NOTE TO USERS - Bibliothèque et Archives Canada
425
NOTE TO USERS The original manuscript received by UMI contains pages with slanted, broken and light print. Pages were microfilmed as received. This reproduction is the best copy available
-
Upload
khangminh22 -
Category
Documents
-
view
0 -
download
0
Transcript of NOTE TO USERS - Bibliothèque et Archives Canada

NOTE TO USERS
The original manuscript received by UMI contains pages with slanted, broken and light print. Pages were microfilmed as
received.
This reproduction is the best copy available


National Library 1*1 ofCanada Bibliothèque nationale du Canada
Acquisitions and Acquisitions et Bibliographie Senrices services bibliographiques
395 Wellington Street 395. rue Wellington OttawaON K1AON4 OltawaON K1AON4 Canada Canada
The author has granted a non- L'auteur a accordé une Licence non exclusive licence allowing the exclusive permettant à la National L i b r v of Canada to Bibliothèque nationale du Canada de rrproduce, loan, distribute or sell reproduire, prêter, distribuer ou copies of this thesis in microform, vendre des copies de cette thèse sous paper or electronic formats. la forme de rnicrofiche/nlm, de
reproduction sur papier ou sur format électronique.
The author retains ownership of the L'auteur conserve la propriété du copyright in this thesis. Neither the droit d'auteur qui protège cette thèse. thesis nor substantial extracts fiom it Ni la thèse ni des extraits substantiels may be printed or otherwise de celle-ci ne doivent être imprimés reproduced without the author's ou autrement reproduits sans son permission. autorisation.
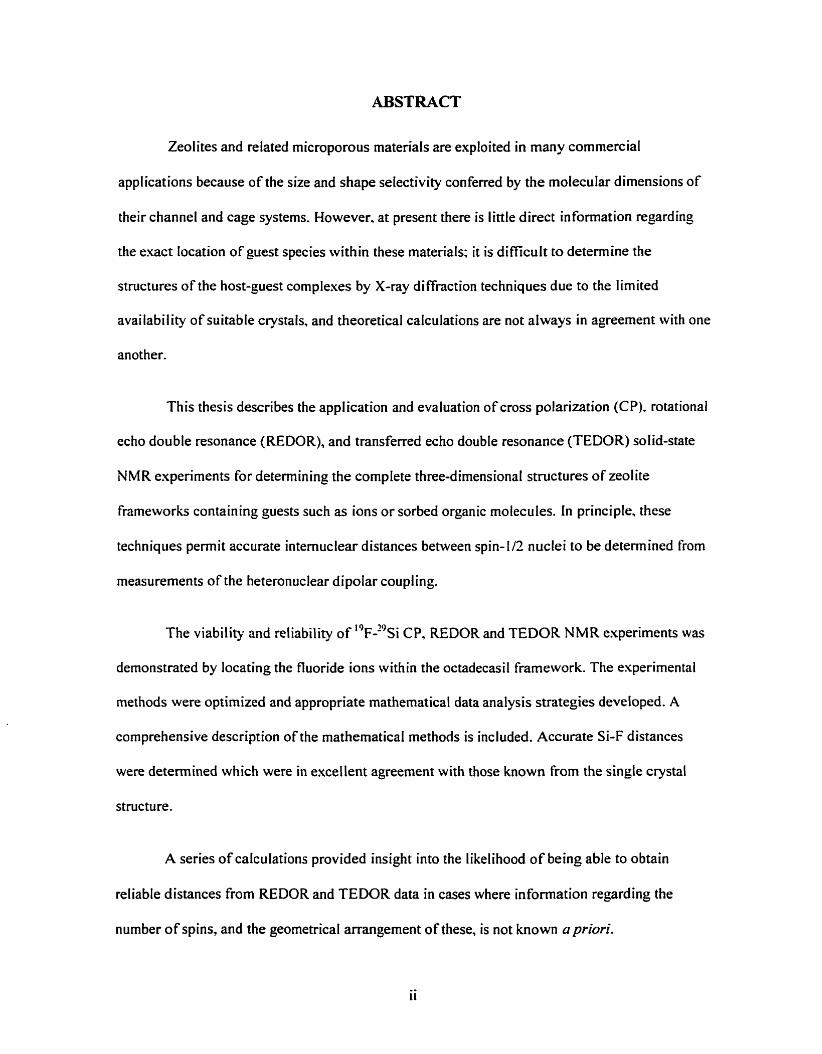
ABSTRACT
Zeolites and related microporous materials are exploited in many commercial
applications because of the size and shape selectivity conferred by the molecular dimensions of
their channel and cage systems. However, at present there is Iittle direct information regarding
the exact location of guest species within these materials; it is dificult to detennine the
structures of the host-guest complexes by X-ray diffraction techniques due to the limited
availability of suitable crystals, and theoretical calculations are not aIways in agreement with one
another-
This thesis describes the application and evaluation of cross polarization (CP), rotational
echo double resonance (REDOR), and transferred echo double resonance (TEDOR) solid-state
NMR experiments for detemining the cornplete three-dirnensional structures of zeolite
frameworks containing guests such as ions or sorbed organic molecules. In principle. these
techniques permit accurate internuclear distances between spin-Il2 nuciei to be detennined from
measurements of the heteronuclear dipolar coupling.
The viability and reliability of 1 9 ~ - 2 9 ~ i CP, REDOR and TEDOR NMR experiments was
demonstrated by locating the fluoride ions within the octadecasil framework. The experirnental
methods were optimized and appropriate mathematical data analysis strategies developed. A
comprehensive description of the mathematical methods is included. Accurate Si-F distances
were determined which were in excellent agreement with those known from the single crystal
structure.
A series of calculations provided insight into the likelihood of being able to obtain
reliable distances from REDOR and TEDOR data in cases where information regarding the
number of spins, and the geometrical arrangement of these, is not known apriori.

Preliminary investigations to locate p-difiuorobenzene molecules within the channels of
purely siliceous ZSM-5 were undertaken using these techniques. Apparatus which permitted the
elitended low temperature operation was developed. Powder X-ray diffraction experiments
confirmed the sorbate- and temperature-induced phase changes obsewed for this systern.
Using a specially designed piece of equipment, a single crystal of ZSM-5 was loaded
with a precisely controlled amount ofp-xylene and the structure successfully refined from X-ray
diffraction data collected at 1 80 K, This represents the most accurate determination of the ZSM-5
frarnework to date.

TABLE OF CONTENTS
. * Abstract ......................................................................................................................................... il
............................................................................................................................ Table of Contents iv
List of Figures ................................................................................................................................. xi
................... List of Tables .. ...................................................................................................... wi
... Syrnbols and Abbreviations ........................................................................................................ XVIIL
........................................................................................................................ Acknow ledgernents 'cu
. ........................................................................................................ ................... Ded kat ion ... n i i
Chapter 1 An Introduction to Zeolites and Solid-State NMR Spectroscopy .......................... 1
1.1 Zeolites and Related Materials ......................... ... ................................................................. 1
....................................................................................................... 1.1.1 General Introduction 1
3 1.1.2 Synthesis .................. ... ................................................................................................ - I . 1.3 Structural Topologies and Nomenclature ........................................................................ 4
1.1.3.1 Framework Topologies and Structures .......................................................... 4
1 - 1 -3.2 Nomenclature ..................................................................................................... 9
1.1.4 Structural Characterization Methods ............................................................................ 1 1
1 -1 -5 Structure Related Properties and Applications ........................................................ 13
1 2 Nuclear Magnetic Resonance Spectroscopy of Sol ids .................................................... 15
1 2 . 1 Nuclear Magnetic Resonance Spectroscopy ................................................................. 15
1 .2.2 Nuclear Spin Interactions in the Solid State ....... .. .................................................. 16
1.2.2.1 The Zeeman Interaction ......................................................................................... 17
1.2.2.2 The Chernical Shifi Interaction ............................................................................... 20
33 1.2.2.3 The Dipolar Interaction ........ .... ......................................................................... -- 1.2.2.4 The Scalar Coupting Interaction ............................................................................. 24
......................................................................................... 1.2.2.5 Summary of Interactions 24
1.2.3 Techniques for Obtaining "High Resolution" NMR Spectra from Solids ................... 25
1.2.3.1 High Power Decoupling .......................................................................................... 26
1.2.3.2 Magic Angle Spinning ......................................................................................... 26
................................................................................................... 1 .2.3.3 Cross Polarization 31
........................................................................................... 1.2.4 NMR Relaxation Processes 34
1 .2. 4.1 Spin-Lattice Relaxation Time ( T l ) .......................................................................... 35

1.2.4.2 Spin-Spin Relaxation Tirne (Ti) ............................................................................ 36
1.2.4.3 Spin-Lanice Relavation Time in the Rotating Frame (Tld ............... .. ............... 3 7
1.2.5 lntemuclear Distance Measurements by Solid-State NMR .......................................... 39
1.3 Investigations of Zeolite Frameworks and Guest Species ....................... .. ................... 4 0
1 .3.1 Structure Determinations by Diffraction Techniques ........................... .. ............... 4 0
........................................... 1.3 2 NMR Studies of Zeolite Frameworks and Guest Species 4 2
1.3.2.1 One-Dimensional NMR Studies of Zeolite Frameworks ........................................ 33
1 -3 2.2 Determination of Framework Connectivities by Two-Dimensional NMR ............. 49
1.3.2.3 NMR Studies of Guest Species ........................................................................... 53
1.3.3 Computer Modelling of Framework Structures and Guest Species .............................. 54
1.4 Outline of Proposed Research ............................................................................................. 56
References for Chapter I ............................................................................................................ 59
................................................................................................ Chapter 2 Experimental Details 67
2.1 Preparation of Samples used for NMR Investigations .................................................. 67
.................................................................................................................... 2.1 - 1 Octadecas il 67
................................................................................................ 2.1 2 Highly Siliceous ZSM-5 68
2.1 -3 Loading of ZSM-5 with p-difluorobenzene .................................................................. 68
......................................................................................... 2.1 Solid-State NMR Spectroscopy 6 9
2.2. I NMR Spectrometer ................... .... ...................................................................... 6 9
2.2.2 NMR Probes . Rotors . and Caps .................................................................................... 70
....... 2.2.3 Measurernent of Nuclear Reiaxati~li Times. Pulse Lengths. and Spirxing Speed 70
......................................................................................... 2.2.4 Low Temperature Operation 71
................ 2.2.5 Cross Polarization and Setting of the Hartmann-Hahn Matching Condition 73
1.2.6 REDOR and TEDOR Experiments ............................................................................... 74
2.2.7 2-D MADEQUATE Experiments ................................................................................. 75
2.2.8 NMR Data Processing ................................................................................................. 7 6
.................................... 2.2.8.1 Peak Integration and Deconvolution of 1 -D NMR Spectra 76
2-2-82 Processing of 2-D NMR Spectra ............................................................................. 76
.......................................... 2.2.8.3 Distance Deteminations from Analysis of NMR Data 77
2.3 X-ray Diffraction Experiments ............................................................................................ 77
2.3.1 Collection and Analysis of Powder X-ray Diffraction Data ......................................... 77
2.3.2 Loading of ZSM-5 Single Crystals with p-xylene ........................................................ 78
.................................... 2.3.3 Collection and Refinement of Single Crystal Diffraction Data 80
References for Chapter 2 ............................................................................................................ 80

Chapter 3 Heteronuclear Distance Determinations from Cross Polarization . REDOR,
......................................................................... and TEDOR NMR Experirnents 8 1
3.1 Introduction ......................................................................................................................... 81
3.2 Heteronuclear Dipolar Interactions Under MAS ................................................................. 83
3.3 Cross Polarization ................................................................................................................ 83
3.3.1 Cross Polarization for tsolated IS Spin Pairs ................................................................ 85
3.3.1.1 Stationary Sarnples ............................................................................................... 85
3.3.1.2 Sarnples Undergoing Magic Angle Spinning .......................................................... 89
3 .3.2 Cross Polarization in Small Spin Clusten .................................................................... 93
3.3.3 Cross Polarization in a Network of Strongly Coupled I Spins ...................................... 93
3.4 Rotational Echo Double Resonance .................................................................................... 96
3.4.1 REDOR for Isolated IS Spin Pairs ...................................... .. ........................................ 98
3.4.2 REDOR Behavior for a Single S Spin Dephased by Several I Spins .......................... IO3
.......-...-..... .... 3.4.3 REDOR Behavior for a Single S Spin in a Network of Many I Spins .. 107
................................................................................ 3.5 Transferred Echo Double Resonance IO8
............................................................................... 3.5.1 TEDOR for Isolated IS Spin Pairs I I I
3-52 TEDOR Curve Families and Experimental Considerations ........................................ I I I
3.5.3 TEDOR Behavior for a Single S Spin Dephased by Several I Spins .......................... 115
3.6 Effects of MolecuIar Motions ............................................................................................ II6
3.7 Summary ......................................................................................................................... II7
References for Chapter 3 .......................................................................................................... 120
Chapter 4 ' 9 ~ - 2 9 ~ i Distance Determinations in Fluoride-Contaiaing Octadecasil from
Solid-State NMR Experiments .............................................................................. 123
4 . 1 introduction ....................................................................................................................... 123
4.1.1 Synthesis of Molecular Sieves in Fluoride-Containing Media ................................... 174
..................... 4.1 -2 '%-"si Distance Determinations from Solid-State NMR Experiments 125
4.2 Materials and Methods ...................................................................................................... 127
4.2. l Cross Polarization Experiments .................................................................................. 127
4.2.2 REDOR and TEDOR Experiments ............................................................................. 127
4.2.4 Calculations and Data Analysis .................................................................................. 128
4.3 Results and Discussion ..................... ,. .......................................................................... 130
...................................................................................... 4.3.1 Octadecasil Crystal Structure 130 19 4.3.2 I-D F and 2 9 ~ i NMR Experiments ......................................................................... 131
19 4.3.3 F-"si Cmss Polarization Experiments .................................................................. 134

............ ............................................... 4.3.3.1 Hartmann-Hahn Matching Profiles ... 1 34
4.3.3.2 Variable Contact Time Experiments ................................................................... 136
4.3.3.3 Fitting of the Oscillatory Cross Polarization Behavior for the T-I Silicons ........ 139 19 ..................................................................................... 4.3 -4 F-'~s i REDOR Experiments 143
4.3.4.1 REDOR Experiments on the D4R Silicons (T- I Si) ............................................. 145
4.3.4.2 REDOR Experiments on the Silicons not in the D4R (T-2 Si) ............................. 148 - 19 29 .......... ................................................................ 4.3.3 F- Si TEDOR Experiments ..., 153
4.3.5.1 TEDOR Experiments on the D4R Silicons (T- l Si) .......................................... 154
4.3.5.2 TEDOR Experirnents on the Silicons not in the D4R (T-2 Si) ............................. 160
4.4 Conclusions ............................... .............................................................................. . . 160
........................................................................................................ References for C hapter 4 162
Chapter 5 Investigations into the Uniqueness of NMR Distance Determinations in Multiple
........................................................................................................... Spin Systems 165
5.1 tntroduction ..................................................................................................................... 165
..................................................................................................... 5.2 Selection of Parameters 166
5.3 REDOR Simulations ......................................................................................................... 168
5.3.1 Theoretical REDOR Behavior for 3-Spin 1-S-I Systems ............................................ 168
5.3 -2 The REDOR Transforrn Applied to Multi-Spin Data ......... .... ............................ 174
5.3.3 Gaussian Distribution of Dephasing Spins ............................................................... 176
5.4 Theoretical TEDOR Behavior for 3-spin 1-34 Systems .................................................. 176
5.5 Conclusions ....................................................................................................................... 183
References for C hapter 5 .......................................................................................................... 185
Chapter 6 Preliminary Solid-State NMR Investigations of the Structure of the Low-
Loaded para-Difluorobenzene / ZSM-5 Complex ............................................ 186
6.1 Introduction ....................................................................................................................... 186
6.1.1 Framework Structure of MFI-type Zeolites ................................................................ 188
6.1.2 Guest- and Temperature-Induced Framework Changes in ZSM-5 ............................. 190
6.1 2 . 1 X-ray Diffraction Studies of ZSM-5 Systems ....................................................... 190
6.1.2.2 2 9 ~ i NMR Studies of ZSM-5 Systems ................................................................... 192
6.1.3 Other Techniques for Locating Sorbates in the ZSM-5 Framework .............. ......,,... 196
6.1.3.1 Predictions of Sorbate Locations from Energy Minimization Calculations ......... 196
6.1.3.2 Predictions of Sorbate Locations from SoIid-State NMR Experiments ............... 198
6.2 Materials and Methods ...................................................................................................... 200
vii

6.2. L Sample Preparation and Sorbate Loading ........................ ...... ........................ 2 0 0
6.2.2 NMR Experirnents ....................................................................................................... 200
........... 6.2.3 Calculations to Determine Sorbate Locations and Orientations from CP data 202
6.3 Results and Discussion ...................................................................................................... 204 19 79 6.3. 1 1 -D F and Si MAS NMR ....................................................................................... 204
...................................................................................... 6.3.2 NADEQUATE Experiments 209
...................................................................... 6.3 -3 ' H-'~s i Cross Polarization Experiments III
6.3 -4 '"-'9~i Cross Polarization Experirnents ................................................................ 219
6.3.5 "F-"s~ REDOR and TE W R Experirnents ............................... ......... ........................ 225
6.4 Sumrnary and Conclusions ................................................................................................ 225
References for Chapter 6 ................... ..... ............................................................................... 228
Chapter 7 Prelirninary Powder X-ray Diffraction Investigations of the Low-Loaded
para-Difluorobenzene / ZSM-5 Complex ..................................... ... ..................... 231
7.1 Introduction ....................................................................................................................... 231
7' - 7.2 Materials and Methods ...................................................................................................... -J>
7.2.1 Sample Preparation and Data Collection .................................................................... 235
7.2.2 Fitting of Reflection Data ............................................................................................ 236
3- 7.3 Results and Discussion ...................................................................................................... ~8
...................................................................................... 7.3.1 Phase Transitions on Cooling 238
7.3.2 Ernpty ZSM-5 at 293 K ...................................... .. ............... 244
7.3.3 DFB / ZSM-5 at 260 K ............................................................................................ 247
7.3.4 DFB 1 ZSM-5 at 293 K ................................................................................................ 250
7.4 Conclusions ........................................................................................ ........................... 251
References for Chapter 7 ...................................... .. ..................................... 254
Chapter 8 Structure of the Low-Loaded Complex ofpara-Xylene in ZSM-5 from a
Single Crystal X-ray Diffraction Study .............................................................. 256
8.1 Introduction ....................................................................................................................... 256
8.1.1 Single Crystal X-ray Diffraction Studies of ZSM-5 Systerns ..................................... 258
............ 8.1.2 Correlations Between ' g ~ i NMR Chernical Shifts and Structural Parameters 259
8.1.3 Previous Investigations of the Low-Loaded p-xylene 1 ZSM-5 Cornplex ................... 160
8.2 Materials and Methods ...................................................................................................... 264
8.2.1 Crystal Preparation and Sorbate Loading ................................................................... 264
8.2.2 Data Collection and Refinernent of Reflection Data ................................................... 265

8.2.2.1 Data CoIlection ..................................................................................................... 265
8.2.2.2 Definitions or R-indices Used .................................. ..,. ......................-... 265
8.2.2.3 Processing and Refinement of the Reflection Data .............................................. 269
77 1 8.3 Results and Discussion ................................... ,., ................................................................ - 8.3.1 Geometry of the Framework .................... ,.... .................., . 2 7 6
8.3.2 Geometry and Packing of the p-xylene Molecules .................................................... 282
8.3.3 Comparisons with p-xylene Orientations determined by Other Methods ..... .............. 288
8.3.4 Predictions of ' 9 ~ i Chemical Shifts .......................................................................... 288
'93 8.4 Summary and Conclusions ................................................................................................ - References for C hapter 8 ............... ,. ......................................................................................... 294
Chapter 9 Conclusions and Suggestions for Future Work ................................................... 297
9.1 Summary and Conclusions .......................................................................................... - 3 9 7
9.2 Suggestions for Future Work ...................................................... .. 3 0 2
References for Chapter 9 ......................................................................................................... 305
APPENDICES
Appendix A Schematics of NMR Spectrometer Configurations .................... ............ ........ 306
Appendix B Pulse and Automation Progrnms ............................................................ 3 12
B . 1 Index of Programs .............. ....... ................................................................................... 313
B.2 Program Listings ............................................................................................................... 316
Appendix C Functions and Mathematica Code for Fitting Data frorn Cross Polarization.
REDOR. and TEDOR NMR Experiments ........................................................ 345
C . 1 Hartmann-Hahn Cross Polarization .................................................................................. 346
C . 1 . 1 Cross Polarization Behavior for Isolated IS Spin Pairs .............................................. 346
C . 1.1 . 1 Functions Used to Describe HHCP Behavior ..................................................... 346
C . 1 . 1.2 Nonlinear Least Squares Fitting of Experimental HHCP Data ............................ 350
C . 1.2 Cross Polarization Behavior in a Network of StrongIy Coupled i Spins ................... 352
C.2 Rotational Echo Double Resonance ............................................................................ 353
C.2.1 REDOR Behavior for Isolated IS Spin Pairs ............................................................. 353
C.2.1.1 REDOR Functions and Nonlinear Fitting ...................................... .. .................... 353
C.2.1.2 The REDOR Transform ..................................................................................... 357
C.2.2 REDOR Behavior for a Single S Spin Dephased by Several I Spins ......................... 359
................................................................................. C.2.2.1 Exact Geometrical Analysis 359
.................. C.2.2.3 SingIe S Spin Dephased by Gaussian Distribution of l Spins ...... 363
C.3 Transferred Echo Double Resonance .................... ,.. .................................................. 366
C.3.1 TEDOR Behavior for Isolated IS Spin Pairs .......................... .. .................... 366
......................... C.3.2 TEDOR Behavior for a Single S Spin Dephased by Several 1 Spins 371
References for Appendix C ................................................................................................... 376
Appendix D Derivation of Equations for Calculating Heteronuclear Second Moments in
the Presence of Molecular Motion ................................................................... 377
References for Appendix D ...................................................................................................... 380
Appendix E Algorithm for Locating Molecules in ZeoIite Channels from CP Data .......... 381
E . 1 Program Options and Detai ts of Transformations Used ........................................ 3 8 2
E.2 Sample Input File ............................. .. ............................................................................ 384
E.3 Pseudo-Code Listing ......................................................................................................... 387
References for Appendix E ...................................................................................................... 391
Appendix F Supplementary Data for Chapter 6 ................................................................... 392
Appendix G Supplementary Data for thep-Xylene / ZSM-5 Single CrystaI Structure ..... 396

LIST OF FIGURES
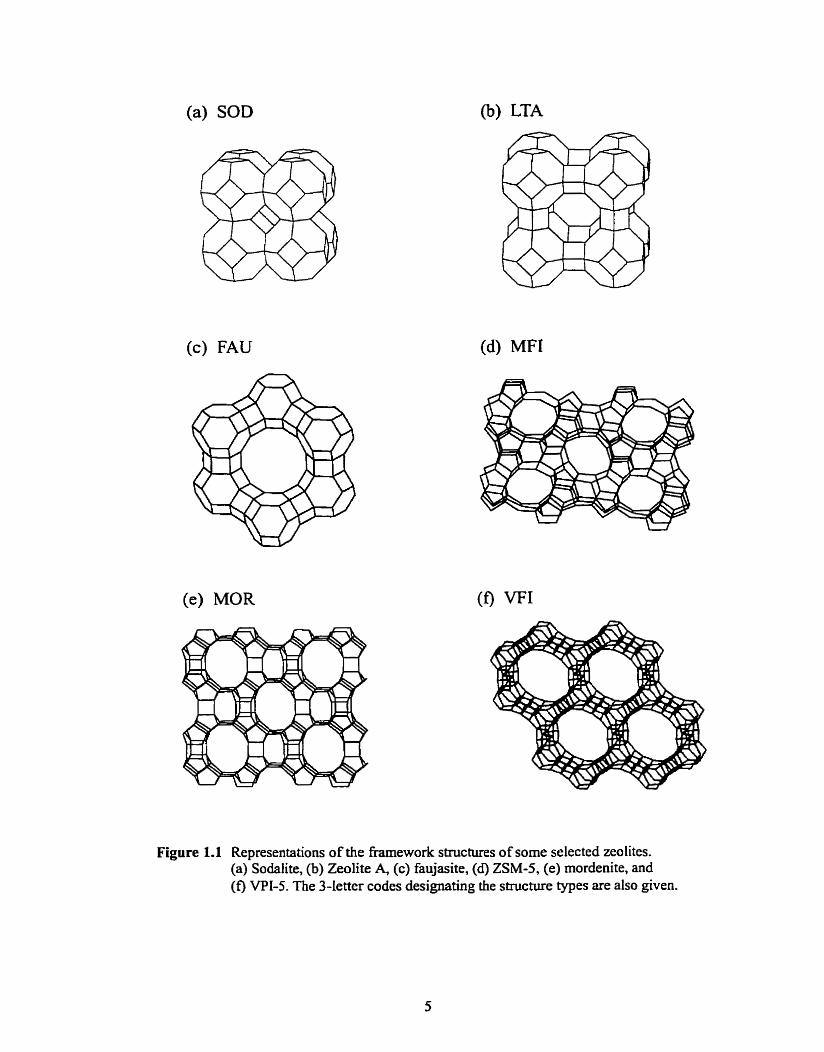
Figure 1.1 Representations of the framework structures of some selected zeolites ...................... 5
Figure 1.2 The secondary building units fiom which al1 known zeolite topologies can Se built .. 6
Figure 13 Cage-like poiyhedra observed in clathrasils and high silica clathrates ........................ 8
Figure 1.4 FID signa1 and real spectrum following Fourier transformation ........................... Z l
............. Figure 1.5 Phase shift of the net magnetization induced by application of an r.f. pulse 21
Figure 1.6 Definitions of angles used to describe the orientation of an IS internuclear vector in a powder sample undergoing MAS ..................... .... ....................................... 28
Figure 1.7 I3c spectra of a powder sample of ferrocene showing the effects of MAS .............. 30
9- Figure 1.8 Pulse sequence and vector representation of Hartmann-Hahn CP experiment .......... J J
Figure 1.9 Pulse sequence and vector representation of the spin-echo experiment .................... 38
Figure 1.10 The five possible local environments of a silicon atom in a zeolite framework and their corresponding "si MAS NMR chemical shifis ....................................... 45
Figure 1.1 1 ->si MAS NMR spectra of highly si ticeous ZSM-5 and the improved resolution obtained if a very crystalline. purely siliceous sample is used ........... .. .................. 47
Figure 1.12 Framework structure of ZSM- 12 and contour plot of a "si NADEQUATE experiment with the T-site connectivities shown ................................................... 51
Figure 2.1 Schematic of the equipment used for low temperature NMR experiments ............... 72
Figure 2.2 Apparatus for loading single zeolite crystals with precisely controlled amounts of volatile sorbates ................................................................................................. 79
Figure 3.1 Behavior of the dipolar coupling as a function of the rotation under MAS ............... 84
Figure 3.2 Cross polarization matching curves under various conditions ................................... 86
Figure 3 3 Evolution of the S spin polarization under Hartmann-Hahn cross polarization at different matching conditions .................................................................................... 88
Figure 3.4 Theoretical CP behavior for S spins in a network of strongly coupled I spins .......... 95
Figure 3.5 CP MAS curves for gtycine showing the different behavior observed for the methylene and carbonyl carbons as a function of the contact time ............................ 95
Figure 3.6 REDOR pulse sequences ............................................................................................ 97
Figure 3.7 Theoretical REDOR behavior calculated for an isolated IS spin pair assum ing different dipolar couplings. and the YJniversal REDOR curve ............................. 100

Figure 3.8 REDOR dephasing S/So and the results of apply ing a Fourier transformation and the REDOR transfomi ....................... ., ..,, ......... .. ............................................... 102
Figure 3.9 Definitions of angles used to describe the orientation of the fi internuclear ..................... vectors in an spin system in a powder sarnple undergoing MAS .. 106
........................................................................................ Figure 3.10 TEDOR pulse sequences 110
Figure 3.11 Theoretical TEDOR behavior calculated for an isolated IS spin pair illusttating the effects of varying different parameters ........................................................... II3
Figure 4.1 Representation of the framework structure of octadecasil showing the location .................................... of the occluded fluoride ions and the two kinds of T-sites 132
Figure 4.2 I9F and "si MAS NMR spectra ofoctadecasil ........................................................ 133
Figure 4.3 Hartmann-Hahn I9~-"si matching profiles for the two T-sites in octadecasil ......... 135
Figure 4.4 I9~-l9si CP behavior for the two T-sites in octadecasil under MAS conditions ...... 138
Figure 4.5 I9~-"si CF behavior for the T-1 Si in a stationary octadecasil sample .................. .. 138
Figure 4.6 ' 9 ~ - ' 9 ~ i CP behavior for the T- 1 Si in octadecasil at the 1 f 1 = 1 sideband matching conditions under various MAS speeds ................................................ 141
Figure 4.7 I9~-l9si CP behavior for the T-1 Si in octadecasil at the f = +2 sideband matching condition for an MAS of 4.15 kHz ..................................................... 141
Figure 4.8 ' 9 ~ - " ~ i REDOR data and fits for the T-1 Si in octadecasil ..................................... 146
Figure 4.9 REDOR Transforrn of REDOR data acquired for the T-I Si in octadecasil ............ 149
Figure 4.10 ' 9 ~ - 2 9 ~ i REDOR data and fits for the T-2 Si in octadecasil ................................... 149
Figure 4.11 I9F-l9si TEDOR spectra of octadecasil acquired with n=2. m varied and a .............................................. ......................... spinning speed of 4.540 kHz ..., 155
Figure 4.12 TEDOR data and fits for the T-1 Si in octadecasil with n fixed and m varied ...... 156
Figure 4.13 TEDOR data and fits for the T-1 Si in octadecasil with n varied and m fixed ...... 157
Figure 4.14 TEDOR data and fits for the T-1 Si in octadecasil using different placement ......................................................................................... of the dephasing pulses 159
Figure 4.15 TEDOR data and fÏts for the T-2 Si in octadecasil with n varied and m=3 ........... 159
Figure 5.1 Pictoriai representation of the spin systems for which the theoretical REDOR and TEDOR dephasing was investigated ................................................... 167
........................................... Figure 5.2 REDOR curves caiculated for sorne 12S spin systems 170

Figure 5 3 REDOR curves calculated for an 1-S spin system (D,=l00 Hz, D - ~ 1 0 0 Hz) as a function of the 14-1 angle 6 ................................................... ............ 17 1
Figure 5.4 REDOR curves calculated for an I s spin system (DI=l 00 HZ 0 - ~ 7 5 Hz) as a function of the 14-1 angle .............................................................. - . . 172
Figure 5.5 REDOR curves calculated for an 1-a spin system (D1=lOO Hz, &+50 Hz) as a function of the 1-S-[angle < ..................... ... ...-..---.- . - -- . . ...........--- . . . . 173
Figure 5.6 REDOR curves calculated for a single S spin dipolar coupled to a large number of 1 spins (Gaussian distribution) ....-........,......................... ..........----.- ------.- ......-.-.. 1 77
Figure 5.7 TEDOR curves calculated for some I s spin systems .......................... ..-. ............... 179
Figure 5.8 TEDOR curves calculated for an spin system ( D l 4 00 Hz, &- 1 00 Hz) as a function of the I-S-i angle < .................................................................. 180
Figure 5.9 TEDOR curves calculated for an Ifi spin system (Dl=[ 00 Hz 0 - ~ 7 5 H z ) as a function of the 1-S-1 angle 6 .......................................... . ..................... 18 1
Figure 5.10 TEDOR curves calculated for an 1-8 spin system (DI=l 00 Hz, D--50 Hz) as a function of the 1-S-I angle < ........................................................... . ............ 182
Figure 6.1 Building units. topology and channel structure of the MFI frarnework ................... 189
Figure 6.2 High resolution 19si MAS NMR spectra of highly siliceous ZSM-5 showing the changes that occur with temperature or loading with p-xylene ............................... 193
Figure 6.3 High resolution ' 9 ~ i MAS NMR spectra of highly siliceous ZSM-5 loaded with selected organic molecules ........................ ... ............................................... 194
Figure 6.4 High resolution 2 9 ~ i MAS NMR spectra of highly siliceous ZSM-5 loaded with 4 molecules / U.C. of p-dichlorobenzene, p-chlorotoluene. or p-xylene ................,.. 195
Figure 6.5 Phase diagram for highly siliceous ZSM-5 loaded with p-xylene ........................... ..... 197
Figure 6.6 ' 9 ~ MAS NMR spectra ofp-difluorobenzene in ZSM-5 at different temperatures -205
Figure 6.7 19si MAS NMR spectra of the low-loaded pdifiuorobenzene I ZSM-5 cornplex at different temperatures ...................-..-............-..-.... . .-............-. - - ....... 206
Figure 6.8 Contour plot of a CP-NADEQUATE experiment on ZSM-5 loaded with 4 molecutes ofp-difluorobenzene per unit ce11 at 245 K ...... . .................................. 208
Figure 6.9 Quantitative ' 9 ~ i MAS NMR spectra ofp-difluorobenzene in ZSM-5 compared with the 'H- '~s~ and I9~-"si CP MAS spectra (20 ms contact time) ..................... 2 I O
Figure 6.10 lntensities of the 'H-'~s~ CF MAS NMR signals as a function of the contact time for the low-Ioaded p-difluorobenzene 1 ZSM-5 complex at 230 K ....................... 2 13
xiii

Figure 6.1 1 Best linear fits of l/Tcp vs . the calculated 'H- '~s~ second moments found from analysis of the 'H-% CP MAS data recorded at 230 K ...................................... 215
Figure 6.12 View down [O 101 showing the Iocation and orientation of the p-difluorobenzene molecules found from fitting the 'H-'~s~ CP data recorded at 230 K ................... 217
Figure 6.13 Location and orientation of the p-difluorobenzene molecules found from analysis of ' H - ~ s ~ CP data recorded at 230 K ..................................... ... ......... 218
Figure 6.14 Intensities of the "F-'~s~ CP MAS NMR signals as a function of the contact time for the low-Ioaded p-difluorobenzene / ZSM-5 cornplex at 235 K ............... 221
Figure 6.15 Best linear fit of l/Tcp w . the calculated ' 9 ~ - 2 9 ~ i second moments found from analysis of the I 9 ~ - ? S i CP MAS data recorded at 235 K ..................................... 221
Figure 6.16 View down [O 1 O] showing the location and orientation of the p-difluorobenzene molecules found from fitting the I9~-I9si CP data recorded at 235 K .................. 224
Figure 7.1
Figure 7.2
Figure 7.3
Figure 7.4
Figure 7.5
Figure 7.6
View along the zig-zag channels of ZSM-5 for structures having orthorhombic .................................... .................... . . Pnmu. and monoclinic PZl/n I 1 symmetry .. 333
Powder XRD patterns of the low-loaded p-difluorobenzene / ZSM-5 com plex as the sample was cooled from 293 K to 260 K ........................................................... 240
Powder XRD patterns of the low-loaded p-difiuorobenzene / ZSM-5 complex at 293 K and 260 K compared with the powder pattern for empty ZSM-5 at 293 K .. 242
Experimental and calcutated powder XRD for empty ZSM-5 at 293 K .................. 246
Experimental and calculated powder XRD for the low-loaded p-difluorobenzene / ZSM-5 complex at 260 K ......................................................................................... 249
Experirnental and calculated powder XRD for the low-loaded p-difluorobenzene / ZSM-5 complex at 293 K ..................... .., ............................................................... 252
Figure 8.1 'H-'~s~ CP MAS NMR spectra of purely siliceous ZSM-5 loaded with three molecules of p-xylene / u.c. recorded at 1 73 K and 193 K ...................................... 262
Figure 8.2 Numbering scheme of the Si and O atoms in the asymmetric unit of the ZSM-5 framework with orthorhombic Pnrna symmetry ...................................................... 274
Figure 8 3 ORTEP drawings showing location of the p-xylene in ZSM-5 ............................. 275
Figure 8.1 View of the tow-loaded p-xylene / ZSM-5 complex showing the orientations and packing of the p-xy lene molecuies in the straight channels ................................. 281
............................................... Figure 8.5 Labeling of the carbon atoms in p-xylene molecules 283
Figure 8.6 Angles and coordinates used to describe the orientations of sorbates in ZSM-5 ..... 283
Figure 8.7 N M R and XRD correlation diagrams for ZSM-5 containing 2.85 molecules of p-xylene per u.c . at 180 K ........................................................................................ 291
xiv

Figure 8.8 NMR and XRD correIation diagrams for ZSM-5 containing 2-85 motecules of p-xylene pet U.C. at 180 K .................................................................... 292
Figure A. 1 Schematic of spectrometer configuration used for ' H-'~S i experiments ................. 309
Figure A.2 Schematic of spectrometer configuration used for 1 9 ~ - 2 9 ~ i experiments with mixing of the F2 and F3 frequencies to generate the 1 9 ~ i frequency ....................... 3 1 0
Figure A.3 Schematic of spectrometer configuration used for ' 9 ~ - ' 9 ~ i experiments with the 29 . Sr frequency generated directly ............................................................................ 3 i 1
Figure C.1 Theoretical HHCP behavior calculated for an isoiated IS spin pair in a static powder sample using numerical integration and Bessel functions ......................... 349
Figure C.2 Theoretical REDOR dephasing calculated for an isolated IS spin pair for different placements of the dephasing pulses ......................................................... 355
Figure C.3 Theoretical REDOR dephasing calculated for an isolated IS spin pair for the indicated placements of the two dephasing pulses in the period afier transfer ...... 369
LIST OF TABLES
Table 1.1 Pore dimensions and channel dimensionalities of selected zeotype structures ........... 1 0
Table 1.2 Typical magnitudes of nuclear spin interactions for I3c in a 4.7 T magnetic field ..... 18
Table 1 3 Important NMR parameters of setected nudei .........,........................-.--m. -.----------- 18
Table 4.1 "F-'~s i dipolar couplings calculated for various Si-F interatomic distances ............ 129
19 Table 13 and F relaxation parameters measured for octadecasil ................................. .... 1.9
Table 4 3 Comparison of the 2 9 ~ i - 1 9 ~ dipolar couplings and Si-F distances for octadecasil determined by various methods .....,,..... -.. ................................................... 144
Table 6.1 Space gruups and numbers of T-sites for several ZSM-5 structures ......................... 19 1
Table 6.2 Experimental and calculated parameters related to the 'H-'~s~ CP experiments on the low-loaded p-difluorobenzene / ZSM-5 complex at 230 K ......... . ..........- -.---...-... 2 1 3
Table 63 Resul ts of fitting CP data for the low-loaded p-difluorobenzene / ZSMS complex. 2 14
Table 6.4 Experimental and calculated parameters related to the ''F-'~s~ CF experiments on 339 the low-loaded p-diff uorobenzene / ZSM-5 cornplex at 23 5 K ............ . ...... .....-.--- ---
Table 7.1 Results from fitting of the ZSM-5 XRD powder data using the AJUST program ..... 345
Table 8.1 Crystal data and structure refinement forp-xylene in ZSM-5 at 1 80 K ............. . ...... 266
Table 8.2 Atomic coordinates and equivalent isotropic displacement parameters forp-'rylene in ZSM-5 at 180 K ..........,....,... ,., .................... 273
Table 8 3 Comparison of the framework geometry in several ZSM-5 structures determined by single crystal X-ray diffraction ..................................................................... 278
Table 8.4 Minimum and maximum diagonal 0-0 distances across the 10-rings in several 7 79 ZSM-5 structures ......................................... -
Table 8.5 Comparison of the bond lengths and bond angles in p-'iylene molecuIes at the channel intersections in ZSM-5 with those in crystalline p-xylene at 180 K............ 284
Table 8.6 Comparison of the locations and orientations for different organic molecules adsorbed at the channel intersections in ZSM-5 ................ . ......... ,., ........... . . . . 286
Tabie 8.7 "si chemical sh ifts and structural pararneters for ZSM-5 loaded with 2.85 molecules ofp-xylene / U.C. at 1 80 K ...................................................................... 290
Table 8.8 Linear regression analysis of the "si chemical s h i h against the various geornetric parameters indicated for the low-loaded p-xytene / ZSM-5 complex at 180 K.. ....... 290
xvi

Table A.1 Abbreviations used in the spectrometer configuration schernatics ,.........-....-.-.---.S..- 308
Table A.2 Phases of the F3 signal before and afler tripling ........................................... 308
Table C.1 Functions describing the HHCP behavior for isolated IS spin pairs in a powder sample at various matching conditions .......................... .. -.--.....-...-....-.... . . ........ 347
Table C.2 REDOR dephasings catculated for a tetrahedral arrangement of 4 /spins about a central S spin using different step sizes for the numerical integration .....-..-..-....-- 36 1
Table C 3 REDOR dephasings calculated for different 1-6 spin system geometries .-.....,......... 3 62
Table C.4 TEDOR functions A b , , for different positions of the dephasing pulses ..................- 368
Table CS TEDOR dephasings calculated for different 1-8 spin system geometries ........-........ 374
Table F.1 T-sites. their occupancies and connectivities for the asymmetric unit in the rnonoclinic Ptl/n. I. I phase of ZSM-5 ............................ . ...................................... 393
Table F.2 Fractional coordinates of the p-difluorobenzene atoms found from fitting of the I H-'~s~ CP data at 230 K .......................................................................................... 394
Table F.3 Fractional coordinates of thep-difluorobenzene atoms found from fitting of the 19 29 F- Si CP data at 235 K ............................................................................. 395
Table G.l Anisotropic displacement factors for the Iow-loadedp-xylene 1 ZSM-5 cornplex at 180 K ......................................................................................................... 397
Table G.2 Bond lengths for framework atoms in ZSM-5 loaded with 2.85 molecules of p-xylene per unit ce11 at 180 K ........................................................................ 398
Table G 3 Bond angles for framework atoms in ZSM-5 loaded with 2.85 molecules of p-xylene per unit ce11 at 180 K ....... . .................................. 399
xvii

SYMBOLS AND ABBREVIATIONS
a. 6. c
6, Bo BII BIS C
CP D
f FI D FT h HHCP I NADEQUATE
-4 n
1v
NMR tn
M
Mo l&(II) IV& {IS, lt&(SS)
MAS
P p, r
r. f. REDOR S S i- 1. S i-2, etc.
so s f ST t
tl. h T- 1, T-2
Tl
crystallographic unit cell dimensions (lanice constants) orientation dependent dipolar coupling (i = 0- 1'2) static magnetic field of an NMR spectrometer radiofrequency magnetic field applied to the I nuclei radiofrequency magnetic field appIied to the S nuclei number of combinations of possible spin States Cross Polarizat ion dipolar coupling Hartmann-Hahn match ing condition Free Induction Decay Fourier Transfonn Planck's constant Hartmann-Hahn Cross Polarization magnetic quantum number associated with I spins; unobserved nucleus Incredible Natural Abundance Double Quantum Transfer Experiment Bessel functions of the first kind nurnber of rotor periods in REDOR experiment number of rotor periods before coherence transfer in TEDOR experiment num ber of spin pairs: number of I spins Nuc lear Magnetic Resonance number of rotor periods after coherence transfer in TEDOR experiment macroscopic magnetization of a spin system in the presence of Bo equilibrium macroscopic magnetization of a spin system in the presence of Bo I-I homonuclear second moment I-S heteronucIear second moment S-S homonuclear second moment
Magic Angle Spinning probability that a given site is occupied Binomial probability of that i sites are occupied internuclear distance radio freq uency Rotational Echo Double Resonance magnetic quantum number associated with S spins; observed nucleus crystallographically inequivdent T-sites (silicons) in a zeolite framework signal intensi ty in REDOR experirnent with no dephasing pu [ses applied signal intensity in REDOR experiment with dephasing pulses applied signal intensity in TEDOR experiment time
position of dephasing puIses during rotor cycle as Fraçtion of rotor period t, crystallographically inequivalent T-sites in octadecasil framework spin-lattice or longitudinal relaxation time
xviii
Tl P
F? TEDOR TGA
X
XRD
spin-lattice relaxation time in the rotating fiarne spin-spin or transverse relaxation time Transferred Echo Double Resonance Thermal Gravimetric Analysis unit ce11
I-S internuclear vector ( v l , V A V J ) (unit length) { 1.0, O), unit vector parallel to .r-axis X-ray Diffraction
{O. 1, O) , unit vector parallel to y-axis
{O, 0, 1 ). unit vector parallel to - a i s
polar angles describing orientation of 1-S vector in a powder sample
crystallographic unit ceIl angles (lattice constants)
average S i(OSi)4 angle
angles describing orientation of aromatic ring in zeolite channels
angles describing orientation of aromatic ring in zeolite channels
gyromagnetic ratios of I and S spins
chemical shifi
1-S-I angle in a 3-spin system
nLh, dirnensionless parameter (REDOR)
nDtr dimensionless parameter (TEDOR)
mDrr dimens ion less parameter (TEDOR) contact tirne in cross polarization experiment
rotor period (time for one complete rotor cycle)
spinning speed (BI)
rotor frequency (rad s-')
Larmor frequency of the I spins
Larmor frequency of the S spins
amplitude of the radiofrequency field applied to the 1 spins
amplitude of the radiofrequency field applied to the S spins
accumulated dephasing during REDOR experiment
So-Sr REDOR di fference
dephasing in n rotor cycles before coherence transfer in TEDOR esperiment
dephasing in n~ rotor cycles afier coherence transfer in TEDOR erperiment
angle between 1-S internuclear vector and static magnetic field Bo Euler angles used to describe orientation of 1-S vectors
the "Magic Angle". 54-74'
I have enjoyed my time at U.B.C. immensely and would like to take this opponunity to
acknowledge the assistance of the many friends and colleagues who have helped and supported
me during my Ph-D. studies.
First and foremost. 1 would like to express my sincerest gratitude to Colin Fyfe for his
continuous support and encouragement. His valuable advice and deep insight. as well as a
seemingly endless supply of ideas. have greatly influenced rny work and continue to inspire my
research efforts. I would also like to thank Hiltrud Grondey for teaching me the mechanics of
experimental NMR: without her guidance and knowledge of the Bruker software many of the
experiments in this thesis would have been impossible. G.E. Barlow kindly provided the
outstanding sarnples of ZSM-5 used in the NMR experiments.
During my Ph.D. 1 was truly fortunate to enjoy fruitful collaborations with several
distinguished visitors to the Fyfe group: Jean-Michel Chézeau, who brought with him the tmly
outstanding sarnples prepared by Anne-Catherine Faust and Philippe Caullet, which allowed the
optimization of the NMR experiments and the calculations that proved pivotal in this research
project; George Kokotailo, who possesses a contagious, boundless enthusiasm and an
unparalleled knowledge of zeolites was always inspirational; Wilhelm Schwieger. who is
thanked for his great expertise in synthesizing the very high quality, large single crystals of ZSM-
5 used in the XRD investigations; and Karl Mueller whose assistance and advice was crucial to
the success of the REDOR and TEDOR calculations.
I am severely indebted to Tom Markus and Milan Coshiua for having the patience to
repair the spectrometer and probes on the many occasions that 1 caused them to malfunction. and
also for teaching me the "secrets" of the inner workings of the MSL spectromrter. 1 am
particularly thankful to Tom, who was able to perform the seemingly rnagical feats of designing,
modQing, improving and building NMR instrumentation required to implernent al1 of the NMR
experiments in this thesis. 1 would also like to thank Oskar Grenier for his skill in altering and
fixing many pieces of equipment, ofien at very short notice and much faster than could
reasonably expected. Steve Rak is thanked for constructing the single crystal apparatus. Steve

Rettig is pteful ly acknowledged for his efforts to collect single crystaI data and also for advice
on the crystallographic software.
1 would also like to express my gratitude to Hermann Gies for inviting me to visit the
Institut fur Mineralogie at Ruhr-Universitat in Bochum, and for greatly improving my
understanding of symrnetry. X-ray diffraction, and zeolite fi-ameworks. At Bochum under the
expert guidance of Bernd hfarler, the powder XRD data was collected and 1 was introduced to
the techniques of X-ray diffraction structure refinement. Peter Daniels and Holger Meyer zu
Altenschilde are also thanked for their suggestions and assistance in the single crystal refinement
work.
Felix Aubke is acknowledged for careful reading of the final version of this thesis and
also for his support during the initial stages of rny Ph-D. work. Sabine Hediger is thanked for
providing a copy of her thesis, and for having the patience to answer my many questions about
the intricacies of Hartmann-Hahn cross polarization. My present and former CO-workers Anis
Diaz, Almira Blazek, Jim Sawada. Jeny Bretherton, Kirby Wong-Moon. Darren Brouwer. Jargen
Skibsted. Yining Huang, Patty Aroca-Oulette, Zhimming Mei, and Chanqing Wang are also
thanked for their patience, help, enlightening discussions, and for rnaking my time at U.B.C. so
enjoyable.
I gratefully acknowledge the Natural Sciences and Engineering Research Council of
Canada which funded the research reported in this thesis and also the financial assistance of the
University of British Columbia.
1 would like to thank the many friends who visited me during my time in Vancouver and
provided weIcorne distractions from my toil, especialiy Lisa Simpson, Jirn Blanking and Ewen
Anderson. Finally, 1 thank my farnily for their continued patience, support, and encouragement
throughout my academic pursuits.
xxi

Dedicaîed ro the rnernory of my Father

CHAPTER 1
AN INTRODUCTION TO ZEOLITES
AND SOLID-STATE NMR SPECTROSCOPY
This chapter introduces the structures and physical properties of zeolites and related
microporous materials, then briefly discusses some concepts and techniques used in solid-state
nuclear magnetic resonance (NMR) spectroscopy. An overview of previous investigations of
microporous materials and guest species by solid-state NMR is also presented.
1.1 ZEOLITES AND FULATED MATERXAlLS
1.1.1 General Introduction
Zeolites are crystalline open fiamework aluminosilicates which play important roles as
rock-fonning materials (minerais) and as synthetic products of considerable industrial and
scientific interest. They have many large scale industrial applications as catalysts, ion
exchangers, molecular sieves, and absorbents.' The name "zeolite" is derived from the Swedish
word zeolit coined by Cronstedt in 1756 from the Greek words &IV (zein = to boiI) and h~uog
(lithos = stone) to describe the apparent "boiling" he observed as the water frothed out of the
mineral stillbite upon heating with a flame. Traditionally, the term zeolite was only considered to
describe porous aluminosilicates, however in recent years its usage has been expanded to include
crystalline inorganic materials containing elernents other than siIicon and aluminium which have
zeolite-like frameworks. These zeolite-like materials encompass completely siliceous analogues
of zeol ites and clathrates (zeosils and dathrasils respective1 y ), porous aluminop hosphates
(AlP04s), and materials such as GaPOs which contain gallium or other elements?' Several
comprehensive books have been written about these materials including those by ~arrer,' ~reck,"
and the more recent compilations fiom the International Zeolite Association Summer ~chools.'-'"
1.1.2 Syn t h a i s
Although natural mineral zeolites have been known for more than 200 years, there was
relatively little interest in them until McBain demonstrated their ability to selectively absorb
organic molecules and coined the term "molecular sieve" in 1932.' In the 194Os, Barrer began the
first systematic studies of zeolite synthesis, demonstrating not only their molecular sieving
properties, but also producing the hydrogen forms of these materials, which act as strong acid
catalysts. Within a relatively short period following the synthesis of the naturally occumng
zeolites chazabite, and mordenite, the first synthetic zeolite not found in nature, zeolite A, was
prepared by il ton." The early synthetic methods were based on hydrothermal treatments of
alkaline silicate and aluminate gels and produced samples with relatively low (< 6) Si/Al ratios
similar to those found in naturaily occuning zeolites. Kerr pioneered the use of quatemary
ammonium organic cations R&f as "templating" or structure directing species, which allowed
the direct synthesis of materials with larger Si/Al ratios and this gave rise to a whole new
generation of materials, many with previously unknown structure^.^^
Zeolite compositions may be described using a simple empirical oxide formula (Eq. 1.1 ),
where the Mn' represents the exchangeable cations, the part within brackets the framework, and
z HtO the water of hydration.
M:;" [(SiO,), (A102 ),1 - z H,O
The silicon to aluminium ratio (Si/Al= yfx) rnay Vary fiom 1 to infinity, and the cations are
usually metal ions or quatemary organic ammonium cations incorporated during crystallization.
These cations are required to balance the net negative charges introduced by the aluminium

atoms in the h e w o r k . Often the large organic cations block the pores and channels and need to
be removed before the materials can be used. In many cases this is simply achieved by heating
the materia1 at about 550 OC in air (oxygen) to combust the organic matter. Other species such as
ammonium ions and transition metal complexes may be introduced after synthesis by ion
exchange. however protons are by far the most important cations because they generate strongly
acidic catalytic sites within the zeolite voids.
Once it became apparent that properties such as the catalytic activity and thermal
stabii ity were related to the Si/AI ratio, other methods invo lving themochemical modification,
chemical treatments, and acid extraction, were developed to increase the Si/AI ratio. Where a
framework can't be directly synthesized in a high Si/Al ratio (e-g. zeolite Y) steaming of the
hydrogen forrn can be used to remove aluminium from the h e w o r k . Heating (usually above
700 OC) in the presence of steam drives a fraction of the hydrogen ions from the zeolite crystals
and causes an equal number of aluminium atoms to leave the h e w o r k . The vacancies created
are somehow filled by silicon atoms, thereby increasing the SVAI ratio. Some aluminium species
may rernain in the pores as octahedrally coordinated cations and can act as catalytic sites.
Zeolites synthesized with boron rather aluminium can also be steamed, and the boron is much
easier to remove from the framework. A direct isomorphous substitution of Si for Al can be
achieved by treating the sample with
In the 1980s a new class of matenals, the A1P04s, whose hrneworks contain aluminium
and phosphorus were discovered. AIPOls have frameworks with AI/P ratios of unity and rigorous
alternation of Al and P sites within their structures which means there is no net charge on the
framework. However it is principally the charge balancing cations which create the catalytic sites
in zeolites so the synthetic techniques were quickly extended to permit isomorphous substitution
(e.g. of P by Si or Al by Ga) and thereby introduce net framework charges in these materials.lJ
A new synthetic route involving the use of non-alkaline, fluoride-containing media was
introduced by Flanigen and patton,13 and has been extended by Guth and CO-workers." and

othen." This method allows the direct synthesis of purely siliceous materials, AlPO4s and
isomorphously substituted and many novel materials have been prepared using this approach. A
wide variety of treatments have also been successfilly used to modiQ the as-synthesized
materials?
1. t 3 Structural Topologies and Nomenclature
1.1.3.1 Frame work Topclogies and Strucf ures
Zeolites and their non-aluminosilicate analogues are microporous rnaterials, having pore
sizes and channel dimensions in the range 3-13 k and as such are distinct from the mesoporous
materials which have much larger void dimensions (up to 100 A). Some cornmon frameworks,
showing the channel systems which can be one, two, or three-dimensional in nature, are depicted
in Figure 1.1. It is the dimensions of these channels which confers the size and shape
selectivities.
These frarneworks contain only corner-sharing tetrahedra, allowing them to be
distinguished from layered materials such as clays, which share many of their useful physical
properties (e.g. cation exchange abilities, voids of molecular dimensions and very similar
elemental compositions), but also have edge-sharing ocahedra. A hrther, though less clear-cut
distinction can be made between zeolites, which contain true "channels", and clathrates whose
structures consist of assemblies of cage-like unis with intraframework cavities connected
through the cage openings.
The basic building blocks of zeolite-like structures are T04 unis, where T represents
elements such as dicon, aluminium, or phosphorus, tetrahedrally coordinated to four oxygen
atoms. These positions in the Framework structure are usually referred to as "T-sites", even
when, as is the case of AI in some AIP04s, up to two water molecuies can be absorbed to yield
five- or six-coordinated atoms. These are linked together by sharing oxygen atoms into larger
finite units known as Secondary Building Units (SBUs) which contain up to 16 T-sites (Figure
(a) SOD
(c) FAU
( e ) MOR
Figure 1.1 Representations of the framework structures of some selected zeolites. (a) Sodalite, (b) Zeolite A, (c) faujasite, (d) ZSM-5, (e) mordenite, and (f) VPI-S. The 3-letter codes designating the structure types are also given.

4-1
Q 4 -1
Figure 1.2 The secondary building units (SBU's). AI1 of the known zeolite topologies c m be built from combinations of these. In these figures, each vertex or termination represents a T-site. The oxygens (omitted for clarity) lie approximately rnidway between the vertices, but not on the Iine joining them because the T-O-T angles are not 1 80". After reference 1 7.

1.2). The assembly of these SBUs into three-dimensional structures through oxygen-bridges
produces the farniliar frameworks containing regular systems of molecular-sized, interconnected
channels and cavities. The cations necessary to balance the negative charge of the fiamework,
and other guest species including water molecules, non-silicate anions (e-g. fluoride and chloride
ions), organic cations, or organic molecules may be located in the voids.
An alternative method of visuaIizing zeolite topologies is to consider the fkameworks as
being constmcted tiom stacks of polyhedral cages. These cages, which must share faces with
other polyhedra, can be either different or al1 alike. Some of the common polyhedra found in
zeolites are depicted in Figure 1.3. These are usefùl for desctibing many structure types,
especially the clathrates, but also for some of the common zeolites such as sodalite, zeol ite A,
and the faujasite structure of zeolites X and Y. The frameworks structures of these four materials
contain the truncated octahedron (P-cage or [4668] unit), sharing 4-ring faces in the case of
sodalite, or linked through double 4-ring (D4R) units (zeolite A), or double 6-ring (D6R) units
(faujasite) as shown in Figure 1.1. Representations of three other common zeolites (ZSM-5,
mordenite and VPI-S), whose frameworks are better described as being built up from chains of
SBUs are show in Figure I -1 . The channels present in many zeolites are clearly seen in the
latter two examples. Variations in the framework composition (e.g. by isomorphous substitution),
coupled with large number of possibilities for connecting the sub-units into 3-dimensional
networks, yield an essentialIy infinite conceivable number of structures. At present several
hundred naturally occurring zeotites and related synthetic materiais are known, with more than a
hundred distinct structure types ~onfirmed.'~
Microporous materials such as zeolites and AlPOjs can have many different types of
channels and intrastructural cavities.16 The sires are determined by the number of T- or O-atoms
that form the rings (often circula or elliptical) and control difision through the channels.
Generally, only those apertures which are more open than regular six-rnernbered rings are

Figure 1.3 Compilation of the cage-like polyhedra observed in dathrasils and high silica clathrates. The topological code descriptor, and the free volume for the different units are indicated. After reference 18.

considered to be channels, and the smaller openings are described as windows which connect
Iarger cavities, One, two, and three-dimensional systems of channels are known, and in many
cases (but not aiways), these are interconnected. Table 1. t sumrnarizes information about the
nature and fiee diameters of the channel systems for some common structures. The void volumes
of these polyhedra are given in Figure 1.3. It must be emphasized that the frameworks are not
completely rigid: the T-O bond Iengths and particularly T-O-T angles can change with
temperature and in the presence of sorbed or occluded ~~ecies.'''~
1.1.3.2 IVomencIuture
The conventions for naming zeoIites and related materials are quite diverse, principally
because many groups have synthesized materials and given them "in-house" names, but also
because of the many naturalIy occurring mineral analogues which have their own established
nomenclature. There are cases where identical materials have been synthesized by several
research groups and given different names,'' and also of materials containing different elements
but having the same framework topology. Recently however, an IUPAC Commission on Zeolite
Nomenclature mled that names consisting of three capital letters will be assigned to designate the
structure ypes of porous fiamework materials. The mnemonic codes (which are generalty
derived from one of the established names of the material type) represent the structures and
connectivities within the h e w o r k s and a complete listing of these codes is given in the current
on-line edition of the International Zeolite Associations' publication "Atlas of Zeolite Structure
~~~es".'"hese structure types do not depend on composition. distribution of the various
possible atoms, ceIl dimensions or symmetry, and should not be confused or equated with actual
materiak. For example the faujasite framework type is denoted by FAU and describes the
framework structure of faujasite, zeolite X, Y and others. Several more examples are given in
Table 1.1.

Table 1.1 Pore dimensions and dirnensionalities of selected zeotype structures (compiled frorn
data Iisted in reference 17.)
- - -
Materials 1 Pore Systern -
Channel
Diameten [A] ~imensionality'
zeolite A, Gal lophosphate-A, SAPO-42 3
ZSM-5. Silicate- 1 , TS- 1. VS- 1
ZSM-23, KZ- 1, EU- 13 I 1
ALPOj- 1 1 , SAPO- 1 1 I I
ZSM- 12, NU- 13, Theta-3 I 1
Theta- 1 , ZSM-22, KZ-2, NU- I O 1 -
Mordenite, Zeolon
zeolite p
-
Faujasite, zeoIite X, zeoIite Y, SAPO-37
Cloverite
the different channels may be interconnected pore systems.

Aluminosilicate materials are generally referred to as zeolites or clathrates, whiIe their
purely siliceous analogues are known as zeosils and clathrasils respectively. Aluminophosphate
molecular sieves are denoted as A1P04s (or sometimes AIPQ-n, where n denotes a specific
structure type, but other narnes are also used) and the materials formed by isomorphous
substitution into AlP04s are called MeAPOs or EIAPLOs. Here Me and El denote the rnetals or
elements (e-g. Fe, Ti, Si, Ge, B etc.) which have been introduced into tetrahedral frarnework
positions.2 GaPOs (Ga and P) and SAPOs (Si, Al, and P) are examples of such materiais.
1.1.4 Structural Characterization Methods
The main physical techniques used to characterize the structures and properties of
crystalline microporous materials are diffraction, rnicroscopy, and spectroscopy. Other methods
such as thermal analysis and adsorption studies also provide valuable information about thermal
stability, pore sizes, channel structure, and surface area. In recent years progress has been made
in the development of compter modelling software (e-g. packages such as ~ e r i u s ? ~ ) for
calculating the energies of frarnework structures, and properties related to the interactions
between guest species and the host frarnework, such as their preferred locations and diffusion
rates. These methods involve predicting the minimum energy configuration of the system being
investigated, and the limiting factor at present is the availabiIity of reliable potential energy
functions.
Diffraction remains by far the most important technique for determining the atomic
arrangements in these crystalline rnaterials. Single crystal diffraction studies using X-rays,
electrons, and neutrons are capable of yielding accurate positions for the constituent atoms, but
these require single crystals of adequate quality and size, and this can often present a major
obstacle because it is extremely dificult to synthesize such large zeolite crystals of sufficient
quality. However, the recent availability of area detectors and increased source beam intensities
(e.g. synchrotron beam lines) now means, in principle at ieast, that smalIer crystals may be
analyzed. In most cases, recoune must be made to the use of X-ray and neutron difiction from
microcrystalline or powder samples, which yield only limited information. However, Rietveld
refir~ernent?~ and more recently, the use of socalled "Direct ~ethods"~ ' have proven to be
effective means for structure elucidations. Rietveld refinement requires that a mode1 structure is
proposed (based on information such as elementai composition, symmetry, and unit ce11
dimensions derived from NMR and X-ray diffraction experiments) and then refined, usually with
geometric restraints such as acceptable ranges for bond lengths and angles.
Notable advances for probing the microstnrcture of these materials have been achieved
in the last few years through the use of Transmission Electron Microscopy (TEM) and Scanning
Electron Microscopy (SEM). In a few cases these techniques have provided images at close to
atomic resolution showing the pore openings and channels, as well as crystal defects such as
dislocations, site vacancies and stacking faults. These have been reviewed by ~hornas."
Spectroscopic techniques can be used to probe local structural properties such as site
symmetries, coordination nurnben, and to detect the presence of crystal imperfections, variations
in local order, and impurities. Spectroscopic measurements generally provide detaiis about the
short-range or local order, which is complimenrary to the information conceming long-range
ordering obtained from microscopie and diffraction techniques. Some important rnethods include
vibrational spectroscopy (infrared and Raman), X-ray spectroscopy (X-ray fluorescence (XRF),
absorption edge fine structure (AEFS), extended X-ray absorption edge fine structure (EXAFS)).
and electron spectroscopy (X-ray photoelectron spectroscopy (XPS or ESCA). The most useful
and important spectroscopic technique for characterizing microporous crystalline materials is
solid-date nuclear rnagnetic resonance spectroscopy, since it is capable of providing unique
information about both the fi-ameworks and guest species within the void spaces of these
materials. In addition it is a non-destructive technique that requires relatively small samples (ca.
100-500 mg) in the form of powders. A review of previous NMR investigations of microporous
materials is presented in Section 1.3.2.
1.1.5 Structure Relaîed Properties and Applications
Molecular sieves have industn'ally important applications as catalysts, ion exchangers.
adsorbents, and in gas separations.'." The wide range of applications is directly related to their
unique structures, and the key to a better understanding of the chemical and physical properties
of crystalline microporous materials such as zeolites lies in detailed knowledge of their
framework structures, and the locations of guest species within the channels and cavities. This is
the principal goal of many current research efforts, including the investigations reported in this
thesis.
Each aluminium atom present in a zeolite framework introduces a net negative charge,
which is balanced by cations. These cations are exchangeable, and this propew is exploited in
many of the industrial processes which use zeolites. By far the largest use of zeolites is as water
softeners: the propensity of zeolites A and P to effectively remove ~ a " and M ~ ' * cations from
"hard" water and replace them with Na' ions means these materials have replaced the potentially
environmentally damaging phosphates in many detergents. The application of zeolites as
adsorbents, desiccants, and in gas separations stem h m their regular arrays of molecular-sized
pores and channels. For example, the 4 A openings in the sodium fonn of zeolite A make it
highly efficient desiccant that is used to dry solvents and gases in almost evecy laboratory in the
world, while the ~ a " exchanged fonn has 5 A openings and is utilized as a molecular sieve to
separate nitrogen and oxygen gas- The hydrophobicity of zeolites increases with the Si/Al ratio,
and materials with high silicon contents have been used to selectively adsorb organic molecules
fiom aqueous media.
Probably the most important property of these microporous materials afier their pore
size, is their acidity. Both Brensted and Lewis acid sites may be present in zeolites, and very
oflen these are the active catalytic sites. The acid or hydrogen form of a zeolite (often written
HZ, where Z represents the zeolite framework) is obtained by ammonium ion exchange, followed
by calcination in air at 500 OC to drive off ammonia gas (Eqs. 1.2 and 1.3):

For zeolites crystallized using a quatemary ammonium cation as template, calcination of the "as-
synthesized" material produces the acid form directly. The proton associates with an oxygen
connected to a trivalent framework aluminium, thus producing a Bronsted acid site whose proton
donor ability greatly exceeds that of amorphous siIica-alumina catafysts. Further heating at 550
O C rnay result in the formation of Lewis acid aluminium sites.
There is an extraordinary range of chemisû-ies possible when organic reactants are in
contact with zeolites and related rnaterial~."~~ Although small pore (&ring) zeolites were the first
to be expIoited as catalysts, it was the medium pore (IO-ring) zeolites such as ZSM-5 which
provided the size- and shape-selectivity that revolutionized the oil industry. The shape selectivity
means that only molecules smaller than the aperture of the zeolite pores can reach the intemal
catalytic sites, and only those reactions with intermediate transition States having geometries
capable of being accomrnodated in the cavities or pores c m be formed and diffuse out. These
matenals are still extremely important in petroleum retining, aromatics processing, and in the
production of synthetic fuels and petrochemicals. More recently applications of the larger pore
(1 2 rings and above) molecular sieves such as the AIP04, SAP0 and MeAPO types have begun
to appear. Isomorphous substitution has also provided new chernical applications inctuding the
use of titanium-containing MF1 in the presence of hydrogen peroxide to achieve shape-select ive
oxidation."
The ability to tailor the reactivity and selectivity of zeolites and related materials to
specific reactions and their characteristic physical properties make them attractive as catalysts.
Additional benefits are gained fiom their heterogeneous nature, which means they may be used
with a variety of reactor designs and are easily separated fiom liquid or gaseous reaction

products. Environmental advantages arise because they are reusable (although they may need to
be regenerated), non-corrosive, and generally non-toxic-
1.2 NUCLEAR MAGNETTC RESONANCE SPECTROSCOPY OF SOLJDS
1.2.1 Nuctear Magoetic Resonance Spectroscopy
Over the last 50 years, hi&-resolution NMR has developed into one of the most
powerful and useful techniques available to chemists for the investigation and elucidation of
molecular structures, particulariy with the availability of superconducting high field magnets and
pulse Fourier transform (FT) spectrometers. The introduction of two-dimensional techniques in
the 1970s greatly expanded the kind of information available fiorn NMR studies.
Four main features characterize a high-resolution NMR spectrum of the liquid state (Le.
solutions and isotropic liquids) and provide chemical information. These are:
(13 the exact resonance frequencies of the signals (also called the "chemical shift"). These are
dependent on the particular nucleus, the strength of the magnetic field, and are characteristic
of the magnetic, and therefore the chemical, environment of the different individual nuclei.
(ii) the relative signal intensity of each resonance which is directly proportional to the total
number of nuclei undergoing resonance.
(iio the multiplet structure arising fiorn spin-spin scalar coupling. This provides information
about the numbers of closely bonded nuclei and on the geometric relationship between them.
(iv) the width and line shape of the resonance. This can provide insight into rnolecular motions.
Many of the magnetic spin interactions are averaged to zero or to their isotropic values
by the rapid random molecular motions in the Iiquid state. In the sotid-state these interactions can
cause severely broadened, relatively featureless, absorption spectra. However, although
additional chemical information compared to that available from Iiquid state spectra is present, it
is usually obscured. The primary objective of high-resolution NMR spectroscopy of solid

samples is usually to reduce or average these interactions, thereby simpliQing the spectra to
recover information about the chemical shifts, intensities, and couplings. For structural
investigations it is possible to recover the threedimensional anisotropic information. The
following sections provide a brief overview of the nuclear spin interactions which are important
in the solid-state, and also of some techniques useful for obtaining "liquid-like" NMR spectra of
solids. For more detailed treatments of the theory and practice of solid-state NMR the reader is
directed to the texts by ~ b r a ~ a m l ' Ernst et ~lichter,~' Engelhardt and ~ i c h e l ? ~ e h r i n ~ . "
and ~ f l e . ~ ~ Other useful NMR theory and background c m be found in references 33-39.
1.2.2 Nuclear Spin Interactions in the Solid State
The interactions for nuclear spins in an applied magnetic field may be divided into five main
categories:"
(a) the Zeeman interaction of the nucleus with the applied magnetic field.
(b) the chemical shift interaction caused by magnetic shielding from the surrounding electrons.
(c) dipoIar interactions with other nuclei.
(4 scalar coupling with other nuclei.
(e ) quadrupolar interactions which are present for nuclei with spins greater than 112.
In the Iiquid state, rapid molecular tumbling averages these interactions to their isotropie values.
However in solids, molecular motions are generally more restricted, and because these
interactions are orientation dependent (anisotropic), they usually have significantly larger effects.
In Table I .2 typical magnitudes of the various interactions for I3c nuclei in solids and liquids are
compared.
A general Hamiltonian, H may be written (Eq. 1.4) which describes the total nuclear spin
interactions as the sum of the individual interaction ~amiltonians."" The subscripts 2, CS. D.
SC. Q and Krefer to the Zeeman, chemical shift, dipolar, scalar coupling, quadrupolar, and
Knight interactions respectively.

With the exception of Hz, the individual Hamiltonians in Eq. 1 -4 cm be general ized:
Here C, is a constant which varies for different interactions, 1 is a quantum mechanical operator
(with components [, 1, and 1,) with the eigenvalues of P being I(I + 1). i is the spin quantum
number which is often referred to as spin, The angular momentum and thus the spin is
h proportional to the magnetic moment p of the nucleus, p = y - 1, where h is Planck's constant.
2n:
This equation defines the gyromagnetic ratio y. K is either an external magnetic field or a nuclear
spin vector. 7 is a second rank tensor which characterizes the magnitude and directional
characteristics of the interaction. Tenson representing the chemical shifl, dipolar, scalar coupling
A A
and quadrupolar interactions are denoted by &, D, J , and Q respectively. The interaction of a
spin 1/2 nucleus with its local electronic environment is incorporated in the chemical shifi
interaction, and in cases where the spin quantum number I is greater than 112, in the quadrupolar
interaction. Spin-spin couplings may be either through-bond or through-space interactions, and
these are represented by the scalar and dipolar coupling interactions respectively. Because
quadrupolar nuclei and rnetals were not investigated in the present work the discussion below
will not include the quadrupolar and Knight interactions.
1.2.2.1 The Zeeman Interaction
The Zeeman interaction is the basis of NMR spectroscopy, and occurs for al l nuclei
possessing a non-zero spinquantum number. As seen from Table 1.2 it is usually far larger than
the other interactions (except for some quadrupolar nuclei). This interaction determines both the
frequency of observation in a given magnetic field, and via the Boltzmann distribution, the

Table 1.2 Typical magnitudes of nuclear spin interactions for 'y in a 4.7 Tesla magnetic field (Afier reference 42).
Table 13 tmportant NMR parameters of selected nuclei. (Data fiom reference 33).
Magnitude in Liquids 1
50 MHz
isotropic value
O
- 200 Hz ,
O
Spin Interaction
Zeeman
C hemical Shielding
Dipolar
Scalar
Quadrupolar Coupling
Magnitude in Solids
50 MHz
up to 1 kHz
- 1 5 k H ~
- 200 Hz
up to - 100 MHz
Natural
Abundance (%)
99.985
0.0 15
1.108
0.3 7
1 O0
1 O0
4.70
100
50.54
1 O0
NucIear
Isotope
'H
'H
13c
'%
' 9 ~
"AI
29s i
"P
7 9 ~ r
1271
Spin Gyromagnetic Ratio
y 1 10' rad T' S-'
NMR Frequency
at 9.4 T / MEIz
400.22
6 1.40
100.58
40.54
376.30
104.22
79.46
161.92
100.22
80.02
1 /2
1
1 /2
1 /2
1 /2
Si2
1 /2
1 /2
3/2
512
26.7520
4.1066
6.7283
-2.7 120
25.1810
6.9760
-5.3 188
10.8410
6.7228
5.3817

tùndamental detection sensitivity for a particular magnetically active isotope. The interaction of a
spin with a static extemal magnetic field Bo c m be described by Eq. 1.6:
The Zeeman interaction is linear with the appIied magnetic field, with larger separations of the
quantized energy levels and correspondingly larger population differences occumng at higher
fields, giving increased sensitivity. Different magnetically active isotopes have characteristic
gyromagnetic ratios and corresponding resonance fiequencies in a given magnetic field strength.
Table 1.3 iists some important NMR parameters of selected nuclei of interest in the present work.
Because of their high natural abundances and large gyromagnetic ratios, 'H, 1 9 ~ , and "P are the
most sensitive common nuclei. Isotopic enrichment is often used to enhance the sensitivity of
other commonly investigated nuclei such as ')c and '% which are of low natural abundance as
weli as having lower gyromagnetic ratios.
In the presence of a static magnetic field Bo the spiiis will align themselves either parallel
or antiparallel with the direction of Bo. A population difference (defined by the Boltzmann
populations of these two levels) creates a net macroscopic magnetization M aligned with Bo. If
this magnetization is tilted by some means so as to make an angle 8 with Bo, it will precess
around Bo at a fiequency a, = 1 y 1 Bo rad s-'. This fiequency is called the Larmor frequency, and
is in the range 10'-109 Hz, which falls in the radio-fiequency (cf.) domain.
The practical method for tilting the magnetization away From its equitibriurn orientation
is to apply an cf. field Bi « Bo, which is perpendicular to & and rotates around Bo with
fiequency o,. To simpli@ the discussion of these effects, a change of reference frarne fiom a
static Cartesian axes system (x. y. z) to one that rotates about Bo at the frequency of the applied
r.f. field (denoted by x ', y ', r ') is used. In this rotating h r n e of reference, the magnetization will
precess around BI at frequency o 1 = 1 y 1 Bi , and if BI is appl ied for a time t, the magnetization
will be tipped away from the direction of Bo by an angle 0 = o, t. After BI is switched off, the

magnetization will precess around Bo. In practice the sample is surrounded with a coi1 (connected
to an appropnately îuned r.f, circuit) which can produce an r-f. field BI (a "pulse"). The coi1 also
detects the induced electromagnetic field following a pulse, which is then arnplified and observed
as the free-induction decay (FiD) of the NMR signal. Fourier trarisfomation of the FID yields
the NMR spectnirn (Figure 1.4).
The rotation of the net magnetization by the pulse cm be controlled by varying either the
power or the time for which it is applied, and a pulse which causes the orientation of the
magnetization to change by 90 degrees is called a d 2 pulse. The relative phase of the applied
field, which determines the direction that the magnetization is tipped can also be controlled. and
the usual convention is that a d 2 pulse applied along the positive x ' axis is denoted as (d2) , and
rotates the magnetization so that it lies along y ' (Figure I.S(a)). The relationship between the
time and frequency dornains, coupled with the relatively broad fiequency ranges that need to be
excited by a pulse in solid-state NMR, means that the strength of BI must be quite high so that
typical d 2 pulses are iess ihan 15 ps. The field strength of a pulse can be deduced from the
fiequency at which the magnetization is rotated. For example a pulse which takes 20 ps to rotate
the magnetization of spin 1/2 nuclei through 360 degrees corresponds to an r.f. field strength of
50 kHz. The ability to control the phases and amplitudes of the pulses, as well as the phase of the
receiver, is crucial for the successful implementation of many NMR experiments, and schemes
that cycle these phases are used to suppress instrumental artifacts and to select specific
coherence pathways.
1.2.2.2 The Chernical Sh~yt Interaction
The chemical shifl interaction is related to the screening or shielding of the applied
magnetic field by the fields induced from the motions of the electrons surrounding the nucleus.
The Hamiltonian which describes this interaction is given in Eq. 1.7.

FID
Figure 1.4 Free induction decay (FID) signal and resulting spectrum (real part only) following Fourier transformation.
Figure 1.5 Illustration of the phase shift of the net magnetization induced by application of: (a) 7~/2~, and (b) Rn, r.f. pulses. The direction of the extemal magnetic tield (Bo) and the r.f. pulse ( B I ) are shown.

In a suitable axis frame (the principal axis system), 6 becomes diagonal, with principal
(diagonal) elements o, o,, and o,. Because rapid molecular motions occur in liquids, the three-
dimensional nature of the interaction (which potentially contains diagnostic structural
information) is averaged to its isotropic value ch = (a, -+ o, + o,) / 3, and a single NMR
resonance is observed at the isotropic chemical shift ah. Generally in solids, molecular motions
do not cornpletely average the chemicat shift anisotropy (CSA). For single crystals, sharp lines
wilI be observed whose resonance fiequencies depend on the orientation of the crystal (and
therefore the nucleus in the molecular coordinate system) relative to the applied static rnagnetic
field. in the case of microcrystalline (powder) samples, every crystallite orientation is possible,
and each has its own resonance frequency. The resulting spectnim is the sum of al1 of these
resonances, and is thus very significantly broadened. However this may not be the only
interaction responsible for broadening the spectra (see below). The exact shape of the absorption
observed in the spectrum wiIl depend on the principal elements of the chemical shift iensor."
The chemical shift interaction has a linear dependence on the strength of the applied magnetic
field, and will thus make a larger contribution relative to the dipolar interaction (which has no
field dependence) at higher fields. The range of fiequencies covered by the chemical shift
broadening of a single resonance in solids is similar to, or larger than, the whole range of
isotropic chemical shifts values found for Iiquids.
1.2-2.3 The D i p o h Interaction
The dipolar interaction is the interaction between the magnetic moments of nuclear
spins; spin 1 experiences the magnetic field of spin S with the Hamihonian given by:

In iiquids the fast random molecular motions yield an isotropic value of zero for the dipolar
A
couplings (because D is a traceless tensor). In solids, however, molecular motions are more
restricted, and so the dipolar interactions are usually not averaged to zero. The dipoledipole
interaction is an entirely through-space coupling, and can be either hornonuclear (e-g. 'H-'H) or
heteronuclear (e-g. 'H-"c) in nature. The magnitude of the dipolar coupling is dependent on the
gyromagnetic ratios, the distance between the spins, and the orientation of the intemuclear vector
with respect to the appiied static magnetic field. Unlike the chernical shift interaction, the
magnitude of the dipolar interaction is independent of the strength of the applied magnetic field.
For a pair of heteronuclear nuclei I and S the Hamiltonian can be written as:
where D is the dipolar coupling constant (in Hz) defined by:
p,, = 4x x 1 O-' kg m s" A" is the permitivity of free space, r is the distance between the two
nuclei (in metres), the gyromagnetic ratios y, and ys have units ofrad s-' TI, and 9 is the angle
between the internuclear vector and the direction of the applied static rnagnetic field.
The strong inverse dependence of the dipolar coupling on the intemuclear distance ( D 9
1 / ? ) means that the magnitude of the dipole-dipole interaction decreases rapidly with
increasing separation of the nuclei, and thus only neighbouring nuclei will experience a strong
coupling. This distance dependence can be used to accurately determine distances between pairs
of nuclei. Because dipoledipole interactions are directly proportional to the gyromagnetic ratios
of the two nuclei, dipolar couplings will be more important for systems containing nuclei with
large gyromagnetic moments such as 'H and 1 9 ~ . Conversely, exchange of abundant spins having

large gyromagnetic ratios by an isotope with a lower y (e-g. replacement of 'H by 'H) can be a
very effective rnethod for reducing dipolar broadening.
1.2.2.4 The Scafar Co upling Interaction
Scalar coupling, also called J-coupling, arises fiom indirect coupling between spins, and
is rnediated by the bonding etectrons. Like the dipolar interaction, the scalar interaction can be
either homo- or heteronuclear in nature, but it is a through-bond, rather than a through-space,
spin-spin coupling. The multiplet structure arising fiom J-couplings between two or more spins,
and the magnitudes of these couplings, often provide very usehl information about the
conformations and structures of molecules. The Hamiltonian for the heteronuclear scalar
interaction between spins I and S can be written as:
Scalar couplings are independent of the magnitude of the applied magnetic field, and are usualty
smaller than the other interactions in solids (see Table 1.2), by which they are often
overshadowed in the solid-state. The magnitude of the scalar coupling drops rapidly as the
number of intervening bonds increases, but is very similar in liquids and solids, only differing if
the molecular geometry is altered with the change of state.
1.2.2.5 Surnnrary of Interactions
The relative importance of the different nuclear spin interactions which contribute to
NMR spectroscopy in the solid state will depend on the nucleus being observed, the static
magnetic field strength, and the particular system being studied. The critical feature of these
interactions is their orientational dependence, and the relatively restricted motions in solids
means they are usually not averaged to their isotropic values. Although the NMR spectra of
solids may have linewidths of up to several thousand hertz, they potentially contain more
information than solution spectra because the individual principal components of the various
tenson may be determined, and these describe the threedimensional character of the
interactions. Usually however, NMR spectra of solids must be simplitied by obtaining higher
resolution if structural information is to be readily extracted, and the next section introduces
techniques developed for this purpose.
1 . 2 Techniques for Obtaining "High-Resolutionn NMR Spectra from Solids
The orientation dependence of nuclear spin interactions in the solid state means that
NMR spectra of powdered solids can have linewidths of several kHz. Two main approaches are
used to average or reduce these in order to obtain high resolution spectra of powders. The first
kind involves the use of mechanical reorientations or rotations of the sarnple, and this includes
the techniques of Magic Angle Spinning (MAS), Dynamic Angle Spinning (DAS) and Double
angle Rotation (DOR). These techniques work by averaging the spatial parts of the spin
Harniltonians, and have recently been reviewed by Chernlka and ~wanz i~e r . ' ~ DAS and DOR are
specifically used for quadmpoiar nuclei, where the second order terms need to be averaged.
The second approach is to reduce or average the spin part of the Hamiltonian through the
use of r.f. pulses. This rnay be further divided into techniques used for decoupling hetero- and
homonuclear interactions, which rnay be achieved by using high power decoupling and multiple
pu Ise schernes, respectively. Multiple pulse sequences including WAHUHA," M REV-8," and
BR-24? rely on carefully chosen cycles of pulses (and the phases of these) to average the
dipolar interactions to zero. The chemical shift anisotropy is scaled but not removed by these
multiple pulse techniques.47 Combinations of mechanical reorientation and pulse techniques can
be used for homonuclear decoupling (e.g. Combined Rotation and Multiple Pulse Scheme or
CRAMPS.~" MAS with high power decoupling is by far the most common technique for
heteronuclear decoupling. The following discussion will be resû-icted to high power
heteronucIear decoupling and MAS as these were the techniques employed in this research.
I.Z.3.Z High Power Decoupling
For most dilute spin-I/2 systems (e.g those having a low concentration of magnetically
active nuclei such as "C and "si which are of low isotopic abundance), the major source of
linebroadening in the solid-state NMR spectrum is heteronuclear dipolar coupling to other
abundant spins such as 'H and 1 9 ~ . It is possible to eliminate these heteranuclear interactions by
applying a strong r.f. field at the Larmor fiequency of the abundant spins. This resonant
irradiation causes rapid transitions of the abundant nuclei between their two spin States, with the
result that their average contribution to the effective local field is zero, and so no net
heteronuclear coupling interactions are observed for the dilute nuclei. To be effective, the
strength of the applied r.f. field must be such that the fiequency of the abundant nuclei spin-fiips
is comparable to (or preferably exceeds) the heteronuclear coupling frequency. In typical systems
this requires r.f. fields of the order of gauss, requiring amplifier powers in the range of hundreds
of Watts compared to the ca. 50 W decoupling fields used in liquid state spectroscopy. Another
consideration is that these decoupling fields ofien need to be applied throughout the entire pulse
sequence and the data acquisition, meaning that the amplifiers must be capable of providing
stable r.f. fields for hundreds of milliseconds.
1.2.3.2 Magic Angle Spinnhg
As discussed above, chemical shift anisotropy, dipolar and quadrupolar interactions can
result in linebroadening for solids. These interactions have a fint-order orientational dependence
which contains the terrn (3 cos% - l), where 9 is the angle between a specific molecule-fked
vector and the applied static magnetic field Bo. For the dipole-dipole interactions it is convenient
to use the intemuclear vector r. In solution, fast, random molecular tumbling averages the value

of (3 cos% - 1) to zero. Independently, both hdrewJq and ~ o w e ~ ' realized that tirnedependent
motions could be imposed on a solid to mimic or approximate the isotropie molecular motions in
Iiquids. As an exarnple we will consider the dipolar interaction. Rotation of a solid sample about
an axis at an angle 8, with respect to Bo causes the vector r to trace out a conical path described
by the angles a and P as shown in Figure 1.6. ï h e average value of (3 cos% - 1) over the conical
path is given by Eq. 1.12. where or is the angular velocity of the rotation (sample spinning), and
the brackets < > indicate that it is an average over the rotation."
3 + - [sin20, sin2P cos(w, t + a) + sin' 0, sin'p cos(20r t + a)] 2
In a rigid solid P will be constant for a given crystal in the spinner. However for a powder
sample each individual crystailite can be at a different (random) orientation with respect to Bo
and so B E [O, n]. A suficiently high value of w, 'ifast" spinning compared to the frequency
of the interaction) will average the time dependent parts cos(20r t) and cos(o, t) to zero." The
1 - (3 cos' 0, - 1 ) term acts as a scaling factor, and the angle 8, is under the control of the 3 -
i l experimentalist. If 8, = cos- - = 54.74O, then (3 cos28, -1) = 0, and so O cos' 9-1> = O for al1 f i
crystallite orientations (al1 values of P). This improves the resolution in the NMR spectrum by
eliminating broadening arising fkom the chernical shift anisotropy as well as homo- and
heteronuclear dipole-dipole interactions. The angle 54.74' is called the "Magic Angle", and
spinning samples about an axis inclined at the magic angle to the static magnetic field is referred
to as Magic Angle Spinning or MAS." However, the sample rotation rate required must be
greater than the frequency of the dipolar couplings which need to be averaged to zero so spinning
speeds of the order tens of kHz are usually required. At present speeds of 2-1 5 kHz are routinely
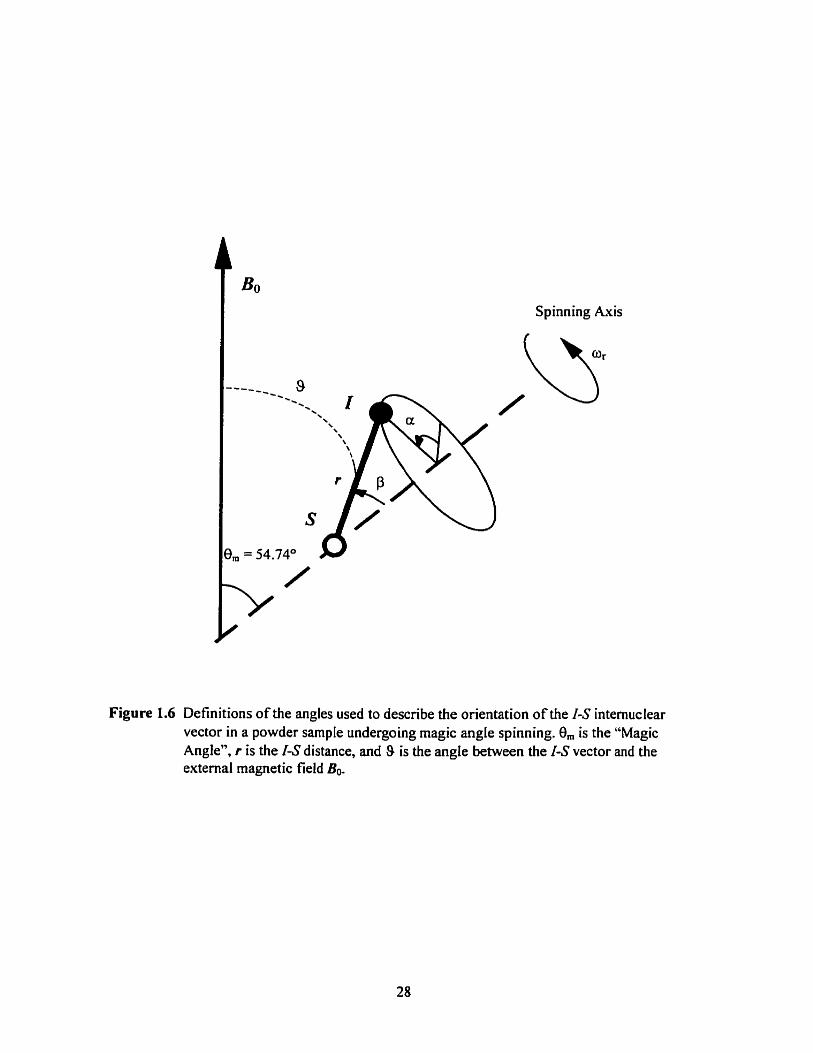
Spinning Axis
Figure 1.6 Definitions of the angles used to describe the orientation of the I-S internuclear vector in a powder sample undergoing magic angle spinning. 0, is the "Magic Angle", r is the 1-S distance, and 9 is the angle behveen the I-S vector and the externa1 magnetic field Bo.

available, and for small diameter spinners (< 5 mm), frequencies in excess of 30 kHz can be
attained.
The problem of homonuclear broadening is elirninated if the nucleus being studied is of
low natural abundance (e-g. 13c, "si, see Table 1.3) since the NMR active nuclei are dilute in the
sample. For nuclei of high isotopic abundance it is possible that physical ditution is achieved due
to the nature of the sarnple, or that it can be introduced through isotopic exchange as is oflen
done for hydrogen nuclei (i-e. exchange of 'H by 'H).
For di lute nuclei where homonuclear interactions are weak, fast MAS and high power
decouphg can be used to average the dipole-dipole interactions to their isotropic value.
Spinning the sample at frequencies lower than the frequency width of the chernical shift
anisotropy powder pattern does not completely average the time dependent parts of Eq. 1.12.
This produces a series of "spinning sidebands" in the spectnim, centered at the isotropic
chemical shif?, and spaced at multiples of the spinning speed. The intensity envelope of these
spinning sidebands mimics the chemical shift anisotropy observed in the spectrum of the static
sarnple (the -'powder pattern"). Figure 1-7 illustrates these effects. Since the chemical shifi
anisotropy is proportional to the strength of the applied magnetic field, the sideband pattern will
be larger at higher magnetic fields for a given spinning rate. Information about the full anisotropy
(averaged by MAS) is retained in the sideband pattern, and appropriate analysis of the sidebands
can be used to determine the principal tensor components, but not their orientation.j2 Methods for
suppressing these sidebands under MAS have also been reported."".
As discussed above, MAS is capable of averaging some of the anisotropic interactions to
their isotropic values. This is a time-average over each complete rotation of the sample, and the
magnitude of a given interaction is not equal to the isotropic value at every instant during the
rotor cycle. The anisotropic parts are still present and result in dephasing of the spins
irnmediately following the application of an r.f. pulse. However, at the end of each rotor penod
following the pulse, al1 of the spins will be back in their onginal positions. This refocusing of the

v, = 100 Hz
Stationary
Figure 1.7 13c ('H decoupled) spectra obtained for a powder m p l e of ferrocene, (CsH&Fe The spectra were recorded: (a) for a stationaq sample, and (b)-(e) using MAS at the rotation speeds v, indicated. Adapted from reference 56.

spins after each rotor cycle is ofien referred to as a "rotational echo"?
Because the rnajority of the experiments used in the research reported here were
performed under MAS conditions and relied upon the dipolar interactions or involved the
determination of the dipolar coupling, the effects of MAS on the dipole-dipole interactions will
now be discussed.
Spinning the sample sufficiently fast about an axis inclined at the magic angle averages
the dipolar coupling to zero over a complete rotor cycle. However the dipole-dipole interaction
does not vanish - in fact only those spin pairs whose internuclear vectors are paral tel to the
spinning axis will have a dipolar coupling of zero at al1 times during a rotor cycle . For a11 other
orientations the dipolar coupling is still present and changes continuously during the rotor penod.
Eq. 1.13 gives the time dependency for the dipolar coupling under MAS."
Here a and p are the azimuthal and polar angles respectively, and define the position of the
intemuclear vector as shown in Figure 1.6. The value of the dipolar coupling has a periodic
dependence on the rotor cycle, and since only the time average of the dipole-dipole interactions
over each cycle are zero, the dipolar coupling can still be utilized to investigate connectivities
and measure distances between nuclei. Solid-state NMR techniques specifically designed for this
purpose (e.g. REDOR and TEDOR) are discussed in detail in Chapter 3.
1.2.3.3 Cross Pularizalion
For dilute spin-112 nuclei, direct one-pulse NMR experiments oflen suffer from two
disadvantages: inherently low sensitivity and the requirernent of long recycle delays due to the
relatively long TI relaxation times. The cross polarization (CP) technique, first introduced by
Pines, Gibby and waugh," can often eliminate these disadvantages. During the CP experiment
spin polarization, and thus net magnetization, is transferred via dipolar interactions from
13 abundant I spins (usually 'H) to the dilute S spins (e.g. C, '%J, or 29~i) , which are then observed.
The CP experiment provides enhancement of the S spins magnetization up to a theoretical
maximum factor given by the ratio of the gyromagnetic ratios of the two spins, y1 / y.~, which can
be as large as 4 for 'H-'~c, and 5 for ' H - ~ ~ s ~ . The recycle delay for the CP experiment is
determined by the Tl of the (abundant) Ispins, and these are ofien much shorter than those of the
observed (dilute) nuclei. This means that more FtDs can be accumulated in a given time period.
resulting in improved signal to noise in the final CP spectrum compared to a one-pulse
experiment.
Figure 1.8 shows the pulse sequence used to accomplish the magnetization transfer from
I to S spins and a representation of the behaviour of the magnetization vectors during the CP
experiment. Initially both Iand S spins are at their equilibrium magnetization distributions. A 7û2
pulse along x ' is applied to the I spins, rotating the magnetization along the y ' axis in the rotating
frame. The application of an on-resonance r.f. field with strength BI, along y ' spin-Iocks the I
spin magnetization along this a i s , which it precesses about with frequency = y, Bi / . During
this spin-locking pulse, an r.f field Bis is applied (along the x ' axis) to the S-spins, causing them
to rotate about the y ' axis with angular frequency ois = ys BIS. The time period for which both r.f.
fields are applied is known as the "contact time". During this contact time, s, net S spin
magnetization builds up along the direction of the applied Bis field. Following the contact time,
the BIS r.f. field is switched off and the S spin FID signal is recorded. The I spin r.f. field is lefi
on during the acquisition and acts as a decoupling tield. The process is repeated after an
appropriate recycle delay, with suitable phase cycIing of the pulses to remove instrumental and
phenomenological effects.
For efficient magnetization transfer to occur during the contact tirne, the amplitudes of
the r.f. fields applied to the Iand S spins must be adjusted so that the Hartmann-Hahn matching

1 SPIN LOCK DECOUPLE
APP~Y 41 I spins precess , * - 9 to spin lock around y' axis
V I
_II)
RECYCLE DELAY
1
Apply matched S spin magnetintion , r r.f. field BIS to builds up in direction ), *:spins f B;;uring r -
Y'
X' + +
X' 4 s X' BIS
1 I
b
Figure 1.8 (a) Puise sequence for the Hartmann-Hahn spin-locked cross polarkation experiment. (b) Vector representation showing the spin Iocking of the I spins and the build-up o f the S spin rnagnetization during the contact time s.
ACOUIRE
S CONTACT PULSE
9
a
FID I'
Y

condition is met? For spin-IR nuclei undergoing MAS, the Hartmann-Hahn match is described
by Eq. 1 .14:~
Ys BIS = YI BI/ *f 0, 1.14
where or is the spinning fiequency and f = 1 or 2. If the Hartmann-Hahn condition is satisfied
then the Zeeman level separation in the rotating h e are equal for both the I and S spins, and
therefore mutual spin-flips c m occur. The mutual spin-flipping allows the transfer of potarization
between the two spin systems via I-S dipolar interactions. The spin-locking method described
above is not the only means for establishing cross polarization, and some other techniques are
discussed by ~lichter:' Pines et al." and th ers.^
Historically, CP has been used to transfer spin polarkation from abundant spins to di lute
spins, with protons being used almost exclusively as the abundant spins. There have been some
examples where other nuclei, particularly 1 9 ~ , have been ~sed .~ '~ . ' Schaefer and CO-workers6'
reponed magnetization transfer between "C and '%J in isotopically enriched materials and
successfully demonstrated elegant triple-resonance "Double Cross Polarization" experirnents
involving initial polarization transfer frorn 'H to "C followed by a second magnetization transfer
to '%. Recently Fyfe et al. dernonstrated the fint CP experiments involving polarization transfer
from quadrupolar nuclei ("AI) to spin-1/2 nuclei (''si and Several reviews of CP
experiments involving Iess common pairs of nuclei have been published.67-6~urther details of
the cross polarization experiment are discussed Chapter 3 and reference 70.
1.2.4 NMR Relaxation Processes
The presence of molecular motions causes a fluctuation of the anisotropic magnetic
interactions that provides a well-defined relaxation mechanism for the nuclei via modulations of
the spin interactions." Shielding anisotropy, scalar and spin rotation interactions, dipole-dipole
interactions and interactions with unpaired electrons can al1 provide relaxation pathways under

the appropriate conditions." The most important relaxation mechanism in both homo- and
heteronuclear spin systems in the majority of situations is via dipoledipole interactions between
the nuclei." The measurement of relaxation times is a powerful technique for the detection and
quantification of molecular motions. The three relaxation times which are commonly measured
wiil be briefly discussed below,
1.2.4.1 Spin-La!îice Relaxation Tinte (Tl)
Spin lattice relaxation is the process by which a population difference between two spin
States returns to its equilibrium value afier a perturbation. This is assumed to be a first order
kinetic process which is exponential in nature and is described by Eq. 1.15. Mo is the equilibrium
magnetization, and Tl (units of seconds) is the reciprocal of the kinetic rate constant which is
referred to as the spin-lattice relaxation tirne.
The name spin-lattice relaxation is derived from the fact that the process involves a transfer of
Zeeman energy from the "excited" spins to the surrounding environment or "lattice." Because
spin-lanice relaxation involves the restoration of magnetization aIong the z-axis it is sometimes
referred to as "longitudinal" relaxation. Five times T, after a perturbation more than 99% of the
magnetization is recovered.
The Inversion-Recovery experirnent is comrnonly used to measuring Ti is (pulse
sequence: x - r - d 2 - acquire - recycle delay). TI is determined from the variation of the signal
intensity as a function of the delay r. A disadvantage of the Inversion-Recovery experirnent is
that some prior knowledge of the approxirnate Tl values is required to ensure that the recycle
delay between successive scans is long enough to permit the magnetization to recover

suficiently for a quantitative detemination. For solids Tl can be of the order of seconds to hours
which can mean very long recycle delays are needed.
The use of cross polarization can drarnatically improve the eficiency of the Inversion
Recovery experiment through increased sensitivity (up to 4 in the case of 'H-"c), and because
the recycle delay during a CP experiment wiIl be determined by the (usually) much shorter Tt of
-7
the abundant spins. -
1.2.4.2 Spin-Spin ReIaxation T h e ( Tz)
When a rd2 pulse is applied to an ensemble of spins initially at equilibrium in a static
magnetic field, the net z-magnetization is rotated into the x-y plane. Fol lowing this perturbation,
spin-spin relaxation occurs via the exchange of spin energy brought about by mutual spin-
flipping of the spin-states of different nuclei, and by dephasing that occurs due to
inhomogeneities in the magnetic field. These spin-fiips change the net magnetization along the x-
and y-axes (Mx and My respectively), but do not change the total Zeeman energy of the spin
system. Because this relaxation occurs in the x-y plane it is sometimes also called "transverse"
relaxation. Assuming that we can describe this process as exponential, we can define a time
constant T2 which is the reciprocal of the first order kinetic rate constant governing the spin-spin
relaxation in a perfectly homogeneous magnetic field (Eq. 1.1 6). A similar expression can also be
written for 4.
Any inhomogeneity in the magnetic field will cause the relaxation to proceed more rapidly, and
the time constant T?' < T2 is used to denote the relaxation tirne in the presence of such
inhomogeneities.

A spin-echo experiment (d2 - r - n - r - acquire - recycle delay, Figure 1.9(a)) c m be
used to measure T?. The initial d 2 pulse tips the magnetization into the x-y plane, then afier a
time r, a K pulse is applied which inverts the direction of the dephasing. This causes the spin-
coherence to be refocussed, producing an "echo" at tirne 2r (Figure 1.9(c)). The x-pulse also
refocusses the c hemical shifts and the effects of any inhornogeneities in the applied static
magnetic field Bo, [n practice T2 is usually determined using the Cam-Purcell-Meiboorn-Gill
(CPMG) sequence which generates a train of echoes separated by 2t, whose peak intensities
decay with time constant Tz. The decay of the individual FIDs is determined by T; (Figure
1 -9(b)).
For solid samples under MAS conditions, it is desirable to chose the delays between n
pulses to be integrai multiples of the rotor period T, = UV,, (v, is the spinning fiequency of the
sample in Hz) to ensure that the dipolar interactions and chemical shift anisotropy are properly
averaged to zero for each experiment. Cross polarization can atso be used to improve the
eficiency of the Spin-Echo experiment.
1.2.4.3 Spin-Lanice Relaxation T h e in the Rotating Frarne (TI,)
As described above, spin-spin relaxation as described by fi normalIy occurs foilowing a
d2-pulse ; however if another r.f. pulse which has its phase changed by 90" is applied
immediately after the initial pulse, a different situation arises. In the rotating fiame an initial rd2
pulse applied along x ' will rotate the magnetization fiom z ' and generate a net magnetization
along y '. if a second pulse is applied along y ' (Le. the phase of the applied r.f. field BI is shifted
by 90°) then the magnetization will precess about 4 (in the rotating frame) rather than decay due
to T'O. Because this second phase-shified pulse effectively "locks" the magnetization along the
axis parallel to Bi it is called a "spin-locking" pulse, and while this BI r.f. field is applied the
spins are said to be "spin-locked". However this spin-locking BI field also acts as a static
magnetic field in the rotating frame, and relaxation analogous to conventional spin-lanice

SPIN @)
-' Direction - reversed
\
-' - - 1
Spins refocus -
t = r Apply n,, pulse t=22
Figure 1.9 The spin-echo pulse sequence showing: (a) the timing of the pulses, and (b) the decay and formation of the echo of the fkee-induction decay (FID) signal. The FID decays with a time constant Tz* (< G), white the echo amplitude decays with a time constant T2 (the mie spin-spin relaxation time). (c) A vector representation showing the progressive dephasing and the refocussing of the transverse magnetization spin isochromats during the spin-echo sequence.

relaxation occun, with characteristic time constant Tl,
Spin-locking is an essential component of the CP technique used for solid-Gate NMR,
and thus Tlp is an important parameter in the analysis of CP experiments. To measure Ti, the spin
Iocking pulse is applied for a variable time T after which the FID is detected. The variation of the
obsemed signal intensity 1 with r allows Ti, to be determined from Eq. 1.17 where 10 is the full
signal obtained when r = 0.
1.2.5 hternuclear Distance Measurements by Solid-State NMR
The combination of high power decoupling and MAS usually provides the necessary
resoiution to obtain chemical and stmctural information from dilute spins in solids. However
during MAS the heteronuclear dipolar interaction is averaged to zero during each complete rotor
cycle''7 and thus in its simplest form, the use of MAS precludes a direct measurement of D.
Several techniques for measuring heteronuclear distances from determinations of the
heteronuclear dipolar coupling have been reported. These include Spin-Echo DOuble Resonance
(SEDOR),'~ Rotational Ec ho Triple ResOnance (RETRO)," Rotational-Ec ho DOuble Resonance
- (REDOR)," Transferred Echo DOuble Resonance (TEDOR),'~ and others.' Techniques which
utilize the homonuclear dipolar interaction to obtain information about internuclear distances
between spins in solids possessing the same gyrornagnetic ratio have been devised. These include
RF Driven Dipolar Recoupling (RFDR),'~ Dipolar Recovery at the Magic Angle (DRAMA),"
Simple Echo Excitation for Dephasing of Rotational Echo Amplitudes (SEDRA)? Dipolar
Recoupling with a Windowless Sequence (DRAWS)," and others."*' These have been recently
reviewed by Bennett et aL8'

With the exception of SEDOR, al1 of the techniques Iisted above were explicitly
designed to function under MAS conditions, and with appropriate analysis to alIow the
magnitude of the dipolar coupling, D to be measured. Because D is inversely proportional to the
third power of the heteronuclear distance, r (Eq. 1.1 O), these experiments are capable of
providing considerable insight into molecular structures. Moderately accurate values of dipolar
couplings can yield very accurate values for the corresponding intemuclear distances. While the
most unambiguous distance measurements will corne fiom experimental systems where the
heteronuclei I and S interact as isolated spin pairs, these techniques also permit the
discrimination between different structural models for cornplex systems.
To date the most successfu1 techniques for determining reliable (and accurate)
measurements of the heteronuclear dipolar coupling for isolated spin pairs seem to be REDOR
and TEDOR. Cross polarization also depends on the heteronuclear dipolar interaction, and can in
principle be used to obtain heteronuclear distance^."^ These three methods were used
extensively in the research presented in this thesis, and the reader is referred to Chapter 3 for
detailed descriptions of the theory, pulse sequences and caIcuIations used to extract distance
information.
1.3 INVESTIGATIONS OF ZEOLITE FRAMEWORKS AND GUEST SPECES
The use of diffraction techniques, solid-state NMR, and computer modelling to
determine framework structures and investigate the guest species within the channels and cages
of molecular sieve materials will be outlined in the following sections. Potential problems related
to the application, and reliability of the various methods will also be discussed.
13.1 Structure Determinations by Diffraction Techniques
As discussed in Section 1.1, there is considerable interest in investigating the detaiied
three-dimensional lattice structures of zeolites and related materials, and locating guest species

within them. Although these materials are normally highly crystaliine, the stmctural infomation
obtainable from X-ray diffraction measurements is often severely 1 imited for the reasons outlined
in Section 1.1.4. In light of these dificulties, it is remarkable that several hundred framework
structures have been s~ lved . '~ However, there is relatively little direct experimental information
regarding the exact location of the various guest species within the channels and cages of the
microporous frameworks, A few structures have been solved for as-synthesized microporous
materials where the location of the organic template has been determined: however this is not
always possible, and sometimes the results are arnbiguous.
In general, even in cases where the framework structure is known, it is usually not
possible to locate the occluded guest species. To date, there have only been six detailed single
crystal structures which locate sorbed organic guest molecules (other than templating species) in
the ftamework, a11 involving the MF1 (ZSM-5) framew~rk. '"~ ' '~~~-~~ There have been some powder
X-ray and neutron di ffiact ion investigations which have tried to locate ionic temp lating species
or sorbed organic species, but often there is disagreement between the various studies. For
example, the structures of the host-guest complexes formed by benzene in zeolite Y, and pyridine
in zeolite L have been determined from neutron powder diffraction st~dies,"'~ and several
groups have attempted to locate p-xylene or pdichlorobenzene in ZSM-5." However in the case
of the p-dichlorobenzene in ZSM-5, the location proposed from the powder data was not the
same as found Iater by a more reliable single crystal study?.""
Structural determinations of such host-guest systems can also be complicated by the fact
that the structure c m depend on both the temperature and the number of the guest molecules
sorbed pet unit ce11. '~ '~~ The sorbed species may be disordered or quite mobile at ambient
temperature. Furthennore, sorbates of a simiIar size and shape may show powder diffraction
patterns with peaks at virtually the sarne 28 values, but large difTerences in the peak intensities.
Such a case was observed by Fyfe et al. for several organic sorbates in ZSMJ.'"."~ The
observation of intensity differences in the X-ray powder patterns implied that the sorbates are

more or less ordered fie. they are located at specific sites within the frarnework), since
disordered guest molecules would only contribute to d i f i se scattering and this was later
confirmed by single crystal structure determinations. 19.20.89
Recent advances in the use of computer modelling methods have meant that these
techniques are beginning to correctly predict both the framework structures and the locations of
guest species (see Section 1.33). At present however, these calculations are not always reliable.
and other techniques capable of providing detailed structural information need to be developed.
As will be outlined in the next section, solid-state NMR is capable of providing information
which is extremely helpful in structure elucidations of microporous materials and their
complexes with guest species.
13.2 NMR Studies of Zeolite Frameworks and Guest Species
Several reviews which discuss the application of solid-state NMR to microporous
materials have been published inc tuding the cornprehensive book by Engelhardt and ~ichel ,J '
106.107 and shorter reviews by Fyfe et a~,~*'-'" and others. Virtually al1 of the atoms making up the
Frameworks of zeolites and related microporous materials have NMR-active nuclei, and can thus
I I be studied by solid-state NMR. These include, among others, B, "O, "AI, %i. "P, and a a. In
addition, 'H nuclei may be present in the h e w o r k structure as hydroxyl groups. Many of the
guest species which can occupy the channels and cages in molecular sieves are also amenable to
investigation by NMR. For instance, the templating species and sorbed organic molecules
contain 'H, "C and sometimes '%, and the major@ of the exchangeable charge-compensating
cations have NMR active isotopes (e.g. ' ~ i , %a and 133~s) . This section will briefly review the
information that can be obtained fiom one and two-dimensional solid-state NMR investigations
of the frameworks and the guest species.
1.3.2.1 One-Dimensional AMR Studies of Zeoliie Frumeworks
The important nuclei that are commonly present in the h e w o r k structures of
microporous materials (and their natural abundances) are: 'H (100%), "O (0.04%). "AI (1 00%).
29 Si (4.7%), and 3 1 ~ (100%). Other nuclei such boron, gallium, germanium, titanium, cobalt, and
vanadium, which have NMR-active isotopes may also be present in certain cases. MAS usually
yields particuiariy simple NMR spectra for the spin-1/2 nuclei such as "si and 3 ' ~ . The NMR
spectra of the quadrupolar nuclei are much more cornplex, but are capable of providing
additional information regarding their Iocal environments. The use of high magnetic fields,
ultrafast spinning, and techniques such as Dynamic Angle Spinning and Double-Angle Rotation
simplifies the NMR spectra of these quadrupolar nuc~ei . '~* '~ Although oxygen is a very
important cornponent of the framework, its extremely low naturai abundance means that isotopic
enrichment rnust be used if it is to be profitably studied by NMR, and thus relatively little
research has been done on it. In a few cases. DAS N M R of 170-enriched samples has been able to
resolve crystallographically distinct framework oxygen sites.'lN The ovenvhelming majority of
solid-state NMR studies of molecular sieve frameworks have been devoted to 'H, 2 7 ~ 1 , ' 9 ~ i . and
3 1 ~ and these will be discussed below.
The 2 7 ~ 1 MAS NMR spectra of aluminosilicates generally show hvo types of resonances
reIated to the usual tetrahedral and octahedral coordination geometries of Al within these
materials. The tetrahedrally coordinated Al is actually in the framework, and has a chemical shift
in the range 50-65 ppm (referenced to aqueous [ A I ( H ~ O ) ~ ] ~ ~ ) . In virtually al1 cases, only a single
resonance is observed for these tetrahedral aluminiums, and so crystallographicalIy inequivalent
Al-sites are not distinguishable. Only in the case of zeolite omega have crystallographically
inequivalent AI-sites been resolved.""he octahedrally coordinated Al (which usually gives rise
to a peak at about O ppm) is due to "extra-hework" aluminium, that is, aluminum species
within the pores. and not part of the framework. The high sensitivity of " ~ l NMR, and the ability
to readily distinguish the two types of Al, have meant that " ~ l NMR has been extensively used

to study the deahmination of zeolite lattices, and to investigate the efficiency of various
treatments designed to remove any extra-framework Al species following dealumination. 32.105
The ' 7 ~ 1 MAS NMR spectra of AIP04s ofien show single resonances due to
tetrahedrally-coordinated (to four P atoms because there is strict AiP lattice altemation in these
matenals), Upon hydration, some frarnework Al in AIPOjs may also coordinate two molecuies of
water, changing its coordination fiom bfold to 6-fold, and this is readily detected by "AI MAS
NMR. The 3 1 ~ nuclei in these materiais are always tetrahedrally coordinated. and often only a
single signal is observed in the 3 ' ~ MAS NMR spectrum. However, for AIPOd-8 and VPl-5 and
others which have complex unit cells, several well-resolved resonances corresponding to the
different T-sites have been obser~ed.~'
' 9 ~ i MAS NMR spectra have yielded a wealth of information about the framework
structures of zeolites, and the temperature and sorbate induced changes they sometimes undergo.
For low SilAI ratio zeolites, the ->si MAS spectra of the simplest systems show five resonances
which could be assigned to the five possible distributions of Si and Al atoms about a silicon
nucleus at the center of an Si04 tetrahedron: Si[4AI], Si[3AI, 1 Si], Si[2AI92Si], Si[ I AIJ Si], and
Si[4Si]. The chemical shift ranges for these resonances are reasonably characteristic. (Figure
1-10) although they overlap and care must be taken in their use. The SVAI ratio of the framework
may be calculated from the %i MAS spectra under the assumption that Loewenstein's rule"'
(which postulates that Al-O-AI linkages in the h e w o r k should be avoided if possible) holds.
Because this yields the SilAI ratio for the framework, it is complementary to that provided by
bulk chemical analysis, which determines the total Al content of the sample (Le. elemental
analysis also includes any Alcontain ing species occluded within the pores).
The resonances in the ' 9 ~ i MAS NMR spectra of Iow Si/AI ratio zeolites are quite broad
(5 ppm), however if the aluminium is removed (e.g. by hydrothermal or chemical treatments),
then highly siliceous frameworks can be obtained. If the lattice structures of these highly
siliceous zeolites are also well ordered (i-e. highly crystalline), then the spectra will show narrow

Figure 1.10 (a) The five possible lociil environments of ii Si utom in a zcolite frarnework and the corrcsponding chernicul shin runps. ( b ) 2 9 ~ i MAS N M R spcctrum of a NaY zeolite (SiIAI ratio of 2.6) with the resonances for thc five differcnt silicon cnvironments resolved. A fter re ference 112.

resonances due only to Si[4Si]. With careh1 optimization of the experimentat variables and
instrumentation, ulûa hi& resolution NMR spectra with peak widths of ca. 0.1 pprn can be
obtained in the best cases as depicted in Figure 1.1 1.
The excellent resolution of these spectra can be exploited to obtain very useful structural
information that is not readily obtainable by other techniques. Fyfe et al. and others have
reported high resolution ' 9 ~ i MAS NMR spectra for a number of highly siliceous zeolites and
related materials including ZSM-5,""' ZSM- 1 1 , I lJ ZSM- 12,"' Z S M - ~ ~ ~ ' ) , Z S M - ~ ~ . ' ~ ~ ZSM-
39.lI6 DD~R,"' decad~decasil,"~ offretite,l19 and mordenite."' In these spec- the individual
resonances correspond to crystalIographicaIly inequivalent T-sites. With appropriate care,
quantitative spectra can be obtained wherein the relative peak intensities reflect the populations
of the different T-sites. This allows a direct link to be made between the NMR spectra and the
information provided by diffraction methods. While NMR is sensitive to the local (short range)
ordering, diffraction methods reflect the long range ordering in the lattice, and the
complementary nature of the two techniques has been exploited to elucidate the detailed
structures of several microporous materials. IO4 120-122
In a few cases the number of resonances and relative intensities may provide sufficient
information to allow the individual peaks to be unambiguously assigned to specific T-sites in the
lattice (e.g. zeolite offretite"?. In other cases there may be accidental degeneracies (e-g.
mordenite"'), or several resonances with equal intensities, which means that the assignments can
not be obtained from the 1-D spectra, and the use of two-dimensional NMR techniques such as
NADEQUATE and COSY is required. These 2-D methods are discussed in Section 1.3.2.2.
Several empirical correlations have been proposed which relate 2 9 ~ i chemical shifts to
various aspects of the local geometry of the Si nuclei in the lattice. These include relationships
based on the mean Si-O-Si bond angle"' and the average Si-Si distance.'" Unfortunately, these
methods are not accurate enough to provide rigorously correct assignments of the resonances to
specific T-sites, especially in cases where the chemical shifi differences are small, and thus

I 1 I 1 I I 1 1 -108
1 1 1
ppm fiom TMS -1 18
Figure 1.1 1 (a) ' 9 ~ i MAS NMR spectrum of calcined, highly siliceous zeolite ZSM-5 at 79.495 MHz. (b) "si MAS NMR spectrum obtained of a very crystalline, completely siliceous sample of ZSM-5 after careful optimization of al1 experimental variables. (c) Deconvolution of spectrum (b) in terms of Lorentzian curves corresponding to the 24 individual T-sites. After reference IO5.
should only be used as a general guide.'26 This is mainly due to the uncertainties in the exact Si-
O-Si bond angles and Si-Si distances found fiom X-ray structure determinations.
The assignment of the 2 9 ~ i resonances to specific T-sites is further cornplicated by the
chemical shift variations observed as the temperature is changed, or in the presence of guest
molecules within the channels, since both may induce subtle changes in the local geometry.v7-
uo.l1:-17Y For example, the 2 9 ~ i MAS spectra of calcined (empty) ZSM-5 at 293K contains 2 1
resonances which may be assigned (using 2-D WADEQUATE) to the 24 T-sites determined
fiom the crystal structure at the same temperature.99 At this temperature the framework has
monoclinic (P2,/n. 1.1) symmetry, but this changes to orthorhombic (Pnma) if the temperature is
raised above 357 K. In the orthorhombic phase, there are only 12 T-sites. These changes are
accurately reflected in the "si MAS spectra and are completely reversible. Similar changes have
been observed for ZSM- 1 1 ' % n d ZSM-39."'
The introduction of organic species into the channels can sometirnes result in drarnatic
changes in the "si spectra, again reflecting the slight modifications which can occur in the local
envimnments of the T-sites. Several groups have reported "si MAS NMR of ZSM-S"'~)~'-'" and
ZSM- 1 1 '" containing various organic sorbates which illustrate these changes. The spectra show
a dependence on the actual number of molecules per unit ce11 that are present, and the nature of
the adsorbed molecule. Y#.102./2ï- The combined effects of sorbate and temperature have also been
in~esti~ated."'~' These effects are discussed in more detail in Chapter 6.
There have been a few studies where distances between framework atoms were
determined fiom NMR experiments. Van Eck and veemad3' used SEDOR to estimate average
' 7 ~ ~ - 3 1 ~ distances in AIP04-5 and SAPO-I 1. They measured mean 2 7 ~ l - 3 ' P distances of 3.15 A
and 3.17 A for the two materials respectively, by observing 2 7 ~ ~ while dephasing "P. These
distances are in good agreement with those determined fiom refinements of X-ray and neutron
powder diffraction data. Fyfe and co-workers have reported 1-D REDOR and TEDOR
experiments on several zeolitesM and the AIPO4 VPI-5.'" However because these techniques

were designed to measure the dipolar coupling between spin-IR nuclei and they used "AI as one
of the nuclei in their experiments, Fyfe et aL were unable to determine AI-P distances,
1 H nuclei are ofien present in the h e w o r k structures of zeolites, most commonly at the
Brmsted acid sites or in hydroxyl gmups at lattice defect sites. Extensive 'H MAS NMR studies
have Ied to the assignments of the various proton resonances which are observed, and these have
been reviewed by Pfeifer et al.'" Freude et al.''' were able to estimate the mean distance for AI-
OH-Si acid protons in zeolites. Using the fact that the 'H-"AI dipolar coupling dominates the
proton second moment, they were able to determine 'H-"AI distances of 2.38 A and 2.48 A fiom
' H NMR spectra of static samples of ZSM-5 and zeolite Y respectively. ' H-'~s~ CP and REDOR
experiments have been performed to investigate the Bransted acid protons in the NW-exchanged
forrns of ZSM-5 and zeolite Y.'" Although they report that they were able to fit the experimental
data satisfactorily. specific 'H-'~s~ distances were not given.
Although onedimensionaI MAS NMR spectra of microporous materials can be directly
related to the crystalIographically inequivalent T-sites in the asyrnmetric unit, assignment of the
individual resonances to specific T-sites is not always straightforward for the reasons discussed
above. The iwo-dimensional NMR techniques discussed in the next section can provide
information about the connectivities between the various resonances, and thus between the T-
sites in the lattice, which greatly assists the assignment.
1.3.2.2 Determination of Framework Connectivities by Two-Diinensional NMR
In solution-state NMR, the application of two-dimensional techniques has furnished
considerable information about the connectivities between atoms within rnole~uies.~~~~~~~~'~~~'.'~
The assignment of resonances in the MAS spectra to specific T-sites is an essential first step in
the process of locating guest species within frameworks by NMR, since it is necessary to
determine exactly which T-sites the nuclei in the guest species are closest to. These 2-D
techniques include Heteronuclear Shift Correlation (HSC), which establishes heteronuclear

connections such as 'H-'~c, and Correlation SpectroscopY (COSY) that determines homonuclear
31 3t correlations (e-g. ' W'H, Pl P etc.). The MADEQUATE (Incredible Natural-Abundance
DoublE QUAntum Transfer Experiment) sequence was introduced to establish "c/"c
connectivities in natural abundance s a ~ n ~ l e s . ' ~ ~ Benn and co-worker~'~~ successfully
demonstrated the application of COSY and INADEQUATE to solids, showing " ~ i / ' ~ ~ i
connectivities in Q8M8 (the cubic octamer Si80t2[0Si(CH3)3]8), and ' 3 ~ / ' 3 ~ connections in
camphor. These experiments use the scalar or J-coupling between covalently bonded spin pairs,
and can be utilized to determine the three-dimensional connectivities between nuclei in
microporous materials such as zeolites. 121.122
Fyfe et al. were the first to apply these 2-D homonuclear correlation techniques to
establish the three-dimensional Si-O-Si Iattice connectivities in ze~lites."~*"' Because of the low
natural abundance of 2 9 ~ i (4.7%), which means that spin pairs have only a 0.22% probability of
occurring, the initial experiments were perforrned on "si isotopically-enriched (ca. 85%)
samples. Afier optimization the experiments could be perforrned on samples with natural
29s -9% f2f). 12"
To illustrate the important aspects of these two experiments, ZSM-12 wiIl be used as an
exarnple. The structure of ZSM-I 2 is shown in Figure 1.12(a). The "si MAS NMR spectrum of
highly siliceous ZSM-12 shows seven clearly separated resonances of equaI intensity (Figure
1.12(b)). These reflect the seven inequivalent T-sites in the crystal lattice of ZSM- 12 which have
equal occupancy (Figure 1.1 2(a)).I4'
An important aspect of the COSY 2-D spectrum is the doublet splitting observed in the
cross peaks, which correspond to ' 9 ~ i - ~ - 2 9 ~ i J-couplings of 9 to 16 Hz. Knowledge of the
magnitude of these J-couplings is important for the efficient application of the INADEQUATE
experiment. The optimal value for the fixed delay r in the MADEQUATE pulse sequence (rd2 -
r - IE - T - x - t , - 3 d 4 - acquire) is ll(45). Because of the echo portion in the sequence, there is

Figure 1.12 (a) Frarnework structure of ZSM- 12 showing the seven crystaiIographically inequivalent T-sites. (b) Contour plot of a 2 9 ~ i INADEQUATE NMR experiment on purely siliceous ZSM-12 with the one dimensional MAS NMR spectrurn above. Fie-two experiments were carried out using a spectral width of 800 a fixed delay of 20 ms and 64 scans per experiment. Adapted from reference 115.

the added restriction that T2 < I f J in order that acceptable SM is obtained. Figure 1.12(b) shows
the result of a 2-D WAD EQUATE experiment on ZSM- 1 2.
Compared to a COSY experiment, the INADEQUATE experiment has the significant
advantage that there are no large signals on the diagonal. This makes it easier to observe
connectivities between closely spaced resonances, which are often obscured by the single
quantum resonances in a 2-D COSY spectnirn. However, the successfüI implementation of an
INADEQUATE experiment requires a reasonable estimate of the J-coupling. Overall, the
INADEQUATE experiment has proven itself to be superior to COSY in investigations of
moiecular sieve frarne~orks. '~~ For exampie, in the case of ZSM-5 loaded with two molecules p-
xylene per unit cell, 2 1 of the expected 22 connectivities were resolved fiom NADEQUATE
experiments, but only 12 were determined using COSY? Using 2-D MADEQUATE
experiments, FYfe and CO-worken have successfully assigned individual ' 9 ~ i resonances to
specific T-sites in several other highly siliceous zeolites including ZSM-22,"' and ZSM- 1 1 . I I 4
More recently several techniques that yield heteronuclear fiamework connectivities have
been reported. These include 2-D cross polarization, TEDOR and iNEPT experiments on several
zeolitesM.123 and A I P O ~ ~ . ~ ~ . 123.132 142 Such experiments revealed connectivities between framework
atoms ("AI and ''si in zeolites, and "AI and 3 i ~ in AIP04s) that were in agreement with those
anticipated from the known fiamework structures.
1.3.2.3 MMR Srudies of Guesf Species
Many of the guest species that may be located within the pore and cages of microporous
matenals contain NMR active nuclei. Consequently, there have been a large number of NMR
investigations of the various occluded species and several reviews have been
published.30~106~'07 The vast majority of NMR studies of guest species have involved 'H and ')c,
mainly because many of the guest species are organic.
The early 'H NMR midies of guest species were devoted to the adsorption of water and
aIcoho1s on zeolites, and Iater srnall hydrocarbon molecules such as acetylene and ethylene were
investigatedo However, the 'H-'H hornonuclear dipolar interactions are usuaiiy quite large
which ofien means that the ' H spectra of static samples are very broad. The use of MAS and
CRAMPS can provide 'H spectra with substantiaily improved resolution." The protons on
sorbed organic molecules and templates are often utilized as a polarization source for improving
the efficiency of NMR spectra of zeolite fiamework nuclei via CF. Recently. Fyfe and co-
workers have used CP, TEDOR, and REDOR experiments between the 'H nuclei in selectively
deuterated, sorbedp-xylene and "si in highly siliceous ZSM-5 to locate the guest molecules
within the channe~s.'~~
13 C NMR has also been widely used to investigate templating species, sorbed organic
molecules, and to fol low chemical reactions catalyzed by microporous materials. For example,
the conversion of methanol to dimethyl ether and other hydrocarbons on ZSM-5 has been
extensively studied in-situ by "C NMR.'""~ I3 C MAS NMR spectra of tetrapropyl ammonium
cations (TPA-) in as-synthesized ZSM-5 are aImost identicat to that of the ion in aqueous
solution, proving that the template remains intact.3o Reischman et ai."' observed splitting of the
methy l gro up resonances in the "C spectrum of ZSM-5 loaded with p-xy lene, and interpreted this
as evidence for the existence of two different sorption sites. This was later confirmed by a single-
crystal X-ray structure." Recently, Fyfe et ai. have undertaken extensive NMR investigations of
the ZSM-5 lp-xylene system, using CP, REDOR, and TEDOR to rneasure ' 3 ~ - ' 9 ~ i distances
between the hmework silicons and the '3~-labeled methyl goups of the sorbed p-xylene
molecules, and I3c Spin-Difision experiments to study the molecular motion^.'^'
'H NMR of static samples has yielded many insights into the nature, mechanisms, and
tirnescales of the rnolecular motions of sorbed species." A good example of this is provided by
the study of the temperature dependence of the 'H spectra of selectively deuterated p-xylenes on
ZSM-5, which allowed the temperature ranges where vanous molecular rotations were present or
absent to be deter~nined.'~'
The potential of '% NMR to study nitrogen-containing guest species has not been fully
exploited, mainly because of the low natural abundance of 'k (0.37 %), which means that
isotopic enrichment is necessary. '% chemical s h i k are very sensitive to the nature of the
adsorption site, and 'SN-labeled molecules such as ammonia, acetonitde, and pyridine have been
used to probe the strength and number of acid sites in ~ e o l i t e s ~ ~ ~ ' ~ ~ For example, the '% NMR
spectra of pyridine adsorbed on zeolite Y clearly show the conversion to pyridiniurn ions.'0r
Many of the molecules used as templates are quatemary ammonium saits (e.g. the TPA' cations
used for ZSM-S), and could be more readily studied if marerials were synthesized with '%I-
labeled templates.
There have been several NMR studies of simple ions within the frameworks of zeolites
and AIP04s. Most of the charge-compensating, exchangeable cations in zeolites can potentially
be studied by NMR to, but only a few (such as ' ~ i , %a, '''TI, and '"CS) have been used to
date.'()~he NMR spectra of these cations cm provide insights into their location and degree of
19 hydration. F MAS NMR has been invoked to investigate the rotes played by the fluoride ions
that are often encapsulated within the framework structures of microporous materials synthesized
from fluoride-containing media.'46
An interesting NMR technique used to investigate microporous materiak involves the
Iz9xe NMR study of sorbed xenon gas. The ' " ~ e chemical has proved usehl as a passive probe
of the pore structures, occluded metal species and other adsorbed guest molecules. 30.147
1.33 Cornputer Modelling of Framework Structures and Guest Species
in recent years computer modelling techniques have become well established as powerful
tools in the study of micmporous solids, and comprehensive commercial software packages are
now available." Several recent reviews have been pub1ished,1"'51 and reference 152 contains

detailed accounts of the simulation techniques which have been used. Techniques which rest on
the specification of interatomic potentials (Forcefield Methods) have been extensively used to
model the structures of microporous materials, and to investigate the locations and diffusion of
guest species. These Forcefield methods include Energy Minimization, Monte Car10 and
Molecular Dynamics, and the reliability of the simulations depends critically on the quality of the
interatornic potential models employed.'4' The parameten for these techniques are derived from
empirical methods or ab-initio calculations. When modelling the interactions between guest
species and the frarneworlc, parameters are sometimes "borrowed" from those developed for
organic systems. Using these parameters, simulations have been able to reproduce the qualitative
aspects of adsorption isotherms, and yield diffusion coefficients that are in good agreement with
those determ ined experimental ly.I5'
Freeman and co-workers'" have developed a "docking" procedure which uses a
combination of Monte Car10 and Molecular Dynamics methods with energy minimization. This
has been widely used for identiQing low energy sites for sorbed molecules (e-g. butene in
silicalite 1, pyridine in zeolite L), and has successfully located the organic templating species in
the frameworks at their X-ray determined positions.'"
By far the majority of the simulations of guest-host complexes in microporous materials
have been performed using rigid h e w o r k s , and ofken the organic species are also fixed at some
predetermined configuration. Calculations which allow the (empty) framework to relax
completely unrestrained to the local energy minimum have been able to reproduce the
experimentally determined unit ce11 dimensions and fractional coordinates for zeolite A and
silicalite.'" Titiloye et al.'56 have simulated linear hydrocarbons adsorbed in MF1 and faujasite
frameworks including complete flexibility of the organic component.
The location ofp-xylene in purely siliceous MF1 frameworks has been studied by Pickett
et al.,"i and Reischman and c o - ~ o r k e n . ' ~ ~ These calculations used rigid frameworks and similar
potential functions, but different parameterizations. While the adsorption sites seem to be in

relatively good agreement with the X-ray determined location^,'^ the presence of the sorbate
molecules changes the local symmetry of the zeolite framework, and this was not revealed by.
nor included in, the simulations.
In conclusion, although a considerable number o f theoretical calculations have been
canied out, the results are not always in agreement.'" The reliability of the computer simulations
of framework-guest systems depends critically on the quality of the potential hnctions and the
parameters used. These problems may be compounded by the subtle geornetry changes induced
by the guest species. There is a definite need for experimental techniques capable of locating
guest species reliably within the channels and voids and providing detailed information about the
frameworks. The aim of the research presented in this thesis is to develop solid-state NMR
techniques to tirmish exactly this information.
1.4 OUTLiNE OF PROPOSED RESEARCH
As has been described above, diffraction techniques, sol id-state NMR studies and
computer modelling have been used to investigate the framework structures of crystalline
microporous inorganic materials such as zeolites, and the host-guest complexes that are fonned
with occluded guest species. It is now possible to establish a direct relationship between the
information provided by solid-state NMR, and the results of the X-ray diffraction studies using
two-dimensional homonuclear solid-state NMR experiments such as COSY and INADEQUAT E.
Heteronuclear 2-D NMR techniques (e-g. iNEPT, TEDOR and CP) can also provide detailed
information about framework connectivites.
Overall, however, relatively linle is known about the locations of the guest species
within the channels and cages of microporous rnaterials. Such information is vital if we are to
irnprove understanding of the many unique properties of these materials. It is also important to
obtain independent, reliable experimental data to assist refinement of structures from diffraction
techniques and as a test o f the correctness of solutions obtained fiom computer modelling

methods, Solid-state NMR has considerable potential in solid-state structure investigations for
directly determining internuclear distances from experiments based on the through-space 1-S
dipolar interactions. With this in mind, the major thnia of the research was to develop the
techniques of cross polarization, REDOR, and TEDOR to allow quantitative distance
determinations between nuclei in the guest species and framework atoms.
It was decided to concentrate on highly crystalline, purely siticeous h e w o r k systems
with fluorine-containing guest species for several reasons. Firstly, highly resolved 2 9 ~ i MAS
NMR spectra can be obtained if the materials are of the very highest quality, allowing the
individual NMR resonances to be assigned to specific T-sites using 2-D experiments such as
MADEQUATE. This is a crucial first step in locating guest species. Secondly, ' 9 ~ is a spin 112
nucleus with a large gyromagnetic ratio, making "F-'~S~ experiments attractive, since the dipolar
couplings will be of the order of hundreds of hertz. Thirdly, although ' 9 ~ has 100% natural
abundance. it is relatively rare, whic h dramatical ly reduces the Iikelihood of background
interferences. Finally, rnany of the samples synthesized v i a the "Fluoride Method" of Flanigen
and Patton contain fluoride ions in their as-synthesized form, and there is considerable interest in
detennining the roles which these ions play in the syntheses.
An important aspect of this work will be the development of appropriate protocols and
analytical techniques capable of providing reliable measurements of the heteronuclear dipolar
coupling in the situations typically encountered in these host-guest complexes. These techniques
will be tested and refined using systems where the structure is known from single crystal X-ray
diffraction studies. Once the reliability is established, they c m be used to achieve the overall
goal of the research: to locate guest species within fi-amework structures where no detailed
information concern ing the locations is available.
Chapter 2 is concemed with the experimental details, spectrometer modifications,
specialized equipment required, and preparation of samples. The CP, REDOR, and TEDOR
techniques are introduced in detail in Chapter 3, before the results of 1 9 ~ / 2 g ~ i NMR experiments

on octadecasil are presented in Chapter 4. Octadecasil was chosen because it is a purely
siliceous, fluoride-containing framework whose structure is known from single crystal snidy, and
it contains two types of T-sites; one which interact. with only a single fi uoride ion (i-e. an
isolated Si-F spin pair), and the another that is dipolar coupled to several ' 9 ~ nuclei. Thus
octadecasil provides an ideal test case for the deveiopment of reliable fitting procedures. A
critical comparison and assessrnent of these NMR distance determination techniques is presented
in Chapter 5.
In Chapter 6 the results of the MADEQUATE, CP, REDOR, and TEDOR experiments
used to locate 1.4-difluorobenzene molecules in ZSM-5 are discussed. Preliminary investigations
of the powder X-ray diffraction of the low-loaded p-difluorobenzene / ZSM-5 complex are
presented in Chapter 7. The successful single crystal refinement of the structure of the low-
loaded complex ofp-xylene in ZSM-5 is presented are detailed in Chapter 8. Chapter 9
summarizes the research results and conclusions, and outlines some proposais for future studies.
Several Appendices have been included. These contain schematics of the NMR
spectrometer configurations, listings of the pulse and automation programs used, as well as
detailed information concerning the fitting procedures, equations, and Mathemarica scripts used
to analyze the results of the CP, REDOR and TEDOR experiments.

REFERENCES FOR CB[APTER 1
(a) Pajado, P.R.; Rabo, J.A.; Antos, G.J.; Gembicki, S.A. Catal. Today, 1992, 13, 1 1 3. (b) Moscou, L. in Introduction to Zeolite Science and Practice, Ch. 1, van Bekkum, H.; Flanigen, E.M.; Jansen, J-C. (Eds.), Elsevier: Amsterdam, 199 1.
Flan igen, E.M. in Introduction to Zeolite Science and Prucfice, Ch. 2, van Bekkum. H,; Flanigen, E.M.; Jansen, J-C. (Eds.), Elsevier: Amsterdam, 199 1.
Arends, I.W.C.E.; Sheldon, R.A.; Wallau, M.; Schuchardt, U. Angew. Chem. Int- Ed. Engl. 1997,36. 1 144.
Barrer, R.M. Zeolite and C i q Marerials as Sorbents und Molecular Sieves; Academic Press, 1974-
Brec k, D. W. Zeolite Moleculur Sieves; Wiley Interscience, 1974.
van Bekkum, H.; Flanigen, E.M.; Jansen, J.C. (Eds.), Introduction ta Zeolite Science and Practice; Elsevier: Amsterdam, 199 1.
Jansen, J. C.; Stocker, M.; Karge, H.G.; Weitkamp, J. (Eds.), Advanced Zeolite Science and Applications; Elsevier: Amsterdam, 1994.
Chon, H.; Woo, S.I.; Park, S.E. (Eds.), Recent Advances and New Horizons in Zeolite Science and Technology, Elsevier: Amsterdam, 1996. Stud SUI$ Sci. Carat. vol. 102.
McBain, J. W. Sorption of Gases and Vapours by Solids, Routlidge and Sons: London, 1932.
Quoted in Kerr, G.T. Scientiftc American, 1989, July, 100.
Quoted in Newsam, J.M. Science, 1986,231, 10%.
Chang, C.D. U.S. Patent No. 4,273,753, 198 1.
Flanigen, E.M.; Patton, R.L. US. Patent No. 4073865, t 978.
Guth, J.L.; Kessler, H.; Caullet, P.; H m , J.; Merrouche, A.; Patarin, J. in Proceedings of rhe 9th International Zeolite Conference, Montreal, 1992. von BalImoos, R.; U iggins J .B .; Treacy, M.M.J. (Eds), Butterworth-Heinemann I993,2 1 5
Zhao, D.; Qiu, S.; Pang, W. in Proceedings of the 9th International Zeolite Conference. Montreal, 1992. von BalImoos, R.; Higgins J.B.; Treacy, M.M.J. (Eds), Butterworth- Heinemann 1993,33 7.
Meier, W .M.; Olson, D.H.; Baerlocher, Ch. A t h of Zeolite Structure Types, 4th Revised Ed.; EIsevier: London, 1 996. www-iza-sc.csb.yale.edu/IZA-SC/
Atlas of Zeolife Structure Types, 3rd. Revised Ed.; Meier, W.M.; Olson D.H. (Eds.) Butterworth-Heinemann, 1992.
Gies, H.; Marler, B. in Cornprehensive Supramoleculur Chemistry, Ch. 26, vol 26 MacNicol, D.D.; Toda, F,; Bishop, R. (Eds.) Permagon, 1996.

19 van Koningsveld, H.; Tuin- F.; van Bekkum, H.; Jansen, J-C. Acta Cryst. 1989, B45,423.
20 van Koningsveld, H.; Jansen, K.; de Man, A.J.M. Acta Cryst. 1996, BjZ, 13 1.
Fyfe,C.A.; Kokotailo, G.T.; Strobl, H.; Pasztor, C.S.; Barlow, G.; Bradley, S. Zeolites 1989, 9,53 1.
~ e r i z k Molecular Simulations Inc. Burlington, MA. U.S.A.
(a) Rietveld, H.M. J. Appl. Cryst. 1969,2,65. (b) Young, R.A. (M.). The Rietveld Method, Oxford University Press, 1993
Giacovazzo, C. (Ed.) Fundamenrals of CrystaIZography. Oxford University Press, 1995.
Thomas, J.M. in Zeolites: Facfs. Figures and Future, van Santen, R.A.; Jacobs, P.A. Eds., Elsevier: Amsterdam, 1989, p. 3 Stud Sur$ Sci. Catal. d9A.
Venuto, P.B. Microporous Mater. 1994,2,297.
Abragam, A. The Principles of Nuclear Magnetism; Oxford University Press: London, 196 1.
Ernst, R-R.; Bodenhausen, G.; Wokaun, A. Principles of Nuclear Magnefic Resonance in Une and Two Dimensions. Clarendon Press: Oxford, 1990.
Slichter, C.P. Principles of Magnetic Resonance, 2nd Ed.; Springer-Verlag: New York. 1983.
Engel hardf (3.; Michel, D. High-Resolution SoZid-State NMR of Silicates and Zeolites. John Wiley & Sons, 1987.
Mehring. M. Principles of High Resolurion NMR in Solids, 2nd Ed.; Springer-Verlag: New York, 1983.
Fyfe, C.A. SolidState NUR for Chemisfs; C.F.C. Press: Guelph, Canada, 1983.
Harris, R. K. Nuclear Magnetic Resonance Specnoscopy - A Physiochemical Vieiv, 3 rd Revised Ed. Longmann Scientific and Technical: United Kingdom, 1987.
Derome, A.E. Modern N ' Techniques For Chernistry Research. Permagon Press, 1987.
A ki tt, J .W. NMR and Chemistry - An Introduction to the Fourier Transform - Mziitinuclear Era. 2nd ed., Chapmann and Hall, 1984.
Sanden, J.; Hunter, B. Modern NMR Spectroscopy: A Guide for Chemists, Oxford University Press, Oxford, England, 1987.
Harris, R.K.; Mann, B.E. (Eds.) NMR and the Periodic Table. Academic Press, 1978.
Günîher, H. NMR Specb-oscopy - Basic Principles, Concepts, and Applications in Chemisby; 2nd Ed., John Wiley and Sons, 1995.
Stejskal, E.O., Memory, J.D. High Resolution NMR Techniques in the Solid State - Fundamentals of CP/%US. Oxford University Press, 1994.
40 Andrew, E.R.Int. Rev. Phys. Chem. 1981,1, 195.
Andrew E.R. in Encyclopedia of Nucfem Magnetic Resonance. Grant, D.M.; Hamis, R. K. (Eds.) John Wiley & Sons, 1996. p. 289 1.
Jelinski, L.W.; Melchior, M.T. in NMR Spectroscopy Techniques, Dybowski, C.; Lichter, U.L., Eds. Marcel Dekker: NewYork, 1987.
Chemlka, B.F.; Zwanziger, J.W. NMR Basic Principles and Progress. 1994,33,80.
Waugh, J.S.; Huber, LM.; Haeberien, U. Phys. Ra). Lert. 1968,20, 180.
Rhim, W.K.; Elleman, D.D.; Vaughn, R.W. J. Chem. Phys- I973,59,3740.
Buntm, D.P.; Rhim, W.K.J. Chern. Phys. 1979, 71,944.
Engel hardt, G.; Michel, D. High-Resolution Solid-State NMR of Silicales and Zeolites. p. 42, John Wiley & Sons, 1987-
(a) Harris, R.K.; Jackson, P. in Multinucfear Magnetic Resonance in Liquids and Solids - Chernical Applications, ch. 29, Granger, P.R.; Harris, R.K. (Eds.), Kluwer Academic Publishers 1990 NATO AS1 Series C 322. (b) Ryan, L.M.; TayIor, R.E.: Paff, A.J.; Gerstein, B.C. J. Chem. Phys. 1980, 72, 508.
Andrew, E.R.; Bradbury, A.; Eades, R.G. Nature. 1958, 182, 1659.
Lowe. M.; Phys. Rev. Lett. 1959,2,285.
(a) Wind, R.A. in Modern NMR Techniques and Their Applications in Chernisrry, Ch. 3, Popov, A.I.; Hallenga, K. (Eds.), Marcel Dekker, 1991 .(b) Maricq, M.M.; Waugh, J.S. J. Chem. Phys. 1979, 70,3300.
Herzfeld, J.; Berger, A.E. J. Chem. Phys. 1980, 73,602 1.
(a) Dixon, W.T. J. Magn. Reson. 1981,44,220. (6 ) Dixon, W.T. J. Chem Phys. 1982, 77, 1800.
(a) Dixon, W.T.; Schaefer, J.; Sefcik, M.D.; Stejskal, E.O. J. Magn. Reson. 1981, 45, 173. (b) Dixon, W.T.; Schaefer, 3.; Sefcik, M.D.; Stejskal, E.O. J. Magn. Reson. 1982,49,34 1.
Kolbert, A.C.; Raleigh, D.P.; Griffin, R.G. J, Magn. Reson. 1989,82,483.
Grondey, H. Ph.D. Dissertation, Universitiit Gesarnthochschule, Siegen, Germany 1988
(a) Gullion, T.; Schaefer, J. J. Magn. Reson. 1989,81, 196. (b) Pan, Y.; Gullion, T.; Schaefer, J. J. Mam. Reson. 1990,90,330.
Pines, A.; Gibby, M.G.; Waugh, J.S. Jt Chem. Phys. 1973,59, 569.
Hartmann, S.R.; Hahn, E.L. Phys. Rev. 1962,128,2042.

Hediger? S.; Meier, B.H.; Ernst, R.R. Chem. Phys. Lett. 1995,240,449. (b) i-iediger, S.; Meier, B.H.; Ernst, R,R. J- Chem, Phys. Lett. 1995, 102,4000. (c) Hediger? S.; Meier9 B.H.; Ernst, R.R. Chem. Phys. Lett. 1993,213,627.
Fleming, W.W.; Fyfe, C.A.; Kendrick, R.D.; Lyerla, J.R.; Vanni, H.; Yannoni, CS. ACS Symp. Ser. 1980, 142,206.
Sebald. A., Merwin, L.H,; SchaIler, T.; Knôller, W. J, Mugn. Reson. 1992, 96, 159.
Peters, G.; Preetz W.; Schaller, T.; Sebald, A. J. Magn. Reson. Ser. A. 1996, 120. 12 1.
Schaefer, J.; McKay, R.A.; Stejskal, E.O. J. Magn. Reson. 1979,34.443.
Fyfe. C.A.; Mueller, KT.: Grondey, H.; Wong-Moon, K-C, J. Phys. Chetn. 1993,97, 13484.
Fyfe, C.A.; Wong-Moon, K.C.; Huang, Y.; Grondey, H.; MuelIer, K.T. J. Phys. Chem. 1995,99,8707.
Fyfe, C.A.; Mueller, KT.; Wong-Moon, K.C. in NucIear Magnetic Resonance in Modern Technology, MacieI, G.E., Ed, Kluwer Academic Publishers : Dordiecht, The Netherlands. 1 994, NATO ASI Series C 44 7 447.
Sebald, A. NUR Basic Principles and Progress, Diehl, P.; Fluck, E. (Eds.) Springer Verlag: Berlin 1994. vol. 3 1, p. 9 1.
Michel, D.; Engelke, F. NMR Basic Principles and P rogress, Fluck, E. (Eds.) Springer Verlag: Berlin 1994. Diehl, P.; vol. 32, p. 7 1.
(a) Yannoni, C.S. Acc. Chem. Res. 1982, 15,201. (b) VoeIkel, R- Angew. Chem. Int- Ed Engl. 1988.27, 1468. (c) Stejskal, E.O.; Schaefer, J.; Waugh, J.S. J. Magn. Reson. 1977.28, 105.
Hallenga, K.; Popov, A.I. in Modern N ' Techniques and Their Applicatioas in Chemistry, Ch. 1, Popov, AL; Hallenga, K. (Eds.), Marcel Dekker, 199 1.
Torcia, D.A. J. Magn. Reson. 1978,30,613.
Waugh, J.S.; Maricq, M. M.; Cantor, R. J. Magn. Reson. l978,29, 1 83.
(a) Kaplan, D.E.; Hahn, E.L.J. Phys. Radium. 1958, 19,821. (b) Wang, P.K.; Slichter, C.P.; Sinfelt, J.H. Phys. Rev. Lett. l984,53, 82.
Hotl, S.M.; McKay, R.A.; Gullion, T.; Schaefer, J. J. Magn. Reson. 1990,89,620.
(a) Hing, A.W.; Vega, S.; Schaefer, J. J , Magn. Reson 1992,96,205. (6) Hing, A.W.; Vega, S .; Sc haefer, J . J. MW. Reson. Ser. A. 1993,103, 1 5 1.
(a) Schmidt, A.; McKay, R.A.; Schaefer, J. J. Magn. Reson. 1992,96,644. (b) Grey, C.P.; Veeman, W.S. Chem. Phys. Lett. 1992, 102,379. (c) Grey, C.P.; Veeman, W.S.; Vega, A.J. J. Chern. Phys. 1993,98,77ll. (d) Gu1lion.T. J. Magn. Reson. Ser. A. 1995,117,326. (e) Gui1ion.T. Chern. Phys. Lett. 1995,246,325. (f) Bork, V.; Gullion, T.; Hing, A.; Schaefer, J. J. Magn. Reson. 1990,88, 523. (g) Guilion, T.; Poliks, M.D.; Schaefer, J. J. Mugn. Reson. 1988,80,553.

78 Bennett, A.E.; O k J.H.; Griffin, R-G.; Vega, S. J. Chem. Phys- 1992,96,8624.
79 Tycko, R.; Smith, S.O.J. Chem Phys. 1993,98,932.
80 Gull ion, T.; Vega, S. Chem. Pbs. Left. 1992, 194,423.
81 Gregory, D.M.; Mitchell, D.J.; Stringer, J.A.; Kiihne, S.; Sheils, J-C.; Callahan, J.; Mehta, M.A.; Drobny, G.P. Chem. Phys- Lett. 1995,246,654.
82 Sun, B.Q.; Costa, P.R.; Kocisko., D.; Lansbuiy, P.T.; Griffin, R.G. J. Chem. Phys. 1995, 102, 702,
83 Baldus, M.; Tomaselli, M.; Meier, B.H.; Ernst, R.R.Chem. Phys. Lett. 1994,230,329.
84 Lee. YK.; Kurur, N.D.; HeImle, M-; Johamessen, O.G.; Nielsen, N.C.; Levi& M-H- Chem- P@s. Letf. 1995,242,304.
85 Bennett. A.E.; Griffin, R.G.; Vega, S. NMR Basic Principles and Progress, 1994,33,3.
86 Müller, L.: Kumar, A.; Baumann, T.; Ernst, R.R Phys. Rev. Lett. 1974,32, 1402.
87 Hediger, S. Ph.D. Thesis, Eidgenôssische Technische Hochschule Zürich, Switzerland, 1 997
88 (a) Hawkes, G.E.; Mantle, M.D.; Sales, K.D.; Aime, S.; Gobetto, R.: Groombridge, C.J. J. Magn. Reson. Ser. A. 1995, 116,251. (b) Hagaman, E.W.; Ho, P.C.; Brown, L.L.; Schell, F.M.; Woody, MC. J. Am. Chem. Soc. 1990, 112,7445.
89 van Koningsveld, H,; Jansen, J-C.; van Bekkum, H. Acta Cryst. 1996, B52, 140.
90 van Koningsveld, H.; Jansen, J.C. Microporous Mater. 1996,6, 159.
91 Reck, Ci.; MarIow, F.; Kornatowski, J.; Hill, W.; Caro, J. J. Chem. Phys. 1996, 100, 1698.
92 van Koningsveld, H.; Koegler, J.H. Microporolrs Mater. 1997, 9,7 1.
93 Fitch, A.N.; Joboc, H.; Renouprez, A. J. Phys. Chem. 1986,90, 13 1 1.
94 Wright, P.A.; Thomas, J.M.; Cheetharn, A.K.; Nowak, A.K. Nature. 1985,318.6 1 1.
95 (a) Gies, H.; Marler, B.; Fyfe, C.A.; Kokotailo, G.T.; Cox, D.E. J. Phys. chem. Solids, 1991, 52, 1235. (b) Mentzen, B.F.; Sacerdote-Peronnet, M. Mat. Res. Bull. 1993,28, 1 16 1. (c) Mentzen, B.F.;' Vigné-Maeder, F. Mai. Res. Bull. 1987,22, 309.
96 Cox, D.E. Acta Cryst. 1984, A30,369.
97 Fyfe. C.A.; Kennedy, G.J., DeScfiutter, C.T.; Kokotailo, G.T. J. Chem. Soc., Chern. Conzrnun. 1984,54 1.
98 Fyfe, C.A.; Strobl, H.; Kokotailo, G.T.; Kennedy, G.J.; Barlow, G.E.; J. Am. Chem. Soc. 1988,110,3373.
99 Fyfe, C.A.; Grondey, H.; Feng, Y.; Kokotailo. G.T. J. Am. Chem. Soc., 1990,112,88 12.

100 West, G.W. Aust. J, Chem. 1984,37,455-
IO1 Engelhardt, G., Michel, D. Unpublished results reported in High-Resolurion Solid-Staîe NMR of Silicates and Zeolites, JO hn W i ley and Sons, 1 987,3 1 3.
1 O2 Strobl, H. Ph.D. Thesis University of Guelph, Canada, 199 1.
103 Feng Y, Ph.D. Thesis, The University of British Columbia, Canada, l991.
104 Fyfe,C.A.; Feng., Y.; Grondey, H.; Kokotailo, G.T.; Gies, H. Chem. Rev. 1991, 91, 1525.
105 Fyfe. C.A.; Mueller, K.T.; Kokotailo, KT. in NMR Techniques in Catalysis, Ch. 1, Bell, A-Te: Pines, A. (Eds.), Marcel Dekker, 1994,
106 Klinowski, J. Chem. Rev. 1991,91, 1459.
107 Pfeifer, H.; Meiler, W.; Deininger, D. Ann. Rep. NMR Spectros. 1983, 15, 29 1.
108 Mueller, K.T., Ph.D. Thesis, University of California, Berkley, 199 1.
109 (a) Mueller, KT.; Wu. Y.; Chemlka, B.F.; Stebbins, J.; Pines, A. J, Am. Chem. Soc. 1991, I13,32. (b) Vermillion, K.E.; Pierre, F.; Grandinetti, P.J.J. Chem. Phys. 1998. 108, 7274. (c) Bull, L.M.; Cheetham, A.K.; Anupold, T.; Reinhold, A.; Samoson, A.; Sauer, J.; Bussemer. B.; Lee, Y.; Gann, S. Shore, J.; Pines, A.; Dupree, R J, Am. Chem. Soc. 1998, 120,35 10.
I I0 Fyfe, C.A.; Gobbi, G.C.; Kennedy, G.J.; Graham, J.D.; Ozubko, R.S.; Murphy, WJ.; Bothner-By, A.; Dadok, J.; Chesnick, A.S.; Zeolites, 1985,5, 1 79.
111 Loewenstein, W. Am- Mineralog. 1954,39,92.
112 (a) Fyfe, C.A.; Thomas, J.M.; Klinowski, J.; Gobbi, G.C. Angew. Chem. In[. Ed. Engl. 1983, 22,259. (b) Lippmaa, E.; Magi, M.; Samoson, A.; Grirnrner, A.R.; Engelhardt, G. J. Am. Chem. Soc. 1980,102,4889.
113 Chézeau, LM.; Detmotte, L.; Guth, J.L.; Soulard, M. Zeolites. 1989, 9, 78.
114 Fyfe, C.A.; Feng, Y .; Grondey, H.; Kokotailo, G.T.; Mar, A. J. Phys. Chem. 1991,jj, 3747.
115 Fyfe, C.A.; Gies, H.; Feng, Y.; Kokotailo, G.T. Nalure. 1989,341,223.
117 Fyfe, C.A.; Gies, H.; Feng, Y.; Grondey, H. Zeolites. 1990, IO, 278.
118 Alma-Zeestraten, N.C.N.; Dorrepaal, J.; Keijsper, J.; Gies, H. Zeolites, 1989, 9, 8 1.
119 (a) Fyfe, C.A.; Gobbi, G.C.; Kennedy, G.J.; De Schutter, C.T.; Murphy, W.J.; Ombko, R.S.; Slack, D.A. J. Am. Chem. Soc. 1984,106,4435. (b) Fyfe, C.A.; Gobbi, G.C.; Murphy, W.J.; Ozubko, R.S.; Slack, D.A. Chern. Lett. 1984, 163.
120 Fyfe, C.A.; Gies, H.; Feng., Y.; Kokotailo, G.T. NalMe. 1989,341,223.

121 Fyfe, C.A.; Feng, Y.: Gies, H.; Grondey, H.; Kokotailo, G.T. J. Am. Chem. Soc. 1990. 112, 3264.
122 Fyfe, C.A.; Feng, Y.; Grondey, H.; Kokotailo, G.T.; Mar, A. J. Phys. Chem. 1991, 95,3747.
123 (a) Fyfe, C.A.; Wong-Moon. K.C.; Huang, Y.; Grondey, H. J. Am. C'hem- Soc. 1995,117. 10397. (b) Wong-Moon, K.C. Ph.D. Thesis, The University of British Columbia Canada.
124 (a) Thomas, J.M.; Klinowski, J.; Rammdas, S.; Hunter, B.K.; Teenakoon, D.T.B. Chem. Phys. Left. 1983, 102, 158. (b) Ramdas, S.; KIinowski, J. Name. 1984,308,52 1. (c) Engelhardt, G.; Radeglia, R. Chem. Phys. Left. 1984, 1O8,27 1. (d) Derouane, E.G.: Hubert, R.A. Chern. Phys. Letf. 1986, 132,3 15.
125 (a) Smith, J.V.; Blackwell, C.S. Nature, 1983,303,223. (b) Fyfe, C.A.; Strobl, H.; Kokotailo, G.T.; Pasztor, C.T.; Barlow, G.E.; Bradley, S. Zeolites, 1988,8, 132.
126 Fyfe. C.A.; Feng. Y .; Grondey, H. Microporous Mater- 1993,1,393.
127 Fyfe. C.A.; Strobl, H.; Gies, H.; Kokotailo, G.T. Can. J. Chern. 1988,66, 1942.
128 Strobl, H.; Fyfe, C.A.; Kokotailo, G.T.; Pasztor, C-T.J. Am-Chem. Soc. 1987,109, 7433.
129 Fyfe, C.A.; Gies, H.; Kokotailo, G.T.; Pasztor, C.T.; Strobl, H.; Cox, D.E. J. Am. Chem. Soc. 1989,1 11, 2470.
130 Fyfe, C.A.; Kokotailo, G.T.; Strobl, H.; Gies, H.; Kennedy, G.J.; Pasztor, C.T.; Barlow, G. E. in Zeofites as Cataiysrs, Sorbents and Detergent Builders. p. 827. Karge, H.G.; Weitkamp, J. Eds. Elsevier, 1989.
13 1 van Eck, E.R.H.; Veeman, W.S. Solid Sfute Nucl. Magn. Reson. 1992, 1, 1.
132 Fyfe. C.A.; Mueller, K.T.; Grondey, H.; Wong-Moon. K.C. Chem. Phys. Letf. 1992, 199, 198.
133 Pfeifer, H.; Freude, D.; Kiirger, J. 2. Phys. Chern. 1988,269,320.
134 (a) Freude, D.; Klinowski, J.; Harnden, H. Chem. Phys. Lett. 1988,149,355- (b) Freude, D.; Klinowski, J.; Hamden, H. Chem. Phys. Lett. 1988, 150, 188. (c) Freude, D.; Klinowski, J. J, Chern. Soc. Chem. Commun. 1988, 14 1 1.
135 Blumenfeld, A.L.; Coster, D.; Fnpiat, J.J. J. Phys. Chem. 1995, 99, f 5 18 1.
136 Benn, R.; Günther, H. A-. Chem. Int. E d Engl. 1983,22,250.
137 Bax, A. Two Dimensional Nuclear Magnetic Resonance in Liquids, Delft University Press, The Netherlamds, 1982,
138 Bax, A.; Freeman, R.; Frenkiel, T.A.; Levitt, M.H. J. Magn, Reson. 1981, 43,478.
139 Benn, R,; Grondey, H. Brevard, C.; Pagelot, A. J. Chem. Soc. Chern. Commun. 1988, 102.
140 (a) La Pierre, R.B. Zeolites, 1985,5,346. (b) Fyfe, C.A.; Gies, H.; Kokotailo, G.T.; Marler, B.; Cox, D.E.J. Phys. Chem. 1989,98,3718.

IJI Fyfe, C.A.; Gies, H.; Feng, Y.; Kokotailo, G.T.J. AmChem. Soc. 1990, 112,8812.
1-42 van Eck, E.R.H.; Veeman, W.S.J. Am. Chem. Soc. 1993,115, 1168.
143 (a) Fyfe, C.A.; Diaz, AC.; Lewis, A.R.; Chézeau, J.-M.; Grondey, H.; Kokotailo, G.T.in SolidState NMR S p e c ~ c o p y of lnorganic Materials. Fitzgerald, J.J. ( Ed.) ACS Symposium Series. in Press. (b) Diaz, A.C.; Fyfe, C.A. Unpublished Results.
144 Reischman, P.T.; Schmitt, K.D.; Olson, D.H. J. Plys, Chem. 1988,92,5165.
I4.5 Kustanovich, 1.; Fraenkel, L-; Luz, 2; Vega, S.; Zimmermann, H. J. Phys. Chem. 1988. 92, 4 134.
146 (a) Klock, E.; Delmotte, L.; Soulard, M.; Guth, J.L. in Proceedings of the 9th International Zeoiife Conference, Montreal, 1992. von Ballmoos, R.; Higgins J.B.; Treacy, M.M.J. (Eds.), Butterworth-Heinemann 1993,6 1 1. (b) Delmotte, L.; Soulard, M.; Guth, F; Seive, A.; Lopez, A.; Guth, J.L. Zeolites. 1990, 10, 778.
147 (a) Fraissard, J. Chern. Phys Leti. 1987,136,3 14. (b) Johnson, D.W.; Griffiths, L.; Zeolites, 1987, 7,484. (c) fto, T.; Springuel-Huet, M-A.; Fraissard, J. Zeolites, 1989, 9,68, (d) Ito, T.; Fraissard, J. J. Chem, Phys. 1982, 76,5225.
148 Cheetham, A.K.; Bull, L.M- Caiai. Lett.1992, 13,267.
249 Catlow, C.R.A.; Bell, R.G.; Gale, J.D.; Lewis, D.W. Stud. SM Sci. Catal. 1995, 97, 87.
150 Krarner, C.J.; van Santen, R.A., Emeis, CD.A.; Nowak, A.K. Nature. 1993,363,529.
151 Sauer, J- Stud Sur$ Sei. CataL I994,84,2039.
152 Modefiing of Strucm-es and Reactivity in Zeolites. Catlow, C .R.A., (Ed.) Academic Press: London, 1992.
153 Freeman, CM.; Catlow, C.R.A.; Thomas, J.M.; Brade, S. Chem. Phys. Lett. 1991, 186, 137.
154 Bell, R.G.; Lewis, D.W.; Voigt, P.; Freeman, C.M.; Thomas, LM.; Catlow, C.R.A. Stud SUI$ Sci CutaI. 1994, 84,2075.
155 Jackson, R.A.; Catlow, C.R.A. Mol. Simul. 1988,1, 207; Demontis, P.; Suffritti, G.B.; Quartieri, S.; Gamba, A.; lois, E.S. J. Chem Soc. Faraday Trans. 2 l99l,87, 1 65 7.
156 Titiloye, J.O.; Parker, S.C.; Stone, F.S.; Catlow, C.R.A. J. Phys. Chem. 1991, 95,4038.
157 Pickett, S.D.; Nowak, A.K.; Cheetharn, A.K.; Thomas, J.M. Molec. Simul. 1989,2,353.
158 Cheetham, A.K.; Bull, L.M. Catal. Lett. 1992,13,267.

C W T E R 2
EXPERIMENTAL DETAILS
2.1 PREPARATION OF SAMPLES USED FOR NMR INVESTIGATIONS
2.11 Octadecasil
Highly crystal Iine samples of octadecasil prepared by hydrothermal crystallization ( 14
days at 80 OC) from a fluonde-containing medium with quinuclidine (1-azabicyclo[2,2,2] octane,
[N(CH2CH2)3CH]) as template in the presence of HF were kindly provided by Dr. P. Caullet and
A. C. Faust of the Laboratoire de Matériaux Minéraux, Ecole Nationale Supérieure de Chimie,
Université de Haute Alsace, France. Two different sarnples, designated as PC 752 and ACF
2 134, were used. After synthesis, the product was washed with distilled water and dried at 90 O C .
The samples were checked by powder X-ray diffraction and "F and 19si MAS NMR
measurements. Carbon, nitrogen and silicon contents were determined by eIementaI analysis.
Calculated (weight %) for 100% occupancy: C, 1 1.48%, N, 1.9%, Si 38.4%, Found: C, 10.5%, N,
1,78%, Si, 38.12%. Fluorine contents were not determined for the samples used, but typical
fluorine contents in these materials are in the range 2.3% to 2.6%.' Al1 experiments were
perfonned on as-synthesized samples; no calcination was done since this is known to result in a
loss of the fluoride ions from the structure in addition to removal of the template.'

2.1.2 Highly Siliceous ZSM-5
Siliceous, highly crystalline ZSM-5 was kindly provided by G.E. Barlow. The sample
was crystallized from a boron-containing, aluminium-free hydrothermal synthesis. After washing
with boiling water, the sample was calcined at 500 O C overnight to rernove the organic template
(tetrapropylammonium), refluxed overnight with 0.2 M ammonium bifl uoride solution, re-
calcined at 500 OC, and then steamed at 800 OC for 6 days. Following this treatment the ZSM-5
sample had "si MAS NMR linewidths of CU- 0.1 ppm. Before use, samples were calcined at 500
OC for severaI hours to remove any adsorbed species.
2 . 1 Loading of ZSM-5 with p-difluorobenzeoe
Controlled amounts ofp-difluorobenzene were added to freshly calcined ZSM-5
prepared as described above. For samples where 'H-~'S~ CP was required, p-difiuorobenzene
(Aldrich 99+ %) was used. Because simultaneous decoupling of 'H and ' 9 ~ was not possible on
the available NMR probes, 1,4-difluorobenzene-dJ (Aldrich 98 atom% D) which was fuIly
deuterated at the 2- ,3-,5-, and &ring positions was utilized to remove complications (e-g. line
broadening) that could have arisen from 'H-->si dipolar interactions. The volume of liquid
sorbate required to achieve a specific loading (molecules / unit cell) was calculated from the
known density of the liquid, and added to a glass via1 containing the zeolite using a 25 pL glass
syringe with 0.5 p.L divisions. For example, to achieve a loading of 4 molecules / u.c., 20 pL of
p-difluorobenzene-d' was added to 280 mg of zeolite. The glass via1 was then cooled briefly in
liquid nitrogen and immediately flame-sealed. To ensure an equilibrium loading was attained
throughout the sample, it was put into an oven at 60 OC or Ieft at room temperature for at least 48
hours. To ver;@ that the desired loading had been achieved, the samples were checked using
thermal gravimetric analysis and "si MAS NMR.

2 2 SOLID-STATE NMR SPECTROSCOPY
22.1 NMR Spectrometer
AI1 NMR experiments were carried out using a Bruker MSL-400 NMR spectrometer
running ADAKOS 89 and DIS~MSL 91 software. Operating frequencies were 400.13,376.434 and
79.495 MHz for 'H, and 2 9 ~ i respectively. "si chernical shifts were referenced with respect
to tetramethylsilane (TMS), using the highest field resonance of an Q8M8 (set to -1 09.7 ppm) as
an intemediate standard. ' 9 ~ NMR spectra were referenced to extemal CFCI,. The "si offset
was appropriately chosen, and 'H or ' 9 ~ signals set on resonance. A third channel consisting of a
Programmed Test Sources PTS 250 synthesizer (fiequency range 0-250 MHz) and an Amencan
Microwave Technology broad-banded r.f. amplifier (300 W) had been added to the original MSL
spectrorneter. The phases and amplitudes of the r.f. pulses were calibrated using a Hewlett-
Packard 8405A vector voltmeter.
Initial "F / 19s i experiments were done using the F 1 synthesizer set to 3 76.434 MHz to
drive the high-power ' H 1 kW amplifier (retuned to 376.43 4 MHz) which provided about 3 00 W
of r-f. power for the fluorine fiequency. The silicon fiequency was generated by mixing a 400.13
MHz signal (from the F2 synthesizer) with a fiequencydoubled 160.3 175 MHz signal provided
by the F3 synthesizer. The frequency doubling and mixing was provided by a home-built unit.
The "si signal was unmixed and observed at 400.13 MHz.
Later experiments made use of a commercial 'H decoupling arnplifier retuned to 376.434
MHz. This tripled the 125.478 MHz input frequency (from the third channel synthesizer) and
produced an output of approximately 20 W. This was suficient to drive the (appropriately tuned)
hi&-power amplifier, and allowed the FI synthesizer to be used for ' g ~ i . Although lower ' 9 ~ r.f.
powers were obtained with this set-up, it provided a significant increase in the SM ratio when
observing "si because it removed the need for frequency mixing and unmixing. Schematics
detailing the components and connections needed for these experiments are given in Appendix
A.

2.23 NMR Probes, Rotors, and Caps
Commercial Bruker WX double-tuned probes with either Bruker or Doty Scientific MAS
stators were used. These spun 7 mm diameter zirconia rotors holding 250-300 mg of sample. In
some cases a layer of Teflon tape was packed on top to improve the spinning stabiIity of the
sarnples. Spinning speeds up to 5.2 kHz were available with a stability of better than 20 Hz over
a period of several days. For room temperature experiments, Nylon or Kel-F caps were used,
boron nitride stators and caps were required for low temperature work. The magic angle was set
by observing the 7 9 ~ r resonance of KB~,' and the magnetic field was shimmed using a rotor filied
with a dilute aqueous solution of copper sulfate (0.00 1 M) mixed with Da to prevent
overloading the spectrometer receiver,
The performance of the Bruker double-tuned 'WX NMR probes was carefully optimized.
Modifications included soIdering two or three 2 pF (5 kV) capacitors in series across the Ieads of
the sample coil were often required to adjust the frequency of the 'H channel for correct
matching and tuning at 376.4 MHz (for experirnents involving 1 9 ~ ) . These capaciton were WPO"
rated meaning they had very stable capacitance over the temperature range -55 to 125 OC.
Suitable commercially-made and home-bui It fi lters were attached at the probe to irnprove noise
rejection.
The air pressure for MAS sample spinning was controlled using a Bruker MAS
pneumatic unit. Temperature regulation was achieved with a Bruker BVT 1000 temperature
controller and a heater coil within the probe (insulated) bearing air supply Iine. A copper-
constantan themocouple positioned close to the sample allowed a temperature stabiIity of better
than f 1 OC to be maintained.
2.23 Measurement of Nuclear Relaxation Times, Pulse Lengtbs, and Spinning Speed
Measurement of the nuclear relaxation parameters was achieved using the pulse
programs listed in Appendix B. Analysis of the spectra to determine Ti, Tl, and Tl, was carried
out using the commercial Bruker software. Pulse lengths and r.f. field strengths were determined
using the various pulse programs listed in Appendix B. The pulse lengths were always measured
on the sample under investigation to ensure accurate values because this is crucial for the
performance of the REDOR, TEDOR and NADEQUATE experiments. If cross polarization
was used then the "si channel pulse lengths were detennined after polarkation transfer.
Typically, d2-pulses were in the range 6-1 5 p corresponding to r.f- field strengths of 16.6-4 1.6
Hz.
The spinning frequency, v, was determined using an optical spinning rate detector, or
from the peak separations of the spinning sidebands in the ' 9 ~ MAS NMR spectra if no spinning
rate detector was available. The spinning speed was checked before and afier each experiment,
and could be measured to an accuracy of better than 10 Hz. Knowledge of v, was required to
calculate the rotor period and the various delays needed for precise positioning of the pulses in
the TEDOR and REDOR experiments.
2.2.4 Low Temperature Operation
Many of the NMR experiments required stable spinning at low temperatures for
extended periods. This was achieved using cold nitrogen gas as the bearing suppIy to the MAS
rotor with further temperature regulation provided by a heating coi1 inside the probe. In order to
ensure stable spinning speeds, the source gas pressure had to be maintained at a level which
significantly exceeded that being used, and this waç accomplished by utilizing the boil-off from a
large (200 L) self-pressurizing liquid nitrogen Dewar operating at a pressure of 1 100 kPa. The
bearing gas was fürther cooled by it passing through loop immersed in 50 L Dewar filled with
liquid nitrogen. A schematic of the equipment set-up for low temperature MAS experiments is
shown in Figure 2.1. The drive gas was either nitrogen or dry air which was pressure regulated
using the Bruker MAS unit. The probe electronics were flushed continuously with nitrogen gas


to prevent water condensation and ice formation within the probe which could result in
deterioration of the probe performance during the experirnent.
Approximateiy six hours were needed for the probe electronics to reach an equilibrium
temperature (and for the tuning to become constant) after cooling from room temperature. Stable
2 kHz spinning for more than 45 hours at temperatures as Iow as 200 K was possibIe using this
set-up. A digital timer controlled the automatic refilling of the srnall cooling Dewar from another
liquid nitrogen Dewar, and permitted up to 10 hours of unsupervised operation. To maintain a
temperature of 240 K, the timer was set to provide one minute of refilling every 2 112 hours.
During the penods when the large Dewar was being refilied, a flow of nitrogen gas was flowed
through the probe bearing supply, and afier four days operating at low temperature the probe was
taken out of the magnet and air dn'ed overnight with the cover removed.
It was discovered that spinning the samples for long periods of time with nitrogen gas
resulted in replacement of the air inside the spinner by nitrogen. This process was gradua1 but
had a dramatic effect on the NMR experiments because it caused significant changes in the
nuclear relaxation times. For example, over a 20 hour period, the TI values for "si and 'H
increased from ca. 2 s and 46 ms to about 60 s and 4.5 s respectively. This problem was
circumvented by using dry air as the drive gas which ensured the sample contained oxygen,
providing a well-known relaxation mechanism via interactions with paramagnetic dioxYgm3
2.2.5 Cross Polarization and Setting of the Hartmann-Hahn Matching Condition
The ' H - ~ s ~ Hartmann-Hahn cross polarization (HHCP) matching condition was
established experimentally using Q8M8 with the 'H radio-frequency power set on resonance and
held constant and the "si r.f. field strength adjusted to maximize the observed signal for a 2 rns
contact time. For ' 9 ~ - 2 9 ~ i cross polarization the appropriate Hartmann-Hahn rnatching condition
was set on the sample being investigated (octadecasil or ZSM-5 loaded with p-difluorobenzene).
The 1 9 ~ tmsmitter was set on resonance and the "F field strength set to a suitable level with

extemal attenuators. The "si r-f. power was adjusted to optimize the "si NMR signal using
contact times ranging fiom 2 to 30 ms.
Quantitative cross polarkation experiments require constant r.f. field strengths and
spinning speeds, sometimes for penods of several days at low temperature in the work reported
in this thesis. Under MAS conditions the HHCP-matching condition is split into several sideband
conditions which depend directly on the spinning speed, making it necessary to maintain a steady
spinning speed throughout the duration of the experiment. The maintenance of correctly matched
r.f. field strengths was also crucial, and this is affected by the amplifier performance and probe
tuning, For low temperature experiments, a period of 5-6 hours was required for the tuning to
stabilize; this was the time needed for probe electronics to corne to an equilibrium temperature.
On occasion the forward and reflected r.f. power on both channels was monitored by placing a
bi-directional coaxia1 coupler (Narda 3020A, fiequency range 50- i 000 MHz) in-line and
observing the output on an oscilloscope. The Tektronix 2465 oscilloscope had a 300 MHz
bandwidth and had been calibrated to compensate for roll-off at 376 and 400 MHz. Minimizing
the reflected power was the most sensitive method for matching the probe to 50 Q, and obtaining
optimal probe tuning and performance.
2.2.6 REDOR and TEDOR Experiments
In al1 the REDOR experiments the observed nucleus was "si, and the trains of rotor-
synchronous dephasing pulses were applied to "si or 1 9 ~ , depending on the pulse sequence used.
The dephasing pulses were always timed to occur at half and full rotor periods, the ' 9 ~ offset was
exactly on resonance, and the "si frequency was set to be approximately in the middle of the
spectrum. In the REDOR experiments which incorporated an initial cross polariuition from "F to
"si to improve the efficiency, a 10 ms contact time was used. To eliminate artifacts from the
effect of small but finite switching times within the spectrorneter, dephasing pulses were applied
in both the So and Sr experiments rather than removing the pulses for the So as is normally done.

The desired effect of either reintroducing the dipolar interactions or not was then achieved by
switching the frequency on and off resonance using a frequency offset list. A variety of nul1
experiments confirmed that the IO MHz offset employed was suficiently large. Appendix B
contains listings of the pulse programs, as weIl as automation programs used to calculate the
required delays and increment the number of rotor periods.
For TEDOR experiments the ' 9 ~ signal was set exactly on resonance and the observed
nucleus was "si. For octadecasil the 2 9 ~ i frequency was set so that one of the silicon signals was
on resonance since no refocussing z-pulse was used in the period afier coherence transfer. Nul1
experiments performed without the transfer pulse showed that the observed signals arose from
coherence transfer. Several different versions of the TEDOR experiment were used. These
included applying the dephasing pulses on 19si or ' 9 ~ before the coherence transfer pulse. varying
the spinning speed, the positions of the dephasing pulses, and incrementing the number of rotor
cycles before or after the transfer pulse.
2.2.7 2-D lNADEQUATE Experiments
The 2 9 ~ i offset was appropriately chosen so that the individual resonances were clear of
the transmitter and exact convergence of signals on either side of the central frequency was
avoided if possible. The fixed delay was usually set to 15 or 16 ms based on values reported in
the literature for previous 2-D NADEQUATE experiments on zeolites.' Typically, spectral
widths of 800-1000 Hz were used to reduce the noise in the final 2-D spectrum. Because no lock
channel was available on the NMR spectrorneter used, drift in the extemal magnetic field (c 5 Hz
/ day) was compensated for by acquiring several complete 2-D data sets (each containing up to
48 increments in the F 1 dimension) of 12-1 4 hours duration which were subsequently CO-added.
The tmsmitter offsets were carefully adjusted so that 1 -D 19si MAS NMR spectra were exactly
coincident. The number of scans in each experiment was determined by the Tl relaxation times of
the 2 9 ~ i nuclei, or by that of the 'H nuclei if 'H?'s~ cross polarization was used. When high-

power decoupling of ' 9 ~ or 'H was required, the maximum allowable acquisition time was
restricted to ensure the duty cycle did not exceed 10%.
2.2.8 NMR Data Processing
2.2.8.1 Peak Inregration and Deconvoiufion of l-D W R Spectra
For N M R spectra containing only a few weildefined and well-separated resonances,
peak areas were obtained by integration of defined regions of the spectrum. This was used to
rneasure relaxation times, and for processing of NMR data acquired for octadecasil- For the
ZSM-5 samples loaded with sorbate where up to 12 or 24 overlapping resonances were present in
the ">!Si MAS NMR spectra, data were apodized if necessaiy (using a simple exponential
function), Fourier transformed, and phased using the Bruker Wm NMR 1 D software mnning on
an IBM-compatible PC. If required, any baseline corrections were also done at this stage. The
individual spectra were then exported using a J-Camp DX or ASCII file format suitable for
import into the Gram-386 program.'
Curve fitting of the experimental NMR spectra was done using the Grams-386 software
utilizing the appropriate nurnber of Lorentzian curves. The peak intensities were allowed to Vary
with the center fiequencies and peak widths of the individual peaks constrained to values
detemined from fitting of quantitative spectra. A linear baseline was also included during the
feast squares fitting process (minimization of 2) to match the calculated and observed spectra.
2.2.8.2 Processing of 2 4 NMR Specfra
The individual 2-D data sets were zero-filled to at Ieast twice the number of real data
points, apodized using sine-bel 1 functions in both FI and F2 dimensions, and double Fourier
transformed with a power presentation mode using Bruker DISMSL or W N N M R 2 0 software.
The number of real points in the time domain was ofien reduced to improve signal to noise in the
final spectrum.

2.2-8.3 Diktance Determinafions from Andysik of NMR Data
For the CP, REDOR, and TEDOR experiments, the heteronuclear I9~-">si dipolar
couplings were detemined from nonlinear les t squares fitting of the data in the ~uthernatica~
programming environment using the methods descnbed in Chapter 3 and Appendix C. For
experiments where analytical functions in terms of Bessel fiinctions were not available, nonlinear
regression was not practical, and appropriate integrals were detemined and evaluated using
point-by-point numerical integration over a sphere to produce a powder average as outlined in
Appendix C I
Pnor to commencing nonlinear regression analysis, trial fittings were used to determine
approximate values for the parameten that were not fixed in the experirnent. Weighted nonlinear
fittings of the data were carried out using the Levenberg-Marquardt algorithm in Mafhernafica
starting from these initial parameter values. If necessas, some of the parameters were constrained
to realistic (positive) limits. Further details are given in Section 4.2.3.
2 3 X-RAY DIFFRACTION EXPERIMENTS
2.3.1 Collection and Analysis of Powder X-ray Diffraction Data
ZSMJ powder was calcined at 550 OC for 4 hours, cooled to room temperature and
loaded into Lindemann glass X-ray capillaries (0.7 mm diameter). One sample was sealed
directly, another had a measured amount ofp-difluorobenzene (corresponding to slightly less
than 4 rnolecules/u.c.) added before cooling in liquid nitrogen and flame-sealing. Powder XRD
patterns were acquired on a Siemens D5000 system at the Institut für Mineralogie, Ruhr
Universitat, Bochum, Germany. To avoid preferred orientation of the crystallites, the capillary
was mechanically rotated about the long au's diroughout the experiment. Diffraction data were
collected using a focused beam of monochromatic Cu Ka radiation (A = 1.5406 A) and a position
sensitive detector over the range 6.0 - 40.0' 28. A step size of 0.007ï0 was used and each scan
took approximately six houn. Up to six of these scans were CO-added to yield the final XRD

pattern. Diffraction data was acquired at 2S°C and below O OC, with cooling provided by a Stream
of air that had passed through a coiled length of copper tubing packed in dry ice and insulated
within a vacuum flask. Refinement of the ce11 parameters fiom the baseline corrected XRD data
was done using the prograrn AJUST ' as described in Chapter 7.
2.3.2 Loading of ZSM-5 Single Crystals with p-Xylene
Large single crystals of ZSM-5 were grown by Dr. W. Schwieger using hydrothemal
synthesis (3-5 days at 175 O C ) with tetrapropiyammoniurn chloride, then calcined at 500 OC to
remove the templating species. Several large (> 0- 15 mm) crystals without obvious visible
defects or twinning which were suitable for single crystal X-ray difhction experiments were
selected using an optical microscope. These were loaded into 0.3 mm diameter quartz X-ray
capillaries (Charles Supper Company, wall thickness 0.01 mm) with graded quartz-Pyrex
transition pieces attached at the open end, and joined to the purpose-built apparatus constructed
of Pyrex glass show in Figure 2.2. FreshIy calcined highly siliceous ZSM-5 (ca. 300 mg) was
loaded into the powder reservoir, and p-xylene (BDH, generaI purpose reagent 98.5%, Ca. 25 PL)
added to the liquid reservoir. After evacuating the single crystals and ZSM-5 powder for two
hours, the p-xylene vapour was allowed to corne into contact with the ZSM-5. Cooling of the
powder reservoir by immersion in Iiquid nitrogen ensured complete transfer of the pxylene into
the part of apparatus containing the ZSM-5. The liquid reservoir was then sealed and removed.
The entire apparatus was heated at 60 O C for 28 hours, then stored for two days at room
temperature. FolIwoing this the individual capillaries were isolated by closing the stopcocks and
the loading of the ZSM-5 powder verified by thermal gravimetric analysis and MAS NMR of
the ZSM-5 powder. The capillaries containing the single crystals were then immerçed in 1 iquid
nitrogen and flame-sealed as close as practical to the crystal. An equilibrium loading was ensured
by keeping the sealed capillary at room temperature for several days before coltecting the X-ray
difhction data.

Single Zeolite Ciystals in Quartz Capillaries
Quartz-to-Pyrex Graded Seal
Figure 2.2 Apparatus for loading up to three single zeolite crystals with precisely controlled amounts of volatile sorbates. The main body (opproximate volume I O mL) is constructed from borosilicate (Pyrex) glass and can be evacuated. The stopcocks (Kontes Air-less ware) have PTFE valves with Viton O-rings and polyacetal knobs and the entire systern may be heated to 1 OO°C during the equilibration procedure. Glass wool prevents loss of zeolite powder during evacuation.

233 Collection and Refinement of Single Crystal Diffraction Data
Dr. S. Rettig of the Chemistry Deparhnent at the University of British Columbia.
colIected X-ray d ihc t ion data on a single ZSM-5 crystal loaded with ca. three rnoleculesp-
xy1eneh.c. at a temperature of 1 80 K using graphite monochromated Mo Ka: radiation. A
Rigaku ACF7 diffictometer equipped with an Area Detector System Corporation charge-
coupled device (CCD) detector was utilized and a total time of 2 1 hours was required for the data
coltection. The crystal was cooled by a flow of cold nitrogen gas. The indexed difiction data
was processed using the r e h for Windows software,'Y and refined using the program SHELX-
9? running on an IBM-compatible PC with a Pentium 200 processor under the Windows NT
operating system. Full details of the refinernent are described in Chapter 8.
REFERENCES FOR C W T E R 2
2 Cadiet, P.; Guth, J.L.; Hazrn, J.; Larnbtin, J.M.; Gies, H. Eur. J. SolidStute Inorg. Chem. 1991,28.345.
2 Frye. J.S.; Maciel, G.E. J , Magn. Reson. 1982,48, 125.
3 Klinowski, J.; Carpenter, T.A.; Thomas, J.M. J. Chem. Soc.. Chem. Commun. 1986,956.
4 Fyfe. C.A.; Grondey, H.; Feng, Y,; Kokotailo, G.T. J. Am. Chem. Soc. 1990, 1 12,88 12.
5 Grams-386, Galactic Industries Corporation, 395 Main Street, Salem, NH 03079 USA.
6 Wolfi-am, S. The Mathematica Book Third Edition. Cambridge University Press, 1996.
7 AJUST.- Programa D'exiraccio D'intensitats Integrades, Version 13, 1996, Rius, J. Institut de Ciencia de Materials de Barcelona (CSIC), Catalunya, Spain.
8 teiY.sun for Windows 1.01. Molecular Structure Corporation, 3200 Research Forest Drive, The Woodlands, TX 7738 1, U.S.A.
9 S heldrïc k, G. SHELXL-97: Program for the Refinement of Crys~al Smctures. U n iversiîy of Gottingen, Germany. 1997.

HETERONUCLEAR DISTANCE DETERMINATIONS
FROM CROSS POLARIZATION, REDOR, AND TEDOR
NMR EXPEltiMEWTS
3.1 INTRODUCTION
Solid-state NMR spectroscopy has considerable potential in soiid-state structure
investigations via the direct determination of internuclear distances fiorn experiments based on
the through-space dipolar interactions between pairs of nuclei. The dipolar coupling, D, between
two nuclei, (and S, depends on the gyromagnetic ratios of the two nuclei, y,, and ys, and on the
intemuclear distance r (Eq. 1.10). Furthemore, since D ac f3, moderately accurate values of
dipolar couplings can yield very accurate values for the corresponding internuclear distances,
with the most unarnbiguous distance measurements coming fiom experïmental systems where I
and S interact as isolated spin-pairs.
in high-resolution solid-state NMR, magic angle spinning is used to narrow the otherwise
extremely broad (up to several kHz) resonances. Under MAS conditions the heteronuclear
dipolar interaction is not removed, but its average over each complete rotor cycle is zero.'.' Thus,
in its simplest fom, the use of MAS precludes a direct measurement of D.
In the cross polarization (CP) expeiiment, spin polarization, and thus net magnetization,
is transferred via dipolar interactions from abundant I spin system (usually 'H) to the dilute S
spins (e-g. "c, '%, or %i), which are then observed. Commonly, CP experiments are carried out

where the signal intensity is rnonitored as a finction of the spin-locking tirne t. The initial build-
up of intensity is related to the strength of the I-S dipolar couplings, and thus analysis of CP
experiments shouId permit discrimination between different I-S distances, and ideally, yield
quantitative estimates for these distances.
Recently, Schaefer and CO-workers have introduced the Rotational-Echo DOuble
Resonance REDO OR)^..' and Transferred-Echo DOuble Resonance (TEDOR)"' experirnents
which use radio frequency pulses applied at specific points in each rotor period to prevent the
complete averaging out of the dipolar interactions, and thus permit dipolar dephasing to occur.
Using appropriate a.nalysis,M the magnitude of the dipolar couplings can be experimentally
determined and accurate interatomic distances can be determined, TEDOR and REDOR have
been applied to amino acids," peptides,""' proteins,'o." semiconductors,*2 polymers,13 and
molecular sieve frame~orks.'"'~ In cases where the distances are known independently from X-
ray diffraction measurements, those obtained from REDOR and TEDOR experiments are in very
good agreement."'
In the present Chapter, the solid-state NMR techniques of cross polarization, REDOR
and TEDOR are introduced, and the background theory is outlined. The mathematical formalisms
required to analyze the experimental data and obtain estimates for the I-S distances are then
developed. Appendix C contains details of the implementation of these calculations on a
computer utilizing the ~a therna t i cd~ programming environment.
The case of isolated IS spin pairs, where it is possible to obtain unambiguous
heteronuclear distances, is treated first. The analysis is then extended to encompass cases where
multiple I spins are coupled to a single observed S spin. The effects of molecular motions that
occur on the timescale of these experirnents are also described. Because these experirnents rely
on the hetemnuclear dipolar coupling, and were carried out under MAS conditions, a bief
discussion of the behavior of the dipolar interaction under MAS is presented first.

3.2 HETERONUCLEAR DIPOLAR INTERACTIONS UNDER MAS
As discussed in Section 1.2.3.2 spinning the samp1e suficiently fast about an axis
inclined at 54-74" to & averages the effective dipolar coupling to zero over a complete rotor
cycle. However the dipole-dipole interaction does not vanish - in fact only those spin-pairs whose
internuclear vectors are pal le1 to the spinning axis (Le. B = 0, see Figure 1.6) will have a
dipolar coupling of zero at al1 times during a rotor cycle. For al1 other orientations the dipolar
coupling is still present and changes continuously dunng the rotor period. Eq. 3.1 gives the time
dependence for the dipolar coupling under MAS.'
a and @ are the azimutha1 and polar angles respectively, and define the position of the
intemuclear vector as shown previously in Figure 1.6. The behavior of the dipolar coupIing for
an isoIated spin-pair as a function of the rotor period (calculated for two different orientations of
the internuclear vector relative to the external magnetic field using Eq. 3.1) is pIoteed in Figure
3.1. Inspection of Figure 3.1 reveals that the value of the dipolar coupling has a periodic
dependence on the rotor cycle. Since only the time average of the dipole-dipole interactions over
each cycle is zero, the dipolar coupling can still be utilized to investigate connectivities and
measure distances between nuclei.
3 3 CROSS POL,ARIZATION
As discussed in Chapter 1, Hartmann-Hahn cross polarization (HHCP) is the most widely
used technique for heteronuclear double resonance experirnents in solid-state NMR. Stejskal and
Memory have written an excellent book on the fundamentals of CP under MAS conditions which
presents a detailed overview of the topic.I9 In the mon cornrnon case we have abundant spins
such as 'H coupled to dilute spins e.g. 13c. In the present discussion we consider the phenomenon

Figure 3.1 Behavior of the dipolar coupling as a fiinction of the spinner orientation under MAS for the heteronuclear spin pair orientations indicated. Curves were calculated using Equation 3.1 with D = 1000 Hz and the time is given as a hction of the rotor period.
in more detail, with specific emphasis on situations involving srna11 numbers of spins (e-g. IS.
&S, etc.) where 1-S distances rnight be detennined.
The pulse sequence used to accomplish the magnetization transfer from I to S spins via
the Hartmann-Hahn spin-lock is shown in Figure 1.8. The CP experirnent is selective in that only
S nuclei which are dipolar coupled to the Ispins will show signais in the CP spectrum, and any
uncoupled S spins will be not be observed. Because the dipolar interaction is a through-space
interaction. it is not necessary that the coupled (and S nuclei be covalently bonded; they only
need to be close to one another.

33.1 Cross Polarization for Isolated IS Spin Pairs
3.3.2.1 Sfa fionary Samples
For efficient magnetization transfer to occur during the contact time, the amplitudes of
the r.f.-fields applied to the ((mir = -y1 Bir) and S (a ls = -yu Bis) spins must be adjusted so that
the Hartmann-Hahn matching condition is met. For spin- I/2 nuclei in a static sample the
Hartmann-Hahn match is described by Eq. 3.2."
The separation of the Zeeman levels in the rotating M e is equal for both the I and S
spins when this condition is satisfied, and mutual spin-flips allow the transfer of polarization
between the two spin systems to occur." Since the r.f. field strength (in fiequency units) is equal
to the reciprocal of the 2x-pulse time, this condition corresponds experimentally to the d 2 pulse
times on both channels being equal. For static sarnples the Hartmann-Hahn matching condition is
usually broadened by the stronger 1-1 homonuclear interactions. The theoretical CP matching
profile calculated for a static sarnple is shown in Figure 3.2. Matching profiles such as this
represent the eficiency of the polarization transfer (signal intensity of the S spins) as a function
of the mismatch of the r.f.-field strengths wl- ois The broad profiIe observed in this case
indicates that there is still efficient polarization transfer even if the r.f. fields are not precisely
matched.
As described by Hediger, for a static single ciystal in the high-field approximation (1 mil
+- olsl »I bol ) with matched r.f. fields ( a l l = mis), the expectation value of the polarization on
the S spin, <S?(r) is:"

Figure 3.2 Cross polarization matching curves calculated for a solid with relatively weak dipolar couplings. The MAS spinning rates (a,) and sideband matching conditions V) are indicated. Adapted from reference 21.
Here cool is the Larmor frequency of the (spin and bu is the orientation dependent dipolar
coupl ing defined by Eq. 3.4, where D is defined in Eq. 1.10.
Eq. 3.3 descnbes the shuttling of the polarization back and fonh between the land Sspins with a
Frequency corresponding to buand this will depend on the orientation of the I-S internuclear
vector relative to the static magnetic field Bo (Figure 1.6). In a powder we must consider the
orientations of the individual crystallites, and this is achieved by integrating over the angle 9. For
a powder the tirne dependence of the polarization on the S spin is defined by:"
with

This superposition of many different cosine functions in a powder gives nse to a damped
oscillation as depicted in Figure 3.3(a). The Fourier transform, Go(@, of the oscillatory part of
Eq, 3.5 yields a Pake doublet which provides information about the dipolar coupling O directly
(Figure 3.3(b)). Equation 3.6 can also be expressed in terms of Bessel functions of the first kind
using the mathematical formalism reported by ~ u e l l e r ' as described in Appendix C. This results
in a more efficient calculation than numerical integration and simplifies non-linear Ieast squares
fitting to experimental data with Eq. 3.5.
The spin system under consideration reaches an intemal quasi-equilibrium state, CS,,
after a suitable time, and this is followed by fùrther equilibration with the lattice on a longer time
scale. With the Hartmann-Hahn polarization scheme for a truly isolated IS spin system (ignoring
any relaxation), half of the polarization initially on the I spin is transferred to the S spin, Le.
<S2'-,== wo, 1 2.
In real systerns it is necessary to consider the case where N (not necessarily equivalent) 1
spins are coupled to a single S spin. These additional couplings will influence the system in two
ways. Firstly, there can be an additional damping due to spin diffusion among the I spins.
Secondly there will be an increase in the maximum poIarization which the S spin can attain in the
quasi-equilibrium state. For a "real" isolated spin system it is likely that the S spin is strongly
coupled to one Ispin, and weakly coupled to many other remote [spins. If there is a coupling to
the environment which can be considered as an infinitely large temperature bath (large, open spin
system), the initial polarization on the N I spins will be distributed over the (N + 1 ) spins, and
CS>,= oo, NI (N +1), which approaches oo, for large N."
Transient oscillations in CP signal intensities as a function of the contact tirne were first
reported by Müller et al. in their 'H-"C CP study of a stationary ferrocene crystal? and they
derived an equation (Eq. 3.7) which describes the osciIIatory behavior observed in the build-up
of the "C magnetization.

(a) Static, Matching Condition o 11 - o is = O
(b) MAS, Matching Condition 0.111 - ois = +or
(c) MAS, Matching Condition O 1, - O 1s = S m , 0 / 2
Figure 3.3 Evolution of the S spin polarization for an isolated iS spin systern in a powder sample and the Pake doublets obtained fiom the Fourier transfomi G,(w) of the oscillatory part. (a) Stationary sample at exact Hartmann-Hahn match. Samples under MAS at (b) f = * 1 and (c) f = *2 sideband matching conditions. Adapted corn reference 23,

The first order rate constants kl, and k2 describe the decay of the transient oscillation and the
increase in the net magnetization respectively. Müller et ufdb. assumed that the spin system could
be described by a Hamiltonian limited to the strongly coupled ïS spin pair, with the effect of
more remote I spins represented by an isotropie random-field spin-diffusion relaxation
mechanism- Under this latter assumption they proposed that kl = 3R/2 and k:! = R where R is the
relaxation rate constant. Hediger has since determined that the rate constants kl and k2 are better
treated in de pendent^^." If the spindiffision rate constant R is of the same order of magnitude or
larger than a11 heteronuclear couplings, the model used to derive Eq. 3.7 is no longer valid.
Eq. 3.7 can easiIy be extended to the case of a powder by replacing the cosine function
by its integral over 9, defined by go(r) in Eq. 3.6. Considering the quasi-equilibrium polarization
62, obtained for long contact times we obtain:"
3.3.2.2 Samples Undergoing Mngr'c Angle Spinning
Sample rotation such as MAS introduces a time dependence in the dipolar Hamiltonian
which means that it cannot be solved analytically for most systems. Using Floquet Theory,
Hediger was able to obtain approximate, time-independent Hamiltonians and to predict the
explicit CP MAS behaviour for isolated ïS spin pairs under spin-locking (Hartmann-Hahn) CP
conditions."-25 The relevent results fiom her work are summarized is this Section.
As discussed in Section 3.2, sarnple rotation causes the dipolar interactions to become
time-modulated and averaged to zero of each complete rotor period. Stejskal et aL2' tirst
described the effects of MAS on Hartmann-Hahn cross polarization. They showed that the

matching condition centered at al, = ois splits into narrow sideband conditions ail = cols +for (f
= 0, il, e, +3 . . .) sepantted by the rotation FrPquency or (Figure 3.2). These sideband matching
conditions will appear whenever the MAS frequency Ur is comparable to, or exceeds, the width
of the abundant I spin resonance and the heteronuclear dipolar coupling fkequencies. If the MAS
frequency is slow compared to the homogeneous linewidth of the abundant [spins, sample
spinning does not significantly influence the polarization transfer obtained by HHCP.
However, if the sample rotation is sufficiently f a t (or / 2x » D) then the CP effkiency
can be dramatically affected. This can occur in solids such as hexamethylbenzene and
adamantane where fast molecular motions significantly reduce the strong intramolecular
homonuclear dipolar couplings, or if there are small, relatively isolated clusten of spins. This so-
called fast MAS regime can now be reached in many samples with modem high-speed spinning
systems (currently capable of achieving speeds in excess of 30 kHz), and must be taken into
account in CP MAS experiments under these conditions.
For an isolated /S spin system spinning suficiently rapidly to reach the fzt MAS
regime, the HHCP matching condition is split into only four new sideband matching conditions
(Figure 3.2(e)):""
The expectation value of the polarization on the S spin at the matching condition f is then defined
by :"
with
The orientation dependent dipolar couplings at the first e l ) and second Fe) sideband
matching conditions are given by Eqs. 3.12 and 3.1 3?3

The polar angles a and B descnbe the orientation of the internuclear vector r with respect to a
MAS rotor-fixed coordinate system with its r-axis along the spinning axis as shown previously in
Figure 1.6. Eq. 3.1 1 can also be expressed in terms of Bessei functions for convenient fitting of
experimental data as described in Appendix C.
The integration in Eq. 3.10 for an isolated spin system is taken over only a single angle
(p) because it is not possible to detect the phase of the dipolar coupling. Note however, that if
several 1 spins are coupled to the S spin, the integration would be over both angles.26 Figures
3.3(a-c) show the theoretical oscillatory behaviour predicted for an isolated IS spin pair by Eq.
3.10 at the MAS matching conditions and their corresponding Pake patterns. The evolution of the
spin system is identical at matching conditions for f = 1 and -1, and for f = 2 and -2. No CP
transfer is predicted to occur at the centerband position (ois = mil), although this is sometimes
observed due to the contribution of flip-flop processes between remote I spins and from
polarization transfer via heteronuclear ~ - c o u ~ l i n ~ ? ~
In the high-speed limit (a, I2a » D), Eq. 3.8 can be extended to the case of a powder
undergoing MAS by replacing the oscillatory part ga(r) by the corresponding oscillation for
rotating samples, g-j(r) depending on the matching condition used. Considering the quasi-
equilibrium polarization <S>qe inside the spin system we obtain:"

Sample spinning tends to reduce the 1-I homonuciear couplings somewhat, and thus under MAS
<Spqe can take on values between 0.5 (ideal isolated two-spin system, no kz as a consequence)
and 1 .O (significant 1-1 homonuclear c o ~ ~ l i n g ) . ~ ~ Provided the spinning speeds are not vastly
different, the oscil latory behavior should be independent of the MAS speed used.
Dipolar oscil1ations have been reported for several different systems under MAS
conditions, and attempts have been made to determine the dipolar coupling in some
However, in a11 but two cases the data was fitted using slight modifications of the equation
derived by Müller et al. (Eq. 3.7) i.e. for a stationary single crystal.-'" Thus the effects of having
a powder sample, MAS, and sideband matching conditions were not incorporated, and the
couplings obtained must be viewed accordingly. Hawkes et al." included the effects of MAS, but
not sideband matching to qualitatively reproduce the oscillatory behavior they observed, but
made no estimate of D. To date the only reliable determination of the heteronuclear dipolar
coupling fiom the oscillatory behavior in CP MAS experiments is for ferrocene in a powder
sample of CO-crystallized Csa(ferroceneh by ~ e d i ~ e ? . ' using the mathematical treatment
presented in this section.
33.2 Cross Polarization in SmaH Spin-Clusters
Systems with srnaII clusters of spins which are relatively isolated fiom one another i.e.
Id spin systems are also possible, especially in the presence of MAS and rapid molecular
motions. However the equations in Section 3.3 for isolated IS spin pairs were derived using
specific assumptions to define the Hamiltonian describing the interactions in such systems. The
prediction of the Hartmann-Hahn CP behaviour for small spin clusters is much more
complicated. The different 1-S couplings will behave homogeneously, and if a11 of the couplings
(both I-land 1-S) are of the same order of magnitude (e.g. in a CH2 group) the Hamiltonian must
be constructed taking into account both the number of spins and their explicit geometrical
arrangement. A full quantum mechanical calculation could then be performed for each crysîallite

orientation, which may be feasible for 3-spin system (Le. -S) but would be very time consuming.
1t may also be possible to apply Floquet Theory to calculate the behavior of <Sz>(t) under the
appropriate Hamilton ian.'6
At present no simple way to calculate the CP behavior for small spin clusters has been
presented in the literature, and although the calculations could theoretically be done, this was not
attempted in the present work since it was considered outside the scope of this research. In the
1 iterature, oscillatory CP behavior is apparent in samples which very likely contain [$ spin
systems with N < 4. Such osciilatory behavior is anticipated provided that the number of I spins
is small, and is also observed in the theoretical behavior calculated for some 1s systems under
REDOR and TEDOR conditions (see Chapter 5).
If the observed S spin is strongly dipolar coupled to many I spins, oscillations at several
fiequencies interfere and a smooth exponential rise to a maximum followed by a decay due to
relaxation is typically observed."'" The dynarnics of magnetization transfer during Hartmann-
Hahn CP for such a system is presented in the next section.
3 3 3 Cross Polarization in a Network of Strongly Coupled I Spins
For systems with a large nurnber of l spins (e.g. 'H) dipolar coupied to isotopically dilute
S nuclei (e-g. "c), the spin-lattice relaxation in the rotating frame of the abundant l spins (Tldl))
is usually much faster than that of the S spins (T,,,(S)). In this case Tlp(I) dominates the decay and
the relaxation due to Tlp(S) can be ignored."" An expression of the form of Eq. 3.15 describes
the behaviour of the observed S spin net magnetization in such situations. Here Mo is maximum
magnetization obtainable in the absence of relaxation and M(r) are the net magnetization
attained after matched Hartmann-Hahn CP for time r.
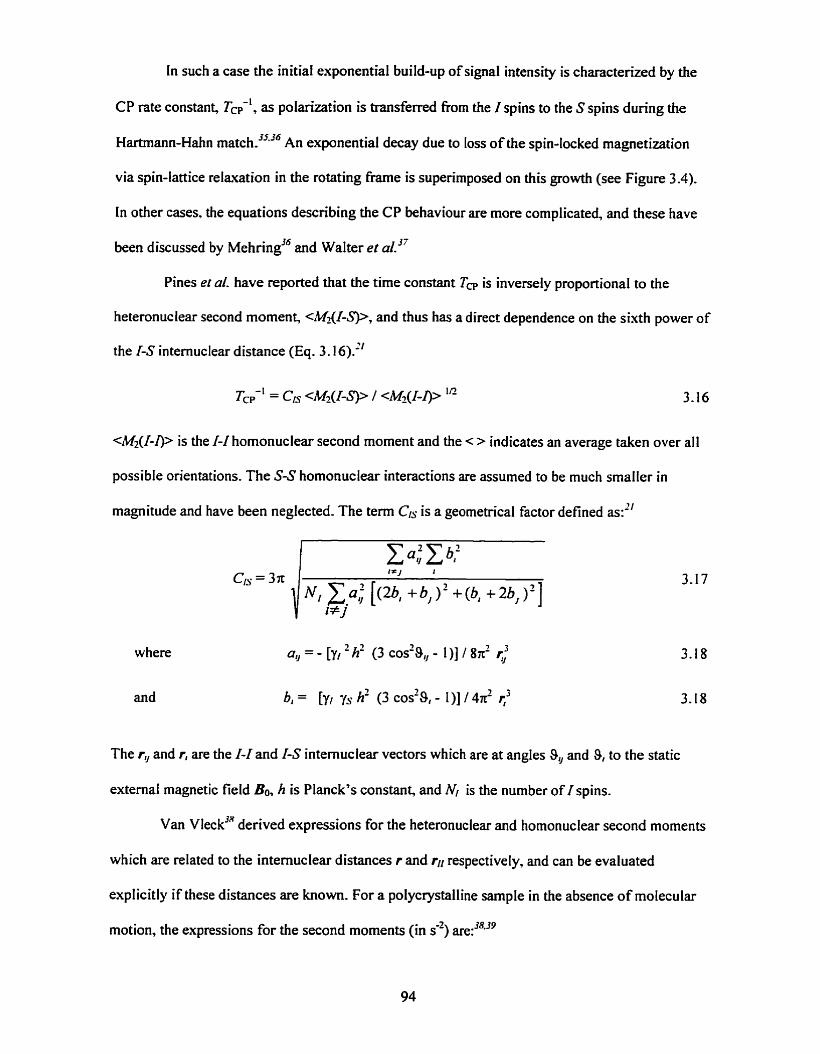
In such a case the initial exponential build-up of signal intensity is characterized by the
CP rate constant, T&', as polarkation is transferred from the I spins to the S spins during the
Hartmann-Hahn An exponential decay due to loss of the spin-locked rnagnetization
via spin-lanice relaxation in the rotating frame is superimposed on this growth (see Figure 3.4).
In other cases. the equations describing the CP behaviour are more complicated, and these have
been discussed by ~ e h r i n ~ " and Walter et cil.''
Pines el al. have reported that the time constant TCp is inversely proportional to the
heteronuclear second moment, CM~(I-S))~ and thus has a direct dependence on the sixth power of
the 1-S intemuclear distance (Eq. 3.16)."
<M2(I-1)2 is the 1-1 homonuclear second moment and the < > indicates an average taken over al1
possible orientations. The S-S homonuclear interactions are assumed to be much srnaller in
magnitude and have been neglected. The term Cis is a geometrical factor defined as:"
where a, = - [yI ' h' (3 COS'S,, - 1 )] 1 83' r: 3.18
The r,, and r, are the I-I and 1-S intemuclear vectors which are at angles S, and 9, to the static
externai magnetic field Bo, h is Planck's constant, and NI is the number of Ispins.
Van vleck3' derived expressions for the heteronuclear and homonuclear second moments
which are related to the intemuclear distances r and r,, respectively, and can be evaluated
explicitly if these distances are known. For a polycrystalline sample in the absence of molecular
motion, the expressions for the second moments (in s-~) are:"''

Figure 3.4
- r - 8 20 40 I 1
60 80 1 O0 Contact Time (ms)
Theoretical CP behavior for S spins in a network strongly homonuclear coupled I spins. The thick Iine was calculated using Equation 3.15 with TCp = 5 ms and Tl , = 100 ms and shows the effect of the build up of the S spin magnetization (thin line) in the presence of the I spins Tl , exponential decay (dashed line).
Signai Intensity
Contact Time (ms)
Figure 3.5 CP MAS curves for glycine showing the different behavior for the methylene (CH2) and carbonyl (C=O) carbons as a function of the contact time. Adapteded fiorn reference 22.

Usually some suitable cut-off distance is chosen (typically 8-10 A), after which the interactions
are ignored? The effects of rnolecular motion on the second moment can be accounted for using
the formalism presented by Michel et al." The derivation of the appropriate equations is given in
Appendix D.
Thus, using Eq. 3.15 (or an appropriate function which describes the behaviour in a
given system), it should be possible to fit the CP signal amplitude as a function of the contact
tirne and to deterrnine TCP. Discriminations between different 1-S distances shoutd follow fiom
cornparisons of the TCp values; small TCP values will correspond to short heteronuclear distances
while larger TCP's indicate longer distances. The literature contains some examples where
measurernents of average intemuclear distances from Tm values have been This
behavior is weli illustrated by the 'H-"C CP MAS curves measured for the carbonyl and alpha
carbons in glycine (Figure 3.5).
3.4 ROTATIONAL ECHO DOUBLE RESONANCE
In the EEDOR pulse sequence, a different approach is taken to make the effect of the
di polar coupling directly observab le under MAS conditions. Trains of rotor-synchronized x-
pulses which reverse the sign of the dipolar coupling are applied to reintroduce the effects of the
heteronuclear dipolar coupling that are normally removed by sarnple rotation at the magic angle.
Two dephasing pulses per rotor cycle are needed to prevent the spinning from averaging the
heteronuclear dipolar interactions to zero, and to ensure the dephasing is accurnulated? Figure
3.6 shows REDOR pulse sequences with and without initial cross polarization. They both consist
of a simple spin echo sequence on the observed nucleus, and a train of rotor-synchronized x-
pulses on the unobserved, dipolar-coupled spins.

Figure 3.6 REDOR Puise sequences. Two experiments are performed; one with no dephasing pulses (So experiment) and one with dephasing (Sr experiment). A series of these two experiments is acquired using different numbers of rotor periods n. The dephasing n-pulses are shown at half and complete rotor periods which gives the maximum dephasing, but positions can be varied. (a) Spin-echo on observed (S) nuciei and dephasing K-puises on the I spins. (b) Sequence with initiai cross polarization of the S nucluei from an abundant nucleus (e-g. ' H).
x/2
'H SL DECOUPLE

Two expenments are performed, one with the dephasing sc-pulses applied to the
unobserved spins, and one without. The echo intensity of the experirnent where no dephasing
occurs is denoted by So, while that of the echo acquired under the influence of the reintroduced
heteronuclear dipolar dephasing is Iabeled SI. The normalized intensity difference, AS = So - Sf, is
due to the effect of the heteronuclear dipolar coupling. The REDOR technique has been
successfully applied to determine heteronuclear distances in a nurnber of systems including
amino a~ids."~ proteins," semicond~ctors,'~ and p~ l~mer s . ' ~ Distances as large as 8 A 19 31 and 16 A have been determined between isolated l9~-l3c and F- P nuclei re~~ectively.""
3.4.1 REDOR Behavior for holateci IS Spin Pairs
For an isolated ïS spin pair, AS/So shows a non-periodic oscillation (whose "period" is
related to the heteronuclear dipolar coupling, D) when plotted against the number of rotor cycles,
n, the evolution time, rtr, or the dimensionless parameter 1 = n ~ s , . ' Here r, = I/vr = 23 / or is the
time for one complete rotor revolution. The phase accumulation h m dipolar dephasing for an
isolated heteronuclear spin-pair may be calculated by integrating over the time of the evolution to
yield the normalized REDOR difference signal as defined by Eq. 3.22 with the integration Iimits
a E [O, 2x1 and p E [O, n].'
Here a is the azimutha1 angle and P is the polar angle defined by the intemuclear vector in a
coordinate system defined with the z axis parallel to the rotor axis as illustrated previously in
Figure 1.6. The factor of (4x)-' is required to normalize this integral, and the sin P is a
geometrical weighting factor required to account for the statistical (spherical) distribution of the
pairs of nuclei in a powder about the spinning axis. For two dephasing R-pulses per rotor cycle
positioned at one-half and comptete rotations of the spinner, the REDOR phase accumulation
- AOR is given by Eq. 3.23.'
Mueller has derived an elegant analytical mathematical formalism which allows the
REDOR behavior to be expressed in terms of Bessel functions of the fint kind.' Using this. Eq.
3.22 can be evaiuated with a significant reduction in computation time. lt also makes possible
non-linear l e s t squares fitting of experimental data. Details of this approach are presented in
Appendix C.
In a REDOR experîment AS/So may be monitored as a îùnction of either the number of
rotor periods or the position during the rotor cycle at which the dephasing pulses are applied,
with the number of rotor periods constantl Commonly, a series of dephasing x-pulses is applied
to the unobserved heteronuclear spins, with a simple spin-echo sequence on the observed spins as
shown in Figure 3.6(a), but other variations have been reported."'6 The importance of phase
cycling the dephasing pulse, finite puise lengths and accurate positioning of the pulses have been
investigated."+' Because the REDOR experïrnent involves the formation of an echo for the
observed nucleus, it is the nuclear relaxation characteristics of this nucleus which determines
how quickly the sequence can be repeated (T l ) , and the maximum dephasing time at which viable
signal intensity can be recorded (Tz).
Figure 3.7 illustrates the theoretical REDOR behaviour predicted for an isolated IS spin
pair with different dipolar couplings. These REDOR curves agree exactly with those previously
published, and were calculated assuming that the spins were at fixed positions within a rigid
lattice. If the system can be described as an isolated IS spin pair, then the magnitude of the
dipolar couplings c m be deterrnined by fitting of the expenmental data with an appropriate
expression (e.g. Eq. 3.22), and this permits accurate measurements of interatomic distances for

Rotor Periods
Figure 3.7 Theoretical REDOR behavior calculated for an isolated IS spin pair. (a) Effect of diflerent dipolar couplings at spinning rate of 4.0 kHz D=l000 Hz (solid line), -500 Hz (dashed line), and B 1 0 0 Hz (dotted line). (b) "Universal" REDOR curve with AS& plotted as a fùnction of the dimensionless parameter h=nDt,.
systems of isolated heteronuclear Experimentally, the requirement of isolated spin-pairs
has usually been met by isotopically labelling the molecules of interest (e.g. "c-'% in nahiral
cornpounds) and diluting these in a large excess of the unlabelled compound.b"'
Schaefer et d6 have noted that the initial behavior of the universal REDOR curve (Le.
that plotted versus the dimensioniess parameter h = nDr,, (see Figure 3.7(b)) is parabolic, being
described by AS/So = 1 .O66 A.'. In principle, this allows the dipolar coupling to be quickly
determined from the initial dephasing, but this approach is val id only when the spin system under
investigation can be described as a truly isolated iS spin pair (see Chapter 5).
Positioning the dephasing pulses at half and full rotor periods produces the maximum
dephasingJ0 but other pulse positions can be used. If the pulses are not at ri2 and r, then
appropriate functions &&(a, p, A) must be detemined (see Appendix C). These may then be
evaluated using point-by-point numerical integration over a sphere to produce a powder average,
or alternatively derived in ternis of Bessel functions using the fonnalism presented by Mueller.
Fourier transformation of the REDOR dephasing signal S/So (Figure 3.8(a)) yields a
resonance with a width proportional to the dipolar coupling (Figure 3.8(b)). In practice however,
it is usually difficult to determine D precisely due to problems associated with determining the
exact width of the Recently Mueller et al. derived a new analytical transform method,
analogous to the Fourier transform, that pmduces resonances at the di polar coupling frequenc ies
present in the REDOR signal? They named this the REDOR transfomi, and theoretically this
permits direct determination of 1-S distances provided that the dephasing S/So is due to isolated
IS spin pairs. Figure 3.8(c) shows the dipolar spectrum resulting from a REDOR transform of the
REDOR data in Figure 3.8(a). The REDOR transform has been successful !y appl ied to determine
6 LI-"C distances," and for simultaneous multiple distance measurements in peptides." Further
details of this approach are presented in Appendix C.
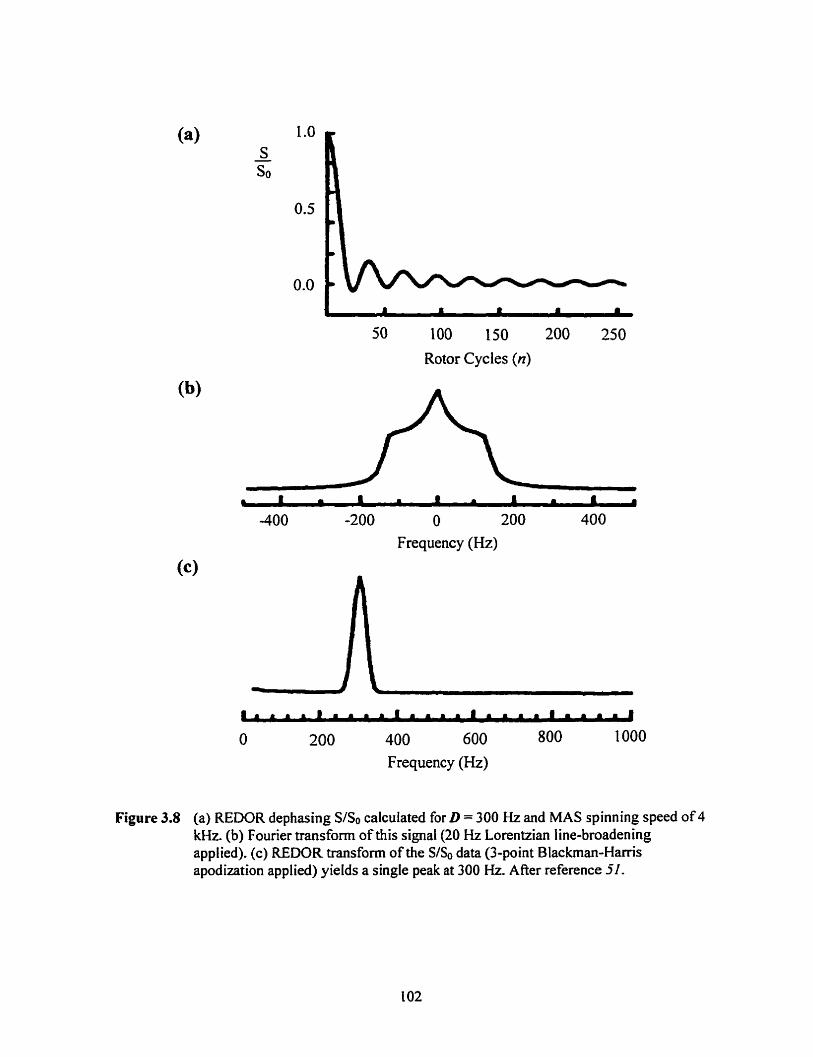
-400 -200 O 200 400 Frequency (Hz)
Figure 3.8 (a) REDOR dephasing SISo calculated for D = 300 Hz and MAS spinning speed of 4 kHz. (b) Fourier transform of this signal (20 Hz Lorentzian line-broadening applied). (c) REDOR transform of the S/So data (3-point Blackman-Harris apodization applied) yieIds a single peak at 300 Hz. ARer reference 5 1.
3.42 REDOR Behavior for a Single S Spin Dephased by Several I Spins
When the observed magnetimtion of a single S spin is dephased by simultaneous dipolar
interactions with more than one 1 spin, the dephasing wiIl normally be most affected by the
nearest I spin (since D oc llr 4. However, when the distances are comparable, dephasing fiom
multiple spins will be cumu~ative."~ REDOR distance determinations are thus much more
complicated if several I nuclei contribute to the dephasing. Such a situation can arise in
isotopically enriched samples when there is a significant presence of naturat abundance
"background" spins. Even in non-enriched samples, there can be cases where a single S spin is
dipolar coupled to several I spins as will be seen Iater in this thesis. These multiple ispins cm
substantially influence the observed dephasing, especially if the nuclei under investigation have
large gyromagnetic ratios. Corrections for this background dephasing may be made by
subtracting the dephasing measured for a natural abundance sample6 but this is not always
feasible. Another option is to generate or propose a mode1 structure assuming an appropriate
statistical and geometric distribution of the dephasing spins, and then to caIcuiate the multi-spin
dephasing as described below.
Several approaches which permit the calculation of the REDOR behavior for systerns
where multiple spins are dipolar coupled to the observed spin have been reported. 63.I2.3.55
Calculations for three-spin systems indicate virtually no difference between the dephasing
calculated either including or neglecting the effects of hornonuclear couplings, provided these
interactions are significantly smaller than the magic angle spinning speed.f'.'5 In the equations
presented here, the effects of homonuclear coupling are assumed to be averaged out by the
sample spinning, and are thus not included.
Naito et al." detailed the derivation of an expression for a three spin system based on the
assumption that it could be represented as the summation of two painvise interactions with
permutations of the possible spin States. They demonstrated that the geometrical arrangement of
the spin-pairs had a measurable effect on the calculated curves. Schaefer and CO-workers derived

a more general equation for the REDOR behavior of an S spin dipolar coupted to any number of I
spins provided that the geometric arrangement of these spins is known-j4." This is also based on
the addition of pairwise interactions. Further, Schaefer et a[. were able to formulate their final
equations for multi-spin REDOR in terms of a product of cosine terms, rather than as the sum of
cosine sums. The product representation gives a substantial improvement in the eficiency of the
computations, and this eficiency becomes more important as the number of spin pairs involved
increases.
The calculation of multinuclear dephasing is based on the additivity of exponential
products.'6 and requires a knowledge of the relative geometry as well as the intemuclear
distances.*." Where the structure is known this c m be incorporated, otherwise a rnodel of the
spin cluster must be proposed. The dephasing of a single observed S spin dipolar coupled to more
than one I spin can be calculated directly as the powder average of a sum of independent
dephasings assuming that the I nuclei are not coupIed to each other, and that the I spin
dephasings of the S spins are independent of one another."" The first condition can be satisfied
when the sarnple is undergoing magic angle spinning at speeds that greatly exceeded the largest
homonuclear 1-Idipolar coupling. The second condition has not been demonstrated to date but is
assumed to hold because satisfactory fits to REDOR data under this approximation have been
obtained in a few stems."'^^^"'^
For a collection of two or more I spins dipolar coupled to an observed S spin, three
angles are required to produce al1 possible relative orientations of the intemuclear vectors in a
spinning powder sarnple. While it is possible to parameterize a muitiple spin system by
specifying the spherical poiar angles (a, P) of the axis of rotation and a third angle y to define the
angle of the rotation about this axis (Figure 3.9), it is more convenient to use the Euler angles (4,
0, y) as this simplifies the calculations required to perform the vector rotations. To describe the
REDOR behavior for the case when two or more spin42 nuclei dipolar coupled to the observed
spin-1R nucleus, it is thus necessary to express AQR in terms of the three Euler angles.

We define v = IV,, vz, v,} to be a vector of unit magnitude which lies along the
heteronuclear vector. and x, y, and z to be unit vectors along the principal axes of the coordinate
system (z is coincident with the spinner axis). A rotation of v through (& 8, y) gives v' = R(4, O.
W ) v where R(4, O. y) is a 3 x 3 rotation matrix defining a rotation about the z-axis by &
followed by a rotation about the y-axis by 8, and then a rotation about the z-mis by W.5'
The folIowing fùnctions of the spherical polar angles a and fi can be defined in terms of
the dot products of these vecton:"
sinP cosa = v' x
sinP sina = v' y
cosp = v' z
Using these identities gives:
sinP cosp sina =(vV - y) (v' z)
AQR can thus be expressed (neglecting any hornonuclear interactions) as:
where
and
(v' z) = v (cos4 sine) + vl (sine sin4) + VJ cos8 3.29
(v' y)=vl(-cosv sin4 - cose cos4 sinv) + 3.30
v2(cos$ cosy - cos0 sin4 siny) + v3(sinû siny)
For a system of N independent I nuclei interacting with a single observed S nucleus,
there will be N dipolar couplings, DI (i = 1 to N), needed to account for the different
heteronuclear distances. We must determine the A@& for al1 possible combinations of Z I l D, 1,
recognizing that the individual *Il2 spin States occur with equal probability so îhere are 2N
combinations of 2 DI (or Z A,). Because the sample is a powder, we must average these sums over
space (indicated by the angular brackets) to account for the possible crystallite orientations

Figure 3.9
Spinning
I I
Axis
Definitions of angles used to calculate dipolar dephasing for a powder undergoing MAS. M e n two or more I nuclei interact with a single S nucleus three angles a E [O, 2x1, @[O, x], and y E [O, 2x1 are required to describe the possible I-S orientations. For actual calcuiations of the it is convenient to use the Euler angles (I, 8, and y since the matrices defining the rotation are simpler.
(assumed to be isotropic), add them together, and divide by the number of combinations, c (Eq.
3.3 1 ). This Function is thus a sum of the appropriate powder averaged sums.
For two I spins interacting with a single observed S spin, we have two dipdar couplings
(DI and DJ, N = 2, and c = 2. REDOR experiments yield only the magnitude and not the sign of
D, and since 1 Dl + = 1 -Dl - ~~1 , the number of terms in the sums can be reduced by a factor
of two. The averaging over space is accomplished by numerical integration over the three Euler
angles, with I$ and varied fiom O to 2n, and 8 fiom O to TE. Additional factors are needed to
normalize the integral (II&?), and to account for the statistical (spherical) distribution of the
spins in a powder about the spinning axis vector (sin 0). A step size of one degree (or less) is

desirable, but larger step sizes may be used to reduce the computation time and still provide
acceptable accuncy (see Appendix C). For such a 3-spin system Eq. 3.3 1 becomes:
Schaefer et al. have shown that the dephasing can also be calculated as a pmduct over
the Ndipolar interactions, with spatial (powder) averaging?'.." In this form (Eq. 3.33) it is no
longer necessary to consider the two possible signs of the dipolar couplings as this is implicitly
inc~uded.""~ This considerably reduces the number of calculations required, and thus the
computation time. This efficiency gain in the computations gets progressively larger as the
number of spin pairs increases.
The analysis will be less straightforward for pulse placements other than 542 and 5,
described above because, in general, the functions describing the dephasing are more corn plex
(see Appendix C).
The validity of programs written to perforin the calculations based on Eqs. 3.3 1 and 3 -33
in the present work was checked by compari'ng the results for a variety of 3-spin geometries
against the data presented in reference 8. Details of the implementation of these calculations
using the Mathematica prograrnming environment are given in Appendix C. The theoretical
REDOR behavior for a variety of 3-spin systems clusters is examined in Chapter 5.
3.43 REDOR Behaviour of Isolateci S Spins in a Network of Many I Spins
Blumenfeld et a1.16 have proposed a formalism for calculating the REDOR dephasing of
isolated S spins in the presence of a large number of l spins where the explicit gometrical
arrangement is unknown. Their approach is analogous to that used to relate TCP to the

heteronuclear second moment (Eq. 3.16). They assume that the heteronuclear lineshape is
inhomogeneous, and can thus be considered as a superposition of a large number of doublet
resonances with splitting 20,. Under the fùrther assumption that this lineshape is Gaussian. they
sum the REDOR curves calculated (W. m,) for the individual Dl's with a weighting w(D,) of each
to the final curve determined by a Gaussian distribution (Eq. 3-34):
The resulting REDOR curve obtained in this rnanner will show a smooth rise to a maximum and
may be considered as the response of a spin system with a given heteronuclear second moment
M2(I-S). Analytical fiinctions were derived to calculate the REDOR behavior assuming a
Gaussian distribution. Full details are presented in Appendix C together with the Marhernutica
scripts used to pei-forrrt the calculations.
REDOR experiments may be complicated by the presence of background signals arising
from uncoupled spins (cg. natural abundance ')c in natural cornpounds) and in some cases it is
desirable to remove these interactions." The signal intensity that has been "lost" due to dephasing
in a REDOR experiment has not vanished; it has just been transferred to another type of
coherence which is not directly observable. However, the application of appropriate pulses
makes it possibte to recover this magnetization, and to transfer it to observable S spin
magnetization. The TEDOR experiment which is specifically designed to do this is described in
the next section.
3.5 TRANSFERFtED ECHO DOUBLE RESONANCE
TEDOR experiments were originally developed by Schaefer and CO-workenc' as an
alternative to the REDOR experiment to measure weak dipolar coupling of heteronucfear IS spin
pairs while eliminating unwanted background signals from uncoupled spins. This is particularly

important for "C in organic and biological systerns, where there will always be natural
abundance "c. The TEDOR experiment uses a coherence transfer analogous to the solution-state
iNEPT experiment.
As seen from Figure 3.10(a), a TEDOR experiment is essentially comprised of two
REDOR-type sequences: an initial one on the I spins, and a subsequent one on the S spins
following the application of simultaneous d2-pulses to both spins. These simultaneous pulses
allow for a coherence transfer of polarkation fiom the I to the S spins. Thus, there are two time
periods of dipolar dephasing; one before the transfer of coherence, and another after. The pulse
sequence in Figure 3.10(b) includes an initial cross polarization transfer from a third, abundant
nucleus.
During the n rotor periods before the coherence txmsfer, a series of dephasing rr-pulses
(two per rotor cycle) are applied to prevent the refocussing of the I-S dipolar interaction by MAS.
As in the REDOR experiment, the dephasing pulses are placed at specitic points within each
rotor period. TEDOR experiments are usually perfonned with the dephasing pulses at 5J4 and
3rJ4, but they rnay be placed at different fractions of the rotor period. Some other possibilities
are examined in Section 3.5.2.
Once an effective heteronuclear dipolar dephasing has accumulated, a coherence transfer
is performed that selects only those S spins that are dipolar coupled to I spins. Because of this
selective transfer, the TEDOR effectively eliminates contributions from uncoupled S spins. In the
m rotor periods that follow, the antiphase magnetization that was transferred from the I spins to
the S spin is modulated by the dephasing pulses, and evolves into observable S spin
rnagnetization.'
The ability to vary n with rn fixed, or to vary rn with n fixed, gives more flexibiIity to the
TEDOR experiments compared to REDOR, since it allows the selection of the experimental
parameters best suited to the TI and T2 relaxation values of a particular system, although this has
not been described in the literature to date. This flexibility may be especially useful if f i values

(a) m2 xn X X X X - - 7t
I I I
I
I ~oherence I I Transfer I I
I I
I X X ld2 I I I
S ; I I
I + Tr b
n=I n=2 m= 1 ACQUIRE
SL DECOUPLE
1 I
mr
I ~oheknce I I Transfer I I
I I
I ' ACQUIRE
Figure 3.10 Pulse sequences for TEDOR with: (a) dephasing pulses on the observed (S) spins before coherence transfer (achieved by simultaneous d2-pulses), and on the unobserved (0 nuclei afier, (b) initial cross polarization fiorn an abundant nucleus (e.g. 'H) to the unobserved spins. A series of experiments are acquired with n held constant and rn varied or vice versa The simultaneous rr-pulses ensure that the chemical shifts are refocussed.

are short. as cm often be the case for inorganic solids. 1 3 ~ - ' % distances which are in agreement
with those determined from diffraction studies have been successfully detennined using TEDOR
e~~eriments.'~"'~ In addition, Klug and Schaefer have demonstrated a double TEDOR experiment
for the direct detection of 1-S-l triads?
3.5.1 TEDOR Bebavior for Isolated IS Spin Pairs
For an isolated heteronuclear IS spin pair, the TEDOR signal, ST, arising from pIacement
of the dephasing sc-pulses at one-quarter and threequarters of a rotor cycle is described by Eqs.
3.3 5-3 -3 7.j.' The integration lirnits are a E [O, 2x1 and P E [O, n], h, = nk,, and hm = mm..
where
and
S, = (4x)-' 1 ~in[A%~ (a, p, A.)] sin[Aom (a, p, hl1 sinP dp da
A T , , (a, p, A,,) = 32'" A, si@ cosp cosa
A*, (a, f3, hm) = 32IR Am sinp CO@ cosa
3.5.2 TEDOR Curve Families and Experimental Considerations
TEDOR dephasing behavior is best presented by plotting curves of S-r versus the number
of rotor periods n or the dephasing tirne n ~ , if the number of rotor penods afier coherence
transfer was fixed. If n was fixed then ST VS. m or mr is appropriate. The analysis of TEDOR
experiments requires that both the spinning rate and the exact value of the dipolar coupling
during the pied before coherence transfer are known in order to calculate the curve for the
period after the transfer, and vice versa. In real situations the coupling is usually not known a
priori, but can often be estimated by using known values for similar systems. As for REDOR it
is advantageous to use the analytical expressions in ternis of Bessel fünctions derived by
~ue l le r ' as these avoid the more complex (and time-consuming) numerical integration and
permit nonlinear least squares fiaing as described in Appendix C.

Figure 3.1 1 illustrates several families of theoretical TEWR curves including van-ation
of n with rn fixed for different values of m, n fixed with rn varied, different rotor speeds, dipolar
couplings, and several values of the parameter used to "dampen" the curves to account for the
homogeneous (T2) decay that occurs after the coherence transfer.' For a TEDOR experiment, the
theoretical maximum transfer of coherence (neglecting Tz decay) is predicted to occur when nDs,
= 0.84.'
Inspection of Figure 3.1 1 (a) and (b) shows how the position of the initial maximum in
the curves shifts to higher number of rotor periods as the magnitude of the dipolar interaction
decreases, or as the spinning rate increases. Calculation of a series of curves with appropriate
parameten corresponding to the experimental conditions prior to beginning TEDOR experiments
is invaluable for selecting the best experimental variables. For a given spin system certain values
of n or m may be preferable depending on nuclear relaxation parameten and available spinning
speeds.
Because the TEDOR signal intensity ST is not norrnaIized as it is for REDOR the
experimental intensities need to be scaled to match the theoretical curves. In addition to
experimenta1 constraints (such as avaitable pulse lengths and spinning speeds), it is important to
take into consideration the nuclear relaxation parameters of the nuclei as these Iimit the range of
n or m values that will give viable signal intensities. If the TEDOR pulse sequence contains
additional simultaneous n-pulses to generate a spin-echo? it is T2 rather than that is important.
This will be the case where a refocussed TEDOR pulse sequence is used (Figure 3.10). During
the period before coherence transfer, the spin-spin relaxation rate, T2, of the I nuclei is important,
and after the transfer it is the Ti of the observed (S) nuclei which b i t s the number of rotor
periods afier coherence transfer that signal can be detected.
Other alternatives for optimizing TEDOR experiments for specific samples include using
different spinning speeds, or changing the positions of the dephasing n-pulses. For example they
can be at z , f 3 , 2 ~ 4 3 before coherence transfer and .c44,3~44 after, or at r,./4,35$4 before transfer

~ ~ 4 . 0 kHz
1 Rotor Periods After Transfer
1 Rotor Periods After Transfer
Figure 3.1 1 Theoreticai TEDOR curves illustrating the effects of different dipolar couplings (a) and different spinning speeds (b). The curves were calculated for an isolated 1S spin pair assuming n = 2 with m varied.

1 Rotor Periods After Transfer
1 Rotor Periods After Transfer
Figure 3.1 1 (continued) Theoretical TEDOR curves illustrating the effects of difierent numben of fixed rotor periods (c) and dampening to account for T2 decay (d). The curves were calculated for an isolated IS spin pair assuming v a . 0 Id-iz, D=1000 Hz, n held constant, and rn varied.

and TAS, 4 ~ 4 5 afler. If the pulses are shifted fiom r44 and 3 ~ i 4 , appropriate theoretical functions
must be determined, and numerical integration is now required to calculate the theoretical
TEDOR curves. The appropriate functions for a selection of pulse placements have been derived
and are presented in Appendix C .
3.53 TEDOR Behavior for a Single S Spin Dephased by Several 1 Spins
The theoretical treatment presented above for the case of REDOR multi-spin dephasing
can be extended to the TEDOR experiment. For dephasing pulses positioned at ~ 4 4 and 3~44,
using Eqs. 3 -24 and 3 .X gives:
sinP cosp cosa = (v' x) (vl z)
A*,, can thus be expressed (neglecting any homonudear interactions) as:
A%(@, e, y, L) = 3212 x,,(vi X) (v' . Z)
where
(v' - Z) = VI (COS@ sine) + vl (sin9 sin4) + vj cos0
and
(v' x) = vt(cosû cos4 cos^ - sin4 siny) + vZ(cosû cosv sin4 + cos@ siny) - v3(cosv sine) 3.4 1
An identical expression is obtained for A(Prm with hm replacing A,. If the dephasing pulses are not
at the one- and threequarters points of each rotor period, these equations will become very
complex (see Table C.4, Appendix C).
Since there are now contributions fiom several dipolar couplings, the theoretical TEDOR
curves must be plotted versus the dephasing time n.r, if the nurnber of rotor periods before the
transfer was varied (or versus m, if m was varied). Using the expressions derived above, it was
possible to calculate the TEDOR dephasing for 1s systems as a sum of sums in an analogous
manner to that described for REDOR in Section 3.4.2. Attempts to express the multi-spin
TEDOR dephasing in tenns of a product of sums produced dephasing behavior which was not
physically meaningful (ST very small). This stems from the nature of the functions that are
evaluated. The theoretical TEDOR behavior for a variety of 3-spin 1s clusters is exarnined in
C hapter 5.
3.6 EFFECTS OF MOLECULAR MOTIONS
Any relative motions of the nuclei within a heteronuclear spin system can affect the
dipolar interactions since the intemuclear distance will vary. ClearIy CP, REDOR and TEDOR
experiments will al1 be affected by any changes in the magnitude of the 1-S dipolar couplings
which occur during the course of the experiment. Such motions will need to be considered if they
occur on time scales which are shorter than the reciprocal of the heteronuclear dipoledipole
interaction i.e. of the order of milliseconds. In systems with weak dipolar couplings where the
evolution of the dephasing needs to be obsewed for 30 ms or more, the inclusion of the effects of
motion may be very important in correctly determining D. However, the effects of motions
should only be included where they are known to exist fiom other independent evidence.
The net effect of relative motions of the land S spins will be to average the dipolar
coupling. and the exact form of the averaging will depend directly on the expl icit nature of the
geometrical displacement, and the timescale on which it occurs. Any motion will reduce the
magnitude of the overall dipolar coupling. In this section a qualitative description of the effects
of molecular motions, and techniques for calculating the effects if details of the motion are
known is presented.
For an isolated IS spin pair during a cross polarization experiment, motion will result in a
situation where at a given instant sorne S spins will experience weak dipolar coupling, while
othen will be influenced by stronger couplings. Each different coupling will give rise to an
oscillatory behavior whose period is determined by the dipolar coupling. The observed signal
will be the superposition of a large number of these oscillations and will thus be a relative!^

smooth curve without oscillations. Depending on the timescale of the motions, the couplings
within each spin pair may also change during the experimenf which would also result in a
smooth, non-periodic behaviour.
In spin systems with a large excess of 1 spins which experience strong 1-1 homonuclear
couplings, the averaged, reduced dipolar couplings will mean that the TCP value will increase.
However, provided the motion can be modelled then the effect on the heteronuclear second
moment (M2) can be calculated using the formalism presented by Michel et (see Appendix
Dl-
Goetz and Schaefer have descnbed how to calculate the REDOR dephasing in the
presence of such motions." Basically a three-dimensional powder average is perfomed in the
same manner as in the multiple-spin case, except that the argument of the cosine term Eq. 3.33 is
replaced by a sum of terms which depend on the trajectory of the moving spin(s). The presence
of such motions will result in an apparent reduction in dephasing compared to that predicted for a
rigid spin system. A similar approach may also be valid for TEDOR.
3.7 SUMMARY
REDOR and TEDOR experiments are proven, reliable techniques for measuring 1-S
distances from the magnitude of the heteronuclear dipolar couplings in ngid lattices. Although it
is anticipated that heteronuclear distances can also be determined from CP experiments where
oscillatory behavior is observed, this has only been reliably dernonstrated in very few cases.
Quantitative CP experirnents require that the Hartmann-Hahn matching condition is
sustained for the entire duration of the spin-locking pulse, which places stringent requirements
on the amplifiers to provide constant r.f. fields for severai tens of milliseconds. Under MAS the
requirements become even more demanding since the spinning speed must remain constant to
ensure that the chosen sideband matching condition cm be maintained; slight misrnatching will
result in dramatic loses in the CP signal. Thus CP MAS is very demanding on both the
mechanical and eIectrica1 instrumentation.

REDOR and TEDOR require much shorter pulses than CP (typically 1 0 - 2 0 ~ ) which do
however, need to be quite precisely positioned to prevent the complete averaging out of the
dipolar interaction. Thus in addition to rnaintaining a constant spinning rate, the speed must be
accurately determined so that the delays between the pulses can be correctly calculateci.
REDOR experiments yield nortnalimd intensities which can provide information about
the statistical occupancy of the I spin sites. Although TEDOR expenments eliminate unwanted
background signais &sing from observed nuclei which are not dipolar coupled to the
heteronuclear spins, the analysis requires an estirnate of the dipolar coupling in order to calculate
the dephasing that occurs during the penod where the number of rotor periods is held constant.
TEDOR offers advantages because of the larger number of experimental variables
available. and the corresponding increased flexibility to accommodate large Ti or srnall T2 values
of either nucleus. Another advantage of TEDOR over REDOR is that it is possible to perform 2-
D TEDOR correlation e~~erirnents.'"'"".~' This is potentially very useful in cases where there
are several resonances for both nuclei.
Incorrect intemuclear distances could be obtained from fitting REDOR and TEDOR
experimental data if more than one spin is dipolar coupled to the observed spin and the fitting
assumes only a single, static, isolated spin pair. The use of only a few data points acquired at
srna11 nurnbers of rotor penods may give incorrect answers and should thus be avoided.
Independent information which verifles that the experimental data relates to an isolated spin pair
should be obtained if possible. For spin systems which cannot be considered as isolated spin
pairs, it may be possible to detemine the dipolar couplings (and thus distances) accurately From
REDOR and TEDOR experirnents. However, because there is a strong dependence on the
number of spins involved, as well as the specific geometrical arrangement and motions of these.
direct determination of the dipolar couplings cannot be achieved as it can for isolated spin pairs,
and the experimental data must be fit to a mode1 structure.

Simulations with various clusters of spins have show that the dephasing is typically
dominated by the closest heteronuclear contacts when homonuclear interactions are ignored. If
an accurate mode1 which specifies the positions (and motions) of a11 the spins within a cluster
can be proposed, then distances fiom observed spins to multiple heteronuclear dephasing spins
may be inferred. Such a model must explicitly include the number of spins, any motional
averaging, the statistical probability that each site is occupied by an NMR-active isotope, the
relative spatial arrangement, and the heteronuclear distances. The quality of the model will be
determined by the ability of the theoretical curve to account for the experimentally observed
behavior as a function of dephasing time. Because the dephasing predicted for different
geometries can be very similar at short dephasing times, it is general ty important that data be
acquired at suficiently long dephasing times to discriminate between different models.
However, other problems associated with the use of long dephasing times such as poor
signal-to-noise, relative motions of the spins, and significant dephasing fiom more distant spins
may complicate these analyses. Reliable distance determinations for multiple spin systems may
only be obtained with knowledge of the spin cluster geometry. If unambiguous distance
determinations are needed, the system under investigation should be prepared in manner that will
produce only isolated spin pain (e-g. by isotopic dilution) if at ail possible. I t is also desirable to
ensure complete occupancy of each labeled site since this avoids further complications arising
fiom the need to consider the statistics of different distributions of the spins.
Recently, Blumenfeld et al. have reported that in cases where there are a large number of
spins dephasing a single (observed) spin, it may be appropriate to assume a Gaussian distribution
of isolated IS spin pain, and calculate the REDOR behavior as a sum of these." The resulting
curves are thus related to a single measurable variable? the hetemnuclear second moment. This
approach may prove usefùl in many cases, especially where the structure is not known, and
oscitlations are not seen.

REFERENCES FOR cTlAFiER 3
1 Waugh, J.S.; Maricq, M. M.; Cantor, R.J. Magn. Reson. 1978,29, 183.
2 Gullion, T.; Schaefer, J. Abv. Magn. Reson 1989,13, 57.
3 Gullion, T.; Schaefer, J. J. Magn. Reson. 1989,81, 196.
J Hing, A. W.; Vega, S.; Schaefer, J. J. Magn. Reson 1992,96,205.
5 Hing, A.W.; Vega, S.; Schaefer, J. J. Magn. Reson. Ser. A. 1993,103, 15 1.
6 Pan, Y.; Gullion, T.: Schaefer, J. J. Magn. Reson. 1990,90, 33 0.
7 MueIler, K.T.J. Magn. Reson- Ser- A, 1995, 113,81.
8 Naito, A.; Nishimura, K.; Tuzi, S.; Saitô, H. Chem. Phys. Lett- 1994,229. 506.
9 Holl, S.M.; Marshall, G.R.; Beusen. D.D.; Kociolek, K.; Redlinski, AS.; Leplawy, M.T.; McKay, R.A.; Vega, S.; Schaefer, J. J. Am. Chem. Soc. 1992,114,4830.
I O Marshall, G.R.; Beusen, D.D.; KocioIek, K.; Redlinski, AS.; Leplawy, M.T.; Pan. Y.; Schaefer, J. J. Am. Chem. Soc. 1990, i 12,963.
I I McDowell, L.M.; Barkan, D.; Wilson, G.E.; Schaefer, J. Solid State Nucl. Magn. Resun. 1996, 7,203.
I2 Holl, S.; Kowalewski, T.; Schaefer, .J. SufidState .Vucl. Magn. Reson. 1996, 6, 39.
13 Pan, Y. Solid State Nucl. Magn. Reson. 1995,5,263.
14 Fyfe. C.A.; Mueller, KT.; Grondey, H.; Wong-Moon. K.C. Chem. Phys. Letf. 1992, 199, 198.
IS Fyfe. C.A.; Mueller, KT.; Grondey, H.; Wong-Moon, K.C.J. Phys. Chem. 1993,97, 13484.
16 Blumenfeld. AL.; Coster, D.; Fripiat, J.J. J: Phys. Chem. 1995, 99, 15 18 1.
17 Fyfe. C.A.; Wong-Moon, K.C.; Huang, Y.; Grondey, H.; Mueller, K.T. J. Phys. C'hem. 1995, 99. 8707.
18 Wolfram, S. The Muihemotica BookThird Edition. Cambridge University Press, 1996.
19 Stejskal, E.O.; Memory, J.D. High Resolution NMR in the Solid State - Fundamentals of CP MIS. Oxford University Press, New York 1994.
20 Hartmann, S.R.; Hahn, E.L. Phys. Rev. 1962,128,2042.
21 Pines, A.; Gibby, M.G.; Waugh, J.S. J. Chem. Phys. 1973,59,569.
22 (a) Engel ke, F. in Encyclopedia of N d e a r Magnetic Resonance, Granî, D.M .; Harris, R.K. (Eds.) John Wiley and Sons, 1996. p. 1529. (b) Burum, D.P. in Encyclopediin of Nuclear Magnetic Resonurzce, Grant, D.M.; Harris, R.K. (Eds.) John Wiley and Sons, 1996. p. 1535.

23 Hediger, S. Ph.D. Dissertation, Eidgenossische Technische Hochschule Zürich, Switzerland, 1996.
24a Müller, L.; Kumar, A.; Baurnann, T.; Ernst, R.R. Phys. Rev. Lett. 1974,32, 1402.
24b Stejskal. E.O.; Schaefer, J.; Waugh, J.S. J. Magn. Reson. 1977,28, 1 05.
25 (a) Hediger, S.; Meier, B.H.; Ernst, R.R. J. Chem. P&s. 1995,102,4000. (b) Hediger, S.; Meier, B.H.; Ernst, R.R Chem. Phys. Left. 1995,240,449.
26 Hediger, S. Eidgenossische Technische Hochschule Zurich, Personal Communication, August 1997.
27 Walther, K.L.; Wokaun, A.; Baiker, A. MoL Pllys. 1990, 71,769.
28 Klein Douwel, C.H.; Maas, W.E.J.R.; Veeman, W.S.; Werumeus Buning, G.H.; Vanken, J.M.J. Macromol- 1990,23,406.
29 Hagarnan, E.W.; Ho, P.C.; Brown, L.L.; Schell, F.M.; Woody, M.C.J. Am. Chem Soc. 1990, 112,7445.
30 Pratima, R.; Ramanathan, K.V. J , Magn. Reson.. Ser. A. 1996,I 18, 7.
31 Tian. F.; Cross, T.A. J. Mugn. Reson. 1997, 127,220.
32 Hawkes, G.E.; Mantle, M.D.; Sales, K.D.; Aime, S.; Gobetto, R.; Groombridge, C.J.J. Magn. Reson. Ser. A. 1995,116,25 1.
33 Voelkel, R. Angew. Chem. Int. E d Engl. 1988,7, 1468.
34 Schaefer, J.; Stejskal, E.O.; Garbow, J.R.; McKay, R.A. J. hfagn. Reson. 1984,jg. 150.
35 Yannoni, C.S. Acc. Chem. Res. 1982, 15,201.
36 Mehring, M. Principles of High Resolurion NMR in Solids, 2nd ed.: Springer-Verlag: New York, 1983; Chapter 4.
3 7 Walter, T.H.; Turner, G.L.; Otdfield, E. J , Magn. Reson. 1988, 76, 106.
38 van Vleck, J.H. Phys. Rev. 1948, 74, 1168.
39 Hams, R. K. Nuclear Magnetic Resonance Spectroscopy - A Physiochemical Viau, 3 rd revised ed.; Longman Scientific & Technical: United Kingdom, 1987; Chapter 6.
40 Fyfe. C.A. SolidSmte NMR for Chemists; C.F.C. Press: Guelph, Canada, 1983; Chapter 2.
4I Michel, J.; Drifford, M.; Rigny, P.J. Chim. Phys. 1970,67,3 1.
42 Aroca, P.P. Ph.D. Thesis, The University of British Columbia, 1995.
43 (a) McDowell, L.M.; Holl, S.M.; Quian, S.; Li, E.; Schaefer, J. Biochem. 1993,32,4560.(b) Christensen, A.M.; Schaefer, J.; Krarner, K.J.; Morgan, T.D.; Hopkins, T.L. J. Am. Chem. Soc. 199l,lI3,6799. (c) Marshall, GR.; Beusen, D.D.; Kociolek, K.; Redlinski, AS.; Leplawy, M.T.; Pan, Y.; Schaefer, J. J. Am. Chem. Soc. 1990,112,963.

44 Studelska, D.R.; Klug, C.A.; Beusen, D.D.; McDowell, L.M.; Schaefer, J. J. Am. Chem. Soc. 1996,118,5476.
15 Gullion T.; Schaefer, J. J. Magn Reson 1991, 92,439.
-16 Garbow, J.R.; Gullion T. J. M a s Reson 1991,95,442
47 Naito, A.; Nishimura, K.; Kirnura, A.; Tuzi, S.; Aida, M.; Yasuoka, N.: Saitô, H- J. Phys. Chem. 1996, 100, 14995.
48 Garbow, J.R.; Gullion, T. Chem. Phys. Lett. 1992, 192, 71.
19 Gullion, T.; Baker, D.B.; Conradi, M.S. J. Magn. Reson. 1990,89,479.
50 Holl, S.M. Ph.D. Thesis, Washington University, Missouri, U.S.A. 1993.
51 (a) MueIler, KT.; Jarvie, T.P.; Aurentz, D.J.; Roberts, B.W. Chem Phy. Letf. 1995,242, 535. (b ) Mueller, K.T.; Jarvie, T.P.; Aurentz DL; Roberts, B.W. Chern. Pb. Lett. 1996, 254,28 1 .
52 Quist, P-O.; Forster, H.; Johnels, D. J Am. Chem. Soc. 1997, 119,5390.
53 Jarvie, T.P.: Went, G.T.; Mueller, K.T.J. Am. Chem. Soc. 1996, 118,5330.
54 McDoweIl, L.M.; Klug, C.A.; Beusen, D.D.; Schaefer, J. Biochern. 1996,35,5395.
5.5 Goetz, J.M.; Schaefer, J. J. Magn. Reson. 1997,127, 147.
56 Boyce, J.B. Ph-D. Thesis, University of Illinois at Urbana-Champaign, U.S.A., 1972.
57 van Eck, E.R.H.; Veeman, W.S. SoIidState Nucl. Magn. Reson. 1992, 1, 1.
58 Arfken, G. Mathemafical Methods for Physicists; Acadernic Press, 1985; Chapter 4 .
59 van Eck, E.R.H.; Veeman, W.S. J. iMagn. Reson. Sr. A. 1994, 109,250.
60 K l u g C.A.; Schaefer, J.J. Magn. Reson. Ser. B. 1996,110, 176.
61 Vega, A. J. J. Am. Chem. Soc. 1988,110, 1049.

CHAPTER 4
' 9 ~ - 2 9 ~ i DISTANCE DETERMINATIONS IN FLUORLDE-
CONTAINING OCTADECASIL FROM SOLID-STATE
N M R MEASUREMENTS
4.1 LNTRODUCTION
The frarnework structures of microporous materiais contain regular systems of cavities
and channels of molecular dimensions (3-13 A) which are critical in the application of these
materials as sorbents, catalysts and molecular ~ieves . '~ One of their most important
characteristics is the size and shape selectivity which they display towards sorbed organic
molecules and thus there is considerable interest in investigating the detailed three-dimensional
structures of zeolite frameworks containing intercalated species in order to understand in detail
the nature of these sorbate-framework interactions.
Unfortunately, there is relatively little direct experimental information regarding the
exact location of sorbed molecules within these frameworks; theoretical calculations are not
always in agreement with one another, and it is dificult to determine these structures by single
crystal X-ray diffraction as discussed in Chapter 1. For these reasons other techniques must be
developed to obtain this structural information. In this chapter results from NMR experiments
and caIcuIations which Iocate the fluoride ions within the framework of octadecasil are
presented. The feasibility of extending these experiments to other hework-hos t / fluorine-
containing-guest systems is clearly demonstrated.

4.1.1 Synthesis of Molecular Sieves in Fluoride-Containing Media
The fluoride-synthesis route to molecular sieves, which was originally developed by
Flanigen and Patton' and extended by Guth and CO-workers and others,bv produces very highly
crystalline samples having high degrees of both long range and local ordering. This is indicated
by the sharp reflections extending to high 20 values which are observed in their X-my powder
diffraction patterns,'"'2 and by the narrow resonances in their "si MAS NMR spectra.13 During
the synthesis, fluonde anions can play several roles, acting as mineralizers, templates or
structuredirecting agentsa6 Chernical analysis and ' 9 ~ MAS NMR spectroscopy reveal that most
of the as-synthesized materials have incorporated fluonde anions."
However, it is often dificult to locate the fluonde ions by X-ray diffraction as the single
crystals may be too small, or twinned, and recourse rnust be made to other techniques. There are
additional complications in that fluoride ions and the OH groups (which can occur as defects
within these framework structures) have very similar numbers of electrons making them dificult
to distinguish." In several cases, however, fluoride anions have been clearly located in the
double 4-ring (D4R) units of the framework. These include octadeca~il,'~ the tetragonal variant
of AIPO~- 16,'' three GaP04s (cloverite,'" G~PO~-LTA." and ULM-5'4, and also an LT A-type
AlPQ containing some cobalt and silicon."
The D4R moiety is not the only possible location for the fluoride ions; in the triclinic
CHA-like A L P O ~ - ~ ~ , " and ~ a ~ 0 ~ - 3 4 , " fluorine is part of the framework and it apparently
bridges two AI (or Ga) atoms. In A1PO4-5, the fluoride anion has been Iocated in the 4-ring
columns of the framework, f a from the organic counter-ion." In some cases it is not localized,
and for purely siliceous MFI-type zeolites a discrepancy exists: Price et al." reported that the F
was located close to the nitrogen of the tetrapropylammonium ion (TPA'), while Mentzen et al.23
Iocated it in the framework close to a Cring, but also found an unassigned site close to the TPA'.
In a few cases, such as the recently reported precursor of FER-type zeolite? F is not

incorporated, suggesting that its role in this case is restricted to that of a mobilizing agent. Thus,
there is also interest in being able to locate the fluoride ions in these types of samples to irnprove
understanding of the various roles they play in the syntheses.
4.12 ' 9 ~ - 2 g ~ i Distance Determinations from Solid-State NMR Experiments
Solid-state NMR in conjunction with Rietveld refinement of powder XRD data has been
successfully demonstrated to be a powerful technique for the investigation of zeolite
structures?-'%e 2 9 ~ i MAS NMR spectra of highly siliceous zeolites can be directly related to
the framework structure, the number and relative intensities of the resonances reflecting the
numbers and occupancies of the crystallographically inequivalent T-sites in the asymmetric
"nit.l'-l" This makes it possible, in principle, to determine the locations of species within the
fiameworks by detecmining the distances between their component atoms and specific T-sites in
the framework. This can be done using experiments based on the through-space dipolar
interactions between pairs of nuclei I and S as described in Chapter 3.
The magnitude of the dipolar coupling between two nuclei depends on the gyromagnetic
ratios of the two nuclei, y[, and ys, and on the 1-S intemuclear distance (Eq. 1.10). making ' 9 ~
attractive for these studies. Furthexmore, while the ' 9 ~ isotope is 100% abundant, fluorine is
relatively uncommon in chernical systems, and thus the Iikelihood of potential background
interferences is minimal.
In high-resolution solid-state NMR, magic angle spinning (MAS), is used to narrow the
otherwise extremely broad (up to several kHz) resonances. E-fowever, in addition to averaging the
chemicat shift to its isotropie value, the heteronuclear dipolar interactions for an isolated spin-
pair are averaged to zero dunng each complete rotor Thus, in its simplest form, the use
of MAS precludes a direct measurement of D, although this interaction is responsible for the
coherence transfer in the cross polarization (CP) process."33 In those cases where the spin
system behaves essentially as an isolated heteronuclear spin-pair, an oscillatory behavior in the

amplitude of the CP signal at short contact times is observed for both non-rotating solid
~arn~les'~-" and those undergoing magic angle spinning.JS Such dipolar have been reported for
several different systems under MAS condition^?^' Fitting of these oscillations with appropriate
hnctions allows the heteronuclear dipolar coupling and thus the internuclear I-S distances to be
determined as discussed in Chapter 3. If the observed spins experience dipolar coupling to
several heteronuclear spins, oscillations at several frequencies interfere and a smooth exponentiat
rise to a maximum followed by a decay due to relaxation is typically 0bserved."'-
Recently, Schaefer and CO-worken have introduced the REDOR"." and TEDOR"."
experiments. The magnitude of the dipolar couplings can be experimentally determined fiom
these experiments using appropriate analyses."4x As discussed in Chapter 3, REDOR and
TEDOR distance determinations are more cornplicated if several nuclei contribute to the
dephasing.
In this chapter the results of Si-F distance measurements on as-synthesized octadecasil
are presented. Octadecasil, chosen to be representative of molecular sieve framework structures.
is the purely siliceous analogue of AIP04-1 6, and was recently synthesized by Caullet et al. fiom
fluoride-containing media.I6 The crystal structure was solved using single crystal X-ray methods,
the fluoride anions located, and accu rate Si-F distances determined.16 The low natural abundance
of "si (4.7%) in the framework, combined with the weak homonuclear couplings means that the
19 F- '~s~ dipolar interactions should approximate clusfers of isolated heteronuclear spin-pain for
which theoretical CP, REDOR, and TEDOR behavior can be calculated. Octadecasil, which
contains two distinct T-sites and two quite different Si-F interatomic distances, was chosen as a
mode1 case for determining the best experiments to use, as well as the optimization of these
experiments and the subsequent analysis of the experimental data.
4.2 MATERIALS AND METHODS
The pure, highly crystalline octadecasil simple (crystal size 80 p), was kindly pmvided
by Dr. P. Caullet. The structure was checked by powder X-ray diffraction and ' 9 ~ and 2 9 ~ i MAS
NMR measurements, all of which agreed with previously reported res~lts.~'"'~ Fluorine contents
in these materials are usually in the range 2.3% to 2.6%,16 which corresponds to occupancies of
80% to 100% of the D4R units by fluoride ions. The idealized elemental composition of
octadecasil is SitoOJo 2(Q' 0 where Q* is the quinuciidinium cation.
The NMR experirnents were carried out using a Bruker MSL-400 spectrometer,
operating at frequencies of 376.434 MHz and 79.495 MHz for ' 9 ~ and "si respectively as
described in Chapter 2. A Bruker double-tuned 'IUX MAS probe with the 'H channel tuned to
the ' 9 ~ frequency was used, and spinning speeds of 2.0-5.2 kHz were attainable. The peak
separations of the spinning sidebands in the ' 9 ~ MAS NMR spectra were used to determine the
spinning frequency, v,, to an accuracy of better than 10 Hz. Furthet details are given in Chapter
7 &.
4.2.1 Cross Polarization Experiments
For the CP experiments the Hartmann-Hahn sideband matching ~ondition~"~') was
established experimentally by fixing the ' 9 ~ radio-frequency power and adjusting the 2 9 ~ i radio-
frequency power to maximize the observed signal. Field strengths up to 33 kHz were availabte
for the ' 9 ~ channel. For variable contact time CP experiments, spectra were acquired using
contact times from 10 ps to 60 ms. The Hartmann-Hahn matches were optimized using a 2 ms
contact time for non-spinning (static) samples, and 10 ms for samples undergoing MAS.
4.2.2 REDOR and TEDOR Experimeats
ln al1 the REDOR experirnents the observed nucleus was "si, and the trains of rotor-
synchronous dephasing pulses were applied to "si or "F, depending on the pulse sequence used.

The dephasing pulses were always timed to occur at half and full rotor periods, the ' 9 ~ offset was
exactly on resonance, and the ' 9 ~ i fiequency was set to be approximately midway between the
two silicon resonances. In the REDOR experiments which incorporated an initial cross
polarization from 1 9 ~ to 2 g ~ i to improve the efficiency, a 10 ms contact time was used. Further
details of the experimental set-up are describec! in Chapter 2.
For TEDOR experiments the fluorine signal was set exactly on resonance and the
observed nucleus was 19si. Several variations of the TEDOR experirnent were used. These
included applying the dephasing pulses on or 1 9 ~ before the coherence transfer pulse, varying
the spinning speed, the positions of the dephasing pulses, and incrementing the number of mtor
cycles before or afier the transfer pulse.
4.2.3 Calculations and Data Aoalysis
Fitting to determine the relaxation times was carried out using the commercial Bruker
software. Values of the expected ' 9 ~ - ' 9 ~ i dipolar coupling constants for a range of Si-F distances
were calculated using Eq. 1.10 and are sumrnarized in Table 4.1. The boldface entries in the table
correspond to the experimental Si-F interatomic distances determined from the crystal structure
data for octadecasil reported by Caullet et a1.,16 and the corresponding dipolar couplings.
For the CP, REDOEZ, and TEDOR experiments, the heteronuclear 1 9 ~ - 2 9 ~ i dipolar
couplings for the T-l silicons were detemined from nonlinear least squares fitting of the data in
~afhematica" using the methods described in Chapter 3. For al1 the calculations the spins were
assumed to be at fixed positions within a rigid lattice and homonuclear dipolar interactions were
19 19 ignored because the F- F couplings and the much weaker 2 9 ~ i - 2 9 ~ i couplings were much less
than the sample spinning speeds employed (2-5 kHz).


Prior to commencing nonlinear fitting, trial fittings were used to determine approximate
values for the parameters that were not fixed in the expenment, the dipoIar coupling and a
scaling factor to match the experimental and theoretical intensities if required. During fitting of
the CP data, some constraints were necessary to prevent physically unrealistic values for some of
the parameters. For TEDOR experiments there is no normalization as there is for REDOR, so the
scaling factor was arbitrary, and an exponential darnping factor was incorporated to take into
account f i decay during the evolution period." Weighted nonlinear fittings of the data were
carried out starting from these initial parameter values, and these were constrained to realistic
(positive) limits. The Levenberg-Marquardt algorithms' was utilized to minimize the value of the
parameter = X I F, - f, 1 ' where F, is the value of the ta data point and f, is the value obtained
€rom the fit. The best values for the parameters were taken as those which gave the srnallest
values. Because the spectra acquired for small numbers of rotor cycles had better signal-to-noise
ratios, they yielded more accurate intensities, and consequently these data were given more
emphasis during the fitting procedure. Several data-weighting schemes were evaluated, and
weighting by the inverse of the number of rotor periods proved to be the most reliable, giving
very reproducible results if the initial parameter values were varied.
For experiments where the positions of the pulses were not those used for the derivations
of the analytical functions reported by ~ u e l l e r , ~ ~ and also when multiple spin analysis was
required (T-2 Si), the appropriate integrals 3'.44.4i for the TEDOR and REDOR functions were
deterrnined and then evaluated using point-by-point numerka1 integration over a sphere to
produce a powder average as described in Chapter 3 and Appendix C.
4 3 RESULTS AND DISCUSSION
4 . 1 Octadecasil Crystal Structure
The structure of octadecasil, the purely siliceous analogue of AIPOJ- 1 6 (IZA Structure
Commission Framework Code AST), has been solved by single crystal X-ray method~.'~ The
framework consists of octadecahedral [46612] cages and he~ahedral[4~] cages, and can be built
by linking the octadecahedra through al1 their common 6-rnembered ring faces (Figure 4.1 (a)).
Since these octadecahedral cages do not completely fil1 3dimensional space another type of
void. the very small [46]cage or double Cmembered ring (D4R) unit is created.
When prepared fiom a fluoride-containing medium, the as-synthesized product contains
the quaternary ammonium templating cation (quinuclidinium in this case) in the large cages, and
the negativeiy charged fluoride anion (needed to b a h c e the positive charge of the organic
cation) in the D4R units, and crystallizes in a tetragonal phase (space group M m , No. 87).'"he
octadecasil structure contains two types of T-sites (Figure 4.1), T-1 sites at the vertices of the
D4R units and T-2 sites located at the vertices of 6-rings in the ratio 4 T-1 : 1 T-2. There are 20
[Si04J tetrahedra, and thus 16 T-1 and 4 T-2 sites pet unit cell. Each T-2 links 4 T-1 's fiom four
different D4R units (Figure 4. I(b)). From the X-ray crystal structure data, the T-l silicons are
2.63 A from the fluoride ion inside their D4R unit and more than 7 A fiom the fluoride ions in
the adjacent D4R units. The T-2 silicons are 5.69 A from each of four equivalent fluoride anions,
and the closest F-F distance is 9.33 A.
43.2 1-D ' 9 ~ and 2 9 ~ i NMR Experiments
Qualitative 1 9 ~ and L 9 ~ i MAS NMR spectra were in general agreement, both with
previously reported data and the crystal structure as discussed above. In order to best impiement
the different experiments, a knowledge of the different nuclear relaxation parameters is essential.
Tl and T2 were measured for both nuclei, and are summarized in Table 4.2. For CP experiments
the value of Tl, was measured using an 1 9 ~ spin locking field of 17 or 33 kHz.
The room-temperature 1-D ">F MAS NMR spectrum (Figure 4.2(a)) shows a single
resonance at -38.2 ppm with respect to CFC13. The chemical shift is indicative of a single, unique
environment, and is similar to those reported for other ' 9 ~ 1 19si systems where the fluoride ion is
located within a D4R unit.*"'6 The static ' 9 ~ NMR spectrum consists of a single peak with a full-

Silicon
Figure 4.1 (a) Schematic representation of the framework structure of octadecasil showing the pac king arrangement of the two types of cages, the large [466'2]-cages, and the smal l [46]-cages (or D4R units). Silicon atoms lie at each vertex, and oxygen atorns are located approximately midway along the lines. Thick lines indicate connections closer to the viewer. The [466'2]tages pack in a tetrahedral arrangement by sharing a11 their 6-rnembered ring faces and [46]-cages fil1 the voids thus created. Fluonde anions lie at the center of ca. 90% the double four-ring units. (b) Portion of the octadecasil framework showing the four D4R units surrounding each T-2 silicon. Each T- 1 silicon is connected to three other T-1 sites in the sarne D4R unit and to one T-2 silicon. Fluoride anions are 2.63 A from each T-1 silicon in the [46]-cage and 5.69 A from the nearest T-2 silicon. The distance between fluoride anions in adjacent D4R units is 9.33 A.

ppm (w.r.t. TMS)
Figure 4.2 (a) ' 9 ~ MAS NMR spectrum of octadecasil, obtained with 132 scans, spinning speed 4.296 kHz, pulse width 9 p, reiaxation delay 10 s (spinning sidebands marked *). (b) Quantitative "si MAS NMR spectrum of octadecasil showing the two resonances assigned to the T-l and T-2 silicons respectively. The relative peak intensities (4: 1 ) are as expected fkom the crystal structure. The spectrum was acquired with 48 scans, spinning speed 2.2 I<Hz, pulse width 8 p, relaxation delay 1 10 s, and no 'H decoupling.

width at half-height ( F m of 6200 Hz. The room temperature 1 -D "si MAS NMR spectrum
of octadecasil shows two resonances at -1 07.7 ppm and -1 1 1.6 ppm with respect to
tetrarnethylsilane (TMS) (Figure 4.2(b)). These peaks have art intensity ratio of 4: 1, and can thus
be assigned to the silicons in the T-1 and T-2 sites r e ~ ~ e c t i v e l ~ . ' ~ The static "si NMR spectrum
shows a single resonance with a FVJHH of 1700 Hz.
Clearly, the known Wework structure of octadecasil containing fluoride anions in the
D4R units with its two different Si-F interatomic distances and two distinct silicon environrnents
provides an ideal test case for evaluating the reliability and robustness of ' 9 ~ I "si CP, REDOR
and TEDOR NMR experiments involving molecular sieve frameworks, as well as for
deterrnining the optimum expeiimental conditions for them. For clarity the different experiments
will be discussed separately.
4.3.3 1 9 ~ - 2 g ~ i Cross Polarization Experirnents
4.3.3.1 Hartmann-Hahn Malchhg Profies
Hartmann-Hahn matches for the ' 9 ~ - n > ~ i cross polarkation were determined by fixing the
19 F field strength and varying the ' 9 ~ i r.f. power. For a non-spinning sample, a single match
condition was found (Figure 4.3(a)) which corresponded to the exact Hartmann-Hahn condition
( 0 . 1 ~ ~ - 01s = O) as expected. Under MAS up to four matching conditions which exhibited a clear
dependence on the spinning speed were found (Figure 4.3). Moreover, under MAS almost no
polarization transfet was observed at the exact Hartmann-Hahn match, but four other matching
conditions separated by integral multiples of the spinning speed were found. In some cases the
available ' 9 ~ i r.f. power range was not suficient to observe al1 four conditions.
For an isolated 1s spin pair the heteronuclear dipolar interactions are modulated by one
and two times the spinning frequency under MAS conditions, and this leads to strong tirst and
second order sidebands in the CP matching profile if the spinning speed exceeds the width of the
abundant Ispin resonance line and the heteronuclear dipolar coupling frequency." Although the
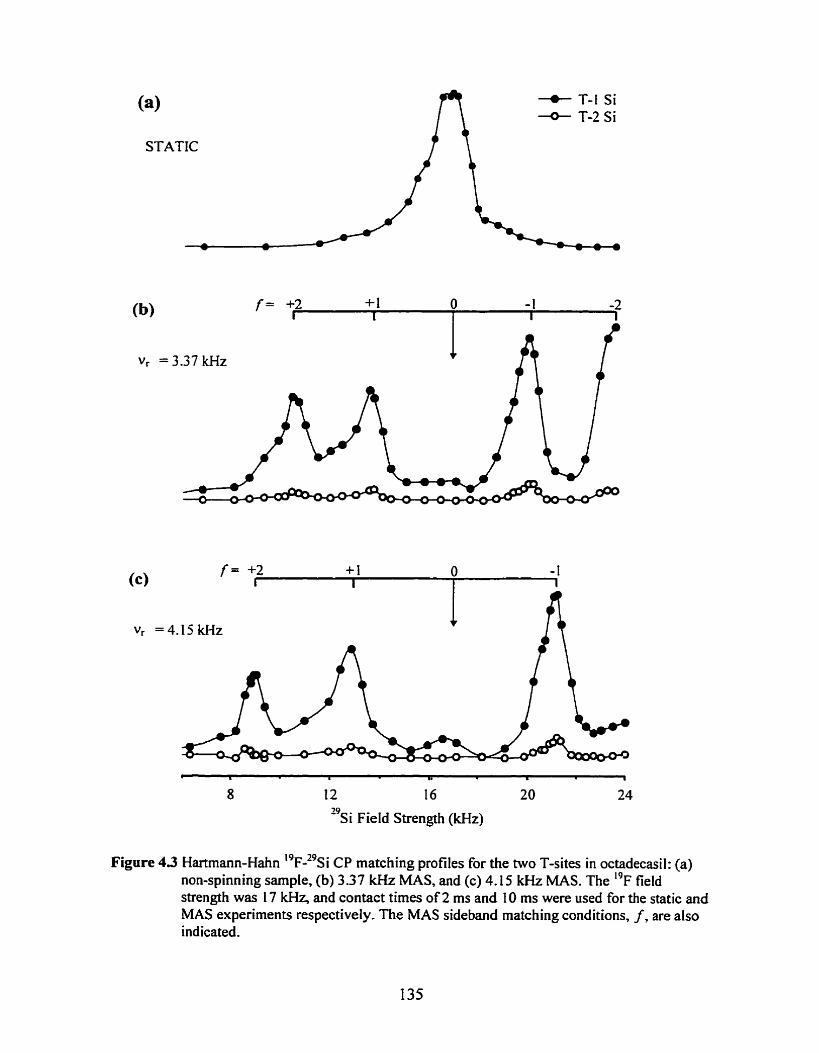
(a)
STATIC
. -- - 1
8 12 16 20 24
"si Field Strength (kHz)
Figure 43 Hartmann-Hahn I9~-"si CP matching profiles for the two T-sites in octadecasil: (a) non-spinning sample, (b) 3.37 kHz MAS, and (c) 4.15 kHz MAS. The 1 9 ~ field strength was 17 W and contact times of 2 ms and 10 rns were used for the static and MAS experiments respectively. The MAS sideband matching conditions, f , are also indicated.

spinning speeds employed were only approximately three times p a t e r than the ' 9 ~ - ' 9 ~ i dipolar
coupling calculated from the crystal structure of octadecasil for the - 1 Si ( 1230 Hz), the
Hartmann-Hahn matching profile indicates that the T-1 Si 1 F ion pair is essentially behaving as
an isolated spin pair with sideband matching conditions corresponding to f = * 1 and *2 observed
as predicted by Eq. 3.9. The small arnount of polarization transfer observed at the centreband (f
= O) matching condition may be due to flip-flop processes between remote ' 9 ~ spins or
polarization transfer mediated through hetemnuclear ~ - cou~ l in~ . "
The matching profiles for the T-2 Si are also shown in Figure 4.3 and seem to mimic the
behaviour seen for the T-l Si. The signal to noise ratio for the T-2 Si was quite poor at the 10 ms
contact time employed as indicated by the re!ative intensities of the signals.
4.3.3.2 Variable Contacf T h e Experiments
In variable-contact time CP experiments, the "si signal intensity is monitored as a
function of the spin-locking time t . The initial exponential build-up of intensity is usually
characterized by the CP rate constant, as polarization is transferred from ' 9 ~ to 2 9 ~ i during
the Hartmann-Hahn match? An exponential decay with first order rate constant T,," due to loss
of the spin-locked magnetization via spin-lanice relaxation in the rotating frame is superimposed
on this growth. For a system of isolated spin pain, the magnetization transfer process via
matched Hartmann-Hahn spin-locked cross polarization under MAS conditions should exhibit
oscillatory behavior as the polarization shunles between the connected spin-pairs, as reported
36-11.52 previously for a few cases. Variable contact time CP experiments from ' 9 ~ to ' 9 ~ i on
octadecasil were camied out at several spinning speeds and different behavion were observed for
the hvo types of T-sites.
For the T-1 silicons the variable contact tirne CP experiments showed a rise to a
maximum, with a clear oscillatory behavior in the signal amplitude at short contact times,
followed by an exponential decay (Figure 4.4). On some occasions these oscillations were absent

and this was attributed to mismatching arising fiom variations in the r.f. power or the spinning
speed dunng the course of the experiment (the CP matching sidebands become narrow at high
spinning speeds, and efficient CP under MAS requires highly stable r.f. amplitudes and constant
spinning rates over extended periods of time)." The "penod" of the oscillatory behavior was
dependent on the matching condition employed, but independent of the spinning speed.
Moreover, the oscillatory behavior was virtually identical under equivaient matching conditions,
i.e. at f = +1 and - I (or f = +2 and -2). For samples undergoing MAS, the dampening of the
oscillations showed a noticeable dependence on the spinning speed; becoming more clearly
resotved with increasing spinning rates- The rate of decay at longer contact times was found to be
directly dependent on the magnitude of the 1 9 ~ spin locking field, becoming less with increasing
19 F r.f. power, indicating that Tl, was increasing (as would be expected).
Because the silicons in the T- l sites are very close (< 3 A) to the fluonde ion which
occupies their D4R, and the next-nearest ' 9 ~ nuclei in adjacent D4R units are much further away
(> 7 A), these silicons and their corresponding F may be considered as isolated ' 9 ~ - ' 9 ~ i spin-
pairs. An oscillatory behavior is thus predicted for the T-1 silicons, and is clearly seen in Figure
4.4.
For the T-2 sil icons a fairly srnooth rise to a maximum, fol lowed by a decay was
observed (Figure 4.4). Since the T-2 silicons are surrounded by up to 4 equidistant (5.69 A)
fluoride anions, they are not expected to show the pronounced osciiIatory behavior predicted for
isolated spin pairs. Unfortunately no explicit anatytical hnctions are available at present to
describe the cross polarization behavior of srnaIl spin clusters. however calculations for the
RED0 R dephasing of an 4S system with tetrahedral geometry show oscillations (see Section
4.3.4.2). Based on the sirnilarities in the oscillatory REDOR and CP signai amplitudes seen for
isoIated spin pairs, some oscillatory behavior might be expected for the T-2 Si. This wodd be far
less obvious than that seen for the T-1 Si, and could be easily obscured (e.g. by ' 9 ~ spin difision
processes). A cmde estimate of the period of the oscillation expected for the T-2 Si can

Peak Area
( a h units:
3.37 lcHz MAS f= -1 T-l Si 0 T-2 Si
?
Contact Time (rns)
Figure 4.4 I9~-I9si CP behaviour for the two T-sites in octadecasil under MAS conditions as a function of the contact time at the f = - 1 sideband matching condition. The oscillatory behaviour for the T-1 Si and the decay due to Tl, are clearly seen. The theoretical fit calculated using Eq. 3.14 for the T-l Si with D = 1360 Hz is also shown.
Peak Area
(arb. units)
i
Contact Time (ms)
Figure 4.5 l9~-I9si CP behaviour for the T-1 Si in a non-spinning octadecasil sample as a function of the contact time. The line shows the fit calculated using Eq. 3.8 with D = 1440 Hz, S, = 0.9, ki-' = 2.2 ms, kyl = 26.7 ms and Tl, = 2 S. The field strength was 17 kHz-

be made by assuming these behave as isolated 19~-"si spin pairs with a dipolar coupling of 120
Hz. From Figure 3.3 the oscillation period is found to be about 35 ms; much longer than the time
it takes for the oscillatory behaviour to be dampened for the T-1 Si (ca. 15 ms).
As described in Chapter 3, ~ediger" has reported analytical functions for fitting the
oscillatory CP behavior in isolated ïS spin pairs at specific Hartmann-Hahn matching conditions
and these were used to determine the dipolar coupling for the T-1 Si as discussed in the
following sections.
4.3-3.3 Fitting of the OsciiIaiory Cross PoIarizatÏon Behavior for the T-1 Silicon
Non-spinning Sanzples at the Centerband Matching Condirion
Figure 4.5 shows the area of the 2 9 ~ i resonance for a static sample as a function of the
contact time. At short contact times a clear oscillatory behavior is seen, which is progressively
damped. An upward trend at longer contact times is also apparent. Although this resonance
includes signals fiom both the T-1 and T-2 silicons, the contribution to the total area from the T-
2 Si will be small. Under MAS where the two T-sites are well resolved, an estimate of the
relative areas of the contribution arising from each T-site can be made (e.g. from Figure 4.4) and
is found to be less than 10 % for contact times up to 10 ms. This is about sarne as the uncertainty
in determining the area of the static resonance by integration. On this basis the analysis and
fitting of the data in terms of only T-1 Si was considered valid.
Fitting of the data was camed out using Eq. 3.8 in order to determine the I9~-"si dipolar
coupling. The increasing signal amplitude at longer contact times indicates that the spin system
cannot be considered as a truly isolated spin pair, as this would level out as seen in Figure 3.3
(a)). Thus in addition to kt (the rate constant describing the dampening of the transient
oscillations), a rate constant (k? ) which describes the build-up of the net magnetization is needed
to allow a good fit to the experimental data, and this rneans <S+ must be greater than 0.5.
However, 62, and k2 are strongly correlated (Eq. 3.8), and in order to ensure reliable titting

between diserent data sets the value of 62, was fixed at 0.9. This value was arrived at based
on an evaluation of the number of fluoride ions surrounding the T-1 Si determined from the X-
ray detennined structure of octadecasil. Within a 12 A-radius sphere surrounding a T- i Si
(corresponding to I9~-"si dipolar couplings > 15 Hz), there are eight F ions which yields <S2,
= N/ N + 1 ;s 0.9 when the statistical occupancy of the D4R's is taken into consideration.
Additional parameters are required to match the intensities of the experimental data and
theoretical curves, and to include the effects of decay due to TIP.
The best fit to the envelope of experimental data was obtained with kl-' = 2.2 ms. kl-' =
26.7 ms, and Tl , = 2 S. The actual values of these panuneters do not affect the dipolar coupling
since this is defined by the period of the osciIlations. Once suitable values for these five
parameters were found, nonlinear least squares regression to fit the data with Eq. 3.8 (expressed
in terms of Bessel fiinctions) was undertaken and the best fit found with D = 1440 Hz. The
resulting theoretical curve calcuIated using these values is overlaid on the experimental data in
Figure 4.5 and shows quite good agreement. The largest discrepancies occur at contact times up
to 1 ms, and this is attributed to the slight variation (decrease) in the output of the ' 9 ~ amplifier
power with increasing contact time; the Hartmann-Hahn match had been optimized for a 2 ms
contact time. D = 1440 Hz corresponds to a Si-F distance of 2-49 A, which is slightly shorter than
the 2.63 A determined from XRD. The slightly larger dipolar coupling found from fitting of the
experimental data may reflect the contribution from fluoride ions in other D4R7s, and to a lesser
extent the T-2 Si intensity.
Spinning Sampies at the f = kI Sideband Matching Conditions
Under MAS conditions, the transient oscillations becarne significantiy more pronounced
than those observed for static samples. This phenornenon is readily seen by cornparison of the
experimental data presented in Figures 4.5,4.6 and 4.7. According to the theoretical treatment
presented by ~ e d i ~ e r ? the oscillatory behaviour at the f = +1 sideband matching condition

Peak 1
Contact Time (ms)
Figure 4.6 19~-?Si CP behaviour for the T- l Si in octadecasil at the 1 f 1 = 1 sideband matching conditions under various MAS speeds. Curves calculated using Eq. 3.14 with D = 1340 Hz(v,=3.37 f=-l), D = 1380 Hz(vr=3.37 !d-k f = + l ) , andD= 1360 Hz (v, = 4.66 kH& f = - 1 ) are overlaid. The intensities have been arbritrady scaled to separate the curves.
Peak Area -
I m n 1
0 2 4 6 8 10
Contact Time (ms)
Figure 4.7 19~-19si CP MAS behaviour for the T-1 Si in octadecasil at the f = +2 sideband matching condition. The line shows the fit calculated using Eq. 3.14 with D = 1400 Hz, S, = 0.9, kl-' = 6 ms, ki' = 14 ms, and T l , = 125 ms. The spinning speed was 4.15 kHz, and the ' 9 ~ tield strength was 17 W.
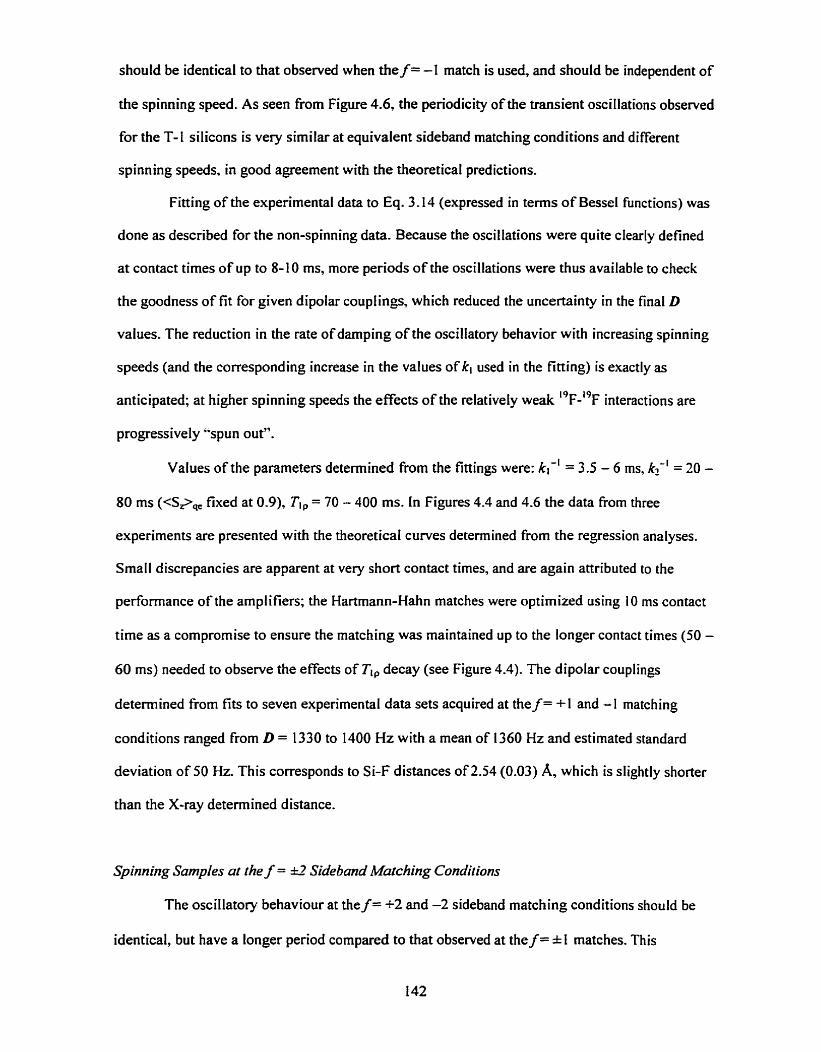
should be identical to that observed when the f = -1 match is used, and should be independent of
the spinning speed. As seen from Figure 4.6, the perîodicity of the transient oscillations observed
for the T- 1 silicons is very similar at equivalent sideband matching conditions and different
spinning speeds, in good agreement with the theoretical predictions.
Fitting of the experimental data to Eq. 3.14 (expressed in temis of Bessel functions) was
done as described for the non-spinning data. Because the oscillations were quite clearly defined
at contact times of up to 8-1 O ms, more periods of the oscillations were thus available to check
the goodness of fit for given dipolar couplings, which reduced the uncertainty in the final D
values. The reduction in the rate of damping of the oscillatory behavior with increasing spinning
speeds (and the corresponding increase in the values of kl used in the fitting) is exactly as
anticipated; at higher spinning speeds the effects of the relatively weak l9F-I9F interactions are
progressively "spun out".
Values of the parameters determined from the tittings were: ki-' = 3.5 - 6 ms, kc' = 20 -
80 ms (<Spq, fixed at 0.9), T l , = 70 - 400 ms. In Figures 4.4 and 4.6 the data from three
experiments are presented with the theoretical curves determined frorn the regression analyses.
Small discrepancies are apparent at very short contact times, and are again attributed to the
performance of the amplifiers; the Hartmann-Hahn matches were optimized using 10 ms contact
tirne as a compromise to ensure the matching was maintained up to the longer contact times (50 -
60 ms) needed to observe the effects of Tl, decay (see Figure 4.4). The dipolar couplings
determined from fits to seven experimental data sets acquired at the f = + I and -1 matching
conditions ranged from D = 1330 to 1400 Hz with a mean of 1360 Hz and estimated standard
deviation of 50 Hz. This corresponds to Si-F distances of 2-54 (0.03) A, which is slightly shorter
than the X-ray determined distance.
Spinning Samples al the f = L' Sideband Mafching Condilions
The oscillatocy behaviour at the f = +2 and -2 sideband matching conditions should be
identical, but have a longer period compared to that observed at the f = *l matches. This

behavior was observed in the experimental data acquired for the T-l Si under MAS conditions
when the field strengths were appropriately adjusted. Fitting of the data to Eq. 3.14 was camed
out as described in the preceding sections and similar values of the various parameters were
found. Erperimental data obtained for the T- 1 Si at the f = +2 matching condition for a spinning
speed of 4.15 kHz is shown in Figure 4.7 together with the curve calculated using the parameten
listed in the caption. At the f = *2 matching condition only two penods of the oscillation were
observed up to a contact time of 10 ms compared with the three to four seen when f = * 1. Thus
the uncertainty of the dipolar couplings is reduced somewhat compared to those obtained from
data acquired at the first sideband matches, and is similar to that determined from the static
sample data,
The average of the dipolar couplings determined fkom fitting of al1 the CP data at the five
possible matching conditions (static and MAS) for the T-1 Si is given in Table 4.3. Cornparison
with Si-F distances determined from REDOR TEDOR, and X-ray diEmction experiments
reveals that, for isolated spin pairs at least, analysis of variable contact time data from I9~-"si CP
experiments can yield reliable and quite accurate interatomic distances providing oscillatory
behaviour is observed.
13.4 ' ' F - ~ ~ s ~ REDOR Experiments
In a REDOR experiment the signal intensity is monitored as a function of either the
number of rotor periods or the position dunng the rotor cycle at which the dephasing pulses are
applied, with the number of rotor periods constant." Commonly, a series of dephasing n-pulses is
applied to the unobserved heteronuclear spins, with a simple spin-echo sequence on the observed
spins.." However when the resonance offsets are large, pulse errors can accumulate, and while
phase-cycfed pulse trains help to compensate for pulse imperfections, they too become
ineffective at large offsets.j3 In such cases it is desirable to rninirnize the number of puises on
those nuclei having large offset effects. Garbow and Gullion have reported a modified REDOR

19 29 Table 4.3 Cornparison of the dipolar coupliiigs ( D ) aiid F- Si interatomic distances ( r ) for octadecasil detennined by various methods. Standard deviations are given in parenthesis.
1 1 1 TECHNIQUE 1
(') Dipolar couplings detemined from nonlinear leasi-squares fitting of experimental data and internuclear distances calculated from these. 'b' Distances determined from the single crystiil X-ray data of Caullet ef ril.'%ad dipolar couplings calculated froin these. '" Dipolar couplings determined from visual fitting of experimental data and iiiternuclear distances calculated from the~e.'~' Standard deviation estimated from visual fittings. (') Not determined.
T-Site
T-1
(Si in D4R)
I T-2
(Si not in D4R)
Parameter
(Hz)
r (4
D (Hz)
r (4
Cross ~olarization'~)
1 3 80 (80)
2.53 (0.04)
I I . ~ ! ~ )
n.d. (Cl
REDOR@'
l 150 (50)
2.69 (0.04)
1 20 (20)'~'
5.7 (0.4)'~'
TEDOR'~'
II30 (50)
2,70 (0.04)
120 (20)'~'
5.7 (0.4)'~)
~ - r a ~ ' ~ '
1230 (5)
2.632 (0.003)
122 (5)
5.688 (0,003)

pulse sequence that requires only a single dipolar dephasing pulse on the unobserved
heteronuclear spins to minimize these problems."
Several pulse sequence schemes were used to impIement the REDOR experiments, two
of which are presented in Figure 3.6. REDOR experiments were performed with either a train of
dephasing pulses applied to the unobserved (0 nuclei (I9F), or by applying just a single
dephasing pulse on the unobserved nuclei. Because the REDOR experiment involves the
formation of an echo for the observed nucleus, it is the spin-lattice relaxation behavior of this
nucleus which determines how quickly the sequence can be repeated. As "si was the observed
nucleus in these experiments, and the T, values for the silicons in octadecasil are relatively long
(ca. 20 s), an initial presaturation sequence was incorporated to achieve a more efficient
recycling time, while still ensuring quantitative reliability. In experiments which utilized an
initial cross-polarization from I9F to ' 9 ~ i prior to beginning the REDOR portion of the sequence.
the repeat time was govemed by the much shorter ' 9 ~ Tl (see Table 4.2), and presaturation was
not necessary.
4.3.4.1 REDOR Experiments on the D4R Sificons (T-I Si)
Experimental REDOR results for the Si in the T-1 site using three different pulse
sequences are shown in Figure 4.8. In the absence of an initial polarization transfer from 1 9 ~ . the
experimental values of AS/So did not reach the theoretical maximum of about 1.05 during the
first 4.5 ms of dipolar evolution. but seemed to oscillate around 0.85 - 0.92. The explanation for
this is that only about 90% of the D4R units contain a fluoride ion, as detemined by elemental
analysis. This would allow signals from "si nuclei in D4R units without fluoride anions to
contribute to the intensity of the peaks in the off-resonance (So) experiments, which limits the
value of AS& attainable. In the case of octadecasiI then, these maximum normalized AS/So
intensities provide a direct method for estimating the percentage occupancy of the D4R units by
fluoride ions.

Figure 4.8 I9~-"si REDOR data and tits for the T- l Si in octadecasil at the spinning speeds indicated. The theoretical curves were calculated assuming D = 1 150 Hz and either complete (dashed line) or incomplete (solid line) occupancy of the D4R by fluoride ions. (a) Dephasing pulses on "F, solid curve calculated for 85% occupancy. Data at vr = 3.950 lcHz acquired with initial cross polarkation fiom 1 9 ~ . (b) Dephasing pulses on "si, solid curve calculated for 92% occupancy.

The oscillations observed for the T- 1 silicons at short contact times in the CP
experirnents justiS, the analysis of the REDOR behavior for these silicons in terms of an isolated
"s~-'~F spin pair. To permit fitting of the data, the theoretical values of AS& were multiplied by
a scaling factor to account for the incomplete occupancy. This scaling factor does not affect the
"period" of the oscillation from which the distance is deterrnined. Nonlinear least squares fitting
of the REDOR data for the T-1 Si included this scaling factor as a variable, and gave an average
value for the dipolar coupling of 1 150 Hz (standard deviation 50 Hz). This corresponds to a Si-F
distance of 2.69 + 0.04 A, in excellent agreement with the value of 2.63 A determined from the
X-ray structure. The plots in Figure 4.8 illustratc how well the scaled theoretical curves (solid
lines) calculated using the di polar coupl ings and scaling factors determined from the fitt ing
match the observed experimental data. REDOR experiments with cross polarization fiom ' 9 ~ to
'%i prior to the REDOR sequence were also successful (Figure 3.6(b)). The use of an initial
polarization transfer from ' 9 ~ means that the observed REDOR signals will originate only from
"si nuclei which have F ions in their associated D4R and hence the incomplete occupancy will
not be apparent. Consequently the AS& value should oscillate about I .O as was observed (see
Figure 4.8(a)).
A drift towards a AS/So value of unity at longer dephasing times (> 4.5 ms, n > 12) was
noted (Figure 4,8(a), open circles), and this probably arises from additional dipolar couplings
between the T-1 silicons and the next closest (> 7 A) fluoride ions, whose contributions take a
much longer time to build up. It is also apparent that data acquired using the puIse sequence with
a single dephasing pulse on the unobserved nuclei attain a somewhat higher maximum AS&
ratio (ca. 0.92) compared with the value of ca. 0.85 if the train of dephasing pulses was applied
to the unobserved nuclei. This small difference in efficiency between the two pulse sequences
rnay be due to resonance offset effects. However the curve fitting for both experiments yielded
exactly the same value for the 2 9 ~ i - ' 9 ~ dipolar coupling within experimental error. It should be
noted that this may not be the case for other '9~sontaining systems (e.g. fluoro-organic

sorbates), where there may exist large chemical shift anisotropies, homonuclear and ' H- '~F
heteronuclear Iine broadening interactions. En such cases the choice of pulse sequence may be
critical in obtaining the most reliable measurement of D,
Figure 4.9 shows the resuit of applying the REDOR transform reported by ~ u e l l e r ~ * to
the data acquired at a spinning speed of 3.950 kHz. The peak maximum occurs at 1 188 Hz which
corresponds to a Si-F distance of 2.663 A. The full width at half maximum (CU. 590 Hz) is
primariiy a result of the Iimited number of data points acquired (10). and the apodization
function (three-point Blackman-Harris) used. Although several REDOR data sets were acq u ired
having more than ten AS/So values, the spinning speeds in these experiments were not
sufficiently high for the REDOR transform to be applied. To see a coupling of about 1200 Hz,
the REDOR data must be acquired with v, 2 3 kHz since the REDOR transfonn will only show a
range of frequencies from O to v, / 2. The fluctuation in the spectrum below 500 Hz is an artifact
arising from the initial decay in the S/So values at srnaIl numbers of rotor periods.
6-3-42 REDOR Experiments on Siiicons not in the D4R (T-2 Si)
For the T-2 silicons, the ' 9 ~ - ' 9 ~ i dipolar coupling was estimated to be 122 Hz fiom the
Si-F distance of 5.69 A calculated from the crystal stnicture. However, depending on the exact
occupancy of the D4R units, there can be up to four fluonde anions in a tetrahedral arrangement
about each T-2 silicon, and therefore equidistant fiom it (Figure 4. I(b)). This represents a more
complicated situation than for the Si in the D4R (T-1 site) as the experiment no longer involves a
single, isolated spin pair. Coupling to several fluorines can produce extra dephasing which
translates into a stronger apparent dipolar coupling, and thus to an underestimate of the true
heteronuclear distance. The theoretical curve calculated for a single, isolated "s~-'~F spin pair
with a dipolar coupling of 120 Hz (not shown) does not fit the experimental data at all, but a
reasonable fit at short dephasing times (< 4 ms) assuming an IS spin pair could be obtained with
D = 220 HG corresponding to a Si-F distance of 4.67 A. This is much shorter than that known

O 500 1 O00 1500 2000
Dipolar Coupting (Hz)
Figure 4.9 REDOR transform of REDOR data acquired for the T-l Si in octadecasil at a spinning speed of 3.950 kHz, Ten experimental S/So data points were acquired up to n = 20, apodized with a three-point Biackrnann Harris function of the form 0.424 + 0.497 cos(nx / 10) + 0.079 cos(2nx / t O), and zero-filied to 128 points. The peak maximum occurs at 1 188 Hz and ha . a F W H of approximately 590 Hz,
Figure 4.10 "F-'~s~ REDOR data and fits for the T-2 Si in octadecasil at a spinning speed of 2.350 kHz. The curves were calculated for: a tetrahedral arrangement of four flouride ions about the T-2 Si with D = 120 Hz (dashed line); a binomial distribution assuming a (partial) tetrahedral arrangement of (up to) four flouride ions having D = 120 Hz and an 85% probability that each D4R is occupied (solid Iine); (c) the superposition of a large number of REDOR curves calculated for isolated ' 9 ~ - ' g ~ i spin pain and weighted using a Gaussian distribution with variance defined by -(Si-F) = 15 1450 HS (dotted line).

from the X-ray structure, and it illustrates a potential problem when multiple spins could be
involved and no clear oscillation is observed.
When an observed spin magnetization is dephased by dipolar interactions with more than
one other spin. the dephasing will normally be dominated by the nearest one (since D a ilr ').
However, when the distances are comparable, dephasing from multiple spins wilI be
cumulative.'^" Naito et al." demonstrated that the geometrical arrangement of the spin pairs had
a measurable effect on the calculated REDOR curves, and Schaefer and CO-~orkers'~'~ derived a
general equation for the REDOR behavior of an S spin dipolar coupled to any number of I spins
provided that the geometric arrangement of these spins is known as described in C hapter 3.
Blumenfeld et al? have also proposed the use of the superposition of many REDOR curves for
isoiated spin pairs weighted by a Gaussian distribution with variance related to the 1-S
heteronuclear second moment, M2(&S). Calculations based on these two methods are presented in
the foilowing sections.
Eract Mdti-Spin Calcularions with Statistical Occupancy
Calculation of theoretical dephasing of a single "si by multiple I9~ 's was undertaken for
the T-2 silicons assuming an exact tetrahedral arrangement, and additional corrections for the
partial occupancy of each D4R unit were also incorporated. The dephasing of a single obsewed
"si spin dipolar coupled to more than one ' 9 ~ spin can be calculated directly4- as the powder
average of a sum of independent dephasings assuming that the fluorines are not coupled to each
other, and that the fluorine dephasings of the silicons are independent of one another. For
octadecasi 1 the first condition is satisfied because the sample is undergoing magic angle spinning
at speeds (2-5 kHz) that greatly exceeded the largest homonuclear ' 9 ~ - ' 9 ~ dipolar coupling (130
Hz for 9.3 A separation). The second condition is assumed to hold because of the good fits
4 ï.#t.j6 obtained in other systems and for the T-l silicons in the present work.
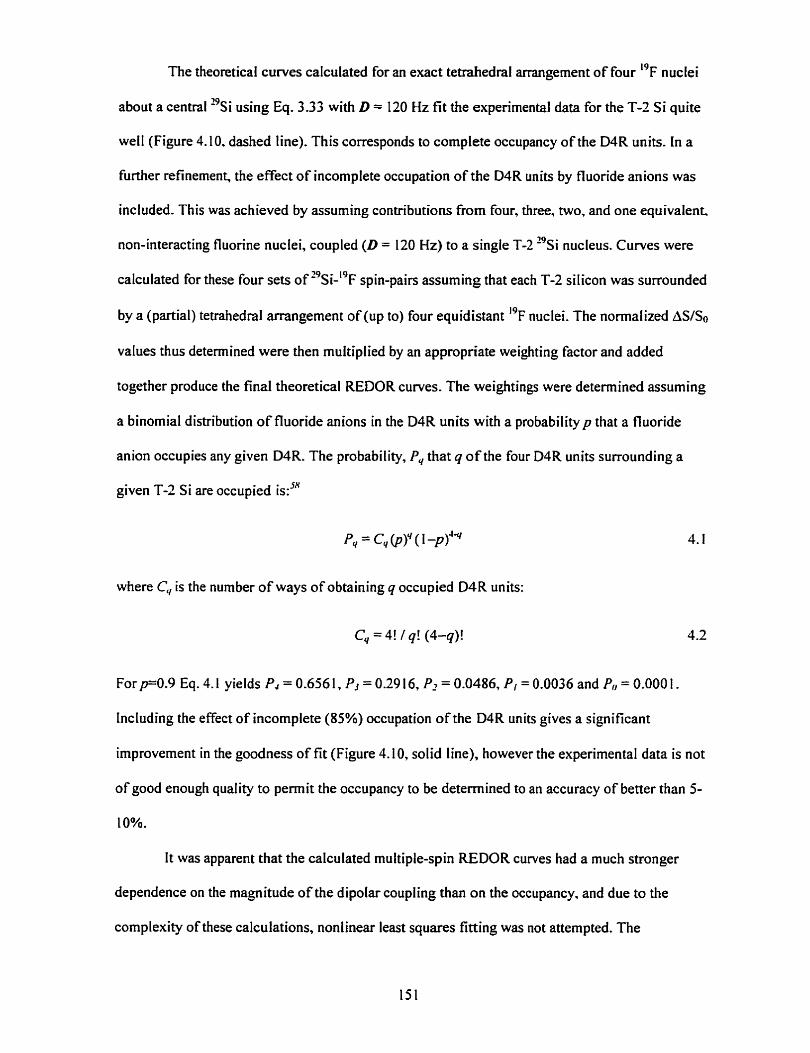
The theoretical curves calculated for an exact tetrahedral arrangement of four ' 9 ~ nuclei
about a central ' 9 ~ i using Eq. 3.33 with D = 120 Hz fit the experimental data for the T-2 Si quite
well (Figure 4.10. dashed line). This corresponds to complete occupancy of the D4R units. In a
further refinement, the effect of incomplete occupation of the D4R units by fluoride anions was
included. This was achieved by assuming contributions from four, three, two, and one equivalent,
non-interacting fluorine nuclei, coupled ( D = 120 Hz) to a single T-2 I9si nucleus. Cumes were
calculated for these four sets of "s~-'~F spin-pain assuming that each T-2 silicon was surrounded
by a (partial) tetrahedral arrangement of (up to) four equidistant ' 9 ~ nuclei. The nonnalized AS&
values thus determined were then multiplied by an appropriate weighting factor and added
together produce the final theoretical REDOR curves. The weightings were determined assuming
a binomial distribution of fluoride anions in the D4R units with a probabilityp that a fluoride
anion occupies any given D4R. The probabiiity, P, that q of the four D4R units surrounding a
given T-2 Si are occupied is:"
where C , is the number of ways of obtaining q occupied D4R units:
C,, = 4! / q! (4-q)! 4.2
For pO.9 Eq. 4.1 yields P, = 0.656 1, PJ = 0.29 16, P7 = 0.0486, PI = 0.0036 and P,, = 0.000 1.
Including the effect of incomplcte (85%) occupation of the D4R units gives a significant
improvement in the goodness of fit (Figure 4.10, solid line), however the experimental data is not
of good enough quality to permit the occupancy to be determined to an accuracy of better than 5-
10%.
It was apparent that the calcdated multiple-spin REDOR curves had a much stronger
dependence on the magnitude of the dipolar coupling than on the occupancy, and due to the
complexity of these calculations, nonlinear least squares fitting was not attempted. The

uncertainty in D was estimated to be Iess than 20 Hz fiom inspection of curves calculated
assuming I 00% occupancy of the D4R units and a range of di polar couplings (not shown). Thus,
the REDOR fits for the T-2 Si yield a Si-F distance of 5.7 * 0.4 A, in very good agreement with
the value of 5-69 A determined from the X-ray crystal structure. This analysis is also in good
agreement with the rna~irnurn dephasing observed in the REDOR experirnents for the T-1
silicons. and indicates that the actual occupancy of the D4R units is probably slightly higher than
85%.
Although in the case presented here (T-2 Si in octadecasil), a11 of the 1-S distances were
equal, the method outlined above accommodates different distances within the group of nuclei. 1t
should be emphasized that the possibility of obtaining distances directly. However these results
demonstrate that these exact analyses are reliable and should work for any geometrical
arrangement, provided this is known,
Gausian Distribution of Isolated ''F-% Spin Pairs
Nonlinear leastsquares regression analysis of the T-2 Si REDOR data in terms of a
Gaussian distribution of isolated I9~-l9si spin pairs was also undertaken. Using Gaussian-
Hermitian quadrature integration with 1 80 roots of the Hermite polynomials (see Appendix C),
the best fit (lowest X') was obtained with M2(Si-F) = 151450 ~2 and the simulated curve is
shown in Figure 4.1 O (dotted line). The heteronuclear second moment calculated from the XRD
determined structure (assuming complete occupancy of the D4R units and a 8 A cut-off ) is
305660 HZ'. The overall tit of the curve to the data is not good; the shape of the curve deviates
quite significantly from the trend in the experimental data. This probably indicates that the
Gaussian distribution model is not very appropriate in this case.

43.5 ' 9 ~ - 2 9 ~ i TEDOR Erperiments
TEDOR experiments were originally developed as an alternative to REDOR to mesure
the heteronuclear dipolar coupling between nuclei while eliminating unwanted background
contributions from uncoupled spins.'"" The TEDOR experiment involves two tirne penods of
di polar dephasing, one before the transfer of coherence (achieved by sirnultaneous R/2 pulses),
and another after the coherence transfer (Figure 3.10). This allows more permutations of the
experiment. which give the added flexibility of being able to select the experiment best suited to
the Ti and fi relaxation parameten of a particular system. This flexibility may be particularly
useful, especially if one Tz value is unacceptably shoq as is oRen the case for inorganic solids.
The theoretical TEDOR behavior can be calculated as described in Chapter 3.
Variations of the TEDOR experiment included the application of n-pulses on "si. or ''F
before the coherence transfer pulse, varying the spinning speed, the position of the pulses, and
the number of rotor cycles before and afier the transfer pulse. The pulse sequences used for
experiments (Figure 3.10) were such that the minimum increment allowed for the number of
rotor cycles before coherence transfer was two because of the use of the simuItaneous ic-pulses to
form an echo to ensure that the chemical shifts are refocussed at the transfer point. Larger
increments are possible but only in even numbers of rotor cycles, 4,6, 8. etc. For the number of
rotor cycles after coherence transfer, incrernents of 1,2,3, or more were permitted since no
sirnultaneous refocussing K-pulses were applied in this part of the sequence. Ali TEDOR
experiments were performed with one of the silicon signals set exactly on resonance and several
"periods" of the oscillations were acquired to ver@ the accuracy of the D values.
It is important to take into consideration the nuclear relaxation parameters of the nuclei
as these limit the range of n or rn values that will give viable signal intensities. During the penod
before coherence transfer, the spin-spin relaxation rate, T', of the source nuclei (e.g. 1 9 ~ ) is
important, and after the transfer it is the Tz of the observed nuclei (e.g. "si) that limits the
maximum time (and thus the number of rotor periods) after coherence transfer that signal can be
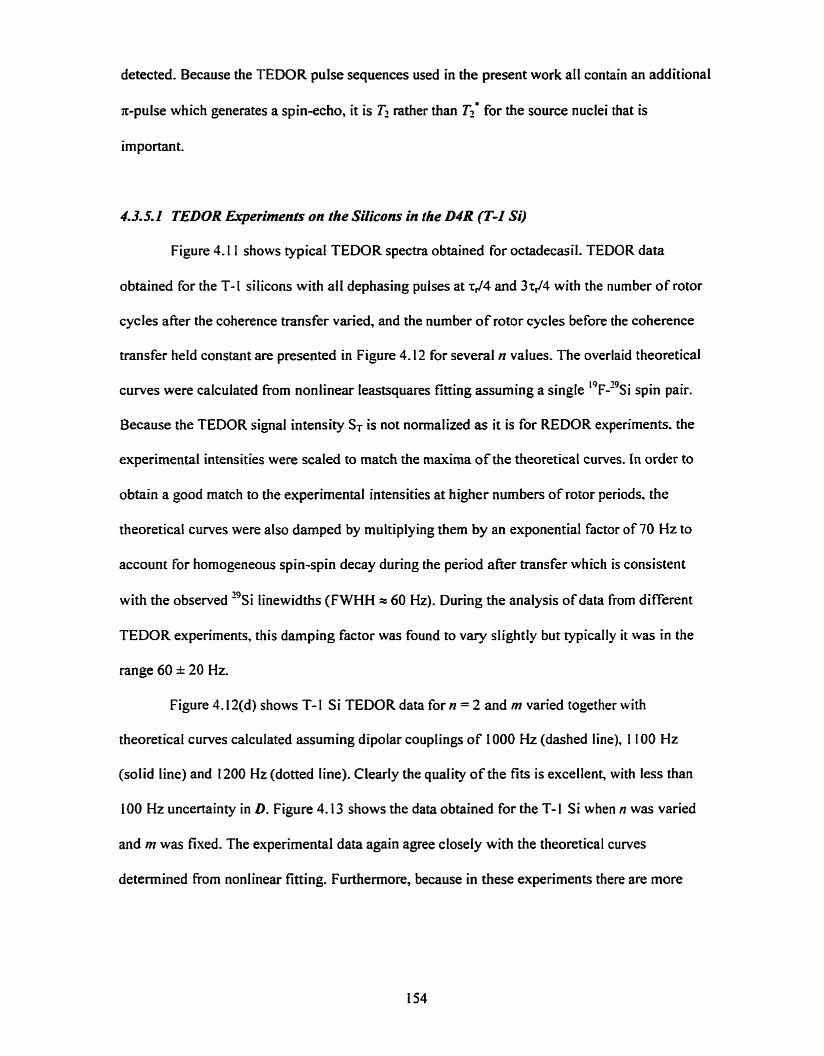
detected. Because the TEDOR pulse sequences used in the present work al1 contain an additional
x-pulse which generates a spin-echo, it is T2 rather than T~' for the source nuclei that is
important.
4.3.5.1 TEDOR Experiments on the Silicons in the D4R (T-I Si)
Figure 4.1 1 shows typical TEDOR spectra obtained for octadecasil. TEDOR data
obtained for the T-I silicons with al1 dephasing pulses at ~ 4 4 and 3rJ4 with the number of rotor
cycles afier the coherence transfer varied, and the number of rotor cycles before the coherence
transfer held constant are presented in Figure 4.12 for several n values. The overlaid theoretical
curves were calculated from nonlinear Ieastsquares fitting assuming a single I9~-l9si spin pair.
Because the TEDOR signal intensity ST is not normalized as it is for REDOR experiments. the
experimental intensities were scaled to match the maxima of the theoretical curves. In order to
obtain a good match to the experimental intensities at higher numbers of rotor periods, the
theoretical curves were also damped by multiplying them by an exponential factor of 70 Hz to
account for homogeneous spin-spin decay during the period after transfer which is consistent
with the observed "si linewidths (FWHH = 60 Hz). During the analysis of data from different
TEDOR experiments, this darnping factor was found to Vary slightly but typically it was in the
range 60 * 20 Hz. Figure 4.12(d) shows T-1 Si TEDOR data for n = 2 and m varied together with
theoreticai curves calculated assuming dipolar couplings of IO00 Hz (dashed line), 1 100 Hz
(solid Iine) and 1200 Hz (dotted line). Clearly the quality of the fits is excellent, with less than
100 Hz uncertainty in D. Figure 4.13 shows the data obtained for the T-1 Si when n was varied
and m was fixed. The experimental data again agree closely with the theoretical curves
determined fiorn nonlinear fitting. Furthemore, because in these experiments there are more


(a) n = 2
(b) n = 4
(d) n = 2
ln, Rotor Periods AFTER Transfer
Figure 4.12 TEDOR data and fits detennined fiom nonlinear least-squares fitting of the T- I silicon by varying m with n held constant and al1 dephasing pulses at 544 and 3~44 . (a)n=2, v,,=4.770 kHz, D=ll3l Hz, (b)n=4, v,,=4.770 kHz, D = 1100 Hz, and (c) n = 6, v,, 4 2 4 4 Id-Iz, D = 1077 Hz. (d) Indication of the sensitivis of the fit for n = 2, v,, = 4.296 kHz: cunres calculated with dipolar couplings of 1200 Hz (dashed l ine), 1 100 E b (solid line) and 1 O00 M (dotted line). An exponential damping of 70 Hz was applied to al1 curves to account for T2 decay. The ST scaIes are in arbitrary units.

(a) m = 1
(b) m = 2
(c) m = 3
(d) m = 2
n, Rotor Periods BEFORE Transfer
ligure 4.13 TEDOR data and fits determined fiom nonlinear least squares fitting of the T- 1 silicon as a function of n for different rn values at a spinning rate of 4.540 kHz with al1 dephasing pulses at rJ4 and 3~44. (a) m = 1, D =Il76 Hz, (b) m = 2, D = 1207 Hz, and (c) rn = 3, D = 1213 Hz. (d) Indication of the sensitivity of the fit for rn = 2, spinning speed 5.244 kHz. The curves were calculated assuming dipolar couplings of 1200 Hz (dashed Iine), 1 100 I-Iz (solid Iine) and 1000 Hz (dotted Iine). An exponential damping of 70 Hz was applied to al1 curves to account for T2 decay. The ST scales are in arbitrary units.

"periods" of the osciI1ation to fit, these represent a quite stringent test of the fit of the
experimental data to the theoretically predicted behavior. This is the first time TEDOR
experiments have been reported where n was varied and m fixed. There was no discemible
difference between TEDOR experiments performed with the dephasing pulses before the
coherence transfer on either ' 9 ~ i or 1 9 ~ .
Weighted, nonhear fittings of the TEDOR experiments with a11 dephasing x-pulses at
~ $ 4 and 3r44 yielded an average value of D = 1 130 Hz witb a standard deviation of 50 Hz for the
silicons in the D4R units. From these values the Si-F interatomic distance was calculated to be
2.70 * 0.04 A. which is slightly longer than the value of 2.63 A calculated from the diffraction
measurernents, but still in very good agreement. As seen from Table 4.3, the Si-F distance for the
T- 1 silicons determined from TEDOR experiments is in very close accord to that found from
REDOR experiments, but slightly longer than found from fitting of the CP data, although al1
techniques have comparable accuracy.
The TEDOR data obtained by changing the positions of the dephasing pulses from r44.
3t44 required integration of the appropriate functions describing the dipolar interactions, and
subsequent numerical point-by-point integration of those functions. Results from these
experiments were plotted versus the dimensionless parameter A,, = nDr, (or A,,, = ~ D T , ) so that
-'universal" curves (for isolated IS spin pairs) were obtained that could be used for fitting data
acquired at different spinning speeds. The resulting curves (calculated using D = 1 100 Hz and 70
Hz dampening) showed very good agreement with the experimental data. Figure 4.14 shows data
for the T-1 Si and the theoretical curves for TEDOR experiments performed with the dephasing
pulses moved to (a) ~45,4545 and (b) 716,5546 aafter the coherence transfer. The dephasing
pulses were at q./4 and 3rJ4 before the transfer. The dipolar coupling determined from
experiments performed with the pulses moved from r44 and 3r44 4vas generally less (by about 50
Hz) than that determined for other TEDOR experiments and probably indicates that moving the
pulses yields a less efficient TEDOR experiment.

Figure 4.14 TEDOR data and fits for the T-I silicon with ail dephasing pulses before the coherence transfer at r44 and 3 ~ 4 4 and those aRer the transfer positioned at: (a) ri5 and 4rA5, and (b) ~ 4 6 and 5~,./6. The number of rotor periods before the transfer was fixed at 2, rn was varied, and the spinning speed was 4.285 kHz. The theoretkat curves were caIculated for D = 1 100 Hz with an exponential darnping of 70 Hz to account for Tz decay. The ST scale is in arbitrary units.
Figure 4.15 TEDOR data for the T-2 silicon (n varied, m = 3, v, = 4.53 kHz, dephasing pulses at r44 and 3r,./4), and the theoretical curves calculated assuming an exact tetrahedral arrangement of four fluoride ions about the T-2 Si and 1 9 ~ - ' 9 ~ i dipolar couplings of: (a) 100 Hz, (b) 120 Hz, and ( c ) 140 Hz. An exponential damping of 70 Hz was applied to account for T' decay. The ST scale is in arbitrary units.

4.3.5.2 TEDOR EXperiments on the Sificons not in the DdR (7'-2 Si)
As seen in Figure 4.15, TEDOR data for the T-2 Si were also well fit by theoretical
curves calculated for a tetrahedral arrangement of four fluorides about a central T-2 silicon (D =
120 Hz) using multiple spin analysis as outlined in Chapter 3. Statistical occupancy was not
incorporated because of the arbitrary scaling between experimental data and theoretical
intensities. This dipolar coupling corresponds to r = 5.7 1 A in good agreement with that
determined from the crystal structure and the REDOR fits. If an isolated " s ~ - ' ~ F spin pair was
assumed. nonlinear least squares fitting to the TEDOR data for the T-2 Si yielded a value of D =
205 HG which corresponds to a Si-F distance of 4.78 A. This result again illustrates the danger of
obtaining incorrect internuclear distances frorn fitting TEDOR experimental data if more than
two spins are present and the fitting assumes only a single, isolated spin pair.
4.4 CONCLUSIONS
These results clearly establish the viability of these experiments for determining the
precise location of 19~-containhg species within framework structures from the magnitude of the
' 9 ~ - ' 9 ~ i dipolar coupling derived from CP, REDOR, and TEDOR. Such experiments could be
19 31 extended to determine F- P interatomic distances in aluminophosphate molecular sieves
(AlP04s) with fluorine-containing guests and to other framework/sorbate host-guest complexes.
REDOR experiments yield normalized intensities which are useful for testing the
goodness of the fit of experimental data to the theory, and even in the present case for estimating
the percentage occupancy of the D4R units by fluoride ions. TEDOR experiments eliminate
unwanted background signals arising from observed nuclei which are not dipolar coupled to the
heteronuclear spins, and can provide additional advantages because of the larger number of
experimental variables available, and the corresponding increased flexibility to accommodate
large Tl or small T' values of either nucleus. An advantage of TEDOR experiments over REDOR
is that it is possible to extend them to 2-D correlation e~~erirnents. '~~" This could be very useful

in cases where there are several resonances for both nuclei as it should permit a differentiation
between the connectivities. This will important for threedimensional host guest-structure
determinations in frameworks of the type studied here.
It is possible to obtain incorrect internuclear distances from fitting REDOR and TEDOR
experimental data if more than one spin is dipolar coupled to the observed spin and the fitting
assumes only a single, static, isolated spin pair. Independent information which verifies that the
experimental data relates to an isolated spin pair should be obtained. For spin systems which
cannot be considered as isolated spin pairs (e-g. the T-2 Si in octadecasil), it may be possible to
determine the dipolar couplings (and thus distances) accurately fiom REDOR and TEDOR
experiments (provided the geometry of the spin system is known) as demonstrated in the present
work. In order to more fully explore the uniqueness of the REDOR and TEDOR behavior for
multi-spin systems a series of 3-spin calcuIations were undertaken. The results of these
simulations are presented in Chapter 5-

REFERENCES FOR CHAPTER 4
Breck, D. W. Zeolite Molecular Sieves; Wi ley Interscience, 1974-
Barrer, R.M. ZeoZiie md Clay Materials as Sorbents m d Molecular Sieves; Academic Press, 1974.
van Bekkum, H.; Flanigen, E.M.; Jansen, J-C. (Eds.), Introduction to Zeolite Science and Practice: Elsevier: Amsterdam, 199 1.
Jansen. J. C.; Stocker, M.; Karge, H.G.; Weitkamp, J. (Eds.), Advonced Zeolite Science and Applications: Elsevier: Amsterdam, 1994.
Flanigen, E.M.; Patton, R.L. U.S. Patent No. 4073865, 1978.
Kessler, H.; Patarin, J.; Schott-Darie, C. Stud. Surf: Sci. Catal. 1994, 85, 75.
Guth, J.L.; Kessler, H.; Caullet, P.; H m , J.; Merrouche, A.; Patarin, J. in Proceedings of the 9th In~ernational Zeolite Conference, Montreal. 1992. von Ballmoos, R.; Higgins J.B.; Treacy, M.M.J. (Eds), Butterworth-Heinemann 1993,S 15.
Zhao, D.; Qiu, S.; Pan& W. in Proceedings of the 9th International Zeolite Confeence. Montreal, 1992. von Ballrnoos, R.; Higgins J.B.; Treacy, M.M.J. (Eds), Bunerworth- Heinemann 1993, vol. 1,337.
Loiseau, T.; Riou, D.; Taulelie, F.; Férey, G. Srud. Surf: Sci. Catal. 1994,84,395.
Schott-Darie, C.; Kessler, H.; Soulard, M.; Grarnlich, V.; Benazzi, E. Ski. Swjf Sei. Caral. 1994,8J, 101.
Simmen, A. Ph.D Thesis, E.T.H. Zurich, SwitzerIand, 1 992.
S immen, J.; Patarin, J.; Baerloc her, Ch. in Proceedings of rhe 9th International Zeolite Conference. Montreal, 1992. von Ballmoos, R.; Higgins J.B.; Treacy, M.M.J. (Eds), Buttenvorth-Heinemann 1993,433.
13 Chézeau, LM.; Delmotte, L.; Guth, J.L.; Soulard, M. Zeolites. 1989, 9, 78.
14 Delmotte, L.; Soulard, M.; Guth, F.; Seive, A.; Lopez, A.; Guth, J.L.; Zeolites 1990, IO. 778.
15 Védrine, J-C. in Guidelines for Mastering the Properties of Moledur Sieves, Barthorneuf, D.; Derouane E.G.; Holderich, W. (Eds), Plenum Press: New York, 1989, 12 1.
16 Caullet, P.; Guth, J. L.; H m , J.; Lamblin, J. M.; Gies, H. Eur. J. Solid Sîate Inorg. Chem. 1991,28,345.
17 Schott-Darie, C.; Patarin, J.; Le Goff, P.Y.; Kessler, H.; Benazzi, El Microporous Mater. 1994,3, 123.
18 Estermann, M.; McCusker, L.B.; Baerlocher, C.; Merrouche, A.; Kessler, H. Nature, 1991, 35& 320.
19 Merrouche, A.; Patarin, J.; Soulard, M.; Kessler, H.; Anglerot, D. in Synihesis of Microporous Materiais: Occell i, M.L.; Robson, H.E. (Eds.), Van Nosaand Reinhold; 1992, 1,384.
20 Sierra, L.; Deroche, C.; Gies, H,; Guth, J.L. Microporow Mater. 1994,3,29.
21 Qiu, S.; Pang, W.; Kessler, H.; Guth, J.L. Zeolites. 1989, 9,440.
22 Price, G.D.: Pluth, J.J.; Smith, J.V.; Bennett, J.M.; Patton, R.L.J. Am. Chern. Soc. 1982, 104. 5971.
23 Mentzen, B.F.; Sacerdote-Peronnet, M.; Guth, J.L-; Kessler, H. C.R Acud Sci. Paris 1991, 313, 177.
24 Schreyeck, L.; CauIlet, P.: Mougenel, J-C.; Guth, J.L.; Marler, B. J. Chem, Soc., Chem. Cornm. 1995.2 1 87.
2.5 Fyfe, C.A.; Gies, H.; Feng., Y.; Kokotailo, G-T. Nature. 1989,341,223-
26 Fyfe. C.A.; Feng., Y.; Grondey, H.: Kokotailo, G.T.; Gies, H. Chem. Rev. 1991, 91. 1525.
27 Fyfe. C.A.; Strobl, H.; Kokotailo, G.T.; Kennedy, G.J.; Barlow, G.E.; J. Am, Chem. Soc. 1988,110,3373.
28 Fyfe, C.A.; Feng, Y.; Gies, H.; Grondey, H.; Kokotailo, G.T.J. Am. Chem- Soc. 1990, 112, 3264.
29 Engel hardt, G .; Michel, D, High-Resolution Solid-Stufe I V . of Silicates and Zeolites. John Wiley and Sons: New York, 1987.
30 Waugh, J.S.; Maricq, M. M.; Cantor, R. J. Magn. Reson. 1978,29, 183.
31 Gu Ilion, T.; Schaefer, J. Adv. Magn. Reson. 1989, 13, 57.
32 Voelkel, R. Angew. Chem. Int. Ed. Engl. 1988,27, 1468.
33 Stejskal, E.O.; Schaefer, J-; Waugh, J.S. J. Magn- Reson. 1 9 7 7 , X 105.
34 Mehring, M. Principles ofHigh Resolution NMR in Solids, 2nd ed.; Springer-Verlag: New York, 1983; Chapter 4.
35 Hediger, S.; Meier, B.H.; Ernst, R.R. J. Chem. Phys. 1995,102,4000.
36 Hagaman, E. W.; Ho, P.C.; Brown, L.L.; ScheII, F.M.; Woody, M.C. J. Am. Chem. Soc. 1990, 113,7445.
37 Schaefer, J.; Stejskal, E.O.; Garbow, J.R.; McKay, R.A. J. Magn. Reson. 1984,59. 150.
38 Hawkes, G.E.; Mantle, M.D.; Sales, K.D.; Aime, S.; Gobetto, R.; Groombridge, C.J. J. Magn. Reson. Ser. A. 1995,116,25 1.
39 Hediger, S.; Meier, B.H.; Ernst, R.R Chem, Phys. Lett. 1995,240,449.
40 Walther, K.L.; Wokaun, A.; Baiker, A. Mol. Phys. 1990, 71, 769.
41 Klein DouweI, C.H.; Maas, W.E.J.R.; Veeman, W.S.; Werumeus Buning, G.H.; Vanken, J.M.J. Macromol. 1990,23,406.
42 Gullion, T.; Schaefer, J. J. MW. Reson. 1989,81, 196.
13 Hing, A.W.; Vega, S.; Schaefer, J.J. Magn. Reson. 1992,96,205.

44 Hing, A. W.; Vega, S.; Schaefer, J. J. Magn. Reson. Ser. A, 1993, 103. 1 5 1.
45 Pan. Y.; Gullion, T.; Schaefer, J. J. Magn. Reson. 1990,90,330.
46 Mueller, KT. J. Magn, Reson. Ser. A. 1995,113,8 1.
47 Goetz, J.M.; Schaefer. J. J. Magn. Reson. 1997,127, 147.
48 Naito, A.; Nishimura, K.; Tuzi, S.; Saitô, H. Chem. Phys. Lett- 1994,229, 506.
49 MarcucciIIi Hoffher, F.; DeIrnotte. L.; Kessler, K. Zeolites, 1993, 13,60.
50 Hartmann, SU.; Hahn, E.L. Phys. Rev. 1962, 128,2042.
51 Wo I h , S. Muthematico. A System for Doing Mathematics by Cornputer. Addison- Wesley: Massachusetts, 199 1.
52 Hediger, S. Ph-D. Dissertation, Eidgenossische Technische Hochschule. Zürich, Switzerland, 1997.
53 Guliion T.; Schaefer, J. J. Mugm Reson. 1991, 92,439.
54 Garbow, J.R.; Gu11 ion T. J. Magn. Reson. 1991, 95,442.
55 Mueller, K.T.; Jarvie, T.P.; Aurentz, D.J.; Roberts, B.W. Chem. Phys. Lett. 1995.242, 535. Chem. Phys. Lett. 1996,254,28 1 .
56 McDoweIl, L.M.: Klug, C.A.; Beusen, D.D.; Schaefer, J. Biochem- 1996,35.5395.
57 Blumenfeld, A.L.; Coster, D.; Fripiat, J.J. J. Phys. Chem. 1995, 99, 15 18 1.
58 Mendenhail, W.; Beaver, R.J. Introduction tu Probabiliry andStatistics. 9th Edition; Duxbury Press: California, 1994, p.167.
59 Fyfe. C.A.; Mueller, K.T.; Grondey, H.; Wong-Moon. K.C. Chem. Phys. Lett. 1992,199, 198.
60 Fyfe, C.A.; Mueller, K.T.; Grondey, H.; Wong-Moon, K.C. J. Phys. Chenz. 1993.97. 13484.
61 Fyfe, C.A.; Wong-Moon, K.C.; Huang, Y.; Grondey, H.; Mueller, K.T. J. Phys. Chem. 1995, 99, 8707.
62 Vega, A. J. J. A m Chem. Soc. 1988,110, 1 049.
63 Fyfe. C.A.; Di- A.C.; Grondey, H.; Fahey, B. In preparation.

CHAPTER 5
INVESTIGATIONS INTO THE UNIQUENESS OF NMR
DISTANCE DETERMLNATIONS 1[N MULTIPLE SPIN SYSTEMS
5.1 INTRODUCTION
As discussed in the Chapter 3, the REDOR and TEDOR behavior in ItS spin systems is
generally different than the dephasing for an isolated IS spin pair. Theoretical REDOR and
TEDOR curves can be calculated for multiple Ispins about a single (observed) S spin as
described in Sections 3.4.2 and 3 -5.3, provided the precise geometrical arrangement (number and
relative orientations) of the spins is specified. Naito et al. were the fint to describe the
mathematical framework necessary for calculating the REDOR dephasing in a )-spin I.$ system.
and demonstrated the application of this in a simple peptide system.' This methodology was later
extended by Schaefer and CO-workers who intmduced a convenient method for perfoming the
calculations in tems of vector dot products beîween the 1-S vectors.' The expansion of these
techniques to describe the dephasing in TEDOR experiments was derived and presented in
Chapter 3. Using these approaches, experimental REDOR and TEDOR data for the T-2 silicon in
octadecasil could be well fitted (Chapter 4). This study represents the only multi-spin TEDOR
analysis reported to date.' Furthemore, only very few studies reported in the literature have
included multi-spin REDOR analysis, and in most of these cases the geometry of the spin system
was known, or could be predicted with a fair degree of certainty, from other methods (e-g. X-ray
diffraction studies) pior to the analysis of the experimental data."-"

Any relative motions of the nuclei within a heteronuclear spin systern can aiso affect the
REDOR and TEDOR dephasing because the intemuclear distances (and thus the dipolar
coupling) will Vary. The presence of such motions will result in an apparent reduction in
dephasing compared to that predicted for a rigid spin systern. Goetz and ~chaefe? have presented
a mathematical formaIism for calculating the dephasing where the trajectory of the motion is
known. and Naito et al." have proposed a method to include the effect of thermal motions.
At the time the experirnents reported in this thesis were undertaken no systematic
evaluation of the theoretical REDOR and TEDOR behavior in IhS spin systems was available, It
was unclear if the REDOR and TEDOR dephasing in multiple spin systems could be identified
and quantified directly, or whether the dephasing behavior was unique for different spin systems.
In many of the systems that REDOR and TEDOR might be utilized to characterize, the stmctural
information available will be somewhat Iimited. The investigations of sorbate / zeolite structures,
which is the topic of this thesis, will fa11 into this category. For this reason it is crucial to
determine the situations where analysis of REDOR and TEDOR data may be unable to furnish
unambiguous, dependable distance information. A series of theoretical REDOR and TEDOR
calculations on a selection of I;& spin systems assess the practicality of extracting useful
structural information from analysis of REDOR and TEDOR experiments in such cases, and the
results are surnmarized in this Chapter.
5.2 SELECTION OF PARANETERS FOR SIMULATIONS
A selection of 3-spin, 1-S systems were chosen to simpIiQ the calculations, and the
effects of varying two parameters were investigated: (a) the 1-3 dipolar couplings, and (6) the 1-S-
I angie, t;. A pictorial representation of these systems is given in Figure 5.1. The full range of 6
(O0 5 1; 5 1 80° ) was considered, and values for the two di polar couplings, DI and D,, (i.e.
between rd-S and 1&? respectively) were chosen to represent couplings in typical "c-'%

systems. This is because many REDOR and TEDOR expenrnents have focused on C-N distance
determinations in biologica1 systems such as peptides and amino acids.
Figure 5.1 Pictorial representation of the ILS spin systems for which the theoretical REDOR and TEDOR dephasing was investigated. The dipolar coupling for I,-S (Di) was fixed at 1 O0 Hz, while D2 (the dipolar coupling between iB and S) and the &S-iB angle, <, were varied.
Three distinct 1'-S-ls systems with DI = 100 Hz and D2 = 100 HZ, 75 Hz, or 50 Hz were
considered in detail. Preliminary calculations on a 5-spin iJS system indicated that the step size
utilized (7d20) for the 3-spin calculations provided sufficient accuracy for the integration to
produce the powder average (Table C. 2, Appendix C. For clarity, the results of the REDOR and
TEDOR 3-spin simulations are discussed separately.
It should be emphasized that the features of the REDOR behavior calcuIated for these
cases can be related directly to other 1-i systems. Because the dephasing time ( ie . the product of
the number of rotor cycles (n or m) and the rotor period, t,) was used in calculations, the curves
are independent of the spinning speed. Furthemore, so long as the ratio of relative magnitudes of
the two dipolar couplings are in a ratio similar to those used here (1 .O: 1 .O, 1.0:0.75 and 1.0:0.5)

the curves are related by a simple scaling: the larger the dipolar couplings, the shorter the time
needed for a given degree of dephasing to occur.
When considering the TEDOR behavior, there is the small additional complication that
the dep hasing tirne in the part of the experiment which has a constant number of rotor cycles
must be known in order to calculate the dephasing. The theoretical curves presented in this
chapter were calculated assuming a spinning speed was 2.5 kHz, with the number of rotor
periods before the coherence transfer (n) varied, and the number of rotor periods afier the
transfer (m) tixed. For an isolated IS spin pair, the maximum theoretical dephasing occurs when
mDr, = 0.84.'~ On the assumption that the net dipolar coupling would be approximately 100 Hz
in the spin systems investigated, a value of m = 20 was selected.
5.3 REDOR SIMULATIONS
53.1 Theoretical REDOR Bebavior for 3-Spin 14-1 Systems
Cumes calculated for DI = DI = 100 Hz and selected values of the angle < (some of
which are cornmonly encountered in chemical systems) are shown in Figure 5.2(a). The data used
to generate Figure 5.2(a) are listed in Table C.3 (Appendix C). The curve for an isolated IS spin
pair with D = 100 Hz is also given. It should be emphasized that these curves are not the same as
those calculated by simply adding curves calculated for the individual spin systems, i4-S and Ir
S, even though the calculation involved a sum of independent S spin dephasings by the I nuclei
(see Section 3.4.3).
The dephasing curves are identical for 5 and 1 GO0-(; due to the symmetry of the cosine
function in the dephasing equations (Eqs. 3.3 1 and 3.33). The most distinctive behavior is
observed when < is small (or close to 180°), otherwise there are quite minor differences in the
dephasing when & is in the range fiom appmximately 20' to 1 60°. In general the initial dephasing
occurs faster in the 3-spin systems than for the IS spin pair. Also the nearer t; is to 90°. the faster
the value of AS& approaches the equilibrium value of 1 .O. Obviously, in systems with larger

dipolar couplings these differences would evoive more quickly, but the relative behaviors of the
curves will be similar.
Two speciat cases occur if DI = D2 : (0 when & = 90°, and (i i) when = 180". In the first
case (data not shown) the dephasing is identical to that calculated for an isolated spin pair with a
dipolar coupling of fi Dl. In the second situation, the equilibriurn AsBo value is 0.5 rather than
1 .O. This arises because two of the four possible combinations of the dipolar couplings cancel
(+DI -Dr = -DI + D2 = O), and thus only the two remaining combinations contribute to the
dephasing. This behavior is identical to that predicted for and isolated IS spin pair having a
dipolar coupling of 2 DI with the 1 spins present only 50% of the time.
Figure 5.2(b) shows the dephasing curves calculated for three different values of & with
1; = 180°7 and two general trends are evident. Firstly, the dephasing dunng the early stages is
faster for larger D2. Secondly, except in the special case where Dl = D 2 , the smaller & , the
shorter the dephasing time needed to approach the equilibrium AS& value of 1 -0. As D2
becomes a smaller fraction of DI, the IrS interaction has a correspondingly smaller effect on the
total dephasing. In fact when the magnitude of D2 is < 10% of DI, the effect of the third spin ( IB)
becomes airnost negligible, and the dephasing is very similar to that predicted for an isolated iS
spin pair.
Figures 5.3,5.4 and 5.5 illustrate the dependence on 6 where Dl = 100 Hz and D? = 100
Hz, 75 Hz, or 50 Hz, respectively. Inspection of these plots reveals that the variation between the
three cases is quite small once t; is larger than about 30". It is also apparent that a variation in t;
of the order of IO0 is required to effect a noticeable change, and spins systems with quite distinct
geometries may exhibit very similar dephasing behavior. For example, the curve calculated for
DI = D2 = 100 Hz with C=2O0 (Figure 5.2(a)) closely mimics that obtained with DI = 100 Hz, D2
= 50 Hz and t;=180° (Figure 5.2(b)). The relatively small changes that are observed in the
calculated data will be even more dificult to detect in experirnental data due to üncertainties

O IO 20 30 40 Dephasing Time (ms)
O 10 20 30 40 nt, Dephasing Time (ms)
Figure 5.2 REDOR curves calculated for some 3-spin 1 ' systems. (a) DI = 1 O0 Hz, 4 = 100 Hz, and the 1-S-1 angle, <, indicated. (b) < = 180' with D, = 100 Hz, and D2 = 100, 75, or 50 Hz. The curve for an isolated IS spin pair with D = 100 Hz is included for cornparison.
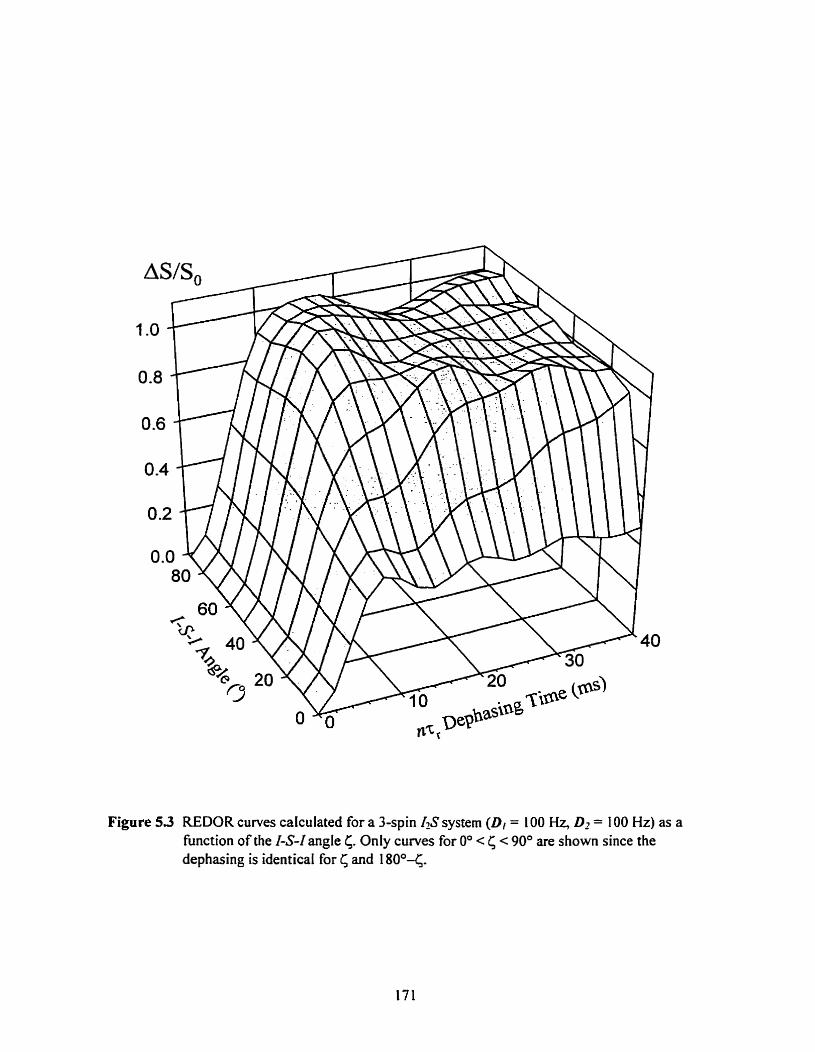
Figure 5 3 REDOR curves calculated for a 3-spin I f i system (DI = 100 Hz, D2 = 100 Hz) as a function of the I-S-I angle C;. Only curves for 0" < C; < 90° are shown since the dephasing is identical for 6 and 1 80°<.

Figure 5.4 REDOR curves calculated for a 3-spin I&S system (DI = 100 HG D2 = 75 Hz) as a function of the 1-S-langle 5. Only curves for O0 < < < 90° are shown since the dephasing is identical for < and 1 80°<.

Figure 5.5 REDOR curves calculated for a 3-spin 12S system (Dl = 100 Hz, D2 = 50 HZ) as a function of the 1-S-langle 6. Only curves for O0 c 5 c 90' are shown since the dephasing is identical for < and 1 80°<.

arising from a finite signal-to-noise (SM) ratio. Thus even in a "best-case" scenario where both
interatomic distances are known (i-e. DI and D2 can be fixed) and only C; needs to be varied. it is
anticipated that < couid only be determined to an accuracy about Il 5".
5.32 The REDOR Transform Applied To Multi-Spin Data
The REDOR transform is an analytic transform method, analogous to a Fourier transform, which
provides a means of analyzing REDOR data in such cases." When applied to SdSo REDOR data,
the REDOR transform produces a frequency-domain spectrum containing resonances at the
dipolar coupling frequencies present in the time-domain REDOR signal. Provided that the
experimental data is of adequate quality (i.e. good signal-to-noise ratio and collected up to a
çuficiently large number of rotor periods), and the spinning speed used exceeds ca. three times
the largest dipolar coupling present, the REDOR transform can successfully extract the correct
dipolar frequencies from real experimental REDOR data where the spin systern contains discrete
sets of heteronuclear spin
It was not apparent fiom the literature what information, if any, the REDOR transform
would yieid when applied to REDOR data acquired for samples containing multiple spin
systems. In particular, it was hoped to determine whether the REDOR transform was capable of
providing correct dipolar couplings from multiple spin data. There was also interest in the actual
appearance of the REDOR transform spectrum for multiple spin systems (e.g. [,uS systems), to
determine if the transform spectrum contained features which might be diagnostic of the
presence of multiple spins, or act as indicators that the spectrum should be interpreted with
caution. Information such as diis is vital to determine the validity of applying the REDOR
transfom in cases where little or no information about the nature of the spin system is available
prior to beginning REDOR 1-S internuctear distance determinations.
For the REDOR transform to be well behaved, the S&, data must decay cornpletely to a
value of 0.0. Because of a finite signal-to-noise ratio and the incomplete dephasing inherent in

real experimental data, an apodization fùnction must be applied to ensure this requirement is met.
Reports to date favor the use of a 3-point Blackman-Harris fun~tion'"'~ and this was used in the
present work.
To investigate the strengths and weaknesses of the REDOR transform method, it was
applied to SdSo REDOR data calculated for several 1 - systems. The data were calculated in two
rotor cycles increments up to 64 rotor periods for a spinning speed of 2.5 kHz using the product
formalism described in Section 3.4.2. Following apodization the data were zero-filled up to 256
rotor penods to improve the appearance of the transform spectrum,
One eRect of apodization is to smooth the data, however any oscillatory fine-structure
present in the data is also modified, While this is potentialiy troublesome for data from isolated
IS pairs, it becomes a major problem in the case of &S spin systems because the relatively minor
differences which distinguish the &S spin system geometries will be further reduced.
Furthemore, apodization preferentially weights the contribution of the data at short dephasing
times (where the behavior is very similar for different geometries), and thus discriminates against
the information present in the behavior seen at longer times. Application of the REDOR
transform to non-apodized data generally produces a periodic dipolar spectrum (due to truncation
effects) which is very dificult to interpret.
The appearance of the REDOR transform was found to depend on the 1-S-1 angle < and
on the dipolar couplings used for the calculation of the SdSo data. In some instances the
transfomi spectrum indicated that only a single dipolar coupling was present, while for other
values of <, several resonances were clearly evident. The dipolar couplings determined directly
from the transform spectra varied significantly; in some cases the values exceeded those assumed
for the calculation of the S&, data, while in othen smaller couplings were seen. No features
were observed which might indicate that the REDOR data was not from isolated spin pairs.
In summary, the REDOR transfoms calculated for theoretical 12S data did not exactly
reproduce the known di po lar couplings, and the initial apodization ovenhadowed any unique

features apparent in the raw &/Sa data in many cases. The situation will be even worse for
experimental data where the finite signal-to-noise ratio inhoduces additional uncertainties in the
precise AS/So values. ïhese results were not unexpected because the REDOR transfomi was
developed assurning only contributions fiom isolated spin pairs.
533 Gaussian Distribution of Dephasing Spins
Blumenfeld et al.'5 have proposed an appmach where the REDOR behavior is calculated
in terrns of the 1-S second moment, M2(I-S), for cases where a large number of 1 spins dephase a
single S spin. The applicability of this approach was demonstrated by these authors using the
experimental "AI-observed, 'H-dephased REDOR data for two minerais. The fitting yielded
values for iM2(I-S) which where in good agreement with those caiculated from crystal stni~ture.'~
This is discussed in Section 3.4.3 and details of the calculations are presented in Appendix C.
By using, for example, a Gaussian distribution of dephasing spins, no information
regarding the specific geometrical arrangement needs to be provided. However since any
dependence on the effect of the 1-S-I angles is neglected, the potential to determine specific 1-S
distances is relinquished. The caveat is that the number of dephasing spins is suficient to
approximate the assumed distri but ion.
In Figure 5.6, Gaussian REDOR curves calculated assuming M2(I-S) = 5000 ~ d , 10000
HZ', and 50000 HZ' are shown together with that for REDOR dephasing in an isolated IS spin
pair (D = 100 Hz). The rate of dephasing increases with increasing magnitude of the
heteronuclear second moment, and shows a smooth rise without oscillations; precisely the
behavior expected when a large number of oscillatory curves having different periods are added.
5.4 THEORETICAL TEDOR BEHAVIOR FOR 3-SPIN 14-1 SYSTEMS
As for the REDOR calculations, three spin systems with dipolar couplings of D, = 100
Hz and D2 = 100 Hz, 75 Hz, or 50 Hz were considered for various IA-S-l~ angles. Cumes

O 1 O 20 30 40
rn, Dephasing Time (ms)
Figure 5.6 REDOR curves calculated for a single (observed) S spin dipolar coupled to a large number of 1 spins and different 1-S heteronuclear second moments, M(i-S). A Gaussian distribution was used to weight the contributions of the individual 1-S dipolar couplings to the total dephasing. The curve for an isolated IS spin pair with D = 100 Hz is included for cornparison.

calculated for DI = D2 = IO0 Hz and selected values of the angle 4 are shown in Figure 5.7(a),
together with that calculated for an isolated IS spin pair having D = 100 Hz. The data used to
generate Figure 5.7(a) are listed in Table CS (Appendix C). As was also the case for the multi-
spin REDOR behavior, these curves are noi the same as those calculated by simply adding curves
calculated for the individuaI spin systems, iA-S and leS. The 1s TEDOR curves calculated for &
and 180°-t; are identical because of the nature of the expression (a product of the sine functions)
describing the dephasing (see Appendix C). When < is in the approximate range 30' < < < 150".
the dephasing is slightly faster for the 3-spin system than for an isolated IS spin pair (Figure
5.7(a)).
Figure 5.7(b) shows the dephasing curves calculated for three different values ofD2 with
< = 180". and two trends are evident. Firstly, the initial maximum for Sr occurs at essentiaIly the
same dephasing time (ca. 8 ms) in al1 cases, and is also the same as that for an isolated IS spin
pair. This could potentially be very problematic when attempting to fit experimental data, since
the theoretical ST vaIues must be multiplied by a scale factor to match the experimental TEDOR
data. This need arises because, unlike AS& values determined for a REDOR experiment, ST is
not norrnalized. Secondiy, the time between successive maxima in Sr becomes longer as D2 gets
smaller. It is essentially these variations which distinguish the behavior in the different systems.
However, at longer dephasing times in the TEDOR experiment, T2 induceddamping can quickly
"wash-out" these osci Ilations.
Figures 5.8,5.9, and 5.1 O illustrate the dependence on 6 where D, = 100 Hz and Dz =
100 Hq 75 Hz, or 50 Hz, respectively. Inspection of these plots reveals that the variation between
the three cases is quite small once 6 is larger than about 30". It is also apparent that, as for the
REDOR data, a variation in < of the order of 10" is required to effect a noticeable change. Again,
the relatively small changes observed in the calculated data will be even more dificult to detect
in reat experimental data due.

- lS Spin Pair - C=20"
+ & = 109O - C = 120"
4 < = 180"
10 20 30 n.r, Dephasing Time (ms)
I I 1 1 1
O 10 20 30 40 n.c, Dephasing Time (ms)
Figure 5.7 TEDOR cuwes calculated for some 3-spin 1 ' systems. (a) DI = 100 Hz, D2 = 100 Hz, v, = 2.5 kHz, n varied, rn = 20, and the I-S-Iangle, <, indicated. (b) = 180" with DI = 100 H z , and 4 = 100,75, or 50 Hz. The curve for an isolated IS spin pair with D = 100 Hz is included for cornparison.

Figure 5.8 TEDOR curves calculated for a 3-spin 12S system (Dl = 100 Hz, D2 = 100 Hz, spinning speed 2.5 n varied, rn = 20) as a function of the I-S-[angle 5. Only curves for O0 c 5 < 90° are shown since the dephasing is identical for 6 and 1 80°<.

Figure 5.9 TEDOR curves calculated for a 3-spin IzS system (Dl = 100 Hz, Dr = 75 HS spinning speed 2.5 kHz, n varied, m = 20) as a function of the I-S-Iangle <. Only curves for O0 < < < 90° are shown since the dephasing is identical for < and 180°-(;.

Figure 5.10 TEDOR curves caIcutated for a 3-spin i2S system (DI = 100 Hz, D2 = 50 HG spinning speed 2.5 I<Hz, n varied, m = 20) as a function of the 1-S-Iangle 5. Only curves for O* < 5 < 90° are shown since the dephasing is identical for < and 180'4.

A major limitation with TEDOR data is that the ST intensities are not norrnalized which
means that a scaling factor is required to match the experirnental and theoretical ST values.
Inspection of Figures 5.7-5.10 reveals that the shape of the curves (which is effectively what
must be matched) is not completely unambiguous in many cases. In addition, any differences
visible in the theoretical curves will probably vanish when working with real experimental data
due to finite SM and damping of the oscillations due to spin-spin relaxation. These dificulties
are compounded because the S/N decreases with increasing dephasing time.
Any relative motions of the nuclei within a heteronuclear spin system can also affect the
TEDOR dephasing because the internuctear distances (and thus the dipolar coupling) will vary.
Overali , the presence of such motions wilt be more problematic in TEDOR experiments than in
REDOR because there are two dephasing periods.
In summary, the likelihood of determining reliable distances in a 1-' systems from
TEDOR behavior is potentiaIIy even less than for REDOR. Even in the "best-case" scenarios
where both interatomic distances, or one distance and the angle, are known, it would be dificult
to determine the complete geometry unless T2 is sufficiently long that data of adequate SM can
be obtained at large numbers of rotor cycles.
5.5 CONCLUSIONS
In conclusion, these calculations indicate that it is highly unlikely that direct and
unambiguous distance determinations can be obtained fiom REDOR and TEDOR experiments on
multiple spin systems when the number of spins and geometrical arrangement of these is
unknown. This is true even for the simple 3-spin geometnes investigated here, and the problem
will be compounded when more spins and/or relative motions are present. Furthemore, there is
no discrimination between I 'systems with < and 1 80°<, and it is possible to obtain the wvrong
answer if an isolated spin pair is assumed and multiple spins are present. REDOR transfoms of

data fiom multiple spin systems yields transform spectra devoid of features which might indicate
that the spin system was not composed of isolated spin pairs, and could thus be mis-interpreted.
The algorithm used to calculate the powder averaging in the present work is very
computationally intensive (Appendix C), which significantly hinden fitting experimental multi-
spin data within a reasonable time period. Increasing the efficiency of the integration over the
two angles to produce the powder average is thus highly desirable. This is especially true for
TEDOR data where a summation must be used to performed the caIculations. Methods which
could be implemented include the approaches proposed by Aldemann er al.. '"ang and
anso on.*- and the recently reported REPULSE algorithrn."
Even with irnproved calculation effkiency, the best approach will be to try and ensure
that the spin system approximates an isolated spin pair as closely as possible, (e.g. by isotopic
substitution and dilution in the unlabeled compound), or several isolated spin pairs. If this is not
feasible, one possibility is to acquire several REDOR and TEDOR data sets (with different
parameters). Alternatively, CP data from groups of spins could be obtained and analyzed to
obtain TCP - In both cases a model of the spin system which fuliy describes the relative geometric
arrangement (Le. with al1 angles and distances implicitly defined) must be proposed, and the
theoreticai dephasing or heteronuclear second moments are calculated and compared to the
experimental data. The model is modified and the calculations re-run until optimal agreement
between the calculated and experimental dephasing is obtained for al1 of the esperimentd data
sets. With these approaches there wiil be no direct determinations of distances, but structural
information can still be (indirectly) obtained. This method will be most efficient if constraints
c m be ptaced upon the model which limit the possible number of spins and intemuclear
distances. This may be the case for sorbate molecules in zeolites since the guests must lie within
the channels or voids. This approach was applied to locatep-difluorobenzene in the zeolite ZSM-
5 as described in the next Chapter.

REFERENCES FOR CHAPTER 5
1 Naito, A.; Nishimura, K.; Tuzi, S.; Saitô, H. Chem P@sS Lett- 1994,229,506.
2 Goetz J.M.; Schaefer, J. J. Magn. Reson. 1997,127, 147.
3 Fyfe. C.A., Lewis, AR,; Chezeau, J.M.; Grondey, H. J. Am. Chem. Soc, 1997,119, 122 10.
4 Pan, Y.; Gullion, T.; Schaefer, J. J. hfagn. Reson. 1990, 90,330.
j Holl, S.M.: MarshaIl, G.R.; Beusen, D.D.; Kociolek, K.; Redlinski, A.S.; Leplawy, M.T.; McKay, R.A.: Vega, S.; Schaefer. J. J . Am. Chem. Soc. 1992,114,4830.
6 McDowell, LM.; Klug, C.A.; Beusen, D.D.; Schaefer, J. Biochem. 1996.35,5395.
7 Marshall, GR.; Beusen, D.D.; Kociolek, K.; Redlinski, AS.; Leplawy, M.T.; Pan, Y.; Schaefer, J. J. Am. Chem. Soc. 1990,112,963.
8 McDowell, L.M.; Barkan, D.; Wilson, G.E.; Schaefer, J. Soiid State Nuci. Magn. Reson. 1996, 7,203.
9 Holl, S.; Kowalewski, T.; Schaefer, J. Solid State Nucl. Magn. Reson. 1996,6,39.
10 Pan, Y. Soiid Sfafe Nuci. Magn. Reson. 1995,5,263.
11 Naito, A.; Nishirnura, K.; Kimura, S.; Tuzi, S.: Aida, M.; Yasuoka, N.; Saitô, H. J. Chem- Phys. 1996, 100, 14995.
12 Hing, A.W.; Vega,S.; Schaefer, J.J. Magn. Reson. Ser. A. 1993,103, 151.
13 MueIIer, KT.; Jarvie, T.P.; Aurentz, D.J.; Roberts, B.W. Chem. Phys. Leff- 1995.742,535. Mueller, KT.; Jarvie, T.P.; Aurentz, D.J.; Roberts, B.W. Chem. Phys. Lett. 1996,254. 28 1 .
14 Jarvie, T.P.; Went, G.T.; MueIler, K.T. J. Am. Chem. Soc. 1996, 118, 5330.
15 Blumenfeld, A.L.; Coster, D,; Fripiat, J .J. J. Phys. Chem. 1995, 99, 15 18 1.
16 Alderman, D.W.; Solum, M.S.: Grant, D.M. J, Chem. Phys. 1986,234,3717-
17 Wang, D.; Hanson, G.R. J. Magn. Reson. Ser. A. 1995, 11 7, 1.
18 Bak, M.; Nielson. N.C.J. Magn. Reson. 1997, 125, 132.

C W T E R 6
PRELLMLNARY SOLID-STATE NMR INVESTIGATIONS
OF THE STRUCTURE OF THE LOW-LOADED
PARA-DIFLUOROBENZENE 1 ZSM-5 COiMPLEX
6.1 INTRODUCTION
As discussed in Chapter 5, the direct determinations of distances between nuclei on
organic guests and the framework nuclei of microporous hosts will usually not be possible. The
porous nature of the hosts means that the framework nuclei will interact with several nuclei on
the guest molecules, even if they are isolated on the guests themselves. Thus a mode1 must be
postulated and tested for agreement with experimental data. the simplest such experiment is CP
from a "group" of nuclei on the organic guest with no assurnption of isotated spin pairs. Such
experiments are described in the present chapter with the 1 9 ~ and 'H nuclei ofp-difluorobenzene
as independent magnetization sources. The microporous framework system chosen was purely
siliceous ZSM-5.
ZSM-5 was selected because it is one of the few microporous materials for which single
crystals suitable for single crystal X-ray diffraction experiments can be synthesized and XRD
studies provide an independent a check of the appropriateness of the experimental protocol
outlined in this chapter. In addition ZSM-5 has considerable significance as a catalyst in many
industrial processes, including the conversion of rnethanol to gasoline, the interconversion of
aromatic cornpounds, and parafin cracking.'.' Information on the preferred locations of sorbed

mo Iecules inside the c hannels of zeoIites wouId greatly aid understanding of the catatytic,
diffisive, and shape-selective properîies of these materials. The changes which can occur in the
ZSM5 framework lattice due to temperature and the presence of guest species (e-g. sorbed
organic molecules). Factors including the dependence on temperature, the number of guests
present (loading), as well as the nature of sorbate-sorbate and sorbate-framework interactions
have been studied by a variety of physicat and theoretical methods as discussed in Chapter 1 -
Only six sorbate / ZSM-5 single crystal structures (some closely related) have been
reported to date,"' and at the present time, these represent the only cases where the locations of
the sorbed organic molecules been reliably determined. Although sorption sites have been
proposed from theoretical calculations, these are not always in agreement with one another. or
the X-ray determined structures. 3. IO-I J
There is a definite need to expand the database of dependable structures to irnprove the
reliability, and verify the results, of the calculation methods before they can be relied upon to
yield accurate locations of sorbates in zeolite structures. However, it is generally difficult to
synthesize zeolite crystals of adequate size and quality for single crystal XRD structure
determinations, and also to load them with controlled amounts of volatile organic sorbates.
Hence other techniques capable of providing locations and orientations of guest molecules must
be developed.
While X-ray diffraction (XRD) studies of microcrystalline (powder) samples and single
crystals of ZSM-5 have yielded the majority of the structural information in these systems, 3 4 . f & l Y
MAS NMR has provided critical information such as the number of T-sites, and is very
sensitive method for detecting structural Using sorbate-lattice distance information
fkom the solid-state NMR techniques developed in the previous chapters, it should (theoretically)
be possible to determine the complete three-dimensional structures of sorbate / zeolite complexes
fkom powder samples.

In this chapter. the results of the preliminary attempts to determine the location and
orientation of p-difluorobenzene molecules in the low-loaded ZSM-5 complex containing ca.
four molecules per unit ce11 (u.c.) are presented. The 'H-"s~ and I9~-%i heteronuclear dipolar
couplings were probed using CP, REDOR, and TEDOR experiments. Possible sorption sites
which were consistent with these data were then determined.
6.1.1 Framework Structure of MFI-type Zeolites
MFI-type zeolites include ZSM-5 which contains Si and Al in varying ratios fiom about
50 through to the purely siliceous form known as silicalite, as well as V ~ ~ O U S other materials
having isomorphous substitution of Al, Si, or both by, for example B or Ti. The MF1 framework
topology was first determined by Kokotailo et al. h m powder X-ray diffraction dat&'"" and
this was subsequently confirmed by a number of other investigations including several single
crystal XRD s tud ie~?~~ .~ '
The basic building block of the MF1 framework is the pentasil unit (Figure 6.1 (a)) which
consists of eight 5-membered rings. These pentasil units link together by sharing edges to form
chains that run parallel to the [O0 11 axis of the unit ce11 (Figure 6. I (b)). The complete 3-
dimensional MF1 framework is constructed from sheets of these chains and contains 4-, 5-,6-,
and IO-rings where the neighbouring chains are related by rnirror pIanes. This produces a 3-
dimensional channel system formed by two kinds of intersecting channels: sinusoidal (also called
zig-zag) channels which run along the [100] axis and straight ones running pardiel to [O 101 as
illustrated in Figure 6.1 (d). Both types of channels are defined by IO-membered rings which are
slightly elliptical (Figure 6.l(c)), and the effective pore dimensions (determined by the oxygen
van der Waals radii) are approximately 5.2 x 5.8 A. The exact symmetry of the lattice and the
shapes of the channel openings c m change with temperature and the presence of guest species
such as sorbed organic molecules (see below).

Figure 6.1 Building units, framework topology, and channel structure of the MF1 Framework. (a) Pentasil basic building unit (BBU) formed by five 8-membered rings. Each vertex represents a T-atom (Si or Ai), and oxygens are omitted for clarity. (b) Chains which nin parallel to [O0 11 in the hmework fonned by linking the pentasil BBü's. (c) View down [O0 11 showing sheets fonned by joining the chahs. The IO-rnembered ring aperatures define the straight channels. Sirnilar sheets are present in the [IO01 direction. (d) Representation of the channel structure showing the interconnecting straight and sinusoicial (zig-zag) channels. M e r reference 14.

Because of the nature of the pore system, ZSM-5 possesses very distinct sorption and
difision properties which are exploited in its industrial applications. The channel size is
intermediate between the small pore ( 8 h g openings e.g. the LTA fiamework) and large pore
zeolites such as zeolites X and Y (12-ring openings, FAU hmework topology). ZSM-5 can
adsorb molecules such as p-xylene, but effectively excludes molecules with larger kinetic
diameters such as I,3 ,5-trimethylbenzene.1'
6.12 Guest- and Temperature-Induced Framework Changes in ZSM-5
6.1.2.1 X-ray DQ'jGraction Srudies of ZSM-5 Sysfems
ZSM-5 has been found to adopt four space groups: three with orthorhombic symmetry:
Puma ( 12 crystaliographically inequivalent T-sites), P212121 (24 T-sites), and Pn21a (24 T-sites):
and one having monoclinic PZl /n. 1.1 syrnrnetry with 24 T-sites. As-synthesized ZSM-5.
containing the tetrapropylarnmonium cation (TPA-) as template, exhibits orthorhombic Pnma
~ ~ r n m e t r ~ . ' ~ * ' ~ AAer calcination to remove the template, the framework shows a reversible phase
transition at about 340 K (the precise temperature depends on the Si/AI ratio) and has monoclinic
symmetry below and orthorhom bic (Pntnu) symmetry above the transition temperature.
15.1 -. lX21.22.26
If certain organic molecules are adsorbed into ZSMS, the framework symmetry may also
change. These changes were observed using powder XRD" and ''si MAS NMR on highly
crystalline, siliceous ZSM-5 ~arn~les.'""~~~-"" Only four different sorbed molecules in ZSM-5
have been studied by single crystal diffraction studies to date: pxylene,"'pdichlorobenzene,"'
p-nitroaniline:' and naphthalene." Details of the space groups and locations of the sorbed
molecules determined from these single crystal studies are summarized in Table 6. t .
While structure refinements from powder diffraction data have been carried out for
ZSM-5 containing p-xylene,'"30p-dichlorobenzene,*3~31 naphthalene,3233 and several other


A. 35.36 sorbates subsequent single crystal diffraction studies showed that the sorbate Iocation(s)
proposed from the powder studies were not always correct."
6.L 2.2 i R Studies of ZSM-5 Systemr
As discussed previously, the "si MAS NMR spectra of highly crystalline. purely
siliceous zeolite systems can be very diagnostic of the lattice structures (and syrnmetries) in
terms of the local environments of the Si atoms. For exarnple, subtle changes in the average
Si(0Si)d angles by as little O.ZO can be detected as a "si chemical shifl difference of about 0.1
ppm, which is readily observab~e.'.~' The ternperature-induced phase transition fiorn rnonoclinic
to orthorhombic syrnmetry is clearly observed in the "si MAS NMR spectra of highly siliceous
ZSM-5 as seen in Figures 6.2(a) and (c). Two-dimensional COSY and INADEQUATE
experiments were used to assign the individual "si NMR resonances indicated in these
Distinct changes in the 2 9 ~ i MAS NMR spectra are also observed upon sorption of
several organic molecules including p-xylene, pyridine, benzene, dirnethylsulfoxide (DMSO),
acetylacetone. p-chlorotoluene (Figures 6.2-6.4)."."." These changes are revenible ( cg . by
calcination to remove the sorbate), and occur at ambient temperatures. However, no changes are
seen when attempts are made to adsorb o-xylene, m-xylene, octane, cyclohexane, durene. or
ethylcyclohexane. This indicates that the framework symmetry is maintained and it is only the
local framework symmetry and geometry which is alteredJ9 This is because these molecules are
too small to alter the structure or are excluded. Similar temperature and sorbate induced changes
have been observed for ZSM-1 1, but have not been seen for other highly siliceous zeolites (e.g.
mordenite, omega, ZSM-23, and others), confirming that the observed changes are not caused by
general susceptibility effects of the sorbed organic molecules in the cav i t i e~?~~~ '~ '
For the ZSM-5 1 sorbate systems where changes are seen, the nature of the lattice
distortions seems to be relatively characteristic of the nature of the sorbed molecule (Figure 6.3),

b . 1 w s . - 1 10 -1 12
1
- 1 14 -1 16 - 1 18 -120
ppm from TMS
Figure 6.2 High resolution ' 9 ~ i MAS NMR spectra o f highly siliceous ZSM-5 showing changes that occur with temperature or loading with p-xylene. (a) Empty ZSM-5 at 300 K (monoclinic, P21/n. 1. I phase). (b) ZSM-5 loaded with 2 molecules p-xy lene per U.C.
at 300 K (orthorhombic, Pnma phase). (c) Empty ZSM-5 at 403 K (orthorhombic, Pnmu phase). (b) ZSM-5 loaded with 8 molecules p-xylene per U.C. at 300 K (orthorhombic, P2,ZIZl phase). The nurnbers indicate the assignments to specific T- sites fiom MADEQUATE experiments. After reference 38.

Figure 6 3 High resolution 1 9 ~ i MAS NMR spectra of highly siliceous ZSM-5 loaded with selected organic molecules: (a) pyridine (35 W2SO mg); (b) pxylene (IO pLI250 mg); (c) dimethylsulfoxide (40 pL/250 mg); (d) acetylacetone (20 pu250 mg); (e) benzene (25 pLI250 mg); and (f) toluene (24 pL/250 mg). AI1 spectra recorded at room temperature at 79.495 MHz with 7 s recycle delay. After reference 40.

0 -108 -1 I O -112 -114 - 1 16 - 1 18 ppm kom TMS
Figure 6.1 High resolution 2 9 ~ i MAS NMR spectra of highly siliceous ZSM -5 loaded with ca. 4 molecules per U.C. of: (a) pchlorobenzene, (b) pchlorotoluene, and (c) p-xylene. The spectra recorded at ambient temperature. Afier reference 20.

and the observed changes are usually also affected by the precise loading and temperanire?'~x40
In some cases however, very similar ' g ~ i MAS NMR spectra are obtained wiih different
molecules, indicating that the lanice geometries are closely related. For example the low-loaded
forms of ZSM-5 containing equal numben of sorbed p-xylene, p-chlorotoluene. orp-
dichlorobenzene only exhibit minor differences (Figure 6.4). From these spectra it was concluded
that the locations of the molecules would Iikely be very similar (CH, is sterically similar to CI
and thus the size and shape of these molecules is c~m~arable) . '~ This prediction has since been
confirmed by single crystal XRD s tudie~.~-~ '
Fyfe and CO-workers detemined phase diagrarns for highly siliceous ZSM5 containing
various amounts of sorbed p-xylene and p-dichlorobenzene at temperatures ranging frorn 293 to
393 K using "si MAS NMR.".'~ The "si MAS NMR spectra showed that the temperature at
which the phase transition between monoclinic and orthorhombic symmetry occurred was
dependent on the precise loading and temperature. Furthemore, at certain loadings and
temperatures a mixture of the two phases was present and it was possible to detemine the
fraction of each phase from the 19si MAS NMR spectra (Figure 6.3."
In attempts to assign the "si resonances to specific T-sites within the frarnework based
on the observed ''si chemical shifts. V ~ ~ O U S correlations based on the structural geometrical
parameters of the T-sites have been proposed.'"4J-0 These are discussed fùrther in Chapter 8.
However. reliance on these conelations can result in erroneous a ~ s i ~ n r n e n t s ~ ~ ~ ' " ' and at present
the only reliable methods for assigning the "si NMR resonances to specific T-sites are the two-
dimensionai hornonuclear NMR correlation experiments such as COSY and MADEQUATE."."."
6.13 Other Techniques for Locating Sorbates in the ZSM-5 Framework
6.1.3.1 Predictiom of Sorbute Locations /rom Energy Minimization Calculations
Several groups have proposed sorption sites of organic molecules within the channels of
zeolites from energy minimization ~alculations.'""*~~*~ For example, based on calculated van der


Waals interactions between the hydrocarbon and the zeolite framework and between the
hydrocarbon molecules themselves, the mon energetically favourable sorption sites for p-xylene
at loadings up to 4 molecules/u.c. in silicalite were found to be at the channel intersections with
the methyl-methyl axes lying along the straight channel.'"" When the p-xylene occupies only the
channel intersections, the van der Waals interactions between adjacent molecules are small, and
the major contribution cornes frorn framework-oxygen / p-xylene-hydrogen interactions. Other
researchers have reported similar ~ocations.'~.'~ Sorption sites in the zig-zag channel and in the
straight channel between the channel intersections have also been found for different sorbates
(e-g. alkanes)," and when higher sorbate loadings were assumed.'%orbate-sorbate interactions
may be significant in some cases, and should be considered especially at higher sorbate
concentrations.
In the overwhelming majority of these calcdations the framework has been kept rigid.
and the sorbate geometry is usually maintained as a semi-rigid group having some pre-optimized
confor~nation.'~~'-' The locations determined by these techniques are dependent on the potential
functions and calculation technique used, and there is not always complete agreement between
the various calc~lations.~~~" Furthemore, there seems to be a dynamic interaction between the
organic molecules and the framework because the exact framework geometry adopted is related
to the nature of the sorbate present,""7 thus the orientations and locations determined frorn
calculations are sensitive to the atornic coordinates used for the framework atoms?
6.2.3-2 Predictions of Sorbate Locations front SolidStole W R Evperiments
Recently Fyfe and CO-workers have investigated the location ofp-xylene in ZSM-5 with
several solid-state NMR techniques. Using selectively deuterated p-xylenes (deuterated at the
ring or methyl groups), the locations of the sorbate molecules at a loading of 3,6, and 8
rnolecules/u.c. were detemined."" The inverse of the TCp values obtained fiom fitting of the 'H-
2 9 ~ i CP MAS data were plotted vs. the calculated "si heteronuclear second moments. The

position of the p-xylene molecules was systematically varied until a good linear correlation was
found. Both the hmework and the p-xylene molecules (idealized geometry) were kept Rgid
during these calculations. The framework symmetries and coordinates used were those reported
for the single crystal XRD determinations of the low-loaded p-dichlorobenzene complex.' and
the high-loaded form ofp-xylene in ZSM-5.'
Because I/TCp is directly proportional to the 'H- '~s~ heteronuclear second moment (Eq.
3-16), a linear correlation which passes through the origin should be obtained- However the
Iinear fit detemined frorn the 1 /Tep vs. hL(' H-'~S~) data for the high-loaded complex (i-e.
containing 8 molecuies/u.c.) at room temperature had a positive y-intercept.s'" The cause of this
disagreement was detemined to be sorbate motions on the time scale (tens of milliseconds) of
the CP experiment. These motions were detected by ')c spin-diffusion measurements on p-
xylene with a "C label on one of the methyl groups." Lowering the temperature to 273 K or
below reduced the diffusion suficiently that the regression behaved exactly as expected. The
final locations and orientations found for thep-xylene molecules in the straight and zigzag
channels from these experiments were in excellent agreement with those reported for the single
crystal XRD determined structure. validating the general approach.'
These techniques were then applied to the low-loaded p-xylene / ZSM-5 cornplex where
the sorbate location was not reliably known pior to beginning the NMR experiments. Static 'D
NMR experiments indicated that the sorbate rings were undergoing 180' ring-fl ips about the
methyl-methyl mis at the temperatures used, and these motions were included in the second
moment calculations. In this case, temperatures below ca. 2 15 K were required to reduce the
molecular motions suficiently to obtain a zero intercePt." The p-xylenes were located at the
channel intersections with the rnethyl-methyl axis along the straight channel, in agreement with
the previous predictions.''," More importantly, the sorbate location and orientation proposed
from the NMR data were very close to that found by a subsequent single crystal X-ray diffraction
structure determination can-ied out as part of the present work (Chapter 8).' The success of these

investigations indicates that analysis of CP data can be used to obtain reliable information about
the location of sorbates within the ZSM-5 framework, provided that the temperature is low
enough to minimize molecular diffusion. In the best cases it is possible to obtain the precise
position and orientation of the guest rnolecule. In the present chapter, prel irninary solid-state
NMR studies of the low-loaded pdifluorobenzene 1 ZSM -5 complex are presented
6.2 MATERIALS AND METHODS
6.2 . Sample Preparation and Sorbate Loading
Crystalline. completely siliceous ZSM-5 was kindly provided by Ms. G.E. Barlow. The
Universis. of Guelph. Freshly calcined ZSM-5 (500 mg) was loaded into 5 mL glass ampoules.
To this 36 pL of 1,4-difluorobenzene (Aldrich, 99 %) or 1,4-difluorobenzene~ (Aldrich 98
atom % D) was added (corresponding to a loading of 4 molecules/u.c.) using a micro-syrïnge.
The sample was cooled by immersion in liquid nitrogen, and the ampoule sealed with a fiarne.
The sample was stored at room temperature for several days to ensure an equilibrium loading had
been attained before loading the rotors for the NMR experiments. The loading of the ZSM-5
powder was verified by thermal gravirnetric analysis (TGA) and ' 9 ~ i MAS NMR. The TGA
measurements were perfomed on TA Instruments TGA 5 1 Thermogravirnetric Analyzer using a
temperature ramp of 10 "Clmin. from room temperature to 600 OC under flowing nitrogen gas.
The samples showed weight losses corresponding to 3.9 (f 0.3) molecules/u.c. 'H-'~s~. "F-%
CP, and I9si MAS NMR experiments confirmed that the samples contained sorbedp-
difluorobenzene.
6.2.2 NMR Experirnents
In order to rninirnize the molecular motions of the sorbate (which can adversely affect
the dipolar-based experiments such as CP, REDOR and TEDOR), the NMR experiments were
perfomed a t low temperatures using the apparatus described in Chapter 2 (Figure 2.1). Initially,

experiments were performed using nitrogen as the drive gas rather than air to prevent formation
of ice within the probe, however it was discovered that the nitrogen replaced the molecular
oxygen present within the sample. This process was gradua1 (occumng over a period of 12 hours
or longer), and had a direct affect on the low temperature NMR experiments. As the
concentration of oxygen within the rotor was reduced, the "si relaxation times increased
drarnatically. For example, at 240 K the TI relaxation times increased from ca. 2 s to greater
than 35 s afier the sample had been cooied for 24 hours using nitrogen gas to spin the rotor.
This problem was solved by utilizing air as the drive gas. The air was dried by passing it
through several filters and a drying column (Drierite) filled with freshly calcined 5A zeolite A
pellets and an indicator material which changed colour when wet. After less than one hour using
air instead of nitrogen, the L 9 ~ i Tl was about 2 s again. Similar changes were seen for the ' 9 ~ and
I H relaxation times: at 235 K the I9f Tl increased from 1.5 to 10 s, while the 'H Tl increased
from 45 ms to 4.5 s if nitrogen was used. The spin-Iattice relaxation times also increased with
increasing temperature: from 80 ms to 105 ms for 1 9 ~ , and from ca. 2 s to about 4 s for "si as the
temperature was changed from 293 to 3 10 K. The 19si spin-spin relaxation times were 1 10-225
rns at 293 K and 40- 1 50 ms at 240 K.
Temperatures used for the INADEQUATE, CP, REDOR and TEDOR experiments were
selected to obtain the maximum number of resonances in the "si MAS NMR spectra. The need
to maintain a stable temperature and spinning speed for an extended time (> 2 days) was also
considered. The pulse and automation programs used to acquire the NMR data are listed in
Appendix B. To minimize the effect of drift in the extemal magnetic field, the [NADEQUATE
experiments were performed as a series of ( 12- 1 6 h) experiments which were then CO-added. CP-
INADEQUATE experiments which employed an initial polarization transfer from protons on the
p-difluorobenzene were also performed. The fixed delay in the NADEQUATE pulse sequence
was set to 15 or 16 ms, following the typical values used for similar experiments reported in
references 26 and 38.

The WN-NMR sohareJ9 was used to perform the Fourier transformations, phase and
baseline corrections of the NMR data. The real mode spectra were then exporîed using a
JCAMP-DX format.") curve-fitting of the spectra was achieved using the program ~ r m - 3 8 6 ?
Quantitative ->si NMR spectra were fitted to determine the appropriate parameters (FWHH.
chernical shift) for the individual Lorentzian curves, and these parameters were then used for
curve-fitting the spectra from CP MAS experiments.
Fitting of the variable contact time CP data to determine TCP values was perfomed using
non Iinear least squares regression analysis in the Mathemotka programming environment" as
described in Appendix C.
6.23 Calculations to Determine Sorbate Locations and Orientations from CP Data
Two cornputer prograrns were wrinen to analyze the data from the 'H-'~s~ and "F-'~s~
CP experiments. The first of these (CPF9.PAS) calculated the static heteronuclear second
moments, while the second program (CPH9.PAS) assumed that the sorbate molecules were
undergoing 180" ring-flips about the F-F axis on the timescale of the experiments, and calculated
the M- values using the approach reported by Michel et al." as described in Appendix D. Only F-
Si (or H-Si) distances less than 8 A were used in the second moment analysis, except when the
ring flips were assumed, in which case both sites that the H atoms occupied dunng the motion
were included.
The prograrns moved (and rotated) the sorbate molecule systematically thorough the
channel system of the ZSM-5 hmework and performed linear regression analysis of the I /TCP
values vs. the calculated second moments for each location and orientation. Initial calculations to
determine potential sorbtion sites used a fairly coarse step size for the translations and rotations
(0.25 A and 15' respectively), in order to sample a larger space within the channel system.
Checks were also made to ensure that the molecules did not get too close (< 2 A) to the
framework atoms. Calculations were then mn using smaller step sizes (0.1 A and 5 O ) for the

rotations and translations over the region of interest. A typical calculation required in excess of
750 000 iterations, and took more than 48 hows to mn. Any sorbate positions and orientations
found which had acceptable regression coefficients (p) were output. Further details of the
algorithms used in these programs and a sampie input file are presented in Appendix E.
The ZSM-5 framework was assumed to be rigid with monoclinic (P?/'n. 1. I ) symmetry as
deduced from the chemical shifts in the "si MAS NMR spectra. The fractional atornic
coordinates and cell parameters utilized were those reportedlx for the single crystal XRD
structure of calcined ZSM-5 at room temperature, as this has the correct space group symmetry.
Thep-difluorobenzene molecules were defined as rigid units having an idealized geometry: the
(planar) aromatic ring was described as a regular hexagon with C-C bond Iengths of 1.392 A and
interior C-C-C angles of 60°, and the C-H and C-F bond lengths were fixed at 1 .O80 A and
1 -328 A respectively.
The molecules were placed in the straight channels at the channel intersections (one per
intersection) with the F-F axes aligned parallel to the b axis and plane of the aromatic ring in the
x - plane. The parent molecule was positioned with the ring centroid at fractional coordinates of
(0.5,0.25,0.0), and al1 other sorbate molecules in the central unit cell and surrounding 26 unit
cells were generated from this by appropriate syrnmetry operations. The symmetry operaton
(general positions) for the non-standard space group P2/n. 1. l are:" x, y; z; O.j+x. 0.5-y. 0.5-z;
-x, -y;-,?; O.j-x, O. S+y? O.S+z. However, tu ensure the sorbate molecules remained intact after
applying translations, rotations and the necessary symmetry operations to generate a complete
unit cell, the following modified symmetry operators were used: x, y; r; O.S+x, 0.5-y. O-5-z; I-.r,
I-y, I-z; 0 . 5 ~ . 0.5+y7 O.j+r. Figures of the solutions found were generated using ORTEP-3 for
windows." Some geometrical analysis was also checked using the PLATON-98 software.M

6.3 RESULTS AND DISCUSSION
63.1 1-Di9F+andZ9siMASNMR
1-D ' 9 ~ and "si MAS (with decoupling) NMR data were collected at 5 degree intervals
fi-om ? 15 K to 300 K. The 1 9 ~ MAS spectra showed a senes of spinning sidebands at the spinning
speeds used (Figure 6.6). The isotropie chemical shift was -128.8 ppm.
At temperatures above Ca. 293 K, the 2 9 ~ i MAS NMR spectra showed 12 resonances, and
the chemical shifts indicated that the ZSM-5 framework had orthorhombic Pnma symmetry
(Figures 6.7(ab)). This phase has been reported for several other low-loaded sorbate 1 ZSM-5
complexes.-'0 However, on cooling below ambient temperature. the appearance of the spectrum
changed dramatically. The most obvious change was the appearance of a new resonance at -1 09.8
ppm, and also 4 new peaks in the region -1 14 to -1 17 ppm (Figure 6.7). The resonance at - 109.8
ppm is characteristic of the monoclinic P2l/n. 1.1. phase. At lower temperatures. the spectrum
was very similar to that observed for the empty ZSM-5 at room temperature (Figures 6.7(k)). It
was concluded that a portion of the sample had undergone a phase transition from orthorhombic
to monoclinic symmetry. Inspection of the spectra obtained for temperatures below 290 K
showed a gradua1 increase in the intensities of these additional resonances relative to those
assigned to the orthorhombic phase. The resonance at -1 17 ppm is diagnostic of the orthorhombic
phase, and below about 260 K. this peak was no longer observed, indicating the sample had
completely transformed to monoclinic symmetry.
The precise "si chemical shifts varied slightly with temperature. and the temperature at
which the phase transition was complete was also found to depend on the concentration ofp-
difluorobenzene. At lower loadings, the transformation occurred at higher temperatures, in
agreement with the behavior reported for the low-loaded p-xy Iene- and p-dic hlorobenzene /
ZSM-5 complexes.20 The low-tem perature (monoc linic) spectra cou Id be deconvo luted in tems
of up to 20 Lorentzian curves (Figure 6.8). This phase transition from orthorhombic to
monoclinic symmehy was completely reversible, and was subsequently confirmed by powder X-


ppm From TMS
Figure 6.7 "si MAS NMR spectra of purely siliceous ZSM-5 ioaded with CU. 4 molecules ofp- difluorobenzene/u.c recorded at the temperatures indicated using a recycle delay of 20 S. 'Oriho' and 'Mono' label resonances which are diagnostic of the orthorhornbic (Pnma) and monoclinic (PZ,/n.l. 1) phases, respectively. The spectrum of the empty (monoclinic) ZSM-5 at 295 K is shown for cornparison (k).

EMPTY ZSM-5 T=295 K
Mono (Monociinic)
ppm from TMS
Figure 6.7 (continued) "si MAS NMR spectra of purely siliceous ZSM-5 loaded with Ca. 4 molecules ofpdifluorobenzenelu.~ recorded at the temperatures indicated using a recycle delay of 20 S. 'Uriho' and 'Mono' label resonances which are diagnostic of the orthorhornbic (Pnma) and monoclinic (PZl/n. 1.1) phases, respectively. The spectrum of the empty (monoclinic) ZSM-5 at 295 K is show for cornparison (k).

Quantitative ' 9 ~ i MAS T=240 K
Calculated Fit
Component Curves
' H-'~s i CF T=230 K
20 ms Contact Time
1 I 1 1 1 I I 1 1 1 1 1 1 1 I 1 1 I 1 1
-109 -1 1 1 - 1 13 -1 15 -1 17
pprn from TMS
' 9 ~ - 2 9 ~ i CP
Figure 6.8 MAS NMR spectra of the low-loaded pdifiuorobenzene / ZSM-5 compiex. (a) Quantitative 2 9 ~ i MAS spectnim and fit obtained (b) by deconvolution in tenns of individual Lorentzian curves (c). CP MAS spectni obtained using 20 ms cross polarization from: 'H (d), and "F (e). The temperatures and tentative assignments of the resonances to specific T-sites are indicated.
1
I
T=235 K 1 20 ms Contact Time
1 O i~ 8
ray diffraction experiments (see Chapter 7). Although the framework symmetq at low
temperatures is the same as that observed for empty ZSM-5, thep-difluorobenzene moIecules
remain inside the ZSM-5 framework dunng and after the phase transition. This was confirmed by
successful polarization transfer from 'H and ' 9 ~ in Cl? experiments (see below).
63.2 INADEQUATE Experimenl
It is essential to know the assignments of the diflerent "si resonances to specific T-sites
if information about the positions of guest molecules within zeolites is to be obtained using NMR
techniques based on the dipolar interactions between the sorbed molecules and the silicon atoms
in the framework. In order to assign the resonances in the 2 9 ~ i NMR spectra, a series of 2-D
MADEQUATE and 2-D CP-NADEQUATE experiments were perforrned at temperatures of
235 K, 245 K and 250 K. These temperatures were selected because the 1-D spectra showed at
least 17 well resolved resonances, sorne of which had chemical shifts that changed considerably
between these temperatures. It was thought that 2-D spectra obtained at these three temperatures
would provide the best possible chance of achieving a cornplete assignment. However, due to the
variation in the relaxation times induced by spinning with nitrogen gas, good quality
MADEQUATE spectra were only obtained at 245 K when air was used. A contour plot of the
CP INADEQUATE acquired at 245 K is presented in Figure 6.9.
The monocl inic phase of ZSM-5 having P2,/n. 1.1 symmetry contains 24
crystallographicaIly inequivalent T-sites, and thus represents one of the most compiicated of the
known zeolite frameworks. The connectivity list for the T-sites (based on the single crystal
structure'") is given in Table F. 1 (Appendix F). 48 different 2 9 ~ i - " ~ i connectivities are present
and should theoreticaIly be observed in a 2-D [NADEQUATE spectnirn. However, there are no
self-connectivities, and even when the second coordination sphere of T-atoms (ignoring oxygens)
is considered, no T-site has a unique connectivity pattern, This makes it difficult to find a
suitable starting point to rnake the assignment.

Figure 6.9 Contour plot of a CP-MADEQUATE experiment on ZSM-5 loaded with 4 molecules/u.c. ofp-difluorobenzene at 245 K with a 1-D 'H-'~s~ CP MAS spectrum above. 48 experirnents with 1 120 scans in each experiment were carried out using a recycle delay of 3 s for a total experiment tirne of ca. 48 h. A spectral width of 1000 Hz, contact tirne of 35 ms, fwed delay of 16 ms and 256 real data points were used. Sine-bel1 apodization and a power calculation were used for the data processing.

Due to the close similarities between the "si MAS NMR spectrum of the empty
(monoclinic) ZSM-5 (for which a complete assignment has been published26) and that observed
for the pdifluorobenzene / ZSM-5 complex at Iow temperatures, it was felt that the previous
assignment provided a good starting point. Assuming that the differences between the T-sites
would be maintained in the low-temperature rnonoclinic forrn, the lowest field resonance (at ca.
-1 09.5 ppm) was tentatively assigned to Si-2 1, and the highest field resonance at eu- - 1 17.1 ppm,
to Si-8.
From these starting points a partial assignment of the spectrum was possible (Figure 6.9).
The assignment is self consistent but incomplete because there is considerabte peak overlap in
the center region of the 1-D spectnim. There is good interna1 consistency in the assignment of the
best resolved peaks ( ie . the highest and lowest-field resonances), and al1 of the expected
connectivities between these sites are clearly observed. For example Si-5 is connected to Si- I I ,
which is connected to Si-IO, and silicons 8, 10 and 21 are al1 connected to Si-9 as expected from
the framework connectivities. At the present time this assignment is thought to be correct.
An important difference from the empty monoclinic ZSM-5 at 300 K, is the interchange
of the resonances assigned to Si- 14 and Si- 1 6; at 245 K silicon 14 is to high field of Si- 16 in the
"si MAS NMR spectrum of thep-difluorobenzene 1 ZSM-5 complex. The silicons in four-
membered rings (T-sites 9, 10,S 1 and 22) are expected to occur at lower field based on
correlations between ' 9 ~ i chemical shifts and the geometrical parameters such as Si-O-Si bond
angles and Si-Si distances?' For the resonances which have been assigned, there is also a
reasonable correlation between the 2 9 ~ i chemical s h i h and the mean Si-Si distances which
supports the correctness of the assignrnent?
6 3 3 'H-~'s~ Cross Polarization Experiments
Figure 6.8(d) shows 'H-"s~ CP MAS spectrum of the low-loaded pdifluorobenzene /
ZSM-5 complex obtained using a 20 ms contact time at 230 K. Comparison with the quantitative

% MAS NMR spectrum (Figure 6.8(a)) reveals that the intensities of the resonances in the CP
spectrum are no longer equal. For example, the signals for silicons 1 1 and 14 are almost twice as
intense as for Si- 16. Also at 230 K, the resonances assigned to Si- I O and Si-23 overlap with other
peaks and thus there are only six well resolved resonances. A series of CP experirnents were
acquired as a function of the contact time, and deconvoluted in terms of 18 individual Lorentzian
curves. Figure 6.10 shows a plot of the intensities of the 6 outermost (best resolved) T-sites as a
function of the contact time. The different T-sites seem to be divided into three groups. Silicons
2 1 and 5 show the most rapid intensity increase as a fùnction of contact time and are thus the
most efficiently polarized, while Si- 1 1. Si- 14 and Si-8 show less efficient polan'zation. and Si- 1 6
shows quite ineficient polarization. From this behavior it is cIear that silicons 2 1 and 5 are
closer io the 'H polarization source than silicons 1 1, 14 and 8, while Si-16 is relatively far €rom
any 'H nuclei. Si-16 is located in the zig-zag channel while those silicons with largest
polarization following CP are in the straight channel. Because the 'H nuciei used as the source of
the polarization are on the aromatic rings, the p-difluorobenzene rnolecules must be Iocated
somewhere within the straight channels.
The TCP values determined fiom nonlinear least squares regression analysis of this data
to Eq. 3.15 (with T~,('H) held constant at 1 10 ms) are listed in Table 6.2. Silicons which have
protons in close proximity will have the srnaller TCP values than those which are far from the
sorbate. The CP curves calculated using these time constants are overlaid on the experimental
data in Figure 6.10. Using these TCp values and assuming a static sorbate molecuIe, the best
solution found from analysis with the program CPF9.PAS had a correlation coefficient, @, of
0.99 1, with a dope of 3 .O92 x 1 0 -', and a y-intercept of 45.9 1. The second moments calculated
for this solution are listed in Table 6.2, and the parameten defining the translations and rotations
applied are given in Table 6.3. Figure 6.1 I(a) shows the highly linear correlation found between
the experimental l/Tcp values and the (static) second moments calculated for this solution.

lntensity (arb. units
20 40 60 Contact Time (ms)
Figure 6.10 Intensities of the 'H-'~s~ CP MAS NMR signals as a function of the contact time at 230 K for ZSM-5 loaded with Ca. 4 molecules ofpdifluorobenzene per u.c. The curves were obtained from nonlinear least squares fitting of the data to Eq. 3.15 with T~J'H) fixed at 1 10 ms.
Table 6.2 Experimental and calculated parameters related to the 'H- '~s~ cross polarization experiments on the low-loaded p-difluorobenzene / ZSM-5 cornplex at 230 K.
Chernical Shift
( P P ~ " ' TCP (rn~) '~) s tat ic"'
'a' Referenced to TMS. 'b'~alculated using nonlinear Ieast squares fitting to Eq. 3.15 with T,,('H) fixed at 1 1 O ms. 'c'Calculated using Si-H distances up to 8 A for the sorbate locations described by the translations and rotations given in Table 6.3.

Table 6 3 Results of fitting cross polarization data for the low-loaded pdi fluorobenzene / ZSM- 5 cornplex at Iow temperature.
"' Y avis intercept. "' Translations along the a (a), b (AY). or c (U) axes from the chosen starting position at the channel intersection in centre of straight channel (10.0535 A, 4.96941 A, -0.058 1 1 A). "' Euler angles defining rotation fiom starting orientation with aromatic ring in the x-y plane, and F-F axis paraltel to b auis.
Parmeter
Calculation Type
Temperature (K)
Numbet of Points
k
Slope
~ntercept"'
AX (A)'b'
AY (A)'b'
AZ (A)lb'
$ (OP 0 (o)(~)
W (O)"'
' 9 ~ - ' 9 ~ i Cp
Static
23 5
7
0.962
3.908 x IO-^
54.79
0.0
-0.4
-0.4
-40
O
40
'H-"s~ CP
Static
230
6
0.99 1
3.092 x IO-'
45-9 1
-0.3
0 .O
-0.4
-40
-40
-25
180" Ring Flips
230
6
0.966
5.483 x 10⁴
45 -24
-0.2
O. 1
-0.5
-60
-40
-20

Calculated Second Moment (H&
O 1 O000 20000 30000 40000
Calculated Second Moment ( ~ 2 )
Figure 6.11 Best linear fits of l/Tcp us. calcuiated M~('H-'~s~) values found fiom analysis of the 'H-'~s~ CP MAS data recorded at 230 K assuming the pdifluorobenzene molecules were static (a), or undergoing 180' ring-flips about the F-F axis (b). See Table 6.3 for parameters.

The rnolecule was found to be shifted slightly from the center of the straight channel(0.3
A along [IO01 and 0.4 A along [O011 ) and was oriented so that the plane of the aromatic ring was
almost parallel to the major a i s of the elliptically distorted IO-ring (Figure 6.12). The molecule
was also twisted slightly away from the b axis. However, the most striking difference between
the orientation found from this anatysis and those reported for other sorbates in the straight
channels of ZSM-5, is the rotation of the ring by 40" so that the fluorine atoms point towards the
openings of the zig-zag channels rather than being paraIIel to [O 1 O] as can be clearly seen in
Figure 6.1 3(b). The fractional atornic coordinates for the sorbate atoms for this solution are listed
in Table F.2 (Appendix F). In this location Si-16 has only three 'H nuclei within an 8 A radius
sphere. and these are ail more than 7.1 A away. Conversely Si-21 has six protons within 8 A
three of which are cioser than 6 A, and Si-5 also has two protons closer than 4.6 A.
A possible reason why the molecules adopt this orientation within the channels is to
minimize the repulsive fluorine-fluorine and fluorine- oxygen interactions. Considering the
orientations which are permitted by steric restriction between the sorbate and frarnework atoms.
the fluorine-fluorine distances have been maximized. For the best solution found, the distance
between F atoms on adjacent rings in the straight channel is 10.0 A, and the closest F-F distance
between molecules in neighbouring channels is 8.3 1 A. This arrangement may also explain why
loadings of more than 4 molecule/u.c. were not obtained at ambient temperature and pressure,
even when excess p-difluorobenzene was used. If more than 4 molecules/u.c. were present, some
moIecules wouid need to be in the zig-zag channels, and this would prevent the molecules in the
straight channels from having their fluorine atoms near the openings of the zig-zag channels.
When 180" ring-fiips about the F-F axis were included in the 'H-'~s~ heteronuclear
second moment calculations, the best solution (R' = 0.966) had very sirnilar location and
orientation of the p-difluorobenzene as seen from a comparison of the parameters for the two
solutions listed in Table 6.3. The correlation obtained for the l/Tcp vs. Mz in this case is shown in
Figure 6.1 1 (b), which again does not pass through the origin. For this solution, the closest F-F

0 Carbon
O Fluorine
Hydrogen
Figure 6.12 View dowii [O101 showing location and orientation ofp-difluorobenmne in ZSM-5 found froin fining of 'H-"si cross polariuition data at 230 K.

Figure 6.13 Location and orientation of the pdifluorobenzene molecuIes in ZSM-5 found from analysis of 'H-">si CP data acquired at 230 K: Views along the straight channel (a), and into the zigzag channel (b) show the spatial relationship of the sorbate atoms to the different Si atoms (T-sites).
distances between molecules in the same channel and those in adjacent channels are 10.2 A and
8.1 A respectively.
Figures 6.13 shows views down the straight channel and into the zig-zag channel for the
orientation and location found from the fitting assuming stationary molecules. In these figures,
the proximity of the sorbate protons the different T-sites is seen. There are no ' H nuclei close to
Si- 16, while silicons 2 1 and 5 have several protons in close proximity, as expected from the
genera1 qualitative trends in the CP intensities as a function of contact time.
The regession lines found in these experiments had large y-intercepts which from the
previous work on the p-xylene / ZSM-5 systems, probably indicates that the pdifluorobenzene
molecules are still undergoing some slow diffusion along the channels on the time scaIe of the
CP experiments at 230 K. Furthemore, the reliability of the assignment of the %i resonances
from the NADEQUATE experiments is not confirmed at the present time, and only six from the
possible 24 T-sites were included in the analysis. For these reasons the location and orientation
found from fitting of the 'H-"si CP data at 230 K should be viewed as tentative, and preliminary
at this time.
As a check of the location found from the 'H-'~s~, a series of 'F- '~S~ variable contact
time experiments were also perfomed at low temperatures. These results are presented in the
next section.
6.3.4 ' 9 ~ - 2 9 ~ i Cross PolarUation Experiments
Sarnples of purely siliceous ZSM-5 containing ca. 4 moIecules/u.c. p-difluorobenzene-dJ
were used for the I 9 ~ 3 i cross polarizat ion experiments to avoid possible complications from
'H-'~F dipolar interactions. Variable contact time CP experiments were performed at 235 K, 240
K. 245 K and 250 K. Figure 6.9(e) shows a 19~-19si CP MAS spectrum obtained using a 20 ms
contact time at 235 K. Again the peak assigned to Si-16 shows reiatively low intensity, and is
thus far from the "F nuclei. Conversely, the peak assigned to Si-8 is very intense, and Si-14 and

Si-2 1 are also relatively strong indicating that silicons in these T-sites rnust have ' 9 ~ nuclei in
close proximity. Because the resonance assigned to Si-23 is better separated than at 230 K. data
from this peak was also used.
Figure 6.14 shows a plot of the intensities of the 7 outennost (best resohed) T-sites as a
function of the contact tirne. Again. the different T-sites seem to be divided into three groups.
Silicon 8 shows the most rapid intensity increase as a function of contact time, Si- 16 shows
relatively inefficient polarization. and the other 5 silicons show intermediate degrees of
polarization transfer. From this behavior it is clear that the ' 9 ~ nuclei in the sorbate molecules are
close to S i-8. and that si1 icons 14 and 2 1 are also closer to fluorine atoms than the other silicons.
Again these observations are consistent with the pdifluorobenzene molecules being located
somewhere within the straight channel.
There is no obvious decay seen in the data up to the 55 ms contact time used, which
indicates that T, d i 9 ~ ) is quite long. The TCp values determined from nonlinear least squares
regression analysis of this data to Eq. 3.15 (with T , & ' ~ F ) held constant at 1800 ms) are listed in
Table 6.4. The CP curves calculated using these time constants are overlaid on the experimental
data in Figure 6.14, and although there is agreement between the calcuiated and experimental
data the fits are not as good as for the 'H- '~s~ CP data.
Using these TCP values and assurning a static sorbate rnolecule, the best solutions found
from analysis with the pmgram CPF9.PAS had R' = 0.962, a dope of 3.908 x I O ". and a-v-
intercept of 54.79 (Figure 6.15). In this case there was a family of solutions having the sarne
parameters for the correlations. For al1 of these solutions the ring centroid was shifted from the
center of the straight (by 0.4 A along [O IO] and 0.4 A down [O0 11) but different rotational angles
were found. This is precisely the behavior expected because any orientation of the aromatic ring
plane about the F-F a i s will leave the Si-F distances (and hence the I9~-I9si heteronuclear
second moments) unchanged.

1 1
20 40 Contact Time (ms)
Figure 6.14 Intensities of the I9F-l9si CP MAS NMR signals as a function of the contact time at 235 K for the ZSM-5 loaded with ca, 4 molecules ofpdifluorobenzene-d4 per U.C.
The curves were obtained fiom nonlinear ieast squares fitting of the data to Eq. 3.15 with T~,,('~F) fixed at 1800 ms.
O 2000 4000 6000 8000 IO000 12000 14000 Calculated Second Moment ( ~ 2 )
19 29 Figure 6.15 Best linear fit of UTcp vs. calculated M2( F- Si) values found frorn anaIysis of the 1 9 ~ - 2 g ~ i CP MAS data recorded at 235 K. See Table 6.3 for parameters.

Table 6.4 Experimental and calculated parameters related tu the ' 9 ~ - ' 9 ~ i cross polarization experiments on the low-Ioaded p-difluorobenzene / ZSM-5 cornplex at 235 K.
with T,,('~F) fixed at 1800 ms. 'c'~a~culated using Si-F distances up to 8 A for translations and rotations given in Table 6.3.
T-site
Si 21
Si 5
Si 23
Si I I
Si 16
Si 14
Si 8
'"' Referenced to TMS. 'b'~alculated using nonlinear least squares fitting <O Eq. 3.15
M~( '~F-I~S i) (HZ')
tat tic"'
12 134
II194
9424
8722
2846
t 1441
12758
Chemical Shift
( P P ~ " '
- 109.5
-1 10.8
-1 14.5
-1 15.0
-1 15.2
-1 16.1
-1 17.1
TCp (msfb'
9.674
10.248
10.34 1
11.149
1 5.566
10.27 1
9.766

However, as seen from comparison of the translation and rotation parameters in Table
6.3, this solution corresponds to a position and orientation of the organic molecules which is
significantly different from those found for the 'H-'~S~ CP data The molecule has the fluorine-
fluorine a i s parallel with the srraight channel as shown in Figure 6.16. This position and
orientation is very similar to those found for the two other Iow-toaded sorbate / ZSM-5
complexes whose structures are known."' When the sorbates are at this location. the fluorine-
fluorine distances between adjacent molecules in straight channel is reduced to 5.7 A. The
closest F-F distance behveen fluorines in neighbouring channels is 1 1.7 A. Table 6.4 summarizes
the second moments caIculated for one of these (equivalent) soIutions, and the fractional atomic
coordinates for the sorbate atoms are listed in Table F.3 (Appendix F).
As seen from Figure 6.15, the large y-intercept and lower l? are a primarily due to the
large displacements seen for the Si-10 and Si-16 from the overall correlation trend. This may be a
result of the overlap of the resonance corresponding to Si4 O with another peak, which would
affect the intensity deterrnined from curve fitting since there may have been a significant
contribution from the next (unassigned) resonance and the TCP value obtained would be incorrect.
Slow diffusion occurring on the time scale of tens of milliseconds will also affect the CP
experiments. and the large y-intercepts tend to indicate that such motions are present.
Another possibility is that there are too few ' 9 ~ nuclei to fulfill the assumptions of
19 19 adequate (strong) F- F dipolar interactions (which mean that the fluorines can be treated as a
large spin reservoir) required for Eq. 3.15 to be valid? In fact, there may be oscillatory behavior
in the variable contact time CP data which indicates the system might be more appropriately
described in tems of an &S spin system with Nsmall. In the case of the 'H-'~s~ CP experiments
this is less of a concern because the are more protons (twice the number of fluorines), and they
are much closer to one another.

Hydrogen O Carbon 0 Fluorine
Figure 6.16 View down [O 1 O] çhowing location and orientation ofp-difluorobenzene in ZSM-5 found froiii fitting of "F- cross polarization data at 235 K.

19 29 6.3.5 F- Si REDOR and TEDOR Experiments
A series of REDOR and TEDOR experiments were also perfonned at 240 K, and the
results indicate that both experiments are viable. However these were al1 affected by the variation
of the relaxation times caused by the gradua1 replacement of the oxygen gas in the sampIe by
nitrogen described above. In addition the positive y-interccpts found for the correlations beween
I/Tcp vs. the calculated heteronuciear second moments indicated that slow diffusions were still
occurring at 240 K which would also affect the REDOR and TEDOR experiments and they were
not analyzed in detaii.
Although the spin system could not be considered to be cornposed of completely isolated
19 F- '~S~ spin pairs. the low loading did minimize the number of dipolar "F-'~s~ interactions
within an 8 A radius of any of the T-sites. It was hoped that the positions and orientations found
for the p-difluorobenzene molecules from analysis of the cross polarization experiments could
provide a good starting mode1 of the spin-system as required for the multi-spin REDOR and
TEDOR calculations (see Chapter 3).
6.4 SUMMARY AND CONCLUSIONS
Loading ZSM-5 with 4 molecules ofp-difluorobenzene per unit ce11 caused the
framework to change from monoclinic ( P & h I . 1 symmetry, 24 T-sites) to a phase having 12 T-
sites at temperatures above ca. 293 K. From the appearance of the ' 9 ~ i MAS NMR spectra the
orthorhombic Pnma symmetry is proposed for this phase. This orthorhombic phase has been
reported previously for three other low-loaded, para-disubstituted aromatic / ZSM-5 complexes.
Loadings higher than 4 molecules/u.c. were not obtained for samples prepared with excess p-
difluorobenzene at ambient pressure and temperature.
Cooling the sample below 290 K resulted in a transformation back to a phase having 24
T-sites, which was maintained to the lowest temperature accessible (2 1 5 K). The ' 9 ~ i NMR
chernical shifts observed for this phase indicated that it was almost identical to the monoclinic

PZl/n. 1.1 phase adopted by the ernpty ZSM-5 fiamework at temperatures below ca. 340 K. The
success of 'H- '~s~ and I9~-I9s polarkation ûansfer observed during Hartmann-Hahn CP
experiments provided unambiguous evidence that the sorbate molecules remained within the
ZSM-5 channel system during, and afier, this phase transition. It is anticipated that the
transformation to monoclinic symmetry for the ZSM-5 framework observed in the present case
may also occur in other sorbate / ZSM-5 systems at low temperatures.
The general location of the sorbedp-difluorobenzene molecules was determined to be in
the straight channels at the intersection with the sinusoidal channels. However, the precise
position and orientation could not be unambiguously determined frorn these initial studies. Two
different orientations were found from analysis of the 'H-'~s~ and ' 9 ~ - ' 9 ~ i CP MAS NMR data.
Fitting of the 'H-'~S~ CP data acquired at 230 K yielded a very good linear correlation for the
experimental I/Tcp values versus the calculated 'H-'~s~ heteronuclear second moments when the
p-difluorobenzene molecules were oriented so that the fluorine atoms were pointing towards the
openings of the zig-zag channels and the plane of the aromatic ring was at an angle which
corresponded closely to the longest cross-channel dimension of the straight channel. A much
poorer linear correlation was obtained frorn calculations utilizing the l9~-l9si CP data acquired at
235 K, with the best solution(s) found when the fluorine-fluorine axis was parallel to [O1 O]. This
orientation is in accord with that previously observed for the other low-Ioaded ZSM-5 / sorbate
complexes. Unfortunately, the ' 9 ~ - 2 9 ~ i experiments cannot provide any information about the
orientation of the plane of the aromatic ring relative to the crystallographic axes. This is because
the ring can rotate fieely about the F-F axis without affecting the F-Si distances. In both cases the
molecule centroid was shified slightly from the center of the straight channel.
When sorbate molecuks are present the IO-rings defining the channels containing the
sorbate distort to become more elliptical, presumably in order to better accommodate the guest
molecules.""' In the present work, as in most of the previous investigations to determine
preferred sorption sites of guests in the zeol ite channel systems from theoretical calcu lations ( cg .
energy rninimizations), the framework geometry was selected and kept rigid. However the
precise geornetry of the framework (and the channel shapes) is known to vary with different
sorbates,"" and the chosen fi-arnework geometry may not accurately reflect the real structure.
which rnay affect the exact position and orientation foound for the sorbed molecules.
Additional 2-D NADEQUATE experirnents are required (including several at different
temperatures) in order to assign al1 of the resonances in the "si MAS NMR spectra. and in
addition. these preliminary results indicate that experiments need to be done at Iower
temperatures to slow the rate of the diffusions within the channels.
Detailed investigations of powder X-ray data and 19si MAS NMR data are invaluable
aids to detennining the possible symmetry, number of crystallograpically inequivalent T-sites.
and space group, as well as the temperature and loadings at which any changes occur, and if
possible should be obtained prior to single crystal studies.
Recent NMR investigations of the Iow-loaded p-xylene / ZSM-5 corn plex have been
utilized to predict the sorbate location and orientation," and the solution found to correspond
closely to that determined by the subsequent single crystal XRD structure determination (Chapter
8), thus proving the feasibility, and reliability of these NMR techniques to accurately locate the
guests within the channels of zeolites. In the next chapter, the results of the preliminary powder
X-ray diffraction studies undertaken to verie the space group symmetries and unit cell
parameters of the hvo phases observed for the low-loaded p-difluorobenzene in ZSM-5 are
presen ted .

REFERENCES FOR CHAPTER 6
1 Venuto, P. Microporous Mater. 1994,2,297.
2 Moscou. L. in introduction to ZeoZite Science and Practice van Bekkum, H.; Flanigen. E.M : Jansen, J-C. (Eds.) Chapter 2. Elsevier Amsterdam, 199 1.
3 van Koningveld, H.: Tuinstra. F.; van Bekkum, H.; Jansen. J.C. Acta Cryst. 1989. B45,423.
J van Koningsveld, H.: Jansen. I.C.: van Bekkum, H. Acta Cryst- 1996, B52, 140.
5 van Koningsveld, H.: Jansen, J-C.; de Man, A.J.M. Acta Cryst. 1996, B52, 13 1.
6 Reck, G.; Marlow, F.; Komatowski, J.; Hill, W.; Caro, J. J. C'hem. Phys. 1996, 100, 1698.
7 van Koningsveld, H.; Koegle. J.H. Microporous Mater. 1997,9,7 1.
8 van Koningsveld, H.; Jansen, J-C. Mcroporous Muter. 1996,6, 159.
9 Single crystal XRD structure of low-loaded p-xylene / ZSM-5 cornplex. See Chapter 8.
10 Reischrnan, P.T.; Schmitt, K.D.; Olson, D.H. J. Phys. Chem. 1988,92,5 165.
I I Cheetham, A.K.; Bull, L.M. Catal. Lett.1992, 13,267.
12 Bell, R.G.; Lewis, D. W.; V o i s P.; Freeman, C.M.; Thomas, LM.; Catlow, C.R.A. Sfud- S t d Sci. Catul. 1994,84.2075.
13 Gies. H.; Marier, B.: Fyfe, C.A.; Kokotailo, G.T.: Feng, Y .; Cox, D.E. J. Phys. Cltem. Solids. 1991, 152, 1235.
14 Kokotailo, G.T.: Lawton. S.L.; Olson, D.H.; Meier, W.M. Nmure 1978,272,437438.
1.5 Wu, E.L.; Lawon. S.L.; Olson, D.H.; Rohrman, A.C., Kokotailo, G.T. J: Chem. Phys. 1979, 83.2777.
16 van Koningsveld, H.; van Bekkum, H.; Jansen, J-C. Acta Crysr. 1987. B43, 127.
17 van Koningsveld, H. Acta C y f - 1990, B46, 73 1.
18 van Koningsveld, H.; Jansen, J-C.; van Bekkum, H. ZeoZites 1990,10,235.
19 Fyfe. C.A.; Kennedy, G.J., Deschutter, C.T.; Kokotailo, G.T. J: Chem, Soc., Chem. Commun. 1984,54 1.
-70 Fyfe, C.A.; Strobl, H.; Gies, H.; Kokotailo, G.T. Cm. J: Chem. . 1988,66, 1942.
I I Fyfe. C.A.; Strobl, H.; Kokotailo, G.T.; Kennedy, G.J.; Barlow, G.E.;J. Am. Chem. Soc. 1988,110,3373.

22 Fyfe, C.A.; Kokotailo, G.T.; Strobl, H.; Gies, H.; Kennedy, G.J.; Pasztor, C.T.: Barlow, G.E. in Zeolites as Catalysts. Sorbents and Detergent Builders. p. 827. Karge, H.G.; Weitkamp, J. Eds. Elsevier, 1989.
23 OIson, D.H.; Kokotailo. G.T.; Lawton, S.L.; Meier, W.M.J. Phys. Chem. 1991,85,2239.
24 Price, G.D.: Piuth. J.J.; Smith, J.V.; Bennett, J.M.; Patton, R.L. J. Am. Chem. Soc. 1982, 104, 5
25 Chao, K-J.: Lin. J-C.: Wang, Y.: Lee, G.H. Zeolites. 1986,6,35.
26 Fyfe. C.A.: Grondey, H.; Feng, Y,; Kokotailo. G.T. J. Am. Chem. Soc., 1990, 112, 8812.
27 West, G.W.Aust. J. Chenz. 1984.37.455.
28 Engelhardt. G.. Michel. D. Un pub1 ished results reported in High-Resolrrrion Solid-State NIMR of Silicmes and Zeolites, John Wiley and Sons, I987,3 13.
29 Mentzen. B.F: Vigné-Maeder, F. Mat. Res. Bull- 1987,22,309.
30 Mentzen, B.F: Bosselet, F. Mat. Res. Btrll. 1988,23,227.
3 1 Mentzen. B.F; Sacerdote-Peronnet, M. Mut. Res. Bu[[- 1993,28. 1 16 1.
32 Mentzen, B.F.; Sacerdote-Peronnet, M.; Bérar, J-F.; Lefebvre, F. Zeolites 1993, 13,485.
33 Klein H.; Fuess. H.: Ernst. S.; Weitkamp, J. Microporous Muter. 1994. 3.291.
34 Mentzen. B-F Mat. Res. Bull. 1987,22,337.
35 Sacerdote-Peronnet, M.; Mentzen, B.F. Mat, Res. Bull. 1993,28,767.
36 Mentzen, B.F; Favre, R.; Cauwet F. Mat. Res. Bull. 1994, 29, 587.
37 Fyfe. C.A.; Feng. Y.: Grondey. H. Microporous Mater. 1993,I. 393.
38 Feng, Y. Ph.D. Thesis, The University of British Columbia, 199 1.
39 Kennedy, G. J. Ph.D. Thesis University of Guelph, 1985.
40 Strobl, H. Ph-D. Thesis University of GueIph, 199 1.
41 Fyfe,C.A.; Gies, H.: Kokotailo, G.T.; Pasztor, C.T.; Strobl, H.;Co'c, D.E.J. Am. Chern. Soc. 1989,11 1,2470.
42 Fyfe, C.A.; Strobl, H.; Kokotailo, G.T.; Kennedy, G.J .; Barlow, G.E. J. Am. Chem. Soc. 1988, 110,3373.
43 High-Resolution Solid-Stafe NA4R of Silicates and Zeolites. Engelhardt, G., Michel, D., John Wiley and Sons, 1987.
44 Smith, J.V.; Blackwell, CS. Natztre, 1983,303,223.

45 Grimmer, A.R.; Radeglia, R. Chetn. Phys. Lett., 1984, 106,262.
46 Fvfe. C.A.; Strobl. H.; Kokotailo. G.T.: Pasztor, C.T.; Barlow, G.E.; Bradley, S. Zeofites, 1988,8. 132.
47 Thomas, J.M.: Klinowski, J.; Rammdas, S.; Hunter, B.K.; Teenakoon, D.T.B. Chem. Phys. Lett. 1983, 102. 158.
48 Ramdas. S.; Klinowski. J. Nature 1984,308, 52 1.
49 Engelhardt, G.; Radeglia, R. Chrm. Phys. Lett. 1984, 108,271.
50 Derouane, E.G.: Hubert, R.A, Chem. Phys. Lett. 1986,132,3 15.
51 Engelhardt, G.; van Koningsveld, H. Zeolites, 1990, 10,650.
52 Modelling of Sfrzrctures and Reactivity in Zeolites. Catlow, C.R.A., Ed. Academeic Press: London, 1992.
53 Pickett. S.D.: Nowak, A.K.; Cheetham, A-K.; Thomas, J.M. Mofec, Sirnul. 1989,2,353.
54 Freeman, C.M.; Catlow, C.R.A.; Thomas, J.M.; Brode, S. Chem. Phys, Lett. 1991, 186. 137.
55 Smit, B.; Maesen. T.L.M. Nature, 1995,374,42.
56 Bosselet. F.; Sacerdote. M.; Bouix, J.: Mentzen, B.F. Mat. Res. Bull. 1990,25,443.
57 Fvfe. C.A. Diaz, A C ; Lewis. A.R.: Chézeau, J-M.; Grondey, H.; Kokotailo, G.T. in Solid- Staie NMR Spectroscopy of Inorgunic Materiais. Fitzgerald, J . J. ( Ed. ) A CS Symposium Series. In Press.
58 Diaz A.C., Fyfe, C.A. Unpublished Results, University of British Columbia, Canada.
59 I-D WIN-NMR Bruker-Franzen Analytik GmBH, Bremen, Germany. 1 996.
60 (a) McDonald, R.S.: Wilks, P.A. Appl. Spectroscopy. 1988,43, 15 1. (b) Davies, A.N.: Lampen, P. @pl. Spectroscopy. 1993,47, 1093,
61 Grams-386, Galactic Industries Corporation, 395 Main Street, Salem. NH 03079, U.S.A.
62 Wolfram, S. The Mathematka Book. Third Edition. Cambridge University Press, 1996.
63 Michel, J.; Drifford, M.; Rigney, P.J. Chim. Phys. 1970, 67,3 1.
64 International Tables for Crystallugraphy Volume A. Hahn, T. (Ed.); Kluwer Academ ic Publishers, Dordrecht, 1993.
65 Ortep3 for Windows, Johnson, C.K.; Bumeît, MN.; Fanugia, L.J. Department of Chernistry, University of Glasgow, U.K. 1998. http://www.chem.gla.ac.uk/-touis/ortep3/
66 Platon98 for W i h v s , Speck, A.L; Farrugia, L.J. Department of Chernistry, University of Glasgow, U.K. 1998. http://www.chem.gla.ac.uk/-louis/piaton97/
67 Voelkel, R. Angew. Chem. Int. Ed. Engl. 1988,27, 1468.
CHAPTER 7
PRELIMINARY POWDER X-RAY DIFFRACTION
INVESTIGATIONS OF THE LOW-LOADED PARA-
DIFLUOROBENZENE / ZSM-5 COMPLEX
7.1 INTRODUCTION
As discussed in Chapter 6, single crystal diffraction experirnents (where feasible) would
provide an incisive check on the correctness of guest-host structures predicted by NMR. Powder
diffraction data acquired with both synchrotron and conventional X-ray sources has provided
information about the unit ceII parameters, framework symmetry, and phase transitions in ZSM-
5!.2 In a few cases, the location and orientation of sorbed guest species within the hmework
channels have been proposed from fitting of powder diffraction data." However, although
refinement of these structures is possible, the small arnount of literature data indicate that these
are very complex systems. X-ray diffraction studies were initiated for the low-loaded p-
difluorobenzene I ZSM-5 complex and the progress to date is presented in this chapter.
"si MAS NMR can provide complementary information such as the number of T-sites
which greatly assists the space group determinati~n.'-'~ Details of the MF1 framework structure,
and previous investigations of the guest- and temperature-induced changes in the Framework by
X-ray powder diffraction and ' 9 ~ i MAS NMR are discussed in Chapter 6.
For the ZSM-5 / sorbate systems where changes are seen, the lattice distortions seem to
be reasonably characteristic of the nature of the sorbed mo~ecule.~-" In some cases however, very
similar "si MAS NMR spectra are obtained with different molecules, indicating that the lattice

geometries are closely related." It may be that the Iocations of the molecules in these cases are
similar, but this has only been verified for three systems to date (including the low-loaded form
ofp-xylene in ZSM-5 described in Chapter 8)."IX
As-synthesized ZSM-5 has Pnma symmetry (12 s si tes),'^.^^ which is transformed to
monoclinic symmetry following calcination to remove the templating species.'." Loading the
calcined (empty) ZSM-5 framework with more than two, but less than four, molecules ofp-
xylene per unit ce11 (u.c.) bnngs about a transformation from monoclinic P21/n. 1.1 (with 24 T-
sites) to orthorhombic Pnma symmetry."" The symmetry of the empty frarnework also changes
to Pnma symmetry at temperatures above about 340 K? Increasing the loading to between 6
and 8 molecuIes/u.c. induces a further change to P2,2/2[ symrnetry which bas 24 inequivalent T-
sites.f4.x These transformations are reversible, and sorbates other than p-xylene may induce
simiIar structural transformation^.'-^^
Figure 7. [(a) shows a view along the zig-zag channel of the orthorhombic (Pnma) phase
of ZSM-5. For the empty ZSM-5 frarnework, the srnaIl increase in the cell angle (typically from
90" to 90.3-90.7O) changes the shape of the unit cell. This results in the removaI of the symmetry
elements such as the mirror planes parallel to the b axis which bisect the sinusoidal channel in
the orthorhornbic phase (Figures 7.1 (a) and (c)). The change to monoclinic symmetry is also
associated with small displacive transformations of the frarnework atoms, although the
fiamework topology is maintained.
Overall, the X-ray diffraction patterns of the orthorhombic and monoclinic phases are
quite similar. However there are small (but characteristic) differences which can be detected
provided the samples are of high crystallinity. When the ce11 angIes are al1 90" (as is the case for
orthorhombic symmetry), certain reflections will overlap. For exarnple, the reflections with
Miller indices (h k Z) of (-3 1 3) and (3 1 3) are coincident and occur at approximately 2 4 . 4 O 20 in
the orthorhornbic phase (a 2 20.1 A, b r 19.9 A, c = 13.3 A). When P becomes larger than 90"
(rnonoclinic P1.Z1/n. 1 phase), these refiections are no Ionger equivalent, and they are observed

Figure 7.1 View along the zig-zag channels o f ZSM-5 for structures having different symmetries: (a) orthorhombic Pnma symmetry, (b) monoclinic P247. I . I symmetry with domain twinning and ( c ) ideal monoclinic P2& 1.1 syrnmetry without twinning. The site o f the twin domains was estimated to be approximately 50 unit cells (CU. 1 O00 A)." Afier reference 21.

as independent peaks in the powder pattern at about 24.3" and 24.6" 20 respectively.'." Similar
behavior is seen for other pairs of reflections, with the most obviuus being those centered at Ca.
1 1.9O, 1 5S0 , and 28.5" 28. The separation of the diffraction peaks into these *'doublets" will
increase with increasing 28 and also as the deviation of the ceil angle from 90" becomes Iarger.
The observation of such "doublets" is usually taken as evidence that the sample has monoclinic
symmetryl
The presence of ordered guest species within the channels of the ZSM-5 has a relatively
small effect on the appearance of the powder XRD patterns, unless the loading is suficient to
bring about a change of symrnetry. The major differences between the patterns for the empty
h e w o r k and a sorbate-containing sample with the same overall symmetry are usually only
detected as smail changes in the relative intensities of the reflections below about 30" 28, and
may be associated with slight peak shifts due to changes in the ceIl dimensions. In general
however, these changes are significant (and measurable), particularly the intensity changes for
the lowest angle reflections due to the presence of sorbed organic guest.
For purely siliceous ZSM-5. both powder XRD and "si MAS NMR can be used to
distinguish between monocl inic and orthorhombic symmetry. However only NMR can be used to
determine whether the orthorhombic symmetry is Pnma or P212131 since the number of T-sites
and chernical shifts in the 19si MAS NMR spectra are diagnostic. Exceptions may anse if the
variations in the local framework geometry are not large enough to be observed in the NMR
spectnirn, or if the unique ce11 angle is very close to 90" in the monoclinic phase.
For the monoclinic phase, the single crystal X-ray ret'nement reported in the literature"
was performed using the non-standard setting P21/n. 1. I rather than PI.2,/n. I . The use of
?'&/ne 1.1 ensures that the straight channels are aligned along the b mis, rather than a, which
permits direct cornparisons with the orthorhombic structures. PZl/n. 1. I symmetry with ceIl
constants a = 20.107 A, b = 19.879 A, c = 13.369 & and a = 90.67O is equivalent to the standard
setting Pl.tl/n.I with a = 19.879 A, b = 20.107 A, c =I3 -369 A, and P= 90.67O.
An additional complication for the monoclinic phase is the (apparently intrinsic) domain
hvinning which was observed by van Koningsveld et ai. in their single crysta1 investigations of
calcined ZSM-5 at room temperature." They determined that the monoclinic phase consists of an
aggregate of monoclinic twin domains with domain sizes of the order of 1000 A. A
representation of the monoclinic framework structure in the presence of these twin domains is
reproduced in Figure 7.1 (b). An "ideal" single-domain monoclinic crystal without hvinning
present is shown in Figure 7.1(c) for comparison.
This chapter presents the results of preliminary X-ray diffraction studies on the Iow-
loaded p-difluorobenzene / ZSM-5 cornplex. Powder XRD data were collected on a ZSM-5
sample loaded with approximately four molecules ofp-difluorobenzenelu.~. at several
temperatures, and also for a sample of the empty (calcined) ZSM-5 at room temperature. The cell
constants and space group for calcined ZSM-5 are well established,'." and provided a check of
the analysis technique. before it was applied to fit the p-difluorobenzene 1 ZSM-5 data.
7.2 MATERIALS AND METHODS
7.2.1 Sample Preparation and Data Collection
Highly crystalline, purely siliceous ZSM-5 powder identical to that used for the NMR
experiments was calcined at 825 K immediately prior to use. AAer cooling to room temperature
it was loaded into 0.7 mm diarneter glass capillaries specifically designed for X-ray use. One
sample was sealed directly and a measured amount ofp-difluorobenzene (corresponding to 4
molecules/u.c.) was added to another before freezing in liquid nitrogen and flame sealing. These
samples are referred to as "calcined" and "DFB" respectively in the following discussion.
Powder XRD patterns were acquired with the assistance of Dr. Bemd Marler using a
Siemens D5000 system at the Institute of Mineralogy, Ruhr-Universitiit Bochum, Germany. The

diffractometer was operated in a modified Debye-Scherrer transmission geometry using
monochromatized Cu Ka radiation (h = 1 S40598 A) with a position sensitive detector. The
sealed capillary containing the sarnple was rotated to reduce preferred orientation effects and a
step-scanning mode was used to produce more accurate difiction line profiles.
For both the calcined ZSM-5 and the sample loaded with p-difluorobenzene, data were
recorded over the range 6.0-40.0° 28 with a step size of 0.007772" at room temperature (293 K).
Four individual scans (ca. six hours 1 scan) were CO-added to obtain the final powder patterns.
The difluorobenzene-containing sample was then cooled using a stream of cold air. The air was
cooled by passing it through a 0.5 m length of coiled copper tubing immersed in a vacuum dewar
filled with dry ice. The cold air was directed onto the capillary through an insulated transfer tube.
A series of scans over the range 2 1-27 " 20 (step size 0.007772" 20) were acquired at
approximately 1 O minute incrernents (ca. 1 minute scan time) dunng the cooling from room
temperature. Afier cooling for about one hour, the temperature of the air stream stabilized at
approximately 260 K and data (4 scans) were collected over the range 6.0-40.0" 28 (000777S0
steps).
The powder patterns were baseline corrected using the GRAMS-386 software package'6
and converted to ASCII-format files with the appropriate header information for the analysis
program.
7.2.2 Fitting of Reflection Data
Analyses and fitting of the XRD data were done using the AJUST program2' mnning on
an IBM-compatible PC with the MS DOS operating system. The program allowed selection of
the crystal system, as well as the reflection conditions to detine the space goup? The input file
contained information about the sample geometry (capillary), wavetength of the X-ray radiation
used, the 28 range (and step size), initial values for the various parameters which could be

optimized by the least squares Win& and "flags" for each parameter which indicated whether
the specific parameter was to be varied or held fixed dunng the refinement cycles.
The Voigt iùnction is a convolution of Lorentzian (L) and Gaussian (G) functions which
has been s h o w to describe the experirnental peak profiles in X-ray difiction data quite well."
Although an analytical form exists for the Voigt function, this is usually approximated as a
pseudo-Voigt function to reduce caIculation timeslg AJUST implements a pseudo-Voigt function
to mode1 the diffraction lineshapes with a weighted sum of the two lineshape functions L and G
described by Eq. 7.1.
pV= qL + (1 - q)G 7.1
Here q is the mixing parameter describing the weighting of the Gaussian and Lorentzian
contributions to the final peak profile. The full-widths at half-height for the diffraction (WL and
WG for the Lorentzian and Gaussian contibutions, respectively) have a dependence on the
7 7
scattering angle 8 which are modeled as:-.
and
WG = IV, tan9 + (w, COS^) 7.3
In addition to a zero correction (linear shift of a11 26 values), an asymrnetry function was
applied to the peaks up to 20" 20 to account for the diffractometer and sarnple-induced effects
(absorption, unfocussed X-ray beam, etc.). Up to 12 parameters were refined: the ce11 constants
(u, 6. c, and the unique angle ,8 if monoclinic symmetry was assumed), the lineshape
contributions (w,, w2, w ~ , w, and w,,), an asymmetry parameter, a zero correction, and a scale
factor to match observed and calculated intensities. The variable for transparency correction (to
account for absorption effects etc.) was fixed at 0.0 in al1 cases, and other cell angles were held
constant at 90". During the early stages of a refinement, sevenil of the parameten were held fixed
(e-g. Iineshape parameters) while the ce11 constants were refined. As the refinement proceeded
(and the R, decreased), the other variable parameters were progressively included in the fitting.
In the final cycles al1 of the parameters were refined.
The weighted pattern residual ('R' factor) R, used is defined in Eq. 7.4. R, provides a
numerical criterion for following the progress of the refinement as well as a measure of the
"goodness of fit" between the calculated and observed panems?)
Here y, is the intensity at the ith position in the profile, abs and calc refer to the observed and
calculated intensities respectively, and w, is the weight assigned to the intensity observed at the
ith step. A smaller value of R,$, indicates a smaller deviation between the observed and calculated
panerns, and a better "fit". From a purely mathematical point of view, R, is the most meaningful
of the possible R factors because the numerator is the residual being minimized, and thus it also
refiects the progress of the refinement."
7.3 RESULTS AND DISCUSSION
7.3.1 Phase Transitions on Cooling
The ' 9 ~ i MAS NMR spectra acquired in the investigations of purely siliceous ZSM-5
Ioaded with 4 molecules/u.c. ofp-difluorobenzene were presented in Chapter 6 , At temperatures
above 293 K a spectnim characteristic of orthorhombic Pnma symmetry with 12 resonances was
observed (Figures 6.7(a,b)). Below about 260 K, the appearance of the spectnim and chemical
shifts were very simitar, but not identical, to those seen for ernpty ZSM-5, which is known to be
monoclinic with P2,/n, 1.1 symmetry (Figures 6.7(g-j)). At intermediate temperatures, a mixture
of the two phases was detected (Figures 6.7(d-f)). The exact temperature of the (assumed)

orthorhombic to monoclinic transformation was found to depend on the precise sorbate loading,
but was completely reversible.
This phase transition for the DFB sample was foIIowed as the temperature was lowered
From room temperature by recording XRD powder patterns over the region 22.5" to 25.0" 20
every 10 minutes after cooling was initiated. This 28 range was chosen because it included the
region around 24.5" 20 where a characteristic monoclinic "doublet" should be clearly resoived if
lower temperatures induced a phase transformation from orthorhombic to monoclinic syrnrnetry
as predicted from the NMR studies.
Selected diffraction patterns obtained during this experiment are reproduced in Figure
7.2, Of particular interest is the number of peaks in the region from Ca. 24.2-24.7O 28. At 293 K a
single peak centered at 24.45' 20 was clearly seen (Figure 7.2(a)). AAer cooling for I O minutes
the appearance of the powder pattern changed considerably, and the doublet (peaks at 24.3O and
24.6" 20) expected for the monoclinic symmetry appeared (Figure 7.2(b)). In addition. a new
reflection centered at 23.J0 became visible. These observations indicated that the sample was a
mixture of two phases. There was certainly a temperature gradient across the sarnple, but this
was not the only reason for the coexistence of the two phases. Similar two-phase samples were
also detected in the NMR experiments where the temperature gradient was minirnized by holding
the sample at a constant temperature for an extended period of time. Also, in the NMR
investigations the temperature range studied was considerably larger (230-300 K), It was
therefore concluded that either the size of the individual crystals determined the temperature at
which the phase transformation occurred, or that domains of each syrnmetry were present within
individual crystals.
As the cooling continued, a general decrease in the intensities of reflections assigned to
the orthorhombic Pnma phase. and an associated increase in those for the monoclinic syrnmetry.
was observed. After cooling for 40 minutes the orthorhornbic reflections were no longer detected
(Figure 7.2(c)). The temperature of the air stream had sbbilized at 260 K by this time, and afier

DFB T=293 K
Orthorhombic Pnrna
(a) A - -
Cooled 10 minutes
Cooled 40 minutes
T = 260 K Monoclinic PI.21/n. 1
CALCiNED T=293 K
Monoclinic P1.2,/n. I
1 I l I I Ï 22.5 23 .O 23.5 24.0 24.5 25.0
Degrees 28
Figure 7.2 Powder X-ray diffraction patterns of ZSM-5 loaded with 4 molecules per unit ceIl of p-diflurobenzene (DFB) showing the transformation, (a) to (d), from orthorhombic (Pnma) to monoclinic (P1.&/n. 1) symrnetxy observed as the sample was cooled from 293 K to 260 K. The pattern for the calcined (empty) ZSM-5 at 293 K (monoclinic P1.2,/n. I syrnmety) is shown for comparison in (e).

allowing an additional 20 minutes for the sample to reach an equilibrium temperature, a series of
four scans over the range 6-40" 28 (step size 0.007772", CU- 6 hours / scan) were recorded.
Comparison of the patterns recorded for the DFB sample afier more than 40 minutes
cooling (Figure 7.2(d)), with that obtained for the calcined ZSM-5 at room temperature (Figure
7.2(e)), shows that the patterns are almost indistinguishable in the 22.5-25.0" 28 region. This
indicates that the DFB sample alrnost certainly has the same (rnonoclinic) symmetry as the ernpty
ZSM-5 at low-temperatures.
The powder patterns recorded over the ranges 7-0-40.0" 20 for the catcined (T=293 K),
and p-difluorobenzene loaded ZSM-5 (at T=293K and 260 K) are presented in Figure 7.3.
Inspection of these diffraction patterns reveals a direct correspondence between those recorded
for the calcined and low temperature difluorobenzene-Ioaded samples, again supporting the
rnonoclinic symrnetry postulated for the DFB sample at low temperatures fiom the "si MAS
NMR studies.
At room temperature, the absence of the "doublet" reflections at ca. 8S0, 24.4", and
28.5" 28 (as well as other differences) for the difluorobenzene-loaded sample, indicates that the
symmetry is orthorhombic. Because only 12 resonances are observed in the ' 9 ~ i NMR spectrum
above ca. 293 K, the framework symmetry may be unambiguously described as Pnma rather than
P3/7/2,. Theoretically, it is also possible that rnonoclinic symmetry is rnaintained, but that al1 of
the ce11 angles are 90' (or at least very close to 90"). However, such a change would essentially
make the framework virtually identical to that having truly orthorhombic symrnetry, and it would
be impossible to distinguish between these.
The fitting of the powder diffraction data for the calcined ZSM-5 and the DFB samples
recorded at 293 K and 260 K undertaken and to determine the ce11 constants, and veriQ the
symmetries of the two phases, is described in the following sections. For clarity the three
samples are discussed separately.
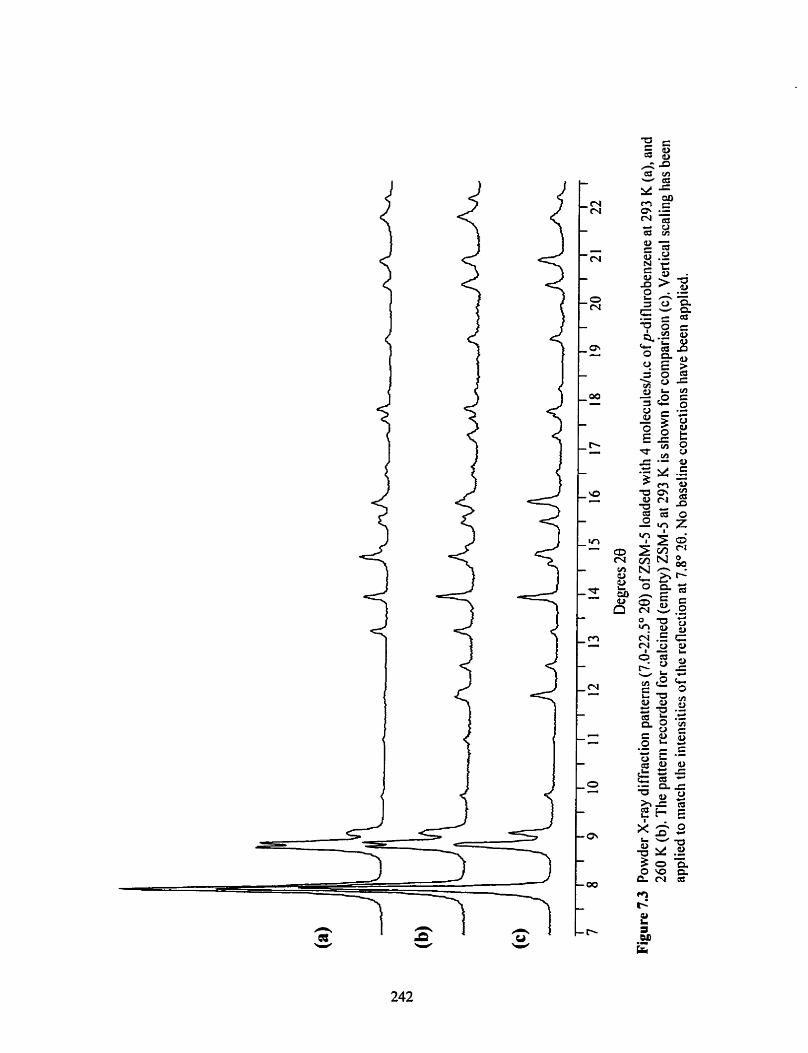
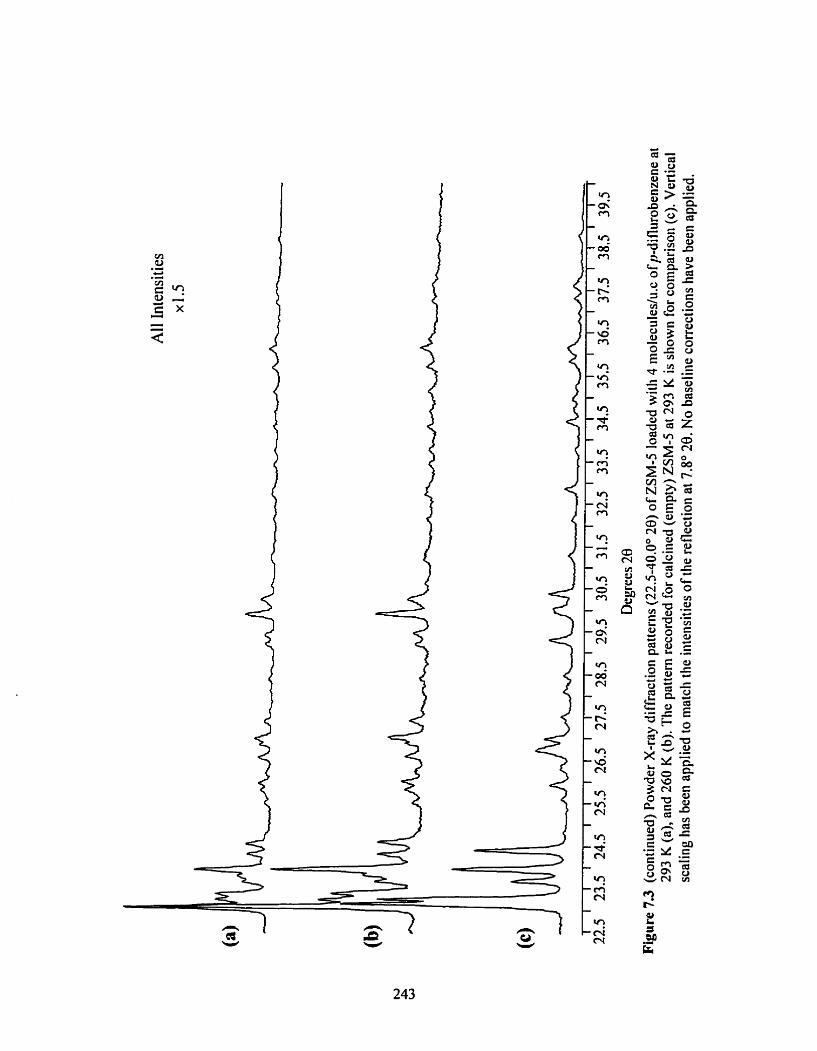

732 Ernpty ZSM-5 at 293 K
An ideal polycrystalline material or powder is an ensemble of a very large number of
randomly orientated crystals. The correct unit cell pararneters and information regarding the
possible space groups may not be always be readily deterrnined from a twinned single crystal."
In a powder sample however, each of the twin domains scatters the X-ray radiation slightly
differently, and effectively produces a "more random" orientation of the crystaltites. Such a
system will therefore approximate a "perfect" powder sample more closely. For these reasons,
the problems in data analysis of domain twinning which affect the single crystal data for the
monoclinic phase are avoided when powder X-ray diffraction data is used.
The powder XRD data recorded for the calcined ZSM-5 at 293 K were successfully
refined to Rw = 4.7 1 % in Pi.Z,/n. I, and yielded ceIl parameters of a = l9.8823(4) A, b =
20.1085(2) A, c =L3.3686(2) A. and /?= 90.537(2)O. A small zero shifi correction of -0.02 I o 20
was automatically determined, refined. and applied by the AJUST program during the fitting.
Because the standard setting of P l.,il/'n. I (i-e. with f l unique) rather than PZl/n. 1. I (a unique)
was used, the a and b ceIl dimensions are swapped cornpared to those reported for single crystal
data in the literature." Estimated standard deviations for the ce11 constants and the lineshape
parameters used are listed in Table 7.1. As expected, the estimated standard deviations for the
ce11 parameters are sign ificantly smal ler than those reported for the monoclinic single crystal
structure (0.002 A and 0.0 1°)." The cell dimensions of ZSM-5 are known to Vary with
temperature, and aIso with the Si/Al content, but the values found fiom fitting of the XRD data
are within the range reported for calcined ZSM-5 in the literature.',"
The calculated pattern shows excellent agreement with the observed reflection data with
only minor differences apparent (Figure 7.4). The major discrepancies are seen for the low angle
reflections. and this is primarily due to the inability to exactly match the experimental peak
profiles using the pseudo-Voigt lineshape function in this case, even when some peak asymmetry
is included. This is ctearly seen as "dispersion-type" peaks in the difference pattern (obsewed -

Table 7.1 Results h m the titting of the ZSM-5 XRD powder data using the program WCIST." The lineshape and zero-shifi parameters used are also Iisted.
Parameter
Temperature
Collection time
Space Group
R, (%)
a (4 b (4 c (A) a ("1
P (O)
r ("1 CeII Volume (A3)
Scale ~actor "' Zero Correction (O 20) '"
Transparency
Asymmetry Coefficient "' w.r
wy
W I
w2
wj
Empty (calcined) 4 moIecules/u.c. pdifiuorobenzene
260 K
12 h
PI.2,/n. I (No. 14)
6.82
19.8796 (0.0004)'"'
20.0978 (0.0003)"'
1 3 -3 65 1 (0.0003)'~'
90.000'~'
90.705 (0.002)"'
90.000'~'
5339.4
0.998945
-0.0 1 146
0.000'~'
0.5 1337
-0.193252
0.09 1 O62
0.002464
-0,022436
0.154197
293 K
24 h
Pnma (No. 62)
6.2 1
20.0298 (0.0002)'"'
19.9 195 (0.0003)'~'
13 -3 776 (0.0003)'"'
90.000'~'
90.000'~'
90,000'~'
53 3 7.4
0.999846
-0.01713
O.OOO'b'
0.502 15
-0.1 94023
0.098729
0.00 1320
-0.007556
0.087879
'"' Estimated standard deviations. Parameter held constant dunng fitting. '" To match calculated and experirnental patterns. '" Linear shift of a1128 values. '" Applied up to 20° 29.

hh Observed
Calculated
Difference (Obs. - Calc.) "
Degrees 20
Figure 7.4 Observed (baseline corrected) and calculated powder X-ray diffraction patterns for calciiied (ernpty) ZSM-5 at 293 K. The acquistion time for the experiinental patteni was 24 hours and the calculated pattern (Rv = 4.7 1%) was obtained using the A./UST prograni assuming inonocliiiic PI.2,/11.1 symmetry with the parameters listed Table 7.1.

calculated). The baseline correction may have also modified the peak profiles slightly.
A small broad peak at CU. 2 1 .go 20 was not well fit and was in fact due to srna11 arnount
of cristobalite in the samples used. Cristobalite is a dense silica phase often present as an
irnpurity in zeolite syntheses. This was not observed in the 2 9 ~ i NMR spectra because it was only
very minor small faction of the sample, and more importantly, because of the long Tl relaxation
times (1 00's of seconds) which rneans it was discriminated against with the relatively short
recycIe deiays (of order of 10-20 s) used-
The successful refinement of the Iattice parameters for the calcined ZSM-5 sarnple
validates the use of the program AJUST, and the generd refinement approach employed. It
fumishes values for the ce11 constants for the purely siliceous ZSM-5 used, and initial values for
the peak profile parameters to be used in the other refinements. Furthemore, the low R, value
indicates a very good fit, and provides a "benchmark" by which the quality of the subsequent
refinements for the DFB data may be judged.
733 DFB / ZSM-5 at 260 K
A total of four scans were acquired for the DFB sample at 260 K. The fint bvo of the 4
six-hour scans recorded with the sample cooled showed only the characteristic monoclinic
features, while the third in the series contained reflections for both phases. The fourth and final
scan in the series was essentially identical to that recorded for the sample at room ternperature.
This transformation back to the (proposed) orthorhombic phase was aîtributed to a gradua1
warming of the sarnple as the dry ice sublimed and the cooling became less efficient.
Consequently only the first two of the low ternperature scans were added and used for the
refinement of the low temperature phase. This reduced the signal-to-noise ratio compared with
the other two data sets, so it was anticipated that the final Rw should be slightly higher than that
obtained for the calcined ZSM-5.

Cornparison of the powder diffraction data recorded for the DFB sample at 260 K
(Figure %3(b)), with that obtained for the calcined ZSM-5 at room temperature (Figure 7.3(c))
reveals that the relative intensity of many of the reflections below about 25" 29 is substantiaIIy
different in the presence ofp-difluorobenzene. A vertical intensity scaling has been applied to
ensure the peak height of the reflection at ca. 7.8" 28 is equal for al1 of the powder patterns in
Figure 7.3. The peak intensities have not changed uniformly for al1 of the reflections: some are
almost unchanged (e-g. reflections at 14.7O. 17.6" and 17.8" 28), while others exhibit dramatic
increases (see peaks in region 10- 14" 20). If this intensity scaling is disregarded, the patterns are
virtually indistinguisbable, with the retlections occumng at almost the same 28 values in both
cases.
The sorbate atoms wilt contribute to the scattering and will affect the intensity of al1 the
reflections. The contribution to the scattering fiom the sorbate molecules will fa11 off quite
steeply (compared to that for the framework) with increasing 20 due to significant thermal
motions of the sorbate molecules. Because of this, the major intensity differences are expected at
lower 28 angles. as was indeed observed.
Assuming P I . Z P . I symmetry, the DFB powder data acquired at 260 K refined to a final
R , of 6.82 % using the parameters listed in Table 7.1. Considering the reduced signal to noise
ratio for these data, this indicates a very good fit to the experimental pattern. The good agreement
between the calculated and observed powder patterns can be seen in Figure 7.5. For the reasons
described in section 7.3.2, the largest discrepancies occur in the low angle region (as was also the
case for the calcined ZSM-5 data),
The refined ce11 parameters refined to a = 19.8796 A, 6 = 20.0978 A. c 43.365 1 A, and
p = 90.70S0. The cell dimensions are al1 slightly smaller than those found for the empty ZSM-5
at 293 K. but the angle P has becorne slightly Iarger (see Table 7.1). Overall, the unit cell volume
was reduced by about O. 1 % compared to that of the empty ZSM-5 at 293 K. Similar reductions in

Observed
Calculated
1 1 I I I I I I I I I I t I I 1 1 1; 6 1 O 14 18 22 26 30 34 38
Degrees 28
Figure 7.5 Observed (badine corrected) and calculated powder X-ray diffraction pattenis for ZSM-5 loaded with 4 molecules/u.c. ofp- difluorobenzene at 260 K . The acqiiistion time for the experimeiitol pattern was 12 hours and the calculated pattern (RN, =
6.82%) was obtained using AJUST assuming monoclinic PI.Zl/ri. I symmetry with the parameters listed Table 7.1.
23 16 the unit ce11 volume are seen for the low-loaded p-xylene-, p-dichlorobenzene-, and p
nitroaniline-ZSM-5 complexes at room temperature.'i-lx However, because low temperature data
was not collected for the calcined ZSM -5. it is unclear whether this contraction is prirnarily due
to the presence of the sorbed guest molecules, or whether the lower temperature also changes the
unit ce11 dimensions and angles.
73.4 DFB / ZSM-5 at 293 K
As check for other cell symmetries, refinements were tried using the refiection
conditions corresponding to Pnma and the lower symmetry space group Pnlla, which is related
to Pnma by removal of the mirror plane perpendicular to the b mis. Becausep-difluorobenzene
is a centrosymrnetric molecule, it was decided that the higher Pnma symmetry would more likely
be adopted by the DFB sample above 293 K. The only sorbate / ZSMJ complex which has been
characterized to date (by single crystal XRD techniques) using Pn2/a symmetry is ZSM-5 loaded
with 4 molecules/u.c. ofp-nitroaniline / ZSM-5."
Using Pnma symmetry the data were successfully refined to an Rv of 6.2 1 % using the
Iineshape and correction parameters listed in Table 7.1. The angles a, P, and y were al1 fixed at
90" during the fitting and the final ce11 dimensions obtained are listed in Table 7.1. The unit cell
volume is less than both the ernpty ZSM-5. and the DFB at 260 K. This was caused by a
reduction in the a dimension by almost 0.08 A, even thougb b and c both increased very slightly.
These ce11 dimensions are in general agreement with those reported for the singIe
ctystal /6-18N.'J and powder refinements2" of the sorbate / ZSM-5 containing ca. 4 molecules/u.c. of
single ring aromatics which exhibit Pnma symmetry. An interesting trend in the unit ceil volumes
was noted for these systems. The ce11 volume increases from 53 15 A3 when ca. 4 molecules/u.c.
ofgxylene are sorbed," through 5320 A3 forp-nitroaniline," to 5324 A' when p-
dichlorobenzene is sorbed.I6 Although these values will be affected by the exact Si/AI ratio of the
ZSM-5 used' they are perhaps a useful indicator for the strength of the sorbate-framework

interactions (strongest for p-xylene and decreasing with increasing unit ce11 volume). Assuming
this to be true, the cell volume found for the low-toaded p-difluorobenzene / ZSM-5 complex
having Pnma syrnmetry (5339 A'), would suggest that the sorbate-framework interactions are
weaker than for the other systems. Fluorine-fluorine and fluorine-oxygen repulsive interactions
may contribute to this. Further support for this argument is provided by the relatively high
temperature (290 K) below which the p-difluorobenzene / ZSM-5 complex transforms to
monoclinic symmetry.
Although the R, value is slightfy higher than the benchmark value of 4.71% obtained for
the calcined ZSM-5, it is still low enough to support the proposed Pnma symmetry. As can be
seen from inspection of Figure 7.6, the calculated powder pattern shows very good agreement to
the experimentally determined XRD data, and with the exception of the broad peak at Ca. 2 1.8"
20 attributed to the presence of a very srnall amount of cristobalite in the sample, al1 of the
reflection features are well described.
7.4 CONCLUSIONS
Accurate Iattice parameters were determined from refinement of the powder X-ray
diffraction data collected for calcined ZSM-5 at 293 K, and ZSM-5 loaded with 4 moiecules of p-
difluorobenzene1u.c. at 260 and 293 K. The cell parameters are sumrnarized in Table 7. i . The
calcined and iow temperature DFB data sets were successfülly refined in the space group
PI.Zl/n. 1. and the room temperature DFB data was satisfactorily refined in Pnma. These XRD
refinements complement the NMR investigations into the location and orientations ofp-
difluorobenzene molecules in the channels of ZSM-5 at a Ioading of approximately 4 molecules
per unit cell described in Chapter 6 . In addition to furnishing accurate ceIl parameters, fitting of
the XRD data provided an independent verification of the framework symmetries proposed from
the NMR experiments, and confirmed that the framework adopts two distinct symmetries within
the temperature range studied.


Above Ca. 293 K, the tkamework has Pnma symmetry, as has been found for three other
low-loaded sorbate / ZSM-5 ~om~lexes.'~~'"" At temperatures below about 290 K, the
framework symmetry for the low-loaded form of the p-difluorobenzene / ZSM-5 complex
transforms to rnonoclinic (space group Pl. t , /n. 1) which is the same symmetry adopted by empty
ZSM-5 below 340 K. Unambiguous proof that the p-difluorobenzene molecules remain inside the
ZSM-5 framework following this phase transition is provided by the successful '£+-"si and 1 9 ~ -
29 Si cross poIan'zation experiments described in Chapter 6. From these observations it was
concluded that the sorbate / framework interactions in this system are sornewhat weaker than
those in the low-loaded p-xylene / ZSM-5 complex which maintains orthorhornbic Pnma
symmetry to temperatures at least as low as 173 K."
It is predicted that sorbate / ZSM-5 complexes other than the low-loaded from ofp-
difluorobenzene in ZSM-5 studied here may undergo similar orthorhombic to monoclinic
transformations at Iow temperatures. Knowledge of such transitions will be critical if the NMR
techniques for locating guest species in the voids of microporous materials described in this
thesis are to be successfully applied to other guest / host, sorbate / zeolite systems.
In general, detailed investigations of powder X-ray data and 2 9 ~ i MAS NMR data such as
those described in this section and in Chapter 6 are invaluable aids for determining the possible
crystal system, lattice parameters, the symmetry (space group), and the number of
crystallograpicaIly inequivalent T-sites. They can fumish information about the temperatures
and/or loadings at which structural changes occur. If possible, these techniques should be utilized
pior to beginning single crystal studies. Moreover, even in cases where the crystals are twinned
or contain aggregates of twin domains, fitting of the powder X-ray diffraction data should still
permit the correct unit ce11 parameten and possible space groups to be determined.
No attempts were made to locate thep-difluorobenzene molecules within the ZSM-5
frarnework from the powder XRD data. However, these investigations have established the space
group symmetry; information that will be extremely useful for future single crystal XRD

experiments to determine the location(s) and orientation(s) ofpdifluorobenzene molecules in
ZSM-5. Several single crystal XRD data sets have been acquired on pdifluorobenzene / ZSM-5
samp les prepared using the specially designed apparatus described in Chapter 2 (which permits
single zeolite crystals to be loaded with precisely controlied arnounts of volatile organic
sorbates). Although at this point a complete structure refinement has not been possible using
these data sets, (which is not surprising given the complexities of these kinds of systems), the
structure of the low-Ioaded p-xylene / ZSM-5 complex has been determined from single crystal
data and this is discussed in Chapter 8.
REFERENCES FOR C W T E R 7
Wu, E.L.; Lawton. S.L.; Olson, D.H.; Rohrman, A.C.; Kokotailo, G.T.J. Chem. Phys. 1979, 83,2777.
Gies. H.; Marler. B.; Fyf'e, C.A.; Kokotailo, G.T.; Feng, Y.; Cox, D.E. J. Phys. Chem. Solids. 1991,152. 1235.
Mentzen, B.F; Vigné-Maeder, F. Mar. Res. Bull. 1987,22,309.
Bosselet, F.; Sacerdote, M.; Bouix, J.: Mentzen, B.F. Mat- Res. Bull. 1990,25,443.
Mentzen, B.F; Sacerdote, M. Mut. Res. Bull. 1993,28, 1 16 1.
Sacerdote, M.; Mentzen, B.F. Mat. Res. Bull. 1993,28, 767.
Fyfe. C.A.; Kennedy, G.J.: Deschutter, C.T.; Kokotailo, G.T. J. Chem. Soc.. Chem. Commun. 1984.54 1.
Fyfe, C.A.; Strobl, H.; Gies, H.; Kokotailo, G.T. Cm. J. Chem. 1988,66, 1942.
Fyfk, C.A.; Strobl, H.; Kokotailo, G.T.; Kennedy, G.J.; Barlow, G.E.; J. Am. Chem. Soc. 1988, 110,3373.
Fyfe, C.A.; Kokotailo, G.T.; Strobl, H.; Gies, H.; Kennedy, G.J.; Pasztor, C.T.: Barlow, G.E. in Zeolites as Catalysfs, Sorbenrs and Detergent Builders. p. 827. Karge, KG.; Weitkarnp, J. Eds. Elsevier, 1989.
Strobl, H.J. Ph.D. Thesis, The University of Guelph, 1989.
Strobl, H.; Fyfe, C.A.; Kokotsiiio, G.T.; Pasztor, C.T.J. Am. Chem. Soc. 1987,109,4733.

13 Fvfe. C.A.: Gies, H.: Kokotailo. G.T.; Marler, B.; Cox, D.E. J. Phys. Chem. 1989. 94,37 18.
14 van Koningsveld. H.: Tuinstm F.: van Bekkum, H.: Jansen, J-C. Acta Crysf. 1989.8-15.423-
15 van Koningsveld. H.: Jansen, J-C.; van Bekkurn, H. Acta Crysr. 1996, B52, 140.
16 van Koningsveld, H.: Jansen. J-C.; de Man, A.J.M. Acta Cys t . 1996, B52, 13 1.
17 Reck. G.: Marlow. F.; Kornatowski, J.: Hill. W.; Caro, J. J. Chem. Phys. 1996, 100, 1698.
18 van Koningsveld. H.: Koegler. J.H. Microporouc Mater. 1997, 9. 7 1.
19 Kokotailo, Lawton. S.L.;G.T.:Olson, D.H.: Meier, W.M. Nature. 1978,272, 437.
10 van Koningsveld. H.; van 8eldcum, H.; Jansen, J.C. Acra Cryst. 1987, BJ3, 127.
21 van Koningsveld, H.: Jansen, J.C.: van Bekkum, H. Zeoiites 1990, IO, 235.
72 Fyfe. C.A.; Grondey. H.: Feng, Y.; Kokotailo, G.T.J. Am. Chem. Soc. 1990. 112,8812.
3 Lewis, A.R; Fyfe, C.A.; Schwieger, W. Snwctzire of the Low-Loaded Para-&dene/ZShf-5 Complex Determined by Single Crystaf X-ray D fi action. In preparation. (see C hapter 8)
24 van Koningsveld, H. Acta Cryst. 1990,846,73 1 .
25 Coilecrion of Sinrzdated XRD Powder Patterns for Zeoiites. Th ird Revised Ed ition. Treacy. M.M.J.: Higgins, J.: von Balimoos, R. (Eds.), Elsevier, 1996. h~p://wwv.iza-sc.ethz.ch/IZA- SC/
26 Grms-386 Galactic Industries Corp.. 395 Main Street, Salem, NH 03079, U.S.A. 1996.
27 AJWT: PROGRAMA D'EXTRACCIO D'iNTENSITATS INTEGRADES, Version 13. Rius. J., Institut de Ciencia de MateriaIs de BarceIona, Cataiunya, Spain. 1996.
28 Intrrnutional Tables for Crystullography. Hahn, T (Ed.); Kluwer Academic Publishen, Dordrecht, 1993, Volume A.
29 Snyder, R.L. in The Rietveld Method. Chapter 7. Young, R.A., (Ed.), Oxford University Press, 1993.
30 Young, R.A. in The Rietveld Methud. Chapter 1. Young, R.A., (Ed.), Oxford University Press. 1 993.
31 Diaz AC; Fyfe, C.A. Persona1 communication.
CHAPTER 8
STRUCTURE OF THE LOW-LOADED COMPLEX OF PARA-
XYLENE IN ZSM-5 FROM A SINGLE CRYSTAL X-RAY
DIFFRACTION STUDY
8.1 INTRODUCTION
Although it has not been possible to date to fulty refine the single crystal XRD data for
the p-difluorobenzene / ZSM-5 complex described in the preceeding chapters. the general
concept of using singIe crystal X-ray diffraction data to check the correctness of the NMR
derived structures has been checked for one other system where a structure had previously been
proposed frorn NMR experiments identical to those described in Chapter 6.' This is the low-
loaded complex ofp-xylene in ZSM-5. and the successful refinement of the single crystal XRD
data is described in detail in this chapter.
As discussed in Chapters 1 and 6 , there have been several investigations into the changes
which occur in the frarnework lattice due to the presence of guest species such as sorbed organic
molecules. However, only in a very lirnited number of cases has the location of the sorbed
organic molecules been reliably determined (e.g. by refinement of single ctystal X-ray diffraction
data)? Sorption sites have been proposed from theoreticai calculations, but these are not always
in agreement with one another, or the X-ray determined structures where these are known.""-" In
general, the successful refinement of single crystal X-ray diffraction data from ZSM-5 single
crystals is nol trivial; there are difficulties in synthesizing single zeolite crystals of adequate size

and quality for single crystal XRD work (twinning is often a problem). At the t h e the current
investigation was undertaken. only six single crystal X-ray diffraction studies of ZSM-5
containing organic sorbates had been reported in the literature.
While X-ray Diffraction (XRD) studies of microcrystalline (powder) samples and single
crystals of ZSM-5 have yielded much of the structural inf~mation.'~~''-'"~~i MAS NMR has
also provided critical inf~rmation.'"'~ For the ZSM-5 / sorbate systems where changes are seen.
the nature of the Iattice distortions seems to be relatively characteristic of the nature of the
sorbed m~lecule.'"~~ In some cases however, very similar "si MAS NMR spectra are obtained
with different molecules, indicating that the lattice geometries are closely related. It may be thai
the locations of the molecules in these cases is very similar, but this has only been verified for
hvo systems to date."
The increasing reliance on theoretical calculations to determine the locations of sorbates
in these zeolite structures must be tempered by the relatively few accurate structures which have
been determined by experiment. Moreover, the calculations rely on molecular forcefields and
potential functions -borrowed from other (ofien purely organic) stems.'^ Clearly there is a
need to expand the database of dependable structures as a check on the accuracy of the proposed
structures and also to improve the reliability of the calculations methods,
This chapter presents the results of the structure refinement forp-xylene molecules in the
framework of ZSM-5 at a loading of less than four molecules per unit ceIl using X-ray diffraction
data collected from a single crystal at 180 K. Prior to the structure determination reported here.
the location and orientations ofp-xylene molecules in the low-loaded form of ZSM-5 had been
proposed from a *fit' of X-ray powder diffrnction data? and also by energy minimization
calc~lations."~~" Solid-state NMR experiments including 'H-"s~ CP MAS and "c-"si REDOR
had recently been completed in this research group to determine the location of thep-xylene in
ZSM-5 for the low-loaded form by solid state NMR." The location and orientation found in the
present work for p-xylene in ZSM-5 by single crystal X-ray diffraction is compared to those

proposed from the previous investigations and those of other sorbate / ZSM-5 complexes
determined from single crystal XRD studies reported in the literature.
8.1.1 Single Crystai X-ray Diffraction Studies of ZSM-5 Systems
Following the initial determination of the ZSM-5 fiamework structure from powder
diffraction data by Kokotailo et af.,"xseveral refinements using single crystal X-ray diffraction
data on as-synthesized samples were undertaken. Of these, the most accurate structure to date is
that by van Koningsveld et of. who were able to locate the ternplating TPA' ion. (the other
structure determinations of the as-synthesized materials are discussed in reference 1). The space
croups. numbers of crystallograpicatIy inequivalent T-sites, as well as the number and general C
location of guest species present (if any) found from single crystal XRD refinements on ZSM-5
systems are summarized in Table 6.1.
ZSM-5 has been found to adopt four space groups: three with orthorhombic symmetry:
Pnma (12 T-sites), PZ12121 (24 T-sites), and PnZla (24 T-sites); and one having monoclinic P z I
/n. !. I symmetry with 24 T-sites. Four different sorbed molecules in ZSM-5 have been studied by
single crystal diffraction studies to date: p-xylene,'p-dichlorobenzene.~~~p-nitroaniline,~ and
naphthalene.- The latter three compounds are al1 solids at roorn ternperature. allowing the low-
loaded (5 4 moIecuIes/u.c.) forms to be relatively easily obtained. However in the case ofp-
xytene, which is a volatile Iiquid, only the high-loaded (saturated) complex containing 8
molecules/u.c. had been previously studied by single crystal X-ray diffraction, presumably due to
difficulties in controlling the amount of volatile sorbate loaded into a single crystal.
With the exception of the high-loaded p-xylene 1 ZSM-5 complex, al1 of the single
crystal X-ray diffraction studies reported for sorbates in ZSM-5 used crystals which were
selected from a batch of crystals suficiently large that controlled amounts of (solid) sorbates
could be added by weight. In the case of the high-loaded p-xylene a single crystal was simply

exposed to excess vapor to obtain a saturated foading. It is assumed that for these studies the
crystals were not loaded in capillaries since this was not discussed in the literature.
Using the specially designed apparatus described in Chapter 3. precise loading of volatile
organic motecules into single crystals of ZSM-5 is now possible. This represents a major advance
in this field and use of this purpose-built equipment will permit the single crystal XRD
investigations of many other previously unobtainable zeolite host-guest systems by X-ray
diffraction, provided single crystals of adequate dimensions and quality are available.
The current availability of image plate and CCD area detectors has dramatically reduced
the minimum crystal size required (from ca. 100 p to about 20 pm), thus increasing the nurnber
of zeolites for which single crystal studies should be possible. Furthemore, the irnproved
collection efficiency of these area detectors means that data collection times are reduced frorn
more than a week to less than 24 hours and Iow temperature studies are thus quite feasible. In
general, collection of diffraction data at low temperatures results in smaller thermal errors.
reduces the dynamic disorder. and allows morc accurate bond distances and angles to be
obtained.
Detailed investigations of powder X-ray data and 19si MAS NMR data are invaluable
aids to determîning the possible crystal system and lattice parameters. the symmetry (space
group), and the nurnber of crystallograpically inequivalent T-sites. In addition they can ofien be
used to deterrnine the temperatures and/or loadings at which structural changes are induced. If
possible, these techniques should be utilized prior to beginning single crystal studies.
8.1.2 Correlations Between 2 g ~ i NMR Chernical Shifts and Structural Parameters
As discussed in Chapter 6, the "si NMR chernical shifi is a vety sensitive probe of the
local structure and geometry around the Si nuclei in the T-sites. and this information has been
utilized as aid in selecting the correct space group for structure determination in cases where this
is ambiguous.i~i" In attempts to interpret and assign the "si resonances to specific T-sites within

the framework lattice, various correlations based on the structural geometrical parameters of the
' ' 7% JO T-sites have been presented.--'- The geometrical parameters from XRD data used for
interpreting the 2 9 ~ i MAS NMR spectra of highly siliceous zeolites are: (0 the rnean Si-O-Si
'3). 35.36 angle c ~ , and various functions based on this including cos cr, / cos(% - 1);- (ii') the mean
si - si distance;'9.3032 and (iii) The mean Si-O bond ~ength.~" The latter is not very sensitive since
the Si-O distances show little variation in siliceous zeolites. The most accepted parameters are
cos a,, 1 cos(%, -1) and the mean Si-Si distance which has a dependence on both the bond
angles and lengths?"
Two problems restrict the quality of the linear correlations obtained in this rnanner.
Fintly the quality of the positional data must be accurate (e.s.d.'s better than 0-004A and 0.02' if
possible). Secondly reliable assignments of the L 9 ~ i NMR resonances to specific T-sites. with
well resolved NMR spectra to provide accurate chemica1 shifis. The first condition can be
realized from refinements of hi& quality single crystal XRD data, and the second criteria may be
met through 2-D NMR correlation experiments such as COSY and MADEQUATE.'-
To date the main limitation preventing these correlations frorn being completely quantitative
arises from uncertainties in the XRD derived structural parameters, rather than the precision of
the L 9 ~ i chernical ~hifts.~' However. in at least one case," reliance on these correlations produced
incorrect assignments of the 19si NMR resonances. Consequently the published correlations
should only be used to draw qualitative conclusions and not as a definitive method for assigning
the NMR spectra.
8.1.3 Previous Investigations of the Low-Loaded p-xylene / ZSM-5 Cornplex
Fyfe et al. tint reported changes in the powder XRD patterns and ' 9 ~ i MAS NMR
spectra of ZSM-5 with sorbed p-xylene, and correctly deduced they where the result of
framework lattice dis tort ion^.'^^' It was also found that the powder XRD pattern ofp-xylene
sorbed in ZSM-5 at loadings greater than two but less than four molecules/u.c. were indicative of
a change to orthorhombic symrnetry.'"-"
The I9si MAS NMR spectrum of the low-loaded p-xylene / ZSM-5 complex can be
resolved in tenns of hveIve resonances of equal intensity in agreement with the proposed Pnmu
space group at temperatures from 173 K to 393 K." 2 9 ~ i 2-D COSY and INADEQUATE
experiments at room temperature were used to assign the individual "si NMR resonances and
the connectivities found were consistent with orthorhombic space group P n n a symmetry.'-
Figure 8.1 shows 'H-"si CP MAS spectra for the low-loaded p-xylene / ZSM-5 complex
acquired at 173 and 193 K with the assignments indicated. Fyfe and CO-workers also reported
phase diagrams for highly siliceous ZSM-5 containing various amounts of sorbed p-xylene at
temperatures ranging from 293 to 393 K determined from ' 9 ~ i MAS NMR e~~eriments.'"~"
Mentzen and Vigné-Maeder proposed locations for p-xylene from powder X-ray
diffraction data in an MFI-type zeolite containing some boron at low loadings.-" Using the
framework coordinates of TPA- ZSM-5 reported by ~aerlocher~' and space group Pnrnu.
powder XRD patterns were simulated and compared these to the experimentally determined
patterns. The best agreement was found when the centroid of thep-xylene ring was positioned on
the mirror plane with the methyl groups Iying almg the straight channels. Several orientations of
the p-xy Ienes were considered and they concluded that the organic molecules m ight be
statistically disordered with two simultaneous orientations in the channels."
Reischman et al. proposed equilibrium absorption sites forp-xylene in the channels of
ZSM-5 based on calculated van der Waals interactions between the hydrocarbori and the zeolite
and between the hydrocarbon molecules themselves.* Their calculations used the Pnnm
framework coordinates of Olson et al." and indicated that the most energetically favourable
sorption sites for loadings up to 4 molecules/u.c. were the channel intersections with the methyl-
methyl axes along the straight channel. This configuration had a calculated energy of-82 kl/mol,

I 1 I 1 1 1 I I 1 I 1 I 1
- 1 08 - 1 10 -1 12 -1 14 -1 16 -1 18 -120 ppm from TMS
'I 1 1 1 a I I 1 1 1 1 I
- 1 O8 -1 10 -1 12 - 1 14 - 1 16 -1 18 -120
ppm from TMS
Figure 8.1 'H- '~s~ CP MAS NMR spectra of thep-xylene / ZSM-5 cornplex at a loading of 3 molecules 1 U.C. recorded at (a) 1 73 K and (b) 193 K. 32 scans were acquired using a 30 ms contact time and a recycle delay of 3 S. The assignment of the resonances to specific T-sites is indicated where they could unambiguously determined from a 2-D NADEQUATE experiment at 268 K."

which was significantly more favorable than those calculated for several other configurations
including molecuIes in the sinusoidal channels or rnotecu~es in both channels (> -50 k.J/mol).
They noted that when p-xylene occupies only the channel intersections. the van der Waals
interactions between adjacent molecules are smaIl. and the major contribution cornes from
framework-oxygen l p-xylene-hydrogen interactions.
Several other groups have reported theoretical calculations to determine the sorption site
ofpxylene in the MFI- framework. usually using silicalite.'"% a11 these calculations the
framework has been rigid. and the sorbate is also usually defined as a semi-rigid group.'-" In
some cases a wrong framework symmetry was used and the sorbate-induced framework chanses
can be quite substantia1.'- The locations determined are dependent on the potential functions and
calsutation technique used, and there is not always complete agreement behveen the various
calcu~ations."
More recentIy Diaz and Fyfe have investigated the location ofp-xylene in ZSMS with
several sol id-state NMR techniques at low temperatures (down to 1 73 K) utilizing different
7 - isotopically labeled p-xy1enes.- When three molecules/u.c. p-xylene having a single i3~-labeled
methyl group were sorbed in ZSM-5, only a single ''c resonance was observed for the methyl
7 - groups.- Through the use of selectively deuterated p-xylenes the location of the sorbate
molecules at a loading of 3 molecules/u.c. was determined from fitting of 'H- '~S~ CP MAS data
forp-sylene (deuterated at the ring or methy 1 groups) and correlations between TCP and the
calculated "si heteronuclear second moments (see Chapter 6).
In these calculations, a rigid framework and p-xytene molecule were assumed, using the
framework coordinates reported for the single crystal XRD determination of the low-loaded form
ofp-dichlorobenzene. and an ideal geometry for the sorbate molecule.' From analysis of the CP
behavior it was deduced that the molecule was located near the channel intersections. Starting
from a position near the channel center. thep-xyIene location was moved around in the straight
channel using small steps and a range of orientations. For each orientation and position the

heteronuciear L 9 ~ i - ' ~ second moments kf2 were calculated (cut-off distance of 8 A) and a plot of
the reciprocal of experimentalIy detennined TCp values vs. MI made. Three almost identical
solutions yielded veiy similar. highly linear correlations. and the ' H - ~ ~ s ~ CP MAS NMR spectra
simulated (using TCp to determine the peak intensities) showed very similar agreements with the
experimentally observed spectrum. The "best" solution was chosen from these and had the
molecular centre exactly coincident with the mirror plane and the methyl-methyl axes parallel to
[O101 in accord with the observation of a single "C resonance. In the other solutions. the ring
centre was displaced by less than 0.3 A from the mirror plane and the molecules showed small
angular deviations frorn the b and c axes.
8.2 MATERIALS AND METHODS
8.2.1 Crystal Preparation and Sorbate Loading
Large single crystals of ZSM-5 were grown by Dr. W. Schwieger using hydrothermal
synthesis (3-5 days at 175 OC) with tetraproplyammonium chloride. The molar composition of
the reaction mixture was SiOl (12.2) NaAloz (0.04), NaOH (44.9), TPABr (43.1 ), H 2 0 (2000).
Due to the small quantity of material obtained, bulk elemental analysis was not done. The
crystals were thoroughly washed with distilled water then calcined in air at 500 OC to remove the
template. An optical microscope was used to select large crystals (dimensions > 0.15 mm) having
no visible defects or twinning. These were loaded into 0.3 mm diameter quartz X-ray capillaries
(wall thickness 0.0 1 mm, graded quartz-Pyrex transition piece attached), and connected to a
purpose-built apparatus constructed of Pyrex glas (see Figure 2.2). Details of the method used to
load the crystal with p-xylene are given in Section 2.3.2.
The capillaries were isolated and the loading of the ZSM-5 powder was verified by
thermal gravimetric analysis (TGA) and "si MAS NMR. TGA (temperature rarnp 10 OC / min. to
600 OC under flowing nitrogen gas) indicated a weight loss equal to 3.4 (0.3) molecules/u.c. As a
more sensitive check that the low-loading (< 4 rnolecules/u.c.) had been achieved, 2 9 ~ i MAS

NMR spectra of the ZSM-5 powder were acquired. These were in agreement with those reported
in the literature for sorbate loadings greater than two but less than four molecules p-xylene per
19.20 U.C. Individual capiIlaries containing the single crystals were isolated, immersed in liquid
nitrogen, and sealed. They were stored at room temperature to allow an equilibrium Ioading to re-
establish before the X-ray diffiction data were collected.
8.2.2 Data Collection and Refinement of Reflection Data
8.2.2.1 Data Collection
The crystaI selected for study had dimensions of 0.2 x 0.2 x O, 15 mm. Data were
collected by Dr. S. Rettig at a temperature of 180 K on a Rigaku ACF7 diffractometer equipped
with an Area Detector System Corporation charge-coupIed device (CCD) detector (size 98 x 98
mm) using graphite monochromated Mo K a radiation. 768 CCD images were stored (recording
time 96 s / image) in o and 4 scan modes with 0.3 degree steps between images up to =
30.05". A total tirne of 21 hours was required for the data collection during which the crystal was
cooled by a flow of cold nitrogen gas. Table 8.1 summarizes other data collection parameters.
8.2.2.2 Definilions of R-indices Used
As described in the SHELYL-97 l iterature? a variety of parameters are available which
can be used to monitor the success of a refinement. The diffraction experiment measures
intensities and their standard deviations, which afier the V ~ ~ O U S corrections give F,' and o(~,').
Refinement against al1 FI-values is demonstrably superior to refinement against F-values greater
than some threshold [say 4o(F)], because more experimental information is incorporated
(suitably weighted) and the chance of getting stuck in a local minimum is reduced.
The progress and quality of the refinement was monitored using wR2, the weighted R-
factor based on F?

Table 8.1 Crystal data and structure refrnement for the low-loaded p-xytene / ZSM-5 complex at
CRYSTAL DATA
Chernical formula Chemical formula weight Crystal system Space group Unit cell dimensions Cell volume Reflections used to determine ceil parameters z CalcuIated Density Absorption Coefficient CrystaI fom Crystal size Crystal colour Crystal mounting
DATA COLLECTlON
Di ffractometer Data Collection Temperature Radiation Type Wavelength Theta range for data collection Mi Iler index ranges Nurnber of measured reflections Nurnber of observed reflections [ >di) ] Unique reflections (after averaging) R index for syrnmetry equivalent reflections R index from counting statistics Compieteness to O= 30.05 Ma~imum and minimum transmission Number of CCD images collected Exposure tirne per CCD image Scan mode Scan range Background measurements
Cu.8 H28.6 si96 0 1 9 1
15 17-06 Orthorhornbic Pnrna a= l9.989(4) A, b= l9.899(4) A. c= 13.362(3) A 53 I 5(î) A3 35854 1 1 -935 g/crn3 p = 0.685 mm-' Block 0.20 .u 0.20 x 0.15 mm Colourless (clear) Sealed quartz capillary (0.3 mm diameter)
Rigaku ACF7 with ADSC CCD detector 180(2) K Mo K a (graphite monochromated) h=0.7!073 A 2.10 r 0 1 30.0S0 -28- h +24, -25+ k -23, -1 5- ! -+ 18 47400 45435 7420 Rint = 0.0398 R,,,, = 0.0464 93 .O% 0.9043 and 0.8752 768 96 seconds w and 4 oscillation, A( = -90' -23" 2 O 5 17.8', 0° I 4 I 190.2" Determined during image integration

Table 8.1 (continued) Crystal data and structure refinernent for the low-loaded p-xylene 1 ZSM-5 complex at 180 K.
Refinement method
Final R indices [ I > 261) ]
R indices (a11 data)
Goodness-O f-fit (al I data)
Number of reflections used
Number of restraints
Number of least squares parameten
H-atom treatment
Weighting scheme
Largest and mean least squares shift
Largest e' Density Peak and HoIe
Absorption correction method
Structure refinement program
Source of atomic scattering factors
Fu Il-matrix least-squares on
RI(F) = 0.043 7 , WR?(F') = O. 1 148
R I ( R = 0.07 1 1. W R ~ ( F ~ ) = 0.1238
S(P)= 1.1080
7420
6 (to fix hydrogen positions)
3 74
Fixed U at calculated positions
w=i/ [d (F,,') + (0.0743 P)' + 0.3534 Pl
where P = (F~' + 2 ~ ~ ' ) / 3
0.002 Ma, 0.000 No
~ p , , = 1.038 e/A3.~p,,.=-0.641 e / A 3
Semi-empirical using equivalent reflections
SHELXL-97 (Sheldrick, 1997)"
Interoationa! TubIes for Crys~aIlogruphy
( 1992, Vol. C. Tables 4.2.6.8 and 6.1. I .4)'-

Here Fc is the calculated intensity and IV is the weighting scheme used:
w = 1 / [ &(Fa') + (d)' + bP ]
P = [ ZF,' + M~K(F.'.o) ] 1 3 w here
The use of this combination of F0' and F,' was shown by ils son'^ to reduce statistical bias. For
cornparison with older refinements based on F, a conventional index RI (Eq. 8.4) based on
observed F values larger than 4o(F,) was also calculated.
In general . the smaller the values of these R-factors, the better the agreement behveen the model
and the diffraction data. Another parameter which describes the quality of the final structure is
the Goodness of Fit S. and this is also based on p:
S = ( I: [ iv(FO2-F,')' j / (n-p) ) If' 8.5
Here n is the number of reflections and p is the total number of parameters refined. S should be
close to unity when the weights of the observations have been correctly assessed, the errors in the
model are negligible in cornparison with the errors in the data, and there are no significant
systernatic errors."
Two pararneters which describe the quality of the reflection data are Rint (Eq. 8.6) and
Rsim (Eq. 8.7).

In Eq. 8.6 both summations involve al1 input reflections for which more than one symmetry
equivalent is averaged, and the summation in Eq. 8.7 is over al1 reflections in the merged list.
8.2.2.3 Processing and Refrnernent of the Reflection Datu
Intensities of the reflections were determined by three-dimensional inteption of the
CCD images. Initially a dynamic profile-fitting function was used to perform the peak
integration. however this yielded non-positive definite thermal parameters for the framework
atoms during the earIy stages of the refinernent. Subsequently a constant volume integration
technique which used fixed volumes for the individual peaks was employed and this gave well-
behaved intensity data. Background intensities were measured from the images in the vicinity of
the individual peaks and subtracted during the integration procedure. The final intensities were
corrected for absorption using a semi-empirical method based on an analysis of equivalent
reflections. Lorentz and polarkation corrections were also applied. Cell parameters were
determined from a least squares fitting of 35854 reflections and are given in Table S. i .
The final data file contained the Miller indices (indexing done by D*TREK softwareJi).
the and 4 ~ ' ) values for 47400 reflections (45435 with I > 1 O). This data set was pre-
processed using the teXsan for Windows sofhvare4%nd showed systematic extinctions indicating
the crystal was onhorhombic with possible space groups Pnmo (No. 62) or Pnlla (No. 33).'-
Pnmu symmetry was confirmed by successful refinement (see below). Before refinement
commenced. the data were exported in the format required for the refinement program SHELYL-
9 7?'
SHELXL-97 was run on an 1BM-compatibfe PC with a Pentium 200 processor under the
Windows NT operating system. Starting coordinates of framework atoms were taken from those
reported in the literature for TPAORT.' Al1 frarnework atoms were treated as zero valent Si or O
with anisotropic temperature factors. The atomic scattering factors used were taken from the
International i ab les:' and any systematically absent reflections were automatically rejected by

the refinement program. Afier the equivalent reflections were merged and their indices converted
to standard symmetry equivalents. a set of 7420 unique (averaged) reflections was obtained.
Using these data., anisotropic. full matrix least squares refinement on F' of the framework atoms
only (with site occupancies fixed to 1 .O) converged to Ri = 6.64 % (w& = 23.03%. JV = I /
4~ ' ) ) . The Fourier difference map calculated at this stage revealed several peaks with
significant electron density. The four highest were assigned to C atoms ofp-'rylene (the other
four C's are related by mirror plane at y = 0.25).
As check for reduced symmetry andlot disorder. attempts were made to refine the whoIe
system (Le. framework and sorbate) in Pn2,u. To achieve this a complete set of the mirror related
12 Si and 26 O atoms was generated (usingr, y. z 4 x, 0.5-y, z ) and several cycles of refinement
in Pma carried out using these atoms to reorient the thermal ellipsoids. The hvo sets were
cornbined and refinement proceeded in Pn2,a. However during this refinement the thermal
factors for several framework atoms went non-positive definite or the R factors became unstable
even when constraints were applied to keep the formerly minor-related framework atoms
equivaient.
To test for the presence of disorder in the p-'cylenes, several different models were used
including hvo rigid p-xylene molecules with separate occupancies. In this case one set moved
ont0 the mirror plane white the other carbons became non-positive definite or the C-C bond
lengths and the geornetry of the moIecule became unreasonable. A similar disordered mode1 was
tried in Pnrna but was also badly behaved. Consequently the refinement was continued in Pnma
with four C atoms having a common (refined) occupancy, the ring centre coincident with the
mirror plane at y = 0.25 and individual anisotropic thermal parameters for al1 atorns (Si, O. C).
During the final cycles, six constraints were used to fix the five unique hydrogen atoms of the p-
xylene (isotropic with occupancy equal to that of the carbons) at calculated positions (C-H =
0.98 A, C-C-H = 120").

Using this model. the refinernent converged to RI = 4.37 % (wRI = 1 1.48%, weighting
scheme given in Table 8.1) and a goodness-of-fit parameter S = 1.108 for 7420 reflections and
374 parameters. The average and maximum shifi 1 e.s.d. values in the last refinement cycle were
0.002 and 0.000 respectively. The final difference synthesis showed small amounts of residual
electron density with the highest peak (1 .O38 e 1 A3) located in the centre of the zigzag channel.
A possible explanation for this is residual debris not completely removed during the calcination.
A srnall peak was also detected near the p-xylene molecule. but al1 other peaks were in close
vicinity of the framework atoms and attributed to ?est density" of these atoms. The occupancy
of the carbon atoms refined to 0.714(7) which corresponds to 2.85(3) p-xylene molecules / unit
ceIl. in close accord with the loading determined from TGA analysis of the powder sample.
Heating during the sealing of the capillary may have resulted in a slight loss of sorbate, and it is
also possible that the cooling of the crystal and capillary during the data collection may have had
a small effect on the precise sorbate loading.
Final atomic fractional coordinates and equivalent isotropic thermal displacement factors
for the framework and sorbate atoms (excluding hydrogens) determined from the refinement are
listed in Table 8.2. The individual anisotropic thermal parameters are listed in Appendix G.
Figures were generated using ORTEP-3 for windows4' and some geometrical analysis
(e-g. of the coordination spheres) was done with the P U TON-98 sofh~are.~'
8.3 RESULTS AND DISCUSSION
This structure represents a major advance since it is the first reported single crystal
structure determination where a volatile organic sorbate was loaded to less than 4 molecules1u.c.
in a single crystal: with the exception of the high-loaded p-xylene 1 ZSM-5 cornplex, the single
crystal XRD structure determinations of the other sorbate / ZSM-5 systems reported previously
contained sorbates which were solids at room temperature. The crystal investigated was of
comparable size to those used by other groups in previous ZSM-5 single crystal XRD structure

nn h h h n n n h h n n n ~ h h n n n n n n n n ~ n n n n h n n n - e - - n n ~ - - ~ e n & r i ) - - n - - - ~ - - c h - d + d - ~ - ~ i ~ - - m n B n n ~ n + t n h
,-- ri.,
V M V1 \O
n ri)
t-- in
n ri)
80" M ln
n n n n n h

dete~-minations.~-~.~ Ce11 parameters are very accurately determined since they were found from
fitting of more than 35000 reflections compared to the usual25 on conventional single crystal
XRD systems.
Data collection at low temperature (180 K for >20 hours) was made possible through the
use of a CCD detector. This aliowed the simultaneous collection of Bragg reflections from a
wide angular region. and thus greatly reduced the collection tirne needed (in this case from more
than 7 days to less than 24 hours). An associated benefit of the CCD detector is the significant
reduction in the s i x of crystal required. which is especially important for the type of system
investigated here.
Although. in general. the intensities measured for individual reflections are less
accurately determined using a CCD detector compared to a conventional counter in a given t h e ,
many reflections are collected several times which allows for averaging, and thus the overall
statistics are often significantly improved. Another advantage is that al1 of the data for a
cornplete hemisphere (representing a compIete set of reflections) is collected and stored; thus if
the wrong space group or ce11 is inadvertently chosen. the data can simpiy be re-indexed rather
than having to collect the +missed' reflections.
The p-xylene molecules were Iocated in the straight channels at the intersection with the
zigzag channels, in agreement with other single crystal structure determinations reported for
host-guest ZSM-5 / sorbate systems. The labeling of the framework atoms is indicated in Figures
8.2 and 8.3 The orientation of the p-xylene molecule in the straight channei is shown in Figure
8.3, where the presence of the mirror plane through 023,034.025 and 036 can be easily seen.
Van Koningsvetd and CO-workers found Pnmn symmetry for two other single crystal
XRD structures of low-loaded / ZSM-5 complexes containing naphthalene- orp-
dicholorobenzene' but needed to invoke a mode1 having disordered molecules at two orientations
(related by the mirror plane imposed by the Pnma symmetry). This disorder may actually be the
result of a lower symrnetry which is not resolved due to limitations in the data. When a non-

Figure 8.2 Numbenng scheme of the Si and O atoms in the asymmetric unit of the ZSM-5 fnmework in Pnmo viewed approxirnately along (a) [ 1001 and (b) [O 1 O].
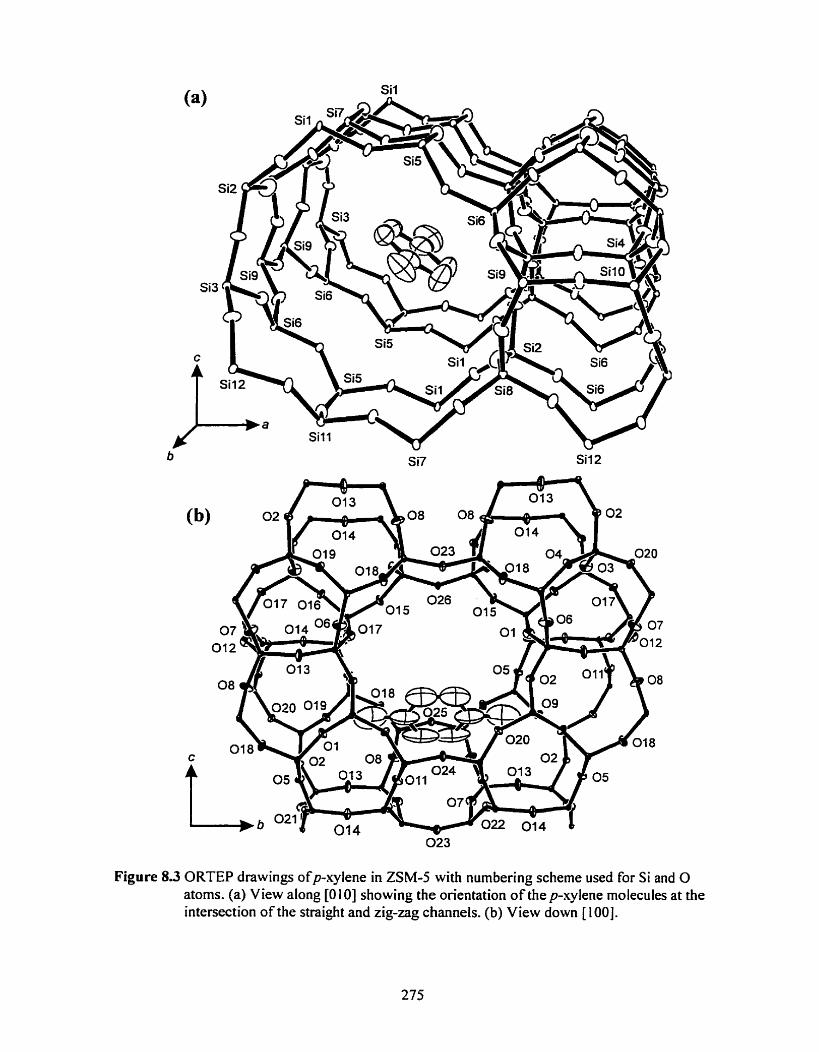
Figure 8.3 ORTEP drawings ofpxylene in ZSM-5 with numbering scheme used for Si and O atoms. (a) View along [O 101 showing the orientation of the p-xylene molecules at the intersection of the straight and zigzag channels. (b) View down [ 1001.

centrosymmetric rnolecule @-nitroaniline) was sorbed in ZSM-5 two space groups were found:""
PnZ,a and Pnrna. In the former case the framework configuration was virtually identical to that
determined previously for the unloaded high temperature (Pnma) phase of ZSM-5. and a large
number of constraints were needed to suppress the effects of strong correlations between the
(Pnrnu) "mirror-related" fmmework atoms. Although disorder might rnodel this effectively. it is
more chemically reasonable that the overall symmetry is reduced. at least in the case of non-
centrosymmetric molecules (eg. p-nitroanitine and p-chlorotoluene).
This apparent contradiction can be understood if the contributions to the scattering by
the sorbate and framework atoms are considered. The scattering by the carbon atoms in a sorbate
will be much less than that due to the frarnework atoms, and rnay not be large enough to '~iolate"
the Pnnra syrnmetry- These space groups exhibit the same systernatic extinctions and the
presence or absence of the mirror plane perpendicuiar to b cannot be deduced from analysis of
the reflection extinctions alone. Moreover, Pn2,u is a subgroup of Pnrncr and can be obtained by
eliminating the inversion centre which has the effect of removing the mirror plane at y = 0.25.
8.3.1 Geometry of the Framework
In Table 8.3 the framework geometry (ranges and averages for bond lengths and angles)
determined for low-loaded p-xylene / ZSM-5 in the present work is compared to those reported
for previous ZSM-5 structures. Full details of the Si-O bond Iengths, as well as O-Si-O. Si-O-
Si bond angles for the individual T-sites are given in Appendix G. The present structure
represents the most accurate determination of the ZSM-5 framework to date: the thermal
displacement parameters for the Si and O atoms in the ZSM-5 framework, as well as the
observed variation in the Si-O bond lengths, are considerably smaller than any previously
reported for ZSM-5. For example the range of Si-O bond lengths in low-loaded p-xylene fom of
ZSM-5 is 0.0 16 A compared with ca. 0.03 A or greater for other structures, and the range of the
averages for the individual Si-O-Si bond angles is narrower by more than two degrees (Table

8.3). The estimated standard deviations of the bond lengths and bond angles are small. being less
than 0.002 A and O. I o respectively (see Appendix G).
The more accurate determination stems pnmarily from the low temperature ( 180 K) at
which the data was acquired and large number of refiections collected (93% cornpleteness).
resulting in reduced thermal errors and a high observation / parameter ratio (= 20) respectively.
The average Si-O bond length is slightly longer (by ca 0.005 A) than that seen for the low-
loaded sorbate / ZSM-5 complexes. and significantly longer (0.0 15 A) than those reported for the
hi&-loaded complexes. Another striking difference is that the minimum Si-O bond length is
somewhat longer than that observed in other ZSM-5 systems, although the maximum is very
similar to those in other structures, The average Si-O-Si angle is also at least 3" lower than in
other ZSM-5 structures. These may be a result of the lower temperature at which the diffraction
data was collected (ail of the other structures were determined at or above room temperature) as
the lattice is quite flexible and can change to accommodate thermal stresses caused by cooling or
heating.
The pore sizes mainly determine the molecular sieving and diffusion properties of
zeolites, and while they are ofien referred to in terms of the number of T-atoms in the rings
outlining the openings, it is really the oxygens which define the effective or "fiee" pore size
owing to their larger van der Waals radii. One way to describe the dimensions of the channels is
through use of the diagonal 0-0 distances across the rings. The free pore dimensions accessible
to guests can easily be calculated from these by subtracting hvice the van der Waals radii of
oxygen (1 -35 A).' In Table 8.4 the minimum and maximum diagonal 0-0 distances across the
IO-rings defining the channels in ZSM-5 are listed for the low-loaded p-xylene / ZSM-5 cornplex
and those reported for the other ZSM-5 single crystal determinations. In framework structures
with Pnma symmetry, the two 10-rings defining the straight channel are related by a min-or
plane, and those describing the zigzag channel share an inversion center. In the monoclinic
space group Pn&a and the orthorhombic P21212, symmetry observed for the high-loaded ZSM-5

Table 8.3 Cornparison of the fraiiiework geonietry i r i several ZSM-5 structiires as detennined by single crystal X-ray diffraction.
MONO
HTORT
TPAORT
HLPXY
HLPDCB
LLPDCB
LLPNA
LLPXY
NAPH
-
Ref.
15
14
1
2
3
4
5
this rvork 7 -
Temp (KI
Si-O Boiid Lengtlis (A)
Range Range Average ~ v e r a ~ e ' ~ '
O-Si-O Botid Angles (O)
Range Average
Si-O-Si Boiid Angles (O)
Range Average Range s~(os~), Average
'"' See Table 6.1 for description of codes. "' Range of the averaps calculated for eacli crystallographically iiiequivalent Si atoiii.
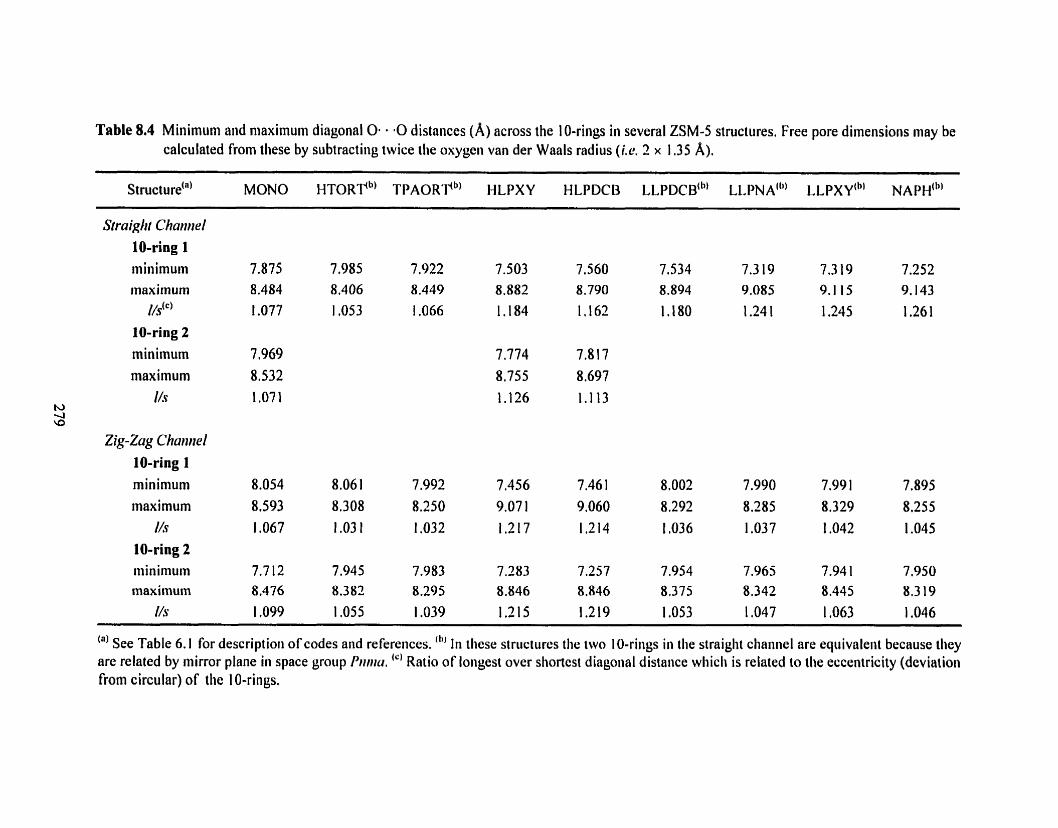
Table 8.4 Minimum and maximum diagonal 0. * 0 0 distances (A) across the IO-rings in several ZSM-5 structures. Free pore dimensions inay be calculated from these by subtractiiig twice the oxypii van der Waals radius (ive. 2 x 1.35 A).
structure") MONO H T O R ~ ~ ' TPAORV~) HLPXY HLPDCB LLPDCB("' LLI>NA(") L J X Y ~ ~ ) NA PH(^)
Straight Chartrd 10-ring 1 minimum inaxiinum
//P 10-ring 2 minimum maximum
l h
Zig-Zug Chu~iciel 10-ring 1 minimum maximum
I h
10-ring 2 minimum maximum
//s
(" See Table 6.1 for descriptioii of codes and refereiices. "" I i i tlicse striictures the two IO-rings in the straiglit chaiinel are equivaleiit because tliey are related by mirror plane iii space group P~~nru. '" Ratio of loiipst over shortcst diagonal distalice wliicli is related to the eçcentricity (deviation from circular) of the 1 0-rings.

/ sorbate complexes. there are two independent I O-rings defining each of the straight and
sinusoidal channels respectively.
As seen from the values listed in Table 8.4. there is a fair amount of variation between
the three general structure types (empty framework, high- and low-loaded). but there are general
similarities within each group. A useful parameter which describes the deviation of the channels
from circular is the ratio of the longest over the shortest diagonal 0-0 distances (the
eccentricity l k ) . If Us = I .O the Tia rings are essentially circular, while larger values of Us
indicate increasing elliptical distortion. The I/s ratios for the ZSM-5 structures are listed in Table
8.4. Cornparison of the eccentricities for the three structure types indicates that the elliptical
character of the 1 0-rings is significantly more pronounced when there is a sorbate molecule
present. This elliptical distortion of the I O-rings closely mirrors the shape of the sorbed rnolecule
and can be clearly seen in Figure 8.4 which shows the packing of thep-xylenes in the straight
channels of ZSM-5. Note that the distortion produces a free pore dimension that is quite closely
related to the kinetic diameter ofpxylene (5.85 A).'"
An exception to the guest-induced eccentricity in the 10-rings is seen for the as-
synthesized ZSM-5 containing TPAc ions, where only relatively rninor elliptical distortions are
present. This is probably due to the smaller effective kinetic diameter of the propyl groups
compared with those of aromatic ring compounds such as naphthalene and substituted benzenes.
and the associated reduction in close framework-sorbate contacts.
For the low loaded structures the sorbates are located at the channel intersection but lie
in the straight channels, and it is these 1 O-rings which have I/s markedly larger than 1 .O (actually
close to 1 .Z), whiIe the zigzag channels rernain essentially circular. The effective pore
dimensions for straight channels in ZSM-5 containing less than 4 molecules p-xy1enelu.c. (4.6 x
6.4 A) are very close to those of the other ZSM-5 structures having sorbates at the channel
intersections, although in the case of p-dichloro benzene, a SI ightly less pronounced el1 iptical
character is observed. In the high-loaded sorbate I ZSM-5 complexes, molecules are also present
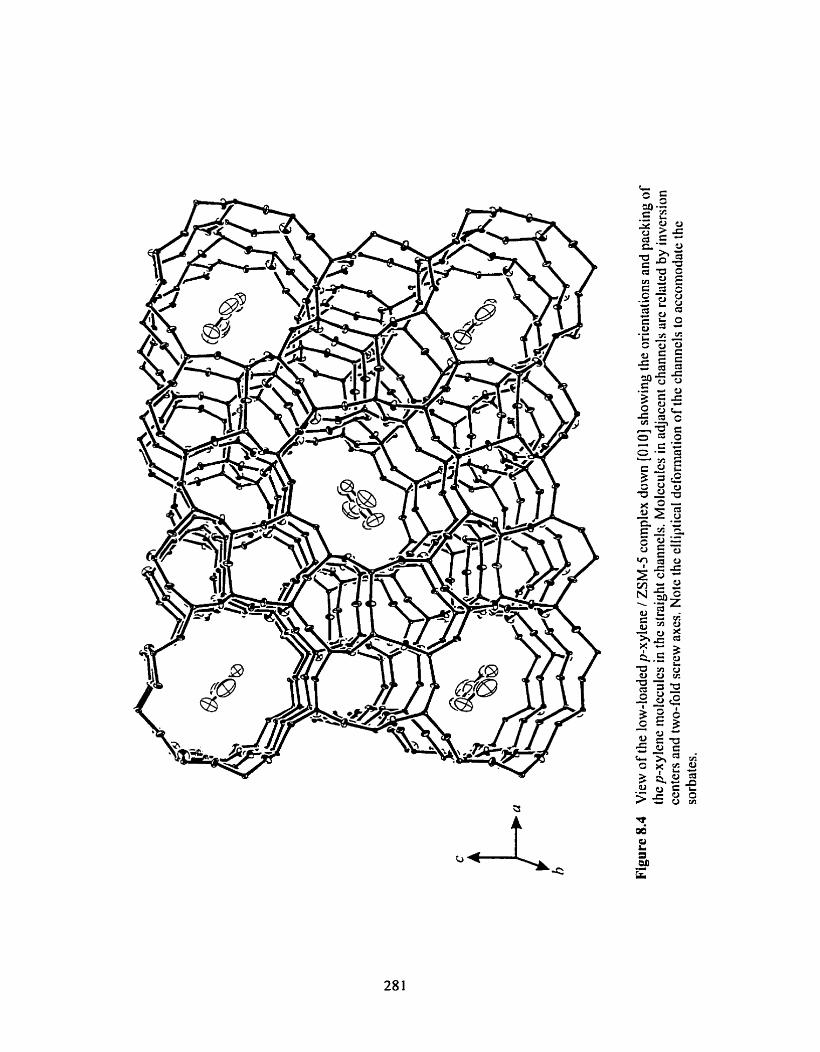

in the sinusoidal channels and an elIiptical distortion is observed for these IO-rings as welI. In the
empty ZSM-5 frarnework, al1 of the t O-rings are more or less circular- These changes reflect the
general flexibility of the zeolite framework and indicate that slight changes in the geometry
about each T-atom (mainly in the O-Si-O bond angles) can occur to accommodate sorbed
molecules or temperature variations. In many theoretical calculations used to detemine preferred
sorption sites of guests in the zeolite channel systems (e-g. energy minimizations) the framework
is kept rigid, and this may not accurately reflect the real structure.
8.3.2 Geometry and Packing of thep-xylene Molecutes
The C-C bond lengths and C-C-C bond angles determined for the p-xylene molecules
sorbed in ZSM-5 at loading of 2-85 molecules/u.c. are given in Table 8.5. The labeling of the
atoms in Table 8.5 is different than used in the structure determination (see Table 8.1 ) and the
new labeling scheme is indicated in Figure 8.5. During the refinement of the XRD data. these
atoms had an equal occupancy that was freely varied. and individual anisotropic thermal factors
for the four independent C atoms. In the previously published single crystal determinations of
low-loaded sorbate / ZSM-5 complexes. the sorbate molecules were refined as rigid groups with
ideal geometries, and sometimes with fixed occupancies as well (For the two high-ioaded forms
@-xylene and p-dichlorobenzene) the sorbate geometries were unconstrained).
The bond lengths and angles are in excellent agreement with those determined for a
single crystal ofpxylene at 180 K (Table 8.5) The geometry reported2 forp-xylene molecules in
the straight channels of the high-loadedp-xylene / ZSM-5 complex are also listed in Table 8.5
and a comparison reveals that the present structure determination has significantly lower e.s.d.'s
in the bond lengths and a geometry that agrees very well with those found forp-xylene at the
same temperature.
The anisotropic thermal displacement parameters forp-xylene (Table G. 1, Appendix G)
are similas to those seen in the high-loaded form' and are quite elongated in the [O101 direction.

Figure 8.5 Labeling ofp-xylene carbon atoms in (a) X-ray determined structure of low-loaded form of ZSM-5 and (b) Table 8.5. Apostrophes indicate symmetry related atoms generated by the mirror plane rn in the space group Pnma.
Figure 8.6 Angles and coordinates used to describe orientations of sorbates in ZSM-5. The coordinates of the ring centre are x,y,z. (a) Angles al, Pl and y1 define the orientation of the long molecular axis relative to the crystal axes a, 6. and c respectively. (b) Angles d, f l and y2 are rneasured to a vector which is normal to the plane of the ring See footnotes to Table 6.1 for fiirther information.

Table 8 5 Cornparison of bond lengths (A) and bond angles (O) in p-xy lene molecules at the channel intersections of ZSM-5 with those in a single crystal ofp-xylene at 180 K. Estirnated standard deviations are given in parentheses.
Bond Lengths C 1 -C2 C2-C3
C3-C4 C4-C5 CS-C6 CO-C 1
mean
CLC7 1.50(1) C4-C8 l.SO(1)
rnean 1.50
Endocyclic Angles C 1 -C2-C3 12 I.6(6) C2-C3-C4 12 1.6(6) C4-C5-C6 1 20 .0(6) CS-CO-C 1 1 20.0(6)
rnean 120.8
Erocyciic Angles C3-C 1 -C7 12 1.7(9) C6-C 1 -C7 1 19.9(8) C3-C4-C8 12 1.7(9) CS-C3-C8 1 19.9(8)
mean 120.8
"' LLPXY: 2.85 molecules ofp-xylene / u.c.; HLPXY: 8 molecules ofp-xylene / U.C.
'b' p-xylene located on mirror plane (see Figure 8.5 for the labelling scheme). "' p-xy lene molecule has a centre of ~~rnrnetry.'~' Data from reference 2.

No noticeable distortions in the [100] or [O0 1 ] directions are observed. indicating that the
deviation of the methyl-methyl vector from the straight channel axis is quite srnall. A possible
interpretation of the ellipsoid shapes is that the energy minimum for the sorbate rnolecules is
somewhat flat and we are seeing some thermal motion of the p-xylene molecules.
As seen in Figures 8.3 and 8.4. thep-xylene molecule lies at the intersection with the
rnethyl-methyl a..is aligned along the straight channel. The plane of the arornatic ring is tilted
away from the n and c &.es so that it faces the opening to the zigzag channel (defined by Si-1.
Si-2, Si-5. Si-6 and Si-9). The p-'cylene molecules form loosely connected chains along [O 1 O],
with neighbouring molecules in each straight channel related by an inversion centre, and
alternating ring orientations in adjacent channels along the c direction (Figure 8.4). The C-C
contact distance benveen terminal (rnethyl) carbons residing in the same channel is 4.05 A.
which is very close to that reported for the hi@-loaded p-xylene / ZSM-5 cornplex (4.08 A) and
indicates the packing along the channels is similar in these hvo structures. Methyl carbons of
molecules residing in adjacent channels are separated by a distance of 1 1.73 A.
The location and rotational orientation of the adsorbed p-xytene molecules within the
fmmework can be described by the fractional coordinates of the centre of the arornatic ring (-Y, y.
r), and the angles between the methyl-methyl a i s and the a, 6. and c axes (al. fl . y2
respectively), and from a vector normal to the plane of the ring to these axes (d. PZ. and y2).
These variables are defined in Figure 8.6. The location and orientation ofp-xylene molecules
determined in the present work, together with the corresponding values calculated from the
coordinates and ceIl dimensions of other ZSM-5 / sorbate systems determined by single crystal
XRD are presented in Table 8.6.
If the sorbate molecule is centrosymmetric, and the center is coincident with the mirror
plane in space group Pnrna, there will only be two orientations for the molecules as seen for p-
xylene within the straight channels in Figure 8.4. However if the rnolecular center is not
coincident with the mirror plane, then disorder will be present and there will be four orientations.


For the high-loaded sorbate / ZSM-5 complexes which have P212121 symmetry, only two
orientations will be observed. OnIy the parameters for one of these orientations is given is Table
8.6 since the others are related by the appropriate syrnmetry operations in each space group.
The disorder observed in these cases may be a result of the symmetry imposed on the
system by the space group selected for refmement. The higher symmetry is observed occurs
because the framework atorns contribute most of the scattered X-ray intensity. NMR is more
sensitive to the local geornetry of the individual T-sites and may provide the key to unraveling
this pseudo sy mmetry versus disorder controversy.
Cornparison of the values given in Table 8.6 reveals that the location and orientation of
p-xylene are sirnilar to that found for other low-loaded ZSM-5 complexes. In the present work
the ring centroid lies exactly on the rnirror plane forp-'cylene. This is in agreement with the
observation of a single "C NMR resonance for the rnethyl carbon of the sorbed p-xylene-'- (in the
high-loaded from the rnethyl groups are no longer equivalent and four resonances are observed:
two for the methyl's in the straight channel and two for those in the zigzag channels). ln al1
other cases the sorbate molecules are shifted slightly (up to 0.4 A) from the rnirror plane and thus
are disordered.
The angular rotation of the p-xylene ring relative to the crystallographic axes is. overall.
quite similar to those found for the other low-loaded ZSM-5 complexes. but some differences are
apparent. Forp-xylene the methyl-methyl axis is exactly paraIlel to the [O 1 O] mis (al = yl = 90°,
PI = O"). compared with deviations of up to 1 t O seen for the long molecular ares of the other
sorbates; only naphthalene is so closely aligned to the straight channel axes. a2 and y2 are also
slightly higher for the low-loaded p-xylene / ZSM-5 cornplex than in any of the other low-Ioaded
structures,
Striking differences are seen for the orientation of the aromatic ring plane in the low- and
high-loaded sorbate 1 ZSM-5 complexes. When the sorbate loading is less than 4 molecules1u.c.
a2 is approximately 50' and y2 is nearly 140". If eight molecules are present then a 2 increases to

c a 1 50° and y2 is reduçed by about 20". This change of almost 10O0 in ~2 reflects the rotation of
the sorbates in the straight channel to have a more favourable interaction with the terminal ring-
substituent atoms of molecules present in the zigzag channels in the hi&-loaded forms. The
elliptical distortion of the straight channels (see Table 8.4) in the high loaded form also reflects
the different molecular orientations and occurs in almost the opposite direction to that seen in the
low-loaded corn pl ex es.'^'
8 3 3 Cornparisons with p-xyIene Orientations Determined by Other Methods
The orientations i i i d 1ocatior.i poposed from the two previous investigations of the low-
loaded p-xyylene / ZSM-5 complex by powder X-ray diffra~tion~~and NMR-'- are given in Table
8.6. In both cases the centre of the aromatic ring lies on the mirror plane. and the methyl-methyl
avis is exactly along the straight channel, in agreement with the present XRD structure. There are
small differences in the precise position of the ring centroid relative to the channel (by up to 0.2
A) . and the angles between the vector normal to the plane of the aromatic ring Vary by about 6'.
Overall the locations and rotational orientation within the channels determined from NMR and
powder XRD investigations are in close agreement with the present structure.
No coordinates were published for the locations found by energy minimization
calculations. so the orientational parameters could not be computed for these: however it was
reported that the molecules were Iocated at the channel intersections with the CH;-C W; suis
parallel to [O 1 O].""
8.3.4 Prediction of 2 9 ~ i Chernical Shifts
In previous correlations between chemicai shifis and structural parameters derived from
framework atoms from XRD detemined structures, the limiting factor was the relatively large
e.s.d.'s of XRD derived parameters. In the present work the structural parameten have been
determined to a high degree of accuracy, and NMR data acquired in a similar temperature range
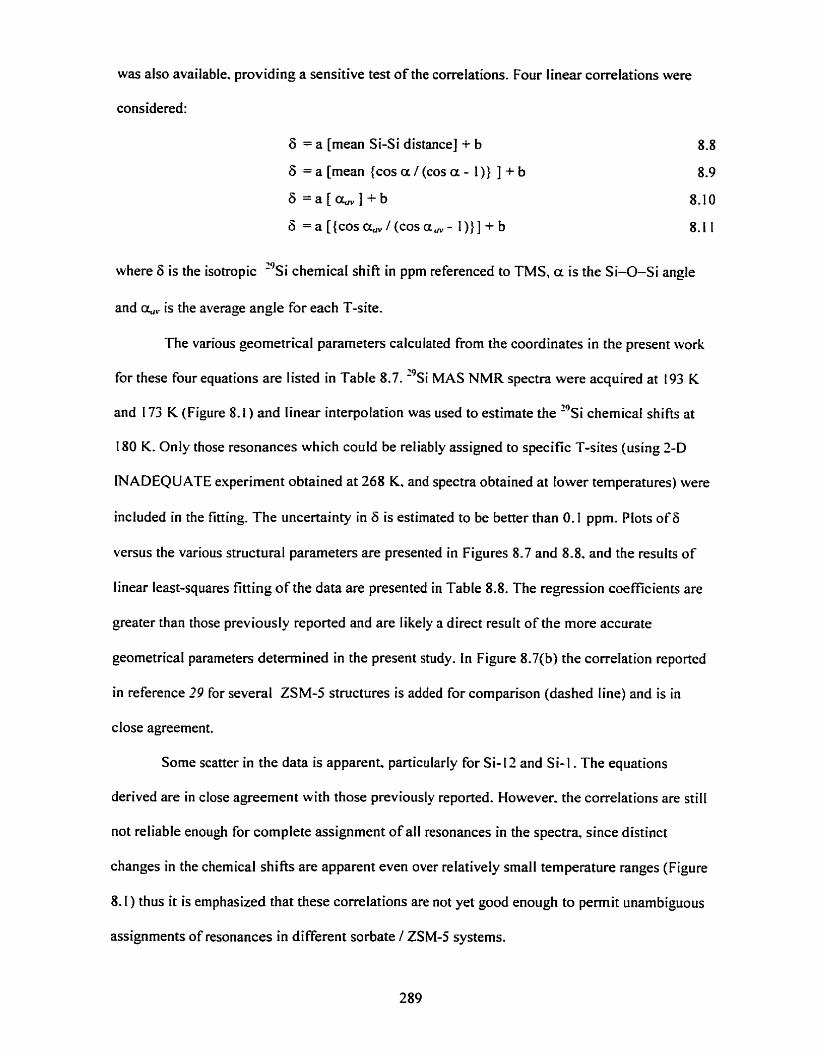
was also available, providing a sensitive test of the correlations. Four linear correlations were
considered:
6 = a [mean Si-Si distance] +- b
6 = a [mean (cos a / (cos a - 1)) j + b
6 = a [ c r , ] + b
6 = a [(COS o ~ , / ( c o s ~ , - l))] + b
where 6 is the isotropic 2 9 ~ i chemical shifi in ppm referenced to TMS, a is the Si-O-Si angle
and g,. is the average angle for each T-site.
The various geometrical parameters calculated from the coordinates in the present work
for these four equations are listed in Table 8.7. "si MAS NMR spectra were acquired at 193 K
and 173 K (Figure 8.1 ) and linear interpolation was used to estimate the I9si chemical shifis at
t 80 K. Only those resonances which could be reliably assigned to specific T-sites (using 2-D
MADEQUATE experiment obtained at 268 K. and spectra obtained at lower temperatures) were
included in the fitting. The uncertainty in 6. is estirnated to be better than 0.1 pprn. Plots of 6
versus the various structural parameters are presented in Figures 8.7 and 8.8. and the results of
1 inear least-squares fitting of the data are presented in Table 8.8. The regression coefiicients are
greater than those previously reported and are likely a direct result of the more accurate
geometrical parameters deterrnined in the present study. In Figure 8.7(b) the correlation reported
in reference 29 for several ZSM-5 structures is added for comparison (dashed Iine) and is in
close agreement.
Some scatter in the data is apparent. particularly for Si-12 and Si-1. The equations
derived are in close agreement with those previously reported. However. the correlations are still
not reliable enough for complete assignment of al1 resonances in the spectra, since distinct
changes in the chemical shifts are apparent even over relatively smal 1 temperature ranges (Figure
8.1) thus it is emphasized that these correlations are not yet good enough to permit unambiguous
assignments of resonances in different sorbate 1 ZSM-5 systems.

Table 8.7 "si chemical shifts and structural parameten for ZSM-5 loaded with 2.85 molecules of p-xylene l U.C. at 1 80 K.
Chernical Mean Mean Mean T-Site Shift S i-O-S i cosg , / [ cosa , - I l S i-S i
cos a l [cos a- 11 5 (ppm)' angle & ( O ) Distance (A)
' Chernical shifts are referenced to TMS and were estimated from interpolation of spectra acquired at 173 K and 193 K. Only those resonances which could be unambiguously assigned to speci fic T-sites are iisted.
Table 8.8 Linear regression analysis of L 9 ~ i chemical shifu 6 against the various geometric parameters indicated for ZSM-5 loaded with 2.85 molecules ofp-xy1enelu.c. at 180 K.
X Linear Regression Correlation Coefficient R'
Mean Si-O-Si angle a,, (O) 6 = -0.72 X - 4.12 0.967
Mean cos a / [cos a - 11 6=-317.52X-35.14 0.973
COS au" / [cos aoy - 1 ] 6 = - 1 67.76 X - 34.62 0.973
Mean Si-Si Distance (A) 6 = - 123 -65 X - 270.09 0.96 1

Mean cos a / [cos a - 11
Figure 8.7 NMR and XRD correlation diagrains for zeoIite ZSM-5 containing 2.85 molecules of p-xylene / U.C. at 180 K. Only those NMR resonances which could be unambiguously assigned to specific T-sites are included. (a) Plot of chernical shift 6 versus the mean Si-O-Si angle G. (b) Plot of 6 vs. the average of cos a / [cos a - 11. Equations for the linear regressions (sotid lines) are given in Table 8.8. The dashed line in (b) is the correlation reported in reference 29 for several ZSM-5 structures.

O .44 0.45 0.46 0.47 0.48 0.49 0.50
cos a,/ [cos cl, - 11
3.06 3.07 3.08 3.09 3.10 3.11 3.12 3.13 3.14
Mean Si-Si Distance (A)
Figure 8.8 NMR and XRD correlation diagrarns for zeolite ZSM-5 containing 2.85 molecules of p-xylene 1 U.C. at 180 K. Only those NMR resonances which could be unambiguously assigneci to specific T-sites are included. (a) Plot of chernical shift 6 versus cos a / [cos a - 11 for the average Si-û-Si angle a,. (b) Plot of 6 vs. the mean Si-Si distance. Equations for the linear regressions (solid lines) are given in Table 8.8.

8.4 SUMMARY AND CONCLUSIONS
The structure of ZSM-5 Ioaded with 2.85 molecules per unit cell ofp-xylene was
determined from refinement o f single crystal X-ray diffraction data. This is the first structure
determined for a volatile organic sorbed in ZSM-5 at a controlled loading and was achieved
using a specially-designed, purpose-built apparatus. The diffraction data were coIIected at 180 K
using a diffractometer with a CCD detector, and a virtually complete hemisphere of independent
Bragg reflections were accumulated, allowing the most accurate determination of the structural
parameters for the ZSM-5 framework reported to date.
The sorbed p-xylene molecules were located in the straight channels at the intersection
with the sinusoidal channels, and have their methyl-methyl axes esactly parallel to [O 101. The
orientation is in good accord with those previously observed for the other low-Ioaded ZSM-5 /
sorbate complexes. and agrees closely with those proposed determined from energy rninimization
calculations.*." and powder XRD.~'
Recent NMR investigations of the low-loaded p-xy lene / ZSM-5 complex have been
utilized to predict the sorbate location and orientation, and the resulting solution corresponds
very closely to that determined in the present XRD structure detemination.'- These results prove
that the NMR techniques described in this thesis can be used to determine the locations(s) and
orientation(s) of guests species within the channels of microporous materials such as zeolites.
With appropriate precautions and suitable data analysis strategies (for example based on the
methods outlined in Chapters 3 and 6), cross polarization, REDOR, and TEDOR NMR
experirnents should permit the three-dimensional structure of host-guest structures of sorbates in
microporous materials to be determined. In cases when single crystal X-ray diffraction methods
are not practical, the techniques developed in this thesis provide powerful and effective tools
which have the potential to greatly expand the understanding of these important materials.

SUPPLEMENTARY DATA FOR CHAPTER 8
The following supplementary data are Iisted in Appendix Ci:
Table G.1 Anisotropic displacement factors For Si. O and C.
Table G.2 Bond lengths in the ZSM-5 framework.
TabIe G 3 Bond angles in the ZSM-5 fmework.
REFERENCES FOR CHAPTER 8
Diaz A.C.: Fyfe. C.A. Personal communication.
(a) van Koningsveld. H.: van Bekkum. H.: Jansen, J.C. Acta C w . 1987. B43, 1 27. (b) van Koningsveld. H.; Tuinstra, F.: van Bekkum, H.: Jansen. J-C. Acta Crysf. 1989. B4j. 423.
van Koningsveld. H.: Jansen, J-C.: van Bekkum, H. Atm C ~ s t - 1996, B57. 140.
van Koningsveld. H.: Jansen, J-C.: de Man. A.J.M. Acta Ctysf. 1996. B52. 13 1.
Reck. CI.: Marlow. F.: Komatowski, J.: Hill. W.: Caro. J.J. Chem. Phys. 1996. 100. 1698.
van Koningsveld. H.; Koegler. J.H. !Micropororrs lGIater. 1997. 9. 71.
van Koningsveld. H.: Jansen. J-C. bficroporoiu hfaier. 1996.6. 159.
Reischman. P.T.: Schmitt. K.D.: Olson. D.H. J. Phys. Chem. 1988, 92.5 165.
Cheetham, A.K.; Bull, L.M. Cutaf. Left.1992, 13. 267.
Bell. R.G.: Lewis. D.W.: V o i s P.: Freeman, C.M.: Thomas. J.M.: Catlow. C.R.A. Strrd Surf: Sci Caial. 1994. 84. 2075.
Gies. H.; Marler. B.: Fyfe, C.A.: Kokotailo, G.T.: Feng Y.: Cos, D.E. J. Phys. Chrrn. Soli&. 1991,152. 1235.
Kokotailo, G.T.; Lawton, S.L.: Olson, D.H.; Meier. W.M. Nufure. 1978, 672.43 7.
Wu. E.L.; Lawton. S.L.; Olson. D.H.; Rohrman. AC.. Kokotailo, G.T. 1 Cheni. Phys. 1979.83,2777.
van Koningsveld, H. Acia Cryst. 1990, B46, 73 1 .
van Koningsveld, H.; Jansen, J.C.; van Bekkum, H. Zeolites 1990,10,235.

16 Fyfe. C.A.: Kennedy, G.J.; Deschutter. C.T.: Kokotailo. G.T. J. Chern. Soc., Chrrn. Commzcn. 1984. 54 1 .
17 Strobl. H.: Fyfe. C.A.: Kokotailo. G.T.: Pasztor. C.T. J. Am. Chem. Soc, 1987, 109.4733.
18 Fyfe, C.A.: Gies. H.: Kokotailo, G.T.: Marier. B.: COL D.E. J. Phys. Chern. 1989. 94.371 8.
19 Fyfe, C.A.; Strobl. H.; Gies, H.; Kokotailo. G.T. Can. J , Chem. 1988.66. 1942.
20 Fyfe, C.A.: Strobl. H.: KokotaiIo. G.T.: Kennedy. G.J.: Barlow. G.E.J. Am. Chem. Soc. 1988, 110,3373.
21 Fyfe,C.A.:KokotaiIo,G.T.:Strob1, H.:Gies.H.: Kennedy,G.J.:Pasztor,C.T.:Barlow. G. E. in Zeolites as Catalysts. Sorbents and Detergent Builders. p. 827. Karge. H.G.: Weitkamp, J. Eds. Elsevier. 1989.
22 High-Resolution So Iid-State NbfR of Silicates und Zeolites. Enge l hardt. G .. Miche 1. D .. JO hn Wiley and Sons. 1987.
23 Modelling of Strzrctlires and Rract iviîy in Zeolites. Cat low, C.R.A., ( Ed. ) Academic Press: London. 1992.
24 Mentzen, B.F: Vigné-Maeder. F. Mat. Res. Bull. 1987.22.309.
25 Bosselet. F.: Sacerdote, M.: Bouix, J.: Mentzen, B.F. Mat. Res. Bull. 1990.25.443.
26 Pickett. S.D.: Nowak, A.K.: Cheetham, A.K.; Thomas. J.M. ibfokrc. Simzrl. 1989.2.353-
27 Diaz A C . Fyfe. C.A. Unpublished work Chemistry Dept.. University of British Columbia. Canada.
28 Oison, D.H.: Kokotailo, G.T.; Lawton, S.L.; Meier, W.M. J , Phys. Chrm. 1981. 85. 2-38.
29 Fyfe, C.A.: Feng. Y.: Grondey, H. iclicroporous Mater. 1993. 1.393.
30 Smith, J.V.; BlackwelI. C.S. Nature. 1983,303,223.
31 Grimmer. A.R.; Radeglia R. Chrm. Ph-vs. Lett., 1981, 106.262.
32 Fyfe, C.A.: Strobl. H.; Kokotailo, G.T.; Pasztor, C.T.; Barlow, G.E.: Bradley, S. Zrolites. 1988,8. 132.
33 Thomas, J.M.; Klinowski, J.: Rammdas, S.: Hunter, B.K.: Teenakoon. D.T.B. Clirnz. Phys. Lett. 1983, 102, 158.
34 Ramdas, S.: Klinowski, J. Native 1984.308,52 1 .
35 Engelhardt, G.; Radeglia, R. Chem. Phys. Lett. 1984. 108,17 1 .
36 Derouane, E.G.: Hubert, R.A. Chem. Phys. Lett. 1986,132,3 15.
37 Fyfe, C.A.: Grondey, H.; Feng, Y.; Kokotailo. G.T. J. Am. Chem. Soc.. 1990, 112,88 12.
38 Engelhardt, G.; van Koningsveld. H. Zeolites, 1990, 10, 650.
295

39 Kennedy. G. J. Ph.D. Thesis University of Guelph. t 985.
Fyfe, C.A.; Strobl, H.: Kokotailo. G.T.; Kennedy, G.J.: Barlow. G.E. J. Anz. Chem. Soc- 1988. 110,3373.
Baerlocher, C, in "Proceedings of the Vith International Con ference on Zeolites" 1 O- 1 5 July. 1983. Reno, Nevada. USA. Olson. D.H., Bisio, A. (eds) Butterworths. 1984 p. 823- 833-
SHELXL-97: Progrom for the Refinement ofCrysta1 Structures. Sheldrick. G., University of Gottingen, Germany, 1997.
Wilson. A.J.C. .k ta Ctyst. 1976, ,432,994-
FundurnentuIs of CqrtcdIography. G iacovazzo. C . ( Ed. ). Oxford U niversiiy Press. 1 992.
D*TREK s o f ~ u r e for SGI Molecular Structure Corporation. 3200 Research Forest Drive. The Woodlands, Texas. TX 773 8 1. U.S.A. http://www.msc.corn/
teYsun for Windorvs 1.01 Molecular Structure Corporation. 3 200 Research Forest Drive. The Woodlands, Texas, TX 7738 1, U.S.A. http://~~vw.msc.com/
International Tubles for CrystaIIography. Hahn, T. (Ed.): Kluwer Academic Publishers. Dordrecht, 1993. Volume A.
ORTEP-3 for Windorvs. Johnson, C.K.: Burnett. M.N.: Fanugia, L.J. Department of Chemistry, University of Glasgow. U.K. 1998. http://www.chern.gla.ac.uk/-louis/ortep31
PLATON-98 for Winrlows. Speck. A.L: Farrugia, L.J. Department of Chemistry. University of Glasgow, U.K. 1998. fmp://www.chem.gla.ac.uk/-louis/platon97~
Breck. D.W. Zeolite ~Molectriur Skves. John Wiley, New York, 1974, pp 636-637.

CHAPTER 9
CONCLUSIONS AND SUGGESTIONS FOR FUTURE WORK
9.1 SUMMARY AND CONCLUSIONS
The purpose of the research reported in this thesis was to develop solid-state NMR
techniques which could be used to determine the three-dimensional structures of guest-host
complexes. In particular, these investigations were directed to developing an experimental
protocol and the necessary data anatysis techniques to locate guest species within the channels
and cages of microporous materials such as zeolites. Although the results reported here are for
fluorine-contain ing guest species in purely sil iceous materials. these techniques can be readi Iy
extended to other investigate other systems containing spin- 1/2 nuclei.
The general strategy developed was as follows: First, the resonances in the 2 9 ~ i MAS
NMR spectrum need to be assigned to specific T-sites within the zeolite framework. This can be
accomplished using, for exarnple, 2-D [NADEQUATE experirnents. The next step is to
determine specific internucIear distances between nuclei in the guest species and the framework
(Si) atoms. Knowledge of three or more such distances may be sufficient to locate the guest
within the channels and cages of the host lattice. The approach adopted in the present work was
to use the MAS NMR techniques of cross polarization (CP), REDOR and TEDOR. In pririciple,
these techniques allow the magnitude of the 1-S heteronuclear dipolar coupling to be rneasured,
and since this is inversely proportional to the cube of the 1-S distance, they provide direct
methods to measure the necessary distances.

Octadecasil, a clathrasil which contains encapsulated fluonde ions, was selected as the
model compound for optimizing the experimental techniques, spectrometer configurations, and
f 9 data analysis methods. F-'~s~ CP, REDOR and TEDOR NMR experiments were performed.
The Si-F distances between the T-1 Si and the fluoride ion in the D4R unit determined directly
from these three techniques were in exceilent agreement with that known from the single crystal
XRD structure.' Because of the low natural isotopic abundance of ' 9 ~ i , and because the closest
fluoride-fluoride distance in octadecasil is > 9.3 A, the T-1 silicon / fluoride ion closely
approximates an isolated I9F-"si spin pair. Nonlinear Ieast squares fitting of the CP data was
made possible by expressing the equations derived by Hediger er al.' in terms of Bessel
functions.
From these experiments it was concluded that when the spin system can be described as
an isolated IS spin pair, the distances determined from CP, REDOR and TEDOR should be. in
principle, of comparable accuracy. However, the three techniques have quite different
dependencies on the various relaxation properties of the nuclei in the systern being investigated,
and this provides some degree of flexibility for selecting the method(s) best suited to a particular
sampte. In any case, it is highly recommended that at Ieast two of the techniques be used to
validate the results. Because the REDOR zxperiment provides normalized data, it can sometimes
provide additional information about the nuinber of S spins which are not dipolar coupled to an I
spin, which may be useful to determine site occupancies for example.
For the T-2 site in octadecasil. the analysis of the experimental data was complicated by
the fact that up to four I9F nuclei were dipolar coupled to the 1 9 ~ i nucleus. However, when the
tetrahedrd arrangement and partial occupancies (known from the crystal structure) of the D4R
units by the fluoride ions was included in the theoretical calculations, good agreement was
obtained between the calculated and observed REDOR and TEDOR dephasing. It was necessary
to extend the approach reported3 for multi-spin REDOR calculations to permit fitting of the
TEDOR data. These results represent the fint ' 9 ~ - 2 9 ~ i REDOR and TEDOR expenments
reported in the literature: as well as the first multi-spin TEDOR analyses.
A series of calculations on a selection of 3-spin, 1-S systems was pefiormed to gain
insight into the Iikelihood of being able to obtain reliable distance information from analysis of
REDOR and TEDOR data acquired on systems where Little or no information regarding the
number of spins. or the geometrical arrangement of these, is available. It was apparent that even
for the simple systems studied, it is highly unlikely that direct and unambiguous distance
determinations can be obtained. The problem wiIl be compounded when the noise present in
experimental data is considered, and more spins andor relative motions are present.
Furthemore, it is possible to obtain erroneous distances if an isolated spin pair is assumed and
multiple spins are in fact present.
Thus the best approach will be to try and ensure that the spin system approximates an
isolated spin pair as closely as possible, (e-g. by isotopic substitution and dilution in the
unlabeled compound), or several isolated spin pairs. If this is not possible. the only alternative is
to acquire several REDOR and TEDOR data sets (with different parameters), then propose a
model of the spin system which fully describes the relative geometric arrangement (Le. with al1
angles and distances impticitly defined). Using this model, the theoretical dephasing can be
calculated and compared to the experimental data. The mode1 is modified and the calculations re-
run until optimal agreement between the calculated and experimental dephasing is obtained for
al1 of the experimental data sets. With this approach, there will be no direct deteminations of
distances, but structural information can still be (indirectly) obtained. This method wiil be most
eficient if constraints can be placed upon the mode1 which limit the possible nurnber of spins
and intemuclear distances. This may be the case for sorbate rnolecuies in zeolites since the guests
must lie within the channel systern.
The low-loaded form of thep-difluorobenzene / ZSM-5 complex was chosen as a test
case for applying these NMR techniques to a system where no prior information about the

location of the sorbate rnolecules within the channel systems was available. Loading ZSM-5 with
4 molecules ofpdifluorobenzene pet unit cell caused the h e w o r k to change from monoclinic
(PZ,/n. 1. I symmetry, 24 T-sites) to a phase having 12 T-sites at temperatures above ca. 293 K.
From the appearance of the "si MAS NMR spectra, orthorhornbic Pnma symmetry is proposed
for this phase. as has been reported previously for three other low-loaded, puru-disubstituted
arornatic / Z S M J complexes."' Loadings higher than 4 molecules/u.c. could not be obtained for
samp les prepared at ambient pressure and temperature. even when excess p-difluorobenzene was
added.
Cooling the sample below 290 K resulted in a transformation back to a phase having 24
T-sites, which was maintained to the lowest temperatures accessible (2 15 K). The 19si NMR
chemical shifts observed for this phase indicated that it was almost identical to the rnonoclinic
phase adopted by the ernpty Z S M 5 framework. Equipment and an experimental protocol were
developed which allowed experirnents with stable MAS rates to be performed at low
temperatures for periods of 2 days or longer. It was found that dry air (rather than nitrogen)
should be used as the drive gas for the low temperature experiments, in order to prevent the loss
of the oxygen gas from within the sample. The nuclear relaxation times of both the sorbates and
framework nuclei are dependent on the concentration of paramagnetic oxygen. becoming
signi ficantly longer as the concentration decreases.
The success of 'H-"s~ and 1 9 ~ - ' 9 ~ polarization transfer observed during CP experiments
proves that the sorbate rnolecules remain within the ZSM-5 channel system during, and after, this
phase transition. The orthorhornbic, Pnma and monoclinic, PZi/n.l . ï symmetries proposed for
these two phases were subsequently verified and the lattice constants determined from analysis
of powder XRD data. A partial assignment of the ' 9 ~ i resonances to specific T-sites was obtained
from analysis of 2-D CP-NADEQUATE experiments.
The relatively high temperature (290 K) at which the framework changed to adopt the
same (monoclinic) symmetry observed for the empty ZSM-5 indicates that the sorbate-

frarnework interactions are much weaker than in the case of the Iow-loaded p-xylene 1 ZSM-5
cornplex. which maintains Pnmn symmetry to temperatures at least as low as 173 K." It is
anticipated that the transformation to monoclinic symmetry for the ZSM-5 frarnework obsewed
in the present case may also occur in other sorbate 1 ZSM-5 systems at low temperatures,
Two programs were written as part of the effort to locate p-difluorobenzene within the
ZSM-5 framework. These utilize the TCP values detemined from fitting variable contact time CP
experimental data, and calculate the heteronuclear second moments as the sorbate molecule is
translated (and rotated) through the channels. The program searches for positions and
orientations which have Iinear correlations for the I/Tcp and calculated M2 values for a set of
silicons. This approach had been successfully used previously to locate the p-xylene molecules in
ZSM-5"' Using these programs. 'H-'~s~ and I9~-I9si CP data acquired at 230 K and 235 K
respectively were analyzed. It was discovered the sorbate molecules were undergoing slow
diffusion that affected the CP, REDOR and TEDOR data, and thus lower temperatures need to be
used. Although the precise position and orientation of the p-difluorobenzene molecule were not
obtained, a location in the straight channel very close to the intersection with the zig-zag
channels is consistent with the experimental data.
A single crystal of ZSM-5 was Ioaded with a precisely controlIed amount ofp-xylene
using a purpose-built piece of apparatus developed as part of the present work. The low-Ioaded
forrn of the p-xylene / ZSM-5 complex prepared contained 2.85 moIecule/u.c., and single crystal
XRD data collected at 180 K was successfully refined in the orthorhombic space group Pnma.
The p-iiylene molecules were located in the straight channels at the channel intersections, with
the methyI-methyl axes aligned paraIIel to the b axis, in general agreement with the locations and
orientations proposed previously from other techniques?i0." This structure represents the most
accurate determination of the ZSM-5 framework distances and angies reported to date.
In summary, using the NMR techniques (and analysis methods) developed in the present
work, in conjunction with the general strategy proposed, determination of the complete 3-

dimensional structures of sorbate-zeolite complexes is possible, At the present time however. it is
not routine. and care must be taken to ensure that: (0 the spin system approximates isolated spin
pairs if at a11 possible, (iî) the guest molecules are not rnoving on the tirne scale of the dipolar-
based NMR experiments.
19si MAS NMR experirnents c m provide direct information about the nurnber of T-sites
for sorbate / zeolite complexes. When used in conjunction with powder X-ray diffraction data
the space group symmetry, cel! parameten, and temperatures at wh ich phase transitions (if any )
occur can be detemined. This information is invatuable for determining the best loadings and
temperatures for collecting single crystal XRD data.
9.2 SUGGESTIONS FOR FUTURE WORK
For the p-difluorobenzene 1 ZSM-5 compleq additional [NADEQUATE experiments are
needed at several temperatures to confirm the preliminary assignment. Further experiments at
temperatures lower than 230 K could slow the sorbate diffusion enough that the molecu!es could
be reliably located using CP, REDOR and TEDOR experiments. Static 'D NMR investigations of
p-difluorobenzene-d4 in ZSM-5 could provide information about the nature of the sorbate
motions, and be used to probe the temperatures at which these are minimized, Several single
crystals of ZSM-5 loaded with ca. 4 molecules/u.c. ofp-difluorobenzene have been prepared. and
X-ray diffraction data acquired at 180 K and room temperature. A structure determination will be
attempted in the near future.
The techniques developed in this thesis could be applied to locate sorbates in other
zeolite frameworks where highly crystalline, purely siliceous samples are available (e-g.
mordenite. ZSM-1 1, and ZSM-12). These techniques may also allow the fluoride ions to be
located in other microporous materials synthesized from fluoride-containing media (e.g. the as-
synthesized AIPOIS and GaPOs) using I9~-"p CP, REDOR, and TEDOR. It is important that
methods are developed which can be used to determine if the spin system can be treated as

consisting of isolated spin pairs. Although selective isotopic enrichment combined with dilution
in the corresponding unlabeled compound sometimes provides a possible solution. it is not
always an option.
The algorithm used to perfom the powder averaging needed to calculate the theoretical
dephasing in the present work is very computationally intensive, which significantly hinders
fitting experimental multi-spin data within a reasonable time period. Methods which could be
implemented to increase the eficiency of the powder averaging include the approaches proposed
by Aldemann er al.." Wang and anso on," and the recently reported REPULSE algorithm.14
The measurement of heteronuclear dipolar couplings for isoIated IS spin pairs using CP,
REDOR and TEDOR is relatively straightforward. However, once the observed nuclei are
coupled simultaneously to two or more spins (Le. i&!? spin systerns) the determination of
unam biguous distance information is virtually impossible without some prior know ledge of
(fairly explicit) information regarding both the number of spins, and the relative geometrical
arrangement of these. A new technique, O-REDOR, has recently been presented" which seeks to
reduce these problerns, and this should be investigated.
The NMR techniques developed in this thesis to deterrnine intemuclear distances from
measurements of the heteronuclear dipolar interactions may be applied to other systems
containing spin-112 nuclei. Related techniques have been developed for non-spin 1/2 stems,'^.'-
which may allow cations such as to be located, or framework-sorbate distances to be
obtained in aluminium-containing materials. There are also several techniques for measuring
hornonuc lear dipolar coupl ings,"." and these rnay provide a rneans to deterrnine sorbate-sorbate
distances, and investigate the problem of disordered sorbate moIecuies. which will be very
difficult or impossible to solve by diffraction techniques..
One of the most important areas which offers the potential for advancing the current
knowledge is to enlarge the database of reliable sorbate / zeolite structures. At present time,
single crystal XRD structures still represent the most unambiguous method for determining the

positions and orientations of guest species within rnicroporous materials. However, the
experimental protocol developed in this thesis are at the stage where it is viable to determine the
three-dimensional structures of sorbate / zeolite complexes from solid-state NMR investigations.
Using the special apparatus developed in the present work (Chapter 2), it is now possible to load
single crystals of these materials with precisely controlled amounts of volatile organic sorbates
(or even mixtures). High-quality XRD data can be colIected at low temperatures using a
diffractometer equipped with CCD or image plate detectors. and the structures determined. At
the present time high quality single crystals of ZSM-5 and zeolite A are available which are large
enough for single crystal X-ray diffraction studies. Furthemore the synthesis of single crystals of
AIP04-5 and mordenite having dimensions suitable for single-crystal XRD studies have been
reported." These single crystal structure determinations should be carried out.

REFERENCES FOR CEIAPTER 9
Caullet. P.; Guth, J. L.; H m , J.; Lamblin, J. M.; Gies, H. Eur. J . Solid Sfute inorg. Chem 1991,38. 345.
(a) Hediger, S. Ph.D. Dissertation, Eidgen6ssische Technische Hochschule, Zürich. Switzerland, 1997. (b) Hediger, S.; Meier. B.H.; Ernst, R.R Chem. Phyx Left. 1995.240, 449.
Goetz, J.M.; Schaefer. J. J. Magn. Reson. 1997, 127, 147.
Fyfe, C.A.; Lewis. A.R.: Chézeau, S M . ; Grondey, H.J. Am. Chem. Soc. 1997.119. 12210.
van Koningsveld, H.: Jansen, J.C.; de Man, A.J.M. Acta Cryst. 1996, B52. 13 1.
van Koningsveld, H.; Koegler, J.H. Microporous Maier. 1997,9.7 1 .
Single crystal XRD structure of low-loaded p-xylene / ZSM-5 complex. (Chapter 8).
Diaz, A.C., Fyfe. C.A. Unpublished Results. University of British Columbia, Canada.
Fyfe, C.A. Diaz. A.C.; Lewis. A.R.; Chézeau, J-M.: Grondey, H.; Kokotailo. G.T. in Soiid- Sfafe !'fII.fR Specfroscopy of lnorganic Muteriais. Fitzgerald, J.J. (Ed.) ACS Svrnposium Series. In Press.
10 Mentzen, B.F; Vigné-Maeder. F. Mur. Res. B ~ t l i . 1987.3.309-
11 Reischman. P.T.; Schmitt, K.D.; Olson, D.H. J. Phys. Chem. 1988, 92.5 165.
12 Alderman. D. W.; Solum, M.S.: Grant. D.M. J. Chem Phys. 1986,84,3 7 1 7.
13 Wang. D.; Hanson, G.R. J. hfagn. Reson. Ser. A. 1995,117, 1 .
14 Bak. M.: Nielson, N.C.J. Magn. Reson. 1997. 125, 132.
15 Gullion, T.: Pennington, C.H. Chem. Phys. Leff. 1998,290, 88.
16 Bennett, A.E.; Grifin, R.G.; Vega, S. in Encyclopedia of Nzdear Magne fic Resonance. Grant. D.M.: Harris, R.K. (Eds.) John Wiley and Sons, 1 996. p. 2390.
1 7 (a) Schmidt, A.; McKay, R.A.; Schaefer, J. J. Magn. Reson. 1992, 96,644. (b) Gullion, T. Chem. Phys. Lett. 1995,Z 46,325. ( c ) Grey, C.P.; Veeman, W.S.; Vega A.J. J. Chem Phys. 1993,98,77 1 1 .
18 (a) Gtiffiths, J.M.; Bennett, A.E.; Grifin, R.G.in NblR Basic PrincÏpies und Progress. 1994, 33, .1 (b) Lee, Y.K.; Kurur, N.D.; Helmle, M.; Johannessen, O.G.; Nielsen. N.C.; Levitt. M.H. Chem. Phys. Lett. 1995,242,304. (c) Bennett, A.E.; Weliky, D.P.; Tycko, R. J. Am. Chem. Soc. 1998, 120,4897. ( d ) Sun, B.-Q., Costa, P.R.; Kocisko, D.; tansbury, P.T.; Grifin, R.G. J. Chem. Phys. 1995,102,702. (e) Rayleigh, D.P.; Levitt, M.H.; Griffin. R.G. Chem. P&sS Leff. 1988, 1 46, 7 1. (f) Zhu, E.; Klug, C.A.; Schaefer, J. J. Magn. Reson. Ser. A. 1994,108, 12 1. (g) Gullion, T.; Vega, S. Chem. Phys. Lett. 1992,194,423.
19 Linder, G.-G.; Marlow, F.; Hoffmann, K. Proceedings of fhe I1fh In/emafional Zeoiife Conference, Seoul, Korea, August 12- 1 7 1996.

SCHEMATICS OF NMR SPECTROMETER CONFIGURATIONS
Three different configurations of the Bruker MSL 400 NMR Spectrometer were used to
perform the experiments reported in this thesis. Schematics showing the connections. amplifien.
synthesizers, filters, and attenuators are presented in this appendix.

Schematics for the three spectrometer contigurations are given in Figures A 1. A2 and A.3.
Abbreviations used in these figures are Iisted in Table A. 1. Many of the experiments performed
in the curent investigations required non-standard configurations because F3 could not be
directIy observed, which meant either the F 1 (range 10 - 400.13 MHz) or the F2 (400.13 MHz
only) receivers had to be utilized.
Figure A.1 Schematic of set-up used for "si spectroscopy with high power 'H decoupling. and
for ' H-'~S~ cross polarization experiments.
Figure A.2 Schematic of set-up used for ' 9 ~ - 2 9 ~ i CP, REDOQ and TEDOR NMR experiments
with mixing of F2 and F3 to generate the I9si frequency. The phase control of the
"si signal was achieved using a single (constant) r.f. phase for F3 and varying the
19 F2 phase. F could be observed directIy using the F1 receiver (with FI frequency
set to 376.434 MHz) if the appropriate connections to the F2 prearnplifier insert ('H
I "F) were made.
Figure A.3 Schematic of set-up used for ">F-"si CP, REDOR. and TEDOR NMR experiments
without the need for frequency mixing. The "F frequency was generated by tripling
F3 and this means that the r.f. phases were also tripled (see Table A.?). The phase
cycling used in the pulse programs needed to take this into consideration. ' 9 ~ could
be observed using the F 1 receiver if the appropriate connections to the F2
preamplifier insert (' H / 1 9 ~ ) were made, and the F3 carrier frequency (SFF3) and
offset (03) were set to one-third of those for F 1 (SF and 01 respectively), ln this
case, these frequencies had to be multiples of 100 Hl as required by the
specifications of the F3 synthesizer (Programmed Test Sources PTS-250).

Table A.l Abbreviations used in the Spectrometer Configuration Schematics.
TabIe A.2 Phases of the F3 signal before and after tripting.
Abbreviation
BP
EXT STD
HP
INT STD
LP
REJ
RF
Meaning
Band Pass
Extemal Standard
High Power
Interna1 Standard
Low Pass
Reject
Radio Frequency
BEFORE Tripling
+x (O0) +Y (90')
-X (1 80")
-Y (270")
AFTER Tripling I
+x (O0) -Y (270')
-X (540" 180")
+Y (8 1 0°= 90')

1 - " " " - ' - - - " - - " - - - - *
I I
I PTS-250 SYNT HESIZER (F3) : PTS-IO 1 SYMïiESIZER (F2) PTS-200 SYNTHESIZER (FI ) I I
I
EXT INT 10 MHz lOMHz E.Xï INT IOMHr 10Mk E,YT INTIOMHz 10 MW2 I I STD STD OUT MA'N IN I STD STD OUT iN STD STD OLlT IN I I
OUTPUT
9 d OUTPUT
I ?
I I I 1 F3 F2 F 1 1 1 I
MODULATOR I
1
NOT USED
l I MN-CIRCUIT l AmENUATORS
I I AMT PULSE AMPLLFIER (F3) \ i
MODULATOR
400 MH=
MAN CONSOLE
Figure A.l Schematic of MSL 400 spectrometer configuration used to perform 'H 1 "si experiments. The 'H channel connections shown are those for high power decoupling or cross polarization.

PTS-250 SYNTHESIZER (F3) PTS-10 1 SYNTHESIZER (F2) PTS-300 SYNTHESIZER (F 1 )
(25 dB TOTAL) TEXSCAN
1 3DBSO / 4-3-CD
AMT PULSE AMPLIFIER (F3) 1
. . . . . . . . . . . . . . . . HIGH POWER CABINET
HIGCI TO HP FZ POWER CABINET RF IN
a 3 U
R IN From F l Frorn FZ
13
80 :CIHz
150 MHz LP FILTER \
FROM "'1 \
Figure A.2 Schematic of MSL 400 spectrometer configuration used to perform "F / "si experiments with mixing. The 2 9 ~ i frequency (79.495 MHz) was generated by rnixing F2 (100.13 MHz) with a fiequency-doubled F3 signal ( 1 60.3 125 MHz). The 2 9 ~ i signal was then unmixed and observed at 400.13 MHz. The ' 9 ~ frequency (376.434 MHz) was generated directly.
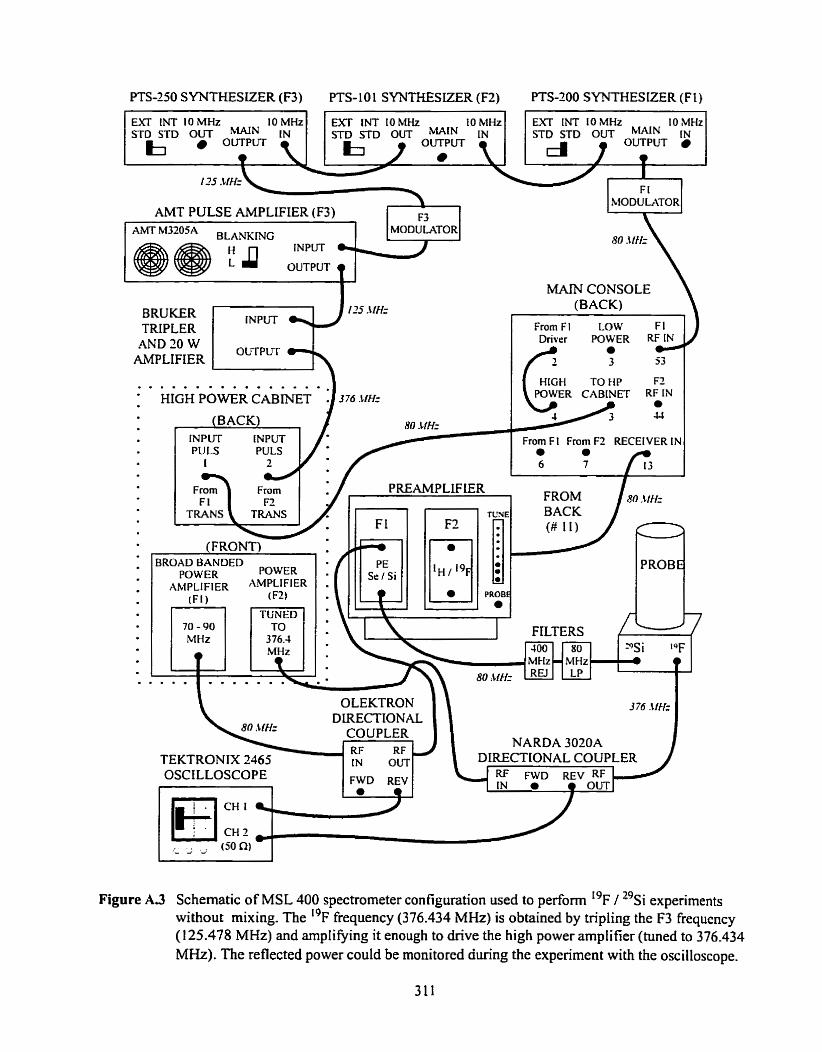
PTS-250 SYNTHESIZER (F3) PTS-IO 1 SYNTHESIZER (F2) PTS-200 S W H E S I Z E R (F 1 )
EXT [NT 10 MHz 10 MHz E n INT IO MHz 10MHr EXTINTlOMHz IO ,MHz STD STD OUT '%%IN IN STû STD OUT -IN IN
OUTPUT STD STD OUT 'IAIN IN
b OUTPUT \ b J OUTPUT 9
F 1 MODU LATOR
AMT PULSE AMPLIFIER (F3) F3 AMT M3205A BLANKING MODULATOR
i
MAiN CONSOLE
BRUKER TRIPLER
AND 20 W OUTPUT
AMPLIFIER
. . . . O . . . . . o . . . HIGH TO HP FZ
POWER CABINET RF IN
PREAMPLLFER
BROAD BANDED PROBE
400 80
80 .Wk
3 76 1ftk DIRECTIONAL COUPLER
NARDA 3020A TEKTRONIX 2465 iN OUT DIRECTIONAL COUPLER OSCILLOSCOPE FWD REV
Figure A 3 Schematic of MSL 400 spectrometer configuration used to perform 1 9 ~ I 2 9 ~ i experiments wiihour mixing. The ' 9 ~ frequency (376.434 MHz) is obtained by tripling the F3 frequency ( 1 25.478 MHz) and ampIi@ing it enough to drive the high power amplifier (tuned to 376.434 MHz). The reflected power could be monitored during the experiment with the oscilloscope.

APPENDLX B
PULSE AND AUTOMATION PROGRAMS
This appendix contains a compilation of the pulse and automation programs written to
perform the NMR expetiments reported in this thesis. They are wrinen for a Bruker MSL-400
running DISMSLB 1. Details of the command and programrning structure may be found in the
DISMSL Manual (version 9 1 1 10 1 ) :
Bruker Analytische
Messtechnik GMBH
Silberstrifen
D-75 12 Rheinstetten 4
Germany
Bmker Instruments, Inc.
Fortune Drive
Manning Park
Billerica, MA 0 182 1
U.S.A.
Pulse programs are included for the three spectrometer configurations shown in
Appendix A: (i) 'H on F2 (400.13 MHz) and ''si (79.495 MHz) on FI, (ii) "F on FI (376.434
MHz) and ' 9 ~ i obtained by miaing F2 with (frequency-doubled) F3. and (iii) ->si on FI with 1 9 ~
obtained by tripling and ampliQing F3. The programs include esamples of scripts cornpiled to
measure pulse lengths, relaxation times. and to acquire CP, REDOR, TEDOR. and
INADEQUATE spectra. Several automation prograrns used to acquire or process the spectral
files, and to calculate delays for REDOR and T EDOR experiments are also given. Standard pulse
programs available with the DISMSL software have not been included. A complete listing of the
filenames and a brief description of the specific function of the each program script is given
below.

B.1 INDEX OF PROGRAMS
B. 1.1 Single Nucleus Experiments
HSOLIDC-PC One-puise experiment for FI.
HQUA D F2F.PC One-pulse e-rperiment for FYF3 wifh miring ofF2 and F3.
LQUADF3 .PC One-pulse experimenf for F3 withfiquency tripfing on F3.
B.l.2 Pulse Length Determination
LVD 1 .AUM Automation ro vary pulse lengfh DI.
L90FSI.PC Memurement of F?/F3dZ-pziise using CPfi.om fripled F3.
L 1 80FSI.PC Meusurement of FYF3 rr-pulse rlsing CP Rom fripled F3.
B.1.3 Relaxation Time Measurements
CPTONE-PC Meusurement of FI Tl using CPfiom F2.
HCPT 1 RHO-PC Measuremenr of Fl Tl, using CPfrom F2.
B. 1.4 Cross Polarisation Experiments
HCPCYCL.PC CPfrom F2 fo FI with dtflerenf F2 power during CP and decoupiing.
LVD-AUM Aufonzation fo Vary contact fime (VD) using a variable drfay lis[.
LFSICPD-PC CPfrom F3 (fripled) fo Fl with decozphg of F3 during ucquistiort.
B. 1.5 ][NADEQUATE Experirnents
HINADMAS-PC Program to acquire 2-D INADEQUATE using CPfrom F2 to FI.
LMAD2D.PC Program to acquire 2-D INADEQU. TE on FI witholrr CP.
H2DAQ.AUM Automation io acquire 2-0 INA DEQUA TE seriaifde.
HCOM B M EAUM Automation fo add rwo .SER$ies /e.g. hvo INADEQUA TE FID '.Y/.
LADDSMX.AUM Automation to addtivo .SU;Yf;ies (e.g. two NADEQUATEplots).

BJ.6 REDOR Experirnents
LREDCAL2.AUM
LRED 1 .PC
LRED2.PC
LREDCALS-AUM
LREDFID-AUM
REDOR experiment with al[ dephasing pulses on FI funobserved) und simple90- r- 180- r spin-echo sequence on FZF3 fobserved). AU dephasing pulses are postioned at 112 of the rotor cycle.
Azrtornation to caletdate deluys for LREDSIF. PCfiom pulse lengths und spinning speed.
Automation to acquire series of REDOR es-perirnents zaing LRED F3FI. PC or LREDSIF. PC by reading in ofsets for FI jfom oflset iist.
RED0 R experiment wirh dephasing pulses on FYF3 (observed) and singfe 180 pulse on unobserved FI with intiul presaturution on FYF3. r l l l dephasing pzrlses are paioned ut IR of the rotor cycle.
Automation ro euladate delays for L REDF3 F Z. PCJi-on1 pz& lengths crrrd spinning speed.
S,, REDOR experiment dephasing pzrlses on F3 (ir@Zed) with CP Rom F3. AZI dephasing pzdses are postioned at I/2 of the rotor cycle.
Sf REDOR experiment dephasing pdses on F3 (tripled) with CPfiorn F3. Ail dephasing pulses are posrioned al 1/2 of the rotor c-vcie.
Azrtomation to calculate delays for LREDI. PC and LRED2. PC@m pzrlse Iengrhs and spinning speed.
Azrromution to ucqriire series of REDOR experinienis zrsing LRED I. PC und LRED2. PC.
B. 1.7 TEDOR Experiments
LTEDF 1 F2.PC TEDOR ex-perimentjkorn FI to FZF3 with dephasing prrlsw on FYF3 BEFORE transjer und on FIA FTER transfer. AI dephasing puises positioned at I/4 and 3/4 of the rotor cycle.
TE DO RC AL-AU M Automation to cuiculate dehys for L TEDF I F2. PC from pzrlse lengths und spinning speed.
LIC4.AUM Automation to vary rn (incrernent C4'. the nzrrnber of rotor cycles AFTER coherence trunsfer with a f red nurnber of rotor cycles BEFORE tramfer.
LIC I .AUM Automation to vary n (incremen~ CI), the number ofrotor cycles BEFORE coherence transfer with a fd number of rotor cycles A FTER transfer.

LT E D M OV B. PC TEDOR experiment Rom FI to FYF3 with dephaing ptrlses on FPF3 BEFORE coherence transfer and on FI AFTER transfer. Pzdses BEFORE transfer can be MOVED kg. to 1/3, Y 3 of each rotor cycle using TEDCAL13.AUw. Pulses AFTER transfer are at I/-C und 3/4 of each rotor c~cle .
TE DCAL 1 3 .AU M Automation to cakulate delays for L TEDMO YB. PC with pufses BEFORE transfer at 1/3.2/3 and I'4. 3/4 of each rotor cycle AFTER.
LTE DMOVA. PC TEDOR experirnent from F l to FYF3 with depharing-pifses on FYF3 BEFORE transfer and on FI A FTER transfer. Pzdses AFTER trunsfer c m be 1WO VED fe.g. to 1 6 415 of each rotor cycle rrsing TEDCA L I5.A Ukr). Pulses BEFORE transfer are at I/4 and 3/4 of each rotor c y k .
TE DC AL 1 5 .AU M Automation to calculare detays for L TEDMO VA. PC ivith pulses BEFORE coherence pansfer at I/-l.3/4 and I/j. 4 6 of rach rotor cycle AFTER.
LREFTED-PC I-D refocussed TEDOR using transfer_fi.orn F3 to FI and tripiing of F3. Al! dephasing pulses positioned at I/4 and 31-1 of the rotor cycle.
LRTCALAUM Automation to colctdate defays for LREFTED. PCfronz pzrlse Iengths und spirrning speed.

B.2 PROGRGM LISTINGS
B.2.1 Single Nucleus Experimen ts
; HSOLIDC.PC ; ONEPULSE ACQUISITION WITH PHASE CYCLPNG ; (RING DOWN DELAY MDEPENDANT O F DW)
PROT P, START. D 1 [F 1 @PLS 1 RGATE] : PULSE WITH PHASE LIST 1
D3 [STA RGATE] : RING D O W DELAY AND TRfGGER AQ
LOOP C4 TIMES DO : ACQUISITION
END LOOP *PLS 1 GOTO START
BEGIN LISTS PLS1, +X-Y-X+Y RLS, +X -Y -X +Y END LISTS
: RECEIVER MODE : RPN OR QPN : TRIGGER MODE : N T
: HQUADF2F.PC : CREATION OF FREQUENCY BY MIXING OF F2 AND F3 : ONEPULSE ACQUISITION WITH QUADRATURE PHASE CYCLE
PROT F2 START. D 1 [F3 +X F2 PLS 1 * RGATE]
D3 [STA RGATEJ : RING DOWN DELAY AND TRIGGER AQ : ACQUISITION DO : RECYCLE DELAY
GOTO START
BEGIN LISTS PLSI. +X-Y-X+Y RLS. +X -Y -X +Y END LISTS
: RECEIVER MODE : RPN OR QPN ; TRIGGER MODE : NT ; REC:F2, DECOUPLER MODE DO

; LQUADFXPC : ONEPULSE ACQUISITION ON F3 USMG TRIPLER : TRIPLING MEANS +Y AND -Y SWAPPED ; WITH QUADRATURE PHASE CYCLE
PROT F3 START. Dl [F3 PLS 1 * RGATE]
D3 [STA RGATE] ; RING DOWN DELAY AND TRiGGER AQ ; ACQUISITION DO ; RECYCLE DELAY
GOTO START
BEGIN LISTS PLSI. + X + Y - X - Y RLS, +X -Y -X +Y END LISTS
; RECEIVER MODE : RPN OR QPN ; TRIGGER MODE : NT : MUST SET REC:F 1 . 0 3 = O 1 / 3, SFF3 = SF /3 [N 100 HZ STEPS

B.2.2 Pulse Length Determination
: LVDI-AUM ; TO iNCREMENT Dl TO MEASURE PULSE LENGTHS : USE WTH E.G. HSOLIDC-PC : A L E W I S J ü N E 5 1996
D 1 =ZU : N T I A L D 1 DI6=I U : INCREMENT RF tfl.001
I ZE VDEL = DI G O WR # I IF 41 DI=DI + Dl6 : WCREMENT D l BY ADDWG DI6
IN= 1 : LOOP T O 1 NE TIMES
EXIT
; L90FSI.PC ; CROSS POLARIZATION PULSE SEQUENCE WITH PHASE ALTERNATION : C P FROM F3 TO F 1. OBSERVE F 1 ; TRIPLER MEANS F-19 BY F5 HAS +Y AND -Y MTERCHANGED ; DETERMINATION OF 90 DEG FI PULSE : A. LEWIS FEB 6 1997
PROT XT
START. 3OU DI 1 [F3 PLSlA] : SOURCE 90 DEGREE D5 [F3 -Y FI PLS2" RGATE] ; CONTACT PULSE 2U [RGATE] : 2 US SWITCHRJG DELAY D 1 [F 1 @PLS3 RGATE] : FI 90 DEG PULSE
; NOTATION IMPORTANT FOR SMALL PULSES (> 0.7 US) D3 [RGATE STA] ; DEAD TIME DELAY AQ : USE NT FOR ACQUISITION DO * PLS3 ; NCREMENT PULSE LIST 3,
; AND RECYCLE DELAY GOTO START
BEGIN LISTS PLSI, +X-X PLS2, iX +X +Y +Y -X -X -Y -Y PLS3, -Y -Y +X +X +Y +Y -X -X RLS, +X -X +Y -Y -X +X -Y +Y
END LISTS
; RECEIVER MODE : RPN, TRIGGER MODE : NT ; DECOUPLER MODE: DO, NS=8*N

; L180FSt.PC : CROSS POLARIZATION PULSE SEQUENCE WITH PHASE ALTERNATION : DETERMiNATION O F 180 DEG F1 PULSE WITH C P FROM F3 ; FOR F-19 ON F3 SO TRIPLER -Y AND +Y MTERCHANGED ; A. LEWIS FEB 6 1997
PROT XT
START.DI1 [F3 PLSIA] ; SOURCE 90 DEGREE D5 [F3 -Y F 1 PLS2" RGATEl ; CONTACT PULSE 2U : 2 US SWITCHMG DELAY D 1 [F 1 @PLS3 RGATE] : OBSERVED 90 DEG PULSE
; NOTATION IMPORTANT FOR SMALL PULSES (> 0.7 US) î u D2 [FI @PLS3 RGATE] : OBSERVED 180 PULSE 03 [RGATE STA] : DEAD TIME DELAY AQ : USE N T FOR ACQUISITION DO ++ PLS3 ; CNCREMENT PULSE LIST 3,
: AND RECYCLE DELAY GOTO START
BEGIN LISTS PLSI. +X -X PLS2. +X +X +Y +Y -X -X -Y -Y PLS3. -Y -Y +X +X +Y +Y -X -X RLS. +X -X +Y -Y -X +X -Y +Y
END LISTS
: RECEIVER MODE : RPN ; TRIGGER MODE : NT ; DECOUPLER MODE: DO : NS=8*N

B.2.3 Relxxation Time Measurements
; CPTONE-PC : TI RELAXATION USMG CP FROM F2 TO FI : SEE TORCHIA D.A.. J.M.R.. 30. (1978). 613-6 16
PROT XT
START. DO [RGATE] ; RELAXATiON D l l [F2PLSIb] : 90 DEG. PROTON PULSE D5 [F 1 +X F2 -Y RGATE] ; CONTACT PULSE DI [FI +Y] ; 90 DEG. FI PULSE
LOOP 1000 TIMES : FOR LONG T 1 VD ; VAR DELAY SET M MILLISECS IN VD LIST
END LOOP ; THUS GET VD IN SECONDS D 1 [F I PLS2" RGATE] : RECOVERY PULSE D3 [F2 -Y RGATE STA] ; DEAD TIME D7 [=-Y] : OBSERVATION
GOTO START
BEGIN LISTS PLS 1, +X -X PLS2. +X +X +Y +Y -X -X -Y -Y RLS, +X -X +Y -Y -X +X -Y +Y END LISTS
; SET RPN, NT, USE NS = 8*N
: HCPTI RHO.PC ; T O MEASURE FI Tl-RH0 USMG CP FROM F2 TO FI ; WlTH INVERSION OF SPIN TEMPERATURE
PROT XT START,
Dl1 [F2@PLSI] ; F2 90 DEGREE VD [F2 -Y RGATE] D5 [F2 -Y FI @PLS2 RGATE] ; CONTACT TIME D3 [F2-YSTARGATE] D7 [F2 -Y] ; USE NT FOR ACQUISITION DO +-+PLSI ++PLS2 ; RECYCLE DELAY
GOTO START BEGIN L E T S PLS 1, 4(+X) 4(-X) PLS2, +X -Y -X +Y -X +Y +X -Y RLS, +X -Y -X +Y END LISTS ;RECEIVER MODE: RPN, TRIGGER MODE N T ;DECOUPLER MODE DO, NS=8*N

B.2.4 Cross Polarization Erperiments
: HCPCYCLPC ; CROSS POLARIZATION PULSE SEQUENCE : POLARIZATION TRANSFER FROM F2 T O F 1 : WITH SPIN TEMPERATURE iNVERSION : DECOUPLER POWER LEVEL CAN BE CHANGED
PROT X T START. 10U [DECPL=S I]
DI 1 [F2 @PLSI] : PROTON 90 DEGREE D5 [F2 -Y F 1 @PLS2 RGATE] ;CONTACT TIME D3 [F2 -Y STA RGATE DECPL=S3] D7 CF2 -Y] : USE N T FOR ACQUISITION DO ++PLSI ++PLS2 ; RECYCLE DELAY
GOTO START BEGiN L E T S PLS 1. 4(+X) 4(-X) PLSî, +X -Y -X +Y -X +Y +X -Y RLS, +X -Y -X +Y END LISTS : RECEIVER MODE: RPN, TRIGGER MODE: NT : DECOUPLER MODE: DO. NS=8*N
; LVD.AUM ; READ IN VDEL VALUE FROM VD LIST : AND CHECK VDEL IS LESS THAN D l 6 SO DON'T FRY ANYTHMG : FOR USE WITH LFSICPD-PC O R ANY C P PROG WITH D 17 DELAY INCLUDED
:RF #! 1 .O26 ; SET FILE EXTENSION 1 ZE 2 VD ; READ iN NEXT VDEL VALUE FROM VD LIST D I 7 = VDEL ; NOW CHECK VDEL IS OK D l 6 = 101M ; MAXIMUM ALLOWABLE CONTACT TIME D l 7 = D16 - DI7 ; IF D l 7 < O SHOULD STOP ; MUST HAVE A DELAY D l 7 iN THE PULSE PROG !!!! 3 GO 4 W R # I ; WRITE FILE 5 IF # I ; INCREMENT EXTENSION 6 [N=l ; LOOP T O START NE TIMES EX lT

; LFSICPD-PC ; CROSS POLARKATION FROM F3 TO FI FOR FI9 TRiPLER AMP ; WITH DECOUPLiNG OF F3 DURING ACQUISITION : TRIPLWG OF F3 MEANS -Y = -Y: +Y = -Y : PULSE SEQUENCE WITH QPN AND MVERSION OF SPM TEMPERATüRE : A. LEWIS AUG 8 1 997 : USE WITH LVD-AUM TO RECORD VARIABLE CONTACT TIME
PROT XT START. D 1 7 ; DELAY TO TRAP LONG VD VALUES
Dl 1 [F3 @PLSI] : SOURCE 90 DEGREE VD [F3 -Y F1 @PLSî- RGATE] : CONTACT TIME D3 [F3 -Y STA RGATE] ; TRIGER RECEIVER D7 [F3 -Y] : DECOUPLE DURMG ACQU [SITION DO -PLS I - P U 3 : RECYCLE DELAY
GOTO START BEGM LETS PLSI. 4(+X) 4 - X ) PLSî. -X -Y -X -Y -X +Y +X -Y RLS. rX -Y -X ?Y END LISTS : RECEIVER MODE: RPN : REC=FI : TRIGGER MODE NT : NS=8*N

B. 1.4 INADEQUATE Experiments
: HINADMAS-PC ; CP INADEQUATE PULSE PROGRAM FOR CPMAS SPECTROSCOPY ; H-GRONDEY AND R.BENN : MPI FUER KOHLENFORSCHUNG. MUELHEIM A.D.RUHR
PROT NONE START, IOU [DECPL=S 11
DI 1 [F2 PLS 1 A RGATE] D5 [FI PLS3" P- @PLSI, RGATEl 0 6 [DECPL=Sî, F2 @PLSZ RGATE] : (ZN+ 1)/4J DELAY D2 [FI PLSSA RGATE] : 180 DEGREE PULSE D6 [F2 @,PLS2 RGATE] DI [FI RGATE] D4 IF2 @PLS2 RGATE] : 3U DELAY D I O [F 1 PLS6" RGATE] D3 [F2 @PLS2 STA RGATE] D7 CF2 PLS2"] DO [RGATE]
GOTO START
BEGIN LISTS PLS 1, 32 (+X -X) PLS', -Y PLS3, 8 (-Y) 8 (+X) 8 (+Y) 8 (-X)
8 (+Y) 8 (-X) 8 (-Y) 8 (+X) PLS4, +X 'X +X +X +X +X +X +X
+ Y + ~ + Y + Y + Y Ç ~ + Y + Y - X - X - X - X - X - X - X - X - Y - Y - Y - Y - Y - Y - Y - Y
PLS5, +X +X +X +X -X -X -X -X +Y +Y +Y +Y -Y -Y -Y -Y
PLS6, +X + y -X -y +X + y -X -Y -X -Y +X +Y -X -Y +X +Y
RLS, +X -Y -X +Y END LISTS
; RECEIVER PHASE: RPN, NS=64*N

: LINAD2D.PC ; [NADEQUATE PULSE PROGRAM FOR F1 ; DECOUPLING F3 ; A. LEWIS MAY 6 1998 AFTER HGRONDEY AND R-BENN ; MPI FUER KOHLENFORSCHUNG. MUELHEIM A.D.RUHR : SEE BAX ET AL J.A.C.S. (1980) 102-4829
PROT FI START. D I [F 1 PLS 1 A RGATE] : MITIAL 90
D6 [F3 +X RGATE] : (ZN+ 1 )/4J DELAY D2 [FI PLS3" RGATE] : 180 DEGREE PULSE D6 [F3 +X RGATE] D l [F 1 PLS2" RGATE] D4 [F3 +X RGATE] : 3U DELAY Dl0 [FI PLS4" RGATE] ; 135 DEGREE PULSE D3 [F3 +X STA RGATEj AQ [F3 +X] DO [RGATE]
GOTO START
BEGIN LETS PLSI, 8 (+X) 8 (+Y) 8 (-X) 8 (-Y) PLS2. 8 (+X) 8 (+Y) 8 (-X) 8 (-Y) PLS3, +X +X +X +X -X -X -X -X
+Y +Y +Y +Y -Y -Y -Y -Y PLS4. +X +Y -X -Y +X +Y -X -Y
-X -Y +X +Y -X -Y +X +Y RLS, +X -Y -X +Y END L E T S : RECEIVER PHASE: RPN, USE NT. NS = 32 * N : SET SW I =SWZ SI=TD. USE H2DAQ.AUM T O NCREMENT D4 : SET ND4=I SO D4 INCREMENTED BY IN FROM 3U ONCE EACH EXPT

: H2DAQ.AUM : STANDARD 2D ACQUISITION PROGRAM
DJ = 3U :RESET TO 3U! 1 ZE 2 G O 3 W R # I 4 IF#1 5 14 6 IN=! 7 EXIT
; HCOMBINE.AUM : TO ADD TWO SERIAL FILES ; FILES # 1 + #3 = W ARE SERIAL FILES : SET DC=I SO FILES ARE ADDED
1 R E # I ; FIRST SERIAL FILE WR #2 ; TEMPORARY 1 D FILE RE #3 ; SECOND SERIAL FILE AT #2 WR #4 ; OUTPUT FILE IF f f 1 IF #3 IF #4 2 IN=!
EXIT
; LADDSMX-AUM ; TO ADD TWO .SMX 2D FILES ; FILES # 1,3 AND 4 ARE .SMX FILES!!! ; FILE ff 2 (TEMPORARY FILE) MUST BE NORMAL FILE E.G. JüNK : SO ADD .SMX TO THE FILENAMES WHEN ENTERNG THEM ; SET DC = 1 SO ADD FILES ! ; SET NE EQUAL TO SI 1 SO CORRECT NUMBER O F ROWS
1 RSR # I ; READ SUB ROW WR #2 ; WRITE TEMPORARY SUB ROW FILE RSR #3 ; READ SECOND SMX FILE AT #2 ; ADD TWO SUB ROWS WSR #4 ; OUTPUT SMX FILE
IF f f l ; INCREMENT FILE EXTENSIONS IF if3 IF M
2 IN=l : LOOP T O I NE TIMES
EXIT

; LREDSiF.PC : A LEWIS OCT 34 1995 ; 1-D REDOR PULSE SEQUENCE : FOR FI - PJF3 FREQUENCIES, E.G. F-19 AND SI-29 : Y . PAN. T. GULLION, J. SCHAEFER, JMR 90,330-340 (1990) : ALLOWS DIFFERENT PULSE LENGTHS ON FI & F2 : 180 PULSES ON UNOBSERVED NUCLEl : AT 1 2 AND FULL ROTOR PERIODS : WITHOUT PRESATURATION ; USE LREDCAL-AUM T O CALC DELAYS D3. D22. D23 AND D34
PROT ALL START, 10U
DI [F3 +X F2 @PLSI RGATE] D22 DI2 [FI @PLSÎ, RGATE] LOOP Cl TIMES ; N = Z * C [ + z
D23 D 12 [FI @PL% RGATE] D23
D l 2 [FI @PLS2RGATE] END LOOP D24 D2 [F3 4 X F2 @PLS4 RGATE] D24 LOOP C 1 TIMES
D l 2 [FI @PLS2 RGATE] D23 D 12 [F l @ P U 3 RGATE] 023
END LOOP D l 3 [F 1 @PLS2 RGATE] 023
D3 [STA RGATE] ; MAKE D3=D1/2 AND USE NT D7
LOOP C2 TIMES DO
END LOOP ++PLS 1 ++PLS2 ++PLS3 +-tPLS4
GOTO START
BEGIN LISTS PLSI, +X -Y -X +Y PLSî. +X PLS3, +Y PLS4, +Y +X -Y -X RLS, +X -Y -X +Y END LISTS

: TRIGGER MODE NT, REC = F2. USE RPN : TO CALCULATE DELAYS USE LREDCAL-AUM ; D23 = [T( ROT)-2* D 12112 ; D22 = [T(ROT)-D 1 -D 12]/2 ; D24 = [T(ROT)-D2-D 12]/2
; LREDCALAUM ; A LEWIS OCT 12 1995 ; MICROPROGRAM TO CALCULATE DELAYS FOR REDOR EXPERIMENT : TO BE USED IN CONNECTiON WITH LREDFI R.PC AND LREDSIF-PC ; 180 PULSES ON FI AT 112 AND FULL ROTOR PERIODS ; ENTER Dl (F2 90). D2 (F2 180) ; AND D l 2 (FI 180) AND K3 SPINNiNG FREQ BEFORE RCMNiNG THIS!!!
C2 = Z C3 = 50 : FOR PRESATURATION DI3 = IM DIS = D l 3 / K3 ; TIME FOR ONE ROTOR PERIOD ; K3 IS THE SPiNNING FREQUENCY IN KHZ Dl5 = D l + Dl2 Dl6 = D l 5 /C2 : Dl12 + Dl212 D 1 7 = D 1 2 / C 2 : Di32 Di9 = D2 / C2 ; D a 2 D20 = DI7 + D l 9 : D I 2 2 + DY2 DI8 = DI4/C2 ; 1/2 OF ROTATIONAL PERIOD ;NOW CALC DELAYS USED IN PULSE PROG D 3 = D l I C 2 : D l 2 D22 = D l 8 - Dl6 ; T E - D l / ? - D l 2 2 D23 = D l 8 - DI2 ; T E - D l 2 D24 = D I 8 - D20 :TE - D12/2 - DZ2
EXIT

: LREDORAUM ; A LEWIS JAN 14 1996 ; TO RECORD SERiES OF REDOR FID'S : RECORDS TWO SPECTRA OFF AND ON RES : READS IN OFFSET VALUES FROM OFFSET LIST ; INCREMENTS C I ( N = X 1 +2) : OFFSET LIST MUST HAVE 2 OF EACH OFFSET !!!!
C1=6
RF #1.010 RF $2.0 10 2 ZE 01 01
11 GO
WR f : l [F # l ZE 0 1 O 1
(1 GO
WR #2 IF #2 3 ICI 4 IN=?
EXIT
: SET INITIAL C 1 VALUE
: READ IN OFF RES O 1 VALUE : READ IT IN AGAIN ; [NITlALISE INTERFACE
; READ IN ON RES O 1 VALUE ; READ IT M AGAiN : INITIALISE INTERFACE
; INCREMENT C 1 BY IC 1 : LOOP NE TIMES

; LREDF3FI.PC : A LEWIS JAN 12 1996 : 1-D REDOR SEQUENCE : FOR FI - P J F 3 FREQUENCIES. E-G, F-19 AND SI-29 : ALL PULSES ON OBSERVED NUCLEI (FYF3) EXCEPT ONE : 180 PULSES AT 10 AND FULL ROTOR PERIODS : J.R. G A M O W AND T. GULLION. JMR 95.442-5 (199 1) : ALLOWS DIFFERENT PULSE LENGTHS ON F1& F3FS : USES PRESATURATION : USE LREDCALLAUM T O CALC DELAYS D3, D33. D23 AND D24
PROT ALL
START. IOU LOOP C3 TIMES ; SET C3 = 50
DI [F3 +X F2 +X RGATE] IM : I MS DELAY
END LOOP ; PRESATURATION DO : RELAXATION DELAY SET T O 1 * T l DI [F3 +X F2 @PLS 1 RGATE] D22 D2 [F3 -X F2 @PLS2 RGATE] LOOP CI TIMES ; N = ~ * c ] + 3
D23 D2 [F3 tX F2 @PLS3 RGATE]
023 D2 [F3 +X F2 SPLSS RG ATE]
END LOOP D24 D l 2 [F 1 @PLS4 RGATE] ; SINGLE 180 ON LMOBSERVED D24 LOOP C 1 TIMES
D2 [F3 +X F2 @PLSS RGATE] D23
D2 [F3 +X F2 @PLS3 RGATE] D23
END LOOP D2 [F3 +X F2 @PLS2 RGATE] D23
D3 [STA RGATE] : MAKE D3=D1/2 AND USE NT D7 10M ;DELAY *PLS 1 ++PLS2 ++PLS3 ++PLS4
GOTO START
BEGIN LISTS PLSI. +X -Y -X +Y PLS3, +X PLS3, +Y PLS4, +Y +X -Y -X RLS, +X -Y -X +Y END LISTS

: TRIGGER MODE : NT. REC = F2, USE RPN : T O CALCULATE DELAYS USE L R E D C A E A U M ; D23 = [T(ROT)-2*D2]/2 ; D22 = [T(ROT)-D 1 -D2]/2 ; 0 2 4 = [T(ROT)-DZ-D I2]/2
: LREDCAL2.AUM : A LEWIS JAN 12 1996 : MICROPROGRAM T O CALCULATE DELAYS FOR REDOR EXPERIMENT : T O BE USED M CONNECTION WITH LSIFRED-PC OR LREDF3FI.PC : ENTER D 1 (F2 90). D2 (F2 180) : AND D l 2 (F1 180) AND K3 SPiNNMG FREQ BEFORE RUNNiNG THIS!!!
C 2 = 2 C3 = 50 : FOR PRESATURATIObi D l 3 = 1M DI4 = D 1 3 / K : =T, TIME FOR ONE ROTOR PERIOD : K3 IS THE SPINNING FREQUENCY [N KHz! D l 5 = D I + 0 2 D l 6 = D l 5 / CS D l 7 = D I S I C 2 DXI = D2 / C2 D21 = Dl7 + D20 D l 8 = DI4 1 CZ ; =Tl?, 1/2 OF ROTATIONAL PERIOD ; NOW CALC DELAYS USED IN PULSE PROGRAM D3 = D l I C 2 ; D I 1 2 D22 = DI8 - D l 6 : TI2-D1/2 -DZ2 D 2 3 = D I 8 - D 2 ; T/2 - D2 D 2 4 = D 1 8 - D21 : T / 2 - D I E - DY2 EXIT
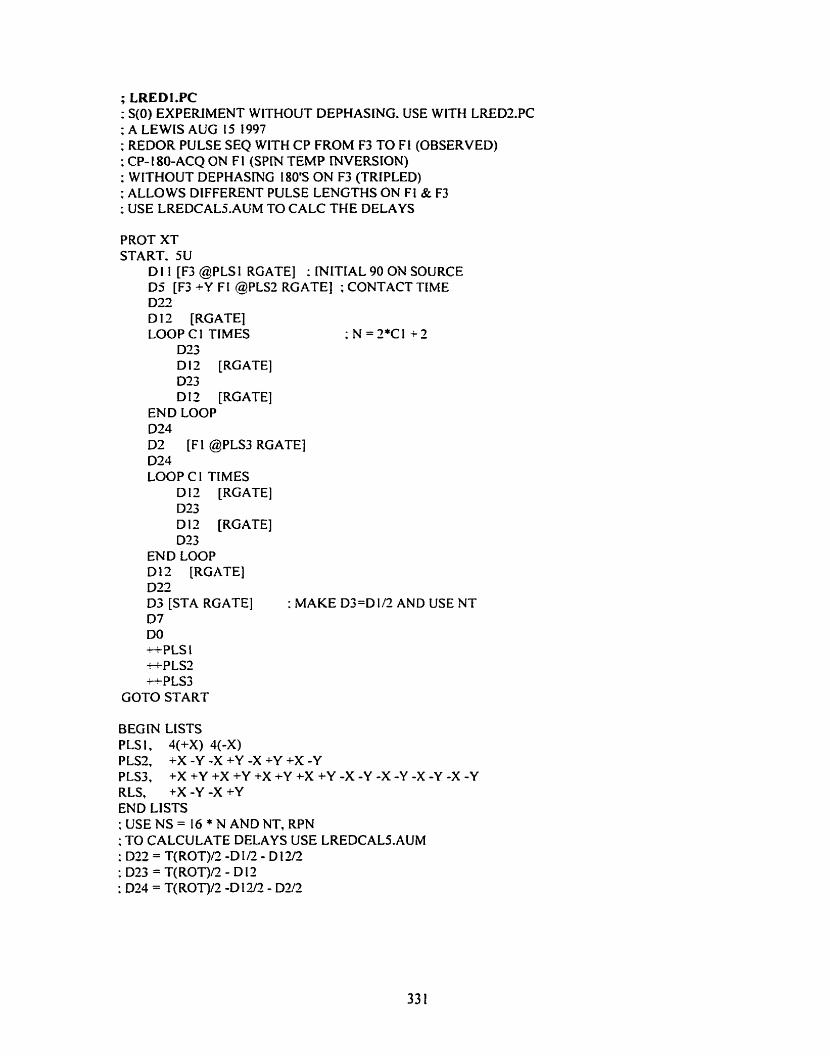
; LREDI.PC : S(0) EXPERIMENT WITHOUT DEPHASMG. USE WITH LREDLPC : A LEWIS AUG 15 1997 ; REDOR PULSE SEQ WITH CP FROM F3 TO F t (OBSERVED) ; CP- 180-ACQ ON FI (SPtN TEMP WVERSION) : WITHOUT DEPHASMG 180's ON F3 (TRIPLED) ; ALLOWS DIFFERENT PULSE LENGTHS ON FI & F3 : USE LREDCALS.AUM TO CALC THE DELAYS
PROT XT START. 5U
Di 1 [F3 @PLSI RGATE] : INITIAL 90 ON SOURCE D5 [F3 +Y FI @PLSS RGATE] ; CONTACT TIME D22 D l 2 [RGATE] LOOP C I TIMES ; N = 2 * C 1 i 2
D23 D l2 [RGATE] D23 DI2 [RGATE]
END LOOP D24 D2 [Fl @PLS3 RGATE] 024 LOOP CI TIMES
Dl2 [RGATE] D23 D l 2 [RGATE] 0 2 3
END LOOP D l 2 [RGATE] D22 03[STARGATE] :MAKED3=D1/2ANDUSENT D7 DO ++PLSI t t P L S 2 +PLS3
GOTO START
BEGIN LISTS PLS I , 4(+X) 4(-X) PLS2, +X -Y -X +Y -X +Y +X -Y PLS3, +X +Y +X +Y +X +-Y +X +Y -X -Y -X -Y -X -Y -X -Y RLS, +X -Y -X +Y END LISTS : USE NS = 16 * N AND NT, RPN ; TO CALCULATE DELAYS USE LREDCALS-AUM ; D22 = T(ROT)/2 -D 1 /2 - D 13/3 ; D23 = T(ROT)/2 - D 12 ; D24 = T(ROT)/S -D 1 Y2 - D2/2
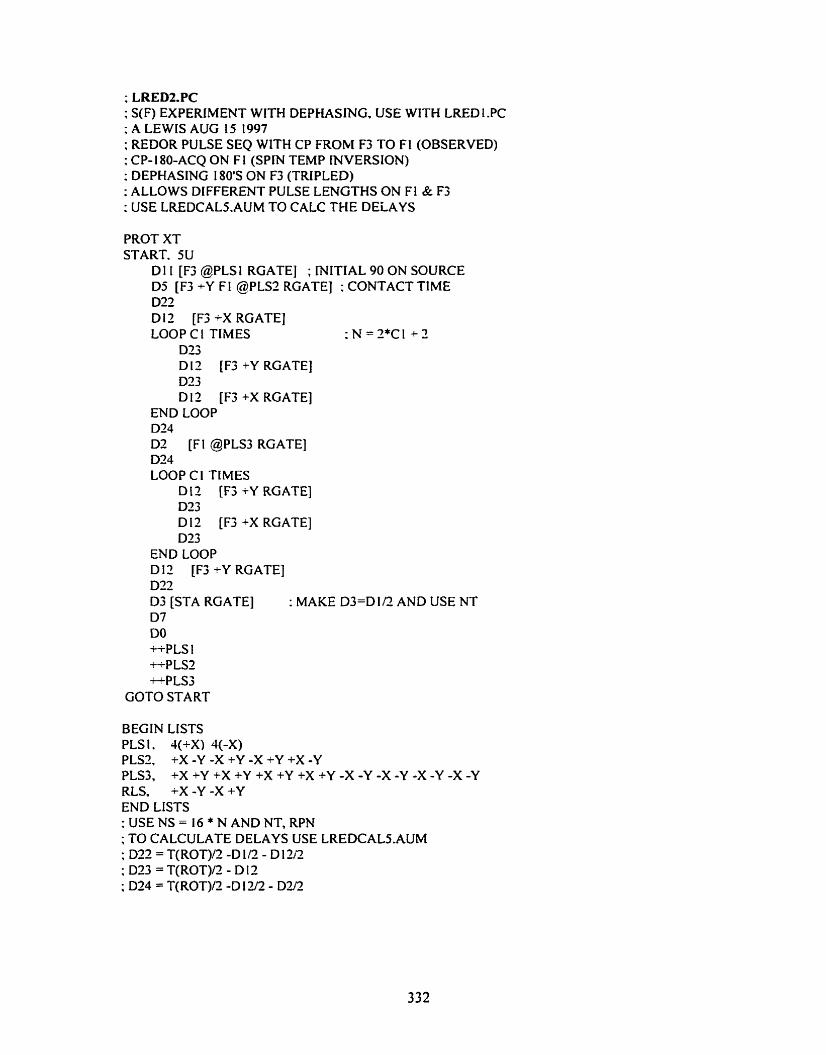
; LRED2.PC ; S(F) EXPERIMENT WITH DEPHASMG, USE WITH LRED 1.PC ; A LEWIS AUG 15 1997 ; REDOR PULSE SEQ WITH CP FROM F3 TO F1 (OBSERVED) ; CP- 1 80-ACQ ON F 1 (SPW TEMP INVERSION) : DEPHASING 180's ON F3 (TRIPLED) : ALLOWS DIFFERENT PULSE LENGTHS ON F1& F3 : USE LREDCALS-AUM TO CALC THE DELAYS
PROT XT START. SU
D 1 1 [F3 @PLSI RGATE] ; MITIAL 90 ON SOURCE D5 [F3 +Y FI @PLS2 RGATE] : CONTACT TIME D22 D 12 [F3 +X RGATE] LOOP C 1 TIMES :N=2*Cl + 3
DZ3 D 13 [F3 +Y RGATE] D23 D 12 [F3 +X RGATE]
END LOOP D24 D3 [FI @PLS3 RGATE] 024 LOOP C 1 TIMES
D t 2 [F3 +Y RGATE] D23 D 12 [F3 +X RGATE] D23
END LOOP D 13 [F3 +Y RGATE] D22 D3 [STA RGATE] : MAKE D3=D1/2 AND USE NT D7 DO +PLS 1 ++PLS2 i-tPLS3
GOTO START
BEGIN LISTS PLSI, 4(+X) 4(-X) PLS2. +X -Y -X +Y -X +Y +X -Y PLS3, +X +Y +X +Y +X +Y +X +Y -X -Y -X -y -X -Y -X -Y RLS, +X -Y -X +Y END LISTS : USE NS = 16 * N AND NT, RPN ; TO CALCULATE DELAYS USE LREDCALS-AUM ; D22 = T(ROT)/:! -D 1 /2 - D 1 2 2 : D23 = T(ROT)/2 - D 12 ; D24 = T(ROT)/Z -D 12/2 - DS/2

: LREDCAb-AL'M : X LEWIS ACiG 15 1997 ; MICROPROGR4;M 10 CALCULATE DEL4YS FOR REDOR FUPEIUMEN : TO BE USED iN CONNECTION WITT4 LREDI-PC AND LREDZ-PC : 180 PULSES ON F3 .AT I l ? AVD WLL ROTOR PERiODS : ENTER DI (FI 90)- D3, (FI 180), Dl 1 (F3 90)- Di?(= 180) : AND K3 S P W N G FREQ BEFORE RLWING THIS!!!
: FOR PRESATLrRATION
D13 = 1M 014 = 013 EG : TIME FOR ONE ROTOR PERIOD
: K.3 IS THE SPIirciNG FREQ lN KHZ! DIS = DI - D l 1 D I 6 = D I S C2 :Dt ? - D I 2 2 DI7 = D2 - DI2 DI8 = D l 7 'CI - D3.2 - D 1-3 D19=DI4 C3 : 1!3 OF ROTATIONAL PERiOD
: NOW CALC DELAYS USED IN PULSE PROG

: LREDFID-AUM : RECORDS CP REDOR S(0) AND S(F) SPECTRA ; READING Pi THE PULSE PROGS LRED I.PC AND LREDZPC : A LEWIS AUG 15 1997 : FOR CF FROM F3 T O FI. OBSERVE F 1, DEPHASMG ON F3 ; INCREMENTS C 1 (N=2*C 1). CI MUST BE >= 1 !!!
C 1=0 : SET INITIAL C I VALUE. C 1 >=I !! : SET ICI THE INCREMENT FOR Cl OUTSIDE !!
:RF # 1 .O08 :RF H2.008
1 RP LREDI I I ZE G O
WR i : I IF #1
2 RP LREDî, I I ZE G O
WR #2 IF $2
; RESET FILE EXTENSIONS FOR OFF RES. FID ; RESET FILE EXTENSION FOR ON RES. FID
: READ M THE S(0) PULSE PROG : INITIALISE MTERFACE : ZERO MEMORY : ACQUIRE OFF RES FID : WRITE OFF RES FID : [NCREMENT EXTENSION
: READ iN S(F) PULSE PROG : CNITIALISE MTERFACE : ZERO MEMORY ; ACQUIRE ON E S F[D : WRITE ON RES FID : INCREMENT EXTENSION
: NOW INCREMENT THE N LOOP COUNTER C I IC 1 : INCREMENT LOOP COUNTER IN= 1 ; LOOP TO START NE TIMES
EXIT
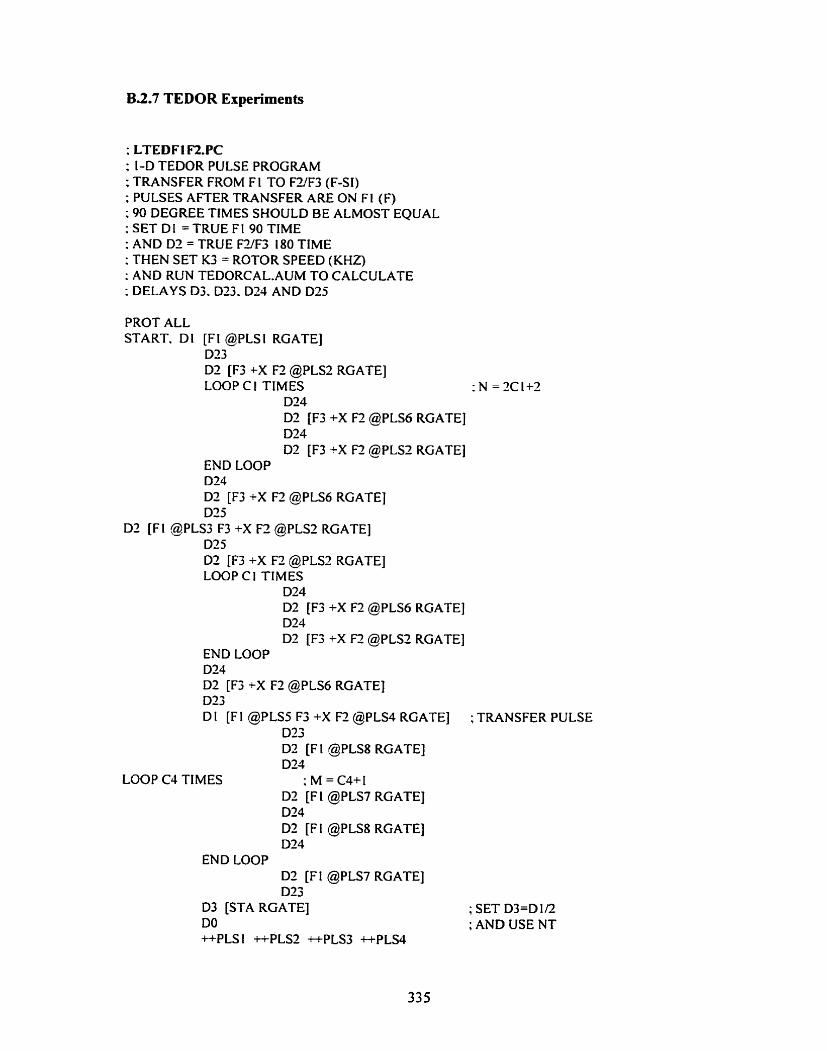
B.2.7 TEDOR Experiments
: LTEDFI F2.PC ; 1-D TEDOR PULSE PROGRAM ; TRANSFER FROM FI T O FYF3 (F-SI) : PULSES AFTER TRANSFER ARE ON F1 (F) ; 90 DEGREE TIMES SHOULD BE ALMOST EQUAL : SET DI =T'RUE FI 90 TIME ; AND D2 = TRUE F3F3 180 TIME : THEN SET K3 = ROTOR SPEED (KHZ) : AND RUN TEDORCAL-AUM TO CALCULATE : DELAYS D3.023.024 AND D35
PROT ALL START. DI [FI @PLSI RGATE]
D23 D2 [F3 +X F2 @PLS2 RGATE] LOOP C I TIMES : N = 2C1+2
D24 D2 [F3 +X F2 @PLS6 RGATE] D24 D2 [F3 +X F2 @PLSZ RGATE)
END LOOP D24 D2 [F3 +X F3 @PLS6 RGATE] D25
D2 [FI @PLS3 F3 +X F 2 @PLS2 RGATE] D25 D2 [F3 +X F2 @PLS2 RGATE] LOOP Cl TIMES
D24 D2 [F3 +X F2 @PLS6 RGATE] D24 D2 CF3 +X F2 @PLS2 RGATE]
END LOOP D24 D2 [F3 +X F2 @PLS6 RGATE] D23 DI [FI @PLS5 F3 +X F2 @PLS4 RGATE] ; TRANSFER PULSE
D23 D2 [FI @PLS8 RGATE] D23
LOOP C4 TIMES ; M = C 4 + I D2 [FI @PLS7 RGATE] D24 D2 [FI @PLS8 RGATE] D24
END LOOP D2 [FI @PLS7 RGATE] D23
D3 [STA RGATE] ; SET D3=D1/2 DO ; AND USE NT ++PLSI ++PLS2 *PLS3 ++PLs4

++PLSS ++PLS6 ++PLS'I ++PLS8 GOTO START
BEGIN LISTS PLSI. +X +X-Y -Y -X-X +Y +Y PLS2. +X PLS3. +Y +Y +X +X -Y -Y -X -X PLSQ. +X +X -Y -Y -X -X +Y +Y PLSS. -Y +Y -X +X +Y -Y +X -X PLS6. -Y PLS7. -Y PLS8. +X RLS. +X -X -Y +Y -X +X +Y -Y END LISTS
; RECEIVER MODE RPN. TRIGGER MODE NT, NS = 8*N ; D 3 = D I / Z : D33 = T(R0T)l.I - D2/2 - D 1/2 : D24 = T(ROT)Iî, - D2 ; D25 = T(ROT)/J - D2
: TEDORCAL.AUM : MICROPROGRAM TO CALCULATE DELAYS FOR TEDOR EXPERIMENT : WILL POSITION 180 PULSES AT I l4 & 3 4 O F THE ROTOR PERIOD : BEFORE AND AFTER THE COHERENCE TRANSFER : T O BE USED IN CONNECTION WITH KTEDORSî-PC, HTEDNMV-PC : LTEDFI F2.PC. TEDFI F3.PC. LTEDFI .PC AND HTEDFI .K. : ENTER Dl. D2, AND K3 = SP[NNtNG FREQUENCY BEFORE RüNNiNG THIS
C S = 2 C2 = 4 c 3 = 3 D l 3 = IM D l 4 = D I X 3 : T= ROTOR PEWOD ; K3 IS THE SPINNWG FREQUENCY R\t K H z Dl5 = DI+D2 D l 6 = 5151C5 ; D1/2+D2/2 D l 7 = D14lC2 ; 1/4 O F ROTATIONAL PERIOD D l 8 = D141C5 : 113 OF ROTATIONAL PERIOD
; NOW CALC DELAYS USED IN PULSE PROG D3 = Dl/C5 ; D l 1 2 D23 = DI7 - Dl6 ; T/4 - Dl13 - D= D 2 4 = D 1 8 - D 2 ; Tl2 - D2 D25 = D 1 7 - D 2 : T/4 - D2 EXIT

: LIC4AUM ; TO INCREMENT C4 ; FOR VARYiNG M iN TEDOR EXPERIMENT : SET CI AND IC4=1
C4=0 ; SET INITIAL C4 VALUE RF #1.001 : RESET FILE EXTENSION 1 ZE GO WR f:l IF # 1
IC4 ; MCR- CJ BY iC4 2 IN=l ; LOOP TO 1 NE TIMES EXIT
; LICIAUM : [NCREMENTS Cl BY IC 1 ; USE FOR VARYING N IN TEDOR EXPERIMENTS :SETC4AND ICI=I
RF #\.O01 ; RESET FILE EXTENSION CI=O : SET WITIAL C 1 VALUE 1 ZE GO W R # I IF #1
IC 1 : INCREMENT CI BY IC 1 2 IN=l ; LOOP TO I NE TIMES EXIT

: LTEDMOVB.PC 1-D TEDOR : TRANSFER FROM F1 TO FTF3 (F-SI) ; FOR VARIATION OF PULSE POSITIONING : ALLOWS PULSE POSITIONS BEFORE AND AFTER TRANSFER ; TO BE AT D I F F E E N T PLACES E.G. 1/8,7/8 AND 1/4,3/4 ; PULSES AFTER TRANSFER ARE ON Fi (F) ; 90 DEGREE TIMES SHOULD BE ALMOST EQUAL ; SET D 1 = TRUE FI 90 TIME, AND D2 = TRUE W F 3 180 TiME : THEN SET K 3 = ROTOR SPEED (KHZ) : AND RUN E.G. TEDCAL13.AUM TO CALCULATE FOR 1/3.2/3, I/4,3/4 : DELAYS D3. D23. D34 AND DS5 PLUS D26. D37, D28 AND D29
PROT ALL START, DI [FI @PLSI RGATE]
D26 D2 [F3 +X F2 @PLS2 RGATE] LOOP CI TIMES : N = 2Cl+2
D27 D2 [F3 -tX F2 @PLS6 RGATE] D28 D2 [F3 +X F3 g P L S 2 RGATE]
END LOOP D27 D2 [F3 +X F2 @PLS6 RGATE] DS9 D2 [FI @PLS3 F3 +X F2 @PLS2 RGATE] D29 D2 [F3 +X F2 @PLS2 RGATE] LOOP C 1 TIMES
D27 D2 [F3 +X F2 @PLS6 RGATE] D28 D2 [FS +X F2 @PLSî RGATE]
END LOOP 0 2 7 D2 [F3 +X F2 @PLS6 RGATE] D26 D l [FI QPLS5 F3 +X F2 @PLS4 RGATE] ; TRANSFER PULSE
D23 0 2 [FI @PLS8 RGATE] D24
LOOP C4 TIMES : M = C 4 + l D2 [F 1 @PLS7 RGATE] D24 D2 [FI @PLS8 RGATE] D24
END LOOP D2 [FI @PLS7 RGATE] D23
D3 [STA RGATE] ; SET D3=D1/2 DO ; AND USE NT
*PLS 1 *PLS2 +-+PIS3 ++PLS4

+-+PLSS *PLS6 t-ePLS7 ++PLSS GOTO START
BEGIN LISTS PLSI. +X +X -Y -Y -X -X +Y --Y PLS2, +X PLS3. -+Y +Y +X +X -Y -Y -X -X PLS4. +X +X -Y -Y -X -X +Y +Y PLS5. -Y +Y -X *X -Y -Y +X -X PLS6, -Y PLS7. -Y PLSS. +X RLS. +X -X -Y +Y -X +X +Y -Y END LISTS
; RECEIVER MODE: RPN. TRIGGER: NT. NS = 8*N ; D 3 = D 1 / 2 : D23 = T(ROT)/.C - D2/3 - D 112 ; D24 = T(ROT)/2 - D2 : D25 = T(ROT)/4 - D2
; TEDCALIS-AUM ; A. LEWIS AUG 12 1995 : MICROPROGRAM T O CALCULATE DELAYS FOR TEDOR EXPERIMENT : PULSES AT 1 / 3 - 3 3 BEFORE TRANSFER AND 1/4, Y.1 A M E R TRANSFER ; TO BE USED IN CONNECTION WITH LTEDMOVB-PC : ENTER Dl. D2, AND K3 = SPINNING FREQUENCY BEFORE RUNNING THIS
C 5 = 2 C 2 = 4 C3 = 3 C6 = 8 C 7 = 6 D l 3 = IM DI4 = D13K3 D l 5 = Dl+D2 D l 6 = D15/CS D 17 = D14/C3 D l 8 = D14/C5 D 1 9 = D 1 4 / C 3 D 2 0 = D 1 9 *C5 D3 = D1/C5 D23 = D 1 7 - D I 6 D 2 4 = D t 8 - D 2 D 2 5 = D 1 7 - D 2 0 2 6 = D l 9 - D l 6 D27 = D20 - D2 D28 = D l 9 - D2 D 2 9 = D 1 9 -DS EXIT
; = R (K3 IS THE SPINNMG FREQ M KHz)
; DI6 IS 312 OF DI : 1/4 OF ROTATIONAL PERIOD = W4 : 112 OF ROTATIONAL PERIOD = RI2 ; Rf3 ; 2W3 ; D I E ; RI4 -D1/2 - D 2 2 ; R/2 - D2 ; W 4 - D 2 ; W3 - D l Z - D 2 / 2 ; 2R/3 - D2 ; W 3 - D 2 : W 3 - D 2

: LTEDMOVA-PC ; 1-D TEDOR ; TRANSFER FROM FI T O P2.3 (F-SI) ; ALLOWS POSiTlON O F PULSES AFTER TRANSFER T O BE MOVED ; PULSES BEFORE ARE AT 1/4 AND 34 ; PULSES AFTER TRANSFER ARE ON Fl (F) : 90 DEGREE TIMES SHOULD BE ALMOST EQUAL ; SET Dl = TRUE F 1 9 0 TIME AND D2 = TRUE wF3 180 TIME ; THEN SET K3 = ROTOR SPEED (KHZ) ; AND R W E.G.TEDCAL 15.AUM (PULSES A T 1/5,4/5) ; TO CALC DELAYS D3, D23. D24 AND 025. D26. D27 AND D28
PROT ALL START. D 1 [FI @PLS 1 RGATE]
D23 D2 [F3 +X F2 @PLS2 RGATE] LOOP CI TIMES :N = 2C I+Z
D24 D2 [F3 +X F2 @ P I S 6 RGATE] 0 2 4 D2 [F3 +X F2 @PLS2 RGATE]
END LOOP D24 D2 [F3 +X F2 @PLS6 RGATE] D25 D2 [F 1 @PLS3 F3 +X F2 @PLS2 RGATE] D25 D2 [F3 +X F3 @PLS2 RGATE] LOOP C 1 TIMES
D24 D2 [F3 +X F2 @PLS6 RGATE] D24 D2 [F3 +X F2 @PLSZ RGATE]
END LOOP 0 2 4 03 [FS +X F2 @PLS6 RGATE] D23 D i [FI @PLSS F3 +X F2 @PLS4 RGATE] : TRANSFER PULSE
D26 D2 [FI @PLS8 RGATE] D27
LOOP C 4 TIMES ; M =C4+I D2 [Fl @PLS7 RGATE] D28 D3 [FI @PLS8 RGATE] D27
END LOOP D2 [Fi @PLS7 RGATE] D26
D3 [STA RGATE] ; SET D3=D1/2 30 ;AND USENT ++PLS 1 ++PLS2 ++PLS3 ++PLU

++PLSS ++PLS6 *PLS7 +PLS8
GOTO START
B E G N LlSTS PLS1. +X +X -Y -Y -X -X +Y +Y PLS2. +X PLS3. +Y +Y +X +X -Y -Y -X -X PL%. +X *X -Y -Y -X -X +Y +Y PLSS. -Y +Y -X +X +Y -Y +X -X PLS6. -Y PLS7. -Y PLS8. +X RLS, +X -X -Y +Y -X +X +Y -Y END LISTS
; RECEIVER MODE: RPN, TRIGGER: NT. NS = 8 * N
; TEDCAL15.AUM A. LEWIS AUG 13 1995 : MICROPROGRAM TO CALCULATE DELAYS FOR TEDOR EXPERIMENT : PULSES AT 114, Y4 BEFORE TRANSFER AND 1/5.4/5 AFTER TRANSFER : TO BE USED IN CONNECTION WITH LTEDMOVA.PC : ENTER DI. D2, AND K3 = SPiNNMG FREQUENCY BEFORE RUNNlNG THIS
C5 = 2 C2 =4 c 3 = 3 Cd = 8 C7=6 C8 = 5 Dl3 = 1M DI4 = DlYK3 : = R (W IS THE SP[NN[NG FREQ IN KHz) D l 5 = Dl+D2 D16 = DlYCS ; D l 6 1 S 3 / 2 O F D I DI7 = D14/C2 ; I/4 O F ROTATIONAL PERIOD = FU4 DI8 = D14/C5 : 1/2 OF ROTATIONAL PERIOD = RI2 D I 9 = D 1 4 / C 8 : W5 D20= Dl9 * C3 ; 3R/5 D21 = D l 9 * CS : 2R/5

; LREFTED.PC : 1-D REFOCUSSED TEDOR : TRANSFER FROM F3 TO FI USMG TRIPLER ON F3 : SO F3 +Y AND -Y PHASES ARE INTERCHANGED : A. LEWIS JAN 12 1998 ; PHASE CYCLiNG AS FOR REFOCCUSSED MEPT ; DEPHASiNG BEFORE TRANSFER ON FI AT 1/4 314, N=2C I+2 ; DEPHASINGAFTER TRANSFER ON €3 A T 1/4,3/4, M=2C4+2 : ALLOWS DIFFERENT PULSE LENGTHS ON F1 AND F3 : D l = FI 90, D 2 = F 1 180, DI1 = F3 90, D l 2 = F3 180 ; SET K3 = ROTOR SPEED (KHz), USE LRTCAL-AUM T O CALC : DELAYS D32. D23. D24, D25, D26. D27, D28, AND D29
PROT ALL START. D 1 1 [F3 @PLS 1 RGATE]
D22 D3 [FI +X]
LOOP C l TIMES D23 D2 [Fl +Y RGATE] D23 D2 [FI +X RGATE]
END LOOP D23 D2 [F 1 +Y RGATE] D24
D3 [F3 @PLS2 FI @PLS3 RGATE] D24 D2 [F 1 +X RGATE]
LOOP C I TIMES D23 D2 [FI +Y RGATE] 0 2 3 D2 [FI +X RGATE]
END LOOP D23 D2 [FI +Y RGATE] D25
: MITIAL 90 PULSE : T A ; DEPHASING ON FI : N = 2C1+2
: SIMULTANEOUS 180 TO REFOCUS
Dl [F3 @PL% FI @ P i 3 RGATE ] ; COHERENCE TRANSFER D26 D 12 CF3 +X RGATE]
LOOP C4 TIMES D27 D 12 [F3 +Y RGATE] D27 D 12 [F3 +X RGATE]
END LOOP D27 D 12 [F3 +Y RGATE] D28
D2 [F3 @PLS2 FI @PLS6 RGATE] D28 D 13 [F3 +X RGATE]
LOOP C4 TIMES 0 2 7
; NOW DEPWASNG ON F3 : M = 2C4+2
; SIMULTANEOUS 180 T O REFOCUS

DI2 [F3 +Y RGATE] D27 D 12 [F3 +X RGATE]
END LOOP D27 D E [F3 +Y RGATE] D29 D3 [STA RGATEI : SET D3=D 112 AND USE NT
AQ : ACQUIRE ECHO DO : RELAXATION DELAY RECYCLE ON 5*TI (F3) +-+PLS 1 +-+PLS2 ++PLS3 +PL% ++PLS5 ++PLS6
GOTO START
BEGiN LISTS PLS 1 , 8(+X) 8(-X) PLSî, +X -X PLS3. +X -X PLS4, -Y -Y +Y +Y PLSS. 4(+X) 4(+Y) 4(-X) 4(-Y) PLSO, +X -X +X -X +Y -Y +Y -Y RLS, +X +X -X -X +Y +Y -Y -Y END LISTS
: RECElVER MODE: RPN, REC:Fl : TRIGGER MODE: NT :NS= 16*N

: LRTCALAUM : A. LEWIS JAN IS 1998 : MICROPROGRAM TO CALCULATE DELAYS FOR REFOC. TEDOR EXPERIMENT : TO BE USED WITH LREFTED-PC : FI AND F3 PULSES ARE SIMULTANEOUS!!! ; ENTER D 1 (FI 90), D2 (FI 1 go), D 1 I (F3 90), D 12 (F3 180) : AND K3 = SPiNNlNG SPEED IN KHz. BEFORE RUNNiNG THIS
CS=? C2 = 4 D l 3 = IM D l 4 = D13 / K3 : ONE ROTOR PERlOD D 3 = D 1 /C5 : Dl12 D 1 7 = D 2 / C 5 : DY2 D 1 6 = D l J / C 2 ; 1/4 ROTOR CYCLE D l 5 = DI4 / CS ; 1/2 ROTOR CYCLE D2t = D l l / C S :D11/3 D29 = D l 2 CS ; 0 1 2 2
: NOW CALC DELAYS USED iN PULSE PROG D22=D16-D21
D22 = D32 - Dl7 : T(ROT)/4 - D 1 1/2 - DY2 023 = D 1 5 - D 2 ; T(ROT)/2 - D2 D24 = D l 6 - DS : T(ROT)/4 - D2
D25 = D 1 6 - D l 7 D25 = DS5 - D3 ; T(ROT)/4 - D 2 2 - D 1 /2
D 2 6 z D 1 6 - D 3 D26 = D26 - D29 : T(ROT)/4 - D 1 /2 - D 1 2 2 D27 = Dl5 - DI2 : T(ROT)/2 - 0 12
D28 = DI6 - D29 D28= DS8-Dl7 : T(ROT)/4 - D 1 2 2 - DY2
D29 = DI6 - 029 D 2 9 = D39-D2I :T(ROT)/4 - D12Z - D l 1/2
EXIT

FUNCTIONS AND M A T H E M A X A CODE FOR FITTING DATA
FROM CROSS POLARIZATION, REDOR AND TEDOR NMR
EXPEFUMENTS
Functions used to fit data from Hartmann-Hahn CF, REDOR and TEDOR experirnents
are presented in this appendix. Details of the fitting and the code used to perform this in the
iblu~hematica programming environment' are also given where appropriate.
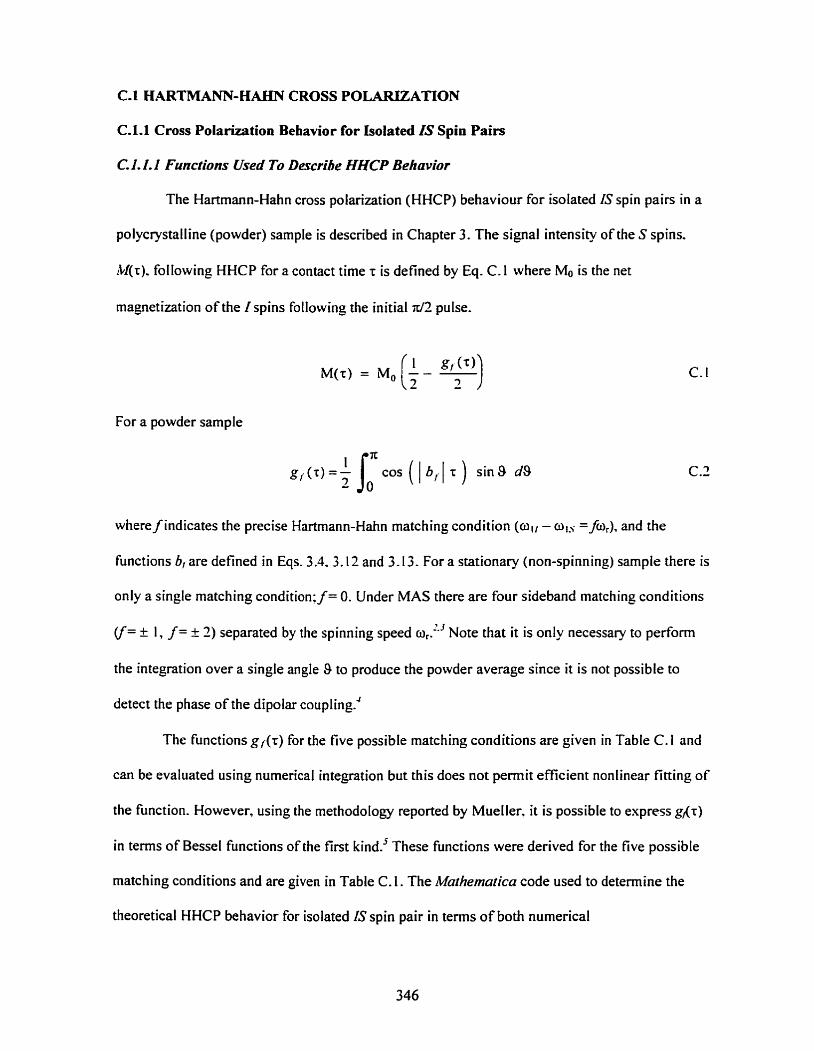
C- 1 HARTMANN-HAAN CROSS POLAFUZATION
C.1-1 Cross Polarization Behavior for Isolated IS Spin Pairs
C. 1. I. I Functions Used To Describe HHCP Behaviur
The Hartmann-Hahn cross polarization (HHCP) behaviour for isolated IS spin pairs in a
polycrystalline (powder) sample is described in Chapter 3. The signal intensity of the S spins.
~bf(r), following HHCP for a contact time t is defined by Eq. C. 1 where Mo is the net
magnetization of the I spins following the initial d 2 pulse.
For a powder sample
where f indicates the precise Hartmann-Hahn matching condition (all - col.,- = fw,), and the
functions 6, are defined in Eqs. 3.4.3.12 and 3.13. For a stationary (non-spinning) sample there is
only a single matching condition; f = 0. Under MAS there are four sideband matching conditions
ÿ= + 1, f = f 2 ) separated by the spinning speed or." Note that it is only necessaiy to perform
the integration over a single angle 9 to produce the powder average since it is not possible to
detect the phase of the dipolar coupling."
The functions g,(r) for the five possible matching conditions are given in Table C. 1 and
can be evaluated using numerical integration but this does not permit efficient nonlinear fitting of
the function. However, using the methodology reported by Mueller. it is possible to express g,(r)
in terms of Bessel functions of the first kind.' These functions were derived for the five possible
matching conditions and are given in Table C. 1. The Mathemica code used to determine the
theoretical HHCP behavior for isolated IS spin pair in terms of both numerical
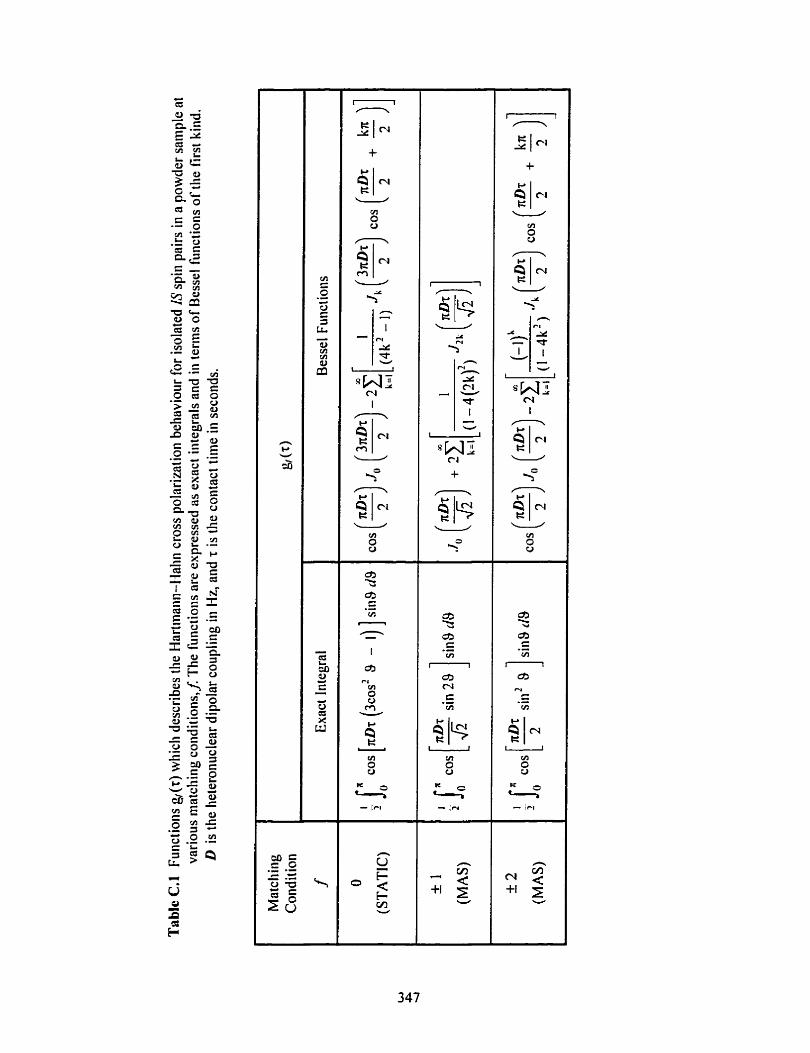

integration and Bessel functions of the first kind is outlined below using the static (f= O)
matching condition in the absence of relaxation as an example.
Define the function StatPowder which corresponds to numerical integration of Eq. C. 1.
StatPowder utilizes the numerical integration routine NIntegrate provided with ~Clathernutticu.
and because 1Mathematica requires arguments for trigonometric functions to be in radians, the D t
/ 2 tenn in Eq. C.2 has been multipled by 2x.
A list of data points (list3) is generated using StatPowder and a plot of these versus the
dimensionless parameter D r is generated (plot3).
dip = 1000; list3 = {{O, O)) ; = incr; i = 2;
Define a function StatPowBess describing Eq. C. 1 in tems of Bessel functions as given in Table

Here d is the 1-S heteronuclear dipolar coupling in Hz, t is the contact time in seconds. and the
variable k determines the number of Bessel functions to include in the sums. ~uel ler ' had
suggested that including five terms provides suficient accuracy and thus k = 5 was used in this
case. Note that the cosine argument in the Bessel functions must be converted to radians by
introducing an additional factor of 27r.
A list is generated using StatPowBess and the results plotted as described above for the
numerical integration. The resulting two plots are overlaid and show exact agreement as seen in
Figure C. I . Sirnilar analysis was carried out to check the validity of a1 I expressions derived in
ternis of Bessel functions, and to confirm that the functions used to analyze the experimental CP.
REDOR and TEDOR data were in agreement with those reported in the literature.
Figure C.1 Theoretical Hartmann-Hahn cross polarization behavior calculated for an isolated IS spin pair in a static powder sarnple (f= O) using numerical integration of Eq. C. 1 (filled circles) and in terms of Bessel functions (curve). No relaxation effects have been included.
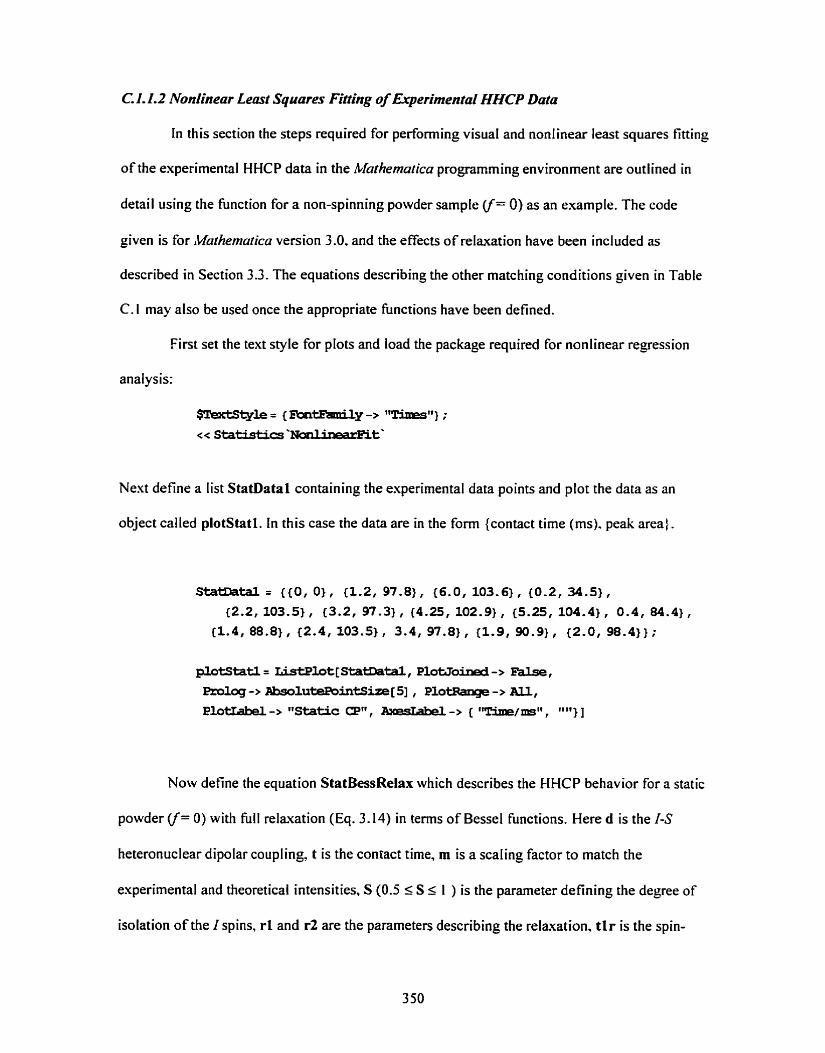
C. 1.1.2 Nonlinear Leaa Squares Firting of Experimental HHCP Data
In this section the steps required for performing visual and nonlinear least squares fitting
of the experimental HHCP data in the Mathematica programming environment are outlined in
detail using the function for a non-spinning powder sample Cf= O) as an example. The code
given is for ~Mathernatica version 3.0. and the effects of relaxation have been included as
described in Section 3.3. The equations describing the other matching conditions given in Table
C. 1 may also be used once the appropriate functions have been defined.
lirst set the text style for plots and load the package required for nonIinear regession
analysis:
Next define a list StatDatal containing the experirnental data points and plot the data as an
object called plotstatl. In this case the data are in the forrn {contact time (ms). peak area}.
Sta-tal = { (O , O), (1.2, 97.81, (6.0, 103.6), {0.2, 34.5},
(2.2, 103.5) , (3.2, 97.3) , (4.25, 102.9) , (5.25, 104.4) , 0.4, 84.4) , (1.4, 88.81, C2.4, 103.5), 3.4, 97.81, (1.9, 90.9), (2.0, 98-41};
Now define the equation StatBessRelax which describes the HHCP behavior for a static
powder Cf= O) with full relaxation (Eq. 3.14) in terms of Bessel functions. Here d is the 1-S
heteronuclear dipolar coupling, t is the contact time. rn is a scaling factor to match the
experimental and theoretical intensities, S (0.5 5 S r 1 ) is the parameter defining the degree of
isolation of the I spins, r l and r2 are the parameters describing the relaxation, t lr is the spin-

lattice relaxation of the / nuclei in the rotating frame, and the variable k determines the number
of Bessei functions to include in the sums (five in this case).
Sta-rd-, t-, m, S-, l., d., +It] := ~ [ r n * ~ [ - ] t tlr
Visual fitting of the experimental data is then carried out to determine appropriate values
for the various parameters. First the parameters are assigned values and a list statl is created.
Note that several parameter values are divided by a factor of 1000 to convert them from
milliseconds to seconds. A graph of the theoretical curve is produced (plotfitl) and the plot of
the experirnental data (plotstatl) overlaid for cornparison. The parameters are adjusted until an
acceptable match between the experirnental and theoretical plots is obtained.
statl= { {O , O ) ] ; tau = ïna;i=2;

Using these parameter values as initial starting values. nonlinear Ieast squares fitting of
the experimental cross polarization data to determine the 1-S heteronuclear dipolar coupling D is
then performed utilizing the Mothematica procedure ~onl inear~e~ress ' which rninimizes the ;(' merit function.
The Levenberg-Marquardt algorithm was found to be the rnost efficient method for the
minimum search. In this case not al1 of the parameters are allowed to Vary freely during the
fitting; S and tlr were fixed to values of 0.9 and 2 respectively. The output from this procedure
are used as input to plot the theoretical curve and compare it to the experimental data as above.
The procedure NoalinearRegress also generates a regession report containing the best fit
parameters, the asymptotic standard errors and confidence interval of the fitted parameters.
C.1.2 Cross Polarization Behavior in a Network of Strongly Coupled I Spins
The HHCP behavior for spins in a strongly dipolar-coupled network is different from
that observed for isolated IS spin pairs. The underlying assumptions and equations describing the
intensity of the S spin signa1 as a function of the contact tirne are given in Section 3.3.3. If T l , of
the S spins is much longer than that of the Ispins then Tl, (1) dominates the decay and a function
of the form given in Eq. 3.15 can be used to fit the experimental HHCP data. Below is the
Muihemutica function cpfunc which was used for nonlinear least squares fitting of HHCP data
when the there was a network of strongIy coupled I spins.

Here a is a scaling factor to match experirnentat and theoretical intensities, tcp defines the time
constant describing the build-up of magnetization due to polarization transfer. t l rho defines
(exponential) decay in rotating frame, and time is the contact time.
C.2 ROTATIONAL ECHO DOUBLE RESONANCE
C.2.1 REDOR Behavior for Isolated 1s Spin Pairs
The REDOR experiment is described in detail in Section 3.4. The equations and
1Mcrthematicc1 scripts used during fitting of the experimenta! data, and to investigate the
theoretical behavior REDOR for different puIse positions and numbers of spins are presented
below.
C.2.1. I REDOR Funcrions and Nonlinear Fitfing
The REDOR behavior for an isolated 1 ' spin pair is detinedL6 by Eq. C.2 where = nDr,
is a dimensionless parameter which is the product of the number of rotor cycles (n). the /S
heteronuclear dipolar coupling (D), and the rotor period (t,).
For a mirror symmetric REDOR pulse sequence with the dephasing pulses positioned at r , the
dipolar phase accurnulated over each mtor period, AmR, is:'

where al, is defined in Eq. 1.14 and the minus sign reflects the action of the I spin pulse. The
- complete expression is:
Figure C.2 shows the theoretical REDOR curves calculated for a selection of possible
positions of the dephasing pulses. The Mathematim code used to generate the REDOR curves
for dephasing pulses applied at position fract (O < fract < rJ2) is given below. In this example
30 points are caIculated as a function of the dimensionless parameter nDT, with the dephasing
pulses at t, /S.
When the dephasing pulse are at tl = r,/ 1, Eq. C.4 is simplified considerably and becomes:

Figure C.2 Theoretical REDOR dephasing calculated for an isolated IS spin pair with different placements of the dephasing x-pulses in a mirror symmetric REDOR sequence. The dephasing puises occur at 11 (indicated) during the period before the echo-forming ir-pulse and at sr - r i after. The curves are pIotted as a function of the dimensionless parameter nDr,.

A@, = h sinP cos P sin a C.5
Mueller reported thai Eq. C S can be re-expressed in terms of Bessel functions of the first
kind as:'
The Mathernatica code defining a function for the theoretical REDOR behavior for an isolated IS
spin pair with dephasing pulses applied at sr /2 in terms of Bessel functions of the first kind is:
where dip is the dipolar coupling and nTr is the product of the number of rotor cycles and the
rotor period r,.
Recently Mueller et UZ." reported a further simplification which makes allows the
calculation of AS/& in terms of Bessel functions of order 1/4 (Eq. C.7).
The 11.luthernaficn code defining a function for the theoretical REDOR behavior for an isolated IS
spin pair with dephasing pulses applied at r, / 2 in terms of Bessel functions of order 1/4 is:
where n is the number of rotor cycles. d is the dipolar coupling, and tr is the rotor period.

Either of these foms in terrns of Bessel functions can be used for efficient nonlinear fitting of
the experimental REDOR data in a manner analogous to that described in Section C . 1.1.2.
During the fitting procedure two parameters were varied and optimized: one corresponding to the
dipolar coupling, and an additiona1 parameter (a scaling factor) to account for incomplete or
statistical site occupancies.
C.2.1.2 The REDOR Transfurrn
Mueller et al." have reporteci a new analytical transfon which allows the dipolar
coupling to be determined directly fiom REDOR data for isolated IS spin pairs. as described in
Section 3.4. The Mathematica code used to perform this is given below. The originaI code was
kindly suppIied by Dr. K. MueIler.
First define a list which contains the experimental data in the forrn {n . Sr/So). Note the
use Sf/So rather than AS/So so the data decays to zero.
Next define apodization function (three-point Btackman-Harris) used to smooth the experimentat
data and ensure it decays completely to zero:
Apodize the experimental data and zerofill it to 128 rotor periods:

Define the REDOR transform "kernal" function and create a look-up table:
kreal[d-, tr-, ii., if, ünc_] := Table[{i, kemreaï[d, i tr]), {i, ii, if, iule) ] ;
Define the routine to calculate the REDOR Transforrn spectrum. This uses a simple summation
for the integration.
Calculate the REDOR transform kernal as a look-up table kerntab. This can take several
minutes. Note that we must avoid freql = O since the function is not defined at this point. speed
is the spinning speed in Hz used to acquire the experimental data.

Now perform actual calculation (REDOR transform) to produce the dipolar spectnim from the
apodized experimental data and plot it. The list spec128 contains the transform intensities as a
function of the dipolar frequency.
This analysis assumes the REDOR data was acquired with dephasing pulses positioned
at J2. The '~iggle" at small values of dipolar coupling in the REDOR transform --spectrum"
arises from the initial decay of the SISo data. A restriction determining the applicability of the
REDOR transform is that the maximum dipolar coupling observable is half of the spinning speed
used. This means that the spinning speed used must exceed the dipolar coupling by at least three
times if good REDOR transform spectra are to be obtained with the maximum corresponding to
the 1-S dipolar coupling clearly defined.
C.2.2 REDOR Behavior For a Single S Spin Dephased by Several I Spins
C.2.2. l Exact Georne frical Anabsis
The background theory and approach to calculating the REDOR dephasing for a single S
spin coupled to several Ispins when the explicit geometrical arrangement of the spins is known
is discussed in Section 3.4.2. The Mathematica code used to implement the formalism proposed
by Goetz and ~chaefe? in ternis of a pmduct of cosine Functions contsining vectorial dot
products as arguments is given below. It is also possible to calculate this in terms of a sum (Le.
Eq. 3.3 1 ) as presented for the multi-spin TEDOR dephasing in Section C.3.2.

First define the REDOR function AOR (Eq. 3.28) in terms of a dot product between the
(rotated) intemuclear vector v = (v l . v?, vJ ) having unit length, and unit vectors along the-v and z-
axes. A cornpiled function is used to reduce the computation tirne. The Mathrmuficu package
Geometry-Rotations is also Ioaded since this contains the function Rotate3D
used to perform rotations of the vectors through the three Euler angles.
Now define the experimental parameters such as the initial I-S vectors. the angle < between them. and individual I-S dipolar couplings, and evaluate Eq. 3.33 using a simple
summation procedure to perform the integration. In this example the dephasing is calculated for
an with < = 20'. and dipolar couplings DI = D2 = 100 HZ. The function Rotate3Dl~. 0. $1
performs successive rotations about the three Euler angles y, 0. and 4: the first by y about the z
ais. the second by angle 0 about the x s~uis, and the third around the z mis by angle 4.'
A series of calculations was underiaken to determine the angular step size for the
integration and the computation tirne required to achieve suitable precision. The results are
presented in Table C.2 and reveal that a step size of 7tMO radians provides AS/So correct to three
decirnal places, and thus represents a very efficient trade-off in terms of computation time versrrs
precision. Table C.3 Iists the theoretical REDOR dephasing AS/% calculated for a %spin
system having D, = D2 = 100 Hz for different I-S-l angles <. The theoretical behavior for several
1-A spin systems is explored further in Chapter S.

Table C.2 REDOR AS/So dephasings calculated using Eq. 3.33 for an exact tetrahedral geometry o f four Ispins dipoiar coupled (D = 120 Hz) to a single observed S spin using various step sizes for the numerical integration.
Dephasing Time
Calculation time per
point
Step Size (radians)
Data from Dr. J. Schaefer; persona! communication. December 5, 1996.
71/20
0.00000
0.04069
O. 1492 1
0.30726
0.48658
0.65772
1 min
n / 40
0.00000
0.039 18
O. 14779
0.30599
0.4855 1
0.65687
8 min
xI60
0.00000
0.03890
O. 14753
0.30576
0.4853 1
0.65672
27 min
~ x a c c
0.00000
0.03 867
O. 14728
0.30548
0.48502
0.65645
n / 90
0.00000
0.03878
O. 14742
0.30566
0.48523
0.65665
1.5 h
K I 180
0.00000
O. 143 75
0.485 17
12 h

Table C.3 Theoretical REDOR AS& dephasings calculated using Eq. 3.33 for different geometries of two I spins dipoIar coupled (DI = D2 =100 Hz) to a single (observed) S spin. 6 is the angle between the two heteronudear vectors. A step size of d20 radians was used for the numerical integrations.
<=90°
0.000
0.084
0.295
0.553
0.776
0.920
0,992
1 .O22
1 .O32
1 .O27
1 .O03
0.964
0.926
0.907
0.913
0.937
0.965
0.986
0.998
1 .O02
1 .O00
<=45"
0.000
0.084
0.302
0.577
0.825
0.984
1.045
1 .O36
1 .O04
0.985
0.992
1.013
1 .O28
1 .O27
1.012
0.993
0.98 1
0.980
0.988
0.998
1 .O05
nt, (ms)
O
2
4
6
8
10
12
14
16
18
20
7 7 --
24
26
38
30
32
34
36
38
JO
<=20°
0.000
0.083
0.280
0.490
0.627
0.672
0.679
0.709
0.786
0.882
0.955
0.985
0.989
0.997
1 .O23
1 .O52
1 .O63
I .O46
1.018
0.999
0.996
<=180°
0.000
0.082
0.269
0.445
0.521
0.497
0.442
0.426
0.459
0.500
0.5 10
0.486
0.462
0.464
0.488
0.505
0.498
0.475
0.459
0.462
0,473
C=109O
0.000
0.084
0.300
0.572
0.815
0.980
1 -059
1 .O79
1 .O72
1 .O58
1 .O4 1
1 .O22
1 .O03
0.991
0.990
0.997
1.003
1 .O0 1
0.991
0.981
0.976
<=120°
0,000
0.084
0.3 03
0.585
0.844
1 .O19
1 .O93
1.090
1.052
1.016
0.998
0.997
I .O0 1
1 .O02
0.99 8
0.996
0.998
1.005
1.013
1.019
1.019
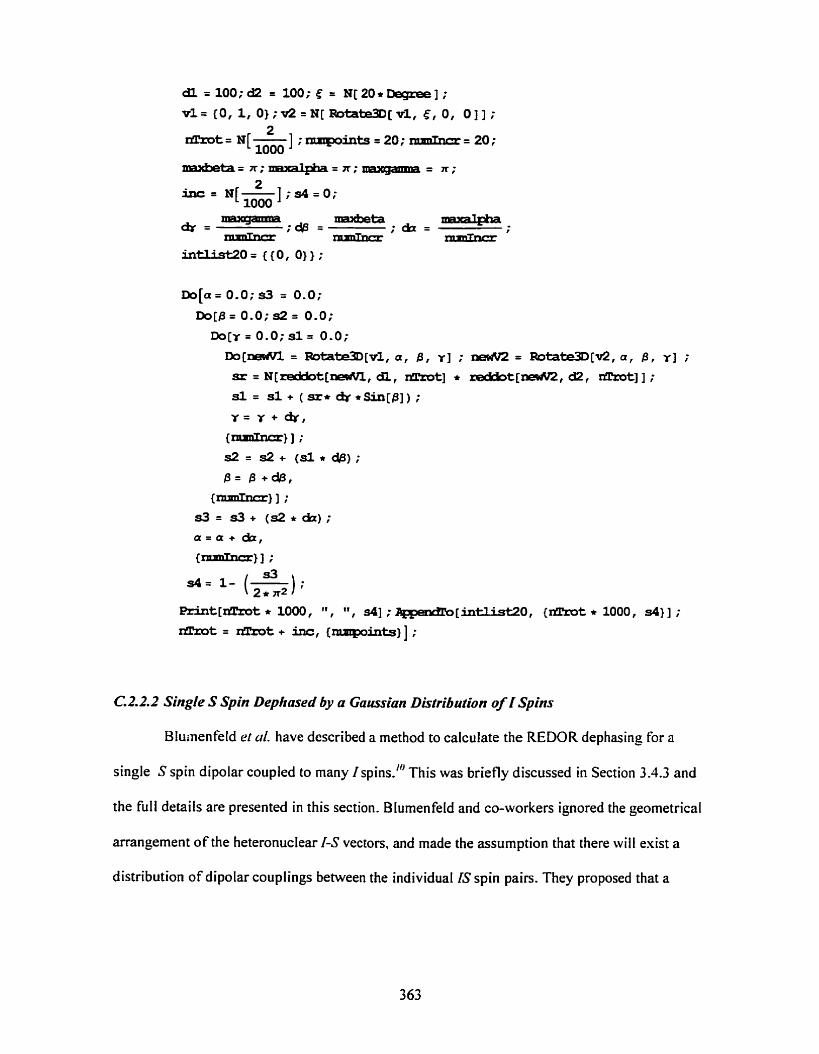
dl =100;d2 = 100;E = N[20+-1; vl= {O, 1, 0);02=N[Rotate3D[vl, 0, O]];
rn
in+li_9+5!0= {{O, O});
C.2.2.2 Single S Spin Dephmed by a Gaussian Disrriburion of l Sphs
Bluinenfeld el uL have described a method to calculate the REDOR dephasing for a
single S spin dipolar coupled to rnany I spins.'" This was briefly discussed in Section 3.4.3 and
the full details are presented in this section. Blumenfeld and CO-workers ignored the geometrical
arrangement of the heteronuclear 1-S vectors, and made the assumption that there will exist a
distribution of dipolar couplings between the individual IS spin pairs. They proposed that a

Caussian distribution could be used to weight the contribution of the individual IS spin pairs.
The result is a function having a direct dependence on the hetemnuclear second moment MI(I-S):
where iv(D,) is the Gaussian weighting function:
Eq. C.8 can be evaluated numerically. but requires long computation times. Substitution of ASlSo
by the appmpriate expression in terms of Bessel functions of order 114 (Eq. C.7) makes it
possible to obtain an analytical solution (Eq. C. IO).
?FZ is a hypergeornetric function defined by:"
where
(a& = 1, and (a& =(al) (al+ 1) (al+ 2) . . . (al+ k- 1) etc.
Unfortunately the hypergeometric function becomes unstable (due t~ the magnitude of the
individual terms and the number of terms) when n' M, ( I - S) r: > 3 and no longer converges.
However Eq. C.8 can be re-expressed as:

Eq. C. 1 1 can be evaluated nurnerically using the Gaussian-Hermite quadrature method"
since it is of the form:
where X, is the i-th root of Hn(.r), the Hermite polynomial of order n, w, is defined by Eq- C. 13.
and Rn is a (small) remainder term which was not included in the calculation.
The following hfathemarica code find the nodes of the n-th order Hermite poiynomials.
calculates the Gaussian weights, and defines the actual GaussREDOR function. Note that Hn
must to be large enough (typically >150) so that the approximation is acceptable and oscillations
are not present in the resutting function. This function was derived by D. Brouwer.
-t= m[ sBh-= Enl! 4 It ] /. Hmots; (HexniteEx[rn- 1, XI)
Here nTr is the dephasing time in milliseconds, and M is the heteronuclear second moment in
HZ'. A series of curves calculated for different values of the second moment are given in

Chapter 5. Nonlinear fitting of experimental REDOR data c m be achieved usine this function as
described in Section C, 1 . 1 2 and uses onty a single parameter corresponding to M2(I-S).
C.3 TRANSFERRED ECHO DOUBLE RESONANCE
CA1 TEDOR Behavior for Isolated IS Spin Pairs
The theory of the TEDOR experiment is discussed in Section 3.5. [n this section the
equations and hlalhenmtica code used to detennine fiinctions for different positions of the
dephasing pulses, and perfom nonlinear teast squares fitting of the experimental data are
presen ted.
The theoretical TEDOR behavior for an isolated IS spin pair is:'.'
where n is the number of rotor periods before coherence transfer, m is the number of rotor cycles
after transfer. A,, = and hm= rnDt,. In a TEDOR experiment there are hvo dephasing K-pulses
applied per rotor period, and these are applied at times r , and tz ( O < f i < 12 < T,). The dipolar
phase accurnulated over each rotor penod (Aar,, where i = n or m) is:'
Eq C. 15 can be evaluated in Mathemufica for various choices of 1, and rz as follows:
function describing the dipolar coupling under MAS conditions (Eq. 1.14).

Now this hnction is integrated using appropriate Iirnits. In this example position the pulses are at
one quarter and three quarters of each rotor cycle so tl = rr/4 and t? = 3r,/4.
r, 3tr r n - q a i e g a m r b, cl. (cf - J -}] +
4 4
rable C.4 contains the functions (i= n or m ) determined for a selection of possible
pulse positions using this code. Numerical integration of Eq. C. 14 (using the appropriate
functions frorn Table C.4) was used ro determine the theoretical TEDOR dephasing for selected
pulse positions and several of these are plotted in Figure C.3.
The ma..imurn dephasing occurs when t2 - 1, = T,/S and it is apparent that the oscillations
are not periodic. There is no restriction that the pulse positions before and after the coherence
transfer be the same. Furthemore, it is possible to achieve the same dephasing using different
pulse positions. For example. identicaI behavior is observed with pulses at (T, /3 . 2 ~ , / 3 ) and (t, /6
. 5rJ6) since the net time during which the dephasing accumulates equals rJ3 in both cases (see
Figure C.3 (a)).
Inspection of the equations in Table C.4 reveals that the expression for AmT., is
particularly simple when the dephasing pulses are applied at (r,A .32,/4). Mueller derived an
expression for this case in terms of Bessel functions of the fint kind:'


Figure C3 Theoretical TEDOR dephasing for an isolated IS spin pair for the indicated placements of the two dephasing n-pulses in the period following coherence transfer. The curves are plotted as a function of the dimensionless parameter mDtr and were calculated assuming nDr, = 0.84 and that the dephasing pulses before coherence transfer were at r44 and 3~44. The curves are identical for r,./3,2rJ3 and t,./6,5tJ6 since the net dephasing time is the same (743).

Using Eq. C.16. nonlinear least squares fitting of the experimental TEDOR data acquired
with al1 dephasing pulses applied at (rJ4 , 3rr /4) was possible. In addition to a parameter for the
dipolar coupling, a scaling factor was required to match experimental and theoretka1 intensities
since TEDOR intensities are not normalized. [t was found that the use of a weighting function
greatly irnproved the fitting procedure. The best weighting scheme was one determined by the
inverse of the number of rotor cycles, since the TEDOR data decay to zero and better signal to
noise (and thus more reliabte peak intensities) are available at srnail numbers of rotor periods. A
damping function was also applied to account for T2 decay during the experiment. The
bfa~hematica code used tc pelcforming nonlinear fitting of TEDOR data is given below.
First define a list teddata containing the experimental data in form (number rotor cycles.
peak area). and set the other experimental parameters used to acquire the data. In this case the
spinning speed was 4.77 kHz n = 2, and rn was varied from I to 16 (maxm) in increments of one
rotor cycle. The package for the nonlinear regression analysis is also loaded.
<< S t d M c s 9 N a r i l u l e a r F i t '
= 16; n = 2; speed= 4770; trot = ~ [ 1 / -1 ;
Calculate a list containing the weights to be used during the nonlinear fitting:

Define the function tedfunc describing the TEDOR behavior for isolated IS spin pair in terms of
Bessel functions (Eq. C. 16). Here dampening is dependent on rn (since the number of rotor
cycles afler the coherence transfer was varied), and sf is a scale factor to match the theoretical
and experimental intensities.
Now do the least squares fitting of the data to obtain the best parameters:
Numerical integration of Eq. C. 14 (using the appropriate functions from Table C.4) was used to
visually fit experimental TEDOR data acquired when the dephasing pulses were not applied at (t,
/4 . 3 T~ 14).
C.3.2 TEDOR Behavior For a Singte S Spin Dephased by Several 1 Spins
The theoretical TEDOR behavior for a single S spin dephased by several I spins can be
derived by extending the methodology presented by Naito et aLf3 and Schaefer and co-
workers.'"" The basis for the general approach and the underlying assumptions are described in
Sections 3.4.2, 3.5.3 and C.2.2. Essentially the LM+, arguments within the sine functions in Eq.
C. 14 are repIaced by a sum of terms expressed as the appropriate vector dot products (Eqs. 3.38-

3.4 1 ). ALI unique combinations of the individual Ml's must be considered. Eq. C. 17 gives the
expression which must be evaluated for a 3-spin &S system. In this case there are only hvo
combinations of the dipolar couplings which need be considered: DI + D2 and D, - D,. These
combinations are represented as ch,., (i = n or m. and j = 1.2.3 ... c) where c is the nurnber of
combinations of the individuai Dl's. The expression is integrated over the three Euler angles to
reproduce ail possible crystalIite orientations and achieve a powder average.
I I ST = - Is Jz (sin[d@-&. 8. iy. +hl,) + A*, (4.0. y. +&,)]} x
c 4n- 0 0 0
The package Geometry 'Rotations' required to perform rotations of the vectors through the
three Euler angles and is loaded rising:
cc -tq'Ebtatians '
Define compiled funciions tedsum4 tedsum3, and tedsum2 for four. three. and two I spins
coupled to a single S spin respectively. The calcuIation can be done for the chosen values of the
mperirnental parameters using a simple summation to perform the integration. In this example
the spinning speed was 4.540 kHz, rn = 2, n was varied, and there are four I spins in an exact
tetrahedral arrangement about a central S spin. For this 5-spin systems there are eight unique
combinations of the M,'s (out of a possible sixteen since. for example, 1 Dl + D2 + Dl + D, 1 =
1 -DI - - DJ - D, 1 ) which rnust be included.
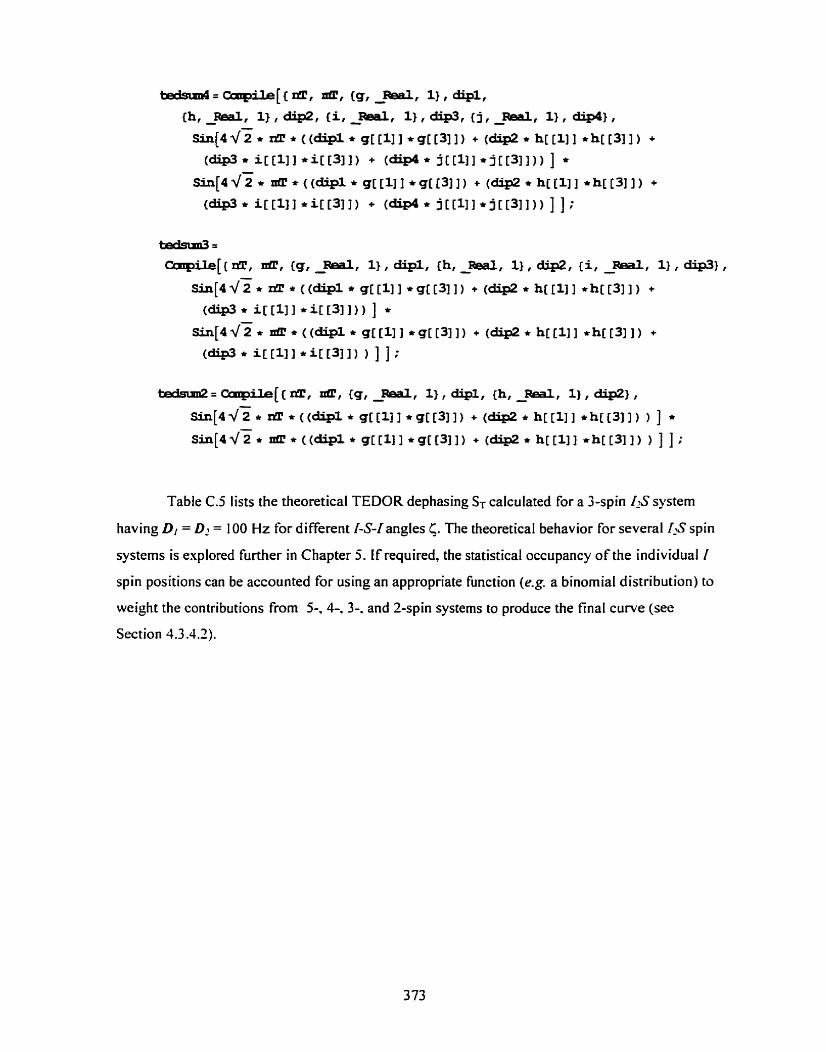
Table C.5 lists the theoretical TEDOR dephasing ST calculated for a 3-spin 12S system
having DI = LI2 = 100 Hz for different 1-S-Iangles <. The theoretical behavior for several &S spin
systems is explored further in Chapter 5. If required, the statistical occupancy of the individual I
spin positions can be accounted for using an appropriate function ( c g . a binomiaI distribution) to
weight the contributions from 5-, 4-,3-. and 2-spin systems to produce the final cuwe (see
Section 4.3.4.2).

Table CS Theoretical TEDOR Sr dephasings calculated using Eq. C . 17 for different geometries of MO I spins dipoIar coupled (DI = D2 = 100 HZ) to a singIe (obsewed) S spin. 6 is the angle between the two heteronuclear vectors. A step size of 7d20 radians was used for the numerical integrations assuming a spinning speed of 2.5 kHz, and that the number of rotor periods afier the coherence tram fer, m. was fixed at 20 (mDz, = 0.84).
<=180°
0.000
0.025
0.086
0.1 72
0.228
0.209
O. 120
0.020
-0.039
-0.016
0.022
0.039
0.0 19
-0.0 12
-0.025
-0-0 12
0.005
0.004
-0.012
-0.025
-0.019
nt, (ms)
O
7 - 4
6
8
10
I2
14
16
18
20
7 7 -- 24
26
28
30
32 --
34
36
38
40
<=120°
0.000
0.216
0.395
0.503
0.525
0.465
0.347
0.206
0.078
-0.008
-0.047
-0.047
-0.027
-0.005
0.007
0.010
0.008
0.006
0.004
0.003
0.000
t;=109"
0.000
0204
0.3 79
0.497
0.535
0.486
0.370
0.225
0,093
0.005
-0.034
-0.040
-0.034
-0.028
-0.024
-0.020
-0.013 ----- -0,005
0.000
0.000
0.001
<=90°
0.000
0.183
0.348
0.469
0.5 15
0.471
0.353
0.205
0.075
-0.006
-0.039
-0.042
-0.033
-0.020
-0.002
0.018
0.036
0.042
0.033
0.0 15
0.000
1;=20°
0.000
0.091
0.199
0.3 12
0.39 1
0.399
0.337
0.247
0.181
0.162
0.1 72
0.1 71
0.138
0.08 1
0.03 1
0.006
0.003
0.001
-0.013
-0.034
-0.045
<=4s0
0.000
0,203
0.371
0.475
0.50 1
0.450
0.345
0.21 7
0.101
0.021
-0.016
-0.021
-0.01 1
-0.002
-0.002
-0.007
-0.01 1
-0.009
0.000
0.011
0.020
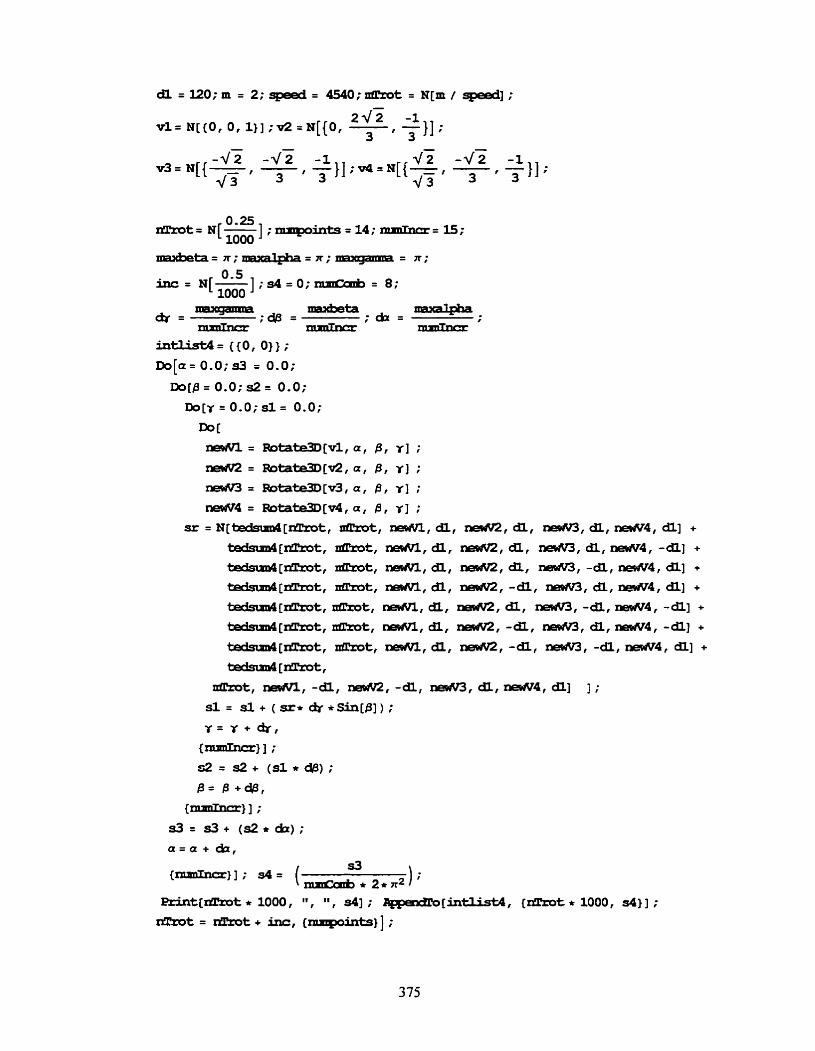
-;* = Illaabta ctr = ; & = -.
rnmTiirrr - - in-= {{O, O)] ;
m[a = 0.0; 93 = 0.0;
m[B = 0.0; 92 = 0.0;
Do[r = 0.0; sl = 0.0;
Do[ neoJNl = Rotatx=3l[vl, a, fi, y] ;
= Rotate3D[11iLf a , B , rl ; rrePnn = R o t a w [ v 3 , a, 8 , Y] ;
-4 = Rotate3D[v4, a , 43, 1-1 ;
sI: =N[i=dSud[nTrot, rdllrot, newl,dl, neoNS, dl , neP4V3,dl,new4, dl] +
tedsunrl[xfIbt, -t, rlewl,dl, m , a , n e k N 3 , d l , W 4 , - d l ] +
t€!dsm4[drmt, nnrrot, newvl,dl, rreo4V2, a, na4V3, -dl,ne!vw4, dl] +
-dsud[-t, nlllrat, n w v l , d l , ndV2,-dl, I m w 3 , d l , ~ 4 , d l ] +
tdsm4[-t,iibllrot, newl,dl, rlew2,dl, neoén,-dl,rreI4V4,-dl] +
tdsm4[xfIbt, IdFmt, neml, d l , neo4V2, -a, nmm, dl , new4, -dl] +
tedSm4[nTmt, ImrOt, riepnn,a, m, -dl, neolnn, - d l , d 4 , dl] +
-[-kt
-t, newl,-dl, rm%n,-dl, riso4V3,dl,new4,dl] j ;
sl = s l + ( s r * & * Ç i n [ B ] ) ;

REFERENCES FOR APPENDIX C
I (a) WolFram, S. The Mathematica Book. Cambridge University Press, 3rd Edition. 1996. (b) Wolfram Researc h, iblarhernatica 3. O Standard Add-On Packages. Cam bridge University Press. 1996.
2 Hediger. S.: Meier, B.H.; Ernst. R.R Chem. Phys. Lett. 1995.240,.149-456.
3 Hediger. S. €TH Zürich. Personai Communication, August 1997.
4 Hediger, S. Ph.D. Dissertation, Eidgenossisc he Technische Hochschu le Zürich. Switzerland. 1996.
6 Gullion T.; Schaefer, J. Adv. Magn. Reson. 1989, 13,57-93.
7 Hoil. S.M. Ph.D. Thesis, Washington University, Missouri, U.S.A. 1993.
8 Mueller, KT.; Jarvie. T.P.; Aurentz, D.J.: Roberts, B. W. Chem. P b s . Lett. 1995,242. 535- 542, Muelier, KT.: Jarvie, T.P.; Aurentz, D.J.; Roberts. B.W. Chenz. Phys. Lert. 1996. 254, 28 1-282.
9 Goetz, J.M.; Schaefer, J.J. Magn. Reson. 1997, 127, 147-154.
IO Blumenfeld, A.L.; Coster. D.: Fripiat, J.J. J, Phys. Chem. 1995. 99. 15 18 1 - 15 19 1.
I I Oberhettinger, H . in Handbookof Mathemarical Frinctions, Abramowitz, M.; Stegun. I.A. (Eds.) Dover Publications [nc. New York, 1970,9th printing, Chapter 15.
I Z Hing, A.W.; Vega, S.: Schaefer. J.J. iMugn. Reson. Ser. A. 1993, 103. 151-162.
13 Naito, A.: Nishimura, K.; Tuzi, S.: Saitô, H. Chem. Ph-vs. Lett. 1994.229.506-5 I 1 .
14 Pan, Y .; Gu11 ion, T.; Schaefer, J. J. Magn, Reson. 1990, 90,330-340.

DERIVATION OF EQUATIONS FOR CALCULATING
HETERONUCLEAR SECOND MOMENTS IN THE PRESENCE OF
MOLECULAR MOTION
The equations necessary for evaiuating the 1-S heteronuclear second moments for a
polycrystalline (powder) sample in the presence of molecular motion are derived in this
appendix. These were incorporated in the computer programs described in Appendix E used to
locate sorbed p-difluorobenzene in the channels of ZSM-5 from 'H- '~s~ cross polarintion data.
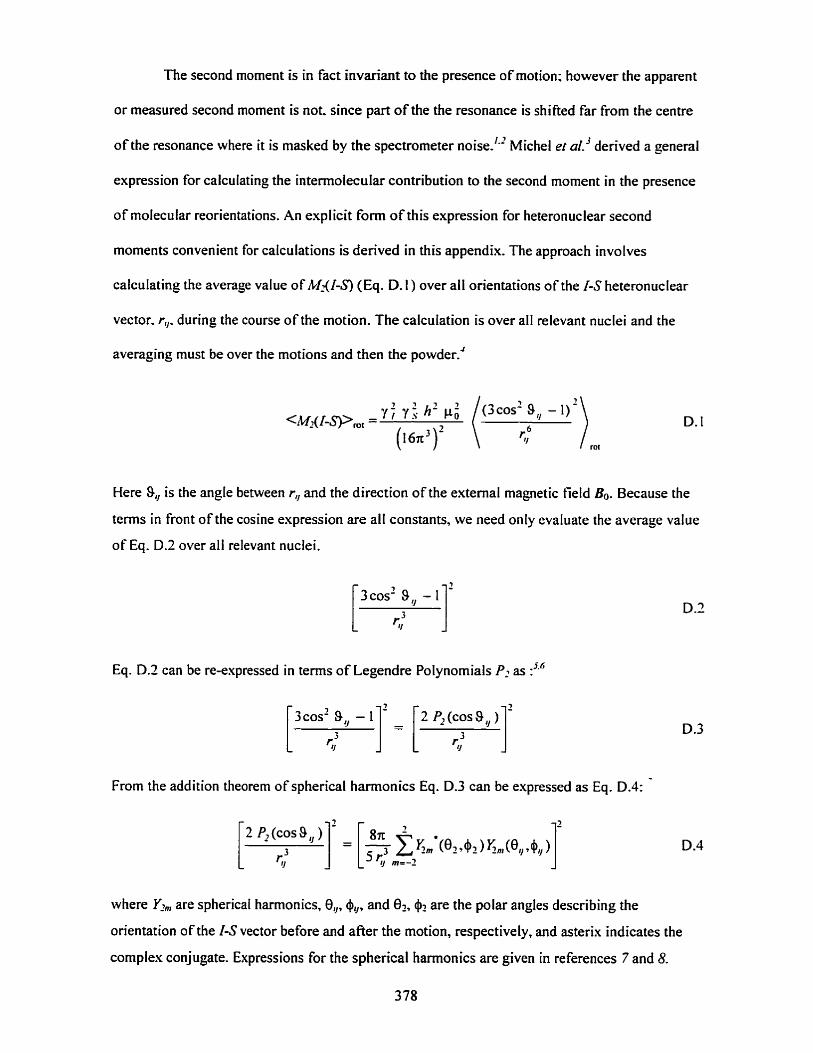
The second moment is in fact invariant to the presence of motion; however the apparent
or measured second moment is not. since part of the the resonance is shified far from the centre
of the resonance where it is masked by the spectrometer noise.'..' Michel er of.' derived a pnerai
expression for calculating the intermolecular contribution to the second moment in the presence
of molecular reorientations. An explicit form of this expression for heteronuclear second
moments convenient for calculations is denved in this appendix. The approach involves
calculating the average value of M2(I-S) (Eq. D. 1 ) over al1 orientations of the 1-S heteronucIear
vector. r,,. during the course of the motion. The calculation is over al1 relevant nuclei and the
averaging must be over the motions and then the powder.'
Here 9, is the angle between r,, and the direction of the extemal magnetic field Bo. Because the
tenns in front of the cosine expression are al1 constants, we need only evaluate the average value
of Eq. D.2 over al1 relevant nuclei.
Eq. D.2 can be re-expressed in tems of Legendre Polynomials P2 as :'"
From the addition theorem of spherical harmonics Eq. D.3 can be expressed as Eq. D.4:
where Y?,, are spherical harmonics, O,,, +,,, and 02, e2 are the polar angles describing the
orientation of the ES vector before and after the motion, respectively, and asterix indicates the
complex conjugate. Expressions for the spherical harmonics are given in references 7 and 8.
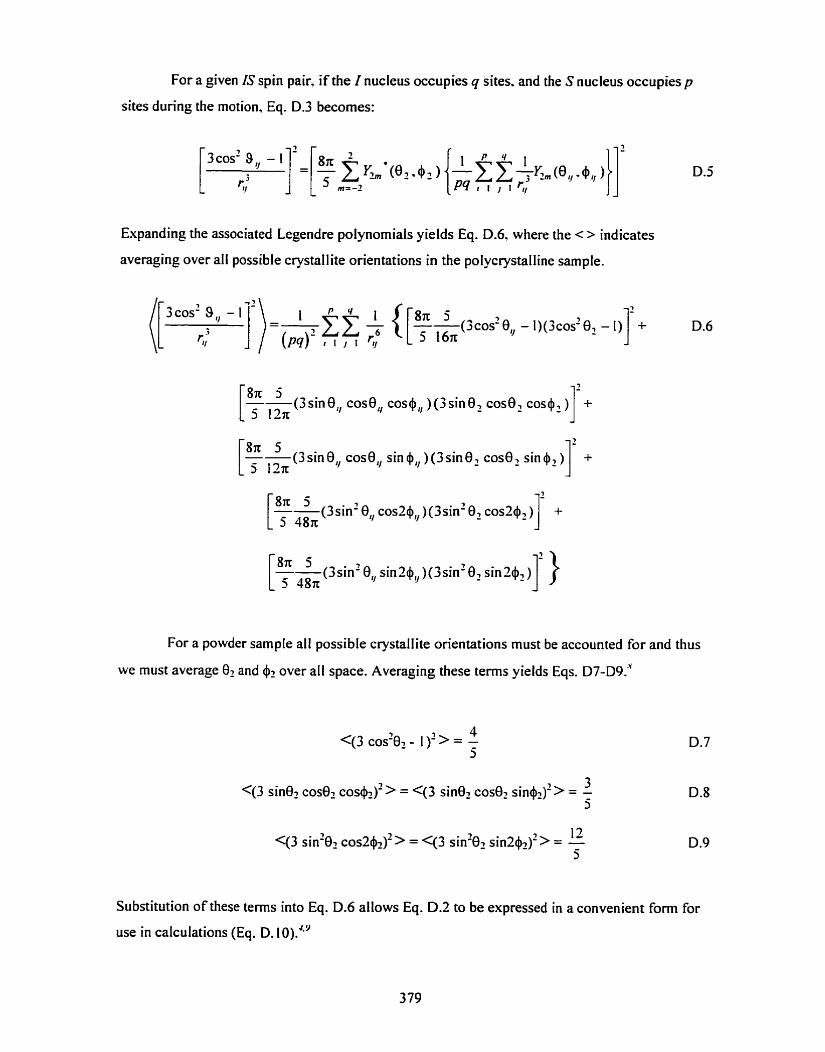
For a given IS spin pair. if the I nucleus occupies q sites. and the S nucleus occupies p
sites during the motion, Eq. D.3 becornes:
3 cos' 9, -
5 ,=-,
Expanding the associated Legendre polynomials yields Eq. D.6. where the c > indicates
averaging over all possible crystallite orientations in the polycrystalline sample.
(3 sine,, cosCl, 5 127r
(3 sin O,, cos O,,
(3 sin2 0, cos24, ) (3 sin' cos24, ) + 5 487r - 1
(3sin' 0, sin2$,,)(3sin2 8, sin 24, ) 5 48x - ] >
For a powder sample alt possible crystallite orientations must be accounted for and thus
we must average and 4? over al1 space. Averaging these tems yields Eqs. ~ 7 - ~ 9 . "
Substitution of these tems into Eq. D.6 allows Eq. D.2 to be expressed in a convenient form for
use in calculations (Eq. D. 1 O)."'
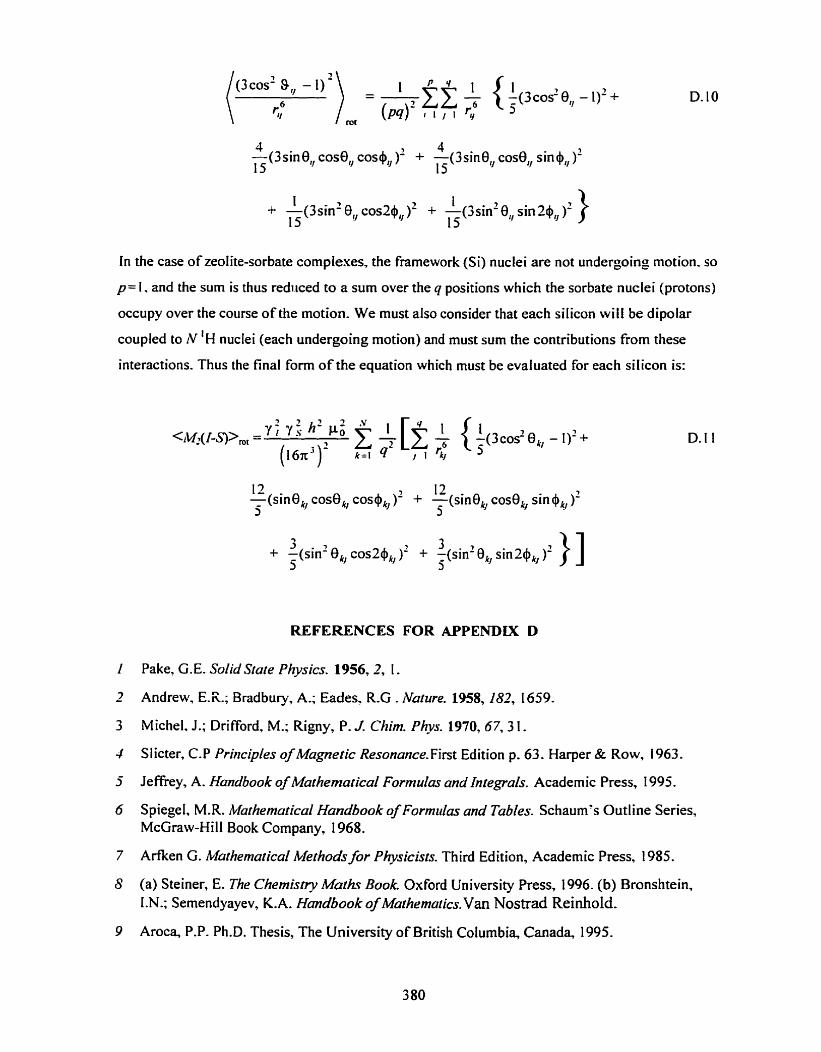
I 1 + -(3sin2 0, cos241, )' + -(3sin2 0, sin 24, )' 15 15
In the case of zeolite-sorbate complexes, the framework (Si) nuclei are not undergoing motion. so
p= i . and the surn is thus reduced to a surn over the q positions which the sorbate nuclei (protons)
occupy over the course of the motion- We must also consider that each silicon wilI be dipoiar
coupled to N 'H nuclei (each undergoing motion) and must sum the contributions from these
interactions. Thus the final fonn of the equation which must be evaluated for each silicon is:
12 7 12 -(sinek, cosOb cos@,,)- + -(sinOk, cosû,, sine,, )' 5 5
3 3 + -(sin2 OkJ cos2@, )' + :(sin2 BkJ sin2+,, )-
5 3
REFERENCES FOR APPENDIX D
Pake, Ci. E. Sofid Sme Physics. l956,2, 1 .
Andrew, EX.; Bradbury, A.; Eades, R.G . Nature. 1958,182, 1659.
Michel. J.; Drifford, M.; Rigny, P. J. Chim Phys. 1970,67,3 1.
Siicter, C.P Principles of Magnetic Resonance.First Edition p. 63. Harper & Row, 1963.
Je Rrey, A. Handbook of Mathematical Formulas and Integrals. Academ ic Press, 1 995.
Spiegel, M.R. hfathematical Handbook of Formrilas and Tables. Schaum's Outline Series, McGraw-Hill Book Company, 1968.
Arfken G. Mathematical Methods for Physicists. Third Edition, Academic Press, 1985.
(a) Steiner, E. The Chemisny Muth Book Oxford University Press, 1996. (b) Bronshtein, LN.; Sernendyayev, K.A. Hmdbook of Mathematics. Van Nostrad Reinhold.
Aroca, P.P. Ph.D. Thesis, The University of British Columbia, Canada, 1995.

ALGORITHM FOR LOCATING MOLECULES IN ZEOLITE
CHANNELS FROM CROSS POLARIZATION DATA
This appendix contains a descriptive outline of the logical sequence of steps necessary
for calcuations used to determine the location and orientation of thep-difluorobenzene molecule
in zeolite ZSM-5 from I9~-"si and 'H - '~s~ cross polarization (CP) data. The actual computer
programs were developed directly from this "pseudo-code'' algorithm. The approach used was to
search for linear correlations between the silicon-fluorine (or silicon-proton) heteronuclear
second moments and the 1 / TCP values of selected silicons in the frarnework as the rigid sorbate
molecule was rotated and translated within the zeolite channel system. Details of the background
theory, NMR experiments, fining of the CP data, and the results of these calculations are
discussed in Chapter 6.

E.1 PROGRAM OPTIONS AND DETAUS OF TRANSFORMATIONS USED
Two different programs were wrïtten. The first of these (CPF9.PAS) calculated static second
moments, while the second (CPH9.PA.Y) incorporated molecular motions of the sorbate
molecules ( 180" ring-fIips about the F-F a i s ) using the equations derived in Appendix D. The
actual programs were implemented using the PASCAL programming Ianguage and contained
approximately 1800 Iines of code. Routines incorporated in the program alIowed orthogonal and
non-orthogonal space groups syrnmetries to be used. and also supported non-standard choices of
the &.es in the different crystal systems, This latter requirement was imposed by the need to use
the non-standard settings for the monocl in ic phase of ZSM-5 (i. e. space group PZ,/n. 1.1). The
source code was compiled to run under the DUS operating system using the firrbo Pascul
software package1. The pseudo-code presented here is for analysis of ' 9 ~ - ' 9 ~ i CP data but is also
applicable for 'H- '~s~ CP data (only the input file had to be modified). A sarnple input file used
for the analysis of a ' 9 ~ - ' 9 ~ i CP data set is also included.
The programs allowed the mode of operation to be selected from four possible options :
1 . Output atomic coordinates (fractional or Cartesian) for a given rotation andor translation
2 . Output of framework-sorbate distances for a given rotation and/or translation
3 . Calculation of second moments and least-squares fit for a given rotation andor translation
4. Calculation of second moments and least-squares fits for a range of rotations and translations
Option I provided coordinates for subsequent viewing in an appropriate graphical
environment. The prograrns ATOMS #.& and ORTEP-3 for ~ i n d o i v s ~ were used for this purpose.
The option to output sorbate-framework distances was used to produce the information required
for the REDOR and TEDOR simulations (Cartesian coordinates were also output when this
option was selected). The program was thoroughly checked by comparing the output distances
with those obtained from the PUT ON-^^^ crystallography software. and against manual
calculations performed for selected sorbate locations and orientations.
The coordinate transformations used to interconvert between fractional and orthogonal
Cartesian coordinates are:'

X = M x and X = M ' * X
where X and x are position vectors wntten as colurnn vectors. with X expressed in Cartesian
coordinates (dimension of length), and x in (dimensionless) crystallographic fractional
coordinates. The matrices M and M-* are valid for al1 230 space groups and are defined as:'
a p/ sin a O
a(cosy-cosacosp) /s inar bsinar
a cos
sin a l a p O
(COS acosp-cosy) / b psin a I / b sin a
( c o s a c o s y - c o s p ) / c p s i n a -1lc tana
where a. b. c. a: p, and yare the usual cell parameters (lanice constants). and
Fractional coordinates and details of the crystallographic unit cell parameters for the ZSM-5
framework were taken from the single crystal X-ray structure of calcined ZSM-5 at room
temperature reported by van Koningsveld el al. (Monoclinic. P&/n. I . 1, a = 20.107 A, b = 19.879
A. c = 13.369 A. a = 90.670).' The symmetry operators for this non-standard space group were
obtained from reference 7. Different symmetry operators were used for the FROM and TO atom
sets to ensure that the central unit ceIl contained 4 complete (intact) sorbate moiecules. The
sorbate molecule geometry was fixed to an ideal geometry: a planar, rigid. hexagonal parct-
disubstituted benzene ring with C-C. C-H, and C-F bond lengths of 1.392 A. 1 .O80 A. and
1.328 A respectively.
The matrix R used for perfoming the rotations about three Euler angles (4.0, q ~ ) is:"
cos iy cos 8 cos + - sin yr sin + cos tp cos 0 sin $ + sin tp cos 4 -cos sin 0 -sin yr cos 8 cos 4 - cos y . ~ sin + -sin v cos 8 sin $ + cos w cos 4 sin v sin 8
sin 0 cos + sin 8 sin cos 8
where the first rotation is by 4 about the z axis followed by a rotation of 0 about they mis. and
finally a rotation about the (new) z axis by y.
3 83

Four set of atorns were used. These were subdivided into two groups; the FROM atoms
(zeolite framework Si and O), and the TO atoms (F and H atoms in sorbate molecules). In
addition to a complete unit ceIl of Si. O, F. and H atoms, the 26 surrounding unit cells of TO
atoms were generated. Ail FROM-TO distances were checked to ensure that a given translation
and rotation did not bring the sorbate too close to the framework atoms (distances less than 7 A were flagged as -tao close"). The second moment calculations were only done for the "si and
the T 0 atoms of interest (cg . 1 9 ~ for ' 9 ~ - ' 9 ~ i CP data). with any TO-FROM distances exceeding
the chosen Iimit (typicaily 8-10 A) ornitted. In the case of the ' H - ~ S ~ CP data. tsvo calculations
were done; one assuming the rings were stationary (static second moments calculated. Le. using
CPF9.PAS). and another using CPH9.PAS assuming the sorbate was undergoing 180" ring-flips
about the F-F auis.
E.2 SAMPLE INPUT FILE
INPUT FILE for CPF9.PAS TITLE F-Si CP @ 230K 4 DFB + ZSM-5 (P21/n.l. 1 Zeolites l99O,l0,235) Ce11 parameters a b c (Angstroms)
20.107 19.879 13-369 alpha beta gamma (degrees) 90- 67 90.00 90.00 "Fromff Atoms Data Number of known atoms to calculate distances etc. FROM 24 Gyromagnetic ratio for FROM Nuclei in rad / Tesla sec 53188000 FROM Atoms (label up to 4 chars, No spaces) and FRACTIONAL coords atom x Y z Si1 O. 42056 0.05546 -0.31990 Si2 O. 31368 0.03090 -0.16358 Si3 0,27960 0.06249 O. 05346 Si4 O. 12395 O. 06233 0- 03674 Si5 O. 07678 O. 02804 -0.17597 Si6 0.19556 O .O5585 -0.31331 Si7 0.42542 -0.17148 -0.31930 Si8 O. 31225 -0.12653 -0.17388 Si9 0.27325 -0.17590 0.03597 Si10 0.11895 -0.17634 0.03436 Si11 0.07156 -0.12939 -0.17516 Si12 0.19079 -0.16528 -0.31408 Si13 0.42837 O. 44297 -0.33456 Si14 0.31237 0.47305 -0.18814 Si15 0.27704 O. 43889 O. 02940 Si16 0.12155 O. 43563 0.03380 Si17 0.07096 0.47315 -0.17844 Si18 0.18737 0.43778 -0.31743

Si19 0.42389 0.67204 -0.31417 Si20 0.31278 0. 63130 -0.16836 Si21 0.27312 O. 66892 O. 04608 Si22 0.11867 0.67007 0.03868 Si23 0.07268 O. 63082 -0.17757 Si24 0,19446 0.68070 -0.29789 " O t h e r F r o m " A t o m s D a t a N u m b e r o f known a t o m s t o check distances etc. FROM 4 8 Cther FROM A t o m s ( label up t o 4 chars, N o spaces) and FRACTIONAL coords

0 4 5 0 .1862 O - 5032 -0 .3863 0 4 6 0 .2074 0 . 6 3 2 6 -0 .3914 0 4 7 -0 .0039 O , 4576 -0.2104 048 - 0 - 0 0 1 3 0 . 6 4 8 1 -0 - 2 1 2 0 "To" Atoms Data Number o f known atoms t o calculate d i s t a n c e s e tc . TO 2 Gyrornagnetic r a t i o f o r TO Nucle i r a d / Tes la sec 251810000 TO Atoms (r;p t o 4 c h a r s , No s p a c e s ) and FRACTIONAL coords atom X Y z F1 0 .500000 0 . 1 1 3 1 6 3 - 0 - 0 0 2 3 7 9 F2 0 .500000 O . 386837 0 . 002379 Number of O t h e r atoms t o check d i s t a n c e s f o r ( n o t i n c l u d e d i n c a l c ) 4 l a b e l and f r a c t i o n a l coords (x , y, z ) f o r Other a toms Hl 0 .393530 0 .187819 -0 .001081 H l 1 0 .606470 0 .187819 -0 .001081 HZ 0 .393530 0 .312181 0 . 0 0 1 0 8 1 H22 0 .606470 0 , 3 1 2 1 8 1 0 . 0 0 1 0 8 1 Ring Centre ( x , y, z as F r a c t i o n a l c o o r d s )
0 . 5000 0 .2500 O . O000 Number of "From" Symmetry o p e r a t i o n s 4 Symmetry I n s t r u c s t o g e n e r a t e a l 1 FROM atoms i n u n i t ce11 Must be same number as above and i n c l u d e X Y Z a s FIRST Opera tor
d l d2 d3 e l e2 e3 f l f2 f 3 (3 h i 1 0 0 0 1 0 0 0 1 0 .0000 0 .0000 0 . 0 0 0 0 i O O 0 - 1 O O 0 - 1 0 .5000 0 .5000 0 . 5 0 0 0
-1 O O 0 - 1 O O 0 - 1 0 .0000 0 .0000 0 . 0 0 0 0 - 1 0 0 0 1 0 0 0 1 0 . 5 0 0 0 0 .5000 0 . 5 0 0 0 Number of "To" Symmetry o p e r a t i o n s 4 Symmetry I n s t r u c s t o g e n e r a t e a l 1 TO atoms i n u n i t ce11 Must be same number a s above and i n c l u d e X Y Z as FTRST Opera tor
d l d2 d3 e l e 2 e3 f l f2 f 3 g h i 1 0 0 0 1 0 0 0 1 0 . 0 0 0 0 0.0000 0 . 0 0 0 0 1 O 0 - 1 O O 0 - 1 0 .5000 0 .5000 0 . 5 0 0 0
-1 O O 0 - 1 O O 0 - 1 1 * 0000 1 .0000 1 . 0 0 0 0 - 1 0 0 0 1 0 0 0 1 0 .5000 0 .5000 0 . 5 0 0 0 Number of S i l i c o n s w i t h known T c p v a l u e s i n p u t 8 S i l i c o n Tep ( m s ) 2 1 9 .674 5 1 0 . 2 4 8 1 0 1 1 . 7 1 6 2 3 1 0 . 3 4 1 î 1 1 1 . 1 4 9 16 1 5 . 5 6 6 14 1 0 . 2 7 1 8 9 - 7 6 6 END

E.3 PSEUDO-CODE LISTING (Static Second Moments)
START PROGRAM
Get information from User about filenames and desired mode of operation get filenames for Input and Output files determine whether to do full calculation, single calculation, output distances or coordinates get lirnits and step sizes for translations and rotations get cut-off distance (distances longer than this were excluded from the calculations)
Read in the information from the Input file get ceIl constants (a, b, c a: ,@ y) get fractional coordinates for the 4 sets of atoms (Si, O. F and H) get symmetry operators wromagnetic ratios of 19si and ' 9 ~ for second moment calculations -*
coordinates of ring centroid for rotations read in TCP data for specific silicons calculate needed constants
Generats comptete unit ce11 of Si and O atoms apply symmetry operators to fractional coordinates ensurethey l i e w i t h i n O < x ~ 1.O<y1 l , O < z ~ I convert to orthogonal Cartesian coordinates
Prepare H and F atoms coordinates for rotations and translations shift fractional coordinates so ring centroid lies at (0.0.0) convert H and F coordinates to orthogonal Cartesian convert coordinates of ring centroid to orthogonal Cartesian store these coordinates
Open Output file and write header information describing output, Iimits selected etc.
- - - - - . . - .. - - - - . - - - - - - - - - - . - . - -
IF Output Coordinates selected THEN Pedorm Rotation and Translations
calculate rotation matnx for selected angles $,O, and y rotate Cartesian coordinates shifl ring atoms to proper location using ring centroid coordinates apply translations along x, y, and z axes in Cartesian system
IF Output Cartesian Coordinates selected THEN write coordinates to Output file Close Output file
IF Output Fractional Coordinates selected THEN convert rotatedftranslated Cartesian coordinates to fractional coordinates write coordinates to Output fifç Close Output file

-
IF Output Distances selected THEN Perform Rotation and Translations
calculate rotation matrix for selected angles @, 0. and rotate Cartesian coordinates shifi ring atoms to proper location using ring centroid coordinates apply translations along x, y, and z axes in Cartesian system
Generate 37 cornplete cetls of F atoms convert rotated / translated F Cartesian coordinates to fractional coordinates apply symrnetry operators to fractional coordinates keeping rings intact convert to orthogonal Cartesian coordinates generate the 26 surrounding unit cells of F atoms
Check and output Si-F and O-F distances detemine al1 Si-F and O-F distances IF distance is less than the selected cut-off THEN
wnte distance and Cartesian coordinates to Output file IF distance is less than 2.0 A THEN add "Too Close" flag
Generate 27 cornplete ceIls of H atoms convert rotated / translated H Cartesian coordinates to fractional coordinates apply symmetry operators to fractional coordinates keeping rings intact convert to orthogonal Cartesian coordinates generate the 26 surrounding unit cells of H atoms
Check and output Si-H and O-H distances determine al[ Si-H and O-H distances IF distance is less than the selected cut-off THEN
write distance and Cartesian coordinates to Output file IF distance is less than 2.0 A THEN add "Too Close" flag
Close Output file

IF Single Calculation selected THEN Perforrn Rotation and Translations
calculate rotation matrix for selected angles 4.8. and iv rotate Cartesian coordinates shift ring atoms to proper location using ring centroid coordinates apply translations along x, y. and z axes in Cartesian systern
Generate 27 complete unit ceils of H atoms convert rotatedtranslated Cartesian coordinates to Fractional coordinates apply symmetry operators to fractional coordinates keeping rings intact convert to orthogonal Cartesian coordinates generate the 26 surrounding unit cells of H atoms
Check Si-H and O-H Distances determine distances from every frarnework atom in unit ce11 to al1 H atorns IF any of these distances is less than 2.0 A THEN set "Too Close" flag
IF no H atoms are too close to framework atoms THEN Generate 27 complete unit cells of F atoms
convert rotatedltranslated Cartesian coordinates to fractional coordinates apply symrnetry operators to fractional coordinates keeping rings intact convert to orthogonal Cartesian coordinates generate the 26 surrounding unit cells of F atoms
Check Si-F and O-F Distances determine distances from every framework atom in unit ce11 to ail F atoms IF any of these distances is les- han 2.0 A THEN set "Too Close'' flag
IF no sorbate atoms (H or F) are Too Close to Si or O atoms THEN Calculate Second Moments for each of the unique silicons
determine al1 Si-F distances (r) IF r < cut-off THEN add 1 1 P to sum of 11 r6 multiply sum of 1 1 r6 by appropriate factor to obtain second moment in HZ'
Perforrn least squares fit of second Moment vs. 1 1 TCP data write results of regession (R~, slope, y-intercept) to Output file write list of second moments for al[ silicons to Output file
Close Output file

[F Full CalcuIation selected THEN
ROTATION LOOP Increment angles 4.8. and w between selected limits using appropriate steps
Pefi0t-m Rotation calculate rotation matrix for selected angles $, 0, and q~ rotate Cartesian coordinates shift ring atoms to proper location using ring centroid coordinates
TRANSLATION LOOP Increment translational shifi parameten between selected limits using appropriate steps
Perform Translation translate along x. y. and z axes in Cartesian system
Generate 27 complete unit cells of H atoms convert rotated/translated Cartesian coordinates to fractional coordinates apply symmetry operaton to fractional coordinates keeping rings intact convert to orthogonal Cartesian coordinates generate the 26 surrounding unit cells af H atoms
Check Si-H and O-H Distances determine distances from every framework atorn in unit cell to al1 H atoms IF any of these distances is less than 2.0 A ThEN set -'Tao Close" fi ag
IF no H atoms are too close to frarnework atoms THEN Generate 27 complete unit celIs of F atoms
convert rotatedtranslated Cartesian coordinates to fractional coordinates apply symmetry operaton to fractional coordinates keeping rings intact convert to orthogonal Cartesian coordinates generate the 26 surrounding unit cells of F atoms
Check Si-F and O-F Distances determine distances from every Si and O atom in unit ceIl to al1 F atoms
IF any of these distances is less than 2.0 A THEN set "Too Close" flag
IF no sorbate atoms (H or F) are Too Close to Si or O atoms THEN Calculate Second Moments for each of the unique silicons
determine al1 Si-F distances (r) IF r < cut-off THEN add 1 / r6 to sum of 1/ r6 rnultiply sum of I / r6 by appropriate factor to obtain second moment in HZ'
Perform least squares fit of second Moment vs. 1 / TCP data
Check and compare regression results check dope is positive IF good regression THEN

wnte results of regression (R', slope, y-intercept) to Output file write Iist of second moments for al1 silicons to Output file compare regression results with previous best IF better regression update "best fit" THEN
store location, orientation, and regression results
LOOP through ail possible TRANSLATIONS
LOOP through ail possibIe ROTATIONS
Output details of -'best" solution wnte results of best regression found (R', slope. y-intercept) to Output file list orientation and translations used to obtain this fit
Close Output file
END PROGRAM
******************************************************************************
=FERENCES FOR APPENDIX E
Turbo Pascal, Version 6.0, 199 1. Borland International, Inc. 4585 Scotts Valley Drive, Scotts Valley, CA 95066. U.S.A.
ATOMS 40. Shape Software, 52 1 Hidden Valley Road, Kingsport. TN 57663 U.S.A. http://~~vw.tricon.net/comm/shape/
ORTEP-3 for Windows, Johnson, C.K.; Burnett, M.N.; Farrugia, L.J. Department of Chem istry. University of Glascow, U.K. 1998. http://www.chem.gla.ac.uk/-louis/onep3/
PL4 TON-98. Speck, A.L.: Farrugia, L.J. Department of Chemistry. University of Glascow. U.K. 1998. http://www.chem.gla.ac.uk/-louis/platon97/
Diamond, R. in International Tubles for Crystallography, Volume B. p. 345, Shrnueli, U. (Ed.), Kluwer Academic Pu blishers, 1993.
van KoninsveId, H.: Jansen, K.; van Bekkum, H. Zeolites, 1990, 10.235.
Internotional Tablesfor CrystalIography, Volume A, Hahn, T. (Ed.), Kluwer Academic PubIishers, 1992.
Arfken, G. Mathematical Methods for Physicisrs, Th ird Edition, C hapter 4, Academic Press, 1985.

SUPPLEMENTARY DATA FOR CHAPTER 6
This appendix contains supplementary data from the low temperature NMR
investigations of purely silicieous ZSM-5 loaded with ca. 4 molecules ofp-difluorobenzene per
unit cell presented in Chapter 6.
Three tables are included:
Table F.1 Occupancies and connectivities within the asymrnetric unit of the monoclinic
(PZ,/n. I . 1) phase of ZSM-5.
Table F.2 Fractional coordinates forp-difluorobenzene atoms for the best location and
orientation found from analysis of the 'H- '~s~ CP data at 230 K.
Table F.3 Fractional coordinates for p-difluorobenzene atoms for the best location and
orientation found from analysis of the 1 9 ~ - 2 9 ~ i CP data at 235 K.

Table F.l T-sites, their occupancies and connectivities for the asymmetric unit in the monolinic (P?,/n. 1. I ) phase of ZSM-5. Each T-site is connected to the four sites t isted.
Occupancy Connectivity I
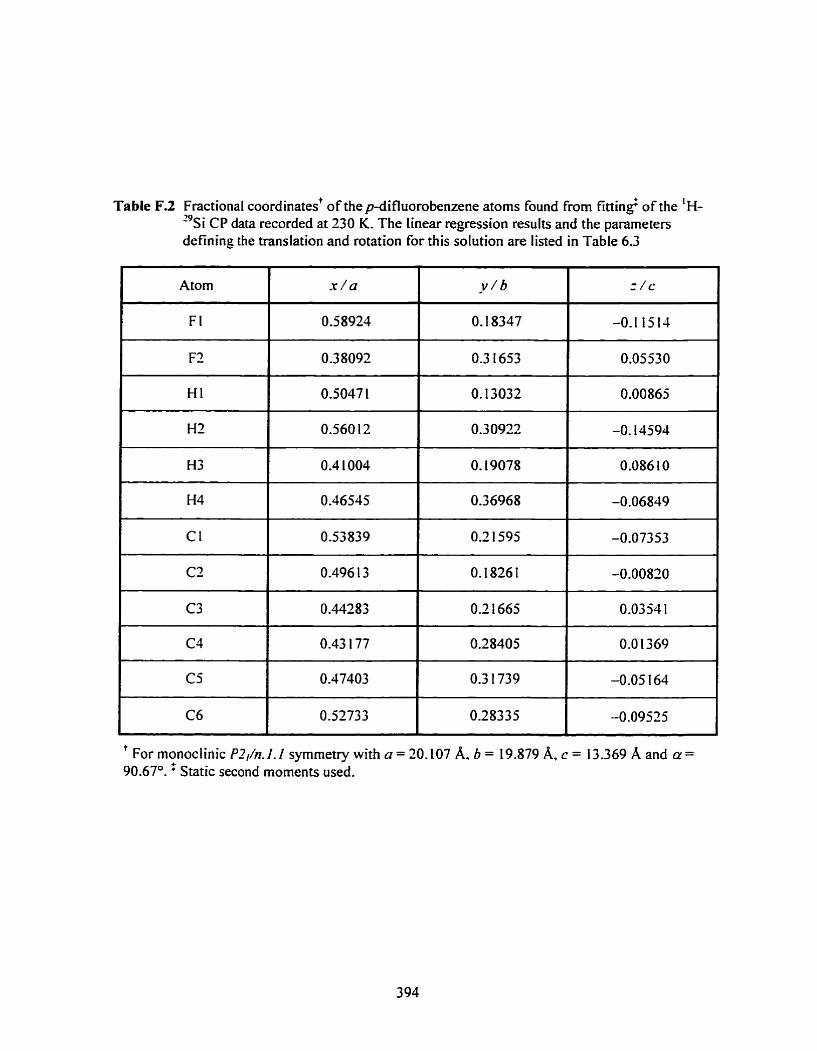
Table F.2 Fractional coordinates' of thep-difluorobenzene atoms found from finin2 of the 'H- ' 9 ~ i CP data recorded at 230 K. The linear regression results and the parameters defining the translation and rotation for this solution are Iisted in Table 6.3
t For monoclinic PZ,/n. I. I symmetry with a = 20.107 A. b = 19.879 A, c = 13.369 A and a = 90.67'. = Static second moments used.

Table F.3 Fractional coordinatest of the p-difluorobenzene atoms found from finin2 of the 1 9 ~ -
"si CP data recorded at 235 K. The linear regression results and the parameten defining the translation and rotation for this solution are Iisted in Table 6.3
I Atorn
i For rnonoclinic PZ,/n.i.i symmetry with a = 20.107 A. b = 19.879 A, c = 13.369 A and a= 90.67". = Static second moments used.

SUPPLEMENTARY DATA FOR THE PARA-XYLENE / ZSM-5
SINGLE CRYSTAL STRUCTURE
This appendia contains supplementary data from the X-ray diffraction refinement of a
single crystal of ZSM-5 loaded with 2.85 molecules ofp-xylene per unit ceIl. Full details of the
structure refinement are presented in Chapter 8.
Three tables are included:
Table G.1 Anisotropic displacement factors for Si. O and C.
Table G.2 Bond Iengths in the ZSM-5 fmmework.
Table G.3 Bond angles in the ZSM-5 framework.

Table C. 1 Anisotropic displacement parameten (AL x 10)) for the low-loaded pxylene / ZSM-5 cornplex at 180 K. The anisotropic displacement factor exponent takes the form: 22 [hL a*' U, , + ... + 2 h k u* b* Up].

Table G.2 Bond lengths for h e w o r k atoms in ZSM-5 loaded with 2.85 molecules ofpxylene per unit
Atom I -Atom2 Distance 1 A

n
V 5 oci 0
n h h n nn n n - n n n n O n O n O - n o O n n 0 0
= 0 0 * Q I m 0 0 - m - m - m m - m m - - V V w V V V V W V u u V w V w w V ~ V ~ I O F O ~ ~ ~ U ~ ~ N W - P I ~ ~ O - ~ ~ ~ o b \ o r ? b \ o qm-q~q'qqqoqcrto
~ o c i & c i 6 6 ~ ~ ~ m b o b c b Q I o O I m ~ d
I o o o o o o o ~ o o = o o o z o o I

l MAGE NALUATION TEST TARGET (QA-3)
APPLJED 4 IMAGE. lnc 1653 East Main Street
O 1993. Appi i i Image. Inc. Ail Righh Reserved