North Belut Dualstream II Advanced Wet Gas Meter – Flow Testing at CEESI
16
7 th South East Asia Hydrocarbon Flow Measurement Workshop 5 th – 7 th March 2008 1 North Belut Dualstream II Advanced Wet Gas Meter – Flow Testing at CEESI Warih Kundono and Malcolm Brown, COP Indonesia Gordon Stobie, COP Company Mark Tudge, Alan Downing and Alistair Collins, Solartron ISA Richard Steven and Thomas Kegel, CEESI ABSTRACT An 8” Solartron ISA Dualstream II Advanced wet gas meter for North Belut, Indonesia has been dry gas tested in natural gas (at Bishop Auckland, UK) and wet gas flow tested at CEESI with air and kerosene/water mixes. This paper discusses the selection and proposed use of this meter, the validity of testing wet natural gas meters with air flows and describes the new CEESI wet gas facility for testing large diameter, high flow rate wet gas meters. The CEESI facilities commissioning runs with a 4” orifice plate meter are described and the results compared to existing CEESI and NEL wet gas orifice meter data. With a validated test system the Dualstream II wet gas meter data will be analysed The operational principles of the meter will be reviewed and the performance of the meter with the wet gas flow with water cuts will be discussed. 1 INTRODUCTION ConocoPhillips Indonesia (COPI) is currently developing the North Belut Field, located in the Block B sector of the Natuna Sea. The field is located approximately 60 km East North-East of the Belanak FPSO. The North Belut development comprises a remote wellhead platform (WHP-C), a central processing and production platform (NBCPP) and a wellhead platform (WHP-D) that is bridge linked to the CPP. A 10km 22” multiphase flow line connects WHP-C to the NBCPP. The total gas export rate from the NBCPP is 315 MMscfd which includes contribution from the West and South Belut fields (still to be developed). The maximum design condensate rate is 21,350 bbls/d, although the North Belut contribution is likely to be between 8,000 to 10,000 bbls/d from the separator and a further 7,000 bbls/d may be produced from the dew point control plant. North Belut will export gas and liquids via Kerisi to the Belanak FPSO. Gas from the North Belut field is dedicated to an existing Gas Sales Agreement to Malaysia. COPI is progressing the development of the North Belut field with a target first production date of Q4 2008. The field layout for North Belut and its surrounding fields is shown in the schematic contained in Figure 1. The NBCPP is primarily a gas processing facility, with well stream products from its two wellhead platforms. The gas/oil (condensate) ratio is approximately 68 bbls/MMscf. Each wellhead platform has 20 slots, with 10 allocated as a single well conductor and 10 as twin well conductors, giving a maximum of 30 wells per platform. The intent of this paper is to present the flow testing of the Wet Gas Meters selected for use as well test meters on the North Belut wellhead facilities. These are a direct replacement for a conventional test separator arrangement. In order to operate any hydrocarbon field and manage the production efficiently it is imperative that the Operations and Reservoir Engineers are provided with data on the overall flow rates and multiphase fractions of oil, gas and water flowing from each well. This data is required for Reservoir Management programmes, optimization of the hydrocarbon recovery from the reservoir, and for estimation of the reserves in place.
-
Upload
independent -
Category
Documents
-
view
4 -
download
0
Transcript of North Belut Dualstream II Advanced Wet Gas Meter – Flow Testing at CEESI

7th South East Asia Hydrocarbon Flow Measurement Workshop 5th – 7th March 2008
1
North Belut Dualstream II Advanced Wet Gas Meter – Flow Testing at CEESI
Warih Kundono and Malcolm Brown, COP Indonesia
Gordon Stobie, COP Company Mark Tudge, Alan Downing and Alistair Collins, Solartron ISA
Richard Steven and Thomas Kegel, CEESI
ABSTRACT An 8” Solartron ISA Dualstream II Advanced wet gas meter for North Belut, Indonesia has been dry gas tested in natural gas (at Bishop Auckland, UK) and wet gas flow tested at CEESI with air and kerosene/water mixes. This paper discusses the selection and proposed use of this meter, the validity of testing wet natural gas meters with air flows and describes the new CEESI wet gas facility for testing large diameter, high flow rate wet gas meters. The CEESI facilities commissioning runs with a 4” orifice plate meter are described and the results compared to existing CEESI and NEL wet gas orifice meter data. With a validated test system the Dualstream II wet gas meter data will be analysed The operational principles of the meter will be reviewed and the performance of the meter with the wet gas flow with water cuts will be discussed. 1 INTRODUCTION ConocoPhillips Indonesia (COPI) is currently developing the North Belut Field, located in the Block B sector of the Natuna Sea. The field is located approximately 60 km East North-East of the Belanak FPSO. The North Belut development comprises a remote wellhead platform (WHP-C), a central processing and production platform (NBCPP) and a wellhead platform (WHP-D) that is bridge linked to the CPP. A 10km 22” multiphase flow line connects WHP-C to the NBCPP. The total gas export rate from the NBCPP is 315 MMscfd which includes contribution from the West and South Belut fields (still to be developed). The maximum design condensate rate is 21,350 bbls/d, although the North Belut contribution is likely to be between 8,000 to 10,000 bbls/d from the separator and a further 7,000 bbls/d may be produced from the dew point control plant. North Belut will export gas and liquids via Kerisi to the Belanak FPSO. Gas from the North Belut field is dedicated to an existing Gas Sales Agreement to Malaysia. COPI is progressing the development of the North Belut field with a target first production date of Q4 2008. The field layout for North Belut and its surrounding fields is shown in the schematic contained in Figure 1. The NBCPP is primarily a gas processing facility, with well stream products from its two wellhead platforms. The gas/oil (condensate) ratio is approximately 68 bbls/MMscf. Each wellhead platform has 20 slots, with 10 allocated as a single well conductor and 10 as twin well conductors, giving a maximum of 30 wells per platform. The intent of this paper is to present the flow testing of the Wet Gas Meters selected for use as well test meters on the North Belut wellhead facilities. These are a direct replacement for a conventional test separator arrangement. In order to operate any hydrocarbon field and manage the production efficiently it is imperative that the Operations and Reservoir Engineers are provided with data on the overall flow rates and multiphase fractions of oil, gas and water flowing from each well. This data is required for Reservoir Management programmes, optimization of the hydrocarbon recovery from the reservoir, and for estimation of the reserves in place.

7th South East Asia Hydrocarbon Flow Measurement Workshop 5th – 7th March 2008
2
Historically, individual well rate measurement has been accomplished using a Test Separator. The separator/instrument assembly can be considered as a large-scale multiphase meter. However, a test separator is both large and heavy, with flow meters for each phase, and requires considerable utility and process connections which are space consuming and costly.
Figure 1 – South Natuna Sea development including Belut fields
Well testing has not proved to be consistently accurate over the years, and ‘well allocation’ balance factors of 0.5 to 1.5 are not uncommon in real field applications. In addition the logistics of putting a well on test and then recording data doesn’t generally result in frequent, regular or repeatable results when a large number of wells are involved. With this in mind the use of MPM’s in the North Belut development was already of interest to ConocoPhillips (COP) Operations and Reservoir Engineers.
There are many different types of multiphase flow, however North Belut is expected to flow wet gas (high GVF’s >98%) and this was expected to be a difficult measurement application for both Separator and Multiphase Meter designs.
For the North Belut field it is envisaged that well testing will be carried out every 30 days over a 24 hour period for each well. With a test separator it was considered that this would be a time consuming affair, with the need to fill and stabilize taking several hours in addition to the well test. Using a multiphase meter (MPM) will reduce these delays and it has been shown in several other COP assets using MPM’s that well tests can be accomplished in shorter durations as there is significantly less mass and no volume needed to establish stable conditions. In operation MPMs have been observed to react quickly to changes in well flow rate without the lag seen in test separation systems. It has also been demonstrated within COP assets that the use of shorter MPM based well tests at a higher frequency allows more well test data to be made available, which over time gives more consistent results. This leads to the view that consistent and more frequent test data is more useful than longer less frequent well tests.

7th South East Asia Hydrocarbon Flow Measurement Workshop 5th – 7th March 2008
3
The reservoir structure for North Belut is complex, with many different zones and fluid types, which mean that well testing frequency will need to be higher than normal. This merely strengthened the argument for a reliable, practical and cost effective method of well test metering. It had been proposed that multiphase meters be utilized for North Belut’s well test flow measurement in place of the traditional test separator, however under a critical review which considered the technologies available, the levels of expertise available, the extreme process systems and the remote offshore location, a more simple proven dual differential pressure wet gas metering system was selected as having the most robust cost benefits. In the light of this the proven Solartron ISA Dualstream II Advanced Wet Gas Meter was selected for use in the North Belut development. 2 SOLARTRON ISA DUALSTREAM II ADVANCED WET GAS METER “Effective well, or reservoir, management depends on good well flow data being acquired in a timely manner at a reasonable cost.” [1] Wet gas metering has often relied on the rudimentary approach of utilizing a differential producing meter and wet gas correction algorithms (such as those developed by Chisholm [2] and De Leeuw [3]) to make allowances for small amounts of liquid in the gas. However, these methods require an accurate measurement of the liquid fraction to provide low uncertainty in the gas flow rate measurements. Generally, this would necessitate frequent sampling of the fluid using a separator or tracer injection. However these processes cannot be considered to be on-line methods and the tracer method is impractical for use sub-sea. It was this requirement for a low cost wet gas meter that did not require knowledge of the liquid fraction that motivated the development of a dual differential pressure (�p) device from an initial concept by BG International (now Advantica International) into a commercial product with Solartron ISA. The resultant flow meter, the Dualstream II, has been widely tested and subsequently has been used on projects around the world in nominal sizes from 2” to 14”. [4,5] The Dualstream II system (Figure 2) combines a standard venturi flow meter with a proprietary upstream mixer and a second differential pressure flow meter. Effectively there are two �p meters in series, each with different overreading characteristics when metering wet gas flows. The principal behind the measurement is that the two devices will exhibit different overreading to the same flowrate and conditions (Figure 3), thereby allowing the liquid and gas flowrates to be determined. The measurement relies on there being sufficient difference in the responses of the two meters to allow accurate discrimination of the liquid. Algorithms based on Murdock-type corrections are used to estimate the gas mass fraction.
Figure 2: Solartron ISA Dualstream II Advanced Wet Gas Flowmeter

7th South East Asia Hydrocarbon Flow Measurement Workshop 5th – 7th March 2008
4
Figure 3: Example of over-reading of Venturi and 2nd �p device in wet gas flows.
The calculated gas mass flowrates for the two �p meters take the same general form:
gtd
g pAC
m ����
�� 2
1 4 (1)
Under dry gas conditions the two meters nominally read the same, but as the liquid content increases the indicated gas flowrates diverge (due to their different overreading characteristics). A different Murdock-type correction (to convert from indicated to true gas flow rate) applies to each. The correction used here takes the form:
XMc
mm tpg
actualg ���
1)(
)( (2)
where mg(actual) represents the corrected (or actual) mass gas flowrate and mg(tp) the indicated (i.e. two-phase) flowrate. M and c are Murdock-type coefficients, which differ for the two meters. In terms of the differences between the indicated gas mass flows and Murdock coefficients for the two meters:
)(11)(
1)(1)( 1
tpgtpg
tpgtpgmMMm
cmcmX
���
����� (3)
The true gas mass flow is found by substituting X into the expression for mg, and the liquid mass flow from the expression for the Lockhart-Martinelli parameter (X):
gl
gl mXm��
� (4)
0.0
0.2
0.4
0.6
0.8
1.0
0.00 0.05 0.10 0.15 0.20 0.25 0.30 0.35 0.40
Lockhart-Martinelli, X (-)
Frac
tion
over
read
in �
p
Venturi
2nd DP device

7th South East Asia Hydrocarbon Flow Measurement Workshop 5th – 7th March 2008
5
This basic “Dual-�p” version of the meter does however suffer from poor liquid detection capabilities at low liquid fractions, and the manufacturers offer no specification on the liquid measurement uncertainty at Lockhart-Martinelli values below about 0.05. To alleviate this problem, the vendor now includes an additional (i.e. third) pressure tapping downstream of the Venturi section of the Dualstream II meter. This additional tapping (Figure 4) provides a measurement of the overall pressure drop (or pressure recovery) across the Venturi. [3,6,7].
Figure 4: Additional pressure tapping on Dualstream II Venturi.
Figure 5 shows an example of the effect of the liquid fraction (Lockhart-Martinelli parameter, LM) and the gas velocity on the pressure loss ratio (PLR) i.e. the ratio between the overall �P and the throat �P, for a Dualstream II meter. It can be seen that the PLR is significantly affected by the quantity of liquid present in the gas, with the PLR increasing with increasing liquid fraction. The rate of increase is most significant at lower liquid fractions, in this case up to LM ~ 0.1. At higher liquid fractions, the PLR data tends to flatten and becomes insensitive to changes in the liquid fraction. �
Figure 5: Example of pressure loss ratio (�p1/�p2) for Dualstream Advanced In practice, both measurement methods can be used with the Dualstream II: the PLR method for low liquid contents (high GVF) and the Dual-�p approach for high liquid fractions (low GVF).
�p1
�p2
�p1
�p2

7th South East Asia Hydrocarbon Flow Measurement Workshop 5th – 7th March 2008
6
Measurement Uncertainty: Historically, the performance of the Dual-�p version of the meter is shown in Table 1:
Gas flow rate (relative):
Liquid flow rate (relative):
± 5 % ± 10 % ± 20 % No reading
for for for for
X = 0.25 to 0.00 X = 0.25 to 0.10 X = 0.10 to 0.05 X < 0.05
Table 1: Dualstream II Original Performance Specifications (90% confidence) These claimed uncertainties compare favourably with independent test experience, provided that the meter is used within its nominal operating envelope and at working pressures similar to those under which the underlying correlations were derived. In the case of a 6” test meter, the above uncertainty values have been independently verified for an operating envelope corresponding to superficial gas velocities (SGVs) above 4 m/s, differential pressures within a turndown range of 10:1 (for either �p device), Lockhart-Martinelli values between 0.05 and 0.25, and line pressures of both 45 and 60 bar. (At lower line pressures the liquid flow response tended to fall outside specification although the gas flow measurement remained reasonable.) Within the tolerance band of ± 5% quoted for gas mass flow, there was also evidence of a systematic behaviour of the mass flow error with both SGV and X. In principle, this could be calibrated out to a large degree, since the reproducibility of the gas flow measurement was found to be extremely good - better than 0.15% at 60 bar, and still below 0.5% at 30 bar. By calibrating the meter as a function of SGV, as well as gas density, this has allowed the meter specification to be improved. A similar argument applies to the liquid mass flow data, which had a reproducibility of better than 2% at 60 bar, although only around 10% at 30 bar. With the inclusion of a 3rd tapping on the Venturi to measure the recovered pressure, the meter is able to detect lower quantities of liquid than given in the above specification, although to enable this approach each meter must generally be characterised against a suitable reference device (i.e. test facility or high quality test separator). With the flowmeter instrumented in this way, the performance claimed by the manufacturer for a Dualstream II Advanced Wet Gas Meter is shown in Table 2 below.
Gas flow rate (relative):
Liquid flow rate (relative):
± 3 % ± 10 – 20 %
for for
GVF: 80 – 100% GVF: 80 – 100% (In fact X > 0.01)
Table 2: Dualstream II Advanced Performance Specification (90% confidence) A reproducibility of better than 0.15% on gas mass flow rate and better than 1% on liquid mass flow rate is claimed. However, there is presently little independent data to verify the above performance (i.e. of the Dualstream II Advanced [with PLR measurement]) at present. The manufacturers of multiphase and wet gas systems have traditionally stated uncertainties at the 90% confidence level. This practice is retained in the current paper in the interest of consistency among manufacturers. The present text not withstanding, it is strongly recommend that the 95% confidence level be adopted industry wide per the requirements of API RP 86. This would provide consistency with calibration facilities that universally state uncertainty at a 95% confidence level. Mathematical conversion between different confidence levels is quite simple: U95 = 1.2U90
7th South East Asia Hydrocarbon Flow Measurement Workshop 5th – 7th March 2008
7
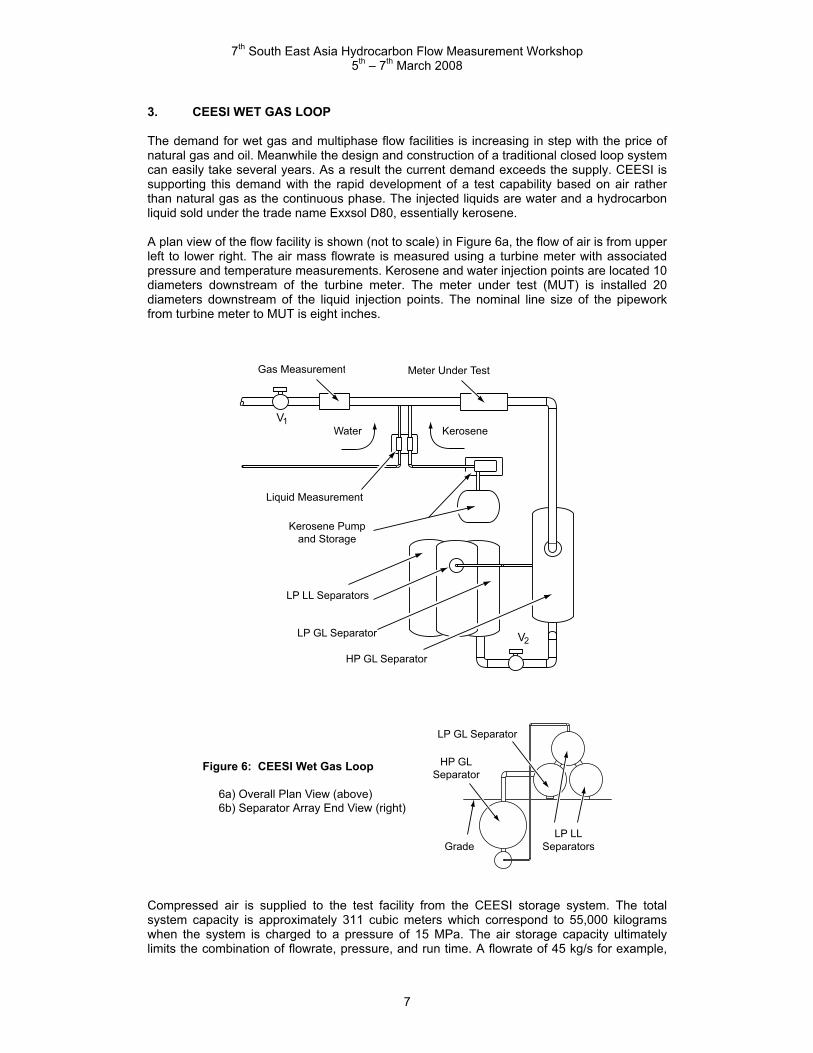
3. CEESI WET GAS LOOP The demand for wet gas and multiphase flow facilities is increasing in step with the price of natural gas and oil. Meanwhile the design and construction of a traditional closed loop system can easily take several years. As a result the current demand exceeds the supply. CEESI is supporting this demand with the rapid development of a test capability based on air rather than natural gas as the continuous phase. The injected liquids are water and a hydrocarbon liquid sold under the trade name Exxsol D80, essentially kerosene. A plan view of the flow facility is shown (not to scale) in Figure 6a, the flow of air is from upper left to lower right. The air mass flowrate is measured using a turbine meter with associated pressure and temperature measurements. Kerosene and water injection points are located 10 diameters downstream of the turbine meter. The meter under test (MUT) is installed 20 diameters downstream of the liquid injection points. The nominal line size of the pipework from turbine meter to MUT is eight inches.
Compressed air is supplied to the test facility from the CEESI storage system. The total system capacity is approximately 311 cubic meters which correspond to 55,000 kilograms when the system is charged to a pressure of 15 MPa. The air storage capacity ultimately limits the combination of flowrate, pressure, and run time. A flowrate of 45 kg/s for example,
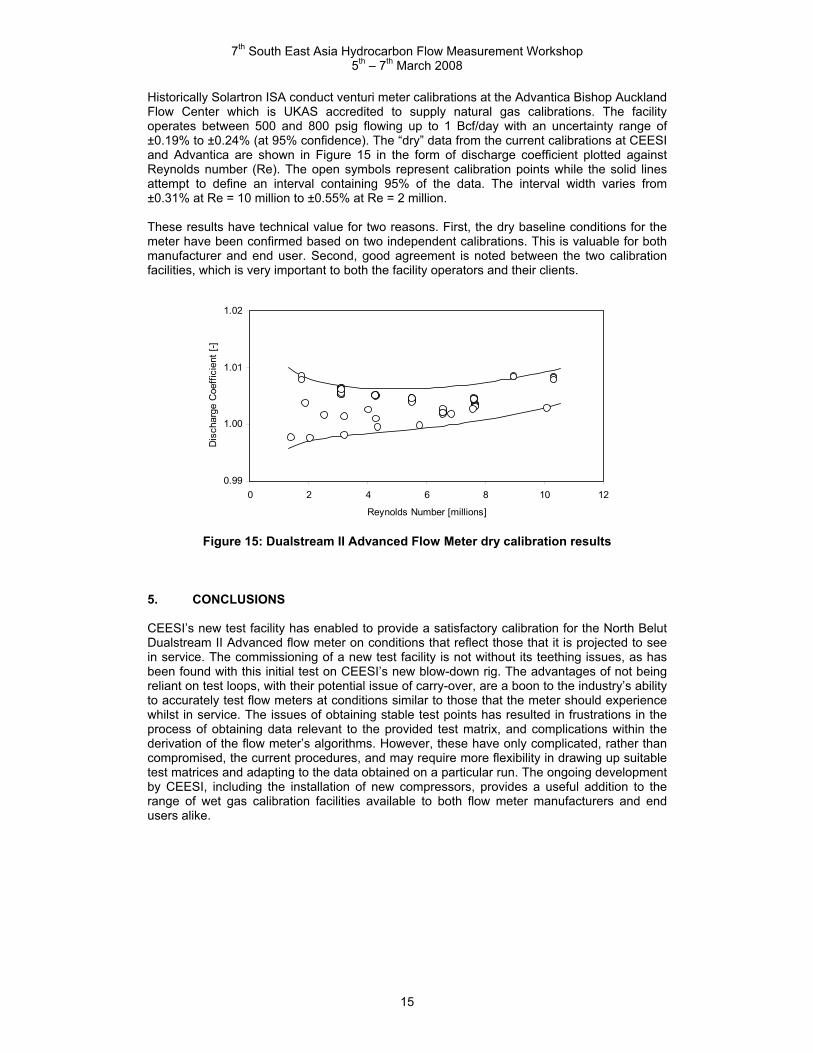
HP GLSeparator
LP LLSeparators
LP GL Separator
Grade
Figure 6: CEESI Wet Gas Loop
6a) Overall Plan View (above) 6b) Separator Array End View (right)
HP GL Separator
LP LL Separators
Liquid Measurement
LP GL Separator
Gas Measurement
Kerosene Pumpand Storage
Meter Under Test
V1
V2
Water Kerosene
7th South East Asia Hydrocarbon Flow Measurement Workshop 5th – 7th March 2008
8
will exhaust half of the available air in approximately ten minutes. The storage pressure will also decrease to approximately half the initial value. The wet gas flow exiting the MUT enters the high pressure gas-liquid separator (HPGLS) which is located below the test section to facilitate the liquids draining under the influence of gravity. The HPGLS design, seen in Figure 6b, consists of two pressure vessels. A larger upper vessel contains the internal structure that provides surfaces for liquid collection. A smaller lower vessel collects the liquids. Facility pressure and flow control are achieved with valves V1 and V2, the position of V2 represents a trade-off. Moving V2 upstream of the separator would reduce system response time and facilitate faster reaction to valve position. Unfortunately the ability to control the system is reduced as a result of wet gas and the occasional liquid slug passing through valve V2. Experience has shown that the reduction in controllability resulting from the separator volume is considerable less than that resulting from wet gas flowing through the valve. The flowing air exits the HPGL separator, flows through control valve V2 and enters the low pressure gas-liquid separator (LPGLS). This separator, a thin walled vessel, is designed to add swirl to the flow and remove traces of residual liquid in the air. The kerosene-water mixture collects in the bottom of the HPGLS as a test proceeds. The flowing pressure required for a particular test is generally sufficient to drive the liquid into the upper low pressure liquid-liquid separator (LPLLS). This liquid transfer is controlled based on a differential pressure measurement used to indicate HPGLS liquid level. Care must be taken in adjusting the liquid flowrate to prevent gas breakout in the long vertical line. In addition to inhibiting liquid flow, gas breakout will increase the difficulty in controlling the pressure and flowrate. The flowrate of injected water is measured using a one inch coriolis meter. Water is stored in a pressure vessel, air under pressure provides the motive force to inject the water into the test section. Approximately 12,000 kg of water are available for a single test batch. The valves required to control water flowrate are omitted from Figure 6 in the interest of clarity. The flowrate and density of injected kerosene are also measured using a one inch coriolis meter. The kerosene was injected using a three cylinder positive displacement pump. Valves and bypass lines required to control kerosene flowrate are omitted from Figure 6 in the interest of clarity. Approximately 2,500 kg of kerosene were available for a single test batch. The expanding air is subject to Joule-Thomson cooling, a heat exchanger located upstream of the turbine meter (not shown in Figure 6) allows for control of the flowing air temperature to within� �2 C. The water and kerosene tanks are subject to variations in ambient temperature, more so with the kerosene. The air temperature control set point was maintained to match the average of the liquid temperature values. During the test program the air temperature was always with 6 C of both liquid temperatures. The offline data processing included calculating liquid densities based on the flowing air temperature. The uncertainty associated with the mass flowrate of air is �0.5% at a 95% level of confidence. Dry (single phase) air calibrations in the facility are part of the CEESI (NVLAP) accreditation scope. The manufacturer’s uncertainty specifications are used for the coriolis meters. Those values, assumed to be stated at 95% confidence, are �0.1% for mass flowrate and �0.5 kg/m3 for density.

7th South East Asia Hydrocarbon Flow Measurement Workshop 5th – 7th March 2008
9
Comparing “Wet Air” and “Wet Gas” Results: It has long been assumed that a wet gas meters performance is insensitive to the type of gas flowing whereas it is sensitive to the type of liquid flowing. The theoretical concept behind this belief was that for wet gas flows the gas phase’s gas dynamic pressure supplied the driving force for the liquid phases flow. Hence, two wet gas flows with different gas properties but the same liquid properties should behave in the same way if the gas dynamic pressure and therefore the driving mechanism was constant. However, if two wet gas flows had the same gas dynamic pressure but different liquid properties the flow would react in two different ways. The liquids density, viscosity and interfacial tension dictates the flow pattern (i.e. how the liquid is dispersed in a pipe flow) for a given gas dynamic pressure and hence how a wet gas flow meter will respond to the flow. This was shown to be the case by Reader-Harris et al [5]. Fluid combinations of nitrogen/kerosene, argon/kerosene and nitrogen/water were flowed through Venturi meters. For set combinations of fluids the gas to liquid density ratio and gas densiometric Froude number were held constant across increasing steps of Lockhart-Martinelli parameter. Figure 7 shows a typical result for a ISO 5167 Part 4 compliant, 4” schedule 80, 0.75 beta ratio Venturi meter. The constant gas to liquid density ratio was 0.046 and the constant gas densiometric Froude number was 2.5. Note that for different liquid properties this means different gas dynamic pressures. In fact here, the water based wet gas flow has a higher gas dynamic pressure than the kerosene based wet gas flow. However, for constant liquid properties, a constant gas to liquid density ratio and gas densiometric Froude number means a constant gas dynamic pressure.
Figure 7: A 4”, 0.75 beta ratio Venturi meter with a gas to liquid density ratio of 0.046 and a gas densiometric Froude number of 2.5. It can be seen from Figure 7 that at these conditions the water based wet gas flows over-reading lags that of the kerosene based wet gas flows over-reading (even though it is being driven by a higher gas dynamic pressure). However, the nitrogen and argon flows with kerosene have no significant difference in over-reading size. This was proof that the gas properties do not matter as long as the gas dynamic pressure is matched. This result opened the way for wet gas meters to be tested with wet gas flow facilities that used different gas properties to that which the meter would experience in the field. CEESI has therefore developed the air blow down facility into a wet gas test facility by adding Exxsol D80 and water injection capabilities to the air flow. It was seen necessary to commission the system and compare the results from a meter tested in this system with air and Exxsol D80 against results from meters tested with natural gas and hydrocarbon liquids. The largest wet gas data set publicly available is that of the 4” orifice plate meter. In this data set there is in excess of 1,000 test points from three different test facilities, two operating

7th South East Asia Hydrocarbon Flow Measurement Workshop 5th – 7th March 2008
10
natural gas with various hydrocarbon liquids and one operating with nitrogen and kerosene. Steven et al [6] have produced a 4” orifice plate meter wet gas correlation for this data set that, for a known liquid flow rate, will correct the liquid induced error on the gas flow rate prediction to ±2% at 95% confidence. The correlation is shown as Equation 5:
2
,
1 LMLM
apparentgg
XCX
mm
��� (5)
where
n
g
ngC �
��
����
�
��
����
����
�
�
�� �
� (6)
For Frg � 1.5 n = 0.214 (7) and for Frg > 1.5
23.0
21
��
���
��
���
���
�
�
���
�
����
�
����
��
gFrn (8)
The solution to this data set is by iteration if the gas mass flow rate. Commissioning of the new CEESI wet gas test facility was therefore carried out by testing a 4”, orifice plate meter and comparing its results to this orifice plate meter correlation. The test matrix was:
Air / Exxsol D80 4”, Schedule 40, 0.5836 Beta Ratio, Flange Tapped Orifice Plate Meter
17.2 < Pressure (bara) < 49.3 20.8 < Density (kg/m3) < 58.8
10,645 Pa (42.8 “WC) < Differential Pressure < 180,000 Pa (724.1 “WC) XLM < 0.22
0.0264 < Gas to Liquid Density Ratio < 0.0743 1.03 < Gas Densiometric Froude Number < 4.1
The results are shown in Figure 8. The uncorrected data is shown as solid points. The data corrected by the new Steven et al orifice plate meter wet gas equation for a known liquid flow rate are shown as the hollow points. The equation has corrected all 19 non-dry points to within 2% of the test facilities dry gas flow reference meter. This therefore indicates that the new CEESI air blow down wet gas facility gives the same meter results as all other wet gas flow test facilities.

7th South East Asia Hydrocarbon Flow Measurement Workshop 5th – 7th March 2008
11
Figure 8: Wet gas flow data results from CEESI air blow down wet gas test facility
4. SOLARTRON METER TEST RESULTS The wet gas calibration of the North Belut flow meter was performed at flow conditions based upon those the 8” Dualstream II Advanced flow meter is likely to see in service. Therefore the test matrix is based on three nominal pressures (12 bara, 21 bara, 29 bara) which are equivalent to nominal gas densities of 15 kg/m3, 25 kg/m3 and 35 kg/m3 respectively, and four gas volume flow rates equivalent to superficial gas velocities of between 9 m/s and 31 m/s. The actual data from the tests at CEESI can be seen in Figures 9 and 10.
Figure 9: The actual test matrix data shown in terms of volume flow rates.
0
500
1000
1500
2000
2500
3000
0 20 40 60 80 100 120 140 160Test Point
Gas
Flo
w (a
m3/
h)
0
5
10
15
20
25
30
Liqu
id F
low
(am
3/h)
Gas Flow Condensate Flow Water Flow

7th South East Asia Hydrocarbon Flow Measurement Workshop 5th – 7th March 2008
12
Figure 10: The actual test matrix data shown in terms of gas density and gas mass fraction.
The test facility design mandates limited supplies of air, water and kerosene available for a test run. Planning a test involves selecting the optimum order of test points to efficiently work with the resource limitations. The air supply was particularly stressed; plans to add compression were delayed, and a rental unit was eventually obtained. The limited air supply resulted in a trade-off between consumption and stabilization time between test points. With client approval, CEESI therefore did not attempt to exactly match conditions between data points obtained on different days, electing instead to obtain more data points per day of testing. The test matrix was constructed such that, as far as possible, only one parameter was varied at a time. It was intended that this be accomplished by holding pressure and gas flow rate constant whilst a batch of test points was performed, varying only the liquid flow rates. As described above, efficient facility operation resulted in test parameter changes between data points, which did complicate derivation of the calibration parameters. In the graphs this results in the appearance of a lack of stability in nominally constant parameters. This was especially noticeable at the higher flow rates where the quantities of compressed air being used meant that it was not viable to spend time fine tuning the flow rate to that specified in the test matrix. These issues complicated, but did not compromise the derivation of the algorithms for the Dualstream II Advanced flow meter. As can be seen in Figures 11 and 12 (representative of the data set provided from CEESI) the data is fitted to curves for the venturi and wedge meter over-reads, and Pressure-Loss curves dependent upon the water and condensate values can also be derived (not shown for reasons of Intellectual Property). In these graphs the abscissa is the ratio of liquid to gas mass flowrates. The ordinate represents the meter reading expressed relative to the actual facility dry air flowrate. A value of “0.2”, for example, means that the meter indicates 20% more flowrate than the actual dry air flowrate. The scatter observed is greatest at the lower gas flow rates and gas densities. This is therefore reflected in the meter uncertainties observed for different flow conditions. Figures 13 and 14 show errors obtained when the meter is used in combined dual �p and pressure loss modes. The mode of operation is selected based on the ratio of the indicated gas mass flow rates from the venturi and wedge meters. In these graphs the abscissa is the ratio of gas to total mass flowrate.
0
10
20
30
40
0 20 40 60 80 100 120 140 160Test Point
Gas
den
sity
(kg/
m3)
0.6
0.7
0.8
0.9
1.0
Gas
Mas
s Fr
actio
n
Gas Density Gas Mass Fraction

7th South East Asia Hydrocarbon Flow Measurement Workshop 5th – 7th March 2008
13
From these graphs it is clear that the meter generally performs well within uncertainties of 5% on gas and 20% on liquid, with the exception of some outliers in the extremities of the test matrix. For data at the flow conditions the meter is expected to see, the error on the gas measurement is less than ±3.1%, and the respective error in the liquid measurement is ±12.7% (for a 90% confidence level).
Figure 11: Venturi and wedge meter over-reads at one nominal gas density
Figure 12: Pressure loss curves at one nominal gas density.
0.0
0.2
0.4
0.6
0.8
1.0
0.0 0.1 0.2 0.3 0.4 0.5 0.6
Ql/Qg
DPt
/DPv
2500am3/h 1500am3/h 1150am3/h 800am3/h
0
0.1
0.2
0.3
0.4
0.5
0.0 0.1 0.2 0.3 0.4 0.5 0.6
Ql/Qg
Ove
r-re
ad
Venturi 2500am3/h Wedge 2500am3/h Venturi 1500am3/h Wedge 1500am3/h Venturi 1150am3/h Wedge 1150am3/h
Venturi 800am3/h Wedge 800am3/h

7th South East Asia Hydrocarbon Flow Measurement Workshop 5th – 7th March 2008
14
-10
-5
0
5
10
0.6 0.7 0.8 0.9 1.0GMF
% E
rror
on
Qg
12bar 1500am3/h 12bar 2500am3/h 21bar 1150am3/h 21bar 1500am3/h 21bar 2500am3/h29bar 1150am3/h 29bar 1500am3/h 29bar 2500am3/h 90% Confidence
Figure 13: Measurement of gas mass flow rate by combined Dualstream II Advanced
flow meter.
-40
-20
0
20
40
0.6 0.7 0.8 0.9 1.0
GMF
% E
rror
on
Ql
12bar 1500am3/h 12bar 2500am3/h 21bar 1150am3/h 21bar 1500am3/h 21bar 2500am3/h29bar 1150am3/h 29bar 1500am3/h 29bar 2500am3/h 90% Confidence
Figure 14: Measurement of liquid mass flow rate by combined Dualstream II Advanced
flow meter.
7th South East Asia Hydrocarbon Flow Measurement Workshop 5th – 7th March 2008
15
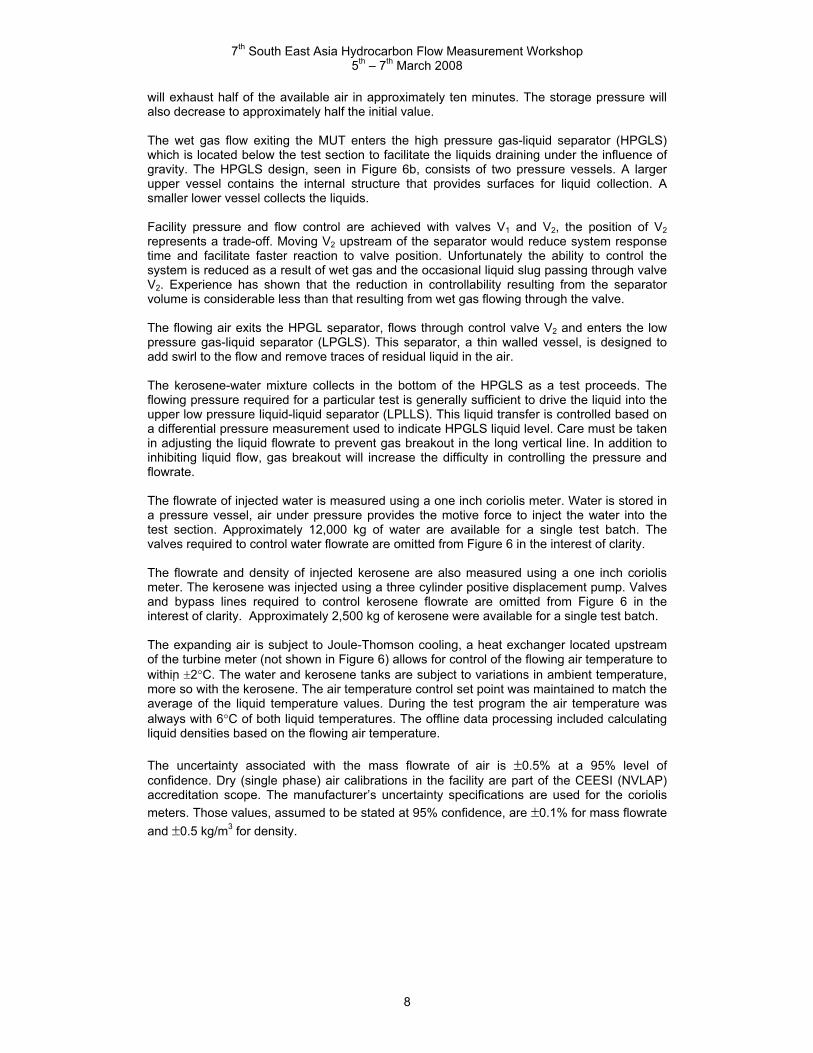
Historically Solartron ISA conduct venturi meter calibrations at the Advantica Bishop Auckland Flow Center which is UKAS accredited to supply natural gas calibrations. The facility operates between 500 and 800 psig flowing up to 1 Bcf/day with an uncertainty range of ±0.19% to ±0.24% (at 95% confidence). The “dry” data from the current calibrations at CEESI and Advantica are shown in Figure 15 in the form of discharge coefficient plotted against Reynolds number (Re). The open symbols represent calibration points while the solid lines attempt to define an interval containing 95% of the data. The interval width varies from ±0.31% at Re = 10 million to ±0.55% at Re = 2 million. These results have technical value for two reasons. First, the dry baseline conditions for the meter have been confirmed based on two independent calibrations. This is valuable for both manufacturer and end user. Second, good agreement is noted between the two calibration facilities, which is very important to both the facility operators and their clients.
Figure 15: Dualstream II Advanced Flow Meter dry calibration results
5. CONCLUSIONS CEESI’s new test facility has enabled to provide a satisfactory calibration for the North Belut Dualstream II Advanced flow meter on conditions that reflect those that it is projected to see in service. The commissioning of a new test facility is not without its teething issues, as has been found with this initial test on CEESI’s new blow-down rig. The advantages of not being reliant on test loops, with their potential issue of carry-over, are a boon to the industry’s ability to accurately test flow meters at conditions similar to those that the meter should experience whilst in service. The issues of obtaining stable test points has resulted in frustrations in the process of obtaining data relevant to the provided test matrix, and complications within the derivation of the flow meter’s algorithms. However, these have only complicated, rather than compromised, the current procedures, and may require more flexibility in drawing up suitable test matrices and adapting to the data obtained on a particular run. The ongoing development by CEESI, including the installation of new compressors, provides a useful addition to the range of wet gas calibration facilities available to both flow meter manufacturers and end users alike.
0.99
1.00
1.01
1.02
0 2 4 6 8 10 12
Reynolds Number [millions]
Dis
char
ge C
oeffi
cien
t [-]

7th South East Asia Hydrocarbon Flow Measurement Workshop 5th – 7th March 2008
16
REFERENCES
1. Downing A, Daniel P & Lund J, “First Field Experience of the Dualstream II Wet Gas Flowmeter”, NEL Wet Gas Metering Seminar , Paris 2001.
2. Chisholm D., "Research Note: Two-Phase Flow Through Sharp-Edged Orifices",
Journal of Mechanical Engineering Science, Vol. 19, No. 3, 1977.
3. de Leeuw. R, "Liquid Correction of Venturi Meter Readings in Wet Gas Flow", North Sea Flow Measurement Workshop, Norway, October 1997.
4. Wood I. & Daniel P., “Penguin Dualstream II Wet Gas Measurement”, North Sea Flow
Measurement Workshop, St. Andrews, Scotland 2003 5. Jacobsen E., Denstad H.,Downing A., Daniel P. & Tudge M., “Validation &
Operational Experience of a Dualstream II Wet Gas Meter in a Subsea Application on the Statoil Mikkel Field”, North Sea Flow Measurement Workshop, St. Andrews, Scotland 2004
6. Steven R., Britton C. & Kinney J., “Comparisons Between Horizontally Installed
Standard and Non-Standard Flange Tapped Orifice Plate Meter Wet Gas Flow Responses”, 14th International Flow Measurement Conference Flomeko 2007, Sandton, Johannesburg, September 2007.
7. Steven R. & Kinney J., “Wet Gas Flow Metering –with a Horizontally Installed Simple
DP Meter Technologies”, flotek.g Global Conference & Exhibition 2007, Technical Proceedings, Fluid Council Research Institute, Palakkad, Kerala, India, September 2007.
8. Reader-Harris M., Hodges D. & Gibson, J., “Venturi-Tube Performance in Wet Gas
Using Different Test Fluids”, North Sea Flow Measurement Workshop, Scotland, October 2006.
9. Steven R., Stobie G. & Hall A., “Further Evaluation of the Performance of Horizontally
Installed Orifice Plate and Cone Differential Pressure Meters with Wet Gas Flows”, SE Asia Hydrocarbon Flow Measurement Workshop, Kuala Lumpur, Malaysia, March 2008.