North America Beverages: The Shape of the Future
85
North America Beverages: The Shape of the Future Morgan Stanley Global Consumer & Retail Conference November 20, 2008
-
Upload
khangminh22 -
Category
Documents
-
view
1 -
download
0
Transcript of North America Beverages: The Shape of the Future

North America Beverages: The Shape of the Future
Morgan Stanley Global Consumer & Retail Conference
November 20, 2008

Indra NooyiPepsiCo Chairman & CEO

2
Safe Harbor StatementThis material may contain “forward-looking” statements about our expectations regarding future performance, such as our business outlook. These forward-looking statements are based on currently available information, operating plans and projections about future events and trends. They inherently involve risks and uncertainties that could cause actual results to differ materially from those predicted in any such forward-looking statements. Such risks and uncertainties include, but are not limited to: changes in demand for our products, as a result of shifts in consumer preferences or otherwise; our ability to maintain our reputation; our ability to build and sustain our information technology infrastructure, successfully implement our business process transformation initiative or to outsource certain functions effectively; fluctuations in the cost and availability of raw materials; our ability to compete effectively; disruption of our supply chain; trade consolidation, the loss of any key customer, or failure to maintain good relationships with our bottling partners; changes in the legal or regulatory environment; our ability to hire or retain key employees; unfavorable economic, environmental or political conditions in the countries where we operate; market risks arising from changes in commodity prices, foreign exchange rates and interest rates; and risks that benefits from our Productivity for Growth initiative may not be achieved or may take longer to achieve than expected or may cost more than currently anticipated. For additional information on these and other factors that could cause our actual results to materially differ from those set forth herein, please see our filings with the Securities and Exchange Commission, including our most recent annual report on Form 10-K and subsequent reports on Forms 10-Q and 8-K. Investors are cautioned not to place undue reliance on any such forward-looking statements, which speak only as of the date they are made. We undertake no obligation to update any forward looking statements, whether as a result of new information, future events or otherwise.

3
2008 – The Year In Review
Bright Spots
• Solid North America Foods Performance–Strong net sales management
• Strong Performance in International Markets−Both snacks and beverages performing well
• On track to deliver full year core guidance

4
FLNA: Solid YTD Results
6
8
2
Volume Revenue NOPBT
• Strong top-line growth
• Solid Core salty performance
• Pricing to cover commodity inflation
• Accelerated productivity and cost management
FLNA Q3 YTD %YAGFLNA Q3 YTD %YAG

5
FLNA: Go-Forward Priorities
• Sustain growth of our core salty business
• Balance pricing and value
• Execute Productivity for Growth agenda
• Continue portfolio evolution towards healthier macrosnacking

6
LAF: Outstanding YTD Results
2933
5
Volume Revenue NOPBT
• Balanced top-line growth
• Successful integration of acquisitions
• Accelerated productivity and judicious cost management
LAF Q3 YTD %YAGLAF Q3 YTD %YAG

7
LAF: Go-Forward Priorities
• Sustain growth trends in our key markets– Mexico salty and sweet/baked portfolio– Invest to win in emerging markets
• Stay ahead of inflation – revenue and cost management focus
• Execute Productivity for Growth agenda
• Continue expansion of the Quaker brand and Gamesa sweet/baked portfolio across LAF

8
PI: Solid YTD Results
Volume
1923
128
Snacks Bevs Rev NOPBT
• Balanced top-line growth
• Strong growth across developing markets
• Continued success in China
• Successful expansion of PLI partnership
PI Q3 YTD %YAGPI Q3 YTD %YAG

9
PI: Go-Forward Priorities
• Manage net revenue and profitability
• Successfully integrate Lebedyansky and Marbo
• Execute Productivity for Growth
• Invest to win in key emerging markets
• Continue NCB expansion

Managing for Long Term Growth
• Operating agility to manage through challenging environments− Experience managing through adversity− Focus on consumer value proposition− Leveraging productivity for growth− Selectively investing and making smart trade-offs
• Diverse, consumer-driven product portfolio
• Continuing to invest for the long term− Building brands and innovating− Retaining world class talent− Maintaining focus on Performance with Purpose sustainability agenda
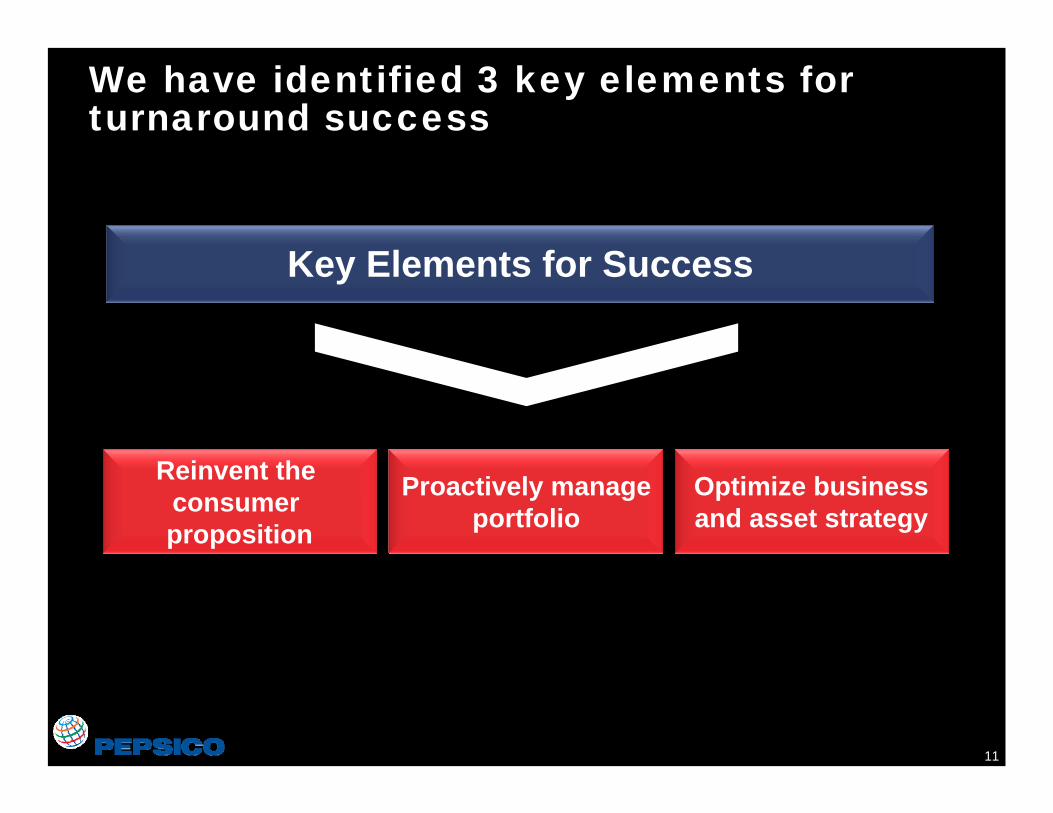
11
Reinvent the consumer proposition
Proactively manage portfolio
Optimize business and asset strategy
Key Elements for Success
We have identified 3 key elements for turnaround success
12
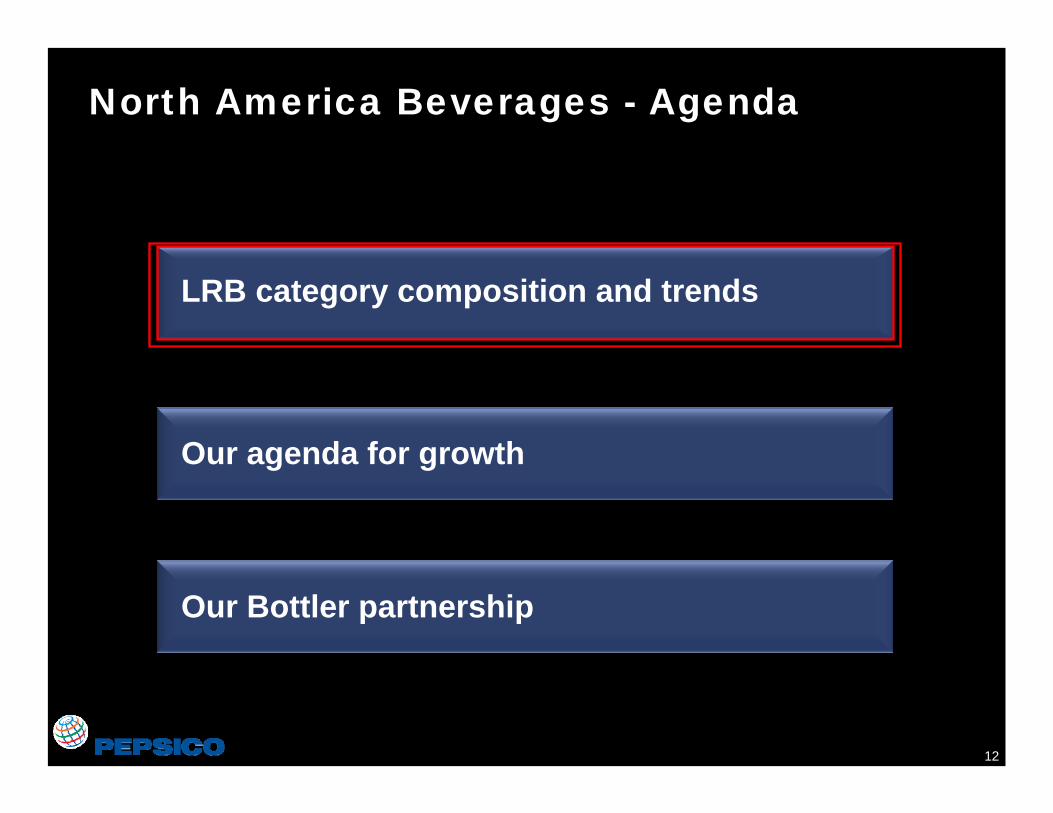
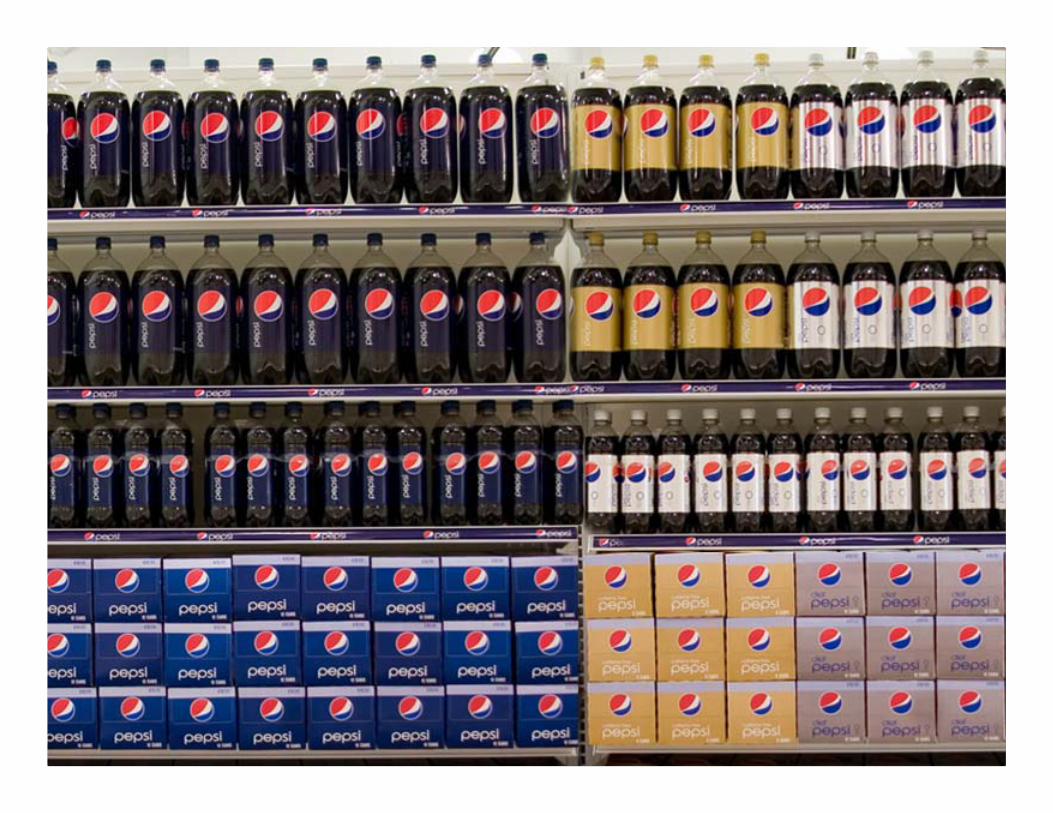
LRB category composition and trends
North America Beverages - Agenda
Our Bottler partnership
Our agenda for growth

Massimo D’Amore
CEO PepsiCo Americas Beverages

14
Consumers are still drinking…
Total beverage occasions increasing…
…but Liquid Refreshment Beverages (LRB) lost share to cheaper in-home alternatives
Continued penetration growth in Non-Carbs (NCBs)- CSDs & bottled water losing occasions

15
% LRB 48.1% 53.4%
Source: Beverage Marketing Corp; 2008 LRB Model v98; internal PAB LRB estimates
LRB
Coffee and Teas
Coffee and Teas
Tap Tap
Alcohol Alcohol
Milks Milks
LRB
1999 2007
34.8 Bn 37.9 Bn
Total US Volume (8oz)Volume
CAGR (99-07)
flat
1%
(4)%
1%
2.4%
1%
Historically LRB sourced share from other beverages
Through 2007 LRB was the fastest Through 2007 LRB was the fastest growing segment within Total Beveragesgrowing segment within Total Beverages

16
Accelerating CSD decline & a halt in bottled water growth were the primary reasons for 2008 fall off
2008F
1. Other NCB — Non-Carbonated Beverages (Juice, Juice Drinks, Sports Drinks, Enhanced Water, Energy, RTD Tea, RTD Coffee, VAD) 2. Water includes bottled water, Jug / bulk and other water (does not include enhanced water)
Source: LRB 2008 Model; Beverage Marketing Corporation; BCG analysis
CSDs45%
Bottled Water2
25%
Other NCBs1
30%
20B 8oz CasesBottled Water2
(5)
0
5
10
15
'00 -'04
'05 -'06
'07 -'08F
'00 -'04
'05 -'06
'07 -'08F
'00 -'04
'05 -'06
'07 -'08F
Volume CAGR (%)
Other NCBs1CSDs
LRB Category Mix

17
• Under-served consumers
• Unfulfilled occasions
• Unmet need intersections
• Advantaged science brings new ways to address needs:
- Nutrition
- Transformation
In-depth consumer analysis identified significant opportunities for LRB growth

18
We expect LRB Will Return to Growth With Economic Recovery
Regain share of occasions from non-LRB
Population Growth
LRB Growth
+
See value-oriented growth through the economic downturn
Returning to volume growth at least in line with population
Positive trends for value-added products over longer term fuelled by:
– Functional benefits
– New occasions
– Leveraging science

19
Over 50% of LRB value remains with CSDs
LRB value % mix
11
31 34 33 35 38
54586065 51
11964
0
25
50
75
100
1990 1995 2000 2005 2008F
CSDs
1. Other NCB — Non-Carbonated Beverages (Juice, Juice Drinks, Sports Drinks, Enhanced Water, Energy, RTD Tea, RTD Coffee, VAD) 2. Water includes bottled water, Jug / bulk and other water (does not include enhanced water)
Source: LRB 2008 Model; Beverage Marketing Corporation; BCG analysis
Other NCBs1
Water2
20
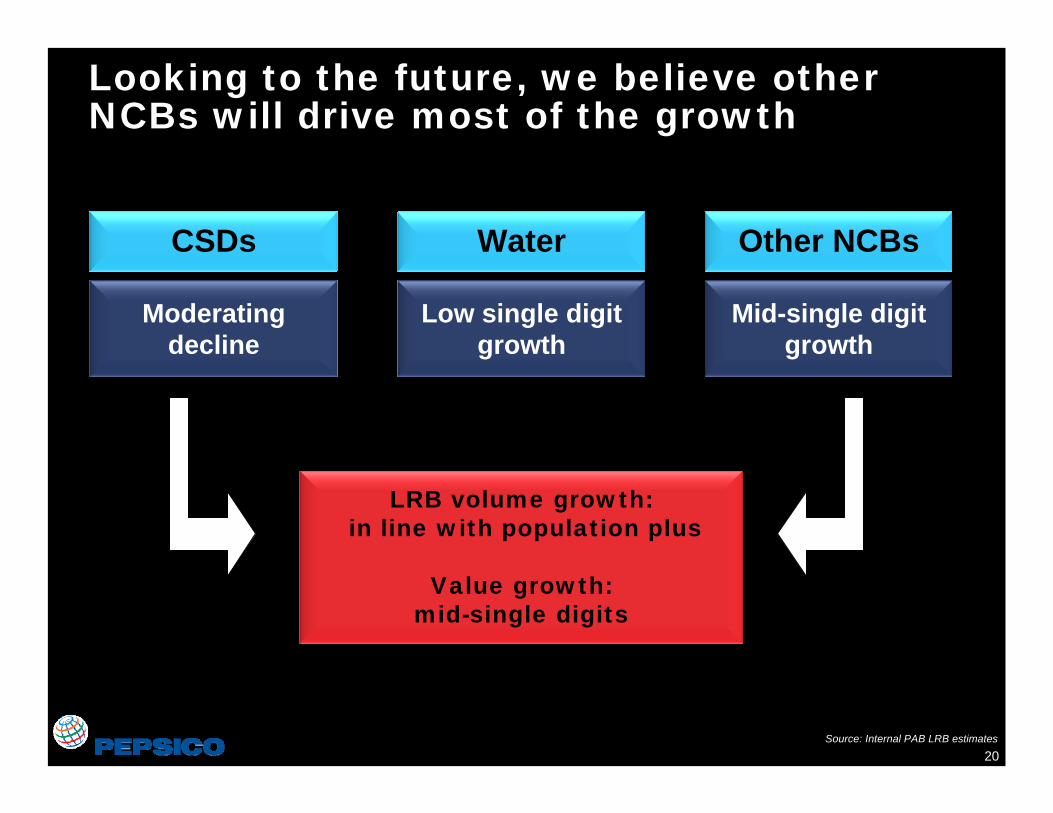
Looking to the future, we believe other NCBs will drive most of the growth
Other NCBsWaterCSDs
Moderating decline
Low single digit growth
Mid-single digit growth
LRB volume growth:in line with population plus
Value growth: mid-single digits
Source: Internal PAB LRB estimates
21
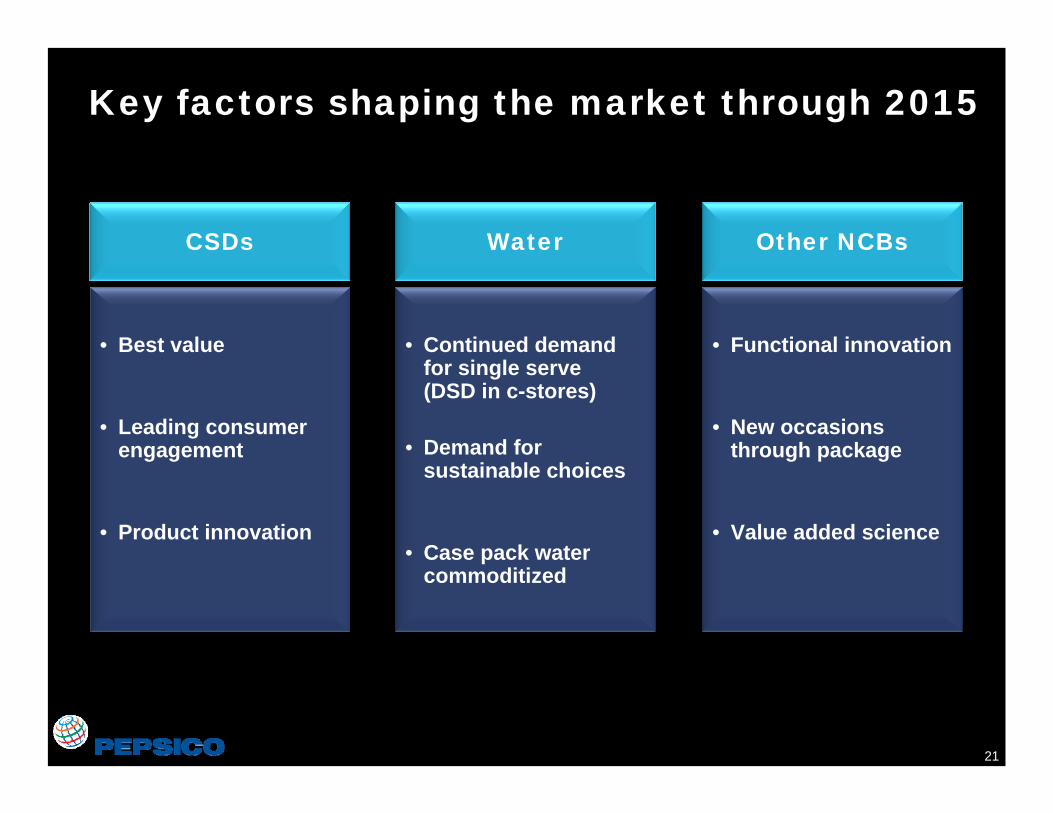
Key factors shaping the market through 2015
Other NCBsWaterCSDs
• Best value
• Leading consumer engagement
• Product innovation
• Continued demand for single serve (DSD in c-stores)
• Demand for sustainable choices
• Case pack water commoditized
• Functional innovation
• New occasions through package
• Value added science

22
LRB category composition and trends
North America Beverages - Agenda
Our Bottler partnership
Our agenda for growth
23
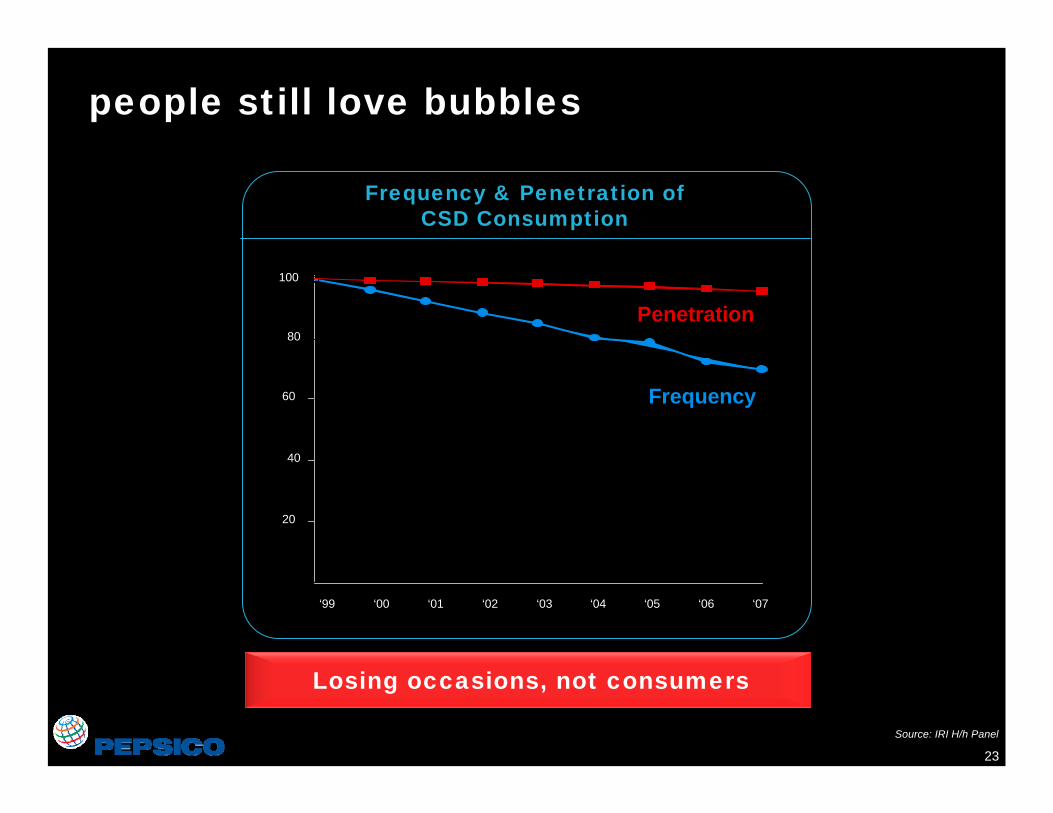
people still love bubbles
Index (1999 = 100)
Penetration
‘99 ‘00 ‘01 ‘02 ‘03 ‘04 ‘05 ‘06 ‘07
80
100
40
60
20
Frequency
Frequency & Penetration of CSD Consumption
Source: IRI H/h Panel
Losing occasions, not consumers

24
Regaining CSD momentum requires removing frequency barriers
Natural sweetener
Less “artificial” ingredients
Reinvent the consumer proposition
We’re making focused bets against all of these

25
With Mt Dew we have proven our ability to deliver despite category headwinds
Mt Dew Succeeding Despite CSD Headwinds
#1 Flavored CSD brand
#1 C&G CSD SKU
Extremely Loyal &
Passionate Consumers
0%
1% 1%
(3%)
CSD Mt Dew
’99-’06Vol CAGR
’07-’08FVol CAGR
Source: PAB LRB Model, IRI GDMxC YTD Nov 2, 2008

26
Dew succeeding with deep consumer connection
Beyond flavored line extension to “experiences”
Harnessing the power of the
masses
Leveraging an open source model for
creativity
Driving affinity via compelling content

27
Sierra mist video

28
1920s 1940s 1960s 1980s 2000s
Timeline
Culture
Double Ounces‘Jingle’ that united
Spirit of Victory
First Moverto Embrace
Diversity
PepsiGeneration
SuperstarsNew Generation
GenerationNextYouth identity
PEPSI
At its best, Pepsi was a catalyst for change in popular culture

29
• A catalyst for positive change
• Leading rather than mirroring culture
• A true challenger
We have a history of being…

30
Humanity
Simplicity Modern, iconic
Optimism and energy
Heritage Sign of the times
… And Renewed Our Brand Identity

31
DesignHeritage
Sign of the Times
Simplicity
Modern,simple, iconic
Humanity
Humanity, Optimism,Energy

32
Smile
Wink
Laugh
:-)
;-)
:-D
33

34
Our New Icon
PEPSIDIET PEPSI
SmileSavor theOriginal
GrinIndulgence
Without Regret
PEPSI MAX
LaughMaximumEnjoyment

35
Arnell Video

36
Bharat
37
Bharat

38
39
40

41

42

43

44
Water and Non-Carbs…
1. NCB — Non-Carbonated Beverages (eg, sports drinks, RTD tea, etc) 2. Water includes bottled water, Jug / bulk and other waterSource: LRB 2008 Model; Beverage Marketing Corporation; BCG analysis
2008F LRB Category Mix
3038
5145
1125
0
25
50
75
100
Volume Value
CSDs
Other NCBs1
Water2
• Energy• RTD CoffeeTransform
Nourish
Hydrate• Bottled Water• Enhanced Water• Sports Drinks
• Chilled Juice• Shelf Stable Juice• RTD Tea• Value Added Protein
Fulfill three consumer needs
1. Other NCB — Non-Carbonated Beverages (Juice, Juice Drinks, Sports Drinks, Enhanced Water, Energy, RTD Tea, RTD Coffee, VAD) 2. Water includes bottled water, Jug / bulk and other water (does not include enhanced water)
Source: LRB 2008 Model; Beverage Marketing Corporation; BCG analysis

45
PepsiCo is the #1 player in hydration with top brand positions
Share of 04-08F Category Vol CAGR
Bottled Water 14% 10%
Sports Drinks 78% 7%
Enhanced Water 34% 26%
Total Hydration* 30% 10%
PEP Hydration Portfolio
* Excludes jug waterSource: YTD Nov 2, 08 GDMxC IRI, PAB LRB Model
Rank
#1 Aquafina
#1 Gatorade
#2 Propel#3 Aquafina Flavor Splash#4 SoBe Lifewater

46
Hydration is a big category serving broad needs
Transform
Nourish
Hydrate
• Simple hydration
• Body wellness
• Performance hydration
• Bottled Water
• Enhanced Water
• Sports Drinks

47
Consumers have clearly segmented hydration needs
PepsiCo hydration portfolio designed to address unique consumer needs
Simple Hydration Body WellnessPerformance
Hydration

48
48

49
Aquafina – Flavor Splash

50
Body wellness – Propel was #1 brand and will be reasserted in 2009

51

52

53

54
55

56
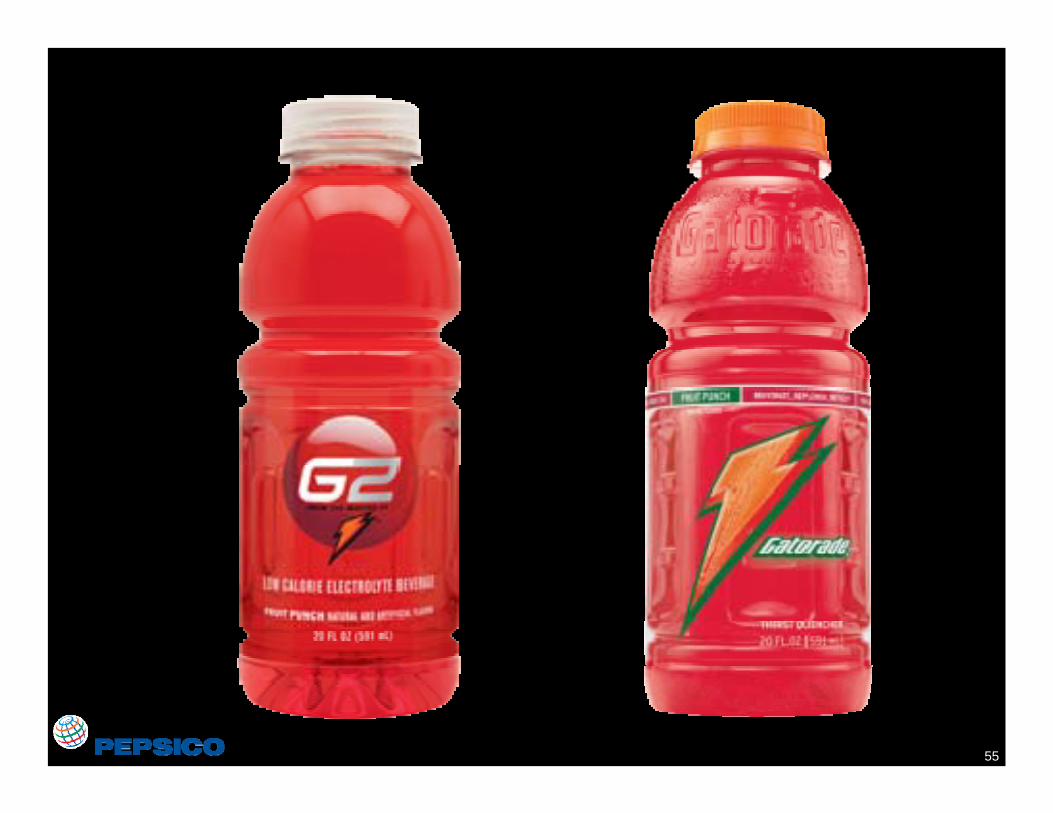
Performance Hydration: Gatorade
Source: PepsiCo Market Research
Heritage
Opportunity

57
“G” will become the essence of Gatorade

58
jimmy video
59
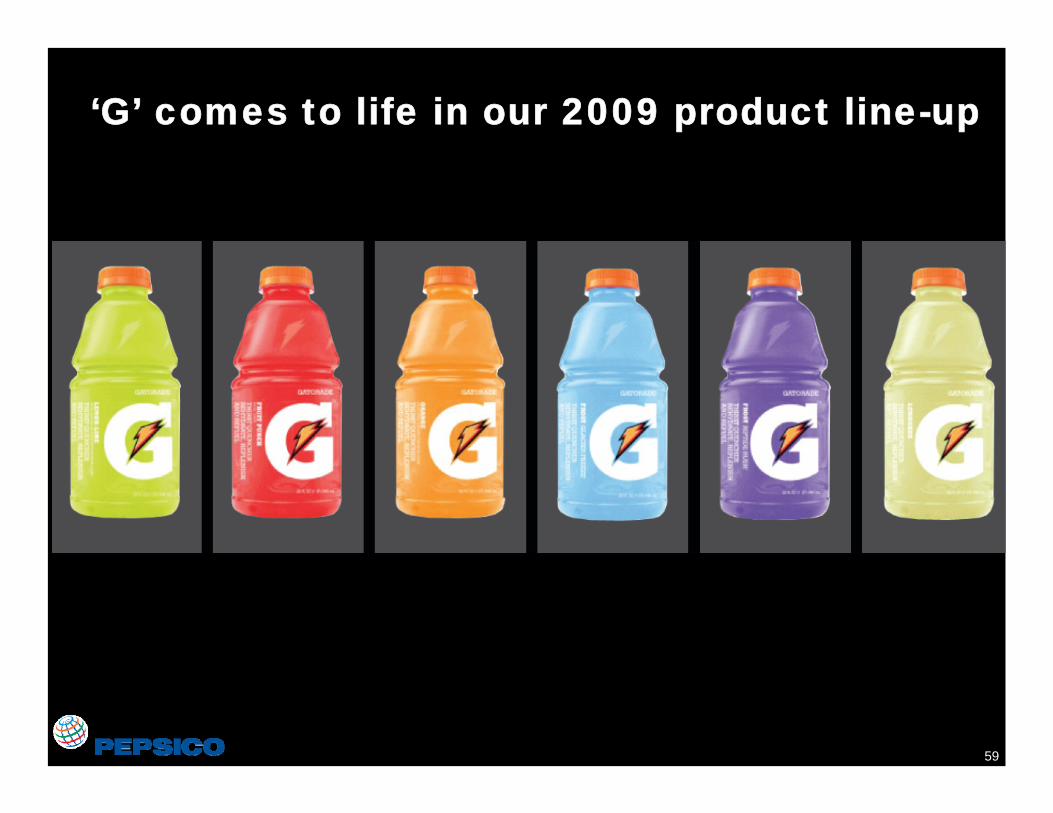
‘G’ comes to life in our 2009 product line-up

60
Gatorade sizzle video
61
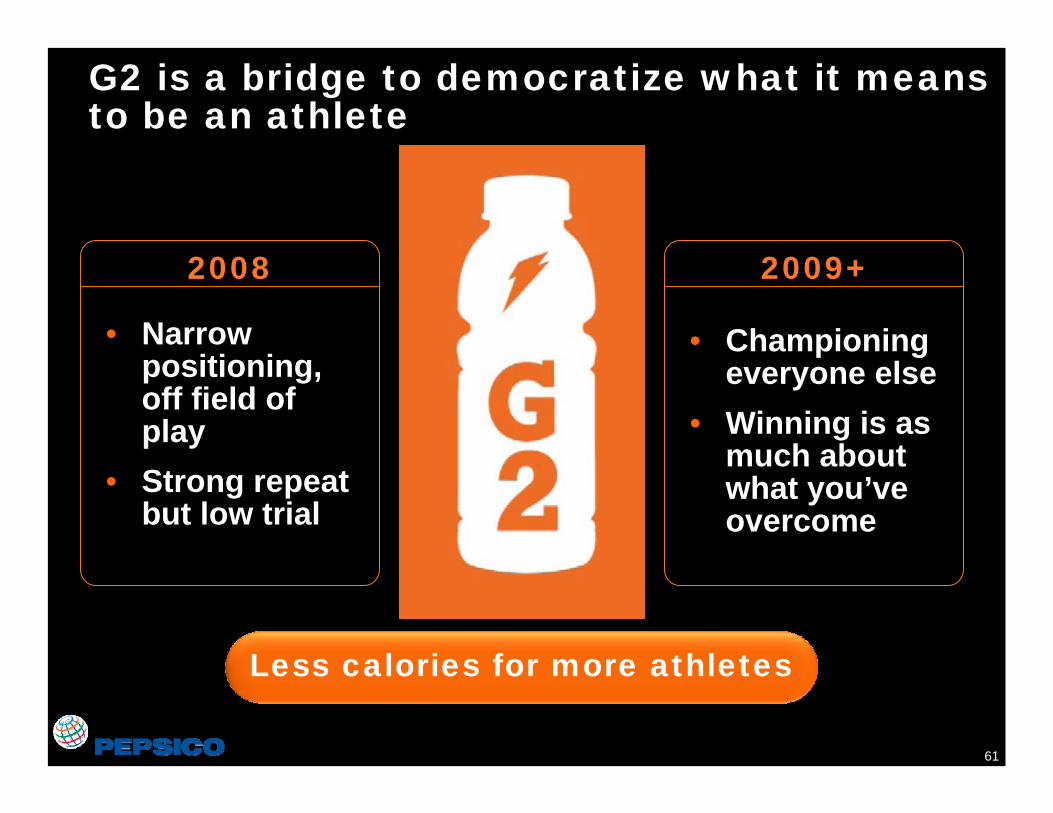
G2 is a bridge to democratize what it means to be an athlete
• Narrow positioning, off field of play
• Strong repeat but low trial
2008
Less calories for more athletes
• Championing everyone else
• Winning is as much about what you’ve overcome
2009+

62
PepsiCo’s right to succeed in Hydration
# 1 share, leading portfolio of brands
Know consumer segments well
Portfolio aligned to consumer needs
Source: YTD Nov 2, 08 GDMxC IRI, PAB LRB Model

63
Nourishment: a growing category
Transform
Hydrate
Nourish
Sustain My
Health
Tide Me
Over
Manage My
Weight

64
We are re-positioning Tropicana to own the breakfast occasion
Great Start To The Day
Emotional Connection
Positive Nutrition 100% Goodness

65
TPP Morning video

66
For lapsed OJ drinkers concerned about calories
Great Start To The Day
Positive Nutrition 100% Goodness
50% Less Sugar
67
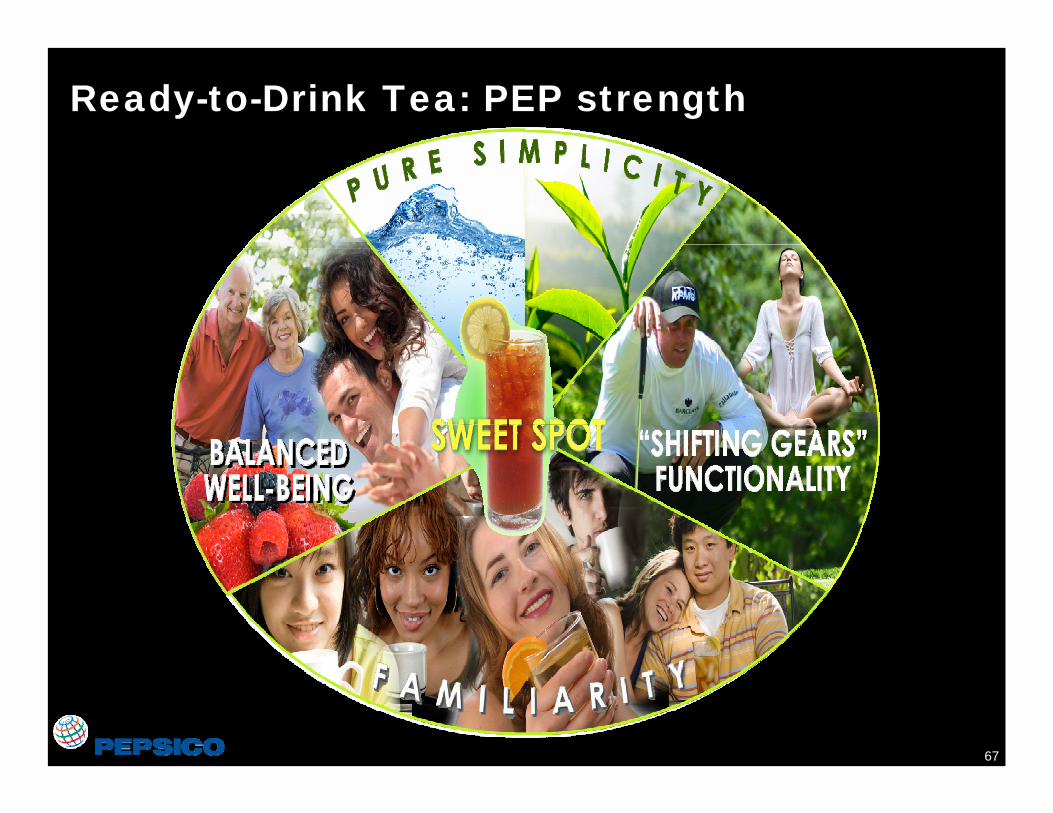
Ready-to-Drink Tea: PEP strength

68
Terrific partnership and portfolio
Demographic
Need
Benefit

69
Leadership growth with roll-out of Green Tea
$950MM
$115MM05-08F CAGR
LIT +99%RTD Tea +15%
PAB estimates

70
Sparkling Tea with the joy of bubbles

71
Magnify the benefits of tea with Alpha…
• Goodness from the Leaf
• Breakthrough Beverage
• Improved Focus & Concentration

72
Creating new occasions with Jug
73
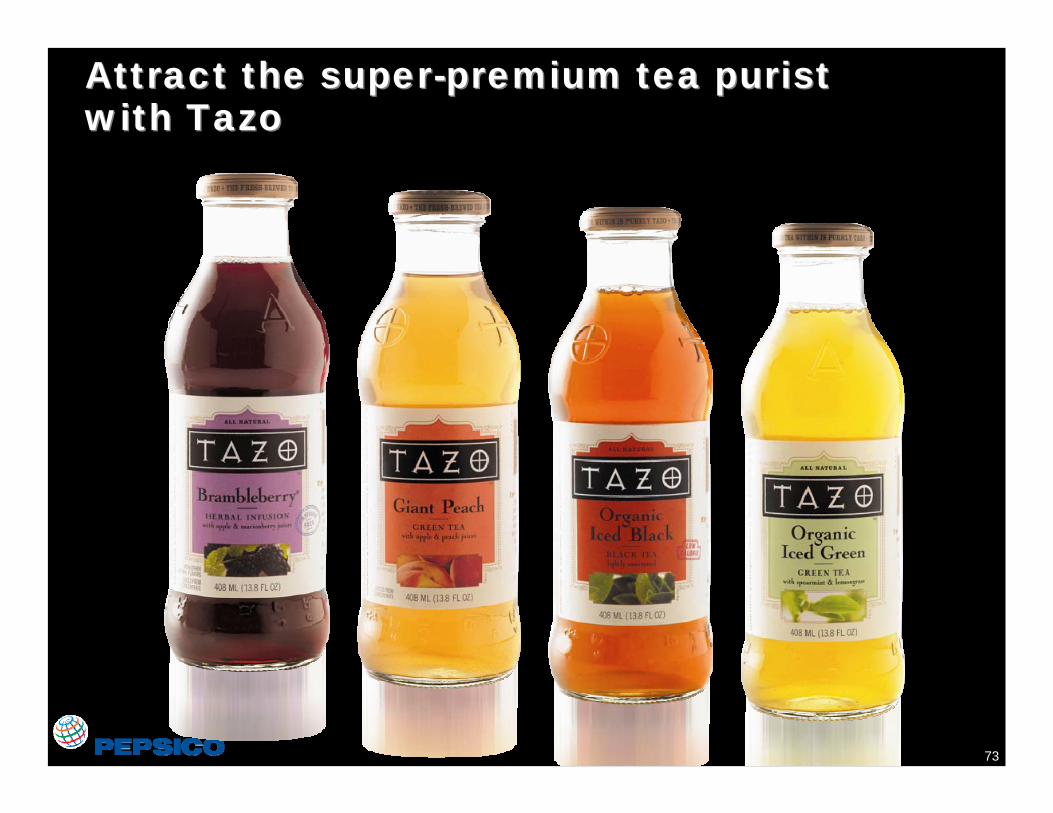
Attract the super-premium tea purist with TazoAttract the super-premium tea purist with Tazo
• Artfully crafted teas
• Highest quality plants & botanical
• Super-premium
• Available nationwide via our distribution reach

74
Transformation
Nourish
Hydrate
Transform

75
We are targeting AMP growth at expanding light users
Significant number of light users in category
Reasons For NotDrinking/Drinking More
Unfamiliar Ingredients: 51%
Bad Taste: 47%
Not Thirst Quenching: 44%
14%
43% 16%
21%
70%
36%
% Users % Volume
Heavy
Medium
Light
Source: Itrac March 2008 Source: 2008 Energy A&U

76
Hybrids fuse Energy with familiar LRB segments
GREEN and BLACK TEA LEMONADE

77
Grassroots
Programs
Media
Value
Dale Jr. has been a Big Win engaging consumers

78
NA BeveragesGrowth
Transforming our portfolio
Other NCBsWaterCSDs
Stem Declinein CSDs
Grow NCBs• Functional benefits• Natural sweeteners• Increase occasions
Source: Internal PAB LRB estimates
Re-inventing the consumer proposition for many key brands
Pro-actively managing the portfolio
ProfitableGrowth
79
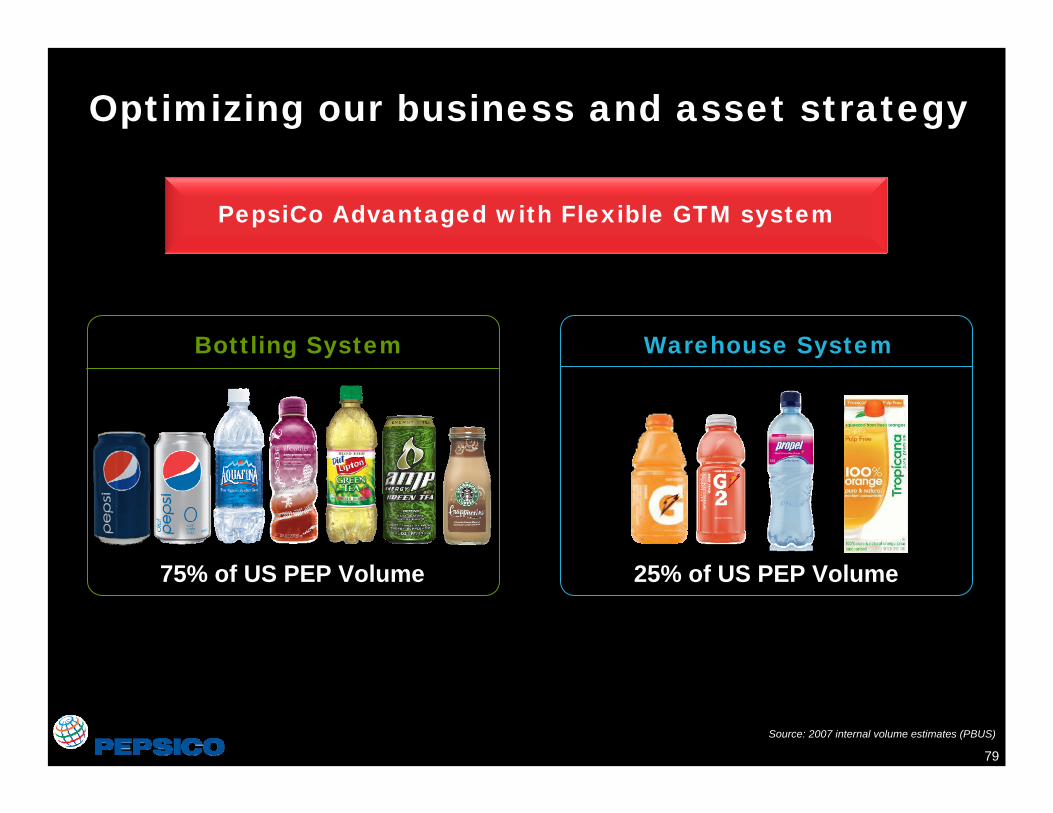
Optimizing our business and asset strategy
75% of US PEP Volume
Source: 2007 internal volume estimates (PBUS)
Bottling System Warehouse System
25% of US PEP Volume
PepsiCo Advantaged with Flexible GTM system

80
We view our bottling partners as essential to our joint success
• Healthy relationship, constructive dialogue
• Win-win partnership for margin expansion– Joint supply chain productivity– Cold fill manufacturing consolidation
• Robust joint business planning process– 4% concentrate price increase
• Aligned, integrated plans for 2009 innovation

81
Reinvent the consumer proposition
Proactively manage portfolio
Optimize business and asset strategy
Key Elements for Success
Our beverage plan addresses all 3 key elements for turnaround success

82
PepsiCo NA Beverages long-term prospects
• PepsiCo re-architecting portfolio to achieve growth– Gatorade re-positioning for
profitable growth– Re-energizing CSDs to
moderate declines– Focused efforts on key
NCBs for targeted growth bets
NA Beverageslong-term goal
• At least 1+%volume growth
• Mid-single digitNOPBT growth
83
Summary
• Confident LRB category will grow at least in-line with population
• 2009 challenge due to macro economic environment, but we are prepared– Scorecard in place to measure success– Expect visible impact in H2
• PepsiCo committed to winning in LRB– Stem decline in CSDs– Grow NCBs
84