Invariant Solutions of Richards’ Equation for Water Movement in Dissimilar Soils
Upload
independentCategory
view
0download
0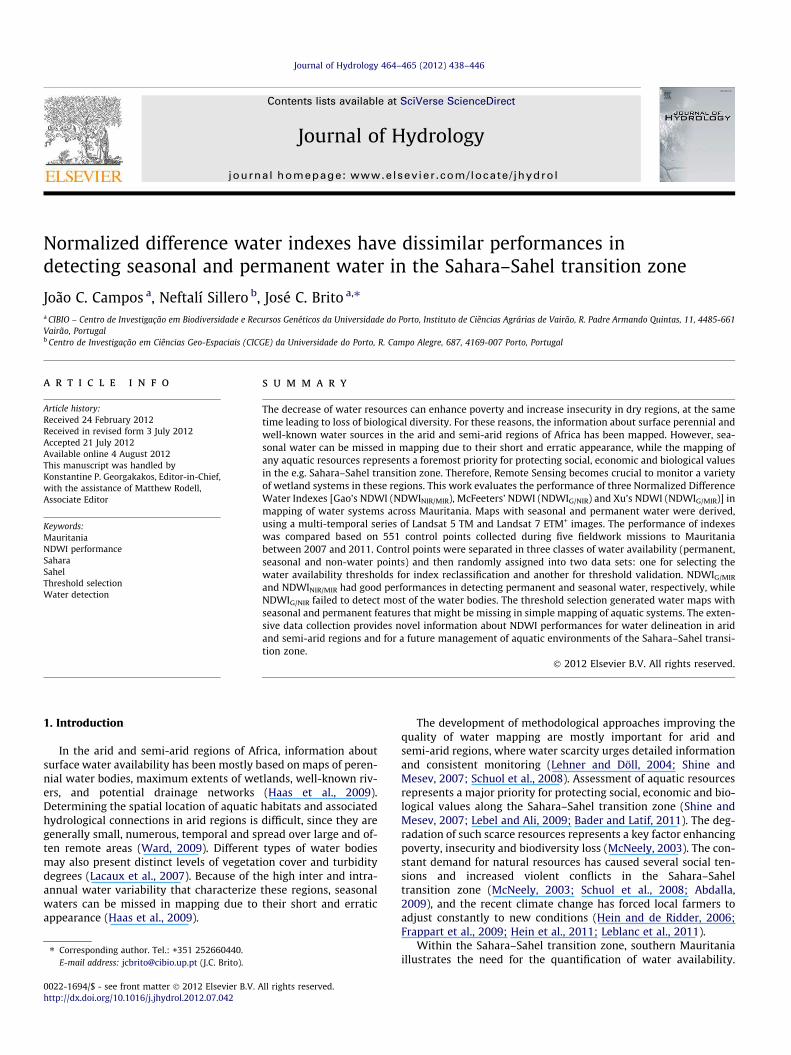
Normalized difference water indexes have dissimilar performances indetecting seasonal and permanent water in the Sahara–Sahel transition zone
João C. Campos a, Neftalí Sillero b, José C. Brito a,⇑
aCIBIO – Centro de Investigação em Biodiversidade e Recursos Genéticos da Universidade do Porto, Instituto de Ciências Agrárias de Vairão, R. Padre Armando Quintas, 11, 4485-661
Vairão, PortugalbCentro de Investigação em Ciências Geo-Espaciais (CICGE) da Universidade do Porto, R. Campo Alegre, 687, 4169-007 Porto, Portugal
a r t i c l e i n f o
Article history:
Received 24 February 2012Received in revised form 3 July 2012Accepted 21 July 2012Available online 4 August 2012This manuscript was handled byKonstantine P. Georgakakos, Editor-in-Chief,with the assistance of Matthew Rodell,Associate Editor
Keywords:
MauritaniaNDWI performanceSaharaSahelThreshold selectionWater detection
s u m m a r y
The decrease of water resources can enhance poverty and increase insecurity in dry regions, at the sametime leading to loss of biological diversity. For these reasons, the information about surface perennial andwell-known water sources in the arid and semi-arid regions of Africa has been mapped. However, sea-sonal water can be missed in mapping due to their short and erratic appearance, while the mapping ofany aquatic resources represents a foremost priority for protecting social, economic and biological valuesin the e.g. Sahara–Sahel transition zone. Therefore, Remote Sensing becomes crucial to monitor a varietyof wetland systems in these regions. This work evaluates the performance of three Normalized DifferenceWater Indexes [Gao’s NDWI (NDWINIR/MIR), McFeeters’ NDWI (NDWIG/NIR) and Xu’s NDWI (NDWIG/MIR)] inmapping of water systems across Mauritania. Maps with seasonal and permanent water were derived,using a multi-temporal series of Landsat 5 TM and Landsat 7 ETM+ images. The performance of indexeswas compared based on 551 control points collected during five fieldwork missions to Mauritaniabetween 2007 and 2011. Control points were separated in three classes of water availability (permanent,seasonal and non-water points) and then randomly assigned into two data sets: one for selecting thewater availability thresholds for index reclassification and another for threshold validation. NDWIG/MIR
and NDWINIR/MIR had good performances in detecting permanent and seasonal water, respectively, whileNDWIG/NIR failed to detect most of the water bodies. The threshold selection generated water maps withseasonal and permanent features that might be missing in simple mapping of aquatic systems. The exten-sive data collection provides novel information about NDWI performances for water delineation in aridand semi-arid regions and for a future management of aquatic environments of the Sahara–Sahel transi-tion zone.
� 2012 Elsevier B.V. All rights reserved.
1. Introduction
In the arid and semi-arid regions of Africa, information aboutsurface water availability has been mostly based on maps of peren-nial water bodies, maximum extents of wetlands, well-known riv-ers, and potential drainage networks (Haas et al., 2009).Determining the spatial location of aquatic habitats and associatedhydrological connections in arid regions is difficult, since they aregenerally small, numerous, temporal and spread over large and of-ten remote areas (Ward, 2009). Different types of water bodiesmay also present distinct levels of vegetation cover and turbiditydegrees (Lacaux et al., 2007). Because of the high inter and intra-annual water variability that characterize these regions, seasonalwaters can be missed in mapping due to their short and erraticappearance (Haas et al., 2009).
The development of methodological approaches improving thequality of water mapping are mostly important for arid andsemi-arid regions, where water scarcity urges detailed informationand consistent monitoring (Lehner and Döll, 2004; Shine andMesev, 2007; Schuol et al., 2008). Assessment of aquatic resourcesrepresents a major priority for protecting social, economic and bio-logical values along the Sahara–Sahel transition zone (Shine andMesev, 2007; Lebel and Ali, 2009; Bader and Latif, 2011). The deg-radation of such scarce resources represents a key factor enhancingpoverty, insecurity and biodiversity loss (McNeely, 2003). The con-stant demand for natural resources has caused several social ten-sions and increased violent conflicts in the Sahara–Saheltransition zone (McNeely, 2003; Schuol et al., 2008; Abdalla,2009), and the recent climate change has forced local farmers toadjust constantly to new conditions (Hein and de Ridder, 2006;Frappart et al., 2009; Hein et al., 2011; Leblanc et al., 2011).
Within the Sahara–Sahel transition zone, southern Mauritaniaillustrates the need for the quantification of water availability.
0022-1694/$ - see front matter � 2012 Elsevier B.V. All rights reserved.http://dx.doi.org/10.1016/j.jhydrol.2012.07.042
⇑ Corresponding author. Tel.: +351 252660440.E-mail address: [email protected] (J.C. Brito).
Journal of Hydrology 464–465 (2012) 438–446
Contents lists available at SciVerse ScienceDirect
Journal of Hydrology
journal homepage: www.elsevier .com/locate / jhydrol
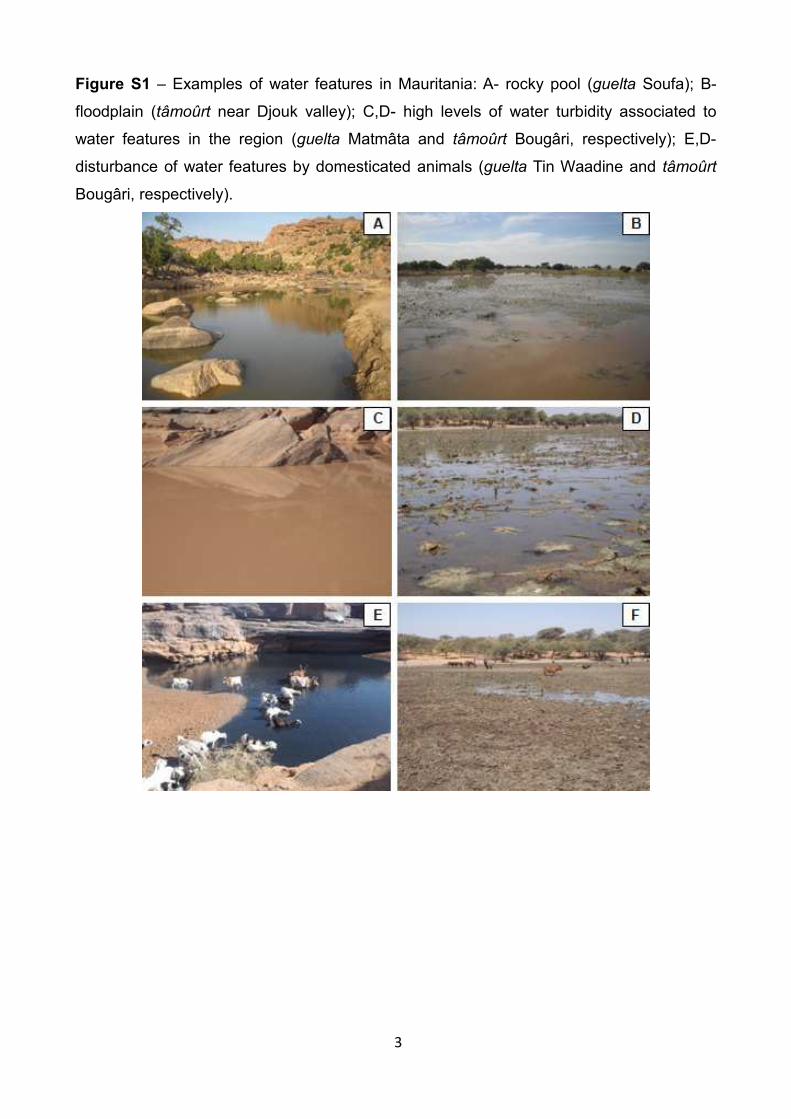
There are two major types of aquatic habitats in Mauritania: waterpools in rocky outcrops and temporary floodplains, locally knownas gueltas (Fig. S1, A, C and E) and tâmoûrts (Fig. S1, B, D and F),respectively. Gueltas are located upstream of narrow valleys atthe base of mountains and they are usually small (varying between0.001 ha and 1.0 ha), deep, and supplied by torrential waterfallsduring the rainy season, between July and October (Cooper et al.,2006; Brito et al., 2011). Tâmoûrts are located on the foothills ofmountains, and are normally large (more than 1000 ha) and shal-low, being frequently covered by hydrophytes and surrounded byAcacia trees (Cooper et al., 2006; Shine and Mesev, 2007). Tâmoûrts
are mostly arid during the dry season, because of the low deepnessand frequent exploitation for watering domesticated animals(Cooper et al., 2006). Both gueltas and tâmoûrts are generally iso-lated and spatially restricted, being highly vulnerable to humanactivities and climate change (Shine andMesev, 2007; Trape, 2009).
An accurate estimation of water availability is needed for con-serving the Sahara–Sahel biological values. The major mountainsof Mauritania, Adrar Atar, Tagant, Assaba and Afollé (Fig. 1), holdisolated populations of several vertebrate species of Afro-tropicalorigin (Trape, 2009; Brito et al., 2010, 2011). During the rainy sea-son, raging water fills streams, partially connecting many gueltas,and flows to the lower Senegal river, through the Gorgol el Abiod,Gorgol el Akhdar and Garfa basins (Fig. 1). As the persistence of sev-eral Mauritanian relict populations depends on mountain humidhabitats and associated hydrological corridors, it is very importantto evaluate the structure and availability of those habitats.
Remote Sensing (RS) has proven to be a useful solution for mon-itoring a variety ofwetland systems in regionswherefield investiga-tions are difficult to perform (Ahmed et al., 2009). These techniqueshave been explored in the arid and semi-arid regions of North Africa
for producingmapswith the exact location ofwater bodies andwithdetailed information about pond dynamics, vegetation cover, andturbidity (Chipman and Lillesand, 2006; Lacaux et al., 2007; Shineand Mesev, 2007; Niang et al., 2008; Leblanc et al., 2011).
Specific RS methods were developed for water assessment, suchas the Normalized Difference Water Indexes, NDWIs (Gao, 1996;McFeeters, 1996; Zarco-Tejada et al., 2003; Jackson et al., 2004;Chipman and Lillesand, 2006; Ouma and Tateishi, 2006; Xu,2006; Lacaux et al., 2007; Zhang et al., 2008; Soti et al., 2009; Jiet al., 2009). The NDWI is a ratio combining two different bandsthat enhances water spectral signals by contrasting the reflectancebetween different wavelengths and removing a large portion ofnoise components in different wavelength regions (Ji et al.,2009). The near-infrared (NIR) band has been referenced as well-suited for detecting open aquatic surfaces from satellite images,since water has a stronger absorptive capacity in the NIR range(McFeeters, 1996; Verdin, 1996). The middle infra-red (MIR) bandis also efficient, because water has very high MIR absorption andother landscape components have higher reflectance of MIR thanNIR (Gao, 1996; Xu, 2006). Several NDWIs combining the NIRand/or MIR bands have been proposed. The most frequently usedNDWIs are: (1) the NDWINIR/MIR = (NIR �MIR)/(NIR + MIR) (Gao,1996); (2) the NDWIG/NIR = (green � NIR)/(green + NIR) (McFeeters,1996); and (3) the modified NDWI, NDWIG/MIR = (green �MIR)/(green + MIR) (Xu, 2006). These indexes range between �1 and+1, which forces the definition of specific thresholds of NDWIreclassification to separate water from other land cover compo-nents. However, threshold definition is uncertain due to the intrin-sic water characteristics and land cover complexity of distinctregions (Xu, 2006; Ji et al., 2009). Therefore, threshold definitionis specific to each study case. Several studies have developed
Fig. 1. Study area where Remote Sensing techniques were used for the detection of water availability, discriminating main mountain massifs (underlined) and majorhydrographical networks (italics) in Mauritania.
J.C. Campos et al. / Journal of Hydrology 464–465 (2012) 438–446 439
different thresholdingmethods, such as the logical standard thresh-old (waterP 0) (Gao, 1996; McFeeters, 1996; Xu, 2006); arbitrarythresholds determined by photo-interpretation (Lacaux et al.,2007); or thresholds derived from experimental trials (Chipmanand Lillesand, 2006; Ji et al., 2009). Despite the considerable num-ber of studies addressing water delineation, there have been diver-gent opinions concerning which index should be chosen and howthresholds should be established (Ouma and Tateishi, 2006; Lacauxet al., 2007; Zhang et al., 2008; Soti et al., 2009; Ji et al., 2009).
In this study, water resources are evaluated across the arid andsemi-arid regions of Mauritania with remote sensing techniques inorder to: (i) assess the performance of NDWINIR/MIR, NDWIG/NIR andNDWIG/MIR for mapping seasonal and permanent water; (ii) devel-op a methodology of threshold selection that assures the best clas-sification of variable water-availability systems; and (iii) createwater availability maps for central-southern Mauritania.
2. Methods
2.1. Study area
The study area encompasses nearly 463,925 km2, between 21�Nand 13�N and 14–5�W, and comprises the central and southernMauritania (76% of study area), extreme south-western Mali(13%) and north-eastern Senegal (11%) (Fig. 1). Within Mauritania,the study area includes the major mountains of Adrar Atar, Tagant,Assaba and Afollé. While the Adrar Atar is relatively isolated, theother three massifs can be connected by seasonal rivers that occa-sionally flow to the Senegal river. Altitude varies from 9 m on theSenegal river valley to 793 m in the Adrar Atar. Climate is charac-terized by a cool and dry period from November to February and ahot, dry period from March to June (Cooper et al., 2006). The an-nual average temperature is moderately homogeneous, varying be-tween 26.6 �C in the Tagant and 30.8 �C in the lowland Aouakârsand sea (Hijmans et al., 2005). Annual precipitation has a north–south gradient, ranging from 98 mm in the northern desert areas
up to 884 mm in the southern savanna regions (Hijmans et al.,2005). Annual rains are scarce and seasonal, falling in a singlewet season from July to October, with most precipitation in Augustand September (Cooper et al., 2006; Ahmed et al., 2008). Highlandsare covered by sparse and poorly diversified desert steppe vegeta-tion (Tellería et al., 2008). Lowlands are covered by trees (usuallyAcacia nilotica) and marshlands that are used by sedentary farmersfor cultivation (Tellería et al., 2008). The land cover is composed inthe north by stony and sandy desert with dunes and in the southby croplands and shrubs, interspersed between annual and peren-nial grasses (Fensholt et al., 2009).
2.2. Field data
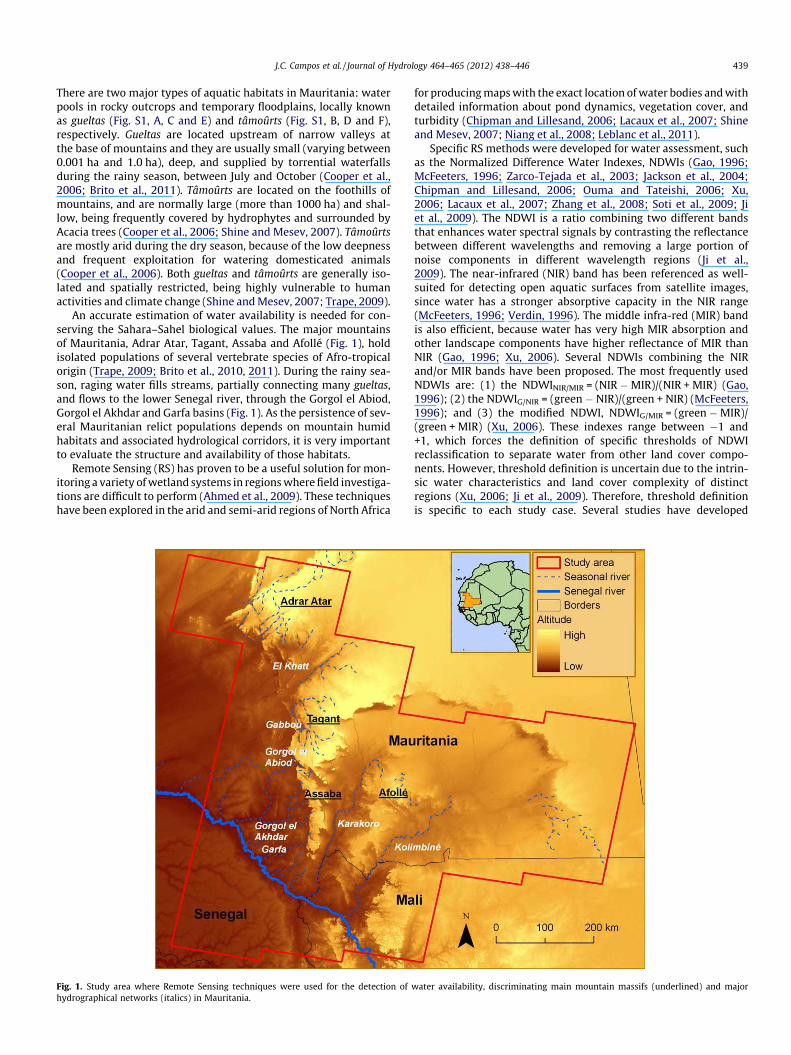
A total of 551 control points were collected during five field-work missions to Mauritania between 2007 and 2011, and sepa-rated in three classes according to water availability: (1)permanent water points, where water is yearly present (N = 34);(2) seasonal water points, where water is present at least in1 month of the year (N = 118); and (3) non-water points, wherewater is never available throughout the year, like rocky areas ordunes (N = 399) (Fig. 2). The classification of each site as perma-nent or seasonal was based on inquiries to local people and visualevaluation of likelihood of water availability. The difference be-tween sample sizes of the three classes reflects the water availabil-ity present in the study area: few locations with permanent wateravailable and vast areas where water is not available. The coordi-nates of the control points were gathered from a Global PositioningSystem (GPS) receptor, Trimble Nomad, on the datum WGS 1984UTM (Zone 29 N).
2.3. Remote sensing data
Satellite images from the Landsat 5 Thematic Mapper (TM)series were obtained through the Global Visualization Viewer(GLOVIS; http://glovis.usgs.gov/) of the United States Geological
Fig. 2. Distribution of permanent water, seasonal water, and non-water control points collected during five fieldwork campaigns to Mauritania.
440 J.C. Campos et al. / Journal of Hydrology 464–465 (2012) 438–446
Survey (USGS) (Table S1). One image per month, between 2001 and2010, for each of the 17 Landsat scenes of our study area was ana-lyzed (Fig. S2). Whenever cloud cover was higher than 10%, thetime series was completed with images from the Landsat 7 ETM+,also available at GLOVIS (Table S1). The final dataset comprised204 satellite images, with a spatial resolution of 30 m (Tables S1and S2). The Landsat images were georeferenced and atmosphericcorrected by the USGS (http://landsat.usgs.gov/). All analyses weredeveloped in the ArcGIS 9.3 software (ESRI, 2008) on the datumWGS 1984 UTM (Zone 29 N).
2.4. NDWI calculation
NDWIG/MIR, NDWINIR/MIR and NDWIG/NIR were calculated for eachimage using the Spatial Analyst extension for ArcGIS. After calcula-tions, 6 km edges were removed from each image in order to avoid
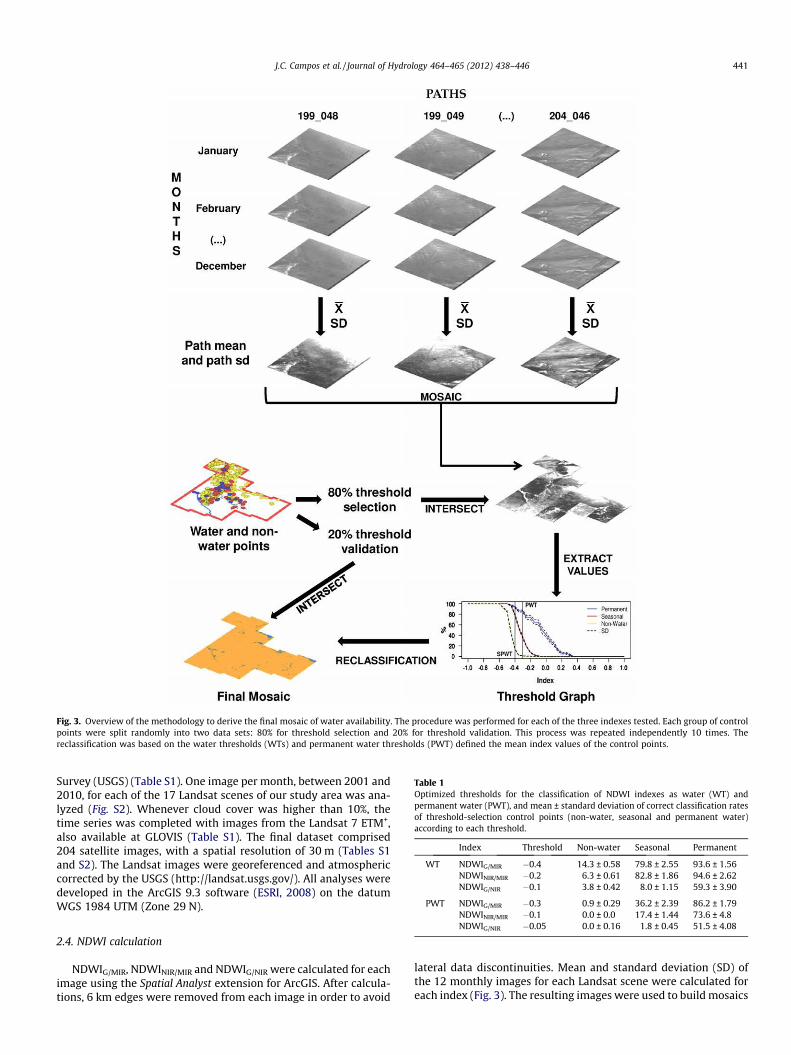
lateral data discontinuities. Mean and standard deviation (SD) ofthe 12 monthly images for each Landsat scene were calculated foreach index (Fig. 3). The resulting images were used to build mosaics
Fig. 3. Overview of the methodology to derive the final mosaic of water availability. The procedure was performed for each of the three indexes tested. Each group of controlpoints were split randomly into two data sets: 80% for threshold selection and 20% for threshold validation. This process was repeated independently 10 times. Thereclassification was based on the water thresholds (WTs) and permanent water thresholds (PWT) defined the mean index values of the control points.
Table 1
Optimized thresholds for the classification of NDWI indexes as water (WT) andpermanent water (PWT), and mean ± standard deviation of correct classification ratesof threshold-selection control points (non-water, seasonal and permanent water)according to each threshold.
Index Threshold Non-water Seasonal Permanent
WT NDWIG/MIR �0.4 14.3 ± 0.58 79.8 ± 2.55 93.6 ± 1.56NDWINIR/MIR �0.2 6.3 ± 0.61 82.8 ± 1.86 94.6 ± 2.62NDWIG/NIR �0.1 3.8 ± 0.42 8.0 ± 1.15 59.3 ± 3.90
PWT NDWIG/MIR �0.3 0.9 ± 0.29 36.2 ± 2.39 86.2 ± 1.79NDWINIR/MIR �0.1 0.0 ± 0.0 17.4 ± 1.44 73.6 ± 4.8NDWIG/NIR �0.05 0.0 ± 0.16 1.8 ± 0.45 51.5 ± 4.08
J.C. Campos et al. / Journal of Hydrology 464–465 (2012) 438–446 441
with mean and SD for the three indexes. Maximum values werechosen for overlapping areas during the construction of mosaics.
2.5. Threshold selection, NDWI performances and water maps
The control points were used to identify optimized thresholdsfor NDWI reclassification and to evaluate NDWI performances indistinguishing water/non-water and permanent/seasonal loca-tions. Firstly, control points were randomly assigned, using HawthsTools 3.27 (Beyer, 2004) extension for ArcGIS, into two data sets:80% for threshold selection (corresponding to 27, 94 and 319points of permanent, seasonal and non-water locations, respec-tively) and 20% for threshold validation (corresponding to 7, 24and 80 points of permanent, seasonal and non-water locations,respectively). The process of random selection was repeated togenerate 20 independent data sets (10 data sets for threshold-selection points, and 10 data sets for threshold-validation points).
Secondly, each data set of threshold-selection points were inter-sected with mean mosaics, using Hawths Tools (Fig. 3). Plots werederived depicting the average relative number of each of the threeclasses of threshold-selection points. Thirdly, profiles of averagecurves were used to identify two thresholds: (1) water threshold(WT), which discriminated pixels with water from those with nowater; and (2) permanent water threshold (PWT), which distin-guished pixels with permanent water from pixels with seasonalwater or no water. The WT corresponds to the mean NDWI valuethat maximizes the average number of water points and minimizesthe average number of non-water points on those pixels defined aswater by the WT. The PWT corresponds to the value that maxi-mizes the number of permanent water points and minimizes thenumber of seasonal water points on those pixels defined as perma-nent water by the PWT. Fourthly, mean mosaics were reclassifiedaccording to the identified WT and PWT thresholds into threeclasses of water availability: non-water, seasonal water and
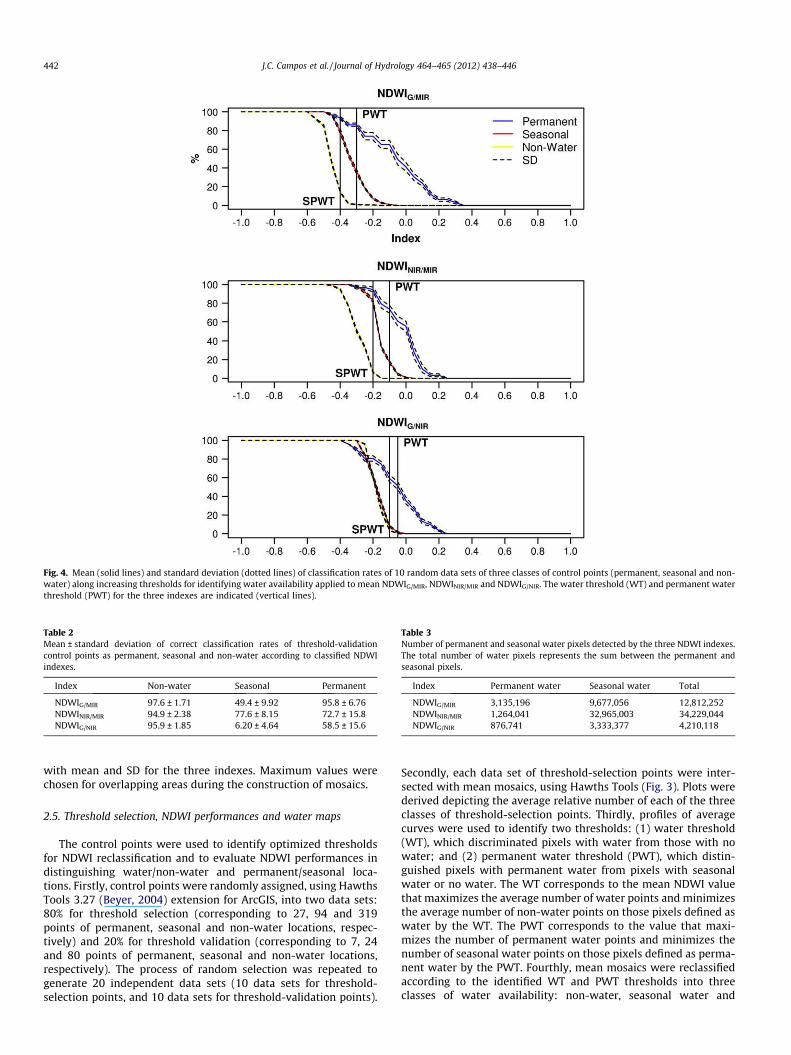
Fig. 4. Mean (solid lines) and standard deviation (dotted lines) of classification rates of 10 random data sets of three classes of control points (permanent, seasonal and non-water) along increasing thresholds for identifying water availability applied to mean NDWIG/MIR, NDWINIR/MIR and NDWIG/NIR. The water threshold (WT) and permanent waterthreshold (PWT) for the three indexes are indicated (vertical lines).
Table 2
Mean ± standard deviation of correct classification rates of threshold-validationcontrol points as permanent, seasonal and non-water according to classified NDWIindexes.
Index Non-water Seasonal Permanent
NDWIG/MIR 97.6 ± 1.71 49.4 ± 9.92 95.8 ± 6.76NDWINIR/MIR 94.9 ± 2.38 77.6 ± 8.15 72.7 ± 15.8NDWIG/NIR 95.9 ± 1.85 6.20 ± 4.64 58.5 ± 15.6
Table 3
Number of permanent and seasonal water pixels detected by the three NDWI indexes.The total number of water pixels represents the sum between the permanent andseasonal pixels.
Index Permanent water Seasonal water Total
NDWIG/MIR 3,135,196 9,677,056 12,812,252NDWINIR/MIR 1,264,041 32,965,003 34,229,044NDWIG/NIR 876,741 3,333,377 4,210,118
442 J.C. Campos et al. / Journal of Hydrology 464–465 (2012) 438–446
permanent water (Fig. 3). Finally, each data set of threshold-valida-tion points was intersected with reclassified water-maps (Fig. 3) tocalculate average percentages and standard deviations of correctclassification of each of the three classes of control points by thereclassified water maps.
The control points were also intersected with the SD mosaics toassess the index deviation for permanent, seasonal and non-waterlocations.
3. Results
3.1. Threshold selection and NDWI performances
The water (WT) and permanent water (PWT) thresholdsvaried between �0.05 and �0.40 (Table 1, Fig. 4). The identified
thresholds were coherent amongst the 10 data sets of threshold-selection control points, and the low standard deviation (SD) andsimilarity of profiles of curves confirmed the consistency of results(Fig. 4). All index values were low in non-water areas and in thethree data sets: 100% of non-water points had negative values.When the NDWIs reached a certain mean value, the profile fornon-water points decreased abruptly, followed by the decrease ofwater points, except for the NDWIG/NIR, for which non-water pointscollapsed in a similar way as the seasonal water points. Most of theseasonal points had small index values for the three NDWIs: for theNDWINIR/MIR and NDWIG/NIR, 96% and 98% of the seasonal pointshad values lower than �0.05, respectively, while for the NDWIG/MIR,97% of these points had values under �0.15. Except for NDWIG/NIR,the profile for seasonal points started to decrease when the per-centage of non-water points was below 50% (�0.45 for NDWIG/MIR
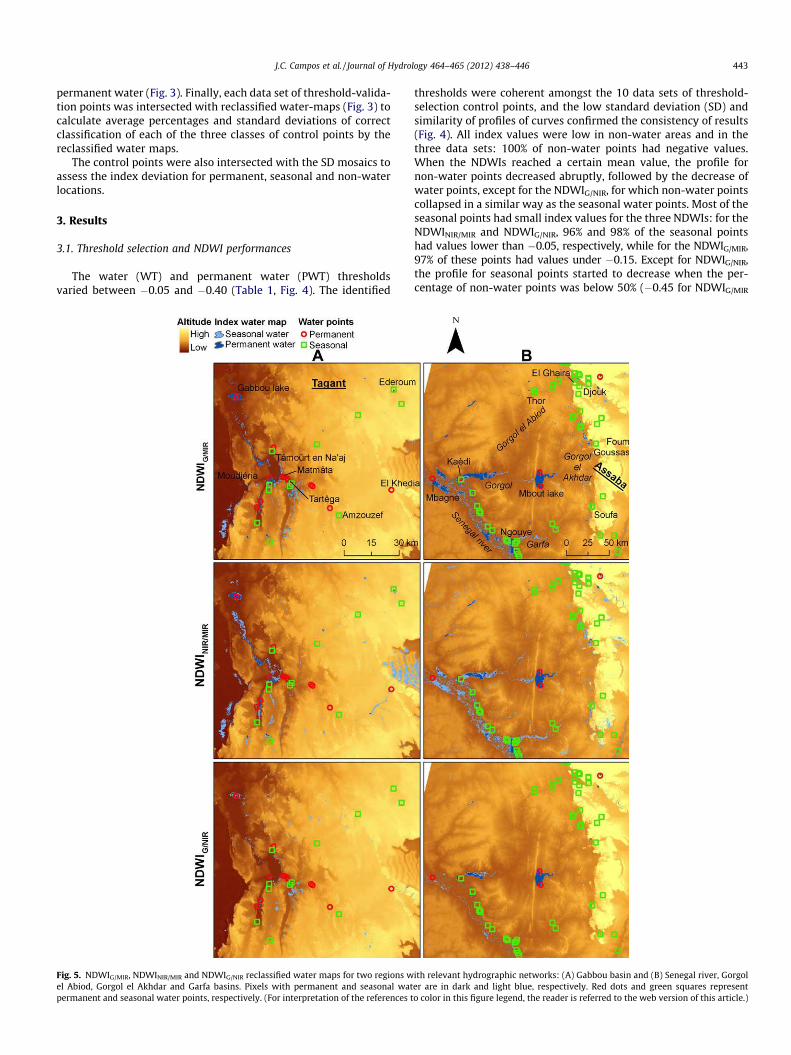
Fig. 5. NDWIG/MIR, NDWINIR/MIR and NDWIG/NIR reclassified water maps for two regions with relevant hydrographic networks: (A) Gabbou basin and (B) Senegal river, Gorgolel Abiod, Gorgol el Akhdar and Garfa basins. Pixels with permanent and seasonal water are in dark and light blue, respectively. Red dots and green squares representpermanent and seasonal water points, respectively. (For interpretation of the references to color in this figure legend, the reader is referred to the web version of this article.)
J.C. Campos et al. / Journal of Hydrology 464–465 (2012) 438–446 443
and �0.25 for NDWINIR/MIR). The permanent points had the highestindex values: at least 70% of permanent points had values greaterthan �0.20 in all indexes. The profile for permanent points de-creased smoothly, in comparison to the non-water and seasonalpoints, and descent peaks were found at higher index values:�0.20 in NDWINIR/MIR and NDWIG/NIR and �0.10 in NDWIG/MIR.
According to the 10 data sets of threshold-validation points, atleast 95% of non-water points were correctly classified by all in-dexes (Table 2). The highest correct classification rates and rela-tively low standard deviation of permanent and seasonal pointswere obtained with the NDWIG/MIR and NDWINIR/MIR, respectively,while the NDWIG/NIR had the lowest rates of correct classificationof water points, in both threshold-selection and -validation points(Tables 1 and 2).
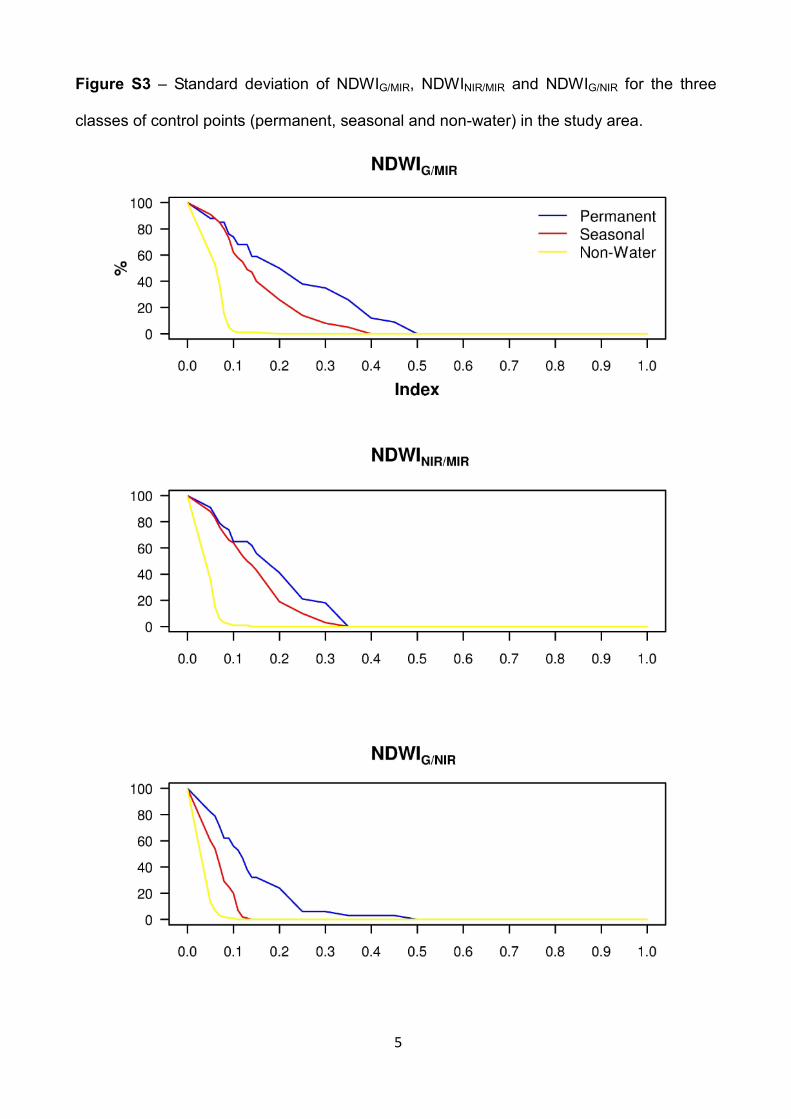
The profiles of curves depicting the percentage of control pointswith increasing NDWI standard deviations were concordant for allindexes (Fig. S3). In all cases, the non-water control points hadsmall deviations, while permanent points exhibited higher devia-tions. The seasonal points had intermediate deviations, and theprofiles of the curves were similar between seasonal and perma-nent points in the NDWIG/MIR and NDWINIR/MIR and between sea-sonal and non-water points in the NDWIG/NIR.
3.2. Water maps
The NDWINIR/MIR was the index that detected more pixels withwater followed by the NDWIG/MIR and by NDWIG/NIR, and theNDWIG/MIR was the index that detected more pixels with perma-nent water (Table 3). All NDWIs detected the Senegal river andother large water features, such as the M’bout lake, and detectedminimal water availability between the Assaba and Afollé moun-tains (Figs. 5, S4–S6). The NDWIG/MIR detected seasonal water inthe northern region, north of the Tagant and Adrar Atar, pixels withpermanent water along the eastern region, and practically nowater south of Senegal river (Fig. S4). The NDWINIR/MIR distin-guished a great part of the northern study area as seasonal water,including southern Adrar Atar and extreme southern portions ofthe study area, and detected permanent and seasonal water ineastern Mauritania (Fig. S5). In comparison to the other two in-dexes, the NDWIG/NIR detected fewer water pixels and only identi-fied permanent water in flat areas of north-eastern Tagant andSenegal river, while north-western Adrar Atar and some scatteredregions in the eastern part of the study area were identified as sea-sonal (Fig. S6).
In particular, the NDWIs performed differently in areas consid-ered as hydrologically important (Figs. 5, S4–S6). NDWIG/MIR andNDWINIR/MIR classified correctly the permanent Gabbou lake andother relevant gueltas of the Gabbou basin (Fig. 5A). However,the NDWINIR/MIR provided the most complete water map for thisbasin, identifying accurately the water streams flowing to the Gab-bou lake. The NDWIG/NIR offered an incomplete water map for thisarea, classifying the large-sized Gabbou lake (2500 ha) as seasonal.In the Djouk valley, the NDWIG/MIR detected more permanentwater bodies while the NDWINIR/MIR identified the large and sea-sonal tâmoûrts located at the foothills of Tagant and Assaba(Figs. S4 and S5B). The NDWIG/NIR had the worst results, detectingfew permanent pixels in the valley (Fig. S6B). The NDWIG/MIR de-tected the Senegal and lower Gorgol rivers and the M’bout lakeas permanent, but failed to detect other important water coursesconnecting with the Senegal river, such as the Gorgol el Akhdar,Gorgol el Abiod and Garfa rivers (Fig. 5B). The NDWINIR/MIR identi-fied these water courses in detail, especially the Garfa and the con-nection among M’bout lake and the lower Gorgol. The index alsoclassified M’bout, the Senegal river, and most of the lower Gorgolriver as permanent water. The NDWIG/NIR classified correctly theM’bout lake and the lower Gorgol and Senegal rivers as permanent,
but did not detect any water connecting these major hydrologicalcourses. Similar patterns among indexes were observed in theKarakoro basin (Figs. S4, S5 and S6D–E). The NDWINIR/MIR detectedmore water in this area, especially seasonal water in the lowerKarakoro. The NDWIG/MIR detected water in the upper and lowerKarakoro, but despite identifying more sites with permanentwater, it detected less hydrological connections than the NDWI-NIR/MIR in this basin. The NDWIG/NIR detected very few water pixels,failing in the classification of the entire Karakoro, despite classify-ing correctly the permanent lakes of Boubleïne and Kankossa.
4. Discussion
4.1. Sources of uncertainty
The restricted temporal resolution of Landsat satellites limitedthe selection of a complete time-series for the present work, whichprobably affected the accuracy of water variability (Jackson et al.,2004; Zhang et al., 2008). The satellite imagery covered areas out-side Mauritania, like north-eastern Senegal and south-westernMali, where control points were not available. Security reasons(Abdalla, 2009;Walther and Retaillé, 2010) also hampered the datacollection in eastern Mauritania. Therefore, caution is requiredwhile interpreting water availability estimations in these regions.
Despite the relevant contribution of Landsat satellites forextracting data from remote regions, the use of satellite imagerywith higher temporal resolution (e.g. MODIS satellite) could behelpful to improve the delineation quality of variable water sys-tems. However, high temporal resolution satellites have usuallylow spatial resolution, which could prevent the development of de-tailed water maps for hydrological significant areas.
4.2. Threshold selection and NDWI performances
The low values attributed to most of non-water points demon-strated that the three NDWIs are sensible to separatewater featuresfromdry areas. The control points assignednegative index values foralmost all seasonal points, an unexpected result given the theoreti-cal value for water features: waterP 0 (McFeeters, 1996). The soilsof these regions are composed by large proportions of silt, inducingwater streams to become muddy and loaded with suspended sedi-ments. Moreover, human activities in these dry regions, water-extraction for agriculture, domestic and cattle needs (Cooper et al.,2006), may also amplify water turbidity (Fig. S1). Therefore, pondsmay present similar traits to bared soils, which could lead to under-estimations (Lacaux et al., 2007). The short time availability of sea-sonal waters in Mauritania could be an additional explanation forthis fact. Since annual rains are scarce, the few months with avail-ablewatermaynot be representative for inducing a positive averagein the final mosaics. As expected, most of the permanent waterpoints hadpositiveNDWIs, indicating that thesemethods candetectcomplex hydrological streams and secondary permanent waters.
The standard deviation of the control points indicates thecoherency of the three water indexes. Non-water points had lowerdeviations, reflecting the continuous scarcity of water in theselocations. Seasonal sites, despite having higher deviations thannon-water locations, presented low index variability; probably be-cause these places are dry throughout most the year, having lim-ited spectral variances. Permanent water points showed highindex variability that may be related to annual variations of waterlevels, which affects water turbidity and reflectance (Lacaux et al.,2007; Soti et al., 2009). The great income of sediments brought byseasonal floods may also affect index variability.
The control points allowed setting and validating optimizedthresholds, and thus, evaluating the performance of NDWIs in
444 J.C. Campos et al. / Journal of Hydrology 464–465 (2012) 438–446
distinguishing water/non-water and seasonal/permanent water.Ground-validation has been referenced as a helpful method formonitoring water bodies in arid areas, allowing direct comparisonsbetween different indexes for identical situations and quantitativeassessments of relative NDWI performances (Soti et al., 2009). Inthe present study, NDWIG/NIR exhibited serious limitations indetecting water features, corroborating its inadequacy for precisewater delineation (Ouma and Tateishi, 2006; Xu, 2006; Soti et al.,2009). The NDWIG/MIR and NDWINIR/MIR had better performancesin separating water from non-water points, confirming the betteraccuracy of indexes that incorporate the MIR band (Ouma andTateishi, 2006; Ji et al., 2009; Soti et al., 2009). Similar results wereobtained by Soti et al. (2009) for the Sahelian region of northernSenegal. Authors concluded that indexes that combine the NIRand visible bands (NDWIG/NIR) are less efficient than indexes thatuse the MIR band for detecting water bodies in arid areas. How-ever, the present study reveals novel and interesting results. Infact, it was discovered that, for the Sahara–Sahel transition zone,different indexes that use the MIR band had dissimilar perfor-mances in detecting seasonal and permanent water. NDWIG/MIR
accomplished a better classification of permanent water whileNDWINIR/MIR detected seasonal water with more accuracy. Thecharacteristics of permanent waters may explain the better perfor-mance of NDWIG/MIR. These water features, usually correspondingto gueltas, are generally deep and have small amounts of sedimentsand vegetation, thus their reflective properties are closer to thetypical spectral reflectance of clear water (Lillesand et al., 2008).Permanent waters may have higher MIR absorptions and highergreen reflectance, being detected more precisely by NDWIG/MIR,while seasonal waters, usually corresponding to tâmoûrts, are shal-lower and surrounded by large vegetation. Suspended sedimentscould lead to underestimations of seasonal waters, but the pres-ence of vegetation may increase the performance of NDWINIR/MIR
in detecting these features. Given that vegetation has high reflec-tance of NIR than in MIR, seasonal waters with associated vegeta-tion will probably be identified by NDWINIR/MIR more accurately.On the contrary, vegetation has generally higher MIR thangreen reflectance (Lillesand et al., 2008), which should renderNDWIG/MIR as less appropriate for detecting seasonal waters sur-rounded with vegetation.
Different approaches with good performances in detecting vege-tation water content, such as the Normalized Difference VegetationIndex (NDVI), could also be useful for identifying seasonal water. Infact, Shine and Mesev (2007) proved that NDVI can detect seasonalwater, particularly tâmoûrts in Mauritania, since these are usuallyassociatedwith complex vegetation structures. However, some sea-sonal water features and most of the permanent water locations ofthese regions have no vegetation (e.g. permanent gueltas of Fig. S1,A, C and E). As such, NDVI would not be so precise in the detectionof these important water features. The combination of differentNDWI’s could be more effective for maximizing detection of waterwith different availabilities and different vegetation covers.
4.3. Water maps
NDWINIR/MIR was the index that detectedmore pixels with waterand it over-predicted water features over large areas of northernstudy area and in north-eastern Adrar Atar. The same trend was ob-served with NDWIG/MIR but to a lesser extent. Such biases wereprobably caused by shadow noises associated to the irregularityof sand dunes. Gao (1996) advised for possible overestimations byNDWIs due to shadow noise, arguing that the NDWIG/MIR performsbetter at suppressing this misleading component.
In the Sahelian regions of Senegal and Mali, large water areaswere overestimated by the NDWINIR/MIR. Given the southwards in-crease of average rainfall in the region, these areas are covered by
more complex structures of natural vegetation and composed bydistinct soil types (Foley et al., 2003; Frappart et al., 2009; Timouket al., 2009). Moist-soaked soils and abundant vegetation may havelead NDWINIR/MIR to detect these landscapes as water.
NDWIs revealed low water availability in the plains separatingthe mountains of Tagant–Assaba from Afollé, and the Adrar Atarfrom the southern mountains. The low availability along theKarakoro basin, that separates the Afollé from the Assaba, mightbe related to the geomorphological characteristics of the latermountain. The bend plateau of the Assaba declines to the west(Toupet, 1966), forcing most of the running water to drain west-ward and limiting water availability in the upper Karakoro basin.Only the lower Karakoro was detected accurately by NDWIG/MIR
and NDWINIR/MIR, probably due to the greater flow accumulationsnear the Senegal river. The gap between the Adrar Atar and thesouthern mountains corresponds to the permanently dry anddune-covered El Khatt river basin.
5. Conclusions
The extensive effort during five fieldwork campaigns to Mauri-tania allowed the collection of a major data set that was para-mount for achieving the main objectives of this work. Moreover,this data set provided useful information concerning water spatialdistribution in a region where the assessment of aquatic resourcesrepresents a major priority.
This study showed that independent threshold estimationmethods are essential for optimized classification of NDWIs giventhat indexes can generate distinct water maps for the same areas.The use of optimized thresholds for the Sahara–Sahel transitionzone in Mauritania revealed that indexes that combine the NIRand green bands (NDWIG/NIR) are less efficient for detecting waterbodies in arid areas, confirming previous results (Soti et al., 2009).On the other hand, indexes that use the MIR band (NDWINIR/MIR
and NDWIG/MIR) were most reliable in water detection and in thedistinction of water availability. It was also discovered that differ-ent indexes that use the MIR band can have dissimilar perfor-mances in detecting seasonal and permanent water. NDWINIR/MIR
was more sensible for detecting seasonal water despite significantoverestimations, while NDWIG/MIR provided accurate permanentwater estimations but less precise predictions of seasonal features.
The present work provided important information about thehydrological characteristics of the Sahara–Sahel transition zonein Mauritania, constituting framework data for future managementof important aquatic resources. The obtained results should betested and further analyzed on different study areas, in order toconfirm the distinct performances of NDWI’s in detecting differentwater availabilities. Moreover, the application of these techniquesin other Sahara–Sahel areas could be crucial for protecting its so-cial and economic values. The accurate water assessment is alsoneeded for protecting local biodiversity. NDWI’s should be usedin other mountain systems that hold several isolated species (e.g.Air mountains in Niger and Tibesti mountains in Chad), in orderto conserve the Sahara–Sahel biological values.
Acknowledgements
This study was partially supported by a Grant from NationalGeographic Society (8412-08) and by Fundação para a Ciência eTecnologia (PTDC/BIA-BEC/099934/2008) through the EU Pro-gramme COMPETE. NS and JCB are supported by FCT (SFRH/BPD/26666/2006 and Programme Ciência 2007, respectively). Logisticsupport for fieldwork was given by Pedro Santos Lda (TrimbleGPS), Off Road Power Shop, and P.N. Banc d’Arguin. D.V. Gonçalves,
J.C. Campos et al. / Journal of Hydrology 464–465 (2012) 438–446 445
F. Martínez-Freiría, P. Sierra, A.S. Sow, R. Vasconcelos, andZ. Boratynski helped in the fieldwork.
Appendix A. Supplementary material
Supplementary data associated with this article can be found, inthe online version, at http://dx.doi.org/10.1016/j.jhydrol.2012.07.042.
References
Abdalla, M.A., 2009. Understanding of the natural resource conflict dynamics. Thecase of Tuareg in North Africa and the Sahel. ISS Paper 194, Institute for SecurityStudies, South Africa.
Ahmed, A.O.C., Yasuda, H., Hattori, K., Nagasawa, R., 2008. Analysis of rainfallrecords (1923–2004) in Atar–Mauritania. Geofizika 25, 53–64.
Ahmed, M.H., Leithy, B.M., Thompson, J.R., Flower, R.J., Ramdani, R., Ayache, F.,Hassan, S.N., 2009. Application of remote sensing to site characterisation andenvironmental change analysis of North African coastal lagoons. Hydrobiologia622, 147–171.
Bader, J., Latif, M., 2011. The 1983 drought in the West Sahel: a case study. Clim.Dynam. 36, 463–472.
Beyer, H.L., 2004. Hawth’s Analysis Tools for ArcGIS. <http://www.spatialecology.com/htools>.
Brito, J.C., Álvares, F., Martínez-Freiría, F., Sierra, P., Sillero, N., Tarroso, P., 2010. Dataon the distribution of mammals from Mauritania, West Africa. Mammalia 74,449–455.
Brito, J.C., Martínez-Freiría, F., Sierra, P., Sillero, N., Tarroso, P., 2011. Crocodiles inthe Sahara desert: an update of distribution, habitats and population status forconservation planning in Mauritania. PLoS ONE 6, e14734.
Chipman, J.W., Lillesand, T.M., 2006. Satellite-based assessment of the dynamics ofnew lakes in southern Egypt. Int. J. Remote Sens. 28, 4365–4379.
Cooper, A., Shine, T., McCann, T., Tidane, T.A., 2006. An ecological basis forsustainable land use of Eastern Mauritanian wetlands. J. Arid Environ. 67, 116–141.
ESRI, 2008. Arcmap 9.3. Environmental Systems Research Institute, Inc., Redlands,California.
Fensholt, R., Rasmussen, K., Nielsen, T.T., Mbow, C., 2009. Evaluation of earthobservation based long term vegetation trends – intercomparing NDVI timeseries trend analysis consistency of Sahel from AVHRR GIMMS, Terra MODISand SPOT VGT data. Remote Sens. Environ. 113, 1886–1898.
Frappart, F., Hiernaux, P., Guichard, F., Mougin, E., Kergoat, L., Arjounin, M., Lavenu,F., Koité, M., Paturel, J.-E., Lebel, T., 2009. Rainfall regime across the Sahel bandin the Gourma region, Mali. J. Hydrol. 375, 128–142.
Foley, J.A., Coe, M.T., Scheffer, M., Wang, G., 2003. Regime shifts in the Sahara andSahel: interactions between ecological and climatic systems in Northern Africa.Ecosystems 6, 524–539.
Gao, B., 1996. NDWI—a normalized difference water index for remote sensing ofvegetation liquid water from space. Remote Sens. Environ. 58, 257–266.
Haas, E.M., Bartholomé, E., Combal, B., 2009. Time series analysis of optical remotesensing data for the mapping of temporary surface water bodies in sub-Saharanwestern Africa. J. Hydrol. 370, 52–63.
Hein, L., de Ridder, N., 2006. Desertification in the Sahel: a reinterpretation. Glob.Change Biol. 12, 751–758.
Hein, L., de Ridder, N., Hiernaux, P., Leemans, R., de Wit, A., Schaepman, M., 2011.Desertification in the Sahel: towards better accounting for ecosystem dynamicsin the interpretation of remote sensing images. J. Arid Environ. 75, 1164–1172.
Hijmans, R.J., Cameron, S.E., Parra, J.L., Jones, P.G., Jarvis, A., 2005. Very highresolution interpolated climate surfaces for global land areas. Int. J. Climatol. 25,1965–1978.
Jackson, T., Chen, D., Cosh, M., Li, F., Anderson, M., Walthall, C., Doriaswamy, P.,Hunt, E.R., 2004. Vegetation water content mapping using Landsat data derivednormalized difference water index for corn and soybeans. Remote Sens.Environ. 92, 475–482.
Ji, L., Zhang, L., Wylie, B., 2009. Analysis of dynamic thresholds for the NormalizedDifference Water Index. Photogram. Eng. Remote Sens. 75, 1307–1317.
Lacaux, J.P., Tourre, Y.M., Vignolles, C., Ndione, J.A., Lafaye, M., 2007. Classification ofponds from high-spatial resolution remote sensing: application to Rift ValleyFever epidemics in Senegal. Remote Sens. Environ. 106, 66–74.
Lebel, T., Ali, A., 2009. Recent trends in the Central and Western Sahel rainfallregime (1990–2007). J. Hydrol. 375, 52–64.
Leblanc, M., Lemoalle, J., Bader, J.-C., Tweed, S., Mofor, L., 2011. Thermal remotesensing of water under flooded vegetation: new observations of inundationpatterns for the ‘Small’ Lake Chad. J. Hydrol. 404, 87–98.
Lehner, B., Döll, P., 2004. Development and validation of a global database of lakes,reservoirs and wetlands. J. Hydrol. 296, 1–22.
Lillesand, T.M., Kiefer, R.W., Chipman, J.W., 2008. Remote Sensing and ImageInterpretation, sixth ed. John Wiley & Sons, New York.
McFeeters, S.K., 1996. The use of the Normalized Difference Water Index (NDWI) inthe delineation of open water features. Int. J. Remote Sens. 17, 1425–1432.
McNeely, J.A., 2003. Biodiversity in arid regions: values and perceptions. J. AridEnviron. 54, 61–70.
Niang, A.J., Ozar, A., Ozer, P., 2008. Fifty years of landscape evolution inSouthwestern Mauritania by means of aerial photos. J. Arid Environ. 72, 97–107.
Ouma, Y., Tateishi, R., 2006. A water index for rapid mapping of shoreline changes offive East African Rift Valley lakes: an empirical analysis using Landsat TM andETM+ data. Int. J. Remote Sens. 27, 3153–3181.
Schuol, J., Abbaspour, K.C., Srinivasan, R., Yang, H., 2008. Estimation of freshwateravailability in the West African sub-continent using the SWAT hydrologicmodel. J. Hydrol. 352, 30–49.
Shine, T., Mesev, V., 2007. Remote and GIS for ephemeral wetland monitoring andsustainability in southern Mauritania. In: Mesev, V. (Ed.), Integration of GIS andRemote Sensing. John Wiley & Sons Ltd., Chichester, pp. 269–289.
Soti, V., Tran, A., Bailly, J.-S., Puech, C., Seen, D.L., Bégué, A., 2009. Assessing opticalearth observation systems for mapping and monitoring temporary ponds in aridareas. Int. J. Appl. Earth Obs. Geoinf. 11, 344–351.
Tellería, J.L., Ghaillani, H.E.M., Fernández-Palacios, J.M., Bartolomé, J., Montiano, E.,2008. Crocodiles: Crocodylus niloticus as a focal species for conserving waterresources in Mauritanian Sahara. Oryx 42, 292–295.
Timouk, F., Kergoat, L., Mougin, E., Lloyd, C.R., Ceschia, E., Cohard, J.-M., de Rosnay,P., Hiernaux, P., Demarez, V., Taylor, C.M., 2009. Response of surface energybalance to water regime and vegetation development in a Sahelian landscape. J.Hydrol. 375, 178–189.
Toupet, C., 1966. Étude du milieu physique du massif de l’Assaba (Mauritanie).Introduction a la mise en valeur d’une région Sahélienne. Initiations et ÉtudesAfricaines, Institut Fondamental d’Afrique Noire, 20.
Trape, S., 2009. Impact of climate change on the relict tropical fish fauna of CentralSahara: threat for the survival of Adrar mountains fishes, Mauritania. PLoS ONE4, e4400.
Verdin, J.P., 1996. Remote sensing of ephemeral water bodies in Western Niger. Int.J. Remote Sens. 17, 733–748.
Walther, O., Retaillé, D., 2010. Sahara or Sahel? The fuzzy geography of terrorism inWest Africa. CEPS/INSTEAD.
Ward, D., 2009. The Biology of Deserts, firs ed. Oxford University Press, New York.Xu, H., 2006. Modification of normalised difference water index (NDWI) to enhance
open water features in remotely sensed imagery. Int. J. Remote Sens. 27, 3025–3033.
Zhang, W., Lu, Q., Gao, Z., Peng, J., 2008. Response of remotely sensed NormalizedDifference Water Deviation Index to the 2006 drought of eastern Sichuan Basin.Sci. China, Ser. D Earth Sci. 51, 748–758.
Zarco-Tejada, P., Rueda, C., Ustin, S., 2003. Water content estimation in vegetationwith MODIS reflectance data and model inversion methods. Remote Sens.Environ. 85, 109–124.
446 J.C. Campos et al. / Journal of Hydrology 464–465 (2012) 438–446
Supplementary data
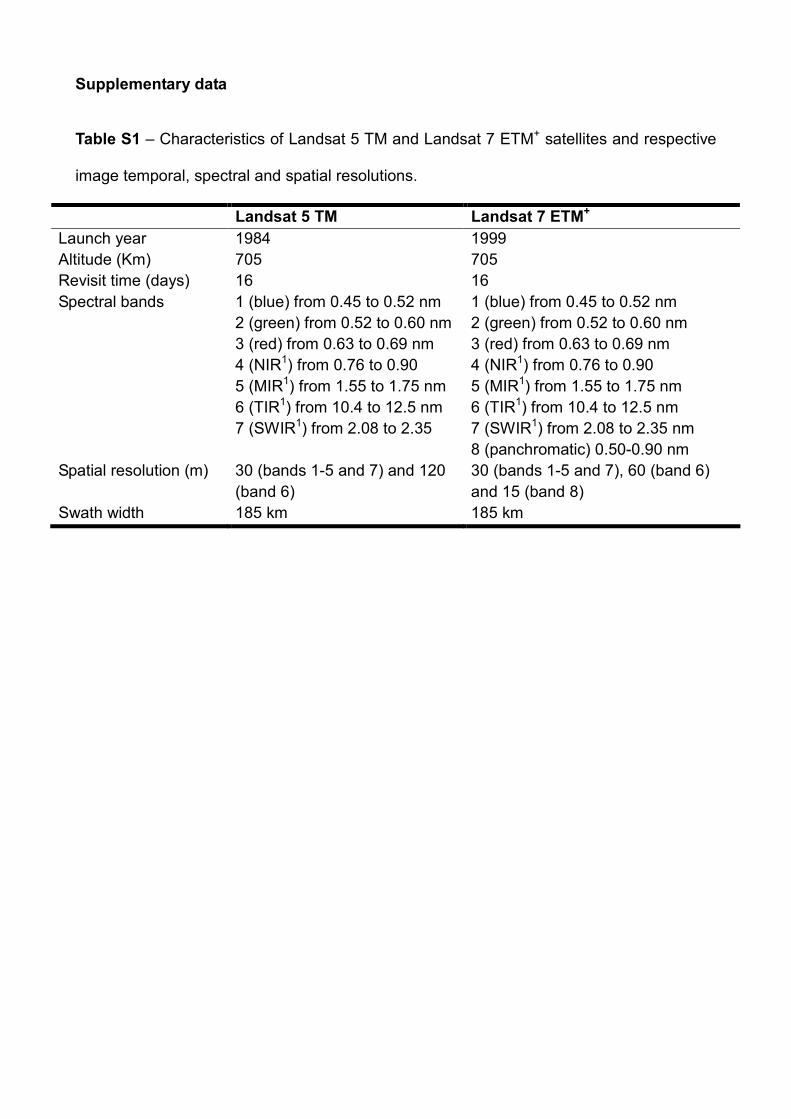
Table S1 – Characteristics of Landsat 5 TM and Landsat 7 ETM+ satellites and respective
image temporal, spectral and spatial resolutions.
Landsat 5 TM Landsat 7 ETM+
Launch year 1984 1999
Altitude (Km) 705 705
Revisit time (days) 16 16
Spectral bands 1 (blue) from 0.45 to 0.52 nm
2 (green) from 0.52 to 0.60 nm
3 (red) from 0.63 to 0.69 nm
4 (NIR1) from 0.76 to 0.90
5 (MIR1) from 1.55 to 1.75 nm
6 (TIR1) from 10.4 to 12.5 nm
7 (SWIR1) from 2.08 to 2.35
1 (blue) from 0.45 to 0.52 nm
2 (green) from 0.52 to 0.60 nm
3 (red) from 0.63 to 0.69 nm
4 (NIR1) from 0.76 to 0.90
5 (MIR1) from 1.55 to 1.75 nm
6 (TIR1) from 10.4 to 12.5 nm
7 (SWIR1) from 2.08 to 2.35 nm
8 (panchromatic) 0.50-0.90 nm
Spatial resolution (m) 30 (bands 1-5 and 7) and 120
(band 6)
30 (bands 1-5 and 7), 60 (band 6)
and 15 (band 8)
Swath width 185 km 185 km
2
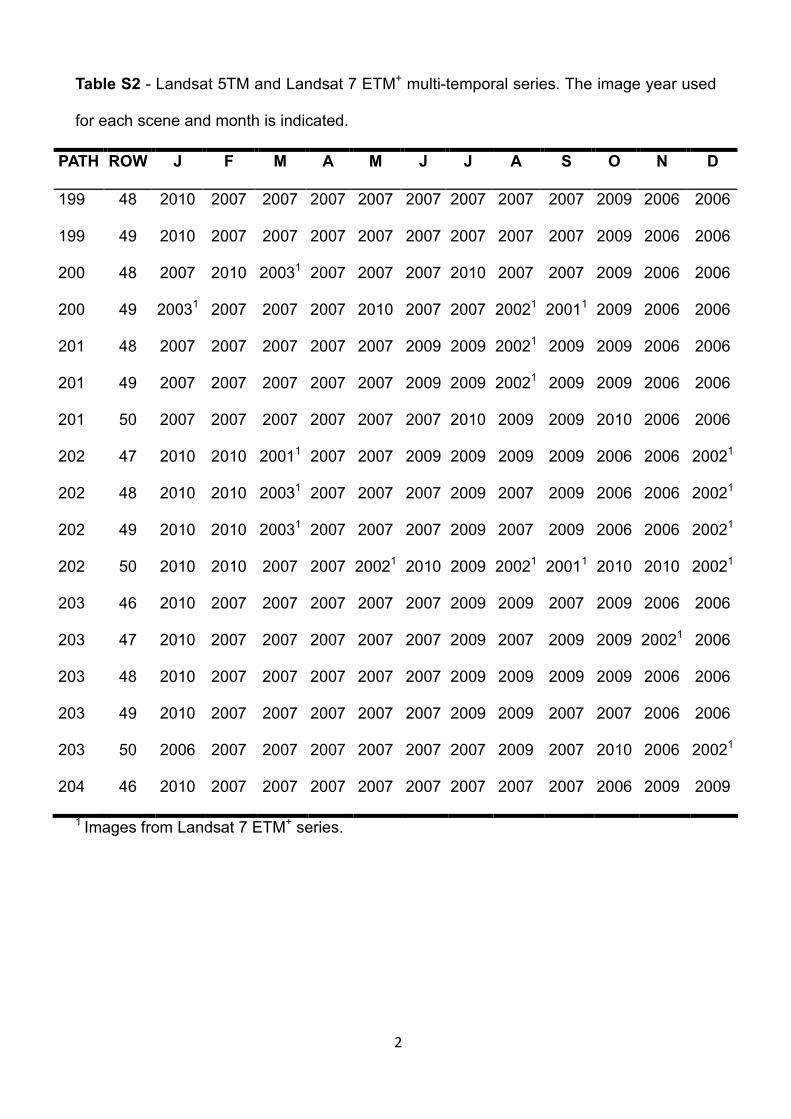
Table S2 - Landsat 5TM and Landsat 7 ETM+ multi-temporal series. The image year used
for each scene and month is indicated.
PATH ROW J F M A M J J A S O N D
199 48 2010 2007 2007 2007 2007 2007 2007 2007 2007 2009 2006 2006
199 49 2010 2007 2007 2007 2007 2007 2007 2007 2007 2009 2006 2006
200 48 2007 2010 20031 2007 2007 2007 2010 2007 2007 2009 2006 2006
200 49 20031 2007 2007 2007 2010 2007 2007 20021 20011 2009 2006 2006
201 48 2007 2007 2007 2007 2007 2009 2009 20021 2009 2009 2006 2006
201 49 2007 2007 2007 2007 2007 2009 2009 20021 2009 2009 2006 2006
201 50 2007 2007 2007 2007 2007 2007 2010 2009 2009 2010 2006 2006
202 47 2010 2010 20011 2007 2007 2009 2009 2009 2009 2006 2006 20021
202 48 2010 2010 20031 2007 2007 2007 2009 2007 2009 2006 2006 20021
202 49 2010 2010 20031 2007 2007 2007 2009 2007 2009 2006 2006 20021
202 50 2010 2010 2007 2007 20021 2010 2009 20021 20011 2010 2010 20021
203 46 2010 2007 2007 2007 2007 2007 2009 2009 2007 2009 2006 2006
203 47 2010 2007 2007 2007 2007 2007 2009 2007 2009 2009 20021 2006
203 48 2010 2007 2007 2007 2007 2007 2009 2009 2009 2009 2006 2006
203 49 2010 2007 2007 2007 2007 2007 2009 2009 2007 2007 2006 2006
203 50 2006 2007 2007 2007 2007 2007 2007 2009 2007 2010 2006 20021
204 46 2010 2007 2007 2007 2007 2007 2007 2007 2007 2006 2009 2009
1 Images from Landsat 7 ETM+ series.
3
Figure S1 – Examples of water features in Mauritania: A- rocky pool (guelta Soufa); B-
floodplain (tâmoûrt near Djouk valley); C,D- high levels of water turbidity associated to
water features in the region (guelta Matmâta and tâmoûrt Bougâri, respectively); E,D-
disturbance of water features by domesticated animals (guelta Tin Waadine and tâmoûrt
Bougâri, respectively).
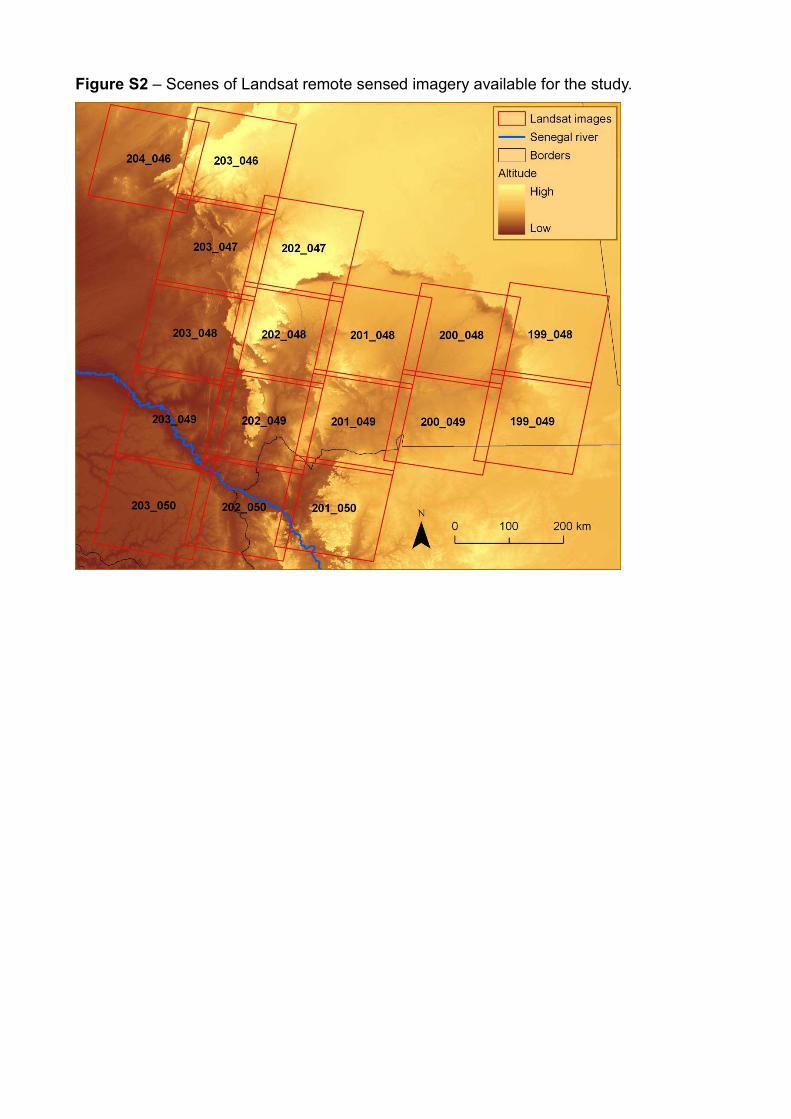
Figure S2 – Scenes of Landsat remote sensed imagery available for the study.
5
Figure S3 – Standard deviation of NDWIG/MIR, NDWINIR/MIR and NDWIG/NIR for the three
classes of control points (permanent, seasonal and non-water) in the study area.
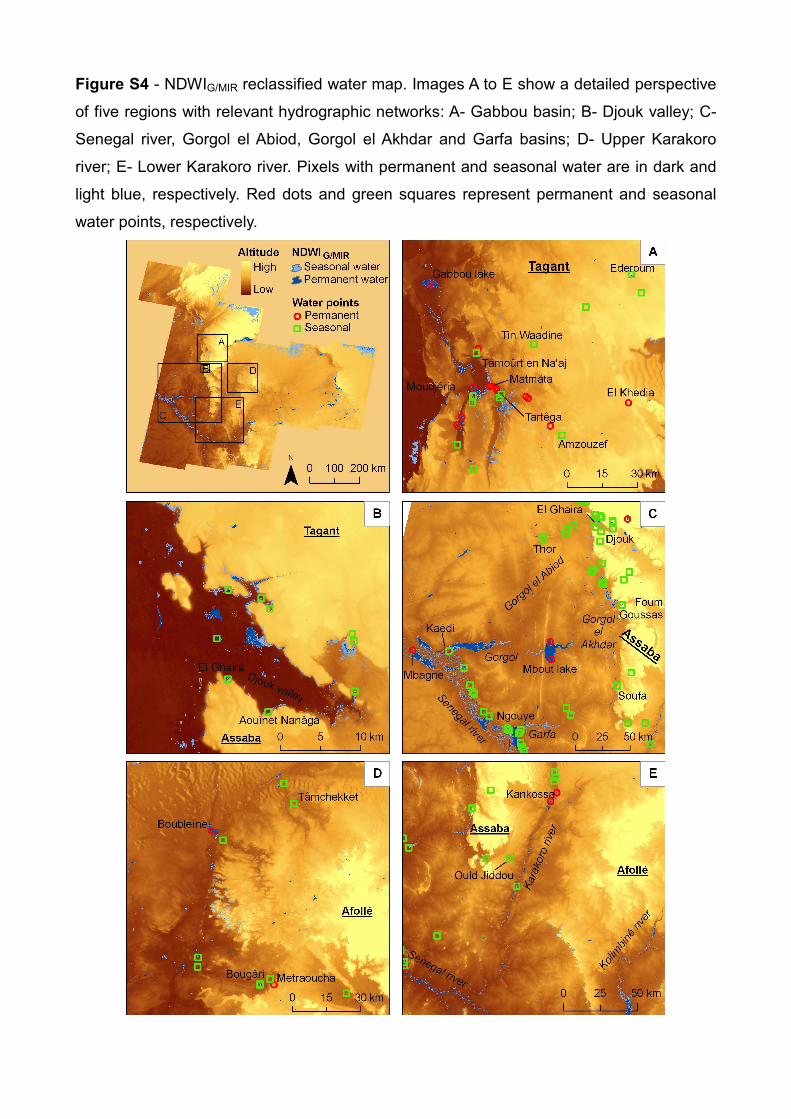
Figure S4 - NDWIG/MIR reclassified water map. Images A to E show a detailed perspective
of five regions with relevant hydrographic networks: A- Gabbou basin; B- Djouk valley; C-
Senegal river, Gorgol el Abiod, Gorgol el Akhdar and Garfa basins; D- Upper Karakoro
river; E- Lower Karakoro river. Pixels with permanent and seasonal water are in dark and
light blue, respectively. Red dots and green squares represent permanent and seasonal
water points, respectively.
7
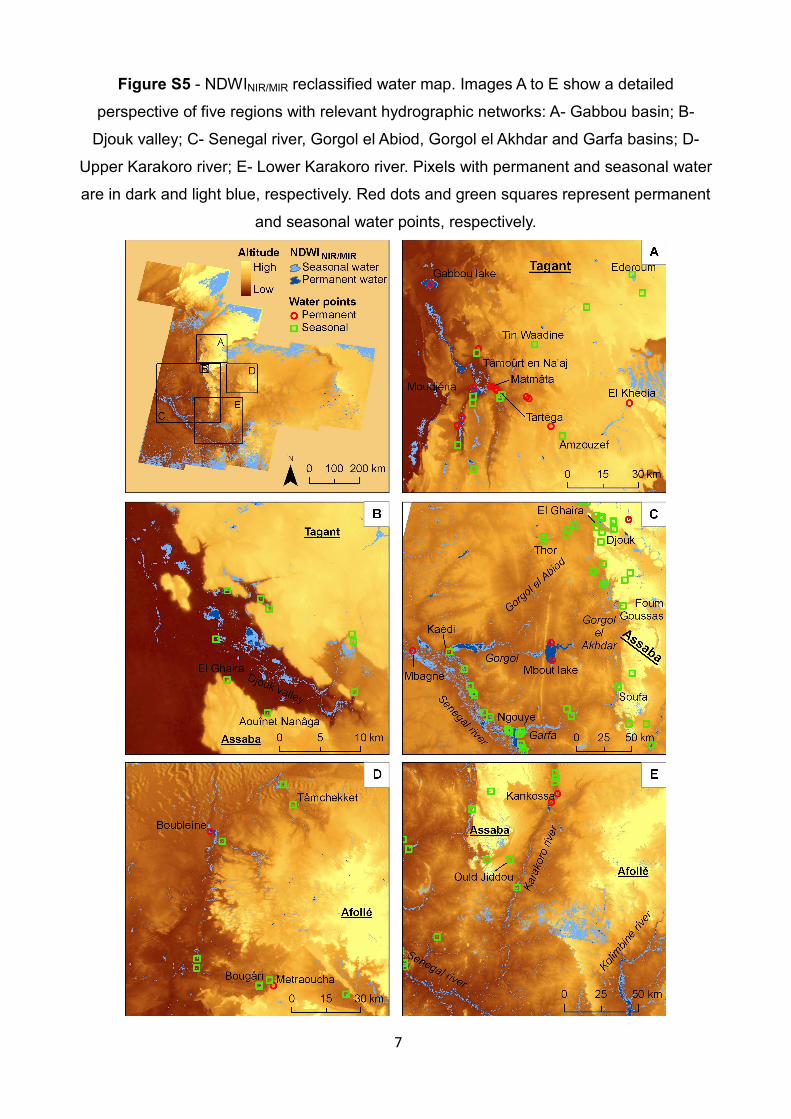
Figure S5 - NDWINIR/MIR reclassified water map. Images A to E show a detailed
perspective of five regions with relevant hydrographic networks: A- Gabbou basin; B-
Djouk valley; C- Senegal river, Gorgol el Abiod, Gorgol el Akhdar and Garfa basins; D-
Upper Karakoro river; E- Lower Karakoro river. Pixels with permanent and seasonal water
are in dark and light blue, respectively. Red dots and green squares represent permanent
and seasonal water points, respectively.
8
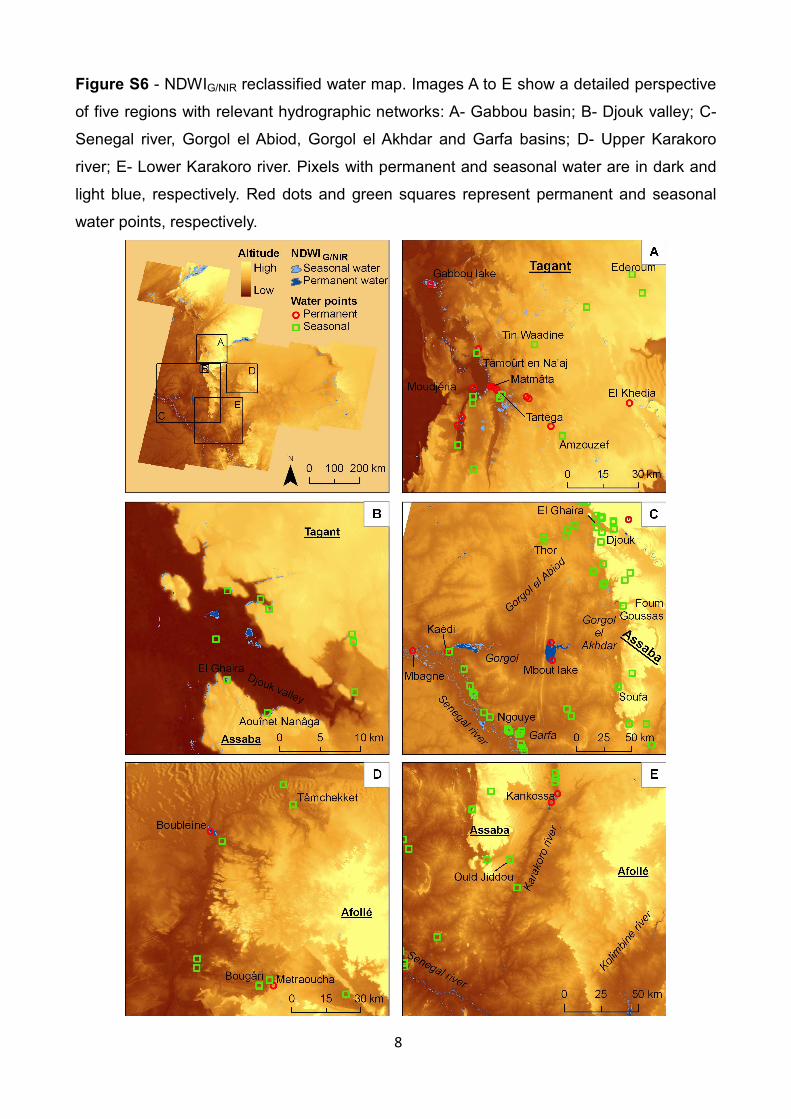
Figure S6 - NDWIG/NIR reclassified water map. Images A to E show a detailed perspective
of five regions with relevant hydrographic networks: A- Gabbou basin; B- Djouk valley; C-
Senegal river, Gorgol el Abiod, Gorgol el Akhdar and Garfa basins; D- Upper Karakoro
river; E- Lower Karakoro river. Pixels with permanent and seasonal water are in dark and
light blue, respectively. Red dots and green squares represent permanent and seasonal
water points, respectively.
Copyright © 2022 FDOKUMEN