Nonlinear refraction and absorption: mechanisms and magnitudes
141
Nonlinear refraction and absorption: mechanisms and magnitudes Demetrios N. Christodoulides, 1 Iam Choon Khoo, 2 Gregory J. Salamo, 3 George I. Stegeman, 1, * and EricW. Van Stryland 1 1 College of Optics and Photonics, Center for Research in Optics and Lasers, University of Central Florida, 4000 Central Florida Boulevard, Orlando, Florida 32816, USA 2 Department of Electrical Engineering, 121 Electrical Engineering East, Pennsylvania State University, University Park, Pennsylvania 16802, USA 3 Department of Physics, University of Arkansas, 226 Physics Building, 825 West Dickson Street, Fayetteville,Arkansas 72701, USA * Corresponding author: [email protected] Received August 6, 2009; revised October 27, 2009; accepted October 27, 2009; published January 26, 2010 (Doc. ID 115416) We provide an in-depth treatment of the various mechanisms by which an inci- dent light beam can produce an intensity- or flux-dependent change in the re- fractive index and absorption coefficient of different materials. Whenever pos- sible, the mechanisms are initially traced to single-atom and -molecule effects in order to provide physical understanding. Representative values are given for the various mechanisms. Nine different mechanisms are discussed, starting with the Kerr effect due to atoms and/or molecules with discrete states, includ- ing organic materials such as molecules and conjugated polymers. Simplified two and/or three-level models provide useful information, and these are sum- marized. The nonlinear optics of semiconductors is reviewed for both bulk and quantum-confined semiconductors, focusing on the most common types II–VI and III–V.Also discussed in some detail are the different nonlinear mechanisms that occur in liquid crystals and photorefractive media. Additional nonlinear material systems and mechanisms such as glasses, molecular reorientation of single molecules, the electrostrictive effect, the nuclear effect (vibrational con- tributions), cascading, and the ever-present thermal effects are quantified, and representative tables of values are given. © 2010 Optical Society of America OCIS codes: 190.4720, 160.4330. 1. Introduction............................................... 62 2. Nonlinearities Involving Transitions between Discrete Molecular States.................................................... 65 2.1. Two-Level Model in Isotropic Media........................ 68 2.2. Onset of Saturation of Electronic Transitions.................. 72 2.3. Summary of the Two-Level Model.......................... 74 2.4. Conjugated Molecules and Polymers........................ 76 Advances in Optics and Photonics 2, 60–200 (2010) doi:10.1364/AOP.2.000060 60 1943-8206/10/010060-141/$15.00 © OSA
Transcript of Nonlinear refraction and absorption: mechanisms and magnitudes

Nm
DG1
o
2
S
3
8
*
Rp
12
A
onlinear refraction and absorption:echanisms and magnitudes
emetrios N. Christodoulides,1 Iam Choon Khoo,2 Gregory J. Salamo,3
eorge I. Stegeman,1,* and Eric W. Van Stryland1
College of Optics and Photonics, Center for Research in Optics and Lasers, Universityf Central Florida, 4000 Central Florida Boulevard, Orlando, Florida 32816, USA
Department of Electrical Engineering, 121 Electrical Engineering East, Pennsylvaniatate University, University Park, Pennsylvania 16802, USA
Department of Physics, University of Arkansas, 226 Physics Building,25 West Dickson Street, Fayetteville, Arkansas 72701, USA
Corresponding author: [email protected]
eceived August 6, 2009; revised October 27, 2009; accepted October 27, 2009;ublished January 26, 2010 (Doc. ID 115416)
We provide an in-depth treatment of the various mechanisms by which an inci-dent light beam can produce an intensity- or flux-dependent change in the re-fractive index and absorption coefficient of different materials. Whenever pos-sible, the mechanisms are initially traced to single-atom and -molecule effectsin order to provide physical understanding. Representative values are given forthe various mechanisms. Nine different mechanisms are discussed, startingwith the Kerr effect due to atoms and/or molecules with discrete states, includ-ing organic materials such as molecules and conjugated polymers. Simplifiedtwo and/or three-level models provide useful information, and these are sum-marized. The nonlinear optics of semiconductors is reviewed for both bulk andquantum-confined semiconductors, focusing on the most common types II–VIand III–V. Also discussed in some detail are the different nonlinear mechanismsthat occur in liquid crystals and photorefractive media. Additional nonlinearmaterial systems and mechanisms such as glasses, molecular reorientation ofsingle molecules, the electrostrictive effect, the nuclear effect (vibrational con-tributions), cascading, and the ever-present thermal effects are quantified, andrepresentative tables of values are given. © 2010 Optical Society of America
OCIS codes: 190.4720, 160.4330.
. Introduction. . . . . . . . . . . . . . . . . . . . . . . . . . . . . . . . . . . . . . . . . . . . . . . 62
. Nonlinearities Involving Transitions between Discrete MolecularStates. . . . . . . . . . . . . . . . . . . . . . . . . . . . . . . . . . . . . . . . . . . . . . . . . . . . 652.1. Two-Level Model in Isotropic Media. . . . . . . . . . . . . . . . . . . . . . . . 682.2. Onset of Saturation of Electronic Transitions. . . . . . . . . . . . . . . . . . 722.3. Summary of the Two-Level Model. . . . . . . . . . . . . . . . . . . . . . . . . . 74
2.4. Conjugated Molecules and Polymers. . . . . . . . . . . . . . . . . . . . . . . . 76dvances in Optics and Photonics 2, 60–200 (2010) doi:10.1364/AOP.2.000060 601943-8206/10/010060-141/$15.00 © OSA

34
56
7
891
1R
A
2.5. Charge Transfer Molecules. . . . . . . . . . . . . . . . . . . . . . . . . . . . . . . . 852.6. Miscellaneous Molecules. . . . . . . . . . . . . . . . . . . . . . . . . . . . . . . . . 912.7. Excited-State Absorption and Reverse Saturable Absorption. . . . . 93
. Glass Nonlinearities. . . . . . . . . . . . . . . . . . . . . . . . . . . . . . . . . . . . . . . . . 97
. Semiconductor Nonlinearities. . . . . . . . . . . . . . . . . . . . . . . . . . . . . . . . . 1014.1. Carrier-Related Nonlinearities (Excitation and De-Excitation of
Carriers). . . . . . . . . . . . . . . . . . . . . . . . . . . . . . . . . . . . . . . . . . . . . . 1044.1a. Bulk (3D) Semiconductors. . . . . . . . . . . . . . . . . . . . . . . . . . . 1044.1b. Active Nonlinearities (with Gain). . . . . . . . . . . . . . . . . . . . . . 110
4.2. Ultrafast Passive Nonlinearities (Kerr Effect etc.). . . . . . . . . . . . . . 1124.3. Low-Dimensional Semiconductors. . . . . . . . . . . . . . . . . . . . . . . . . . 117
4.3a. Quantum Wells. . . . . . . . . . . . . . . . . . . . . . . . . . . . . . . . . . . . 1214.3b. Quantum Dots. . . . . . . . . . . . . . . . . . . . . . . . . . . . . . . . . . . . . 1244.3c. Summary for Quantum Confinement Structures. . . . . . . . . . . 134
. Nuclear (Vibrational) Contributions to n2. . . . . . . . . . . . . . . . . . . . . . . . 135
. Molecules with Anisotropic Polarizabilities. . . . . . . . . . . . . . . . . . . . . . . 1386.1. Single-Molecule Reorientation of Anisotropic Molecules. . . . . . . . 1396.2. Liquid Crystals. . . . . . . . . . . . . . . . . . . . . . . . . . . . . . . . . . . . . . . . . 141
6.2a. Orientational Optical Nonlinearities of Nematic LiquidCrystals. . . . . . . . . . . . . . . . . . . . . . . . . . . . . . . . . . . . . . . . . . 143
6.2b. Giant Orientational Optical Nonlinearities in DopedNematic Liquid Crystals. . . . . . . . . . . . . . . . . . . . . . . . . . . . . 148
6.2c. Field-Assisted Photorefractivity in Nematic LiquidCrystals. . . . . . . . . . . . . . . . . . . . . . . . . . . . . . . . . . . . . . . . . . 149
6.2d. Optical Nonlinearities Associated with Order ParameterChanges, and Thermal and Density Effects. . . . . . . . . . . . . . 152
. Photorefractive Nonlinearities. . . . . . . . . . . . . . . . . . . . . . . . . . . . . . . . . 1567.1. Diffusion Nonlinearity. . . . . . . . . . . . . . . . . . . . . . . . . . . . . . . . . . . 158
7.1a. Diffusion-Induced Two-Wave Mixing. . . . . . . . . . . . . . . . . . . 1597.1b. Diffusion Effects on Beam Propagation. . . . . . . . . . . . . . . . . 161
7.2. Screening Photorefractive Nonlinearity. . . . . . . . . . . . . . . . . . . . . . 1627.2a. Physical Origins of the Screening Photorefractive
Nonlinearity. . . . . . . . . . . . . . . . . . . . . . . . . . . . . . . . . . . . . . . 1627.2b. Self-Trapped Beams—Screening Photorefractive Solitons. . 165
7.3. Photovoltaic Nonlinearity. . . . . . . . . . . . . . . . . . . . . . . . . . . . . . . . . 1667.4. Photorefractive Nonlinearities Due to dc Kerr Effects. . . . . . . . . . . 168
. Electrostrictive Effect. . . . . . . . . . . . . . . . . . . . . . . . . . . . . . . . . . . . . . . . 168
. Thermo-optic Effect. . . . . . . . . . . . . . . . . . . . . . . . . . . . . . . . . . . . . . . . . 1710. Cascading Nonlinearity. . . . . . . . . . . . . . . . . . . . . . . . . . . . . . . . . . . . . 17310.1. Local Cascading. . . . . . . . . . . . . . . . . . . . . . . . . . . . . . . . . . . . . . . . 17310.2. Nonlocal Cascading. . . . . . . . . . . . . . . . . . . . . . . . . . . . . . . . . . . . . 175
1. Conclusions. . . . . . . . . . . . . . . . . . . . . . . . . . . . . . . . . . . . . . . . . . . . . . 180eferences. . . . . . . . . . . . . . . . . . . . . . . . . . . . . . . . . . . . . . . . . . . . . . . . . . . 182
dvances in Optics and Photonics 2, 60–200 (2010) doi:10.1364/AOP.2.000060 61

Nm
DG
1
Ntatcuitwennlf
Tbt−cnsitiptsftapuc
An
A
onlinear refraction and absorption:echanisms and magnitudes
emetrios N. Christodoulides, Iam Choon Khoo, Gregory J. Salamo,eorge I. Stegeman, and Eric W. Van Stryland
. Introduction
onlinear processes occur in abundance in nature. Optics is of course no excep-ion, and nonlinearities are inevitable. At high input optical intensities, there isn intensity-dependent change in a material’s refractive index, frequently linkedo an intensity-dependent absorption change. (Note that here we adopt the moreommonly used term “intensity” rather than “irradiance” to describe light innits of power/area.) Nonlinear index and absorption changes play the key rolen many important nonlinear phenomenon such as all-optical switching or soli-on generation; they may be harmless artifacts, for example, in degenerate four-ave mixing, or they may be deleterious, for example, in second-harmonic gen-
ration or parametric mixing. Nonlinear absorption is the key phenomenon inonlinear spectroscopy. It is surprising that, given the important role of suchonlinear effects, the relevant information is scattered throughout the scientificiterature and there is no review of the different physical phenomena responsibleor these effects.
he intensity-dependent refractive index n2�I�, where I is the intensity, is definedy �n=n2�I�I. Historically n2�I� was first defined for the Kerr effect in terms ofhe sum of the real part of the third-order electronic susceptibilities ��3��−� :� ,� ,��+��3��−� :� ,−� ,��+��3��−� :� ,� ,−��. In this case, the indexhange is local and effectively instantaneous so that �n=n2I. This electroniconlinearity has proved very useful for probing different nonlinear interactions,ince many problems can be solved analytically with this particular form for thendex change. However, in addition to the Kerr effect there is a myriad of addi-ional physical mechanisms that also lead to an intensity-dependent refractivendex change. Many of them depend on the state of the matter that is beingrobed optically, e.g., polymer, semiconductor, liquid crystal, or glass. In this tu-orial review we discuss the physics of these mechanisms and derive, where pos-ible, formulas that link index change to intensity, and we provide typical valuesor the intensity-dependent refractive index coefficients and the characteristicimes that it takes to produce the index change when an optical field is turned onnd the decay time when the field is turned off. In order to achieve these goals, itroved useful in this review to first describe the pertinent physics of some of thenique states of matter such as conjugated polymers, semiconductors, liquidrystals, and photorefractive (PR) materials.
lthough a principal goal of this paper is to discuss the relevant physical mecha-
isms that give rise to an intensity-dependent refractive index and absorption, indvances in Optics and Photonics 2, 60–200 (2010) doi:10.1364/AOP.2.000060 62

telmctfmmcop
T
Teo
IcStatwstoatre(
Iddotic
A
he final analysis it is necessary to evaluate these pertinent nonlinear coefficientsxperimentally. First, the very parameters that enter into expressions for the non-inearity require experimental determination. Second, although many nonlinearechanisms can be described on a single-molecule level, the transition to the
ondensed matter phase is not very precise because of intermolecular interac-ions, collisions, local field effects, etc. Therefore, although many of the grosseatures, such as location of maxima, symmetry relations, and a first-order esti-ate of dispersion with frequency, can be obtained successfully from single-olecule theories, ultimately experimental measurements of nonlinear coeffi-
ients, most specifically in this case the nonlinear refractive index, are needed inrder to interpret data and accurately predict phenomena. Nonlinear optics isrimarily an experimental discipline!
he nonlinear mechanisms to be discussed in this review are listed below:
1. Nonlinearities involving transitions between discrete molecular states2. “Glass” nonlinearities3. Semiconductor nonlinearities4. Nuclear (vibrational) contributions to n2.5. Molecules with anisotropic polarizabilities
(a) Molecular reorientation(b) Liquid crystals
6. Photorefractive effects7. Electrostriction8. Thermal nonlinearities9. Cascading of second-order nonlinearities
his list is arranged to be approximately in order of increasing time constants,xcept for cascading, which is a special case. Note that some of the mechanismsccur in all materials, and others are material specific.
n Section 2, nonlinear refraction and absorption due to transitions between dis-rete states in matter, principally dielectric and organic media, are explored.ince the general case is very complicated, the formulas are reduced, assuming a
wo-level system, to analytical formulas for the nonlinearity near and on the one-nd two-photon resonances; off resonance, in which case the damping term inhe resonance denominators is set to zero; and finally in the nonresonant limit, inhich the photon frequency is ignored relative to the resonance frequencies as-
ociated with the transitions. Insights into some general properties of nonlineari-ies gained from applying a two-level model are summarized. In addition, sincerganic molecules are classical systems with discrete energy levels, the physicsnd magnitudes of their nonlinearities are reviewed. Included are polyenes andheir polymerized counterparts, i.e., conjugated polymers, a variety of symmet-ic and asymmetric charge transfer molecules, and the special cases of dendrim-rs. Finally, the phenomena of excited state and reverse saturable absorptionRSA) are discussed with illustrative examples.
n Section 3 the nonlinearities of glasses are briefly discussed. They are basicallyiscrete energy level systems broadened to overlap between states by the ran-om, amorphous, disordered nature of a glass. Although the focus is primarilyn fused silica, for which the dispersion in n2 is well known and highly relevanto communications fibers, the effect on the nonlinearities of adding various ox-des is summarized. To date, the largest nonlinearities have been obtained inhalcogenide glasses whose absorption edge is in the near infrared.
dvances in Optics and Photonics 2, 60–200 (2010) doi:10.1364/AOP.2.000060 63

Ssltlcpftfmetmqio
Si
ScmetitisdsFcea
P(recnenT
Spao
Ttp
A
ection 4 deals with semiconductors, which exhibit the largest and best under-tood range of physical phenomena responsible for different nonlinearities. Theargest nonlinearities arise from the absorption of light with the consequentransfer of an electron from the valence to conduction bands. Even larger non-inearities, but over a narrow spectral range, occur as a result of bleaching of ex-iton states located in the bandgap below the conduction band. The effects of ap-lying active pumping of electrons from the valence band to conduction bandsollowed by stimulated emission reverses the sign of the nonlinearities and leadso nonlinear gain rather than loss. The different effects that lead to nonlinearitiesor photon energies below the bandgap are summarized next. The analytical for-ulas derived in this spectral region are shown to be in excellent agreement with
xperiment. Finally, the results for nonlinearities of the confinement of electronso two (quantum wells), one (quantum wires) and zero (quantum dots, QDs) di-ensions are reviewed. Evidence is presented for modest enhancements in
uantum wells (factor of 2–3). However, it is clear that in most QD systems stud-ed to date there is no clear measurable enhancement except perhaps for GaAs inne case, in which an order of magnitude enhancement has been reported.
ection 5 reviews the nonlinearity obtained from coupling to vibrational modesn matter. The contributions are of the order of a few tens of percent in glasses.
ection 6 deals with the reorientation of anisotropic molecules, individually orollectively, and the resulting contributions to nonlinear phenomena. For singleolecules, the dipoles induced by an optical field tend to align the large mol-
cule polarizability axis with the field, creating a refractive index anisotropy inhe liquid state. In liquid crystals, intermolecular forces lead to collective behav-or. This results in a spectrum of nonlinearites due to absorption and resultingemperature changes, which reduce the size of the aligned regions and hence thenduced index change. If the liquid crystal molecules are anchored at the sampleurfaces, the application of electric fields results in molecular reorientation withistance into the sample or a field-dependent threshold for decoupling from theurface anchoring. Both cases lead to an intensity-dependent refractive index.inally, doping a liquid crystal with dye molecules that undergo structuralhanges (trans-cis isomerization) on light absorption can disrupt collective ori-ntation in liquid crystals, resulting in huge nonlinearities. All of these effectsre discussed in Section 6.
hotorefractive media, explored in Section 7, are another source of very largeand usually very slow) nonlinearities. Their physics involves absorption thataises an electron from a donor state to the conduction band, the motion of thatlectron either due to diffusion or applied fields, and then retrapping in an ac-eptor state some distance from the initial absorption. This process introducesonlocality and electric fields due to the charge separation, which, via thelectro-optic effect, yield index changes. The nonlocality is responsible for aumber of different phenomena such as beam fanning and two-beam coupling.hese processes are quantified, and typical numbers are given.
ection 8 contains information on the electrostrictive effect, which always com-resses a material along the field direction. This effect, although relatively slownd small, leads to acoustic wave generation, which, depending on sample ge-metry, can cause spurious effects on the light beam.
he thermo-optic effect (described in Section 9) arises because of beam absorp-ion, followed by changes in sample temperature and hence index changes. De-ending on the time scale of measurements of the nonlinearity and the magni-
dvances in Optics and Photonics 2, 60–200 (2010) doi:10.1364/AOP.2.000060 64

teg
Tcsilog
S
2D
Tlmdssaeasttcit
Topbtleeasoge
abwg
A
ude of the material absorption coefficient, this can be the dominant nonlinearffect. The decay time scale of the index change is slow and depends on beameometry and the material’s thermal properties.
he last contribution to nonlinear effects that mimic nonlinear absorption andhanges in index proportional to intensity occurs owing to the cascading ofecond-order nonlinearities. This can occur at the molecular level (local cascad-ng) or on propagation coincident with the generation of new frequencies (non-ocal cascading). The latter can lead to large effects, especially if the second-rder process is near a phase-match condition, for example, in second-harmoniceneration. These effects are described in Section 10.
ome concluding remarks are given in Section 11.
. Nonlinearities Involving Transitions betweeniscrete Molecular States
he physical origin of nonlinearities involving transitions between discrete mo-ecular states is the electric dipole interaction between the electrons in atoms andolecules and an electromagnetic field (see standard textbooks such as [1,2] for
etailed discussions). Electrons are excited from the ground state to excitedtates via the product of three or more electric fields, which can be either theame or different electric fields. This changes the electron distribution in thetom or molecule, and hence the polarization induced by the field has a nonlin-ar component that is proportional to the product of three fields. The proportion-lity is calculated from first-order perturbation theory and described in theingle-isolated-molecule limit by the sum of three different third-order suscep-ibilities �ijkl
�3� , which are functions of the electric dipole transition elements be-ween electronic states and the permanent dipole moments in the ground and ex-ited states. In the condensed matter limit pertinent to nonlinear optics, thenteractions are described by the sum of three different third-order susceptibili-ies �ijkl
�3� derived from the molecular susceptibilities.
he starting point for a calculation of�ijkl�3� is the isolated-single-molecule third-
rder susceptibility �ijkl�3� . For detailed discussions see [1]. (In this tutorial review,
arameters associated with single isolated molecules are identified with an over-ar.) From a combination of repeated applications of first-order perturbationheory, the method of averages approach to deal with divergences, limiting theight–matter interaction to electric dipole coupling, assuming that the molecule’slectrons are initially in the ground state, and limiting the interaction to a singlelectron excitation per molecule, the third-order molecular susceptibility �ijkl
�3� forrbitrary input frequencies �p, �q, and �r is given below by Eq. (2.1). For detailsee the classic paper by Orr and Ward [3]. Here both summations, each over allf the molecular excited states v, m, and n [see Fig. 1(a)] specifically exclude theround state g (as indicated by the superscript �); i.e., they are taken over thexcited states only. Furthermore, the energy separation between states, for ex-
mple m and n, is written as Em− En=��mn, and the transition dipole momentetween these states is given by µ�mn. The permanent dipole moment in state m isritten as µ�mm. Usually finite excited state lifetimes for the excited state to theround state are added phenomenologically by making �mn complex for the ex-
dvances in Optics and Photonics 2, 60–200 (2010) doi:10.1364/AOP.2.000060 65

cq
T
(a
A
ited states, i.e., �ng→ �ng− i�ng. Note that subsequent to Eq. (2.1) �ng is a realuantity:
�ijkl�3� �− ��p + �q + �r�;�p,�q,�r�
=1
�0�3 �
v,n,m�� µgv,i�µ�n,l − µgg,l��µnm,k − µgg,k�µmg,j
���g − �p − �q − �r���ng − �q − �p���mg − �p�
+µgv,j�µvn,k − µgg,k��µnm,i − µgg,i�µmg,l
���g* + �p���ng
* + �q + �p���mg − �r�
+µgv,l�µvn,i − µgg,i��µnm,k − µgg,k�µmg,j
���g* + �r���ng − �q − �p���mg − �p�
+µgv,j�µ�n,k − µgg,k��µnm,l − µgg,l�µmg,i
���g* + �p���ng
* + �q + �p���mg* + �p + �q + �r�
�−
1
�0�3 �
n,m�� µgn,iµng,lµgm,kµmg,j
��ng − �p − �q − �r���ng − �r���mg − �p�
+µgn,iµng,lµgm,kµmg,j
��mg* + �q���ng − �r���mg − �p�
+µgn,lµng,iµgm,jµmg,k
��ng* + �r���mg
* + �p���mg − �q�
+µgn,lµng,iµgm,jµmg,k
��ng* + �r���mg
* + �p���ng* + �p + �q + �r�
� . �2.1�
Figure 1
a) Schematic of the electronic energy levels for a molecule; g is the ground statend m, v, and n are arbitrary excited states. Transition diagrams for (b) ��3�
�−� ;� ,� ,−��, (c) ��3��−� ;� ,−� ,��, and (d) ��3��−� ;−� ,� ,��.
his is called the “sum over states” equation, typically abbreviated S.O.S. The
dvances in Optics and Photonics 2, 60–200 (2010) doi:10.1364/AOP.2.000060 66

ue+�fa
Ib+
iiacsntMantiE�tc
Fattsts
A
sual notation is used in which the frequency of the field affected by the nonlin-ar interaction ��p+�q+�r� appears as the first argument in �ijkl
�3� �−��p+�q
�r� ;�p ,�q ,�r� and the input interacting fields have frequency components�p,
q, and �r. Note that in this notation all of the fields can be±with the negativerequency components corresponding to the complex conjugate of the fields, whichre written as
Ej,inc�r�,t� =1
2Ej���e−i�t + c.c. =
1
2Ej���ei�k�·r�−�t� + c.c. �2.2�
f the medium of interest is a dilute gas of molecules so that molecules can stille considered isolated, the macroscopic third-order susceptibility �ijkl
�3� �−��p
�q+�r� ;�p ,�q ,�r� is given by
�ijkl�3� �− ��p + �q + �r�;�p,�q,�r� = N�ijkl
�3� �− ��p + �q + �r�;�p,�q,�r� ,
�2.3�
n which N is the number of molecules per unit volume. However, the principalnterest in n2,el is for condensed matter in which both intermolecular interactionsnd the electromagnetic fields generated by the dipoles induced at the site of a spe-ific molecule by neighboring molecules are important. (See standard textbooksuch as [1,2] for detailed discussions.) The former can lead to changes in the reso-ances and the lifetimes of the electrons in excited states, whereas the latter results inhe local field at a molecule being different from those fields obtained from
axwell’s equations. (Solving the standard boundary conditions for input beams atsample’s interfaces yields the Maxwell fields in the medium of interest.) Unfortu-ately, there is no truly satisfactory way for calculating the local field correction tohe Maxwell fields. One usually resorts to the approximate Lorenz–Lorenz relationn which each of the incident (Maxwell) fields associated with �p, �q, and �r, i.e.,
j��p�, Ek��q�, and El��r� is multiplied by ��jr��p�+2� /3, ��k
r��q�+2� /3, and�l
r��r�+2� /3, respectively, to approximate the local field. Here �jr��p�=nj
2��p� ishe relative dielectric constant for light polarized along the j axis, x in the currentase. Thus, in condensed matter,
�ijkl�3� �− ��p + �q + �r�;�p,�q,�r� = Nf �3��ijkl
�3� �− ��p + �q + �r�;�p,�q,�r� ,
f �3� = ��ir��p + �q + �r� + 2
3��j
r��p� + 2
3��k
r��q� + 2
3��l
r��r� + 2
3.
�2.4�
ocusing the discussion to a single input field of frequency � with polarizationlong the x axis of the material, there are three separate pathways to n2,el, illus-rated in Figs. 1(b)–1(d), that affect the field at this frequency. Thus there will behree different susceptibilities �xxxx
�3� and a total of 24 separate terms needed to de-cribe the nonlinear interaction for each summation over the excited states.The elec-ronic nonlinear refractive index coefficient n2,el is then defined in terms of the these
usceptibilities bydvances in Optics and Photonics 2, 60–200 (2010) doi:10.1364/AOP.2.000060 67

w
wtt
Ttcdtliedretpfztc
2
Emionmm
A
n2,el =1
4nx2�0c
�R,xxxx�3� �− �;�,− �,�� + �R,xxxx
�3� �− �;�,�,− ��
+ �R,xxxx�3� �− �;− �,�,��� =
3
4nx2�0c
�R,xxxx�3� �− �;�,− �,�� , �2.5a�
here
�R,xxxx�3� �− �;�,− �,�� =
1
3�R,xxxx
�3� �− �;�,− �,�� + �R,xxxx�3� �− �;�,�,− ��
+ �R,xxxx�3� �− �;− �,�,��� ——→
nonresonant,�→0
= �R,xxxx�3� �− �;�,− �,�� = �R,xxxx
�3� �− �;�,�,− ��
= �R,xxxx�3� �− �;− �,�,�� , �2.5b�
here the subscripts R and I refer to the real and imaginary parts of ��3�, respec-ively. This index change is accompanied by an intensity-dependent change inhe absorption defined by �=2�I�I with
2,el =�
2nx2�0c
2�I,xxxx
�3� �− �;�,− �,�� + �I,xxxx�3� �− �;�,�,− ��
+ �I,xxxx�3� �− �;− �,�,��� . �2.5c�
he spectral breadth of an optical spectrum, for example, the absorption spec-rum, is related to just the radiative lifetime of the excited state only in specialircumstances [1,2]. In the formulas above it has been assumed that the decay isue to coupling to the ground state, which results in homogeneous broadening ofhe susceptibilities. However, there are other possible contributions to the stateifetime, especially in dense gases or condensed matter. These typically lead tonhomogeneous broadening of spectral lines and a variety of line shapes differ-nt from those given above. Examples are intermolecular forces, collisions inense gases, and additional decay channels involving virtual states. It is prima-ily when a multiple of the incident photon energies approximately equals thenergy difference between the ground and an excited state that the responseakes on the simple form used above. Because of the multiple decay mechanismsossible, the results of the S.O.S. approach, which considers only a single,requency-independent lifetime, cannot in principle be used in the so-called theero-frequency limit, although it is frequently used successfully in comparinghe magnitude of nonlinearities in families of molecules in the field of theoreti-al chemistry [4].
.1. Two-Level Model in Isotropic Media
ven without the above considerations on excited state lifetimes, the above for-ulas for the general third-order susceptibility are quite complicated, since they
nvolve multiple summations over all of the excited states. However, a great dealf physical insight can be obtained from a simple two-level model with one reso-ant frequency �10 for a single input beam (x polarized for example) in three com-on limits. In fact, a single dominant one-photon transition is a very useful approxi-
ation in many molecules for the interaction of radiation with that molecule.dvances in Optics and Photonics 2, 60–200 (2010) doi:10.1364/AOP.2.000060 68

O
pcemlmt
Tt−�
Ar
F
(=c
F
�
A
f the 24 terms that need to be evaluated in the general case, only 2 contain two-
hoton terms of the form ���10±2��2+ ��10/2�2� due to �µ10�2�µ11− µ00�2, andlearly only the resonance at �10 2� gives rise to an enhanced two-photon nonlin-arity. That is, a molecule must have a nonzero difference in its permanent dipoleoments, which rules out two-photon effects in symmetric molecules in the two-
evel approximation. (Two-photon effects solely due to dipole active transition mo-ents between states occur in a three-level model of molecules of arbitrary symme-
ry!)
he remaining 22 terms contain terms of the form ���10±��2+ ��10/2�2�m inheir denominator with m=1,2 ,3. These terms arise owing to both �µ10�2�µ11
µ00�2 and �µ10�4 interactions. Clearly in those cases enhancement only occurs when¯ 10 �.
ll of the terms were evaluated numerically for �10 � and �10 2�, and theesults are summarized in Figs. 2 and 3.
Figure 2
requency dispersion in the normalized (multiplied by ��10/2�3) (a) n2��� and
b) 2��� for the contributions due to �µ10�4 for � �10. Here �10=1, �10/20.01.The exact and approximate (formulas in text) curves for n2,el��� and2,el���oincide.
Figure 3
requency dispersion in the normalized (multiplied by ��10/2�3) n2��� and
2��� for the contributions due to �µ10�2�µ11− µ00�2 for 2�� �10. Here, �10=1 and¯
10/2=0.01.
dvances in Optics and Photonics 2, 60–200 (2010) doi:10.1364/AOP.2.000060 69

H
pocm aitdw
O
O
Hceb
O
N
A
ere, only the frequency dispersion terms are given and these have been multi-
lied in the numerator by ��10/2�3 to produce dominant terms of order unity for thene-photon resonance case. In the curves labeled “exact” all of the terms were in-luded, and it was assumed for simplicity that �µ10�2�µ11− µ00�2= �µ10�4. In brief sum-ary, near the one-photon resonances almost complete cancellation occurred ��10
��, although the individual contributions to the �µ10�2�µ11− µ00�2 terms were large,nd the net results were 4–5 orders of magnitude smaller than the leading �µ10�4 term,.e., negligible unless �µ11− µ00� is of the order of 25 or greater.And in all cases it washe triple resonance, m=3, term associated with ��3��−� ;� ,−� ,�� [Fig. 1(b)] thatominated the response. Based on these numerical results, approximate formulasere obtained for n2,el and 2,el and are given below:
n and near resonance ��10� �10�
ne-photon resonance: �� !�− �10 !�5�10�:
n2,el � −1
4nx2�0c
N
�0�3f �3��µ10�4
2��10 − �����10 − ��2 −�10
2
4
���10 − ��2 +�10
2
43
, �2.6a�
2,el � −�
2nx2�0c
2
N
�0�3f �3��µ10�4
�10��10 − ���2�10��10 − �� +�10
2
4
�10���10 − ��2 +�10
2
43
.
�2.6b�
owever, off resonance, for which the contribution of �10 in the denominatorsan be neglected, the contributions of all 24 different terms become comparable, andxactly equal in the�→0 limit. Exact formulas appropriate to these cases are givenelow.
ff-resonance �� !�− �10� �10�:
n2,el =Nf �3�
4nx2�0
2c�3� �µ10�2�µ11 − µ00�212�10
��102 − �2���10
2 − 4�2�−
�µ10�44�10
��102 − �2�3
�3�102 + �2�� ,
�2.7a�
2,el =N
2nx2�0c
2�3
�2�10�10
��102 − �2�3
f �3���µ10�2�µ11 − µ00�2104�4 − 25�10
2 �2 − 7�104
��102 − 4�2�2
+ �µ10�44�3�2 − �10
2 �
��102 − �2� �. �2.7b�
¯
onresonant (limit �→0, i.e., �10�2�):dvances in Optics and Photonics 2, 60–200 (2010) doi:10.1364/AOP.2.000060 70

N
Sra
T
Ti
�
TeS
kfi
Rkmoqcfhi
Fttc
A
n2,el = 3Nf�3�
nx2�0
2c�3�103
�µ10�2�µ11 − µ00�2 − �µ10�4� . �2.7c�
ote the interference between the �µ10�2�µ11− µ00�2 and �µ10�4 terms.
imilar calculations were for the frequency region �10 2� with results summa-ized in Fig. 3. Here only the �µ10�2�µ11− µ00�2 term has a resonance. Given below arepproximate formulas for both for n2,el and 2,el.
wo-photon resonance �� !�− �10/2 !�5�10�:
n2,el �1
4nx2�0c
N
�0�3f �3��µ10�2�µ11 − µ00�2� 8���10 − 2�� − � �10
2
2�10
��10
2 ���10 − 2��2 + � �10
2�2� ,
�2.8a�
2,el ��
2nx2�0c
2
N
�0�3f �3��µ10�2�µ11 − µ00�2� 4�10
�102 ���10 − 2��2 + � �10
2�2�.
�2.8b�
he difference between the exact and the approximate curves for the dispersionn n2,el shown in Fig. 3 results from the neglect of the term with the denominator
��10+2��2+ ��10/2�2� in the approximate formula.
he question of “nonresonant” susceptibilities merits further comment. The lit-rature is replete with measurements of n2 that are claimed to be “nonresonant.”uch claims are frequently erroneous and most likely refer to off-resonance. The
ey consideration is usually whether both ��10−��� �10 and �10�� are satis-ed for a measurement to be in the nonresonant regime.
ecall that light of a given frequency can propagate with a specific wave vector� for a given frequency and direction in one of two orthogonally polarized eigen-
odes. The refractive index of one of these eigenmodes can be changed by itswn high intensity as discussed above and/or by an intense beam of the same fre-uency but with orthogonal polarization. Furthermore, the index can also behanged by a beam at a different frequency of either polarization. And, unless therequencies of interest are clearly in the nonresonant regime, each of these canave different numerical values and different dispersion with frequency, even insotropic media.
or an amorphous isotropic material the symmetry relations for ��3� lead directlyo n2�,el�−�a ;�a�= 2
3n2�,el�−�a ;�a� at any frequency�a, where the polarization ofhe index change of interest is identified by � and the orthogonal one inducing the
hange by �. In the nonresonant regime (only), the nonlinear refractive index co-dvances in Optics and Photonics 2, 60–200 (2010) doi:10.1364/AOP.2.000060 71

e==d
Fns
In
2
Intatnisls
Aspt
Tt
i
asWtw
He
A
fficient at �a by a copolarized beam of frequency �b is n2�,el�−�a ;�b�2n2�,el�−�a ;�a� and by an orthogonally polarized beam is n2�,el�−�a ;�b�43n2�,el�−�a ;�a�. Unfortunately, in the literature there is frequently no distinction
rawn between these different coefficients and they are assumed to be equal.
or crystalline media, the relations can be much more complex. The pertinentonzero ��3� coefficients for crystalline media can be found in textbooks (seetandard textbooks such as [1,2]).
n this review we focus primarily on the frequency degenerate case
2�,el�−�a ;�a�, usually written as n2 for convenience.
.2. Onset of Saturation of Electronic Transitions
n the preceding section the results for n2,el were based on the assumption that aegligible fraction of electrons were excited out of the ground state (subscript g) intohe excited states Nm, implying that Ng �N in the ground state; i.e., Ng is effectivelyconstant. This is, however, an approximation, especially in spectral regions charac-
erized by strong absorption, i.e., � �mg for some state m where Nm can becomeonnegligible. Since ��p�� �Ng−Nm�, where p is an integer, this leads to a decreasen the magnitude of ��p� from its value with negligible population in the excitedtates. More important, for Nm→Ng /2 it also leads to a saturation effect for theinear absorption at �, which over some time scales mimics the Kerr ��3� and hasometimes been interpreted as ��3� ,��5� ,��7�, etc. Here we discuss only effective
2 due to saturation, 2,sat, the contribution that is linear in the intensity.
gain we resort to the two-level model to quantify this effect in the simplest pos-ible case. As stated previously, the two-level model can yield a very good ap-roximation, since frequently the largest transition dipole moment occurs fromhe ground state to just a single excited state we have labeled m.
he linear susceptibility ��1� for electric-dipole transitions from the ground tohe mth excited state is given by
�xx�1��− �;�� =
�Ng − Nm�
��0
�µmg�2f �1��mg − � + i�mg/2
��mg − ��2 + �mg2 /4
, �2.9�
n which f�1� = ��r���+2� /3 is the local field correction. The excited state decays
symptotically to the ground state with relaxation time mg= �mg−1 , and it is as-
umed that the decay to all other excited states occurs over much longer times.hen a cw beam of intensity I��� illuminates the material, the time dynamics of
he ground and dominant excited state, under the assumption that both are onlyeakly coupled to other states, is given by
d
dtNm = B�Ng − Nm��f �1��2I��� −
Nm
mg
,
d
dtNg = − B�Ng − Nm��f �1��2I��� +
Nm
mg
. �2.10�
ere B is the Einstein coefficient. In the steady state, for small population of the
xcited state and N=Ng+Nm, the leading term for the population difference isdvances in Optics and Photonics 2, 60–200 (2010) doi:10.1364/AOP.2.000060 72

S
c
T
w�
Fcsa
A
TiFerc
Iepl2pNatc
A
Ng − Nm �N
1 + I���/Isat���. �2.11�
ince the first of Eqs. (2.10) can be rewritten in terms of the linear absorption
oefficient, this saturation intensity Isat��� is defined in terms of B by
1
Isat���=
B�f�1��2
�mg
1��� =kvac
2��nx��0
�f�1��3�µmg�21
��mg − ��2 + �mg2 /4
.
�2.12�
herefore for small values of I��� / Isat���
�xx,eff�1� �− �;�� =
N
��0
f�1��µmg�2�mg − � + i�mg/2
��mg − ��2 + �mg2 /4
1 − I���/Isat���� ,
�2.13�
hich now contains an intensity-dependent contribution of a form similar ton=n2,elI.
or input intensities approaching Isat���, the linear susceptibility (and hence theontribution to the refractive index) is reduced, i.e., the oscillator strength of the tran-ition is bleached out.The nonlinear term ��I� is written as �sat
�3��−� ;� ,−� ,�� withreal part �
R,sat�3� �−� ;� ,−� ,��, which gives
n2,sat =�R,eff
�3� �− �;�,− �,��
4nx2�0c
= −N
16nx2�0
2c�3�f�1��4�µmg�4
�mg − �
���mg − ��2 + �mg2 /4�2
.
�2.14a�
nd the corresponding contribution to the nonlinear absorption is
2,sat = −Nkvac
8nx2�3�0
2c�f�1��4�µmg�4
�mg
���mg − ��2 + �mg2 /4�2
�2.14b�
hus the saturation effect always leads to absorption that decreases with increas-ng intensity. As a result, this effect is sometimes called “bleaching” of the state.or an example in which both 2,sat and 2,el occur, see [5]. This effective nonlin-arity proportional to �µmg�4 is sometimes (mistakenly) identified as the one-photonesonant component of the electronic nonlinearity given by Eq. (2.6a). In fact it is aomponent of the Kerr nonlinearity with n2,Kerr=n2,el+n2,sat.
t is interesting to compare this contribution near resonance for a fictitious mol-cule with zero permanent dipole moments and only one dominant electric di-ole transition. (This corresponds to a symmetric molecule for which a single,arge electric dipole transition may not be realistic.) The result is shown in Fig.(a). Clearly n2,sat is an important ��25% � contribution to n2,Kerr near the one-hoton resonance. Its relative contribution decreases with increasing frequency.ote that although it is not strictly valid to extend Eq. (2.14a) too far from resonance
nd certainly not to the zero-frequency limit, since other considerations about radia-ive loss from virtual states would have to be included, such an extrapolation shows a
ontribution of only �2% in the nonresonant limit.dvances in Optics and Photonics 2, 60–200 (2010) doi:10.1364/AOP.2.000060 73

To�F
�fc
Tdstaio
2
Asrt
pgtc
at
n
dtqqi
c
Rf
A
hese contributions due to the terms n2,el and n2,sat can be differentiated from eachther. The first way is by turning off the optical field abruptly (turn-off timet� mg) and observing the return of the refractive index to its zero-intensity value.or the electronic case, the return is instantaneous for a detuning from resonance
�� �mg, which involves virtual states, whereas the return due to the saturation ef-ect takes place over the time scale of mg, since it involves real population of the ex-ited state, as shown in Fig. 4.
here are a variety of other examples similar to the one just discussed where in-ex changes are produced by the redistribution of population densities via ab-orption, both linear and nonlinear absorption. The index changes occur bothhrough the reduction of oscillator strength caused by saturation as discussedbove, but also through the production of new absorbers. They will be discussedn Subsection 2.6 below. The signs of the respective refraction changes dependn the frequency position relative the absorption resonances.
.3. Summary of the Two-Level Model
lthough the above results are based on a simple two-level model and the as-umption that there is only one contribution to the excited state lifetime that cor-esponds to homogeneous broadening, some useful conclusions can be madehat are useful for more general cases.
1. Although there are resonant enhancements in the denominator of the ex-ressions for n2 and 2 near the one- and two-photon (and multiphoton in theeneral case) resonances, this does not necessarily mean that enhancement ac-ually occurs, because the numerators may vanish or be very small. For example,ancellation effects make the contributions of the �µ10�2�µ11− µ00�2 terms to n2,el
nd 2,el negligible relative to the �µ10�4 term, which has a ���10−��2+ ��10/2�2�−3
erm near the one-photon resonance.2. An intensity-dependent change in the refractive index is always accompa-
ied by a nonlinear change in the absorption.3. The magnitude and dispersion of the one-photon resonant change in the in-
ex and absorption is negligible compared with the magnitude and dispersion inhe linear refractive index and absorption, which occurs at exactly the same fre-uency and over the same spectral width. However, the 2PA occurs in a fre-uency region far from the dominant one-photon absorption (1PA) spectrum, its resonantly enhanced and can be measured and used.
4. Intensity-induced population changes between the ground state and the ex-
Figure 4
ecovery of the dispersion in the refractive index induced by the saturation ef-ect after an optical field is turned off at t=0.
ited state(s) produce significant contributions to the nonlinear index and ab-
dvances in Optics and Photonics 2, 60–200 (2010) doi:10.1364/AOP.2.000060 74

scf
tttmu
i�
FiIt
aes3
LrctKfTCawwc
F(pt−
Tsafrg
A
orption near the one-photon resonance. However, their relative contribution de-reases with increasing ��10−��, and their contributions are negligible in the zero-requency limit.
5. Off resonance the sign of the nonlinearity depends on the relative magni-udes of the contributions due to �µ10�2�µ11− µ00�2 and �µ10�4, and these contribu-ions depend strongly on frequency. In contrast to the on-resonance case where oneerm dominates, the contributions of the different terms become comparable. If theolecule is symmetric (no permanent dipole moments), the nonlinearity is negative
nless contributions from other states are included.6. The nonlinear index coefficient approaches a constant value with decreas-
ng frequency in the nonresonant limit, whereas the absorption change dies of as2. Here all of the terms (except for the saturation) contribute equally to n2,Kerr.
requently third-harmonic generation, which depends on ���3��−3� ;� ,� ,���2,s used to estimate the nonlinear refractive index coefficient given by Eq. (2.5a).n the nonresonant limit �
R,xxxx�3� �−3� ;� ,� ,��=�
R,xxxx�3� �−� ;� ,−� ,��=�
R,xxxx�3�
�−� ;� ,� ,−��=�R,xxxx�3� �−� ;−� ,� ,��, which makes this a valid procedure in
hat limit. However, in general for symmetric molecules
�xxxx�3� �− 3�;�,�,��
= −N
�0�3f �3��µ10�4� 4�10 + i�10�10/�
����10�2 − 9�2� − 3i��10�����10�2 − �2� − i��10�� ,
nd it is clear that there is a different resonant structure for third-harmonic gen-ration than for n2 and 2. Therefore in practice the input frequency must be cho-en so that 3���10 for the two-level model, and in the more general case���mn for all transition frequencies �mn.
isted in Table 1 are the measured n2 and 2 coefficients for a number of mate-ials. Note that although the table contains the net n2, which includes all of theontributions (some still to be discussed), these values (with the exception of ni-robenzene, which has a large rotational component) should be due mostly to theerr effect to within the accuracy of the measurements. There can be large dif-
erences �±50% � in reported values, depending on the measurement technique.he first comprehensive measurements for n2 were reported by Adair et al. [6]. Seehase and Van Stryland [7] for extensive recent tabulations. Note that these valuesre either off-resonance or nonresonant, depending on the difference between theavelengths of the absorption maxima and the measurement beams, and the spectralidths of the absorption features as discussed above. Furthermore, they may well
ontain small contributions from some of the other effects discussed here below.
rom the simple two-level model results in Eqs. (2.6), (2.7a), (2.7b), (2.7c),2.8), (2.10)–(2.13), (2.14a), and (2.14b), large n2s can occur near one and two-hoton resonances, i.e., when �� �10 or 2�� �10, and when �µ10�2 is large and/orhe difference between permanent dipole moments between the states, i.e., �µ11
µ00�2, is large, preferably both.
hese conditions for large ��3� due to electronic transitions between discretetates are best satisfied in organic materials. To the nonchemist there seems to besemi-infinite number of possible molecules for nonlinear optics. In fact, to date
our special classes of organic materials were identified as promising and haveeceived most of the attention: (1) linear or quasi-linear molecules and conju-
ated polymers with large �-electron delocalization lengths resulting in largedvances in Optics and Photonics 2, 60–200 (2010) doi:10.1364/AOP.2.000060 75

�e�pi�plbcvo
2
Ttegtaan[m
R
wim
A
µng�2 and/or �µmn�2; (2) linear molecules with strong charge transfer groups, anlectron donor at one end and an electron acceptor at the other end, with-electron bridges between them, and hence large dipole moments and hyper-olarizabilities; (3) symmetric linear molecules with an electron acceptor groupn the middle and an electron donor group at both ends, separated again by-electron bridges, and (4) 3D molecules, with and without conjugation, such asorphyrines, phthalocyanines, and dendrimers. These properties can be molecu-arly engineered in many materials by judicious choices of chains of carbononds, which leads to electron delocalization along the chain. For detailed dis-ussions, see Nonlinear Optical Properties of Organic Molecules and Crystals,olumes 1 and 2 [12]. Otherwise the values for n2 in organic materials are typicalf those found in Table 1.
.4. Conjugated Molecules and Polymers
hese systems are characterized by electron orbitals normally associated withhe individual atoms becoming delocalized and extending over the whole mol-cule (polyenes) or even connected chains of molecules in the case of conju-ated polymers. They were initially of interest in the field of electrical conduc-ors, and much of the early development of these materials was focused on thispplication. Electrical conductivity rises by orders of magnitude when poly-cetylenes are appropriately doped [13]. Interest in using such materials also foronlinear optics was triggered by the seminal paper by Sauteret and co-workers14] in which they reported large third-order nonlinearities from third-harmoniceasurements at 1.89 and 2.62 µm in a number of conjugated polymers in their
Table 1. Representative Materials with Values of n2 and 2a
MaterialEg
(eV)
n210−15 �cm2/W� 2 (cm/GW)
1064 nm 532 nm 355 nm 266 nm 532 nm 355 nm 266 nm
LiF 11.6 0.081 0.061 0.061 0.13 �0 �0 �0
MgF2 11.3 0.057 0.057 0.066 0.15 �0 �0 �0
BaF2 9.2 0.14 0.21 0.27 0.31 �0 �0 0.06
NaCl [6] �8.7 1.8
SiO2 �7.8 0.21 0.22 0.24 0.78 �0 �0 0.05
MgO [6] 7.77 0.39
Al2O3 7.3 0.31 0.33 0.37 0.60 �0 �0 0.09
BBO 6.2 0.29 0.55 0.36 0.003 �0 0.01 0.9
KBr 6.0 0.79 1.27 �0
CaCO3 5.9 0.29 0.29 0.37 1.2 0.018 0.8
LiNbO3 3.9 0.91 8.3 0.38
KTP 3.8 2.4 2.3 0.1
ZnS [9] 3.66 6.3 3.4
Te Glass �3.6 1.7 9.0 0.62
ZnSe [9] 2.67 29 −68 5.8
ZnTe [10] 2.26 120 4.2
CdTe [10] 1.44 −300 22
GaAs [10] 1.42 −330 26
Nglass [11] �1.4 2.2
aOrdered according to bandgap energy, Eg, or cutoff wavelength, taken from [8] excepthere noted. The values quoted were obtained by using multiple pulse widths in order to
solate the Kerr response. See the references for details. Blank cells indicate no measure-
ent at this wavelength.dvances in Optics and Photonics 2, 60–200 (2010) doi:10.1364/AOP.2.000060 76

rb
Basttnfbbmgg
Ccactcdb
TnR
ttnoTisSqiu
Spn
A
esonant and near-resonant regimes. Specifically, for polydiacetylene [PTS, polyis(p-toluene sulfonate) of they estimated n2,Kerr=1.810−12 cm2/W.
ased on carbon chemistry, there are three basic conjugated polymer types thatre shown schematically in Fig. 5. In their pure form, they exhibit dominant ab-orption maxima (sometimes called exciton lines) in the 500–900 nm range withypically the longer the peak absorption wavelength, the more effective the conjuga-ion. Of these three classes, namely, polyacetylenes, polydiacetylenes, and polyphe-ylvinylenes, in general it has not been possible to make optical-quality materialsrom their pure forms, and it has been necessary to add side groups to achieve solu-ility in solvents etc. In this way, polydiacetylenes and polyphenylvinylenes haveeen made suitable for optical applications. The backbone chains still dominate theolecular nonlinearity, which in the first approximation is independent of these side
roups, although it does reduce the n2 by the fractional extra volume due to the sideroups; i.e., N is reduced.
onjugated molecules are a result of the delocalization of the 2pz orbitals asso-iated with carbon atoms into � orbitals, which extend over the whole molecules shown in Fig. 6 for the acetylene molecule. Consequently the electrons asso-iated with the initial 2pz orbitals can easily be displaced relatively large dis-ances in the � orbitals, leading to enhanced polarizabilities along the carbon–arbon bonds. Furthermore, since the potential wells associated with theseelocalized molecular orbitals are relatively shallow, they are strongly nonpara-olic and are easily distorted by electric fields, leading to strong nonlinearities.
he prototypical molecules, which can be polymerized via heat or �-ray illumi-ation into conjugated polymer, are shown in Fig. 5 [15]. For acetylenes,�uCvCuCvCuR, and diacetylenes,
R� u C v C u C w C u C v C u R,
he bonds shown as double and triple are the ones that delocalize; i.e., they shareheir bond character with the single bonds. R� and R are end groups that termi-ate the molecule. In the liquid state, these quasi-linear molecules are randomlyriented, thus reducing the net nonlinearities to 1/5 of the value along the chain.hese molecules can in some cases be polymerized to form amorphous media,
n which case the orientations are essentially random, or thin films deposited onpecially prepared surfaces for which some degree of alignment is also possible.ome molecules (unfortunately very few) can be polymerized into optical-uality single crystals so that the full nonlinearity can be obtained for one polar-zation. On polymerization, the bonds to the end groups are broken and multiple
Figure 5
tructures of three generic types of conjugated polymers: (a) polyacetylene; (b)olydiacetylene, where R denotes PTS , 4BCMU, 3BCMU, etc; and (c) polyphe-ylvinelyne, where R denotes H, , alkyl, aryle, MEH etc.
nits are joined together, producing a polymer, an example of which (polydi-
dvances in Optics and Photonics 2, 60–200 (2010) doi:10.1364/AOP.2.000060 77

astAptr
Ph[lnnd
TcmF
(soc
(fcj
A
cetylene PTS) is shown in Fig. 7. Note that the end groups R and R� actuallyerve two functions, the coupling between the carbon–carbon chains in the crys-al and also used to make the molecules soluble for crystallization from solution.lthough the polymer chain may be hundreds or thousands of units long, inractice the electron coherence length (effective electron delocalization dis-ance, important to nonlinear optics) is usually limited to at most a few tens ofepeat units.
ure trans-acetylene has been measured via third-harmonic generation to ex-ibit large third-order nonlinearities in the resonant and near resonant regimes16,17]. However, it is not readily soluble and has not found application in non-inear optics. Henceforth the polydiacetylenes (like PTS) and the polyphenylvi-ylenes [like MEH-PPV, (poly2-methoxy-5-(2�-ethylhexyloxy)-1,4- phenyle-evinylene)] will be used as illustrative examples in the nonlinear opticsomain.
he backbone chain (characterized by delocalized � electrons due to carbon–arbon bonds) responsible for the large nonlinearity has no permanent dipoleoments in either its ground or excited states because of the linear symmetry.urthermore, the linear symmetry means that the electronic states are either
Figure 6
a) Typical electron distribution in acetylene molecule. The �-shell electrontates (originating from carbon atomic p=2 states), the �-shell electron statesriginate from the carbon atomic s=2 states, and the tightly bound K electronsome from the atomic s=1 states. (b) Molecular potential well for the electrons.
Figure 7
a) Crystal structure of the polymer diacetylene PTS [poly bis(p-toluene sul-onate) of 2,4-hexadiyne-1,6-diol]. The large n2 occurs along the b axis of therystal. (b) End groups R and R� (of the diacetylene molecule now link the ad-acent polymer strands in the crystal lattice [22].
dvances in Optics and Photonics 2, 60–200 (2010) doi:10.1364/AOP.2.000060 78

sttsbtmtiegcbssFteta
Bmtta
a
A
ymmetric (gerade) or antisymmetric (ungerade). For allowed electric dipoleransitions, the initial and final states must have different symmetries. It turns outhat in this class of materials it is necessary for nonlinear optics to consider threetates, two of which have even symmetry and one that has odd symmetry [18]. Inoth polydiacetylenes and polyphenylvinylenes, there are strong dipole allowedransitions from the even symmetry (gerade) ground state to the first odd sym-etry (ungerade) excited state 1Bu (transition moment labeled �µ10�), and from
his excited state to a higher-lying even symmetry state mAg ��µ21��. For nondelocal-zed or only weakly localized molecules, the ordering of the electronic states in en-rgy normally mirrors that of particles in a square well potential, alternating betweenerade and ungerade. The electron correlation effects are sufficiently strong in theseonjugated polymers that the first even symmetry �1Ag� excited state frequently lieselow 1Bu, but the dipole allowed transition moment between these two states ismall and usually neglected [19,20]. The locations of the 1Bu and mAg ��3Ag�tates are measured from the linear and 2PA spectra.An example of each is shown inigs. 8 and 9 for single-crystal polydiacetylene PTS [21,22]. Note that in both cases
he existence of transitions within the vibrational subbands located to the high-nergy side of the main peak arise because of the strong coupling to the vibrations ofhe main polymer chain [23,24]. The 1PA and 2PA spectra found in PPV-MEH alsore broadened owing to vibrational subbands [24,25].
ased on the above discussion a minimum three-level model with µii=0 (no per-anent dipole moments in the three important states) is needed to describe the
hird-order nonlinearity in conjugated polymers. Furthermore, the decay fromhe even symmetry excited state mAg is down to the 1Bu state, i.e., only 12�0nd 10�0. In the off-resonance regime
n2,Kerr =Nf �3��µ10�2
nx2�0
2c�3��102 − �2�2��µ21�2� �20��10
2 + �2� + 4�10�2
��202 − 4�2�
+ 2�10
2
�20
− �µ10�2� �10
��102 − �2�
�3�102 + �2� +
��10 + ��2
16��10 − ��� , �2.15a�
nd for the nonresonant case
Figure 8
Linear absorption spectrum of the crystal polymer diacetylene PTS [22].
dvances in Optics and Photonics 2, 60–200 (2010) doi:10.1364/AOP.2.000060 79

N�sleoqlc
2o[
Ftco
A
n2,Kerr = 3Nf �3��µ10�2
nx2�0
2c�3�103 � �10
�20
�µ21�2 −49
48�µ10�2� . �2.15b�
ote that the interference between the ground to first excited state transition�µ10�2� and the first antisymmetric to the higher-lying symmetric excited state tran-ition ��µ21�2� in such conjugated systems can be actually detrimental to obtainingarge nonresonant nonlinearities! Furthermore, since the two terms have both differ-nt signs and different frequency dispersion, the net sign of n2 can depend stronglyn frequency. This is illustrated in Fig. 10, which shows calculations of the fre-uency dispersion of n2 typical of polydiacetylenes and squaraines (discussed be-ow). As predicted by Eqs. (2.15a) and (2.15b), the sign of the nonlinearity canhange with photon frequency depending on the relative magnitude of �µ21�2 / �µ10�2.
Figure 9
PA spectrum (100 fs pulses) of the crystal polymer diacetylene PTS. Inset, detailsf the main two-photon spectrum measured with 100 fs, 2 ps, and 60 ps pulses21,22].
Figure 10
requency dispersion of n2,Kerr for �21=10�10, �20=1.33�10, and different rela-ive values of �µ12�2 / �µ10�2. (a) For �µ10�2= �µ21�2, the contributions due to �µ10�2 (redurve), �µ21�2 (green curve) and the sum of the two (black curve) are shown. (b) Sumf the contributions for different relative values of the transition dipole moments.
dvances in Optics and Photonics 2, 60–200 (2010) doi:10.1364/AOP.2.000060 80

Inpis
Maaotswfaes
(s2vo
A
n polydiacetylenes the sign of n2 is negative between the one- and two-photon reso-ances, becomes positive near the two-photon resonance, and generally remainsositive all the way to zero frequency (nonresonant case). In contrast to this behav-or, the nonlinearity in squaraines, which have weaker two-photon transitiontrength, remains negative over the full range �10���0.
any of the parameters such as �10, �20, �µ10�2, and �µ21�2, that are needed to evalu-te n2 depend on the lengths, distribution, and orientation of the conjugation chains,nd these in turn depend weakly on the details of the R and R� groups, but stronglyn the preparation techniques, temperature, and density of defects. An example ofhe variation in the linear absorption spectrum and its effect on the nonlinearity ishown in Fig. 11 for PPV [26]. Another example is the polydiacetylene 4BCMU,hich comes in blue, yellow, and red forms that are due to different molecular con-
ormations possible with absorption maxima in the spectral regions for which theyre named [27]. Dependences of the same factors on the even symmetry state prop-rties are just not known. Furthermore, the propagation loss is known to be very sen-itive to preparation technique, for example [28,29].
Figure 11
a) Examples of absorption spectra for PPV prepared from precursors synthe-ized with sodium hydroxide base and water solvent (curve 1), organic base and0% water, 80% methanol solvent (curve 2), and organic base and methanol sol-ent (curve 3). (b) Variation of the third-order nonlinearity of PPV as a functionf the wavelength for maximum absorption �max [26].
dvances in Optics and Photonics 2, 60–200 (2010) doi:10.1364/AOP.2.000060 81

Aa“cosn
Slsmssf
Tpvdacbbwcmdfcwta
(tnbat
A
lthough in principle independent measurements of all of the above parametersre possible, there is an additional complication that is the main reason why anear- and on-resonance” formula is not given here. In conjugated polymers,learly a significant fraction of the oscillator strength occurs in transitions thatccur at energies higher than the peak of the absorption involving the vibrationalidebands, and detailed theoretical treatments of such problems for calculating
2 are not available.
ome of the best single-crystal polymers grown to date have been polydiacety-enes, of which PTS is the most thoroughly investigated [30]. The PTS crystaltructure was shown in Fig. 7. It is characterized by large transition dipole mo-ents, multiple debye, for the dominant transitions from the symmetric ground
tate to the first antisymmetric �1Ag→1Bu� excited state and from this excitedtate to the second symmetric excited state �1Bu→2Ag� [31]. The decay timesrom these excited states are in the few picosecond to �100 fs range for 10 and
¯21, respectively [32].
here are too many reports of the nonlinearity in such polydiacetylene materials,rimarily in the on- and near-resonant regime, to be summarized here: using aariety of techniques they collectively confirmed that the nonlinearities are in-eed very large in the near-resonant and nonresonant regimes, where the 1PAnd 2PA is also large. (Some examples are given in [33–36].) It is generally ac-epted that n2�0 in the region between the 1PA and 2PA peaks, partially due toleaching of the one-photon �1Ag→1Bu� transition; see Fig. 12(a). This haseen confirmed by both Z scan and the negative absorption change associatedith bleaching of the 1PA there [5,21]. However, in the off-resonant regime, spe-
ifically at 1064 nm, some controversy exists about the sign of n2, although theagnitude in the range �5–10�10−12 cm2/W appears consistent [37,38]. This
ifference could be due to the different fabrication techniques used resulting in dif-erent values of dipole transition moments. In this region the nonlinear absorptionhange is positive. For example, see Fig. 13 [5]. The dispersion with increasingavelength as shown in Fig. 12(b) indicates that indeed �10�µ21�2��20�µ10�2 and
hat the nonresonant value is positive (Fig. 11) at least for the sample studied, ingreement with calculations of transition dipole moments in polyenes [31].
Figure 12
a) Wavelength dispersion in �n2� over the range 0.72–1.06 µm measured by spec-ral broadening due to self-phase modulation in a sample made by the shear tech-ique [22,36]. (b) Wavelength dispersion in n2 over the range 1.2–2.2 µm measuredy Z scan for hundreds of micrometers thick platelets of single-crystal polymer di-cetylene PTS made by crystallization from solution. The dashed curve is a guide tohe eye.
dvances in Optics and Photonics 2, 60–200 (2010) doi:10.1364/AOP.2.000060 82

IwpcwtTaTtedl1
T2a8mbiws
L
Adtolar
A
n contrast to the conjugated polymers polyacetylene and polydiacetylene,hich contain only carbon in their backbone chain, the main backbone chain ofhenylenevinylene contains phenyl (benzene) rings as well as linear carbon–arbon bonds. Note that although the phenyls have double carbon bonds fromhich electrons can be delocalized, the benzene structure does not appear to lead
o delocalization that is as effective as in the polyacetylenes and diacetyelenes.he PPV absorption maxima occur at shorter wavelengths than those of polydi-cetylenes and polyacetylenes (�450 nm versus 620 and 650 nm, respectively).o improve the solubility and reduce the defects in PPV, side groups like MEH, i.e.,
o make MEH-PPV, are added. Thin film samples of both random and highly ori-nted forms have been fabricated and characterized for optical studies [39,40]. Theetails of the fabrication determine the optical losses that can be minimized to be asow as 0.1 dB/cm, orders of magnitude lower than in pristine PPV, as shown in Fig.4.
here have been a number of nonlinear optical studies of PPVs. There is a strongPA maximum along with vibrational subbands for incident radiation at ��20/2s shown in Fig. 15. Detailed measurements of n2 have been reported around00 nm by the Australian National University group for a number of PPV-relatedaterials [41], and the wavelength dispersion at longer wavelengths of PPV-MEH
y Chris Bubeck and collaborators at Max Planck Mainz [29]. Of particular interests the dispersion (Fig. 15), which clearly shows a change of sign of the nonlinearityith increasing wavelength, as might be expected from Eqs. (2.15a) and (2.15b),
imilar to the results in polydiacetylene PTS.
isted in Table 2 are values of n and for a number of conjugated polymers
Figure 13
bsorption change induced by an intense pump pulse as measured in the poly-iacetylene 3 BCMU by a probe pulse for three different delay times betweenhe probe and the pump. The negative absorption change is due to the dominancef bleaching of the 1Ag→1Bu transition whose peak is located at 620 nm. Atower photon energies, interference with the two-photon transition 1Ag→2Ag withpeak located at 930 nm occurs, and after 660 nm the 2PA term dominates. These
esults also show that the decay time from 1Bu to the ground state is �1 ps [5].
2 2
dvances in Optics and Photonics 2, 60–200 (2010) doi:10.1364/AOP.2.000060 83

afb
Tlrtntod
TR
NClotDhd
A
nd the measurement technique used. The values are much larger than thoseound in normal dielectric media. More complete listings of n2 at �=0.8 µm cane found in [41]. Structures are shown in Fig.16.
he nonlinearity n2 of 30–100 nm sized nanocrystallites of polydiacetylene in so-ution has been investigated by Nakanishi and co-workers [46].The results were cor-ected for the random crystallite orientation and its concentration in solution. Al-hough the magnitude and sign of n2 was of the same order as that in bulk crystals, aumber of quantum effects were clear in their measurements. Namely, the absorp-ion peak was shifted to longer wavelengths, the spectrum of the vibronic sidebandsn the low-wavelength side of the absorption peak changed in structure, and n2 didepend on the crystal size.
he effect of metallic coating of polydiacetylene [with R1= �CH2�11CH3 and
2= �CH2�8COOH] was evaluated in [47]. After polymerization via � irradiation,
Figure 14
Comparison of residual absorption of PPV and MEH-PPV [29].
Figure 15
onlinear optical spectra of MEH-PPV measured at the laser wavelength �. (a)omparison of data of 2 from nonlinear prism coupling (films, filled large dots,
eft-hand scale), from two-photon excitation spectra of fluorescence (solutions,pen circles, arbitrary units scaled to the peak of film data, error bars are smallerhan symbol size), and from Z scan (solution, small dots, right-hand scale). (b)ispersion of n2 from nonlinear prism coupling (films, filled large dots, left-and scale), and Z scan (solution, small dots, right-hand scale). See [29] foretails.
dvances in Optics and Photonics 2, 60–200 (2010) doi:10.1364/AOP.2.000060 84

td
2
Tsdplattaq1t
A
he absorption spectrum resembled that of bulk polydiacetylenes. An enhancementue to the silver coating of �2 was measured for n2 at 532 nm.
.5. Charge Transfer Molecules
he generic form for charge transfer molecules (also called chromophores) ishown in Fig. 17(a) [12]. For detailed discussion see, for example, [12]. As in-icated in the cartoons in Fig. 17(b), the end groups have contrastingly differentroperties. The donor (D) groups, for example N�CH3�2, OCH3, H2N haveoosely bound electrons. At the other end, there is an acceptor (A) group, for ex-mple NO2, CN, etc., which easily accommodates additional electrons. The in-ermediate bridge group should facilitate the transfer of electrons between thewo end groups. This is usually achieved by a structure for which 2pz electronsre partially delocalized, such as a single or multiple benzene ring(s), or a se-uence of single–double carbon bonds as discussed above. As indicated in Figs.7(b) and 17(c), there is a partial transfer of charge from the donor to the accep-or groups, resulting in a permanent dipole moment in the ground (and excited)
Table 2. Kerr and Nonlinear Absorption (Where Available) Coefficients for aSelection of Conjugated Polymers in Thin Film Form
Materialn210−12
�cm2/W�2
(cm/GW)�
�µm�Measurement
Technique
PPV [26] �n2 � =1–10 a80 0.8 D4WMb
2,5-Dimethoxy p-PPV [42] �n2 � =4 0.8 D4WM
2,5-Dimethoxy p-PPV [41] n2=−4 25–80 0.8 Kerr gate
MEH-PPV [43] n2=−3 180 0.5 Z scan
PPV-AC8H [41] n2=−1.1 40 0.8 Z scan
DBSA-PANI [45] n2=−1.7 42 1.054 Z scan
Polydiacetylene 4BCMU [44] n2=0.05 �0.25 1.31 Mach–Zehnder
aMeasured by power-dependent transmission.bDegenerate four-wave mixing.
Figure 16
Structures for conjugated polymers of Table 2.
dvances in Optics and Photonics 2, 60–200 (2010) doi:10.1364/AOP.2.000060 85

srtl�n[
Tesd
(edg
(Ec[
A
tate(s). An example for which there are both large dipole moments as well as aeversal of their signs is shown in Fig. 18 [48]. In such molecules it is typical thatheir nonlinearity is dominated by the ground and first excited states; i.e., a two-evel model is a reasonable approximation, i.e., in the nonresonant limit n2,el
�µ10�2�µ11− µ00�2− �µ10�4. The nonlinearity n2,el can be dominated by the perma-ent dipole moments for large values of �µ11− µ00�2.An example is shown in Fig. 1949].
ypically, quantum chemical calculations (AM1, Austin Model 1) are needed tovaluate the molecular parameters as well as the molecular nonlinearities in suchystems [50]. Such calculations have shown that the nonlinearity is linked to theegree of charge transfer from the donor to the acceptor, which is related to the
Figure 17
a) Prototype charge transfer molecule with an electron acceptor group on onend, a donor group on the other end, separated by a bridge. (b) Change in chargeistributions introduced by an electron acceptor group A, an electron donorroup D, and both A and D. (c) The charge transfer molecule nitroaniline [12].
Figure 18
a) Chromophore structure (KJS-1) with strong charge transfer properties. (b)lectron distribution in the ground state. (c) Electron distribution in the first ex-ited state. Permanent dipole moments have different signs in the two states48]!
dvances in Optics and Photonics 2, 60–200 (2010) doi:10.1364/AOP.2.000060 86

bdgnvzmhlslflg
Tscg
T
Ptg4s
A
ond-length alternation (the average difference in length between single andouble bonds in the molecule due to the charge transfer from the D to the Aroup). This led to a simple physical two-level model based on a linear combi-ation of the two extreme (resonance) structures, the cyanine limit (called thealence bond configuration, VB) in which no electron transfer occurs and thewitterionic limit (called the charge transfer configuration, CT) in which theaximum electron transfer occurs [51–53]. These limiting resonance structures
ave different single–double carbon bond linkage structures. Assuming a two-evel model, which frequently is adequate for charge transfer molecules, thetructure for a specific molecule is assumed to be a linear combination of the va-ence and charge transfer bond configurations. Writing�VB and�CT as the waveunction of the two limiting configurations, the corresponding ground state energyevels as EVB and ECT, and −t as the interaction between the donor and acceptorives a molecule’s Hamiltonian as
H0 = � 0 − t
− t V�, V = ECT − EVB, − t = ��VB�H��CT� . �2.16�
he Schrödinger wave equation is then solved for the ground state and excitedtate wave functions �gr and �ex and energies Egr and Eex, respectively of theoupled system in terms of the fraction f of the charge transfer configuration in theround state, i.e.,�gr=�1− f�VB+�f�CT and
Egr =1
2�V − �V2 + 4t2�, Eex =
1
2�V + �V2 + 4t2�,
f =Egr
2
t2 + Egr2
=1
2−
V
2�V2 + 4t2. �2.17�
Figure 19
lot of the molecular second hyperpolarizability ���3�� (averaged over all orien-ations) on permanent electric dipole-moment difference between excited andround states �µ for three charge transfer molecules [49]. DEANST,-(N,N-diethylamino)-�-nitrostyrene; 2,6-ANS, 2-anilinonaphthalene-6-ulfonic acid; PRODAN, 6-propionyl-2-dimethylamino naphthalene.
he problem now requires finding the change in the carbon bonding distances in
dvances in Optics and Photonics 2, 60–200 (2010) doi:10.1364/AOP.2.000060 87

twa+amqt
Td
N=wmfia
Id=fi
M
Tamlcfis
Stbpa
A
erms of the above parameters. This change involves an additional elastic energyith force constant k associated with the optical phonon with displacements
long the charge transfer axis. Noting that EVB=0.5k�q−qVB0 �2 and ECT=V0
0.5k�q−qCT0 �2, where the decoupled state energy EVB has been set to 0, V0 is the
diabatic energy difference between the ground and excited states (i.e., at their mini-um energy value), q is the molecule’s bond length due to the charge transfer, and
CT0 and qVB
0 are the equilibrium bond lengths in the decoupled valence and chargeransfer bond configurations, the ground state energy is now given by
Egr =1
2�V0 +
1
2k�q − qVB
0 �2 + �q − qCT0 �2� − �V2 + 4t2 . �2.18�
he ground state corresponds to the minimum energy of Egr�q�, i.e.,Egr�q� /dq=0, which yields [51]
→qopt =1
2�qVB
0 + qCT0 � +
1
2�qVB
0 − qCT0 �
V
�V2 + 4t2⇒ f =
qVB0 − qopt
qVB0 − qCT
0.
�2.19�
ow an optical field is introduced in order to find the optical response. µCT
Q �e �LDA is defined as the dipole moment created in the charge transfer state,here Q is the maximum charge transferred over a distance LDA and the dipoleoment of the coupled ground state is given by fµCT. The application of an electriceld E polarized along the charge transfer axis leads to a perturbation Hamiltoniandded to the original Hamiltonian so that
H = �EVB − t
− t ECT − µCTE� → VE = ECT − EVB − µCTE →
df
dE=
df
dV
dVE
dE=
2t2µCT
Egr3
.
�2.20�
n the preceding formulation, V is now replaced by VE, and the polarization in-uced along the charge transfer axis by the application of the field is p�E�−dEgr /dE, which contains all the contributions, linear, quadratic, cubic, etc., in theeld E. The nonlinear polarizability ��3� is now given by
�xxxx�3� = � 1
6
d3px
dE3 �E=0
= − µCT4 � d3f
dVE3�
E=0
=4t2µCT
4 �V2 − t2�
Egr7
. �2.21�
ore detail can be found in [51–53].
he plot of ��3� versus the charge transfer fraction f in Fig. 20(a) shows how thispproach can be used to optimize the third-order susceptibility in charge transferolecules [53]. Clearly f=0.5 produces the largest nonlinearity ���3��. This formu-
ation has been verified experimentally as shown in Fig. 20(b) for a family of trieneompounds by using solvents with different polarity (which contribute an additionaleld component) and donor-acceptor groups [53]. Therefore proper molecular de-ign (molecular engineering) can lead to large values for ��3�.
uch molecules can be used in any number of pure forms which, depending onhe operating temperature, are single crystals or neat liquids. They have alsoeen dissolved in appropriate solvents and, as shown in Fig. 21, in solid-stateolymers. The chromophores can be included as “guests” dissolved uniformly in
host polymer and are not chemically attached to the polymer. Alternatively, thedvances in Optics and Photonics 2, 60–200 (2010) doi:10.1364/AOP.2.000060 88

ctIommTcfttatpitb
(fg
A
hromophores can be attached as pendants oriented more or less orthogonal tohe main chain of the polymer by chemical bonding at one end of the molecule.t is also possible to bond (cross link) both ends of the chromophore to differentr even the same polymer backbone chain (which can be folded) inside the poly-er matrix. A fourth alternative is main chain attachment in which the chro-ophore is inserted (bonded) on both ends into the polymer backbone chain.he doping levels of the molecules into the polymers depend on the particularhromophore details, the host polymer and the form of attachment, increasingrom 1%–30% for side-chain and guest–host systems to about in 50% doping inhe main-chain and cross-linked cases. For random orientation of the molecules,he value of the macroscopic third-order susceptibility (and n2) is reduced tobout 1 /5 of the molecular value along the charge transfer axis. However, theechnology for partially orienting the chromophores and forming the solid-stateolymer solutions discussed here is very well developed because of the interestn using them for electro-optics applications [54,55]. Because the chromophoresypically have large dipole moments in the ground state, electric field poling haseen used to achieve some degree of alignment of the chromophores and hence
Figure 20
a) Calculation of ��3� due to varying amounts of f, the fractional charge transferrom the donor D to the acceptor A. (b) Measurement of ��3� by third-harmoniceneration on the triene family of molecules in different solvents [53].
dvances in Optics and Photonics 2, 60–200 (2010) doi:10.1364/AOP.2.000060 89

it
Cisaffp
AstttP
Sll
Dptepm
D
D
M
A
ncrease the net nonlinearity back toward its molecular value along the chargeransfer axis.
hromophore nonlinearities can also be accessed by dissolving them in compat-ble solvents, but of course with the 1/5 random orientation factor. Many of theuitable solvents tend to be polar, which can change the electron transfer char-cteristics of the chromophore dissolved in them and hence the nonlinearity. Inact, experimental verifications of the calculations shown in Fig. 20(b) were per-ormed by using well-characterized solvents to change the electron transferroperties [53].
word of caution is necessary when using bridge groups with double bondsuch as carbon or nitrogen in the bridge group. Oxygen-induced photodegrada-ion of the double bonds of the bridge when illuminated with light primarily inhe visible or UV can lead to changes in chemical structure, drastically reducinghe electron transfer properties of the bridge and hence the nonlinearity [56].inhole-free encapsulation of the polymer is necessary for long-term stability.
ome representative values for large n2 measured in polymers as well as in so-ution are given in Table 3. Structures are shown in Fig. 22. Clearly the valuesisted are higher than those in Table 1 for nonorganic dielectric media.
Figure 21
ifferent ways of including charge transfer molecules (chromophores) insideolymer matrices. (a) Guest–host system in which the molecules are dissolved inhe polymer without bonding to it. (b) Chromophores bonded as pendants at onend to the polymer chain. (c) Charge transfer molecules bonded directly into theolymer chain. (d) Chromophores tethered at both ends either to the same poly-er or to different polymers (case shown).
Table 3. Representative n2 and 2 (Where Available) Values for SomeRandomly Oriented Charge Transfer Molecules
Materialn210−14
�cm2/W�2
(cm/GW)�
�µm� Materialn210−14
�cm2/W�2
(cm/GW)�
�µm�
ANSa[57] +7 �1–2 1.06 DMSMb[59] 16 �1 0.7
AN2a[57] +20 �1–2 1.06 DEANSTc[59] 19 �1 0.7
NAd[58] 25 1.06
a�20%wt in PMMA.b20 wt. % in formamide.c30 wt. % in nitrobenzene.d
Extrapolated from measurements of 17% MNA in PMNMA.dvances in Optics and Photonics 2, 60–200 (2010) doi:10.1364/AOP.2.000060 90

2
Stsmspgt�tid�cc
Anatb1s
(
(
(
(
A
.6. Miscellaneous Molecules
ymmetric squaraine dyes have exhibited large nonlinearities. They are essen-ially linear molecules that have identical donor groups at both ends of a D-A-Dtructure and hence have no permanent dipole moments. Their linear natureeans that their ground and excited states have either even �Ag� or odd �Bu�
ymmetry, similar to that discussed previously for polyenes and conjugatedolymers. Hence a three-level model of the type discussed previously for conju-ated polymers is appropriate as a first approximation. Their absorption spectra,ypically peaked in the 650–900 nm range, exhibit dipole transition moments
10 debye for the 1Ag→1Bu transition with very narrow linewidths and a transi-ion dipole moment to the dominant two-photon state, i.e., 1Bu→mAg, whose values about one half of the 1Ag→1Bu value [60,61]. Equation (2.15a) and Fig. 10 pre-ict a negative n2 off-resonance and nonresonant value, and magnitudes in the −510−12→−10−14 cm2/W range have been measured for 1500 nm��1064 nm [42,62–64]. Values for a few specific cases are given in Table 4. In most
ases, significant 2PA was also found. Squaraine-based molecules have been suc-essfully doped into polymer films and low-loss fibers [63].
nother family of molecules that have been of interest because of their largeonlinearities is the polymethines [65]. An example of the large nonlinearitiesvailable in the communications bands due to the electron delocalization alonghe acetylenelike bridging structure consisting of single and double carbononds is given in Table 4. Since the main absorption maxima occur around000 nm, the listed nonlinearities are off resonance, i.e., in the tails of the linear ab-orption spectra. Structures are shown in Fig. 23.
Figure 22
Structures for molecules in Table 3.
Table 4. Representative n2 and 2 (Where Available) Values for MiscellaneousMoleculesa
Materialn210−14
�cm2/W��
�µm� Materialn210−14
�cm2/W�2
(cm/GW)�
�µm�
1 wt. %) ISQ 4.1 ��n2 � � [63] 1.3 D-A-D squaraine −80 [64] 46 1.3b0.1 wt. %) ISQ 2.1��n2�� [62] 1.06 cPyrole squaraine −13 [140] 0.8
1 wt. %) BSQ 8.8 ��n2 � � [63] 1.3 Polymethine −490 [65] 50 1.3b2 wt. %) BSQ 20 ��n2 � � [62] 1.06 Polymethine −290 [65] 1.55
d(6.4 wt. %) SBAC 0.9 [59] �0 0.8
aRandom orientation of linear molecular axis.bPercentage in PMMA fiber.cEstimated from solution measurements in chloroform.d
SBAC dye in PMMA (a D-A-D structure) .dvances in Optics and Photonics 2, 60–200 (2010) doi:10.1364/AOP.2.000060 91

FTaftimdEpdGCF=tefTnm
Htcc[o
A
inally, dendrimers have been of increasing interest for nonlinear optics [66].hey have proved useful as molecules for certain applications because of theirbility to incorporate multiple functionalities needed, for example, for photore-ractivity. For third-order nonlinear optics, specifically nonlinear absorption,hey offer the possibility of broadband 2PA needed, for example, for optical lim-ting [67]. In fact limited cooperative effects have been observed in an experi-
ent where the number of two-photon active species was doubled in a den-rimer, and a factor of 6 increase in the 2PA cross-section was measured [68].ven though some large molecular nonlinearities �Real��3�� have been re-orted, these dendrimers occupy much larger volumes than the molecules previouslyiscussed here, and it is not clear whether the macroscopic ��3� will also be large.oodson and colleagues have reported n2 and 2 measurements on the dendrimerZD4NS2 (see Fig. 24) at a concentration of 310−3 mol/L in chloroform [69].rom their Z-scan data they calculated n2=−1.110−13 cm2/W and 2
10−2 cm/GW at 800 nm. (The peak linear absorption occurs at 450 nm.) In addi-ion they also observed higher-order nonlinear refraction effects. To check for coop-rative effects potentially leading to an enhanced n2 they measured the nonlinearitiesor both the nitroaminostilbene and carbazole functional groups (Fig. 24) alone.hey found that the dendrimer nonlinearity was completely accounted for by the twoitroaminostilbene groups and that the carbazole had no effect on n2. More experi-ents are clearly needed to truly assess the potential of dendrimers for enhanced n2.
ere we have presented a very brief review of the origins and magnitude of n2 inhe two common organic material systems, namely, conjugated polymers andharge transfer molecules. More detailed information about the chemistry etc.an be found in review books containing many pertinent chapters such as70,71] and discussions of the current status of materials for organic nonlinearptics in [52,53].
Figure 23
Structures for molecules in Table 4.
dvances in Optics and Photonics 2, 60–200 (2010) doi:10.1364/AOP.2.000060 92

2A
Tdv[dsc
Lstdd
Tvts
w
Hap
A
.7. Excited-State Absorption and Reverse Saturablebsorption
here are a variety of examples such as the above where index changes are pro-uced by the redistribution of population densities of two or more excited statesia absorption, both via successive linear and nonlinear absorption processes72,73]. The index changes occur through the reduction of oscillator strengthue to saturation as discussed above, but also through the production of new ab-orbers as discussed in this subsection. The signs of the respective refractionhanges depend on the frequency position relative to the absorption resonances.
inear absorption can promote species to excited states that serve as the lowertate of a second electric dipole allowed transition before the excited state elec-rons decay back to the ground state. Figure 25 shows a quasi-three-level system,escribed in more detail below, that is a good approximation for many organicyes.
his process produces what is called excited state absorption (ESA). It is con-enient to describe the second absorption process by an absorption cross sec-ion, �21, related to the dipole matrix element �µ21�2, since the ESA coefficient isimply
21 = �21N1, �2.22�
here N1 is the electron density of the first excited state, i.e.,
dN1
dt=1gI
��. �2.23�
ere 1g is the absorption coefficient from the ground state g (also described bycross section �1g times the density of ground state absorbers Ng) and �� the
Figure 24
CZD4NS2 dendrimer structure and its constituents [69].
hoton energy—one excited state produced per photon absorbed.
dvances in Optics and Photonics 2, 60–200 (2010) doi:10.1364/AOP.2.000060 93

St
wt
g
Aeccsp�2b
Lo
A
uch equations can be integrated in time to see the effect of the ESA on theransmitted intensity. First, integrating Eq. (2.23) yields
N1�t� =1g
���
−�
t
I�t��dt� �1g
��F�t� , �2.24�
here F is defined as the fluence, energy per unit area, which when plugged intohe equation describing the intensity change,
dI
dz= − �1gNgI − �21N1I , �2.25�
ives
dF�t�
dz= − �1gNgF�t� − Ng
�1g�21
2��F2�t�. �2.26�
similar equation can be obtained for 2PA in which the fluence F (integratednergy of a pulse) is replaced by the intensity, and the product of density timesross sections divided by photon energy is replaced by a quantity called the 2PAoefficient, 2. The process represented here is a pair of sequential linear ab-orption processes, as opposed to the usual nearly instantaneous 2PA, which isroportional to the product of the squares of the transition dipole moments
µ21�2�µg1�2. Thus, Eq. (2.26) is a precursor to the results of perturbation theory forPA, and the transition from sequential 2PA [Eq. (2.26)] to instantaneous 2PA given
2
Figure 25
evel structure of a three-level system, showing the vibration-rotation manifoldf the excited states, the absorption cross sections, and the relaxation routes.
y dI�z�=−2I becomes apparent [74].
dvances in Optics and Photonics 2, 60–200 (2010) doi:10.1364/AOP.2.000060 94

AtFndebrtwa
ItvvTesgoldTnf
Icm
On(
A
realistic depiction of one-photon-absorption-induced ESA is shown by thehree-level system with vibrational–rotational manifolds in the excited states inig. 25. Notice that, although many levels are shown, there are only two domi-ant transitions. For molecules with rotational and vibrational degrees of free-om coupled to the electronic transitions, excitation to higher-lying states inach manifold is rapidly followed by intrasystem relaxation to the bottom of theand. The ESA then proceeds from this relaxed excited state into a higherotational–vibrational manifold. Rapid intersystem relaxation returns the elec-rons in the second excited state manifold to the bottom of the first excited band,here they can again absorb. Thus a single excited state absorber can efficiently
bsorb multiple times even for pulsed inputs.
f the ESA cross section is larger than that of the ground state, �21��1g, wherehe absorption cross sections are now understood to be averages over theibrational–rotation manifolds, then the absorption process is also referred to as re-erse saturable absorption (RSA), and increasing input yields increasing loss [75].his model is a useful model that can be used to describe ESA in many organic mol-cules, and as we will see in the discussion of semiconductors, can also describeome free-carrier absorption phenomena. Figure 26 shows Z-scan data on the or-anic dye chloro-aluminum phthalocyanine, CAP, showing the fluence dependencef both nonlinear absorption, following Eq. (2.26), and the nonlinear refraction fol-owing that discussed at the end of this Subsection [73]. In this figure, two sets ofata are shown for the same energy but with pulse widths differing by a factor of 2.hus the fluence used is identical, but the intensity differs by 2. The fact that theonlinearities are the same shows the fluence dependence. Table 4 gives parametersor a sampling of molecules showing RSA.
n cases where the input pulses deplete the population of the lower level and de-ay of the upper state is possible, the equations governing the process becomeore complicated [76]:
Figure 26
pen (left) and closed (right) aperture Z scans on chloro-aluminum phthalocya-ine at 532 nm; triangles, using 30 ps pulses (FWHM); squares, 62 ps pulsesFWHM) [73].
dvances in Optics and Photonics 2, 60–200 (2010) doi:10.1364/AOP.2.000060 95

TbioFl
Iaeiywg
Wfasfcotnte
T�
A
dNg
dt= −
�1gNg
��I +
N1
1g
, �2.27a�
dN1
dt=�1gNg
��I −
N1
1g
, �2.27b�
dI
dz= − �1gNgI − �21N1I. �2.27c�
he refraction from these absorption processes is simply related to the redistri-ution of the population of levels when we are creating and/or removing absorb-ng species. Depending on which side of resonance, the index can be increasedr lowered. For pulsed input, the index change follows the population in time.or pulses short compared with the population decay time, the index change fol-ows the integrated energy, which has the shape of an error function.
n many situations involving organic molecules triplet states become involved,nd the appropriate level structure is a five-level system [77]. Solutions of thesequations show an increasing loss with increasing intensity that eventually turnsnto saturation for high inputs. More sophisticated approximations to Eq. (2.21)ield overall saturable absorption for �21��1g, and RSA (i.e., increasing lossith increasing intensity) for �21��1g, as seen in Fig. 27 [78]. References [79,80]ive ESA including triplet states along with the dynamics.
e conclude this discussion of excited-state nonlinearities with the nonlinear re-raction associated with the population redistribution. These refractive changesre a result of the changes in the linear absorption arising from creating excitedtates and removing population from the ground state. They were calculatedrom the Kramers–Kronig relations. The prediction is that there should be a de-rease in index below resonance and an increase above resonance if the creationf the excited state absorbers dominates the absorption changes (as opposed tohe loss of ground state absorbers). This should be the case where RSA domi-ates saturable absorption. As shown in Fig. 27 and listed in Table 5 (Fig. 28),he observed nonlinear refraction in CAP is positive, indicating above-resonancexcitation. As for the absorption, defining a refractive cross section, �R, is more
Figure 27
ransmittance versus input fluence for, curve 1, �21��1g; 2, �21=�1g; 3, �21
�1g [78].
dvances in Optics and Photonics 2, 60–200 (2010) doi:10.1364/AOP.2.000060 96

aTcy
Itcut
3
Tttihla
P
C
S
tp
A
ppropriate than using n2. Values of �R for representative molecules are given inable 5, using the following definition to give units of square centimeters for theross section (another definition sometimes used is to drop the wave number k,ielding a cross section with units of cubic centimeters):
kvac�n = �RN1. �2.28�
t is interesting to note that if one calculated an n2for CAP using, for example,he 30 ps data in Fig. 27, one would obtain a value of n2=1.210−14 cm2/W at aoncentration of only 1.3 mM, i.e., a very large value if given a neat material. And,sing the 62 ps data would yield a value for n2 approximately twice as large, givenhat the intensity is only half as large.
. Glass Nonlinearities
here are many definitions for a “glass.” For example “any of a large class of ma-erials with highly variable mechanical and optical properties that solidify fromhe molten state without crystallization. They are typically made by silicates fus-ng with boric oxide, aluminum oxide, or phosphorus pentoxide, are generallyard, brittle, and transparent or translucent, and are considered to be supercoolediquids rather than true solids” [81]. In optics, glass usually refers to silica, i.e.,morphous SiO2 (silicon dioxide) doped with various atoms and/or molecules. Pure
Table 5. Parameters of RSA Dyes
Material/Solvent �1g �21 �21/�1g �R a
olymethine/ethanol [78] 0.710−17 cm2 6010−17 cm2 81 0.3 ns
AP/methanol [73] 2.210−18 cm2 2.310−17 cm2 10 1.810−17 cm2 7.0 ns
iNc/toluene [73] 2.810−18 cm2 3.910−17 cm2 14 4.710−18 cm2 3.2 ns
aHere is the singlet state lifetime. In CAP and SiNc, much of the population goes to theriplet state in this time where it can strongly absorb as opposed to the ground state for theolymethine.
Figure 28
Structures of RSA dyes with parameters listed in Table 5.
dvances in Optics and Photonics 2, 60–200 (2010) doi:10.1364/AOP.2.000060 97

sfiboo
AsateSwewpsnn
Aiwmllrt
Ogottstl1fssr
A
A
ilica, typically doped with Ge to increase its refractive index, is routinely used inbers for transmission, and hence its linear and nonlinear optical properties haveeen studied extensively in optics, especially in the communications bands. On thene hand, a nonlinear refractive index is essential to soliton propagation, and on thether hand, it can produce detrimental crosstalk due to four-wave mixing etc. [82].
s stated in the above definition, the optical properties are not the same for everyample, as they would be, for example, in a single crystal of quartz. The reasonsre primarily twofold. One, glass properties vary with the details of the prepara-ion technique, which is usually proprietary to each commercial supplier. Differ-nt complexes can form on a local scale, especially for multicomponent glasses.econd, the optical properties depend on the purity of the starting materials, asell as upon small amounts of impurities added to the fabrication for stability,tc. In addition, the glass properties may depend on the location in the melt fromhich the sample was taken, the center, the edges, etc., although this aspect isrobably less of an issue with glasses from commercial sources than with re-earch grade samples made in small melts. Because of its importance in optics,
2 has been measured in silica and lightly doped silica by many different tech-iques. Table 6 gives an indication of the variability in n2 with supplier.
t 1.55 µm, which is far from all of the electronic resonances in the UV and hences in the nonresonant regime, the recommended value is n2=2.5±0.1
10−16 cm2/W. This corresponds to one of the very few cases in nonlinear opticshere such precision is possible, primarily due to the elaborate schemes for in situeasurements in fibers (see references cited in [83]). The dispersion with wave-
ength for fused silica is shown in Fig. 29. Note that the spread in values is theeast at 1.55 µm because of the importance of this wavelength region. In the spectralegions where these glasses are used for nonlinear optics, the Kerr response is fem-oseconds or less.
ver the past 10–20 years many new glasses, mostly heavy oxides and chalco-enides, have been synthesized with the goal of improving n2 in glasses. The rangef values along with the glass classification is documented in Fig. 30 [84]. However,he values for loss (1 in inverse centimeters) achieved to date in many of these ma-erials have resulted in lower net figures of merit defined by n2 /1 than in fusedilica. There are two principal reasons for this. In general, the larger the nonlinearity,he more the absorption edge due to electronic transitions is shifted to longer wave-engths, and hence the larger the residual absorption in the near infrared and–1.5 �m regions relative to fused silica. Second, fabrication techniques optimized
or low loss have been pursued vigorously only for silica, Er-doped glasses, andome specialty glasses developed for applications other than nonlinear optics (withmall to moderate n2). Hence there is hope that scattering and other losses can beeduced in highly nonlinear glasses in the future.
number of glasses in standard glass catalogs that were deemed promising for a
Table 6. Measured n2 in Fused Silica at 800 nm from Various Suppliers [83]
Sample Source n210−16 cm2/W
Suprasil 3.2
Schott SQ1 2.5
Heraeus 3.5
Herasil 3.3
dvances in Optics and Photonics 2, 60–200 (2010) doi:10.1364/AOP.2.000060 98

cp1c1v
Tn2cp
Iett
Da
A
ombination of fiber processability and potentially high n2 were investigated,rimarily in the late 1980s and early 1990s. The range of values for n2 was0−15–10−14cm2/W [11,85–88]. The inclusion of metal oxides in glasses for in-reasing the nonlinearity occupied members of the French glass community in the990s; the metal oxides included oxides of Te, Ti, Th, and Nb, which produced n2
alues in the range 10−15 to 610−14 cm2/W [89–91].
he chalcogenide glass family has been of special interest because of its highonlinearities in the near and mid-infrared. Values are typically in the 10−14 to10−13 cm2/W range as shown in Fig. 31. Many of these glasses have absorptionutoffs in the near infrared and are prone to optical damage for wavelengths that, de-ending on the specific glass composition, can extend to 1.3 µm [92–97].
n principle the S.O.S. Eqs. (2.1) and (2.3) can be used to calculate glass nonlin-arities. In practice, the random, amorphous, disordered nature of a glass leadso broad distributions of resonant frequencies and decreased excited state life-imes. The effect of this disorder on, for example, the linear spectrum of glasses
Figure 29
ispersion in n2 with wavelength for bulk fused silica as reported in Santran etl. [83].
Figure 30
Summary of the trends in n2 for different families of glasses [84].
dvances in Optics and Photonics 2, 60–200 (2010) doi:10.1364/AOP.2.000060 99

iceFbwmmwr
o
wat�pEabm
VlFs[
A
s dramatic. Although the absorption spectrum of silica still has structure thatan be identified with the electronic transitions in the dominant glass constitu-nt, gaseous SiO2, the absorption spectrum is quasi continuous and not discrete.urthermore, this corresponds to inhomogeneous broadening; so the inverse of thereadth of the spectrum does not yield the homogeneous relaxation times associatedith S.O.S. Because of these complexities, there have been a number of approxi-ate formulas proposed from which the n2 of a multicomponent glass can be esti-ated based on the glass’s linear optical properties. One such formulation that isidely used, and has been moderately successful provided that it is used in the off-
esonant regime, is the BGO equation named after it’s originators [98], namely,
n2 �cm2/W� =0.29�nd − 1��nd
2 + 2�2
n���vd�1.52 + �nd − 1��nd2 + 2�vd
6nd
10−13, �3.1�
r in its simplified form
n2 =1.64
n
�nd − 1�
��4 vd�5 10−13 cm2/W, �3.2�
here vd is the Abbé number defined as vd= �nd−1� / �nF−nc� and nd, nF, and nc
re the linear refractive indices at 0.48613, 0.58756, and 0.65627 µm, respec-ively. The Abbé number and �nd−1� reflect the strength of the glass dispersion, andnd−1� as well as �nd
2+2� the glass polarizability, both of which are in the S.O.S. ex-ression. A comparison of the n2 values measured at 1.55 µm and estimated fromq. (3.2) is shown in Table 7. Although the agreement deteriorates when the glass’sbsorption edge approaches the refractive indices on which the Abbé number isased in multicomponent glasses, these formulas provide a useful estimation
Figure 31
ariation of n2 with normalized photon energy in chalcogenide systems with se-enide, sulfoselenide, sulfide, and heavy-metal-doped oxides, all at 1.25 µm.used silica is also shown for comparison. The horizontal error bars account for ab-orption edge conventions different from that used in [96]. Smektala et al. refers to95].
ethod.
dvances in Optics and Photonics 2, 60–200 (2010) doi:10.1364/AOP.2.000060 100

4
Sdnc
Tshstnftsott
S
(tal�Esbt
A
. Semiconductor Nonlinearities
emiconductors are very important in optical technologies, since they emit andetect radiation efficiently and can be used to optically and electro-optically ma-ipulate signals etc. As a result their optical properties are very well known, in-luding their nonlinear optical properties [99].
here are multiple mechanisms that contribute to �n�I� in semiconductors. Inome ways bulk semiconductors are more complex than molecules because theyave multiple continuous bands and not discrete states. On the other hand, mostemiconductor properties can often be well characterized by simply specifyinghe bandgap energy and wavelength of interest. The full spectrum of ultrafastonlinearities can be predicted from a single material-related number to withinactors of 2 or 3. This cannot be done for materials with discrete states wherehere are multiple two-photon (2PA) states and therefore knowledge of the fullpectrum is required. In a semiconductor, a single measurement of the nonlinearptical response at a single wavelength, along with the bandgap energy, can givehe full nonlinear spectrum [100]. Table 1 lists n2 and 2 for several representa-ive semiconductors at different wavelengths.
hown in Fig. 32 are the allowed electron states in an ideal semiconductor with a
Table 7. Comparison of Measured and Calculated n2 Based on Eq. (3.2)
Fused Silica BK7 SF6
vd 68 64 25
nd 1.46 1.52 1.81
Theory n2 �cm2/W� 2.610−16 3.010−16 1310−16
Experiment n2 �cm2/W� 2.510−16 3.410−16 2010−16
Figure 32
a) Electron occupation (dark blue) of the valence and conduction bands in awo-band semiconductor at zero temperature as a function of electron energy End wave vector �kxky�. The red line indicates allowed transitions from the va-ence to the conduction band. (b) Incidence of optical field of photon energy��Egap. (c) Electron occupation of the bands subsequent to the optical field.
gap� �Egap defines the resulting bandgap between the lowest energy unoccupiedtates in the conduction band and the highest energy occupied states in the valenceand. is the spontaneous recombination time for a conduction band electron to re-urn to the valence band.
dvances in Optics and Photonics 2, 60–200 (2010) doi:10.1364/AOP.2.000060 101

s“atpn3bag
Tet�dt�fi
Flbbtto
Tbt[st
(ot
A
ingle valence and conduction band [101]. The states lie on the surface ofbowls,” upright for the conduction band and inverted for the valence band, andny electrons occupying the states at the top of the valence band and bottom ofhe conduction band have zero momentum (kinetic energy), i.e., away from thisoint �k� � �0. In fact, a 4D representation of the densities of state in E–k� space isecessary, since the electrons can move in all three spatial coordinates; i.e., Fig.2 represents a cut in this space. At 0 K, all of the electrons exist in the valenceand, none in the conduction band. At finite temperatures, the electrons pick upn additional energy �kBT, and some electrons are excited into the lowest re-ions of the conduction band.
he largest changes in refractive index are associated with the absorption ormission of radiation that results in transfer of electrons to or from the conduc-ion band, respectively [99]. Absorption of an incident beam of frequency ��gap=Egap/� and intensity I leads in the steady state to a partial filling of the con-
uction band near its bottom and a lowering of the electron occupation level at theop of the valence band. This results in a change in the effective gap with Egap�I�
Egap�0� and a change in the optical properties of the semiconductor called “bandlling” or “band blocking,” as indicated in Fig. 33.
urthermore, when a negatively charged electron leaves the valence band iteaves behind a positively charged “hole.” As a result of the coulomb interactionetween the two, additional states called “excitons” are introduced into theandgap near k� =0; see Fig. 34 [99]. Because of their close proximity to the bot-om of the conduction band, these states can be easily bleached out, either byhermal fluctuations �kBT or by incident light, producing another change in theptical properties called “exciton bleaching.”
he dimensionality of allowed electron motion (3D in bulk semiconductors) cane reduced to 2D in quantum wells and superlattices (kx and ky), to 1D in quan-um wires �kx� and 0D (k� =0, full confinement in all three directions) in QDs102]. This reduction in dimensionality changes (1) the nature of the density oftates in the valence and conduction bands, for example, from continuous in 3Do discrete states in 0D, as well as (2) the magnitude of electric dipole transition
Figure 33
a) Absorption spectrum and its change �−�� before and after the passage of anptical field with ���Egap through the semiconductor. (b) Spectral dependence ofhe absorption and refractive index changes. The index change refers to GaAs.
dvances in Optics and Photonics 2, 60–200 (2010) doi:10.1364/AOP.2.000060 102

ef
Twvtv
(Ecb
((tas
A
lements due to changes in the overlap of the initial and final state electron waveunctions. Hence n2 also changes!
he nonlinearity is called “active” when a field is incident on a semiconductor inhich the conduction band is initially occupied by pumping electrons from thealence band, either by electrical injection or by optical pumping so that for cer-ain transition regions the occupation is higher in the conduction band than in thealence band and gain is achieved [103–106]. As shown in Fig. 35, similar
Figure 34
a) Location of the exciton states relative to the conduction and valence bands.
0 is the maximum binding energy. (b) Model for the electron–hole pair for ex-iton states. (c) Energy of the lowest-lying exciton state (E0, n=1) versus theandgap energy for a number of semiconductors [99].
Figure 35
a) Semiconductor with electrons in the conduction band resulting from opticalsolid black arrow) or electrical pumping. An incident field stimulates an elec-ron to drop down to the valence band, producing gain at the optical output. (b)nd (c) Induced change in the absorption spectrum due to the stimulated emis-ion. (d) Resultant change in the refractive index.
dvances in Optics and Photonics 2, 60–200 (2010) doi:10.1364/AOP.2.000060 103

cnm
Tnbtitt[cfi
I2wfrbFt
4D
4
Aettps(fi�tggcirih(ett
Bss
A
hanges but opposite in sign occur in the refractive index, and the absorption isow negative; i.e., gain exists. Such semiconductor optical amplifiers are theost versatile all-optical signal processing elements available to date [105].
he characteristic time for both passive and active nonlinearities is the recombi-ation time r for electrons returning to the valence band from the conductionand, typically 10 ns for GaAs at room temperature. For example, for high input in-ensities the index change associated with the passive nonlinearity can be turned onn subpicosecond time scales but the turnoff time is dictated by the recombinationime; i.e., the index change lingers for r as indicated previously in Fig. 4 , or byhe time it takes to sweep out the electrons, for example, by an applied electric field107]. There are also other mechanisms associated with electron dynamics in theonduction band that will be discussed with respect to semiconductor optical ampli-ers and active nonlinearities [103–106].
n addition, there are other ultrafast nonlinearities like the usual Kerr effect,PA, and the Raman effect, which are relatively much weaker in spectral regionshere there is significant linear absorption [100]. The quadratic (or ac) Stark ef-
ect (QSE), which is a significant contributor to the overall ultrafast nonlinearesponse below the band edge, is often referred to as “virtual saturation,” since itecomes real saturation or band filling for input frequencies above the bandgap.or input frequencies lower than the bandgap region and Urbach tail, these ul-rafast mechanisms dominate the nonlinear response of the semiconductor.
.1. Carrier-Related Nonlinearities (Excitation ande-Excitation of Carriers)
.1a. Bulk (3D) Semiconductors
t 0 K incident radiation of frequency �gap=Egap/� can be absorbed to move anlectron from the top of the valence band to the bottom of the conduction band, andhe absorption is zero for�gap��. For���gap, absorption occurs via near verticalransitions [Fig. 32(a)] that conserve k� with a maximum probability given by theroduct of the density of states in the valence band times the density of unoccupiedtates in the conduction band times the electric dipole transition matrix elementswhich are a measure of the overlap of the spatial wave functions in the initial andnal states) [99]. Thus the absorption spectrum rises smoothly from zero for ��gap. At finite temperatures, the electrons pick up an additional energy�kBT, and
he top and bottom of the bands are now blurred and extend into the gap over ener-ies typically of order kBT. In practice, defects also contribute to this additional re-ion, which is called the Urbach tail. As a result, the absorption spectrum now de-ays smoothly to zero in the gap region even for �gap��. The more intense thencident light, the larger the change in the occupation of states in both bands with aesulting decrease of the absorption; see Fig. 33. The contribution to the refractivendex is different for an electron in the valence versus the conduction bands, andence the dispersion in the refractive index is also changed with increasing intensitylinked to the absorption change via the Kramers–Kronig relation). These nonlin-arities are called “passive.” Furthermore, since the density of states is high and theransition matrix elements large, the index change can be saturated at moderate in-ensities. For details, see [108].
and filling (blocking): There are multiple theories of carrier nonlinearities inemiconductors; however, for most cases of interest they give comparable re-
ults. Here we follow the discussion of [100]. The theory of Banyai and Kochdvances in Optics and Photonics 2, 60–200 (2010) doi:10.1364/AOP.2.000060 104

[samvsawmdbgtpibr
wtl(estttstea
Aebtcoh
w
A
109], which includes the effects of electron–hole Coulomb interaction, plasmacreening, and band filling, is perhaps the most general; however, in order to givequantitative analysis, a knowledge of the value for the interband matrix ele-ent is required. This is often difficult to calculate from first principles, and the
alue is often approximately determined by comparing the computed and mea-ured linear absorption spectrum. This theory is beyond the scope of this papernd luckily is often not needed, as the following theories give good agreementith experiments. The theories that we refer to as band-filling models are theodel attributed to Aronov et al., [110] and Austin et al., [111] (BF1), and the
ynamic Moss–Burstein model with Boltzmann statistics [112–114] (BF2). Inoth theories the refractive changes are attributed to carriers independent of theeneration mechanism, for example by single-photon absorption or 2PA. In BF1he nonlinear refraction from free carriers is calculated directly from the realart of the complex dielectric function. Creating a density �Nc of free electronsn the conduction band accompanied by the elimination of a density −�Nc ofound electrons in the valence band changes the index of refraction for off-esonance excitation �q�Eg� by �n [111],
�n = −�Nce
2
2�0n0�2mcv
Eg2
Eg2 − ����2
, �4.1�
here mcv is the reduced effective mass of the electrons in the conduction band andhe holes in the valence band. Hot-carrier effects are neglected in Eq. (4.1) for pulsesonger than a few picoseconds, which is the time carriers take to reach the band edgethermal equilibrium with the lattice discussed later in the context of active nonlin-arities) for most semiconductors [111]. Shorter pulse excitation requires the moreophisticated analysis of Banyai and Koch [109]. The factor Eg
2 / �Eg2−q2�2� can be
hought of as an enhancement factor of the usual plasma index change. This simpleheory explains most of the nonlinear refraction encountered for carrier nonlineari-ies where the carriers are generated by single- or multiple-photon absorption. Wehould also mention that the carrier nonlinear refraction is always negative, i.e., leadso self-defocusing nonlinearities. While the following heuristic is too simplistic toxplain the details, if one thinks of creating zero-frequency oscillators, one is alwaysbove resonance so that the index change is negative.
somewhat more sophisticated analysis is given in the BF2 model below. Thexcited carriers block the absorption at frequencies higher than the energy gapy filling the available states in the conduction band with electrons taken fromhe valence bands, Fig. 32. This model uses the Kramers–Kronig integral of thehange in absorption to obtain the change in index. The total change in the indexf refraction, including contributions from electrons, heavy holes, and lightoles, is given by Wherrett et al. as [113]
�n = −e2
2n0�2��Nc
mc�1 + Z�mck
mJhe +
mcl
mJlc� +
�Ph
mh�1 + Z
mch
mJhh�
+�Pl
ml�1 + Z
mcl
mJll�� , �4.2�
here
Z =2 Ep ����2
, �4.3�
3�� kBT Egdvances in Optics and Photonics 2, 60–200 (2010) doi:10.1364/AOP.2.000060 105

a�hdTis
Eew
wsvr
Tbb�Icdbatmscsb
Ttm
A
Jij = �0
� x2e−x2
x2 + aij
dx , �4.4�
aij =Eg − ��
kBT
mci
mj
, �4.5�
nd where the photogenerated electron and hole densities are given by �Nc andPh. The subscripts c, h, and l represent the conduction, heavy hole, and lightole bands respectively. Similarly m is the free-electron mass, and the subscriptsenote the bands as above. The electron charge is e, kB the Boltzmann constant,the temperature in kelvins, and Ep is the Kane momentum parameter, where EP
s �21 eV for most semiconductors [115]. In Eqs. (4.4) and (4.5), i and j are dummyubscripts that represent c, h or l. �Ph and �Pl are determined from [113]:
�Nc
�Ph
= 1 + � ml
mh�3/2
,�Nc
�Pl
= 1 + �mh
ml�3/2
. �4.6�
quations (4.2)–(4.5) are an approximation that is adequate for near-resonantxcitation. Off resonance, as is the case for 2PA, Jij should be replaced by Fij,ith Fij defined by
Fij = − 2J�mci
mj
Eg
kBT� + J�mci
mj
Eg − ��
kBT� + J�mci
mj
Eg + ��
kBT� , �4.7�
here the J defines the integral as in Eq. (4.4). For q��Eg and Eg�kBT, theecond term on the right-hand side (RHS) of Eq. (4.7) is dominant, and Fij re-erts to Jij as in Eq. (4.4) [101,103,104]. In 2PA experiments Eg-q� is compa-able with Eg, and all three terms in Eq. (4.7) should be retained.
he contribution of the electrons to the index change, �Nc in Eq. (4.2) includeslocking due to electron transitions from the heavy-hole band and light-holeand in addition to the change in the electron population in the conduction band.Ph and �Pl give the contributions of the holes from the respective transitions.
n semiconductors like ZnSe, CdTe, and GaAs with two-photon excitation ofarriers (thus using Fij in Eq. (4.2) rather than Eq. (4.4) for Jij) the change in in-ex from transitions between the light-hole and the conduction band (electronlocking, light hole blocking, and free-light-hole generation) are nearly equalnd contribute about one-third each to the total index change. This shows that forhese semiconductors it should be a good approximation to use a two-bandodel. This is the case discussed in what follows. Examining Jij in Eq. (4.4), we
ee for aij�1 that Jij �� /4aij. Substituting this value for Jij into Eq. (4.7), Fij be-omes proportional to x2 / �1−x2� with x=q� /Eg. Assuming a two-band model andubstituting Fij for Jij in Eq. (4.2) gives a change in index due to carrier transitionlocking �nb as
�nb �����2
�Eg2 − ����2�
. �4.8�
he dominant frequency dependence here comes from the denominator and ishe same as the enhancement factor in the theory of BF1 using a two-band
odel. This agreement is expected, since the same physical mechanism is useddvances in Optics and Photonics 2, 60–200 (2010) doi:10.1364/AOP.2.000060 106

ic
Ifsq
wtHcwwbt�pb
wI
Dwin
E
�
�
�
n
k
A
n both calculations. Comparison of these theories for 2PA excitation in semi-onductors like ZnSe, CdTe, and GaAs shows good agreement [10].
n this case we can write an equation for the nonlinear refraction by using a re-ractive cross section �R with units of square centimeters (as was used in Sub-ection 2.6 for molecules), using Eq. (4.2) to obtain a function of the ratio� /Eg=x as
�n =�R�N
kvac
=�2e2
2�0n0m
Ep
Eg3
1
x2�x2 − 1��Nc, �4.9�
here we replaced the effective mass with mEg /Ep [100]. Often in the literaturehe kvac is not used in the definition, leaving a cross section in cubic centimeters.ere we use kvac so that we can compare these semiconductor free-carrier refractive
ross sections with the molecular cross sections discussed in Subsection 2.6. Theree saw values in the 0.5 to 210−17 cm2 range, which as we will see is comparableith those for semiconductors; seeTable 8 below. Since the hole densities are relatedy Eqs. (4.6) to the conduction band carrier density, the key parameter for describinghe band filling effect is the electron density in the conduction band at energy E,Nc�E�. Assuming that the population of the conduction band can be neglectedrior to the incidence of the optical beam, for a semiconductor with a single directandgap (two-band model),
d
dt�Nc�E� = 1�I�
I�t�
��−�Nc�E�
r
, �4.10�
here 1 is the intensity absorption coefficient and r is the recombination time.n steady state,
�Nc�E� = 1�I�I�t�
�� r. �4.11�
efining �R as the cross section for the index change (from Eqs. (4.2)–(4.7)hen a carrier is promoted from the valence to the conduction band and assum-
ng minimal change in the absorption spectrum, the band-filling nonlinearity
2,scbf is deduced to be
Table 8. Parameters Needed for Carrier-Related Nonlinearities in SelectedSemiconductorsa
Parameter InSb GaAs ZnSe ZnS CdS ZnO CdTe
g (eV) 0.18 1.42 2.67 3.66 2.42 3.2 1.44
�cm2� 810−16
[116]4.410−18
[9]710−18
[9]310−18
[117]6.510−18
[118]
R �cm2� 2–410−15
[119]3.810−16
[10]4.710−17
[10]3.810−16
[117]910−17
[118]3.010−16
[10]
r (ns) 50 1[9]
�1[9]
3.6[117]
2.8[118]
10 µm 1064 nm 1064 nm 1064 nm 532 nm 532 nm 1064 nm
4.0 3.43 2.7 2.4 2.6 1.9 2.7
aDefect-dependent and Auger (which dominate at high intensities) decay rates are not
nowingly included.dvances in Optics and Photonics 2, 60–200 (2010) doi:10.1364/AOP.2.000060 107

Nctitfo
IG�cf
Fq
w
MEarftoftrsatdrt
A
�n =�R�Nc�E�
kvac
= r1�R
kvac��I → n2,scbf =
r1�R
kvac��. �4.12�
ote that saturation of the index change will occur when 1 is reduced with in-reasing intensity. Furthermore, the electrons (and hence the index change) inhe conduction band can diffuse over distances of a few micrometers so that thendex change is not local. This nonlocality can be utilized to reduce the effectiveurnoff time in semiconductor waveguides with cross-sectional dimensions of aew wavelengths by applying an electric field to sweep out the carriers from theptical path [107].
n Table 8 are listed �R, r, and Egap for a number of common semiconductors. ForaAs, which exhibits an absorption maximum of �104 cm−1, this gives n2,scbf
10−9 cm2/W. Of course, the distance that the incident beam penetrates the semi-onductor is only a few micrometers. Table 9 breaks down contributions to the re-ractive index change caused by plasma and blocking.
requently short pulses are used with pulse width �t� r. In this case, subse-uent to the passage of the pulse, the induced index change �np is given as
�np =�RNc�E,t�
kvac
——→ r�t��t 1�R
kvac���
0
t��t
I�t��dt� =1�R
kvac��F , �4.13�
here F is the fluence. This index change decays in time as
�np�t� = �np exp�− t/ r� . �4.14�
ore on free-carrier refraction and absorption: In Subsection 2.6 we discussedSA and RSA in molecules. The absorption and refraction from excited states isnalogous to that occurring in semiconductors that is due to photogenerated car-iers (electrons and holes). Free-carrier absorption takes the role of ESA, andree-carrier refraction, as discussed above, takes the role of excited-state refrac-ion. The discussion of nonlinear absorption is otherwise nearly identical to thatf Subsection 2.6. The bands take on the role of the vibrational–rotational mani-olds, and the equations describing the loss are the same with simple redefini-ions of the quantities. For example, for linearly excited carriers in Eqs. (2.25) 1
eplaces the product of the ground state absorption cross section times the den-ity, i.e., Ng�1g, where N1 is the density of excited carriers (electrons and holes)nd �21 becomes the free-carrier absorption coefficient�. Here the assumptions arehat band filling can be ignored and that phonon relaxation to the bottom of the con-uction band (top of the valence band) is rapid on the time scale of the pulse. Theesulting nonlinear loss is then given by Eq. (2.26), reproduced here with the substi-utions made for semiconductors:
Table 9. Contributions to Change in the Index of Refraction Caused by Plasmaand Blocking
SemiconductorPlasmaElectron
BlockingElectron
BlockingElectron
lh-cPlasmah-hole
Blockingh-holehh-c
Plasmal-hole
Blockingl-holelh-c
ZnSe 20% 33% 23% 4% 16% 2% 2%
CdTe 27% 23% 21% 7% 15% 4% 3%
GaAs 34% 25% 24% 3% 10% 2% 2%
dvances in Optics and Photonics 2, 60–200 (2010) doi:10.1364/AOP.2.000060 108

HtefsplpsnaT[
Ej3ac
H=ega
Iplce
A
dF�t�
dz= − 1F�t� −
1�
2��F2�t� . �4.15�
ere the relaxation process within the band comes from phonon emission, andhe free-carrier absorption takes the place of ESA. Of course, associated withach absorption process are the corresponding refractive changes described by aree-carrier refractive cross section, �R, as discussed in this section. Values forample cross sections are given in Tables 8 and 10. While RSA is an importantroperty for organic dyes, semiconductors cannot be diluted in solvents; so theinear absorption is usually too large to utilize this nonlinear response excepterhaps in a few thin indirect bandgap materials [120]. However, free-carrier ab-orption and free-carrier refraction are independent of the method of photoge-eration. Thus, for example, 2PA can create the excitation, resulting in furtherbsorption from excited states in molecules or free carriers in semiconductors.hese processes will appear as fifth-order nonlinearities, i.e., ��3� :��1� processes
10].
xciton bleaching: As mentioned briefly before, exciton levels exist in the gapust below the conduction band in the vicinity of k� =0 [dashed curves in Fig.4(a)] [99]. Since the hole–electron binding is weak, these are Wannier excitons,nd their spectrum is hydrogenlike [Fig. 34(a)], with the levels becoming theontinuum reaching the bottom of the conduction band, [99]
En = Egap − E0
1
n2− Coulomb correction, �4.16�
E0 =�2
2mraB2
, aB =�2�0
e2mr
,1
mr
=1
me
+1
mh
. �4.17�
ere En is exciton energy offset from the conduction band for states for n1,2 ,3. . ., aBis the Bohr exciton radius for the n=1 state, and mr is the reducedxciton mass; see Fig. 34(b). Variation of the n=1 energy offset E0 versus band-ap energy is shown in Fig. 34(c) for a selection of semiconductors and indicatesn exponential relation between the two parameters.
n three dimensions well-defined exciton levels exist primarily at very low tem-eratures T, where kBT is smaller than the binding energy as shown in the calcu-ations reproduced in Fig. 36 [99]. As the carrier excitation increases with in-reasing incident light intensity due to absorption, at low temperatures thexciton line is rapidly bleached out and becomes essentially indistinguishable
Table 10. Comparison of Experimental and Theoretical Values for the IndexChange per Unit Carrier Density �R [10].
Material � (nm) Eg (eV) mc /m mv /m
�R �10−21 cm3�
Expt.Theory(BF1)
Theory(BF2)
ZnSe 532 2.67 0.15 0.78 0.8 1.6 1.6
CdTe 1064 1.44 0.11 0.35 5.0 5.9 5.9
GaAs 1064 1.42 0.07 0.68 6.5 7.2 6.2
ZnTe 1064 2.26 0.12 0.60 0.75 2.4 2.2
dvances in Optics and Photonics 2, 60–200 (2010) doi:10.1364/AOP.2.000060 109

fbeCab
Fccltic
4
It�tdci
Tf(c==o
A
rom the absorption band edge, which moves to higher energies because of bandlocking as discussed above. At room temperature in GaAs, the exciton peak isssentially bleached out owing to thermal excitation into the conduction band.learly at low temperatures the peak nonlinearity �n2,exc�10−7 cm2/W� associ-ted with the exciton line can be much larger than that due to band renormalizationut can also be much narrower in spectral width [99,121].
igure 37 shows the measured absorption of GaAs and its refractive index cal-ulated from the plasma model via the Kramers–Kronig relations for differentw input power levels at room temperature [108]. Initially, the index change isinear in the input power, showing that an effective n2 provides a useful descrip-ion for the nonlinearity. Note, however, that the saturation of the absorption andndex change since the absorption change for 1→3.2 mW is comparable with thehange for 20→30 mW.
.1b. Active Nonlinearities (with Gain)
n this process an electron population inversion ��Nc�Ec�−�Pv�Ev��0� be-ween the conduction and valence bands for some range of energy differenceEc−Ev� must be created [103–106]. This population inversion is produced ei-her by pumping optically (by absorption) electrons from the valence to the con-uction band or by injecting these electrons via electrodes attached to the semi-onductor. When a beam of frequency � is incident inside the region ofnversion, stimulated emission can occur, and the beam is amplified, accompa-
Figure 36
heoretical (includes plasma screening and coulomb interactions) curves for therequency dispersion of the (a) absorption and (b) refractive index at 10 K andc) absorption at room temperature in GaAs for different electron densities Ne in theonduction band. For (a) and (b), curve1, Ne=0; 2, Ne=51015 cm−3; 3, Ne=3
1016 cm−3; 4, Ne=81016 cm−3; and for (c), curve 1, Ne=11016 cm−3; 2, Ne
11018 cm−3; 3, Ne=21018 cm−3; 4, Ne=31018 cm−3 [99]. Here me
0.0665m0 mh=0.457m0, aB=12.5 nm, and E0=4.2 meV. Dashed curve, densityf states.
dvances in Optics and Photonics 2, 60–200 (2010) doi:10.1364/AOP.2.000060 110

nTb
Ttossh
Toet“�h3eeT
Tf
EtpKp
A
ied of course by electrons giving up energy by returning to the valence band.his amplification process is shown schematically in Fig. 35(a) and is describedy
d
dt�Nc�E� = − BI�t���Nc�E� − �Pl,h�E − ���� −
�Nc�E�
r
. �4.18�
ypically optical pumping with radiation fields of frequency �pump��gap is usedo achieve and maintain the population inversion, and very fast electron dynamicsccurs in the conduction band when an optical pulse is applied to produce theteady-state Fermi electron distribution as shown in Fig. 38 [103,104]. The corre-ponding electron temperature Tc of this Fermi equilibrium distribution can be veryigh.
o understand the fast time dynamics, consider what occurs when a short pulsef frequency � is incident [103,104]. As indicated in Fig. 38(b), stimulatedmission occurs and the gain is reduced. This results in a hole in the electron dis-ribution in the conduction band, Fig. 38(b), panel II. This process is calledspectral hole burning.” This hole is filled in [Fig. 38(c), III] on a time scale of100 fs by electron scattering, and subsequently this distribution relaxes (carrier
eating) on a picosecond time scale to a new Fermi equilibrium distribution [Fig.8(c), IV] at a lower electron temperature (since the total number of conduction bandlectrons is reduced). Since pumping continues, eventually the conduction bandlectron distribution [Fig. 38(c), V] returns to that prior to the incidence of the pulse.his occurs on a time scale that depends directly on the pumping rate.
hese dynamics have been probed experimentally and confirmed by modeling
Figure 37
xperiment (left-hand side) and theory (right-hand side) of the frequency spec-rum of the absorption and refractive index change in GaAs at different inputowers. The experimental refractive index change was obtained by taking theramers–Kronig transform of the experimental absorption spectrum at differentowers [108].
or very short pulses by passing an ultrashort probe beam through the sample
dvances in Optics and Photonics 2, 60–200 (2010) doi:10.1364/AOP.2.000060 111

atseTtonKr
4
Halaerneafi
Tmvl
(pdceld
A
nd evaluating the nonlinear phase shift imparted on the probe as a function ofime delay between pump and probe [106]. The calculated temporal evolutionhown in Fig. 39 agreed well with experiment. The integrated conduction bandlectron density �Nc recovers on the time scale of nanoseconds in this example.he dominant effects are the Kerr effect, carrier heating, and partial depletion of
he conduction band electron density. Note that an effective n2 over the picosec-nd time scale is not a useful parameter for the active case. The off-resonanceonlinear response of these active devices can also be modeled by usingramers–Kronig relations in a way similar to that done for the bound electronic
esponse discussed in the next Subsection [122].
.2. Ultrafast Passive Nonlinearities (Kerr Effect etc.)
ere we discuss the nonlinear refraction (along with the nonlinear absorption)ssociated with bound electrons in semiconductors and/or dielectrics. This non-inear refraction is called the bound electronic Kerr effect. These nonlinearitiesre only dominant in the transparency range of the material where other nonlin-ar optical effects are negligible, as they are usually the smallest of the nonlinearesponses discussed in this paper (but the fastest!). In the transparency range theonlinear optical response is due to the anharmonic motion of bound valencelectrons that have low mass and can respond at optical frequencies. Thus theyre often referred to as “instantaneous” nonlinearities; however, because of thenite response time ��10−15 s� they still show dispersion, as we will see.
here are three nonlinear processes that need to be taken into account, 2PA, Ra-an absorption, and the so-called QSE, often referred to as the ac Stark effect or
irtual band blocking; see Fig. 40. The nonlinear refraction can then be calcu-
Figure 38
a) Photon field incident on a semiconductor with conduction band partiallyopulated. (b) Stimulated emission reduces the gain as the conduction band isepopulated. (c) I, Conduction Fermi band population distribution before opti-al field incidence. II, Hole produced in electron distribution due to stimulatedmission. III, Relaxation to new electron distribution due to collisions. IV, Re-axation to new Fermi band distribution. V, Return to original (before field inci-ence) Fermi distribution by pumping (electrical or optical) [103,104].
ated by frequency nondegenerate Kramers–Kronig relations derived from cau-
dvances in Optics and Photonics 2, 60–200 (2010) doi:10.1364/AOP.2.000060 112

saes
w
wsg
Tpiic
Pd
A
ality. The change in index at �1 due to the presence of a strong excitation beamt frequency �2 is related to an integral over all frequencies � of the nondegen-rate nonlinear absorption at frequency �2 that is due to the presence of thetrong excitation light beam of frequency �2 by [123]:
n2��;�2� =c
�P�
0
� ���1;�2�
�12 − �2
d�1 �4.19�
here P denotes the principal value of the integral, and
���1,�2� = K�Ep
n01n02Eg3F2�x1,x2� �4.20�
ith x1, x2 given by ��1,2 /Eg, is the nonlinear absorption with F2 containing thepectral information as given in Table 11. K is a material-dependent constantiven by
Figure 39
heoretical modeling of the nonlinear phase shift (due to the index change) ex-erienced by a probe beam as a function of delay time between an intense excit-ng beam and the probe beam. TPA, 2PA (Kerr effect); SHB, spectral hole burn-ng; CH, carrier heating; TOT, total nonlinear phase shift; Ne, electron density inonduction band [106].
Figure 40
rincipal ultrafast nondegenerate two-photon processes that dominate semicon-uctor nonlinearities below the bandgap [122].
dvances in Optics and Photonics 2, 60–200 (2010) doi:10.1364/AOP.2.000060 113

ag
Tpatsbtp
ws
wis
Pi
w
A
p
A
K =25
5�
1
�02
e4
�m0c2
, �4.21�
nd m0 is the free-electron mass. The frequency degenerate n2=n2scuf�−� ;�� isiven by setting �=�2 after the integral has been performed.
he QSE functions in Table 11 are derived in [100] and come from a two-arabolic-band model of semiconductors, i.e., a single direct bandgap. Remark-bly this simple theory gives excellent predictions for the magnitude and spec-ral dependence of the observed nonlinear absorption and refraction inemiconductors and even dielectrics. Refinements of this theory to include fourands (or even higher bands) have been performed [124] and can give even bet-er descriptions of the nonlinear response to ultrashort pulses. This simple two-arabolic-band model gives the spectral dependence of degenerate 2PA as
F2 = � �2x − 1�3/2
25x5 � , �4.22�
here x=�� /Eg, which is shown in Fig. 41. Also shown in Fig. 41 are 2PA mea-urements of several semiconductors with the data scaled according to
F2���Eg
� =1
K�Ep
n2Eg32
exp, �4.23�
here K=3100 cm GW−1 eV5/2 (the experimental best fit) is used with Ep and Eg
n electron volts. Values of the measured 2PA coefficients �2exp� for representative
emiconductors along with several dielectrics are shown in Table 1.
lugging the F2 components into Eq. (4.19), performing the integrals, and tak-ng care to subtract divergences yields the nonlinear refractive index n2,scuf:
n2,scuf��1,�2� =�cK
2
�Ep
n01n02Eg4G2�x1,x2� , �4.24�
here the dispersion function G2 is given by
G2�x1,x2� =2
��
0
� F2�x�;x2�
x�2 − x12
dx�. �4.25�
s pointed out in [125], this integral, when E� ·r� Hamiltonians are used as op-�
Table 11. Components of Nonlinear Absorption Spectral Function F2�x1 ,x2�
Process F2�x1 ,x2�
2PA x1+x2�1 �x1 + x2 − 1�3/2
27x1x22 � 1
x1
+1
x2�2
Raman x1−x2�1 �x1 − x2 − 1�3/2
27x1x22 � 1
x1
−1
x2�2
QSE x1�1−
1
29x1x22�x1 − 1�1/2� x1
x12 − x2
2−
2�x1 − 1��x12 + x2
2�
�x12 − x2
2�2+
8�x1 − 1�2
x22 �
osed to A ·p� , can prove to be difficult to perform, since it includes some diver-
dvances in Optics and Photonics 2, 60–200 (2010) doi:10.1364/AOP.2.000060 114

gti
wq
Fa
A
ences that need to be subtracted out. However, this has been done with resultshat agree with experiments. The nonlinear absorption that goes into Eq. (4.19)s given in Table 11. The result is
n2,scuf��� =A
n02Eg
4G2���/Eg� , �4.26�
here the spectral dependence is in the G2 function as given in Table 12 and isuite complicated.
Figure 41
unction F2 (for 2PA) of Eq. (4.22) plotted as a function of �� /Eg (solid curve)long with data scaled according to Eq. (4.23) [124].
Table 12. Components of Dispersion of n2 from Various Nonlinear AbsorptionProcesses with G2�x1 ;x2�=G2
2PA�x1 ;x2�+G2Raman�x1 ;x2�+G2
acStark�x1 ;x2�
Process G2�x1 ;x2�
2PA H�x1 ,x2�+H�−x1 ,x2�Raman H�x1 ,−x2�+H�−x1 ,−x2�
QSEx2�x2
1
29x12x2
2�−1
2−
4
x12
+4
x22
−x2
2
x1
��1 − x1�−1/2 − �1 + x1�−1/2�
x12 − x2
2 �+
2x12�3x2
2 − x12�
x22�x1
2 − x22�2
��1 − x2�1/2 + �1 + x2�1/2�
� −2x2
2�3x12 − x2
2�
x12�x1
2 − x22�2
��1 − x1�1/2 + �1 + x1�1/2��x1=x2 1
29x14�3
4
�1 − x1�−1/2 − �1 + x1�−1/2
x1
−�1 − x1�−3/2 + �1 + x1�−3/2
8−
1
2
dvances in Optics and Photonics 2, 60–200 (2010) doi:10.1364/AOP.2.000060 115

H
TGn
Iat
TnrrTawdciint
Tnlefba
A
ere
H�x1,x2� =1
26x14x2
4� 5
16x2
3x12 +
9
8x2
2x12 −
9
4x2x1
2 −3
4x2
3
−1
32x2
3x12�1 − x1�−3/2 +
1
2�x2 + x1�2
��1 − x2 − x1�3/2 − �1 − x1�3/2�
−3
16x2
2x12��1 − x1�−1/2 + �1 − x2�−1/2�
+3
2x2x1
2�1 − x2�1/2 +3
2x2
2x1�1 − x1�1/2
+3
4x2�x2
2 + x12��1 − x1�1/2 −
3
8x2
3x1�1 − x1�−1/2
+1
2�x2
2 + x12��1 − �1 − x2�3/2�.� �4.27�
he last term in Table 12 allows one to calculate the limit of the nondegenerate
2 QSE. When the limit x1→x2 is taken, the contribution to the usual degenerate
2,scuf is obtained.
t is noteworthy that the bandgap scaling predicted can also be obtained by usingquasi-dimensional analysis. Such an analysis was used by Wherrett to obtain
he bandgap energy scaling of n2,scuf�Eg−4 [126].
he different contributions are plotted in Fig. 42. In general, below the 2PA reso-ance, 2PA, and Raman effect contribute nearly equally to the small, positive,elatively dispersion free region of n2,scuf, and then 2PA takes over around the 2PAesonance and begins to decrease n2 to take it negative above the 2PA resonance.here the strong one-photon resonance negative contribution from the QSE kicks ins well to take n2 very negative near the 1PA bandgap. This region of the spectrumhere n2 decreases rapidly for ��→Eg is shown in Fig. 43 along with experimentalata. This response evolves smoothly into the real band-blocking nonlinearity dis-ussed in the paragraphs titled “4.1a Band filling (blocking).” Nonlinear refractivendices of several materials have been measured, covering a broad range of normal-zed frequency as shown in Fig. 44. Figure 45 shows the wavelength dispersion of
2,scuf in ZnS along with its 2PA spectrum [127]. In both cases, the agreement ofheory with experiment is good.
he hidden Eg−4 scaling can be displayed more conveniently on a log/log plot of
2 scaled by the dispersion function G2 as in Fig. 46. Here it is seen that the non-inear index at 1064 nm varies from −3.310−13 cm2/W for GaAs, to +3.1
10−16 cm2/W for Al2O3, to +1.2310−13 cm2/W for ZnTe. We also see that, forxample, the measured values of n2 for ZnSe at 1.06 and 0.532 µm, which have dif-erent signs, are consistent with the scaling law derived from a simple two-parabolic-and model. Again, several of the experimentally measured nonlinear parameters
re shown in Table 1.dvances in Optics and Photonics 2, 60–200 (2010) doi:10.1364/AOP.2.000060 116

4
AadaKtmm
Sff
Sf
A
.3. Low-Dimensional Semiconductors
s we have seen in the previous discussion on semiconductor nonlinear optics,t telecommunications wavelengths of about �=1.55 µm, typical bulk semicon-uctors have a nonlinear refractive index insufficient for many applications. For ex-mple, silicon has an n2,el of 0.510−13 cm2/W, while GaAs is a bit larger at 1.5
10−13 cm2/W [128,129]. Both, however, fall far short of the needed strong opticalerr effect of an n2 of about 10−10 cm2/W to produce attractive index changes of
he order of 10−2–10−4 with MW/cm2 intensities. Yet, since these semiconductoraterials are exactly what is used in today’s electronic platforms, optical devicesade of compatible materials are needed if they are to be integrated as an active el-
Figure 42
pectral dependence of the different ultrafast contributions to the nonlinearity n2
or Egap���. Here 2PA refers to the two-photon absorption mechanism (Kerr ef-ect), RAM to the Raman effect, and QSE to the quadratic Stark effect [125].
Figure 43
pectral dependence of the function G2 ��n2� as ��→Egap along with data for aew measured semiconductors [125].
dvances in Optics and Photonics 2, 60–200 (2010) doi:10.1364/AOP.2.000060 117

eseotttc
Astr
Sm
A
ment. One potential approach (still unproved) is to make use of low-dimensionalemiconductors. Confinement in one or more dimensions of the conduction bandlectrons can change the nonlinear optical response of a semiconductor in a numberf ways. This includes confinement structures that are of the order of and smallerhan the exciton Bohr radius in either one (quantum well), two (quantum wire), or allhree (QD) spatial dimensions [99,102]. In each of these structures an excited elec-ron is confined by the dimensions of the structure, and its behavior can be signifi-antly altered from that of a bulk semiconductor of the same material [99,102].
s discussed previously, the transition matrix elements are a product of the den-ity of electron states �Ne� times the integral over the spatial overlap of the elec-ron wave functions in the valence and conduction bands. The overlap integraleferred to above depends on the details of the confined structure, and it can ac-
Figure 44
pectral dependence of the function G2 ��n2� for 0��� /Egap�1 along witheasured data for a few semiconductors [125].
Figure 45
Wavelength dispersion of n2 in ZnS (left) and 2PA spectrum (right) [127].
dvances in Optics and Photonics 2, 60–200 (2010) doi:10.1364/AOP.2.000060 118

ttd
wwlc
w�a
Ttit
Lo
A
ually be enhanced (or reduced) relative to the bulk case. For interband transi-ions between the valence and the conduction band(s), the oscillator strength µcv
epends on
µcv� �V�v
*�r�,k���E� · p���c�r�,k��dr3, �4.28�
here p� is the electron momentum operator, �v�r� ,k�� and �c�r� ,k�� are the electronave functions in the valence and conduction bands, respectively, and the al-
owed wave vectors k� depend on the dimensionality. For the confined states wean write
��r�,k�� = � ck��k�,r�� � ��0,r�� � ckeik�·r� = ��0,r��F�r�� , �4.29�
here the function F�r�� is traditionally called the envelope function while�0,r� is the Bloch wave function at k� =0. As a result Eq. (4.28) can be expandeds
�V�v0
* Fv*�E� · p��Fcdr3 + �
VFv
*Fc�v0* �E� · p���c0dr3. �4.30�
he first integral vanishes owing to the orthogonality between the valence andhe conduction band Bloch wave function, while the other terms are slowly vary-ng over any one unit cell. These terms can therefore be pulled out of the integral
Figure 46
og-log plot of the scaled dispersion function G2 showing the Eg−1 dependence
f n2 [125].
o give
dvances in Optics and Photonics 2, 60–200 (2010) doi:10.1364/AOP.2.000060 119

w
A�n
Itsb
we
Hcw
pc
T((tttmc
Tbtqd
Wnetpdcns
A
�V
Fv*Fc�v0
* �E� · p���c0dr3 � � �Fv*Fc��
V�v0
* �E� · p���c0dr3, �4.31�
here the sum is over unit cells in which Fv*Fc is slowly varying so that
� �Fv*Fc� = �
VFv
*Fcdr3. �4.32�
s a result the oscillator strength of the transition is determined by the integral
VFv*Fcdr3, which is the overlap of the envelope functions and is either zero or
onzero depending on the parity of Fv* and Fc.
n a similar way we can examine the intraband oscillator strength of the transi-ion between two states in the conduction band. This is particularly important,ince some two-photon transitions of interest will likely involve both a band-to-and transition and an intersubband transition. In this case we have
�V�cj
* �E� · p���cidr3 �4.33�
here i and j represent two different states in the conduction band. This can bexpanded to
�V�cj0
* �ci0Fcj* �E� · p��Fcidr3 + �
VFcj
* Fci�cj0* �E� · p���ci0dr3. �4.34�
ere again we can examine both of these integrals over unit cells, and in thisase the first integral is nonzero and the second is zero if we take them as Blockave functions. The first integral can again be zero or nonzero depending on the
arity of Fej* and Fei. However, one must consider that the �E� ·p�� operator will
hange the parity of Fei.
he changes in the electron density of states in going from a bulk semiconductorelectron motion allowed in full three dimensions, kx, ky and kz) to quantum wellselectron motion allowed in two dimensions, ky and kz), to quantum wires (elec-ron motion restricted to one dimension, kz) and finally to QDs in which the elec-ron is completely confined (zero dimensions) are illustrated in Fig. 47 [102]. Ashe dimensionality is decreased, the electron density becomes progressivelyore localized in energy. In fact, in zero dimensions (for QDs), the resulting dis-
rete energy spectrum resembles that found in molecular systems.
he interest in dimensionally reduced semiconductors for nonlinear optics haseen limited primarily to quantum wells and QDs [102]. The reason is simplyhat these structures can be fabricated in a number of different ways. High-uality quantum wires have proved to be difficult to fabricate, and the mainriver for their development has been quantum wire lasers [130].
hile the physics of electron confinement from one to three dimensions onanoscales is a fascinating and current subject, here we will focus on the nonlin-ar optical properties of such structures. Quantum wells have become a matureechnology, and indeed nominal enhancement of resonant nonlinear opticalroperties has been reported. For type II–VI semiconductor crystallites imbed-ed in glass matrices (QDs) it is not clear whether significant enhancement oc-urs [131], although there has been a report of large enhancement for III–Vanocrystals in glass [132]. The magnitude of enhancement experimentally pos-
ible in GaAs QDs is still unresolved although progress has been made on iden-dvances in Optics and Photonics 2, 60–200 (2010) doi:10.1364/AOP.2.000060 120

tsa
4
QmGoFdtMscast(GbwTecb
(Eqd[
A
ifying fabrication conditions which yield the desired geometries of the dottructures, etc. where materials research, especially in the GaAs system, is stillt the frontiers of the field.
.3a. Quantum Wells
uantum well structures have been fabricated in a surprisingly large number ofaterials, AlxGa1−xAs/GaAs, InxGa1−x As/GaAs, InGaAsP/InP, andaN/AlxGa1−xN, to name but a few [133–135]. However, the onus for nonlinearptics has been on AlGaAs/GaAs structures for a number of important reasons.irst, this material system is widely used in the optics industry for making lasers andetectors, as well as modulators of various kinds. Second, the molecular beam epi-axy (MBE) fabrication technology is very highly advanced, and the proliferation of
BE machines throughout the world has resulted in easy availability of high-qualityamples.Third, on the physics side, not only is there an excellent lattice match for theomposite structures, which reduces the internal strain, the reduced electron mass islso very small, leading to large nonlinearities. Hence here we focus on this materialystem. Shown in Fig. 48 (top) is a typical quantum well structure composed of al-ernating AlGaAs and GaAs layers deposited by MBE [136]. As indicated in Fig. 48bottom) periodic modulation of the bandgap results, with the bandgap energy ofaAs being lower than that of AlGaAs. As a result, the lowest energy conductionand electrons are confined to the GaAs regions in allowed discrete energy stateshose location and number depend on the detailed composition of the AlxGa1−xAs.he electron wave functions are essentially sinusoidal across the GaAs layers andxponentially decaying in the AlGaAs layers. The general parity conditions dis-ussed above require that states of the same symmetry in the valence and conduction
Figure 47
a) No confinement in electron motion in conduction band (3D bulk sample). (b)lectron confinement in 1D (2D quantum wells). (c) Confinement in 2D (1Duantum wires). (d) 3D confinement (0D QDs). (e)–(h) Electron energy E versusensity of states Ne�E� for (e) 3D, (f) 2D, (g) 1D and (h) 0D semiconductors102].
ands be connected by transitions, i.e., the even symmetry states (e.g., cosinelike
dvances in Optics and Photonics 2, 60–200 (2010) doi:10.1364/AOP.2.000060 121

wtcsl�abt
Tsaetqaas
Tqepssfcetif�
(er
A
ave functions) and the odd symmetry states. (When there is significant overlap ofhe wave functions between next-nearest-neighbor GaAs layers, the structure isalled a “superlattice”). The resulting calculated absorption spectrum consists of aeries of steps with transitions to confined energy levels Em occurring from the va-ence band when the photon energy ���Em occurs as indicated in Fig. 49(b), until��Egap AlGaAs, at which point it becomes a smooth continuum of the kind associ-ted with bulk semiconductor samples; see Fig. 49 [102]. Associated with eachound electronic state is an exciton level that produces discrete peaks in the absorp-ion spectrum lying below the photon energy associated with that bound state.
he observed absorption spectra of quantum wells agree with these predictions,ee Fig. 50 [136]. As expected, the onset of the absorption of bulk GaAs occurst a lower photon energy than the quantum well. Furthermore the quantum wellxciton features even at room temperature are better defined (narrower) than inhe bulk sample. In addition they show new features not discussed above that re-uire a more sophisticated treatment of the valence electrons than that allowed intwo-band model. Most specifically, the excitons associated with the light hole
nd heavy hole valence bands produce two separate peaks in the absorptionpectrum.
he early definitive experimental work on the nonlinear properties of multipleuantum wells (MQWs), which showed enhanced nonlinear properties due tolectron confinement and hence galvanized the field, is shown in Fig. 51 and re-orted in Table 13 [137]. This work focused on the nonlinear index change due toaturation of the exciton level. The intensity-dependent change in the exciton ab-orption coefficient was measured around resonance in a series of MQWs of dif-erent thickness, and the Kramers–Kronig relations were used to evaluate theorresponding index change. Both the maximum index change and the bandgapnergy increase with decreasing well width were found. A very important fea-ure of these results is that for a given MQW, the index change is sublinear in thencident intensity; i.e., an effective n2 is not a useful concept similar to the resultsound in bulk semiconductors and discussed above. Enhancements of a factor of
3 occur in the maximum refractive index change per excited electron in going
Figure 48
a) Typical MBE-deposited GaAs–AlGaAs quantum well. (b) Example of en-rgy levels and wave functions associated with electrons confined to the AlGaAsegions [136].
dvances in Optics and Photonics 2, 60–200 (2010) doi:10.1364/AOP.2.000060 122

fitet
Stsml
(a
Moo
A
rom bulk GaAs to relatively small GaAs MQWs [137]. Because the absorptions different for each data point in Fig. 51, it is more useful (see Fig. 52) to discusshe index change per electron raised from the valence to conduction bands. How-ver, this calculation also shows about a factor of 3 maximum enhancement forhe MQWs. That is, the �r we used for describing bulk materials is enhanced.
ubsequent experiments on GaAs/AlAs quantum wells at frequencies around halfhe bandgap also showed enhancements of a factor of 2–3 in n2 [138]. In yet anotheret of experiments, the nonlinearities of InGaAs/ InAlGaAs quantum wells wereeasured near their bandgap. The resonant excitation and saturation of the exciton
ine in the 1.48–1.55 µm spectral range gave a value of n2 of 610−10 cm2/W or
Figure 49
a) Idealized absorption spectrum for bulk GaAs including the exciton. (b) Ide-lized absorption spectrum of an AlGaAs–GaAs quantum well [102].
Figure 50
easured room temperature absorption spectrum of a 1 µm GaAs platelet andf a 50 period quantum well of comparable thickness. Note that the net thicknessf the quantum well sample is one half of the bulk sample [136].
dvances in Optics and Photonics 2, 60–200 (2010) doi:10.1364/AOP.2.000060 123

aedwve
4
Itdattmv
Rman
A
n index change of 610−4 for intensities in the 100 MW/cm2 range [139]. How-ver, unfortunately no comments were made on enhancements relative to bulk me-ia [139]. Finally, large enhancements were reported for GaAs/AlGaAs quantumells measured with 532 nm radiation, although no indication is given of the bulkalues used for comparison at that wavelength [140].The net conclusion is that mod-st enhancements of a factor of 2–3 have been measured.
.3b. Quantum Dots
n fact, by reducing the size in all three dimensions, forming what is called a QD,he material properties exhibit the largest changes relative to the bulk semicon-uctor. The reason for this is that each atom in a bulk material sees its neighborss replicas of itself. Hence very few atoms are at the edge or interface surface ofhe material, so that the material parameters or response of the material to an ex-ernal stimulus is basically determined by the atoms in the bulk. Thus in bulkedia the surface atoms can almost always be neglected, even though their en-
ironment or bonding to their neighbors is very different.
Figure 51
efractive index change calculated by using the Kramers–Kronig relation oneasured absorption coefficients for a variety of different quantum well widths
t five incident power levels 0.67, 1.27, 2.65, 5.4, and 7 KW cm2. Here
2,eff�max��1.510−6 cm2 W [137].
Table 13. Measurements of Nonlinear Refraction Coefficient n2 and Absorptionin Various MQWs
Material �bandgap (nm) n2 �cm2/W� NL (cm/GW) � (nm)
GaAs/AlGaAs [137] �840–870 �1.510−6 6 816
GaAs/AlAs [138] �740 5.510−13 4 1545
InGaAs/ InAlGaAs [139] �1600 6.010−10 6.6104 1500
GaAs/AlGaAs [140] 6.510−11 6.5105 532
dvances in Optics and Photonics 2, 60–200 (2010) doi:10.1364/AOP.2.000060 124

Odsottips
Ietnc
Taicjc
wae
Mc
A
n the other hand, for a nanosize structure like a QD the situation is dramaticallyifferent [102]. In this case all of the atoms are influenced by the fact that thetructure has a surface even though the nanostructure may be a cube of 100 at-ms on a side or composed of a million atoms. The consequence of the effect ofhe surface atoms and small volumes is that the energy level structure of the ma-erial is dramatically changed. Since the optical properties of a material dependntimately on its electronic structure, all of the material properties become de-endent on size. This result implies that the nonlinear optical coefficients at apecific wavelength can be tuned by changing QD dimensions.
n many ways QDs made by MBE have features that resemble those of mol-cules such as discrete optical transitions. However, it is not at all obvious thathe change in behavior due to a decrease in size will in practice always enhanceonlinear optical parameters as opposed to decreasing their nonlinear efficien-ies.
he simplest approximation is to assume spherically symmetric crystallites andtwo-band model. (Assuming ellipsoids has had only a minor effect on theoret-
cal results [141,142]. For example, the conduction band wave function Fc�r��an be expressed in terms of the product of spherical Bessel functions of order �,
����p�r /r0��, where r0 is the crystallite radius and ��p is its pth zero and spheri-al harmonics Y�
m�� ,��, so that [131]
Fc�r�� = B�pj����p�r/r0��Y�m��,�� , �4.35�
here B�p is a normalization constant. The valence band wave function Fh�r�� hassimilar form. Taking the zero of energy at the top of the valence band, the en-
rgy levels for the conduction electrons occur at
E�pc = Egap +
�2��p2
2m r2, �4.36a�
Figure 52
aximum change in refractive index per carrier concentration versus the carrieroncentration [137].
c 0
dvances in Optics and Photonics 2, 60–200 (2010) doi:10.1364/AOP.2.000060 125

wb
T5sats
w
Nowpraaeebas
Gl
Sb
A
ith successive levels 1s (�=0, p=1), 1p (�=1, p=1), etc. and for the valenceand
E��p�h =
�2���p�2
2mhr02
. �4.36b�
he valence and conduction band energy levels are shown schematically in Fig.3. Since µcv��VF
v*Fcdr3, the selection rules are ���� ,�nn� ,�mm�; so allowed tran-
itions (in this model) can occur only between similar symmetry states in the valencend conduction bands. In addition, there is a correction to the energies due to the in-eraction between the hole and electron pair; so the resonance frequency for a tran-ition is given by
���p = Eg +�2��p
2
2mhr02
+�2��p
2
2mer02
− be2
�rr0
, �4.37c�
here b is a numerical factor equal to 1.8 for ps→ps transitions.
ote that a different notation is frequently used when electron spin and spin–rbit coupling is included [131]. The valence band(s) arises from p orbitals,hich in the simplest case are sixfold degenerate (i.e., px, py, and pz with twoossible spin states each). Normally spin–orbit coupling lifts the degeneracy andesults in a fourfold degenerate pP3/2 valence band level and a twofold degener-te pP1/2 level. The complication arises because of the coupling between thetomic angular momentum J and the angular momentum L associated with thenvelope functions. As explained in detail in [131], for the lowest energy levels,ven symmetry states involving �=0 and �=2 are denoted pS3/2 (in the valenceand and pSe in the conduction band) and the lowest odd symmetry energy levelsre pP3/2 for �=1 and �=3, etc. It is this notation that is frequently used to de-cribe transitions in QDs.
lasses doped with II–VI semiconductor crystallites: Semiconductor crystal-ites doped into various glasses have been known for many decades as absorp-
Figure 53
chematic representation of the energy spectrum of the valence and conductionands for a QD.
dvances in Optics and Photonics 2, 60–200 (2010) doi:10.1364/AOP.2.000060 126

tiaeLTC
AhtBoaaadwtogeanniaf
Wraqsdss
TntdoTarptttIw
T
A
ion edge filters produced commercially by companies such as Schott and Corn-ng. By varying the crystallite size down to nanometer dimensions, thebsorption edge can be tuned over�100 nm, a well-known feature of QDs in gen-ral. Early degenerate four-wave mixing experiments near resonance by Jain andind stimulated interest in the nonlinear optics community in these systems [143].he most common semiconductor constituents have been the II–VI compoundsdS, CdSe, and CdTe (reviewed in [131]).
consensus on the nonlinear properties of these semiconductor doped glassesas been slow to emerge in the literature because of the complexity of these sys-ems. Much of the work has been summarized in the excellent review article byanfi et al. [131]. Three mechanisms for exciting the semiconductor electronsut of the valence band have been identified. First there is the usual absorption ofphoton to move an electron from the valence to conduction band as discussed
bove. The narrow luminescence peak associated with this process has a relax-tion (recombination) time of nanoseconds. Second, there are trapping statesue to bonds dangling from the glass or semiconductor or both at the interfaceith the glass. This process leads to a broad fluorescence peak with relaxation
imes of microseconds. The broad distribution is indicative of a broad spectrumf trap states. Third, photodarkening of the glass, which depends on the inte-rated optical flux, also occurs. This effect is believed to be due to the ejection oflectrons out of the semiconductor into the glass disordered matrix where theyre trapped. This darkening, which is strongly sample dependent, can be elimi-ated by heating the sample [144]. The contributions of these processes to theet nonlinearity can have different signs and different relaxation times, depend-ng on the particular system under consideration. Furthermore, these processesre coupled. For example, in a darkened sample the recombination time goesrom nanoseconds to picoseconds [145,146].
hether quantum size effects are relevant depends on the ratio of the crystalliteadius r0 to the exciton Bohr radius aB, i.e., R=r0 /aB. For example, aB is 3.2, 5.6nd 7.4 nm for CdS, CdSe, and CdTe respectively [131]. For R��3, significantuantum size effects have been found to appear. See, for example, the complex ab-orption spectrum measured in CdSe-doped glasses shown in Fig. 54 [147]. Manyifferent transitions with widely differing transition strengths between localizedtates are shown theoretically to contribute and their relative contribution dependstrongly on the crystal size.
he situation with respect to the nonlinear properties has been complicated by aumber of factors [131]. For example, there is always a distribution in the crys-allite sizes resulting from the fabrication methods used, which, given the strongependence of the electronic states and transition dipole moments between themn size as illustrated in Fig. 54, tends to smooth out the optical response [131].his affects primarily the resonant response. Unless specifically measured, theverage size of the crystallites and their density is estimated to at best an accu-acy of ±10%. Still another complicating factor is the fact that the crystallite com-osition, for example in CdSSe glasses, is not the same as that of the starting ma-erial [148]. Furthermore, free-carrier absorption is an important contribution tohe effective 2PA when measured with picosecond and longer pulses, and thewo effects were infrequently separated from one another experimentally [131].n summary, the detailed properties of the samples and their contributing physicsere in many cases not sufficiently well defined.
he resonant intensity-dependent index and absorption change was measured,
dvances in Optics and Photonics 2, 60–200 (2010) doi:10.1364/AOP.2.000060 127

ftecmtK
BntiBb4(vwivns
LdTi
A
or example, in a CdSSe-doped glass with average crystallite size of 11 nm, athe boundary between quantum confinement and bulk sample behavior [149]. Thexperimental results for the index change are shown in Fig. 55 for a crystallite con-entration of �10−3. The index change reported was �10−5, in reasonable agree-ent with the values both predicted from the partly phenomenological semiconduc-
or plasma theory based on bulk semiconductor parameters and by applying theramers–Kronig relations to the observed absorption change [149].
anfi and coworkers have carried out extensive measurements on the nonreso-ant properties of II–VI doped glasses, accompanied by complete characteriza-ion of relevant sample properties [131]. The key definitive results summarizedn the excellent review paper by these authors are shown in Figs. 56–58 [131].oth femtosecond and picoseconds pulses at different frequencies were used onoth bulk samples and a series of nanocrystallites with crystal radii varying over.8–14.0 nm for CdTe and 5.2–13.5 nm for CdS0.9Se0.1. To within a factor of 2which is comparable with the overall experimental uncertainty), no significantariation in Imag���3����2� versus crystallite size was found for all the cases andavelengths studied, and the values were essentially equal to the bulk sample value,
.e., no enhancement was observed; see Fig. 56. Given that varying the crystal radiusaries the semiconductor bandgap, the authors also tested whether the nonresonantonlinearity of quantum confined samples followed the trends predicted for bulkamples discussed in Subsection 4.2, specifically the functions F��� and G��� in
Figure 54
ow-temperature absorption spectra and their second derivative for three CdSe-oped glasses with mean crystal radii of 3.8, 2.6, and 2.1 nm, from top to bottom.he calculated contributing transitions are shown as stick spectra and are identified
n the inset [141,142].
dvances in Optics and Photonics 2, 60–200 (2010) doi:10.1364/AOP.2.000060 128

Essn
AcmrCdFttifiiaft
Am=c
A
qs. (4.20) and (4.4). The results in Figs. 57 and 58 show agreement with the bulkemiconductor results to within a factor of 2.The key conclusion from these detailedtudies is that quantum size effects have at most a factor of 2 effect on the nonreso-ant nonlinearities for the values of R investigated!
nother approach rooted in chemistry is to form semiconductor crystallites inolloidal suspensions via chemical reactions. Recently additional 2PA experi-ents were reported on small II–VI crystallites made this way, also over a broad
ange of frequencies [150]. The crystallite sizes for CdTe (r0=3.2,6.6 nm) anddSe (r0=1.9,2.1,2.2,2.4 nm) were smaller than those discussed above in theoped glasses studied by Banfi et al. [131]. An example of these results is shown inig. 59. Two cases were studied, the degenerate 2PA case, i.e., when two photons of
he same frequency were absorbed, and the nondegenerate case, when the input pho-ons had different frequencies. Note the oscillatory behavior observed in 2, whichs now evident for these smaller crystallites, versus frequency due to quantum con-nement. It was found that including band mixing in the theory gave a significant
mprovement to their agreement between theory and experiment, although thegreement was less satisfactory for the smallest crystallites, probably because the ef-ects of the split-off band were not included in the Kane k-p theory. The experimen-al results showed that the volume fraction normalized 2PA cross section actu-
Figure 55
bsorptive changes and corresponding dispersive index changes. (a) Experi-ental results: �=�N=1018 cm−3�−�N=0�. (b) Theoretical results, �p�I=3 MW/cm2�−��I=200 kW/cm2�. (c) Measured dispersive indexhanges, �nsb, using single-beam interferometry [149].
dvances in Optics and Photonics 2, 60–200 (2010) doi:10.1364/AOP.2.000060 129

aiawa
U
MoC
Pac
A
lly decreased with decreasing crystallite radius for R=r0 /aB�1. This decreases small and agrees with the expectation for the small reduction in density ofvailable states as the dot size decreases. It would be expected that these resultsould be applicable to other hosts and is consistent with the results of Banfi etl. for glasses [131].
nfortunately, the anticipated enhancements of optical nonlinearities were not
Figure 56
easured Im���3�� versus crystallite radius r0 and for a bulk crystal at wavelengthsf 1.2 µm (�), 1.4 µm (�) and 1.58 µm (�) for CdTe and at 0.79 µm (+) fordS0.9Se0.1 nanocrystals and bulk CdS [131].
Figure 57
lot of the scaled quantity �� /�0�4Im���3�� for bulk CdS and CdTe crystals as wells CdTe and CdS0.9Se0.1 nanocrystals with the radii shown in Fig. 56. The solidurve is a fit to Eq. (4.20) [131].
dvances in Optics and Photonics 2, 60–200 (2010) doi:10.1364/AOP.2.000060 130

rgppfc
Trpnlte
TMod
It
Ptydgoe
T
PCfi
A
ealized for glasses doped with II–VI semiconductors. Furthermore, these dopedlasses were found to be unsuitable for a range of nonlinear integrated optics ap-lications involving all-optical switching devices because of the semiconductorroperties of the II–VIs involved. Namely, these bulk materials have a large ef-ective electron mass, which produces an unfavorable trade-off between indexhange and absorption and the index change saturates at a small value [151,152].
here has been limited work performed on QDs in other materials systems: theesults are summarized in Table 14 In a study of III–V semiconductors usingump–probe Z-scan studies of GaAs nanocrystals grown in porous glass, theonlinear coefficient reported is 1.310−11 cm2/W. The bound electronic non-inear refraction in the quantum confined sample was found to be enhanced by a fac-or of 30 relative to that of the bulk crystal [132]. This is the only example of largenhancements reported in GaAs nanocrystals.
he other QD system in Table 14 involves a complicated sample structure. Then:ZnSe samples consist of a MnSe core, Zn1−xMnxSe diffusion region, and an
uter ZnSe layer.The authors found the nonlinearity to decrease with decreasing QDiameter.
t would appear that the variation in results from different experiments indicateshat more careful experiments are needed.
rospects for GaAs QDs: However, based on the enhancement obtained fromhe previously discussed MQW work, it is possible that the GaAs system couldield still better results for QDs. On the other hand, based on the II–VI QDs justiscussed, predicting enhancements can be a dangerous business. Controlledrowth of 0D QDs in the GaAs system has only been achieved in the past decader so; so there are expectations for new nonlinear optics measurements to test thenhancement hypothesis in this technologically important material system.
he Stranski–Krastanov (SK) MBE growth mode is the preferred method for
Figure 58
lot of Re���3�� versus �� /Egap for commercial semiconductor doped glasses (�),dS0.9S0.1 series glasses (�) and CdTe series glasses ().The solid curve is the bestt to Eq. (4.26) [131].
dvances in Optics and Photonics 2, 60–200 (2010) doi:10.1364/AOP.2.000060 131

gFtp7sftaf[
UbFbp
Dcd[
M
G
A
rowing GaAs QDs and capping them with higher bandgap material [154,155].or this growth mode the deposited material has a slightly larger lattice constanthan the substrate. For example, in this approach a material such as InAs is de-osited on a substrate like GaAs or AlAs. InAs has a lattice constant that is about% larger than that of GaAs or AlAs; so the small lattice mismatch introducestrain. During SK growth, the first few layers of InAs, typically 1.6 monolayers,orms a pseudomorphic 2D layer, called the “wetting layer” [Fig. 60(a)]. Afterhis critical thickness, however, 2D growth is no longer energetically favorable,nd the energy reduction in strain more than compensates for the increase in sur-ace energy as the 2D islands organize or self-assemble [156] into 3D islandsFig. 60(b)].
nder typical growth conditions the buried QDs are observed to be well alignedut significantly nonuniform in size, shape, and position [157–159]. As shown inig. 61 the QD structures are composed of different shapes. While there haseen significant progress in improving the homogeneity of both morphology andositioning of QDs, achieving control to better than 10% remains a considerable
Figure 59
egenerate and nondegenerate 2PA spectra for two CdTe doped glasses withrystallite radii of 6.6 nm (CdTe-750) and 3.2 nm (CdTe-600) and for two CdSeoped glasses with crystallite radii of 2.4 nm (CdSe-590) and 2.1 nm (CdSe-600)150].
Table 14. Nonlinearities Reported in Various QD Systems
Material n2 NL
�
(nm)
n:ZnSe [153] 1.410−14 cm2/W 8.4 cm/GW 800
aAs in porous vicor glass [132] 1.310−11 cm2/W 80 cm/GW 1064
dvances in Optics and Photonics 2, 60–200 (2010) doi:10.1364/AOP.2.000060 132

cmait
Ss
A
hallenge. For the SK growth, typical densities are 1010–1012 cm−2, althoughuch smaller densities are possible with care [160]. Meanwhile typical SK QD di-
meters [161] are from 10 to 30 nm. Depending on the growth conditions, as shownn Fig. 62, QDs can grow randomly spaced or in regular rows. Such regularity raiseshe possibility of a cooperative QD response.
Figure 60
Strain driven Stranski–Krastanov formation of a QD.
Figure 61
canning tunneling microscope image of the structure for two different QDhapes observed.
dvances in Optics and Photonics 2, 60–200 (2010) doi:10.1364/AOP.2.000060 133

A[ptttslldatci
4
Flctmfi
Amiptplmh
(at
A
very different approach to producing GaAs QDs is based on colloidal growth162–165]. Colloidal QDs are synthesized in a beaker from precursor com-ounds dissolved in solution. The synthesis is based on a three-component sys-em composed of precursors, organic surfactants, and solvents. When the solu-ion is heated to a sufficiently high temperature, the precursors chemicallyransform into monomers. Once the concentration of monomers reaches a super-aturated solution the nanocrystal self-assembled growth begins and is stabi-ized by a layer of surfactants attached to their surface. The typical size of a col-oidal QD is smaller than their MBE counterpart and is about 2–8 nm iniameter.The smaller size therefore results in high densities of about 1014 cm−2.Thepplication of colloidal QDs to the broad field of nonlinear optics may be larger thanhe possibilities for MBE nanostructures because of their significantly lower fabri-ation cost. However, even colloidal QDs suffer from poor uniformity of size with annhomogeneity that is typically also of the order of 10%.
.3c. Summary for Quantum Confinement Structures
or both quantum wells and QDs it is clear that the expectation of a dramaticallyarge enhancement in the nonlinear optical coefficients has not been clearly andonsistently demonstrated, and one can ask why? Basically the reason is that es-imates of the potential enhancement are complicated and that all of the experi-ental conditions, material preparation factors, and competing physics are dif-cult to control.
brief summary of the more important issues is given next. For example, weight expect the enhancement due to confinement to first increase with decreas-
ng size owing to the increase in the overlap of the wave functions, but at someoint we might expect a decrease with decreasing size as the overlap weakens ashe lowest energy state moves near the top of the well. Furthermore, the com-arison between low-dimensional and bulk material is again difficult because ofinewidth and fill factor issues that can significantly lower the effective enhance-ent. Another issue of importance is that low-dimensional structures have a
Figure 62
a) One layer of QDs that are randomly distributed; (b) several layers of QDs thatre influenced by the vertical stacking to form a vertical and lateral alignmenthat results in a large lateral separation between QDs.
igh density of surface states that are localized at the interface between the semi-
dvances in Optics and Photonics 2, 60–200 (2010) doi:10.1364/AOP.2.000060 134

ctahetslit
Attcetane
5
WmdaTg
I3llleim
St[
Twtaci
A
onductor’s well and barrier. That the optical excitation to these states is strongerhan in the bulk and second-harmonic generation at an interface is one good ex-mple. Obviously, the nonlinear behavior of low-dimensional structures couldave significantly larger interface issues. Yet another possibility for an observednhanced nonlinear behavior could be the differences in the nonradiative life-ime. The discrete nature of the energy levels in a low-dimensional structure pre-ents the potential of a longer nonradiative lifetime, a larger excited state popu-ation, and a narrower spectral linewidth. On the other hand, surface andnterface states can have the opposite effect, shortening the nonradiative life-ime, and must also be considered.
ll of these issues, and most likely some that we did not recognize, play a role inhe nonlinear interaction between light and low-dimensional structures. Many ofhe early investigations of the enhancement due to confinement have not yet paidareful attention to many of these issues. In many ways, the question of nonlin-ar optical effects in confined structures begs for more comparison betweenheory and carefully designed experiments in order to single out different issuesnd develop a clear understanding of the effects of decreasing the dimensions ofonlinear optical materials in order to take advantage and optimize the potentialnhancement and therefore engineer more efficient nonlinear optical materials.
. Nuclear (Vibrational) Contributions to n2
hen light couples via electric dipole interaction to other (than electronic) nor-al modes in matter, there is an intensity-dependent change in the refractive in-
ex [166]. Coupling to vibrational modes that modulate the molecular polariz-bility can give rise to significant contributions via n2,nuc (10%–20% in glasses).he formulation given below is for the cw case, normally valid for pulse widthsreater than 1–10 ps and has as its starting point a single vibrating molecule.
t is well known that an isolated molecule containing N atoms can typically haveN−6 vibrational degrees of freedom. Some are dipole active, i.e., they modu-ate the permanent dipole moment, and others are Raman active, i.e., they modu-ate the molecule’s polarizability [167]. Dipole active modes are observed in theinear absorption spectrum, whereas Raman active modes participate in nonlin-ar optical interactions such as Raman scattering and stimulated Raman scatter-ng. In condensed matter these rules can be broken, and weak Raman activeodes can appear in the linear absorption spectrum and vice versa.
ince this effect is rarely found in textbooks, we give a more detailed discussionhan in previous sections. The polarizability for a molecule can be written as167,168]
�m =��mL + �
�
qn�� ��mn
�
�qn� �
qn�=0 . �5.1�
he key material parameter is the nonlinear polarizability tensor ��mn� /�qn
�,hich characterizes the coupling between the light and the Raman active vibra-
ional modes. In Eq. (5.1), the summation over � is taken over all of the Ramanctive vibrational modes, which have a vibrational amplitude q� ���. For a singlew incident field E��r� , t� of frequency �, a nonlinear polarization parallel to the
ncident field [for n2�,nuc�−� ;��] is induced in the molecule of the formdvances in Optics and Photonics 2, 60–200 (2010) doi:10.1364/AOP.2.000060 135

ww
Ftg
wc
amipfmfe
I
S
Mthac
A
p�NL = �
�
qn�� ���n
�
�qn� �
qn�=0
�f �1��2E�, �5.2�
hich includes the local field correction f�1�. The potential energy associatedith this interaction is given by
Vint� − � p�NLdE� = −
1
2��
qn�� ���n
�
�qn� �
qn�=0
�f �1��2E�E�. �5.3�
rom classical mechanics, there is an all-optical force F� � that induces the vibra-ion in the�th mode (approximated as a simple harmonic oscillator) in the moleculeiven by
Fn� = −
�
�qn�
Vint =1
2� ���n
�qn� �
qn�=0
�f �1��2E�E� = m��qn� + ��qn
� + ��2 qn�� ,
�5.4�
here m� is the effective mass associated with the vibration and ��−1 is the opti-
al phonon lifetime [168]. Note that the field product contains frequencies at 2�
nd 0, which drive the vibrations at �=0 and �=2�. Here �� is the normalode (natural) vibration frequency versus�, which is the frequency at which qn
�
s driven by the mixing of the optical fields. The response due to 2� clearly de-ends on the wavelength of the incident light. In the subsequent discussion weocus on the dc term, although the harmonic term will progressively contributeore to the process as the light frequency is decreased toward the vibrational
requency. Substituting the solution to Eq. (5.4) into (5.2) gives, in the mol-cule’s frame of reference,
p�NL�r�,t� = �
�
1
8m���2�� ���n
�
�qn� �
qn�=02
��f �1��4�E�����2E����ei�k�·r�−�t� + c.c.
�5.5�
nserting into the slowly varying phase and amplitude approximation gives
⇒n2�,nuc�− �;�� = ��
N
4n�2���m��0
2c��2�� ���n
�
�qn� �
qn�=02
�f �1��4. �5.6�
imilar considerations give
n2�,nuc�− �;�� = ��
N
4n����nm����02m�c��
2�� ��mn�
�qn� �
qn�=02
�f ��1�f m
�1��2.
�5.7�
ost of the interest in n2,nuc has been for glasses that have small Kerr nonlineari-ies, especially in the case of fused silica. The principal problem in evaluating n2,nuc
as been the lack of information about the molecular Raman polarizability tensornd the fact that disorder etc. in the glassy state leads to continuous rather than dis-
rete Raman spectra. There is, however, a wealth of Raman scattering spectra thatdvances in Optics and Photonics 2, 60–200 (2010) doi:10.1364/AOP.2.000060 136

a
xi
wni
T
f
d
o
be
Ite
TitFt�=
Ds[
F
8
6
0
2
A
rise from thermally excited vibrations in a medium. For a single molecule, the
-polarized Raman spectrum in the limit kBT���� (typically room temperature)s given by
I���s�
��I��p�= �
�
�s4
8c4�4��2�02��� ���n
�
�qn� �
qn�=0�2� kBT
m���2
� ��/2�
��s − �p + ���2 + ��2
+��/2�
��s − �p − ���2 + ��2� , �5.8�
hich contains the same Raman tensor as n2�,nuc [168]. Here �� is the standardotation for the solid angle subtended at the detector in spontaneous Raman scatter-ng and is not related to the sound wave frequency.
he glass disorder can be described by a distribution of phonon frequencies
���−��0�. Comparing the single-molecule Raman spectra (and Raman gain)
ata with the Raman spectra of the glasses shows that for the spectral width���
f f���−��0� with the approximation ���� ��, the Lorenzian functions can
e written as ���s−�p±���. Integrating over the distribution f���−��0� andliminating the Raman polarizability gives
n2�,nuc�− �;�� �c3�4��2
n2����4kBT
�0
�
I���s�d�� − �s�
��I���. �5.9�
n this equation �0�I���s�d��p−�s� is the absolute value of the integrated spon-
aneous Raman spectrum for the Stokes side over the solid angle��, a relativelyasy measurement.
he OKE technique referred to in Table 15 consists of the excitation of a totalndex change with an intense femtosecond pulse and then use of a second fem-osecond pulse to probe the index change [169,171]. A typical result is shown inig. 63(a). The ringing corresponds to the vibrational response when the ul-
rashort pulse of duration �t excites the vibration as a �-function impulse, i.e.,t���1. Detailed modeling shows that after about �10 ps the measured n2,eff
n2,/Kerr+n2,nuc; see Fig. 63(b) [83].
ata also exist for n2,nuc in media other than glasses. The noninstantaneous re-ponse of liquid CS2 has been measured by a number of authors (for example83,172]). Careful analysis of experimental data led to the following results mea-
Table 15. Fractional Contribution Measured of n2,nuc to the total n2 for a FewGlasses
Glass Wavelength (nm) Nuclear Fraction (%) Method
used silica �SiO2� [166] Visible �15–18 Raman
7%GeS2-13%Ga2S3 [169] 825 13±5 35 fs OKE
4%PbO-14%Bi2O3-7%B2O3-15%SiO2 [169] 825 12±5 35 fs OKE
%−50%GeO2 in GeO2-SiO2 [170] 800 13–18 18 fs SRTBCa
0%Nb2O5-80%TeO2 [171] 800 20 100 fs OKE
a
SRTBC-spectrally resolved two beam coupling.dvances in Optics and Photonics 2, 60–200 (2010) doi:10.1364/AOP.2.000060 137
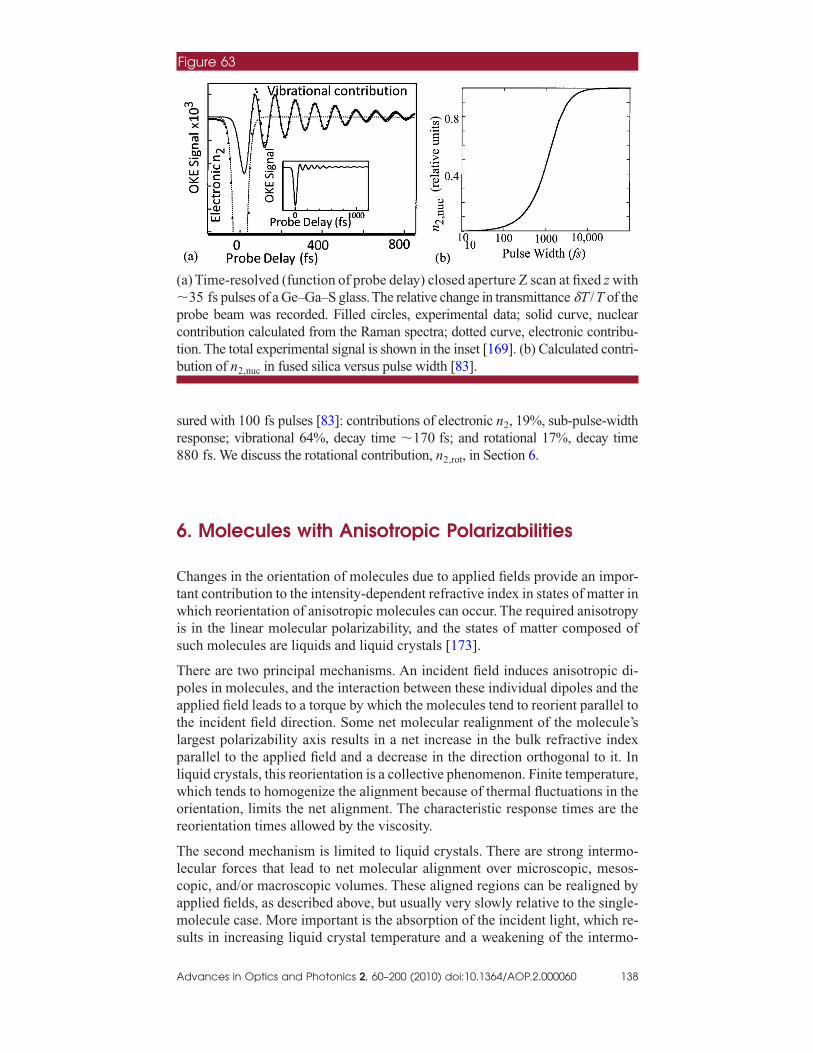
sr8
6
Ctwis
Tpatlplwor
Tlcams
(�pctb
A
ured with 100 fs pulses [83]: contributions of electronic n2, 19%, sub-pulse-widthesponse; vibrational 64%, decay time �170 fs; and rotational 17%, decay time80 fs. We discuss the rotational contribution, n2,rot, in Section 6.
. Molecules with Anisotropic Polarizabilities
hanges in the orientation of molecules due to applied fields provide an impor-ant contribution to the intensity-dependent refractive index in states of matter inhich reorientation of anisotropic molecules can occur. The required anisotropy
s in the linear molecular polarizability, and the states of matter composed ofuch molecules are liquids and liquid crystals [173].
here are two principal mechanisms. An incident field induces anisotropic di-oles in molecules, and the interaction between these individual dipoles and thepplied field leads to a torque by which the molecules tend to reorient parallel tohe incident field direction. Some net molecular realignment of the molecule’sargest polarizability axis results in a net increase in the bulk refractive indexarallel to the applied field and a decrease in the direction orthogonal to it. Iniquid crystals, this reorientation is a collective phenomenon. Finite temperature,hich tends to homogenize the alignment because of thermal fluctuations in therientation, limits the net alignment. The characteristic response times are theeorientation times allowed by the viscosity.
he second mechanism is limited to liquid crystals. There are strong intermo-ecular forces that lead to net molecular alignment over microscopic, mesos-opic, and/or macroscopic volumes. These aligned regions can be realigned bypplied fields, as described above, but usually very slowly relative to the single-olecule case. More important is the absorption of the incident light, which re-
Figure 63
a) Time-resolved (function of probe delay) closed aperture Z scan at fixed z with35 fs pulses of a Ge–Ga–S glass.The relative change in transmittance �T /T of the
robe beam was recorded. Filled circles, experimental data; solid curve, nuclearontribution calculated from the Raman spectra; dotted curve, electronic contribu-ion. The total experimental signal is shown in the inset [169]. (b) Calculated contri-ution of n2,nuc in fused silica versus pulse width [83].
ults in increasing liquid crystal temperature and a weakening of the intermo-
dvances in Optics and Photonics 2, 60–200 (2010) doi:10.1364/AOP.2.000060 138

lpw
6
AsgCof
a
w
a
(afs
A
ecular forces relative to thermal fluctuations. Decreasing alignment leads torogressively more spatially uniform refractive index and large index changesith temperature.
.1. Single-Molecule Reorientation of Anisotropic Molecules
nalysis of molecules with 3D molecular anisotropy involves Euler angles andtraightforward but cumbersome mathematics. Instead of discussing the mosteneral case, we illustrate this with the simpler case of a linear molecule such asS2 with symmetry in the polarizability orthogonal to the linear axis [2]. The ge-metry of interest is illustrated in Fig. 64(a). The incident field in the laboratoryrame of reference is assumed to lie along the x axis,
E� �r�,t� = exE0���cos�k� · r� − �t� ,
nd the polarizability tensor in the molecule’s frame of reference is given by
ith ���. The local field at the molecule is given by
E� loc = �ex cos �a − ey sin �a cos �a + ez sin �a sin �a�f �1�E0���cos��t� ,
f�1� =�r��� + 2
3, �6.1�
nd the dipole moment induced in the ath molecule is given by
Figure 64
a) Orientation coordinates of a liquid CS2 molecule when an optical field islong the x axis in the laboratory frame of reference �x ,y ,z�. The molecularrame of reference is defined by �x , y , z�. (b) Solid-angle element with circularymmetry.
dvances in Optics and Photonics 2, 60–200 (2010) doi:10.1364/AOP.2.000060 139

T
ioePr
nd
wfl
a
Af
im
A
p�a�r�,t� = �� · E� loc = �ex� cos �a − ey� sin �a cos �a + ez� sin �a sin �a�
�f �1��2E0���cos��t� . �6.2�
he polarization Px induced along the laboratory frame’s x axis is given by
Px = N�ex · p�a� = N�� + �� − ���cos2 �a���f �1��2E0��� , �6.3�
n which � � denotes the average over all possible molecular orientations, i.e.,ver �a. Because of the molecular symmetry, the average is taken over rings withffective area elements sin �a d�a (i.e., −d cos �a), see Fig. 64(b). The probabilityr��a� of finding a molecular axis ��� in a cone at angle �a to the x axis (field di-ection), with a cone width −d cos �a, is
Pr��a� � d cos �a exp − �Ordering potential energy
Disordering energy ,
ormalized to �10 Pr��a�=1. The ordering is due to the potential energy of the in-
uced electric dipole in the applied field,
Vint = −1
2p�a · E� loc = −
1
2�� cos2 �a + � sin2 �a��f or
�1��2E02���cos2��t� ,
�6.4�
here cos2��t� is the time average of cos2��t�, i.e., 12 .The disorder is due to thermal
uctuations of energy kBT. Thus
Pr��a� =
exp��−
�E0
2���
4kBT+
�� − �
�cos2�aE0
2���
4kBT��f
�1��
2�d cos �a
�1
0
exp��−
�E0
2���
4kBT+
�� − �
�cos2�aE0
2���
4kBT��f
�1��
2�d cos �a
,
�6.5�
nd therefore
�cos2 �a� =
�1
0
cos2 �a exp� �� − ��cos2 �a
4kBT�f �1��2E0
2����d cos �a
�1
0
exp� �� − ��cos2 �a
4kBT�f �1��2E0
2����d cos �a
.
�6.6�
ssuming that the net reorientation is small and therefore that quantities of theorm ex can be expanded as 1+x, after some algebra
Px = N�� f�1� +�� − ��2E0
2���
45kBT�f �1��2�f �1��2�E0��� , �6.7�
n which � is the isotropic polarizability due to completely randomly oriented
olecules before a strong optical field is turned on. The nonlinear contributiondvances in Optics and Photonics 2, 60–200 (2010) doi:10.1364/AOP.2.000060 140

cc
Ia
Noi�
Ttt
wojt[c�
6
Tv
Vp
A
an now be written as an effective intensity-dependent refractive index coeffi-ient n2,or as
n2�,or�− �;�� =N
nx2�0
2c
�� − ��2
45kBT��f �1��2�1��4. �6.8�
t is easy to calculate the effect of the strong field on the index with polarizationlong y and z axes,
n2�,or�− �;�� = −N
nx2�0
2c
�� − ��2
90kBT��f �1��2�1��4. �6.9�
ote that in principle all of the molecules can be aligned by a sufficiently strongptical field; see Fig. 65. In practice, other phenomena such as damage and ion-zation limit the effect to small net angle changes. For the 3D case where xx
yy� zz,
n2�,or�− �;�� =N
nx2�0
2c
��f �1��2�1��4
45kBT�xx
2 + yy2 + zz
2 � − �xxzz + xxyy + yyzz�� .
�6.10�
he turn-on and turn-off times of this effective nonlinearity depend strongly onhe local viscosity and the temperature. The simplest equation that describes theime dynamics is
�� +��
D
= torque = −�
��Vint = −
1
4�� − ���sin�2�a���Eloc��,t��2
ith D=C� /kBTand viscosity �; the numerical factor C depends on the detailsf the molecular shape. The classic example is liquid carbon disulfide, the caseust discussed theoretically. Here there are many contributions [83,172]. Decayimes ranging from 900 fs to a few picoseconds have been reported (for example,83,172,174]). The magnitude was n2,Kerr�n2,or�1–510−14 cm2/W for thisase. Typically, the larger the molecule, the longer the decay time; for example,30 ps was measured for nitrobenzene [174].
.2. Liquid Crystals
he nonlinear optics of liquid crystals is in some ways closely related to the pre-ious case. Strong intermolecular forces between liquid molecules in the liquid
Figure 65
ariation with input light intensity of the refractive index parallel �n�� and per-endicular �n�� to the applied field.
dvances in Optics and Photonics 2, 60–200 (2010) doi:10.1364/AOP.2.000060 141

sat6ssCsgneam=a“
Wi
El
(a
A
tate can lead to a unique form of matter in which molecular clusters exist,ligned along a direction in space (the “director”). It is this alignment that leadso the name liquid “crystal.” There are many families of liquid crystals; see Fig.6 [173]. Most of the molecules can be considered to have ellipsoidal shapes ashown in Fig. 67(a). The structure of one of the most commonly used and exten-ively studied molecules, 5CB, is shown in Fig. 67(b). Examples of R and R� are
nH2n+1, CnH2n+1O, and nitro and cyano (e.g., 5CB) groups. A single moleculartructure can take on different liquid crystal ordering as temperature or the sideroups are changed. For example, nCB is not a liquid crystal for n�4, and it isematic for n=5–7 and then smectic for larger n. Although some molecules mayxhibit a permanent dipole moment, the net alignment in the liquid state aver-ges the dipole moment to zero over optical wavelengths. Note that the align-ent is not perfect and is described by a scalar order parameter S0.5��3 cos2 �−1��, where � is the angle between the molecular long axis (typicallylong �), and the average over all molecules of the direction of �, n, is called thedirector.”
e focus on nematic liquid crystals in which the preponderance of experimentsn nonlinear optics have been performed and in which there are multiple mecha-
Figure 66
xamples of molecules and their alignment in nematic, cholosteric, and smecticiquid crystals [173].
Figure 67
a) Schematic of a typical liquid crystal molecule. (b) The chemical structure of5CB liquid crystal molecule [173].
dvances in Optics and Photonics 2, 60–200 (2010) doi:10.1364/AOP.2.000060 142

nhotosbcarldg
Acpuwidps
6C
Istcp
Tp
A
isms that give rise to n2 [173]. In bulk form these materials, when oriented, ex-ibit a uniaxial refractive index distribution if the molecules have approximater exact cylindrical symmetry. At properly prepared single boundaries, or be-ween two plates with prepared surfaces, it is possible to anchor the orientationf the molecules for some distance away from the boundary. There are two pos-ible directions for n, parallel to (planar) or orthogonal to (homeotropic) to theoundary, shown in Fig. 68. For all intents and purposes, these aligned nematicells behave as uniaxial crystals characterized by refractive indices n� = ����1/2
nd n�= ����1/2, i.e., with a birefringence �n=n� −n�. As the temperature isaised, a second-order phase transition to an isotropic liquid occurs, and order isost. In the transition region, the correlation distance over which orientational or-er exists decreases, resulting in a decreasing order parameter, and the birefrin-ence approaches vanishing value.
s in all other molecular systems, a laser will induce in nematic liquid crystalshanges in the populations of the electronic energy states, resulting in nonlinearolarizations of various orders. These so-called electronic nonlinearities of liq-id crystals are typical of organic molecules. Except for some effects associatedith the ordered arrangement of the molecules, the magnitudes of the refractive
ndex coefficients n2 are the same order of magnitude as other organic moleculesiscussed above. On the other hand, laser-induced density, temperature, orderarameter, and director axis orientation in nematic liquid crystals are respon-ible for some of the largest optical nonlinearities discovered to date.
.2a. Orientational Optical Nonlinearities of Nematic Liquidrystals
sotropic phase: Just above the nematic-isotropic transition temperature TNI,hort-range molecular correlation still persists, and laser-induced orientation ofhese highly polarizable molecules exhibits critical pretransitional behavior. Theseritical phenomena are described by the Landau–deGennes theory of second-orderhase transition [175]. The free energy per unit volume is of the form
F = F0 +1
2AQijQji −
1
4�ijEi
*Ej, �6.11a�
Figure 68
wo nematic liquid crystal molecular alignments obtained between two glasslates with different surface treatments [173].
dvances in Optics and Photonics 2, 60–200 (2010) doi:10.1364/AOP.2.000060 143

wpFc
Pe
F
H
T
H
Fh
FTtintd
Ntb
A
A = a�T − T*� , �6.11b�
here Qij is a general-order parameter tensor a and T* (�TNI, nematic-isotropichase transition temperature) are constants, and E denotes the applied optical field.or an x-polarized laser, for example, the total optically induced polarization Px
onsists of a linear and a nonlinear term:
Px = ��0� + �0
2
3��Q�Ex = Px
L + PxNL. �6.12�
xL=�0�E is the linear polarization, � is the linear susceptibility, and the nonlin-ar polarization is given by
PxNL =
2
3�0��QE. �6.13�
rom Eqs. (6.11), the dynamical equation for Qij becomes
��Qij
�t+ AQij = fij, �6.14�
fij =1
6���Ei
*Ej −1
3�E�2�ij�. �6.15�
ere � is the viscosity coefficient in the isotropic phase.
he solution for Qij is
Qij�t� = �−�
t � fij�t��
�e−�t−t��/ dt�, �6.16a�
=�
A=
�
a�T − T*�. �6.16b�
ere is the relaxation time constant associated with the viscosity.
or a linearly polarized �i= j� square pulse of duration p, fij= fii=1/9��E2, weave
Qii = ��E2�1 − e− / p�/9�. �6.17�
rom Eqs. (6.16a) and (6.16b), note that as the temperature approaches*��Tc�, both the response time and the optical nonlinearity (which is propor-
ional to Qjj) diverge as �T−T*�−1, as reported in previous studies of the opticallynduced Kerr effect and optical wavefront conjugation [176,177]. Typical mag-itudes of ��3� for orientational optical nonlinearities in the isotropic phase are ofhe order of 10−12 esu at temperatures far from TNI, and �10−10 esu within a fewegrees of TNI.
ematic phase—purely optically induced director axis reorientation nonlineari-ies: In the nematic phase, the free energies associated with splay, twist, and
end deformations in a nematic liquid crystal (shown in Fig. 69) are of the formsdvances in Optics and Photonics 2, 60–200 (2010) doi:10.1364/AOP.2.000060 144
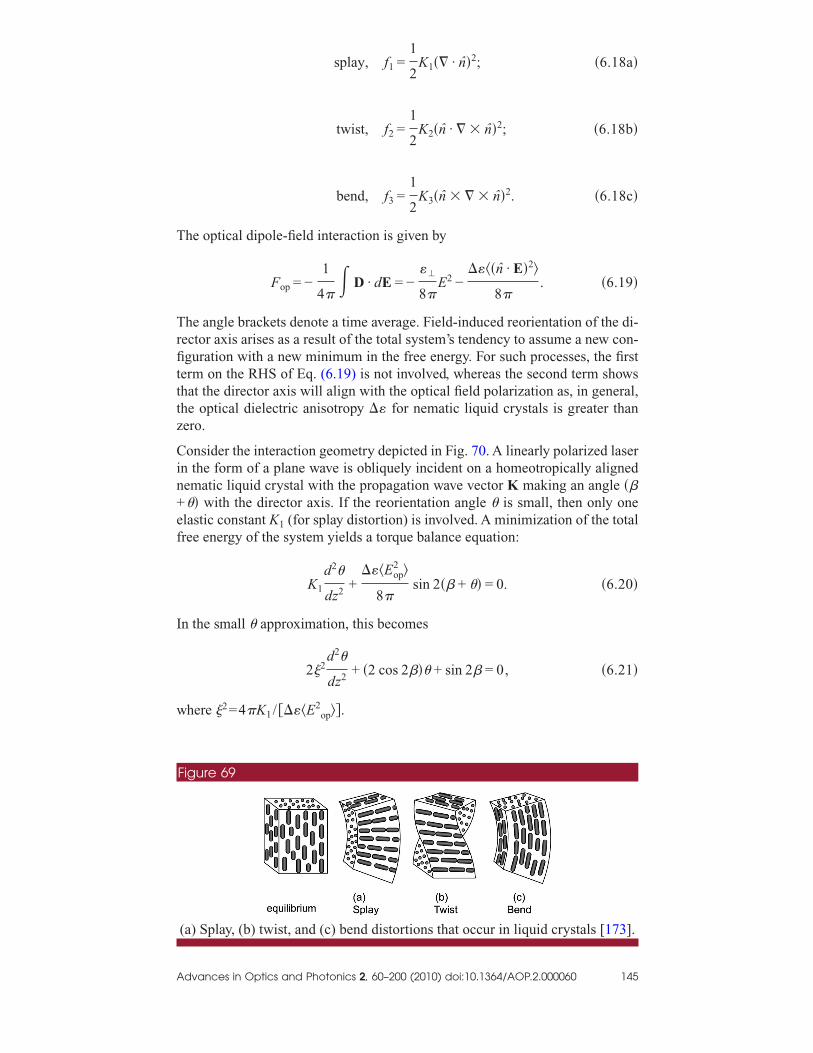
T
Trfitttz
Cin+ef
I
w
A
splay, f1 =1
2K1�� · n�2; �6.18a�
twist, f2 =1
2K2�n · � n�2; �6.18b�
bend, f3 =1
2K3�n � n�2. �6.18c�
he optical dipole-field interaction is given by
Fop = −1
4�� D · dE = −
��
8�E2 −
����n · E�2�
8�. �6.19�
he angle brackets denote a time average. Field-induced reorientation of the di-ector axis arises as a result of the total system’s tendency to assume a new con-guration with a new minimum in the free energy. For such processes, the first
erm on the RHS of Eq. (6.19) is not involved, whereas the second term showshat the director axis will align with the optical field polarization as, in general,he optical dielectric anisotropy �� for nematic liquid crystals is greater thanero.
onsider the interaction geometry depicted in Fig. 70. A linearly polarized lasern the form of a plane wave is obliquely incident on a homeotropically alignedematic liquid crystal with the propagation wave vector K making an angle ���� with the director axis. If the reorientation angle � is small, then only onelastic constant K1 (for splay distortion) is involved. A minimization of the totalree energy of the system yields a torque balance equation:
K1
d2�
dz2+���Eop
2 �
8�sin 2�� + �� = 0. �6.20�
n the small � approximation, this becomes
2�2d2�
dz2+ �2 cos 2��� + sin 2� = 0, �6.21�
here �2=4�K1 / ����E2op��.
Figure 69
(a) Splay, (b) twist, and (c) bend distortions that occur in liquid crystals [173].
dvances in Optics and Photonics 2, 60–200 (2010) doi:10.1364/AOP.2.000060 145

Us
Ar
w
F=t
Ftt
Ute
Gbd
A
sing the so-called hard-boundary condition, i.e., (�=0 at z=0 and at z=d), theolution of Eq. (6.21) is
� =1
4�2sin 2��dz − z2�. �6.22�
s a result of this reorientation, the incident laser (an extraordinary wave) expe-iences a z-dependent refractive index change given by
�n�z� = ne�� + �� − ne��� , �6.23�
here ne��+�� is the extraordinary ray index given by
ne�� + �� =n�n�
�n�2 cos2�� + �� + n�
2 sin2�� + ���1/2. �6.24�
or small �, the change in the local refractive index �n�z� is of the from �n�z�n2,lc�z�I where I= 1
2�0ncEop2 and 2�z� (defined here as the local nonlinearity, not
he 2PA coefficient) is given by
2�z� =����2 sin2�2��
4Kc�dz − z2�. �6.25�
or the oblique incidence geometry, the interaction length is d / cos �, and thushe equivalent refractive index coefficient n2,lc obtained by integrating and averaginghe local value 2�z� over the interaction length is given by
n2,lc =��� sin�2��d�2
24K1c cos2���. �6.26�
sing typical values of d=100 µm, ���0.6, K1=10−6 dyne, �=45°, and notinghat in cgs units a factor of 4107 needs to be accounted for in converting
2 2
Figure 70
eometry for the interaction of a linearly polarized (extraordinary ray) laseream with a homeotropically aligned nematic liquid crystal film. n0 and n are theirectors before and after the application of the optical field [173].
rgs/ �s cm � and W/cm to the unit for the intensity I, we have
dvances in Optics and Photonics 2, 60–200 (2010) doi:10.1364/AOP.2.000060 146

Fco
Imir[cs
Tae
I=
o
Ht
A=idcgia
A
n2,lc � 8 10−3 cm2/W. �6.27�
or more general cases in which splay, twist, and bend distortions are all in-luded, the laser-induced director axis reorientation is described by an equationf the form
�K1 sin2 �� + K3 cos2 ���d2�
dz2− �K3 − K1�sin �� cos ���d�
dz�2
+��
16��sin 2����Ex�2 − �Ey�2� + cos 2���ExEz
* + Ex*Ez�� = 0. �6.28�
n the case of an input laser beam of finite beam size, mutual torques exerted byolecules situated within and outside the laser beam will also be involved, giv-
ng rise to extra terms that depend on radial derivatives of �, d� /dr; the resultingeorientation profile is a nonlocal function with respect to the applied field178,179]. Such nonlocal nonlinearities are particularly important in nonlinear opti-al processes involving the focused laser beam’s transverse intensity dependence,uch as self-focusing, defocusing and soliton formation [180–183].
he dynamics of molecular reorientation by an optical field is described by bal-ncing the optical molecular and the viscous torques. For the interaction geom-try given in Fig. 70, the resulting equation is of the form
���
�t= K
�2�
�z2+���Eop
2 �
8�sin�2� + 2��. �6.29�
f Eop2 is a plane wave, and for the usual case of ��1, we may write ��t ,z�
��t�sin��z /d�, and Eq. (6.29) yields
� = −K�2
�d2� +
���Eop2 �
8��sin 2� + �
���Eop2 �
4��cos 2� , �6.30a�
r
� = −1
r
� + a + b� . �6.30b�
ere a=���Eop2 �sin�2�� /8��, b=���Eop
2 �sin�2�� /4��, and r is the relaxationime constant for reorientation of the director axis:
r = �d2/K1�2. �6.30c�
gain, for a typical cell with cell thickness d�10 µm, �=0.1 P, and K1
10−6 dyne, r 10 ms. It is important to note here that the relaxation time constantn a highly correlated molecular system such as a nematic liquid crystal is stronglyependent on the interaction geometry as well as the intensity distribution of the in-ident light. In a two-wave mixing geometry involving a sinusoidal optical intensityrating, for example, the mutual torques exerted by molecules situated in the opticalntensity maxima and minima will give rise to a dependence on the grating constant
s well as the cell thickness. The corresponding relaxation time constant becomesdvances in Optics and Photonics 2, 60–200 (2010) doi:10.1364/AOP.2.000060 147

w
Urilaa
Aoib
E
NpSswl
6L
Bant
OTclaMmfwom
A
r =�
K 1
�2
d2+ q2! , �6.31�
here =2� /q is the grating constant.
sing a thinner cell with less viscous liquid crystals, the response time can beeduced further to �1 ms; i.e., the upper limit to the useful optical modulation rates �1 KHz. In recent years, with the development of nematic liquid crystals withow viscosity and high birefringence, tens of kilohertz modulation rates can bechieved, making nematic liquid crystals candidate materials for image processingnd display applications.
lthough the relaxation dynamics is in the millisecond regime, the switchingnset dynamics can be much faster, since the laser-induced reorientation processs governed mainly by the intensity, in the limit where the optical torque exertedy an intense laser on the director axis is much larger than the elastic torque, i.e.,
���Eop2 �
8��sin�2� + 2�� � �K1
�2�
�z2�. �6.32�
quations (6.30) then become
� = a + b�→ ��t� =a
b�ebt − 1�. �6.33�
ote that if the laser intensity is sufficiently large such that a p ���Eop2 p /�, it is
ossible to induce a significant reorientation �� p� in a time as short as nanoseconds.uch an ultrafast response of the director axis deformation in nematic as well asmectic liquid crystals has been demonstrated in early studies by Khoo and co-orkers, using nanosecond laser pulses, and by Eichler and others, using picosecond
asers [184–186].
.2b. Giant Orientational Optical Nonlinearities in Doped Nematiciquid Crystals
y introducing photosensitive dye or molecular dopants to mediate, facilitate,nd enhance the reorientation process, studies have demonstrated that the opticalonlinearities n2,lc can be made even orders of magnitude larger, ranging from 10−3
o 103 cm2/W [187–193].
ne of the mechanisms is mediated by the photoexcited dye molecular dopants.he excited dye molecules exert intermolecular torques mol�A op on the liquidrystal molecules that could be stronger than the optical torque op, i.e., A can be asarge as 100 or more, and it can be positive or negative. In Methyl-Red-doped nem-tic liquid crystals, n2,lc can be much larger than 1 cm2/W [187,188]. Studies ofethyl-Red-doped nematic liquid crystals also show that the nonlinearities can beodulated by an applied ac electric field by changing the frequency; a low-
requency (e.g., 300 Hz) ac field will enhance the reorientation nonlinearity,hereas a high-frequency �30 kHz� ac field will quench the reorientation and turnff the optical nonlinearity, pointing to the possibility of dual-frequency switching–
odulation applications [194,195].dvances in Optics and Photonics 2, 60–200 (2010) doi:10.1364/AOP.2.000060 148

Iaenaattgnv
6
Aitcgmfcc(dpdf
Fsptf
Sae
A
n some nematic liquid crystals doped with azo compounds, for examplezobenzenes, studies have shown that the trans-cis configuration changes in thexcited azo-dopant are also an effective mechanism for creating large opticalonlinearities [196–198]. In these materials, the ground state azo dye moleculesre in the trans configuration that is oblong in shape, and they conform to thelignment of the director axis. When photoexcited to the bent cis configuration,hey disturb the nematic axis alignment and cause disorder, i.e., induce a nega-ive change in the order parameter �−�S�, resulting in a change in the birefrin-ence; cf. Fig. 71. Such trans-cis isomerization can happen quite rapidly (inanoseconds), and so the resulting index birefringence changes can be effectedery rapidly.
.2c. Field-Assisted Photorefractivity in Nematic Liquid Crystals
nother mechanism that gives rise to extraordinarily large optical nonlinearitiesn nematic liquid crystal is photorefractivity [199–201]. Under the combined ac-ion of an optical and a dc bias field, the process of photocharge production andreation of space-charge fields that result in a refractive index change is analo-ous to the photorefractive (PR) effect occurring in electro-optically active poly-ers and inorganic crystals as discussed in Section 7, but with an important dif-
erence. In inorganic photorefractive crystals, such as BaTiO3, the induced indexhange �n is linearly related to the total electric field E—the so-called Pockelsell effect. On the other hand, nematic liquid crystals possess centrosymmetry+n is equivalent to −n), and the field-induced refractive-index change is qua-ratic in the total electric field, i.e., �n=n2E
2—the Kerr effect. As we will seeresently, such a quadratic dependence actually allows the mixing of the appliedc field with the space-charge field for enhanced director-axis reorientation ef-ects [199–202,194,203].
or a typical wave mixing interaction (see Fig. 72) a spatially periodic (sinu-oidal) incident optical intensity distribution Iop= I0 sin�q�� acting on thehotocharge-producing impurities or dopants such as dyes, C60, and carbon nano-ubes in the nematic liquid crystals generates a PR-like space-charge field Eph of theorm [199]
Figure 71
chematic depiction of the trans-cis configuration changes experienced by anzo molecule when photoexcited, and their effect in lowering the order param-ter of an aligned nematic liquid crystal [196–198].
dvances in Optics and Photonics 2, 60–200 (2010) doi:10.1364/AOP.2.000060 149

wsccg
Irwd
o
T
TaTd
A
Eph = Eph�0� cos�q�� = �mkBT
2eqv� − �d
�cos�q�� , �6.34�
here m is the optical depth of modulation factor, kB is again Boltzmann’s con-tant, and � is the conductivity under illumination. Furthermore, �d is dark stateonductivity, and �= �D+−D−� / �D++D−�, where D+ and D− are the diffusiononstants for positive and negative ions, respectively, and q=2� / is again therating wave vector, with the grating period.
n nematic liquid crystals, the action of the applied dc field on the director axiseorientation generates two other forms of space-charge fields in conjunctionith the conductivity and dielectric anisotropies. For an interaction geometry asepicted in Fig. 72, these space-charge fields are of the form [200,201,204]
E�� = −���� − ���sin � cos ��
�� sin2 � + �� cos2 �Edc, E�� = −
���� − ���sin � cos ��
�� sin2 � + �� cos2 �Edc
�6.35�
r, for small �,
E�� −��
��
�Edc; E�� −��
��
�Edc. �6.36�
he total electric field in coordinate form then becomes
Figure 72
ypical experimental setup involving two linearly polarized coherent beams thatre overlapped at an oblique incident angle on an aligned liquid crystal cell.ransparent conducting electrode coated windows allow application of a smallc voltage [199].
dvances in Optics and Photonics 2, 60–200 (2010) doi:10.1364/AOP.2.000060 150

E
w
A
HWo
A
Ev
F�c�
A
total = �− �����
+��
��
�Edc� cos � − Eph cos �, 0,
�Edc − �����
+��
��
�Edc� sin � − Eph sin �=�− �E� · � + Eph�cos �, 0, Edc − �E� · � + Eph�sin �� ,
�6.37�
here E�= ��� /��+�� /���Edc.
ccordingly, the total free energy of the system becomes
F =k
2��� · n�r���2 + ��� n�r���2� −
��
8��E� · n�r���2 −
��op
8��E� op · n�r���2.
�6.38�
ere �� is the dc field anisotropy and ��op is the optical dielectric anisotropy.riting n= �sin � ,0 ,cos ��, and minimizing the free energy with respect to the re-
rientation angle � yields the Euler–Lagrange equation for �:
kd2�
dz2+ k
d2�
d�2+��
4��E�Ez cos��� · � + EzEph cos����
+�� · Eop
2
8��sin�2�� + 2 cos�2�� · �� = 0. �6.39�
ssuming that a hard boundary condition exists, a solution for � is of the form
� = �0 sin��z
d�cos�q��. �6.40�
quation (6.39) then yields the familiar solution for the reorientation: �0 is non-anishing only when the applied dc field is above a threshold:
�0 =
1
2
��op
��Eop
2 · sin�2�� + Eph�0�Edc cos���
�E�Edc cos��� +��op
��Eop
2 cos�2�� − EF2�1 + �qd
��2 , �6.41a�
Edc! EF��1 + �qd/��2� − ���op/����Eop/EF�2 cos�2��
�����
+��
��
� · cos � �1/2
. �6.41b�
or 5CB, for example, K�10−11 N, the ac field difference in the dielectric constant��11 (�� �16, �� �5) and �� /�� �0.5. For a typical wave mixing geometri-
al and optical parameters (qd�2�, and the internal angle �=22.5�), Efd=VF
1 V, �1.5, and Vth=VF �1.5 V.
dvances in Optics and Photonics 2, 60–200 (2010) doi:10.1364/AOP.2.000060 151

Ecwostncpstacfit
NccF
6C
Ilacc�
Dulmf
A
xperimental measurements have shown that in typical doped nematic liquidrystals, Eph is estimated to be just a few volts per centimeter, but in conjunctionith a Edc of a few volts per micrometer, the second term in the numerator EphEdc is
ver 10000 �V/cm�2 and is generally much larger than the optical contribution re-ponsible for the first term in the numerator of (6.41a) for the milliwatt-power lasersypically used in these studies [201]. In other words, the occurrence of PR opticalonlinearities in nematic liquid crystals is due mainly to the applied dc field acting inoncert with the optically induced space-charge field, and its �n2� magnitude de-ends critically on the dc bias field strength. Figure 73 reproduces the typical ob-erved self-diffraction as a function of the applied dc voltage, clearly showing thehreshold effect as well as the enhanced response from photocharge-producing dop-nts such as carbon nanotubes. In this particular study, the nonlinear index coeffi-ients n2 obtained were 1.310−3 cm2/W for the undoped sample and 0.8 cm2/Wor the single-wall carbon nanotube doped nematic liquid crystal. Other studies us-ng a variety of other photocharge-producing dopants have also obtained large n2 inhis range.
ote that the EdcEph term ��cos�q��� is � /2 phase shifted from the induced opti-al intensity grating Iopt
2 �sin2�q��, similar to that found in inorganic PR crystals dis-ussed below.The� /2 phase shift gives rise to strong two-beam coupling effects; cf.ig. 74.
.2d. Optical Nonlinearities Associated with Order Parameterhanges, and Thermal and Density Effects
n addition to director axis reorientation, there are several other mechanisms thatead to changes in the refractive indices of the liquid crystal under the action ofn optical field. These include laser-induced molecular internal temperaturehange dT, electrostrictive density changes d"T and d"e, and order parameterhanges dS, for a fixed initial director axis arrangement. The total index changen can therefore be written as
Figure 73
ependency of first-order diffraction efficiencies on the applied dc voltage inndoped (squares) and single-wall carbon-nanotube -doped (circles) nematiciquid crystals. Sample thickness d=25 µm; grating constant =23 µm; wave-ixing angle 2°; �=22.5°. The incident optical intensities are 200 and 2 mW/cm2
or the undoped and doped samples, respectively [201].
dvances in Optics and Photonics 2, 60–200 (2010) doi:10.1364/AOP.2.000060 152

TstauotiTwno(
Ttncst[
A
�n = � �n
�T�"
dT + � �n
�"�
T
d"T + � �n
�"�
T
d"e + � �n
�S�
T,"
dS. �6.42�
he first term on the RHS of Eq. (6.42), ��n /�T�"dT, can be caused by a veryhort-pulse laser that modifies the spectral dependence of the molecular absorp-ion and emission process [205,206]. This term is usually quite small and is notffected significantly by the ordering or molecular correlations present in the liq-id crystalline phase. The second term on the RHS comes from a laser-inducedverall rise in temperature and the resulting changes in the density. The thirderm on the RHS is due to the electrostrictive effect in nonabsorbing materials,.e., the tendency of a material to move toward a region of high field strength.he contribution unique to nematic liquid crystalline systems is the last term,hich is influenced by order parameter changes. This mechanism is the domi-ant one as a result of the critical dependence of the nematic’s extraordinary andrdinary refractive indices n� = ����1/2 and n�= ����1/2 on the order parameter Ssee Fig. 75), i.e.,
n� = n��",S�, n� = n��",S� . �6.43�
Figure 74
wo-beam coupling exponential gain coefficients as a function of (a) the direc-ion and (b) magnitude of the applied dc bias field obtained with the carbon-anotube-doped nematic liquid crystals. Sample thickness d=25 µm; gratingonstant =23 µm; wave-mixing angle 2°; �= ±22.5°. The incident optical inten-ity used is 2 mW/cm2. Note that the direction of beam coupling is dependent onhe applied bias field direction as well as the orientation ��� of the director axis201].
dvances in Optics and Photonics 2, 60–200 (2010) doi:10.1364/AOP.2.000060 153

Stadfra
w
Edape
Hh
Tat
A
everal mechanisms can be employed to change the order parameter. In Subsec-ion 6.2b, we briefly discussed trans-cis isomerism of optically excited azo dop-nts as an effective means of causing order parameter changes. Owing to the or-er parameter’s critical dependence on the temperature (see Fig. 75), a morerequently investigated mechanism is laser-induced temperature and order pa-ameter modification. The corresponding induced temperature index gradientsre of the form [207,173]
dn�
dT=
1
n�
�C1
d"
dT+
2
3C2S
d"
dT+
2
3C2"
dS
dT� , �6.44a�
dn�
dT=
1
n�
�C1
d"
dT−
1
3C2S
d"
dT−
1
3C2"
dS
dT� , �6.44b�
here C1 and C2 are nematic liquid crystal parameters [207].
stimating the nonlinear index coefficients associated with these thermal-ensity-order parameter effects can be a very complex exercise, since the inter-ction geometries are in general multidimensional and the laser-induced tem-erature and density changes are strongly coupled by the hydrodynamicalquations [205,206]
−�2
�t2��"� + v2�2��"� + v2�T"0�
2��T� +�
"0
�
�t�2��"� =
�e
8��2�E2� ,
�6.45a�
"0Cv
�
�t��T� − �T�2��T� −
�Cp − Cv�
�T
�
�t��"� =
u
=nc
4�E2. �6.45b�
ere "0 is the unperturbed density of the liquid crystal, Cp and Cv the specificeats, �T the thermal conductivity, v the speed of sound, �e the electrostrictive
Figure 75
emperature dependence of the extraordinary and ordinary refractive indices ofligned nematic liquid crystals for three visible wavelengths. The nematic liquidransition region is defined by the pale blue shaded region [173].
dvances in Optics and Photonics 2, 60–200 (2010) doi:10.1364/AOP.2.000060 154

cvsp
Ttsta
ItrcS
w
Tpa[wEaT
Ct(p
Tc
A
oefficient ��e="0�"� /�"�T�, �T the coefficient of volume expansion, and � aiscosity coefficient. Equation (6.45a) describes the effects of thermal expan-ion and electrostriction on the density change, whereas (6.45b) describes thehotoabsorption and the resulting temperature rise and heat diffusion process.
hese coupled equations for the laser-induced temperature and density distribu-ions �T�z� and �"�z� will then have to be incorporated into the equation de-cribing the order parameter S of the system. Following the Landau–deGennesheory, the free energy density of the system with a temperature distribution T�z�nd order parameter S�z� is given by [208]
f = a�T�z� − T*�S�z�2 + bS�z�3 + cS�z�4 + L�dS�z�
dz�2
− g1S1 − g2S2.
�6.46�
n this expression, a, T*, b, c, and L are thermodynamic parameters, g1 and g2 arehe surface potentials per unit volume, and S1 and S2 are the surface order pa-ameters. For a typical nematic liquid crystal such as 5CB, b=−5.3105 J /m3,=9.8105 J /m3, T*=307.14 K, and L=4.510−12 J m–1 [208].At equilibrium,�z� is determined by minimization of the free energy equation:
�f
�S−
d
dz� �f
���S/�z�� = 0 �6.47�
ith the boundary conditions
− � �f
���S/�z��1
+�fS1
�S1
= 0, � �f
���S/�z��2
+�fS2
�S2
= 0. �6.48�
hermal and density effects induced by short intense laser pulses: To render theroblem tractable, most experimental and theoretical studies have adopted inter-ction geometries that reduce the dimensions and complexities of the problem209–211]. One example is wave mixing involving a spatially periodic, plane-ave, optical field, i.e., a 1D optical grating intensity distribution of the form2=2E0
2 cos qy, where q=k1−k2 is the grating wave vector. Correspondingly,�"nd �T are of the form �"="�t�cos�q� ·y�� and �T=T�t�cos�q� ·y��, where "�t� and�t� are the density and temperature grating amplitudes.
onsider the transient case involving intense laser pulses. For simplicity in illus-ration, we assume a flat-top square pulse of duration p. For 0� t� p, Eqs.6.45) can be solved to yield the following temperature and density grating am-litudes [209,210]:
T�t� = � cnE02
4�"0Cv�R�1 − exp�− �Rt�� , �6.49�
"�t� = ��eE02
4�v2 �1 − exp�− �Bt�cos�t� − ��TcnE02
4�Cv�R�1 − exp�− �Rt��.
�6.50�
he density change "�t�="e�t�+"T�t� as given in Eq. (6.50) has two distinct
omponents:dvances in Optics and Photonics 2, 60–200 (2010) doi:10.1364/AOP.2.000060 155

Tptpnha=i
Iia
T
R
UD=
Npci
7
Tep
A
"e�t� =�eE0
2
4��2�1 − exp�− �Bt�cos�t� , �6.51a�
"T�t� =− �TcnE0
2
4�Cv�R
�1 − exp�− �Rt��. �6.51b�
he propagating component of "e�t� arises from the electrostrictive effect and isroportional to �e; it is characterized by the Brillouin relaxation constant (acous-ic decay time) B=�B
−1=2"0 /�q2 and frequency �=�q2�2−�B2. The "e com-
onent gives rise to a spectrum of propagating acoustic waves. The other compo-ent, "T�t�, is the thermoelastic contribution (proportional to �T) caused by thermaleating and is characterized by the thermal time constant R=�R
−1="0Cv /�Tq2; it isdiffusive effect. In liquid crystals n�1.5, �=710−2 kg m−1 s−1, v
1540 m s−1, "0=103 kg m−3, and �T /"0Cv=0.7910−7 m2/s [173]. For a grat-ng period of 20 µm, R 100 µs and B 200 ns [207].
n the steady state when p� B, R, the density contributions are generally van-shingly small, while the temperature contribution builds up to a maximum valuend produces an index change �nT given by
�nT =cnE0
2
4�"0Cv�R
�n
�T= n2
SS�T�Iop. �6.52�
his allows us to define a steady-state nonlinear index coefficient
n2SS�T� =
"0Cv�R� �n
�T�. �6.53�
ecalling that �R=Dq2, Eq. (6.53) becomes
n2SS�T� =
"0CvDq2� �n
�T�. �6.54�
sing typical liquid crystalline parameters, "�1 g/cm3, Cp Cv 2 J /g /K, 210−3 cm2/s, �100 cm−1, dn /dT 10−3 K−1 and a grating period 2� /q=20 µm, we get
n2SS�T�
100
4�
�20 10−4�2
1 2 2 10−3 10−3 2.5 10−6 cm2/W.
�6.55�
ear the nematic-isotropic transition temperature, the magnitude of dn /dT [es-ecially dn� /dT], can be as high as 10−2 K−1 (cf. Fig. 75), and the nonlinear indexoefficients n2,lc can be as large as 10−4 cm2/W. These rough estimates are actuallyn good order-of-magnitude agreement with experimental observations.
. Photorefractive Nonlinearities
he PR effect is known to occur in electro-optic photoconductive materials. Itssentially arises from the space-charge field set up by the diffusion and or trans-
ort of photogenerated charge carriers that in turn modifies the index of refrac-dvances in Optics and Photonics 2, 60–200 (2010) doi:10.1364/AOP.2.000060 156

tanvw[tcsioutw
Almattc
Ima
Irt
Stlda
A
ion through the Pockels effect [212–223]. In this respect, the refractive index ofmedium can change through photorefraction as a result of optical beam illumi-ation. This process was first observed by Ashkin and colleagues in 1966, and itsery origin remained for several years a subject of discussion [224]. Today it isidely accepted that the kinetic model first suggested by the Kiev group
225,226] can adequately describe the physics of photorefraction. Irrespective ofhe details behind the actual mechanisms involved, all types of PR effects shareommon characteristics. In all cases the induced refractive index (which can beignificant) can vary anywhere from nonlocal to local and is typically character-zed by a finite or relatively slow response time. In addition these effects can bebserved at low optical intensities and can persist in the dark over long periods,nless erased with uniform illumination. This effect can be observed in manyypes of materials and over a broad wavelength range—from the visible to longavelengths etc. [212–217].
PR material involves both acceptor and donor impurities with energy levelsying between the conduction and the valence band. These levels and physical
echanisms behind the PR effect are schematically depicted in Fig. 76. In thisrrangement, an optical beam photoexcites carriers from donor centers, which inurn diffuse or move through the conduction band. Charge recombination alsoakes place via acceptors. The space-charge field established during this processan then electro-optically alter the refractive index [225].
n the presence of a static electric field E� , the refractive index changes in theseaterials are determined by how the electro-optic effect modifies the imperme-
bility tensor [215], e.g.,
��ij = �� 1
n2�ij
= rijkEk + sijkmEkEm. �7.1�
n Eq. (7.1) rijk and sijkm represent linear and quadratic electro-optic coefficients,espectively. Typically, PR index changes are driven by linear Pockels effects. Inhis case, the 27 elements of the rank 3 tensor rijk can be contracted, i.e.,
Figure 76
ample of a typical PR material showing donor and acceptor impurity states inhe gap between the valence and conduction bands, the raising of an electron viaight absorption from a donor state into the conduction band, electron transportue to drift and diffusion effects, and the subsequent trapping of the electron inn acceptor state.
dvances in Optics and Photonics 2, 60–200 (2010) doi:10.1364/AOP.2.000060 157

Tt[wa=de
Irat(t
wcg
Is
fw
fia
w(
Efdl[
7
Id
A
�� 1
n2�l
= rlmEm. �7.2�
he dynamics of electron photogeneration and recombination together withhose of diffusion and transport are governed by the Kukhtarev–Vinetskii model225,226]. As indicated in Fig. 76, the PR material contains donor impuritiesith density ND, out of which ND
+ are ionized. The density of acceptor atoms islso taken to be NA. Under dark conditions charge neutrality requires that �ND
+ �NA [219]. Of course the nonionized portion of the donor impurities are candi-ates for electron photogeneration. From these arguments it follows that the ratequation for the donor density is given by
�ND+
�t= s�I + Id��ND − ND
+ � − �RNeND+ . �7.3�
n Eq. (7.3), Ne is the electron density in the conduction band and �R is the car-ier recombination rate; s is the photoexcitation cross section and is related to thebsorption cross section 1 via s=1 /h�. I is the externally imposed optical in-ensity, and Id is the so-called dark intensity that phenomenologically accountsthrough the product sId) for the rate of thermally generated electrons. The con-inuity equation also demands that
�
�t�ND
+ − Ne� +1
e� · J� = 0, �7.4�
here e= �e� represents the electron charge. In the absence of any photovoltaicontributions (to be considered in Subsection 7.3), the current density can ineneral include both a diffusion and a drift component, that is,
J� = eNeµE� + kBTµ � Ne. �7.5�
n Eq. (7.5) µ is the electron mobility and is related to the carrier diffusion con-tant D=kBTµ /e. The first term in Eq. (7.5) describes drift transport resulting
rom the presence of an electric field component E� , while the second (associatedith the thermal energy kBT) accounts for diffusion effects. The total electric
eld E� is the sum of the external bias field and that established from the gener-ted space charge. Finally, Gauss’s law dictates that
�� · ��E� � = e�ND+ − Ne − NA� �7.6�
here �=�0�r is the static permittivity of the material. The set of Eqs.7.3)–(7.6) completely describes the PR effect. Once the total space-charge field� is known, then Eq. (7.2) can be used to analyze any index changes resultingrom an optical illumination I. Of importance is also the relative order of theensities involved, e.g., ND�NA�Ne [212–219]. Models accounting for bipo-ar transport (holes and electrons) can also be developed along similar lines227,228].
.1. Diffusion Nonlinearity
n the absence of any external bias �E0=0�, the PR effect is dominated by the
iffusion process [225]. The way the diffusion mechanism affects optical wavedvances in Optics and Photonics 2, 60–200 (2010) doi:10.1364/AOP.2.000060 158

pbfeofc
7
Li
i
s+g
c=pbpd
+(
IdEthotttt
Ttd
avTbt
A
ropagation is primarily nonlocal, and as a result it leads to an energy exchangeetween plane wave components [214,215]. The manifestation of diffusion ef-ects can vary considerably depending on the nature of optical illumination. Forxample two-wave mixing is possible if the illumination is periodic (if it is theutcome of two interfering plane waves), while for finite optical beams beamanning and self-bending can take place [212–214]. For these reasons these twoases will be dealt with separately.
.1a. Diffusion-Induced Two-Wave Mixing
et us consider two monochromatic plane waves (of the same color) interferingn a PR crystal. The total electric field associated with these two waves is written
n the form E� T=E1e1 exp�i��t−k�1 ·r���+E2e2 exp�i��t−k�2 ·r���, and hence the re-
ulting total optical intensity or illumination is given by IT= I0+ �I1 exp�−iK� ·r��c.c.�. In the last expression I0= �E1�2+ �E2�2 represents the constant intensity back-round of the total intensity, while I1= e1 · e2E1E2
* is the amplitude of the periodic
omponent of this interference pattern. The grating wave vector is defined as K�
k�1−k�2 and is related to the spatial period of the interference via K=2� / . Inrinciple this problem cannot be treated analytically. Yet approximate solutions cane obtained under steady-state conditions �� /�t=0� by using perturbation methods,rovided that the periodic component is small, i.e., I1� I0. In this regard, to first or-er, all the unknown quantities in Eqs. (7.3)–(7.6) are written as x=x0
�x1 exp�−iK� ·r��+c.c.� [215,219]. After some algebra, direct substitution into Eqs.7.3)–(7.6) leads to the following result concerning the space-charge field:
E1sc = − i
KkBT
e
1 +K2
kD2
I1
I0
. �7.7�
n Eq. (7.7), kD=e�NA / ��kBT� represents the Debye wave number, which in turnetermines the Debye screening radius LD=2� /kD [215]. Some of the features ofq. (7.7) merit further discussion. To begin with, the imaginary factor i appearing in
he numerator of Eq. (7.7) clearly suggests that the space-charge field E1sc (andence the resulting index grating) is � /2 out of phase with respect to the light peri-dic pattern inducing it. Thus PR diffusion effects are nonlocal. This field is propor-ional to the depth of modulation I1 / I0 and to the thermal potential kBT /e. Finally,he amplitude of E1sc reaches a maximum when K=kD. Analysis also indicates thathe time required for this space-charge field to form is directly related to the dielec-ric relaxation time d=� /�=� /eµNeo [214].
o better appreciate two-wave mixing effects we consider the coherent interac-ion of two plane waves propagating at angles ±� with respect to the z axis. Foremonstration purposes we assume that the periodic pattern forms along the x
xis, e.g., K� =k�1−k�2=Kx. In this case the grating vector is related to the waveectors via K=2k0n0 sin �, where n0 is the effective refractive index of the crystal.he index perturbation induced by the periodic part of the illumination pattern cane obtained from Eq. (7.2). For typical arrangements this index change can be writ-
3
en in the form �n=−n0reffEsc /2 [215,219], where reff is an effective electro-opticdvances in Optics and Photonics 2, 60–200 (2010) doi:10.1364/AOP.2.000060 159

ccc
w
Fpesse
wtw
w
Astwtiagt
A
oefficient that depends on the electro-optic tensor and the orientation of the space-harge field with respect to the crystal’s axes. Thus the refractive index in the PRrystal is given by
n = n0 +1
2�n1 exp�− i��
I1
I0
exp�− iKx� + c.c. , �7.8�
here
n1 exp�− i�� = n03reff
iKkBT
e
1 +K2
kD2
. �7.9�
rom Eq. (7.9) it is again obvious that the index grating is indeed � /2 out ofhase with respect to the periodic intensity pattern resulting from the interfer-nce of these two plane waves, in agreement with the previous discussion. Byubstituting this latter expression into the Helmholtz equation and by retainingynchronous terms [217–219], one obtains the following coupled evolutionquations for the slowly varying field amplitudes E1�z� ,E2�z�:
idE1
dz= −
�n1
� cos �exp�− i��e1 · e2
�E2�2
�E1�2 + �E2�2E1,
idE2
dz= −
�n1
� cos �exp�i��e1 · e2
�E1�2
�E1�2 + �E2�2E2, �7.10�
here in deriving Eqs. (7.10) we have omitted any loss effects. These latter equa-ions describe the two-wave mixing process and together with Eq. (7.9) can beritten in a simpler version:
dE1
dz= −
g
2
�E2�2
�E1�2 + �E2�2E1
dE2
dz=
g
2
�E1�2
�E1�2 + �E2�2E2, �7.11�
here the gain g is given by
g =2�
� cos �e1 · e2n0
3reff
K�kBT/e�
1 + �K2/kD2 �
. �7.12�
s expected, in the absence of any losses the overall power in the system is con-erved, e.g., �E1�2+ �E2�2=const [215]. Moreover, from Eqs. (7.11) it is evident thathe signal field E2 gains energy at the expense of the pump field E1. In the limithere the signal is weak compared with the pump ��E2�� �E1��, one readily finds
hat the signal intensity will experience amplification according to I2= I20 exp�gz�. Its also apparent from Eq. (7.12) that the two-wave mixing gain attains a maximum atspecific angle of interaction �max, i.e., when K=kD=2k0n0 sin �max, in which case
max= ��n03reffkBTkDe1 · e2� / �e� cos ��. To appreciate these effects, let us consider
he following values corresponding to typical PR materials under standard tempera-
dvances in Optics and Photonics 2, 60–200 (2010) doi:10.1364/AOP.2.000060 160

tFac
7
Tn[n[cctab[
Atcadc
mw
Tiow
wdiEra
wabe
A
ure conditions: n0=2.3, reff=250 pm/V, �r=800, NA=21022 m−3, �=0.5 µm.or this case we find that �max 4° and gmax 20 cm−1. Other arrangements, suchs contra-directional two-wave mixing as well as four-wave mixing configurations,an be similarly analyzed [215,220,221].
.1b. Diffusion Effects on Beam Propagation
he nonlocal character of the diffusion PR process also affects in a crucial man-er the propagation of optical beams. One such effect is beam fanning212–221]. Fanning is a direct outcome of the diffusion nonlinearity, and as itsame implies it leads to asymmetric fanning and self-bending of a single beam229]. It typically arises from scattered light from the beam itself when it en-ounters inhomogeneities and impurities in the PR crystal. The scattered lightomponents are then amplified by all the plane-waves composing the beam viawo-wave mixing. The end result is the amplification of spatial scattering noisend the subsequent deterioration of the optical beam. This energy transfer haseen investigated in several works using multiple-wave mixing approaches229,230].
nother possibility is a two-wave mixing energy exchange between all the spec-ral components composing an optical beam. This is a deterministic effect andan be observed only if beam-fanning is carefully eliminated in the experimentalrrangement. To examine this latter mechanism, one has to first obtain theiffusion-induced space-charge field [231]. Given that under no external bias theurrent density is zero, the diffusion-induced space-charge field can be deter-
ined from Eq. (7.5), e.g., E� sc=−�kBT /e���Ne /Ne�. In addition, since Ne� I+ Id,e find that
E� sc = −kBT
e
�I
I + Id
. �7.13�
o see how the diffusion nonlinearity will affect a beam, let us consider a Gauss-an beam propagating along z. The space charge in Eq. (7.13) is assumed to varynly in the x coordinate. In this case, the electric optical field amplitude E of thisavefront will evolve according to
i�E
�z+
1
2k
�2E
�x2+
k0
2n0
3reff
kBT
e� ���E�2�/�x
1 + �E�2 �E = 0, �7.14�
here in Eq. (7.14) the electric field has been normalized with respect to theark intensity level. This problem can be solved in closed form under high-llumination conditions ��E�2�1� provided that beam is initially Gaussian, i.e.,�z=0,x�=A exp�−x2 / �2w0
2��. In this case analysis shows that the Gaussian beamegularly diffracts, while its center self-bends during propagation [232] by anmount xd that is given by
xd =k0
2w02n0
4reffkBT
2e�2� tan−1 � − ln�1 + �2�� , �7.15�
here �=z /kw02. For the same parameters used in Subsection 7.1a, one finds that
Gaussian beam with an initial spot size of w0=4 µm is expected to self-deflecty a distance of xd=5.7 µm after a distance of 10 diffraction lengths ��=10�. This
ffect is schematically depicted in Fig. 77. Intuitively the beam deflection can be ex-dvances in Optics and Photonics 2, 60–200 (2010) doi:10.1364/AOP.2.000060 161

pocd
7
Wspfbssic
7N
T(siE
Aano
Ld
A
lained by considering the spatial profile of the space-charge field and consequentlyf the index distribution. If the optical beam is Gaussian-like then resulting space-harge field Esc is almost linearly varying across the beam, and as a result the in-uced index prism leads to self-bending.
.2. Screening Photorefractive Nonlinearity
hen a PR material is strongly biased another type of nonlinearity manifests it-elf: the screening nonlinearity [233–235]. As we will see, this nonlinearity isrimarily local in nature, and in the same PR system it can lead to both self-ocusing and defocusing conditions depending on the polarity of the externalias. The strength of the screening mechanism can be substantial, and it can re-pond at very low optical power levels. This type of nonlinearity has been exten-ively investigated in conjunction with optical soliton effects, self-focusing, andnstability phenomena, and most recently in the exploration of nonlinear opti-ally induced lattices to mention a few topics [236].
.2a. Physical Origins of the Screening Photorefractiveonlinearity
o understand the origin of the screening nonlinearity, we consider Eqs.7.3)–(7.6) under steady-state conditions, assuming for simplicity that thepace-charge field is established in only one direction (in this case x). By keep-ng in mind the inequalities ND�NA�Ne associated with the densities, fromqs. (7.3) and (7.6) one can show that [233,234]
ND+ = NA�1 +
�
eNA
�Esc
�x� , �7.16�
Ne =s�ND − NA�
�RNA
�I + Id��1 +�
eNA
�Esc
�x�−1
. �7.17�
t this point, let us also assume that the power density I�x ,z� of the optical beamttains asymptotically a constant value I� at x→ ±�. This constant I� can be fi-ite or zero depending on the experimental arrangement used. In these regions
Figure 77
ight spreading on propagation due to diffraction and self-bending in a PR me-ium due to the nonlocality of the optical response.
f constant illumination, the space-charge field is also independent of x, i.e.,
dvances in Optics and Photonics 2, 60–200 (2010) doi:10.1364/AOP.2.000060 162

EwEpbF
UfiJ
Sc
Ucktp
Isvdct
Tt
Iit
A
sc�x→ ±� ,z�=E0. If the spatial extent of the optical wave is much less than the xidth W of the PR crystal, then under a constant voltage bias V, E0 is approximately
0=V /W. On the other hand, if W is comparable with the wave’s width, then this ap-roximation breaks down. In this case the intensity profile of the optical beam has toe taken into account in order to estimate the appropriate correction factors [234].rom Eq. (7.17) the free-electron density Ne0 in these regions is given by
Ne0 =s�ND − NA�
�RNA
�I� + Id� . �7.18�
nder steady-state conditions, Eq. (7.4) implies that � ·J� =0. Hence in 1D con-gurations the current density should, as expected, be constant everywhere, i.e.,=constant. Therefore Ne0E0=NeEsc+ �kBT /e��Ne /�x or
Esc =Ne0E0
Ne
−kBT
e
1
Ne
�Ne
�x. �7.19�
ubstitution of Eq. (7.17) into Eq. (7.19) gives the final expression for the space-harge field:
Esc = E0
�I� + Id�
�I + Id� �1 +�
eNA
�Esc
�x� −
kBT
e
��I/�x�
�I + Id�
+kBT
e
�
eNA�1 +
�
eNA
�Esc
�x�−1�2Esc
�x2. �7.20�
nder strong bias conditions the drift component dominates the transport pro-ess, and thus any diffusion effects can be neglected [terms associated with
BT /e in Eq. (7.20)]. In addition, for relatively broad beams in typical PR mediahe term �� /eNA��ESc /�x�1, and as result Eq. (7.20) can be expressed in a sim-ler form, i.e., [233,234],
Esc = E0
�I� + Id�
�I + Id�. �7.21�
t is interesting to note that one could have arrived at this same relation by con-idering an intensity-dependent conductivity ��I� and only drift transport pro-ided that J=constant. In other words, Eq. (7.21) results if we assume that the con-uctivity varies with intensity according to �=�d�I+ Id� / Id, where �d is the darkonductivity of the PR material [235]. Under constant voltage bias V we also expecthat
V = − �−W/2
W/2
Escdx . �7.22�
he index changes in the PR medium can now be estimated from Eq. (7.2). Inypical arrangements this is given by [233–235]
�n = −n0
3
2reffEsc = −
n03
2reffE0� I� + Id
I + Id� . �7.23�
t is important to emphasize that in many experiments the so-called dark-ntensity level Id is artificially elevated by externally illuminating the crystal, ei-
her from the top or along the other input polarization. Such an elevation not onlydvances in Optics and Photonics 2, 60–200 (2010) doi:10.1364/AOP.2.000060 163

sm
Tsnacs7cselrstaKt
Ioc
ae
Ija=t=
RP
A
peeds up the PR time response but also allows better controllability in experi-ental setups.
o get an appreciation of the index changes expected in this regime, let us as-ume a Gaussian-like beam traversing a biased PR material �I�=0�. If we let
0=2.3, reff=250 pm/V, and if the external bias strength is E0=2 kV/cm, then forGaussian having a peak intensity 10 times higher than Id, we find that the index
hange between the center and the far tails of the beam is approximately �n 310−4. This level of index change is more than enough to enable a host of nonlinear
elf-action effects. The index change corresponding to this case is plotted in Fig.8(a). As the figure indicates, for E0�0 the refractive index is higher at the beamenter (in essence the PR effect lowers the index at the tails), and as a result this PRystem behaves in a self-focusing fashion. On the other hand, if E0=−2 kV/cm,.g., if the polarity of the external bias is reversed, the index profile is inverted. In thisatter case, the index at the center of the beam attains a minimum, and thus in thisegime the PR medium is defocusing [Fig. 78(b)]. What is interesting is that theame crystal can be either self-focusing or defocusing depending on the polarity ofhe external bias. In other words the sign of the screening nonlinearity can be tunedt will. Equation (7.23) also indicates that the screening nonlinearity has a saturableerr-like nonlinear response. This issue is of importance to the stability of 2D self-
rapped beams.
n two transverse dimensions the problem becomes more complicated becausef the space-charge field boundary conditions. In many occasions these effectsan be understood by only considering the drift component and by assuming
gain that �=�d�I+ Id� / Id. Given that E� sc=−�V and � · ��E� sc�=0, the followingquation for the potential is derived [214]:
�2V +�I
I + Id
· �V = 0. �7.24�
n general this latter equation must solved numerically during propagation sub-ect to appropriate mixed boundary conditions for the potential function V. Annalytic solution can be obtained when the optical beam is cylindrical, e.g., II0 circ�r /a� for r�a and zero elsewhere (diffraction effects are neglected here). In
his case the conductivity of the PR medium is �b=�d�I0+ Id� / Id for r�a and �b
�d for r�a.The space-charge electric field associated with this latter arrangement
Figure 78
efractive index change produced by a 1D optical beam with intensity 10Id in aR crystal for (a) a self-focusing and (b) self-defocusing nonlinearity.
dvances in Optics and Photonics 2, 60–200 (2010) doi:10.1364/AOP.2.000060 164

ctc
Tmisc
Tc
7
Tectl
Tn
Isa
A
an be obtained by using standard methods from electrostatics. To do so we assumehat the electric field away from the high-conductivity rod �r�a� is E0. More spe-ifically, in polar coordinates �r ,#�, Esc is given by [237]
E� sc = �2E0x
2 + �I0/Id�r� a
E0x + a2E0� I0
I0 + 2Id� cos�2#�
r2x +
sin�2#�
r2y r� a� ,
�7.25�
he index profile corresponding to this cylindrical optical beam can be deter-ined from Eq. (7.2). This index distribution is shown in Fig. 79. In general the
ndex change is azimuthally asymmetric, and this is a characteristic of thecreening nonlinearity. Similar results can be obtained for other classes of opti-al beams, e.g., Gaussian.
ypical values associated with screening nonlinearities as obtained in typical PRrystals are listed in Table 16.
.2b. Self-Trapped Beams—Screening Photorefractive Solitons
he possibility of optical PR solitons was first suggested in 1992 [238]. Nonlin-ar optical wave propagation under the action of screening PR effects can beonsidered by starting from the Helmholtz equation. By writing the optical elec-ric field in the form E=$�x ,z�exp�ikz� and by assuming a slowly varying enve-ope$�x ,z�, we find that [233,234]
i�$
�z+
1
2k
�2$
�x2− k0
n03
2reffE0� I� + Id
I + Id�$ = 0. �7.26�
his equation can be more conveniently studied in normalized units and coordi-ates, i.e., if �=z /kx0
2, s=x /x0, $= �2�0Id /n0�1/2U, in which case one obtains
i�U
��+
1
2
�2U
�s2− �� 1 + "
1 + �U�2�U = 0. �7.27�
n Eq. (7.27), "= I� / Id is an intensity ratio and �= �k0x0�2�n04reff /2�E0 is the
trength of the screening PR nonlinearity. For singular bright beams that tend to zerot x→ ±�, "=0 in Eq. (7.27).The bright self-trapped states or solitons of Eq. (7.27)
Figure 79
Index change induced in a PR medium by a 2D cylindrical beam.
dvances in Optics and Photonics 2, 60–200 (2010) doi:10.1364/AOP.2.000060 165

c=t
T−
fltn8i
7
Pr
S
S
B
I
A
an be obtained by assuming that their field profile is given by Ur1/2y�s�exp�i���, where r is the ratio of the soliton’s peak intensity to the dark in-
ensity Id. In this case we find that [233,234],
d2y
ds2− 2�y − 2�
y
1 + ry2= 0. �7.28�
his last differential equation can be integrated further provided that �=�� /r�ln�1+r�, e.g.,
�dy
ds�2
= �2�/r��ln�1 + ry2� − y2 ln�1 + r�� , �7.29�
rom which the soliton field profile y�s� can be uniquely determined. These so-utions are possible only for ��0 or E0�0, that is, under self-focusing condi-ions [236]. The intensity distribution corresponding to a soliton in SBN:60 with
0=2.3, reff=225 pm/V, at a bias of E0=2 kV/cm, at �=0.5 µm is shown in Fig.0. Similarly, dark as well as gray soliton solutions can be identified under defocus-ng nonlinear conditions [234,235].
.3. Photovoltaic Nonlinearity
hotovoltaic, or photogalvanic. effects are known to occur in noncentrosymmet-ic crystals such as, for example, LiNbO3, BaTiO3, and KNbO3 [212–220]. This
Table 16. PR Materials Used for Screening Nonlinearities and Their RelevantMaterial Properties
Material Dopant�
�µm� n3reff �pm/V� diel �s�a �nmax
Edc
(KV/cm)
r0.75Ba0.25Nb2O6 Ce 0.4–0.6 17390 0.1–1.0 0.005 3
r0.6Ba0.4Nb2O6 Ce 0.4–0.6 3000 0.1–1.0 0.0014 3
aTiO3 Fe 0.4–0.9 21,500 0.1–1.0 0.005 2.5
nP Fe 0.9–1.3 52 10−6–10−4 510−5 b 8
aAt an intensity of 1 W/cm2.bWith enhancement can go to 510−4.
Figure 80
Intensity distribution corresponding to a bright spatial soliton in SBN:60.
dvances in Optics and Photonics 2, 60–200 (2010) doi:10.1364/AOP.2.000060 166

mrrcpt
Ipm
wot
w
cf−+d
Itv
Artdtaawa
A
echanism results from the asymmetric excitation of carriers and essentially givesise to a current density [214]. This is because carriers are photoexcited from impu-ity centers with a momentum preferentially oriented along the c axis. From theseonsiderations, the current density associated with the photovoltaic effect is pro-ortional to the number of available donors, the optical intensity I, and the pho-oexcitation cross section s, i.e.,
JPV = es�ND − ND+ �LPVI . �7.30�
n Eq. (7.30) LPV is a characteristic length associated with this photogalvanic trans-ort anisotropy—for example, in LiNbO3, LPV is approximately 5 Å. More for-ally, the photovoltaic part in the current density can be expressed as
J�PV = �ijkEjEk, �7.31�
here �ijk represents a third-rank tensor. By adding the photovoltaic componentf Eq. (7.30) to the total current density passing through a PR material, one ob-ains
J� = enµE� + kBTµ � Ne + %effs�ND − ND+ �Ic , �7.32�
here %eff is the photovoltaic constant and c is a unit vector along the c axis of the
rystal. For example, under open circuit conditions �J� =0� and provided that dif-usion effects can be neglected in Eq. (7.32) we find that Esc=−%effs�ND
ND+ �I / �eNeµ�. Given that normally ND
+ NA and that Ne= s�ND−NA��IId� /�RNA, from Eq. (7.17) we find the photovoltaic space-charge field in a PR me-ium [239,240]:
Esc = − EP
I
I + Id
. �7.33�
n Eq. (7.33) EP=%eff�RNA / �eµ� represents the photovoltaic field constant, which isypically of the order of 104–107 V/m. Index changes resulting from the photogal-anic space-charge field can then be obtained from �n=−n0
3reffEsc /2, e.g., [239]
�n =n0
3reffEP
2
I
I + Id
. �7.34�
s in the case of the screening process, the photovoltaic nonlinearity is also satu-able. In addition, in most photovoltaic PR media, the coefficient reffEP is nega-ive, and thus this saturable nonlinearity is of the defocusing type. For this reasonark photovoltaic solitons have been regularly observed in Fe-doped LiNbO3 crys-als [240] (see Table 17). On the other hand, by tuning the background illumination,transition from defocusing to self-focusing can occur in LiNbO3 by exploiting thenisotropy of the photovoltaic tensor. Self-focusing photogalvanic self-action effectsere also observed in KNSBN [�KxNa1−x�2A−2�SryBa1−y�2−ANb2O6][236]. For ex-mple, in LiNbO3, a crystal characterized by a large photovoltaic constant, if we as-
Table 17. Typical Parameters Associated with Fe-Doped LiNbO3
r33 �pm/V� �nmax At Intensity response
30 0.001 �W/cm2 ~minutes
dvances in Optics and Photonics 2, 60–200 (2010) doi:10.1364/AOP.2.000060 167

s�cn
7
NrftneiqK
ww
IPt
Ica�E
8
“mtnetpisn
A
ume that n0=2.2, reff=30 pm/V, and EP 106 V/m, then for I� Id we find thatn�1.610−4. The photovoltaic nonlinearity can be obtained under open and
losed circuit conditions and in conjunction and or competition with the screeningonlinearity [236].
.4. Photorefractive Nonlinearities Due to dc Kerr Effects
onlinear self-action PR effects are also possible in centrosymmetric media as aesult of the dc Kerr effect [214,215]. In this case, the index change is obtainedrom the quadratic electro-optic tensor sijkm [in Eq. (7.1)] as discussed in the in-roduction to Section 7. Such crystals include, for example, potassium tantalateiobate (KTN) and potassium lithium tantalate niobate (KLTN) [241,242]. Forxample, KLTN has a perovskite structure, and in its highest symmetry phase its cubic. In this cubic phase the material’s PR properties are described by theuadratic electro-optic effect. The index change in this system because of the dcerr effect is given by [242]
�n = −n0
3
2geffP
2, �7.35�
here the induced dc low-frequency polarization P is assumed to vary linearlyith the electric field E, that is,
P = �0��r − 1�E . �7.36�
n the above equations, geff is the effective quadratic electro-optic coefficient of theR material and �r stands for the static relative permittivity. From the latter relations,
he expected index change is [243,244]
�n = −n0
3geff�02��r − 1�2
2Esc
2 . �7.37�
f, for example, such a PR material is externally biased, then the maximum indexhange is expected to be approximately �nmax n0
3�geff /2��02��r−1�2E0
2, wheregain as in the screening case E0=V /W. For example, for a KLTN crystal, where
r 8000, n0=2.2, and geff=0.12 m4 C−2, and for an applied external bias field of
0=2 kV/cm, we find that �nmax 1.310−4.
. Electrostrictive Effect
Electrostriction is a property of all electrical nonconductors, or dielectrics, thatanifests itself as a relatively slight change of shape, or mechanical deforma-
ion, under the application of an electric field. Reversal of the electric field doesot reverse the direction of the deformation.” [245] Like the Kerr nonlinearity,lectrostriction is a universal mechanism that occurs in all materials. This is alsorue for an optical field, with the difference that in this case the compression isroportional to the time average of the square of the optical field. This field-nduced stress leads to an increase in the material density. Since the number den-ity of atoms or molecules also increases, there is an increase in the electromag-
etic energy density and an increase in the refractive index. Thus n2,el�0.dvances in Optics and Photonics 2, 60–200 (2010) doi:10.1364/AOP.2.000060 168

Fdsbp
istt
Fe
wd
Sw
Fdes
I
Vt[
Toeas
A
or an optical field polarized along the x direction, the material displacement u�ue to the compression creates an elastic strain in the direction of the appliedtrong field, Sxx=�ux /�x. For a detailed discussion of stresses and strains, see theook by B. A. Auld [246]. This leads via the elasto-optic effect to a nonlinearolarization of the form
PiNL�r�,t� = − �0ni
2nj2pijxxSxxEj�r�,t� , �8.1�
n which the pijk� is the elasto-optic tensor (also known as the acousto-optic ten-or) [167]. For n2�,el�−� ;��, i= j=x is appropriate (coefficient p11 in Voigt nota-ion) and for n2�,el�−� ;��, i= j=y (p21 in Voigt notation) for the case of an addi-ional, weak (“probe”) y-polarized beam.
or an unclamped medium, the work done in compressing the medium ��U� isqual to the increase in electromagnetic energy density ��W�. The work done is
�W = pst
�V
V= − pst
�"
", �8.2�
here pst is the effective pressure exerted by the electromagnetic field on the me-ium and the change in electromagnetic energy is
�U = ��1
2�0�r,x�E0cos�kz − �t��2� = �0
E02
4
��r,x
�"�". �8.3�
etting �U=�W, noting that �"= ��" /�pst�pst, and defining K= ��1/"���" /�pst��−1 as the bulk modulus for pure compressive forces (i.e., only S11�0,hich corresponds to a plane wave field polarized along the x axis), gives
S11 =�"
"=�0"
4KE0
2��r,x
�"= −
�0nx4p11E0
2
4K. �8.4�
or an isotropic material, K= �c11+2c12� /3, whereas for anisotropic materials Kepends on the crystal symmetry, propagation direction, etc. Substituting thisquation for S11 into Px
NL�r� , t� finally gives n2�,el in terms of the electrostrictive con-tant �el (defined below) as
n2�,el�− �;�� =nx
6p112
4Kc=�el
4Kc. �8.5�
t is straightforward to show that
n2�,el�− �;�� =nx
3ny3p11p12
4Kc. �8.6�
alues for n2�,el are given inTable 18 for a number of materials. In general, the softerhe material, the larger is the nonlinearity. Elasto-optic data can be found in247,248].
urn-on and turn-off times are a complex issue. Turning an optical beam on orff involves inducing compressive forces in the medium. They lead to the gen-ration of a spectrum of acoustic waves. The acoustic decay time s��s���s
−2,nd the details of beam shape, sample boundaries, etc., influence the acoustic
pectrum generated, which includes both compressional and shear waves for advances in Optics and Photonics 2, 60–200 (2010) doi:10.1364/AOP.2.000060 169

fi8swatcnn
Tctcsemcsbs
Segses
F
G
M
A
P
A
M
A
nite-sized beam. In Fig. 81 is shown the sequence of events that occurs. Figure1(a) shows the sample before the optical beam enters it. As the beam enters theample, material compression occurs accompanied by the generation of soundaves in all directions; see Fig. 81(b). Beam turn-off is again accompanied by
coustic phonon generation; see Fig. 81(d). In an infinite medium, the shortesturn-on and turn-off times are given by the acoustic transit time across the opti-al beam (beam diameter) /vS, with vS �1 �m/s, giving microsecond–anosecond times. Therefore, the shorter the optical pulse, the smaller the value of
2�,el, since it takes an acoustic transit time to establish this nonlinearity.
he electrostrictive contribution to n2 has typically amounted to a tens of percentontribution to the Kerr effect in various solids and a somewhat larger contribu-ion in liquids because of their low velocity of sound. The spurious effects that itauses have led to important features including spurious optical signals in fusedilica glass fibers, since they have such a small native n2,Kerr [249–251]. Anotherxample is the effect of electrostriction in relatively tight focusing geometries foricrosecond–nanosecond pulses in liquid CS2 found experimentally and numeri-
ally in optical limiting studies [252,253]. Contributions as large as 30% have beeneen. In materials where there is also some absorption, these effects can be com-ined with or masked by thermally driven acoustic waves, which have behaviorsimilar to those discussed in the next section.
Figure 81
equence of events that occur when an intense light beam enters and exits a di-lectric medium. (a) Light at entrance facet to medium. (b) Sound waves areenerated by the material contraction induced by the entering beam. (c) Steady-tate compression exists in the medium as long as the light is present. (d) The tailnd of the beam exits the medium, releasing the compression and generatingound waves. (e) The medium has relaxed to its initial state.
Table 18. Values of n2�,el
Material Polarization � ��m� Elasto-optic Coefficeint K �1010 m2/N� n n2�,el �cm2/W�
used silica (0.63) p11=0.12 3.69 1.46 0.410−16
aAs [110] (1.15) p= �0.14 �7.6 3.37 1.610−15
gO [100] (0.59) p11=0.08 �15.3 1.74 1.010−17
l2O3 [001] (0.63) p33=0.20 �27.0 1.76 3.710−17
olystyrene (0.63) p11=0.31 0.54 1.59 2.410−15
cetone p11=0.35 0.080 1.36 8.510−15
ethanol p11=0.32 0.083 1.33 5.710−15
dvances in Optics and Photonics 2, 60–200 (2010) doi:10.1364/AOP.2.000060 170

9
Aatdsf
T
wml
Wtptasst
Owsupcfi
It
atp
wt d
A
. Thermo-optic Effect
lthough conceptually simple, the index change produced by light absorption isvery complex problem in general [252–254]. Absorption leads to a tempera-
ure change �T, which in turn also leads to a change in local density. A change inensity leads to the generation of sound waves, which effectively relieve thetresses induced by the density changes. Both �T and �" lead to changes in re-ractive index as discussed in Section 6, i.e.,
�n = � �n
�"�
T
�" + � �n
�T�"
�T . �9.1�
he resulting temperature change is given by the thermal diffusion equation
"Cp
���T�
�t− %�2��T� = Q = 1I , �9.2�
here Q is the absorbed power per unit volume per unit time. To a first approxi-ation, the temperature change is the dominant contribution to the thermal non-
inearity.
hat makes this problem difficult is the calculation of the steady-state tempera-ure and hence index distribution. On short times scales of single femtosecond,icosecond, and nanosecond pulses, the initial thermally induced index distribu-ion mirrors that of the incident optical beam. However, for mode-locked laserss well as for cw excitation, the effects are cumulative over microsecond timecales. At this point the size, shape, and thermal boundary conditions of theample become important in establishing the steady-state index change—andhese vary from sample to sample, by geometry, etc.
ptical experiments involve spatially finite beams. Transients due to soundaves occur over the time it takes an acoustic wave to traverse the optical beam,
imilar to electrostriction. The velocity of sound is 1–4 µm/ns. Hence for thesual cases of 0.1–1 mm beams, acoustic transient effects can be ignored for opticalulses 1 µs long, and shorter. Furthermore, since the effect on index of densityhanges is usually much smaller than temperature changes, density changes in therst approximation are neglected.
t is useful to find some simple approach to estimating how large n2,th is for thehermo-optic effect. We start by rewriting Eq. (9.2) as
"Cp
��T
�t− %�2T = Q = 1I, "Cp� ��T
�t−%�2
"Cp
�T = 1I �9.3�
nd note that the term %�2 /"Cp has the units of time. The �2�T term indicateshat any characteristic time will depend on the beam shape, an unwelcome com-lication. It is useful to assume a Gaussian intensity distribution given by
I�r�,t� = I0�z�exp�− r2/w02 − t2/ opt
2 � , �9.4�
here I0 �z� is the on-axis distribution (along the z axis), which decays exponen-ially with distance z due to absorption. Assuming further that the pulse width
opt is much shorter than the thermal diffusion time th, the maximum temperature
istribution is given by the pulse energy absorbed with the spatial temperature dis-dvances in Optics and Photonics 2, 60–200 (2010) doi:10.1364/AOP.2.000060 171

tc
N
tnpa
wsr
r
t
A
Fr
A
k
C
"
d
A
ribution given by the Gaussian beam distribution. The maximum temperaturehange across the beam �Tmax�r�� is given by
�Tmax�r�� =1
"Cp
I�r��−�
�
e−t2/ opt2
dt = �� opt
1
"Cp
I�r��. �9.5�
ote that in
�2��Tmax�r�� = �1
r
�
�r+
�2
�r2�Tmax�r� = −4
w02�1 −
r2
w02��Tmax�r� �9.6�
he largest �T occurs between r=0 and r=w0. This equation can be simplified byeglecting the r2 /w0
2 term, which means that the any solution will be at best ap-roximate. However, this makes it possible to estimate the time evolution of �Tnd the turn-off time subsequent to removing the optical field from
��Tmax�r�,t�
�t= −
4%
w02"Cp
Tmax�r�,t� ⇒ �Tmax�r�,t� = �Tmax�0,t�e−t/ th, �9.7�
here th=w02"Cp /4%. Note that th is not just a material constant! It depends on
ample and beam geometry, heat sinking, beam size, etc. A sampling of th for a va-iety of materials �w0=0.1 mm� is listed in Table 19. Note that
1. There is a strong dependence on the beam size, i.e., w02.
2. Excluding metals, the th varies by about 2 orders of magnitude for a wideange of materials.
3. Because they contain the same atoms, mostly carbon and hydrogen, th inhe organic solvents varies by less than an order of magnitude.
n effective nonlinearity n2,th can be estimated as follows:
�nmax�r�� = � �n
�T�Tmax�r�� = ��� �n
�T opt
1
"Cp
I�r�� ⇒ n2,th � ��� �n
�T opt
1
"Cp
.
or a pulse with a Gaussian shape with th� opt it is the pulse energy �Epulse
ather than the intensity that is important and
�nmax =23/2
�w02� �n
�T 1
"Cp
�Epulse. �9.8�
s an example, consider GaAs:
Table 19. th for a Variety of Materials
Material GaAs Al2O3 NaCl ZnO Acetone C6H6 Methanol
(W/cm °C) 0.55 0.024 0.065 0.30 0.0019 0.0016 0.0020
p (joules/g/°C) 0.33 0.75 0.85 0.83 2.2 1.7 2.4
�g/cm3� 5.32 3.98 2.2 5.5 0.79 0.90 0.80
th (ms) 0.080 3.1 0.72 0.39 45 24 20
n /dT10−4 (/°C) 1.6–2.7 0.13 0.25 0.1 −5.6 −6.2 −4.0
dvances in Optics and Photonics 2, 60–200 (2010) doi:10.1364/AOP.2.000060 172

Fclel
1
Tfo�msest
1
Lupsaaat→tq
Attet
A
= 1 cm−1 and �t = 1 µs ⇒ n2,th = 3
10−10 cm2/W �much bigger than Kerr effect� ,
= 1 cm−1 and �t = 1 ns ⇒ n2,th = 3
10−13 cm2/W �comparable with Kerr effect�
= 1 cm−1 and �t = 1 ps ⇒ n2,th = 3
10−16 cm2/W �negligible�.
or high repetition rates (mode-locked lasers), the key question is the energy ac-umulation over all the pulses within the time window th. For example, a mode-ocked laser operating with 1 ps pulses at a repetition rate of 100 MHz accumulatesnergy from 103 pulses over th, giving a cumulative n2,th=−1.210−12 cm2/W,arger than the Kerr nonlinearity!
0. Cascading Nonlinearity
here are two ways in which a second-order nonlinearity can contribute to an ef-ective n2,cas. In the first, called “local cascading,” a third-order susceptibility isbtained as the product of the molecular second-order susceptibilities�2��−2� ;� ,����2��−� ;2� ,−�� and ��2��−0;� ,−����2��−� ;� ,0�. The light–atter interaction occurs at the molecular level, and there is no propagation of a 2�
ignal. The second is also proportional to the product between second-order nonlin-arities ���2��−2� ;� ,����2��−� ;2� ,−��� but does involve the generation of aecond-harmonic beam that exchanges energy with the fundamental on propaga-ion. This can be called “nonlocal cascading.”
0.1. Local Cascading
ocal cascading refers to a pair of two-step processes, each involving the prod-ct of two optical fields at a noncentrosymmetric molecule. A nonlinear, localolarization is generated at the sum or difference frequency via the molecularecond-order susceptibility �ijk
�2��−��1±�2� ;�1 , ±�2�. The local field generatedt �1±�2 then mixes with the fields at �1 and �2 via �ijk
�2��−�1 ;�1±�2 ,&�2�nd �ijk
�2��&�2 ;�1±�2 ,−�1�, respectively, to give new polarization fields at �1
nd ±�2, respectively. The particular case of interest here, i.e., the contributiono n2�,cascl�−� ;��, i.e., a single input field, involves the two-step processes �+�
2� (second-harmonic generation) and 2�−�→� (difference frequency genera-ion), and the two-step process �−�→0 (dc rectification) and 0+�→� (sum fre-uency generation).
straightforward approach to such a cascading process is to assume that an op-ically excited electron in an anharmonic potential leads to material polariza-ions at the frequencies�, 0, 2�, etc. The total displacement of the electron fromquilibrium q� obeys a nonlinear driven simple harmonic oscillator equation of
he formdvances in Optics and Photonics 2, 60–200 (2010) doi:10.1364/AOP.2.000060 173

wm�+a
mn
cd
Fw
Nctt
Hlpt+
whws
.
Iw
A
qi + �iqi + �i2qi = −
e
mEi −
kijk
mqjqk −
kijk�
mqjqkq�, �10.1�
here kijk and kijk� are nonlinear force constants that can be related directly toeasured second- and third-order susceptibilities �ijk
�2��−��p+�q� ;�p ,�q�N�ijk
�2��−��p+�q� ;�p ,�q� and �ijkl�3� �−��p+�q+�r� ;�p ,�q ,�r��N�ijkl
�3� �−��p
�q+�r� ;�p ,�q ,�r�, respectively. The parameter �i is a resonance frequencyssociated with a transition from the ground state to an excited state, and ulti-
ately a summation over all of the excited states will be required. �i is a phe-omenological damping term related to the lifetime of the excited state. For cas-
ading, the discussion is limited solely to kijk. The inclusion of kijk� would leadirectly to the third-order Kerr nonlinearity in this model.
or a single incident field of frequency �, q� is the total electron displacement,hich has components at multiples of � due to the nonlinearity, i.e.,
qi = qi�0� + qi��� + qi���� + qi�2�� + qi�3�� + . . . . �10.2�
ote that the displacement at � has been separated into the displacement asso-iated with the linear polarization, qi���, and qi���� due to the nonlinear interac-ions, which also produce a nonlinear polarization at�. Since local nonlinear op-ical interactions at the molecule level are normally very small,
qi��� � qi�2��, qi����, qi�0�, qi�3��, etc. �10.3�
ence the linear optics solution for qi��� can be substituted to produce the non-inear term qi���qi��� driving the linear equations for qi�0� and qi�2��. In turn,roducts of those solutions with qi���, i.e., qi�2��qj��� and qi�0�qj���, are usedo generate nonlinear terms for obtaining solutions for qi���� (via 2�−� and 0�) and qi�3�� (which is not of interest here). This procedure results in
qi���� = −1
2� e3
2m5kijmkmk�� Ej
*���Ek���E����
Di���Dj*���Dm�2��Dk���D����
+Ej���Ek
*���E����
Di���Dj���Dm�0�Dk*���D�����ei�kz−�t� + c.c., �10.4�
here Di���= �i2−�2− i�i�. Clearly the first term is the result from the second-
armonic pathway and the second from dc rectification. Defining in the usualay the nonlinear polarization as Pi
NL���=−eNqi����, straightforward algebra re-ults in
n2,casl =1
4ni2�0c
�R,casl,ijk��3� �− �;�,− �,�� =
1
4ni2c
m
2e2N�Dm�2���mk�
�2�
�− 2�;�,���ijm�2� �− �;− �,2�� + Dm�0��mjk
�2� �0;�,− ���i�m�2� �− �;�,0��
�10.5�
t is useful to estimate the order of magnitude of n2,casl for LiNbO3 at nonresonant28 3 3 �3�
avelengths with N=1.8910 mol/m , "=4.64 g/cm , �zzz=56 pm/V:dvances in Optics and Photonics 2, 60–200 (2010) doi:10.1364/AOP.2.000060 174

wgt=w
So
1
Tobripbi
Tat[Epwe
Smgdwtp
A
n2,casl �mD�0�
4n2ce2N��zzz
�2��2 � 5 10−16 cm2/W,
hich is negligible in this case. Consider also another example, the nonlinear or-anic DSTMS (4-N,N-dimethylamino-4-N-methyl-stilbazolium 2,4,6-rimethylbenzenesulfonate), which has the following properties: ��2�
424 pm/V, N=1.81027 molecules/m3, n=2.45, D�0���1015 rad/s,hich yield n2,casl�510−14 cm2/W, certainly not negligible [255].
ince this is a local effect, occurring at the molecular level, the turn-on and turn-ff times are essentially instantaneous.
0.2. Nonlocal Cascading
his process in second-order nonlinear materials was identified in the early daysf nonlinear optics by Ostrovskii but was overlooked until future experimentsrought it back to light [256,257]. This process does not lead to a change in theefractive index of a material, but does result in a nonlinear phase-shift betweennteracting beams coupled via a second-order nonlinear process. This nonlinearhase shift depends in a complicated way on the intensities of the interactingeams, and it accumulates with distance so that it does mimic the effects of anntensity-dependent refractive index coefficient [258–262].
he interest here is in a single incident beam [Ei���, �, ki���] that experiencesn effective nonlinearity n2,casnl. In a noncentrosymmetric medium, this fundamen-al beam can generate a second-harmonic either by birefringence phase matchingEj�2��, 2�, kj�2��; �k=2ki���−kj�2��=0] or quasi-phase-matching (QPM)
i�2��, 2�, ki�2��;�k=2ki���−ki�2��+%=0 where%=2� / and is the QPMeriod]. Away from the phase match, i.e., �k�0, the fundamental and harmonicaves travel at different phase velocities.That is, if�k�0, the harmonic beam trav-
ls faster than the fundamental and vice versa for �k�0; so the relative phase be-
Figure 82
chematic representation of the second-harmonic process that leads off-phaseatch to a nonlinear phase shift in the fundamental. When some harmonic is
enerated by upconversion, it travels at a different phase velocity than the fun-amental. The harmonic is downconverted back to the fundamental frequencyith a phase shift proportional to the product of the phase velocity mismatch and
he coherence length. Thus the reconstituted fundamental experiences a nethase shift [258].
dvances in Optics and Photonics 2, 60–200 (2010) doi:10.1364/AOP.2.000060 175

tta
Cigttclttt
Taa
iums
(wt[
A
ween the two beams changes with propagation distance.As the energy oscillates be-ween the fundamental and the harmonic, relative phase information is transferredlso, and this is the basis of the nonlinear phase shift.
onsider the fundamental beam incident on a second-order crystal. As indicatedn Fig. 82, the second harmonic is generated via ��2��−2� ;� ,��, and it propa-ates some distance (typically the coherence length) before it converts back tohe fundamental via ��2��−� ;2� ,−��. It recombines partially out of phase withhe incident fundamental because of the difference in phase velocities. The in-remental phase shift at a given point depends on the interactions that occur ear-ier in the sample and hence is nonlocal. Furthermore, the higher the fundamen-al input intensity, the larger the conversion to the harmonic, and hence the largerhe relative phase shift imparted by the recombining fundamental. This makeshe process nonlinear.
he equations satisfied by the fundamental and harmonic are the standard onesssociated with second-harmonic generation [field notation in Eq. (2.1)], for ex-mple, for type 1 phase matching:
� + �→ 2�,d
dzE�z,2�� = i
2�
n�2��c�eff
�2��− 2�;�,��E2���ei�kz;
2� − �→ �,d
dzE�z,�� = i
2�
n���c�eff
�2��− �;2�,− ��E�2��E*���e−i�kz;
'1 =2kvac���
n����eff
�2��− �;2�,− ��; '2 =2kvac���
n�2���eff
�2��− 2�;�,��; �10.6�
n which �eff�2� = e
i*�2���ijj
�2��−2� ;� ,��ej���ej���, where ej��� denotes the fieldnit vectors. Numerical solutions for the fundamental’s nonlinear phase shift, funda-ental intensity versus distance, and nonlinear phase shift with input intensity are
hown in Figs. 83 and 84 [262]. The increase in the nonlinear phase shift in the fun-
Figure 83
a) Calculated cw nonlinear phase shift ��NL experienced by the fundamentalith distance for different values of phase mismatch �kL. (b) Corresponding frac-
ion of light in the fundamental beam, also as a function of propagation distance258].
dvances in Optics and Photonics 2, 60–200 (2010) doi:10.1364/AOP.2.000060 176

d�8�swvhado
Vs�
V�
A
amental, ��NL���, occurs in steps with the step size increasing with increasing
coh=� / ��k� with a maximum step size of � /2, Fig. 83(a). Also, as shown in Figs.3(a) and 85, there is a maximum nonlinear phase shift with distance that occurs at�kL��1.6�. Note that for large phase mismatch, the conversion to the harmonic ismall, ��NL��� grows quasi-linearly with distance, and a definition for n2,casnl
ould be useful. Finally, note that the steps in phase shift occur as the harmonic con-erts back to the fundamental, in keeping with the simple model in Fig. 82. Note,owever, that there is a local phase shift of � /2 for fundamental-to-harmonic andnother � /2 for harmonic-to-fundamental conversion; so the nonlinear phase shiftue to backconversion of the harmonic to the fundamental exists on the backgroundf a � phase shift. The growth of ��NL��� with input intensity is initially linear in
Figure 85
ariation with phase mismatch�kL of (a) the nonlinear phase shift��NL and theecond-harmonic intensity for various values of the normalized nonlinearity. Here=�deff
�2��E0� /c�n�n2� [258].
Figure 84
ariation with the incident fundamental intensity of the nonlinear phase shift�NL for various phase mismatches �kL [258].
dvances in Optics and Photonics 2, 60–200 (2010) doi:10.1364/AOP.2.000060 177

itnfmssh
Aimdd
Tdap
iamtc[sims
Tecvmf
�l
A
ntensity but does saturate at very high intensities as shown in Figs. 84 and 85, sincehe second harmonic departs from sinc2��kL /2� under those conditions [263]. Fi-ally, from Fig. 83(b), it is clear that the sample length has to be chosen so that theundamental is fully recovered to its input value in order to maintain high net funda-ental throughput. As always when looking at nonlinear phase shifts there is the as-
ociated nonlinear loss, which here is the loss of the fundamental. For low conver-ion this loss mimics 2PA; i.e., two photons go the second harmonic as opposed toeat in the real 2PA case.
s suggested in Fig. 84, for large �kL, i.e., small harmonic conversion, or smallnput irradiance, i.e., again small depletion, it is possible to obtain a simple for-
ula for n2,casnl. First, the harmonic generation equation is solved for negligibleepletion of the fundamental, and the solution is inserted into the equation for fun-amental regeneration. This gives
d
dzE�z,��= i
'1'2
�k�1 − ei�kz��E����2E���
⇒d
dzE�z,��=
'1'2
�ksin��kz� + i�1 − cos��kz����E����2E���.�
�10.7�
o find a simple definition for the effective n2,nlcas coefficient in the negligible fun-amental depletion regime, one can simply compare the imaginary part of Eq. (10.7)t some point z with the Kerr formulas dE�z ,�� /dz= ikvacn2,KerrI���E�z ,��. Thisrocedure yields
n2,nlcas =4��deff
�2��2
c2�0n2���n�2���k
sin2��kz
2� , �10.8�
n which L is the sample length. Of course, this definition gives a comparison oflocal ��3� nonlinearity to the nonlocal cascading. A different comparison can beade by integrating both third-order and cascaded second-order equations over
he sample length prior to defining an effective n2 (or effective 2), which in-ludes the effects of copropagating fundamental and second-harmonic beams264]. Note that in the final version we use dijj
�2��−2� ;� ,��=2�ijj�2��−2� ;� ,��,
ince it is the material constant diJ�2� that is commonly tabulated for second-order
nteractions. For fundamental input intensities consistent with negligible funda-ental depletion, the accumulated nonlinear phase shift ��NL at the end of a
ample of length L is given by
��NL = �0
L
kvacn2,nlcasdzI��� =2�2�deff
�2��2
c2�0n2���n�2���k
L1 − sinc��kL��I���.
�10.9�
here are a number of interesting properties exhibited by the cascading nonlin-arity. For example, for �kL→�, ��NL is proportional to L, similar to the Kerrase. Furthermore, the sign of the effective nonlinearity n2,nlcas depends on the wave-ector mismatch: it is positive for �k�0 and changes sign when the wave vectorismatch condition is tuned through �k=0; i.e., the nonlinearity can be changed
rom self-focusing to self-defocusing.�2� interactions are parametric processes, i.e., they conserve energy. This fol-
ows immediately from the real part of Eq. (10.7), which describes the periodic
dvances in Optics and Photonics 2, 60–200 (2010) doi:10.1364/AOP.2.000060 178

et
Th
sb
Tlt
EcbasKmctpcismo
Cttl=Qcsto
Ts
A
xchange of energy between the fundamental and the harmonic and can be writ-en in the negligible fundamental depletion limit as
d
dzI��� = −
4�deff�2��2kvac
2 ���
n�2��n2����0c�ksin��kz�I2�z,�� . �10.10�
he small loss of the fundamental at z=L due to the generation of the secondarmonic is obtained from
�0
L dI�z,��
I2�z,��= −
4�deff�2��2kvac
2 ���
n�2��n2����0c�k�
0
L
sin���kz��dz; �10.11�
o the normalized fundamental transmission coefficient for the sample is giveny
T = 1 −I�0,�� − I�L,��
I�0,��� 1 −
2�deff�2��2kvac
2 ���
n�2��n2����0cL2I�0,��sinc2��kL
2�.
�10.12�
his formula is reminiscent of the 2PA process that accompanies the Kerr non-inearity near a two-photon resonance, but of course there is no absorptive loss inhis process and only a “loss” of the fundamental to the harmonic.
xperiments have confirmed the theoretical predictions for this cascading pro-ess. A Z-scan experiment measures the nonlinear phase shift experienced by aeam passing through a sample and hence works for the cascading nonlinearitys well. Results are shown in Fig. 86 for the phase shift experienced whenecond-harmonic generation is tuned through the phase-match condition in aTP �KTiOPO4� sample [265]. The small differences between experiment and nu-erical solutions to the theory are probably because the calculations were done for
w plane waves, whereas only approximate corrections were applied to the results ofhe experiments, which involved pulses and finite beams. However, it is perhaps sur-rising that results of experiments performed in a limit of strong second-harmoniconversion bear a strong resemblance to Eqs. (10.9) and (10.12), which were derivedn the negligible fundamental depletion limit. Nonlocal cascading also leads to thepectral broadening normally associated with self-phase-modulation [266]. Further-ore, all-optical switching based on cascading has also been obtained for a number
f device configurations and found to be in excellent agreement with theory [258].
learly this nonlinearity will exist in all second-order materials. We illustratehis with the example at �=1 µm of QPM LiNbO3, which is phase matchable, andhe organic crystal DSTMS, which is not phase matchable and has a coherenceength of only 3.6 µm but a very large nonlinearity d11=214 pm/V [255]. For L1 cm, n2,casnl is calculated to be 210−12 cm2/W and 3.610−13 cm2/W forPM LiNbO3 (assuming ��kL��1.6�) and DSTMS at�vac=1 µm [255].The con-
lusion is obvious, namely, that the material must either be phase matchable or theecond-order nonlinearity huge, or preferably both, for this mechanism to be impor-ant! Furthermore, this effect saturates, and hence these analytical results are validnly for small intensities.
he turn-on and turn-off times are given by the transit time for light to cross the
ample.dvances in Optics and Photonics 2, 60–200 (2010) doi:10.1364/AOP.2.000060 179

1
TmaopcTd
Atsccselstia
Tpsms
A
1. Conclusions
he phenomena discussed here lead to a large spectrum of possibilities for theagnitude and speed of an intensity-dependent change in the refractive index
nd absorption. The salient question is, what material (or material system) is theptimum? A panel was convened in 1986 to discuss just this question, and its re-ort was published as a paper [267]. There it was concluded that to within aouple of orders of magnitude, the product (n2 response time) is a constant.wenty years later, this conclusion is still valid for nonlinearities ranging over 16 or-ers of magnitude!
lso pointed out in that series of papers is that the details of an application dic-ate which material system is most appropriate. For example, for all-opticalwitching that requires picosecond response times, it is usually necessary to ac-umulate a nonlinear phase shift of about � in a nonlinear medium to get suffi-ient interference between two beams to perform a switching operation. Thiseems to imply that one simply needs to make the nonlinear medium longnough (L) or the intensity (I) high enough to get�, since��NL=n2IL. However,inear and nonlinear loss or even fabrication technology will limit the practicalample length, especially since high throughput is also an important criterion. Fur-hermore, the Kerr relation�n=n2I is only a low-intensity approximation, and theres an upper limit to �n due to either saturation or material damage. These consider-tions have led to the definition of two figures of merit W=2�nmax�I� /�vac1�1
Figure 86
heory and experiment for the nonlocal cascading nonlinearity in KTP near itshase-matching condition for second-harmonic generation as measured by Zcan. (a) Theory and (b) experiment for effective two-photon loss from the har-onic to the fundamental. (c) Theory and (d) experiment for the nonlinear phase
hift [265].
dvances in Optics and Photonics 2, 60–200 (2010) doi:10.1364/AOP.2.000060 180

a[sahoafiomfc
Wfttmiie
Fo�teado
Tlcgs
Tmla
Odoif[dwk
Ifa
A
nd T=�vac2�I� /n2�I��1, where2 is the 2PA coefficient, that need to be satisfied268]. The material that best satisfies these conditions and allows nonlinear phasehifts of�100� is fused silica at 1550 nm in fiber form because of its very low lossnd beam confinement, which arrests beam spreading on propagation and maintainsigh intensities for kilometer distances. The lesson here is that materials should beperated in their nonresonant regime, because there the ultrafast Kerr nonlinearity isconstant and the loss, linear and nonlinear, is very small. Note however, that even inbers, if the operating wavelength is extended into the region in which absorptionccurs due to vibrations, the figures of merit can be violated; so in general specificaterials are useful only over specific wavelength ranges. This is a strong argument
or continuing intensive research into the spectral dependence of nonlinear coeffi-ients over broad wavelength ranges.
hile most of this paper has looked at nonlinear refraction, it is impossible toully describe these phenomena without also mentioning the nonlinear absorp-ion processes that lead to these effects. Just as linear absorption leads to refrac-ion via causality and Kramers–Kronig relations, similar connections can beade with nonlinear processes, as the example of the bound electronic n2 result-
ng from a combination of Raman, ac Stark, and 2PA effects. Every change inndex can be attributed to an absorption process occurring at some frequencyven if widely separated.
or applications that do not require fast response times (longer than microsec-nds), PR and liquid crystal media are ideal. They can have nonlinearities1 cm2/W and are ideal as media for exploring new phenomena. In fact, in most of
hese cases it is the integrated energy rather than the intensity that is the key param-ter. Furthermore, the changes in refractive index may not be reversible. For ex-mple, turning off the index change may require illuminating the medium with ra-iation of a different wavelength.This is the case for the huge nonlinearities that relyn trans-cis isomerization of organic molecules.
hermally related nonlinearities are also very large and easily accessible withow-power cw lasers. But bear in mind that a temperature change generated lo-ally diffuses with time, and the final steady state is determined by a sample’seometry, thermal conductivity, and thermal boundary conditions. Hence the re-ults of an experiment may not be reproducible from sample to sample.
he nuclear contribution due to vibrational modes and electrostriction are nor-ally relatively small effects. We note, however, that they do lead to large stimu-
ated effects such as stimulated Raman and Brillouin scattering under appropri-te conditions [1,2].
ne of the most common consequences of an intensity-dependent refractive in-ex on all time scales is the self-focusing or self-defocusing of high-intensityptical beams with finite cross section. The beam itself creates an effective lensn the medium as a direct consequence of �n�I�. On propagation this can lead toascinating effects in high-intensity nonlinear optics and ultimately damage (see269] for recent reviews). When the nonlinear effect approximately cancels outispersion or diffraction, this can result in beams with fascinating properties,hich do not spread in time or space, as solitons or solitary waves or both, betternown as optical bullets [270].
n addition, we note that the intensity-dependent refractive index can have an ef-ect on second-order nonlinear interactions such as second-harmonic generationnd optical parameteric oscillators, whose efficiency is based on phase matching
dvances in Optics and Photonics 2, 60–200 (2010) doi:10.1364/AOP.2.000060 181
tadid
Ae
R
1
1
1
1
1
1
1
A
hat requires finding conditions to make some index difference vanish. For ex-mple, in birefringent crystal media, both the intensity-dependent refractive in-ex coefficients and dn /dT depend on the optical polarization. Hence changing thencident intensity can detune the phase-matching condition in frequency conversionevices.
dditional ramifications of an intensity-dependent refractive index and nonlin-ar absorption can be found in standard textbooks [1,2].
eferences
1. Y. R. Shen, The Principles of Nonlinear Optics (Wiley-Interscience, 1984).2. R. W. Boyd, Nonlinear Optics (Academic, 1992).3. B. J. Orr and J. F. Ward, “Perturbation theory of the non-linear optical po-
larization of an isolated system,” Mol. Phys. 20, 513–526 (1971).4. M. G. Kuzyk, “Fundamental limits on third-order molecular susceptibili-
ties,” Opt. Lett. 16, 1183–1185 (2000).5. M. Yoshizawa, Y. Hattori, and T. Kobayashi, “Nonlinear optical suscepti-
bilities of epitaxially grown polydiacetylene measured by femtosecondtime-resolved spectroscopy,” Phys. Rev. B 47, 3882–3889 (1993).
6. R. Adair, L. L. Chase, and R. A. Payne, “Nonlinear refractive index of op-tical crystals,” Phys. Rev. B 39, 3337–3350 (1989).
7. L. Chase and E. W. Van Stryland, in Handbook of Laser Science and Tech-nology, Supplement 2: Optical Materials, M. Weber, ed. (CRC Press,1995), Sect. 8, pp 269–366.
8. R. DeSalvo, A. Said, D. Hagan, and E. Van Stryland, “Infrared to ultravioletmeasurements of two-photon absorption and n2 in wide bandgap solids,”IEEE J. Quantum Electron. 32, 1324–1333 (1996).
9. J. Wang, M. Sheik-Bahae, A. A. Said, D. J. Hagan, and E. W. Van Stryland,“Time-resolved Z-scan measurements of optical nonlinearities,” J. Opt.Soc. Am. B 11, 1009–1017 (1994).
0. A. A. Said, M. Sheik-Bahae, D. J. Hagan, T. H. Wei, J. Wang, J. Young, andE. W. Van Stryland, “Determination of bound-electronic and free-carriernonlinearities in ZnSe, GaAs, CdTe, and ZnTe,” J. Opt. Soc. Am. B 9, 405–414 (1992).
1. D. W. Hall, M. A. Newhouse, N. F. Borrelli, W. H. Dumbaugh, and D. L.Weidman, “Nonlinear optical susceptibilities of high-index glasses,” Appl.Phys. Lett. 54, 1293–1295 (1989).
2. For example, D. S. Chemla and J. Zyss, eds., Nonlinear Optical Propertiesof Organic Molecules and Crystals, Quantum Electronics—Principles andApplications, P. F. Liao and P. Kelley, eds. (Academic, 1987), Vols. 1 and 2.
3. A. J. Heeger, “Nobel Lecture: Semiconducting and metallic polymers: thefourth generation of polymeric materials,” Rev. Mod. Phys. 73, 681–700(2001).
4. C. Sauteret, J. P. Hermann, R. Frey, F. Pradere, J. Ducuing, R. H. Baughman,and R. R. Chance, “Optical nonlinearities in one-dimensional-conjugatedpolymer crystals,” Phys. Rev. Lett. 36, 956 (1976).
5. R. R. Chance and G. N. Patel, “Solid-state polymerization of a diacetylenecrystal: thermal, ultraviolet, and �-ray polymerization of 2,4-hexadiyne-1,6-diol bis-(p-toluene sulfonate),” J. Polym. Sci., Part B: Polym. Phys. 16,859–881 (1978).
6. M. Sinclair, D. Moses, K. Agaki, and A. J. Heeger, “Anisotropy of the third-
dvances in Optics and Photonics 2, 60–200 (2010) doi:10.1364/AOP.2.000060 182

1
1
1
2
2
2
2
2
2
2
2
2
2
3
3
3
A
order nonlinear-optical susceptibility in a degenerate-ground-state conju-gated polymer: trans-�CH�x,” Phys. Rev. B 38, 10724–10733 (1988).
7. W.-S. Fann, S. Benson, J. M. J. Madey, S. Etemad, G. L. Baker, and A. J.Heeger, “Spectrum of ��3��−3� ;� ,� ,�� in polyacetylene: an applicationof free-electron laser in nonlinear optical spectroscopy,” Phys. Rev. Lett. 62,1492–1495 (1989).
8. P. C. M. McWilliams, G. W. Hayden, and Z. G. Soos, “Theory of even-parity state and two-photon spectra of conjugated polymers,” Phys. Rev. B43, 9777–9791 (1991).
9. W. E. Torruellas, K. B. Rochford, R. Zanoni, S. Aramaki, and G. I. Stege-man, “The cubic susceptibility dispersion of poly(4-BCMU) thin films:third harmonic generation and two-photon-absorption measurements,” Opt.Commun. 82, 94–100 (1991).
0. B. Lawrence, W. Torruellas, M. Cha, G. I. Stegeman, J. Meth, S. Etemad,and G. Baker, “Identification and role of two-photon excited states in a�-conjugated polymer,” Phys. Rev. Lett. 73, 597–600 (1994).
1. W. E. Torruellas, B. L. Lawrence, G. I. Stegeman, and G. Baker, “Two-photon saturation in the bandgap of a molecular quantum wire,” Opt. Lett.21, 1777–1779 (1996).
2. S. Polyakov, F. Yoshino, M. Liu, and G. Stegeman, “Nonlinear refractionand multiphoton absorption in polydiacetylenes from 1200 to 2200 nm,”Phys. Rev. B 69, 115421 (2004).
3. D. Mukhopadhyay and Z. G. Soos, “Nonlinear optical and electroabsorp-tion spectra of polydiacetylene crystals and films,” J. Chem. Phys. 104,1600–1610 (1996).
4. R. K. Meyer, R. E. Benner, Z. V. Vardeny, M. Liess, M. Ozaki, K. Yoshino,Y. Ding, and T. Barton, “Two photon absorption spectra of luminescent con-ducting polymers,” Synth. Met. 84, 549–550 (1997).
5. L. De Boni, L. S. Corrêa, D. T. Balogh, R. M. Faria, S. C. Zilio, L. Misoguti,and C. R. Mendonça, “MEH-PPV chloroform solution degenerated twophoton absorption spectrum,” proceedings of Encontro Nacional de Físicada Matéria Condensada XXVI (ENFMC XXVI), Ann. Opt. 5, 1–3 (2003).
6. A. Samoc, M. Samoc, M. Woodruff, and B. Luther-Davies, “Tuning theproperties of poly(p-phenylenevinylene) for use in all-optical switching,”Opt. Lett. 20, 1241–3 (1995).
7. E.g., Z. Iqbalt, N. S. Murthyt, Y. P. Khannat, J. S. Szobotai, R. A. Dalterio,and F. J. Owens, “The mechanism of the solid-state phase transitions in thepolydiacetylene, poly-4BCMU: thermal, x-ray diffraction and Raman scat-tering studies,” J. Phys. C 20 4283–4295 (1987).
8. W. Krug, E. Miao, M. Derstine, and J. Valera, “Optical absorption and scat-tering losses of PTS and poly(4-BCMU) thin-film waveguides in the nearinfrared,” J. Opt. Soc. Am. B 6, 726–732 (1989).
9. Reviewed in A. Bahtiar, K. Koynov, A. Kibrom, T. Ahn, and Chr. Bubeck,“Multiphoton spectroscopy of polymers for all-optical switching,” Proc.SPIE 6330, 63300C (2006).
0. G. Wegner, “Recent progress in the chemistry and physics of poly(diacety-lenes),” in Molecular Metals: Proceedings of the NATO Conference on Mo-lecular Metals, W. E. Hatfield, ed. (Springer, 1979) p. 209.
1. Z. G. Soos, P. C. M. McWilliams, and G. W. Hayden, “Coulomb correla-tions and two-photon spectra of conjugated polymers,” Chem. Phys. Lett.171, 14–18 (1990).
2. Reviewed in T. Kobayashi, “Ultrafast relaxation in conjugated polymers
dvances in Optics and Photonics 2, 60–200 (2010) doi:10.1364/AOP.2.000060 183

3
3
3
3
3
3
3
4
4
4
4
4
4
4
4
4
A
with large optical nonlinearity,” Synth. Met. 49–50, 565–581 (1992).3. G. M. Carter, Y. J. Chen, and S. K. Tripathy, “Intensity dependent index of
refraction in organic materials,” Opt. Eng. 24, 609–612 (1985).4. J. Bolger, T. G. Harvey, W. Ji, A. K. Kar, S. Molyneux, B. S. Wherrett, D.
Bloor, and P. Norman, “Near-resonant third-order optical nonlinearities inp-toluene sulfonate polydiacetylene,” J. Opt. Soc. Am. B 9, 1552–1557(1992).
5. P. A. Gass, I. Abram, R. Raj, and M. Schott, “The nonlinear optical spec-trum of polydiacetylene in the near infrared,” J. Chem. Phys. 100, 88–97(1994).
6. A. K. Bhowmik and M. Thakur, “Self-phase modulation in polydiacetylenesingle crystal measured at 720–1064 nm,” Opt. Lett. 26, 902–904 (2001).
7. B. L. Lawrence, M. Cha, W. E. Torruellas, G. I. Stegeman, S. Etemad, andG. Baker, “Measurement of the nonlinear refractive index and two photonabsorption coefficient of PTS at 1064 nm,” Appl. Phys. Lett. 64, 2773–2775 (1994).
8. R. Quintero-Torres and M. Thakur, “Measurement of the nonlinear refrac-tive index of polydiacetylene using Michelson interferometry and z-scan,”J. Appl. Phys. 85, 401–403 (1999).
9. J. A. DeAro, U. Lemmer, D. Moses, and S. K. Buratto, “Nanoscale opticalmicroscopy of conjugated polymer films,” Synth. Met. 101, 300–301(1999).
0. C. H. Lee, J. Y. Park, Y. W. Park, D. Moses, A. J. Heeger, T. Noguchid, andT. Ohnishid, “Polarization dependence of the photoconductivity of stretch-oriented poly(p-phenylenevinylene) films,” Synth. Met. 101, 444–445(1999).
1. M. Samoc, A. Samoc, and B. Luther-Davies, “Two-photon and one-photonresonant third-order nonlinear optical properties of �-conjugated poly-mers,” Synth. Met. 109, 79–83 (2000).
2. M. Samoc, A. Samoc, B. Luther-Davies, and M. Woodruff, “The concept ofguiding light with light and negative third-order optical nonlinearities of or-ganics,” J. Opt. A, Pure Appl. Opt. 5, 681–687 (1996).
3. M. Samoc, A. Samoc, B. Luther-Davies, Z. Bao, L. Yu, B. Hsieh, and U.Scherf, “Femtosecond Z-scan and degenerate four-wave mixing measure-ments of real and imaginary parts of the third-order nonlinearity of solubleconjugated polymers,” J. Opt. Soc. Am. B 15, 817–825 (1998).
4. K. Rochford, R. Zanoni, G. I. Stegeman, W. Krug, E. Miao, and M. W. Be-ranek, “Measurement of nonlinear refractive index and transmission inpolydiacetylene waveguides at 1.319 pm,” Appl. Phys. Lett. 58, 13–15(1991).
5. M. Samoc, A. Samoc, B. Luther-Davies, J. Swiatkiewicz, C. Q. Jin, and J.W. White, “Real and imaginary components of the third-order nonlinearityof polyaniline dodecylbenzenesulfonic salt,” Opt. Lett. 20, 2478–2480(1995).
6. R. Rangel-Rojo, S. Yamada, H. Matsuda, H. Kasai, H. Nakanishi, A. K.Kar, and B. S. Wherrett, “Spectrally resolved third-order nonlinearities inpolydiacetylene microcrystals: influence of particle size,” J. Opt. Soc. Am.B 15, 2937–2945 (1998).
7. X. Chen, G. Zou, Y. Deng, and Q. Zhang, “Synthesis and nonlinear opticalproperties of nanometer-size silver-coated polydiacetylene compositevesicles,” Nanotechnology 19, 195703 (2008).
8. K. D. Belfield, K. J. Schafer, W. Mourad, and B. A. Reinhardt, “Synthesis of
dvances in Optics and Photonics 2, 60–200 (2010) doi:10.1364/AOP.2.000060 184

4
5
5
5
5
5
55
5
5
5
6
6
6
A
new two-photon absorbing fluorene derivatives via Cu-mediated Ullmanncondensations,” J. Org. Chem. 65, 4475–4481 (2000).
9. M. Yamashita, S. Kikuma, Y. Yamaoka, H. Murakami, R. Morita, and H.Shigekawa, “Nonresonant femtosecond second hyperpolarizabilities of in-tramolecular charge-transfer molecules with great excited- and ground-state dipole-moment differences,” Appl. Phys. Lett. 75, 28–30 (1999).
0. For example, S. R. Marder, S. W. Perry, G. Bourhill, C. B. Gorman, B. G.Tiemann, and K. Mansour, “Relation between bond-length alternation andsecond electronic hyperpolarizability of conjugated organic molecules,”Science 261, 186–189 (1993); Chr. B. Gorman and S. R. Marder, “An in-vestigation of the interrelationships between linear and nonlinear polariz-abilities and bond-length alternation in conjugated organic molecules,” 90,11297–11301 (1993).
1. D. Lu, G. Chen, J. W. Perry, and W. A. Goddard III, “Valence-bond charge-transfer model for nonlinear optical properties of charge-transfer organicmolecules,” J. Am. Chem. Soc. 116, 10679–10685 (1994).
2. Reviewed in S. Barlow and S. R. Marder, “Nonlinear optical properties oforganic materials,” in Functional Organic Materials: Syntheses, Strategiesand Applications, T. J. J. Muller and U. H. F. Bunz, eds. (Wiley, 2007), Chap.11.
3. Reviewed in J. M. Hales and J. W. Perry, “Organic and polymeric 3rd-ordernonlinear optical materials and device applications,” in Introduction to Or-ganic Electronic and Optoelectronic Materials and Devices, S.-S. Sun andL. Dalton, eds. (CRC Press, 2008), Chap. 17.
4. See, for example, R. M. de Ridder, A. Driessen, E. Rikkers, P. V. Lambeck,and M. B. J. Diemeer, “Design and fabrication of electro-optic polymermodulators and switches,” Opt. Mater. 12, 205–214 (1999).
5. D. L. Wise, Electrical and Optical Polymer Systems (CRC Press, 1998).6. G. I. Stegeman, A. Galvan-Gonzales, M. Canva, R. Twieg, T. C. Kowalczyk,
X. Q. Zhang, H. S. Lackritz, S. Marder, S. Thayumanavan, K. P. Chan, A.K.-Y. Jen, and X. Wu, “Photodegradation of various electro-optic polymerfamilies,” Nonlinear Opt. 25, 57–66 (2000).
7. M. B. Marques, G. Assanto, G. I. Stegeman, G. R. Mohlmann, E. W. P. Er-dhuisen, and W. H. G. Horsthuis, “Intensity dependent refractive index ofnovel polymer materials: measurements by nonlinear grating coupling,”Appl. Phys. Lett. 58, 2613–2615 (1991).
8. M. J. Goodwin, C. Edge, C. Trundle, and I. Bennion, “Intensity-dependentbirefringence in nonlinear organic polymer waveguides,” J. Opt. Soc. Am. B5, 419–424 (1988).
9. H. Kanbara, H. Kobayashi, and T. Kaino, “Highly efficient ultrafast opticalKerr shutters with the use of organic nonlinear materials,” J. Opt. Soc. Am.B 11, 2216–2223 (1994).
0. S. Ohira, I. Rudra, K. Schmidt, S. Barlow, S. J. Chung, Q. Zhang, J. Mati-chuk, S. R. Marder, and J.-L. Bredas, “Electronic and vibronic contribu-tions to two-photon absorption in donor-acceptor-donor squaraine chro-mophores,” Chem.-Eur. J. 14, 11082–11091 (2008).
1. K. S. Mathis, M. G. Kuzyk, C. W. Dirk, A. Tan, S. Martinez, and G. Gam-pos, “Mechanisms of the nonlinear optical properties of squaraine dyes inpoly(methyl methacrylate) polymer,” J. Opt. Soc. Am. B 15, 871–883(1998).
2. D. W. Garvey, Q. Li, M. G. Kuzyk, C. W. Dirk, and S. Martinez, “Sagnacinterferometric intensity-dependent refractive-index measurements of poly-
dvances in Optics and Photonics 2, 60–200 (2010) doi:10.1364/AOP.2.000060 185

6
6
6
6
6
6
6
7
7
7
7
7
7
7
7
7
7
8
A
mer optical fiber,” Opt. Lett. 21, 104–106 (1996).3. M. G. Kuzyk, U. C. Paek, and C. W. Dirk, “Guest-host polymer fibers for
nonlinear optics,” Appl. Phys. Lett. 59, 902–904 (1991).4. S.-J. Chung, S. Zheng, T. Odani, L. Beverina, J. Fu, L. A. Padilha, A.
Biesso, J. M. Hales, X. Zhan, K. Schmidt, A. Ye, E. Zojer, S. Barlow, D. J.Hagan, E. W. Van Stryland, Y. Yi, Z. Shuai, G. A. Pagani, J.-L. Bredas, J. W.Perry, and S. R. Marder, “Extended squaraine dyes with large two-photonabsorption cross-sections,” J. Am. Chem. Soc. 128, 14444–14445 (2006).
5. J. M. Hales, S. Zheng, S. Barlow, S. R. Marder, and J. W. Perry, “Bisdiox-aborine polymethines with large third-order nonlinearities for all-opticalsignal processing,” J. Am. Chem. Soc. 128, 11362–11363 (2008).
6. H. Ma and A. K.-Y. Jen, “Functional dendrimers for nonlinear optics,” Adv.Mater. 13, 1201–1205 (2001).
7. M. Samoc, A. Samoc, B. Luther-Davies, M. G. Humphrey, and M. P. Cifu-entes, “Nonlinear absorption: materials and mechanisms,” in Proceedingsof the Symposium on Photonics Technologies for 7th Framework ProgramWroclaw 12-14 October 2006 (2006) 230–233 .
8. S. J. Chung, K. S. Kim, T. C. Lin, G. S. He, J. Swiatkiewicz, and P. N.Prasad, “Cooperative enhancement of two-photon absorption in multi-branched structures,” J. Phys. Chem. B 103, 10741–10745 (1999).
9. O. Varnavski, A. Leanov, L. Liu, J. Takacs, and T. Goodson, “Large nonlin-ear refraction and higher order nonlinear optical effects in a novel organicdendrimer,” J. Phys. Chem. B 104, 179–188 (2000).
0. For example, W. Jones, ed., Organic Molecular Solids: Properties and Ap-plications (CRC Press 1997).
1. For example, H. S. Nalwa and S. Miyata, eds., Nonlinear Optics of OrganicMolecules and Polymers (CRC Press, 1997).
2. E. W. Van Stryland, M. Sheik-Bahae, A. A. Said, and D. J. Hagan, “Charac-terization of nonlinear optical absorption and refraction,” Prog. Cryst.Growth Charact. Mater. 27, 279–311 (1993).
3. T. H. Wei, D. J. Hagan, M. J. Sence, E. W. Van Stryland, J. W. Perry, and D.R. Coulter, “Direct measurements of nonlinear absorption and refraction insolutions of phthalocyanines,” Appl. Phys. B 54, 46–51 (1992).
4. For example, J. Worlock, “Two-photon spectroscopy,” in Laser Handbook,F. T. Arecchi and E. O. Schulz-Dubois, eds. (North Holland,1972), Vol. 2,pp. 1323–1369.
5. W. Blau, H. Byrne, W. M. Dennis, and J. M. Kelly, “Reverse saturable ab-sorption in tetraphenylporphyrins,” Opt. Commun. 56, 25–29 (1986).
6. T. Xia, D. Hagan, A. Dogariu, A. Said, and E. Van Stryland, “Optimizationof optical limiting devices based on excited-state absorption,” Appl. Opt.36, 4110–4122 (1997).
7. C. Giuliano and L. Hess, “Nonlinear absorption of light: optical saturationof electronic transitions in organic molecules with high intensity laser ra-diation,” IEEE J. Quantum Electron. 3, 358–367 (1967).
8. O. V. Przhonska, J. Lim, D. Hagan, and E. Van Stryland, “Nonlinear lightabsorption of polymethine dyes in liquid and solid media,” J. Opt. Soc. Am.B 15, 802–809 (1998).
9. R. Lepkowicz, A. Kobyakov, D. J. Hagan, and E. W. Van Stryland, “Pico-second optical limiting in reverse saturable absorbers: a theoretical and ex-perimental study,” J. Opt. Soc. Am. B 19, 94–101 2002.
0. J. H. Lim, O. V. Przhonska, S. Khodja, S. Yang, T. S. Ross, D. J. Hagan, E.W. Van Stryland, M. V. Bondar, and Y. L. Slominsky, “Polymethine and
dvances in Optics and Photonics 2, 60–200 (2010) doi:10.1364/AOP.2.000060 186

88
8
8
8
8
8
8
8
9
9
9
9
9
9
9
9
A
squarylium molecules with large excited-state absorption,” Chem. Phys.245, 79–97 (1999).
1. Answers.com, http://www.answers.com/topic/glass.2. Discussed in G. P. Agrawal, Nonlinear Fiber Optics, 3rd ed., Optics and
Photonics Series, P. L. Kelley, I. P. Kaminow, and G. P. Agrawal, eds. (Aca-demic, 2001).
3. S. Santran, L. Canioni, L. Sarge, Th. Cardinal, and E. Fargin, “Precise andabsolute measurements of the complex third-order optical susceptibility,” J.Opt. Soc. Am. B 21, 2180–2190 (2004).
4. Th. Cardinal, E. Fargin, J. J. Videau, L. Canioni, B. Busquet, V. Rodriguez,M. Couzi, P. Thomas, and L. Petit, “Interaction laser dans les verres et pro-cessus optique non linéaires,” Verre (Paris) 13, 16–25 (2007).
5. R. Adair, L. L. Chase, and S. A. Payne, “Nonlinear refractive-index mea-surements of glasses using three-wave frequency mixing,” J. Opt. Soc. Am.B 4, 875–881 (1987).
6. S. R. Friberg and P. W. Smith, “Nonlinear optical glasses for ultrafast opti-cal switches,” IEEE J. Quantum Electron. QE-23, 2089–2094 (1987).
7. M. A. Newhouse, D. L. Weidman, and D. W. Hall, “Enhanced-nonlinearitysingle-mode lead silicate optical fiber,” Opt. Lett. 15, 1185–1187 (1990).
8. J. E. Aber, M. C. Newstein, and B. A. Garetz, “Femtosecond optical Kerreffect measurements in silicate glasses,” J. Opt. Soc. Am. B 17, 120–127(2000).
9. T. Cardinal, E. Fargin, G. Le Flem, and S. Leboiteux, “Correlations betweenstructural properties of Nb2–O5–NaPO3–Na2B407 glasses and non-linearoptical activities,” J. Non-Cryst. Solids 222, 228–234 (1997).
0. J. C. Sabadel, P. Armand, D. Cachau-Herreillat, P. Baldeck, O. Doclot, A.Ibanez, and E. Philippot, “Structural and nonlinear optical characterizationsof tellurium oxide-based glasses: TeO2–BaO–TiO2,” J. Solid State Chem.132, 411–419 (1997).
1. B. Jeansannetas, S. Blanchandin, P. Thomas, P. Marchet, J. C.Champarnaud-Mesjard, T. Merle-MeHjean, B. Frit, V. Nazabal, E. Fargin,G. Le Flem, M. O. Martin, B. Bousquet, L. Canioni, S. Le Boiteux, P. Seg-onds, and L. Sarger, “Glass structure and optical nonlinearities in thal-lium(I) tellurium(IV) oxide glasses,” J. Solid State Chem. 146, 329–335(1999).
2. M. Asobe, “Nonlinear optical properties of chalcogenide glass fibers andtheir application to all-optical switching,” Opt. Fiber Technol. 3, 142–148(1997).
3. G. Lenz, J. Zimmermann, T. Katsufuji, M. E. Lines, H. Y. Hwang, S. Spal-ter, R. E. Slusher, S. W. Cheong, J. S. Sanghera, and I. D. Aggarwal, “LargeKerr effect in bulk Se-based chalcogenide glasses,” Opt. Lett. 25, 254–256(2000).
4. J. Requejo-Isidro, A. K. Mairaj, V. Pruneri, D. W. Hewak, M. C. Netti and J.J. Baumberg, “Self refractive non-linearities in chalcogenide basedglasses,” J. Non-Cryst. Solids 317, 241–246 (2000).
5. F. Smektala, C. Quemard, V. Couderc, and A. Barthelemy, “Non-linear op-tical properties of chalcogenide glasses measured by Z-scan,” J. Non-Cryst.Solids 274, 232–237 (2000).
6. J. M. Harbold, F. Ömer Ilday, F. W. Wise, and B. G. Aitken, “Highly nonlin-ear Ge–As–Se and Ge–As–S–Se glasses for all-optical switching,” IEEEPhoton. Technol. Lett. 14, 822–824 (2002).
7. H. C. Nguyen, K. Finsterbusch, D. J. Moss, and B. J. Eggleton, “Dispersion
dvances in Optics and Photonics 2, 60–200 (2010) doi:10.1364/AOP.2.000060 187

9
9
1
11
1
1
1
1
1
1
1
1
1
1
1
1
1
A
in nonlinear figure of merit of As2Se3 chalcogenide fibre,” Electron. Lett. 42,571–572 (2006).
8. N. L. Boling, A. J. Glass, and A. Owyoung, “Emperical relations for pre-dicting nonlinear refractive index changes in optical solids,” IEEE J. Quan-tum Electron. QE-14, 601–608 (1978).
9. H. Haug and S. W. Koch, Quantum Theory of the Optical and ElectronicProperties of Semiconductors (World Scientific, 1990).
00. M. Sheik-Bahae, “Optical nonlinearities in the transparency region of bulksemiconductors,” in Nonlinear Optics in Semiconductors I, E. Garmire andA. Kost, eds. (Academic, 1999), Chap. 4, pp 257–318.
01. Cl. Klingshirn, Semiconductor Optics (Springer-Verlag, 2001).02. A. D. Yoffe, “Low-dimensional systems: quantum size effects and elec-
tronic properties of semiconductor microcrystallites (zero-dimensionalsystems) and some quasi-two-dimensional systems,” Adv. Phys. 51, 799–890 (2002).
03. Reviewed by A. Othonos, “Probing ultrafast carrier and phonon dynamicsin semiconductors,” J. Appl. Phys. 83, 1789–1830 (1998).
04. Reviewed by J. Mørk, M. L. Nielsen, and T. W. Berg, “The dynamics ofsemiconductor optical amplifier: modeling and applications,” Opt. Photo-nics News 14(7), 42–48 (July 2003).
05. Reviewed in R. J. Manning, A. D. Ellis, A. J. Poustie, and K. J. Blow,“Semiconductor laser amplifiers for ultrafast all-optical signal process-ing,” J. Opt. Soc. Am. B 14, 3204–3216 (1997).
06. J. Mørk and A. Mecozzi, “Theory of the ultrafast optical response of activesemiconductor waveguides,” J. Opt. Soc. Am. B 13, 1803–1815 (1996).
07. P. LiKamWa, A. Miller, J. S. Roberts, and P. N. Robson, “130 ps recoveryof all-optical switching in a GaAs multiquantum well directional coupler,”Appl. Phys. Lett. 58, 2055–2057 (1991).
08. Y. H. Lee, A. Chavez-Pirson, S. W. Koch, H. M. Gibbs, S. H. Park, J.Morhange, A. Jeffery, N. Peyghambarian, L. Banyai, A. C. Gossard, andW. Wiegmann, “Room-temperature optical nonlinearities in GaAs,” Phys.Rev. Lett. 57, 2446–2449 (1986).
09. L. Banyai and S. W. Koch, “A simple theory for the effects of plasmascreening on the optical spectra of highly excited semiconductors,” Z.Phys. B 63, 283–291 (1986).
10. A. G. Aronov, D. E. Pikus, and D. Shekhter, “Quantum theory of free-electron dielectric constant in semiconductors,” Sov. Phys. Solid State 10,645–647 (1968).
11. D. H. Auston, S. McAffee, C. V. Shank, E. P. Ippen, and O. Teschke, “Pi-cosecond spectroscopy of semiconductors,” Solid-State Electron. 21, 147–150 (1978).
12. D. A. B. Miller, C. T. Seaton, M. E. Prise, and S. D. Smith, “Band-gap reso-nant nonlinear refraction in III–V semiconductors,” Phys. Rev. Lett. 47,197–200 (1981).
13. B. S. Wherrett, A. C. Walker, and F. P. Tooley, “Nonlinear refraction for cwoptical bistability,” in Optical Nonlinearities and Instabilities in Semicon-ductors, H. Haug, ed. (Academic, 1988), p. 239.
14. T. S. Moss, “Theory of intensity dependence of refractive index,” Phys.Status Solidi B 101, 555–561 (1980).
15. E. O. Kane, “Band structure of narrow gap semiconductors,” in NarrowGap Semiconductors Physics and Applications, Vol. 133 of Lecture Notesin Physics, W. Zawadski, ed. (Springer Verlag, 1980), pp. 13–31.
dvances in Optics and Photonics 2, 60–200 (2010) doi:10.1364/AOP.2.000060 188

1
1
1
1
1
1
1
1
1
1
1
1
1
1
1
1
1
1
A
16. J. W. Kurnick and J. M. Powell, “Optical absorption in pure single crystalInSb at 298° and 78°K,” Phys. Rev. 116, 597–604 (1959).
17. H. P. Li, C. H. Kam, Y. L. Lam, W. Ji, “Optical nonlinearities and photo-excited carrier lifetime in CdS at 532 nm,” Opt. Commun. 190, 351–356(2001).
18. X. J. Zhang, W. Ji, and S. H. Tang, “Determination of optical nonlinearitiesand carrier lifetime in ZnO,” J. Opt. Soc. Am. B 14, 1951–1955 (1997).
19. V. Dubikovskiy, D. J. Hagan, and E. W. Van Stryland, “Large nonlinear re-fraction in InSb at 10 µm and the effects of Auger recombination,” J. Opt.Soc. Am. B 25, 223–235 (2008). Note: a range of values is given, sincehere Boltzmann statistics do not hold and the cross section becomes den-sity dependent.
20. T. Boggess, S. Moss, I. Boyd, and A. Smirl, “Nonlinear-optical energyregulation by nonlinear refraction and absorption in silicon,” Opt. Lett. 9,291–293 (1984).
21. N. Peyghamberian and S. W. Koch, “Semiconductor nonlinear properties,”in Nonlinear Photonics, H. M. Gibbs, G. Khitrova, and N. Peyghamberian,eds., Vol. 30 of Springer Series in Electronics and Photonics, D. H. Auson,W. Engl, and T. Sugnao, eds. (Springer-Verlag, 1990), Chap. 2, pp 7–60.
22. M. Sheik-Bahae and E. W. Van Stryland, “Ultrafast nonlinearities in semi-conductor laser amplifiers,” Phys. Rev. B 50, 171–178 (1994).
23. D. C. Hutchings, M. Sheik-Bahae, D. J. Hagan, and E. W. Van Stryland,“Kramers–Krönig relations in nonlinear optics,” Opt. Quantum Electron.24, 1–30 (1992).
24. D. C. Hutchings and E. W. Van Stryland, “Nondegenerate two-photon ab-sorption in zinc-blende semiconductors,” J. Opt. Soc. Am. B 9, 2065–2074(1992).
25. M. Sheik-Bahae, D. C. Hutchings, D. J. Hagan, and E. W. Van Stryland,“Dispersion of bound electronic nonlinear refraction in solids,” IEEE J.Quantum Electron. QE-27, 1296–1309 (1991).
26. B. S. Wherrett, “Scaling rules for multiphoton interband absorption insemiconductors,” J. Opt. Soc. Am. B 1, 67–72 (1984).
27. M. Balu, L. Padilha, D. J. Hagan, E. W. Van Stryland, S. Yao, K. Belfield, S.Zheng, S. Barlow, and S. Marder, “Broadband Z-scan characterization us-ing a high-spectral-irradiance, high-quality supercontinuum,” J. Opt. Soc.Am. B 25, 159–165 (2008).
28. G. I. Stegeman, A. Villeneuve, J. Kang, J. S. Aitchison, C. N. Ironside, K.Al-hemyari, C. C. Yang, C.-H. Lin, H.-H. Lin, G. T. Kennedy, R. S. Grant,and W. Sibbett, “AlGaAs below half bandgap: the silicon of nonlinear op-tical materials,” Int. J. Nonlinear Opt. Phys. 3, 347–371 (1994).
29. E. Dulkeith, Y. A. Vlasov, X. Chen, N. C. Panoiu, and R. M. Osgood, Jr.,“Self-phase-modulation in submicron silicon-on insulator photonicwires,” Opt. Express 14, 5324–5334 (2006).
30. M. Higashiwaki, S. Shimomura, S. Hiyamizu, and S. Ikawa, “Self-organized GaAs quantum-wire lasers grown on B-oriented GaAs sub-strates by molecular beam epitaxy,” Appl. Phys. Lett. 74, 780–782 (1999).
31. G. P. Banfi, V. Degiorgio, and D. Ricard, “Nonlinear optical properties ofsemiconductor nanocrystals,” Adv. Phys. 47, 447–510 (1998).
32. M. D. Dvorak, B. L. Justus and A. D. Berry, “Pump/probe Z-scan studiesof GaAs nanocrystals grown in porous glass,” Opt. Commun. 116, 149–152 (1995).
33. R. Dingle, W. Wiegmann, and C. H. Henry, “Quantum states of confined
dvances in Optics and Photonics 2, 60–200 (2010) doi:10.1364/AOP.2.000060 189

1
1
1
1
1
1
1
1
1
1
1
1
1
1
1
A
carriers in very thin AlxGa1−xAs–GaAs–AlxGa1−xAs heterostructures,”Phys. Rev. Lett. 33, 827–830 (1974).
34. For example, C. Y. Liu and S. Yuan, “InGaAs/GaAs quantum well circularring lasers fabricated by laser direct writing and pulsed anodic oxidation,” J.Cryst. Growth 268, 364–368 (2004).
35. For example, H. M. Ng, C. Gmachl, S. N. G. Chu, and A. Y. Cho, “Molecu-lar beam epitaxy of GaN/AlxGa1−xN superlattices for 1.52–4.2 µm inter-subband transitions,” J. Cryst. Growth 220, 432–438 (2000).
36. For example, reviewed in S. Schmitt-Rink, D. S. Chemla, and D. A. B.Miller, “Linear and nonlinear optical properties of semiconductor quan-tum wells,” Adv. Phys. 38, 89–188 (1989).
37. S. H. Park, J. F. Morhange, A. D. Jefferey, R. A. Morgan, A. Chavez-Pirson, H. M. Gibbs, S. W. Koch, N. Peyghamberian, M. Derstine, A. C.Gossard, J. H. English, and W. Weigmann, “Measurements of room-temperature, band-gap-resonant optical nonlinearities of GaAs/AlGaAsmultiple quantum wells and bulk GaAs,” Appl. Phys. Lett. 52, 1201–1203(1988).
38. S. J. Wagner, J. Meier, A. S. Helmy, J. S. Aitchison, M. Sorel, and D. C.Hutchings, “Polarization-dependent nonlinear refraction and two-photonabsorption in GaAs/AlAs superlattice waveguides below the half-bandgap,”J. Opt. Soc. Am. B 24, 1557–1563 (2007).
39. L. Brzozowskia, E. H. Sargent, A. Spring Thorpe and M. Extavour, “Directmeasurements of large near-band edge nonlinear index change from 1.48to 1.55 µm in InGaAs/ InAlGaAs multiquantum wells,” Appl. Phys. Lett.82, 4429–4431 (2003).
40. R. Liu, Y. Shu, G. Zhang, J. Sun, X. Xing, B. Pi, J. Yao, Z. Wang, and J. Xu,“Study of nonlinear absorption in GaAs/AlGaAs multiple quantum wellsusing the reflection Z-scan,” Opt. Quantum Electron. 39, 1207–1214(2007).
41. A. L. Efros and A. V. Rodina, “Confined excitons, trions and biexcitons insemiconductor microcrystals,” Solid State Commun. 72, 645–649 (1989).
42. A. L. Efros and A. V. Rodina, “Band-edge absorption and luminescence ofnonspherical nanometer-size crystals,” Phys. Rev. B 47, 10005–10007(1993).
43. R. K. Jain and R. C. Lind, “Degenerate four-wave mixing insemiconductor-doped glasses,” J. Opt. Soc. Am. 73, 647–653 (1983).
44. P. Horan and W. Blau, “Photodarkening effect and the optical nonlinearityin a quantum-confined, semiconductor-doped glass,” J. Opt. Soc. Am. B 7,304–308 (1990).
45. S. S. Yao, C. Karaguleff, A. Gabel, R. Fortenberry, C. T. Seaton, and G. I.Stegeman, “Ultrafast carrier and nonlinear grating lifetimes of optical fil-ter glass,” Appl. Phys. Lett. 46, 801–802 (1985).
46. M. Ghanassi, M. C. Schanne-Klein, F. Hache, A. I. Ekimov, D. Ricard, andChr. Flytzanis, “Time-resolved measurements of carrier recombination inexperimental semiconductor-doped glasses: confirmation of the role ofAuger recombination,” Appl. Phys. Lett. 62, 78–80 (1993).
47. A. I. Ekimov, F. Hache, M. C. Schanne-Klein, D. Ricard, Chr. Flytzanis, I.A. Kudryavtsev, T. V. Yazeva, A. V. Rodina, and Al. L. Efros, “Absorptionand intensity-dependent photoluminescence measurements on CdSe quan-tum dots: assignment of the first electronic transitions,” J. Opt. Soc. Am. B10, 100–107 (1993).
48. N. F. Borrelli, D. W. Hall, H. J. Holland, and D. W. Smith, “Quantum con-
dvances in Optics and Photonics 2, 60–200 (2010) doi:10.1364/AOP.2.000060 190

1
1
1
1
1
1
1
1
1
1
1
1
1
1
1
A
finement effects of semiconductor crystallites in glass,” J. Appl. Phys. 61,5399–5409 (1987).
49. G. R. Olbright, N. Peyghambarian, S. W. Koch, and L. Banyai, “Opticalnonlinearities of glasses doped with semiconductor microcrystallites,”Opt. Lett. 12, 413–415 (1987).
50. L. A. Padilha, J. Fu, D. J. Hagan, E. W. Van Stryland, C. L. Cesar, L. C.Barbosa, C. H. B. Cruz, D. Buso, and A. Martucci, “Frequency degenerateand nondegenerate two-photon absorption spectra of semiconductor quan-tum dots,” Phys. Rev. B 75, 075325 (2007).
51. E. M. Wright, S. W. Koch, J. E. Ehrlich, C. T. Seaton, and G. I. Stegeman,“Semiconductor figure of merit for nonlinear directional couplers,” Appl.Phys. Lett. 52, 2127–2129 (1988).
52. N. Finlayson, W. C. Banyai, C. T. Seaton, G. I. Stegeman, M. O’Neill, T. J.Cullen, and C. N. Ironside, “Optical nonlinearities in CdSxSe1−x-dopedglass waveguides,” J. Opt. Soc. Am. B 6, 675–684 (1989).
53. C. Gan, M. Xiao, D. Battaglia, N. Pradhan, and X. Peng, “Size dependenceof nonlinear optical absorption and refraction of Mn-doped ZnSe nano-crystals,” Appl. Phys. Lett. 91, 201103 (2007).
54. Z. Yin, X. Tang, J. Zhao, and S. Deny, “Effects of growth conditions onInAs quantum dot formation by metal-organic chemical vapor depositionusing tertiarybutylarsine in pure N2 ambient,” J. Appl. Phys. 99, 124306(2006).
55. M. Tetsuya, M. Tomoyuki, and K. Fumio, “Topological characteristics ofInAs quantum dot with GaInAs cover using Sb surfactant,” Appl. Phys.Lett. 88, 183109 (2006).
56. S. C. Lee, L. R. Dawson, K. J. Malloy, and S. R. Brueck, “Molecular-beamepitaxial growth of one-dimensional rows of InAs quantum dots onnanoscale-patterned GaAs,” Appl. Phys. Lett. 79, 2630–2632 (2001).
57. C. Cornet, A. Schliwa, J. Even, F. Doré, C. Celebi, A. Létoublon, E. Macé,C. Paranthoën, A. Simon, P. M. Koenraad, N. Bertru, D. Bimberg, and S.Loualiche, “Electronic and optical properties of InAs/ InP quantum dots onInP(100) and InP�311�B substrates: theory and experiment,” Phys. Rev. B 74,035312 (2006).
58. J. D. Bauer, D. Schuh, E. Uccelli, R. Schulz, A. Kress, F. Hofbauer, J. J.Finley, and G. Abstreiter, “Long-range ordered self-assembled InAs quan-tum dots epitaxially grown on (110) GaAs,” Appl. Phys. Lett. 85, 4750–4752 (2004).
59. X. Wang, Z. M. Wang, B. Liang, G. J. Salamo, and C.-K. Shih, “Directspectroscopic evidence for the formation of one-dimensional wetting wiresduring the growth of InGaAs/GaAs quantum dot chains,” Nano Lett. 6,1847–1851 (2006).
60. P. Ballet, J. B. Smathers, and G. J. Salamo, “In-situ observation of InAsself-organized islands on AlAs surfaces,” Appl. Phys. Lett. 75, 337–339(1999).
61. P. Ballet, J. B. Smathers, H. Yang, C. L. Workman, and G. J. Salamo, “Con-trol of size and density of InAs/ �Al,Ga�As self-organized islands,” J. Appl.Phys. 90, 481–487 (2001).
62. X. Peng, “Mechanisms of shape control and evolution of nanocrystals,”Adv. Mater. 15, 459–463 (2003).
63. W. W. Yu, Y. A. Wang, and X. Peng, “Formation and stability of size-,shape-, and structure-controlled CdTe nanocrystals: ligand effects onmonomers and nanocrystals,” Chem. Mater. 4300–4308 (2003).
dvances in Optics and Photonics 2, 60–200 (2010) doi:10.1364/AOP.2.000060 191

1
1
1
1
1
1
1
1
1
1
1
11
1
1
1
1
1
A
64. J. Jack Li, Y. A. Wang, W. Guo, J. C. Keay, T. D. Mishima, M. B. Johnson,and X. Peng, “Large-scale synthesis of nearly monodisperse CdSe/CdScore/shell nanocrystals using air-stable reagents via successive ion layer ad-sorption and reaction,” J. Am. Chem. Soc. 125, 12567–12575 (2003).
65. X. Wang, L. Qu, J. Zhang, X. Peng, and M. Xiao, “Surface-related emis-sion in highly luminescent CdSe quantum dots,” Nano Lett. 3, 1103–1106(2003).
66. R. Hellwarth, J. Cherlow, and T.-T. Yang, “Origin and frequency depen-dence of nonlinear optical susceptibilities of glasses,” Phys. Rev. B 1, 964–967 (1975).
67. F. A. Hopf and G. I. Stegeman, Applied Classical Electrodynamics, Vol 1:Linear Optics, Wiley Series in Pure and Applied Physics, S. S. Ballard andJ. W. Goodman, eds. (Wiley, 1985).
68. F. A. Hopf and G. I. Stegeman, Applied Classical Electrodynamics, Vol 2:Nonlinear Optics, Wiley Series in Pure and Applied Physics, S. S. Ballardand J. W. Goodman, eds. (Wiley, 1985).
69. I. Kang, S. Smolorz, T. Krauss, F. Wise, B. G. Aitken, and N. F. Borrelli,“Time-domain observation of nuclear contributions to the optical nonlin-earities of glasses,” Phys. Rev. B 54, R12641–R12644 (1996).
70. S. Smolorz, F. Wise, and N. F. Borrelli, “Measurement of the nonlinear op-tical response of optical fiber materials by use of spectrally resolved two-beam coupling,” Opt. Lett. 24, 1103–1105 (1999).
71. S. Montant, A. Le Calvez, E. Freysz, and A. Ducasse, “Time-domain sepa-ration of nuclear and electronic contributions to the third-order nonlinear-ity in glasses,” J. Opt. Soc. Am. B 15, 2802–2807 (1998).
72. D. McMorrow, W. T. Lotshaw, and G. A. Kenney-Wallace, “Femtosecondoptical Kerr studies on the origin of the nonlinear response in simple liq-uids,” IEEE J. Quantum Electron. 24, 443–454 (1988).
73. I. C. Khoo, “Nonlinear optics of liquid crystalline materials,” Phys. Rep.471, 221–267 (2009).
74. M. A. Duguay and J. W. Hansen, “An ultrafast light gate,” Appl. Phys. Lett.15, 192–194 (1969).
75. P. G. de Gennes, The Physics of Liquid Crystals (Clarendon, 1974).76. G. K. L. Wong and Y. R. Shen, “Study of pretransitional behavior of laser-
field-induced molecular alignment in isotropic nematic substances,” Phys.Rev. A 10, 1277–1284 (1974).
77. D. Fekete, J. AuYeung, and A. Yariv, “Phase conjugate reflection by degen-erate four wave mixing in a nematic crystal in the isotropic phase,” Opt.Lett. 5, 51–53 (1980).
78. I. C. Khoo, T. H. Liu, and P. Y. Yan, “Nonlocal radial dependence of laser-induced molecular reorientation in a nematic liquid crystal: theory and ex-periment,” J. Opt. Soc. Am. B 4, 115–120 (1987).
79. E. Brasselet, A. Lherbier, and L. J. Dube, “Transverse nonlocal effects inoptical reorientation of nematic liquid crystals,” J. Opt. Soc. Am. B 23,36–44 (2006).
80. I. C. Khoo, G. Finn, R. R. Michael, and T. H. Liu, “Passive optical self-limiter using laser induced axially symmetric and asymmetric transverseself-phase modulations in a liquid crystal film,” Opt. Lett. 11, 227–229(1986).
81. I. C. Khoo, J. Y. Hou, T. H. Liu, P. Y. Yan, R. R. Michael, and G. M. Finn,“Transverse self-phase modulation and bistability in the transmission of alaser beam through a nonlinear thin film,” J. Opt. Soc. Am. B 4, 886–891
dvances in Optics and Photonics 2, 60–200 (2010) doi:10.1364/AOP.2.000060 192

1
1
1
1
1
1
1
1
1
1
1
1
1
1
1
1
A
(1987).82. C. Conti, M. Peccianti, and G. Assanto, “Observation of optical spatial
solitons in a highly nonlocal medium,” Phys. Rev. Lett. 92, 113902 (2004).83. G. Demeter and D. O. Krimer, “Light-induced dynamics in nematic liquid
crystals—a fascinating world of complex nonlinear phenomena,” Phys.Rep. 448, 133–162 (2007).
84. I. C. Khoo and R. Normandin, “Nanosecond laser-induced transient anderasable permanent grating diffractions and ultrasonic waves in a nematicfilm,” Appl. Phys. 55, 1416–1418 (1984).
85. I. C. Khoo, R. R. Michael, and P. Y. Yan, “Theory and experiment on opti-cally induced nematics axis reorientation and nonlinear effects in the nano-second regime,” IEEE J. Quantum Electron. QE-23, 267–272 (1987).
86. H. J. Eichler and R. Macdonald, “Flow alignment and inertial effects in pi-cosecond laser-induced reorientation phenomena of nematic liquid crys-tals,” Phys. Rev. Lett. 67, 2666–2669 (1991).
87. I. C. Khoo, S. Slussarenko, B. D. Guenther, and W. V. Wood, “Optically in-duced space charge fields, dc voltage, and extraordinarily large nonlinear-ity in dye-doped nematic liquid crystals,” Opt. Lett. 23, 253–255 (1998).
88. L. Lucchetti, M. Di Fabrizio, O. Francescangeli, and F. Simoni, “Colossaloptical nolinearity in dye-doped liquid crystals,” Opt. Commun. 233, 417–424 (2004).
89. W. M. Gibbons, P. J. Shannon, S.-T. Sun, and B. J. Swetlin, “Surface-mediated alignment of nematic liquid crystals with polarized laser light,”Nature 351, 49–50 (1991).
90. I. C. Khoo, H. Li, and Y. Liang, “Optically induced extraordinarily largenegative orientational nonlinearity in dye-doped-liquid crystal,” IEEE J.Quantum Electron. 29, 1444–1447 (1993).
91. H. Li, Y. Liang, and I. C. Khoo, “Transient laser induced orthogonal direc-tor axis reorientation in dye-doped liquid crystal,” Mol. Cryst. Liq. Cryst.251, 85–92 (1994).
92. I. Jánossy and L. Szabados, “Optical reorientation of nematic liquid crys-tals in the presence of photoisomerization,” Phys. Rev. E 4598–4604(1998).
93. T. V. Truong, L. Xu, and Y. R. Shen, “Dynamics of the guest–host orienta-tional interaction in dye-doped liquid-crystalline materials,” Phys. Rev. E72, 051709 (2005).
94. I. C. Khoo, M. Y. Shih, M. V. Wood, B. T. Guenther, P. H. Chen, F. Simoni,S. S. Slussarenko, O. Francescangeli, and L. Lucchetti, “Dye-doped pho-torefractive liquid crystals for dynamic and storage holographic gratingformation and spatial light modulation,” Proc. IEEE 87, 1987–1911(1999).
95. M. Kaczmarek, M. Y. Shih, R. S. Cudney, and I. C. Khoo, “Electricallytunable, optically induced dynamic and permanent gratings in dye-dopedliquid crystals,” IEEE J. Quantum Electron. 38, 451–457 (2002).
96. I. C. Khoo, P. H. Chen, M. Y. Shih, A. Shishido, and S. Slussarenko, “Su-pra optical nonlinearities (SON) of methyl-red and azobenzene liquidcrystal-doped nematic liquid crystals,” Mol. Cryst. Liq. Cryst. 358, 1–13(2001).
97. A. T. Shishido, O. Tsutsumi, A. Kanazawa, T. Shiono, T. Ikeda, and N.Tamai, “Rapid optical switching by means of photoinduced change in re-fractive index of azobenzene liquid crystals detected by reflection-mode
dvances in Optics and Photonics 2, 60–200 (2010) doi:10.1364/AOP.2.000060 193

1
1
2
2
2
2
2
2
2
2
2
2
2
2
2
2
2
22
2
A
analysis,” J. Am. Chem. Soc. 119, 7791–7796 (1997), and referencestherein.
98. Y. L. Yu and T. Ikeda, “Alignment modulation of azobenzene-containingliquid crystal systems by photochemical reactions,” J. Photochem. Photo-biol. C 5, 247–265 (2004).
99. E. V. Rudenko and A. V. Sukhov, “Optically induced spatial charge sepa-ration in a nematic and the resultant orientational nonlinearity,” JETP 78,875–882 (1994).
00. I. C. Khoo, H. Li, and Y. Liang, “Observation of orientational photorefrac-tive effects in nematic liquid crystals,” Opt. Lett. 19, 1723–1725 (1994).
01. I. C. Khoo, “Orientational photorefractive effects in nematic liquid crystalfilm,” IEEE J. Quantum Electron. 32, 525–534 (1996).
02. G. P. Wiederrecht, B. A. Yoon, and M. R. Wasielewski, “High photorefrac-tive gain in nematic liquid crystals doped with electron-donor and acceptormolecules,” Science 270, 1794–1797 (1995).
03. I. C. Khoo, K. Chen, and Y. Z. Williams, “Orientational photorefractive ef-fect in undoped and CdSe nano-rods doped nematic liquid crystal—bulkand interface contributions,” IEEE J. Sel. Top. Quantum Electron. 12, 443–450 (2006).
04. W. Helfrich, “Conduction-induced alignment of nematic liquid crystals:basic model and stability consideration,” J. Chem. Phys. 51, 4092–4105(1969).
05. M. E. Mack, “Stimulated thermal light scattering in the picosecond re-gime,” Phys. Rev. Lett. 22, 13–15 (1969).
06. H. J. Eichler, P. Gunter, and D. N. Pohl, Laser Induced Dynamic Grating(Springer-Verlag, 1986).
07. I. C. Khoo and R. Normandin, “The mechanism and dynamics of transientthermal grating diffraction in nematic liquid crystal films,” IEEE J. Quan-tum Electron. 21, 329–335 (1985).
08. See, for example, P. Sheng, “Boundary-layer phase transition in nematicliquid crystals,” Phys. Rev. A 26, 1610–1617 (1982).
09. I. C. Khoo, R. G. Lindquist, R. R. Michael, R. J. Mansfield, and P. Lopresti,“Dynamics of picosecond laser induced density, temperature and flow-reorientation effects in the mesophases of liquid crystals,” J. Appl. Phys.69, 3853–3859 (1991).
10. I. C. Khoo, J. Y. Hou, G. L. Din, Y. L. He, and D. F. Shi, “Laser inducedthermal, orientational and density nonlinear optical effects in nematic liq-uid crystals,” Phys. Rev. A 42, 1001–1004 (1990).
11. I. C. Khoo, J. H. Park, and J. D. Liou, “Theory and experimental studies ofall-optical transmission switching in a twist-alignment dye-doped nematicliquid crystal,” J. Opt. Soc. Am. B 25, 1931–1937 (2008).
12. P. Günter and J.-P. Huignard, eds., Photorefractive Materials and Their Ap-plications I: Basic Effects (Springer-Verlag, 1988).
13. P. Günter and J.-P. Huignard, eds., Photorefractive Materials and Their Ap-plications II: Survey of Applications (Springer-Verlag, 1988).
14. P. Günter and J.-P. Huignard, eds., Photorefractive Materials and Their Ap-plications 1: Basic Effects (Springer-Verlag, 2006).
15. P. Yeh, Introduction to Photorefractive Nonlinear Optics (Wiley, 1993).16. M. P. Petrov, S. I. Stepanov, and A. V. Khomenko, in Photorefractive Crys-
tals in Coherent Optical Systems, Vol. 59 of Series in Optical Sciences(Springer-Verlag, 1991).
17. J. Frejlich, Photorefractive Materials: Fundamental Concepts, Holo-
dvances in Optics and Photonics 2, 60–200 (2010) doi:10.1364/AOP.2.000060 194

2
2
2
2
2
2
2
2
2
2
2
2
2
2
2
2
2
2
2
2
A
graphic Recording, and Materials Characterization (Wiley-Interscience,2006).
18. Papers in Selected Papers on Photorefractive Materials, Vol. MS86 ofSPIE Milestone Series, F. M. Davidson, ed. (SPIE, 1994).
19. A. Yariv, Optical Electronics, 4th ed. (Saunders College Publishing/Harcourt Brace, 1991).
20. B. Ya. Zel’dovich, N. F. Pilipetsky, and V. V. Shkunov, Principles of PhaseConjugation (Springer-Verlag, 1985).
21. J. Feinberg, “Photorefractive nonlinear optics,” Phys. Today 41(10), 46–52(1988).
22. G. C. Valley and M. B. Klein, “Optimal properties of photorefractive ma-terials for optical data processing,” Opt. Eng. 22, 704–711 (1983).
23. J. Feinberg, D. Heiman, A. R. Tanguay, Jr., and R. W. Hellwarth, “Photore-fractive effects and light-induced charge migration in barium titanate,” J.Appl. Phys. 51, 1297–1305 (1980).
24. A. Ashkin, G. D. Boyd, J. M. Dziedzic, R. G. Smith, A. A. Ballman, J. J.Levinstein, and K. Nassau, “Optically-induced refractive index inhomoge-neities in LiNbO3 and LiTaO3,” Appl. Phys. Lett. 9, 72–74 (1966).
25. N. Kukhtarev, V. B. Markov, S. G. Odulov, M. S. Soskin, and V. L. Vi-netskii, “Holographic storage in electrooptic crystals. I. Steady state,” Fer-roelectrics 22, 949–960 (1979).
26. V. O. Vinetskii and N. V. Kukhtarev, “Theory of the conductivity inducedby recording holographic gratings in nonmetallic crystals,” Sov. Phys.Solid State 16, 2414–2415 (1975).
27. G. C. Valley, “Simultaneous electron/hole transport in photorefractive ma-terials,” J. Appl. Phys. 59, 3363–3366 (1986).
28. G. Picoli, P. Gravey, C. Ozkul, and V. Vieux, “Theory of two-wave mixinggain enhancement in photorefractive InP:Fe: a new mechanism of reso-nance,” J. Appl. Phys. 66 3798–3813 (1989).
29. M. Segev, Y. Ophir, and B. Fischer, “Nonlinear multi two wave mixing andthe fanning process in photorefractive media,” Opt. Commun. 77, 265–274(1990).
30. A. A. Zozulya, M. Saffman, and D. Z. Anderson, “Propagation of lightbeams in photorefractive media,” Phys. Rev. Lett. 73, 818–821 (1994).
31. O. V. Lyubomudrov and V. V. Shkunov, “Self-bending specklons in photo-refractive crystals,” J. Opt. Soc. Am. B 11, 1403–1408 (1994).
32. D. N. Christodoulides and M. I. Carvalho, “Compression, self-bending,and collapse of Gaussian beams in photorefractive crystals,” Opt. Lett. 19,1714–1716 (1994).
33. M. Segev, G. C. Valley, B. Crosignani, P. D. Porto, and A. Yariv, “Steady-state spatial screening solitons in photorefractive materials with externalapplied field,” Phys. Rev. Lett. 73, 3211–3214 (1994).
34. D. N. Christodoulides and M. I. Carvalho, “Bright, dark, and gray spatialsoliton states in photorefractive media,” J. Opt. Soc. Am. B 12, 1628–1633(1995).
35. M. Segev, M. Shih, and G. C. Valley, “Photorefractive screening solitonsof high and low intensity,” J. Opt. Soc. Am. B 13, 706–718 (1996).
36. E. DelRe, M. Segev, D. Christodoulides, B. Crosignani, and G. Salamo,“Photorefractive solitons,” in [214], Chap. 11.
37. G. F. Calvo, F. Agulló-López, and M. Carrascosa, “Transition from local tononlocal photorefractive nonlinearity on increasing spatial dimensional-ity,” Opt. Commun. 233, 439–444 (2004).
dvances in Optics and Photonics 2, 60–200 (2010) doi:10.1364/AOP.2.000060 195

2
2
2
2
2
2
2
2
22
2
2
2
2
2
2
2
2
2
A
38. M. Segev, B. Crosignani, A. Yariv, and B. Fischer, “Spatial solitons in pho-torefractive media,” Phys. Rev. Lett. 68, 923–926 (1992).
39. G. C. Valley, M. Segev, B. Crosignani, A. Yariv, M. M. Fejer, and M.Bashaw, “Dark and bright photovoltaic spatial solitons,” Phys. Rev. A 50,R4457–R4460 (1994).
40. M. Taya, M. C. Bashaw, M. M. Fejer, M. Segev, and G. C. Valley, “Obser-vation of dark photovoltaic spatial solitons,” Phys. Rev. A 52, 3095–3100(1995).
41. A. Agranat, V. Leyva, and A. Yariv, “Voltage-controlled photorefractiveeffect in paraelectric KTa1−xNbxO3:Cu,V,” Opt. Lett. 14, 1017–1019(1989).
42. A. Agranat, R. Hofmeister, and A. Yariv, “Characterization of a new pho-torefractive material: K1−yLyT1−xNx,” Opt. Lett. 17, 713–715 (1992).
43. M. Segev and A. J. Agranat, “Spatial solitons in centrosymmetric photore-fractive media,” Opt. Lett. 22, 1299–1301 (1997).
44. E. DelRe, B. Crosignani, M. Tamburrini, M. Segev, M. Mitchell, E. Re-faeli, and A. J. Agranat, “One-dimensional steady-state photorefractivespatial solitons in centrosymmetric paraelectric potassium lithium tanta-late niobate,” Opt. Lett. 23, 421–423 (1998).
45. “Electrostriction,” Encyclopaedia Britannica, http://www.britannica.com/EBchecked/topic/184067/electrostriction.
46. B. A. Auld, Acoustic Fields and Waves in Solids (Wiley, 1973).47. R. J. D. Miller, R. Casalegno, K. A. Nelson, and M. D. Fayer, “Laser-
induced ultrasonics: a dynamic holographic approach to the measurementof weak absorptions, optoelastic constants and acoustic attenuation,”Chem. Phys. 72, 371–9 (1982).
48. D. A. Pinnow, “Elastooptical materials,” in Handbook of Lasers with Se-lected Data on Optical Technology, R. J. Pressley, ed. (CRC Press, 1971),Chap. 17.
49. E. L. Buckland and R. W. Boyd, “Electrostrictive contribution to theintensity-dependent refractive index of optical fiber,” Opt. Lett. 21, 1117–1119 (1996).
50. E. L. Buckland and R. W. Boyd, “Measurement of the frequency responseof the electrostrictive nonlinearity in optical fiber,” Opt. Lett. 22, 676–678(1997).
51. A. Fellega, A. Melloni, and M. Martinelli, “Measurement of the frequencyresponse induced by electrostriction in optical fibers,” Opt. Lett. 22, 1615–1617 (1997).
52. D. I. Kovsh, D. J. Hagan, and E. W. Van Stryland, “Numerical modeling ofthermal refraction in liquids in the transient regime,” Opt. Express 4, 315–327 (1999).
53. D. I. Kovsh, S. Yang, D. J. Hagan, and E. W. Van Stryland, “Nonlinear op-tical beam propagation for optical limiting,” Appl. Opt. 38, 5168–5180(1999).
54. M. Sheik-Bahae, A. A. Said, D. J. Hagan, M. J. Soileau, and E. W. VanStryland, “Nonlinear refraction and optical limiting in thick media,” Opt.Eng 30, 1228–1235 (1991).
55. L. Mutter, F. D. J. Brunner, Zh. Yang, M. Jazbinšek, and P. Günter, “Linearand nonlinear optical properties of the organic crystal DSTMS,” J. Opt.Soc. Am. B. 24, 2556–2561 (2007).
56. L. A. Ostrovskii, “Self-action of light in crystals,” JETP Lett. 5, 272–275(1967).
dvances in Optics and Photonics 2, 60–200 (2010) doi:10.1364/AOP.2.000060 196

2
2
2
2
2
2
2
2
2
2
2
2
2
2
n
A
57. G. R. Meredith, “Second-order cascading in third-order nonlinear opticalprocesses,” J. Chem. Phys. 77, 5863–5871 (1982).
58. Reviewed in G. I. Stegeman, D. J. Hagan, and L. Torner, “��2� cascadingphenomena and their applications to all-optical signal processing, mode-locking, pulse compression and solitons,” Opt. Quantum Electron. 28,1691–1740 (1996).
59. R. C. Eckardt and J. Reintjes, “Phase matching limitations of high effi-ciency second harmonic generation,” IEEE J. Quantum Electron. 20,1178–1187 (1984).
60. A. Kobyakov, U. Peschel, R. Muschall, G. Assanto, V. P. Torchigin, and F.Lederer, “Analytical approach to all-optical modulation by cascading,”Opt. Lett. 20, 1686–1688 (1995).
61. A. Kobyakov, U. Peschel, and F. Lederer, “Vectorial type-II interaction incascaded quadratic nonlinearities—an analytical approach,” Opt. Com-mun. 124, 184–94 (1996).
62. G. I. Stegeman, M. Sheik-Bahae, E. W. Van Stryland, and G. Assanto,“Large nonlinear phase shifts in second-order nonlinear-optical pro-cesses,” Opt. Lett. 18, 13–15 (1993).
63. K. R. Parameswaran, J. R. Kurtz, R. V. Roussev, and M. M. Fejer, “Obser-vation of 99% pump depletion in single-pass second-harmonic generationin a periodically poled lithium niobate waveguide,” Opt. Lett. 27, 43–45(2002).
64. E. W. Van Stryland, “Third-order and cascaded nonlinearities,” in LaserSources and Applications, A. Miller and D. M. Finlayson, eds., ScottishGraduate Series (CRC Press and Taylor & Francis, 1997), pp 15–62(1996).
65. R. J. DeSalvo, D. J. Hagan, M. Sheik-Bahae, G. Stegeman, H. Vanherzeele,and E. W. Van Stryland, “Self-focusing and defocusing by cascaded sec-ond order effects in KTP,” Opt. Lett. 17, 28–30 (1991).
66. M. L. Sundheimer, Ch. Bosshard, E. W. VanStryland, G. I. Stegeman, andJ. D. Bierlein, “Large nonlinear phase modulation in quasi-phase-matchedKTP waveguides due to cascaded second-order processes,” Opt. Lett. 18,1397–9 (1993).
67. Series of articles published by multiple authors under the general title “Re-search on nonlinear optical materials: an assessment,” Appl. Opt. 26, 211–234 (1987).
68. G. I. Stegeman, “Material figures of merit and implications to all-opticalswitching,” Proc. SPIE, 1852, 75–89 (1993).
69. Many articles in Self-Focusing: Past and Present, R. W. Boyd, S. G. Luk-ishova and Y. R. Shen, eds. (Springer Science, 2009).
70. S. Trillo and W. Torruellas, eds., Spatial Solitons (Springer-Verlag, 2001).
Demetri N. Christodoulides received his Ph.D. degree inElectrical Engineering from Johns Hopkins University in1986. From 1986 to 1987 he was a Post-doctoral Fellowwith Bell Communications Research. From 1987 to 2002,he was with the Department of Electrical Engineering atLehigh University, and in 2002 he joined the College ofOptics and Photonics/CREOL at the University of CentralFlorida. His research interests are mainly in the areas of
onlinear optics, nonlinear fiber optics, light-wave technology, and quantum
dvances in Optics and Photonics 2, 60–200 (2010) doi:10.1364/AOP.2.000060 197

eHBEtcP
umtat(aSs
DatiieMdtfcNec
A
lectronics. He is the author or coauthor of more than 200 scientific publications.is most significant contributions include the prediction and observation ofragg, vector, and discrete (lattice) solitons. In the past, he served as a Topicalditor for the IEEE Journal of Quantum Electronics and the Journal of the Op-
ical Society of America B. He has chaired or served on several conferences andonference committees. Prof. Christodoulides is a Fellow of the Americanhysical Society and of the Optical Society of America.
I. C. Khoo received the Ph.D. degree in Physics from theUniversity of Rochester in 1976. He joined Penn State in1984 and currently holds the W. E. Leonhard Chair Profes-sorship in the Electrical Engineering Department. He is theauthor or coauthor of more than 500 scientific publications[~210 journal and proceedings papers and 290 conferencepresentations]. His research interests are centered on novelelectro-optical and nonlinear optical materials such as liq-
id crystals, nonlinear multiphoton absorbing liquids, nanoparticulates, andetamaterials, and on the studies of various nonlinear optical processes and
heir applications in advanced optoelectronic platforms and systems. He is theuthor or coauthor of several books and book chapters, including Liquid Crys-als (2nd ed., Wiley, 2007) and Optics and Nonlinear Optics of Liquid CrystalsWorld Scientific, 1995). He is a Fellow of the Optical Society of America, IEEEnd the UK Institute of Physics and currently chairs the National Academy ofcience—U.S. Advisory Committee/International Commission for Optics, anderves as a Vice President in the International Commission for Optics.
Gregory J. Salamo holds the Basore Chair in Nanotech-nology and Innovation. He received the Ph.D. in physicsfrom City University of New York in 1973, where he alsoworked as an intern student at Bell Laboratories in MurrayHill, New Jersey, from 1968 to 1973. His postdoctoral workwas at the Institute of Optics of University of Rochester inNew York from 1973 to 1975. He joined the faculty of theUniversity of Arkansas in January of 1975, where he is now
istinguished Professor of Physics and the Basore Professor in Nanotechnologynd Innovation. He has carried out research in the areas of optical spatial soli-ons, quantum optics, and the optical properties of semiconductors. His researchs currently focused on growing III–V semiconductors and ferroelectrics by us-ng molecular beam epitaxy, scanning tunneling microscopy, and transmissionlectron microscopy. He is Director of a National Science Foundation (NSF)aterials Research Science and Engineering Center on the Physics of Semicon-
uctor Nanostructures and Director of the Arkansas Institute for Nanoscale Ma-erial Science and Engineering. He has published more than 200 papers in re-erred journals, has given numerous contributed and invited talks, hasontributed several book chapters, and is editor of the Springer Lecture Notes inanoscience. He also pursues the development of interdisciplinary research and
ducation through the establishment of a new MS/Ph.D. degree program in Mi-
ro Electronics–Photonics, which is now the home of 60 graduate students anddvances in Optics and Photonics 2, 60–200 (2010) doi:10.1364/AOP.2.000060 198

weOatanTiUuY
hOtUcttfAaaicrtrtO
ot
A
hich provides greater career opportunities for students and faculty in the sci-nces. He has also started new laboratory courses in Laser Physics, Quantumptics, Nonlinear Optics, Optic Communications, Optical Properties of Solids,
nd Nanoscale Fabrication and Imaging, each with separate NSF Awards. He ishe principal investigator for an NSF educational laboratory in nanotechnology,GK-12 NSF Graduate Student Fellowship program, a NSF partnership for In-ovation program for spin-off small business, an NSF collaborative grant withexas Instruments, and a Hughes Grant for an Undergraduate Research Centern Nanoscience. He is a Fellow of the Optical Society of America and won theA Baum Award for Teaching, the most prestigious UA award made to one fac-lty member each year. He was also the 2009 Case Arkansas Professor of theear. His total research awards amount to more than $40M dollars.
George Stegeman was born in 1942 in Edinburgh Scotlandof Polish parents. The family immigrated to Canada in1949. He and his wife Ann married in 1969 and they havethree adult children, two boys and a girl. He received hiseducation in Toronto Canada, graduating from EngineeringPhysics from the University of Toronto in 1965. He re-ceived his Ph.D. in Physics at the University of Toronto in1969. After he was appointed to the faculty there in 1970,
e progressed through the ranks to Professor in 1980. In 1980 he moved to theptical Sciences Center of the University of Arizona. Since 1990 he has been
he Cobb Family Chair in the College of Optics and Photonics/CREOL at theniversity of Central Florida. He retired in 2009 and is Professor Emeritus in the
ollege of Optics and Photonics, University Central Florida. Currently he iseaching Nonlinear Optics at various institutions and preparing a textbook onhis subject. He has served as Topical Editor (1992–1996) and as Editor-in-Chiefor the Journal of the Optical Society of America B (2000–2006), as Northmerican Editor of Journal of Optical and Quantum Electronics (1997–2000),
nd is currently the editor of Physics Reports for the field of optics. He has beenmember of Editorial Boards of Wave Electronics (1979–1983), Applied Phys-
cs Letters, and the Journal of Applied Physics (1987–1989), Optics Communi-ations (1986–2000), Optics Letters (1989–1993), the Journal of Optical Mate-ials (1991–1992), the Journal of Nonlinear Optics (1991 to the present), andhe International Advisory Board, Journal of the Korean Optical Society of Ko-ea (2000-2009). He has chaired or cochaired numerous conferences, includinghe Annual Meeting of OSA, QELS, Nonlinear Optics, and Nonlinear Integratedptics.
Eric W. Van Stryland is a Professor of Optics and PastDean of CREOL and FPCE, College of Optics and Photo-nics, University of Central Florida. He received a Ph.D. inPhysics in 1976 from the University of Arizona, OpticalSciences Center, where he worked on optical coherent tran-sients and photon counting statistics. He worked in the ar-eas of femtosecond pulse production, multiphoton absorp-tion in solids, and laser-induced damage at the University
f Southern California. He joined the University of North Texas in l978, helping
o form the Center for Applied Quantum Electronics. In l987 he joined the newlydvances in Optics and Photonics 2, 60–200 (2010) doi:10.1364/AOP.2.000060 199

fUretvKcBmHdPwtee2d
A
ormed CREOL (Center for Research and Education in Optics and Lasers) at theniversity of Central Florida. NSF has funded him for the past 30 years. His cur-
ent research interests are in the characterization of the nonlinear optical prop-rties of materials and their temporal response as well as the applications ofhese nonlinear materials properties for optical switching, etc. He helped de-elop the Z-scan and also established the methodology for applying Kramers–ronig relations to ultrafast nonlinearities and helped develop the field of cas-
aded second-order effects. He is a fellow of the OSA, a former member of theiroard, a senior member of the Laser Institute of America and a former boardember, a Fellow of SPIE and IEEE and a member of the APS, SPIE, and MRS.e also served as a Topical Editor for Optics Letters. He was elected Vice Presi-ent of the OSA, which led to becoming President in 2006. He graduated 27h.D.’s, published ~300 papers, and is on the ISI “highly cited” list. In 2003 heas awarded the highest honor UCF bestows, the Pegasus Award. He was Direc-
or of the School of Optics/CREOL from July 1999 to May of 2004. With thelevation of the School to a College, he became its first Dean. In addition, Gov-rnor Bush established the Florida Photonics Center of Excellence (FPCE) in003 and he was Director of that Center along with CREOL until he retired asean in January 2009.
dvances in Optics and Photonics 2, 60–200 (2010) doi:10.1364/AOP.2.000060 200