Non-Performing Assets Management in the Co-operative ...
10
Non-Performing Assets Management in the Co-operative Banks in India: A Descriptive Analysis Sushmitha G.*, N. Nagaraja** * UGC-SRF Scholar, DoS in Commerce, University of Mysore, Mysore, Karnataka, India. Email: [email protected] ** Professor, DoS in Commerce, University of Mysore, Mysore, Karnataka, India. Email: [email protected] Abstract The Indian banking industry is operating in a dynamic and competitive environment. In recent years banks are exposed to various financial crises or challenges due to the highly competitive nature of the market. These financial crises have an adverse influence on the performance of the bank. One of the major challenges faced by the bank is a problem of the mounting amount of Non-performing assets. Non-performing assets are those loans and advances, on which principle or Interest amount is overdue for a period of 90 days. Non-performing assets are the Indicator of the financial health of the bank. The present study made an attempt to compare the performance of Co-operative banks by analysing the trends of Non-performing assets for the period 2008-2018. The data analysis was done by using statistical tools like tabulation and line graphs. The study observes that the UCBs and StCBs have shown a significant improvement in the management of Non-performing assets in comparison to the DCCBs, PACs, SCARDBS, and PCARDBS. Keywords: Non-Performing Assets, UCBs, StCB, DCCBs, PACs, SCARDBs, PCARDBs, RBI International Journal of Banking, Risk and Insurance 8 (1) 2020, 80-89 http://publishingindia.com/ijbri/ Introducon The Indian banking sector is grown significantly after the introduction of financial sector reforms by the RBI and GOI. The banks play a vital role in the economic development of our country. The bank acts as a mediator of funds; which mobilizes and channelizes the financial resources to the various sectors of the economy. The primary function of the bank is to accept all kinds of deposits and lend money to its customers. The bank may confront various challenges or risks while performing its operations. The most challenging issue faced by the bank is the problem of Non-performing assets. Non-performing assets is those assets which do not directly contribute to the profitability of the firm. The mounting amount of Non-Performing Assets is creating a huge disturbance in the economic operation of the Indian banking Industry. The Co-operative bank is a significant position in the Indian banking system. The Co-operative banking institution promotes the economic development of the country by catering financial needs to various sections of the society, especially the rural and weaker section of the society. Alike Commercial banks, Co-operative banks also exposed various risks and crises. The one most concerning issue, which has created a huge stir in the field of banking is the problem of Non- performing assets. Non-performing assets reflect the financial health of the bank. According to estimates For FY16, the district central co-operative banks (DCCBs) had stated that the total NPAs for all co-operative banks amounted to Rs 22,695 crore, which was Rs 6,277 more than NABARD’s findings during audits, which has the authority to conduct an inspection of DCCBs books. NABARD, in the RTI response, stated that the total NPAs accounted for Rs 16,417 crore (Money Control). A high level of Non-performing assets suggests diminishing asset quality and profitability of the bank. The soundness of any financial institution depends on the profitability and quality of its assets. Submitted: 15 December, 2019 Accepted: 31 December, 2019
-
Upload
khangminh22 -
Category
Documents
-
view
3 -
download
0
Transcript of Non-Performing Assets Management in the Co-operative ...
Non-Performing Assets Management in the Co-operative Banks in India:
A Descriptive AnalysisSushmitha G.*, N. Nagaraja**
* UGC-SRF Scholar, DoS in Commerce, University of Mysore, Mysore, Karnataka, India. Email: [email protected] ** Professor, DoS in Commerce, University of Mysore, Mysore, Karnataka, India. Email: [email protected]
Abstract
The Indian banking industry is operating in a dynamic and competitive environment. In recent years banks are exposed to various financial crises or challenges due to the highly competitive nature of the market. These financial crises have an adverse influence on the performance of the bank. One of the major challenges faced by the bank is a problem of the mounting amount of Non-performing assets. Non-performing assets are those loans and advances, on which principle or Interest amount is overdue for a period of 90 days. Non-performing assets are the Indicator of the financial health of the bank. The present study made an attempt to compare the performance of Co-operative banks by analysing the trends of Non-performing assets for the period 2008-2018. The data analysis was done by using statistical tools like tabulation and line graphs. The study observes that the UCBs and StCBs have shown a significant improvement in the management of Non-performing assets in comparison to the DCCBs, PACs, SCARDBS, and PCARDBS.
Keywords: Non-Performing Assets, UCBs, StCB, DCCBs, PACs, SCARDBs, PCARDBs, RBI
International Journal of Banking, Risk and Insurance8 (1) 2020, 80-89http://publishingindia.com/ijbri/
Introduction
The Indian banking sector is grown significantly after the introduction of financial sector reforms by the RBI and GOI. The banks play a vital role in the economic development of our country. The bank acts as a mediator of funds; which mobilizes and channelizes the financial resources to the various sectors of the economy.
The primary function of the bank is to accept all kinds of deposits and lend money to its customers. The bank may confront various challenges or risks while performing its operations. The most challenging issue faced by the bank is the problem of Non-performing assets. Non-performing assets is those assets which do not directly contribute to the profitability of the firm.
The mounting amount of Non-Performing Assets is creating a huge disturbance in the economic operation of the Indian banking Industry. The Co-operative bank is a significant position in the Indian banking system. The Co-operative banking institution promotes the economic development of the country by catering financial needs to various sections of the society, especially the rural and weaker section of the society. Alike Commercial banks, Co-operative banks also exposed various risks and crises. The one most concerning issue, which has created a huge stir in the field of banking is the problem of Non-performing assets. Non-performing assets reflect the financial health of the bank. According to estimates For FY16, the district central co-operative banks (DCCBs) had stated that the total NPAs for all co-operative banks amounted to Rs 22,695 crore, which was Rs 6,277 more than NABARD’s findings during audits, which has the authority to conduct an inspection of DCCBs books. NABARD, in the RTI response, stated that the total NPAs accounted for Rs 16,417 crore (Money Control).
A high level of Non-performing assets suggests diminishing asset quality and profitability of the bank. The soundness of any financial institution depends on the profitability and quality of its assets.
Submitted: 15 December, 2019Accepted: 31 December, 2019
Non-Performing Assets Management in the Co-operative Banks in India: A Descriptive Analysis 81
Non-Performing Assets - Meaning and Definition
Meaning of NPAs
The assets owned by the bank can be classified as the performing assets and Non-performing assets. The performing assets are those assets which contribute greatly to the profitability of the bank. Non-performing assets are those assets that do not contribute income to the bank. In other words, Non-performing assets are those assets which do not yield income to the bank. If the borrower is unable to repay the loan and advances provided to them for a certain period of the time, then it becomes non-performing assets.
Definition of NPAs
The Reserve Bank of India has introduced “prudential norms for income recognition, asset classification and provisioning for the advances” as per the recommendations made by the Committee on the Financial System under the Chairmanship of Shri M. Narasimham. They defined Non Performing Assets as “an asset, including a leased asset, becomes non-performing when it ceases to generate income for the bank”.
A non-performing asset (NPA) is a loan or an advance where;
● interest and or instalment of principal remain over-due for a period of more than 90 days in respect of a term loan,
● the account remains ‘out of order’ as indicated at paragraph 2.2 below, in respect of an Overdraft/Cash Credit (OD/CC),
● the bill remains overdue for a period of more than 90 days in the case of bills purchased and discounted,
● the instalment of principal or interest thereon remains overdue for two crop seasons for short duration crops,
● the instalment of principal or interest thereon remains overdue for one crop season for long duration crops,
● the amount of liquidity facility remains outstanding for more than 90 days, in respect of a securitisation transaction undertaken in terms of guidelines on securitisation dated February 1, 2006.
● in respect of derivative transactions, the overdue receivables representing positive mark-to-market value of a derivative contract, if these remain un-paid for 90 days from the specified due date for payment.
Asset Classification
Categories of NPAs
Banks are required to classify Non-performing assets further into the following three categories based on the period for which the asset has remained Non-performing and the reliability of the dues:
● Substandard Assets ● Doubtful Assets ● Loss Assets
Substandard Assets
With effect from 31 March 2005, a substandard asset would be one, which has remained NPA for a period less than or equal to 12 months. In such cases, the current net worth of the borrower/ guarantor or the current market value of the security charged is not enough to ensure the recovery of the dues to the banks in full. In other words, such an asset will have well-defined credit weaknesses that jeopardise the liquidation of the debt and are characterized by the distinct possibility that the banks will sustain some loss if deficiencies are not corrected.
Doubtful Assets
With effect from March 31, 2005, an asset would be classified as doubtful if it has remained in the substandard category for a period of 12 months. A loan classified as doubtful has all the weaknesses inherent in assets that were classified as substandard, with the added characteristic that the weaknesses make collection or liquidation in full, – based on currently known facts, conditions and values – highly questionable and improbable.
Loss Assets
A loss asset is one where loss has been identified by the bank or internal or external auditors or the RBI inspection but the amount has not been written off wholly. In other
82 International Journal of Banking, Risk and Insurance Volume 8 Issue 1 March 2020
words, such an asset is considered uncollectible and of such little value that its continuance as a bankable asset is not warranted although there may be some salvage or recovery value.
Review of Literature
Reddy (2002), this study made an attempt to analyse the experiences of other Asian countries in the handling of NPA. It further investigates the effects of the reforms on the level of NPAs and suggests a mechanism to handle the problem of NPA. In the Indian context, the study identified the various causes of NPAs, such as legal impediment, time-consuming nature of asset disposal process, manipulation by the debtors and political interference. The study also suggested some solutions to manage the problem of NPAs like, effectiveness of ARCs, well-developed capital market, Contextual Decision making, Securitization, effective capital norms system, Realignment of performance metrics and effective legal mechanism.
Pitre (2003), the study points out that, the main risk exposure of UCBs is not credit risk but interest rate risk. The interest rates of UCBs are not in alignment with commercial banks. In this context, the risk and asset and liability management assumed to be significant. The study also points out that, the level of Non-performance assets increasing in the alarming state due to the general slowdown of economic activity; which will have an effect on the health of the sector.
Ramu (2008), this study analysed the causes of concern and brings out some of the measures which would help urban cooperative banks to co-exist in the present competitive environment. The major issues concerned with the UCBs are stiff competition, mismanagement, and failure of UCBs, political interference, poor credit management, absence of professional management and governance, absence of human resource management and lack of technology-based products. The study also suggested some measures for development and improvement of UCBs. They are, augmenting capital, shuttling of portfolios, reduction of high-cost deposits, end of dual control, removal of political interference, the system of human resource management, need for autonomy and awareness programs for employees.
Ramu (2009), the study attempted to analyse the asset quality of selected UCBs in Tamil Nadu. The study also traces the NPAs of financial Co-operatives in other countries. The study observed that Non-performing assets of banks chosen are within the manageable level but TCUB has had to face moderately severe recovery problems. As per the CAMELs rating model, the highest weight (i.e., 25 percent) is given to asset quality components by RBI. The solution to the problem of NPAs lies in strengthening the credit management in banks over a period by removing the present deficiencies observed in the standards of credit appraisal, monitoring and improving the overall lending policies of the banks.
Saha (2010), the study found that the profitability and operational efficiency of selected Urban Co-operative banks in Karnataka are showing a decreasing trend. The performance of these banks, in terms of Returns on Assets & Returns on Equity, has been far from satisfactory. The study suggested some of the measures to ensure financial stability and profitability such as Sound Fund Deployment Strategies, better & improved Recovery efforts to keep NPA levels under control, budgeted policies & strict budget control, efficient & personalized customer services, and products and technology upgradation.
Bahir (2014), the study examined the agricultural and non-agricultural loan recovery performance of District Central Co-operative Banks (DCCBs) in Maharashtra. From the study, it is revealed that the DCCBs in Maharashtra has achieved an increasing trend in all the indicators selected for the study except the number of branches during the period from 2001-02 to 2010-11. Share capital, reserve funds, deposits, working capital, investments indicated an increase above 100% over the period. There is a matter of concern that outstanding loans and over dues went up, is an indication of poor performance. The study also found out that the average recovery percent of non-agricultural loans are higher than the agricultural loan recovery in terms of both short term and medium-term loans. The study also suggested that DCCBs should emphasize the recovery of agricultural loans. For this purpose, the DCCBs distribute loans to those persons who can repay loans, adopt an efficient supervision system for utilization and recovery of loans and also identify wilful and non-wilful defaulters for proper measures to be taken for recovery.
Non-Performing Assets Management in the Co-operative Banks in India: A Descriptive Analysis 83
Nagaraja and Madegowda (2015), made an attempt to evaluate the NPA of DCCBs and UCBs in terms of Gross NPA Ratio, Net NPA Ratio, Averages, Variance, and T-test. The study shows that the extent of NPA is comparatively very high in UCBs as compared to DCCBs.
Tiwari (2015), made an attempt to study and analyse the major causes responsible for assets turning into non-performing. The study found out that the strongest causes of increasing NPA in the Co-operative banks are the fraudulent approach of borrowers, the Indulgent approach to family or group connection or long-standing relationship than to the project viability and Non-submission of stock and other required periodical statements by the borrowers.
Barki (2015), the study covers the bank’s performances and the lending practices provided by banks to their customers. The study found that the financial performance of UCBs is improved over the period by satisfying customers with the good quality of services, easy mode of repayment of installment, simple procedure and reasonable rate of interest and quick sanction of loans. The study also suggests that the bank should adopt modern methods of banking as well as it should introduce new schemes for attracting new customers and satisfying the present ones
Sivakumar (2018), in his study “A Study on Non-Performing Asset Management with Special Reference to Coimbatore City Co-Operative Bank Ltd, Tamilnadu” analyse the various concepts of NPAs and impact on the performance and profitability of the selected bank. The results of the study show that the bank failed to control the NPA in the early years of the decade. But later on, banks made an attempt to reduce NPA by increasing the provision to avoid net NPA and risks associated with the bank. The substandard asset is more than doubtful and loss asset; it shows that the bank has a good scope to recover its NPA. The study also observed that the priority sector contributes high towards total NPA, especially loans to small scale industry and in non-priority sector mortgage loan is high. The study suggested the bank take corrective steps to prevent the creation of fresh NPAs and recovery of existing NPAs. The study also suggested the bank take up some measures to control NPAs in priority sector and non-priority sector lending.
Sarkar and Karak (2018), the study reveals the trends, causes, and impact of NPAs on the performance of the Burdwan District Central Co-operative Bank Ltd. (BDCCBL). The study observed that there exists a high positive correlation between actual values and trend values of NNPA to Total Assets. It is also observed that actual and trend values are not correlated. That signifies that the overall picture of NPA management is not satisfactory for the bank. The study also suggested various preventive measures to manage NPA, such as pre-sanctioning evaluation and Post disbursement monitoring, strict recovery efforts, strict rules against wilful defaulters and introduction of professional expertise.
Ali and Kaveri (2018), the study focus on how borrowers are mainly responsible for converting a good account into non-performing account by carrying out a diagnostic study and analyzing developments in the case during the Pre-Sanction Credit Appraisal (PSCA) and Post Sanction Credit Monitoring (PSCM) stages. The study suggested several strategies for effective lending such as sound credit appraisal system, effective follow-up system, strict loan sanctioning and disbursement system and regular monitor of the financial performance of the borrowers.
Objectives of the Study
● To understand the conceptual framework of Non-performing assets in banks.
● To examine the trends of Non-Performing assets of Co-operative banks in India.
● To compare the performance various types of Co-operative banks in India.
● To suggest various measures to reduce the Non-performing assets in Co-operative banks in India.
Research Methodology
The study is descriptive and exploratory in nature. The study has used secondary data (published sources) collected from articles, periodicals, journals, RBI Annual Report, RBI Bulletins, RBI website, internet and other websites on the topic relied on. The statistical analysis is done through tabulation, chart and other statistical tools.
84 International Journal of Banking, Risk and Insurance Volume 8 Issue 1 March 2020
Table 1: Gross Non-Performing Assets of Co-operative Banks
(Percent of gross advances)
Year Urban Cooperative
Banks (UCBs)
Rural Co-operative BankShort-Term Structure Long-Term Structure
StCBs DCCBs PACs SCARDBs PCARDBs
2008-09 13.0 12.0 18.0 44.8 30.1 39.0 2009-10 10.1 8.8 13.0 41.4 45.1 51.9 2010-11 8.4 8.5 11.2 25.2 32.3 40.6 2011-12 7.0 7.0 10.2 26.8 33.1 36.7 2012-13 6.0 6.1 9.7 24.7 36.0 37.7 2013-14 5.7 5.5 10.3 19.0 31.6 38.0 2014-15 6.2 4.9 9.5 22.4 30.3 36.2 2015-16 6.1 4.5 9.4 17.6 22.0 36.6 2016-17 7.2 4.1 10.5 26.6 23.6 33.02017-18 7.1 4.7 11.2 - 25.0 38.3
Source: Reserve Bank for UCBs and NABARD for Rural Co-operative Banks (excluding PACs for which the source is NAFSCOB).
StCBs: State Co-operative Banks
DCCBs: District Central Co-operative Banks
PACS: Primary Agricultural Credit Societies
SCARDBs: State Co-operative Agriculture and Rural Development Banks
PCARDBs: Primary Co-operative Agriculture and Rural Development Banks
(-): Data not available
The above table shows, the Gross NPA level of UCBs, StCBs, DCCBs, PACs, SCARDBs and PCARDBs in India. The observed that the Gross NPA of Urban Co-operative bank shown decreasing trend i.e., 13% in the year 2008-09 decreased to 7.1% in the year 2017-18. In the case of StCBs, the GNPA is decreased to 12% in the year 2008-09 to 4.7% in the year 2017-18. The GNPA of DCCBs is also decreased i.e., 18% in the year 2008-09 to
11.2% in the year 2017-18. In the case of PAC, the GNPAs is decreased to 44.8% in the year of 2008-09 to 26.6% in the year 2016-17. The data of the GNPA of PACs of the year 2017-18 is not found. The GNPA of SCARDBs is shown a decreasing trend, i.e., 30 % in the year 2008-09 decreased to 25% in the year 2017-18. In the case of PCARDBs, GNPA is decreased to 39% in the year 2008-09 to 38, 3% in the year 2017-18 (Table 1).
Trends in Non-Performing Assets in Co-operative Banks in India
Non-Performing Assets Management in the Co-operative Banks in India: A Descriptive Analysis 85
10
Source: Reserve Bank for UCBs and NABARD for Rural Co-operative Banks (excluding PACS for which the
source is NAFSCOB).
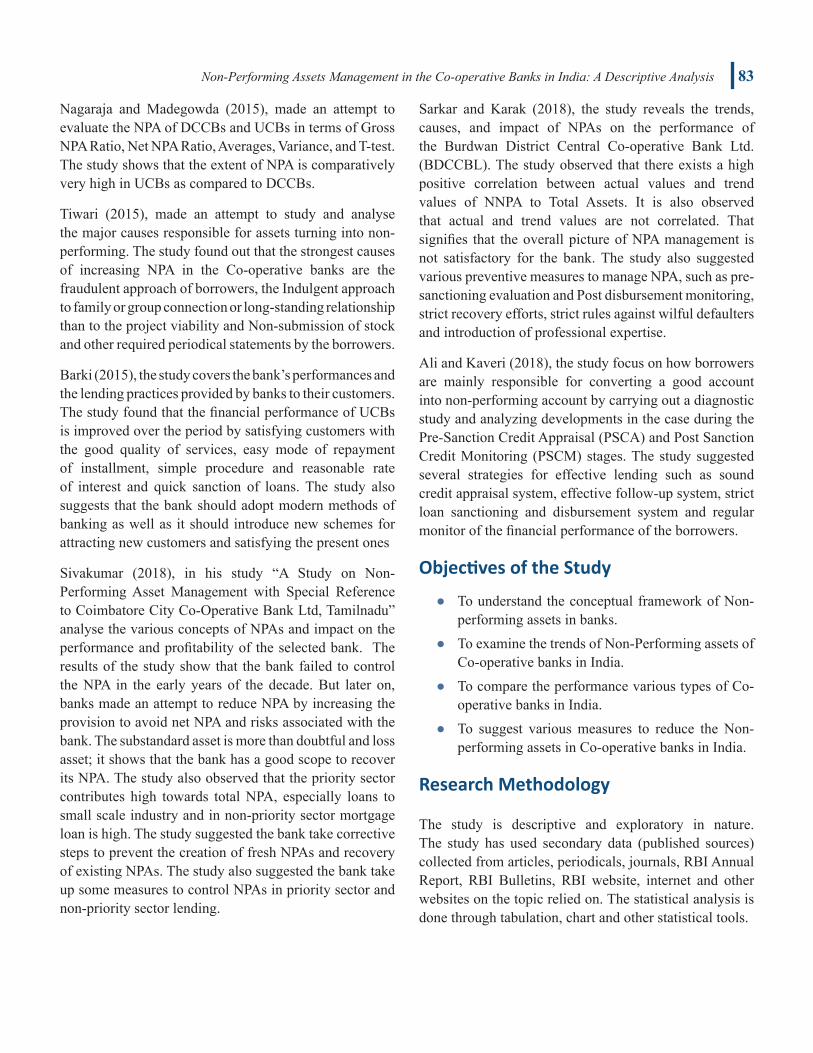
Fig. 1: Comparison of Urban Co-operative Banks and StCBs Percentage of Gross NPA
The comparative analysis of NPA of UCBs and StCBs for the period 2008-09 to 2017-18 is
shown the figure 1. From the above figure, can be interpreted that the GNPA of StCBs is
comparatively lower than UCBS. Even though GNPA of both the bank showing a declining
trend, GNPA of StCBs is lower than UCBs, I e, 4.7%, and 7.1% respectively in the year
2017-18. It is Cleary signifies that the asset quality of StCBs comparatively better than the
UCBs.
0
2
4
6
8
10
12
14 13
10.1
8.47
6 5.7 6.2 6.17.2 7.1
12
8.8 8.57
6.1 5.5 4.9 4.5 4.1 4.7 UCBS
stCBs
0
2
4
6
8
10
12
14
16
18
13
10.18.4
76 5.7 6.2 6.1
7.2 7.1
18
1311.2
10.2 9.7 10.39.5 9.4
10.5 11.2
UCBS
DCCBs
Source: Reserve Bank for UCBs and NABARD for Rural Co-operative Banks (excluding PACs for which the source is NAFSCOB).
Fig. 1: Comparison of Urban Co-operative Banks and StCBs Percentage of Gross NPA
The comparative analysis of NPA of UCBs and StCBs for the period 2008-09 to 2017-18 is shown the Fig. 1. From the above figure, can be interpreted that the GNPA of StCBs is comparatively lower than UCBs. Even though GNPA of both the bank showing a declining trend, GNPA
of StCBs is lower than UCBs, i.e., 4.7%, and 7.1% respectively in the year 2017-18. It is cleary signifies that the asset quality of StCBs comparatively better than the UCBs.
10
Source: Reserve Bank for UCBs and NABARD for Rural Co-operative Banks (excluding PACS for which the
source is NAFSCOB).
Fig. 1: Comparison of Urban Co-operative Banks and StCBs Percentage of Gross NPA
The comparative analysis of NPA of UCBs and StCBs for the period 2008-09 to 2017-18 is
shown the figure 1. From the above figure, can be interpreted that the GNPA of StCBs is
comparatively lower than UCBS. Even though GNPA of both the bank showing a declining
trend, GNPA of StCBs is lower than UCBs, I e, 4.7%, and 7.1% respectively in the year
2017-18. It is Cleary signifies that the asset quality of StCBs comparatively better than the
UCBs.
0
2
4
6
8
10
12
14 13
10.1
8.47
6 5.7 6.2 6.17.2 7.1
12
8.8 8.57
6.1 5.5 4.9 4.5 4.1 4.7 UCBS
stCBs
0
2
4
6
8
10
12
14
16
18
13
10.18.4
76 5.7 6.2 6.1
7.2 7.1
18
1311.2
10.2 9.7 10.39.5 9.4
10.5 11.2
UCBS
DCCBs
Source: Reserve Bank for UCBs and NABARD for Rural Co-operative Banks (excluding PACs for which the source is NAFSCOB).
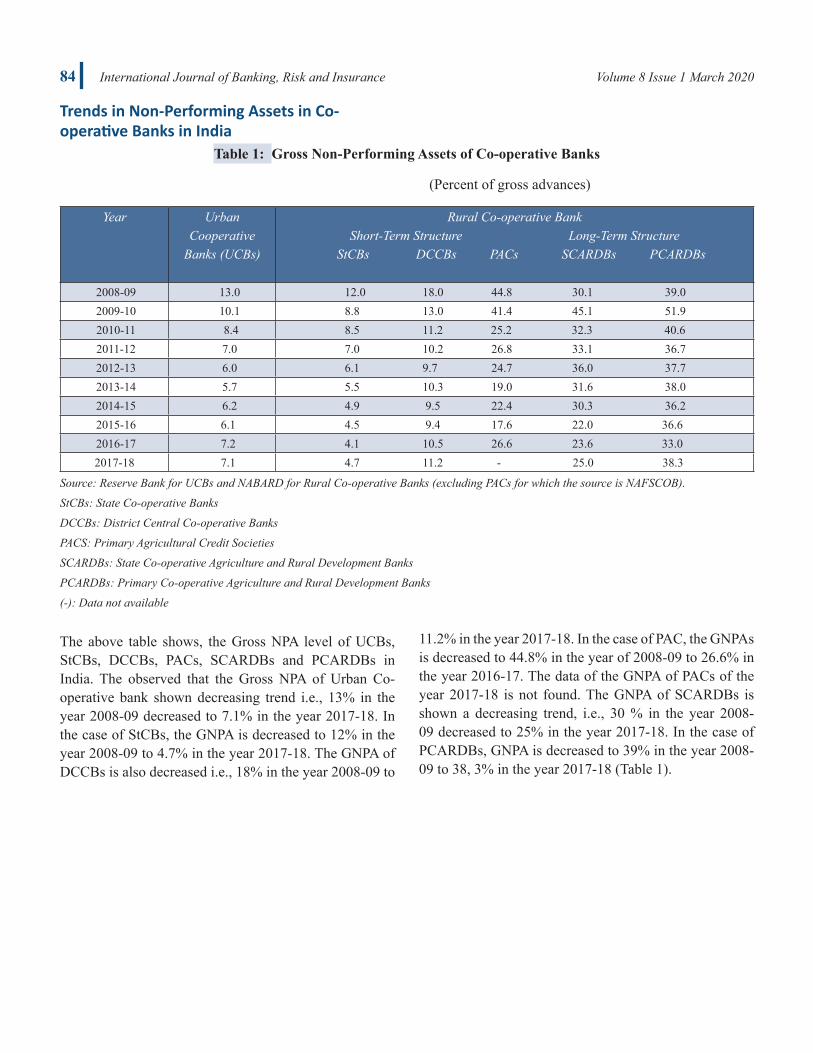
Fig. 2: Comparison of Urban Co-operative Banks and DCCBs Percentage of Gross NPA
86 International Journal of Banking, Risk and Insurance Volume 8 Issue 1 March 2020
The above figures show the comparative analysis of the NPA level of UCBs and DCCBs for the year 2008-09 to 2017-18. The GNPAs of both the banks showing a downward trend. From Fig. 2 can be seen the NPA of
DCCBs comparatively higher than the UCBS i.e., GNPAs of UCBs and DCCBs are 7.1% and 11.2% respectively (2017-18). It denotes that the asset quality of DCCBs is comparatively lower than UCBs.
11
Source: Reserve Bank for UCBs and NABARD for Rural Co-operative Banks (excluding PACS for which the
source is NAFSCOB).
Fig. 2: Comparison of Urban Co-operative Banks and DCCBs Percentage of Gross NPA
The above figures show the comparative analysis of the NPA level of UCBs and DCCBS for
the year 2008-09 to 2017-18. The GNPAs of both the banks showing a downward trend.
From figure 2 can be seen the NPA of DCCBs comparatively higher than the UCBS I,e
GNPAS of UCBS and DCCBS are 7.1% and 11.2% respectively (2017-18). It denotes that
the asset quality of DCCBs is comparatively lower than UCBS.
Source: Reserve Bank for UCBs and NABARD for Rural Co-operative Banks (excluding PACS for which the
source is NAFSCOB).
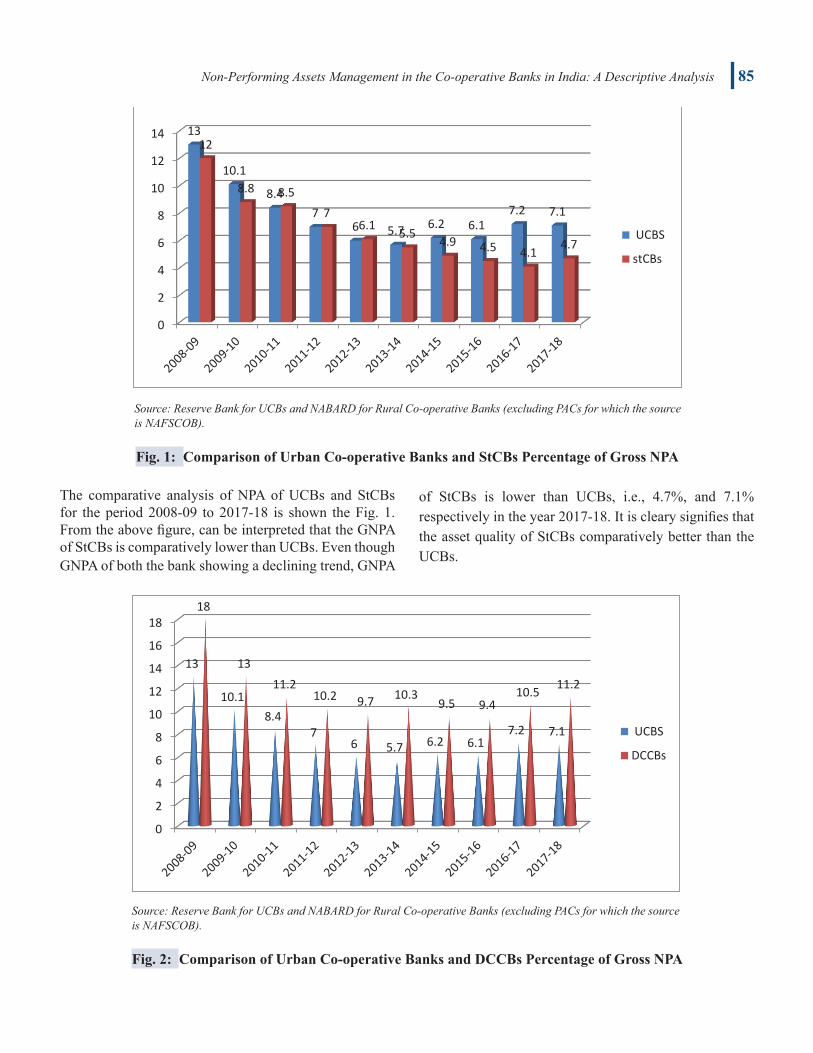
Fig. 3: Comparison of Urban Co-operative Banks and PACs Percentage of Gross NPA
The above figure shows the comparative analyse of NPA of UCBS and PACs for the year
2008-09 to 2016-17. The GNPAs of both banks showing a declining trend. The GNPA of
PACs is comparatively higher the UCBs I,e GNPA of UCBS and PACs were 13% and 44.8%
in the year 2008-09 decreases to 7.2 and 26.6 in the year 2016-17 respectively. It clearly
signifies that GNPAs of PACS is the alarming level.
0
5
10
15
20
25
30
35
40
45
1310.1 8.4 7 6 5.7 6.2 6.1 7.2
44.841.4
25.2 26.824.7
1922.4
17.6
26.6
UCBS
PACs
Source: Reserve Bank for UCBs and NABARD for Rural Co-operative Banks (excluding PACS for which the source is NAFSCOB).
Fig. 3: Comparison of Urban Co-operative Banks and PACs Percentage of Gross NPA
The above figure shows the comparative analyse of NPA of UCBs and PACs for the year 2008-09 to 2016-17. The GNPAs of both banks showing a declining trend. The GNPA of PACs is comparatively higher the UCBs i.e.,
GNPA of UCBs and PACs were 13% and 44.8% in the year 2008-09 decreases to 7.2 and 26.6 in the year 2016-17 respectively. It clearly signifies that GNPAs of PACs is the alarming level.
12
Source: Reserve Bank for UCBs and NABARD for Rural Co-operative Banks (excluding PACS for which the
source is NAFSCOB).
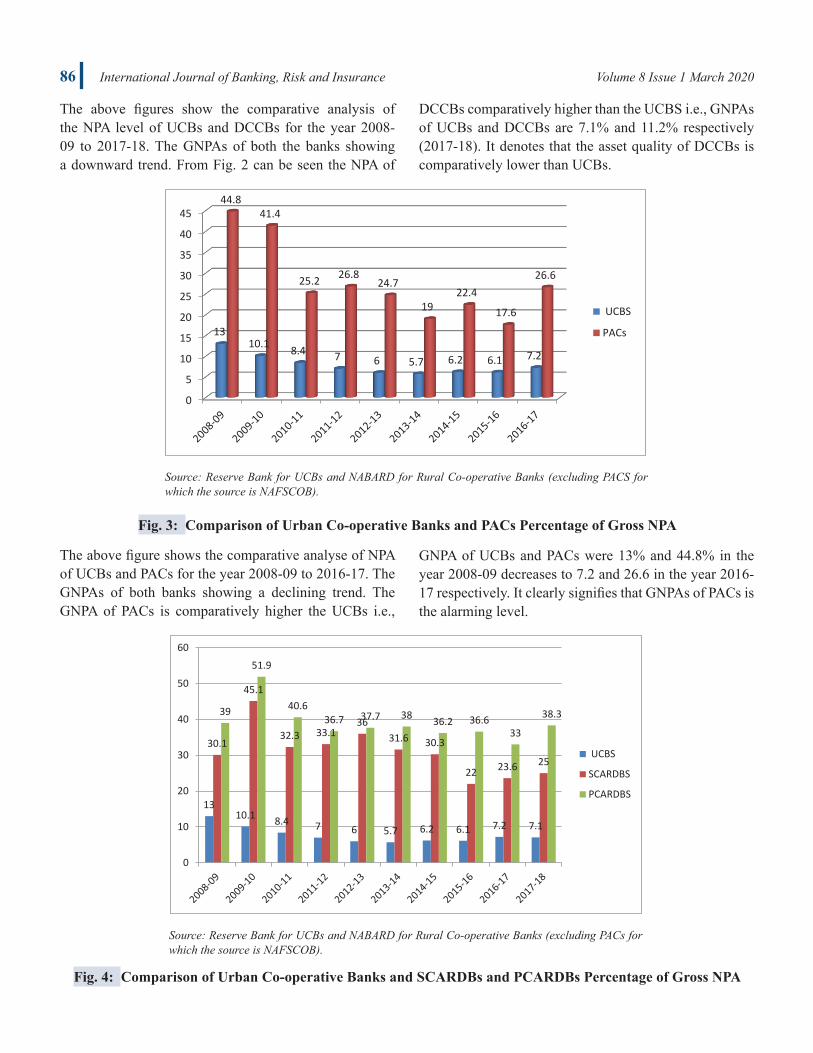
Fig. 4: Comparison of Urban Co-operative Banks and SCARDBS and PCARDBSs
Percentage of Gross NPA
The above figure 4 shows the comparative analysis of GNPA of UCBS with SCARDBS and
PCARDBS for the year 2008-09 to 2017-18. From the above figure, it can be seen that, the
GNPA of both SCARDBS and PCARDBS comparatively higher than the UCBs. The GNPA
of SCARDBS and PCARDBS were 25% and 38.3% respectively (2017-18) higher than 7.2%
(2017-18).it is signifies that the asset quality of SCARDBS and PCARDBS is poor.
Findings of the Study
1. The study observed that the GNPAs of Urban Co-operative banks show a decreasing
trend over the period of the study. The GNPA percentage comes down to 13 % (2008-
09) to 7.1% (2017-18). It shows the marginal improvement in the asset quality of
UCBs over the period of the study.
1310.1 8.4 7 6 5.7 6.2 6.1 7.2 7.1
30.1
45.1
32.3 33.136
31.6 30.3
22 23.6 25
39
51.9
40.636.7 37.7 38 36.2 36.6
33
38.3
0
10
20
30
40
50
60
UCBS
SCARDBS
PCARDBS
Source: Reserve Bank for UCBs and NABARD for Rural Co-operative Banks (excluding PACs for which the source is NAFSCOB).
Fig. 4: Comparison of Urban Co-operative Banks and SCARDBs and PCARDBs Percentage of Gross NPA
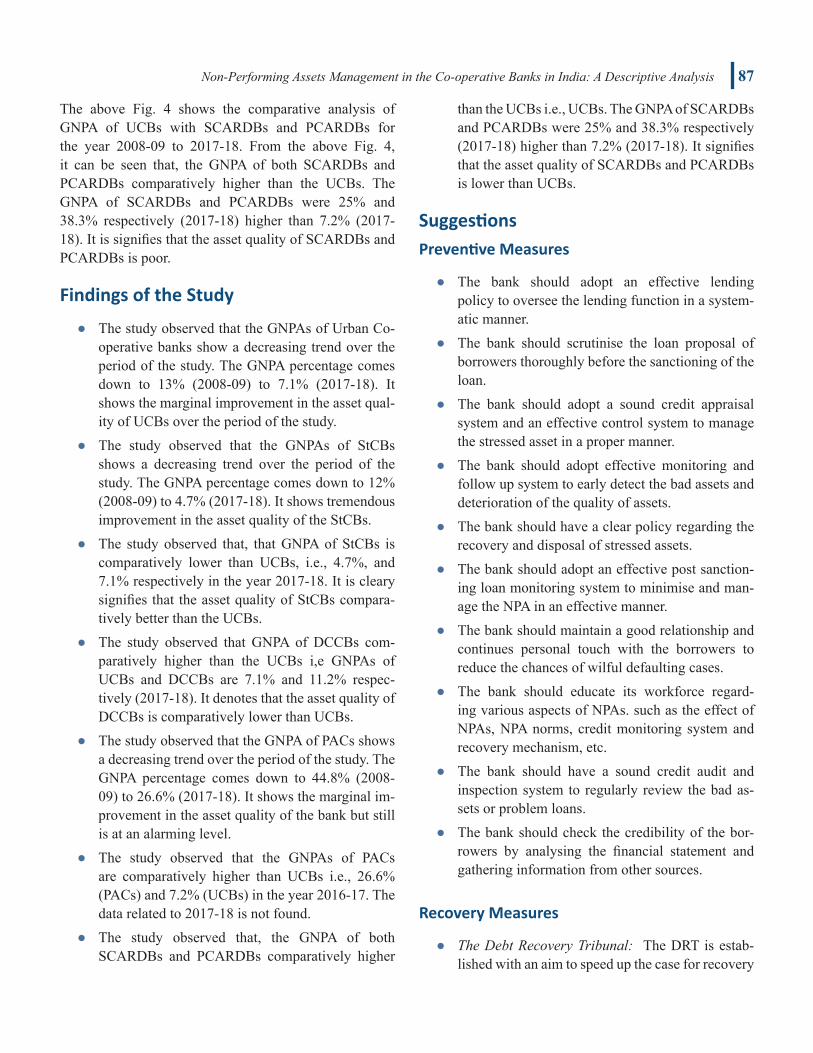
Non-Performing Assets Management in the Co-operative Banks in India: A Descriptive Analysis 87
The above Fig. 4 shows the comparative analysis of GNPA of UCBs with SCARDBs and PCARDBs for the year 2008-09 to 2017-18. From the above Fig. 4, it can be seen that, the GNPA of both SCARDBs and PCARDBs comparatively higher than the UCBs. The GNPA of SCARDBs and PCARDBs were 25% and 38.3% respectively (2017-18) higher than 7.2% (2017-18). It is signifies that the asset quality of SCARDBs and PCARDBs is poor.
Findings of the Study
● The study observed that the GNPAs of Urban Co-operative banks show a decreasing trend over the period of the study. The GNPA percentage comes down to 13% (2008-09) to 7.1% (2017-18). It shows the marginal improvement in the asset qual-ity of UCBs over the period of the study.
● The study observed that the GNPAs of StCBs shows a decreasing trend over the period of the study. The GNPA percentage comes down to 12% (2008-09) to 4.7% (2017-18). It shows tremendous improvement in the asset quality of the StCBs.
● The study observed that, that GNPA of StCBs is comparatively lower than UCBs, i.e., 4.7%, and 7.1% respectively in the year 2017-18. It is cleary signifies that the asset quality of StCBs compara-tively better than the UCBs.
● The study observed that GNPA of DCCBs com-paratively higher than the UCBs i,e GNPAs of UCBs and DCCBs are 7.1% and 11.2% respec-tively (2017-18). It denotes that the asset quality of DCCBs is comparatively lower than UCBs.
● The study observed that the GNPA of PACs shows a decreasing trend over the period of the study. The GNPA percentage comes down to 44.8% (2008-09) to 26.6% (2017-18). It shows the marginal im-provement in the asset quality of the bank but still is at an alarming level.
● The study observed that the GNPAs of PACs are comparatively higher than UCBs i.e., 26.6% (PACs) and 7.2% (UCBs) in the year 2016-17. The data related to 2017-18 is not found.
● The study observed that, the GNPA of both SCARDBs and PCARDBs comparatively higher
than the UCBs i.e., UCBs. The GNPA of SCARDBs and PCARDBs were 25% and 38.3% respectively (2017-18) higher than 7.2% (2017-18). It signifies that the asset quality of SCARDBs and PCARDBs is lower than UCBs.
Suggestions Preventive Measures
● The bank should adopt an effective lending policy to oversee the lending function in a system-atic manner.
● The bank should scrutinise the loan proposal of borrowers thoroughly before the sanctioning of the loan.
● The bank should adopt a sound credit appraisal system and an effective control system to manage the stressed asset in a proper manner.
● The bank should adopt effective monitoring and follow up system to early detect the bad assets and deterioration of the quality of assets.
● The bank should have a clear policy regarding the recovery and disposal of stressed assets.
● The bank should adopt an effective post sanction-ing loan monitoring system to minimise and man-age the NPA in an effective manner.
● The bank should maintain a good relationship and continues personal touch with the borrowers to reduce the chances of wilful defaulting cases.
● The bank should educate its workforce regard-ing various aspects of NPAs. such as the effect of NPAs, NPA norms, credit monitoring system and recovery mechanism, etc.
● The bank should have a sound credit audit and inspection system to regularly review the bad as-sets or problem loans.
● The bank should check the credibility of the bor-rowers by analysing the financial statement and gathering information from other sources.
Recovery Measures
● The Debt Recovery Tribunal: The DRT is estab-lished with an aim to speed up the case for recovery
88 International Journal of Banking, Risk and Insurance Volume 8 Issue 1 March 2020
of debts due to banking and financial institutions. The Debts Recovery Tribunal have been constitut-ed under Section 3 of the Recovery of Debts Due to Banks and Financial Institutions Act, 1993.1 The co-operative banks must make the best use of this channel to overcome the problem of recovery and maintain an asset quality of the bank.
● Lok Adalat: The Lok Adalat is the alternative dis-pute resolution mechanism, it is a forum estab-lished by the National Legal Service Authority to settle the disputes or pending cases in the Court of Law. The Co-operative bank should make use of this facility to resolve recovery cases effectively.
● SARFAESI Act: The Securitisation and Reconstru-ction of Financial Assets and Enforcement of Securities Interest Act, 2002 allows the banking institution or financial institutions to auction the residential or commercial properties of defaulters to recover the loans due to them. The Co-operative banks should make the best use of this facility to reduce the recovery problem faced by the bank.
● One-Time Settlement: The RBI mandated the bank must have a loan recovery policy to oversee the re-covery and settlement of NPAs. OTS is the Scheme is scheme enables the borrower (defaulter) to settle all the due at once to the bank.
● Asset Reconstruction Company: ARC is a special-ized institution that buys the NPA from the banks and financial institutions to clean up the financial statements. The ARC is in the business of buying the debtor of the bank to a mutually agreed value and attempt to recover the bad assets themselves. The ARC is registered under the RBI and regu-lated by The Securitisation and Reconstruction of Financial Assets and Enforcement of Securities Interest Act, 2002.
Conclusion
In this modern era, financial institutions, especially banking institutions, exposed to a remarkable number of financial crises or challenges in their operating environment. The most challenging issue concern to the banks is the mounting amount of Non-performing
1 www.bankdrt.org
assets. The problem of Non-performing Assets becomes an unbearable burden to the bank. A high NPA indicates poor quality of the asset and a lack of credit management system in the bank. The magnitude of NPA has significant influences on the profitability and performance of the bank.
The present study observed that the NPA level of all the selected co-operative banks showing a declining trend over the study period. The study also observed that there is a significant improvement in the Non-performing asset management in UCBs and StCBs, In the case of DCCBs, have a marginal improvement in the NPA management system. But the NPA level of PACs, SCARDBs, and PCARDBs reached an alarming range. It is indicated that they have a poor credit management system. Therefore Co-operative Bank should manage its NPA in an effective and systematic manner.
The RBI and other regulatory authorities introduced prudential norms and guidelines in order to provide a systematic framework to manage the NPA in an effective manner. The precautionary measures such as early alarming system, sound lending policy, evaluation of loan proposal, sound credit appraisal system, systematic monitoring system, etc., advisable to the bank. The post loan inspection and credit audit is an effective tool to verify the creditworthiness of the borrowers. The bank can make the best use of recovery channels such as Debt Recovery Tribunal, Lok Adalat, SARFAESI Act, One- Time Settlement and Asset Reconstruction Company to overcome the problem of recovery and disposal of a problem loan. It is needless to say, the problem of NPA is solved only when the bank makes an effort to enhance the credit assessment and risk management system.
ReferencesBahir, L. B. (2014). Agricultural and non-agricultural loan
recovery performance of district central co-operative banks in Maharashtra. MUDRA: Journal of Finance and Accounting, 1(2), 37-47.
Barki, G. (2015). A study on cooperative banks in Haveri district with special reference to lending practices. Journal of Exclusive Management Science, 4(10), 1-10.
Ali, M. S., & Kaveri, V. S. (2018). Loan default risk: A diagnostic study. The Journal of Indian Institute of Banking and Finance, 189(4), 47-58.
Non-Performing Assets Management in the Co-operative Banks in India: A Descriptive Analysis 89
Nagaraja, R. C., & Madegowda, J. (2015). A compara-tive study of non-performing assets in DCCBs and UCBs. Global Journal for Research Analysis, 4(5), 199-201.
Pitre, V. (2003). Urban cooperative banks: Issues and prospects. Economic and Political Weekly, 38(15), 1505-1513.
Ramu, N. (2008). Urban cooperative banks: At cross-roads. The Indian Banker, 3(1), 14-27. Retrieved from https://ssrn.com/abstract=2290482
Ramu, N. (2009). Dimensions of non-performing assets in urban cooperative banks in Tamil Nadu. Global Business Review, 10(2), 279-297.
Reddy, P. K. (2002). A comparative study of non-perform-ing assets in India in the Global context-similarities and dissimilarities, remedial measures. Remedial Measures, 1-18. Retrieved from file:///C:/Users/HP/Downloads/SSRN-id361322.pdf
Saha, A. (2010). Urban cooperative banks: A case study of Karnataka. Retrieved from https://mpra.ub.uni-muenchen.de/26565/
Sivakumar, S. (2018). A study on non-performing asset management with special reference to Coimbatore city Co-operative Bank Ltd, Tamilnadu. International Journal of Management Studies, 4(2), 75-85.
Tiwari, C. (2015). A study on the causes of Non-performing asset in selected co-operative banks in Pune. International Journal, 3(6), 688-692.
Sarkar, S. C., & Karak (2018). Management of Non-performing assets of district central co-operative bank. Indian Journal of Accounting (IJA), 50(1), 78-86.
Reserve Bank for UCBs and NABARD for Rural Co-operative Banks (excluding PACs for which the source is NAFSCOB). Retrieved from file:///G:/DOCUMENTS/P.Hd%20document/Risk%20management/articles%20on%20risk%20manage-ment/rbi%20guidelines/GNPA%20of%20coopera-tivel%20banks%20-statistical%20data.PDF
Master Circular - Prudential norms on Income Recognition, Asset Classification and Provisioning pertaining to Advances (http://www.rbi.org.in).
Websites
http://www.rbi.org.inhttps://www.moneycontrol.comhttp://jgateplus.com