No-till reduces global warming potential in a subtropical Ferralsol
15
REGULAR ARTICLE No-till reduces global warming potential in a subtropical Ferralsol Jonatas Thiago Piva & Jeferson Dieckow & Cimélio Bayer & Josiléia Acordi Zanatta & Anibal de Moraes & Volnei Pauletti & Michely Tomazi & Maico Pergher Received: 3 December 2011 / Accepted: 30 March 2012 / Published online: 3 May 2012 # Springer Science+Business Media B.V. 2012 Abstract Aims For tropical and subtropical soils, information is scarce regarding the global warming potential (GWP) of no-till (NT) agriculture systems. Soil organic car- bon (OC) sequestration is promoted by NT agriculture, but this may be offset by increased nitrous oxide (N 2 O) emissions. We assessed the GWP of a NT as compared to conventional tillage (CT) in a subtropical Brazilian Ferralsol. Methods From September 2008 to September 2009 we used static chambers and chromatographic analy- ses to assess N 2 O and methane (CH 4 ) soil fluxes in an area previously used for 3 – 4 years as a field- experiment. The winter cover crop was ryegrass (Lolium multiflorum Lam.) while in summer it was silage maize (Zea mays L.). Results The accumulated N 2 O emission for NT was about half that of CT (1.26 vs 2.42 kg N ha −1 year −1 , Plant Soil (2012) 361:359–373 DOI 10.1007/s11104-012-1244-1 Responsible Editor: Elizabeth M. Baggs. J. T. Piva : J. Dieckow (*) : M. Pergher Programa de Pós-Graduação em Ciência do Solo & Departamento de Solos e Engenharia Agrícola, Universidade Federal do Paraná, Rua dos Funcionários 1540, 80035-050 Curitiba, PR, Brazil e-mail: [email protected] C. Bayer Programa de Pós-Graduação em Ciência do Solo & Departamento de Solos, Universidade Federal do Rio Grande do Sul, 91501-970 Porto Alegre, RS, Brazil J. A. Zanatta Centro Nacional de Pesquisa em Floresta, Empresa Brasileira de Pesquisa Agropecuária, 83411-000 Colombo, PR, Brazil A. de Moraes Programa de Pós-Graduação em Agronomia (Produção Vegetal) & Departamento de Fitotecnia e Fitosanitarismo, Universidade Federal do Paraná, 80035-050 Curitiba, PR, Brazil V. Pauletti Fundação ABC para Assistência e Divulgação Técnica Agropecuária, 84166-990 Castro, PR, Brazil M. Tomazi Centro de Pesquisa Agropecuária Oeste, Empresa Brasileira de Pesquisa Agropecuária, 79804-970 Dourados, MS, Brazil Present Address: J. T. Piva Programa de Pós-Graduação em Agronomia (Produção Vegetal), Universidade Federal do Paraná, 80035-050 Curitiba, PR, Brazil Present Address: V. Pauletti Programa de Pós-Graduação em Ciência do Solo & Departamento de Solos e Engenharia Agrícola, Universidade Federal do Paraná, Rua dos Funcionários 1540, 80035-050 Curitiba, PR, Brazil
Transcript of No-till reduces global warming potential in a subtropical Ferralsol
REGULAR ARTICLE
No-till reduces global warming potentialin a subtropical Ferralsol
Jonatas Thiago Piva & Jeferson Dieckow &
Cimélio Bayer & Josiléia Acordi Zanatta &
Anibal de Moraes & Volnei Pauletti &Michely Tomazi & Maico Pergher
Received: 3 December 2011 /Accepted: 30 March 2012 /Published online: 3 May 2012# Springer Science+Business Media B.V. 2012
AbstractAims For tropical and subtropical soils, information isscarce regarding the global warming potential (GWP)of no-till (NT) agriculture systems. Soil organic car-bon (OC) sequestration is promoted by NT agriculture,but this may be offset by increased nitrous oxide(N2O) emissions. We assessed the GWP of a NT ascompared to conventional tillage (CT) in a subtropicalBrazilian Ferralsol.
Methods From September 2008 to September 2009we used static chambers and chromatographic analy-ses to assess N2O and methane (CH4) soil fluxes in anarea previously used for 3–4 years as a field-experiment. The winter cover crop was ryegrass(Lolium multiflorum Lam.) while in summer it wassilage maize (Zea mays L.).Results The accumulated N2O emission for NT wasabout half that of CT (1.26 vs 2.42 kg N ha−1 year−1,
Plant Soil (2012) 361:359–373DOI 10.1007/s11104-012-1244-1
Responsible Editor: Elizabeth M. Baggs.
J. T. Piva : J. Dieckow (*) :M. PergherPrograma de Pós-Graduação em Ciência do Solo &Departamento de Solos e Engenharia Agrícola,Universidade Federal do Paraná,Rua dos Funcionários 1540,80035-050 Curitiba, PR, Brazile-mail: [email protected]
C. BayerPrograma de Pós-Graduação em Ciênciado Solo & Departamento de Solos,Universidade Federal do Rio Grande do Sul,91501-970 Porto Alegre, RS, Brazil
J. A. ZanattaCentro Nacional de Pesquisa em Floresta,Empresa Brasileira de Pesquisa Agropecuária,83411-000 Colombo, PR, Brazil
A. de MoraesPrograma de Pós-Graduação em Agronomia (ProduçãoVegetal) & Departamento de Fitotecnia e Fitosanitarismo,Universidade Federal do Paraná,80035-050 Curitiba, PR, Brazil
V. PaulettiFundação ABC para Assistênciae Divulgação Técnica Agropecuária,84166-990 Castro, PR, Brazil
M. TomaziCentro de Pesquisa Agropecuária Oeste,Empresa Brasileira de Pesquisa Agropecuária,79804-970 Dourados, MS, Brazil
Present Address:J. T. PivaPrograma de Pós-Graduação em Agronomia(Produção Vegetal), Universidade Federal do Paraná,80035-050 Curitiba, PR, Brazil
Present Address:V. PaulettiPrograma de Pós-Graduação em Ciência do Solo &Departamento de Solos e Engenharia Agrícola,Universidade Federal do Paraná,Rua dos Funcionários 1540,80035-050 Curitiba, PR, Brazil

P00.06). Emission peaks for N2O occurred for amonth after CT, presumably induced by mineralizationof residual nitrogen. In both systems, the highest N2Oflux occurred after sidedressing maize with inorganicnitrogen, although the flux was lower in NT than CT(132 vs 367 μg N m−2 h−1, P00.05), possibly becausesome of the sidedressed nitrogen was immobilized byryegrass residues on the surface of the NT soil. Neitherwater-filled pore space (WFPS) nor inorganic nitrogen(NH4
+ and NO3−) correlated with N2O fluxes, although
at some specific periods relationships were observedwith inorganic nitrogen. Soils subjected to CT or NTboth acted as CH4 sinks during most of the experiment,although a CH4 peak in May (autumn) led to overallCH4 emissions of 1.15 kg CH4-C ha−1 year−1 for CTand 1.08 kg CH4-C ha−1 year−1 for NT (P00.90). TheOC stock in the 0–20 cm soil layer was slightly higherfor NT than for CT (67.20 vs 66.49 Mg ha−1, P00.36).In the 0–100 cm layer, the OC stock was significantlyhigher for NT as compared to CT (234.61 vs231.95 Mg ha−1, P00.01), indicating that NTresulted in the sequestration of OC at a rate of0.76 Mg ha−1 year−1. The CO2 equivalent cost ofagronomic practices was similar for CT (1.72 Mg CO2eqha−1 year−1) and NT (1.62Mg CO2eq ha
−1 year−1). How-ever, NT reduced the GWP relative to CT (−0.55 vs2.90 Mg CO2eq ha−1 year−1), with the difference of−3.45 Mg CO2eq ha−1 year−1 (negative value impliesmitigation) being driven mainly by OC sequestration.The greenhouse gas intensity (GHGI, equivalent toGWP/silage yield) was lower for NT than CT (−31.7 vs171.1 kg CO2eq Mg−1 for silage maize).Conclusion As compared to CT, greenhouse gas emis-sions from a subtropical soil can be mitigated by NT bylowering N2O emissions and, principally, sequestrationof CO2-C.
Keywords Nitrous oxide .Methane . C sequestration .
N immobilization . Conventional tillage . Greenhousegas intensity
Introduction
The global estimate for organic carbon (OC) seques-tration by no-till (NT) soils is 0.57 Mg ha−1 year−1
(West and Post 2002), while for southern Braziliansubtropical soils it is 0.48 Mg ha−1 year−1 (Bayer etal. 2006). In NT soils, however, OC sequestration
should not be taken as the ultimate contributor to themitigation of global warming. A full assessment of thesoil and atmosphere fluxes of the three principalgreenhouse gases (CO2, CH4 and N2O) and of theCO2 equivalent costs related to agronomic practices(operations and inputs) is essential to obtain the netglobal warming potential (GWP) of a system (Robertsonand Grace 2004; Six et al. 2004; Mosier et al. 2005)because soil management-related gains achieved by re-ducing the flux of one greenhouse gas may be offset byincreases in the flux of another gas (Six et al. 2004;Gregorich et al. 2005). Besides, a fair comparison be-tween management systems can be achieved using thegreenhouse gas intensity (GHGI), calculated by dividingthe GWP of a soil management system by the crop yieldfor the same system (Mosier et al. 2006). Due to thestrategic importance that NT-based agriculture has, andwill increasingly have, on food production, more studiesare needed to investigate the impact of NT managementon soil N2O and CH4 emissions, soil OC sequestration,hidden carbon costs of farm operations and net GWP andGHGI, particularly in tropical and subtropical regionswhere information is still scarce.
The known OC sequestration potential of NT may beoffset by increased N2O emission (Gregorich et al. 2005;Li et al. 2005), with N2O being 298 times more potent asa active radiative greenhouse gas as compared to CO2.However, this area is still controversial and further studiesare needed to clarify the situation. For example, it hasbeen shown that NT increases N2O emission (MacKenzieet al. 1997; Ball et al. 1999; Baggs et al. 2003), particu-larly because of higher soil moisture due to mulching ofresidual plant material and by soil compaction and higherbulk density and lower aeration porosity (Ball et al.1999), all of which create more favorable conditions fordenitrification. Other studies, however, have shown lowerN2O emissions in NT soil as compared to CT soil, al-though the reasons for this are as yet unclear (Chatskikhand Olesen 2007; Malhi et al. 2006; Gregorich et al.2008; Petersen et al. 2011; Mutegi et al. 2010; Ussiri etal. 2009; Passianoto et al. 2003). Rochette (2008)reviewed the available information and concluded thatwhile emissions were comparable for CTand NTsystemsin well-aerated soils, there were higher N2O emissionsfromNTsoils in poorly aerated soils, such as the Gleysolsinvestigated in some studies (MacKenzie et al. 1997; Ballet al. 1999).
Studies conducted in the Brazilian Subtropics (Jantaliaet al. 2008) and the Brazilian Cerrado scrubland (Metay
360 Plant Soil (2012) 361:359–373

et al. 2007) have shown similar N2O emissions for NTand CT soils. However, other studies in the Cerrado(Carvalho et al. 2009), and the Subtropics (Escobar etal. 2010) have shown higher emissions in NT soil, whilestudies carried out in the Amazon (Passianoto et al. 2003;Carmo et al. 2005) have reported lower emissions for NTsoils. Studies documenting the full accounting expressedin the net GWP for NTand including gas balances and thecarbon costs of agronomic practices are absent or rare forBrazilian conditions, although some studies have alreadyreported the results of gas balances (Carvalho et al. 2009;Metay et al. 2007).
Legume based NT cropping systems have beenreported to increase N2O emissions compared to non-fertilized grass-based systems (Gomes et al. 2009).Nonetheless, it would be reasonable to expect lowerN2O emissions for grass-based systems due to the im-mobilization of nitrogen induced by grass residues,which have high ratios of carbon to nitrogen (C:N),lignin to nitrogen and lignin to polyphenol (Gomes etal. 2009; Frimpong and Baggs 2010).
Aerobic soils, either under natural conditions (Dalaland Allen 2008) or subjected to agricultural manage-ment (Powlson et al. 1997), are important CH4 sinksbecause soil methanotrophs use CH4 as source ofcarbon and energy, oxidizing it to CO2 (Le Mer andRoger 2001). However, methanotrophs are sensitive tosoil disturbance (Hütsch 1998), with CH4 oxidationrates reported to be slightly higher in undisturbed NTsoil than in ploughed CT soils (Ball et al. 1999; Hütsch1998; Six et al. 2004).
The hypothesis of this study was that, as comparedto CT, NT management in a subtropical Ferralsol canmitigate greenhouse gas emissions by promoting OCsequestration and lowering N2O emission. The objec-tive was to assess the potential contribution of grass-based NT management to the mitigation of globalwarming in a subtropical Ferralsol, taking into accountN2O and CH4 fluxes, soil OC sequestration and theCO2 equivalent costs of agronomic practices for a fullaccounting of the GWP of NT systems.
Materials and methods
Site and experimental description
This study was conducted from September 2008 toSeptember 2009 in a field experiment established in
the winter of 2005 at the ABC Foundation experimentalstation located near the town of Castro in the southernBrazilian state of Paraná (24°47′53′′S; 49°57′42′′W,996 m altitude). The climate is humid subtropical (Cfb,Köppen classification), the average monthly temperatureis 23°C in the warmest month (January) and 13°C in thecoldest (July) and the mean annual precipitation is1,400 mm (Caviglione et al. 2000). The soil is a clayeyUmbric Ferralsol (IUSS 2006) or Latossolo Bruno(Embrapa 2006), with 384 gkg−1 sand, 177 gkg−1 siltand 439 gkg−1 clay in the 0- to 20-cm depth.
The area was originally under native grassland(Campos Gerais) but around 1960 (no precise recordof the date is available) it was converted to annualcropland for commercial wheat (Triticum aestivum L.)and soybean [Glycine max (L.) Merr] cropping underCT, this management system being continued until theestablishment of the experiment in 2005. The originalaim of the experiment was to assess crop and soilparameters (mainly physical) related to soil use andtillage systems.
The experiment was set up using a split-plot ran-domized complete block design with four replicates.The main plots (70 m×10 m) comprised soil usesystems in winter, with Italian ryegrass (Lolium multi-florum Lam.) being grazed, hayed or left only as covercrop. Maize (Zea mays L.) was cropped in summer forsilage production. The subplots (10×10 m) coveredseven tillage types, of which we selected conventionaltillage (CT) and no-till (NT) plots in the soil usesystem where ryegrass was used only as winter covercrop. For the CT plots we applied one heavy diskingoperation (∼15 cm deep) and two leveling diskingoperations (∼10 cm deep) in spring to incorporateryegrass biomass before planting maize and again inautumn before sowing ryegrass. We used a heavydisker equipped with 25 inch diameter disks that pro-duced similar effects to ploughing (i.e., a layer cut andinversion, residue incorporation and formation of acompacted pan below the tilled layer). In southernBrazil, this CT management system based on heavydisking up to 15 cm deep represents about 70 % of thearea in which soil is tilled (Derpsch et al. 1991). Forthe NT plots, the ryegrass cover crop was desiccatedwith a glyphosate-based herbicide, equivalent to add-ing glyphosate at the rate of 1,200 gha−1, beforeplanting maize, the same herbicide regime being usedto desiccate spontaneous weeds before sowing theryegrass. The NT systems in this region still depend
Plant Soil (2012) 361:359–373 361

on the application of herbicide. The NT managementimplies no tillage operation over the years. Since treat-ments were based on an annual succession of oat/maize, the cropping system and farm operations wererepeated every other year for each treatment.
Maize was planted in October 2008, in rows spacedat 80 cm (seed020 kg ha−1 ≈ 60,000 plants ha−1) and atotal nitrogen application of 165 kg ha−1 was split-applied using 40 kg ha−1 of 15-30-00 fertilizer with Nas NH4
+ between seed rows at planting and125 kg ha−1 of 25-00-25 urea-N as an unincorporatedsidedress when the maize reached the V4 stage withfour completely expanded leaves. We also applied80 kg ha−1 P2O5 at planting and 125 kg ha−1 K2O atsidedress. Post emergence herbicide (nicosulfuron, ac-tive ingredient060 gha−1) was applied when the maizewas at the three-leaf V3 stage. In February, the maizewas harvested mechanically for silage when the grainswere milky-to-solid as starch. The soil was left fallowfor about 2 months and in April 30 kg ha−1 ryegrass seedwas sown, in rows spaced 17 cm apart. No fertilizer wasapplied to the ryegrass cover crop. Lime was applied at arate of 2 Mg ha−1 every 3 years on the surface of the soilfor NT and incorporated by tillage for CT.
Air temperature and precipitation information fromSeptember 2008 to September 2009 were collected atthe nearest meteorological station (10 km away).
Measurements of N2O and CH4 fluxes from soil
The N2O and CH4 fluxes were measured from 26September 2008 to 16 September 2009, in the 4th yearof the experiment, and included 15 sampling eventsduring maize growth in spring (September–November2008) and 15 during ryegrass cycle in autumn/winter(April–September 2009). Measurements could not beperformed from December 2008 to March 2009 due totechnical problems with the chromatograph but sinceother studies observed that this is a period of back-ground fluxes (Gomes et al. 2009; MacKenzie et al.1997; Petersen et al. 2011) because no fertilization ortillage was carried out, and because of the intensenitrogen uptake by maize, the information regardingannual gas emissions remained reliable.
Static PVC chambers (Mosier 1989; Parkin et al.2003) 20 cm high and 25 cm in diameter weredeployed on metal bases (collars) to collect air sam-ples. Three metal bases to support chambers wereinstalled for CT and NT plots, within a previously
delimitated mini-plot of 2.4 m×2.4 m. The bases weredriven 5 cm into the soil 48 h before the first samplewas taken and kept in place continuously, except fortillage and sowing operations. Each sampling began at9.00 a.m. and lasted for 45 min, with gas samplesbeing collected in 20-mL polypropylene syringes at15-min intervals (0, 15, 30 and 45 min). The chamberwas water-sealed in a gutter surrounding the metal-base. Headspace temperature was monitored and airwas mixed with a 12 V fan installed at the top of thechamber. Samples were analyzed in a Shimadzu 2014Chromatograph, equipped with flame ionization detec-tor (FID) and electron capture detector (ECD). Analyseswere carried out within 24 to 36 h of sampling. Emissionfluxes were estimated from the angular coefficient of thelinear model fitted to describe the increase in headspacegas concentration during the 45-min deployment.
The N2O and CH4 fluxes were calculated using thefollowing equation:
f ¼ ΔQ
Δt
PV
RT
1
A
where, f is the N2O or CH4 flux (μg N2O-N orCH4-C m−2 h−1), Q is the quantity of each gas in thechamber at the sampling moment (micrograms of N2O-N or CH4-C per chamber), P is the atmospheric pressureinside the chamber, assumed as being 1 atm, V is thechamber headspace volume (liters), R is the ideal gasesconstant (0.08205 atm L mol−1 K−1), T is the innertemperature of the chamber at sampling (K) and A isthe surface area of the chamber (m2).
The measured fluxes of N2O and CH4 were con-verted into mean daily fluxes, integrated along the218 days of the assessment period and then normal-ized (extrapolated) to 365 days of 1 year to obtain thetotal annual emissions.
Soil physical parameters, inorganic N and organiccarbon evaluation
For each gas sampling event, three soil subsamplesfrom the 0–5 cm layer were collected within the2.4 m×2.4 m mini-plot to determine moisture andinorganic N (NH4
+ and NO3−). Soil moisture was
determined gravimetrically (105°C). Inorganic N wasdetermined by steam-distillation (Mulvaney 1996),after extraction from approximately 5-g soil sample(at field moisture—correction was done later) in50 mL 1M KCl solution.
362 Plant Soil (2012) 361:359–373
In December 2008, undisturbed soil core sampleswere collected in the 0–5, 5–10 and 10–20 cm layers,at two points per plot, to determine soil bulk density,total porosity, macroporosity and microporosity. Metalcylinders 5.6 cm diameter and 3.1 cm high were insertedvertically to the middle of each soil layer. Microporositywas assumed as being the volume of water contained inthe core sample at after 48 h at 6 kPa in a tension table(Leamer and Shaw 1941). Macroporosity was the dif-ference between total porosity and microporosity. Totalporosity was calculated from bulk and particle densities(Danielson and Sutherland 1986), the latter being as-sumed to be 2.65 Mg m−3. Soil bulk density was deter-mined after drying samples at 105°C. The water-filledpore space (WFPS) was calculated from the total poros-ity and gravimetric moisture.
A second set of samples were collected for OCassessment, adjacent to the points where core sampleswere taken. In the 0–5, 5–10, 10–20 cm layers sampleswere collected with a spatula and in the 20–40, 40–60,60–80 and 80–100 cm layers with a Dutch auger. Sam-ples were air dried at room temperature, crushed with awooden roll and stored in plastic pots. To determine theOC concentration, about 20 g was crushed in a mortar topass a 0.50-mm mesh and 400 mg analyzed by drycombustion in a Shimadzu TOC-VCSH analyzer.
OC stocks were calculated in equivalent soil mass,considering the CT system as the soil mass reference.This procedure normalizes the different effects thatmanagement systems have on soil bulk density. Theequation presented by Sisti et al. (2004) was used tocorrect the values. To calculate the equivalent soilmass below 20-cm depth, we assumed that the bulkdensity was the same of that in 10–20 cm layer,because the opening of a trench to assess bulk densityup to 1 m would cause severe damage to the long-termexperimental plots.
The OC sequestration rate in NT relative to CT soilwas calculated by the difference in OC stock betweenthe two systems divided by the age of the 3.5 years ofthe experiment (June 2005, when the experimentstarted, to December 2008, when soil was sampled).This is referred to as the relative sequestration rate ratherthan the absolute sequestration rate because it does notconsider the OC stock at the beginning of the experi-ment, information on which was not available. AnnualOC sequestration rates were calculated for both 0 and20-cm, the usual sampling depth that includes the tilledlayer in CT and the 0–100 cm layers.
The annual OC sequestration rate (ΔOC) was usedto estimate the net annual CO2 emission or mitigation,instead of the direct CO2 measurements by staticchambers. The direct measurement by static chamberconsiders not only the CO2 from organic matter min-eralization, but also that from root respiration, whichcannot be distinguished from the former. The ap-proach of using soil ΔOC instead of direct measure-ment of CO2 is supported by previous studies(Robertson et al. 2000; Robertson and Grace 2004;Six et al. 2004; Mosier et al. 2005).
CO2 equivalent costs of agronomic practices
CO2 equivalent costs associated to farm operations (till-age, sowing, spraying, fertilizer application and harvest-ing) and inputs (seeds, fertilizers, lime and herbicide)were calculated for the CT and NT systems, consideringthe particular nature of each of these experimental treat-ments and coefficients reported in the literature (Zanattaet al. 2007; Lal 2004; West and Marland 2002).
Global warming potential
The GWP of the CT and NT systems were calculated bysumming the N2O emission, CH4 emission, soil OCsequestration (assumed to represent the soil CO2 bal-ance) and the CO2 costs of agronomic practices in eachsystem. The CT system was assumed as being the base-line system. Gas emission data were normalized intoCO2eq, considering the global warming potential ofN2O (298) and CH4 (25) relative to CO2 in a 100-yeartime horizon (IPCC 2007). We calculated the GWP ofthe NT system twice, one considering the OC sequestra-tion rate in the 0–20 cm layer, and another considering inthe 0–100 cm layer. The difference in GWP between thetwo systems was used to assess whether NTcan mitigategreenhouse gas emissions relative to CT or not.
The greenhouse gas intensity (GHGI) was calculat-ed by dividing the GWP by the maize silage yield, asproposed by Mosier et al. (2006). The silage yield wasthe average of the 4 years of the experiment (2005/2006 to 2008/2009).
Statistical analysis
Data were submitted to analysis of variance (ANOVA)and significance of differences between CT and NTsystems was assessed by P-value of the Fisher F-test.
Plant Soil (2012) 361:359–373 363

Results
Precipitation and air temperature
The recorded annual precipitation of 1,740 mm dur-ing the study year (21 September 2008 to 21 Sep-tember 200905 days before the first air sampling to5 days after the last) was above the normal rainfallof 1,400 mm. Monthly precipitation was below nor-mal in April 2009 (21 vs 88 mm) and was abovenormal in January 2009 (296 vs 188 mm) and July2009 (315 vs 112 mm) (Fig. 1) (Caviglione et al.2000). In general, for other months, precipitationwas normal.
June was the coldest month and its mean tempera-ture of 11.7°C was below the normal 14.0°C (Fig. 1)(Caviglione et al. 2000). February, the warmest month,had a mean temperature of 20.8°C, below the normal23.0°C.
CO2 equivalent costs
The total CO2 equivalent costs of agronomic practices,given in kg CO2eq ha−1 year−1, were similar for CTand NT, although with a slight tendency of beinglower in NT (1,617 vs 1,723) (Table 1). The CTsystem showed costs due to tillage operations(176.0), whilst NT showed additional costs related toherbicides (65.6 more than CT). The major driver ofCO2 costs was N fertilization (786.5), whichaccounted for 46 % and 49 % of the overall costs inCT and NT, respectively.
N2O fluxes
The N2O fluxes, given in μg Nm−2 h−1, during the1st month of measurements, including 3 days beforespring tillage in CT (sampling 1) until 1 day after side-dress application of 125 kg urea-N ha−1 to maize (sam-pling 10), varied from −7 to 27 in NTand from −10 to 38in CT (Fig. 2a). From 7 to 11 days after spring tillage(samplings 4 and 5), however, CTemitted twice as muchN2O as NT (on average, 33 vs 15). One day aftersidedress N application (sampling 10), the fluxes aver-aged a low value of 11 but increased sharply 3 days later(sampling 11), reaching an average of 96 across CT andNT. For the next 3 weeks, until sampling 15, fluxesvaried from 80 to 133 in NT and from 94 to 367 in CT,this being the period where the highest emissions wererecorded. In the ryegrass cycle (samplings 16 to 30),N2O fluxes were considerably lower than those observedin maize and were similar for CT and NT, except that1month after autumn tillage, a significant peak of 69wasobserved for CT (sampling 20).
After integrating the N2O fluxes over time and extrap-olating to the 1-year range, the total N2O emission was1.26 kg N ha−1 year−1 in NT, which was almost half theemission of 2.42 kg N ha−1 year−1 in CT (P00.06)(Table 2). Converting into CO2eq, this difference betweensystems represented an emission reduction of 0.55 MgCO2eq ha−1 year−1 in NT compared to CT (Table 2).
CH4 fluxes
Methane influxes were observed during maize crop-ping (sampling 1–15), except for two sampling events
SepOct
NovDec
Jan Feb
Mar Apr
May Jun
JulAug
Sep
Pre
cip
itat
ion
(m
m)
0
20
40
60
80
100
Precipitation
Tem
per
atu
re (
oC
)
0
5
10
15
20
25
Temperature
2008 2009
First air sampling Last air sampling
Fig. 1 Mean daily precipitation and mean daily air temperature in the experimental site, from 1 September 2008 to 30 September 2009
364 Plant Soil (2012) 361:359–373

in CTwhere fluxes were positive (samplings 3 and 10)(Fig. 2b). For most of the ryegrass cycle (samplings16–30), CH4 influxes were also observed, but an in-tense emission peak occurred in May (autumn) reach-ing 147 μg C m−2 h−1 in CT and 194 μg C m−2 h−1 inNT. Because of this peak, the CH4 annual flux waspositive, being 1.15 and 1.08 kg C ha−1 year−1 in CTand NT, respectively, but the difference was not sig-nificant (P00.90) (Table 2).
Soil physical parameters and inorganic N
Effects of tillage system on soil bulk density, macro-porosity and microporosity were restricted to only the0–5 cm layer, where NT soil showed higher bulkdensity than CT (1.17 vs 1.09 Mg m−3), lower macro-porosity (0.10 vs 0.18 m3 m−3) and higher micropo-rosity (0.45 vs 0.41 m3 m−3) (Table 3).
The WFPS during maize cropping (samplings 1–15)varied from 41% to 67% in CT, and from 49% to 79%in NT (Fig. 3). A wider variation occurred in the rye-grass season (sampling 16–30), both for CT (29 % to68 %) and NT (42 % to 92 %). Overall, the WFPS washigher for NT (mean of 65 %) than CT (mean of 52 %).No correlation was found between WFPS and N2Ofluxes (data not shown).
The NH4+ concentration in the 0–5 cm layer increased
sharply after the sidedress N was applied to maize (sam-pling 10) but reduced to close to zero 21 days later(Fig. 4a). During this period, the NH4
+ concentrationpeaked at 173 mgN kg−1 in NT (2 days after application,sampling 11) and at 212 mg N kg−1 in CT (6 days afterapplication, sampling 12). The largest differences be-tween these systems were observed 6 and 12 days afterapplication (samplings 12 and 13), although not signifi-cant. No correlation was observed between NH4
+
Table 1 Annual CO2 equivalent costs related to agronomic practices (operations and inputs) in conventional tillage (CT) and no-till (NT)
Source Costs (kg CO2eq ha−1) Observations
CT NT
Operations
Tillage 176.0 0.0 88.0 kg CO2eq ha-1 tillage-1, based on estimates for southern Brazil(Zanatta et al. 2007). Two tillage operations in CT per year(spring and autumn)
Sowing 23.5 27.9 17.3 and 13.9 kg CO2eq ha-1 sowing-1 in CT and NT, respectively(Lal 2004). Two sowing operations per year (maize and ryegrass)
Spray herbicide 5.1 15.4 5.1 kg CO2eq ha-1 spraying-1 (Lal 2004). Two desiccation sprayingsin NT (spring and autumn) and one post-emergence spraying in NT andCT (maize)
Sidedress fertilizer 3.3 3.3 3.3 kg CO2eq ha-1 application-1 (Lal 2004). One application to maize
Silage harvesting (maize) 71.9 71.9 71.9 kg CO2eq ha-1 harvesting-1 (Lal 2004)
Total operations 279.8 118.5
Inputs
Maize seeds 77.0 77.0 3.85 kg CO2eq kg-1 seed (West and Marland 2002). 20 kg seeds ha-1
Ryegrass seeds 59.4 59.4 1.98 kg CO2eq kg-1 seed (West and Marland 2002). 30 kg seeds ha-1
Fertilizer (maize) Nitrogen 786.5 786.5 4.77 kg CO2eq kg-1 N (Lal 2004). Application of 165 kg N ha-1
Phosphorus 58.7 58.7 0.73 kg CO2eq kg-1 P2O5 (Lal 2004). Application of 80 kg P2O5 ha-1.
Potassium 68.9 68.9 0.55 kg CO2eq kg-1 K2O (Lal 2004). Application of 125 kg K2O ha-1
Lime 391.2 391.2 0.59 kg CO2eq kg-1 lime (Lal 2004). Application of 2 Mg lime ha-1
every 3 years
Herbicide 1.5 56.8 23.1 kg CO2eq kg-1 herbicide a.i. (Lal 2004). Two desiccation sprayings(1.2 kg glyphosate a.i. ha-1 spraying-1) in NT (spring and autumn)and one post-emergency spraying in NT and CT (maize)(60 g nicosulfuron a.i. ha-1 spraying-1)
Total input 1,443.2 1,498.6
Total CO2 costs 1,723.0 1,617.1
Plant Soil (2012) 361:359–373 365

concentration and N2O emissions (data not shown),although the NH4
+ concentration might have affect-ed the N2O emission at some specific times, suchas the peak observed after application of fertilizer(Figs. 2a, 4a).
The NO3− concentration in the soil also increased after
application of fertilizer-N, reaching the highest concen-trations 12 days after application (79 mg N kg−1 in NTand 66 mg N kg−1 in CT, sampling 13) (Fig. 4b), but thisincrease was not as great as that observed for NH4
+
(Fig. 4a). From sampling 19 to 22, during the ryegrasscycle, the NO3
− concentration tended to be higher in NT,where it reached a concentration of 62 mg N kg−1 (sam-pling 22). As for NH4
+, the NO3− concentration show no
correlation with N2O emissions (data not shown).
Soil organic carbon
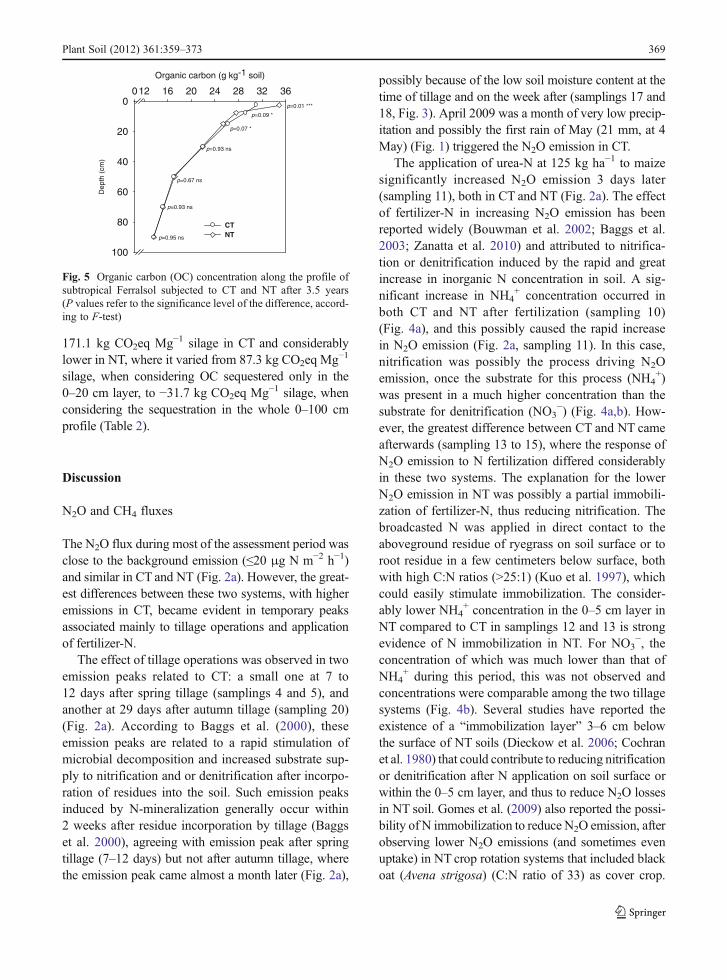
Significant differences in the concentration of OC be-tween tillage systems were observed up to 20-cm depth(Fig. 5). In the 0–5 cm layer, a higher OC concentration
occurred in NT than CT (35 vs 31 gkg−1) but theopposite was observed in 5–10 and 10–20 cm layers,where NT showed lower concentrations (Fig. 5).
In the 0–20 cm layer, there was a tendency, althoughnot significant (P00.36), for greater OC stocks in NT(67.20 Mg ha−1) than in CT (66.49 Mg ha−1) and so anOC sequestration of 0.20 Mg ha−1 year−1 in NT(Table 2). However, when integrating the whole 0–100 cm layer, the OC stocks in NT (234.61 Mg ha−1)were significantly larger (P00.01) than in CT(231.95 Mg ha−1), and here the difference leads to anOC sequestration rate of 0.76 Mg ha−1 year−1 in NTassuming CT as the baseline (Table 2).
Global warming potential
The net GWP of CT system was 2.90 MgCO2eq ha−1 year−1, and that was driven mainly bythe carbon costs of agronomic practices (59 %) andN2O emissions (39 %) (Table 2). The NT systememitted 1.26 kg N2O-N ha−1 year−1 and 1.08 kg
Sep
N2O
(µg
N m
-2 h
-1)
0
100
200
300
400
Oct Nov Apr May Jun Jul Aug Sep
Maizeplanting
SidedressN application
to maizeRyegrassplanting
1
5
10
1520
25 30***
***
* ******
** CTNT
* *
Springtillagein CT
AutumnTillage
in CT
a)
Sep
CH
4 (µ
g C
m-2 h
-1)
-100
-50
0
50
100
150
200
Oct Nov Apr May Jun Jul Aug Sep
Maizeplanting
Sidedress N applicationto maize
Ryegrassplanting
1 5
10
15
20
25 30*
**
***
***
CTNT
Springtillagein CT
Autumntillagein CT
b)
Fig. 2 a Nitrous oxide andb methane fluxes from asubtropical Ferralsol sub-jected to conventional tillage(CT) and no-till (NT), in amaize-ryegrass succession.Underlined numbers refersto the sampling identifica-tion. *P≤0.10, **P≤0.05,*** P≤0.01, according toF-test. No asterisk Differ-ence not significant
366 Plant Soil (2012) 361:359–373

Table 2 Nitrous oxide (N2O) and methane (CH4) emissions,organic carbon (OC) stocks, CO2 equivalent costs of agronomicpractices (operations and inputs), global warming potential
(GWP) and greenhouse gas intensity (GHGI) in a subtropicalFerralsol subjected to NT relative to CT
Parameter CT NT Δ (NT-CT)
Original measured data
N2O emission (kg Nha-1 year-1) 2.42 1.26 *P00.06 −1.16CH4 emission (kg Cha-1 year-1) 1.15 1.08 ns, P00.90 −0.07OC stock in 0–20 cm (Mg Cha-1) 66.49 67.20 ns, P00.36 0.71
OC stock in 0–100 cm (Mg Cha-1) 231.95 234.61 ***, P00.01 2.66
Global warming potential (data normalized to Mg CO2eq ha-1 year-1)
N2O emissiona 1.14 0.59 *, P00.06 −0.55CH4 emission b 0.04 0.04 ns, P00.90 0.00
OC sequestration in 0–20 cm c 0.00 −0.73 ns, P00.36 −0.73OC sequestration in 0–100 cm c 0.00 −2.79***, P00.01 −2.79CO2 equivalent costs of agronomic practices d 1.72 1.61 −0.11Net GWP in NT; 0–20 cm e 2.90 1.51 −1.39Net GWP in NT; 0–100 cm f 2.90 −0.55 −3.45Greenhouse gas intensity
Silage yield (Mg dry matter ha-1)g 16.95 17.33
GHGI; 0–20 cm (kg CO2eq Mg-1silage)h 171.1 87.3
GHGI; 0–100 cm (kg CO2eq Mg-1silage)i 171.1 −31.7
a Considering a global warming potential of 298 for N2Ob Considering a global warming potential of 25 for CH4
c Refers to the annual OC sequestration rate, considering CT as the baseline system and 3.5 years of experimental durationd Original information presented in Table 1e GWP (global warming potential), considering the OC sequestration rate in 0–20 cm depthf GWP (global warming potential), considering the OC sequestration rate in 0–100 cm depthg Average of four years (2005/2006; 2006/2007; 2007/2008 and 2008/2009)h Greenhouse gas intensity, given by GWP divided by silage yield, considering OC sequestration in 0–20 cmi Greenhouse gas intensity, given by GWP divided by silage yield, considering OC sequestration in 0–100 cm
Table 3 Physical properties in asubtropical Ferralsol subjectedto NT and CT systems
*P≤0.10, **P≤0.05 , *** P≤0.01 (F-test for significance ofthe difference between means inthe same column and for thesame soil layer). ns notsignificant
Tillage system Soil bulk density(Mg m-3)
Total porosity(m3 m-3)
Macro-porosity(m3 m-3)
Micro-porosity(m3 m-3)
0-5 cm
CT 1.09* 0.59* 0.18 ** 0.41***
NT 1.17 0.55 0.10 0.45
5-10 cm
CT 1.20 ns 0.55 ns 0.11 ns 0.44 ns
NT 1.23 0.54 0.11 0.43
10-20 cm
CT 1.22 ns 0.54 ns 0.12 ns 0.42 ns
NT 1.24 0.53 0.12 0.41
Plant Soil (2012) 361:359–373 367

CH4-C ha−1 year−1 and costs 1.61MgCO2eq ha−1 year−1
in agronomic practices (Table 2). Part of those emissionswas offset by a sequestration of 0.20Mg OC ha−1 year−1
(0.73 Mg CO2 ha−1 year−1) in the 0–20 cm layerand hence the net GWP in NT was 1.51 MgCO2eq ha−1 year−1 (Table 2), indicating a difference of−1.39Mg CO2eq ha
−1 year−1 relative to CT (the negativevalue implies a mitigation of 1.39 Mg CO2eq ha
−1 year−1
in NT compared to CT). However, when considering theOC sequestration in the whole 0–100 cm layer(0.76 Mg ha−1 year−102.79 Mg CO2 ha−1 year−1), thenet GWP of NT dropped to −0.55Mg CO2eq ha
−1 year−1
and the difference to CT was enlarged to −3.45 MgCO2eq ha−1 year−1 (Table 2).
Considering the maize silage yield in CT (16.95 MgDM ha−1) and NT (17.33 Mg DM ha−1), the GHGI was
Sep
WF
PS
(%
)
0
25
50
75
100
Oct Nov Apr May Jun Jul Aug Sep
Maizeplanting N application
to maizeRyegrassplanting
15 10
15 20
2530
CTNT
Springtillagein CT Autumn
tillagein CT
Fig. 3 Water-filled porespace (WFPS) in the 0–5 cm layer of a subtropicalFerralsol subjected to con-ventional tillage (CT) andno-till (NT), in a maize-ryegrass succession. Under-lined numbers refers tosampling identification
Sep
NH
4+ (m
g N
kg
-1 s
oil)
0
100
200
300
Maizeplanting
SidedressN applicationto maize
Ryegrassplanting
1
5
10
15
20 25
30
CTNT
SpringTillagein CT
AutumnTillagein CT
a)
Sep
NO
3- (m
g N
kg
-1 s
oil)
0
100
200
300
Oct Nov Apr May Jun Jul Aug Sep
Oct Nov Apr May Jun Jul Aug Sep
Maizeplanting
SidedressN applicationto maize
Ryegrassplanting
1
5
10 15
2025
30
CTNT
Springtillagein CT
Autumntillagein CT
b)
Fig. 4 Inorganic nitrogenconcentrations, a NH4
+ andb NO3
−, in the 0–5 cm layerof a subtropical Ferralsolsubjected to conventionaltillage (CT) and no-till (NT),in a maize-ryegrass succes-sion. Underlined numbersrefers to the sampling iden-tifications. The differencesbetween tillage systemswere not significant accord-ing to F-test (P≤0.10)
368 Plant Soil (2012) 361:359–373
171.1 kg CO2eq Mg−1 silage in CT and considerablylower in NT, where it varied from 87.3 kg CO2eq Mg−1
silage, when considering OC sequestered only in the0–20 cm layer, to −31.7 kg CO2eq Mg−1 silage, whenconsidering the sequestration in the whole 0–100 cmprofile (Table 2).
Discussion
N2O and CH4 fluxes
The N2O flux during most of the assessment period wasclose to the background emission (≤20 μg N m−2 h−1)and similar in CT and NT (Fig. 2a). However, the great-est differences between these two systems, with higheremissions in CT, became evident in temporary peaksassociated mainly to tillage operations and applicationof fertilizer-N.
The effect of tillage operations was observed in twoemission peaks related to CT: a small one at 7 to12 days after spring tillage (samplings 4 and 5), andanother at 29 days after autumn tillage (sampling 20)(Fig. 2a). According to Baggs et al. (2000), theseemission peaks are related to a rapid stimulation ofmicrobial decomposition and increased substrate sup-ply to nitrification and or denitrification after incorpo-ration of residues into the soil. Such emission peaksinduced by N-mineralization generally occur within2 weeks after residue incorporation by tillage (Baggset al. 2000), agreeing with emission peak after springtillage (7–12 days) but not after autumn tillage, wherethe emission peak came almost a month later (Fig. 2a),
possibly because of the low soil moisture content at thetime of tillage and on the week after (samplings 17 and18, Fig. 3). April 2009 was a month of very low precip-itation and possibly the first rain of May (21 mm, at 4May) (Fig. 1) triggered the N2O emission in CT.
The application of urea-N at 125 kg ha−1 to maizesignificantly increased N2O emission 3 days later(sampling 11), both in CT and NT (Fig. 2a). The effectof fertilizer-N in increasing N2O emission has beenreported widely (Bouwman et al. 2002; Baggs et al.2003; Zanatta et al. 2010) and attributed to nitrifica-tion or denitrification induced by the rapid and greatincrease in inorganic N concentration in soil. A sig-nificant increase in NH4
+ concentration occurred inboth CT and NT after fertilization (sampling 10)(Fig. 4a), and this possibly caused the rapid increasein N2O emission (Fig. 2a, sampling 11). In this case,nitrification was possibly the process driving N2Oemission, once the substrate for this process (NH4
+)was present in a much higher concentration than thesubstrate for denitrification (NO3
−) (Fig. 4a,b). How-ever, the greatest difference between CT and NT cameafterwards (sampling 13 to 15), where the response ofN2O emission to N fertilization differed considerablyin these two systems. The explanation for the lowerN2O emission in NT was possibly a partial immobili-zation of fertilizer-N, thus reducing nitrification. Thebroadcasted N was applied in direct contact to theaboveground residue of ryegrass on soil surface or toroot residue in a few centimeters below surface, bothwith high C:N ratios (>25:1) (Kuo et al. 1997), whichcould easily stimulate immobilization. The consider-ably lower NH4
+ concentration in the 0–5 cm layer inNT compared to CT in samplings 12 and 13 is strongevidence of N immobilization in NT. For NO3
−, theconcentration of which was much lower than that ofNH4
+ during this period, this was not observed andconcentrations were comparable among the two tillagesystems (Fig. 4b). Several studies have reported theexistence of a “immobilization layer” 3–6 cm belowthe surface of NT soils (Dieckow et al. 2006; Cochranet al. 1980) that could contribute to reducing nitrificationor denitrification after N application on soil surface orwithin the 0–5 cm layer, and thus to reduce N2O lossesin NT soil. Gomes et al. (2009) also reported the possi-bility of N immobilization to reduce N2O emission, afterobserving lower N2O emissions (and sometimes evenuptake) in NT crop rotation systems that included blackoat (Avena strigosa) (C:N ratio of 33) as cover crop.
Organic carbon (g kg-1 soil)
012 16 20 24 28 32 36D
epth
(cm
)0
20
40
60
80
100
p=0.95 ns
p=0.93 ns
p=0.67 ns
p=0.93 ns
p=0.07 *
p=0.01 ***
p=0.09 *
NTCT
Fig. 5 Organic carbon (OC) concentration along the profile ofsubtropical Ferralsol subjected to CT and NT after 3.5 years(P values refer to the significance level of the difference, accord-ing to F-test)
Plant Soil (2012) 361:359–373 369

Additionally, these authors suggest that immobilizationwould be useful to reach a better synchrony betweeninorganic N availability in soil and plant N uptake.
No correlation was observed between N2O emis-sion rates and NH4
+ concentrations (data not shown),although the NH4
+ concentration might have affectedN2O emission at some specific times, e.g., the peakobserved after fertilizer application (Figs. 2a, 4a). Partof the reason for this lack of correlation can be related tothe delay between the presence of NH4
+ in soil and itseffect in N2O emission. The highest NH4
+ concentra-tions in soil (samplings 11 and 12, Fig. 4a) were ob-served to precede the N2O emission peak (samplings 14and 15, Fig. 2a) by about 10–14 days.
Results from the study of Rochette (2008) pointtoward comparable emissions in CT and NT whensoils are well aerated. In our study, however, theWFPS was always higher in NT than in CT. Thissuggests a less aerated condition in NT but, as reportedearlier, this was not expressed in higher N2O emissionin NT than CT. The lack of correlation between WFPSand N2O emission rates thus shows that soil moisturewas not as important a controlling factor of N2Oemissions. In the similar subtropical conditions ofSouthern Brazil, Jantalia et al. (2008) also found norelationship between WFPS and N2O emission.
Regarding CH4 fluxes, soil served as a sink duringmost of the assessment period, but the significant emis-sion in May (Fig. 2b) turned the overall annual flux intopositive emission, both in CT and NT (Table 2). Noplausible explanation could be offered for this unexpect-ed CH4 emission peak. In a study in the BrazilianCerrado, Metay et al. (2007) also observed that soilwas a CH4 source, either in CT or NT, although slightlylower in NT (0.25 vs 0.40 kg CH4-C ha−1 year−1). Usu-ally, agricultural aerobic soils are regarded as importantCH4 sinks (Powlson et al. 1997) and CH4 oxidizingactivity is reported to be higher in NT than in CT(Hütsch 1998). So, the positive annual CH4 emissionin this study (Table 2) should be interpreted with cau-tion, since it might have been skewed because of theunexpected and significant emission peak of May. De-spite this, the observed CH4 emission did not representmore than 5 % of the N2O emission, in CO2eq units.
Organic carbon stocks
The total OC stock in the 0–20 cm layer was notsignificantly different (P00.36) between CT
(66.49 Mg OC ha−1) and NT (67.20 Mg OC ha−1)(Table 2), suggesting that inversion and OC redistri-bution occurred within the tilled layer of CT soil(Angers and Eriksen-Hamel 2008; Angers et al.1997). Nonetheless, there was a tendency towardshigher stock in NT soil.
The OC concentration in layers below 20-cm depthwas slightly higher in NT than CTand when integratingthe whole 0–100 cm profile, the total OC stock wassignificantly higher (P00.01) in NT than CT (Table 2).The difference of 2.66 Mg OC ha−1 accumulated in NTup to 100-cm during the 3.5 years of experimentalduration denotes therefore an OC accumulation rate of0.76Mg ha−1 year−1 (2.79MgCO2 ha
−1 year−1), and thepotential of the NT system to contribute to global warm-ing mitigation by soil OC sequestration (Franzluebbers2010; Dieckow et al. 2009; Zanatta et al. 2007; Vieira etal. 2009; Sá et al. 2009). The combination of root maizecontribution to C input (Eghball and Maranville 1993)and the benefits of NT in allowing deep root develop-ment (lack of subsurface compacted layer) might ex-plain OC sequestration. This accumulation rate fallswithin the range of 0.5 to 1.5 Mg OC ha−1 year−1 forNT soils in subtropical Brazil, according to estimates byBoddey et al. (2010), after considering OC stocks mea-sured up to 100 cm depth. Therefore, the OC assessmentup to 100-cm depth seemed to be a more appropriatemethodology to quantify the effects of tillage systemsand the benefits of NT (Boddey et al. 2010; Sisti et al.2004; Diekow et al. 2005).
Global warming potential
There are concerns about the possibility of N2O emissionoffsetting the gains of soil OC accumulation in NT (Li etal. 2005; Gregorich et al. 2005), but this was not the casein the current study. NT showed a significant contribu-tion tomitigating global warming, both by loweringN2Oemission and by promoting soil OC accumulation, sothat the net GWP in NT (−0.55 Mg CO2eq ha−1 year−1)was −3.45 Mg CO2eq ha
−1 year−1 lower than that of CT(2.90 Mg CO2eq ha
−1 year−1 in CT). The OC sequestra-tion represented 84 % of this reduction in GWP, beingthus the main driving factor of mitigation in NT.
For major US cropping systems, Del Grosso et al.(2005) estimated net GWP values of 1.58, 1.06 and−0.55 Mg CO2eq ha−1 year−1 under CT, NT and fornative systems, respectively. The same trend had al-ready been observed by Robertson et al. (2000), in a
370 Plant Soil (2012) 361:359–373

study in Michigan, where GWP was higher in CT andalmost neutral in NT (1.14 vs 0.14 CO2eq ha−1 year−1).In our study, we found a negative GWP for NT(−0.55 Mg CO2eq ha−1 year−1) when considering OCchanges in the 0–100 cm, which indicates true mitigationof this system in acting as a net sink of greenhouse gases.
The particularities of the cropping system of thisstudy, based only on grass-species of maize and ryegrass(cover crop), could have contributed to the lower emis-sion results for NT. The root additions by maize (shootwas removed for silage) and ryegrass shoot and rootsurely contributed to OC accumulation in NT soil andsince both species demand appreciable amounts of Nand produce high C:N residues that potentially immo-bilize inorganic N in NT soil, the chances of N beingprone to losses as N2O are lower throughout the year.
In spite of that, most of the 0.59Mg CO2eq ha−1 year−1
emitted as N2O in NT (Table 2) was possibly relatedto N fertilizer application, as seen by the flux incre-ment after sidedress (Fig. 2). This, together with thefact that almost half of the 1.61 Mg CO2eq ha−1 year−1
of costs in NT was also due to N fertiliser (Table 1),highlights the significant role of production and appli-cation of synthetic N in causing gaseous emissions,which reinforces the necessity of establishing bestmanagement strategies for this nutrient element.
With respect to the GHGI, this is an indicator of howmuch a management system emits to produce one unit ofgrain or dry matter (Mosier et al. 2006). In this study,maize was not for grain but for silage production, and sodry matter of silage was used to calculate GHGI. Toproduce 1 Mg silage, the CT system emitted 171.1 kgCO2eq ha−1 year−1 (Table 2), while nearly half of thatwas emitted in NT (87.3 kg CO2eq ha
−1 year−1), consid-ering the OC sequestration in 0–20 cm. When consider-ing the OC sequestration in the whole 0–100 cm, insteadof emitting, NTmitigated 31.7 kg CO2eq ha
−1 year−1 pereach megagram of silage and thus can be considered asustainable system from the point of view of balancingagricultural production with global warming mitigation.
A final point to be addressed, however, is that theGWP reduction of −3.45 Mg CO2eq ha
−1 year−1 in NTcompared to CT will not remain constant indefinitelybut may possibly decrease over time. This is becausethe soil capacity to store carbon under a certain man-agement condition is finite, so that the accumulationrate decreases over time. However, Six et al. (2004)indicated a reduction of N2O emission in soils underlong-term NT management (>10 years), which could
counterbalance the OC accumulation decrease. Moreeffort should be placed therefore on elucidating thistime-dependency of tillage effects on greenhouse gasbalance in agroecosystems.
Conclusions
Our findings show that, relative to CT, NT manage-ment in this subtropical Brazilian Ferralsol can reducethe emission of N2O from soil, disagreeing with sev-eral previous works showing the contrary. Besides, ourfindings confirmed that NT is an efficient managementsystem that promotes soil OC sequestration up to 1 mdeep. After considering N2O and CH4 fluxes, soil OCchanges and equivalent C costs of agronomic practi-ces, we conclude that NT has a lower GWP and GHGIrelative to conventionally tilled soil, and contributes tomitigating greenhouse gas emissions.
Acknowledgments The authors thank CNPq (National Councilof Scientific and Technological Development), for providing fi-nancial support to the study (Grants Universal 476613/2009-4,Universal 478000/2009-0 and Repensa 555563/2010-3) andscholarships to J.T.P. (MSc), J.D. (PQ), C.B. (PQ), A.M. (PQ),M.T. (Post-Doc) andM.P. (IC); and Luis Carlos Costa, for helpingin field activities.
References
Angers DA, Eriksen-Hamel NS (2008) Full-inversion tillage andorganic carbon distribution in soil profiles: a meta-analysis.Soil Sci Soc Am J 72(5):1370–1374
Angers DA, Bolinder MA, Carter MR, Gregorich EG, DruryCF, Liang BC, Voroney RP, Simard RR, Donald RG,Beyaert RP, Martel J (1997) Impact of tillage practices onorganic carbon and nitrogen storage in cool, humid soils ofeastern Canada. Soil Tillage Res 41(3–4):191–201
Baggs EM, Rees RM, Smith KA, Vinten AJA (2000) Nitrousoxide emission from soils after incorporating crop residues.Soil Use Manag 16(2):82–87
Baggs EM, Stevenson M, Pihlatie M, Regar A, Cook H,Cadisch G (2003) Nitrous oxide emissions following ap-plication of residues and fertiliser under zero and conven-tional tillage. Plant Soil 254(2):361–370
Ball BC, Scott A, Parker JP (1999) Field N2O, CO2 and CH4
fluxes in relation to tillage, compaction and soil quality inScotland. Soil Tillage Res 53(1):29–39
Bayer C, Martin-Neto L, Mielniczuk J, Pavinato A, Dieckow J(2006) Carbon sequestration in two Brazilian Cerrado soilsunder no-till. Soil Tillage Res 86(2):237–245
Boddey RM, Jantalia CP, Conceição PC, Zanatta JA, Bayer C,Mielniczuk J, Dieckow J, Santos HP, Denardin JE, Aita C,Giacomini SJ, Alves BJR, Urquiaga S (2010) Carbon
Plant Soil (2012) 361:359–373 371

accumulation at depth in Ferralsols under zero-till subtrop-ical agriculture. Glob Change Biol 16:784–795
Bouwman AF, Boumans LJM, Batjes NH (2002) Emissions ofN2O and NO from fertilized fields: summary of availablemeasurement data. Glob Biogeochem Cycle 16(4):1058.doi:10.1029/2001GB001811
Carmo JB, Neill C, Garcia-Montiel DC, Piccolo MD, Cerri CC,Steudler PA, Andrade CA, Passianoto CC, Feigl BJ, MelilloJM (2005) Nitrogen dynamics during till and no-till pasturerestoration sequences in Rondônia, Brazil. Nutr Cycl Agro-ecosyst 71(3):213–225
Carvalho JLN, Cerri CEP, Feigl BJ, Piccolo MC, Godinho VP,Cerri CC (2009) Carbon sequestration in agricultural soilsin the Cerrado region of the Brazilian Amazon. Soil TillageRes 103(2):342–349
Caviglione JH, Kiihl LRB, Caramori PH, Oliveira D (2000)Cartas climáticas do Paraná. Iapar, Londrina
Chatskikh D, Olesen JE (2007) Soil tillage enhanced CO2 andN2O emissions from loamy sand soil under spring barley.Soil Tillage Res 97(1):5–18
Cochran VL, Elliott LF, Papendick RI (1980) Carbon and nitro-gen movement from surface applied wheat (Triticum aes-tivum) straw. Soil Sci Soc Am J 44(5):978–982
Dalal RC, Allen DE (2008) Greenhouse gas fluxes from naturalecosystems. Aust J Bot 56(5):369–407
Danielson RE, Sutherland PL (1986) Porosity. In: Klute A (ed)Methods of soil analysis—part 1: physical and mineralog-ical methods. SSSA, Madison, pp 443–461
Del Grosso SJ, Mosier AR, Parton WJ, Ojima DS (2005) DAY-CENT model analysis of past and contemporary soil N2Oand net greenhouse gas flux for major crops in the USA.Soil Tillage Res 83(1):9–24
Derpsch R, Roth CH, Sidiras N, Köpke U (1991) Controle daErosão no Paraná, Brasil: sistemas de cobertura do solo,plantio direto e preparo conservacionista do solo. In. Deut-sche Gesellschaft fur Technische Zusammenarbeit,Eschborn
Dieckow J, Meurer EJ, Salet RL (2006) Nitrogen applicationtiming and soil inorganic nitrogen dynamics under no-tilloat/maize sequential cropping. Rev Bras Ci Solo 30(4):707–714
Dieckow J, Bayer C, Conceicao PC, Zanatta JA, Martin-Neto L,Milori DBM, Salton JC,MacedoMM,Mielniczuk J, HernaniLC (2009) Land use, tillage, texture and organic matter stockand composition in tropical and subtropical Brazilian soils.Eur J Soil Sci 60(2):240–249
Diekow J, Mielniczuk J, Knicker H, Bayer C, Dick DP, Kogel-Knabner I (2005) Soil C and N stocks as affected bycropping systems and nitrogen fertilisation in a southernBrazil Acrisol managed under no-tillage for 17 years. SoilTillage Res 81(1):87–95
Eghball B, Maranville JW (1993) Root development and nitro-gen influx of corn genotypes grown under combineddrought and nitrogen stresses. Agron J 85(1):147–152
Embrapa (2006) Sistema Brasileiro de Classificação de Solos.Centro Nacional de Pesquisa de Solos (Embrapa Solos),Rio de Janeiro
Escobar LF, Amado TJC, Bayer C, Chavez LF, Zanatta JA,Fiorin JE (2010) Postharvest nitrous oxide emissions froma subtropical Oxisol as influenced by summer crop residuesand their management. Rev Bras Ci Solo 34(2):507–516
Franzluebbers AJ (2010) Achieving soil organic carbon seques-tration with conservation agricultural systems in the South-eastern United States. Soil Sci Soc Am J 74(2):347–357
Frimpong KA, Baggs EM (2010) Do combined applications ofcrop residues and inorganic fertilizer lower emission ofN2O from soil? Soil Use Manag 26(4):412–424
Gomes J, Bayer C, Costa FD, Piccolo MD, Zanatta JA, VieiraFCB, Six J (2009) Soil nitrous oxide emissions in long-term cover crops-based rotations under subtropical climate.Soil Tillage Res 106(1):36–44
Gregorich EG, Rochette P, van den Bygaart AJ, Angers DA(2005) Greenhouse gas contributions of agricultural soilsand potential mitigation practices in Eastern Canada. SoilTillage Res 83(1):53–72
Gregorich EG, Rochette P, St-Georges P, McKim UF, Chan C(2008) Tillage effects on N2O emission from soils undercorn and soybeans in Eastern Canada. Can J Soil Sci 88(2):153–161
Hütsch BW (1998) Tillage and land use effects on methaneoxidation rates and their vertical profiles in soil. Biol FertilSoils 27(3):284–292
IPCC (2007) Climate Change 2007: The Physical Science Basis.Contribution of Working Group I to the Fourth AssessmentReport of the Intergovernmental Panel on Climate Change. In:Solomon S, Qin D, Manning M, Chen Z, Marquis M, AverytKB, Tignor M, Miller HL (eds). Cambridge University Press,Cambridge, UK
IUSS (2006) World Reference Base for Soil Resources 2006(World Soil Resources Reports No. 103). FAO, Rome
Jantalia CP, Santos HP, Urquiaga S, Boddey RM, Alves BJR(2008) Fluxes of nitrous oxide from soil under differentcrop rotations and tillage systems in the South of Brazil.Nutr Cycl Agroecosyst 82(2):161–173
Kuo S, Sainju UM, Jellum EJ (1997) Winter cover cropping influ-ence on nitrogen in soil. Soil Sci Soc Am J 61(5):1392–1399
Lal R (2004) Carbon emission from farm operations. EnvironInt 30(7):981–990
Leamer RW, Shaw B (1941) A simple apparatus for measuringnoncapillary porosity on an extensive scale. J Am SocAgron 33:1003–1008
Le Mer J, Roger P (2001) Production, oxidation, emission andconsumption of methane by soils: a review. Eur J Soil Biol37(1):25–50
Li CS, Frolking S, Butterbach-Bahl K (2005) Carbon sequestra-tion in arable soils is likely to increase nitrous oxide emis-sions, offsetting reductions in climate radiative forcing. ClimChange 72(3):321–338
MacKenzie AF, Fan MX, Cadrin F (1997) Nitrous oxide emis-sion as affected by tillage, corn-soybean-alfalfa rotationsand nitrogen fertilization. Can J Soil Sci 77(2):145–152
Malhi SS, Lemke R, Wang ZH, Chhabra BS (2006) Tillage,nitrogen and crop residue effects on crop yield, nutrientuptake, soil quality, and greenhouse gas emissions. SoilTillage Res 90(1–2):171–183
Metay A, Oliver R, Scopel E, Douzet JM, Alves Moreira JA,Maraux F, Feigl BJ, Feller C (2007) N2O and CH4 emis-sions from soils under conventional and no-till manage-ment practices in Goiania (Cerrados, Brazil). Geoderma141:78–88
Mosier AR (1989) Chamber and isotope techniques. In:Andreae MO, Schimel DS (eds) Exchange of traces gases
372 Plant Soil (2012) 361:359–373
between terrestrial ecosystems and the atmosphere: reportof the Dahlem Workshop. Wiley, Berlin, pp 175–187
Mosier AR, Halvorson AD, Peterson GA, Robertson GP, SherrodL (2005) Measurement of net global warming potential inthree agroecosystems. Nutr Cycl Agroecosyst 72(1):67–76
Mosier AR, Halvorson AD, Reule CA, Liu XJJ (2006) Netglobal warming potential and greenhouse gas intensity inirrigated cropping systems in northeastern Colorado. JEnviron Qual 35(4):1584–1598
Mulvaney RL (1996) Nitrogen - Inorganic forms. In: SparksDL, Page AL, Helmke PA et al (eds) Methods of soilanalysis: part 3 chemical methods. Soil Science Societyof America, Madison, pp 1123–1184
Mutegi JK, Munkholm LJ, Petersen BM, Hansen EM, PetersenSO (2010) Nitrous oxide emissions and controls as influ-enced by tillage and crop residue management strategy.Soil Biol Biochem 42(10):1701–1711
Parkin T, Mosier A, Smith J, Venterea R, Johnson J, Reicosky D,Doyle G, McCarty G, Baker J (2003) Chamber-based tracegas flux measurement protocol. USDA-ARS GRACEnet
Passianoto CC, Ahrens T, Feigl BJ, Steudler PA, do Carmo JB,Melillo JM (2003) Emissions of CO2, N2O, and NO inconventional and no-till management practices in Rondo-nia, Brazil. Biol Fertil Soils 38(3):200–208
Petersen SO, Mutegi JK, Hansen EM, Munkholm LJ (2011)Tillage effects on N2O emissions as influenced by a wintercover crop. Soil Biol Biochem 43(7):1509–1517
Powlson DS, Goulding KWT, Willison TW, Webster CP, HutschBW (1997) The effect of agriculture on methane oxidationin soil. Nutr Cycl Agroecosyst 49(1–3):59–70
Robertson GP, Grace PR (2004) Greenhouse gas fluxes intropical and temperate agriculture: The need for a full-cost accounting of global warming potentials. EnvironDev Sustain 6(1–2):51–63
Robertson GP, Paul EA, Harwood RR (2000) Greenhouse gasesin intensive agriculture: contributions of individual gases tothe radiative forcing of the atmosphere. Science 289(5486):1922–1925
Rochette P (2008) No-till only increases N2O emissions inpoorly-aerated soils. Soil Tillage Res 101(1–2):97–100
Sá JCM, Cerri CC, Lal R, Dick WA, Piccolo MD, Feigl BE(2009) Soil organic carbon and fertility interactions affect-ed by a tillage chronosequence in a Brazilian Oxisol. SoilTillage Res 104(1):56–64
Sisti CPJ, Santos HP, Kohhann R, Alves BJR, Urquiaga S,Boddey RM (2004) Change in carbon and nitrogen stocksin soil under 13 years of conventional or zero tillage insouthern Brazil. Soil Tillage Res 76(1):39–58
Six J, Ogle SM, Breidt FJ, Conant RT, Mosier AR, Paustian K(2004) The potential to mitigate global warming with no-tillage management is only realized when practised in thelong term. Glob Change Biol 10(2):155–160
Ussiri DAN, Lal R, Jarecki MK (2009) Nitrous oxide andmethane emissions from long-term tillage under a contin-uous corn cropping system in Ohio. Soil Tillage Res 104(2):247–255
Vieira FCB, Bayer C, Zanatta JA, Mielniczuk J, Six J (2009)Building up organic matter in a Subtropical Paleudult un-der legume cover-crop-based rotations. Soil Sci Soc Am J73(5):1699–1706
West TO, Marland G (2002) A synthesis of carbon sequestra-tion, carbon emissions, and net carbon flux in agriculture:comparing tillage practices in the United States. AgricEcosyst Environ 91(1–3):217–232
West TO, Post WM (2002) Soil organic carbon sequestrationrates by tillage and crop rotation: a global data analysis.Soil Sci Soc Am J 66(6):1930–1946
Zanatta JA, Bayer C, Dieckow J, Vieira FCB, Mielniczuk J(2007) Soil organic carbon accumulation and carbon costsrelated to tillage, cropping systems and nitrogen fertiliza-tion in a subtropical Acrisol. Soil Tillage Res 94(2):510–519
Zanatta JA, Bayer C, Vieira FCB, Gomes J, Tomazi M (2010)Nitrous oxide and methane fluxes in South Brazilian Gley-sol as affected by nitrogen fertilizers. Rev Bras Ci Solo 34(5):1653–1665
Plant Soil (2012) 361:359–373 373