Carbon accumulation at depth in Ferralsols under zero-till subtropical agriculture
12
Carbon accumulation at depth in Ferralsols under zero-till subtropical agriculture ROBERT M. BODDEY * , CLAUDIA P. JANTALIA *, PAULO C. CONCEIC ¸A ˜ O w , JOSILEIA A. ZANATTA w , CIME ´ LIO BAYER w , JOA ˜ O MIELNICZUK w , JEFERSON DIECKOW z , HENRIQUE P. DOS SANTOS§, JOSE ´ E. DENARDIN§, CELSO AITA } , SANDRO J. GIACOMINI } , BRUNO J.R. ALVES * andSEGUNDOURQUIAGA * *Embrapa Agrobiologia, km 47, Antiga Rodovia Rio – Sa ˜o Paulo, Serope ´dica, 23890-000, RJ, Brazil, wDepartment of Soil Science, Federal University of Rio Grande do Sul, PO Box 15100, 91.501-970 Porto Alegre, RS, Brazil, zDepartment of Soil Science and Agricultural Engineering, Federal University of Parana ´, 80.035-050 Curitiba, PR, Brazil, §Embrapa Wheat Research Centre, Caixa Postal 569, Passo Fundo, 99001-970, RS, Brazil, }Department of Soil Science, Federal University of Santa Maria, Faixa de Camobi, km 9, 97105-900, Santa Maria, RS, Brazil Abstract Conservation agriculture can provide a low-cost competitive option to mitigate global warming with reduction or elimination of soil tillage and increase soil organic carbon (SOC). Most studies have evaluated the impact of zero till (ZT) only on surface soil layers (down to 30 cm), and few studies have been performed on the potential for C accumula- tion in deeper layers (0–100 cm) of tropical and subtropical soils. In order to determine whether the change from conventional tillage (CT) to ZT has induced a net gain in SOC, three long-term experiments (15–26 years) on free-draining Ferralsols in the subtropical region of South Brazil were sampled and the SOC stocks to 30 and 100 cm calculated on an equivalent soil mass basis. In rotations containing intercropped or cover-crop legumes, there were significant accumulations of SOC in ZT soils varying from 5 to 8 Mg ha 1 in comparison with CT management, equivalent to annual soil C accumulation rates of between 0.04 and 0.88 Mg ha 1 . However, the potential for soil C accumulation was considerably increased (varying from 0.48 to 1.53 Mg ha 1 yr 1 ) when considering the soil profile down to 100 cm depth. On average the estimate of soil C accumulation to 100 cm depth was 59% greater than that for soil C accumulated to 30 cm. These findings suggest that increasing sampling depth from 30 cm (as presently recommended by the IPCC) to 100 cm, may increase substantially the estimates of potential CO 2 mitigation induced by the change from CT to ZT on the free-draining Ferralsols of the tropics and subtropics. It was evident that that legumes which contributed a net input of biologically fixed N played an important role in promoting soil C accumulation in these soils under ZT, perhaps due to a slow-release of N from decaying surface residues/roots which favored maize root growth. Keywords: carbon sequestration, conventional tillage, crop rotations, Ferralsol, legume cover crops, maize, soil depth, soybean, zero tillage Received 29 January 2009; revised version received 25 May 2009 and accepted 3 June 2009 Introduction For the last decade or so a general consensus has reigned, especially in the United States, that a change from conventional tillage (CT) to zero tillage (ZT) would lead to a net accumulation of soil carbon (West & Post, 2002; Lal, 2003; Lal et al., 2003). In a review of 275 comparisons at different sites around the world (mostly in North America) of reduced, or zero, tillage with CT, West & Post (2002) found that, on average, stocks of carbon (C) in the soil were increased by 57 g m 2 yr 1 (570 kg C ha 1 yr 1 ) under reduced til- lage/ZT compared with CT. However, recently this conclusion has been challenged by Baker et al. (2007) Correspondence: Robert M. Boddey, tel. 1 55 21 2682 1427 or 1 55 21 8703 1411, fax 1 55 21 3441 1230, e-mail: [email protected] Global Change Biology (2010) 16, 784–795, doi: 10.1111/j.1365-2486.2009.02020.x 784 r 2009 Blackwell Publishing Ltd
Transcript of Carbon accumulation at depth in Ferralsols under zero-till subtropical agriculture
Carbon accumulation at depth in Ferralsols under zero-tillsubtropical agriculture
R O B E R T M . B O D D E Y *, C L A U D I A P. J A N T A L I A *, PA U L O C . C O N C E I C A O w , J O S I L E I A A .
Z A N A T T A w , C I M E L I O B AY E R w , J O A O M I E L N I C Z U K w , J E F E R S O N D I E C K O W z,H E N R I Q U E P. D O S S A N T O S § , J O S E E . D E N A R D I N § , C E L S O A I T A } , S A N D R O J .
G I A C O M I N I } , B R U N O J . R . A LV E S * and S E G U N D O U R Q U I A G A *
*Embrapa Agrobiologia, km 47, Antiga Rodovia Rio – Sao Paulo, Seropedica, 23890-000, RJ, Brazil, wDepartment of Soil Science,
Federal University of Rio Grande do Sul, PO Box 15100, 91.501-970 Porto Alegre, RS, Brazil, zDepartment of Soil Science and
Agricultural Engineering, Federal University of Parana, 80.035-050 Curitiba, PR, Brazil, §Embrapa Wheat Research Centre, Caixa
Postal 569, Passo Fundo, 99001-970, RS, Brazil, }Department of Soil Science, Federal University of Santa Maria, Faixa de Camobi,
km 9, 97105-900, Santa Maria, RS, Brazil
Abstract
Conservation agriculture can provide a low-cost competitive option to mitigate global
warming with reduction or elimination of soil tillage and increase soil organic carbon
(SOC). Most studies have evaluated the impact of zero till (ZT) only on surface soil layers
(down to 30 cm), and few studies have been performed on the potential for C accumula-
tion in deeper layers (0–100 cm) of tropical and subtropical soils. In order to determine
whether the change from conventional tillage (CT) to ZT has induced a net gain in SOC,
three long-term experiments (15–26 years) on free-draining Ferralsols in the subtropical
region of South Brazil were sampled and the SOC stocks to 30 and 100 cm calculated on
an equivalent soil mass basis. In rotations containing intercropped or cover-crop
legumes, there were significant accumulations of SOC in ZT soils varying from 5 to
8 Mg ha�1 in comparison with CT management, equivalent to annual soil C accumulation
rates of between 0.04 and 0.88 Mg ha�1. However, the potential for soil C accumulation
was considerably increased (varying from 0.48 to 1.53 Mg ha�1 yr�1) when considering the
soil profile down to 100 cm depth. On average the estimate of soil C accumulation to
100 cm depth was 59% greater than that for soil C accumulated to 30 cm. These findings
suggest that increasing sampling depth from 30 cm (as presently recommended by the
IPCC) to 100 cm, may increase substantially the estimates of potential CO2 mitigation
induced by the change from CT to ZT on the free-draining Ferralsols of the tropics and
subtropics. It was evident that that legumes which contributed a net input of biologically
fixed N played an important role in promoting soil C accumulation in these soils under
ZT, perhaps due to a slow-release of N from decaying surface residues/roots which
favored maize root growth.
Keywords: carbon sequestration, conventional tillage, crop rotations, Ferralsol, legume cover crops,
maize, soil depth, soybean, zero tillage
Received 29 January 2009; revised version received 25 May 2009 and accepted 3 June 2009
Introduction
For the last decade or so a general consensus has
reigned, especially in the United States, that a change
from conventional tillage (CT) to zero tillage (ZT)
would lead to a net accumulation of soil carbon (West
& Post, 2002; Lal, 2003; Lal et al., 2003). In a review of
275 comparisons at different sites around the world
(mostly in North America) of reduced, or zero, tillage
with CT, West & Post (2002) found that, on average,
stocks of carbon (C) in the soil were increased by
57 g m�2 yr�1 (570 kg C ha�1 yr�1) under reduced til-
lage/ZT compared with CT. However, recently this
conclusion has been challenged by Baker et al. (2007)
Correspondence: Robert M. Boddey, tel. 1 55 21 2682 1427 or 1 55
21 8703 1411, fax 1 55 21 3441 1230, e-mail:
Global Change Biology (2010) 16, 784–795, doi: 10.1111/j.1365-2486.2009.02020.x
784 r 2009 Blackwell Publishing Ltd

who pointed out that in none of the trials was the soil
sampled to a depth 430 cm, and in 68% of the com-
parisons, to 20 cm or less. These authors presented
evidence that in studies, particularly in Canada (Van-
denBygaart et al., 2003) where soils had been sampled to
greater depths, more C was found at depth under CT,
suggesting that the apparent soil C accumulation under
ZT was an artifact of the sampling depth. The same
conclusion was made by Blanco-Canqui & Lal (2008)
from studies at 11 sites in three States of the USA,
although these were on-farm studies and the crop
sequences and management practices in the compari-
sons were not identical.
Adoption of ZT in Brazil has been widespread such
that today over 27 Mha of mechanized crop production
uses this system and the soils in most of this area are
free-draining Ferralsols. A considerable number of
studies on medium- to long-term field experiments
have been published. Most of the earlier studies per-
formed in southern Brazil also sampled the soil to
o30 cm depth and in most cases soil C concentration
or stocks were considerably higher under ZT that
under CT after more than 5 years of the different crop
rotations (Sidiras & Pavan, 1985; Bayer & Mielniczuk,
1997; Bayer & Bertol, 1999; Bayer et al., 2000; Amado
et al., 2001).
In a study in Parana (southern region), Sa et al. (2001)
found that the difference in soil C stocks between ZT
and CT were 23% higher when the soil was sampled to
40 cm rather than 20 cm depth, but these results were
obtained from a chronosequence as opposed to more-
reliable long-term plot experiments. On the other hand,
two studies performed in the tropical central-savanna
(Cerrado) region of Brazil (Centurion et al., 1985; Cor-
azza et al., 1999), showed that while soil C stocks under
ZT were higher than under CT in the surface 0–20 or 0–
30 cm depth intervals, when sampling was extended to
100 cm depth these differences disappeared due to low-
er C content below 30 cm depth under ZT. These results
suggested that it is advisable to sample to a depth
approaching 100 cm.
In a 13-year-old experiment at the Embrapa Wheat
Research Centre it was found that when a winter
legume (hairy vetch – Vicia villosa) was included in crop
rotations under ZT or CT management with soybean
(Glycine max), wheat (Triticum aestivum) and maize (Zea
mays), the C accumulation in ZT soil was much higher
to a depth of 100 cm (approximately 17 Mg C ha�1) than
to a depth of 30 cm (from 5.7 to 9.1 Mg C ha�1), suggest-
ing a large C retention in the 30–100 cm soil layers of the
highly weathered Ferralsol (Sisti et al., 2004). Thus, this
result indicated a distinct behavior of C accumulation at
depth in tropical and subtropical soils in contrast to
most results for North American soils.
The results of a study by the team at the Federal
University of Rio Grande do Sul (UFRGS) led to simi-
lar conclusions (Diekow et al., 2005). The effects of
three different crop sequences managed under ZT on
the recovery of soil organic carbon (SOC) stocks were
examined: a continuous oats-maize sequence, an inter-
crop of lablab (Lablab purpureum) with maize or an inter-
crop of pigeon pea (Cajanus cajan) with maize. All were
managed under ZT and where the summer legumes
were present in the inter-crops, soil C stocks to 17.5 cm
depth increased by approximately 8 Mg C ha�1 over the
17 years of the experiment. When the change in soil
C stocks was evaluated to a depth of 107.5 cm, the
increase in soil C stocks were 13.1 and 21.2 Mg C ha�1
for the maize intercropped with lablab and pigeon pea,
respectively.
The objective of this study was to investigate further
long-term experiments to assess the impact of ZT
management on C accumulation in deeper layers of
free-draining subtropical Ferralsols in comparison with
conventionally tilled soils, as well as to evaluate the
influence of crop rotations on soil C accumulation.
Materials and methods
The experimental sites
General. The geographical co-ordinates, altitude, soil
type and clay content and the annual rainfall for each
site are given in Table 1. In all experiments winter crops
were planted in April/May and summer crops in
October/November. Experimental design in all cases
was randomized complete blocks. Crop sequences and
management (fertilizer addition etc.) were identical for
the ZT and CT treatments in all three experiments.
Soil samples to 1 m depth were taken 15, 17 and
26 and years after installation of the experiments for
the sites 1 (Passo Fundo), 2. (Cruz Alta) and 3 (Santo
Angelo), respectively. At all sites soil bulk density
was estimated by opening one sampling trench (1.0�1.0� 1.2 m deep) per subplot, and four samples were
taken, one from each trench wall, in the center of each
depth interval (see information for individual sites,
below) sampled using a beveled ring of known
volume [4.5 cm internal diameter (i.d.) for sites 1 and
2 and 8 cm i.d. for site 3]. The soil from the rings was
carefully removed and weighed after drying at 110 1C
for 472 h. For analyses of total C, N and fertility
parameters, further soil samples were taken uniformly
from the whole of each depth interval from the four
walls of the trenches. These were air dried before
further processing. Samples of surface residues were
not taken.
Z E R O T I L L I N D U C E S C I N C R E A S E AT D E P T H I N F E R R A L S O L S 785
r 2009 Blackwell Publishing Ltd, Global Change Biology, 16, 784–795
Site 1. Embrapa wheat research centre, Passo Fundo. This
experiment was installed in 1984. Before this the area
had been under continuous wheat (winter)/soybean
(summer) under CT for at least 20 years. Before this
the area was open araucaria (Parana pine – Araucaria
angustifolia) woodland with a ground cover of mainly
C4 grasses (e.g. Aristida longiseta).
Cropping was in a 3-year rotation with (Year 1) black
oats (Avena strigosa) in winter and soybean in summer,
(Year 2) barley (Hordeum vulgare)/soybean followed by
(Year 3) hairy vetch/maize. In the ZT treatment all
crops were direct drilled, and for the CT treatment
tillage was performed before planting both the winter
and summer crops with one pass of a disk plough
followed by two passes of a harrow. The addition of
fertilizer N to each maize crop was 70 kg N ha�1, and to
barley 50 kg N ha�1. No N fertilizer was added to vetch,
oats or soybean. Mean annual additions of P and K
were, respectively, 23 kg P and 44 kg K ha�1. The
experiment had four replicate blocks with tillage
treatments in plots of 5� 10 m.
After 15 years, the soil from the plots was sampled
for depth intervals of 0–5, 5–10, 10–15, 15–20, 20–30, 30–
40, 40–55, 55–70, 70–85 and 85–100 cm. Approximately
200 m from the site was an area of native vegetation and
four trenches were opened in this area for sampling for
bulk density and soil C analysis in the same manner
and at the same sampling depths.
Site 2. FUNDACEP, Cruz Alta. This experiment was
installed in 1985. This area had also been originally
open araucaria woodland until the 1960s, then plowed
and used for continuous wheat/soybean under CT until
1985. There were two crop rotations:
Rotation 1 (R1) – a continuous sequence of wheat in
winter followed by soybean in summer.
Rotation 2 (R2) – (Year 1) common vetch (Vicia sativa)
mixed with black oats in winter and maize in summer,
(Year 2) wheat/soybean followed by (Year 3) black
oats/soybean.
In the ZT treatment all crops were direct drilled, and
for the CT treatment tillage for the oats and maize was
using a heavy disc plough followed two passes of
a harrow, and for the other crops was rotavated to
� 16 cm depth followed by a heavy disc plough and
one pass of a harrow. In both rotations the addition of
fertilizer N to each wheat crop was 60 kg N ha�1. In R2,
the maize crop received 90 kg N ha�1. R1 was fertilized
with an annual mean of 52 kg P and 75 kg K ha�1, and
R2 received annually 62 kg P and 105 kg K ha�1. The
experiment had three replicate blocks with tillage
treatments in main plots and rotations in subplots of
20� 15 m.
After 17 years the soil was sampled for depth
intervals of 0–5, 5–10, 10–15, 15–20, 20–30, 30–40, 40–
60, 60–80 and 80–100 cm.
Site 3 Centro de Atividades Agrıcolas e Florestais da
COTRISA, Santo Angelo. This experiment was installed
in 1979. The site was originally native grassland, with
Paspalum notatum and Aristida pallens as the pre-
dominant species. In 1964, it was plowed and until
1979 was under continuous wheat/soybean with CT
(disk plowing and harrowing). The crop rotations
were:
R1 – from 1979 to 1998 a 1-year rotation with wheat
(T. aestivum) in winter and soybean (G. max) in summer
and from 1999 to 2004 (winter/summer) wheat/
soybean – wheat/maize (Z. mays) – black oats (A.
strigosa)/soybean – oil radish (Raphanus sativus var.
olerifera)/maize – wheat/soybean – oil radish/maize.
R2 – from 1979 to 1985 a 1-year rotation with wheat
in winter and soybean in summer, from 1986 to 1998 a
1-year rotation with black oats in winter and maize in
summer and from 1999 to 2004 the same sequence as in
R1 for this period (wheat/soybean – wheat/maize –
Table 1 Locations and descriptions of sites of the long-term experiments
Site 1 2 3
Location Passo Fundo Cruz Alta Santo Angelo
Geographical co-ordinates 281150S,
521240W
281290S,
531360W
281300S,
541270W
Altitude 684 m 470 m 300 m
Soil type (US Soil Taxonomy Typic Haplorthox Typic Haplorthox Typic Haplorthox
Soil type (FAO) Rhodic Ferralsol Rhodic Ferralsol Rhodic Ferralsol
Slope 1% 1% o1%
Soil clay content* 630 g kg�1 640 g kg�1 630 g kg�1
Annual rainfall 1800 mm 1750 mm 1850 mm
*0–30 cm depth interval.
786 R . M . B O D D E Y et al.
r 2009 Blackwell Publishing Ltd, Global Change Biology, 16, 784–795
black oats/soybean – oil radish/maize – wheat/
soybean – oil radish/maize).
In the ZT treatment all crops were direct drilled and
for the CT treatment tillage was performed (one pass of
a disk plough followed by two passes with a harrow)
for both winter and summer crops. In both rotations,
the N addition was 60 kg N ha�1 for wheat and
80 kg ha�1 for maize, while no N fertilizer was
applied to soybean or the cover crops (black oat and
oil radish). An average of 60 kg ha�1 P and 60 kg ha�1 K
were applied only to the cash crops. The experiment
had two replicate blocks with tillage treatments in main
plots (20� 40 m) and rotations in subplots (10� 40 m)
After 26 years, the soil was sampled for depth
intervals of 0–2.5, 2.5–5, 5–10, 10–20, 20–30, 30–40, 40–
60, 60–80 and 80–100 cm.
Analyses
All air-dried soil samples were passed through a 2 mm
sieve and then ground to a fine powder using a roller
mill similar to that of Arnold & Schepers (2004). Sam-
ples were analyzed for total C content using dry com-
bustion. For samples from sites 1 and 2 a LECO CHN
600 total CN analyzer was used and for samples from
sites 3 and 4 a model VCSH total organic C analyzer
(Shimadzu, Tokyo, Japan).
Samples from all sites were analyzed for 13C natural
abundance. Aliquots of the soil samples containing
between 200 and 400 mg total C were analyzed for 13C
abundance using a continuous-flow isotope-ratio mass
spectrometer (Finnigan DeltaPlus mass spectrometer
coupled to the output of a Carlo Erba EA 1108 total C
and N analyser – Finnigan MAT, Bremen, Germany).
Calculation of total crop residue carbon
Crop yield data was collected for all grain crops. To
calculate the total dry matter of crop residues deposited
on the soil surface, the harvest indices measured by Dr.
Gilberto Tomm of Embrapa Trigo cited in Sisti et al.
(2004 – Table 4) were utilized. The indices used for
soybean, wheat, maize and barley were 0.41, 0.30, 0.41
and 0.30, respectively. It was further assumed that the
residues all contained 450 g C kg DM�1. For the noncash
crops (oats, vetch and oil radish), all biomass was taken
from areas of all plots ranging from 1.6 to 2.4 m2
immediately after application of herbicide or knife roll-
er. Subsamples were weighed and dried and once again
it was assumed that C content was 450 g C kg DM�1.
The annual mean C deposited as crop residues on the
soil surface was calculated from the total C deposited
over the whole of each experiment divided by its
duration.
Soil C data treatment
As contrasting tillage treatments, ZT and CT, may result
in different profiles of soil compaction (Ellert & Bettany,
1995), the bulk density measurements were used to
calculate the mass of soil present in each interval and
then the quantity of C in each depth interval. It was
assumed that soil compaction due to mechanical opera-
tions was most significant in the surface layers of the
profiles. In all cases it was found that to 30 or 100 cm
depth there was a greater mass of soil (i.e. there was
more compaction) in the CT treatment. Firstly the total
mass of soil in the profile of the soil down to 30 cm
under both the ZT and CT treatments was calculated.
Then C stocks to 30 cm were calculated by subtracting
the total C content of the extra mass of soil in the 20–
30 cm layer under the CT treatment from that under the
ZT treatment. For the stocks to 100 cm depth the same
procedure was followed but the total C in the extra
mass of soil in the deepest layer (85–100 or 80–100 cm)
was used. This procedure was expressed mathemati-
cally by Sisti et al. (2004).
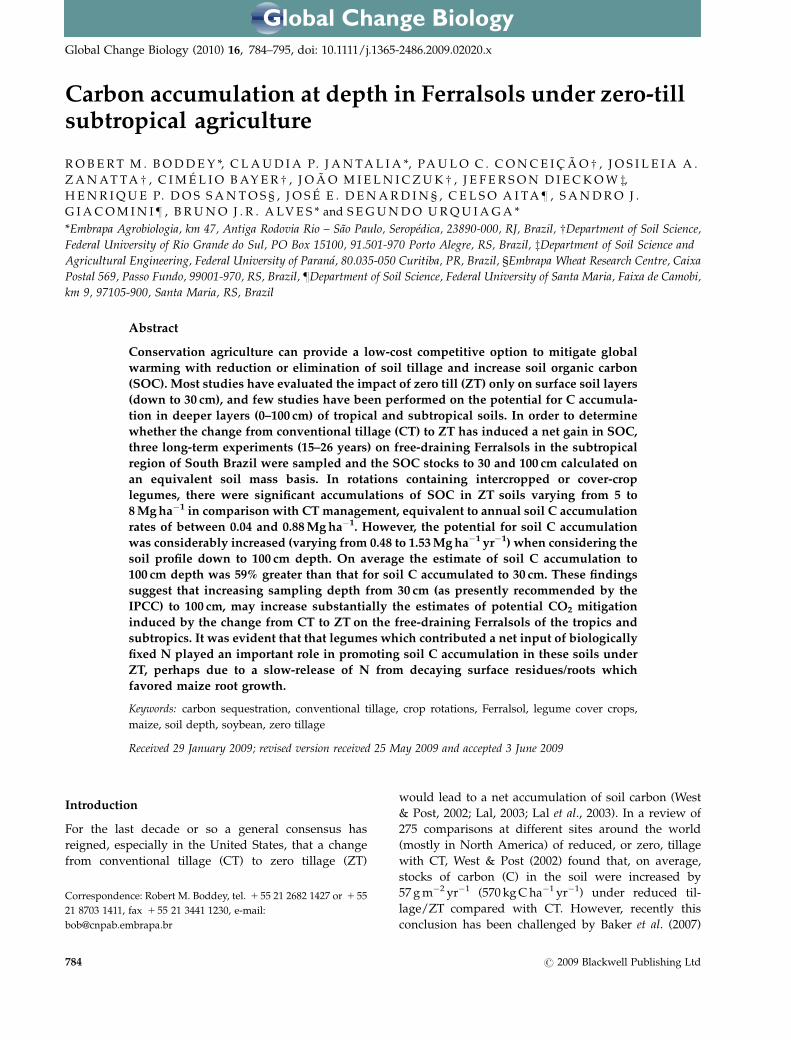
Fig. 1 Soil carbon concentrations (g kg�1) to 100 cm depth after
15 years of a 3-year crop rotation of white oats/soybean –
barley/soybean – hairy vetch/maize managed under either ZT
or CT, and under the neighboring native vegetation, at the
Embrapa Wheat Research Center (Site 1, Passo Fundo, RS). Error
bars for the native vegetation indicate standard errors of the
means, and for the experimental area the least significant differ-
ence (LSD – Student, Po0.05) between ZT and CT means. Values
are means of four replicates.
Z E R O T I L L I N D U C E S C I N C R E A S E AT D E P T H I N F E R R A L S O L S 787
r 2009 Blackwell Publishing Ltd, Global Change Biology, 16, 784–795

Statistical analyses
All data for the soil C stocks were subjected to standard
analysis of variance procedures using the software
package MSTAT-C (Michigan State University, USA).
At sites 2 and 3, tillage treatments were in main plots
and crop rotations in subplots (split plot design). For
the data from these sites in order to evaluate whe-
ther there were statistically significant effects of the
tillage regime (ZT or CT) on the accumulation of C
under the individual crop rotations, it was necessary to
compare subplot treatment means for different main
plots. This was achieved using the procedure descri-
bed by Little & Jackson-Hills (1978): The calculation of
the least significant difference between means (LSD –
Student) becomes:
LSD0:05 ¼ tab
ffiffiffiffiffiffiffiffiffiffiffiffiffiffiffiffiffiffiffiffiffiffiffiffiffiffiffiffiffiffiffiffiffiffiffiffiffiffiffiffiffiffiffiffiffiffi2 b� 1ð ÞEa þ Eb½ �=rbf g
p; ð1Þ
where b is the number of subplot treatments, r the
number of replicates, Ea and Eb are the mean squares
of the subplot and main plot errors, respectively, and tab
is the weighted t value for main plots and subplots
calculated as described by Little & Jackson-Hills (1978).
This procedure was performed on the software SISVAR,
produced by the Federal University of Lavras (UFL),
Lavras, Minas Gerais.
Results
Crop yields
Mean grain yields of soybean for the duration of all
three experiments ranged from 2 to 2.6 Mg ha�1 (Table
2), close to the means for Rio Grande do Sul for 2007
(2.5 Mg) and 2008 (2.0 Mg ha�1) and considerably above
mean yields from a few years ago (Alves et al., 2003;
IBGE, 2009). Likewise, maize yields were well above the
state and national averages. Wheat and barley yields
were similar to State means for the same years. The
yields of these two crops are low by international
standards as farmers are reluctant to invest much
fertilizer and other agro-chemicals in crops with such
low prices on the international markets.
Soil C stocks
Site 1 – Passo Fundo. Only at this site was there a
neighboring area of native vegetation close (� 200 m)
to the experiment which could be used as reference to
evaluate changes in bulk density and carbon (C) stocks.
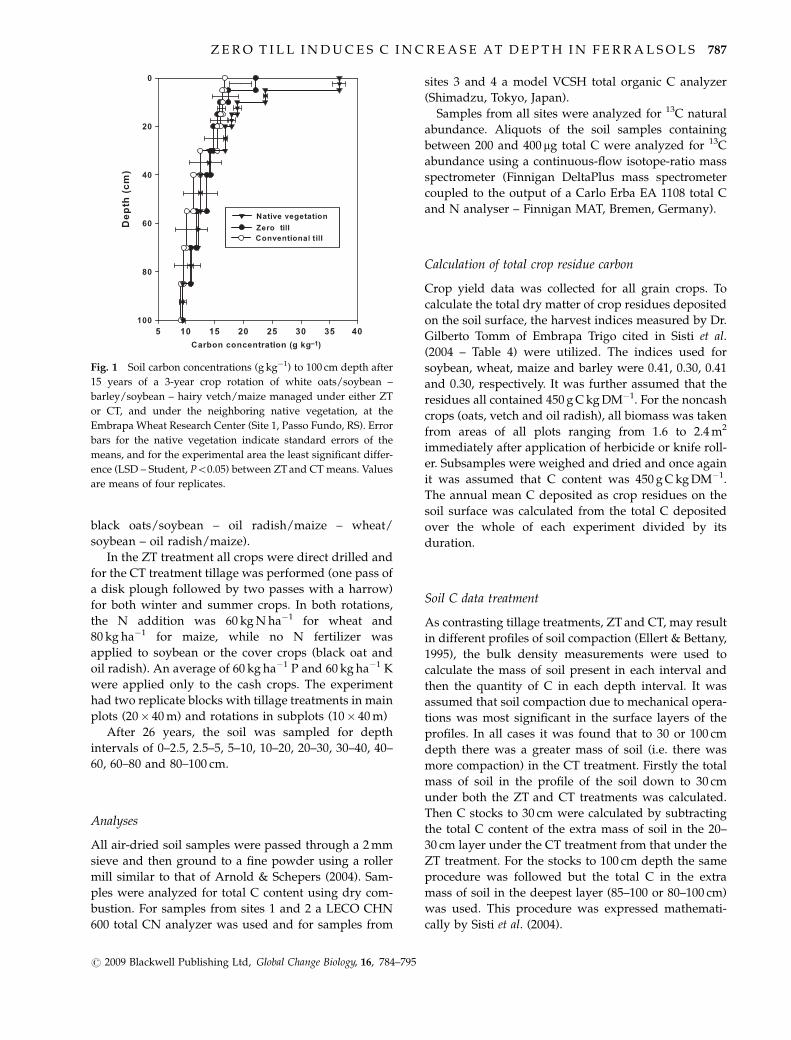
The bulk density data show clearly the very significant
compaction of the soil caused by cultivation and
traction down to a depth of 40 cm (Table 3).
The soil C stocks under the ZT and CT treatments,
corrected for the same mass of soil to 100 cm under the
Table 2 Mean annual yields of grain crops (kg ha�1) and mean annual deposition of C in aboveground residues (Mg C ha�1) by
grain crops and cover crops at the three long-term experiment sites. Details of crop rotations/sequences given in Materials and
methods
Crop
Site 1 Passo
Fundo Site 2 Cruz Alta Site 3 Santo Angelo
R1 R1 R2 R1 R2
ZT CT ZT CT ZT CT ZT CT ZT CT
Grain yield
Soybean 2478 2598 2467 2238 2588 2382 2025 1889 2058 1892
Wheat 1722 1759 2003 1979 1331 1457 1421 1453
Maize 6094 6088 5786 4874 6461 6461 5590 5407
Barley 2742 2893
C-biomass input
Barley 2.88 3.04
Black Oat 1.58 1.58 1.73 1.94 2.25 2.25 2.49 2.75
Black Oat 1 Vetch 2.11 1.84
Vetch 1.97 1.97
Wheat 1.81 1.85 2.10 2.08 1.40 1.53 1.49 1.53
Oil radish 1.06 1.06 0.90 0.90 0.90 0.90
Soybean 1.48 1.55 1.47 1.34 1.54 1.42 1.21 1.13 1.23 1.13
Maize 3.95 3.94 3.75 3.16 4.18 4.18 3.62 3.50
Mean* 4.12 4.22 3.28 3.19 4.31 4.03 3.11 3.13 3.38 3.34
*Annual mean for the whole duration of each experiment considering the number of occurrences of each crop in each rotation.
788 R . M . B O D D E Y et al.
r 2009 Blackwell Publishing Ltd, Global Change Biology, 16, 784–795
neighboring native vegetation, were calculated to be
167.1 and 150.4 Mg ha�1 compared with 171.1 Mg C ha�1
under the former. This suggests that even cropping
under ZT caused some loss of soil carbon (Fig. 1), and
CT management caused much greater losses. However,
this correction was performed based on the assumption
that the C stock under the neighboring native
vegetation was representative of that present at the
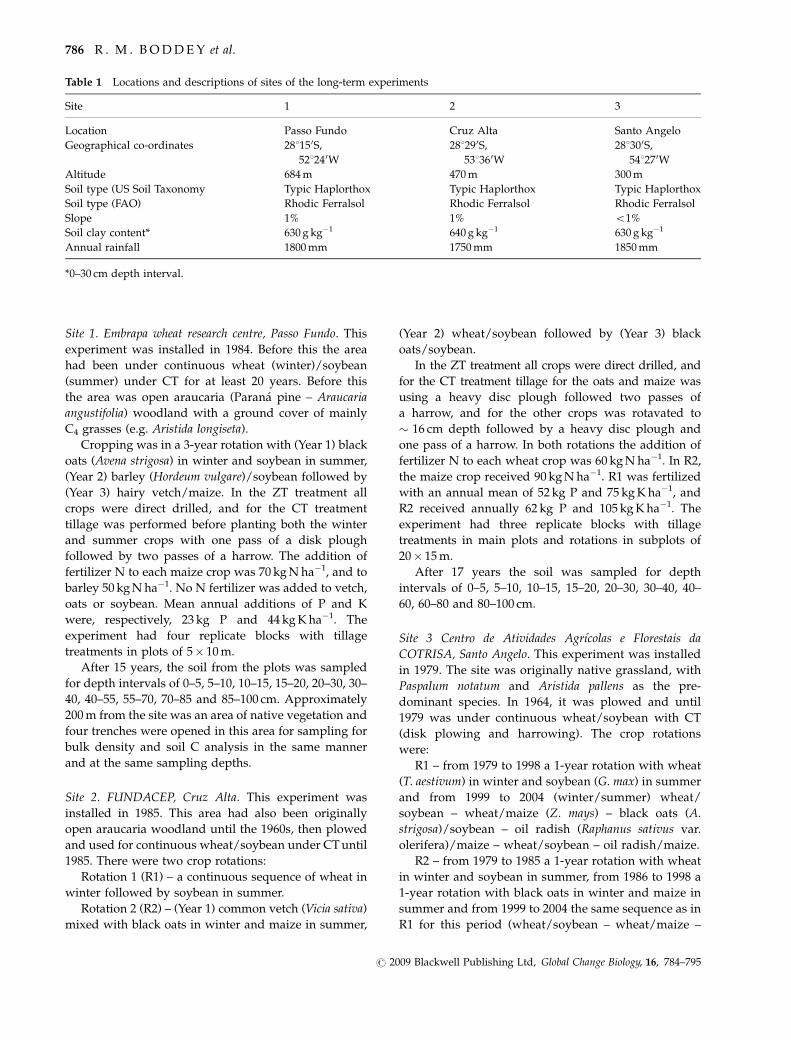
time of planting the experiment in 1984. The 13C
natural abundance data suggest that this may not be
true (Fig. 2). The d13C signal for the area of native
vegetation show that in recent times the vegetation
has been dominated by C3 plants. It is to be expected
that there would be a somewhat higher (less negative)
d13C signal under the cropped area as maize (d13C ffi�12%) was included in the rotation. However, if
15 years previously the composition of the vegetation
at the site of the experiment had been the same, it
would be expected that the d13C signals of the soil
under the experimental plots and the area of native
vegetation would converge at depth. As it appears that
the vegetation before establishment of the experiment
was perhaps not the same as the native vegetation
sampled 200 m away, it cannot be assumed with
complete confidence that the soil C stocks were
exactly the same. Whether the cropping increased or
decreased the total C stocks over the 15-year period of
the study cannot be conclusively deduced from the
results.
While all soil samples were analyzed for 13C natural
abundance, the differences in d13C between CT and ZT
yielded little information of interest as, not only were
nearly all the rotations composed of both C3 and C4
crops, but the sites all had prior histories of C4 grasses
under C3 trees. In addition, except for this site at Passo
Fundo, there were no neighboring native vegetation
Table 3 Variation in bulk density (kg dm�3) of soil with
depth under after 15 years of the 3-year crop rotation bar-
ley/soybean, vetch/maize, black oats/soybean, and under an
neighboring area of native vegetation, Site 1, Passo Fundo
Depth
interval (cm)
Native
vegetation
Crop management
ZT CT
0–5 0.97 � 0.01* 1.14 � 0.03w 1.14 � 0.03
5–10 0.99 � 0.01 1.35 � 0.04 1.33 � 0.02
10–15 1.09 � 0.02 1.41 � 0.06 1.42 � 0.02
15–20 1.15 � 0.01 1.38 � 0.01 1.40 � 0.02
20–30 1.17 � 0.01 1.32 � 0.03 1.37 � 0.02
30–40 1.18 � 0.01 1.26 � 0.05 1.33 � 0.02
40–55 1.16 � 0.01 1.20 � 0.03 1.22 � 0.03
55–70 1.15 � 0.01 1.20 � 0.01 1.20 � 0.01
70–85 1.15 � 0.01 1.20 � 0.01 1.20 � 0.01
85–100 1.15 � 0.01 1.21 � 0.01 1.21 � 0.01
*Values following means are � SEM.
wIn no depth interval were the means of bulk density signifi-
cantly different between ZT and CT at Po0.05.
Fig. 2 13C natural abundance (%) of soil to 100 cm depth after
15 years of a 3-year crop rotation of white oats/soybean –
barley/soybean – hairy vetch/maize managed under either ZT
or CT, and under the neighboring native vegetation, at the
Embrapa Wheat Research Center (Site 1, Passo Fundo, RS). Error
bars for the native vegetation indicate standard errors of the
means, and for the experimental area the least significant differ-
ence (LSD – Student, Po0.05) between ZT and CT means. Values
are means of four replicates.
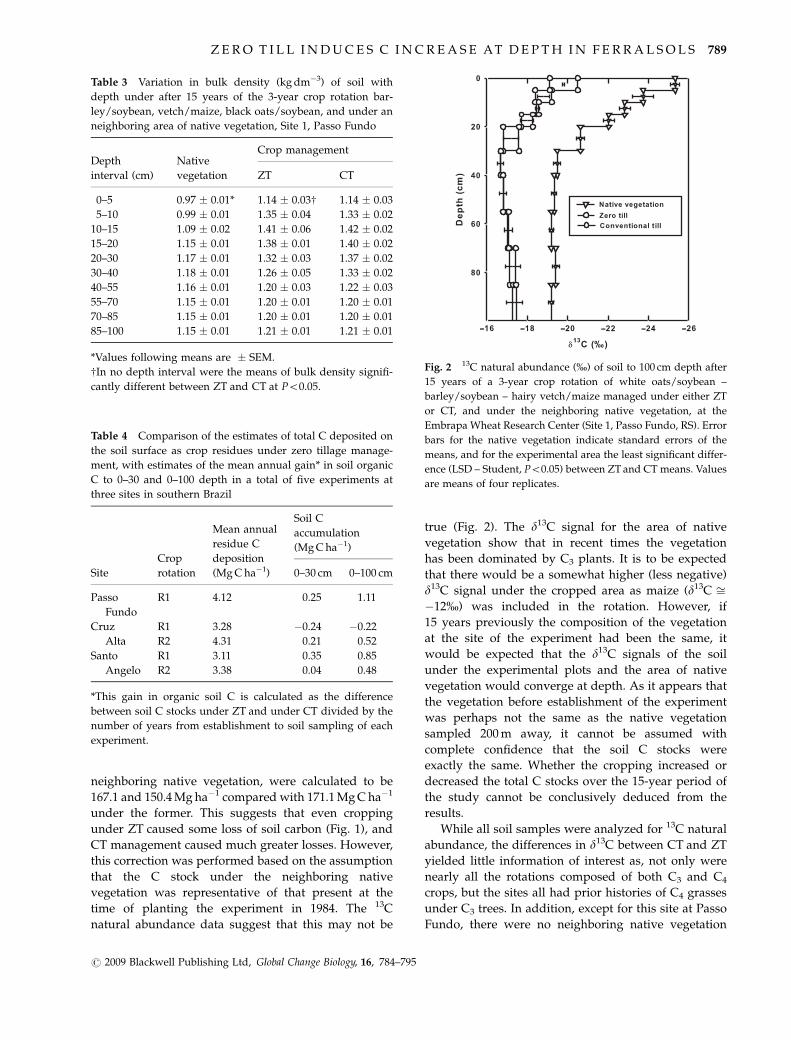
Table 4 Comparison of the estimates of total C deposited on
the soil surface as crop residues under zero tillage manage-
ment, with estimates of the mean annual gain* in soil organic
C to 0–30 and 0–100 depth in a total of five experiments at
three sites in southern Brazil
Site
Crop
rotation
Mean annual
residue C
deposition
(Mg C ha�1)
Soil C
accumulation
(Mg C ha�1)
0–30 cm 0–100 cm
Passo
Fundo
R1 4.12 0.25 1.11
Cruz
Alta
R1 3.28 �0.24 �0.22
R2 4.31 0.21 0.52
Santo
Angelo
R1 3.11 0.35 0.85
R2 3.38 0.04 0.48
*This gain in organic soil C is calculated as the difference
between soil C stocks under ZT and under CT divided by the
number of years from establishment to soil sampling of each
experiment.
Z E R O T I L L I N D U C E S C I N C R E A S E AT D E P T H I N F E R R A L S O L S 789
r 2009 Blackwell Publishing Ltd, Global Change Biology, 16, 784–795
reference sites to see the effects of the deposition of
belowground crop residues on C3 and C4 carbon. For
these reasons these data for the other sites/rotations are
not presented.
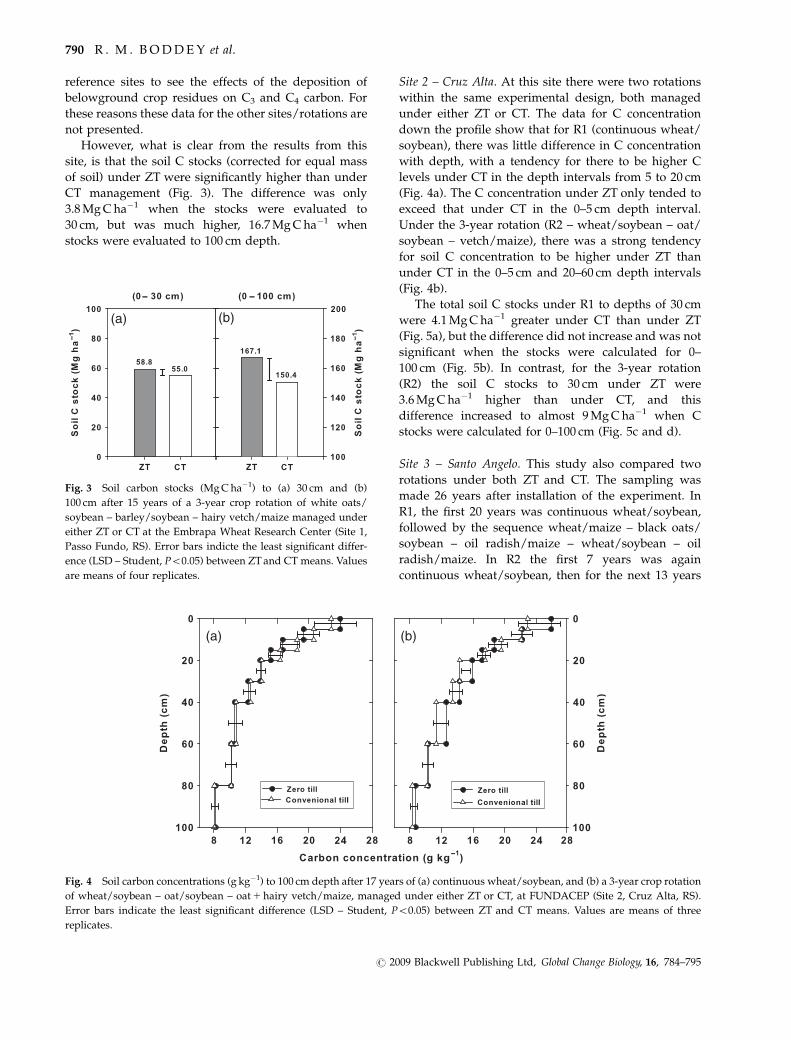
However, what is clear from the results from this
site, is that the soil C stocks (corrected for equal mass
of soil) under ZT were significantly higher than under
CT management (Fig. 3). The difference was only
3.8 Mg C ha�1 when the stocks were evaluated to
30 cm, but was much higher, 16.7 Mg C ha�1 when
stocks were evaluated to 100 cm depth.
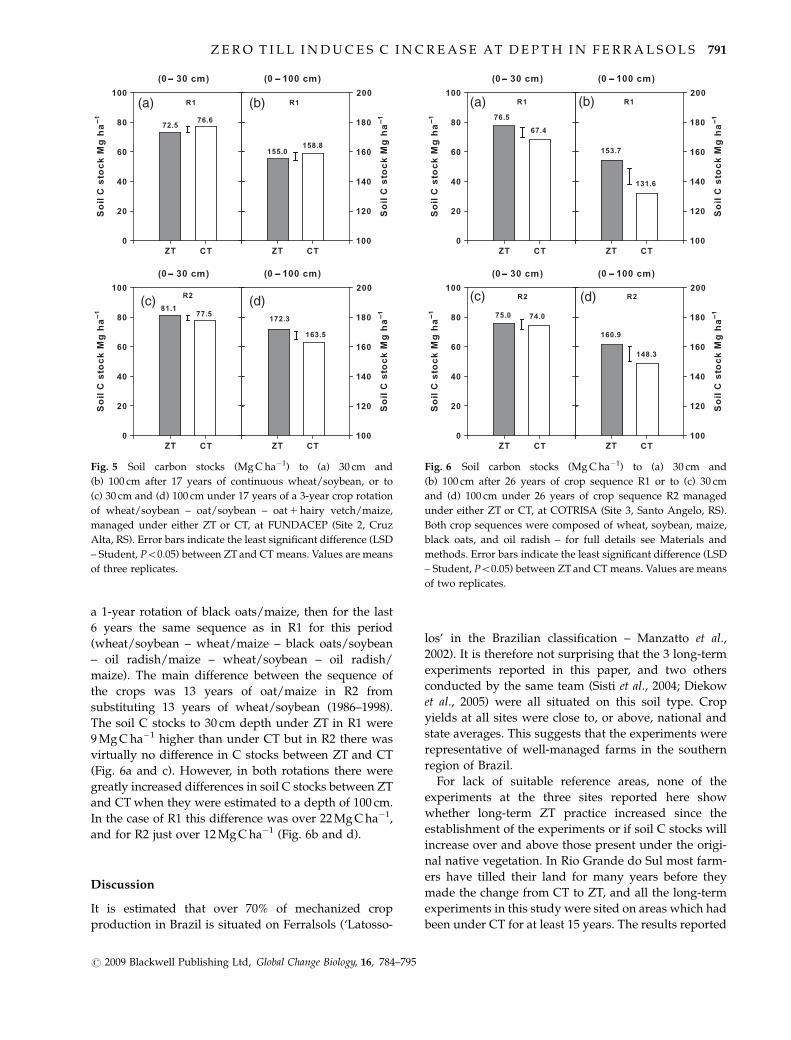
Site 2 – Cruz Alta. At this site there were two rotations
within the same experimental design, both managed
under either ZT or CT. The data for C concentration
down the profile show that for R1 (continuous wheat/
soybean), there was little difference in C concentration
with depth, with a tendency for there to be higher C
levels under CT in the depth intervals from 5 to 20 cm
(Fig. 4a). The C concentration under ZT only tended to
exceed that under CT in the 0–5 cm depth interval.
Under the 3-year rotation (R2 – wheat/soybean – oat/
soybean – vetch/maize), there was a strong tendency
for soil C concentration to be higher under ZT than
under CT in the 0–5 cm and 20–60 cm depth intervals
(Fig. 4b).
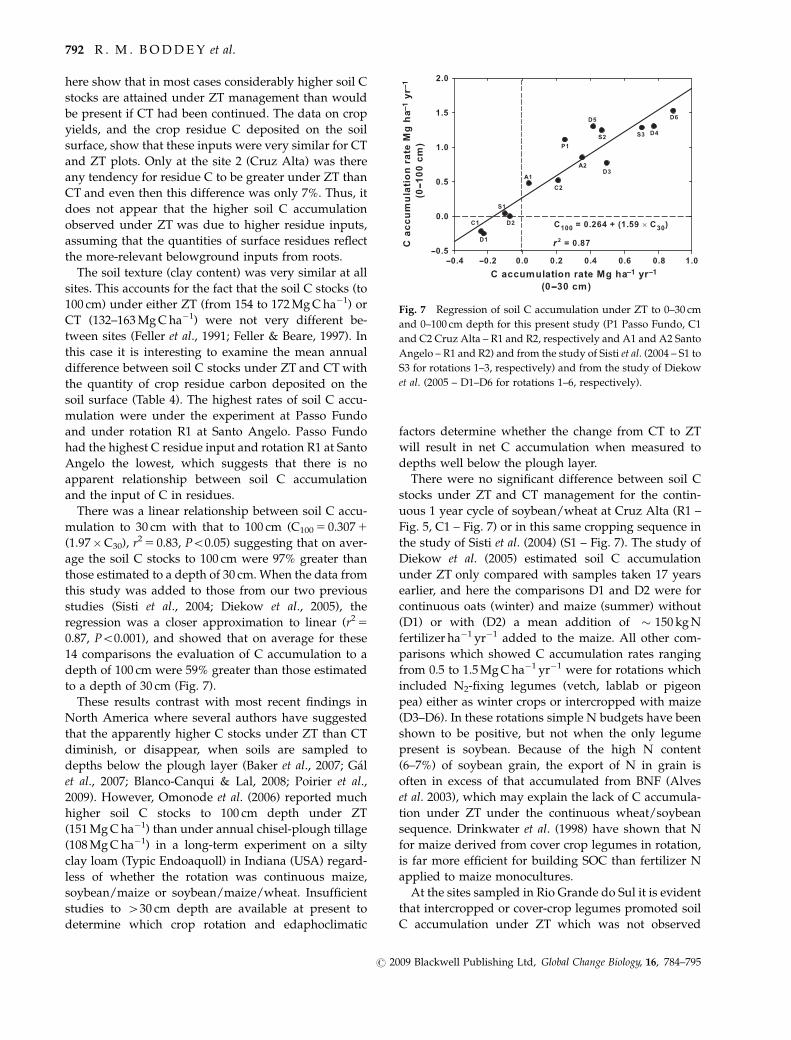
The total soil C stocks under R1 to depths of 30 cm
were 4.1 Mg C ha�1 greater under CT than under ZT
(Fig. 5a), but the difference did not increase and was not
significant when the stocks were calculated for 0–
100 cm (Fig. 5b). In contrast, for the 3-year rotation
(R2) the soil C stocks to 30 cm under ZT were
3.6 Mg C ha�1 higher than under CT, and this
difference increased to almost 9 Mg C ha�1 when C
stocks were calculated for 0–100 cm (Fig. 5c and d).
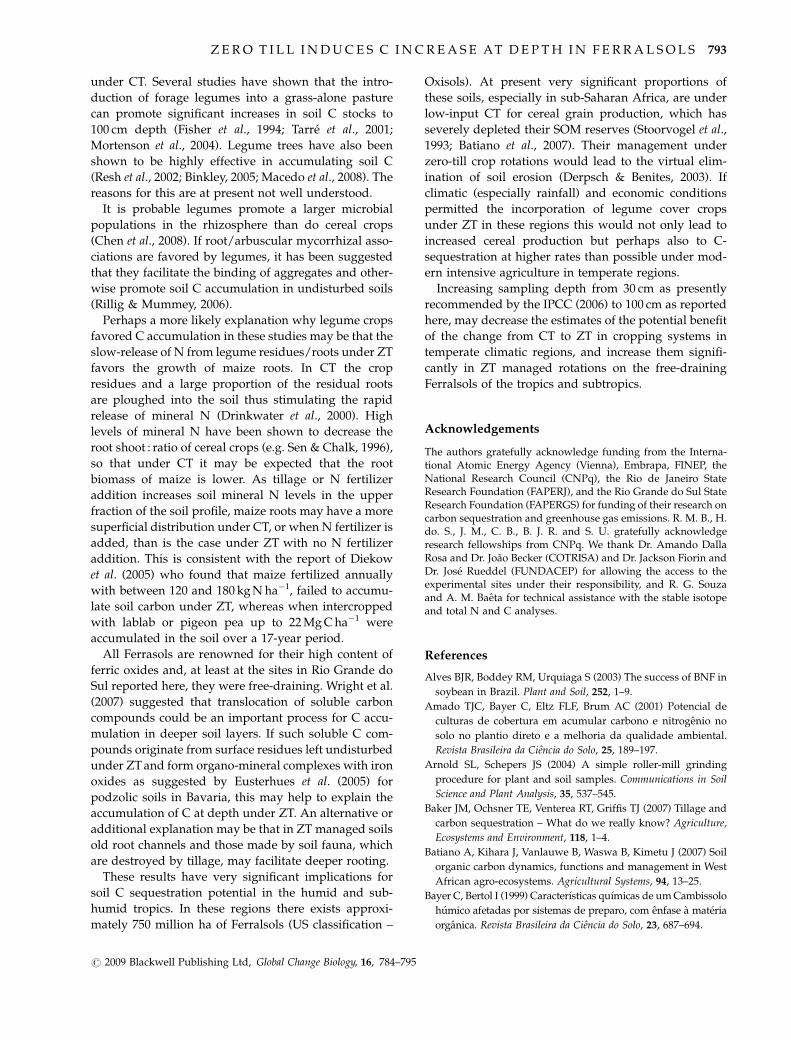
Site 3 – Santo Angelo. This study also compared two
rotations under both ZT and CT. The sampling was
made 26 years after installation of the experiment. In
R1, the first 20 years was continuous wheat/soybean,
followed by the sequence wheat/maize – black oats/
soybean – oil radish/maize – wheat/soybean – oil
radish/maize. In R2 the first 7 years was again
continuous wheat/soybean, then for the next 13 years
(a) (b)
Fig. 3 Soil carbon stocks (Mg C ha�1) to (a) 30 cm and (b)
100 cm after 15 years of a 3-year crop rotation of white oats/
soybean – barley/soybean – hairy vetch/maize managed under
either ZT or CT at the Embrapa Wheat Research Center (Site 1,
Passo Fundo, RS). Error bars indicte the least significant differ-
ence (LSD – Student, Po0.05) between ZT and CT means. Values
are means of four replicates.
(a) (b)
Fig. 4 Soil carbon concentrations (g kg�1) to 100 cm depth after 17 years of (a) continuous wheat/soybean, and (b) a 3-year crop rotation
of wheat/soybean – oat/soybean – oat 1 hairy vetch/maize, managed under either ZT or CT, at FUNDACEP (Site 2, Cruz Alta, RS).
Error bars indicate the least significant difference (LSD – Student, Po0.05) between ZT and CT means. Values are means of three
replicates.
790 R . M . B O D D E Y et al.
r 2009 Blackwell Publishing Ltd, Global Change Biology, 16, 784–795
a 1-year rotation of black oats/maize, then for the last
6 years the same sequence as in R1 for this period
(wheat/soybean – wheat/maize – black oats/soybean
– oil radish/maize – wheat/soybean – oil radish/
maize). The main difference between the sequence of
the crops was 13 years of oat/maize in R2 from
substituting 13 years of wheat/soybean (1986–1998).
The soil C stocks to 30 cm depth under ZT in R1 were
9 Mg C ha�1 higher than under CT but in R2 there was
virtually no difference in C stocks between ZT and CT
(Fig. 6a and c). However, in both rotations there were
greatly increased differences in soil C stocks between ZT
and CT when they were estimated to a depth of 100 cm.
In the case of R1 this difference was over 22 Mg C ha�1,
and for R2 just over 12 Mg C ha�1 (Fig. 6b and d).
Discussion
It is estimated that over 70% of mechanized crop
production in Brazil is situated on Ferralsols (‘Latosso-
los’ in the Brazilian classification – Manzatto et al.,
2002). It is therefore not surprising that the 3 long-term
experiments reported in this paper, and two others
conducted by the same team (Sisti et al., 2004; Diekow
et al., 2005) were all situated on this soil type. Crop
yields at all sites were close to, or above, national and
state averages. This suggests that the experiments were
representative of well-managed farms in the southern
region of Brazil.
For lack of suitable reference areas, none of the
experiments at the three sites reported here show
whether long-term ZT practice increased since the
establishment of the experiments or if soil C stocks will
increase over and above those present under the origi-
nal native vegetation. In Rio Grande do Sul most farm-
ers have tilled their land for many years before they
made the change from CT to ZT, and all the long-term
experiments in this study were sited on areas which had
been under CT for at least 15 years. The results reported
(a) (b)
(c) (d)
Fig. 5 Soil carbon stocks (Mg C ha�1) to (a) 30 cm and
(b) 100 cm after 17 years of continuous wheat/soybean, or to
(c) 30 cm and (d) 100 cm under 17 years of a 3-year crop rotation
of wheat/soybean – oat/soybean – oat 1 hairy vetch/maize,
managed under either ZT or CT, at FUNDACEP (Site 2, Cruz
Alta, RS). Error bars indicate the least significant difference (LSD
– Student, Po0.05) between ZT and CT means. Values are means
of three replicates.
(a) (b)
(c) (d)
Fig. 6 Soil carbon stocks (Mg C ha�1) to (a) 30 cm and
(b) 100 cm after 26 years of crop sequence R1 or to (c) 30 cm
and (d) 100 cm under 26 years of crop sequence R2 managed
under either ZT or CT, at COTRISA (Site 3, Santo Angelo, RS).
Both crop sequences were composed of wheat, soybean, maize,
black oats, and oil radish – for full details see Materials and
methods. Error bars indicate the least significant difference (LSD
– Student, Po0.05) between ZT and CT means. Values are means
of two replicates.
Z E R O T I L L I N D U C E S C I N C R E A S E AT D E P T H I N F E R R A L S O L S 791
r 2009 Blackwell Publishing Ltd, Global Change Biology, 16, 784–795
here show that in most cases considerably higher soil C
stocks are attained under ZT management than would
be present if CT had been continued. The data on crop
yields, and the crop residue C deposited on the soil
surface, show that these inputs were very similar for CT
and ZT plots. Only at the site 2 (Cruz Alta) was there
any tendency for residue C to be greater under ZT than
CT and even then this difference was only 7%. Thus, it
does not appear that the higher soil C accumulation
observed under ZT was due to higher residue inputs,
assuming that the quantities of surface residues reflect
the more-relevant belowground inputs from roots.
The soil texture (clay content) was very similar at all
sites. This accounts for the fact that the soil C stocks (to
100 cm) under either ZT (from 154 to 172 Mg C ha�1) or
CT (132–163 Mg C ha�1) were not very different be-
tween sites (Feller et al., 1991; Feller & Beare, 1997). In
this case it is interesting to examine the mean annual
difference between soil C stocks under ZT and CT with
the quantity of crop residue carbon deposited on the
soil surface (Table 4). The highest rates of soil C accu-
mulation were under the experiment at Passo Fundo
and under rotation R1 at Santo Angelo. Passo Fundo
had the highest C residue input and rotation R1 at Santo
Angelo the lowest, which suggests that there is no
apparent relationship between soil C accumulation
and the input of C in residues.
There was a linear relationship between soil C accu-
mulation to 30 cm with that to 100 cm (C100 5 0.307 1
(1.97�C30), r2 5 0.83, Po0.05) suggesting that on aver-
age the soil C stocks to 100 cm were 97% greater than
those estimated to a depth of 30 cm. When the data from
this study was added to those from our two previous
studies (Sisti et al., 2004; Diekow et al., 2005), the
regression was a closer approximation to linear (r2 5
0.87, Po0.001), and showed that on average for these
14 comparisons the evaluation of C accumulation to a
depth of 100 cm were 59% greater than those estimated
to a depth of 30 cm (Fig. 7).
These results contrast with most recent findings in
North America where several authors have suggested
that the apparently higher C stocks under ZT than CT
diminish, or disappear, when soils are sampled to
depths below the plough layer (Baker et al., 2007; Gal
et al., 2007; Blanco-Canqui & Lal, 2008; Poirier et al.,
2009). However, Omonode et al. (2006) reported much
higher soil C stocks to 100 cm depth under ZT
(151 Mg C ha�1) than under annual chisel-plough tillage
(108 Mg C ha�1) in a long-term experiment on a silty
clay loam (Typic Endoaquoll) in Indiana (USA) regard-
less of whether the rotation was continuous maize,
soybean/maize or soybean/maize/wheat. Insufficient
studies to 430 cm depth are available at present to
determine which crop rotation and edaphoclimatic
factors determine whether the change from CT to ZT
will result in net C accumulation when measured to
depths well below the plough layer.
There were no significant difference between soil C
stocks under ZT and CT management for the contin-
uous 1 year cycle of soybean/wheat at Cruz Alta (R1 –
Fig. 5, C1 – Fig. 7) or in this same cropping sequence in
the study of Sisti et al. (2004) (S1 – Fig. 7). The study of
Diekow et al. (2005) estimated soil C accumulation
under ZT only compared with samples taken 17 years
earlier, and here the comparisons D1 and D2 were for
continuous oats (winter) and maize (summer) without
(D1) or with (D2) a mean addition of � 150 kg N
fertilizer ha�1 yr�1 added to the maize. All other com-
parisons which showed C accumulation rates ranging
from 0.5 to 1.5 Mg C ha�1 yr�1 were for rotations which
included N2-fixing legumes (vetch, lablab or pigeon
pea) either as winter crops or intercropped with maize
(D3–D6). In these rotations simple N budgets have been
shown to be positive, but not when the only legume
present is soybean. Because of the high N content
(6–7%) of soybean grain, the export of N in grain is
often in excess of that accumulated from BNF (Alves
et al. 2003), which may explain the lack of C accumula-
tion under ZT under the continuous wheat/soybean
sequence. Drinkwater et al. (1998) have shown that N
for maize derived from cover crop legumes in rotation,
is far more efficient for building SOC than fertilizer N
applied to maize monocultures.
At the sites sampled in Rio Grande do Sul it is evident
that intercropped or cover-crop legumes promoted soil
C accumulation under ZT which was not observed
Fig. 7 Regression of soil C accumulation under ZT to 0–30 cm
and 0–100 cm depth for this present study (P1 Passo Fundo, C1
and C2 Cruz Alta – R1 and R2, respectively and A1 and A2 Santo
Angelo – R1 and R2) and from the study of Sisti et al. (2004 – S1 to
S3 for rotations 1–3, respectively) and from the study of Diekow
et al. (2005 – D1–D6 for rotations 1–6, respectively).
792 R . M . B O D D E Y et al.
r 2009 Blackwell Publishing Ltd, Global Change Biology, 16, 784–795
under CT. Several studies have shown that the intro-
duction of forage legumes into a grass-alone pasture
can promote significant increases in soil C stocks to
100 cm depth (Fisher et al., 1994; Tarre et al., 2001;
Mortenson et al., 2004). Legume trees have also been
shown to be highly effective in accumulating soil C
(Resh et al., 2002; Binkley, 2005; Macedo et al., 2008). The
reasons for this are at present not well understood.
It is probable legumes promote a larger microbial
populations in the rhizosphere than do cereal crops
(Chen et al., 2008). If root/arbuscular mycorrhizal asso-
ciations are favored by legumes, it has been suggested
that they facilitate the binding of aggregates and other-
wise promote soil C accumulation in undisturbed soils
(Rillig & Mummey, 2006).
Perhaps a more likely explanation why legume crops
favored C accumulation in these studies may be that the
slow-release of N from legume residues/roots under ZT
favors the growth of maize roots. In CT the crop
residues and a large proportion of the residual roots
are ploughed into the soil thus stimulating the rapid
release of mineral N (Drinkwater et al., 2000). High
levels of mineral N have been shown to decrease the
root shoot : ratio of cereal crops (e.g. Sen & Chalk, 1996),
so that under CT it may be expected that the root
biomass of maize is lower. As tillage or N fertilizer
addition increases soil mineral N levels in the upper
fraction of the soil profile, maize roots may have a more
superficial distribution under CT, or when N fertilizer is
added, than is the case under ZT with no N fertilizer
addition. This is consistent with the report of Diekow
et al. (2005) who found that maize fertilized annually
with between 120 and 180 kg N ha�1, failed to accumu-
late soil carbon under ZT, whereas when intercropped
with lablab or pigeon pea up to 22 Mg C ha�1 were
accumulated in the soil over a 17-year period.
All Ferrasols are renowned for their high content of
ferric oxides and, at least at the sites in Rio Grande do
Sul reported here, they were free-draining. Wright et al.
(2007) suggested that translocation of soluble carbon
compounds could be an important process for C accu-
mulation in deeper soil layers. If such soluble C com-
pounds originate from surface residues left undisturbed
under ZT and form organo-mineral complexes with iron
oxides as suggested by Eusterhues et al. (2005) for
podzolic soils in Bavaria, this may help to explain the
accumulation of C at depth under ZT. An alternative or
additional explanation may be that in ZT managed soils
old root channels and those made by soil fauna, which
are destroyed by tillage, may facilitate deeper rooting.
These results have very significant implications for
soil C sequestration potential in the humid and sub-
humid tropics. In these regions there exists approxi-
mately 750 million ha of Ferralsols (US classification –
Oxisols). At present very significant proportions of
these soils, especially in sub-Saharan Africa, are under
low-input CT for cereal grain production, which has
severely depleted their SOM reserves (Stoorvogel et al.,
1993; Batiano et al., 2007). Their management under
zero-till crop rotations would lead to the virtual elim-
ination of soil erosion (Derpsch & Benites, 2003). If
climatic (especially rainfall) and economic conditions
permitted the incorporation of legume cover crops
under ZT in these regions this would not only lead to
increased cereal production but perhaps also to C-
sequestration at higher rates than possible under mod-
ern intensive agriculture in temperate regions.
Increasing sampling depth from 30 cm as presently
recommended by the IPCC (2006) to 100 cm as reported
here, may decrease the estimates of the potential benefit
of the change from CT to ZT in cropping systems in
temperate climatic regions, and increase them signifi-
cantly in ZT managed rotations on the free-draining
Ferralsols of the tropics and subtropics.
Acknowledgements
The authors gratefully acknowledge funding from the Interna-tional Atomic Energy Agency (Vienna), Embrapa, FINEP, theNational Research Council (CNPq), the Rio de Janeiro StateResearch Foundation (FAPERJ), and the Rio Grande do Sul StateResearch Foundation (FAPERGS) for funding of their research oncarbon sequestration and greenhouse gas emissions. R. M. B., H.do. S., J. M., C. B., B. J. R. and S. U. gratefully acknowledgeresearch fellowships from CNPq. We thank Dr. Amando DallaRosa and Dr. Joao Becker (COTRISA) and Dr. Jackson Fiorin andDr. Jose Rueddel (FUNDACEP) for allowing the access to theexperimental sites under their responsibility, and R. G. Souzaand A. M. Baeta for technical assistance with the stable isotopeand total N and C analyses.
References
Alves BJR, Boddey RM, Urquiaga S (2003) The success of BNF in
soybean in Brazil. Plant and Soil, 252, 1–9.
Amado TJC, Bayer C, Eltz FLF, Brum AC (2001) Potencial de
culturas de cobertura em acumular carbono e nitrogenio no
solo no plantio direto e a melhoria da qualidade ambiental.
Revista Brasileira da Ciencia do Solo, 25, 189–197.
Arnold SL, Schepers JS (2004) A simple roller-mill grinding
procedure for plant and soil samples. Communications in Soil
Science and Plant Analysis, 35, 537–545.
Baker JM, Ochsner TE, Venterea RT, Griffis TJ (2007) Tillage and
carbon sequestration – What do we really know? Agriculture,
Ecosystems and Environment, 118, 1–4.
Batiano A, Kihara J, Vanlauwe B, Waswa B, Kimetu J (2007) Soil
organic carbon dynamics, functions and management in West
African agro-ecosystems. Agricultural Systems, 94, 13–25.
Bayer C, Bertol I (1999) Caracterısticas quımicas de um Cambissolo
humico afetadas por sistemas de preparo, com enfase a materia
organica. Revista Brasileira da Ciencia do Solo, 23, 687–694.
Z E R O T I L L I N D U C E S C I N C R E A S E AT D E P T H I N F E R R A L S O L S 793
r 2009 Blackwell Publishing Ltd, Global Change Biology, 16, 784–795
Bayer C, Mielniczuk J (1997) Nitrogenio total de um solo sub-
metido a diferentes metodos de preparo e sistemas de cul-
turas. Revista Brasileira da Ciencia do Solo, 21, 235–239.
Bayer C, Mielniczuk J, Amado TJC, Martin-Neto L, Fernandes SV
(2000) Organic matter storage in a sandy clay loam Acrisol
affected by tillage and cropping systems in southern Brazil.
Soil and Tillage Research, 54, 101–109.
Binkley D (2005) How nitrogen-fixing trees change soil carbon.
In: Tree Species Effects on Soils: Implications for Global Change (eds
Binkley D, Menyailo O), pp. 155–164. Kluwer Academic Pub-
lishers, Dordrecht, the Netherlands.
Blanco-Canqui H, Lal R (2008) No-tillage and soil-profile carbon
sequestration: an on-farm assessment. Soil Science Society of
America Journal, 72, 693–701.
Centurion JF, Dematte JLI, Fernandes FM (1985) Efeitos de
sistemas de preparo nas propriedades quımicas de um solo
sob cerrado cultivado com soja. Revista Brasileira de Ciencia do
Solo, 9, 267–270.
Chen M, Chen B, Marschner P (2008) Plant growth and soil
microbial community structure of legumes and grasses grown
in monoculture or mixture. Journal of Environmental Sciences,
20, 1231–1237.
Corazza EJ, da Silva JE, Resck DVS, Gomes AC (1999) Compor-
tamento de diferentes sistemas de manejo como fonte ou
deposito de carbono em relacao a vegetacao de Cerrado.
Revista Brasileira da Ciencia do Solo, 23, 425–432.
Derpsch R, Benites JR (2003) Situation of conservation agriculture in
the World. Second World Congress on Conservation Agricul-
ture 1, Foz de Iguacu, 11-8-2003, pp. 125–135.
Diekow J, Mielniczuk J, Knicker H, Bayer C, Dick DP, Kogel-
Knabner I (2005) Soil C and N stocks as affected by cropping
systems and nitrogen fertilisation in a southern Brazil Acrisol
managed under no-tillage for 17 years. Soil & Tillage Research,
8, 87–95.
Drinkwater LE, Janke RR, Rossoni-Longnecker L (2000) Effects of
tillage intensity on nitrogen dynamics and productivity in
legume-based grain systems. Plant and Soil, 227, 99–113.
Drinkwater LE, Wagoner P, Sarrantonio M (1998) Legume-based
cropping systems have reduced carbon and nitrogen losses.
Nature, 396, 262–265.
Ellert BH, Bettany JR (1995) Calculation of organic matter and
nutrients stored in soils under contrasting managment re-
gimes. Canadian Journal of Soil Science, 75, 529–538.
Eusterhues K, Rumpel C, Kogel-Knabner I (2005) Organo-miner-
al associations in sandy acid forest soils: importance of specific
surface area, iron oxides and micropores. European Journal of
Soil Science, 56, 753–763.
Feller C, Beare MH (1997) Physical control of soil organic matter
dynamics in the tropics. Geoderma, 79, 69–116.
Feller C, Fritsch E, Poss R, Valentin C (1991) Effets de la texture
sur le stockage et la dynamique des matieres organiques dans
quelques sols ferrugineux et ferrallitiques (Afrique de l’Ouest,
en particulier). Cahiers de ORSTOM, Serie Pedologie, 26,
25–36.
Fisher MJ, Rao IM, Ayarza MA, Lascano CE, Sanz JI, Thomas RJ,
Vera RR (1994) Carbon storage by introduced deep-rooted
grasses in the South American savannas. Nature, 371,
236–238.
Gal A, Vyn TJ, Micheli E, Kladivko EJ, McFee WW (2007)
Soil carbon and nitrogen accumulation with long-term
no-till versus moldboard plowing overestimated with
tilled-zone sampling depths. Soil & Tillage Research, 96,
42–51.
Instituto Brasileiro de Geografia e Estatıstica (IBGE) 2009.
Available at http://www.sidra.ibge.gov.br/bda/default.asp?
t=5&z=t&o=1&u1=1&u2=1&u3=1&u4=1&u5=1&u6=1&u7=1&
u8=1&u9=3&u10=1&u11=26674&u12=1&u13=1&u14=1 (ac-
cessed 4 March 2009)
Intergovernmental Panel for Climate Change (IPCC) (2006).
Guidelines for National Greenhouse Gas Inventories. Avail-
able at http://www.ipcc-nggip.iges.or.jp/public/2006gl/
index.htm (accessed November, 2007).
Lal R (2003) Global potential of soil carbon sequestration to
mitigate the greenhouse effect. Critical Reviews Plant Science,
22, 151–184.
Lal R, Follet RF, Kimble JM (2003) Achieving soil carbon seques-
tration in the United States: a challenge to policy makers. Soil
Science, 168, 827–845.
Little TM, Jackson-Hills F (1978) Agricultural Experimentation.
John Wiley, New York, NY, USA.
Macedo MO, Resende AS, Garcia PC et al. (2008) Changes in soil
C and N stocks and nutrient dynamics 13 years after recovery
of degraded land using leguminous nitrogen-fixing trees.
Forest Ecology and Management, 255, 1516–1524.
Manzatto CV, Freitas Junior E, Peres JRR (2002). Uso agrı-
cola dos solos brasileiros. Embrapa Solos, Rio de Janeiro,
p. 179.
Mortenson MC, Schuman GE, Ingram LJ (2004) Carbon seques-
tration in rangelands interseeded with yellow-flowering alfal-
fa (Medicago sativa ssp. falcata). Environmental Management, 33,
S475–S481.
Omonode RA, Gal A, Stott DE, Abney TS, Vyn TJ (2006) Short-
term versus continuous chisel and no-till effects on soil
carbon and nitrogen. Soil Science Society of America Journal,
70, 419–425.
Poirier V, Angers DA, Rochette P, Chantigny MH, Ziadi N,
Tremblay G, Fortin J (2009) Interactive effects of tillage and
mineral fertilization on soil carbon profiles. Soil Science Society
of America Journal, 73, 255–261.
Resh SC, Binkley D, Parrotta JA (2002) Greater soil carbon
sequestration under nitrogen-fixing trees compared with Eu-
calyptus species. Ecosystems, 5, 217–231.
Rillig MC, Mummey DL (2006) Mycorrizas and soil structure.
New Phytologist, 171, 4–53.
Sa JC, de M, Cerri CC, Dick WA, Lal R, Filho SPV, Piccolo MC,
Feigl BE (2001) Organic matter dynamics and carbon seques-
tration rates for a tillage chronosequence in a Brazilian Oxisol.
Soil Science Society of America Journal, 65, 1486–1499.
Sen S, Chalk PM (1996) Stimulation of root growth and soil
nitrogen uptake by foliar application of urea to wheat and
sunflower. Journal of Agricultural Science, 126, 127–135.
Sidiras N, Pavan MA (1985) Influencia do sistema de manejo do
solo no seu nıvel de fertilidade. Revista Brasileira da Ciencia do
Solo, 9, 249–254.
Sisti CPJ, de Santos HP, Kochhann RA, Alves BJR, Urquiaga S,
Boddey RM (2004) Change in carbon and nitrogen stocks in
794 R . M . B O D D E Y et al.
r 2009 Blackwell Publishing Ltd, Global Change Biology, 16, 784–795
soil under 13 years of conventional or zero tillage in southern
Brazil. Soil and Tillage Research, 76, 39–58.
Stoorvogel JJ, Smaling EMA, Janssen BH (1993) Calculating soil
nutrient balances in Africa at different scales. I. Supra-national
scale. Fertilizer Research, 35, 227–235.
Tarre RM, Macedo R, Cantarutti RB et al. (2001) The effect of
the presence of a forage legume on nitrogen and carbon
levels in soils under Brachiaria pastures in the Atlantic
forest region of the South of Bahia, Brazil. Plant and Soil, 234,
15–26.
VandenBygaart AJ, Gregorich EG, Angers DA (2003) Influence of
agricultural management on soil organic carbon: a compen-
dium and assessment of Canadian studies. Canadian Journal of
Soil Science, 83, 363–380.
West TO, Post WM (2002) Soil organic carbon sequestration rates
by tillage and crop rotation: a global data analysis. Soil Science
Society of America Journal, 66, 1930–1946.
Wright AL, Dou F, Hons FM (2007) Crop species and tillage
effects on carbon sequestration in subsurface soil. Soil Science,
172, 124–131.
Z E R O T I L L I N D U C E S C I N C R E A S E AT D E P T H I N F E R R A L S O L S 795
r 2009 Blackwell Publishing Ltd, Global Change Biology, 16, 784–795