![[2] RPP SD KELAS 6 SEMESTER 1 - Persatuan dan Perbedaan www](https://static.fdokumen.com/doc/165x107/631a326b20bd5bb1740c2d45/2-rpp-sd-kelas-6-semester-1-persatuan-dan-perbedaan-www.jpg)
NO ISBN/ - Persatuan Genetik Malaysia
130
-
Upload
khangminh22 -
Category
Documents
-
view
3 -
download
0
Transcript of NO ISBN/ - Persatuan Genetik Malaysia
NO ISBN/e-ISBN

Exploring Innovationin Genetics
Transactions of Persatuan Genetik MalaysiaNumber 10, November 2019
Editorial CommitteeChan Soon Choy
Norwati MuhammadSyarifah Aisyafaznim Sayed Abdul Rahman
Shamsiah AbdullahNor’Aishah HassanZesdyzar Rokman
Abd. Rahman MilanMohamad Osman
Persatuan Genetik MalaysiaGenetics Society of Malaysia
NO ISBN/e-ISBN

Prof. Dr. Mohamad bin OsmanPresident, Persatuan Genetik Malaysiac/o Department of Crop ScienceFaculty of Agriculture, UPMEmail: [email protected]
Dr. Shamsiah AbdullahFaculty of Plantation and AgrotechnologyUniversiti Teknologi MARA (UiTM)40450 Shah Alam, Selangor, MalaysiaEmail: [email protected]
Prof. Dr. Mohd. Rafii bin Yusop
Editors
Assoc. Prof. Chan Soon ChoySchool of Foundation StudiesPerdana UniversityMAEPS Building43400 Seri Kembangan, Selangor, MalaysiaEmail: [email protected]
Dr. Norwati MuhammadBiotechnology Division Forest Research Institute Malaysia (FRIM)52109 Kepong, Selangor, MalaysiaEmail: [email protected]
Dr. Syarifah Aisyafaznim Sayed Abdul RahmanFaculty of ScienceUniverisity of Malaya50603 Kuala Lumpur, MalaysiaEmail: [email protected]
Dr. Shamsiah AbdullahFaculty of Plantation and AgrotechnologyUniversiti Teknologi MARA (UiTM)40450 Shah Alam, Selangor, MalaysiaEmail: [email protected]
Dr. Nor’Aishah HasanFaculty of Applied SciencesUniversiti Teknologi MARA (UiTM)72000 Kuala Pilah, Negeri Sembilan, MalaysiaEmail: [email protected]
Published by:Persatuan Genetik Malaysiac/o Faculty of Plantation and AgrotechnologyUniversiti Teknologi MARA (UiTM)40450 Shah Alam, Selangor, Malaysia
Editorial Committee
- ii -
Zesdyzar RokmanWMIT Group Sdn. Bhd.D-03A-3, Plaza Paragon Point 2Jalan Medan Pusat Bandar 5, Seksyen 943650 Bandar Baru Bangi, Selangor, MalaysiaEmail: [email protected]
Prof. Dr. Abd. Rahman MilanSchool of Sustainable AgricultureUniversiti Malaysia SabahSandakan, Sabah, MalaysiaEmail: [email protected]
Prof. Dr. Mohamad OsmanSenior AdvisorAtri AdvisoryNo. 296, Jalan Ampang50450 Kuala Lumpur, MalaysiaEmail: [email protected]
Copyright © 2019 by Persatuan Genetik Malaysia (Genetics Society of Malaysia)
All rights reserved. No part of this publication may be reproduced, stored in a retrieval system, or transmitted in any form or any means, electronic, mechanical, photocopying, recording or otherwise, without prior permission, in writing, from the publisher.
The views and opinions expressed therein are those of the individual authors and any statements in this publication do not imply endorsement by the publisher or the editorial staff.
The softcopy of the publication is available at http://www.pgm-org.my
Perpustakaan Negara Malaysia Cataloging-in-Publication Data
Transactions of Persatuan Genetik Malaysia, Number 10Exploring Innovation in Genetics
ISBN 978-967-16583-2-1eISBN 978-967-16583-3-8
ABOUT THE TRANSACTIONS
TPGM is acronymed for Transactions of the Persatuan Genetik Malaysia (or Genetics Society of Malaysia). The Transactions is the Society's scientific publication. It is published periodically and can be downloaded free from PGM website.
Genetics is a rapidly expanding field that has far reaching impact in almost every horizon of life, from agriculture to industry to medicine, and has made many invaluable contributions towards our well being. The Transactions is therefore a valuable publication to highlight new developments and findings encompassing these wide-ranging fields and disciplines.
Each issue comprises articles, reports and reviews which had been contributed to the Society's scientific activities. Selection of articles or contributions to be considered for publication in the Transactions will be done by the Society based on their scientific merit, and also their research and application potential.
Each issue is indexed and a cumulative index is planned for the future.
The Society gratefully acknowledges the outstanding contribution of members and non-members alike.
FOCUS OF THIS TRANSACTIONS
In this Transactions, focus is given to the science of genetics and its allied fields. In a nutshell, genetics is the study of genes, genetic variation, and heredity in living organisms. It is generally considered a field of biology, but intersects and converges with many other life sciences, and is now strongly associated with molecular biology, genomics and bioinformatics.
TPGM Number 10 is a compilation of selected papers from two tracks, namely Track on Plant Genetics and Track on Animal Genetics, contributed to the 13th Malaysia International Genetics Congress 2019 (MIGC13) with the theme “Exploring Innovation in Genetics” held on 19-21 November 2019 in Bangi, Selangor, Malaysia. Selected papers from Track on Human Genetics will be published separately.
TPGM Number 10 is now available for download from the Society’s website.
- iii -

- iv-

PREFACE
Plant breeding has always played an important role in agriculture and plantation sector, especially for ensuring food security, by developing new varieties that are high yielding, high quality, resistant to pests and diseases, and adapted to different growing environments.
In Malaysia, plant breeding and genetics have considerable prospects to be further developed to meet demanding productivity and sustainability targets for future food security and plantation industry.
Although plant breeding activities have been going on for a very long time for most of our economic crops, there has never been an event exclusively dedicated to plant breeding and genetics. Realising the great yet unleashed potential of and the need to further empower plant breeding and genetics in the country, Genetics Society of Malaysia, in 2011, mooted the idea to create and facilitate a platform for plant breeders in the country and also region to meet and share their common but distributed visions, responsibilities, achievements and experiences.
The Society together with Agro-Biotechnology Institute (ABI), Malaysian Agricultural Research and Development Institute (MARDI), and Institute of Agriculture (ITA) of Universiti Putra Malaysia, and in collaboration with the Society for the Advancement of Breeding Research in Asia and Oceania (SABRAO) walked the idea and took the initiative to organise the First Plant Breeding Seminar in July 2012. The Seminar received overwhelming local and international participation, and turned out to be the first in the country for such an event cross-cutting many crop species. It was not just a pure stroke of serendipity.
The following events provide an account of the history in the making. Riding on the success and obligations arising from the first Seminar, in October 2014, the Society again co-organised the Second International Plant Breeding Seminar, accompanied with higher levels of enthusiasm and participation. The book entitled “A Practical Compendium on Advances in Plant Breeding” was published and launched during the second Seminar.
Over 180 participants from 14 countries participated in the third Seminar, namely Australia, Bangladesh, France, India, Indonesia, Malaysia, Netherlands, Nigeria, Pakistan, Philippines, Sri Lanka, Sudan, Thailand, and Vietnam.
The overwhelming participation in the Third International Plant Breeding Conference held in November 2016 provides the testimony that the Society is actively internationalising and pushing the field of plant breeding and genetics to the forefront.
More efforts are needed to provide awareness to students and public on the benefits of plant breeding and genetics. A greater number of young people should be inspired to make plant breeding as their professional careers in plant breeding. A number of universities should consider to develop and offer dedicated plant breeding programmes at undergraduate and postgraduate levels.
We hope the considerable past achievements of plant breeding in the country will continue to provide an impetus to enhance the development of superior varieties and clones for our crops or commodities.
This fourth issue of the Transactions contains selected articles contributed to the international plant breeding conference in 2016.
EditorsSeptember 2017
The Society strives to organize various activities towards fulfilling its primary objectives. These activities will help members to touch base and to keep abreast with new developments in genetics and related fields.
The First National Congress on Genetics was held more than 20 years ago, and since then, there have been considerable and remarkable progress in many areas of genetics. The Genetics Congress is a major scientific activity for the Society, which will provide the forum for researchers, scientists, professionals and policy makers to present theirideas, findings and innovations, and also to offer a mechanism for sharing of knowledge and networking.
A wide range of topics would be presented during theCongress, including topics on plant genetics, animal genetics,microbial genetics, medical and human genetics, moleculargenetics, biodiversity, biosafety and policy issues.
It is my pleasure to invite you to attend the 11th Malaysia Genetics Congress and to deliver the keynote address, also known as the Mendel Lecture. The Malaysia Genetics Congress, which was started in 1994, is a biennial congress organized by the Genetics Society of Malaysia. This is the most unique genetic congress in Malaysia that brings together geneticists from various disciplines including human, animal, plant and microbial. The Mendel Lecture was inaugurated during that first Malaysia Genetics Congress and many prestigious speakers have delivered the Mendel Lecture since then.
The details of the 11th Malaysia Genetics Congress are as follows:
Date : 12-13th August, 2015Venue : Perdana University, Serdang, Selangor, Malaysia
Mendel Lecture: 12th of August, 9.00-10.00am (tentatively)
Your insight into the current and future trends in genetics would certainly benefit all the participants of this congress including lecturers, researchers and post-graduate students. I would also like to point out that the organizers of this congress would cover your travel (return economy airfare and local ground transportation) and accommodation.
Please feel free to contact Dr. Michael Ling at [email protected]/+603-89472564 should you have any enquiries regarding the seminar. He will follow up with you regarding the details of your travel itinerary as well as the Mendel Lecture.
On behalf of the Genetics Society of Malaysia, I look forward to welcoming you in Malaysia and to see you at this great scientific meeting.
Dear Prof. Dr. Khush,Emeritus ProfessorUniversity of California, Davis416 Cabrillo Avenue Davis, CA 95616, USA
I am writing to you to follow up on our discussions we had on 25, 26 & 29 October 2010 when you were the guest of honour with MARDI, Biotek, CEBAR and ASM.
On behalf of the Organising Committee, we are indeed dearly honoured to extend our invitation to you to be the eminent speaker for the 9th Mendel Lecture in conjunction with 9th Malaysia Genetics Congress to be held on 28-30 September 2011in Kuching, Sarawak. This time the 2½-day Congress will be jointly organised by Universiti Malaysia Sarawak (UNIMAS) and Genetics Society of Malaysia (PGM). The theme of the Congress “Appreciating the richness of nature through Genetics” gels well with the focus accorded to biodiversity and biotechnology in the context of our national development.
We would like very much to suggest a topic on the title of "Mendelian Genetics to Functional Genomics in Rice Science: An imperative for Food Security and Environmental Health", but you are at liberty to modify as it suits your understanding and experiences. The 9th Mendel Lecture will begin at the outset of the Congress, and will be presented in one hour in the plenary session as a public lecture. We hope this Mendel Lecture will serve as a premise to continue to strengthen the core areas of the science of genetics as well as to promote their onvergence with new emerging sciences such as genomics in rice science towards fulfilling & achieving our national obligations and goals. We would very much like to print and distribute the manuscript of your presentation in advance during the Congress.
For your information, the past Mendel Lectures presented the following eminent speakers:
* First Mendel Lecture by Prof. Bruce Holloway, 1994 * Second Mendel Lecture by Nobel Laureate Prof. Dr. James Watson, 1996 * Third Mendel Lecture by Prof. Yong Hoi Seng, 1998 * Fourth Mendel Lecture by Prof. Brian Kinghorn, 2000 * Fifth Mendel Lecture by Prof. Dr. Robert Williamson, 2003 * Sixth Mendel Lecture by Prof. Dato' Dr Zakri Abd hamid, 2005 * Seven Mendel Lecture by Prof. Dr Alan Colman, 2007 * Eigth Mendel Lecture by Prof. Datin Paduka Dr. Khatijah Mohd Yusoff, 2009
Since its formation in 1994, Genetics Society of Malaysia (or Persatuan Genetik Malaysia in Malay) has grown steadily in membership. At present, the Society has 78 life members, 199 ordinary members, 98 student members and 5 associate members. These numbers reflect the strong interest and commitments in genetics as a discipline in this country.The Society strives to organise various activities towards fulfilling its primary objectives, i.e. to develop and promote scientific knowledge on genetics, to create public awareness on its importance and advancements, and to foster a strong relationship and understanding between scientists in genetics and allied fields. For the last several decades,
The FirstNa,onal Congress onGene,cswas held over 22 years ago in1994. This Congress will be the 12th edi,on of such Congress onGene,cs.Boostedby successesof thepreviousCongresses, theSocietywillmakeeveryeffort,andwillpushonwithabiggerandwiderroletointerna,onaliseitsscien,ficac,vi,es. Wehopeyou,membersandnon-members alike, will help us make the Congress as a major biennialscien,ficac,vityfortheSociety.
1-7 National8-11 MGC12 MIGC
- v -
The First National Congress on Genetics was held over 25 years ago in 1994. The 13th Malaysia International Genetics Congress (MiGC13) is the 13th edition of such Congress on Genetics. Underpinned by both successes and challenges of past Congresses, PGM vehemently strives to further internationalise this flagship scientific activity. The main aims of the International Congress are to create a platform from which researchers can reflect on advances made in the scientific fields of genetics, consider the best of contemporary research progress, and anticipate future developments. Realising the significance and powerful impacts that the field of genetics could benefit humankind, PGM is therefore very proud to organise MiGC13 on 19-21 November 2019.
ACKNOWELDGEMENTS
Many people contributed to the 10th edition of the Transactions, and for this we would like to thank each and every one for their contributions.
A vote of thanks is due to Assoc. Prof. Dr. Chan Soon Choy and his team for organising the 13th Malaysia International Genetics Congress in 2019 (MiGC13). Sincere thanks to Prof. Dr. Thong Meow Keong, Prof. Dr. Rozita Rosli, Dr. Norwati Mohamad, Dr. Norshariza Nordin, Dr. Nor’Aishah Hasan, Dr. Shamsiah Abdullah, Dr. Low Kheng Oon, Hj. Nor Hazani Mat Daud, Zesdyar Rokman, and subcommittee members for their considerable time, efforts and contributions to the Congress.
Special thanks are also due to the Society’s Executive Council 2019/2021 members for their motivation and support, namely Prof. Dr. Abd Rahman Milan (UMS), Dr. Norshariza Nordin (UPM), Dr. Nor’Aishah Hasan (UiTM), Dr. Azzreena Mohamad Azzeme (UPM), Pn. Sharifah Azween Syed Omar (UKM), Dr. Norwati Muhammad (FRIM), Dr. Shamsiah Abdullah (UiTM), Prof. Dr Thong Meow Keong (UM), Prof. Dr. Zilfalil Alwi (USM), Prof. Dr. Zarina Abdul Latiff (UKM), Assoc. Prof. Dr. Chan Soon Choy (PU), Dr. Mohd Din Amiruddin (MPOB), and Assoc. Prof. Dr. Zarina Zainuddin (IIUM).
We also would like to extend our deep gratitude to all individuals who have contributed and assisted in one way or another.
As always, we would like to acknowledge our heartiest appreciation to many institutions and organisations for their warm support right from preparation to completion of the Transactions, in particular Perdana University, Forest Research Institute Malaysia (FRIM), Universiti Putra Malaysia (UPM), University of Malaya (UM), Universiti Teknologi MARA (UiTM), Universiti Kebangsaan Malaysia (UKM), MARDI, MPOB, MNA, WMIT Group Sdn. Bhd., and Atri Advisory.
We are indeed very thankful for the sincere cooperation and efforts by all the reviewers. We received constructive criticisms and many positive comments that lifted our spirits to keep working on the Transactions until completion.
- vi -
TRANSACTIONS OF THE GENETICS SOCIETY OF MALAYSIA
CONTENTS
Number 10 November 2019
About the Transactions ……………………..........................................................................................…........................…. iii
Preface ………………………………………….……………………………………………………………………………………. v
Acknowledgements .........................................................................................................….........................................….. vi
Contents .............................................................................................................................….....................................….. vii
Reviewers ……….…….……………………………………………………………………………………………………………. x
SECTION I: PLANT GENETICS
Agronomicperformanceoftenselectedpoten2alkenafmutantlinesatBeseri,PerlisZaitonAhmad,FaizAhmad,MustaphaAkil,ZulmadiSani,AffridaAbuHassanandMohammadNazriRomli……………….…………1
Valida2onofsimilaritybetweenbrinjalT-64andBtbrinjaleventEE-1DhabitahKamaruzzaman,HazwaniHumaira’Zakaria,NorliaBasherudin,Norwa,Muhammad,NurNabilahAliasandNorwa,Adnan……………………………………………………….……………………….………….………7
Diversityandgene2cpoten2alofIndonesiapea(Pisumsa(vumL.)landracebasedonmorphologicaltraitsinlowlandsBudiWaluyo,DarmawanSaptadi,andChindyUlimaZaneUa…………………………………………………………………………13
PreliminarystudyonpolyembryonicHarumanismango(Mangiferaindica)seedlingsZulHelmeyMohamadSabdin,MuhammadNajibOthmanGhani,MuhamadHafizMuhamadHassan,andMohdShahrilFirdausAbdulRazak……………………………………………….…………….…………………………………21
Polymorphisminforma2oncontentandheterozygosityvaluesofsimplesequencerepeatmarkersin‘Harumanis’andothermangocul2varsArinaYusuf,AhmadMukhlisAbdulRahman,ZarinaZakaria,VijayKumarSubbiah,andMohdAzinuddinAhmadMokhtar……………………………….……………………………………………………..………… 25
Iden2fica2onofAgrodyke-inducedgenesandpathwayspoten2allyassociatedwithdefenseresponseinAcaciahybridagainstCeratocys(sinfec2onNurNabilahAlias,NorliaBasherudin,MohdFaizalAbuBakar,SamsuddinAhmadSyazwan,MohdFaridAhmad,MohdZakiAbdullah,andAdibahYahya……………………….…………………………………………….…..…………..………… 31
Iden2fica2onofWRKYtranscrip2onfactorexpressedinrootofTongkatAli:PreliminarystudyNorliaBasherudin,NurNabilahAlias,NorHasnidaHassan,Norwa,Muhammad,MohdZakiAbdullah,MohdFaizalAbuBakar,andMohdNoorMatIsa……………………………….……………………………….…………………… 41
Earlynurserygrowthmeasuresindicatesuccessfultransferofdesirabletraitsto3rdcyclederiva2vesfromoilpalmoriginallyprospectedfromNigeriaAmirulAsrafTuminandGohHuaLek……………………………….……………………………………………….………..………47
Simplesequencerepeatiden2fica2onandmarkerdevelopmentforKopyormutantandnormalcoconutbasedonNGSgenomedataAndiNadiaNurulLathifaHaUa,DewiSukma,IsmailMaskromo,andSudarsonoSudarsono……………….………………..………51
WildIpomoeaspeciesinhabi2ngcoastalareaofMalaysiaSi,SofiahMohamad,KhadijahAwang,Mohd.NorAwaluddin,Mohd.KhairuddinOthman,andMohd.ShukriMatAli…………………………………………………………………………………………………….………57
- vii -
Preliminarystudyofpaternaleffectonthecharactersof‘MusangKing’durian(DuriozibethinusL.)fruitfromcross-pollina2onMuhammadAfiqTajolAriffin,MohdMusanifGhazali,AhmadNorhisyamAbdullah,SalehudinMd.Radzuan,NurAzlinRazali,Si,AisyahAbdullah,WanMahfuzahWanIbrahim,MohdAsrulSani,RazaliMustaffa,RozlailyZainol,andPauziahMuda……………………………………………………………………………………..……………61
Preliminarystudyonencapsula2onofAquilariamalaccensisandEndospermummalaccenseforinvitrogermina2onandpropaga2onNorAsmahHassan,NoralizaAlias,RosdiKoter,NadiahSalmiNadzri,NashatulZaimahNoorAzman,andNorRashidahMustapa…………………..…………….…………………………………………………….………….………67
Effectofwaterdeficitontheagronomiccharacteris2csandSDS-PAGEproteinpa`ernofthreeSabahdrylandricevarie2esPoeyShaoJiann,MohamaduBoyieJalloh,andAzwanAwang…………..……………………………………….………..…………73
Rela2onshipbetweenhybridperformanceandgene2cdistance,specificcombiningabilityandheterosisamongparentalinbredlinesinforagecornGhizanSaleh,MaizuraAbuSin,andPedramKashiani………..…………………………………………..……….………..…………81
Gene2cparameterses2ma2onandselec2onofPisumsa(vumaccessionsinlowlandDarmawanSaptadi,MayangAyudyaHandini,NurulHikmah,andBudiWaluyo……………………………………………………..87
SECTION II: ANIMAL GENETICS
Telomerelengthdiversityundertheinfluenceofheatandfeedrestric2onstressesinbroilerchickenBadmus,K.A.,Zulkifli,I.,Goh,Y.M.,Soleimani,A.F.,Sazili,Q.S.,Ernie-Muneerah,M.A.,andKamalludin,M.H.……….…..……95
Phenotypiccharacteriza2onandgene2cvaria2onofNile2lapia(Oreochromisnilo(cus)fromwildandculturepopula2onsAgbebiOlubunmiTemilade,FakunleKikelomoRebecca,OyalekeOdunayoBisola,NwekoyoVitalis,andSanniMuyideenTimothy……………………………….………………………………..………………………………..…… 101
Morphometricvaria2onsofOreochromisnilo(cusfromthreewildpopula2onsinSouth-west(Eleyele,OwallaandOwena)NigeriaAgbebiOlubunmiTemilade,AmadiChukwuemekaKennet,AkinyemiGrace,andSanniMuyideenTimothy………….…………107
Author Index …………………………………………………………….…………………….…..…………………………..…. 112
Subject Index ………………………..………………………………….……………..………..………….……………………… 115
- viii -
129
137
145
151
161
165
REVIEWERS
Prof.Dr.MohamadOsman,AtriAdvisory
Prof.Dr.AbdRahmanMilan,Universi,MalaysiaSabah(UMS)
Assoc.Prof.Dr.AzwanAwang,Universi,MalaysiaSabah(UMS)
Dr.HabsahBidin,MalaysianAgriculturalResearchandDevelopmentIns,tute(MARDI)
Dr.LowKhengOon,MalaysiaGenomeIns,tute(MGI)
Dr.FiqriDizarKhaidizar,UniverisityofMalaya(UM)
Dr.AzzreenaMohamadAzzeme,Universi,PutraMalaysia(UPM)
Dr.AbdulRahimHarun,MalaysianNuclearAgency(MNA)
Dr.MohdDinAmiruddin,MalaysianPalmOilBoard(MPOB)
Dr.Norwa,Muhammad,ForestResearchIns,tuteMalaysia(FRIM)
Dr.NoraishahHasan,Universi,TeknologiMARA(UiTM)
Dr.ShamsiahAbdullah,Universi,TeknologiMARA(UiTM)
Dr.SyarifahAisyafaznimSayedAbdulRahman,UniverisityofMalaya(UM)
Dr.ZaitonAhmad,MalaysianNuclearAgency(NuklearMalaysia)
- ix -
Assoc. Prof. Dr. Halimi Mohd Saud, Universiti Putra Malaysia (UPM)
Dr. Habsah Bidin, Malaysian Agricultural Research and Development Institute (MARDI)
Assoc. Prof. Dr. Yuzine Esa Universiti Putra Malaysia (UPM)
Prof. Dr. Jothi Malar Panandam, Universiti Putra Malaysia (UPM)
Dr. Chan Soon Choy, Perdana University (PU)
Prof. Dr. Thong Meow Keong, Universiti Malaya (UM)
Prof. Dr. Rozita Rosli, Universiti Putra Malaysia (UPM)
Prof. Dr. Zarina Dato’ Hj. Abdul Latiff, Universiti Kebangsaan Malaysia Medical Centre (UKMMC)
Dr. Norshariza Nordin, Universiti Putra Malaysia (UPM)
Mr. Mohaimi Mohamed, Sime Darby
Dr. Mohd Din Amiruddin, Malaysian Palm Oil Board (MPOB)
Dr. Norwati Muhammad, Forest Research Institute Malaysia (FRIM)
Dr. Shamsiah Abdullah, Universiti Teknologi MARA (UiTM)
Dr. Sharifah Shahrul Rabiah Syed Alwee, FGV R&D Sdn. Bhd.
Dr. Syarifah Aisyafaznim Sayed Abdul Rahman, Universiti Malaya (UM)
Dr. Zarina Zainuddin, International Islamic University Malaysia (IIUM)

- x -
Assoc. Prof. Dr. Halimi Mohd Saud, Universiti Putra Malaysia (UPM)
Dr. Habsah Bidin, Malaysian Agricultural Research and Development Institute (MARDI)
Assoc. Prof. Dr. Yuzine Esa Universiti Putra Malaysia (UPM)
Prof. Dr. Jothi Malar Panandam, Universiti Putra Malaysia (UPM)
Dr. Chan Soon Choy, Perdana University (PU)
Prof. Dr. Thong Meow Keong, Universiti Malaya (UM)
Prof. Dr. Rozita Rosli, Universiti Putra Malaysia (UPM)
Prof. Dr. Zarina Dato’ Hj. Abdul Latiff, Universiti Kebangsaan Malaysia Medical Centre (UKMMC)
Dr. Norshariza Nordin, Universiti Putra Malaysia (UPM)
Mr. Mohaimi Mohamed, Sime Darby
Dr. Mohd Din Amiruddin, Malaysian Palm Oil Board (MPOB)
Dr. Norwati Muhammad, Forest Research Institute Malaysia (FRIM)
Dr. Shamsiah Abdullah, Universiti Teknologi MARA (UiTM)
Dr. Sharifah Shahrul Rabiah Syed Alwee, FGV R&D Sdn. Bhd.
Dr. Syarifah Aisyafaznim Sayed Abdul Rahman, Universiti Malaya (UM)
Dr. Zarina Zainuddin, International Islamic University Malaysia (IIUM)

- 1 -
Corresponding author:
Transactions of Persatuan Genetik Malaysia, No. 10, 2019 Published by Genetics Society of Malaysia http://www.pgm-my.org
1
Agronomic performance of ten selected potential kenaf mutant lines at Beseri, Perlis
Abstract
Kenaf (Hibiscus cannabinus L.,) is a high value fiber plant commonly used as a raw material for various industries such as pulp, paper, furniture, construction and automotive. This plant was first introduced in Malaysia in the early 2000 as part of government effort to replace tobacco in tobacco cultivation areas nationwide. Malaysian government through The National Kenaf and Tobacco Board (NKTB) has initially allocated approximately 2000 hectares for smallholder to cultivate kenaf, and the planting areas is expected to increase to 10,000 by 2020. Among the research that have been carried out on kenaf in Malaysia were screening for locally-adapted varieties, development of good agronomic practices, mechanization of planting and harvesting processes as well as development of animal feed and bio-composite. In this project, gamma irradiation was used to induce genetic mutation in Kenaf V36 variety for the development of new varieties with improved traits such as high fiber yield and late flowering. The project which was started in 2015, has generated a number of mutant lines carrying these traits. This paper discusses agronomic performances of ten selected M5 mutant lines at a field plot in Beseri, Perlis. All these selected mutant lines produced higher fiber yield as compared to the control whilst one of them (mutant code: 36-21) also has an additional improved trait (high number of seed pods per plant). Based on their agronomic characters, these mutant lines have the potential to be introduced as new planting materials for kenaf in Malaysia.
Zaiton Ahmad, Agrotechnology and Biosciences Division, Malaysian Nuclear Agency, Bangi, 43000 Kajang, Selangor, MalaysiaEmail: [email protected]
Zaiton Ahmad1, Faiz Ahmad1, Mustapha Akil1, Zulmadi Sani2, Affrida Abu Hassan1 and Mohammad Nazri Romli31 Agrotechnology and Biosciences Division, Malaysian Nuclear Agency, Bangi, 43000 Kajang, Selangor, Malaysia2 Institute of Tropical Agriculture and Food Security, Universiti Putra Malaysia, 43400 UPM Serdang, Selangor, Malaysia3 National Kenaf and Tobacco Board, Km. 2, Jalan Kaki Bukit, Mukim Sena, 01000 Kangar, Perlis, Malaysia
Line
LastKey
Intro
Keywords:Kenaf, Hibiscus cannabinus L., gamma irradiation, mutation breeding, mutant
1 2 3 13
INTRODUCTION
Kenaf (Hibiscus cannabinus L.) is considered a herbaceous annual plant that belongs to Malvaceae family. Other well-known plants that are from the same genus are Hibiscus rosa-sinensis (bunga raya) and Hibiscus sabdariffa (roselle). It is characterized by a large, bell shaped, creamy yellow flower of about 8 to 10 cm in diameter with widely open petals (H’ng et al., 2009). Under normal condition, kenaf plants can grow up to 3 meter tall with an average stem diameter of approximately 2 cm. Its stem fiber is divided into two; bast or bark and core (Paridah 2011).
Kenaf is planted for its fiber in many countries including Malaysia. Besides fiber, kenaf can also be used as an animal feed as they have relatively high protein content. The crude protein content for the whole plant was between 8.99 to 16.23% and crude fiber content was between 16.71 to 37.43% (Jie et al., 2017)
Kenaf was first introduced into Malaysia in the early 2000, as part of the government effort to replace tobacco plants in Kelantan and Terengganu areas. Starting from a very humble beginning with only 0.4 hectare in 2004, the planting acreage has increased to approximately 1,140 hectare in 2011 and is expected to escalate to
10,000 hectare in 2020. Depending on soil and weather conditions, kenaf fiber yield in Malaysia can reach up to 20 tons per hectare in experimental plots, (Lembaga Kenaf and Tembakau Negara, 2013) but generally, the yield in plantation areas is still low which is around 5 to 10 tons per hectare. The highest yield achieved in plantation areas was about 9.8 tons per hectare from V36 (Basri et al., 2014).
A number of research on kenaf has been carried out in Malaysia, mainly in the aspects of screening of suitable varieties adaptable to local weather, development of good agronomic practices, mechanization of planting and harvesting processes. One of the problems faced by kenaf industry in Malaysia is the lack of kenaf varieties that are suitable to Malaysian climate. Most areas are still planted with the same variety which is V36. New varieties which can perform well in local condition especially in terms of biomass yield are highly needed. Therefore, this project was formulated in order to develop new varieties of kenaf with good agronomic traits using mutation breeding technology. Among the traits required are high fiber and seed yield. The other characters that were also investigated in this project were photoperiod insensitive and late flowering or maturity as these are the most essential traits required for growing kenaf plants in a
- 2 -
Zaiton Ahmad et al. (2019): Agronomic performance of ten selected potential kenaf mutant lines
2
1
Transactions of Persatuan Genetik Malaysia, No. 10, 2019
tropical country like Malaysia (Hossain et al., 2011; Wong et al., 2008; Daud et al, 2012). Theoretically, if a plant can delay the reproductive (flowering) process, the energy that is meant for reproduction could instead be channeled to biomass development (especially stem).
Mutation breeding has long been established as a technique for developing new varieties with desirable traits. Since the first release of a mutant variety in 1930s, several outstanding successes have been achieved in this field. The mutation breeding technique has been used in many countries especially China, India, Japan and many others to improve crop varieties such as rice, wheat and barley which have been widely commercialized. Currently, a total of 3,308 new plant varieties have been developed worldwide through mutation breeding technique and registered under International Atomic Energy Agency (IAEA) Mutant Variety Database (http://www-mvd.iaea.org). There were also some reports on the success of generating new mutants of kenaf through mutation breeding (Balogun et al, 2009; Cook and Banuelos, 2011) but at present, none of these mutants are registered with the IAEA (http://www-mvd.iaea.org).
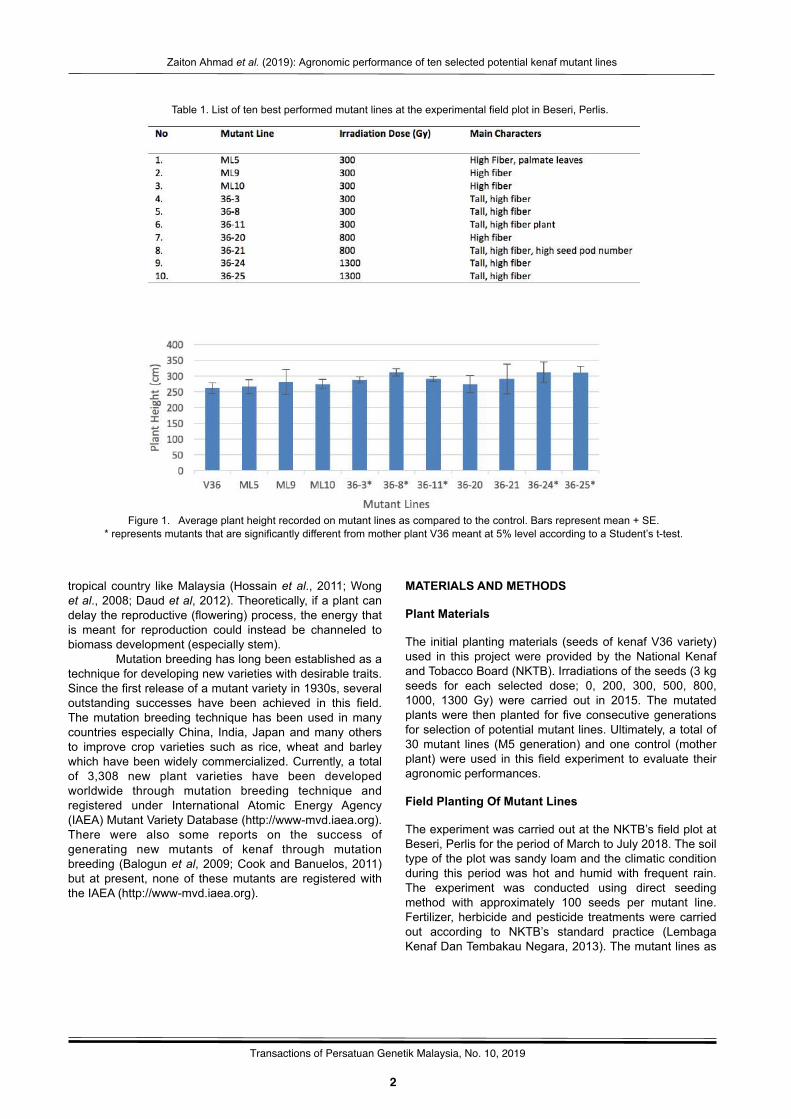
Table 1. List of ten best performed mutant lines at the experimental field plot in Beseri, Perlis.
MATERIALS AND METHODS
Plant Materials
The initial planting materials (seeds of kenaf V36 variety) used in this project were provided by the National Kenaf and Tobacco Board (NKTB). Irradiations of the seeds (3 kg seeds for each selected dose; 0, 200, 300, 500, 800, 1000, 1300 Gy) were carried out in 2015. The mutated plants were then planted for five consecutive generations for selection of potential mutant lines. Ultimately, a total of 30 mutant lines (M5 generation) and one control (mother plant) were used in this field experiment to evaluate their agronomic performances.
Field Planting Of Mutant Lines
The experiment was carried out at the NKTB’s field plot at Beseri, Perlis for the period of March to July 2018. The soil type of the plot was sandy loam and the climatic condition during this period was hot and humid with frequent rain. The experiment was conducted using direct seeding method with approximately 100 seeds per mutant line. Fertilizer, herbicide and pesticide treatments were carried out according to NKTB’s standard practice (Lembaga Kenaf Dan Tembakau Negara, 2013). The mutant lines as
Figure 1. Average plant height recorded on mutant lines as compared to the control. Bars represent mean + SE.* represents mutants that are significantly different from mother plant V36 meant at 5% level according to a Student’s t-test.
- 3 -
Zaiton Ahmad et al. (2019): Agronomic performance of ten selected potential kenaf mutant lines
3
1
Transactions of Persatuan Genetik Malaysia, No. 10, 2019
well as the control were grown until harvesting, approximately 135 days after planting.
Agronomic Characterization Of Mutant Lines
The agronomic data was collected during the harvesting period; (i) plant height (cm), (ii) bast fibre weight (g), (iii) basal and middle stem diameter (mm), (iv) number of pods per plant, (v) leaf morphology, (vi) flower morphology and (vii) percentage of seed maturity. The characters for the mutant lines were analyzed and compared with the control.
Data Analysis
Agronomic data were statistically analyzed using t-test analysis to compare differences between mutant lines and the control at 0.05 significant level using SAS ver. 9.2.
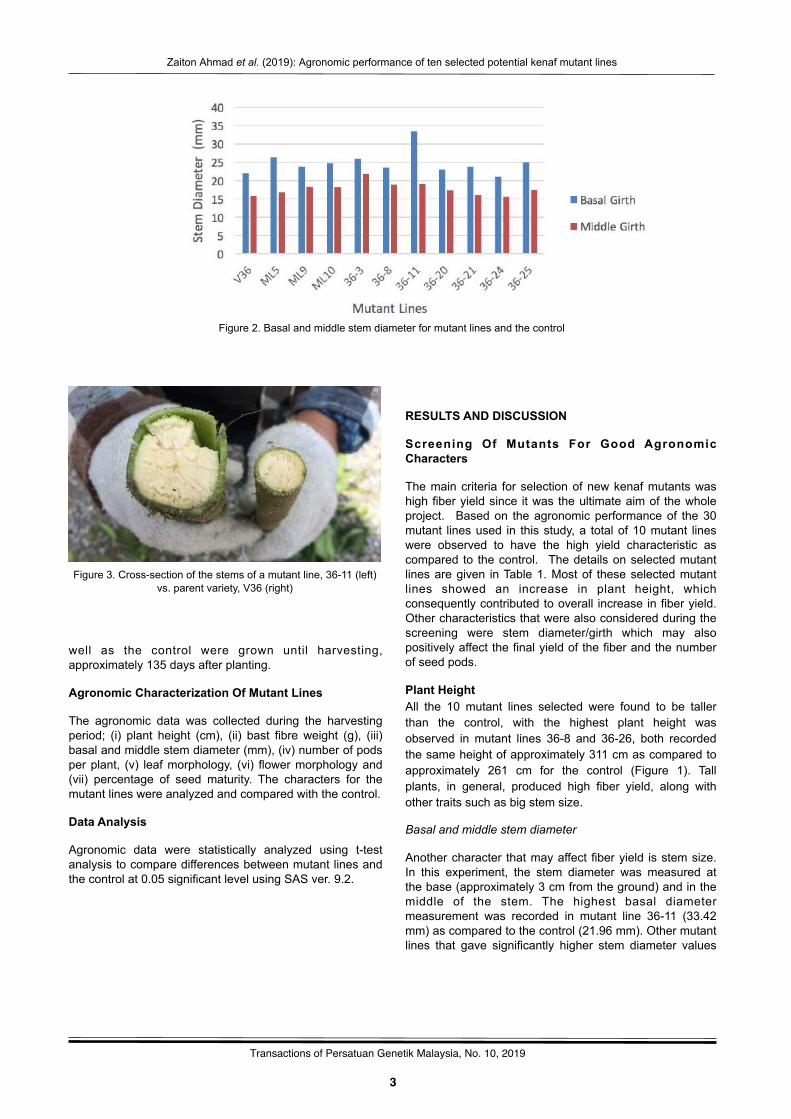
Figure 2. Basal and middle stem diameter for mutant lines and the control
Figure 3. Cross-section of the stems of a mutant line, 36-11 (left) vs. parent variety, V36 (right)
RESULTS AND DISCUSSION
Screening Of Mutants For Good Agronomic Characters
The main criteria for selection of new kenaf mutants was high fiber yield since it was the ultimate aim of the whole project. Based on the agronomic performance of the 30 mutant lines used in this study, a total of 10 mutant lines were observed to have the high yield characteristic as compared to the control. The details on selected mutant lines are given in Table 1. Most of these selected mutant lines showed an increase in plant height, which consequently contributed to overall increase in fiber yield. Other characteristics that were also considered during the screening were stem diameter/girth which may also positively affect the final yield of the fiber and the number of seed pods.
Plant HeightAll the 10 mutant lines selected were found to be taller than the control, with the highest plant height was observed in mutant lines 36-8 and 36-26, both recorded the same height of approximately 311 cm as compared to approximately 261 cm for the control (Figure 1). Tall plants, in general, produced high fiber yield, along with other traits such as big stem size.
Basal and middle stem diameter
Another character that may affect fiber yield is stem size. In this experiment, the stem diameter was measured at the base (approximately 3 cm from the ground) and in the middle of the stem. The highest basal diameter measurement was recorded in mutant line 36-11 (33.42 mm) as compared to the control (21.96 mm). Other mutant lines that gave significantly higher stem diameter values
- 4 -
Zaiton Ahmad et al. (2019): Agronomic performance of ten selected potential kenaf mutant lines
4
1
Transactions of Persatuan Genetik Malaysia, No. 10, 2019
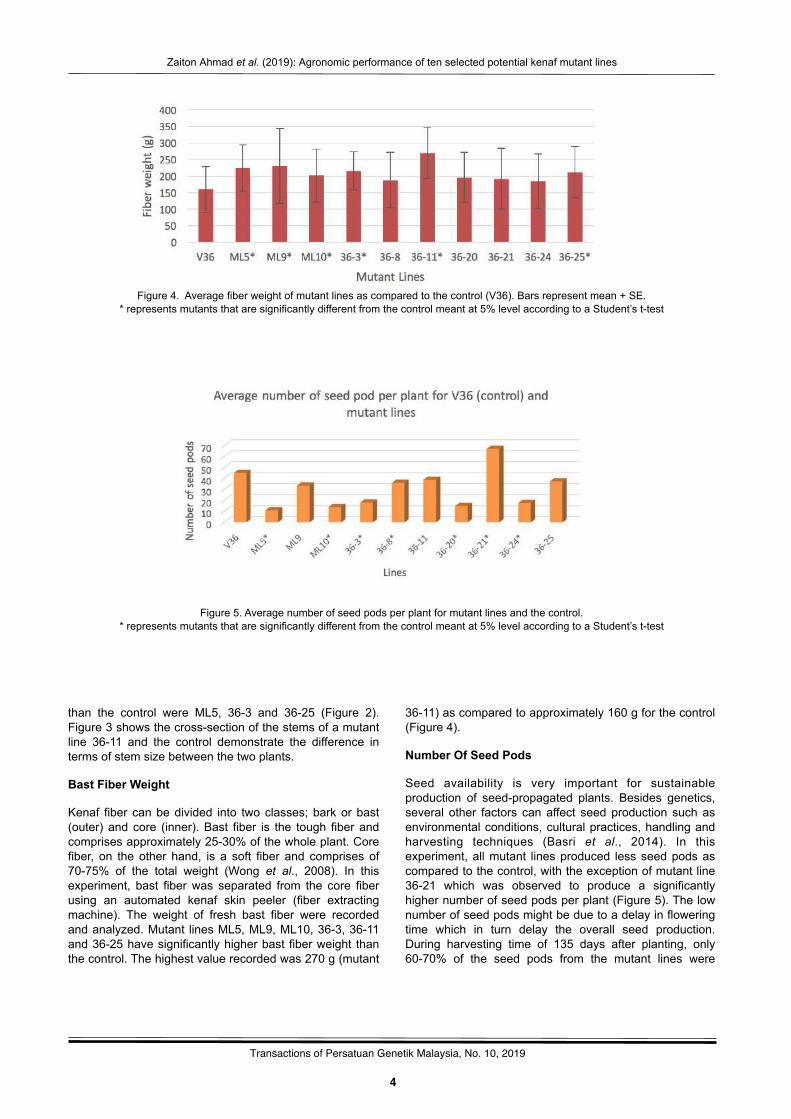
Figure 4. Average fiber weight of mutant lines as compared to the control (V36). Bars represent mean + SE.* represents mutants that are significantly different from the control meant at 5% level according to a Student’s t-test
Figure 5. Average number of seed pods per plant for mutant lines and the control.* represents mutants that are significantly different from the control meant at 5% level according to a Student’s t-test
than the control were ML5, 36-3 and 36-25 (Figure 2). Figure 3 shows the cross-section of the stems of a mutant line 36-11 and the control demonstrate the difference in terms of stem size between the two plants.
Bast Fiber Weight
Kenaf fiber can be divided into two classes; bark or bast (outer) and core (inner). Bast fiber is the tough fiber and comprises approximately 25-30% of the whole plant. Core fiber, on the other hand, is a soft fiber and comprises of 70-75% of the total weight (Wong et al., 2008). In this experiment, bast fiber was separated from the core fiber using an automated kenaf skin peeler (fiber extracting machine). The weight of fresh bast fiber were recorded and analyzed. Mutant lines ML5, ML9, ML10, 36-3, 36-11 and 36-25 have significantly higher bast fiber weight than the control. The highest value recorded was 270 g (mutant
36-11) as compared to approximately 160 g for the control (Figure 4).
Number Of Seed Pods
Seed availability is very important for sustainable production of seed-propagated plants. Besides genetics, several other factors can affect seed production such as environmental conditions, cultural practices, handling and harvesting techniques (Basri et al., 2014). In this experiment, all mutant lines produced less seed pods as compared to the control, with the exception of mutant line 36-21 which was observed to produce a significantly higher number of seed pods per plant (Figure 5). The low number of seed pods might be due to a delay in flowering time which in turn delay the overall seed production. During harvesting time of 135 days after planting, only 60-70% of the seed pods from the mutant lines were
- 5 -
Zaiton Ahmad et al. (2019): Agronomic performance of ten selected potential kenaf mutant lines
5
1
Transactions of Persatuan Genetik Malaysia, No. 10, 2019
already matured as compared to approximately 90% in the control plants. In most mutant plants, small seed pods were still congregated near the terminal end of the stems.
Flower Colour And Leaf Morphology
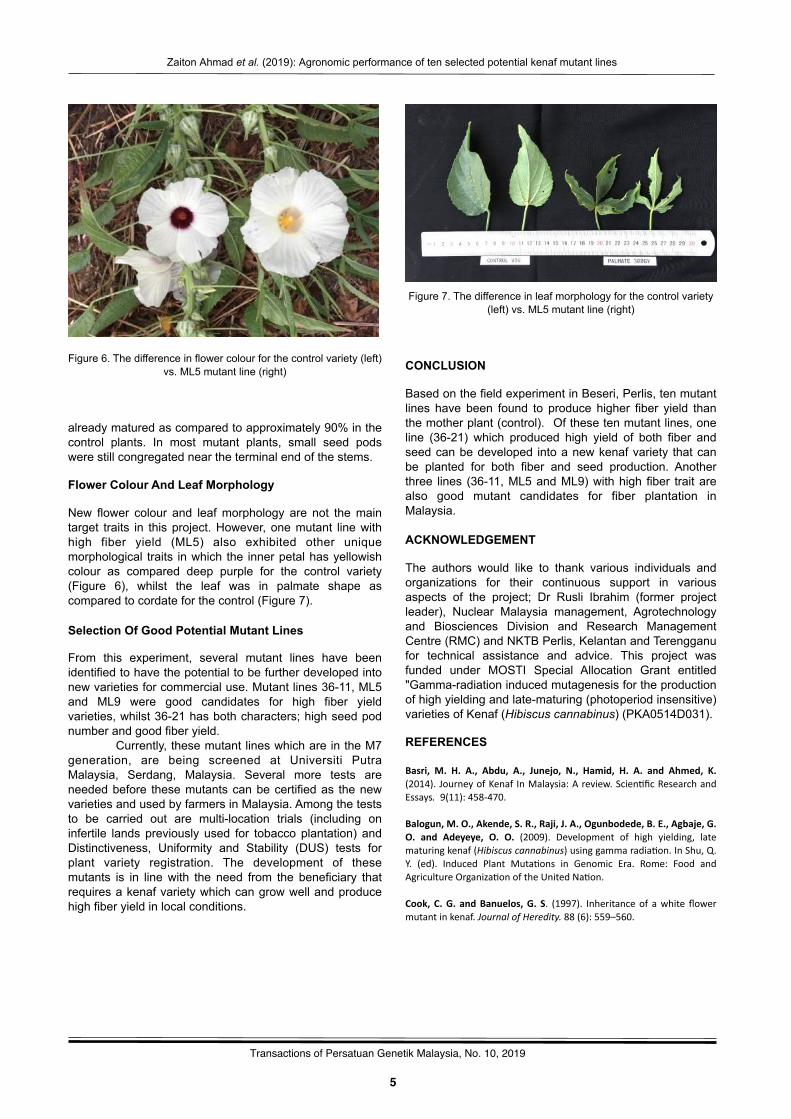
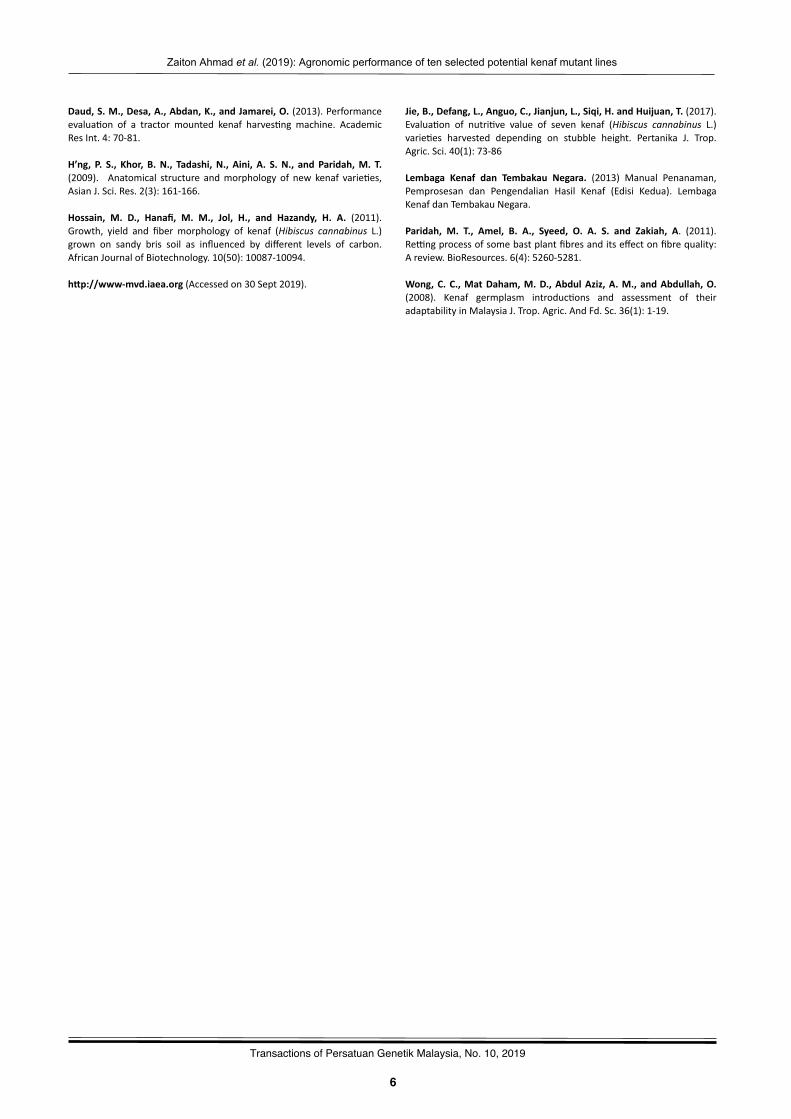
New flower colour and leaf morphology are not the main target traits in this project. However, one mutant line with high fiber yield (ML5) also exhibited other unique morphological traits in which the inner petal has yellowish colour as compared deep purple for the control variety (Figure 6), whilst the leaf was in palmate shape as compared to cordate for the control (Figure 7).
Selection Of Good Potential Mutant Lines
From this experiment, several mutant lines have been identified to have the potential to be further developed into new varieties for commercial use. Mutant lines 36-11, ML5 and ML9 were good candidates for high fiber yield varieties, whilst 36-21 has both characters; high seed pod number and good fiber yield.
Currently, these mutant lines which are in the M7 generation, are being screened at Universiti Putra Malaysia, Serdang, Malaysia. Several more tests are needed before these mutants can be certified as the new varieties and used by farmers in Malaysia. Among the tests to be carried out are multi-location trials (including on infertile lands previously used for tobacco plantation) and Distinctiveness, Uniformity and Stability (DUS) tests for plant variety registration. The development of these mutants is in line with the need from the beneficiary that requires a kenaf variety which can grow well and produce high fiber yield in local conditions.
CONCLUSION
Based on the field experiment in Beseri, Perlis, ten mutant lines have been found to produce higher fiber yield than the mother plant (control). Of these ten mutant lines, one line (36-21) which produced high yield of both fiber and seed can be developed into a new kenaf variety that can be planted for both fiber and seed production. Another three lines (36-11, ML5 and ML9) with high fiber trait are also good mutant candidates for fiber plantation in Malaysia.
ACKNOWLEDGEMENT
The authors would like to thank various individuals and organizations for their continuous support in various aspects of the project; Dr Rusli Ibrahim (former project leader), Nuclear Malaysia management, Agrotechnology and Biosciences Division and Research Management Centre (RMC) and NKTB Perlis, Kelantan and Terengganu for technical assistance and advice. This project was funded under MOSTI Special Allocation Grant entitled "Gamma-radiation induced mutagenesis for the production of high yielding and late-maturing (photoperiod insensitive) varieties of Kenaf (Hibiscus cannabinus) (PKA0514D031).
REFERENCES
Basri, M. H. A., Abdu, A., Junejo, N., Hamid, H. A. and Ahmed, K.(2014).JourneyofKenaf InMalaysia:Areview.Scien?ficResearchandEssays.9(11):458-470.
Balogun,M.O.,Akende,S.R.,Raji,J.A.,Ogunbodede,B.E.,Agbaje,G.O. and Adeyeye, O. O. (2009). Development of high yielding, latematuringkenaf(Hibiscuscannabinus)usinggammaradia?on.InShu,Q.Y. (ed). Induced Plant Muta?ons in Genomic Era. Rome: Food andAgricultureOrganiza?onoftheUnitedNa?on.
Cook, C.G. andBanuelos,G. S. (1997). Inheritanceof awhiteflowermutantinkenaf.JournalofHeredity.88(6):559–560.
Figure 7. The difference in leaf morphology for the control variety (left) vs. ML5 mutant line (right)
Figure 6. The difference in flower colour for the control variety (left) vs. ML5 mutant line (right)
- 6 -
Zaiton Ahmad et al. (2019): Agronomic performance of ten selected potential kenaf mutant lines
6
1
Transactions of Persatuan Genetik Malaysia, No. 10, 2019
Daud,S.M.,Desa,A.,Abdan,K.,andJamarei,O.(2013).Performanceevalua?on of a tractor mounted kenaf harves?ng machine. AcademicResInt.4:70-81.
H’ng, P. S., Khor, B.N., Tadashi,N., Aini, A. S.N., and Paridah,M. T.(2009). Anatomical structure andmorphology of new kenaf varie?es,AsianJ.Sci.Res.2(3):161-166.
Hossain, M. D., Hanafi, M. M., Jol, H., and Hazandy, H. A. (2011).Growth, yield and fiber morphology of kenaf (Hibiscus cannabinus L.)grown on sandy bris soil as influenced by different levels of carbon.AfricanJournalofBiotechnology.10(50):10087-10094.
hJp://www-mvd.iaea.org(Accessedon30Sept2019).
Jie,B.,Defang,L.,Anguo,C.,Jianjun,L.,Siqi,H.andHuijuan,T.(2017).Evalua?on of nutri?ve value of seven kenaf (Hibiscus cannabinus L.)varie?es harvested depending on stubble height. Pertanika J. Trop.Agric.Sci.40(1):73-86
Lembaga Kenaf dan Tembakau Negara. (2013) Manual Penanaman,Pemprosesan dan Pengendalian Hasil Kenaf (Edisi Kedua). LembagaKenafdanTembakauNegara.
Paridah, M. T., Amel, B. A., Syeed, O. A. S. and Zakiah, A. (2011).Recngprocessofsomebastplantfibresanditseffectonfibrequality:Areview.BioResources.6(4):5260-5281.
Wong,C.C.,MatDaham,M.D.,AbdulAziz,A.M.,andAbdullah,O.(2008). Kenaf germplasm introduc?ons and assessment of theiradaptabilityinMalaysiaJ.Trop.Agric.AndFd.Sc.36(1):1-19.
- 7 -
Corresponding author:
Transactions of Persatuan Genetik Malaysia, No. 10, 2019 Published by Genetics Society of Malaysia http://www.pgm-my.org
7
Validation of similarity between brinjal T-64 and Bt brinjal event EE-1
Dhabitah Kamaruzzaman1, Hazwani Humaira’ Zakaria1, Norlia Basherudin1, Norwati Muhammad1, Nur Nabilah Alias1, and Norwati Adnan2
1 Genetics Laboratory, Forestry Biotechnology Division, Forest Research Institute Malaysia, 52109 Kepong, Selangor, Malaysia2 Biosafety Department, Ministry of Water, Land and Natural Resources, Malaysia
Dhabitah Kamaruzzaman, Genetics Laboratory, Forestry Biotechnology Division, Forest Research Institute Malaysia, 52109 Kepong, Selangor, MalaysiaEmail: [email protected]
Abstract
Transgenicbrinjalwithinsectresistance(Btbrinjal)wasdevelopedasanalterna?vetocontrollargeinsec?cideusageagainstfruitandshootborers inbrinjal crop.Bt brinjal termedas event EE-1, contains insect resistance gene (Cry1Ac) under the control of CaMVpromoterandNOSterminator,withnptIIgeneastheselectablemarker.Brinjalisoneofthecommonlyconsumedvegetablesandhasbeencon?nuouslyimportedtomeetthelocalmarket’sdemandinMalaysia.Therefore,gene?callymodified(GM)detec?oniscrucialtodeterminebrinjaliden?tyforfoodsafetyconcern.However,EE-1brinjalreferencematerialisnotcommerciallyavailableandtherequirementoflongprocessofdocumenta?ontogetthematerialfromthedeveloperhaslimitedourefforttodevelopeventspecificdetec?onmethodforEE-1brinjalinMalaysia.Meanwhile,BiosafetyDepartmentofMalaysiahasprovidedpoten?alEE-1brinjalseed(T-64)tobetested.Thebrinjalseedwasvalidatedusingpolymerasechainreac?on(PCR)andSangerDNAsequencingforevidenceofsimilaritywithEE-1brinjal. ThePCRconductedhas successfullyamplifiedall theDNA fragmentsofEE-1brinjal.DNAsequencingresultrevealedthatbothT-64andEE-1brinjalhavehighsimilarityscore.TheresultconfirmsthatT-64brinjalisindeedEE-1brinjalandcouldbeusedindevelopingeventspecificdetec?onmethodforEE-1brinjal.
Line
LastKey
Intro
Keywords: LMOdetec?on;Cry1ACgene,Btbrinjal
INTRODUCTION
Brinjal or eggplant (Solanum melongena L.) belongs toSolanaceaefamilyisanimportantvegetableinSouthandSouth-East Asia (Gautam, 2019). It is beneficial for human healthbecauseofitshighfiberandwatercontent,richinan?-oxidants,high in vitamins, proteins, calcium and phosphorus (Shaukat,2018).BrinjalhasbeenanimportantvegetablecropandisbeinggrownextensivelyinIndia,Bangladesh,Pakistan,ChinaandthePhilippinesaswellasatthewarmtemperatezones,especiallyinSouthernEuropeandtheSouthernUnitedStates.
Despite its poten?al as commercial vegetable crop,brinjal is suscep?ble tomanydiseasesandpests, including theeggplant fruit and shoot borer (EFSB, Leucinodes orbonalisGuenée). EFSB is a medium-sized moth (Lepidoptera:Crambidae)whose feeding larvae cause damage to the brinjalcrop by boring into stems and fruits. Yield, therefore, can beaffected either by severely damagedor destroyed fruits, or bydamagetothedevelopingplant.EFSBhasbeendescribedasthemostseriousanddestruc?vepesttobrinjalcrops(Sheltonetal.,2018;Parimi&Zehr,2009). Brinjal losses toEFSB in India liesanywherebetween5.3-54.8%ofthetotalyieldofcrop(Andow,
2010). Farmers depend on broad spectrum of insec?cide onbrinjalcropstocontroltheinfesta?onbutitisacostlyprac?ceandalsorenderingresiduesonthefruits.
Inviewofthepestanddiseasesseriousproblems,thegene?cally modified brinjal or known as Bt brinjal has beendeveloped by India-basedMaharashtra Hybrid Seed Company(Mahyco) to give resistance againstlepidopteroninsects, inpar?cular the EFSB. The Bt brinjal registered as EE-1, wascreated by inser?ng a crystal protein gene(Cry1Ac) from thesoilbacteriumBacillus thuringiensisinto thegenomeof variousbrinjalcul?vars. The inser?on of the gene, along with othergene?c elements such aspromoters,terminatorsandanan?bio?c resistancemarker gene into the brinjal plant isaccomplished usingAgrobacterium-mediated gene?ctransforma?on.
Malaysia has imported brinjal from abroad to meetlocal market’s demand (Suhana et al., 2016). Therefore, it iscrucialtodevelopeffec?veandaccurateanaly?calmethodsfordetec?onof thisEE-1brinjal inorder toensurecompliance toMalaysiaBiosafetyAct2007.Suchmethodhasbeendevelopedby Ballari et al., in 2012 from CSIR-Central Food TechnologyResearch Ins?tute, India. They had developed a single and
- 8 -
Dhabitah Kamaruzzaman et al. (2019): Validation of similarity between brinjal T-64 and Bt brinjal event EE-1
8
2
Transactions of Persatuan Genetik Malaysia, No. 10, 2019
mul?plexPCRmethodsusingboth standard and real-?mePCR(qPCR)to detect EE-1 brinjal. Molecular diagnos?c method forEE-1brinjaldetec?onusingprimerpairtoamplifytheinser?onlocus region was also published in patent documentWO2007/091277byChar&Ghandi in 2016. The two researchpaperswerethemainreferencesinthisstudy.
Referencematerialplaysanimportantroleforqualitycontrol in GM detec?on to make certain of the GM elementtraceability.Lackofreferencematerialcausedbylongprocessofdocumenta?on to obtain thematerial from the developer haslimitstheefforttodevelopeventspecificdetec?onmethodforEE-1 brinjal inMalaysia. Hence, the focus of this studywas tovalidate the brinjal seed sample provided by BiosafetyDepartment of Malaysia for its compa?bility as a referencematerial. The EE-1 posi?ve brinjal would be useful for thedevelopment of event specific EE-1brinjal detec?onmethod inMalaysia.
METHODS
DNAExtracWon
Seedsofbrinjal(T-64)sampleprovidedbyBiosafetyDepartmentofMalaysiaweregroundandextractedusingtheDNeasyPlantMini Kit (Qiagen, Germany) according to the manufacturer’sprotocol. The absorbance ra?oof (A₂₆₀/₂₃₀) and (A₂₆₀/₂₈₀)were
used todetermine thequan?tyandqualityof totalDNAusingNanodrop2000(ThermoScien?fic,US).
PCRamplificaWon
PCR was conducted using exTen PCR Mastermix (1st BASE,Malaysia) with 1µL of T-64 extracted DNA and 0.5µL 10 Mmprimers specific (18S rDNA, CaMV 35S promoter, NOSterminator, nptII gene, Cry1Ac gene and EE-1).Each primerssequences and expected amplicon size are listed in Table 1.Commercially available Cer?fied Reference Material, MON531cowon (AOCS0804-C) was used as posi?ve control. PCRcondi?ons included ini?al denatura?on of 95°C for 5min,followedby35cyclesofdenatura?onat95°Cfor20s,annealing
at60°C(18S,35S,NOS,nptII,EE-1)and50°C(Cry1Ac),extensionat 72°C for 1min andfinal extension at 72°C for 10min. PCRproductswereanalyzedusing1.5%agarosegelelectrophoresissupplementedwith0.1%GelRedin1xTAEbufferfor33minat120V.ThePCRamplifica?onswereviewedusingAlphaImagerMINI (Cell Biosciences, Australia). PCR product of EE-1 waselutedfromthegelandpurifiedusingMinEluteGelExtrac?onKit (Qiagen, Germany) following the manufacturer’s protocol.The DNA fragment was prepared for cloning into a plasmidvector.
Plasmid construct and transformaWon into Escherichia coliTop10competentcells
The DNA fragment of EE-1 was ligated into pCR®2.1 and the
recombinant(EE-1∴pCR®2.1)wasthentransformedintoTOP10competentcellsthroughheatshockmethod.Subsequently,SOCmedium was added and shook at 37°C for 1 h. Thetransformantswas spread on LB agar supplementedwith 100µg/mL ampicilin and 40 µL X-gal, and then incubated forovernightat37°C.SinglecoloniesthatgrewontheplatewereisolatedandculturedovernightinLBbroth.
PurificaWonandsequencingofplasmidDNA
Plasmid DNA of cultured bacteria was purified using QIAprepSpin Miniprep Kit (Qiagen, Germany) following themanufacturer’s protocol. BigDye Terminator Sequencing Kit(Applied Biosystems, US) was used in cycle sequencing. Thecyclesequencingthermalcondi?onsincludedini?aldenaturingstep of 1min at 95°C, followedby 40 cycles at 95°C for 10 s,50°C for 5 s and 60°C for 4 min. Sequencing reac?ons werepurified by using BigDye XTerminator Purifica?on Kit (AppliedBiosystems, US) and run on the ABI 3130xl Gene?c Analyzer(AppliedBiosystems,US).
DNASequencingdataAnalysis
The raw sequence was edited and assembled usingSEQUENCHER version 5.3 (Gene Codes Corpora?on, US). The
Table1.Primersequencesusedinthisstudy
- 9 -
Dhabitah Kamaruzzaman et al. (2019): Validation of similarity between brinjal T-64 and Bt brinjal event EE-1
9
2
Transactions of Persatuan Genetik Malaysia, No. 10, 2019
iden?fiedsequencewascomparedtoreferencesequenceusingmul?ple sequence alignment tool of BLASTN with the defaultparameters. Reference sequence of EE-1 brinjal Cry1Ac genewasobtained frompatentdocumentWO2007/091277 (Char&Ghandi,2016).
RESULTSANDDISCUSSION
PCRscreeningforEE-1brinjaldetecWon
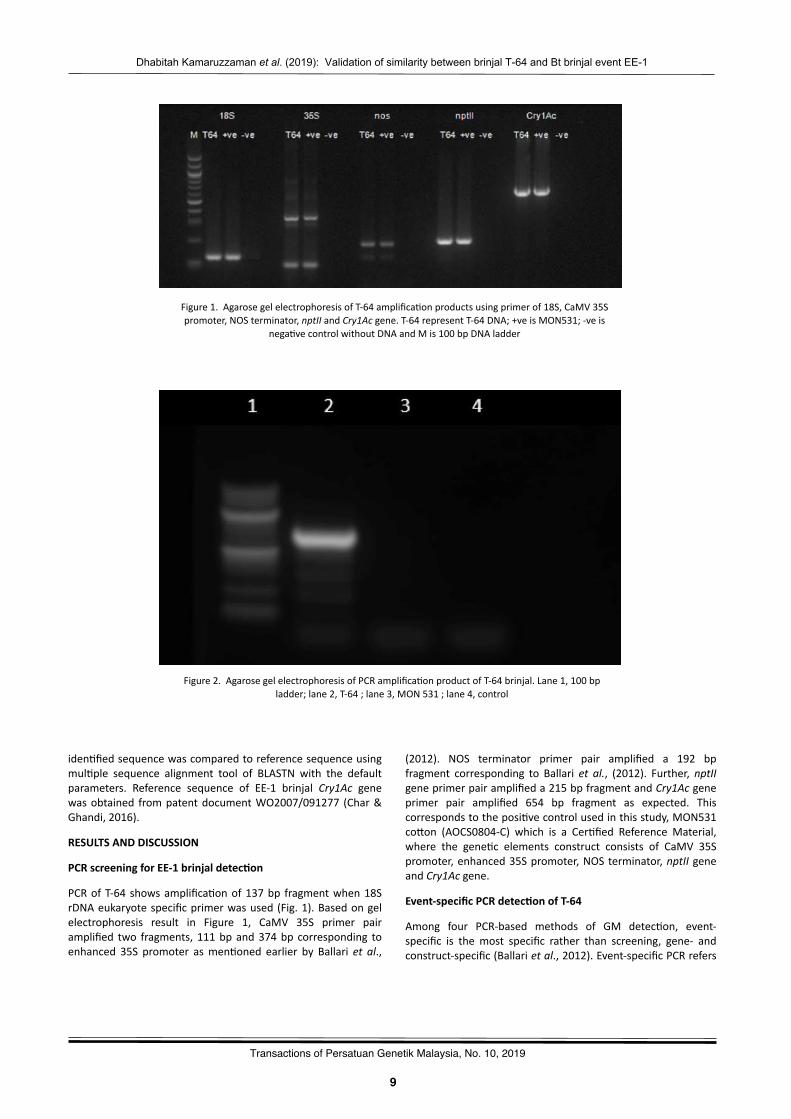
PCRofT-64 showsamplifica?onof137bp fragmentwhen18SrDNAeukaryotespecificprimerwasused(Fig.1).Basedongelelectrophoresis result in Figure 1, CaMV 35S primer pairamplified two fragments, 111bpand374bp corresponding toenhanced 35S promoter asmen?oned earlier by Ballari et al.,
Figure1.AgarosegelelectrophoresisofT-64amplifica?onproductsusingprimerof18S,CaMV35Spromoter,NOSterminator,nptIIandCry1Acgene.T-64representT-64DNA;+veisMON531;-veis
nega?vecontrolwithoutDNAandMis100bpDNAladder
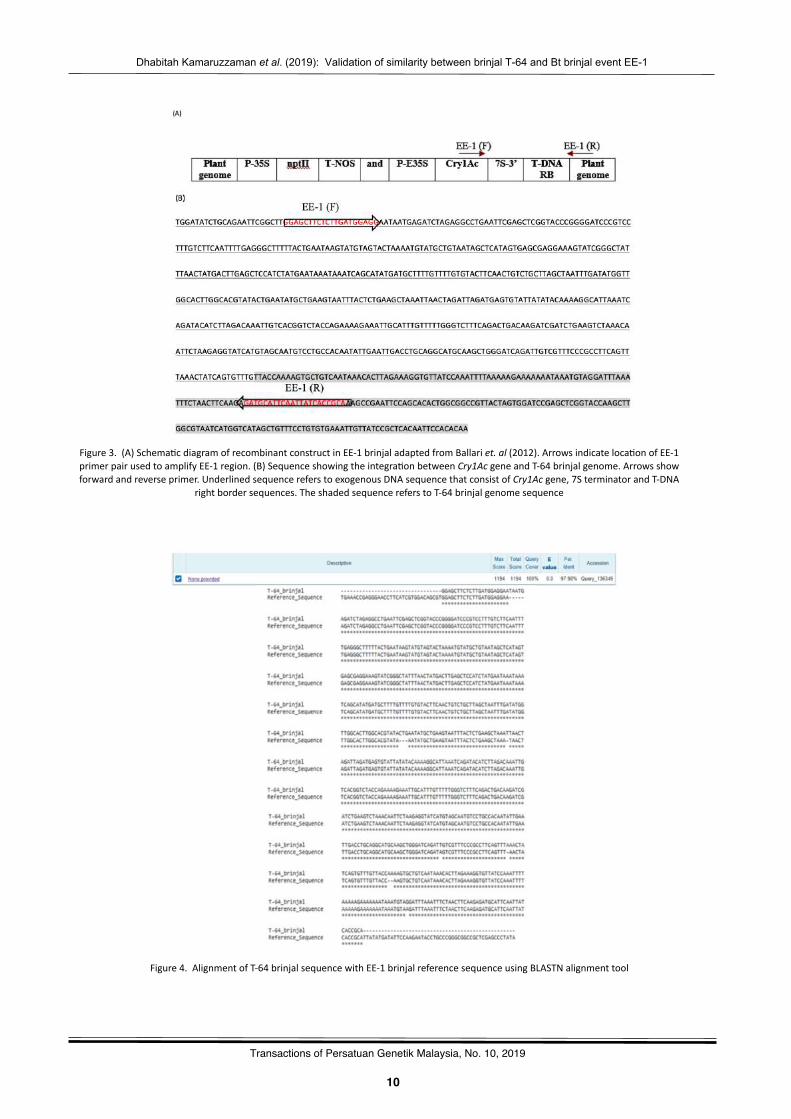
Figure2.AgarosegelelectrophoresisofPCRamplifica?onproductofT-64brinjal.Lane1,100bpladder;lane2,T-64;lane3,MON531;lane4,control
(2012). NOS terminator primer pair amplified a 192 bpfragment corresponding to Ballari et al., (2012). Further,nptIIgeneprimerpairamplifieda215bpfragmentandCry1Acgeneprimer pair amplified 654 bp fragment as expected. Thiscorrespondstotheposi?vecontrolusedinthisstudy,MON531cowon (AOCS0804-C) which is a Cer?fied Reference Material,where the gene?c elements construct consists of CaMV 35Spromoter,enhanced35Spromoter,NOSterminator,nptIIgeneandCry1Acgene.
Event-specificPCRdetecWonofT-64
Among four PCR-based methods of GM detec?on, event-specific is the most specific rather than screening, gene- andconstruct-specific(Ballarietal.,2012).Event-specificPCRrefers
- 10 -
Dhabitah Kamaruzzaman et al. (2019): Validation of similarity between brinjal T-64 and Bt brinjal event EE-1
10
2
Transactions of Persatuan Genetik Malaysia, No. 10, 2019
Figure3.(A)Schema?cdiagramofrecombinantconstructinEE-1brinjaladaptedfromBallariet.al(2012).Arrowsindicateloca?onofEE-1primerpairusedtoamplifyEE-1region.(B)Sequenceshowingtheintegra?onbetweenCry1AcgeneandT-64brinjalgenome.Arrowsshowforwardandreverseprimer.UnderlinedsequencereferstoexogenousDNAsequencethatconsistofCry1Acgene,7SterminatorandT-DNA
rightbordersequences.TheshadedsequencereferstoT-64brinjalgenomesequence
Figure4.AlignmentofT-64brinjalsequencewithEE-1brinjalreferencesequenceusingBLASTNalignmenttool
- 11 -
Dhabitah Kamaruzzaman et al. (2019): Validation of similarity between brinjal T-64 and Bt brinjal event EE-1
11
2
Transactions of Persatuan Genetik Malaysia, No. 10, 2019
to the amplifica?on of integra?on junc?on between hostgenome and transgenic DNA sequence which promotes highspecificityforGMdetec?on.Thus,toreconfirmthepreliminaryscreening results, T-64was amplified using EE-1 event specificprimersretrievedfrompatentdocumentWO2007/091277.EE-1forward primer targets the transgenic region of Cry1AcsequenceandEE-1reverseprimertargetsflankingregionofthebrinjal DNA genome sequence. EE-1 primer pair generatesexpectedamplifica?onproductof685bpforT-64(Figure2),butno amplifica?onwas found inMON 531 sample indicated thespecificity of EE-1 event specific primers. Hence, T-64 ispoten?ally an EE-1 Bt brinjal due to the amplifica?on of EE-1specificregion.
DNASequencedataanalysis
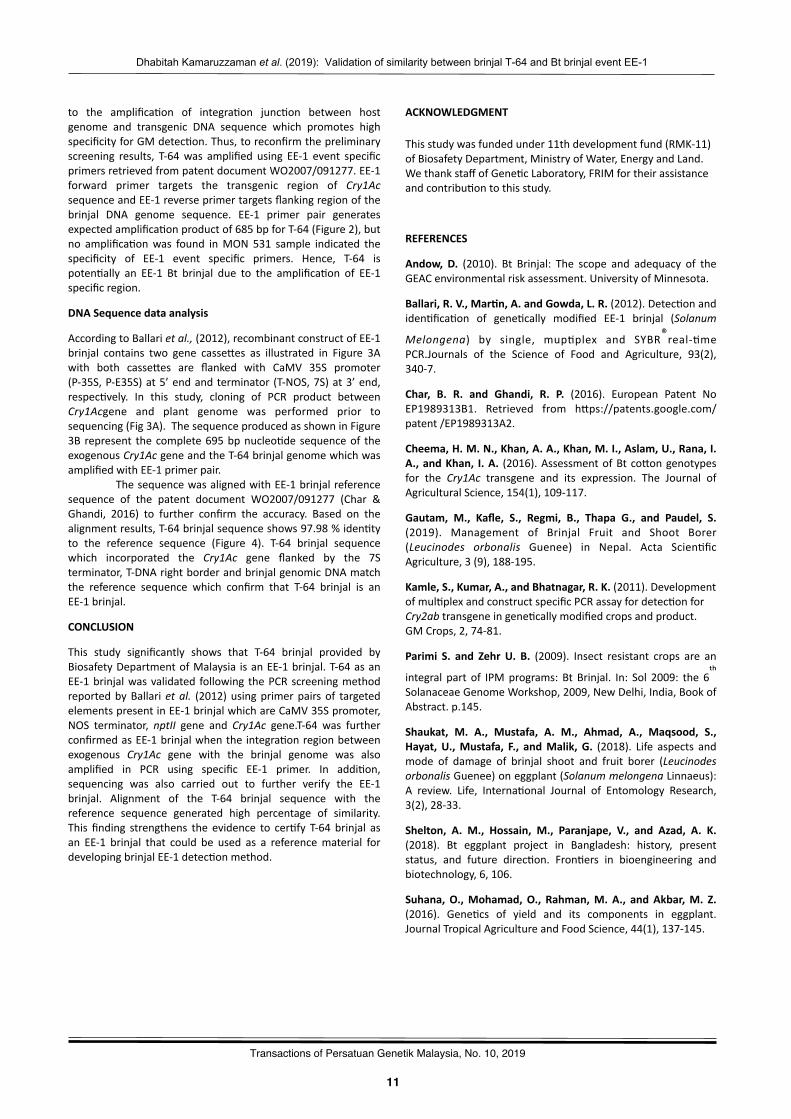
AccordingtoBallarietal.,(2012),recombinantconstructofEE-1brinjal contains two gene cassewes as illustrated in Figure 3Awith both cassewes are flanked with CaMV 35S promoter(P-35S,P-E35S)at5’endandterminator (T-NOS,7S)at3’end,respec?vely. In this study, cloning of PCR product betweenCry1Acgene and plant genome was performed prior tosequencing(Fig3A).ThesequenceproducedasshowninFigure3B represent thecomplete695bpnucleo?desequenceof theexogenousCry1AcgeneandtheT-64brinjalgenomewhichwasamplifiedwithEE-1primerpair.
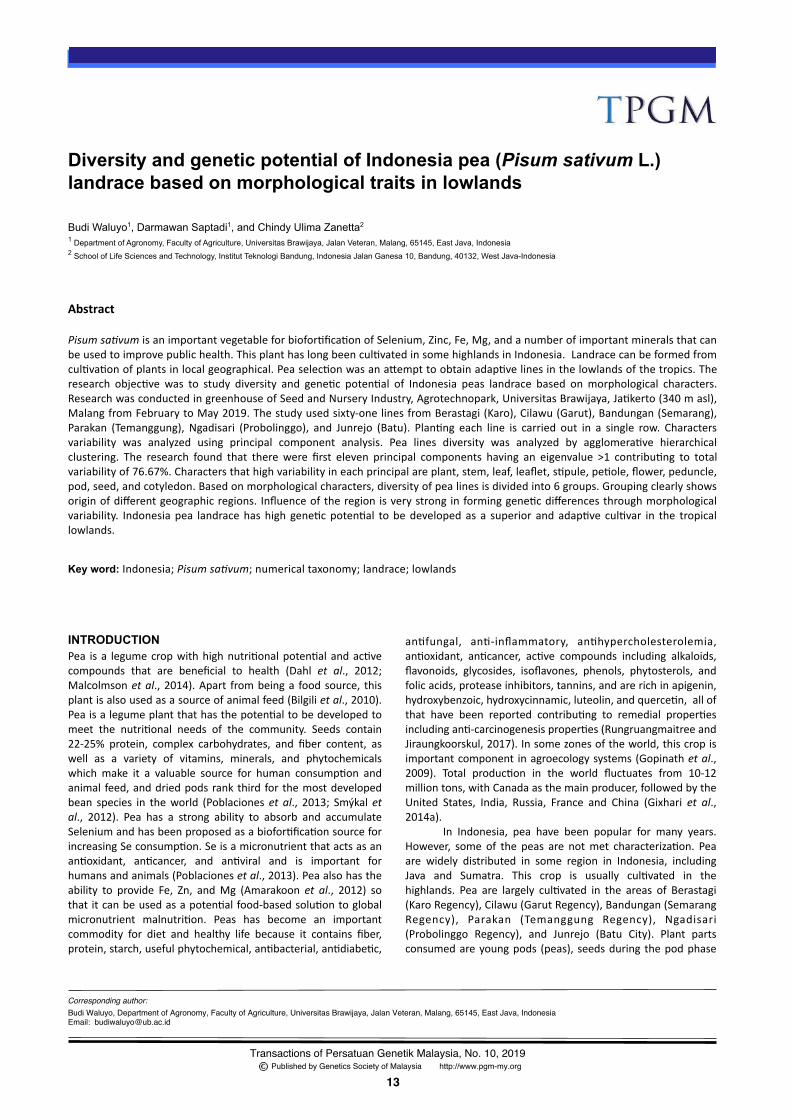
ThesequencewasalignedwithEE-1brinjalreferencesequence of the patent document WO2007/091277 (Char &Ghandi, 2016) to further confirm the accuracy. Based on thealignmentresults,T-64brinjalsequenceshows97.98%iden?tyto the reference sequence (Figure 4). T-64 brinjal sequencewhich incorporated the Cry1Ac gene flanked by the 7Sterminator,T-DNArightborderandbrinjalgenomicDNAmatchthe reference sequence which confirm that T-64 brinjal is anEE-1brinjal.
CONCLUSION
This study significantly shows that T-64 brinjal provided byBiosafetyDepartmentofMalaysia isanEE-1brinjal.T-64asanEE-1brinjalwasvalidated following thePCRscreeningmethodreportedbyBallarietal. (2012)usingprimerpairsof targetedelementspresentinEE-1brinjalwhichareCaMV35Spromoter,NOS terminator, nptII gene and Cry1Ac gene.T-64 was furtherconfirmedasEE-1brinjalwhentheintegra?onregionbetweenexogenous Cry1Ac gene with the brinjal genome was alsoamplified in PCR using specific EE-1 primer. In addi?on,sequencing was also carried out to further verify the EE-1brinjal. Alignment of the T-64 brinjal sequence with thereference sequence generated high percentage of similarity.This finding strengthens the evidence to cer?fy T-64 brinjal asan EE-1 brinjal that could be used as a referencematerial fordevelopingbrinjalEE-1detec?onmethod.
ACKNOWLEDGMENT
Thisstudywasfundedunder11thdevelopmentfund(RMK-11)ofBiosafetyDepartment,MinistryofWater,EnergyandLand.WethankstaffofGene?cLaboratory,FRIMfortheirassistanceandcontribu?ontothisstudy.
REFERENCES
Andow, D. (2010). Bt Brinjal: The scope and adequacy of theGEACenvironmentalriskassessment.UniversityofMinnesota.
Ballari,R.V.,MarWn,A.andGowda,L.R.(2012).Detec?onandiden?fica?on of gene?cally modified EE-1 brinjal (Solanum
Melongena) by single, mup?plex and SYBR®real-?mePCR.Journals of the Science of Food and Agriculture, 93(2),340-7.
Char, B. R. and Ghandi, R. P. (2016). European Patent NoEP1989313B1. Retrieved from hwps://patents.google.com/patent/EP1989313A2.
Cheema,H.M.N.,Khan,A.A.,Khan,M.I.,Aslam,U.,Rana,I.A.,andKhan, I.A. (2016).AssessmentofBtcowongenotypesfor the Cry1Ac transgene and its expression. The Journal ofAgriculturalScience,154(1),109-117.
Gautam, M., Kafle, S., Regmi, B., Thapa G., and Paudel, S.(2019). Management of Brinjal Fruit and Shoot Borer(Leucinodes orbonalis Guenee) in Nepal. Acta Scien?ficAgriculture,3(9),188-195.
Kamle,S.,Kumar,A.,andBhatnagar,R.K.(2011).Developmentofmul?plexandconstructspecificPCRassayfordetec?onforCry2abtransgeneingene?callymodifiedcropsandproduct.GMCrops,2,74-81.
Parimi S. and Zehr U. B. (2009). Insect resistant crops are an
integral part of IPMprograms: Bt Brinjal. In: Sol 2009: the 6|}SolanaceaeGenomeWorkshop,2009,NewDelhi,India,BookofAbstract.p.145.
Shaukat, M. A., Mustafa, A. M., Ahmad, A., Maqsood, S.,Hayat,U.,Mustafa, F., andMalik, G. (2018). Life aspects andmode of damage of brinjal shoot and fruit borer (LeucinodesorbonalisGuenee)oneggplant(SolanummelongenaLinnaeus):A review. Life, Interna?onal Journal of Entomology Research,3(2),28-33.
Shelton, A. M., Hossain, M., Paranjape, V., and Azad, A. K.(2018). Bt eggplant project in Bangladesh: history, presentstatus, and future direc?on. Fron?ers in bioengineering andbiotechnology,6,106.
Suhana,O.,Mohamad,O., Rahman,M. A., andAkbar,M. Z.(2016). Gene?cs of yield and its components in eggplant.JournalTropicalAgricultureandFoodScience,44(1),137-145.

- 12 -Transactions of Persatuan Genetik Malaysia, No. 10, 2019
12
- 13 -
Corresponding author:
Transactions of Persatuan Genetik Malaysia, No. 10, 2019 Published by Genetics Society of Malaysia http://www.pgm-my.org
13
Diversity and genetic potential of Indonesia pea (Pisum sativum L.) landrace based on morphological traits in lowlands
Budi Waluyo1, Darmawan Saptadi1, and Chindy Ulima Zanetta2
1 Department of Agronomy, Faculty of Agriculture, Universitas Brawijaya, Jalan Veteran, Malang, 65145, East Java, Indonesia2 School of Life Sciences and Technology, Institut Teknologi Bandung, Indonesia Jalan Ganesa 10, Bandung, 40132, West Java-Indonesia
Budi Waluyo, Department of Agronomy, Faculty of Agriculture, Universitas Brawijaya, Jalan Veteran, Malang, 65145, East Java, IndonesiaEmail: [email protected]
Key word: Indonesia;PisumsaGvum;numericaltaxonomy;landrace;lowlands
Line
LastKey
Intro
Abstract
PisumsaGvumisanimportantvegetableforbiofor?fica?onofSelenium,Zinc,Fe,Mg,andanumberofimportantmineralsthatcanbeusedtoimprovepublichealth.Thisplanthaslongbeencul?vatedinsomehighlandsinIndonesia.Landracecanbeformedfromcul?va?onofplantsinlocalgeographical.Peaselec?onwasanawempttoobtainadap?velinesinthelowlandsofthetropics.Theresearch objec?ve was to study diversity and gene?c poten?al of Indonesia peas landrace based onmorphological characters.ResearchwasconductedingreenhouseofSeedandNurseryIndustry,Agrotechnopark,UniversitasBrawijaya,Ja?kerto(340masl),MalangfromFebruarytoMay2019.Thestudyusedsixty-onelinesfromBerastagi(Karo),Cilawu(Garut),Bandungan(Semarang),Parakan (Temanggung), Ngadisari (Probolinggo), and Junrejo (Batu). Plan?ng each line is carried out in a single row. Charactersvariability was analyzed using principal component analysis. Pea lines diversity was analyzed by agglomera?ve hierarchicalclustering. The research found that there were first eleven principal components having an eigenvalue >1 contribu?ng to totalvariabilityof76.67%.Charactersthathighvariabilityineachprincipalareplant,stem,leaf,leaflet,s?pule,pe?ole,flower,peduncle,pod,seed,andcotyledon.Basedonmorphologicalcharacters,diversityofpealinesisdividedinto6groups.Groupingclearlyshowsoriginofdifferentgeographicregions. Influenceoftheregionisverystronginforminggene?cdifferencesthroughmorphologicalvariability. Indonesiapea landracehashigh gene?cpoten?al tobedevelopedas a superior andadap?ve cul?var in the tropicallowlands.
INTRODUCTIONPea isa legumecropwithhighnutri?onalpoten?alandac?vecompounds that are beneficial to health (Dahl et al., 2012;Malcolmsonetal.,2014).Apart frombeinga foodsource, thisplantisalsousedasasourceofanimalfeed(Bilgilietal.,2010).Peaisalegumeplantthathasthepoten?altobedevelopedtomeet the nutri?onal needs of the community. Seeds contain22-25% protein, complex carbohydrates, and fiber content, aswell as a variety of vitamins, minerals, and phytochemicalswhich make it a valuable source for human consump?on andanimal feed,anddriedpodsrankthird for themostdevelopedbean species in theworld (Poblacioneset al., 2013; Smýkaletal., 2012). Pea has a strong ability to absorb and accumulateSeleniumandhasbeenproposedasabiofor?fica?onsourceforincreasingSeconsump?on.Seisamicronutrientthatactsasanan?oxidant, an?cancer, and an?viral and is important forhumansandanimals(Poblacionesetal.,2013).Peaalsohastheability to provide Fe, Zn, andMg (Amarakoon et al., 2012) sothat itcanbeusedasapoten?alfood-basedsolu?ontoglobalmicronutrient malnutri?on. Peas has become an importantcommodity for diet and healthy life because it contains fiber,protein,starch,usefulphytochemical,an?bacterial,an?diabe?c,
an?fungal, an?-inflammatory, an?hypercholesterolemia,an?oxidant, an?cancer, ac?ve compounds including alkaloids,flavonoids, glycosides, isoflavones, phenols, phytosterols, andfolicacids,proteaseinhibitors,tannins,andarerichinapigenin,hydroxybenzoic,hydroxycinnamic,luteolin,andquerce?n,allofthat have been reported contribu?ng to remedial proper?esincludingan?-carcinogenesisproper?es(RungruangmaitreeandJiraungkoorskul,2017).Insomezonesoftheworld,thiscropisimportantcomponent inagroecologysystems(Gopinathetal.,2009). Total produc?on in the world fluctuates from 10-12milliontons,withCanadaasthemainproducer,followedbytheUnited States, India, Russia, France and China (Gixhari et al.,2014a).
In Indonesia, pea have been popular for many years.However, some of the peas are notmet characteriza?on. Peaare widely distributed in some region in Indonesia, includingJava and Sumatra. This crop is usually cul?vated in thehighlands. Pea are largely cul?vated in the areas of Berastagi(KaroRegency),Cilawu(GarutRegency),Bandungan(SemarangRegency), Parakan (Temanggung Regency), Ngadisari(Probolinggo Regency), and Junrejo (Batu City). Plant partsconsumedareyoungpods (peas), seedsduring thepodphase
- 14 -
Budi Waluyo et al. (2019): Diversity and genetic potential of Indonesia pea landrace
14
3
Transactions of Persatuan Genetik Malaysia, No. 10, 2019
just before physiological maturity (peas, green peas), and dryseeds (dry peas). Nevertheless, informa?on about charactersvariabilityandgenotypesdiversityofpeas is s?ll limited.Somefarmers usually only suggest gene?c differences in peas basedon morphology in stems, leaves, flowers, fruits, and seeds todetermine a local name. Many local names reflect gene?cdiversityandadapta?ontoenvironmentalcondi?ons.
Peasarevaryinthecharacterofthepodandseedthatusuallyadjustedforthepurposeofconsump?onandprocessingas well as the smells (Malcolmson et al., 2014). Charactervariabilityinpeashasbeenextensivelystudiedinmorphologicaland agronomic characters which show a wide diversity andserve as a basis for selec?ng superior genotypes (Avci andCeyhan,2013;Barcchiyaetal.,2018;Gudadinnietal.,2017;Paland Singh, 2013; Singh et al., 2017). The selec?on of pea
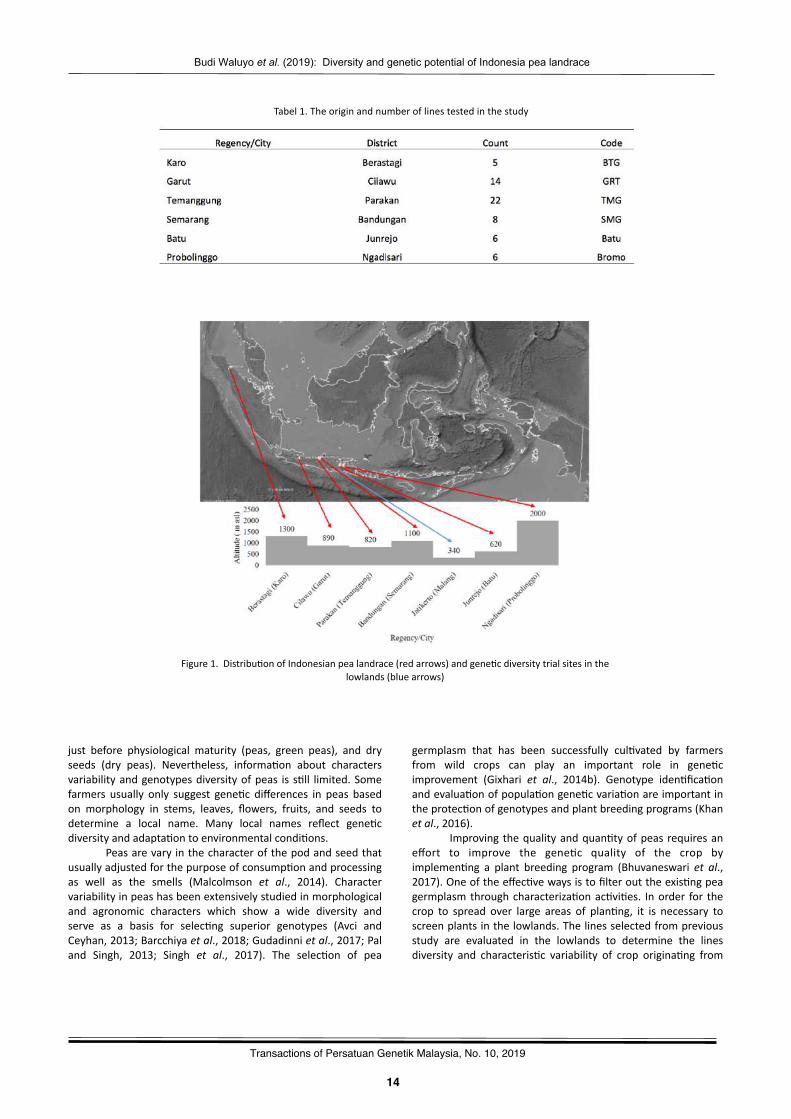
Figure1.Distribu?onofIndonesianpealandrace(redarrows)andgene?cdiversitytrialsitesinthelowlands(bluearrows)
Tabel1.Theoriginandnumberoflinestestedinthestudy
germplasm that has been successfully cul?vated by farmersfrom wild crops can play an important role in gene?cimprovement (Gixhari et al., 2014b). Genotype iden?fica?onandevalua?onofpopula?ongene?cvaria?onareimportantintheprotec?onofgenotypesandplantbreedingprograms(Khanetal.,2016).
Improving thequalityandquan?tyofpeasrequiresaneffort to improve the gene?c quality of the crop byimplemen?ng a plant breeding program (Bhuvaneswari et al.,2017).Oneoftheeffec?vewaysistofilterouttheexis?ngpeagermplasmthroughcharacteriza?onac?vi?es. Inorder for thecrop to spread over large areas of plan?ng, it is necessary toscreenplantsinthelowlands.Thelinesselectedfrompreviousstudy are evaluated in the lowlands to determine the linesdiversity and characteris?c variability of crop origina?ng from
- 15 -
Budi Waluyo et al. (2019): Diversity and genetic potential of Indonesia pea landrace
15
3
Transactions of Persatuan Genetik Malaysia, No. 10, 2019
Table2.Eigenvalues,variability,cumula?vevariability,andprincipalcomponentsfor51morphologicaltraitsof61linesofpeasinlowland
- 16 -
Budi Waluyo et al. (2019): Diversity and genetic potential of Indonesia pea landrace
16
3
Transactions of Persatuan Genetik Malaysia, No. 10, 2019
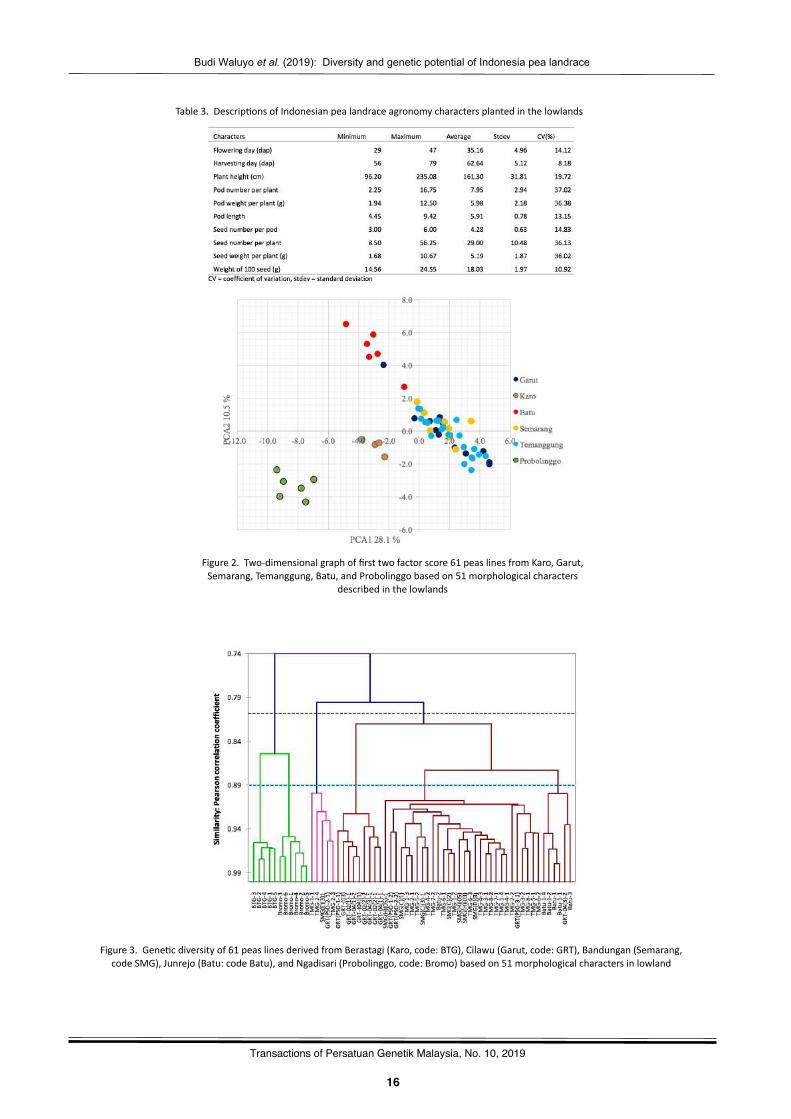
Table3.Descrip?onsofIndonesianpealandraceagronomycharactersplantedinthelowlands
Figure2.Two-dimensionalgraphoffirsttwofactorscore61peaslinesfromKaro,Garut,Semarang,Temanggung,Batu,andProbolinggobasedon51morphologicalcharacters
describedinthelowlands
Figure3.Gene?cdiversityof61peaslinesderivedfromBerastagi(Karo,code:BTG),Cilawu(Garut,code:GRT),Bandungan(Semarang,codeSMG),Junrejo(Batu:codeBatu),andNgadisari(Probolinggo,code:Bromo)basedon51morphologicalcharactersinlowland
- 17 -
Budi Waluyo et al. (2019): Diversity and genetic potential of Indonesia pea landrace
17
3
Transactions of Persatuan Genetik Malaysia, No. 10, 2019
different regions. Assessment of lines diversity and charactervariability is important to be expected in rela?on to selec?onandtheuseofpeasasacandidateforvarie?esandmaterialforenhancing the gene?c capacity (Ahmad et al., 2014; Ali et al.,2007;Habtamu,2013;Iqbaletal.,2017;Singhetal.,2017).Theobjec?ve of this study is to study the diversity and gene?cpoten?al of Indonesian local peas based on morphologicalcharactersplantedinlowlandareas.
MATERIALSANDMETHODS
Research was conducted from February to May 2019 at thegreenhouse of Seed and Nursery Industry, Agrotechnopark,UniversitasBrawijaya,Ja?kerto(340masl),Malang.Thestudyused sixty-one lines separated from landrace origin fromBerastagi (Karo Regency), Cilawu (Garut Regency), Bandungan(Semarang Regency), Parakan (Temanggung Regency), Bromo(Ngadisari,ProbolinggoRegency),andJunrejo(BatuCity)(Table1).Eachlineswasplantedinasinglerowplot.Ineachploteightplants were planted. Observa?ons were made on themorphological characteris?cs of each plant in the plot.PisumsaGvum characteriza?on was performed using the criteria ofthe Interna?onalUnion for theProtec?onofNewVarie?esofPlants(UPOV)(TG7/9PisumsaGvum).
Morphological character variability was analyzedusingprincipalcomponentanalysis(PCA)basedonthetypeofPearsoncorrela?oncoefficient(n).Thecomponentmeaningfulif eigenvalue has a value >1. The characters in each principalcomponentarecontribu?ngtothetotalvariability if thevalueof the loading factor > 0.6 (Peres-Neto et al., 2003). Linesdiversitywasanalyzedbyagglomera?vehierarchicalclustering(AHC) to grouping based on similarity Pearson correla?oncoefficient and unweighted pair group average as a fusioncriterion. Analysis of data usingMicroso�® Excel 2007/XLSTATVersion2009.3.02.
RESULTSANDDISCUSSION
Lines are obtained frompea-producing areas in Indonesia andhavebeencul?vatedbyfarmers forgenera?ons.Separa?onoflines from each area of origin is based on seed physicalcharacteris?cs, includingshape,size,andseedcolor.Seedsareplantedindividually.Inthefollowingseasonseedsfromaplantare then planted in a row. Because pea are self-pollina?ngplants, one row of plants shows a homogeneous appearanceand is called a line. Theoriginof ercis regionof each line andal?tudeareshowninFigure1.
Generallyseedsfromthesameareaorfromdifferentregions have different physical characteris?cs that are easilydis?nguishablevisually.This isahighgene?cpoten?al to formhigh yielding varie?es from local popula?on. The presence ofpeasintropicalhighlandareascanbeusedtoselectplantsthatareadap?ve inthe lowlands.Thisselec?oneffortwas ini?atedbymeasuringcharactersvariabilityand linesdiversityobtainedasabasisforselec?on.
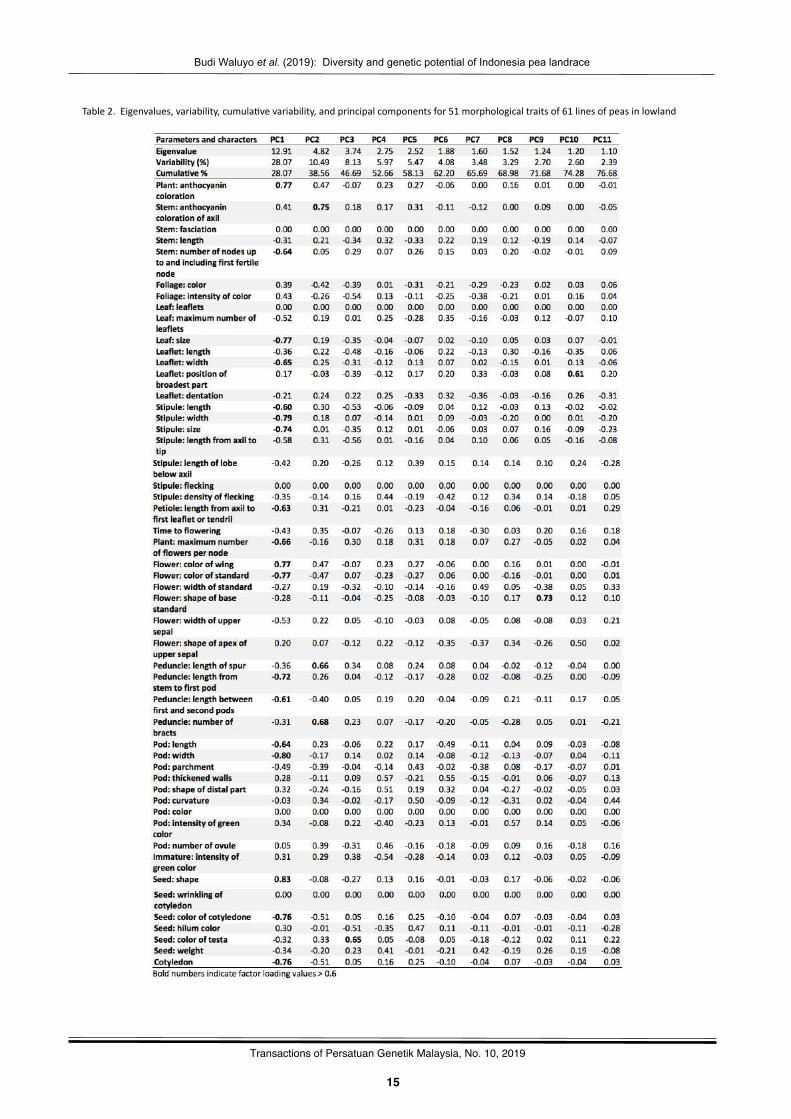
Principal component analysis (PCA) was performed for51morphologicaltraitsofpeasgenotypesas indicated inTable2.Outofforty-three,firstelevenprincipalcomponentsshowedeigenvalue >1. These three components explain 76.7% of the
varia?on in the data.. The first eleven principal componentsweregivendueimportanceforthefurtherexplana?on.PC1hadeigenvalue 12.91 with the highest variability of 28.07 %. PC2had eigenvalue 4.82 with a variability of 10.49 %. PC3 hadeigenvalue3.74withvariabilityof8.13%.PC4hadeigenvalue2.75withavariabilityof5.97%.PC5hadeigenvalue2.52withvariabilityof5.47%.PC6hadeigenvalue1.88withvariabilityof4.08%.PC7hadeigenvalue1.60withvariabilityof3.48%.PC8had eigenvalue 1.52 with variability of 3.29 %. PC9 hadeigenvalue1.24withvariabilityof2.70%.PC10hadeigenvalue1.20withvariabilityof2.60%.PC11hadeigenvalue1.10withvariability of 2.39 %. Each component can be determinedcharacters that contribute to the total variability which isindicatedbyaloadingfactor>0.6.Thelargerabsolutevalueofloadingfactor,moreimportantthecorrespondingvariableisincalcula?ng the component. Although total variability isdetermined by firt eleven principal components but based onfactorloadingonlyPC1,PC2,PC3,PC9,andPC10hascharacterswithhighvariability.
PC1wasmorerelatedtoplant:anthocyanincolora?on,stem: number of nodes up to and including first fer?le node,leaf: size, leaflet:width, s?pule: length, s?pule:width, s?pule:size, pe?ole: length from axil to first leaflet or tendril, plant:maximumnumber of flowers per node, flower: color ofwing,flower: color of standard, peduncle: length from stem to firstpod, peduncle: length between first and second pods, pod:length, pod: width, seed: shape, seed: color of cotyledon,cotyledon. InPC2was related to stem:anthocyanincolora?onof axil, peduncle: length of spur, peduncle: number of bracts.PC3correlatedwith,seed:coloroftesta.PC9wasmorerelatedto flower: shape of base standard. PC10 exhibited leaflet:posi?on of broadest part. The posi?ve and nega?ve sign onfactor loading values indicates the influence of character onvariability.
In the PCA and AHC, agronomic character data isconverted into data categories according to the Interna?onalUnionfortheProtec?onofNewVarie?esofPlants(UPOV)(TG7/9 Pisum saGvum). Agronomic character is a very importantcharacteris?cofeachpealineplantedinthelowlandsbecauseit is a selec?on criterion. In this study some agronomiccharacters are displayed descrip?vely with respect to harvest?me and yields obtained (Table 3). The pea popula?on fromIndonesiaplantedinthelowlandshasafloweringdayrangeof29dapto47dapwithanaverageof35dap,andhasharves?ngdaybetween56dapto79dapwithanaverageof62dap.Plantheight between 96.2 cm to 235.08 cm with an average of161.30cm.Podnumbersperplantarebetween2.25and16.75withanaverageof7.95.Podweightperplantisbetween1.94gand 12.50 g with an average of 5.98 g. Pod lengths are from4.45cmto9.42cmwithanaverageof5.91cm.Seednumberperpodbetween3to6withanaverageof4.27.Seednumberperplant isbetween8.50and56.25withanaverageof29.00.Seedweight per plant is between1.68 g and 10.67 gwith anaverageof5.19g.Weightof100seedsrangingfrom14.56gto24.54gwithanaverageof18.03g.Basedonthecoefficientofvaria?on the lowest varia?on is found in the harves?ng day,whilethehighestvariabilityisfoundinthenumberofpodsperplant.
- 18 -
Budi Waluyo et al. (2019): Diversity and genetic potential of Indonesia pea landrace
18
3
Transactions of Persatuan Genetik Malaysia, No. 10, 2019
PCA biplot first two factor score of morphologicalcharacters indicated the presence of peas grouping by origincollec?on loca?on (Figure2). This is verypossiblebecause theinfluence of the regional origin environment is very strong informing gene?c differences. Lines origina?ng from differentregions show diversity to form specific lines grouping whichshows that localgermplasmhas thegreatgene?cpoten?al tobedevelopedassuperiorandadap?vevarie?esinthetropical.Linesderived fromBerastagi,Bromo,andBatu indicatea cleargene?c separa?on based on morphological character. Thisdivergence indicates that farmers who have inherited gene?cmaterialhavebeenable toexplicitly formdis?nctpopula?ons.Theaddi?onofpurelineselec?ontothephysicalcharacteris?csof different seeds has increased the diversity of peas inIndonesia.While linesseparatedfromthepopula?onofGarut,Temanggung,andSemarangdonotshowanyspecificityfortheregion.However,theselinesalsoexpressthemselvesdifferentlyfromthelinesderivedfromtheBatuandProbolinggo.
Batu, and Probolinggo based on 51morphological charactersdescribedinthelowlands
Peaslineswerealsoclassifiedintodifferentclustersonthebasisofallmorphologicaltraits.Thesimilargenotypeswereclassifiedintothesameclusterbasedontheirvariousmorphologicaltraitsstudied. Cluster analysis is used to determine the gene?cproximitybetweenlinesusingthemorphologicalproper?esofaplantbecausemorphologicalproper?escanbeusedtoiden?fyanddescribespecies-levelkinship(Saragihetal.,2018).Studyofgene?c divergence among the plantmaterials is an importanttooltotheplantbreedersforanefficientselec?onofthediverseparents for their poten?al use in a peas breeding program fortheimprovementofthepeasproduc?oninlowlands.
Cluster analysis of 61 peas lines based on 51morphologicalcharactersperformedinthelowlandsresultedingene?cdivergence. The similarity coefficients generated in thedendrogram range from 0.74 to 1. At the dendrogram cutoffwithacoefficientof0.8, therearethreemajorgroupsof lines.But this distance does not separate the lines based on theregion's origin (Figure 3). At a similarity distance deduc?on of0.89,itformed6clustersinwhichthelinesweredividedbasedontheareaoforiginoftheoriginalpopula?on.Mostno?ceableare the pea lines origina?ng from Garut, Semarang, andTemanggungalthoughsomeoftheseliness?llshowamixingofthe original region. The greater the value of the coefficient ofsimilarity, the higher the similarity that these strains have. Onthecontrary, thesmaller thevalueof thesimilarity coefficient,the lower the degree of similarity that these lines have. Peaslineswere also classified into different clusters based on theirvarious morphological traits. Lines having the samecharacteris?cswereclassifiedintothesamecluster.
CONCLUSION
Charactersof Indonesianpealandraceplantedinthelowlandshaveahigh variability.Basedonprincipal componentanalysisrevealed that thefirstelevenprincipal componentsaccountedfor 76.6% of the total varia?on. The character of eachcomponent that contributes to variability were plant, stem,
leaf, leaflet, s?pule, pe?ole, flower, peduncle, pod, seed, andcotyledon. In agronomic characters the lowest variabilitywasfound in the harves?ng ?me and the highest variability wasfound in the number of pods per plant. The lines based onstudied traits were classified in 6 groups based on similarityPearson correla?on coefficient 0.89. The lines show uniquecharacteris?csbasedontheregionoforigin.ItwasshownthatIndonesia pea landrace has the great gene?c poten?al to bedeveloped as superior and adap?ve varie?es in the tropicallowlands.
ACKNOWLEDGMENTS
The research was supported by a Grant of PNBP Faculty ofAgriculture2019,UniversitasBrawijaya,Indonesia.
REFERENCES
Ahmad,H.B.,Rauf,S.,Rafiq,C.M.,Mohsin,A.U.,andIqbal,A.(2014).Es?ma?onofgene?cvariabilityinpea(PisumsaGvumL.).J.Glob.Innov.Agric.Soc.Sci.2:62–64.
Ali, Z., Qureshi, A. S., Ali,W., Gulzar, H., Nisar,M., and Ghafoor, A.(2007).Evalua?onofgene?cdiversitypresentinpea(PisumsaGvumL.)germplasm based on morphological traits, resistance to powderymildewandmolecularcharacteris?cs.PakistanJ.Bot.39:2739–2747.
Amarakoon,D.,Thavarajah,D.,McPhee,K.,andThavarajah,P.(2012).Iron-, zinc-, and magnesium-rich field peas (Pisum saGvum L.) withnaturally low phy?c acid: A poten?al food-based solu?on to globalmicronutrientmalnutri?on.J.FoodCompos.Anal.27:8–13.
Avci,M.A.,andCeyhan,E.(2013).Determina?onofsomeagriculturalcharactersofpea (PisumsaGvum L.) genotypes. J.Anim.Vet.Adv.12:798–802.
Barcchiya, J.,Naidu,A.,Mehta,A.,andUpadhyay,A. (2018).Gene?cvariability, heritability and gene?c advance for seed yield and yieldcomponents in garden pea (Pisum saGvum L.). Int. J. Chem. Stud. 6:3324–3327.
Bhuvaneswari, S., Sharma, S. K., Punitha, P., Shashidhar, K. S.,Naveenkumar, K. L., and Prakash, N. (2017). Evalua?on ofmorphologicaldiversityoffieldpea[PisumsaGvumsubsp.arvense(L.)]germplasmundersub-tropicalclimateofManipur.Agric.Res.Commun.Cent.40:215–223.Bilgili,U.,Uzun,A.,Sincik,M.,Yavuz,M.,Aydinoǧlu,B.,Çakmakci,S.,Geren, H., Avcioǧlu, R., Nizam, I., Tekeli, A. S., Gül, I., Anlarsal, E.,Yücel,C.,Avci,M.,Acar,Z.,Ayan,I.,Üstün,A.,andAçikgöz,E.(2010).Forageyieldandlodgingtraitsinpeas(PisumsaGvumL.)withdifferentleaftypes.TurkishJ.F.Crop.15:50–53.
Dahl,W.J.,Foster,L.M.,andTyler,R.T.(2012).Reviewofthehealthbenefitsofpeas(PisumsaGvumL.).Br.J.Nutr.108:S3–S10.
Gixhari,B.,Pavelková,M.,Ismaili,H.,Vrapi,H.,Jaupi,A.,andSmýkal,P.(2014).Gene?cdiversityofAlbanianPea(PisumsaGvumL.)landracesassessed by morphological traits and molecular markers. Czech J.Genet.PlantBreed.50:177–184.
Gixhari, B., Vrapi, H., and Hobdari, V. (2014). Morphologicalcharacteriza?onofpea(PisumsaGvumL.)genotypesstoredinAlbaniangenebank.AlbanianJ.Agric.Sci.Specialed.169–173.
- 19 -
Budi Waluyo et al. (2019): Diversity and genetic potential of Indonesia pea landrace
19
3
Transactions of Persatuan Genetik Malaysia, No. 10, 2019
Gopinath,K.A.,Saha,S.,Mina,B.L.,Pande,H.,Kumar,N.,Srivastva,A.K.,andGupta,H.S.(2009).Yieldpoten?alofgardenpea(PisumsaGvumL.) varie?es, and soil proper?es under organic and integrated nutrientmanagementsystems.Arch.Agron.SoilSci.55:157–167.
Gudadinni, P., Bahadur, V., Ligade, P., Topno, S. E., and Prasad, V.M.(2017). Studyongene?c variability, heritability andgene?cadvance ingardenpea(PisumsaGvumvar.hortenseL.).Int.J.Curr.Microbiol.Appl.Sci.6:2384–2391.
Habtamu, S. (2013).Mul?variate analysis of some Ethiopian field pea(PisumsaGvumL.)genotypes.Int.J.Genet.Mol.Biol.5:78–87.
Iqbal, A., Shah, S., Nisar, M., and Ghafoor, A. (2017). Morphologicalcharacteriza?on and selec?on for high yielding and powdery mildewresistantpea(PisumsaGvum)lines.SainsMalaysiana.46:1727–1734.
Khan,R.A.,Mahbub,M.,Reza,M.A., Shirazy,B. J., andMahmud,F.(2016). Selec?on of field pea (Pisum saGvum L.) genotypes throughmul?variateanalysis.Sci.Agric.16:98–103.
Malcolmson, L., Frohlich, P., Boux, G., Bellido, A. S., Boye, J., andWarkenWn,T.D.(2014).Aromaandflavourproper?esofSaskatchewangrownfieldpeas(PisumsaGvumL.).Can.J.PlantSci.94:1419–1426.
Pal, A. K. and Singh, S. (2013). Assessment and gene?c variability ingardenpea(PisumsaGvumL.var.Hortense).Int.J.Agric.Sci.9.
Peres-Neto, P. R., Jackson, D. A., and Somers, K. M. (2003). Givingmeaningful interpreta?on to ordina?on axes: assessing loadingsignificanceinprincipalcomponentanalysis.Ecology84:2347–2363.
Poblaciones, M. J., Rodrigo, S. M., and Santamaría, O. (2013).Evalua?on of the poten?al of peas (Pisum saGvum L.) to be used inSelenium biofor?fica?on programs under mediterranean condi?ons.Biol.TraceElem.Res.151:132–137.
Rungruangmaitree, R., and Jiraungkoorskul, W. (2017). Pea, Pisumsa?vum,anditsan?cancerac?vity.Pharmacogn.Rev.11:39.
Saragih, R., Saptadi, D., ZaneJa, C. U., and Waluyo, B. (2018).Keanekaragaman geno?pe-geno?pe potensial dan penentuankeragamankarakterargo-morfologiercis (PisumsaGvumL.). J.Agro.5:127–139.
Singh,S.R.,Ahmed,N.,Singh,D.B.,Srivastva,K.K.,Singh,R.K.,andMir,A. (2017).Gene?cvariabilitydetermina?on ingardenpea (PisumsaGvumLsubsp.HortenseAsch.andGraebn.)byusingthemul?variateanalysis.Legum.Res.40:416–422.
Smýkal,P.,Aubert,G.,BursWn,J.,Coyne,C.J.,Ellis,N.T.H.,Flavell,A.J.,Ford,R.,Hýbl,M.,Macas,J.,Neumann,P.,McPhee,K.E.,Redden,R.J.,Rubiales,D.,Weller,J.L.,andWarkenWn,T.D.(2012).Pea(PisumsaGvumL.)inthegenomicera.Agronomy.2:74–115.

- 20 -Transactions of Persatuan Genetik Malaysia, No. 10, 2019
20
- 21 -
Corresponding author:
Transactions of Persatuan Genetik Malaysia, No. 10, 2019 Published by Genetics Society of Malaysia http://www.pgm-my.org
7
21
Preliminary study on polyembryonic Harumanis mango (Mangifera indica) seedlings
Zul Helmey Mohamad Sabdin1, Muhammad Najib Othman Ghani2, Muhamad Hafiz Muhamad Hassan1, and Mohd Shahril Firdaus Abdul Razak3
1 Horticulture Research Centre, MARDI Sintok, 06050 Bukit Kayu Hitam, Kedah2 Industrial Crop Research Centre, MARDI Headquarters, Persiaran MARDI-UPM 43400 Serdang, Selangor3 Biotechnology and Nanotechnology Research Centre, MARDI Headquarters, Persiaran MARDI-UPM 43400 Serdang, Selangor
Abstract
Harumanis mango (Mangifera indica) are classified as polyembryonic, which enable each seed to produce several seedlings.Iden?fica?on of zygo?c and nucellar seedlings is important for maintaining gene?c characters which ensures field uniformperformance of rootstocks. However, the seedlings from each seed differ in terms of vigour, plant size or height depending onwhethertheyarenucellarorzygo?c inorigin.Therefore,thispreliminarystudywastoevaluatethe interac?onsbetweengrowthparameters on vigor of seedlings related to the nucellar or zygo?c origin at seedbed stage. The experiment was conducted bycollec?ngofHarumanisfruitsatMARDISintok,Kedahtoobtaintheseeds.Fi�y-fivematurefruitsofHarumanismangowassurfacesterilizedbeforesowninseedbag.Theobserva?onswererecordeda�erone-monthgermina?onofseedlings.ThedatawasanalyseusingSASSta?s?cal so�ware (SAS9.4)andPearson’sCorrela?onCoefficientwas carriedout to confirm the interac?onbetweengermina?on sequence, leaf number, plant height, stem diameter and leaf area on vigor of seedlings. In this study, there wereposi?veornega?vecorrela?onat(p≤0.05)betweengermina?onsequence,leafnumber,plantheight,stemdiameterandleafareaongrowthofHarumanisseedlings.Furthermore, thegermina?onsequenceshowednega?vecorrela?onwith leafnumber,plantheight, stem diameter and leaf area. These result indicate that the first emergence of seedling not always nucellar or zygo?c.However,leafnumbershowedposi?vecorrela?onwithplantheight(r=0.60),stemdiameter(r=0.53)andleafarea(r=0.44).Intermofplantheight,therewerestronglyposi?vecorrela?onwithstemdiameter(r=0.77)andleafarea(r=0.63).Theseresultsalsoindicatethatthemostvigorousseedlingarenotalwaysnucellarorzygo?c.Theiden?fica?onofseedlingsderivedfromnucellarorzygo?cbymorphologicalcriteriaisnotpossibleordifficulttobeconfirmed.Thus,theuseofmolecularmarkersinthefutureisnecessarytomakethedis?nc?onforproduc?onofgoodqualityplan?ngmaterials.
Line
LastKey
Intro
Keywords:Harumanis,seedling,polyembryonic,nucellar,zygo?c
Zul Helmey Mohamad Sabdin, Horticulture Research Centre, MARDI Sintok, 06050 Bukit Kayu Hitam, KedahEmail: [email protected]
INTRODUCTION
Mango (Mangifera indica L.) belongs to the familyAnacardiaceae is an important tropical fruit, which isbeing grown in more than 100 countries of the world(Alametal.,2006;Rametal.,2012).Asrecordedin2017,thereisabout6048.29hectareofmangocul?va?oninMalaysiawith16,912.59metric tonsproduc?on (DOA,2017). Thereareseveralvarie?esofmangogrowninMalaysia;thebewerknowncul?varsareGolek,Masmuda,Maha65,ChokAnan,NamDokMai,SalaandHarumanis(DOA,1995).Harumanisamongthem,themostpopularclone,whichwasregisteredasMA128onMay28, 1971 by the Department of Agriculture, Malaysia (DOA,1995).ThefruitshapeofHarumanisisoblong,hasaprominentbeak,theskincolour isgreenwitha liwlebitofglossyandwillturntoyellowishgreenwhenripen,thefruitsizevariesrangingfrom300to650gram,has16-17°Brixandthefleshisyellowishto orange colour and sweet smell (Mohd Mokhtar, 2014).Harumanis mango is oneof the famous fruitthat havehigheconomic demand and poten?al forMalaysia export businessespeciallythePerlisStateinMalaysia(Farooketal.,2013).
Usually, mango can be propagated by seeds or bygra�ing (Ram et al., 2012). However, propagated byseedsisnottruetotype.Harumanismangoareclassifiedaspolyembryonic, which enable each seed to produce severalseedlings (zygo?c and nucellar) (Mohd Asrul et al., 2018).Iden?fica?onofzygo?cseedlings(referredtoasofftype)fromnucellar seedlings (true to type) is important for maintaininggene?chomogeneitywhichensuresfielduniformperformanceof rootstocks (Rao et al., 2008; Simon et al., 2010). Inpolyembryoniccul?vars,nucellarseedlingscanbeiden?fiedbytheuniformityinthecolouroftheemergingleavesthatarenotpresentinzygo?cseedlings(Zakariaetal.,2002).However,onlyone embryo is of zygo?c in originwhich then degenerates orbecomes weak and stunted seedling (Litz, 1997). Seedlingdetec?on, whether zygo?c or nucellar, and separa?on at theseedbed stage before transplan?ng into nursery polybags isimportant to minimize the number of abnormal (crooked)seedling rootstocks or zygo?c seedlings (Zakaria et al., 2002;Simon et al., 2010). With these facts in view, the presentinves?ga?onwasundertakentoappraisetheinterac?onamonggrowth parameters of Harumanis mango seedlings a�ergermina?on.
- 22 -
Zul Helmey et al. (2019): Preliminary study on polyembryonic Harumanis mango seedlings
22
4
Transactions of Persatuan Genetik Malaysia, No. 10, 2019
MATERIALSANDMETHODS
PlantMaterialsAndGrowthCondiWons
Theexperimentwasconductedbycollec?ngofHarumanisfruitsatMARDI Sintok, Kedah to obtain the seeds. Fi�y fivematurefruitsofHarumanisFi�y-fivematurefruitsofHarumanismangowas surface sterilized before sown in seedbeg. The seedbedwas shaded with black necng and watered daily. Seedlingsgerminated fromeachseedwere labelledwithdifferentcolouroftagaccordingtosequenceofgermina?on.
MeasurementOfGrowth
At30daysa�ergermina?onofseedlings,plantsweresampledatrandomfordetermina?onofplantheight,stemdiameter,leafnumberand leafarea (Figure2).Measurementofplantheightwas taken from the surface of the soil in the seedbed to thehighestshoot?pbyusingameasuringtape.Stemdiameterwasmeasured at the lowest part of stem using Electronic DigitalCaliper (Model SCM DIGV-6) while the leaf number wasmanually counted based on fully expanded leaves. Leaf areasweremeasuredandrecordedas total leafareaperplantusingautoma?cleafareameter(MODELLI-300,LI-COR).
StaWsWcalAnalysis
The datawas analyzed using SAS Sta?s?cal So�ware (SAS 9.4)and Pearson Correla?on Coefficient was carried out todeterminetheinterac?onbetweengrowthparameters.
RESULTSANDDISCUSSION
CorrelaWonAnalysisOfGrowthParametersOfHarumanisSeedlings
In this study, there were significant correla?on at (p≤0.05)betweengermina?onsequence,leafnumber,plantheight,stemdiameter and leaf area on growth of Harumanis seedlings.Furthermore, the germina?on sequence showed nega?vecorrela?onwithleafnumber(r=-0.38),plantheight(r=-0.44),stemdiameter(r=-0.46)andleafarea(r=-0.28).AccordingtoZakaria et al. (2002), the first seedling that emerged is notalways the most viable or vigorous in growth. These resultindicate that the first emergence of seedling not alwaysnucellar or zygo?c. However, leaf number showed posi?vecorrela?onwithplantheight(r=0.60),stemdiameter(r=0.53)andleafarea(r=0.44).Theseresultshowedthattheincreaseofleaf numberwith increase of plant height, stem diameter andleaf area. Same result obtained by Shaban (2010). They foundthat number leaf was correlated posi?vely with leaf area andplant height and leaf area for zebda mango seedlings fromEgypt. In term of plant height, there were strongly posi?vecorrela?onwithstemdiameter(r=0.77)andleafarea(r=0.63).Thestemdiameteralsohadstrongposi?vecorrela?onwithleafarea(r=0.66).Rochaetal.(2004)foundthattheseedlingsfromeach seed differ in terms of vigour, plant size or heightdepending on whether they are nucellar or zygo?c in origin.Zakaria et al. (2002) and Muralidhara et al. (2015) suggested
thattheremovalofseedcoatmaybegavesuperiorresponseinall ini?a?on of plant height, stemdiameter, number of leavesper plant and leaf area. At the same ?me, the differentresponse growth of seedlings produced a�er germina?on andemergence that may be cause by compe??on betweenseedlingsfornutrientuptake,lightandspace.
CONCLUSIONS
Based on the results, leaf number showed significant posi?vecorrela?onwithregardtoplantheight,stemdiameterandleafarea. More significant results showed posi?ve correla?onstudies of plant height and stem diameter. Hence, thepreliminary results of this study are providing usefulinforma?on in future to iden?fy the gene?c origin, zygo?c ornucellarofseedlingsfromHarumanismangopolyembryonicbyusingmolecular technique, rela?ng it to the seedlingvigor forproduc?onofgoodqualityplan?ngmaterials.ACKNOWLEDGEMENTS
This researchworkwas supported byMARDI RMKe11 Project(PRH405-C)undersupervisionofHor?cultureResearchCentre,MARDI. The authors thank to Mr Muhammad Faris Ali forassis?nginsamplesprepara?onanddatacollec?on.
REFERENCES
Alam,M.A.,Mortuza,M.G.,Uddin,M.Z.,Sarker,D.andBarman,J.C.(2006).Effectoflengthandvarietyofscioninstonegra�ingofmango.Interna?onalJournalSustainableCropProduc?on,1(2):07-11.
Department of Agriculture (DOA). (2017). Fruit Crop Sta?s?c 2017(Malaysia).11-40.
Farook,R.S.M.,Ali,H.,Harun,A.,Ndzi,D.L.,Shakaff,A.Y.M.,Jaafar,M.N.,Husin,Z.andAziz,A.H.A.(2013).Harumanismangofloweringstempredic?onusingmachine learning techniques.ResearchNotes inInforma?onScience(RNIS).13:46-51.
JabatanPertanianMalaysia (DOA). (1995). Senarai klonbuah-buahanyangdida�arkanoleh JabatanPertanianSemenanjungMalaysia.KualaLumpur,Malaysia:JabatanPertanianMalaysia.
Litz, R. E. (1997). The mango: botany, produc?on and uses. CABInterna?onal.
MohdMokhtar,M. F. (2014).Mango (HarumManis) Quality GradingSystem.MasterThesis.TunHusseinOnnUniversityofMalaysia.
Muralidhara, B. M., Reddy, Y. T. N., Srilatha, V. and Akshitha, H. J.(2015).Effectofseedcoatremovaltreatmentsonseedgermina?onandseedling awributes in mango varie?es. Interna?onal Journal of FruitScience.16:1-9.
MohdAsrul,S.,HarWnee,A.,MahmadNor,J.,andMohamadBahagia,A. G. (2018). Morphological characterisa?on of Harumanis Mango(Mangifera indica Linn.) in Malaysia. Interna?onal Journal ofEnvironmental&AgricultureResearch.4(1):36-42.

- 23 -
Zul Helmey et al. (2019): Preliminary study on polyembryonic Harumanis mango seedlings
23
4
Transactions of Persatuan Genetik Malaysia, No. 10, 2019
Rao,M.N.,Soneji,J.R.,Chen,C.,Huang,S.andGmiJer,F.G. (2008).Characteriza?onofzygo?candnucellarseedlingsfromsourorange-likecitrus rootstock candidates using RAPD and EST-SSR markers. TreeGene?cGenomic.4:113-12.
Ram, R. B., Kumar, D., Sonkar, P., Lata, R. andMeena,M. L. (2012).Standardiza?on of stone gra�ing in some mango cul?vars underlucknowcondi?ons.HortFloraResearchSpectrum.1(2):165-167.
Simon, A. M., Festus, K. A., Gudeta, S. and Oluyede, C. A. (2010).Rootstockgrowthanddevelopmentforincreasedgra�successofmango(Mangiferaindica)inthenursery.AfricanJournalofBiotechnology.9(9):1317-1324.
Shaban, A. E. A. (2010). Compara?ve study on some polyembryonicmango rootstocks. American-Eurasian Journal Agriculture &EnvironmentalScience.7(5):527-534.
Zakaria,W.,Ab.Malik,T.M.andMasri,M.(2002).Germina?onpawernof threeMangifera species. Journal of Tropical Agriculture and FoodScience.30(2):163–171.
Figure1.SeedsofHarumanismangoa�erremovetheseedcoat
Figure2.SeedlingsofHarumanisMangoa�er30daysofgermina?on
Table1.Correla?onanalysisofgrowthparametersforHarumanismangoseedlings

- 24 -Transactions of Persatuan Genetik Malaysia, No. 10, 2019
24
- 25 -
Corresponding author:
Transactions of Persatuan Genetik Malaysia, No. 10, 2019 Published by Genetics Society of Malaysia http://www.pgm-my.org
11
25
Polymorphism information content and heterozygosity values of simple sequence repeat markers in ‘Harumanis’ and other mango cultivars
Arina Yusuf1, Ahmad Mukhlis Abdul Rahman1, Zarina Zakaria1, Vijay Kumar Subbiah2, and Mohd Azinuddin Ahmad Mokhtar3 1 Department of Chemical Engineering Technology, Faculty of Engineering Technology, Universiti Malaysia Perlis (UniMAP), 02100 Padang Besar, Perlis, Malaysia2 Biotechnology Research Institute, Universiti Malaysia Sabah, Jalan UMS, 88400 Kota Kinabalu, Sabah, Malaysia3 Genomic Department, FGV R&D Sdn. Bhd., FGV Innovation Centre (Biotechnology), PT23417 Lengkok Teknologi, 71760 Bandar Enstek, Negeri Sembilan, Malaysia
Ahmad Mukhlis Abdul Rahman, Dept. of Chemical Engineering Technology, Faculty of Engineering Technology, Universiti Malaysia Perlis, 02100 Padang Besar, Perlis, MalaysiaEmail: [email protected]
Line
LastKey
Intro
Keywords: ‘Harumanis’,simplesequencerepeats(SSR),polymorphisminforma?oncontent,heterozygosity
& INTRODUCTION
In Malaysia, there are numerous variety of mango grown,among the well-known cul?vars are Golek (MA 162),‘Masmuda’(MA204),‘Maha’(MA165),‘ChokAnan’(MA224),‘Nam Dok Mai’ (MA 223), ‘Sala’ and ‘Harumanis’, the mostpopular clone which was registered as MA128 by theDepartment of Agriculture, Malaysia (Ariffin, Sah, Idris &Hashim, 2015) ‘Harumanis’ has emerged as the main choiceamong consumers due to its dis?nc?ve proper?es of fragrantodor, adelicateflavor andfine texture. ThePerlis governmentalsotooktheownershipofthe‘Harumanis’mango(MA128)asit can only be found in Perlis, Malaysia and in Surabaya,Indonesia(Zakaria,Saim,Osman,Haiyee&Juahir,2018).
Fruit dealers have taken this opportunity to gainfraudulent profit by subs?tu?ng the Perlis premium‘Harumanis’ mango with cheaper mangoes varie?es such as‘Tong Dam’, ‘Sala’, ‘Arumanis’ and ‘Susu’. The high price andfame of ‘Harumanis’ have turn out to be the subject ofeconomic counterfei?ng involving replacement and
misjudgement. The existence of other mangoes which haveiden?calawributeswithHarumanissuchastheskinshadeandfruitsizehadaggravatedthesitua?onasthesemaymisleadtheconsumers. Media has also con?nually subs?tute the Perlispremium ‘Harumanis’ mango with cheaper mangoes such as‘TongDam’, ‘Sala’, ‘Arumanis’ and ‘Susu’whichare referredasunauthen?c‘Harumanis’(Zakariaetal.,2018).
Thus, a powerful tool need to be implemented todiscriminatebetweentheoriginalandunauthen?c‘Harumanis’mangoes. Iden?fica?on tags known as markers is one of thebest solu?on for this problem. Among the three types ofmarkers which are morphological, biochemical and molecularmarkers, DNAmarkers (one of the type ofmolecularmarker)hasbeenselectedasitisnotaffectedbyenvironmentalfactorsand the developmental stage of the plant (Winter & Kahl,1995). DNA markers are known for their rapid and extensiveuses in the study of gene?c diversity, iden?fica?on ofredundancies in germplasm collec?ons, tests of accessionstability and integrity, and resolve the taxonomic rela?onships(Ariffinetal.,2015).
Abstract
‘Harumanis’ is amango cul?var that is exclusively cul?vated in Perlis for its high commercial value andmarket poten?al.Mostfarmersandconsumerrelyonmorphologicalcharacteris?cstodifferen?ate‘Harumanis’fromothermangoesforsaplingandfruitpurchasingpurpose.Sellersgreatlyexploitedthissitua?onbysubs?tu?ng‘Harumanis’withothercheapermangoessuchas‘Sala’,‘Susu’and ‘TongDam’sincetheyhavealmostsimilarmorphologicalcharacteris?cs.Despitetherela?veeaseofuseandrapidity,iden?fica?onbymorphologicalmarker is inefficient as thismarker compoundedwith theproblemof low stability as it is highlyaffectedbyenvironmentalfactors.Asignificantgene?cimprovementin‘Harumanis’canbeacceleratedbyusingmolecular-basedapproaches like Simple Sequence Repeat (SSR) as it has high associa?on with expressed genes and directly contribu?ng to aphenotype.Here,wedescribedasetofSimpleSequenceRepeat(SSR)markerswhichcanbeappliedtodiscriminate‘Harumanis’andothermango cul?vars. SixteenDNA samplesof differentmango varie?es including ‘Harumanis’, ‘TongDam’ and ‘Sala’wereobtained fromdifferent loca?ons inPerlis.A total of 39 SSRmarkerswereexaminedusingPCRandPAGE. We thenperformedgene?c sta?s?cal analyses to determine heterozygosity values and polymorphism informa?on content (PIC). From the 39 SSRsscreened,17SSRsproducedclearandreproduciblebands.TheseSSRswerethenselectedforsubsequentdownstreamanalyses.Atotalof443allelesfrom17SSRlociweredetectedinthe16mangosamples,withanaveragenumberofallelesat2.65perlocus.The PIC values ranged from 0.16 to 0.61. SSR 7, LMMA 10 and LMMA 8 were considered as high performingmarkers as theyawainedPICvalueshigherthan0.5.Inaddi?on,itwasfoundthattheobservedheterozygosity(Ho)washigherthantheexpected(He),whichisindica?veofhighgene?cvariabilityinthesamples.TheSSRmarkersiden?fiedinthisstudyareusefulforevalua?nggene?cvariabilityof ‘Harumanis’aswellas forcomparisonwithothercul?vars towards thedevelopmentofDNAprofilesof themango.
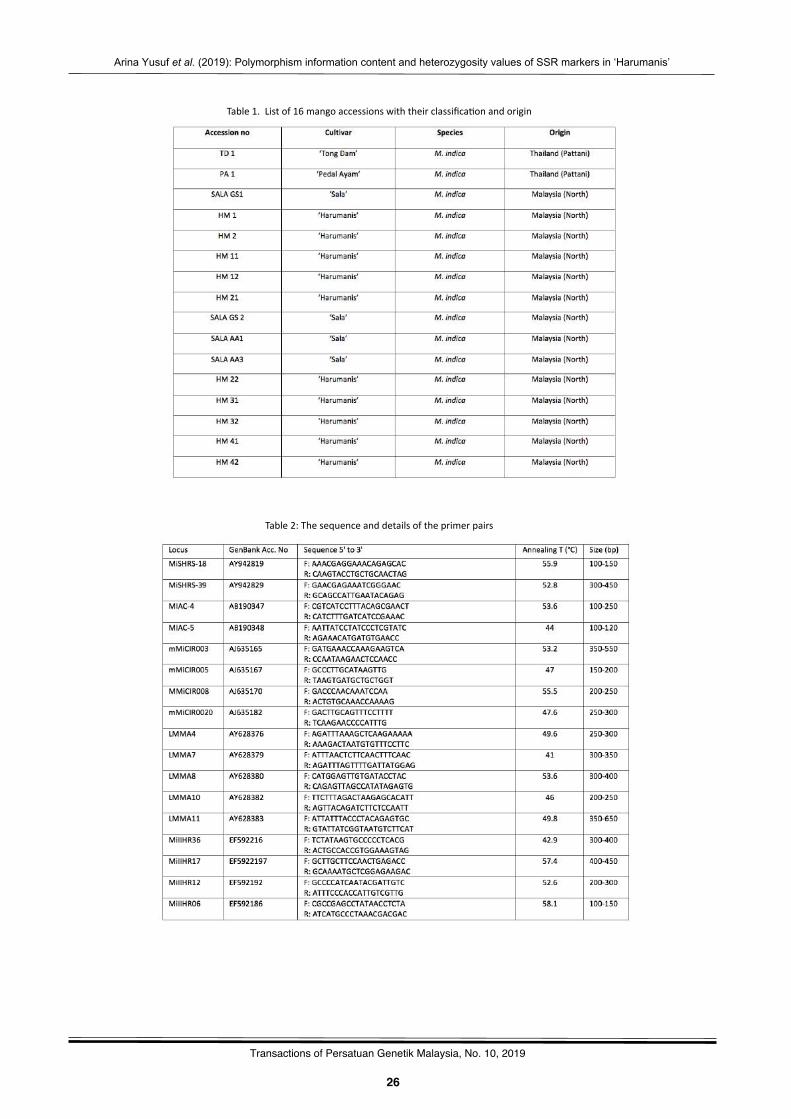
- 26 -
Arina Yusuf et al. (2019): Polymorphism information content and heterozygosity values of SSR markers in ‘Harumanis’
26
5
Transactions of Persatuan Genetik Malaysia, No. 10, 2019
Table2:Thesequenceanddetailsoftheprimerpairs
Table1.Listof16mangoaccessionswiththeirclassifica?onandorigin
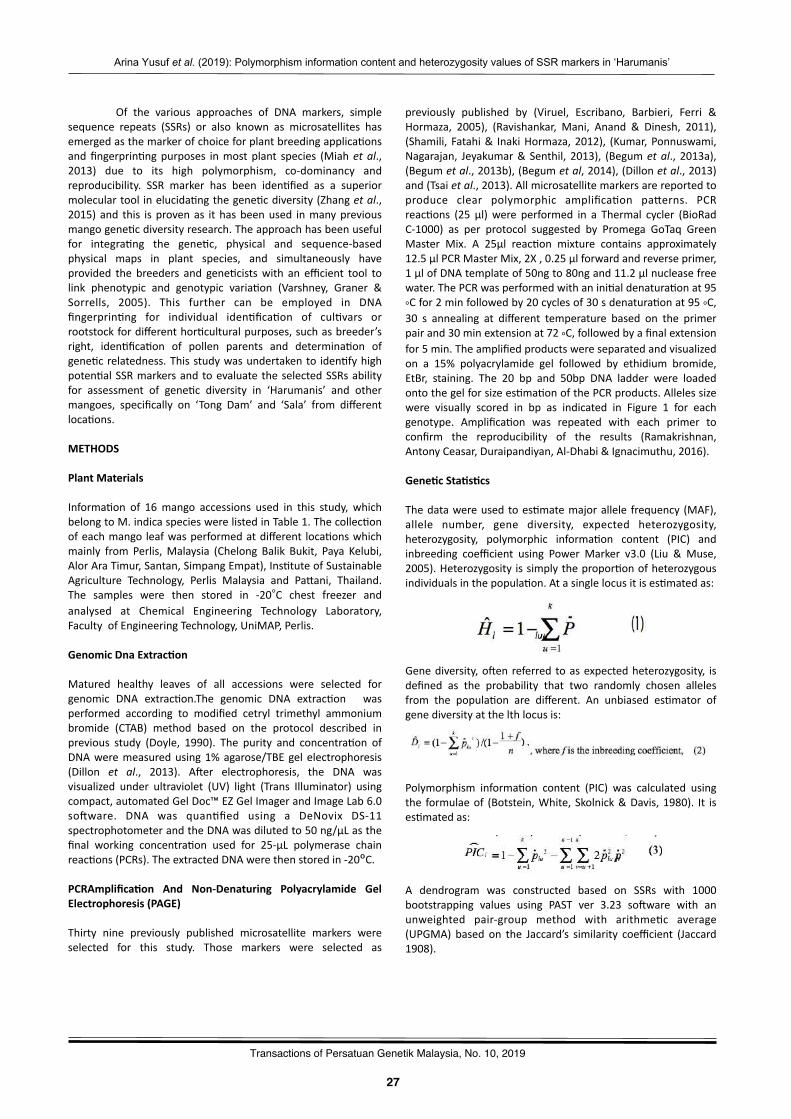
- 27 -
Arina Yusuf et al. (2019): Polymorphism information content and heterozygosity values of SSR markers in ‘Harumanis’
27
5
Transactions of Persatuan Genetik Malaysia, No. 10, 2019
Of the various approaches of DNA markers, simplesequence repeats (SSRs) or also known as microsatellites hasemergedasthemarkerofchoiceforplantbreedingapplica?onsandfingerprin?ngpurposes inmostplant species (Miah et al.,2013) due to its high polymorphism, co-dominancy andreproducibility. SSR marker has been iden?fied as a superiormoleculartool inelucida?ngthegene?cdiversity(Zhangetal.,2015)and this isprovenas ithasbeenused inmanypreviousmangogene?cdiversityresearch.Theapproachhasbeenusefulfor integra?ng the gene?c, physical and sequence-basedphysical maps in plant species, and simultaneously haveprovided the breeders and gene?cistswith an efficient tool tolink phenotypic and genotypic varia?on (Varshney, Graner &Sorrells, 2005). This further can be employed in DNAfingerprin?ng for individual iden?fica?on of cul?vars orrootstockfordifferenthor?culturalpurposes,suchasbreeder’sright, iden?fica?on of pollen parents and determina?on ofgene?crelatedness.Thisstudywasundertakento iden?fyhighpoten?alSSRmarkersandtoevaluatetheselectedSSRsabilityfor assessment of gene?c diversity in ‘Harumanis’ and othermangoes, specifically on ‘Tong Dam’ and ‘Sala’ from differentloca?ons.
METHODS
PlantMaterials
Informa?on of 16mango accessions used in this study, whichbelongtoM.indicaspecieswerelistedinTable1.Thecollec?onofeachmango leafwasperformedatdifferent loca?onswhichmainly from Perlis,Malaysia (Chelong Balik Bukit, Paya Kelubi,AlorAraTimur,Santan,SimpangEmpat),Ins?tuteofSustainableAgriculture Technology, Perlis Malaysia and Pawani, Thailand.The samples were then stored in -20°C chest freezer andanalysed at Chemical Engineering Technology Laboratory,FacultyofEngineeringTechnology,UniMAP,Perlis.
GenomicDnaExtracWon
Matured healthy leaves of all accessions were selected forgenomic DNA extrac?on.The genomic DNA extrac?on wasperformed according to modified cetryl trimethyl ammoniumbromide (CTAB) method based on the protocol described inprevious study (Doyle, 1990). The purity and concentra?on ofDNAweremeasuredusing1%agarose/TBEgel electrophoresis(Dillon et al., 2013). A�er electrophoresis, the DNA wasvisualized under ultraviolet (UV) light (Trans Illuminator) usingcompact,automatedGelDoc™EZGelImagerandImageLab6.0so�ware. DNA was quan?fied using a DeNovix DS-11spectrophotometerandtheDNAwasdilutedto50ng/µLasthefinal working concentra?on used for 25-µL polymerase chainreac?ons(PCRs).TheextractedDNAwerethenstoredin-20ºC.
PCRAmplificaWon And Non-Denaturing Polyacrylamide GelElectrophoresis(PAGE)
Thirty nine previously published microsatellite markers wereselected for this study. Those markers were selected as
previously published by (Viruel, Escribano, Barbieri, Ferri &Hormaza, 2005), (Ravishankar, Mani, Anand & Dinesh, 2011),(Shamili, Fatahi& InakiHormaza,2012), (Kumar,Ponnuswami,Nagarajan, Jeyakumar&Senthil, 2013), (Begum et al., 2013a),(Begumetal.,2013b),(Begumetal,2014),(Dillonetal.,2013)and(Tsaietal.,2013).Allmicrosatellitemarkersarereportedtoproduce clear polymorphic amplifica?on pawerns. PCRreac?ons (25 µl)were performed in a Thermal cycler (BioRadC-1000) as per protocol suggested by Promega GoTaq GreenMaster Mix. A 25µl reac?on mixture contains approximately12.5µlPCRMasterMix,2X,0.25µlforwardandreverseprimer,1µlofDNAtemplateof50ngto80ngand11.2µlnucleasefreewater.ThePCRwasperformedwithanini?aldenatura?onat95⸰Cfor2minfollowedby20cyclesof30sdenatura?onat95⸰C,30 s annealing at different temperature based on the primerpairand30minextensionat72⸰C,followedbyafinalextensionfor5min.Theamplifiedproductswereseparatedandvisualizedon a 15% polyacrylamide gel followed by ethidium bromide,EtBr, staining. The 20 bp and 50bp DNA ladder were loadedontothegelforsizees?ma?onofthePCRproducts.Allelessizewere visually scored in bp as indicated in Figure 1 for eachgenotype. Amplifica?on was repeated with each primer toconfirm the reproducibility of the results (Ramakrishnan,AntonyCeasar,Duraipandiyan,Al-Dhabi&Ignacimuthu,2016).
GeneWcStaWsWcs
Thedatawereusedtoes?matemajorallele frequency (MAF),allele number, gene diversity, expected heterozygosity,heterozygosity, polymorphic informa?on content (PIC) andinbreeding coefficient using Power Marker v3.0 (Liu & Muse,2005).Heterozygosity issimplythepropor?onofheterozygousindividualsinthepopula?on.Atasinglelocusitises?matedas:
Genediversity,o�enreferredtoasexpectedheterozygosity, isdefined as the probability that two randomly chosen allelesfrom the popula?on are different. An unbiased es?mator ofgenediversityatthelthlocusis:
Polymorphism informa?on content (PIC) was calculated usingthe formulaeof (Botstein,White,Skolnick&Davis,1980). It ises?matedas:
A dendrogram was constructed based on SSRs with 1000bootstrapping values using PAST ver 3.23 so�ware with anunweighted pair-group method with arithme?c average(UPGMA) based on the Jaccard’s similarity coefficient (Jaccard1908).
- 28 -
Arina Yusuf et al. (2019): Polymorphism information content and heterozygosity values of SSR markers in ‘Harumanis’
28
5
Transactions of Persatuan Genetik Malaysia, No. 10, 2019
RESULTSANDDISCUSSION
StaWsWcalAnalysisOfGenomicSSRMarkers
39SSRprimerpairswereusedfortheini?alscreeningofthe16mango samples. Out of 39 primer pairs, 17 of them (Table 2)wereselectedforfurtheranalysisbasedontheamplifica?onoftheDNA.Thesequencesofthese17primerpairsareshowninTable 1. Ineffec?ve amplifica?on shown by some primer pairscaused them to be excluded in the study as they may beawributedtothepresenceofintronsintheamplifiedsequence,alackofprimerspecificity,varia?oninthenumberofrepeatedmo?fs,orassemblyerrors(Varshney,Graner&Sorrells,2005b).
Table2ontheotherhandshowstheperformanceofthe17selectedprimerpairs.The17SSRprimerpairsproduceda total of 443 amplified products, ofwhich 216 (48.76%) arepolymorphic, 224 are monomorphic and another three areuniqueacrossall16mangosamples.TheobservedsizesofPCRproductsofthecurrentstudyrangedfrom100to650bp.PrimerpairsofLMMA11showedthehighestPCRproductsizes(350to650bp), followed by MiIIHR17 (400 to 450bp) and MiSHRS-39(300 to 450bp). MiSHRS-18, SSR 8 and MIAC-5 produced thesmallestPCRproductsizeswhichare100 to150bpand100 to120bprespec?vely.
Thenumberofallelesdetectedvaryfrom2(LMMA7,8,11,MIAC4,MiSHRS-18,MMiCIROO20,MiIIHR-36and17)to3(LMMA4,MISHRS39,MIAC5,MMiCIROO3,5,8andSSR8)and4(LMMA10andSSR7).The17SSRprimerpairs(loci)revealedatotalof45alleleswithaveragenumberofallelesperprimerpairis 2.65 (Table 3). Earlier, (Kumar, Ponnuswami, Nagarajan.,Jeyakumar&Senthil.,2013)and(Begumetal.,2013b)reportedsimilarnumbersofallelesrange(2to4)withaveragealleleperlocusof2.70and3.08respec?vely.
AtotalofthreeuniqueallelesweredetectedatthreeSSR loci. The ‘Pedal Ayam’ (PA1) mango accession reported aunique allele with the size of 300 bp at locus MMICIR008,whereas ‘Sala’ (SGS1) mango accession produced two uniquealleles with the sizes of 160 bp and 360 bp at loci SSR 8 andLMMA 4. The unique alleles could be used as markers todis?nguish between ‘Harumanis’ with ‘Pedal Ayam’ and ‘Sala’genotypes.Majorallelefrequenciesrangedfrom0.38(MIAC5)to0.91(MIAC4)withthemeanof0.63.
PolymorphicSSRAmongM.indicaL.Isolates
Iden1fica1onOfPolymorphicMarkers
ThePICvaluewhichrepresentstherela?veinforma?onofeachmarkerrangedfrom0.16formarkerMIAC4to0.61formarkerLMMA10.Thevaluedescribestheintra-popula?ondiversityandcharacterizesthedegreeofpolymorphismineachlocus.Mostofthe loci indicated moderate discriminatory power as the PICvaluewereintherangeof0.25and0.5exceptforSSR7,LMMA10, MIAC 5 and MIAC 4. The polymorphic SSRs iden?fiedindica?ngmoderatediscriminatorypowerwithaPICmeanvalueof0.41.SSR7,LMMA10andLMMA8areconsideredashighlypolymorphic markers for iden?fica?on and gene?c diversityes?ma?onofmango as the SSRs awainedPIC values of higherthan 0.5, while MIAC 4 with a PIC value of 0.16 wascharacterized as a low discriminatory polymorphic SSRmarker
asitisbelow0.25.ThesefindingsindicatedthatthoseselectedSSRsprimerpairsareusefulforinsidepopula?onstudiese.g.totracemarkertraitassocia?onasthePICvalueaverage(0.41)iswithin the rangeof0.4 to0.5,whereas lowerPICvalues (0.0–0.1) of single alleles are usually more useful for studies ofevolu?on or gene?c dri� (Silvertown & Doust 1993). The PICvalues of each locus were comparable to those reported byBegum,whichwerebetween0.25to0.56in‘Panchadarakalasa’mango (Begum et al., 2013a), 0.02 to 0.82 in ‘Cherukurasam’mango, and 0.03 to 0.72 in ‘Cherukurasam’ mango cul?vars(Begumetal,2014).
GeneHeterozygositySSROfM.indicaL.
Observed heterozygosity Ho obtained in this study are in therange of 0.00 (SSR 8) to 1.00 (LMMA 7, MISHRS 18 andMMICIR0020). Gene diversity or expected heterozygosity Hevalues are found to be highest in primer LMMA 10 (0.67),followed by MIAC 5 (0.66) and SSR 7 (0.62). 10 out of 17selected SSR primers recorded higher gene diversity valuesthan the average value (0.47). The mean value of observedheterozygosity (Ho = 0.57) is higher than expectedheterozygosity (He = 0.47), resul?ng in nega?ve value ofinbreedingcoefficientmeanorknownasfixa?onindexF.
Expected He and observed heterozygosity Ho valueswere compared using the fixa?on index F, which reported anaverageoveralltheSSRlociof-0.30withvaluesbetween−0.39(MMICIR003)and1.00(SSR8).14oftheSSRlocifixa?onindex(F)arenega?veinvaluesindica?nganexcessofheterozygotesin the genotypes except for LMMA4,MIAC 5 and SSR 8. Theheterozygote excess observed could be caused by theoutcrossing breeding system and low effec?ve number ofpopula?on size of the accession studied, meanwhile theposi?vefixa?onindexFprobablybecauseofsomeparameterssuch as null alleles, inbreeding phenomenon, homozygosity,and self-compa?ble genotypes (Maghuly, Borroto, Ruthner,Pedryc&Laimer,2005).
ClusterAnalysisAndGeneWcRelaWonshipsOfM.indicaL.
Cluster analyses and rela?onship among 10 ‘Harumanis’accession na?ve to five loca?ons in Perlis and six controlsamples(‘Sala’,‘PedalAyam’and‘TongDam’)wereevaluated.The analyses indicated high gene?c similarity among‘Harumanis’ accessions as all of the ten accessions wereclustered in one group (HM1, HM2, HM11, HM12, HM21,HM22,HM31,HM32,HM41andHM42)andthesecondgroupgathered allanother six mangoes (SALA GS1, SALA GS2, SALAAA1,SALAAA3,PAandTD).Thisresultshowsthatmicrosatellitemarker isalsoeffec?veforcul?varsdiscrimina?onas indicatedin previous study by (Honsho, Nishiyama, Eiadthong, andYonemori, 2005.) and not only based on locali?es (Eiadthong,Yonemori,Sugiura,Utsunomiya&Subhadrabandhu,1999).Thisdivision suggest that different cul?vars probably had differentgenomic component,meanwhile the cluster of ‘Harumanis’ inone group proposed that those accessions probably hadcommon genomic components that originated from othermothertreesastheaccessionsnotsubdividedaccordingtothelocali?esbutaccordingtotheircul?vars(Begumetal.,2013b).Theclusteringanalysesabletoexpressthetruepoten?alofthe
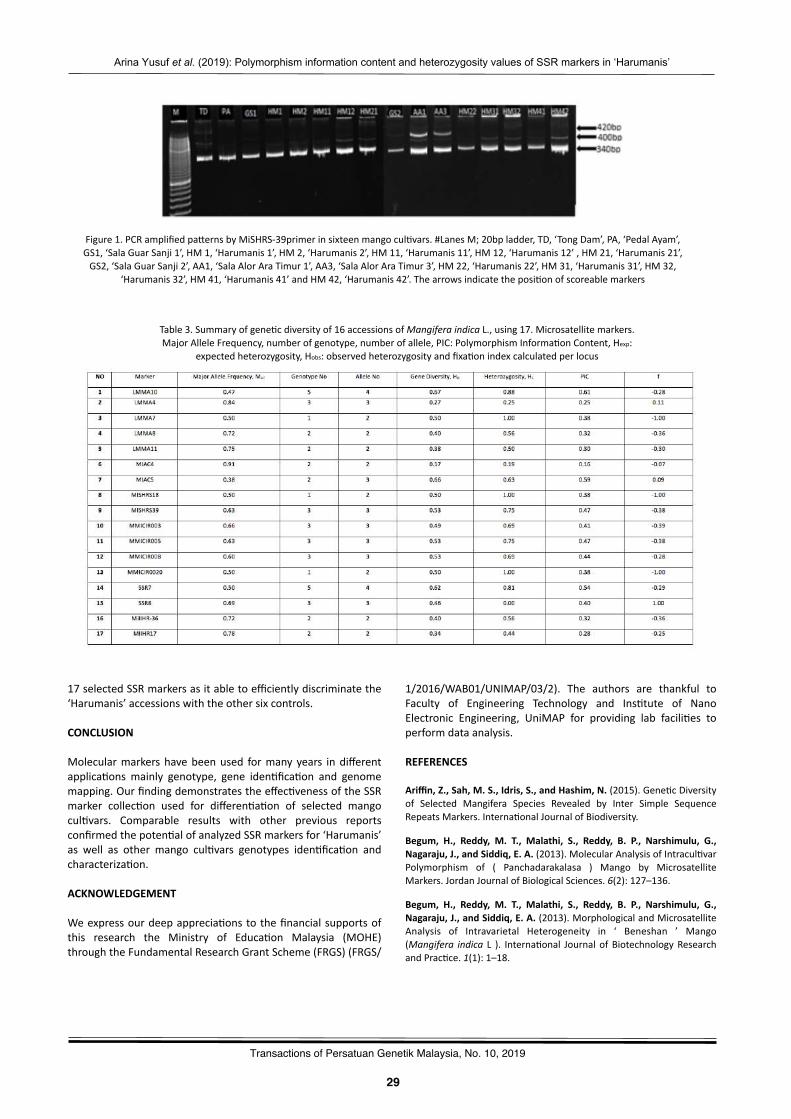
- 29 -
Arina Yusuf et al. (2019): Polymorphism information content and heterozygosity values of SSR markers in ‘Harumanis’
29
5
Transactions of Persatuan Genetik Malaysia, No. 10, 2019
Figure1.PCRamplifiedpawernsbyMiSHRS-39primerinsixteenmangocul?vars.#LanesM;20bpladder,TD,‘TongDam’,PA,‘PedalAyam’,GS1,‘SalaGuarSanji1’,HM1,‘Harumanis1’,HM2,‘Harumanis2’,HM11,‘Harumanis11’,HM12,‘Harumanis12’,HM21,‘Harumanis21’,GS2,‘SalaGuarSanji2’,AA1,‘SalaAlorAraTimur1’,AA3,‘SalaAlorAraTimur3’,HM22,‘Harumanis22’,HM31,‘Harumanis31’,HM32,
‘Harumanis32’,HM41,‘Harumanis41’andHM42,‘Harumanis42’.Thearrowsindicatetheposi?onofscoreablemarkers
Table3.Summaryofgene?cdiversityof16accessionsofMangiferaindicaL.,using17.Microsatellitemarkers.MajorAlleleFrequency,numberofgenotype,numberofallele,PIC:PolymorphismInforma?onContent,Hexp:
expectedheterozygosity,Hobs:observedheterozygosityandfixa?onindexcalculatedperlocus
17selectedSSRmarkersasitabletoefficientlydiscriminatethe‘Harumanis’accessionswiththeothersixcontrols.
CONCLUSION
Molecularmarkershavebeenused formany years indifferentapplica?ons mainly genotype, gene iden?fica?on and genomemapping.Ourfindingdemonstratestheeffec?venessoftheSSRmarker collec?on used for differen?a?on of selected mangocul?vars. Comparable results with other previous reportsconfirmedthepoten?alofanalyzedSSRmarkersfor‘Harumanis’as well as other mango cul?vars genotypes iden?fica?on andcharacteriza?on.
ACKNOWLEDGEMENT
Weexpressourdeepapprecia?onstothefinancialsupportsofthis research the Ministry of Educa?on Malaysia (MOHE)throughtheFundamentalResearchGrantScheme(FRGS)(FRGS/
1/2016/WAB01/UNIMAP/03/2). The authors are thankful toFaculty of Engineering Technology and Ins?tute of NanoElectronic Engineering, UniMAP for providing lab facili?es toperformdataanalysis.
REFERENCES
Ariffin,Z.,Sah,M.S.,Idris,S.,andHashim,N.(2015).Gene?cDiversityof Selected Mangifera Species Revealed by Inter Simple SequenceRepeatsMarkers.Interna?onalJournalofBiodiversity.
Begum, H., Reddy, M. T., Malathi, S., Reddy, B. P., Narshimulu, G.,Nagaraju,J.,andSiddiq,E.A.(2013).MolecularAnalysisofIntracul?varPolymorphism of ( Panchadarakalasa ) Mango by MicrosatelliteMarkers.JordanJournalofBiologicalSciences.6(2):127–136.
Begum, H., Reddy, M. T., Malathi, S., Reddy, B. P., Narshimulu, G.,Nagaraju,J.,andSiddiq,E.A.(2013).MorphologicalandMicrosatelliteAnalysis of Intravarietal Heterogeneity in ‘ Beneshan ’ Mango(Mangifera indica L ). Interna?onal Journal ofBiotechnologyResearchandPrac?ce.1(1):1–18.
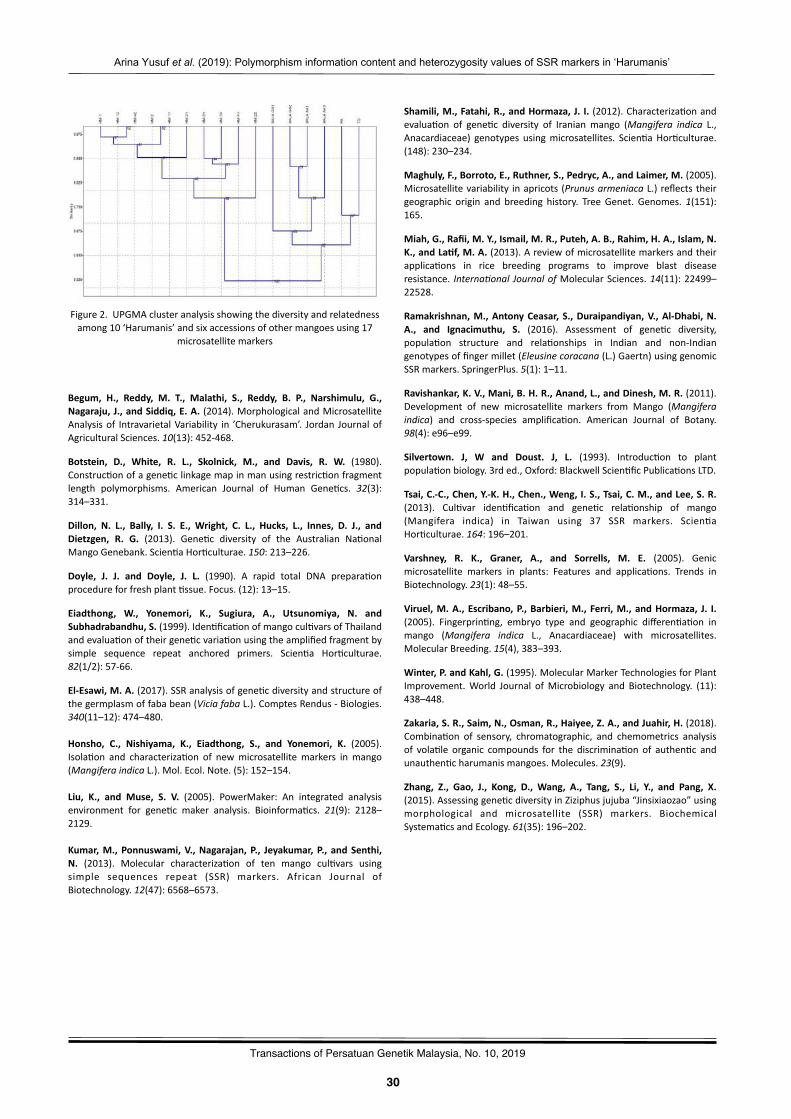
- 30 -
Arina Yusuf et al. (2019): Polymorphism information content and heterozygosity values of SSR markers in ‘Harumanis’
30
5
Transactions of Persatuan Genetik Malaysia, No. 10, 2019
Figure2.UPGMAclusteranalysisshowingthediversityandrelatednessamong10‘Harumanis’andsixaccessionsofothermangoesusing17
microsatellitemarkers
Begum, H., Reddy, M. T., Malathi, S., Reddy, B. P., Narshimulu, G.,Nagaraju,J.,andSiddiq,E.A. (2014).MorphologicalandMicrosatelliteAnalysisof IntravarietalVariability in ’Cherukurasam’. Jordan JournalofAgriculturalSciences.10(13):452-468.
Botstein, D., White, R. L., Skolnick, M., and Davis, R. W. (1980).Construc?onofagene?clinkagemapinmanusingrestric?onfragmentlength polymorphisms. American Journal of Human Gene?cs. 32(3):314–331.
Dillon, N. L., Bally, I. S. E., Wright, C. L., Hucks, L., Innes, D. J., andDietzgen, R. G. (2013). Gene?c diversity of the Australian Na?onalMangoGenebank.Scien?aHor?culturae.150:213–226.
Doyle, J. J. and Doyle, J. L. (1990). A rapid total DNA prepara?onprocedureforfreshplant?ssue.Focus.(12):13–15.
Eiadthong, W., Yonemori, K., Sugiura, A., Utsunomiya, N. andSubhadrabandhu,S.(1999).Iden?fica?onofmangocul?varsofThailandandevalua?onoftheirgene?cvaria?onusingtheamplifiedfragmentbysimple sequence repeat anchored primers. Scien?a Hor?culturae.82(1/2):57-66.
El-Esawi,M.A.(2017).SSRanalysisofgene?cdiversityandstructureofthegermplasmoffababean(ViciafabaL.).ComptesRendus-Biologies.340(11–12):474–480.
Honsho, C., Nishiyama, K., Eiadthong, S., and Yonemori, K. (2005).Isola?on and characteriza?on of newmicrosatellitemarkers inmango(MangiferaindicaL.).Mol.Ecol.Note.(5):152–154.
Liu, K., and Muse, S. V. (2005). PowerMaker: An integrated analysisenvironment for gene?c maker analysis. Bioinforma?cs. 21(9): 2128–2129.
Kumar,M.,Ponnuswami,V.,Nagarajan,P., Jeyakumar,P., andSenthi,N. (2013). Molecular characteriza?on of ten mango cul?vars usingsimple sequences repeat (SSR) markers. African Journal ofBiotechnology.12(47):6568–6573.
Shamili,M.,Fatahi,R.,andHormaza,J. I. (2012).Characteriza?onandevalua?on of gene?c diversity of Iranianmango (Mangifera indica L.,Anacardiaceae) genotypes usingmicrosatellites. Scien?aHor?culturae.(148):230–234.
Maghuly,F.,Borroto,E.,Ruthner,S.,Pedryc,A.,andLaimer,M.(2005).Microsatellitevariability inapricots(PrunusarmeniacaL.)reflectstheirgeographic origin and breeding history. TreeGenet. Genomes.1(151):165.
Miah,G.,Rafii,M.Y.,Ismail,M.R.,Puteh,A.B.,Rahim,H.A.,Islam,N.K.,andLaWf,M.A.(2013).Areviewofmicrosatellitemarkersandtheirapplica?ons in rice breeding programs to improve blast diseaseresistance. InternaGonal JournalofMolecularSciences.14(11):22499–22528.
Ramakrishnan,M.,AntonyCeasar,S.,Duraipandiyan,V.,Al-Dhabi,N.A., and Ignacimuthu, S. (2016). Assessment of gene?c diversity,popula?on structure and rela?onships in Indian and non-Indiangenotypesoffingermillet(Eleusinecoracana(L.)Gaertn)usinggenomicSSRmarkers.SpringerPlus.5(1):1–11.
Ravishankar,K.V.,Mani,B.H.R.,Anand,L.,andDinesh,M.R.(2011).Development of new microsatellite markers from Mango (Mangiferaindica) and cross-species amplifica?on. American Journal of Botany.98(4):e96–e99.
Silvertown. J, W and Doust. J, L. (1993). Introduc?on to plantpopula?onbiology.3rded.,Oxford:BlackwellScien?ficPublica?onsLTD.
Tsai,C.-C.,Chen,Y.-K.H.,Chen.,Weng,I.S.,Tsai,C.M.,andLee,S.R.(2013). Cul?var iden?fica?on and gene?c rela?onship of mango(Mangifera indica) in Taiwan using 37 SSR markers. Scien?aHor?culturae.164:196–201.
Varshney, R. K., Graner, A., and Sorrells, M. E. (2005). Genicmicrosatellite markers in plants: Features and applica?ons. Trends inBiotechnology.23(1):48–55.
Viruel,M.A.,Escribano,P.,Barbieri,M.,Ferri,M.,andHormaza, J. I.(2005). Fingerprin?ng, embryo type and geographic differen?a?on inmango (Mangifera indica L., Anacardiaceae) with microsatellites.MolecularBreeding.15(4),383–393.
Winter,P.andKahl,G.(1995).MolecularMarkerTechnologiesforPlantImprovement.World Journal ofMicrobiology and Biotechnology. (11):438–448.
Zakaria,S.R.,Saim,N.,Osman,R.,Haiyee,Z.A.,andJuahir,H.(2018).Combina?on of sensory, chromatographic, and chemometrics analysisof vola?le organic compounds for the discrimina?on of authen?c andunauthen?charumanismangoes.Molecules.23(9).
Zhang, Z., Gao, J., Kong, D., Wang, A., Tang, S., Li, Y., and Pang, X.(2015).Assessinggene?cdiversityinZiziphusjujuba“Jinsixiaozao”usingmorphological and microsatellite (SSR) markers. BiochemicalSystema?csandEcology.61(35):196–202.
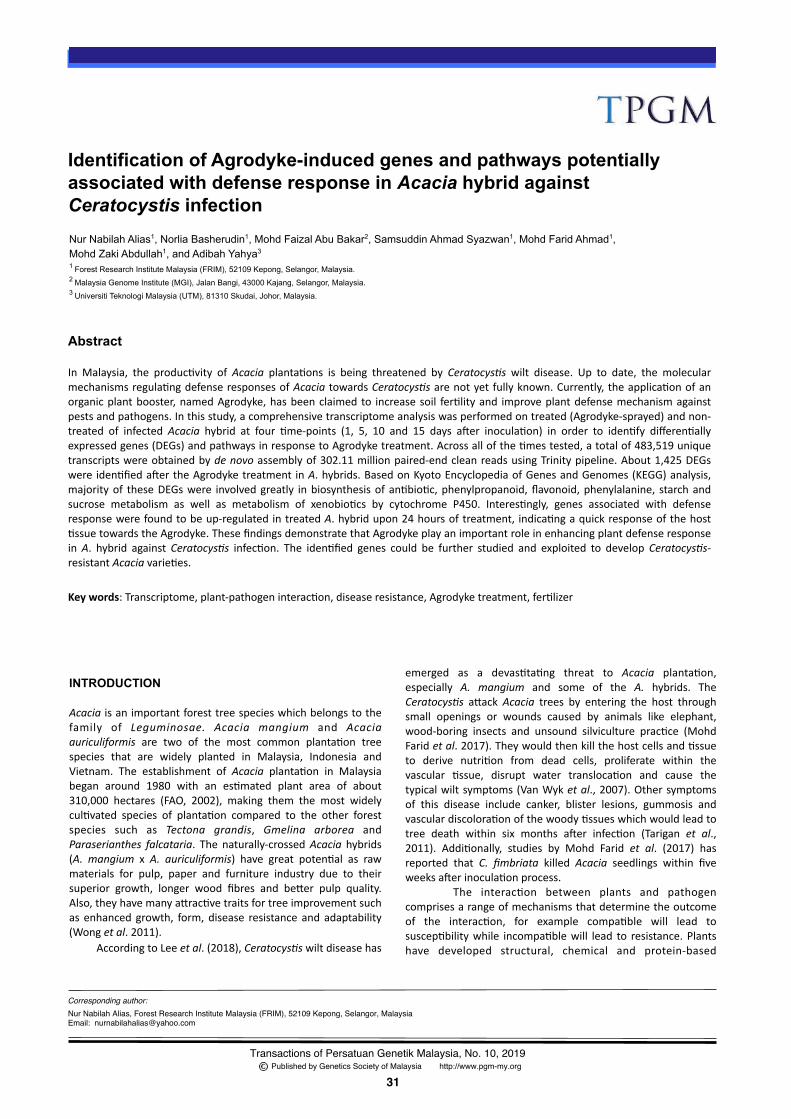
- 31 -
Corresponding author:
Transactions of Persatuan Genetik Malaysia, No. 10, 2019 Published by Genetics Society of Malaysia http://www.pgm-my.org
17
31
Nur Nabilah Alias, Forest Research Institute Malaysia (FRIM), 52109 Kepong, Selangor, MalaysiaEmail: [email protected]
Identification of Agrodyke-induced genes and pathways potentially associated with defense response in Acacia hybrid against Ceratocystis infection Nur Nabilah Alias1, Norlia Basherudin1, Mohd Faizal Abu Bakar2, Samsuddin Ahmad Syazwan1, Mohd Farid Ahmad1, Mohd Zaki Abdullah1, and Adibah Yahya3
1 Forest Research Institute Malaysia (FRIM), 52109 Kepong, Selangor, Malaysia.2 Malaysia Genome Institute (MGI), Jalan Bangi, 43000 Kajang, Selangor, Malaysia.3 Universiti Teknologi Malaysia (UTM), 81310 Skudai, Johor, Malaysia.
Abstract
In Malaysia, the produc?vity of Acacia planta?ons is being threatened by CeratocysGs wilt disease. Up to date, the molecularmechanismsregula?ngdefenseresponsesofAcacia towardsCeratocysGsarenotyetfullyknown.Currently,theapplica?onofanorganicplantbooster,namedAgrodyke,hasbeenclaimedto increasesoil fer?lityand improveplantdefensemechanismagainstpestsandpathogens.Inthisstudy,acomprehensivetranscriptomeanalysiswasperformedontreated(Agrodyke-sprayed)andnon-treated of infected Acacia hybrid at four ?me-points (1, 5, 10 and 15 days a�er inocula?on) in order to iden?fy differen?allyexpressedgenes(DEGs)andpathwaysinresponsetoAgrodyketreatment.Acrossallofthe?mestested,atotalof483,519uniquetranscriptswereobtainedbydenovoassemblyof302.11millionpaired-endcleanreadsusingTrinitypipeline.About1,425DEGswere iden?fieda�ertheAgrodyketreatment inA.hybrids.BasedonKyotoEncyclopediaofGenesandGenomes(KEGG)analysis,majorityof theseDEGswere involvedgreatly inbiosynthesisofan?bio?c,phenylpropanoid,flavonoid,phenylalanine, starchandsucrose metabolism as well as metabolism of xenobio?cs by cytochrome P450. Interes?ngly, genes associated with defenseresponsewerefoundtobeup-regulatedintreatedA.hybridupon24hoursoftreatment, indica?ngaquickresponseofthehost?ssuetowardstheAgrodyke.ThesefindingsdemonstratethatAgrodykeplayanimportantroleinenhancingplantdefenseresponseinA. hybrid againstCeratocysGs infec?on. The iden?fied genes could be further studied and exploited to developCeratocysGs-resistantAcaciavarie?es.
Keywords:Transcriptome,plant-pathogeninterac?on,diseaseresistance,Agrodyketreatment,fer?lizer
Line
LastKey
Intro
INTRODUCTION
Acacia isanimportantforesttreespecieswhichbelongstothefamily of Leguminosae. Acacia mangium and Acaciaauriculiformis are two of the most common planta?on treespecies that are widely planted in Malaysia, Indonesia andVietnam. The establishment of Acacia planta?on in Malaysiabegan around 1980 with an es?mated plant area of about310,000 hectares (FAO, 2002), making them the most widelycul?vated species of planta?on compared to the other forestspecies such as Tectona grandis, Gmelina arborea andParaserianthes falcataria. The naturally-crossedAcacia hybrids(A. mangium x A. auriculiformis) have great poten?al as rawmaterials for pulp, paper and furniture industry due to theirsuperior growth, longer wood fibres and bewer pulp quality.Also,theyhavemanyawrac?vetraitsfortreeimprovementsuchas enhancedgrowth, form,disease resistanceandadaptability(Wongetal.2011).AccordingtoLeeetal.(2018),CeratocysGswiltdiseasehas
emerged as a devas?ta?ng threat to Acacia planta?on,especially A. mangium and some of the A. hybrids. TheCeratocysGs awack Acacia trees by entering the host throughsmall openings or wounds caused by animals like elephant,wood-boring insects and unsound silviculture prac?ce (MohdFaridetal.2017).Theywouldthenkillthehostcellsand?ssueto derive nutri?on from dead cells, proliferate within thevascular ?ssue, disrupt water transloca?on and cause thetypicalwiltsymptoms(VanWyketal.,2007).Othersymptomsof this disease include canker, blister lesions, gummosis andvasculardiscolora?onofthewoody?ssueswhichwouldleadtotree death within six months a�er infec?on (Tarigan et al.,2011). Addi?onally, studies by Mohd Farid et al. (2017) hasreported that C. fimbriata killed Acacia seedlings within fiveweeksa�erinocula?onprocess.
The interac?on between plants and pathogencomprisesarangeofmechanismsthatdeterminetheoutcomeof the interac?on, for example compa?ble will lead tosuscep?bilitywhile incompa?blewill lead to resistance.Plantshave developed structural, chemical and protein-based
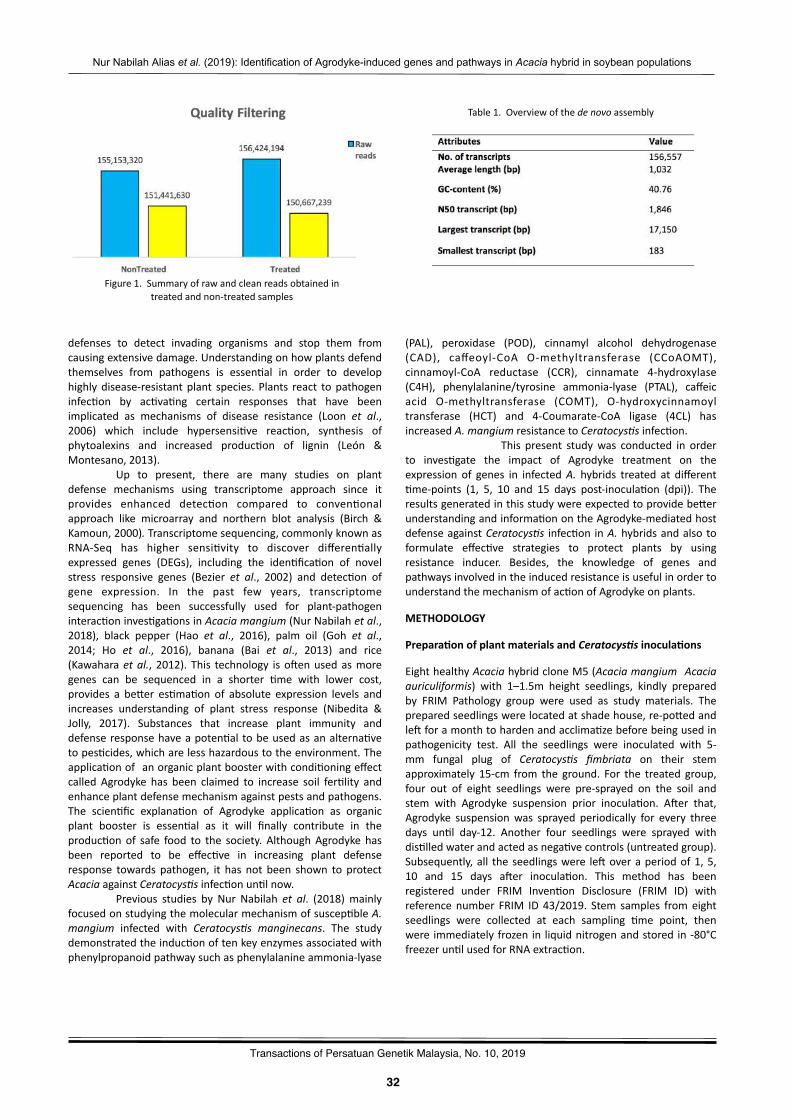
- 32 -
Nur Nabilah Alias et al. (2019): Identification of Agrodyke-induced genes and pathways in Acacia hybrid in soybean populations
32
6
Transactions of Persatuan Genetik Malaysia, No. 10, 2019
defenses to detect invading organisms and stop them fromcausingextensivedamage.Understandingonhowplantsdefendthemselves from pathogens is essen?al in order to develophighlydisease-resistantplant species. Plants react topathogeninfec?on by ac?va?ng certain responses that have beenimplicated as mechanisms of disease resistance (Loon et al.,2006) which include hypersensi?ve reac?on, synthesis ofphytoalexins and increased produc?on of lignin (León &Montesano,2013).
Up to present, there are many studies on plantdefense mechanisms using transcriptome approach since itprovides enhanced detec?on compared to conven?onalapproach like microarray and northern blot analysis (Birch &Kamoun,2000).Transcriptomesequencing,commonlyknownasRNA-Seq has higher sensi?vity to discover differen?allyexpressed genes (DEGs), including the iden?fica?on of novelstress responsive genes (Bezier et al., 2002) and detec?on ofgene expression. In the past few years, transcriptomesequencing has been successfully used for plant-pathogeninterac?oninves?ga?onsinAcaciamangium(NurNabilahetal.,2018), black pepper (Hao et al., 2016), palm oil (Goh et al.,2014; Ho et al., 2016), banana (Bai et al., 2013) and rice(Kawaharaetal., 2012). This technology iso�enusedasmoregenes can be sequenced in a shorter ?me with lower cost,provides a bewer es?ma?on of absolute expression levels andincreases understanding of plant stress response (Nibedita &Jolly, 2017). Substances that increase plant immunity anddefenseresponsehaveapoten?altobeusedasanalterna?vetopes?cides,whicharelesshazardoustotheenvironment.Theapplica?onof anorganicplantboosterwithcondi?oningeffectcalled Agrodyke has been claimed to increase soil fer?lity andenhanceplantdefensemechanismagainstpestsandpathogens.The scien?fic explana?on of Agrodyke applica?on as organicplant booster is essen?al as it will finally contribute in theproduc?onof safe food to the society. AlthoughAgrodyke hasbeen reported to be effec?ve in increasing plant defenseresponse towards pathogen, it has not been shown to protectAcaciaagainstCeratocysGsinfec?onun?lnow.
Previous studies by Nur Nabilah et al. (2018)mainlyfocusedonstudyingthemolecularmechanismofsuscep?bleA.mangium infected with CeratocysGs manginecans. The studydemonstratedtheinduc?onoftenkeyenzymesassociatedwithphenylpropanoidpathwaysuchasphenylalanineammonia-lyase
(PAL), peroxidase (POD), cinnamyl alcohol dehydrogenase(CAD), caffeoyl-CoA O-methyltransferase (CCoAOMT),cinnamoyl-CoA reductase (CCR), cinnamate 4-hydroxylase(C4H), phenylalanine/tyrosine ammonia-lyase (PTAL), caffeicacid O-methyltransferase (COMT), O-hydroxycinnamoyltransferase (HCT) and 4-Coumarate-CoA ligase (4CL) hasincreasedA.mangiumresistancetoCeratocysGsinfec?on.
This present studywas conducted in orderto inves?gate the impact of Agrodyke treatment on theexpression of genes in infectedA. hybrids treated at different?me-points (1, 5, 10 and 15 days post-inocula?on (dpi)). Theresultsgeneratedinthisstudywereexpectedtoprovidebewerunderstandingandinforma?onontheAgrodyke-mediatedhostdefenseagainstCeratocysGs infec?on inA.hybridsandalsotoformulate effec?ve strategies to protect plants by usingresistance inducer. Besides, the knowledge of genes andpathwaysinvolvedintheinducedresistanceisusefulinordertounderstandthemechanismofac?onofAgrodykeonplants.
METHODOLOGY
PreparaWonofplantmaterialsandCeratocys1sinoculaWons
EighthealthyAcaciahybridcloneM5(Acaciamangium Acaciaauriculiformis) with 1–1.5m height seedlings, kindly preparedby FRIM Pathology group were used as study materials. Thepreparedseedlingswerelocatedatshadehouse,re-powedandle�foramonthtohardenandacclima?zebeforebeingusedinpathogenicity test. All the seedlings were inoculated with 5-mm fungal plug of CeratocysGs fimbriata on their stemapproximately 15-cm from the ground. For the treated group,four out of eight seedlings were pre-sprayed on the soil andstem with Agrodyke suspension prior inocula?on. A�er that,Agrodyke suspensionwas sprayed periodically for every threedays un?l day-12. Another four seedlings were sprayed withdis?lledwaterandactedasnega?vecontrols(untreatedgroup).Subsequently,all theseedlingswere le�overaperiodof1,5,10 and 15 days a�er inocula?on. This method has beenregistered under FRIM Inven?on Disclosure (FRIM ID) withreferencenumber FRIM ID43/2019. Stem samples fromeightseedlings were collected at each sampling ?me point, thenwere immediatelyfrozen in liquidnitrogenandstored in-80°Cfreezerun?lusedforRNAextrac?on.
Figure1.Summaryofrawandcleanreadsobtainedintreatedandnon-treatedsamples
Table1.Overviewofthedenovoassembly

- 33 -
Nur Nabilah Alias et al. (2019): Identification of Agrodyke-induced genes and pathways in Acacia hybrid in soybean populations
33
6
Transactions of Persatuan Genetik Malaysia, No. 10, 2019
RNAextracWonandtranscriptomesequencing
Total RNA from treated and untreated stems were extractedusing combina?on method of RNeasy Plant Mini Kit (Qiagen,USA) and Fruit-mate™ (Takara, Japan). The RNA integrity andquan?fica?on of the extracted RNA were determined usingAgilent 2100 BioAnalyzer (Agilent Technologies, USA) with theminimumRNAintegratednumber(RIN)valueof8(Bharudinetal., 2014). The cDNA libraries were generated using IlluminaTruSeq RNA Sample Prepara?on Kit Protocol and sequencingwas performed on Illumina HiSeq 4000 pla�orm at BeijingGenomicsIns?tute(BGI).
Pre-processinganalysisanddenovotranscriptomeassembly
ThequalityoftheobtainedrawreadsoftreatedanduntreatedA.hybridswasevaluatedusingFastQCtool(Andrews,2010)andtrimmingprocesswasdoneusingSolexaQA++(Coxetal.,2010)to filter sequences with a low quality value of < QV20 anddiscardsequenceswith<50bp in length.Thereadswerethenscreened for contamina?on by aligning onto phiX library usingBow?e2 tool (Langmead & Salzberg, 2012). De novotranscriptome assembly of the cleaned paired-end reads wasperformedusingTrinitypipeline(Grabherretal.,2011).
DifferenWal expression analysis and quanWficaWon of geneexpressionlevels
TheFragmentsperKilobaseof transcriptperMillion fragmentsmapped (FPKM), anormalizedquan?ta?veprocedure for gene
Table2.Pairwisecomparisonofdifferen?allyexpressedgenes(DEGs)betweentreated(T)andnon-treated(NT)groupsforeach?me-point(1,5,10and15dayspost-inocula?on(dpi))
Figure2.Comparisonofthenumberofup-anddown-regulatedDEGsbetweentreated(T)andnon-treated(NT)groups
expression of RNA-Seq data was employed to measure theexpressionlevelofeachassembledtranscript.Thefilteredreadsof treatedanduntreatedA.hybridsweremappedback to theassembled transcripts using Bow?e2 (Langmead & Salzberg,2012), followed by transcript abundance es?ma?on processusing RNA-seq by Expecta?on Maximiza?on (RSEM) so�warepackage (Li&Dewey, 2011).Next, the differen?ally expressedgenes (DEGs) were iden?fied using EdgeR with defaultparameters (Robinson et al., 2010). Transcripts showingBenjamin-Hochberg False Discovery Rate (FDR) < 0.01 wereconsidered as significant. Addi?onally, significant transcriptswiththe logfold-changevalue(logFC)>2weremarkedasup-regulated transcripts while logFC < -2 as down-regulatedtranscripts.
FuncWonalannotaWonclassificaWonofdifferenWallyexpressedgenes(DEGs)
The DEGs were annotated using BLASTX alignment againstproteindatabasesNCBInon-redundant(nr)withcut-offE-value<0.00001.Forfunc?onalannota?onofDEGs,theBLASTresultswere imported intoBlast2GOPROso�ware (Gotz etal.,2008)to obtain Gene Ontology (GO) term for the transcripts, thusdescribing the biological process, molecular func?on andcellularcomponentscategories.TheDEGssequenceswerealsoaligned to the Cluster of Orthologous Groups (COGs) proteindatabase (Tatusov et al., 2013) to determine and classifypossible func?ons. The Kyoto Encyclopedia of Genes andGenomes (KEGG), a pathway-based analysis, was then
Figure3.Venndiagramsofoverallup-anddown-regulatedtranscriptsduringCeratocys?sinfec?onacrossfour?me-points(Day1,Day5,Day10
andDay15).(A)Numberofup-regulatedtranscriptsintreated(T)group;(B)Numberofdown-regulatedtranscriptsinnon-treated(NT)
group
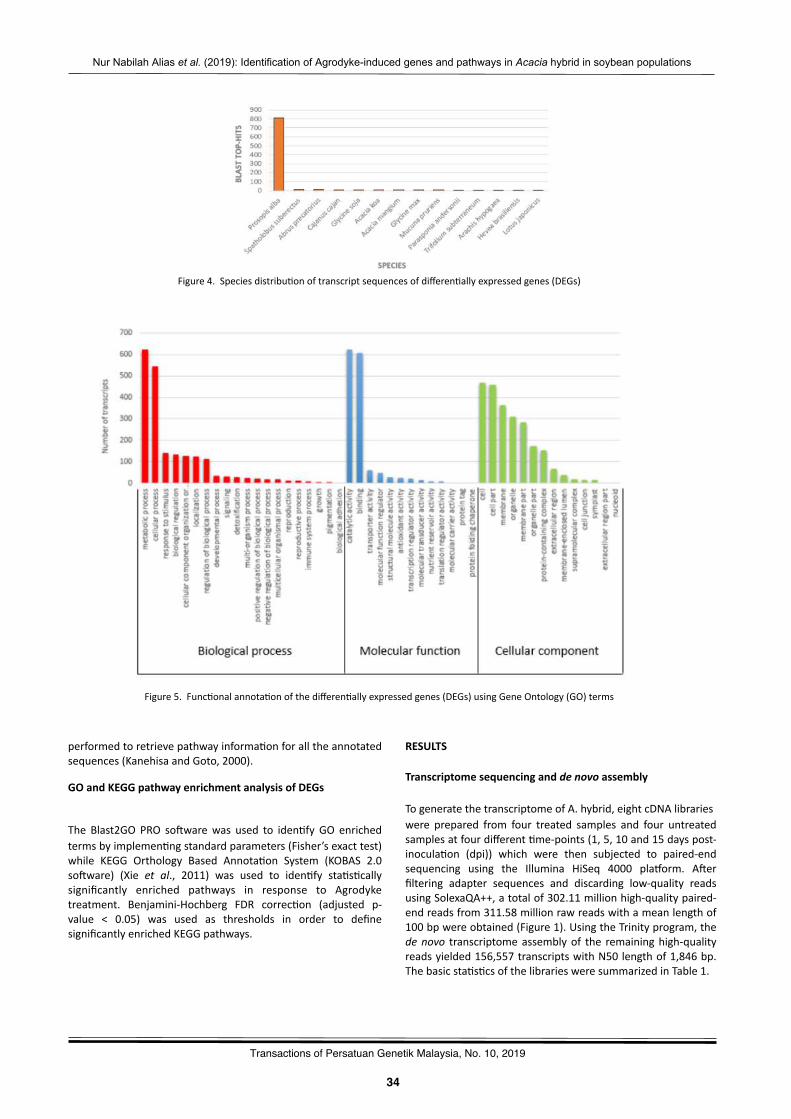
- 34 -
Nur Nabilah Alias et al. (2019): Identification of Agrodyke-induced genes and pathways in Acacia hybrid in soybean populations
34
6
Transactions of Persatuan Genetik Malaysia, No. 10, 2019
performedtoretrievepathwayinforma?onforalltheannotatedsequences(KanehisaandGoto,2000).
GOandKEGGpathwayenrichmentanalysisofDEGs
The Blast2GO PRO so�warewas used to iden?fy GO enrichedtermsbyimplemen?ngstandardparameters(Fisher’sexacttest)while KEGG Orthology Based Annota?on System (KOBAS 2.0so�ware) (Xie et al., 2011) was used to iden?fy sta?s?callysignificantly enriched pathways in response to Agrodyketreatment. Benjamini-Hochberg FDR correc?on (adjusted p-value < 0.05) was used as thresholds in order to definesignificantlyenrichedKEGGpathways.
RESULTS
Transcriptomesequencinganddenovoassembly
TogeneratethetranscriptomeofA.hybrid,eightcDNAlibrarieswere prepared from four treated samples and four untreatedsamplesatfourdifferent?me-points(1,5,10and15dayspost-inocula?on (dpi)) which were then subjected to paired-endsequencing using the Illumina HiSeq 4000 pla�orm. A�erfiltering adapter sequences and discarding low-quality readsusingSolexaQA++,atotalof302.11millionhigh-qualitypaired-endreadsfrom311.58millionrawreadswithameanlengthof100bpwereobtained(Figure1).UsingtheTrinityprogram,thedenovo transcriptomeassemblyof the remaininghigh-qualityreadsyielded156,557transcriptswithN50lengthof1,846bp.Thebasicsta?s?csofthelibrariesweresummarizedinTable1.
Figure4.Speciesdistribu?onoftranscriptsequencesofdifferen?allyexpressedgenes(DEGs)
Figure5.Func?onalannota?onofthedifferen?allyexpressedgenes(DEGs)usingGeneOntology(GO)terms
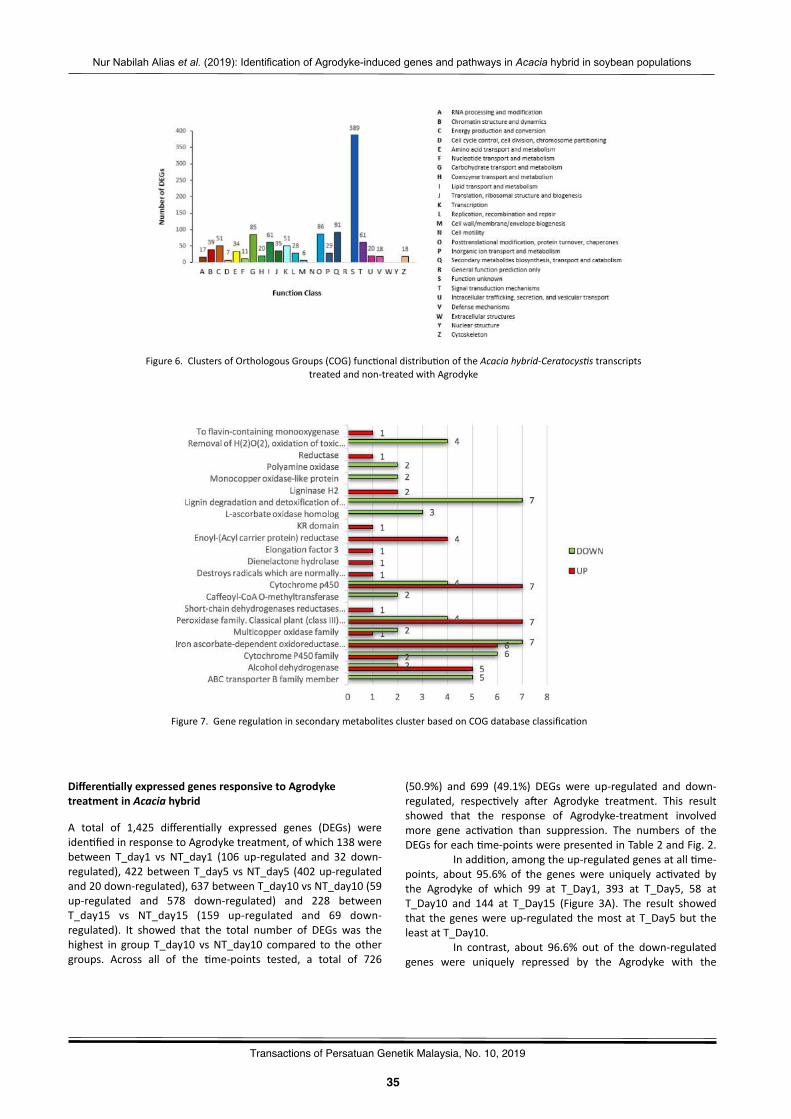
- 35 -
Nur Nabilah Alias et al. (2019): Identification of Agrodyke-induced genes and pathways in Acacia hybrid in soybean populations
35
6
Transactions of Persatuan Genetik Malaysia, No. 10, 2019
DifferenWallyexpressedgenesresponsivetoAgrodyketreatmentinAcaciahybrid
A total of 1,425 differen?ally expressed genes (DEGs) wereiden?fiedinresponsetoAgrodyketreatment,ofwhich138werebetween T_day1 vs NT_day1 (106 up-regulated and 32 down-regulated),422betweenT_day5vsNT_day5 (402up-regulatedand20down-regulated),637betweenT_day10vsNT_day10(59up-regulated and 578 down-regulated) and 228 betweenT_day15 vs NT_day15 (159 up-regulated and 69 down-regulated). It showed that the total number of DEGs was thehighest in group T_day10 vsNT_day10 compared to the othergroups. Across all of the ?me-points tested, a total of 726
Figure6.ClustersofOrthologousGroups(COG)func?onaldistribu?onoftheAcaciahybrid-CeratocysGstranscriptstreatedandnon-treatedwithAgrodyke
(50.9%) and 699 (49.1%) DEGs were up-regulated and down-regulated, respec?vely a�er Agrodyke treatment. This resultshowed that the response of Agrodyke-treatment involvedmore gene ac?va?on than suppression. The numbers of theDEGsforeach?me-pointswerepresentedinTable2andFig.2.
Inaddi?on,amongtheup-regulatedgenesatall?me-points, about 95.6% of the genes were uniquely ac?vated bythe Agrodyke of which 99 at T_Day1, 393 at T_Day5, 58 atT_Day10 and 144 at T_Day15 (Figure 3A). The result showedthat thegeneswereup-regulated themostatT_Day5but theleastatT_Day10.
In contrast, about 96.6% out of the down-regulatedgenes were uniquely repressed by the Agrodyke with the
Figure7.Generegula?oninsecondarymetabolitesclusterbasedonCOGdatabaseclassifica?on

- 36 -
Nur Nabilah Alias et al. (2019): Identification of Agrodyke-induced genes and pathways in Acacia hybrid in soybean populations
36
6
Transactions of Persatuan Genetik Malaysia, No. 10, 2019
highestnumberofgenesatNT_Day10, followedbyNT_Day15,NT_Day1 and NT_Day5 (Figure 3B). This analysis showed thatthe DEGs were responsive differently towards Agrodyketreatment at certain ?me. The results also suggested that theAgrodyke treatmentprobably acted thebest upun?l fivedaysa�er CeratocysGs infec?on but became inefficient a�erprolongedusage.
FuncWonalanalysisofAgrodyke-responsiveDEGs
To find the homologous sequences of Agrodyke-responsiveDEGs, 1,425 transcripts were searched against the NCBI non-redundant (NR) protein database using Blastxwith a cut-off E-
valueof10-⁵.FromBlastsearches,Prosopisalbawas themostfrequent species in blast hitswith 815 transcripts, followedbySpatholobus suberectus (17 transcripts), Abrus precatorius (12transcripts), Cajanus cajan (11 transcripts), Glycine soja (10transcripts),Acaciakoa(10transcripts)andAcaciamangium(10transcripts)(Figure4).
Func?onal gene ontology (GO) classifica?on of 1,425Agrodyke-responsiveDEGswasconductedusingBlast2GOPRO.Based on Figure 5, a total of 47 GO terms were significantlyenrichedandassignedtobiologicalprocess,molecularfunc?onandcellularcomponentcategory.Within thebiologicalprocesscategory, GO terms ‘metabolic process’, ‘cellular process’,‘response to s?mulus’, ‘biological regula?on’ and ‘biogenesis’were the most highly represented groups. While for themolecularfunc?oncategory,mostofthetermsbelongedtothe‘cataly?c ac?vity’, ‘binding’, ‘transporter ac?vity’, ‘molecularfunc?on regulator ’, ‘structural molecule ac?vity’ and‘an?oxidant ac?vity’. GO terms ‘cell’, ‘cell part’, ‘membrane’,‘organelle’and‘membranepart’werethemostenrichedgroupsinthecellularcomponentcategory.
All the DEGswere also aligned to the COG database(Tatusov et al., 2003) to predict and classify their possiblefunc?ons. A total of 1,157 DEGs were classified into 21 COGfunc?onal categories. “Func?on unknown” category (389,33.62%) was the predominant cluster followed by “Secondary
metabolites biosynthesis, transport and catabolism” (91,7.87%), “Poswransla?onal modifica?on, protein turnover,chaperones” (86, 7.43%) and “Carbohydrate transport andmetabolism”(85,7.35%).0gene/transcriptwasassignedtothecategories “Nuclear structure”, “Extracellular structures”, “Cellmo?lity” and “General func?on predic?on only”. Notably, 91and 18 genes were respec?vely annotated to “Secondarymetabolites biosynthesis, transport and catabolism” and“Defense mechanism”, indica?ng that several conservedproteins were associated with defense and biosynthesis ofsecondary metabolism pathways in response to CeratocysGsinfec?onandAgrodyke treatment.Hence, the iden?fica?onofgenes in these pathways is essen?al in order to elucidate thedefense mechanisms in A. hybrids. The results of COGfunc?onalannota?onoftheDEGsareshowedinFigure6.
Further analysis on the secondary metabolite anddefense mechanism clusters was carried out based on COGdatabase classifica?on. Out of 1,425 transcripts that wereassigned throughCOGdatabase,91 transcriptswere clusteredin “Secondary metabolites biosynthesis, transport andcatabolism” with 41 up-regulated and 50 down-regulatedtranscripts, respec?vely (Figure 7). In this cluster, the highestnumber of up-regulated transcripts were ‘Peroxidase family’and ‘Cytochrome p450’ with 7 transcripts each, followed by‘Iron ascorbate-dependent oxidoreductase family’ (6transcripts) and ‘Alcohol dehydrogenase’ (5 transcripts).Whilethehighestnumberofdown-regulatedtranscriptswere‘Lignindegrada?on and detoxifica?on of lignin-derived products’ and‘Iron ascorbate-dependent oxidoreductase family’ with 7transcripts, followed by ‘Cytochrome P450 family’ (6transcripts) and ‘ABC transporter B family member’ (5transcripts).
Intotal,therewere18transcriptsthatweremappedinto defense mechanism cluster, with 2 and 16 up-regulatedanddown-regulated transcripts, respec?vely (Figure8). In thiscluster, two transcripts were up-regulated in response toAgrodyke treatment, namely cinnamyl-alcohol dehydrogenase(CAD)andNADdependentepimerase/dehydratase.Thehighestdown-regulated transcripts were ‘Bifunc?onal dihydroflavonol
Figure8.Generegula?onindefensemechanismclusterbasedonCOGdatabaseclassifica?on
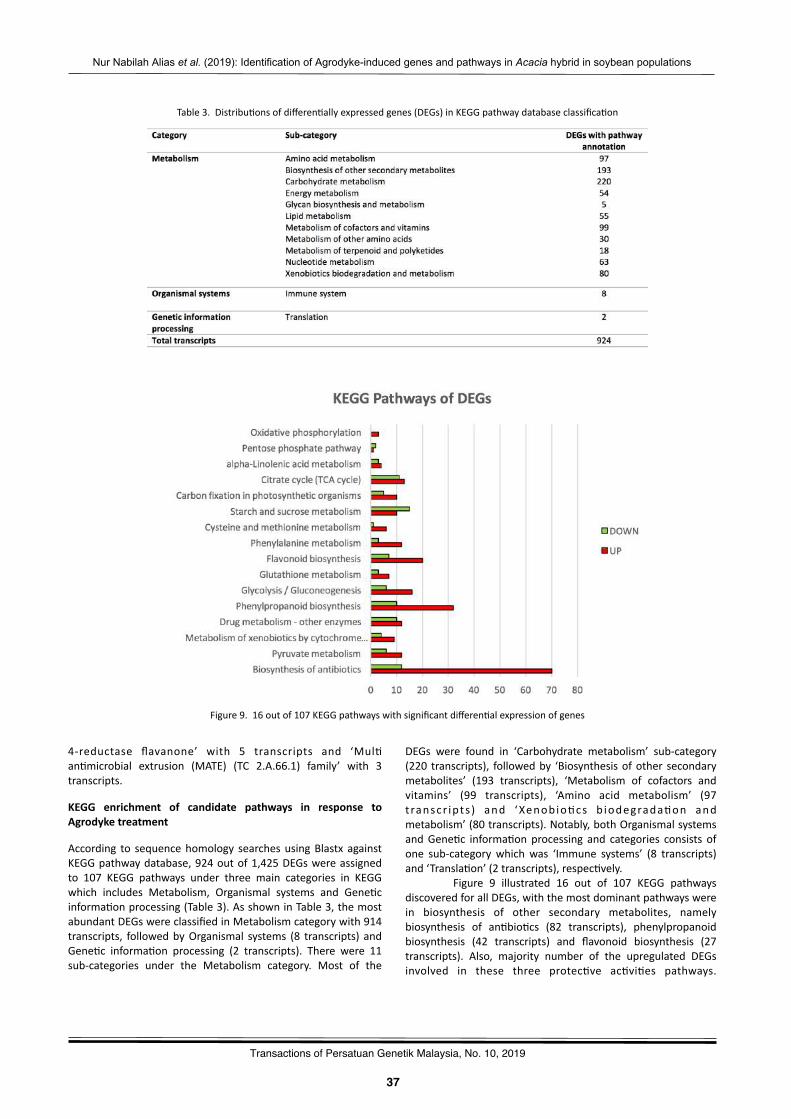
- 37 -
Nur Nabilah Alias et al. (2019): Identification of Agrodyke-induced genes and pathways in Acacia hybrid in soybean populations
37
6
Transactions of Persatuan Genetik Malaysia, No. 10, 2019
Table3.Distribu?onsofdifferen?allyexpressedgenes(DEGs)inKEGGpathwaydatabaseclassifica?on
Figure9.16outof107KEGGpathwayswithsignificantdifferen?alexpressionofgenes
4-reductase flavanone’ with 5 transcripts and ‘Mul?an?microbial extrusion (MATE) (TC 2.A.66.1) family’ with 3transcripts.
KEGG enrichment of candidate pathways in response toAgrodyketreatment
According to sequencehomology searchesusingBlastx againstKEGGpathwaydatabase,924outof1,425DEGswereassignedto 107 KEGG pathways under three main categories in KEGGwhich includes Metabolism, Organismal systems and Gene?cinforma?onprocessing(Table3).AsshowninTable3,themostabundantDEGswereclassifiedinMetabolismcategorywith914transcripts, followedbyOrganismal systems (8 transcripts) andGene?c informa?on processing (2 transcripts). There were 11sub-categories under the Metabolism category. Most of the
DEGs were found in ‘Carbohydrate metabolism’ sub-category(220 transcripts), followedby ‘Biosynthesisofothersecondarymetabolites’ (193 transcripts), ‘Metabolism of cofactors andvitamins’ (99 transcripts), ‘Amino acid metabolism’ (97t ranscr ipts ) and ‘Xenobio?cs b iodegrada?on andmetabolism’(80transcripts).Notably,bothOrganismalsystemsandGene?c informa?onprocessing and categories consists ofone sub-category whichwas ‘Immune systems’ (8 transcripts)and‘Transla?on’(2transcripts),respec?vely.
Figure 9 illustrated 16 out of 107 KEGG pathwaysdiscoveredforallDEGs,withthemostdominantpathwayswerein biosynthesis of other secondary metabolites, namelybiosynthesis of an?bio?cs (82 transcripts), phenylpropanoidbiosynthesis (42 transcripts) and flavonoid biosynthesis (27transcripts). Also, majority number of the upregulated DEGsinvolved in these three protec?ve ac?vi?es pathways.
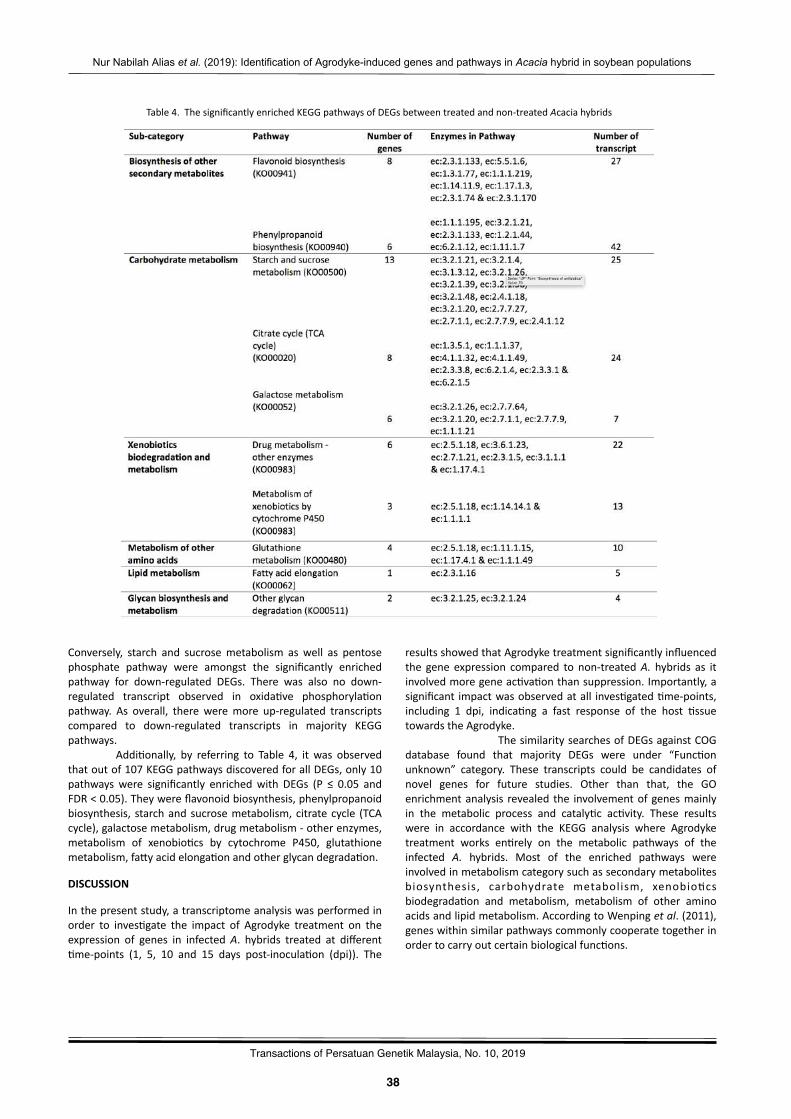
- 38 -
Nur Nabilah Alias et al. (2019): Identification of Agrodyke-induced genes and pathways in Acacia hybrid in soybean populations
38
6
Transactions of Persatuan Genetik Malaysia, No. 10, 2019
Table4.ThesignificantlyenrichedKEGGpathwaysofDEGsbetweentreatedandnon-treatedAcaciahybrids
Conversely, starch and sucrosemetabolism as well as pentosephosphate pathway were amongst the significantly enrichedpathway for down-regulated DEGs. There was also no down-regulated transcript observed in oxida?ve phosphoryla?onpathway. As overall, there weremore up-regulated transcriptscompared to down-regulated transcripts in majority KEGGpathways.
Addi?onally, by referring to Table 4, it was observedthatoutof107KEGGpathwaysdiscoveredforallDEGs,only10pathwayswere significantly enrichedwith DEGs (P ≤ 0.05 andFDR<0.05).Theywereflavonoidbiosynthesis,phenylpropanoidbiosynthesis, starchandsucrosemetabolism,citratecycle (TCAcycle),galactosemetabolism,drugmetabolism-otherenzymes,metabolism of xenobio?cs by cytochrome P450, glutathionemetabolism,fawyacidelonga?onandotherglycandegrada?on.
DISCUSSION
Inthepresentstudy,atranscriptomeanalysiswasperformedinorder to inves?gate the impact of Agrodyke treatment on theexpression of genes in infectedA. hybrids treated at different?me-points (1, 5, 10 and 15 days post-inocula?on (dpi)). The
resultsshowedthatAgrodyketreatmentsignificantlyinfluencedthe gene expression compared to non-treatedA. hybrids as itinvolvedmoregeneac?va?onthansuppression.Importantly,asignificant impactwasobservedatall inves?gated?me-points,including 1 dpi, indica?ng a fast response of the host ?ssuetowardstheAgrodyke.
ThesimilaritysearchesofDEGsagainstCOGdatabase found that majority DEGs were under “Func?onunknown” category. These transcripts could be candidates ofnovel genes for future studies. Other than that, the GOenrichmentanalysis revealed the involvementofgenesmainlyin the metabolic process and cataly?c ac?vity. These resultswere in accordance with the KEGG analysis where Agrodyketreatment works en?rely on the metabolic pathways of theinfected A. hybrids. Most of the enriched pathways wereinvolvedinmetabolismcategorysuchassecondarymetabolitesbiosynthesis, carbohydrate metabolism, xenobio?csbiodegrada?on and metabolism, metabolism of other aminoacidsandlipidmetabolism.AccordingtoWenpingetal.(2011),geneswithinsimilarpathwayscommonlycooperatetogetherinordertocarryoutcertainbiologicalfunc?ons.
- 39 -
Nur Nabilah Alias et al. (2019): Identification of Agrodyke-induced genes and pathways in Acacia hybrid in soybean populations
39
6
Transactions of Persatuan Genetik Malaysia, No. 10, 2019
TheKEGGpathwayanalysisrevealedthatmostoftheupregulated genes involved in biosynthesis of an?bio?cs.An?bio?cs are phytochemicals that are known to havean?microbial and an?viral proper?es in plants (Wink &Schimmer, 2010). Considering to this proper?es, the ac?va?onofgenesinthispathwaymightbeoneofthemainmechanismsof ac?on of the Agrodyke. Apart from that, phenylpropanoidand flavonoids pathways were also significantly enriched inresponse to theAgrodyke treatment.Phenylpropanoidsexhibitan?microbial ac?vity which play major role as chemical andphysical barriers against pathogen infec?on. Also, they act assignalmoleculesinlocalandsystemicplantdefensemechanism.Thephenylpropanoidpathwayislinkedtoflavonoidbiosynthe?cpathway which also plays important role in play resistance(Treuwer, 2006). The overproduc?on of phenylpropanoid andflavonoids by the plant is considered to be a part of specifican?microbialdefensesystem(Winketal.,2010).Therefore,theac?va?onofgeneslikeperoxidase(POD,EC:1.11.1.7),cinnamyl-alcohol dehydrogenase (CAD, EC:1.1.1.195) and O-hydroxycinnamoyl transferase (HCT, EC:2.3.1.133) inphenylpropanoidpathwayandchalcone isomerase(EC:5.5.1.6),flavanone (EC:2.3.1.74) and 4-reductase (EC:1.1.1.219) inflavonoid pathway reconfirms their important involvement asplantdefenseresponse.
Interes?ngly, this study discovered that genesassociated with defense response were highly up-regulatedwhile genes related to growth and development processweredown-regulated upon Agrodyke treatment. Starch and sucrosemetabolism and pentose phosphate pathway have importantfunc?ons in plant growth and development. However, in thisstudy,moregenesareiden?fiedtobedown-regulatedinthesepathwaysuponthetreatmentofAgrodyke.Thisfindingsupportsa view that there is a trade-off between growth and defenseresponseassecondarymetabolitesandstructuralreinforcementare physiologically constrained in dividing and enlarging cellssincetheydivertresources fromtheproduc?onofnew leaf. Inthepresentstudy,itissuggestedthatAgrodykeprobablyplaysacentral role in controlling resource alloca?on between thecompe?ngprocessofdefenseandgrowth.
In addi?on,more up-regulated geneswere iden?fiedin cysteine and methionine metabolism and oxida?vephosphoryla?on pathway, indica?ng their crucial role inoxida?on resistance in plants (Bin et al., 2017). Furthermore,these pathways are important for producing cellular energywhichresults intheac?va?onofthehostdefensemechanismsandsuppressionofthepathogencoloniza?onofthehost?ssue.The results also showed an overall high expression of defensegenes involved in xenobio?cmetabolism inA. hybrids treatedwith Agrodyke. Xenobio?cs are foreign chemical contaminantsthat can be absorbed and accumulated in plant cells(Sandermann,1992).Theplantinducestheexpressionofseveralgenes involved in xenobio?cs metabolism in order to detoxifythosecomponents.Theac?va?onofgenesresponsibleforplantdetoxifica?on, specifically cytochrome P450 and glutathione S-transferases(GSTs,EC:2.5.1.18)suggestedA.hybridresponsetotheAgrodyketreatment.
CONCLUSION
In conclusion, the results of the present study provide acomprehensiveoverviewoftheimpactofAgrodykeonthegeneexpression of treatedA. hybrids, highligh?ng the induc?on ofmul?ple metabolic responses. In par?cular, GO analysis andpathway mapping of the DEGs showed the induc?on ofimportant defense pathways such as phenylpropanoidbiosynthesis pathway, flavonoid biosynthesis pathway andmetabolism of xenobio?cs by cytochrome P450. Besides, theiden?fiedgenesassociatedwithdefenseresponselikePODandCAD could provide a resource for further developing resistantvarie?esofAcaciavarie?esagainstCeratocysGsinfec?on.
ACKNOWLEDGEMENT
We thank University of Technology Malaysia (UTM), Skudai,JohorandForestResearch Ins?tuteofMalaysia (FRIM) for thefund and support. We also thank Malaysia Genome Ins?tute(MGI) for the assistance in bioinforma?cs analysis as well asFRIM Gene?c Laboratory members and Pathology Laboratorymembersfortheirtechnicalassistance.
REFERENCES
Andrews,S. (2010).FastQC:aqualitycontrol tool forhigh throughputsequencedata.
Bai,T.,Xie,W.,Zhou,P.,Wu,Z.,Xiao,W.,Zhou,L.,andLi,H. (2013).Transcriptome and expression profile analysis of highly resistant andsuscep?ble banana roots challenged with Fusarium oxysporum f. sp.cubense.TropicalRace4.PLoSONE.8(9):e73945.
Bezier,A.,Lambert,B.,andBaillieul,F.(2002).Studyofdefence-relatedgeneexpression ingrapevine leavesandberries infectedwithBotryGscinerea.EuropeanJournalofPlantPathology.108:111–120.
Bharudin,I.,Zaki,N.Z.,AbuBakar,F.D.,Mahadi,N.M.,Najimudin,N.,Illias,R.M.,andMurad,A.M.A.(2014).ComparisonofRNAextrac?onmethods for transcript analysis from the psychrophilic yeast,GlaciozymaantarcGca.MalaysianAppliedBiology.43(2):71-79.
Bin, P., Huang, R., and Zhou, X. (2017). Oxida?on resistance of thesulfur amino acids: Methionine and cysteine. BioMed ResearchInterna?onal,2017.
Birch, P. R. J., and Kamoun, S. (2000). Studying interac?ontranscriptomes: analyses of gene expression during plant–microbeinterac?ons.TrendsinPlantScience.Supplement:LifeScienceResearchinthe21stCentury:ATrendsGuide.77–82.
Cox, M. P., Peterson, D. A., and Biggs, P. J. (2010). SolexaQA: At-a-glance quality assessment of Illumina second-genera?on sequencing
data.BMCBioinforma?cs.11:485.
FAO. (2002). Case study of tropical forest planta?ons in Malaysia byD.B.A Krishnapillay. Forest Planta?ons Working Paper 23. ForestResourcesDevelopmentService,ForestResourcesDivision.FAO,Rome.
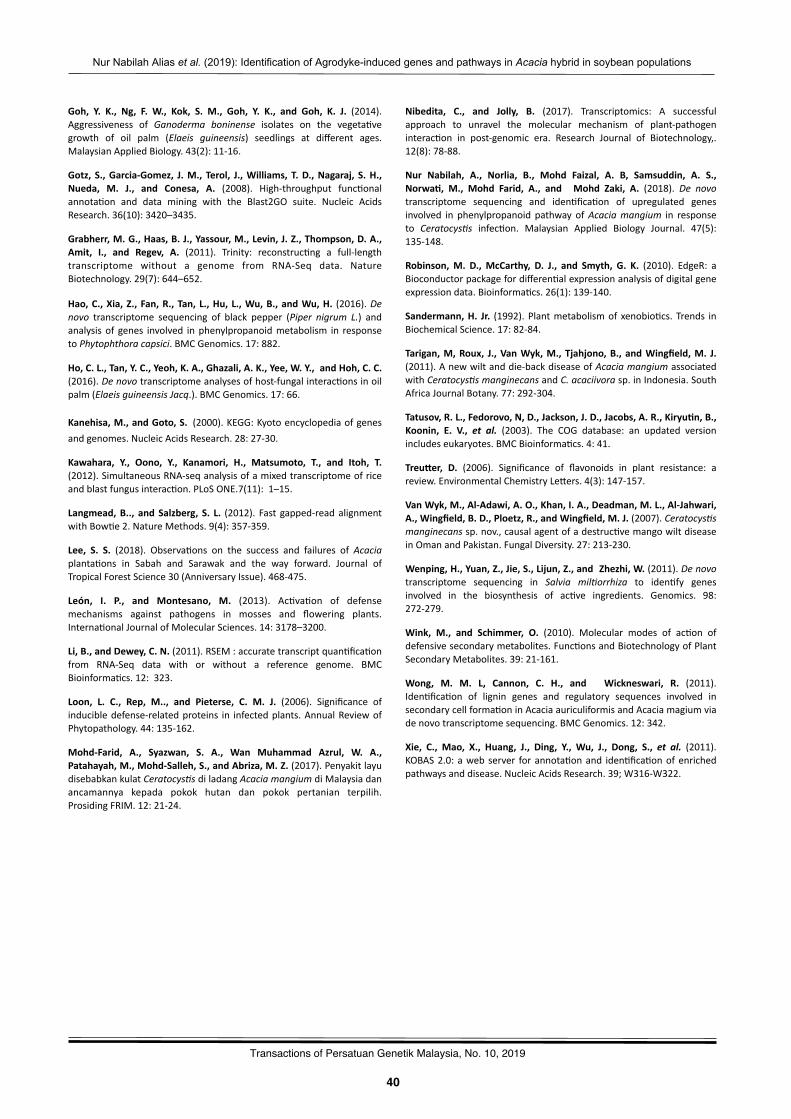
- 40 -
Nur Nabilah Alias et al. (2019): Identification of Agrodyke-induced genes and pathways in Acacia hybrid in soybean populations
40
6
Transactions of Persatuan Genetik Malaysia, No. 10, 2019
Goh, Y. K., Ng, F. W., Kok, S. M., Goh, Y. K., and Goh, K. J. (2014).Aggressiveness of Ganoderma boninense isolates on the vegeta?vegrowth of oil palm (Elaeis guineensis) seedlings at different ages.MalaysianAppliedBiology.43(2):11-16.
Gotz, S.,Garcia-Gomez, J.M., Terol, J.,Williams,T.D.,Nagaraj, S.H.,Nueda, M. J., and Conesa, A. (2008). High-throughput func?onalannota?on and data mining with the Blast2GO suite. Nucleic AcidsResearch.36(10):3420–3435.
Grabherr,M.G.,Haas,B.J.,Yassour,M.,Levin,J.Z.,Thompson,D.A.,Amit, I., and Regev, A. (2011). Trinity: reconstruc?ng a full-lengthtranscriptome without a genome from RNA-Seq data. NatureBiotechnology.29(7):644–652.
Hao,C.,Xia,Z.,Fan,R.,Tan,L.,Hu,L.,Wu,B.,andWu,H. (2016).Denovo transcriptome sequencing of black pepper (Piper nigrum L.) andanalysis of genes involved inphenylpropanoidmetabolism in responsetoPhytophthoracapsici.BMCGenomics.17:882.
Ho,C.L.,Tan,Y.C.,Yeoh,K.A.,Ghazali,A.K.,Yee,W.Y.,andHoh,C.C.(2016).Denovotranscriptomeanalysesofhost-fungalinterac?onsinoilpalm(ElaeisguineensisJacq.).BMCGenomics.17:66.
Kanehisa,M.,andGoto,S. (2000).KEGG:Kyotoencyclopediaofgenesandgenomes.NucleicAcidsResearch.28:27-30.
Kawahara, Y., Oono, Y., Kanamori, H., Matsumoto, T., and Itoh, T.(2012).SimultaneousRNA-seqanalysisofamixedtranscriptomeofriceandblastfungusinterac?on.PLoSONE.7(11):1–15.
Langmead,B.., andSalzberg, S. L. (2012). Fast gapped-readalignmentwithBow?e2.NatureMethods.9(4):357-359.
Lee, S. S. (2018). Observa?ons on the success and failures of Acaciaplanta?ons in Sabah and Sarawak and the way forward. Journal ofTropicalForestScience30(AnniversaryIssue).468-475.
León, I. P., and Montesano, M. (2013). Ac?va?on of defensemechanisms against pathogens in mosses and flowering plants.Interna?onalJournalofMolecularSciences.14:3178–3200.
Li,B.,andDewey,C.N.(2011).RSEM :accuratetranscriptquan?fica?onfrom RNA-Seq data with or without a reference genome. BMCBioinforma?cs.12:323.
Loon, L. C., Rep, M.., and Pieterse, C. M. J. (2006). Significance ofinducibledefense-relatedproteins in infectedplants.AnnualReviewofPhytopathology.44:135-162.
Mohd-Farid, A., Syazwan, S. A., Wan Muhammad Azrul, W. A.,Patahayah,M.,Mohd-Salleh,S.,andAbriza,M.Z.(2017).PenyakitlayudisebabkankulatCeratocysGsdiladangAcaciamangiumdiMalaysiadanancamannya kepada pokok hutan dan pokok pertanian terpilih.ProsidingFRIM.12:21-24.
Nibedita, C., and Jolly, B. (2017). Transcriptomics: A successfulapproach to unravel the molecular mechanism of plant-pathogeninterac?on in post-genomic era. Research Journal of Biotechnology,.12(8):78-88.
Nur Nabilah, A., Norlia, B., Mohd Faizal, A. B, Samsuddin, A. S.,NorwaW, M., Mohd Farid, A., and Mohd Zaki, A. (2018). De novotranscriptome sequencing and iden?fica?on of upregulated genesinvolved in phenylpropanoid pathway ofAcaciamangium in responseto CeratocysGs infec?on. Malaysian Applied Biology Journal. 47(5):135-148.
Robinson,M. D.,McCarthy, D. J., and Smyth, G. K. (2010). EdgeR: aBioconductorpackagefordifferen?alexpressionanalysisofdigitalgeneexpressiondata.Bioinforma?cs.26(1):139-140.
Sandermann,H. Jr. (1992).Plantmetabolismof xenobio?cs.Trends inBiochemicalScience.17:82-84.
Tarigan,M,Roux, J.,VanWyk,M.,Tjahjono,B.,andWingfield,M. J.(2011).Anewwiltanddie-backdiseaseofAcaciamangiumassociatedwithCeratocysGsmanginecansandC.acaciivorasp.inIndonesia.SouthAfricaJournalBotany.77:292-304.
Tatusov,R.L.,Fedorovo,N,D.,Jackson,J.D.,Jacobs,A.R.,KiryuWn,B.,Koonin, E. V., et al. (2003). The COG database: an updated versionincludeseukaryotes.BMCBioinforma?cs.4:41.
TreuJer, D. (2006). Significance of flavonoids in plant resistance: areview.EnvironmentalChemistryLewers.4(3):147-157.
VanWyk,M.,Al-Adawi,A.O.,Khan,I.A.,Deadman,M.L.,Al-Jahwari,A.,Wingfield,B.D.,Ploetz,R.,andWingfield,M.J.(2007).CeratocysGsmanginecanssp.nov.,causalagentofadestruc?vemangowiltdiseaseinOmanandPakistan.FungalDiversity.27:213-230.
Wenping,H.,Yuan,Z.,Jie,S.,Lijun,Z.,andZhezhi,W.(2011).Denovotranscriptome sequencing in Salvia milGorrhiza to iden?fy genesinvolved in the biosynthesis of ac?ve ingredients. Genomics. 98:272-279.
Wink, M., and Schimmer, O. (2010). Molecular modes of ac?on ofdefensivesecondarymetabolites.Func?onsandBiotechnologyofPlantSecondaryMetabolites.39:21-161.
Wong, M. M. L, Cannon, C. H., and Wickneswari, R. (2011).Iden?fica?on of lignin genes and regulatory sequences involved insecondarycellforma?oninAcaciaauriculiformisandAcaciamagiumviadenovotranscriptomesequencing.BMCGenomics.12:342.
Xie, C., Mao, X., Huang, J., Ding, Y., Wu, J., Dong, S., et al. (2011).KOBAS2.0:awebserver forannota?onand iden?fica?onofenrichedpathwaysanddisease.NucleicAcidsResearch.39;W316-W322.

- 41 -
Corresponding author:
Transactions of Persatuan Genetik Malaysia, No. 10, 2019 Published by Genetics Society of Malaysia http://www.pgm-my.org
27
41
Identification of WRKY transcription factor expressed in root of Tongkat Ali: Preliminary study
Norlia Basherudin, Forest Biotechnology Division, Forest Research Institute Malaysia (FRIM), 52109 Kepong, Selangor, MalaysiaEmail: [email protected]
Abstract
TongkatAliorscien?ficallyknownasEurycomalongifoliaisoneofthemostwell-knownherbalmedicinesinSoutheastAsia.TongkatAli extract especially from root haswidely been used in pharmaceu?cal industries and various secondarymetabolites have beenisolated. Duetotheirbeneficialeffectstohealth,biosynthesisofsecondarymetabolitehasbeenaprimefocusofresearch. Manytranscrip?on factors (TF) has been iden?fied toplaymajor roles in regula?ng secondarymetabolite biosynthesis pathways at thetranscrip?onallevel. AmongTFsfrequentlyreportedtoregulateplantsecondarymetabolismbiosynthesisarethefamiliesofWRKY.Herewereport10WRKY-relatedTFwhichexpressedinrootofTongkatAli.TheTFswerededucedfromtranscriptomeanalysisof10-and1-year-oldTongkatAliroot.RNAfrombothrootweresequencedusingIlluminaHi-Seq2000technologyandthesequencingdatawasassembledusingSOAPdenovoso�ware.60,753non-redundantunigeneswerefinallygenerated.BLASTXsearchanalysisshowedthat60unigenesweresimilartoWRKYTFand33unigeneswereup-regulatedinrootof10-year-oldtree. Outof33TFs,17were
Keywords:Eurycomalongifolia,transcriptome,secondarymetabolitesLine
LastKey
IntroINTRODUCTION
Tongkat Ali (Eurycoma longifolia) is a well-known medicinalplant with significant economic value inMalaysia. It is a slowgrowing herbal plant under the family of Simaroubaceae andna?ve to Malaysia, Indonesia, Vietnam, Myanmar, Loas andThailand(Rehmanetal.,2016). TherootextractofTongkatAlihasbeenreportedtoexhibitdifferenttypesofpharmacologicaleffectssuchasan?malaria(Al-Adhroeyetal,2010;Wernsdorferetal.,2009),aphrodisiac(Wahabetal.,2010),an?cancer(Teeet al., 2005), ergogenic (Muhamad et al., 2010) and toxicity(Razaketal.,2011).This plant species is also reported toconsistof several classesof secondarymetabolitesandthemajor among them are the quassinoids, canthin-6-one, beta-carboline alkaloids, squalene deriva?ves,?rucallane-type triterpenes and biphenylneolignans(reviewbyBhatandKarim,2012).
Plantsecondarymetabolitesarecompoundsthatplayrolesininterac?onoftheorganismwithitsenvironment.Thesecompoundsareo�eninvolvedinplantsprotec?onagainstbio?cor abio?c stresses. Plant secondary metabolites are highlydiverseintheirchemicalstructuresandareclassifiedintothreemajor classes which are terpenoids, alkaloids and phenolics.Biosynthesis of plant secondary metabolites went through acomplex network of enzyma?cally catalysed metabolicpathways. Several families of TFs have been iden?fied asregulators of plant secondary metabolism. Among TFsfrequently reported to regulate plant secondary metabolismbiosynthesisarethefamiliesofWRKY,AP2/ERF,MYBandbHLH(Misraetal.,2014;Yang,2012;VomEndt,2002).
WRKYdomain-containinggenescompriseoneofthelargestTFfamilies that have to date only been found in plants. It ischaracterizedbyhighlyconservedWRKYGQKmo?fandusuallyfollowed by zinc-finger mo?f, located at the N-terminus(Rushton et al., 2010). TheWRKYdomain is approximately 60amino acid residues in length and has poten?al DNA bindingac?vity.NumerousWRKYTFsfromawiderangeofplantspecieshave been characterized and shown to par?cipate in growth,development,metabolismandresponsetoenvironmentalcues(Chietal.,2013;SchluwenhoferandYuan,2015;Phukanetal.,2016; Chen et al., 2017; Jiang et al., 2017). Since 2007accumula?onofevidencesuggeststhatcertainWRKYsregulatethe produc?on of valuable natural products by regula?ngmetabolite biosynthesis genes (Kato et al., 2007; Ma et al.,2009; Sucpanta et al., 2011). The first structure of WRKYdomainwaspublished in2005. Basedonthearrangementofzinc-fingermo?f andnumberofWRKYdomain,WRKYTFs areclassified into three major groups and further sub-groups(Rushton et al, 2010). Group I members typically have twoWRKYdomainsandaC2H2zinc-fingermo?fwhereasGroup IImembers have a singleWRKY domain and a C2H2 zinc-fingermo?f.Accordingtothepawernoftheirzinc-fingermo?f,GroupIImemberscanbefurtherdividedintoII(a)-(e)bythepresenceof ten addi?onal structural mo?fs that are conserved amongsubsetsofWRKYfamilymembers.AsingleWRKYdomainandaC2HCzinc-fingermo?fcharacterizeGroup IIIWRKYTFs.GroupIIIWRKYTFsaredividedintotwotypesonthebasisofpawernof zinc-finger mo?f. The structure of zinc-finger mo?f forsubgroup III(a) is C-X7-C-X₂₃·HXC (X for any amino acid),while
thatofsubgroupIII(b)isC-X7-C-Xn-HXC(n ≥ 24).
Norlia Basherudin1, Nur Nabilah Alias1, Nor Hasnida Hassan1, Norwati Muhammad1, Mohd Zaki Abdullah1, Mohd Faizal Abu Bakar2, and Mohd Noor Mat Isa2
1 Forest Biotechnology Division, Forest Research Institute Malaysia (FRIM), 52109 Kepong, Selangor, Malaysia2 Malaysia Genome Institute, Jalan Bangi, 43000 Kajang, Selangor, Malaysia
- 42 -
Norlia Basherudin et al. (2019): Identification of WRKY transcription factor in Tongkat Ali
42
7
Transactions of Persatuan Genetik Malaysia, No. 10, 2019
Table1.Listof17TongkatAlitranscriptomeunigenesannotatedhavingsimilaritytoWRKYtranscrip?onfactorwiththeirreadperkilobasemapped(RPKM)expressioninrootof10and1yearoldtree
WRKYTFs areunique toplants regula?ngvariousphysiologicalfunc?ons therefore any changes at transcrip?onal level wouldalterdiversefunc?onsinplantsincludingsecondarymetabolitebiosynthesis. In this study, few WRKY TF that were highlyexpressed in 10 year old Tongkat Ali root were iden?fied andcharacterized based on their WRKY domain. The TFs wereclassifiedaccordingtomethodsu?lizedbyotherstudies.
MATERIALSANDMETHODS
Plantmaterials
Rootsoftenyear-oldTongkatAliwascollectedfromTongkatAliplot, Bukit Hari, Forest Research Ins?tuteMalaysia (FRIM) andone year-old Tongkat Ali was from the nursery of KepongBotanical Garden, Forest Research Ins?tute Malaysia (FRIM).Root of Tongkat Ali harvested from one and 10 year-old wereimmediatelyputinliquidnitrogenun?lfurtherprocessing. Forlongerstorage,therootswerekeptat-80°C.
RNAisolaWonandquanWficaWon
RNA isola?on from the roots of Tongkat Ali were carried outusing RNeasy Plant Mini Kit (Qiagen) according to protocoloutlinedbythesupplier. Samplewasgroundintopowderinapre-chilled DEPC-treated mortar in the presence of liquidnitrogen. QIAshredderspincolumnwasusedtofilterthecell-debris andRNeasy spin columnwas used to trap all theRNA.TheRNAwas thenelutedwith 50ul of RNase-freewater andkeptat4°Cor-80°Cforlongerstorage.AgilentRNA6000NanoChips run on Agilent 2100 bioanalyzer (Agilent Technologies)wereusedtoassesstheRNAquality. Sampleprepara?onandapparatusset-uptodeterminetheRNAqualitywascarriedoutaccordingtotheapparatusmanual.
Illuminasequencing
The total RNAwith absorbance 260/280nm ra?oof ~2.0 andRINnumbermorethan8.0waschosenforIlluminaHi-Seq2000
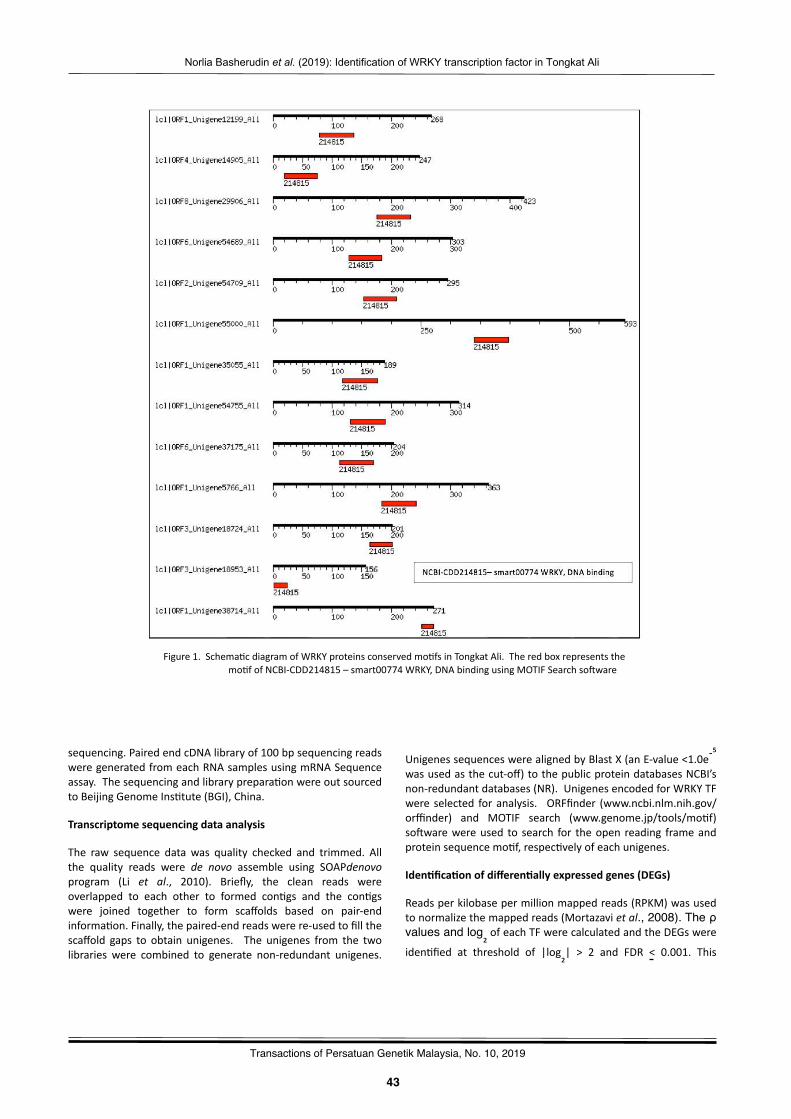
- 43 -
Norlia Basherudin et al. (2019): Identification of WRKY transcription factor in Tongkat Ali
43
7
Transactions of Persatuan Genetik Malaysia, No. 10, 2019
Figure1.Schema?cdiagramofWRKYproteinsconservedmo?fsinTongkatAli.Theredboxrepresentsthemo?fofNCBI-CDD214815–smart00774WRKY,DNAbindingusingMOTIFSearchso�ware
sequencing.PairedendcDNAlibraryof100bpsequencingreadsweregeneratedfromeachRNAsamplesusingmRNASequenceassay.Thesequencingandlibraryprepara?onwereoutsourcedtoBeijingGenomeIns?tute(BGI),China.
Transcriptomesequencingdataanalysis
The raw sequence data was quality checked and trimmed. Allthe quality reads were de novo assemble using SOAPdenovoprogram (Li et al., 2010). Briefly, the clean reads wereoverlapped to each other to formed con?gs and the con?gswere joined together to form scaffolds based on pair-endinforma?on.Finally,thepaired-endreadswerere-usedtofillthescaffold gaps to obtain unigenes. The unigenes from the twolibraries were combined to generate non-redundant unigenes.
UnigenessequenceswerealignedbyBlastX(anE-value<1.0e-⁵wasusedasthecut-off)tothepublicproteindatabasesNCBI’snon-redundantdatabases(NR).UnigenesencodedforWRKYTFwere selected foranalysis. ORFfinder (www.ncbi.nlm.nih.gov/orffinder) and MOTIF search (www.genome.jp/tools/mo?f)so�warewereused to search for theopen reading frameandproteinsequencemo?f,respec?velyofeachunigenes.
IdenWficaWonofdifferenWallyexpressedgenes(DEGs)
Readsperkilobasepermillionmappedreads(RPKM)wasusedtonormalizethemappedreads(Mortazavietal., 2008). The ρ values and log₂ofeachTFwerecalculatedandtheDEGswereiden?fied at threshold of |log₂| > 2 and FDR < 0.001. This
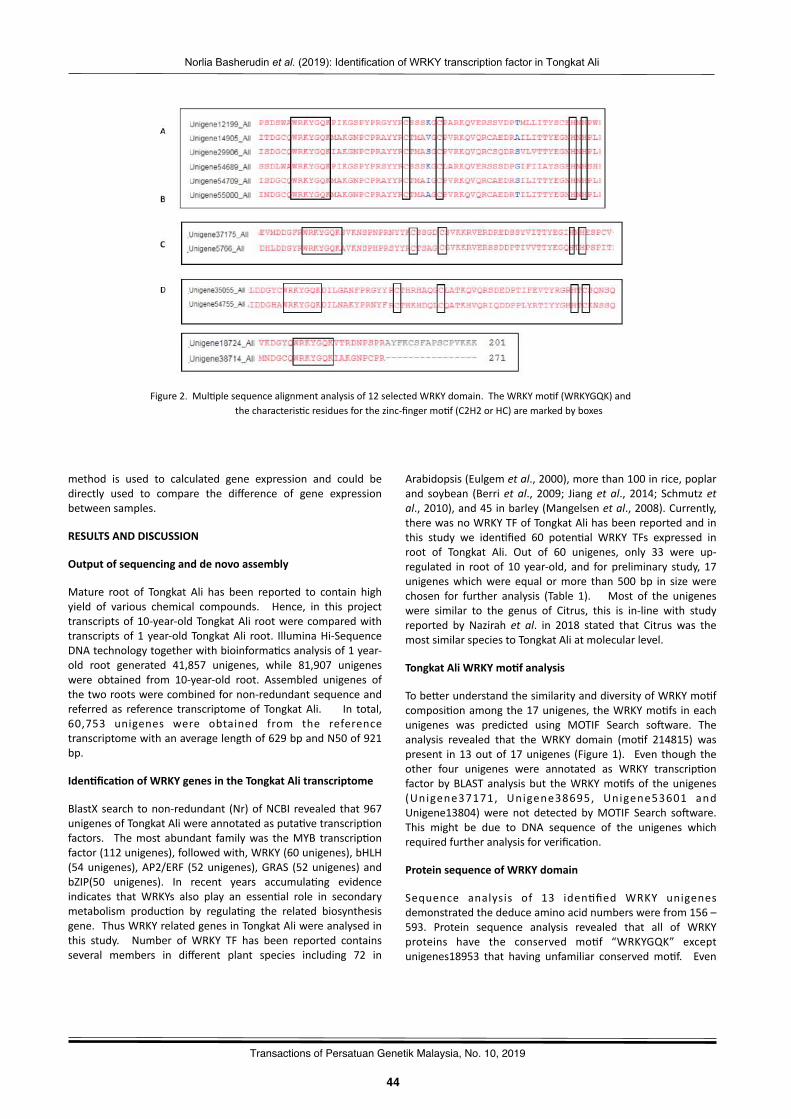
- 44 -
Norlia Basherudin et al. (2019): Identification of WRKY transcription factor in Tongkat Ali
44
7
Transactions of Persatuan Genetik Malaysia, No. 10, 2019
Figure2.Mul?plesequencealignmentanalysisof12selectedWRKYdomain.TheWRKYmo?f(WRKYGQK)andthecharacteris?cresiduesforthezinc-fingermo?f(C2H2orHC)aremarkedbyboxes
method is used to calculated gene expression and could bedirectly used to compare the difference of gene expressionbetweensamples.
RESULTSANDDISCUSSION
Outputofsequencinganddenovoassembly
Mature root of Tongkat Ali has been reported to contain highyield of various chemical compounds. Hence, in this projecttranscriptsof10-year-oldTongkatAli rootwerecomparedwithtranscriptsof1year-oldTongkatAli root. IlluminaHi-SequenceDNAtechnologytogetherwithbioinforma?csanalysisof1year-old root generated 41,857 unigenes, while 81,907 unigeneswere obtained from 10-year-old root. Assembled unigenes ofthetworootswerecombinedfornon-redundantsequenceandreferred as reference transcriptomeof TongkatAli. In total,60,753 unigenes were obtained from the referencetranscriptomewithanaveragelengthof629bpandN50of921bp.
IdenWficaWonofWRKYgenesintheTongkatAlitranscriptome
BlastXsearch tonon-redundant (Nr)ofNCBI revealed that967unigenesofTongkatAliwereannotatedasputa?vetranscrip?onfactors. Themost abundant familywas theMYB transcrip?onfactor(112unigenes),followedwith,WRKY(60unigenes),bHLH(54unigenes),AP2/ERF (52unigenes),GRAS (52unigenes)andbZIP(50 unigenes). In recent years accumula?ng evidenceindicates that WRKYs also play an essen?al role in secondarymetabolism produc?on by regula?ng the related biosynthesisgene. ThusWRKYrelatedgenesinTongkatAliwereanalysedinthis study. Number of WRKY TF has been reported containsseveral members in different plant species including 72 in
Arabidopsis(Eulgemetal.,2000),morethan100inrice,poplarand soybean (Berrietal., 2009; Jiangetal., 2014; Schmutzetal.,2010),and45inbarley(Mangelsenetal.,2008).Currently,therewasnoWRKYTFofTongkatAlihasbeenreportedandinthis study we iden?fied 60 poten?al WRKY TFs expressed inroot of Tongkat Ali. Out of 60 unigenes, only 33 were up-regulated in rootof 10 year-old, and forpreliminary study, 17unigeneswhichwere equal ormore than500bp in sizewerechosen for further analysis (Table 1). Most of the unigeneswere similar to the genus of Citrus, this is in-line with studyreported by Nazirah et al. in 2018 stated that Citrus was themostsimilarspeciestoTongkatAliatmolecularlevel.
TongkatAliWRKYmoWfanalysis
TobewerunderstandthesimilarityanddiversityofWRKYmo?fcomposi?onamongthe17unigenes,theWRKYmo?fs ineachunigenes was predicted using MOTIF Search so�ware. Theanalysis revealed that the WRKY domain (mo?f 214815) waspresent in13outof17unigenes (Figure1). Even though theother four unigenes were annotated as WRKY transcrip?onfactorbyBLASTanalysisbut theWRKYmo?fsof theunigenes(Unigene37171, Unigene38695, Unigene53601 andUnigene13804)were not detected byMOTIF Search so�ware.This might be due to DNA sequence of the unigenes whichrequiredfurtheranalysisforverifica?on.
ProteinsequenceofWRKYdomain
Sequence analysis of 13 iden?fied WRKY unigenesdemonstratedthededuceaminoacidnumberswerefrom156–593. Protein sequence analysis revealed that all of WRKYproteins have the conserved mo?f “WRKYGQK” exceptunigenes18953 that having unfamiliar conservedmo?f. Even
- 45 -
Norlia Basherudin et al. (2019): Identification of WRKY transcription factor in Tongkat Ali
45
7
Transactions of Persatuan Genetik Malaysia, No. 10, 2019
though amino acid sequence of WRKY protein in few studiesreported been replaced byWRRY,WSKY,WKRY orWKKY (Xie,2005), but none of the amino acid sequence similar tounigene18953. All the 12 unigenes consist of one conservedmo?f“WRKY”,indica?ngnoneofthemwerebelongtogroupI.WRKY domain of Unigene18724 and unigene38714 weretruncated at C-terminal ofWRKY domain, therefore conservedzincfingermo?fcouldnotbeiden?fied(Figure2[D]). Howeveras these unigenes possess typical conserved sequence theywereretainedforfurtheranalysistoverifytheirWRKYdomain.
Most proteinswith oneWRKY domain are belong togroup II. Group IImembers have a singleWRKY group and aC2H2zinc-fingermo?f. Basedonzinc-fingermo?f,thisgroupisfurther divided into five subgroups (IIa-IIe). In this study,unigenes12199, 14905, 29906, 54689, 54709 and 55000 werepredicted belong to group II(b) as their zinc finger mo?f typewas CX₅CX₂₃HXH (Figure 2[A]).While, Unigene37175 and 5766
werepredictedbelong to group II(c) as the characteriza?onofthezincfingermo?fshowedasCX₄CX₂₃HXH(Figure2[B]). Zinc
fingermo?fofUnigene35055and54755exhibitedCX₇CX₂₃HXC
typewhichbelongs toWRKYdomain group III(a) (Figure 2[C]).WRKY TF roles in regula?ng metabolite biosynthe?c
genefortheproduc?onofvaluablenaturalproductshavebeenreported in few studies (Kato et al., 2007; Ma et al., 2009;Sucpanta et al., 2011). WRKY TFs of cowon have beeniden?fied to regulate sesquiterpene cyclase at the pathwayleading to the produc?on of gossypol, an an?feedantphytoalexin (Xu et al., 2004). The produc?on of an?malarialdrugartemisinininArtemisiaannuawasalsoreporteddoubledby overexpressing of its WRKY TF (Han et al., 2014). Thesereports provide evidence that WRKY TFs could be used toengineermetaboliteorsecondarymetabolitepathwaysandwasalso suggested that could control cri?cal rate-limi?ng inmetabolicpathways(Schluwenhoferetal.,2015).
WRKY TFs iden?fied from Tongkat Ali werepoten?ally involve in regula?on of its secondary metabolicpathways which was reported to produce in wide rangeespecially quassinoids and alkaloids. However furthercharacteriza?ononeachWRKYTFshouldbecarryout indetailto iden?fy which were the responsible genes in Tongkat Alisecondarymetaboliteproduc?on.Understandingtheirfunc?onswould provide ways to successfully reengineer this medicinalplant to provide con?nuous and higher yielding materials forpharmaceu?calsindustrypurposes.
CONCLUSION
Despite being highly sought a�er medicinal plant inMalaysia,verylimitednumbersofstudyhavebeenreportedinsecondarymetabolites biosynthesis of Tongkat Ali. We have analysedtranscriptomicsdata from rootof TongkatAli to iden?fy genesinvolved in its secondary metabolites produc?on. Amonginteres?ng expressed genes iden?fied were WRKY TFs. FewstudiesinotherplantspecieshavereportedtheroleofWRKYTFin secondarymetabolite produc?on, thusWRKY TF of TongkatAliwereworth to further analysed.As a preliminary resultwe
reportoniden?fica?onoftwelveWRKYTFsofTongkatAlibaseontheirconservedWRKYdomain.AlltheunigeneshaveWRKYmo?f with conserved WRKYGQK amino acid sequence andfollowwith either C2H2or C2HC zinc fingermo?f. Six of theWRKYTFswerebelongtogroupII(b),whiletwowerebelongstogroupII(c)andanothertwowereingroupIII(a).AlltheseWRKYTFswereup-regulatedin10year-oldrootwhichconsisthigheryield of secondary metabolites. However further analysis isrequiredtocharacterizedfunc?onofeachWRKYTF.
ACKNOWLEDGMENTS
ThisstudywasfundedunderRMK-11FRIMdevelopmentfund.WethankstaffofGene?cLaboratory,FRIMfortheirassistanceandcontribu?ontothisstudy.
REFERENCES
Al-Adhroey, A. H., Nor, Z. M., Al-Mekhlafi, H. M., and Mahmud R.(2010).EthnobotanicalstudyonsomeMalaysianan?-malarialplants:Acommunitybasedsurvey.JournalofEthnopharmacol.132:362-364.
Berri, S., Abbruxcato, P., Faivre-Rampant, O., Brasileiro, A. C. M.,Fumasoni, I., Satoh, K., et al., (2009). Characteriza?on of WRKY co-regulatoy networks in rice and Arabidopsis. BioMed Central PlantBiology.9:120.
Bhat,R.,andKarim,A.A.(2010).TongkatAli(EurycomalongifoliaJack):a review on its ethnobotany and pharmacological importance.Fitoterapia.81:669-679.
Chi,Y.,Yang,Y.,Zhou,J.,Fan,B.,Yu,J.Q.etal.(2013).Protein-proteininterac?ons in theregula?onofWRKYtranscrip?onfactors.MolecularPlant.6:287-300.
Chen,F.,Hu,Y.,Vannozzi,A.,Wu,K.,Cai,H.,Qin,Y.etal.(2017). TheWRKY transcrip?on factors family in model plants and crops. Cri?calReviewPlantScience.36:311-335.
Eulgem,T.,Rushton,P.J.,Robatzek,S.,andSomssich,I.E.(2000).TheWRKYsuperfamilyofplanttranscrip?onfactors.TrendsinPlantScience.5:199-206.
Han,M.,Kim,C.Y.,Lee,J.,Lee,S.K.,andJeon,J.S.(2014).OsWRKY42repress OsMT1d and induces reac?ve oxygen species and leafsenescenceinrice.MolecularCells.37:532-539.
Jiang,C.,Shen,Q.J.,Wang,B.,He,B.,Xiao,S.,Chen,L.,etal.(2017).TranscriptomeanalysisofWRKYgenefamilyinOryzaofficinalisWallexWaw and WRKY gene involved in responses to Xanthomonas oryzaestress.PloSOne.12:e0188742.
Jiang,Y.Z.,Duan,Y.J.,Yin,J.,Ye,S.L.,Zhu,J.R.,Zhang,F.Q.,andLuoK. M. (2014) Genome-wide iden?fica?on and characteriza?on of thePopulus WRKY transcrip?on factor family and analysis of theirexpression in response to bio?c and abio?c stresses. Journal ofExperimentBotany.65:6629–6644.
- 46 -
Norlia Basherudin et al. (2019): Identification of WRKY transcription factor in Tongkat Ali
46
7
Transactions of Persatuan Genetik Malaysia, No. 10, 2019
Kato,N.,Dubouzet,E.,Kokabu,Y.,YoshidaS.,Taniguchi,Y.etal.(2007).Iden?fica?on of WRKY protein as a transcrip?onal regulator ofbenzylisoquinolinealko\aloidbiosynthesis inCopGs japonica. PlantCellPhysiology.48:8-18.
Li,R.,Zhu,H.,Ruan,J.,Qian,W.,Fang,X.,Shi,Z.,etal.(2010).DeNovoassembly of human genomes with massively parallel short readsequencing.GenomeResearch.20:265-272.
Ma,D.,Pu,G.,Lei,C.,Ma,I.,Wang,H.,Guo,Y.,etal.(2009).Isola?onand characteriza?on of AaWRKY1, an Artemisia annua transcrip?onfactorthatregulatestheamorpha-4,11-dienesynthasegene,akeygeneofartemisininbiosynthesis.PlantCellPhysiology.50:2146-2161.
Mangelsen,E.,Kilian,J.,Berendzen,K.W.,Kolukisaoqlu,U.H.,Harter,K., Jansson, C., and Wanle, D. (2008). Phylogene?c and compara?vegene expression analysis of barley (Hordeum vulgare) WRKYtranscrip?on factor family reveals puta?ve retained func?onsbetweenmonocotsanddicots.BioMedCentralGenomics.9:194.
Mortazavi, A.,Williams, B. A.,Mccue, K., Schaeffer, L., andWold, B.(2008).Mapping and quan?fying mammalian transcriptomes by RNA-Seq.NatureMethods.5:621-628.
Muhamad,A.S.,Keong,C.C.,Kiew,O.F.,AbdullahM.R.,andLam,C.K. (2010). Effects of Eurycoma longifolia jack supplementa?on onrecrea?onal athlete's endurance running capacity and physiologicalresponses in theheat. Interna?onal Journal ofApplied Sports Science.22:1-19.
Misra, R. C., MaiW, P., ChanoWya, C. S., Shanker, K., and Ghosh, S.(2014) Methyl jasmonate-elicited transcrip?onal responses andpentacyclictriterpenebiosynthesisinsweetbasil.PlantPhysiology.164:1028–1044.
Nazirah, A. (2018). Kajian penghasilan 9-metoksikanthin-6-one danprofil transcriptom kultur akar rerambut Eurycoma longifolia (TongkatAli).MasterSciencethesisofUniversi?KebangsaanMalaysia.
Phukan,U.J.,Jeena,G.S.,andShukla,R.K.(2016).WRKYtranscrip?onfactors:molecularregula?onandstressresponsesinplant.Fron?ersinPlantScience.7:760.
Razak,M.F.A.,andAidoo,K.E.(2011).ToxicitystudiesofEurycomalongifolia(Jack)-Basedremedialproducts.AsianJournalofPharmaceu?cal&ClinicalResearch.4:23-27.
Rehman,S.U.,Choe,K.,andYoo,H.H.(2016).Reviewonatradi?onalherbalMedicine,Eurycoma longifolia Jack (Tongkat Ali): It’s tradi?onalUses, Chemistry, evidence-based pharmacology and toxicology.Molecules.21(3):331-362.
Rushton,P.J.,SomssichI.E.,RinglerP.,andShenQ.X.J.(2010).WRKYtranscrip?onfactors.TrendsinPlantScience.15:247-258.
Schmutz,J.,Cannon,S.B.,Schlueter,J.,Ma,J.X.,Mitros,T.,Nelson,W. et al. (2010) Genome sequence of the palaeopolyploid soybean.Nature.463:178–183.
SchluJenhofer. C., and Yuan, L. (2015). Regula?on of specializedmetabolism by WRKY transcrip?on factors. Plant Physiology. 167:295-306.
Suupanta, N., PaJanaik, P., Kulshrestha, M., Patra, B., Singh, S. K.,and Yuan, L. (2011). The transcrip?on factor CrWRKY1 posi?velyregulates the terpenoid indole alkaloid biosynthesis in Catharanthusroseus.PlantPhysiology.157:2081-2093.
Tee, T. T., and Azimahtol, H. L. P. (2005). Induc?on ofapoptosis by Eurycoma longifolia Jack extracts. An?cancerRes.25:2205-2213.
Wahab,N.A.,Norfilza,M.M.Halim,W.N.H.A., andDasS. (2010).TheeffectofEurycomalongifoliaJackonspermatogenesisinestrogen-treatedrats.Clinics.65:93-98.
VomEndt,D.,Kijne,J.W.andMemelink,J.(2002).Transcrip?onfactorcontrollingplantsecondarymetabolism:whatregulatestheregulators?Phytochemistry.61(2):107-114.
Wernsdorfer, W. H., Ismail, S. Chan, K. L., Congpuong K., andWernsdorfer, G.(2009). Ac?vity of Eurycoma longifolia root extractagainst Plasmodium falciparum in vitro. Wiener KlinischeWochenschri�.121:23-26.
Xie,Z.,Zhang,Z. L.,Zou,X.,Huang, J.,Ruas,P.,Thompson,D.,etal.(2005). Annota?ons and func?onal analyses of the rice WRKY genesuperfamily reveal posi?ve and nega?ve regulators of abscisic acidsignalinginaleuronecells.PlantPhysiology.137:176-189.
Xu, Y.H., Wang, J. W.,Wang, S., Wang, J. Y., and Chen X. Y. (2004).Characteriza?on of GaWRKY1, a Cowon Transcrip?on Factor ThatRegulatestheSesquiterpeneSynthaseGene(+)-δ-CadineneSynthase-A.PlantPhysiology.135(1):507-515.
Yang, C.Q., Fang, X.,Wu, X.M.,Mao, Y. B., andWang, L. J. (2012).Transcrip?onal regula?on of plant secondary metabolism. JournalIntegra?onPlantBiology.54:703-712.
- 47 -
Corresponding author:
Transactions of Persatuan Genetik Malaysia, No. 10, 2019 Published by Genetics Society of Malaysia http://www.pgm-my.org
33
47
Line
LastKey
Intro
Early nursery growth measures indicate successful transfer of desirable traits to 3rd cycle derivatives from oil palm originally prospected from NigeriaAmirul Asraf Tumin and Goh Hua LekIOI Group Pamol Plantations Sdn Bhd, P. O. Box 1, 86007 Kluang, Johor, Malaysia
Amirul Asraf Tumin, IOI Group Pamol Plantations Sdn Bhd, P. O. Box 1, 86007 Kluang, Johor, MalaysiaEmail: [email protected]
Abstract
Breedingforshortpalmshasbeenakeyfocusforoilpalmbreedersovertheyearsforitsadvantageinlongereconomiclifecycleandeaseformatureharves?ng.Withcon?nuousdifficul?estofindcompetenttallpalmharvesterseachyearandtheindustryambi?ontoincorporateautoma?oninharves?ng,workondevelopingshortplan?ngmaterialhasbeengainingmomentum.InMalaysia,theNigerianProspec?onMaterial(NPM)oftheMalaysiaPalmOilBoard(MPOB)isknowntocontainpalmsofsmallsizeandstature.Nohetal.in2014men?onedthatgene?cvariabilityintheNPMpopula?oniss?llhigh,givingamplescopeforfurtherselec?on.DeliduraxNPMpisiferaprogenieswerereportedbyAroluetal.(2018)tobeshortwithaverageannualpalmincrementof<30cm/year,whichis 33-60% less than the typical range in annual height increment of 45-75cm/year for current commercial DxP plan?ngmaterial.Deriva?vesof theoriginalNPM, i.e. 2nd cycleNPM,hadbeenplantedat IOIGroup’sMamorEstate in Kluang, Johor, in 1996. Toconservethematerialforfuturebreeding,palmswereselectedfromafamilyexhibi?ngsmallstaturetoproduce3rdcycleNPM.Wereportearlynurserygrowthmeasurement inthis3rdcycleNPM,showingthatdesirabletraitsofsmallsizeandstaturehavebeensuccessfullytransmiwedfromtheselected2ndcycleparents.Nurserymeasuressuchasthesearerarelyifeverdoneinthenormalcourseofoilpalmbreeding.Thesemeasuresarerela?velysimpletocarryout,andifdone,couldbecomeusefulearlyindicatorsofsuccessfulconserva?onortransmissionofdesirablegrowthtraitsinbreedingpopula?ons.
Keywords: Progeny trial, breeding strategy, genotype, environment
INTRODUCTION
With the acquiring of Pamol Planta?ons and its germplasmmaterialsin2003,IOIhadinheritedthemostwidelyknownandextensively evaluated short Nigerian Prospec?on Materials(NPM).Thismaterialwas ini?allyprospectedbyMalaysiaPalmOilBoardMPOBatNigeria in1973 (Marhaliletal., 2017). TheprospectedNigerianmaterialswereplantedandevaluated inafieldgenebankatMPOBKluang,Johorin1975/76andhasbeenwidelydistributedtootheragencieseversince.
Gene?c variability in theNPMpopula?on is s?ll highwhichgivesamplescopeforfurtherselec?on(Nohetal.,2014).Despitethepoorfruitcharactersofthispopula?on,thevalueofthismaterial hinge at its outstanding vegeta?ve traits (Sengetal.,2015).TheDxPderivedfromthispopula?onwasreportedbyArolu et al. (2018) to be short with average annual palmincrementof<30cm/year,whichis33-60%lessthanthetypicalrange in annual height increment of 45-75cm/year for currentcommercialDxPplan?ngmaterial.
In 1996, second genera?on of NPM was planted inMamor Estate in Kluang, Johor. With the purpose of furtherbreeding and conserva?on, several dura palms from a shortfamily in this second genera?on NPM trial were selected andwere either selfed, sib crossed or outcrossed with breedingmaterial fromother origins to produce the third genera?onofNPMpopula?ons.
A pre-nursery stage vegeta?ve measurement analysis wasthereforeconductedtostudythedifferencesingrowthpawernsat pre-nursery stage between the following three groups ofcrosses(Table1):inbredthirdgenera?onNPMdura(selfedandsib-crossed), outcrossed third genera?on NPM dura (crossedouttootherorigins),andinbredDeliduraascontrol.
METHODS
All the seedlings were subjected to IOI Group standardopera?ng procedure prac?ces for pre-nursery. Sowing wasconducted in IOI-Pamol Research Kluang Pre-nursery usingelevatedpot traysystem.Sowingdate foreach treatmentwasrecorded.
Seedlingheight,diameterofstembase,totalrela?veleafareaandnumberofgreenleavesperplantweremeasuredusing themethodsofCorleyandBreure (1981)at45days,75daysand105daysa�ersowing.
All the data collected were subjected to frequencydistribu?on analysis, rate of growth analysis and analysis ofvariance (ANOVA) using Sta?s?cal Analysis System (SAS)package.
RESULTSANDDISCUSSION
Table2showsresultsofANOVAforvegeta?vemeasuresattheendofthestudyperiod(i.e.105daysa�ersowing).Differences
- 48 -
Amirul Asraf and Goh (2019): Early nursery growth measures indicate successful transfer of desirable traits
48
8
Transactions of Persatuan Genetik Malaysia, No. 10, 2019
between treatments were sta?s?cally significant for height,number of green leaves per plant, total rela?ve leaf area andtrunkdiameter.
Theheightofthe3rdgenera?oninbredNPMdurawassignificantlylowercomparedtoboth3rdgenera?onoutcrossedNPM dura and inbred Deli dura as shown in Figure 1. This isdespitethe3rdgenera?oninbredNPMDurahavingsignificantlymorenumberofgreenleavesperplantandhighertotalrela?veleafareacompared to the tallestDelidura inbredwhich is thecontrolforthisstudy.
The same parent of the 3rd genera?on inbred NPMdurawhenoutcrossedtoatallpalmofanotheroriginproducedprogenythatshowedhybridvigour,withsignificantlytallerplantheight, higher total rela?ve area, and greater stem diameter.Numberofgreens leavesperplantwasalsohigher thoughnotsta?s?callysignificantatthe95%levelofprobability.
It is interes?ng to note in this study that 3��genera?on inbred NPM dura are significantly shorter withoutthe expense of lower number of green leaves per plant. Themeantotalgreen leavesproducedbythismaterialat105daysa�ersowingwas5.7leaves(Table2),oranaverageof1.6greenleavesperplantpermonthwhich is60%higher compared tothe leafproduc?onbynormaloil palm seedlingsgrown inprenurseryunderbestmanagementprac?ces(BMP)asreportedbyDonoughetal.(2014)whichaverageat1leavepermonth.
AlthoughtheDeliduralinehadbeendomes?catedbyoil palm breeders much earlier since the exploita?on of fourpalmsinBogorBotanicalGardenin1848(Rajanaiduetal.,2013)in comparison to the u?liza?on of NPMwhich started only in1973(Marhaliletal.,2017),thelowheighttraitisnotcommonin the former since the selec?on pressure in Deli dura
Table1.Listofcrossesandnumberofseedlingsinvolvedinthestudy
Table2.ANOVAresultsforvegeta?vemeasuresat105daysa�ersowing
Figure1.Randomlyselectedseedlingsofeachtreatmentat105daya�ersowing
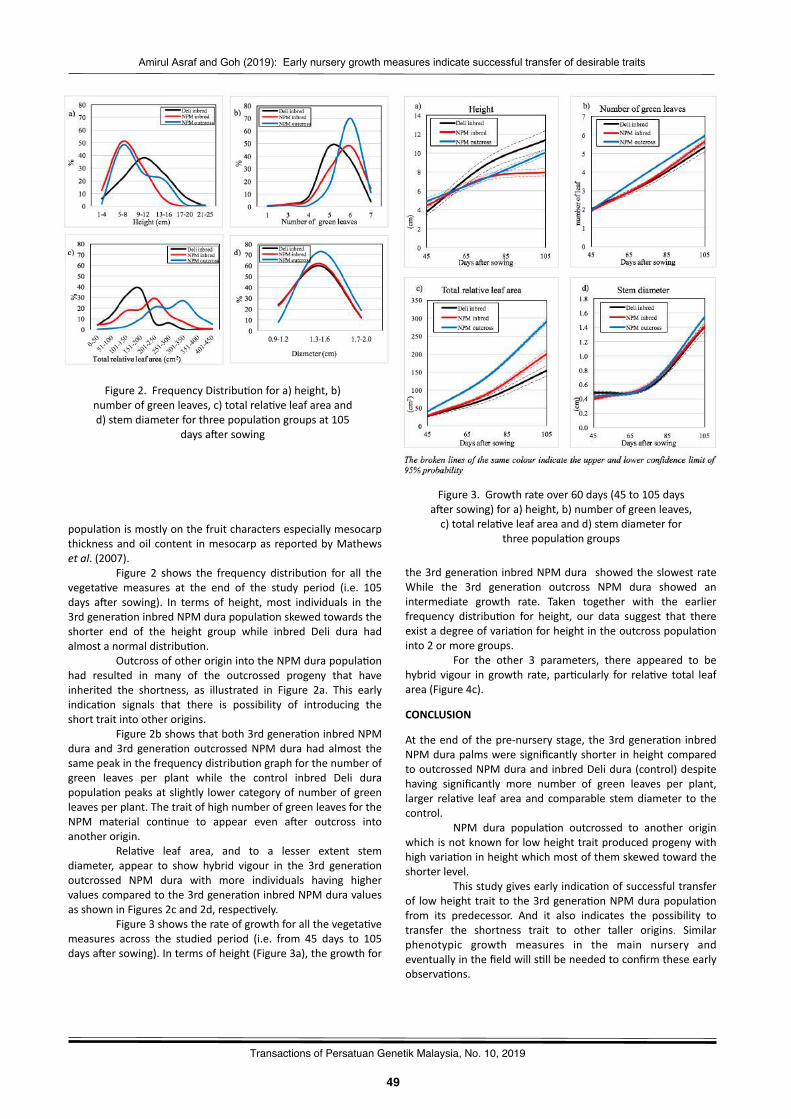
- 49 -
Amirul Asraf and Goh (2019): Early nursery growth measures indicate successful transfer of desirable traits
49
8
Transactions of Persatuan Genetik Malaysia, No. 10, 2019
popula?onismostlyonthefruitcharactersespeciallymesocarpthicknessandoilcontent inmesocarpasreportedbyMathewsetal.(2007).
Figure 2 shows the frequency distribu?on for all thevegeta?ve measures at the end of the study period (i.e. 105days a�er sowing). In terms of height,most individuals in the3rdgenera?oninbredNPMdurapopula?onskewedtowardstheshorter end of the height group while inbred Deli dura hadalmostanormaldistribu?on.
OutcrossofotheroriginintotheNPMdurapopula?onhad resulted in many of the outcrossed progeny that haveinherited the shortness, as illustrated in Figure 2a. This earlyindica?on signals that there is possibility of introducing theshorttraitintootherorigins.
Figure2bshowsthatboth3rdgenera?oninbredNPMduraand3rdgenera?onoutcrossedNPMdurahadalmost thesamepeakinthefrequencydistribu?ongraphforthenumberofgreen leaves per plant while the control inbred Deli durapopula?onpeaksatslightly lowercategoryofnumberofgreenleavesperplant.ThetraitofhighnumberofgreenleavesfortheNPM material con?nue to appear even a�er outcross intoanotherorigin.
Rela?ve leaf area, and to a lesser extent stemdiameter, appear to show hybrid vigour in the 3rd genera?onoutcrossed NPM dura with more individuals having highervaluescomparedtothe3rdgenera?oninbredNPMduravaluesasshowninFigures2cand2d,respec?vely.
Figure3showstherateofgrowthforallthevegeta?vemeasures across the studied period (i.e. from 45 days to 105daysa�ersowing).Intermsofheight(Figure3a),thegrowthfor
the3rdgenera?oninbredNPMdura showedtheslowestrateWhile the 3rd genera?on outcross NPM dura showed anintermediate growth rate. Taken together with the earlierfrequency distribu?on for height, our data suggest that thereexistadegreeofvaria?onforheightintheoutcrosspopula?oninto2ormoregroups.
For the other 3 parameters, there appeared to behybrid vigour in growth rate, par?cularly for rela?ve total leafarea(Figure4c).
CONCLUSION
Attheendofthepre-nurserystage,the3rdgenera?oninbredNPMdurapalmsweresignificantlyshorter inheightcomparedtooutcrossedNPMduraandinbredDelidura(control)despitehaving significantly more number of green leaves per plant,larger rela?ve leafareaandcomparable stemdiameter to thecontrol.
NPM dura popula?on outcrossed to another originwhichisnotknownforlowheighttraitproducedprogenywithhighvaria?oninheightwhichmostofthemskewedtowardtheshorterlevel.
Thisstudygivesearlyindica?onofsuccessfultransferof lowheighttraittothe3rdgenera?onNPMdurapopula?onfrom its predecessor. And it also indicates the possibility totransfer the shortness trait to other taller origins. Similarphenotypic growth measures in the main nursery andeventuallyinthefieldwills?llbeneededtoconfirmtheseearlyobserva?ons.
Figure2.FrequencyDistribu?onfora)height,b)numberofgreenleaves,c)totalrela?veleafareaandd)stemdiameterforthreepopula?ongroupsat105
daysa�ersowing
Figure3.Growthrateover60days(45to105daysa�ersowing)fora)height,b)numberofgreenleaves,c)totalrela?veleafareaandd)stemdiameterfor
threepopula?ongroups
- 50 -
Amirul Asraf and Goh (2019): Early nursery growth measures indicate successful transfer of desirable traits
50
8
Transactions of Persatuan Genetik Malaysia, No. 10, 2019
ACKNOWLEDGEMENT
TheauthorswishtothankPlanta?onDirectorofIOICorpora?onBerhadandGeneralManagerofIOIResearchCentre,forgivingpermission topresent thispaper.Thebreedingofoilpalm isalengthyanddynamicprogrammethustheauthorswishtothankfew former oil palm breeders namely Dr. Vengeta Rao who
ini?ated the establishment of the 2ⁿ� Genera?on NPMpopula?on inMamor Estate andMrChiaChai Chuawhohavetookthepa?encetooverseethemanagementandevalua?onof
the 2ⁿ� Genera?onNPMmaterials. Apprecia?on again goes toGeneralManager of IOI Research Centre,Mr JoshuaMathewsforhisvaluablecommentsandIOICorpora?onBerhadoilpalmbreedingconsultant,MrChristopherDonoughforpainstakinglyreading themanuscript anduseful sugges?ons. Lastly thefieldsupervisors and data processing clerks of IOI Pamol ResearchKluang who had ?relessly worked to collect data is alsogratefullyacknowledge.
REFERENCES
Arolu, I. B., Rafii, M. Y., Marhalil, M., Hanafi, M. M., Sulaiman, Z.,Rahim, H. A., Isa, M., Mohd Din, A., Kushairi, A. and Rajanaidu, N.(2018).BreedingofHighYieldingandDwarfOilPalmPlan?ngMaterialsUsing Deli Dura X Nigerian Pisifera Popula?on. Euphy?ca. (2017)213:154.
Corley, R. H. V. and Breure, C. J. (1981). Measurements In Oil PalmExperiment.Unpublished,UnileverPlanta?onsGroup.9-11pp.
Donough, C. R., Mohanaraj, S. N., Rahmadsyah. and Oberthur, T.(2014).GrowthOfOilPalmSeedlingsInfluencedByNurseryPrac?cesInMalaysiaAndIndonesia.PosterpresentedattheInterna?onalOilPalmConference (IOPC): Green Palm Oil for Food Security and RenewableEnergy,Bali,Indonesia,17–19June2014.
Marhalil, M., Rajanaidu, N., Mohd Din, A., Yaakub, Z., Norziha, A.,Fadila, A.M., Suzana,M.,Meilina,O.A.,Ghizan, S. andKushairi, A.(2017).Mining The Exo?c Nigerian Popula?on 12. Proceedings PIPOC2017,Agriculture,Biotechnology&Sustainability,Volume1,Session2A.89-105pp.
Mathews, J., Teo, K.W. and Ip,W.M. (2007). Breeding for High Oil
YieldingTeneraPalms.6|}ISPNa?onalSeminar2007.
Noh,A.,Rafii,M.Y.,MohdDin,A.,Kushairi,A.,Norziha,A.,Rajanaidu,N., LaWf,M.A. andMalek,M.A. (2014). Variability andPerformanceEvalua?on Of Introgressed Nigerian Dura X Deli Dura Oil PalmProgenies.Genet.Mol.Res.13(2):2426-2437.
Rajanaidu,N.,Ainul,M.M.,Kushairi,A.andDin,A. (2013).HistoricalReviewOfOilPalmBreedingForThePast50Years–MalaysianJourney.ISOPBConference2013.
Seng, S.Y.,Donough,C.R. andRajanaidu,N. (2011).PerformanceofMPOB Nigeria Prospec?on Materials in Sabah. Conference: ISOPBInterna?onal SeminaronBreeding for Sustainability inOilPalm,KualaLumpur.
- 51 -
Corresponding author:
Transactions of Persatuan Genetik Malaysia, No. 10, 2019 Published by Genetics Society of Malaysia http://www.pgm-my.org
37
51
INTRODUCTION
Coconut(CocosnuciferaL.)isanimportanttropicalfruitandoilcropwhich is con?nuous frui?ngperennialandadapted in thehumidtosub-humidcoastal tropics (Wuetal.2018).Coconutsaremonocots,possessingadiploidgenomewith16pairs(2n=2x=32)ofchromosomes(Suriya2016).Coconutisusuallycalledas‘treeoflife’becausehaveamul?tudeofusesbesidesoilandits importance in sustaining the life of the people who growthem.
Kopyorcoconuthasauniquecharacteris?ccomparedto other coconuts which is the endosperm forma?on is notsolid. The endosperm is so� and crumbly, detached from theshell,thatisformingflakesfillinguptheshell(Novariantoetal.2018).Thekopyorcoconutisnaturalmutantandthephenotypeis gene?cally inherited from parents to their progenies(Sukendah 2009). The uniqueness of kopyor coconutmakes ithashigheconomicvalue.However,kopyorcoconutandnormalcoconut only can be dis?nguish by seen the endosperm, bothare very difficult to dis?nguish by phenotype especially inseedlingsphase.Coconutsaredifficultcrops tobreed.The longgenera?on interval, the cross-pollina?ng breeding behavior oftall coconuts, the lack of a viable vegeta?ve propaga?on
Simple sequence repeat identification and marker development for Kopyor mutant and normal coconut based on NGS genome data
Andi Nadia Nurul Lathifa Hatta1, Dewi Sukma1, Ismail Maskromo2, and Sudarsono Sudarsono1
1 Plant Molecular Biology Lab., Dept. of Agronomy and Horticulture, Faculty of Agriculture, Bogor Agricultural University, Bogor 16680, West Java, Indonesia2 Indonesian Palms Research Institute, Agency for Agricultural Research and Development, Manado 95001, North Sulawesi, Indonesia
Abstract
KopyorcoconutisanaturalcoconutmutantfromIndonesiahavingabnormalendospermphenotype.KopyorcoconutishighlylookedforinIndonesiaandithashigheconomicvalues.Theabnormalendospermisso�andpeelofffromtheshell.Themutantphenotypeisgovernedbyasingleormostprobablytwolocihavingrecessiveallele.Kopyorcharactersisnotaneasycharactertobreedbecauseof its recessive nature. Therefore, developingmolecularmarker associated with kopyor coconut would be beneficial. This studyaimedtodevelopSSRmarkersusingkopyorcoconutandnormalcoconutNGSgenomicdata,usethedevelopedmarkerstoevaluatethe gene?c diversity and iden?fy the markers associated with the Kopyor characters. Par?al coconut genomic data have beengeneratedfromKopyorandNormalcoconuts,therawreadswereassembledusingDenovoassembly,andtheassembledgenomicdatawere used to iden?fy the SSR sequence library.We have iden?fied asmany as 4,500,078 and 5,797,081 scaffoldswith thescaffoldsizesof100and180kbforKopyorandNormalcoconuts,respec?vely.ThousandsofSSRsequenceswereiden?fiedfromtheassembledgenomedataandsomeofthemweresuccessfullyusedtodesignSSRprimers.Valida?onofdesignedprimerstogenerateSSRmarkerswereconductedandthevalidatedprimerswereusedtoevaluategene?cdiversityofIndonesiancoconuts.Theul?mategoalsofthisresearchweretoiden?fySSRmarkersassociatedwithKopyormutantphenotypeswhichcanbeusedtosupportKopyorcoconutbreedingprogram.Progressofthisresearchandupdateofitsresultswillbepresentedintheconference.
Andi Nadia Nurul Lathifa Hatta, Dept. of Agronomy & Horticulture, Faculty of Agriculture, Bogor Agricultural University, Bogor 16680, West Java, IndonesiaEmail: [email protected]
Keywords:Coconut mutant, abnormal endosperm, SSR markers, genome sequences, genetic diversity
Line
LastKey
Intromethod,thelownumberofseedsproducedperpalm,andthemassivestatureofthepalmarethemostimportantconstraintsincoconutbreeding(Perera2010).However,molecularbiologytechniqueshavebeenfaintlyusedintheassessmentofgene?cresources and for the improvement of important agronomicandqualitytraitsinCocosnucifera.
For about two decades molecular techniques havebeenusedtoenhancetheabilityofcoconut-breedingprogramsinseveralcountriestoassessthegene?cdiversityof localandglobal germplasm collec?ons and to develop gene?c linkagemaps (Suriya 2016). Somemolecularmarker techniques havebeen developed over the years, using RAPD (RandomlyAmplified Polymorphic DNA), RFLP (Restric?on FragmentLength Polymorphism), AFLP (Amplified Fragment LengthPolymorphism), ISSR (Inter- Simple Sequence Repeat), gene-based SSR (Simple Sequence Repeats) markers, and SNPs(SingleNucleo?dePolimorphism)(Dumhaietal.2019).Amongthem, SSR have shown promising results for germplasmevalua?onandmolecularaidedbreeding(Tabkhkaretal.2012).Unfortunately, markers capable of providing high-resolu?oninforma?on regarding kopyor mutant and normal coconutgenomehavenotbeenreadilyavailable.
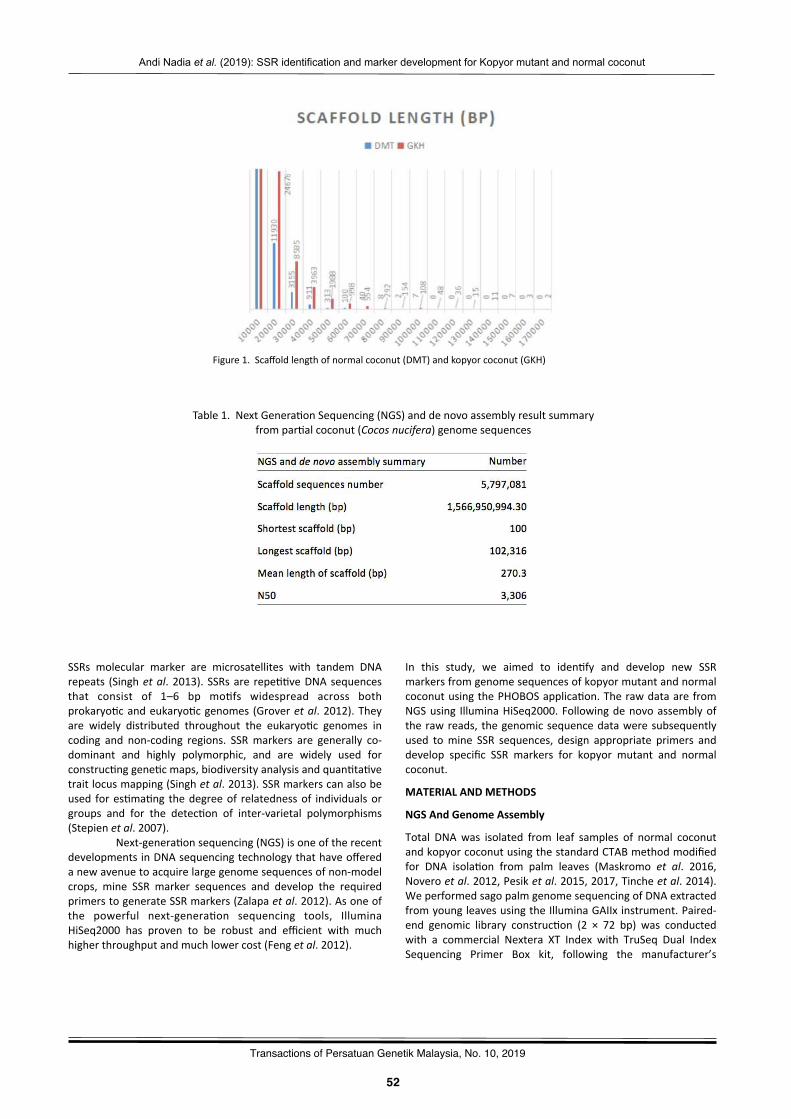
- 52 -
Andi Nadia et al. (2019): SSR identification and marker development for Kopyor mutant and normal coconut
52
11
Transactions of Persatuan Genetik Malaysia, No. 10, 2019
SSRs molecular marker are microsatellites with tandem DNArepeats (Singh etal.2013).SSRsare repe??veDNAsequencesthat consist of 1–6 bp mo?fs widespread across bothprokaryo?candeukaryo?cgenomes (Groveretal.2012).Theyare widely distributed throughout the eukaryo?c genomes incoding and non-coding regions. SSRmarkers are generally co-dominant and highly polymorphic, and are widely used forconstruc?nggene?cmaps,biodiversityanalysisandquan?ta?vetraitlocusmapping(Singhetal.2013).SSRmarkerscanalsobeused fores?ma?ng thedegreeof relatednessof individualsorgroups and for the detec?on of inter-varietal polymorphisms(Stepienetal.2007).
Next-genera?onsequencing(NGS)isoneoftherecentdevelopmentsinDNAsequencingtechnologythathaveofferedanewavenuetoacquirelargegenomesequencesofnon-modelcrops, mine SSR marker sequences and develop the requiredprimerstogenerateSSRmarkers(Zalapaetal.2012).Asoneofthe powerful next-genera?on sequencing tools, IlluminaHiSeq2000 has proven to be robust and efficient with muchhigherthroughputandmuchlowercost(Fengetal.2012).
In this study, we aimed to iden?fy and develop new SSRmarkersfromgenomesequencesofkopyormutantandnormalcoconutusingthePHOBOSapplica?on.TherawdataarefromNGSusing IlluminaHiSeq2000.Followingdenovoassemblyoftherawreads, thegenomicsequencedataweresubsequentlyused tomine SSR sequences, design appropriate primers anddevelop specific SSR markers for kopyor mutant and normalcoconut.
MATERIALANDMETHODS
NGSAndGenomeAssembly
Total DNAwas isolated from leaf samples of normal coconutandkopyorcoconutusingthestandardCTABmethodmodifiedfor DNA isola?on from palm leaves (Maskromo et al. 2016,Noveroetal.2012,Pesiketal.2015,2017,Tincheetal.2014).WeperformedsagopalmgenomesequencingofDNAextractedfromyoungleavesusingtheIlluminaGAIIxinstrument.Paired-end genomic library construc?on (2 × 72 bp) was conductedwith a commercial Nextera XT Index with TruSeq Dual IndexSequencing Primer Box kit, following the manufacturer’s
Figure1.Scaffoldlengthofnormalcoconut(DMT)andkopyorcoconut(GKH)
Table1.NextGenera?onSequencing(NGS)anddenovoassemblyresultsummaryfrompar?alcoconut(Cocosnucifera)genomesequences
- 53 -
Andi Nadia et al. (2019): SSR identification and marker development for Kopyor mutant and normal coconut
53
11
Transactions of Persatuan Genetik Malaysia, No. 10, 2019
protocol.A�erqualitytrimmingofrawreadswithTrimmoma?c,weusedRay so�ware (hwps://github.com/sebhtml/ray) for denovogenomeassembly.Subsequently,weusedtheassemblednormalcoconutgenomesequencesforSSRminingandmarkerdevelopment.
SSR Sequence Mining From KOPYOR And Normal CoconutGenomeScaffold
We used the assembled scaffold data to search for di-, tri-,tetra-andhexanucleo?de repeatsofSSR lociofat least20bplengths. We used Phobos so�ware (hwp://www.ruhr-uni-bochum.de/ecoevo/cm/cm_phobos.htm) to mine SSR mo?fsfromtheassembledgenomesequence.Iden?fiedSSRlociwerethen grouped into either perfect or imperfect SSRs and
Table3.Frequencyofdinucleo?deandtrinucleo?demo?fsingenomicsequencesofcoconut(Cocosnucifera)
Table2.Distribu?onofperfectSSRsingenomicsequencesofcoconut(Cocosnucifera)
designated as either class I or II SSRs. SSR locus density wasdetermined based on the frequency of SSR loci and the totallengthofcon?gscontainingSSRs.Wealsoevaluatedthemo?flength, loci numbers,mean repeat numbers and densi?es fortheselectedrepe??vemo?fs.
SSRPrimerDesignAndMarkerDevelopment
TodesignSSRprimers,weselected100ofthetotalclassISSRlociwith aminimumof 10-fold coverage from the outputs ofPhobos so�ware. The scaffold containing selected SSRs wereusedforSSRprimerdesignusingPrimer3-Plusso�ware(hwp://www.bioinforma?cs.nl/cgi-bin/primer3plus/primer3plus.cgi).The parameters for SSR primer design included 200–600 bpamplicon size, 18 bp op?mum primer size, 50°C–60°C primer

- 54 -
Andi Nadia et al. (2019): SSR identification and marker development for Kopyor mutant and normal coconut
54
11
Transactions of Persatuan Genetik Malaysia, No. 10, 2019
mel?ng temperature (Tm) and 40%–60% primer GC content.Once the SSR primers were iden?fied, we performed syntenyanalysisonselectedcon?gscontainingSSRloci.Syntenyanalysiswas performed on coconut (Cocos nucifera) chromosomesequences available from the NCBIwebsite to evaluate theirprobableposi?ondistribu?onsinthecoconutgenome.
RESULTS
NGSAndAssemblyOfCocosnuciferaGenome
Inthisstudyweusetwotypeofcoconut,normalcoconut(DMT=DalamMapanget) and kopyor coconut (GKH=GejahKopyor
Table4.ListofsequencesofSSRprimerpairs
Hijau). The raw reads of par?al genome sequence data wasgenerated using the Illumina GAIIx paired-end NGS system.From de novo assembly, the longest scaffold in DMT was102,316bpand inGKHwas177,450bp(Figure1).Theprimerwas designed fromDMT genome data then the genome datawasanalyzed.Resultsof totalnucleo?decomposi?onanalysisindicatedthatthyminewasthemostfrequentbase(T=31.2%),followed by adenine (A = 30.9%), guanine (G = 18.9%) andcytosine (C = 18.7%). The percentage ofGC content in par?algenome sequences of normal coconut was approximately37,7%.Atotalof5,797,081scaffoldwasiden?fiedfollowingthede novo assembly (Table 1). The minimum length of theassembled scaffold was 100 bp and the maximum scaffold
- 55 -
Andi Nadia et al. (2019): SSR identification and marker development for Kopyor mutant and normal coconut
55
11
Transactions of Persatuan Genetik Malaysia, No. 10, 2019
length was 102,316 bp. The average length of the assembledscaffoldwas270.3bp,whereasthatofN50was3,306bp(Table1).
SSRSequenceMining
We iden?fied 19,567 loci of perfect SSRs from the par?algenomedataofnormalcoconut(Table2).Dinucleo?des(8,003;40.88%)were themost frequently found types amongperfectSSR mo?fs, then following by trinucleo?des (3,446; 17.60%),tetranucleo?des (3,093; 15.79%), hexanucleo?des (2,739;13.99%), and pentanucleo?des (2,286; 11.67%)were the leastfrequently found (Table 2). The cumula?ve length of the SSR-containingscaffoldwas157,915kbfordinucleo?deand40,210kb for pentanucleo?de SSRs,while the SSR loci densi?eswere5.11 loci/Mb for dinucleo?des and 1.46 loci/Mb forpentanucleo?des (Table 2). The frequency of SSR cumula?velength decreasing from dinucleo?de to pentanucleo?de,whilehexanucleo?de was more longer than pentanucleo?de (Table2). The total densitywas 12.49 SSR/Mb,whereas dinucleo?dedensitywas 5.11 SSR/Mb and pentanucleo?deswas 1.46 SSR/Mb (Table 2). Themean repeat number for dinucleo?deswas9.9,whereasthatforpentanucleo?deswas3.5(Table2).
Among the four dinucleo?de repeat mo?fs found inthe coconut genome (AC, AG, AT or CG), the AG repeat wasmost common (46.74%), whereas the CG repeat was leastcommon (0.94% of the total number of SSRs) (Table 3). Fortrinucleo?des, the AAT repeat (29.34%) was most common,whereas theACG repeatwas least common (0.9%of the totalSSR)(Table3).
SSRDesignPrimer
Todesign primers,we randomly selected 150 dinucleo?des ofclass I SSR loci. However, for 33 (22%) of these randomlyselectedloci,wecouldnotdesigntheflankingprimersbecauseof either unsuitable flanking sequences or Tm constraints.Wedesignedflankingprimersfor117(78%)selectedloci.Next,weselected20primerseachfrom20longestscaffold.
DISCUSSION
Ourgenomicanalysisrevealedacomprehensivegenomeofthenormal coconutandkopyorcoconutusing Illuminasequencingtechnology, contributed a newand significant set of sequencereads,andprovidedasetofNGSgenomedatathroughdenovoassembly. Our analysis also iden?fied 19,576 genomic SSRs inthe normal coconut genome. These findings not only providevaluable informa?on for gene?c diversity, linkage mapping,gene/QTL mapping, and marker-assisted selec?on in cowpeabutalsoshowpromise in thesearch for informa?vemolecularmarkersinacropplantwithfewgenomicresources(Chenetal.2017).
Wecompared scaffold lengthofnormal coconutandkopyorcoconut.The longest scaffold innormal coconut (DMT)genome data was 102,316 bp and in kopyor coconut was177,450 bp. However, the number of scaffold in DMT was5,797,081andinGKHwas4,500,078.Kopyorcoconut(GKH)isanatural mutant, by seeing the number of scaffold from bothDMTandGKH,kopyorcoconutmightbehasadele?onintheirsequences. Dele?on means when a part of chromosome isdeleted(MahdiehandRabbani,2013).
TheefficiencyofSSRdevelopmentwaso�enlimitedbecauseofshort ormissing flanking regions (Sharopova et al. 2002).Weselected 150 dinucleo?des of class I SSR loci from normalcoconutgenometodesigntheirflankingprimers.However,wecouldn’tfoundflankingregionof33dinucleo?des.Wedesigned117flanking primers, and 20 primers hadbeen choosen fromthe longest scaffold. These flanking primers from the longestscaffoldareexpectedtogethighqualityamplifica?onproductwhenitusedasPCRprimer.Mo?fsfromdesignedprimerswasAT,AG,andAC,whichthefrequencyeachofthemwas46.74%,38,70%, and 13,62%. We are not designed primers from CGmo?fbecauseofthefrequencywastoolow(0.94%).
REFERENCES
Chen,H.,Wang,L., Liu,X.,Hu,L.,Wang,S.andCheng,X. (2017).Denovotranscriptomicanalysisofcowpea(VignaunguiculataL.Walp.)forgenicSSRmarkerdevelopment.BMCGene?cs.18:65-77.
Dumhai R., Wanchana S., Saensuk C., Choowongkomon K.,MahatheeranontS.,KraithongT.,ToojindaT.,VanavichitA.,andArikitS.(2019).DiscoveryofanovelCnAMADH2alleleassociatedwithhigherlevels of 2-acetyl-1-pyrroline (2AP) in yellow dwarf coconut (CocosnuciferaL.).SciHor?c.243:490–497.
Feng C., Chen, M., Xu, C. J., Bai, L., Yin, X. R., Li X., Allan, A. C.,Ferguson, I. B., and Chen, K. S. (2012). Transcriptomic analysis ofChinesebayberry (Myrica rubra) fruitdevelopmentandripeningusingRNA-Seq.BMCGenomics.13:19.
Grover, A., Aishwarya, V., and Sharma, P. C. (2012). Searchingmicrosatellites in DNA sequences: approaches used and toolsdeveloped.Physiol.Mol.Biol.Plants.18:11–19.
Mahdieh, N., and Rabbani, B. (2013). An Overview of Muta?onDetec?onMethodsinGene?cDisoredrs.IranJPediatr.375-388
.Novarianto, H., Maskromo, I., DinarW, D. and Sudarsono. (2014).Produc?on technology for Kopyor coconut seednuts and seedlings inIndonesia.Interna?onalJournalonCoconutR&D.30(2):31-40.
Perera,S.A.C.N.(2010).TechnologicalInnova?onsinMajorWorldOilCrops.USA:Springer.
Sharopova,N.,McMullen,M.D.,Schultz,L.,Schroeder,S.,andVilleda,H.S.(2002).DevelopmentandmappingofSSRmarkersformaize.PlantMolecularBiology.48:463–481.
SinghR.etal.(2013).Oilpalmgenomesequencerevealsdivergenceofinterfer?lespeciesinOldandNewworlds.Nature.500(7462):335–339.
StepienL.,MohlerV.,Bocianowski J.andKoczykG. (2007).Assessinggene?c diversity of Polish wheat (TriGcum aesGvum) varie?es usingmicrosatellitemarkers.GenetResourCropEvol.54(7):1499–1506.
Sukendah. (2009). Teknologi pembiakan kultur in vitro dan analisismolekuler pada tanaman kelapa kopyor. [disertasi]. Indonesia (ID):Ins?tutPertanianBogor.
Suriya, A. C. N. (2016). Breeding Oilseed Crops for SustainableProduc?on:Opportuni?esandConstraints.Gupta,SK:AcademicPress.
Tabkhkar,N.,Rabiei,B.andSabouri,A.(2012).Gene?cdiversityofricecul?varsbymicrosatellitemarkers?ghtly linked to cookingandea?ngquality.AustJCropSci.6(6):980–985.
- 56 -
Andi Nadia et al. (2019): SSR identification and marker development for Kopyor mutant and normal coconut
56
11
Transactions of Persatuan Genetik Malaysia, No. 10, 2019
Wu, Y., Yang, Y.,Qadri, R., Iqbal, A., Li, J., Fan,H. andWu, Y. (2018).Development of SSR Markers for Coconut (Cocos nucifera L.) bySelec?velyAmplifiedMicrosatellite (SAM)and ItsApplica?ons.TropicalPlantBiology.1-12.
Zalapa, J. E., Cuevas, H., Zhu, H., Steffan, S., Senalik, D., Zeldin, E.,Mccown, B., Harbut, R. and Simon, P. (2012). Using next-genera?onsequencingapproaches to isolatesimplesequencerepeat (SSR) loci intheplantsciences.Am.J.Bot.99:193–208.
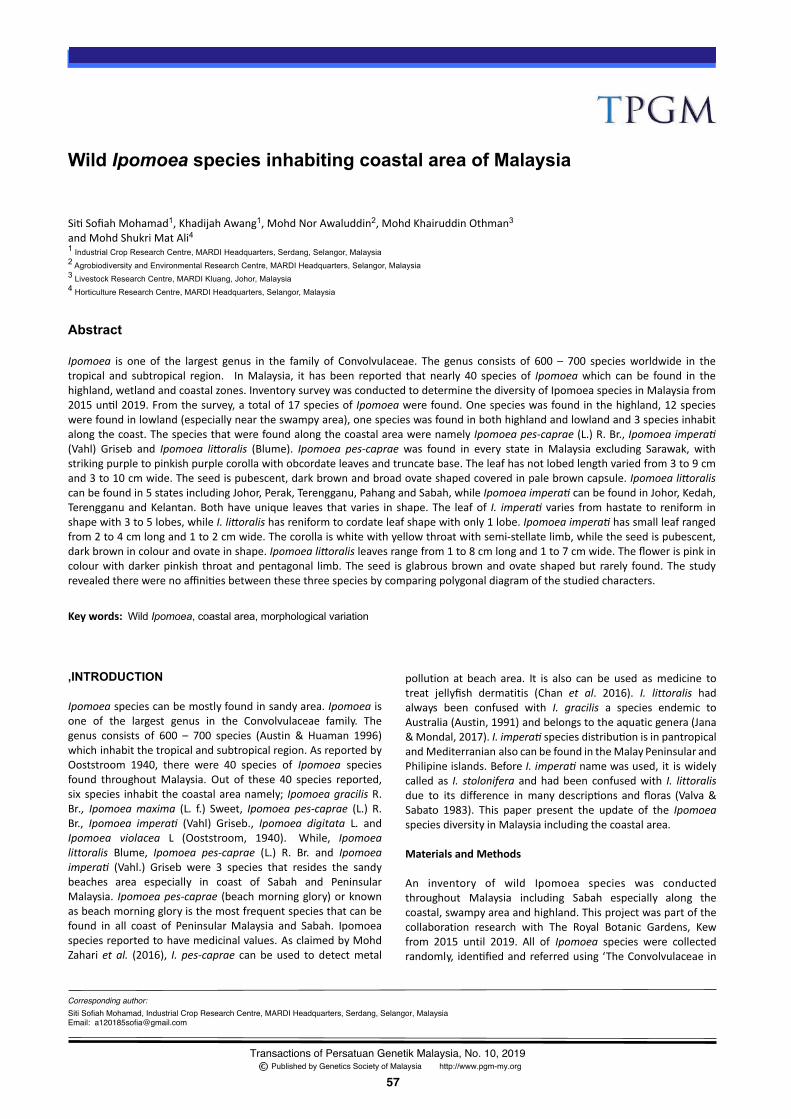
- 57 -
Corresponding author:
Transactions of Persatuan Genetik Malaysia, No. 10, 2019 Published by Genetics Society of Malaysia http://www.pgm-my.org
43
57
Wild Ipomoea species inhabiting coastal area of Malaysia
Si?SofiahMohamad1,KhadijahAwang1,MohdNorAwaluddin2,MohdKhairuddinOthman3andMohdShukriMatAli41 Industrial Crop Research Centre, MARDI Headquarters, Serdang, Selangor, Malaysia2 Agrobiodiversity and Environmental Research Centre, MARDI Headquarters, Selangor, Malaysia3 Livestock Research Centre, MARDI Kluang, Johor, Malaysia4 Horticulture Research Centre, MARDI Headquarters, Selangor, Malaysia
Abstract
Ipomoea is one of the largest genus in the family of Convolvulaceae. The genus consists of 600 – 700 speciesworldwide in thetropical and subtropical region. InMalaysia, it has been reported that nearly 40 species of Ipomoeawhich can be found in thehighland,wetlandandcoastalzones.InventorysurveywasconductedtodeterminethediversityofIpomoeaspeciesinMalaysiafrom2015un?l2019.Fromthesurvey,atotalof17speciesof Ipomoeawerefound.Onespecieswasfoundinthehighland,12specieswerefoundinlowland(especiallyneartheswampyarea),onespecieswasfoundinbothhighlandandlowlandand3speciesinhabitalongthecoast.ThespeciesthatwerefoundalongthecoastalareawerenamelyIpomoeapes-caprae(L.)R.Br.,IpomoeaimperaG(Vahl) Griseb and Ipomoea li_oralis (Blume). Ipomoea pes-caprae was found in every state inMalaysia excluding Sarawak, withstrikingpurpletopinkishpurplecorollawithobcordateleavesandtruncatebase.Theleafhasnotlobedlengthvariedfrom3to9cmand3to10cmwide.Theseedispubescent,darkbrownandbroadovateshapedcoveredinpalebrowncapsule.Ipomoeali_oraliscanbefoundin5statesincludingJohor,Perak,Terengganu,PahangandSabah,whileIpomoeaimperaGcanbefoundinJohor,Kedah,TerengganuandKelantan.Bothhaveunique leaves thatvaries in shape.The leafof I. imperaGvaries fromhastate to reniform inshapewith3to5lobes,whileI.li_oralishasreniformtocordateleafshapewithonly1lobe.IpomoeaimperaGhassmallleafrangedfrom2to4cmlongand1to2cmwide.Thecorollaiswhitewithyellowthroatwithsemi-stellatelimb,whiletheseedispubescent,darkbrownincolourandovateinshape.Ipomoeali_oralisleavesrangefrom1to8cmlongand1to7cmwide.Theflowerispinkincolourwithdarkerpinkish throatandpentagonal limb.Theseed isglabrousbrownandovateshapedbut rarely found.Thestudyrevealedtherewerenoaffini?esbetweenthesethreespeciesbycomparingpolygonaldiagramofthestudiedcharacters.
Siti Sofiah Mohamad, Industrial Crop Research Centre, MARDI Headquarters, Serdang, Selangor, MalaysiaEmail: [email protected]
Keywords:Wild Ipomoea, coastal area, morphological variation
Line
LastKey
Intro ,INTRODUCTION
Ipomoeaspeciescanbemostlyfoundinsandyarea.Ipomoeaisone of the largest genus in the Convolvulaceae family. Thegenus consists of 600 – 700 species (Austin & Huaman 1996)whichinhabitthetropicalandsubtropicalregion.AsreportedbyOoststroom 1940, there were 40 species of Ipomoea speciesfound throughoutMalaysia. Out of these 40 species reported,six species inhabitthecoastalareanamely; IpomoeagracilisR.Br., Ipomoeamaxima (L. f.) Sweet, Ipomoea pes-caprae (L.) R.Br., Ipomoea imperaG (Vahl) Griseb., Ipomoea digitata L. andIpomoea violacea L (Ooststroom, 1940). While, Ipomoealittoralis Blume, Ipomoea pes-caprae (L.) R. Br. and IpomoeaimperaG (Vahl.) Griseb were 3 species that resides the sandybeaches area especially in coast of Sabah and PeninsularMalaysia. Ipomoeapes-caprae (beachmorningglory)orknownasbeachmorninggloryisthemostfrequentspeciesthatcanbefound in all coast of PeninsularMalaysia and Sabah. Ipomoeaspeciesreportedtohavemedicinalvalues.AsclaimedbyMohdZahariet al. (2016), I. pes-capraecanbeused to detectmetal
pollution at beach area. It is also can be used asmedicine totreat jellyfish dermatitis (Chan et al. 2016). I. littoralis hadalways been confused with I. gracilis a species endemic toAustralia(Austin,1991)andbelongstotheaquaticgenera(Jana&Mondal,2017).I.imperaGspeciesdistribu?onisinpantropicalandMediterranianalsocanbefoundintheMalayPeninsularandPhilipineislands.BeforeI.imperaGnamewasused, it iswidelycalled as I. stoloniferaandhadbeen confusedwith I. littoralisdue to its difference in manydescrip?onsandfloras (Valva&Sabato 1983). This paper present the update of the IpomoeaspeciesdiversityinMalaysiaincludingthecoastalarea.
MaterialsandMethods
An inventory of wild Ipomoea species was conductedthroughout Malaysia including Sabah especially along thecoastal,swampyareaandhighland.Thisprojectwaspartofthecollaboration research with The Royal Botanic Gardens, Kewfrom 2015 until 2019. All of Ipomoea species were collectedrandomly, iden?fiedandreferredusing‘TheConvolvulaceaein
- 58 -
Siti Sofiah et al. (2019): Wild Ipomoea species inhabiting coastal area of Malaysia
58
14
Transactions of Persatuan Genetik Malaysia, No. 10, 2019
Malaysia III’ and ‘The Flora of Thailand’. Polygonalrepresenta?on of floral and foliar characteristics wereconstructed. All herbarium samples were prepared anddeposited in the MARDI Herbarium (MDI), Royal BotanicGardens,KewandUniversi?MalaysiaSabahHerbarium(BOHR).
RESULTANDDISCUSSION
As 4 years span of this collaboration project, there were 17speciesofIpomoeafoundinSabahandPeninsularMalaysia.TheIpomoea species that were found were; Ipomoea aquaticaForssk,Ipomoeabatatas(L.)Lam.,Ipomoeacairica(L.),Ipomoeacampanulata L., Ipomoea carnea Jacq. spp. fistulosa, IpomoeaimperaG (Vahl)Griseb., Ipomoea indica (Burm.)Merr., IpomoealittoralisBlume., Ipomoea obscura (L.) Ker Gawl.., Ipomoea nil(L.)Roth.,Ipomoeapurpurea(L.)Roth.,Ipomoeapes-caprae(L.)R. Br., Ipomoea pes-tigridis L., Ipomoea quamoclit L., IpomoeasagittifoliaBurm.f.,IpomoeatricolorCav.andIpomoeatrilobaL.
Out of all species of Ipomoea reported occurred inMalaysia,onlythree Ipomoeaspeciesgrewinthecoastalarea,namelyIpomoeapes-caprae(L.)R.Br., I. littoralisBlumeand I.imperaG(Vahl)Griseb.Botanicaldescriptionswithreferencetotaxonomiccharactersaregivenbelow.
Ipomoeapes-caprae(L.)R.Br.
Perennial creeper, stemprostratealong the seashores, roo?ngat the nodes. The leaf is green and obcordate with truncatebase, no lateral lobes. The shape of central lobes isemarginatedwith3–9cmlongand3–10cmwide.Thepetioleisglabrouswith2–10cmlong.Flowerisfunnelform,4to6cmlongand6to7cmwide.Limbshapeisroundedwithpurpletopinkishpurplecolouranddarkerpinkthroat.Sepalisglabrous,ovatetoellipticwithobtuseapex.Thelengthofsepalisrangedfrom0.5to1cm.Pedicelis2to3cmlong.Thestyleandstigmais pale pink in colour. Seed broad ovate, dark brown anddenselycoveredwithhair.
Ipomoeaimpera1(Vahl)Griseb
Perennial creeper of the seashore and roo?ng at the nodes.Theleafisgreenthatvariesinshapefromhastatetoreniform.3or5leaflobewithmoderateanddeeplytype.2to4cmlongwith 1 to 2 cmwide. Petiole glabrouswith 1 to 2.5 cm long.Flowers iswhitewithbrightyellowthroatwith2 to4 cm longand4to5cmwide.Limbshapeissemi-stellate,ovatesepalandacuteapex.Sepalglabrouswith0.5to1cmlong.Pedicelis1.5to2cmlong.Paleyellowcolourofstigmaandstyle.Seedovate,darkbrownanddenselycoveredwithpalebrownhair.
IpomoealittoralisBlume
Perennial creeper and twiner and roo?ng at the nodes. Theleaf got no lateral lobe with green reniform to cordate leafshape. Ithasonelobewithobtusecentrallobe.Theleafrangefrom 1 to 8 cm long and has 1 to 7 cm wide. The petiole isglabrous with 0.5 to 5 cm long. Flowers is pinkish withpentagonallimbshape.Thefloweris3to4cmlongwith3.5to4.5wide. Sepal is glabrous, ellipticwith acute to obtuse apex
Key1.MorphologicalkeyofIpomoeapes-caprae,IpomoeaimperaGandIpomoealittoralis
Figure 1. Polygonal representa?on of the floral partsmeasurements of Ipomoea pes-caprae,Ipomoealittoralisand
Ipomoeaimperati
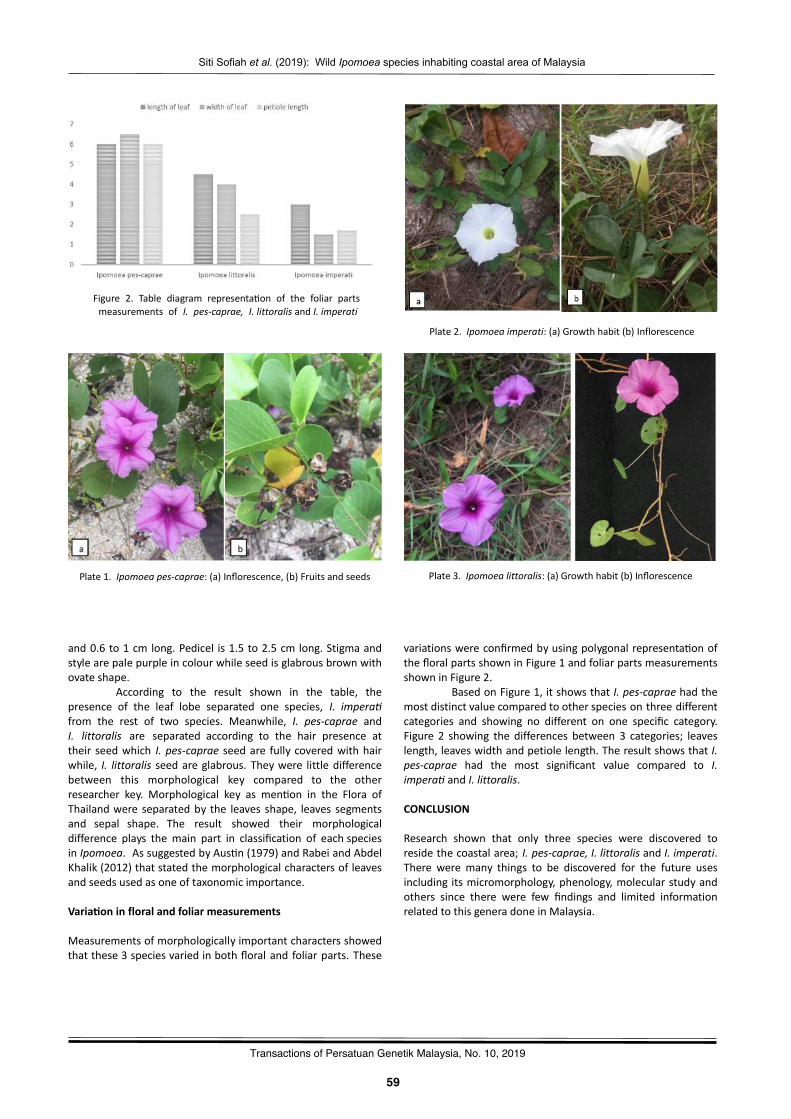
- 59 -
Siti Sofiah et al. (2019): Wild Ipomoea species inhabiting coastal area of Malaysia
59
14
Transactions of Persatuan Genetik Malaysia, No. 10, 2019
and0.6to1cm long.Pedicel is1.5to2.5cmlong.Stigmaandstylearepalepurpleincolourwhileseedisglabrousbrownwithovateshape.
According to the result shown in the table, thepresence of the leaf lobe separated one species, I. imperaGfrom the rest of two species. Meanwhile, I. pes-caprae andI. littoralis are separated according to the hair presence attheir seedwhich I.pes-capraeseedare fullycoveredwithhairwhile, I. littoralisseedareglabrous. Theywere littledifferencebetween this morphological key compared to the otherresearcher key. Morphological key as men?on in the Flora ofThailandwere separatedbythe leaves shape, leaves segmentsand sepal shape. The result showed their morphologicaldifference plays the main part in classification of eachspeciesinIpomoea. AssuggestedbyAus?n(1979)andRabeiandAbdelKhalik(2012)thatstatedthemorphologicalcharactersofleavesandseedsusedasoneoftaxonomicimportance.
VariaWoninfloralandfoliarmeasurements
Measurementsofmorphologicallyimportantcharactersshowedthatthese3speciesvariedinbothfloraland foliarparts.These
Figure 2. Table diagram representa?on of the foliar partsmeasurements of I. pes-caprae, I.littoralisandI.imperati
Plate1.Ipomoeapes-caprae:(a)Inflorescence,(b)Fruitsandseeds
Plate2.Ipomoeaimperati:(a)Growthhabit(b)Inflorescence
Plate3.Ipomoealittoralis:(a)Growthhabit(b)Inflorescence
variationswereconfirmedbyusingpolygonalrepresenta?onofthefloralpartsshowninFigure1andfoliarpartsmeasurementsshowninFigure2.
BasedonFigure1,itshowsthatI.pes-capraehadthemostdistinctvaluecomparedtootherspeciesonthreedifferentcategories and showing no different on one specific category.Figure 2 showing the differences between 3 categories; leaveslength,leaveswidthandpetiolelength.TheresultshowsthatI.pes-caprae had the most significant value compared to I.imperaGandI.littoralis.
CONCLUSION
Research shown that only three species were discovered toresidethecoastalarea; I.pes-caprae,I.littoralisandI.imperati.There weremany things to be discovered for the future usesincludingitsmicromorphology,phenology,molecularstudyandothers since there were few findings and limited informationrelatedtothisgeneradoneinMalaysia.
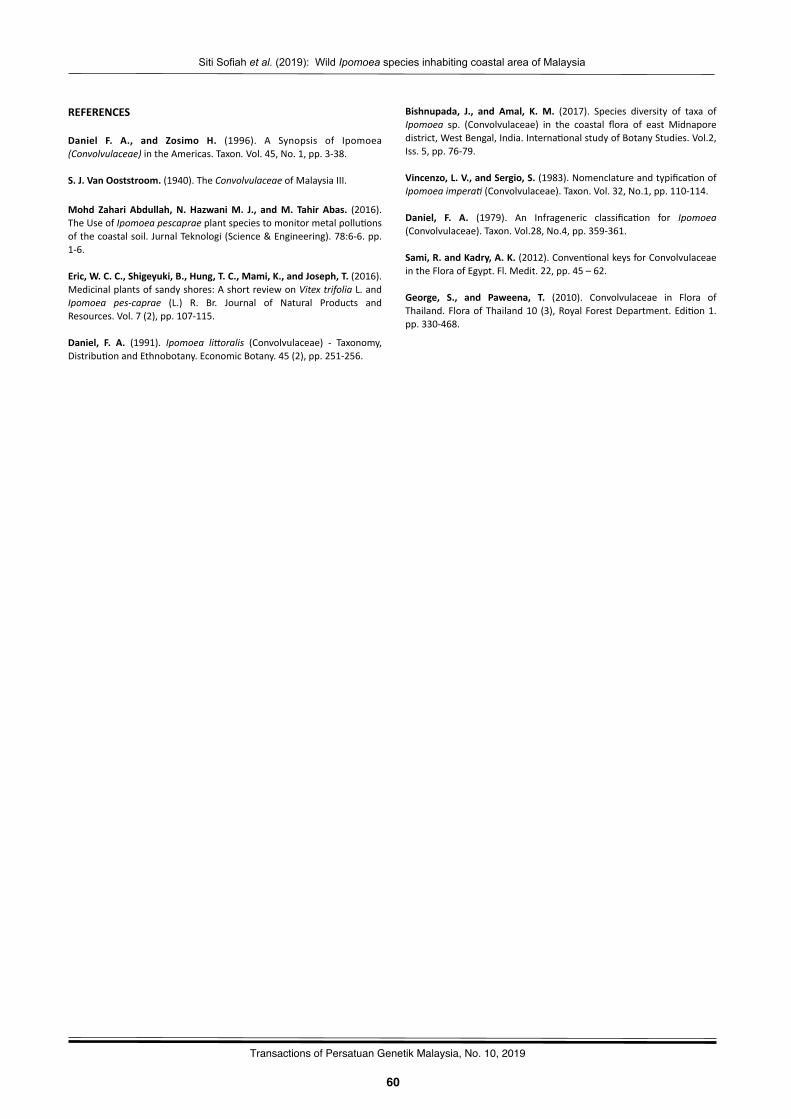
- 60 -
Siti Sofiah et al. (2019): Wild Ipomoea species inhabiting coastal area of Malaysia
60
14
Transactions of Persatuan Genetik Malaysia, No. 10, 2019
REFERENCES
Daniel F. A., and Zosimo H. (1996). A Synopsis of Ipomoea(Convolvulaceae)intheAmericas.Taxon.Vol.45,No.1,pp.3-38.
S.J.VanOoststroom.(1940).TheConvolvulaceaeofMalaysiaIII.
Mohd Zahari Abdullah,N. HazwaniM. J., andM. Tahir Abas. (2016).TheUseofIpomoeapescapraeplantspeciestomonitormetalpollu?onsofthecoastalsoil.JurnalTeknologi(Science&Engineering).78:6-6.pp.1-6.
Eric,W.C.C.,Shigeyuki,B.,Hung,T.C.,Mami,K.,andJoseph,T.(2016).Medicinalplantsofsandyshores:AshortreviewonVitextrifoliaL.andIpomoea pes-caprae (L.) R. Br. Journal of Natural Products andResources.Vol.7(2),pp.107-115.
Daniel, F. A. (1991). Ipomoea li_oralis (Convolvulaceae) - Taxonomy,Distribu?onandEthnobotany.EconomicBotany.45(2),pp.251-256.
Bishnupada, J., and Amal, K. M. (2017). Species diversity of taxa ofIpomoea sp. (Convolvulaceae) in the coastal flora of east Midnaporedistrict,WestBengal,India.Interna?onalstudyofBotanyStudies.Vol.2,Iss.5,pp.76-79.
Vincenzo,L.V.,andSergio,S.(1983).Nomenclatureandtypifica?onofIpomoeaimperaG(Convolvulaceae).Taxon.Vol.32,No.1,pp.110-114.
Daniel, F. A. (1979). An Infrageneric classifica?on for Ipomoea(Convolvulaceae).Taxon.Vol.28,No.4,pp.359-361.
Sami,R.andKadry,A.K.(2012).Conven?onalkeysforConvolvulaceaeintheFloraofEgypt.Fl.Medit.22,pp.45–62.George, S., and Paweena, T. (2010). Convolvulaceae in Flora ofThailand.FloraofThailand10 (3),RoyalForestDepartment.Edi?on1.pp.330-468.
- 61 -
Corresponding author:
Transactions of Persatuan Genetik Malaysia, No. 10, 2019 Published by Genetics Society of Malaysia http://www.pgm-my.org
47
61
Preliminary study of paternal effect on the characters of ‘Musang King’ durian (Durio zibethinus L.) fruit from cross-pollination
Muhammad Afiq Tajol Ariffin1, Mohd Musanif Ghazali1, Ahmad Norhisyam Abdullah4, Salehudin Md. Radzuan1, Nur Azlin Razali2, Siti Aisyah Abdullah2, Wan Mahfuzah Wan Ibrahim1, Mohd Asrul Sani3, Razali Mustaffa2, Rozlaily Zainol2, and Pauziah Muda2
1 Horticulture Research Centre, MARDI Sintok, 06050 Bukit Kayu Hitam, Kedah, Malaysia.2 Horticulture Research Centre, MARDI Headquarters, Post Office Box 12301, General Post Office, 50774 Kuala Lumpur, Malaysia3 Director General Office, MARDI Alor Setar, Post Office Box 105, Jalan Kuala Kedah, 05710 Alor Setar, Kedah, Malaysia.4 Koperasi Pegawai-pegawai MARDI (KOMARDI), 12, Lkk Cempaka 1, Bandar Amanjaya, 08000 Sungai Petani, Kedah, Malaysia
Abstract
Theaimofthisresearchwastostudythepaternaleffectof ‘MusangKing’Durian(DuriozibethinusL.) fruitcharacters fromcross-pollina?onwithselectedpopulardurianclones.ThestudywasconductedatTopFruitsSdnBhddurianorchardinParitSulong,BatuPahat, Johor. Four conducted treatmentswere assisted cross-pollina?onusing pollen fromdurian clone ‘D24’, ‘D168’, ‘D190’, and‘D200’. Observa?ons on fruit secngweremade every twoweeks un?l abscission of fully ripe fruit. Cross-pollina?onwith ‘D24’,‘D168’, ‘D190’,and ‘D200’produced7.14%,13.04%,8.70%,and12.50%fruit set respec?vely.Preliminarydataonharvested fruitsshowedthattherewasnosignificantdifferenceonfruitweight,fruitcircumference,lengthofstalk,thicknessofstalk,spinelength,rind thickness, number of locules per fruit, number of locules without pulp unit, seed weight per fruit, seed number per fruit,percentageofdeflatedseed,percentageofediblepor?on,fleshthickness,andtotal solublesolidcontent (TSS).Theirfleshcolourrangedfromlightyellowtoyelloworange(RHS11A,11B,12A,12B,12C).Pollenfromdifferentduriancul?varscanaffectpercentageoffruitsecngin‘MusangKing’.Therewasnopaternaleffectfrom‘D24’,D168,‘D190’,and‘D200’oncharacteris?csandmorphologyof ‘Musang King’ fruit. Preliminary sensory evalua?on found that different pollen source could affect ‘Musang King’ pulp taste.Furtherstudywithmorefruitsamplesandrespondentcouldbedonetofurtherevaluatethesefindings.
Muhammad Afiq Tajol Ariffin, Horticulture Research Centre, MARDI Sintok, 06050 Bukit Kayu Hitam, Kedah, MalaysiaEmail: [email protected]
Keywords:Self-incompa?bility,metaxenia,mix-plan?ng,singlecul?var,fruitset
Line
LastKey
Intro
INTRODUCTION
‘MusangKing’isoneofthemostvaluabledurianinMalaysia.Itwas registered by Department of Agriculture Malaysia withregistra?oncodeD197(DepartmentofAgriculture,2019).Othernamesfor‘MusangKing’are‘RajaKunyit’and‘MaoShanWang’.It has yellow flesh colour with obovoid to oblong fruit shape,and mix of sweet, creamy and biwer taste. Musang King wasproduced naturally by natural pollina?on and being clonallypropagated in large scale since its being registered in 1993.Nowadays, there are increasing of plan?ng ‘Musang King’plan?ng area in Malaysia due to high demand for export toChina.
‘D24’, ‘D168’, and ‘D200’ are among other popularduriancul?varsbeingsoldinMalaysia.Othernamesfor‘D24’is‘DurianSultan’,for‘D168’are‘IOI’or‘HajahHasmah’,whilefor‘D200’ is ‘Black Thorn’. Both ‘D197’ and ‘D200’ are commonlysoldatpremiumprice inMalaysiawithpriceofmorethanRM30 per kilogram, while ‘D24’ and ‘D168’ are sold at medium
priceofaroundRM20toRM30perkilogram,followingmarketdemandandsupply.
Durianhasperfectflowerwithbothmaleandfemalepartsonthesameflower.Durianflowersgrowinclusterof5to30flowersonprimaryorsecondaryscaffoldbranches(Honshoetal.2004b).Thecommonpollinatorsfordurianarefruitbatsandhoneybee(Apisdorsata)(Bumrungsrietal.,2008)becausedurian flowers have nocturnal character (Davis andBhawacharya, 1974). In order to set fruit, durian pollina?onneed to take place during night. According to Honsho et al.(2004b),anthesisof ‘MonThong’durianstartedat1600hoursand the flower will fully opened at around 1900 hours. Thesamecharactersobservedonduriancul?vars inMalaysiasuchas‘D24’,‘D99’,and‘MusangKing’(personalobserva?on).
Many popular durian cul?vars were reported to beself-incompa?ble,including‘MusangKing’(MuhammadAfiqetal.,2018;Kozaietal.,2014;Bumrungsrietal.,2009;Honshoetal.,2004,Georgeetal.,1994).Theyneedpollenfromdifferentcul?vars to successfully set fruit. Indriyaietal. (2012)andLim
- 62 -
Muhammad Afiq et al. (2019): Study of paternal effect on the characters of ‘Musang King’ durian
62
15
Transactions of Persatuan Genetik Malaysia, No. 10, 2019
andLuders(2009)reportedthatpollensourcecanaffectdurianfruitcharacterssuchasfruitsizeandtotalnumberofseedsperfruit.Theeffectiscommonlyknownaspaternal-effect.Thereiss?ll no informa?on on paternal effect on ‘Musang King’. Thispaperprovidesreportonpreliminarystudyofpaternaleffecton‘Musang King’ fruit secng, fruit characters and taste. Theinforma?on will be useful to iden?fy the best pollen donorcul?varsfor‘MusangKing’produc?on.
MATERIALSANDMETHODS
PlantMaterialsandArWficialPollinaWon
This studywas conducted at Top Fruit SdnBhddurian farm inParitSulong,BatuPahat,Johor(2º0’N,102º52’)duringFebruarytoJune,2019,usingasingle‘MusangKing’plantwithageabout15 years old. Flowers at the ‘white’ stage (Kozai and Higuchi,2011) were emasculated between 0900 hours to 1500 hours,and the flower clusters were covered with costume-mademuslinbag topreventnaturalpollina?on.Flowerclusterswerethinned to two to seven flowers per cluster. Seven to eightflower clusters were emasculated for each cross-pollina?on
Table1.Effectofmaleparentonmeanperiodtofruitmaturityfromanthesis
treatment. Fresh anthers were collected at 2000 hours fromfourdifferentduriancul?varsregisteredas‘D24’,‘D168’,‘D190’,and ‘D200’. The flowers were pollinated at anthesis around2030 hours to 2300 hours. Flowers were covered a�erpollina?on and removed second weeks a�er anthesis. Thenumber of flowers or fruits that remained awached to theplantswas counted on 2, 4, 6, 8, 10, 12weeks a�er anthesisand during mature fruit abscised. Fruits were ?de with smallrope at 12weeks a�er anthesis to prevent fully ripe abscisedfruitfromdroptotheground.
MeasurementofFruitCharacterisWcandMorphology
Fullyripeabscisedfruitswereweighedandstoredincoldroomat7ºCwithin7-14weeksby followingstoragemethodbyNurAzlinetal. (2019),un?l furtherdatameasurementwasmade.The following characteris?cs andmorphology were measuredandrecorded: fruitcircumference, lengthof stalk, thicknessofstalk, fruit colour, fruit shape spine length, spine shape,characterofspineatfruitapex,characterofspineatthebaseofthe fruit pedicel, rind thickness, number of locules per fruit,number of locules without pulp unit, seed weight per fruit,seeds number per fruit, percentage of deflated seed,
Table2.Percentageoffruitsetfromdifferentcross-pollina?ontreatmentonMusangKing
Table3.Meansquaresforcharacteris?csof‘MusangKing’fruitproduceda�ercross-pollina?onwith‘D24’,‘D168’,‘D190’,and‘D200’pollen

- 63 -
Muhammad Afiq et al. (2019): Study of paternal effect on the characters of ‘Musang King’ durian
63
15
Transactions of Persatuan Genetik Malaysia, No. 10, 2019
Figure1.Whitearrowshowsareawithabsentofspinearoundthebaseofthefruitpedicelwhichrepresentanothercommoncharacterfor
‘MusangKing’fruit
Table4.Fruitcharacteris?csof‘MusangKing’fruitproduceda�ercross-pollina?onwith‘D24’,‘D168’,‘D190’,and‘D200’pollen
- 64 -
Muhammad Afiq et al. (2019): Study of paternal effect on the characters of ‘Musang King’ durian
64
15
Transactions of Persatuan Genetik Malaysia, No. 10, 2019
Table5.Panelrespondonsimilarityoftestedsampleto‘MusangKing’characterandtaste(sampleinformofpulp)
percentageofediblepor?on,flesh thickness, and total solublesolid content (TSS). The experimental designwas a completelyrandomized design (CRD). One-way ANOVA was applied toevaluate the significant difference in selected fruitcharacteris?cs parameters, and the differences betweentreatment means were compared by the Least SignificantDifference(LSD)methodat(P<0.05).
SensoryEvaluaWon
Pulp from fruit for each cross-pollina?on treatment and fromrepresentable ‘Musang King’ fruits produced from naturalpollina?onwere stored in vacum container at -18ºC followingstoragemethod reported in Nur Azlin et al. (2016), within 14days a�er fully ripe fruit abscission un?l survey on tasteevalua?on was conducted. Pulp were thawed at roomtemperatureassistedwithelectricalfanfortwoandahalfhoursbeforesurvey.Blindsensoryevalua?onwasmadebyeightwelltrainedrespondentwhohadexperienceofea?ng‘MusangKing’more than20?mesandcan recognize its charactersand tasteeasily.Therespondentswereaskedtoevaluateeachsampleandcompare their characters and taste with commonly presentcharacteron‘MusangKing’.Theneedtoevaluatebaseonfleshcolour, aroma, texture, creaminess, and biwerness. A�er fullyexamine and taste each sample, they need to decidewhethereachsampleissimilarto‘MusangKing’ornot.
RESULTSANDDISCUSSION
Abscissionof fully ripe fruits for all cross-pollina?on treatmentoccur within 102 to 110 days a�er anthesis (Table 1). Duringfully ripe fruit abscission, percentage of fruit harvested from
cross-pollina?on treatment with ‘D168’, ‘D200’, ‘D190’ and‘D24’ were 13.04%, 12.50%, 8.70%, and 7.14% respec?vely(Table2).TheresultwasconsistentwithMuhammadAfiqetal.(2018) on the ability ‘D24’ to be used as pollen source for‘Musang King’. In the report, fruit secng at 12 weeks a�eranthesis from cross-pollina?on with ‘D24’ produced 37.92%fruit secng. The reason of lower fruit reten?on in this study,probably due to different agronomic prac?ce andenvironmental condi?on between both study area. Lim andLuders (2009) reported that fer?liza?on failure, low level ofnutrients, insufficient water, and adverse weather condi?onsduring frui?ng can cause low percentage of fruit set.Meanwhile,Masri(1999)reportedthatrestrictedsoilmoisturecondi?onscouldcauseprematurefruitletdrop.
There was no significant difference on fruitcharacteris?cs between different cross-pollina?on treatmentincludingfruitweight,fruitcircumference,spinelength,numberof locules per fruit, number of loculeswithout pulp unit, rindthickness, seed weight per fruit, seeds number per fruit,percentage of deflated seed, percentage of edible por?on,length of stalk, thickness of stalk, and TSS (Table 3). Thesefindings consistent with Honsho et al. (2009) who found thatfruit characteris?cs were not so affected by pollen. Paternaleffect could only occur on cross-pollina?on between specificduriancul?varssuchasreportedby Indriyanietal. (2012)andLimandLuders(2009).
There was no difference on ‘Musang King’ fruitmorphology produced from all cross-pollina?on treatment.They had green fruit colour, similar length of pyramid shapespine (Table 4), five number of locules, present of viable anddeflatedseedsineveryfruit,presentof“star-shaped”pawernatthe fruit apex due to present of small spine, absent of some
- 65 -
Muhammad Afiq et al. (2019): Study of paternal effect on the characters of ‘Musang King’ durian
65
15
Transactions of Persatuan Genetik Malaysia, No. 10, 2019
spine and unique spine arrangement, absent of spine at thebaseofthefruitpedicel(Figure1),andobovoidtooblongfruitshapewhicharecommon in ‘MusangKing’.Thesemorphologycharacters could only be control by maternal effect. Thesemorphologycharactersarevaluable in iden?fyingandverifying‘MusangKing’fruitatmarket.
Table5showstasteevalua?onon‘MusangKing’fruitsproduced fromdifferent cross-pollina?on. Thepulpwas storedbefore evalua?on, so that fruits from all treatment can becollected and chosen for taste evalua?on at the same ?me.Comparison of samples between different cross-pollina?ontreatment showed that sample from cross-pollina?on with‘D190’hadhighestagreementonitssimilarityto‘MusangKing’,followed by from cross-pollina?onwith ‘D168’ and ‘D24’, with42.9%, 37.5% and 12.5% respondent agree respec?vely.However, their similarity scores were lower than obtained by‘Musang King’ fruits produced from natural pollina?on OP1,OP2,OP3,OP5(71.4%–100%agree),andalmostsimilartoOP4(33.3%agree).OP1,OP2,OP3,andOP5couldbeproducedfromnatural pollina?on of ‘Musang King’ flower with pollen formotherduriancul?varsavailableatthefarm.Paternaleffectcouldinfluencethevola?lecompoundcontent inthefruit.Azizetal.(2019) reported that durian unique flavour, taste and odourwere determined by different type and amount of vola?lecompound available within the pulp. Further study could bedone to further evaluate on the effect of paternal parent onvola?lecontentofdurian.
CONCLUSION
Pollen from different durian cul?vars can affect percentage offruit secng in ‘Musang King’. There were no paternal effectfrom ‘D24’, ‘D168’, ‘D190’, and ‘D200’ on characteris?cs andmorphologyof‘MusangKing’fruit.Preliminarytasteevalua?onfound that different pollen source could affect ‘Musang King’pulp taste. Further study with more fruit samples andrespondentcouldbedonetofurtherevaluatethesefindings.
AKNOWLEDGEMENT
The team would like to acknowledge Director of Hor?cultureResearchCentre,Dr.PauziahMuda;managementboardofTopFruit Sdn. Bhd. and staff (Mr. Faiz andMs. Intan); andMARDISintokmanagement and staff for their collabora?oneffort andassistantthroughoutthisprojectperiod.Thisprojectwasfundedby“WangPembangunanMARDI”(PRH-405).
REFERENCES
Aziz,N.A.A.,Maleyki,A.,and Jalil,M. (2019).Bioac?veCompounds,Nutri?onal Value, and Poten?al Health Benefits of Indigenous Durian(DurioZibethinusMurr.):AReview.Foods.8(96):1-12.
Bumrungsri,S.,Sripaoray,E.,Chongsiri,T.,Sridith,K.,andRacey,P.A.(2009). The pollina?on ecology of durian (Durio zibethinus,Bombacaceae)insouthernThailand.JournalofTropicalEcology.25:85–92.
Davis, T. A., and BhaJacharya, C. (1974). Some morphologicalobserva?ons inDurio zibethinusMurr. (Bombacaceae). The Journal oftheIndianBotanicalSociety.53:48–58.
Department of Agriculture. (2019). Plant Variety Protec?onMalaysia.Retrievedfromhwp://pvpbkkt.doa.gov.my/.
George, S. T., K. R. Pillai, K. H. Lim, S. Tham, andM. Zainal Abidin.(1994). Recent developments in assisted cross-pollina?on to enhanceyieldofduriancloneD24.
Honsho,C.,Somsri,S.,Salakpetch,S.,Tetsumura,T.,Yonemoto,Y.,andYonemori,K.(2009).PollenSourcesEffectsonSeedForma?onandFruitCharacteris?cs in Thai Durians. Tropical Agriculture andDevelopment.53(1):28-32.
Honsho,C.,Yonemori,K.,Somsri,S.,Subhadrabandhu,S.,andSugiura,A. (2004).Marked improvementof fruit set inThaidurianbyar?ficialcross-pollina?on.Scien?aHor?culturae.101(4),399–406.
Honsho, C., Yonemori, K., and Sugiura, A. (2004). Durian floraldifferen?a?onandfloweringhabit.JournaloftheAmericanSocietyforHor?culturalScience.129(1):42–45.
Indriyani,N. L.P.,HadiaW, S.,NasuWon, F., Sudjijo, E., and IrawaW,Y.(2012).MaternalandPaternalEffectontheCharactersofDurian(DurioZibethinus Murr.) Fruit from Cross-Pollina?on. Journal of Fruit andOrnamentalPlantResearch.20(2),23–33.
Kozai,N.,Chusri,O.,ChuWnanthakun,T.,Tongtao,S.,Higuchi,H.,andOgata, T. (2014). Pollina?on and subsequent ovule developmentthrough fruit set in ‘Chanee’, ‘Monthong’, and ‘Kradumthong’ durian.TropicalAgricultureandDevelopment.58(2):58–65.
Lim, T. K., and Luders, L. (2009). Boos?ng durian produc?vity. RuralIndustriesResearchandDevelopmentCorpora?on.Darwin.124.
Masri,M.(1999).Flowering,fruitsetandfruitletdropofdurian(Duriozibethinus Murr.) under different soil mositure regimes. Journal ofTropicalAgricultureandFoodScience.27(1):9-16.
Mohamad, O., Zainal Abidin, M., and Mohd. Shamsudin., O. (eds.).(1994). Recent Developments in Durian Cul?va?on. MARDI, Serdang,Malaysia.
Muhammad Afiq, T. A., Mohd Asrul, S. Salehudin, M. R., Ullia, I.,Razali,M., Johari, S., andMusanif,G. (2018).APreliminary StudyonSelf-Incompa?bilityandTheNeedofCrossPollina?onon‘MusangKing’Durian(Duriozibethinus)forFrui?ng.Transac?onofPersatuanGene?kMalaysia.8:35-37.
NurAzlin,R.,Zaipun,M.Z.,SiWAisyah,A.,Razali,M.,Habsah,M.,andSiW Khuzaimah, T. (2019). Cold storage improved postharvest life ofdurian(Duriozibethinuscv.MusangKing.Transac?onsoftheMalaysianSocietyofPlantPhysiology.26:164–167.
NurAlin,R.,LaWfah,M.N.,SiWAisyah,A.,Pauziah,M.,Zaipun,M.Z.,NurulAdibah,M.,Zainab,M.Y.,Hairiyah,M.,Habsah,M.,Razali,M.,Zaulia,O.,NurSyafini,G., Joanna,C.L.Y.,andNurAlisha,O. (2016).Simula?on studies for export of minimally processed durian by airshipmenttoHongKong.ActaHor?culturae.1141:283–288.

- 66 -Transactions of Persatuan Genetik Malaysia, No. 10, 2019
66
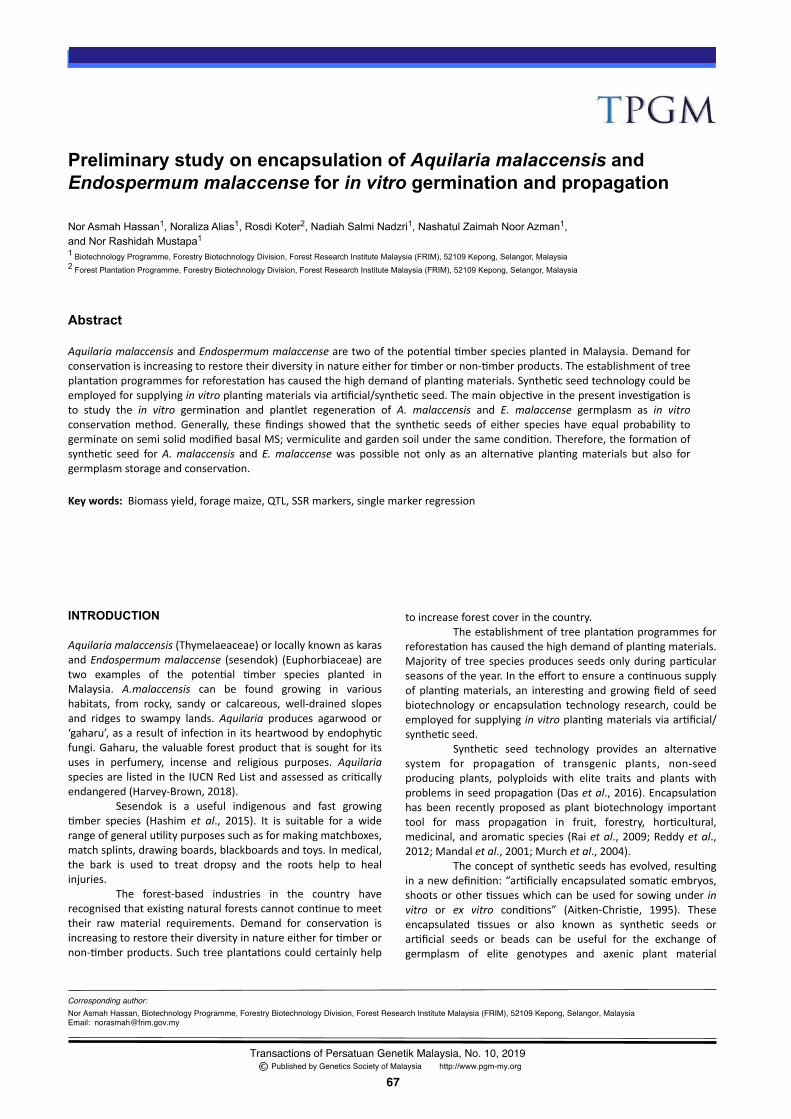
- 67 -
Corresponding author:
Transactions of Persatuan Genetik Malaysia, No. 10, 2019 Published by Genetics Society of Malaysia http://www.pgm-my.org
53
67
Preliminary study on encapsulation of Aquilaria malaccensis and Endospermum malaccense for in vitro germination and propagation
Nor Asmah Hassan1, Noraliza Alias1, Rosdi Koter2, Nadiah Salmi Nadzri1, Nashatul Zaimah Noor Azman1, and Nor Rashidah Mustapa1
1 Biotechnology Programme, Forestry Biotechnology Division, Forest Research Institute Malaysia (FRIM), 52109 Kepong, Selangor, Malaysia2 Forest Plantation Programme, Forestry Biotechnology Division, Forest Research Institute Malaysia (FRIM), 52109 Kepong, Selangor, Malaysia
Abstract
AquilariamalaccensisandEndospermummalaccensearetwoofthepoten?al?mberspeciesplantedinMalaysia.Demandforconserva?onisincreasingtorestoretheirdiversityinnatureeitherfor?mberornon-?mberproducts.Theestablishmentoftreeplanta?onprogrammesforreforesta?onhascausedthehighdemandofplan?ngmaterials.Synthe?cseedtechnologycouldbeemployedforsupplyinginvitroplan?ngmaterialsviaar?ficial/synthe?cseed.Themainobjec?veinthepresentinves?ga?onisto study the in vitro germina?on and plantlet regenera?on of A. malaccensis and E. malaccense germplasm as in vitroconserva?onmethod. Generally, these findings showed that the synthe?c seeds of either species have equal probability togerminateonsemisolidmodifiedbasalMS;vermiculiteandgardensoilunderthesamecondi?on.Therefore,theforma?onofsynthe?c seed forA.malaccensis andE.malaccense was possible not only as an alterna?ve plan?ngmaterials but also forgermplasmstorageandconserva?on.
Nor Asmah Hassan, Biotechnology Programme, Forestry Biotechnology Division, Forest Research Institute Malaysia (FRIM), 52109 Kepong, Selangor, MalaysiaEmail: [email protected]
Keywords:Biomassyield,foragemaize,QTL,SSRmarkers,singlemarkerregression
Line
LastKey
Intro
INTRODUCTION
Aquilariamalaccensis(Thymelaeaceae)orlocallyknownaskarasandEndospermummalaccense (sesendok) (Euphorbiaceae)aretwo examples of the poten?al ?mber species planted inMalaysia. A.malaccensis can be found growing in varioushabitats, from rocky, sandy or calcareous, well-drained slopesand ridges to swampy lands. Aquilaria produces agarwood or‘gaharu’,asaresultof infec?oninitsheartwoodbyendophy?cfungi.Gaharu,thevaluableforestproductthat issoughtfor itsuses in perfumery, incense and religious purposes. AquilariaspeciesarelistedintheIUCNRedListandassessedascri?callyendangered(Harvey-Brown,2018).
Sesendok is a useful indigenous and fast growing?mber species (Hashim et al., 2015). It is suitable for a widerangeofgeneralu?litypurposessuchasformakingmatchboxes,matchsplints,drawingboards,blackboardsandtoys.Inmedical,the bark is used to treat dropsy and the roots help to healinjuries.
The forest-based industries in the country haverecognisedthatexis?ngnaturalforestscannotcon?nuetomeettheir raw material requirements. Demand for conserva?on isincreasingtorestoretheirdiversityinnatureeitherfor?mberornon-?mberproducts.Suchtreeplanta?onscouldcertainlyhelp
toincreaseforestcoverinthecountry.Theestablishmentoftreeplanta?onprogrammesfor
reforesta?onhascausedthehighdemandofplan?ngmaterials.Majorityof tree speciesproduces seedsonlyduringpar?cularseasonsoftheyear.Intheefforttoensureacon?nuoussupplyof plan?ngmaterials, an interes?ng and growingfieldof seedbiotechnology or encapsula?on technology research, could beemployedforsupplying invitroplan?ngmaterialsviaar?ficial/synthe?cseed.
Synthe?c seed technology provides an alterna?vesystem for propaga?on of transgenic plants, non-seedproducing plants, polyploids with elite traits and plants withproblemsinseedpropaga?on(Dasetal.,2016).Encapsula?onhas been recently proposed as plant biotechnology importanttool for mass propaga?on in fruit, forestry, hor?cultural,medicinal,andaroma?cspecies (Raietal.,2009;Reddyetal.,2012;Mandaletal.,2001;Murchetal.,2004).
Theconceptofsynthe?cseedshasevolved,resul?nginanewdefini?on:“ar?ficiallyencapsulatedsoma?cembryos,shootsorother?ssueswhichcanbeusedforsowingunder invitro or ex vitro condi?ons” (Aitken-Chris?e, 1995). Theseencapsulated ?ssues or also known as synthe?c seeds orar?ficial seeds or beads can be useful for the exchange ofgermplasm of elite genotypes and axenic plant material
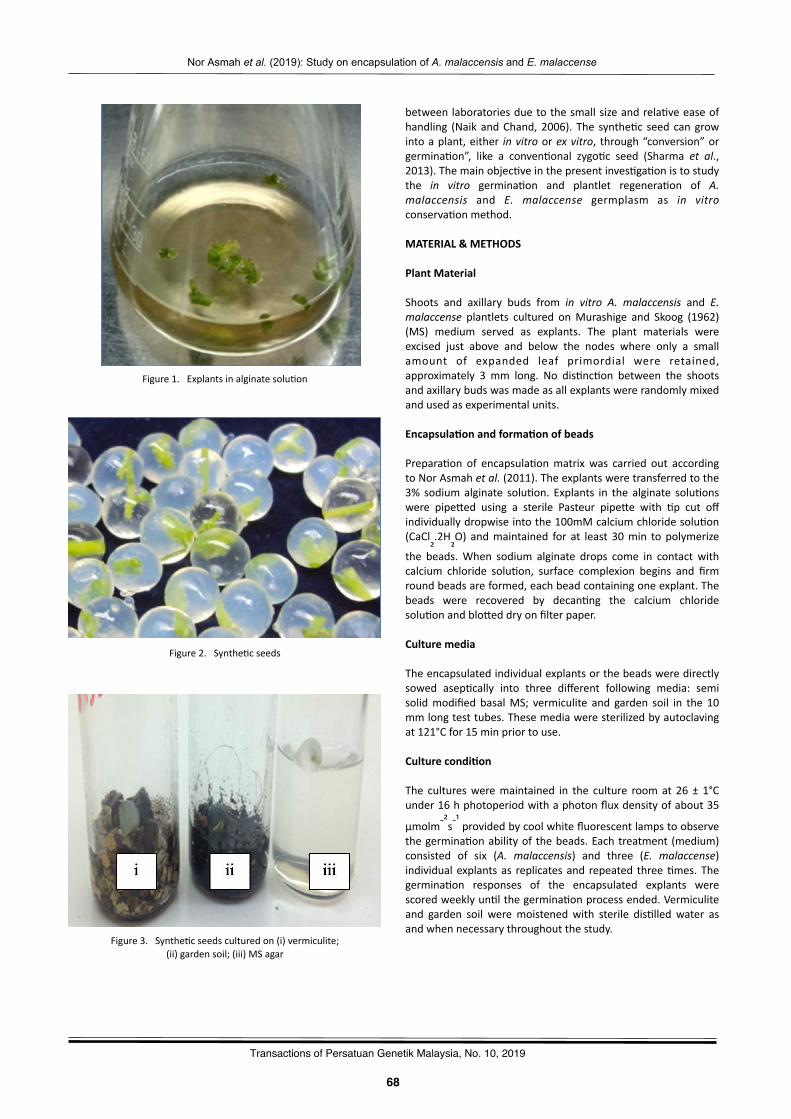
- 68 -
Nor Asmah et al. (2019): Study on encapsulation of A. malaccensis and E. malaccense
68
16
Transactions of Persatuan Genetik Malaysia, No. 10, 2019
betweenlaboratoriesduetothesmallsizeandrela?veeaseofhandling (NaikandChand,2006). The synthe?c seed cangrowintoaplant,either invitroorexvitro, through“conversion”orgermina?on”, like a conven?onal zygo?c seed (Sharma et al.,2013).Themainobjec?veinthepresentinves?ga?onistostudythe in vitro germina?on and plantlet regenera?on of A.malaccensis and E. malaccense germplasm as in vitroconserva?onmethod.
MATERIAL&METHODS
PlantMaterial
Shoots and axillary buds from in vitro A. malaccensis and E.malaccense plantlets cultured onMurashige and Skoog (1962)(MS) medium served as explants. The plant materials wereexcised just above and below the nodes where only a smallamount of expanded leaf primordial were retained,approximately 3 mm long. No dis?nc?on between the shootsandaxillarybudswasmadeasallexplantswererandomlymixedandusedasexperimentalunits.
EncapsulaWonandformaWonofbeads
Prepara?on of encapsula?onmatrixwas carried out accordingtoNorAsmahetal.(2011).Theexplantsweretransferredtothe3% sodiumalginate solu?on. Explants in the alginate solu?onswere pipewed using a sterile Pasteur pipewe with ?p cut offindividuallydropwiseintothe100mMcalciumchloridesolu?on(CaCl₂.2H₂O) andmaintained for at least 30min to polymerize
the beads.When sodium alginate drops come in contact withcalcium chloride solu?on, surface complexion begins and firmroundbeadsareformed,eachbeadcontainingoneexplant.Thebeads were recovered by decan?ng the calcium chloridesolu?onandbloweddryonfilterpaper.
Culturemedia
Theencapsulatedindividualexplantsorthebeadsweredirectlysowed asep?cally into three different following media: semisolidmodified basalMS; vermiculite and garden soil in the 10mmlongtesttubes.Thesemediaweresterilizedbyautoclavingat121°Cfor15minpriortouse.
CulturecondiWon
The culturesweremaintained in the culture roomat 26 ± 1°Cunder16hphotoperiodwithaphotonfluxdensityofabout35
µmolm-²s-¹providedbycoolwhitefluorescentlampstoobservethegermina?onabilityof thebeads.Eachtreatment (medium)consisted of six (A. malaccensis) and three (E. malaccense)individualexplantsas replicatesand repeated three?mes.Thegermina?on responses of the encapsulated explants werescoredweeklyun?lthegermina?onprocessended.Vermiculiteand garden soil weremoistenedwith sterile dis?lledwater asandwhennecessarythroughoutthestudy.
Figure1.Explantsinalginatesolu?on
Figure3.Synthe?cseedsculturedon(i)vermiculite;(ii)gardensoil;(iii)MSagar
Figure2.Synthe?cseeds
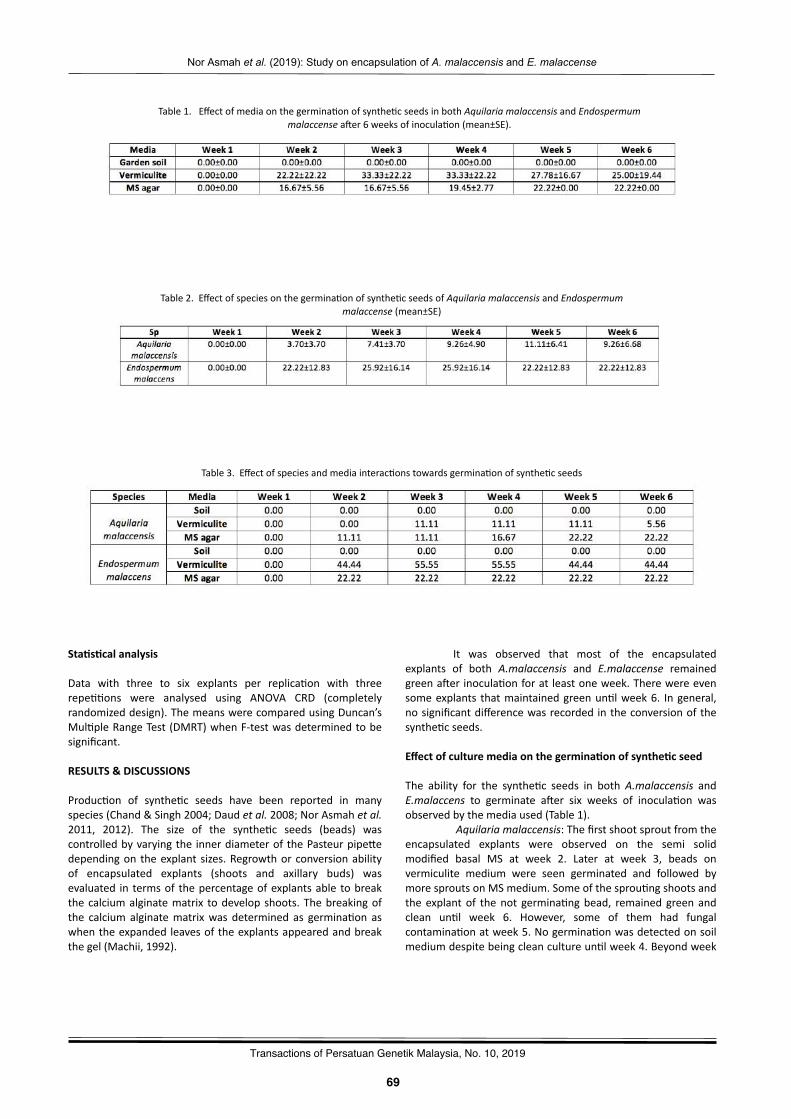
- 69 -
Nor Asmah et al. (2019): Study on encapsulation of A. malaccensis and E. malaccense
69
16
Transactions of Persatuan Genetik Malaysia, No. 10, 2019
StaWsWcalanalysis
Data with three to six explants per replica?on with threerepe??ons were analysed using ANOVA CRD (completelyrandomizeddesign).ThemeanswerecomparedusingDuncan’sMul?pleRangeTest(DMRT)whenF-testwasdeterminedtobesignificant.
RESULTS&DISCUSSIONS
Produc?on of synthe?c seeds have been reported in manyspecies(Chand&Singh2004;Daudetal.2008;NorAsmahetal.2011, 2012). The size of the synthe?c seeds (beads) wascontrolledbyvaryingthe innerdiameterofthePasteurpipewedependingon theexplant sizes.Regrowthorconversionabilityof encapsulated explants (shoots and axillary buds) wasevaluated in termsof thepercentageofexplantsable tobreakthecalciumalginatematrix todevelopshoots.Thebreakingofthe calcium alginatematrixwas determined as germina?on aswhentheexpandedleavesoftheexplantsappearedandbreakthegel(Machii,1992).
It was observed that most of the encapsulatedexplants of both A.malaccensis and E.malaccense remainedgreena�erinocula?onforatleastoneweek.Therewereevensomeexplants thatmaintainedgreenun?lweek6. Ingeneral,nosignificantdifferencewasrecordedintheconversionofthesynthe?cseeds.
EffectofculturemediaonthegerminaWonofsyntheWcseed
The ability for the synthe?c seeds in both A.malaccensis andE.malaccens to germinate a�er six weeks of inocula?on wasobservedbythemediaused(Table1).
Aquilariamalaccensis:Thefirstshootsproutfromtheencapsulated explants were observed on the semi solidmodified basal MS at week 2. Later at week 3, beads onvermiculite medium were seen germinated and followed bymoresproutsonMSmedium.Someofthesprou?ngshootsandtheexplantof thenot germina?ngbead, remainedgreenandclean un?l week 6. However, some of them had fungalcontamina?onatweek5.Nogermina?onwasdetectedonsoilmediumdespitebeingcleancultureun?lweek4.Beyondweek
Table1.Effectofmediaonthegermina?onofsynthe?cseedsinbothAquilariamalaccensisandEndospermummalaccensea�er6weeksofinocula?on(mean±SE).
Table2.Effectofspeciesonthegermina?onofsynthe?cseedsofAquilariamalaccensisandEndospermummalaccense(mean±SE)
Table3.Effectofspeciesandmediainterac?onstowardsgermina?onofsynthe?cseeds
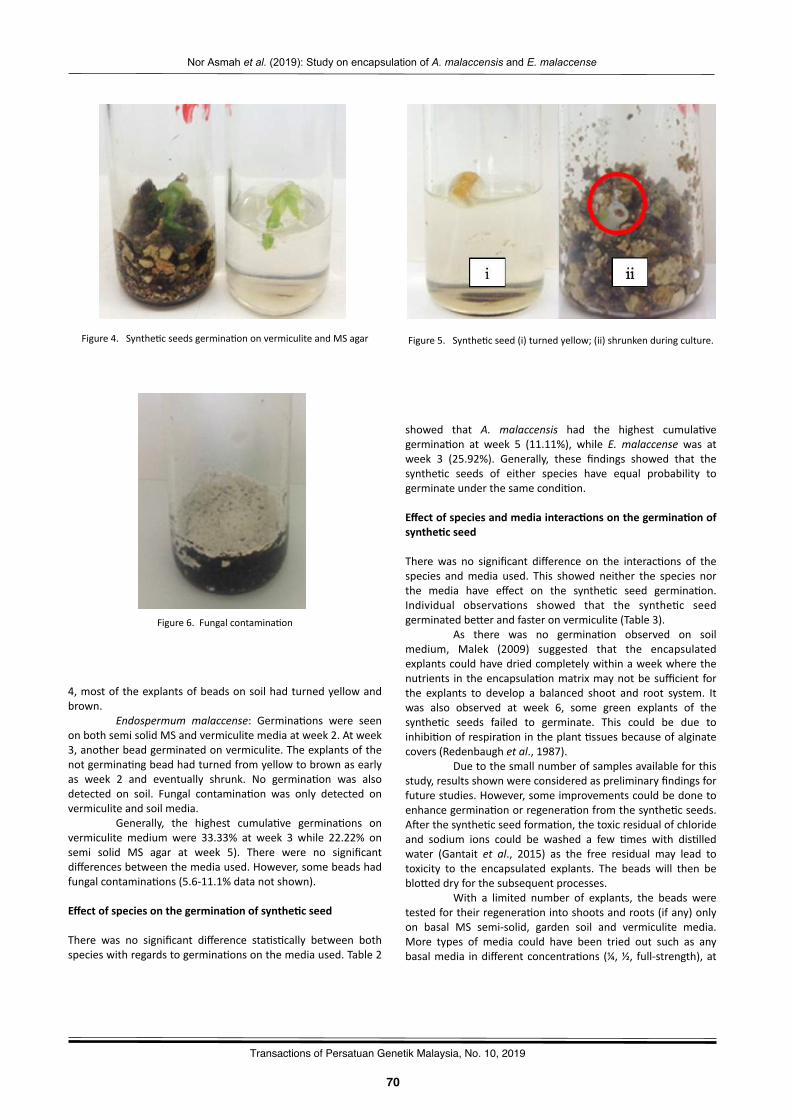
- 70 -
Nor Asmah et al. (2019): Study on encapsulation of A. malaccensis and E. malaccense
70
16
Transactions of Persatuan Genetik Malaysia, No. 10, 2019
4,mostoftheexplantsofbeadsonsoilhadturnedyellowandbrown.
Endospermum malaccense: Germina?ons were seenonbothsemisolidMSandvermiculitemediaatweek2.Atweek3,anotherbeadgerminatedonvermiculite.Theexplantsofthenotgermina?ngbeadhadturnedfromyellowtobrownasearlyas week 2 and eventually shrunk. No germina?on was alsodetected on soil. Fungal contamina?on was only detected onvermiculiteandsoilmedia.
Generally, the highest cumula?ve germina?ons onvermiculite mediumwere 33.33% at week 3 while 22.22% onsemi solid MS agar at week 5). There were no significantdifferencesbetweenthemediaused.However,somebeadshadfungalcontamina?ons(5.6-11.1%datanotshown).
EffectofspeciesonthegerminaWonofsyntheWcseed
There was no significant difference sta?s?cally between bothspecieswithregardstogermina?onsonthemediaused.Table2
showed that A. malaccensis had the highest cumula?vegermina?on at week 5 (11.11%), while E. malaccensewas atweek 3 (25.92%). Generally, these findings showed that thesynthe?c seeds of either species have equal probability togerminateunderthesamecondi?on.
EffectofspeciesandmediainteracWonsonthegerminaWonofsyntheWcseed
Therewas no significant difference on the interac?ons of thespecies andmedia used. This showed neither the species northe media have effect on the synthe?c seed germina?on.Individual observa?ons showed that the synthe?c seedgerminatedbewerandfasteronvermiculite(Table3).
As there was no germina?on observed on soilmedium, Malek (2009) suggested that the encapsulatedexplantscouldhavedriedcompletelywithinaweekwherethenutrients intheencapsula?onmatrixmaynotbesufficient forthe explants to develop a balanced shoot and root system. Itwas also observed at week 6, some green explants of thesynthe?c seeds failed to germinate. This could be due toinhibi?onofrespira?onintheplant?ssuesbecauseofalginatecovers(Redenbaughetal.,1987).
Duetothesmallnumberofsamplesavailableforthisstudy,resultsshownwereconsideredaspreliminaryfindingsforfuturestudies.However,someimprovementscouldbedonetoenhancegermina?onorregenera?onfromthesynthe?cseeds.A�erthesynthe?cseedforma?on,thetoxicresidualofchlorideand sodium ions could be washed a few ?mes with dis?lledwater (Gantait et al., 2015) as the free residual may lead totoxicity to the encapsulated explants. The beads will then bebloweddryforthesubsequentprocesses.
With a limited number of explants, the beads weretestedfortheirregenera?onintoshootsandroots(ifany)onlyon basal MS semi-solid, garden soil and vermiculite media.More types of media could have been tried out such as anybasalmedia indifferentconcentra?ons (¼,½, full-strength),at
Figure4.Synthe?cseedsgermina?ononvermiculiteandMSagar Figure5.Synthe?cseed(i)turnedyellow;(ii)shrunkenduringculture.
Figure6.Fungalcontamina?on
- 71 -
Nor Asmah et al. (2019): Study on encapsulation of A. malaccensis and E. malaccense
71
16
Transactions of Persatuan Genetik Malaysia, No. 10, 2019
semi-solid or liquid states and also in plan?ng substrates likegravel, perlite, sand, soilrite, and vermicompost for completeregenera?on into plantlets. Therewere some researcherswhoaddedMSnutrientsat¼-or½-forwateringthesubstratesasasubs?tute of dis?lled water which has improved theregenera?onpercentage(ChandandSingh,2004;Sharmaetal.,2009). Anotherproblemencounteredduringthestudywasthecontamina?on by microbes. Despite all necessary precau?onsbeing taken, fungal or bacterial contamina?ons was the mainreason of losing the cultures. Thus, in the future, an extraprecau?on couldbe consideredwhereAntoniewaet al. (2007)
has added fungicide of about 50–100 mgl-¹ into theencapsula?onmatrixtominimizethecontamina?onissue.
CONCLUSION
The present study has successfully developed a method ofsynthe?c seed forma?on by encapsula?ng shoots and axillarybuds from invitro grownplantletsof fast-growing tropical treespecies,A.malaccensis and E.malaccens. Although the numberof plantlets regenerated was low, this study revealed thatsynthe?cseedsaregoodalterna?veplan?ngmaterialsbecausetheycanbeproducedthroughouttheyearthroughplant?ssueculturetechniques,integra?ng?ssueculturemanipula?onswithsynthe?c seed technology for germplasm storage andconserva?on.
REFERENCES
Aitken-ChrisWe, J., Kozai, T., and Takayama, S. (1995). Automa?on inplant ?ssue culture: general introduc?on and overview. In: Aitken-Chris?e J, Kozai T, SmithM.A.L, (Eds). Automa?on and environmentalcontrolinplant?ssueculture.Dordrecht:Kluwer.1–18.
AntonieJa, G. M., Micheli, M., Pulcini, L., and Standardi, A. (2007).Perspec?ve of the encapsula?on technology in the nursery ac?vity ofCitrus.Caryologia.60:192–195.
Chand,S.,andSingh,A.K.(2004).Plantregenera?onfromencapsulatednodalsegmentsofDalbergiasissooRoxb.,a?mberyieldingleguminoustreespecies.J.PlantPhysiol.161:237-243.
Daud, N., Taha, R. M., and Hasbullah, N. A. (2008). Ar?ficial seedproduc?on from encapsulated micro shoots of Saintpaulia ionanthaWendl.(Africanviolet).J.Appl.Sci.8(24):4662-4667.
Das, D. K., Rahman, A., Kumari, D., and Kumari, N. (2016) Synthe?cSeedPrepara?on,Germina?onandPlantletRegenera?onofLitchi(LitchichinensisSonn.).AmericanJournalofPlantSciences.7:1395-1406.
Gantait, S., Kundu, S., Ali, N., and Sahu, N. C. (2015). Synthe?c seedproduc?on of medicinal plants: a review on influence of explants,encapsula?onagentandmatrix.ActaPhysiologiaePlantarum.37:98.
Harvey-Brown, Y. (2018).Aquilariamalaccensis. (2018). The IUCN RedListofThreatenedSpecies.e.T32056A2810130.
Hashim, M. N., Mohd Hazim, M. A., and Syafinie, A. M. (2015).Strategic Forest Planta?on Establishment In Malaysia For FutureProduct Development And U?lisa?on. Interna?onal Journal ofAgriculture,ForestryandPlanta?on.Vol.1:14-24.
Machii,H.(1992).Invitrogrowthofencapsulatedadven??ousbudsinmulberry,MorusalbaL.JapanJ.Breed.42:553-559.
Malek, M. A. (2009). In vitro propaga?on of pointed gourd(Trichosanthes dioica Roxb.) through encapsulated shoot ?psBangladeshJ.Agril.Res.34(4):555-563.
Mandal, J., PaJnaik, S., Chand, P. K. (2001).Growth response of thealginate-encapsulated nodal segments of in vitro-cultured basils.JournalofHerbs,SpicesandMedicinalPlants.8(4):65–74.
Murashige,T.andSkoog,F.(1962)Arevisedmediumforrapidgrowthandbioassayswithtobacco?ssuecultures.J.PlantPhysiol.15:473–497.
Murch, S. J., Peiris, S. E., Liu, C. Z., and Saxena, P. K. (2004). In vitroconserva?onandpropaga?onofmedicinalplants.Biodiversity.2004(5):19–24.
Naik,S.K.,andChand,P.K.(2006).Nutrient-alginateencapsula?onofin vitro nodal segments of pomegranate (Punica granatum L.) forgermplasmdistribu?onandexchange.SciHor?c.108:247–252.
NorAsmah,H.,NorHasnida,H.,Noraliza,A.,NashatulZaimah,N.A.,and Nadiah Salmi, N. (2012). In vitro propaga?on of Acacia hybridthrough alginate-encapsulated shoots and axillary buds. Afr JBiotechnol.11:12814–12817.
NorAsmah,H.,NorHasnida,H.,NashatulZaimah,N.A.,Noraliza,A.,and Nadiah Salmi, N. (2011). Synthe?c seed technology forencapsula?onandregrowthofinvitro-derivedAcaciahybridshootandaxillarybuds.Afr.J.Biotechnol.10(40):7820-7824.
Rai, M. K., Asthana, P., Singh, S. K., Jaiswal, V. S., and Jaiswal, U.(2009). The encapsula?on technology in fruit plants – a review.BiotechnolAdv.27:671–679.
Reddy,C.M.,Murthy,K.S.R.,andPullaiah,T.(2012).Synthe?cseeds:areviewinagricultureandforestry.AfrJBiotechnol.11:14254–14275.
Redenbaugh,K.,Slade,D.,Viss,P.andFujii,J.A.(1987).Encapsula?onofsoma?cembryosinsynthe?cseedcoats.Hor?c.Sci.,22,803–809.
Devika, S., Kumaria, S., andDas,M. (2018).Ar?ficial seed for short-term storage: using nodal buds inAquilariamalaccensis Lam. CurrentScience.Vol.115,No.11,10December2018.
Sharma, S., Shahzad, A., and Teixeira da Silva, J. A. (2013) Synseedtechnology—acompletesynthesis.BiotechnolAdv.31:186–207
Sharma, S., Shahzad, A. and Sahai, A. (2009). Ar?ficial seeds forpropaga?on and preserva?on of Spilanthes acmella(L.) Murr., Athreatened pes?cidal plant species. The Interna?onal Journal ofDevelopmentalBiology.3:62–64.

- 72 -Transactions of Persatuan Genetik Malaysia, No. 10, 2019
72
- 73 -
Corresponding author:
Transactions of Persatuan Genetik Malaysia, No. 10, 2019 Published by Genetics Society of Malaysia http://www.pgm-my.org
59
73
Effect of water deficit on the agronomic characteristics and SDS-PAGE protein pattern of three Sabah dryland rice varieties
Poey Shao Jiann, Mohamadu Boyie Jalloh, and Azwan AwangFaculty of Sustainable Agriculture, Universiti Malaysia Sabah
Abstract
Drought is the major limi?ng factor to rice produc?on worldwide. Thus, drought tolerance emerges as one of the mostimportantaspectsofricebreedingprograms.AstudyonSabah’slocaldrylandricevarie?eswerecarriedoutusingSilabukansoilasplan?ngmediumatFacultyofSustainableAgriculture,Universi?MalaysiaSabah.Thisstudyaimedtocomparetheagronomiccharacteris?csbetweenBeruang,KelopakandTigaBulandrylandricevarie?esundernormalanddroughtstresscondi?ons.Twocyclesofdroughttreatmentswereappliedat50%headingstagetoagronomicreplicates.Completelyrandomizeddesignwasused inthisstudy.ResultsshowedthatearlymaturingKelopakvarietyperformedthebestundernormalcondi?on,exhibitedthehighestextrapolatedyield(4.856tonnesha-1).Droughtstressat50%headingstageledtoasignificantdecreaseinrela?vewater content, percentage in filled grain and grain yield per plant. In this study, Tiga Bulan variety experienced the lowestpercentageofyieldreduc?on(28%)andgavethehighestgrainyieldperplant(19.438gplant-1)underdroughtstresscondi?on.Early flowering Tiga Bulan variety with slightly longer days to leaf rolling was selected for proteome analysis. Normal andcompletelyrolledflagleavesofTigaBulanvarietya�erfirstcycleofdroughttreatmentatgrainfillingstageweresubjectedtoSodiumDodecyl SulphatePolyacrylamideGelElectrophoresis (SDS-PAGE)analysis to compare theirproteinexpressions. SDS-PAGEanalysisrevealedoneandtwobandswereup-anddownregulatedsignificantlyinresponsetodroughtrespec?vely.Theseproteinsmaybeinvolvedindroughtmechanism.Recenttrendinclimatechangehavepredictedafurtherincreaseindroughtintensity,thereforeeffortstodevelopdroughttolerantvarie?esarevitaltosustainthericeproduc?onworldwide.
Poey Shao Jiann, Faculty of Sustainable Agriculture, Universiti Malaysia Sabah, MalaysiaEmail: [email protected]
Keywords:Drought,drylandrice,Silabukansoil,proteome,SDS-PAGE
Line
LastKey
IntroINTRODUCTION
Rice isa staple foodcrop fornearly3.5billionpeople,withanannual consump?on ofmore than 450metric tons worldwide(Muthayya et al., 2014). Drought is a climate related naturaldisaster that con?nuously challenges global rice produc?on,throughits impacton limi?ngwatersupply(Wangetal.2013).The frequency of drought event as a consequent to climatechanges is expected to increase in tropical and subtropicalregions(IPCC,2014).Sincericeproduc?on iscloselyassociatedwith water irriga?on, the occurrence of drought events willadversely impact food security and lead to vast economic costonaglobalscale.
Taking Malaysia as an example, 1997/98 El Ninorelated drought event caused severe impacts to theenvironment, economic and social ac?vi?es of the country(Simon,2014).Watershortagesexperiencedduringthisdroughteventhadsignificantlyreducedthericeproduc?onandaffectedthe welfare of rice farming community. Given that there areabout 674,000 hectares of rice fields, producing about 2.6million tonnes of rice annually in Malaysia (DOA Peninsular
Malaysia,2014),theoccurrenceofdroughteventswouldhaveathreatening impacton theNa?onal Self Sufficiency Level (SSL)ofdomes?criceproduc?on.
In the EastMalaysia par?cularly Sabah, dryland ricecul?va?on is mostly prac?ced by the rural communi?es as aself-sustaining agricultural ac?vity. Beruang, Galigim, HijauManis,Kelopak,KondingaandTigaBulanareamongtheSabah’sindigenous rain-feddryland ricevarie?es.Thesevarie?eshavebeenwidelyrecognizedtobemoredroughttolerant,aswellashighly valued for their unique aroma, grain quality andpalatability (Siambun, 2003; Ding et al., 2013). However, thegrain yield of these dryland rice is much lower than that ofwetlands (Hanafietal.,2009).Due to its loweryield, researchonrain-feddrylandricevarie?eshaso�enbeenneglectedandthusresul?nginthescantyagronomyinforma?onavailableforthesevarie?es.
Proteinsarethebuildingblocksofallcells,wherethebiological processes of life maintenance, defense, replica?onandreproduc?onareexerted(Bredaetal.,1999).Proteomicsisthe study of structure and func?on of proteins (Graves andHaystead, 2002). Although drought tolerance is among the

- 74 -
Poey et al. (2019): Effect of water deficit on the agronomic characteristics and protein pattern of Sabah dryland rice varieties
74
17
Transactions of Persatuan Genetik Malaysia, No. 10, 2019
important rice breeding goals, however, proteomic analysis fordrylandricevarie?esinresponsetodroughtstresshasnotbeenwell inves?gated (Kumar et al., 2007). Altera?ons in cellularprotein expression are responsible for drought tolerance indrylandrice(Salekdehetal.,2002;KomatsuandTanaka,2005).The iden?fica?on of drought responsive proteins usingmolecular approach able to assist rice breeding projectsworldwide,byimprovingthedroughttoleranceofhigh-yieldingbutdrought-suscep?blericevarie?es.
Inthisstudy,droughtstresswasappliedduringthe50percentheading(agronomyanalysis)andgrainfilling(proteomicanalysis) stages since these two stages of rice are highlysensi?vetodroughtstress(HeandSerraj,2012).Foragronomyanalysis, agronomic characteris?cs of all sample dryland ricevarie?es under normal and drought stress condi?on wascompared.
Flagleafwasusedforproteomicanalysisbecauseitisthe major carbohydrate producer, and photosynthe?ccarbohydrates are theprimary sourceof rice grain yield. Sinceleaf rolling is most no?ceable on flag leaves, leaf rolling scalewasusedas an indicator fordrought stress treatment (Pasketal., 2011). Sodium dodecyl sulphate-polyacrylamide gelelectrophoresis (SDS-PAGE) analysis was used in this study tocompare and analyze the effect of drought in the proteomicexpressions of dryland rice variety. Two staining methods,namelyCoomassieBrilliantBlue(CBB)andsilverstaining,werecompared in this study to obtain an op?mized method forproteomicanalysisofdrylandricevariety.
METHODOLOGY
This study was carried out in rain shelter no. 6 of Faculty ofSustainableAgriculture(FSA),Universi?MalaysiaSabah(5°55'N,118°00'E) inyear2015.Three(3)rain-feddrylandricevarie?es(Beruang,KelopakandTigaBulan)wereused inthisstudy.Theexperimental soilwasSilabukansoil (30cmdeep fromthesoilsurface),whichwas collected fromplot 16 and17of FSA. Thecollected soil was air-dried, grounded and sieved before use.Transparentplas?cbagswereplaced insideall thenurseryandplan?ngpotspriortosoilfilling.TriplicateSilabukansoilsampleswere analyzed for total nitrogen (N) concentra?on in soil, soilavailable phosphorus (P), ca?on exchange capacity (CEC) andsoilpH.Thisstudywasperformedusingcompletelyrandomizeddesign (CRD) with 5 replicates (for agronomy analysis) and 3replicates (for proteome analysis). The treatments used in thisstudywerenormaltreatmentanddroughtstress.
PlanWngofdrylandrice
Hundred(100)seedsfromeachvarietyweresoakedindis?lledwater for 24hours andplaced in germina?onboxes thatfilledwithmoistpapertowels,un?l theforma?onofprimaryshootsand roots. Once germinated, dryland rice seedlings weretransplanted into nursery clay pots. Fer?lizer applica?on withNPKra?oof2:1:1wassplitintotwo,whicharebasaldressingaweek before transplan?ng and topdressing a�er a week. Thetransplantedseedlingswerewateredtwicedaily.Fourteen (14)days old dryland rice seedlings were then transplanted intoplan?ngpots. Fer?lizerapplica?onwithNPK ra?oof2:1:1wassplit into three, which are basal dressing a week before
transplan?ngandtopdressingduringac?ve?lleringandpanicleini?a?on.Thetransplantedseedlingswerewateredtwicedailyun?lthedroughttreatmentandresumeda�ertreatment.
ApplicaWonofdroughttreatment
Atthe50%headingstage,wateringwasappliedthoroughlyintothe soil and small holeswere punched on the plas?c bags todrain thewaterslowly.Nowateringwasdonesince thenun?ltheflag leaf reached leaf rollingscoreof3 (morethan67%ofleaf rolled).Watering was then applied thoroughly again intothe soil and the full water level was maintained for a day.Second drought stress was applied un?l the flag leaf reachedleaf rolling score of 3.Wateringwas resumed un?l harves?nga�er the second cycle of drought treatment. Surroundingtemperature and rela?ve humidity (RH) were measured dailyusing thermohygrometer (Hanna Instrument HI93640)throughout the drought treatment. Soilmoisture contentwasmeasuredusingsoilmoisturemeter.
Methodsforagronomictraits
Morphological characteris?cs, physiological characteris?cs andyieldfordrylandricevarie?esunderdroughtstressandcontrolcondi?onsweremeasured.
SDSpageanalysis
Three(3)flagleafsampleswerecollectedwhentheleafrollingscore reached 3 following first cycle of drought treatmentduring grain filling stage. Another 3 samples were collectedfrom controls.One (1) dryland rice variety, namely Tiga Bulanwhichexhibitedslightlylongerdaystoleafrollingwereselectedfor proteome analysis. Collected flag leaf samples wereimmediately cut intopieces,wrappedwithaluminium foil andimmersed in liquid nitrogen. The frozen samples were then
storedat-80¦Cun?lfurtheruse.
Acetone dried powder (AcDP) for each flag leafsample was prepared and stored at -80ºC un?l further use.Pierce 660nm protein assay standard curve (R² = 0.99) wasestablished. TCA-acetone precipita?on method was used forprotein extrac?on. Extracted proteins were then resolubilizedand quan?fied using DeNovix DS-11 spectrophotometer. The
Table1.Soilchemicalproper?esofSilabukansoil

- 75 -
Poey et al. (2019): Effect of water deficit on the agronomic characteristics and protein pattern of Sabah dryland rice varieties
75
17
Transactions of Persatuan Genetik Malaysia, No. 10, 2019
proteinsamples(15uLforCBBstaining;5uLforsilverstaining)weresubjectedtoBio-RadMiniProteanTetraCell(#165-8000).Theelectrophoresissystemwasconductedatconstantvoltof70Vfor15minutesandcon?nuedat160Vun?lthebromophenolbluelinereachedthebowomoftheplate.
CBBandsilverstaining
Oncetheelectrophoresisprocesshadcompleted,respec?vegelsampleswereremovedandsubjectedtoCBBandsilverstaining.The stained gels were then subjected to Bio-Rad Gel Doc EZImager(#1708270)foranalysis.
Dataanalysis
Sta?s?cal Analysis System (SAS) was used in this study forsta?s?cal analysis of all the collected data. For analysis ofagronomiccharacteris?csundernormalcondi?on,thecollecteddata were subjected to one-way analysis of variance (ANOVA)and the differences within treatments were analyzed usingTukey’s HSD test at p<5%. For comparison of agronomiccharacteris?cs under normal and drought condi?ons, thecollected datawere subjected to two-way analysis of variance(ANOVA) and the differenceswithin treatmentswere analyzedusingLSDtestatp<5%.Forproteomeanalysis,rela?veintensityof protein bands expressed under normal and drought stresscondi?onswerecompared.Theresultsweresubjectedtopairedsamplet-test.
RESULTSANDDISCUSSION
SoilchemicalproperWesofSilabukansoil
Low total nitrogen (< 0.25%), low available phosphorus (< 20ppm)andmoderatelyhighacidity(pH5.2to6.0)wereobservedin Silabukan soil (Marx et al., 1996), as indicated in Table 1.Similar resultswereobtainedbyLigunjang (2010).Thus, itcanbesuggestedthatSilabukansoilisoflowfer?lityandfer?lizersinputs are necessary for plan?ng ac?vi?es. Acidic nature (pH5.37)ofSilabukansoilmayreducethesolubilityofnutrientsinthesoil,sincemostnutrientsareintheirmostavailablestateatpHbetween6.0and6.5(Brady,1990).
CECofSilabukansoilwasfoundtobe18.3cmolckg-1,
thus itcanbesuggestedthatSilabukansoil ismadeupofclayloams.Triantafilisetal.(2007)reportedthatCECforclayloamswas between 15 to 30 cmolc kg-
1. Silabukan soil which
composed mainly of Ul?sol, is a member of low-ac?vity clay(LAC) soils thatpossesses lowCEC. LowCEC is correlatedwithcomposi?on of the clay mineral and low soil organic carboncontent(Prasetyoetal.,2001).
AgronomiccharacterisWcsundernormalcondiWon
KelopakandTigaBulanvarie?esareofmediumflowering ricevarie?es,withaveragedaysto50%headingof81.4and82daysrespec?vely,whereasBeruangvariety,with106.8days to50%heading is of late flowering species (Mitra and Biswas, 1977).Plant height at harvest, culmheight at harvest, percentage offilled and unfilled grain, grain yield per plant for all threevarie?eswerenotsignificantlydifferent.
Table2.Meancomparisonofagronomiccharacteris?csbetweenselecteddrylandricevarie?esundernormalcondi?ons.
Table3.NumberofdaystoleafrollingofBeruang,KelopakandTigaBulandrylandricevarie?esundertwocyclesofdroughttreatment
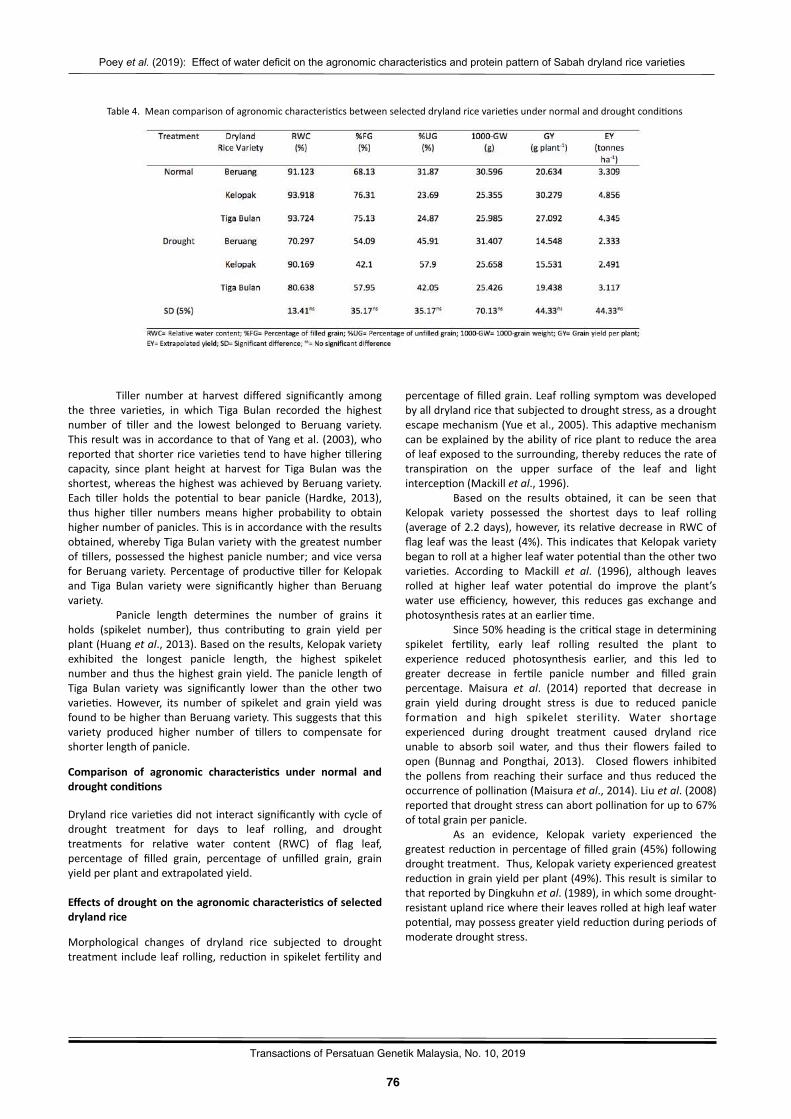
- 76 -
Poey et al. (2019): Effect of water deficit on the agronomic characteristics and protein pattern of Sabah dryland rice varieties
76
17
Transactions of Persatuan Genetik Malaysia, No. 10, 2019
Table4.Meancomparisonofagronomiccharacteris?csbetweenselecteddrylandricevarie?esundernormalanddroughtcondi?ons
Tiller number at harvest differed significantly amongthe three varie?es, in which Tiga Bulan recorded the highestnumber of ?ller and the lowest belonged to Beruang variety.ThisresultwasinaccordancetothatofYangetal.(2003),whoreportedthatshorterricevarie?estendtohavehigher?lleringcapacity, since plant height at harvest for Tiga Bulan was theshortest,whereasthehighestwasachievedbyBeruangvariety.Each ?ller holds the poten?al to bear panicle (Hardke, 2013),thus higher ?ller numbers means higher probability to obtainhighernumberofpanicles.Thisisinaccordancewiththeresultsobtained,wherebyTigaBulanvarietywiththegreatestnumberof?llers,possessedthehighestpaniclenumber;andviceversaforBeruangvariety.Percentageofproduc?ve?ller forKelopakand Tiga Bulan variety were significantly higher than Beruangvariety.
Panicle length determines the number of grains itholds (spikelet number), thus contribu?ng to grain yield perplant(Huangetal.,2013).Basedontheresults,Kelopakvarietyexhibited the longest panicle length, the highest spikeletnumberand thus thehighestgrainyield.Thepanicle lengthofTiga Bulan variety was significantly lower than the other twovarie?es. However, its number of spikelet and grain yield wasfoundtobehigherthanBeruangvariety.Thissuggeststhatthisvariety produced higher number of ?llers to compensate forshorterlengthofpanicle.
Comparison of agronomic characterisWcs under normal anddroughtcondiWons
Drylandricevarie?esdidnot interactsignificantlywithcycleofdrought treatment for days to leaf rolling, and droughttreatments for rela?ve water content (RWC) of flag leaf,percentage of filled grain, percentage of unfilled grain, grainyieldperplantandextrapolatedyield.
EffectsofdroughtontheagronomiccharacterisWcsofselecteddrylandrice
Morphological changes of dryland rice subjected to droughttreatment include leafrolling, reduc?on inspikelet fer?lityand
percentageoffilledgrain.Leafrollingsymptomwasdevelopedbyalldrylandricethatsubjectedtodroughtstress,asadroughtescapemechanism(Yueetal.,2005).Thisadap?vemechanismcanbeexplainedbytheabilityofriceplanttoreducetheareaofleafexposedtothesurrounding,therebyreducestherateoftranspira?on on the upper surface of the leaf and lightintercep?on(Mackilletal.,1996).
Based on the results obtained, it can be seen thatKelopak variety possessed the shortest days to leaf rolling(averageof2.2days),however, itsrela?vedecrease inRWCofflag leafwasthe least (4%).This indicatesthatKelopakvarietybegantorollatahigherleafwaterpoten?althantheothertwovarie?es. According to Mackill et al. (1996), although leavesrolled at higher leaf water poten?al do improve the plant’swater use efficiency, however, this reduces gas exchange andphotosynthesisratesatanearlier?me.
Since50%headingisthecri?calstageindeterminingspikelet fer?lity, early leaf rolling resulted the plant toexperience reduced photosynthesis earlier, and this led togreater decrease in fer?le panicle number and filled grainpercentage. Maisura et al. (2014) reported that decrease ingrain yield during drought stress is due to reduced panicleforma?on and high spikelet sterility. Water shortageexperienced during drought treatment caused dryland riceunable to absorb soil water, and thus their flowers failed toopen (Bunnag and Pongthai, 2013). Closed flowers inhibitedthe pollens from reaching their surface and thus reduced theoccurrenceofpollina?on(Maisuraetal.,2014).Liuetal.(2008)reportedthatdroughtstresscanabortpollina?onforupto67%oftotalgrainperpanicle.
As an evidence, Kelopak variety experienced thegreatestreduc?oninpercentageoffilledgrain(45%)followingdroughttreatment. Thus,Kelopakvarietyexperiencedgreatestreduc?oningrainyieldperplant(49%).ThisresultissimilartothatreportedbyDingkuhnetal.(1989),inwhichsomedrought-resistantuplandricewheretheirleavesrolledathighleafwaterpoten?al,maypossessgreateryieldreduc?onduringperiodsofmoderatedroughtstress.
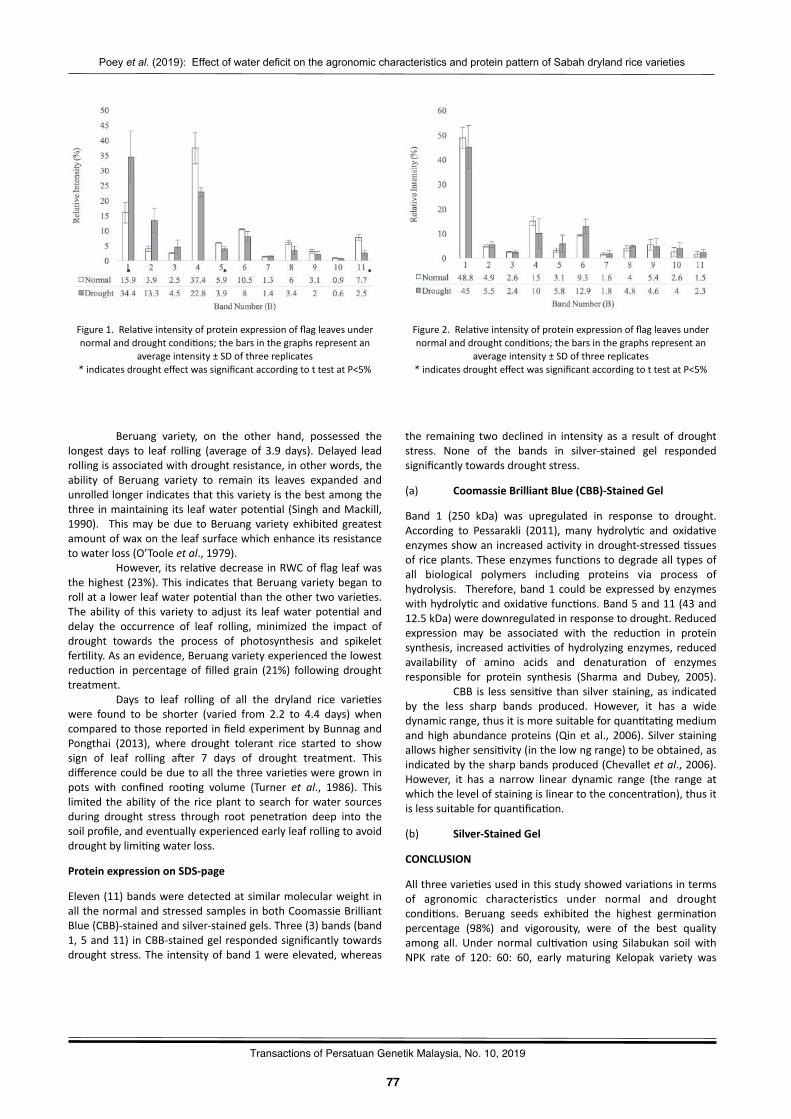
- 77 -
Poey et al. (2019): Effect of water deficit on the agronomic characteristics and protein pattern of Sabah dryland rice varieties
77
17
Transactions of Persatuan Genetik Malaysia, No. 10, 2019
Beruang variety, on the other hand, possessed thelongest days to leaf rolling (average of 3.9 days). Delayed leadrollingisassociatedwithdroughtresistance,inotherwords,theability of Beruang variety to remain its leaves expanded andunrolledlongerindicatesthatthisvarietyisthebestamongthethree inmaintaining its leafwaterpoten?al(SinghandMackill,1990). Thismaybedue toBeruang variety exhibited greatestamountofwaxontheleafsurfacewhichenhanceitsresistancetowaterloss(O’Tooleetal.,1979).
However,itsrela?vedecreaseinRWCofflagleafwasthehighest (23%).This indicatesthatBeruangvarietybegantorollatalowerleafwaterpoten?althantheothertwovarie?es.Theabilityof this variety to adjust its leafwaterpoten?al anddelay the occurrence of leaf rolling, minimized the impact ofdrought towards the process of photosynthesis and spikeletfer?lity.Asanevidence,Beruangvarietyexperiencedthelowestreduc?on inpercentageof filled grain (21%) followingdroughttreatment.
Days to leaf rolling of all the dryland rice varie?eswere found to be shorter (varied from 2.2 to 4.4 days) whencomparedtothosereportedinfieldexperimentbyBunnagandPongthai (2013), where drought tolerant rice started to showsign of leaf rolling a�er 7 days of drought treatment. Thisdifferencecouldbeduetoallthethreevarie?esweregrowninpots with confined roo?ng volume (Turner et al., 1986). Thislimited theabilityof the riceplant to search forwater sourcesduring drought stress through root penetra?on deep into thesoilprofile,andeventuallyexperiencedearlyleafrollingtoavoiddroughtbylimi?ngwaterloss.
ProteinexpressiononSDS-page
Eleven(11)bandsweredetectedatsimilarmolecularweightinallthenormalandstressedsamplesinbothCoomassieBrilliantBlue(CBB)-stainedandsilver-stainedgels.Three(3)bands(band1,5and11) inCBB-stainedgelrespondedsignificantlytowardsdroughtstress.Theintensityofband1wereelevated,whereas
Figure1.Rela?veintensityofproteinexpressionofflagleavesundernormalanddroughtcondi?ons;thebarsinthegraphsrepresentan
averageintensity±SDofthreereplicates*indicatesdroughteffectwassignificantaccordingtottestatP<5%
Figure2.Rela?veintensityofproteinexpressionofflagleavesundernormalanddroughtcondi?ons;thebarsinthegraphsrepresentan
averageintensity±SDofthreereplicates*indicatesdroughteffectwassignificantaccordingtottestatP<5%
the remaining twodeclined in intensity as a result of droughtstress. None of the bands in silver-stained gel respondedsignificantlytowardsdroughtstress.
(a) CoomassieBrilliantBlue(CBB)-StainedGel
Band 1 (250 kDa) was upregulated in response to drought.According to Pessarakli (2011), many hydroly?c and oxida?veenzymesshowanincreasedac?vityindrought-stressed?ssuesofriceplants.Theseenzymesfunc?onstodegradealltypesofall biological polymers including proteins via process ofhydrolysis. Therefore,band1couldbeexpressedbyenzymeswithhydroly?candoxida?vefunc?ons.Band5and11(43and12.5kDa)weredownregulatedinresponsetodrought.Reducedexpression may be associated with the reduc?on in proteinsynthesis, increasedac?vi?esofhydrolyzingenzymes, reducedavailability of amino acids and denatura?on of enzymesresponsible for protein synthesis (Sharma and Dubey, 2005).
CBB is less sensi?ve thansilver staining,as indicatedby the less sharp bands produced. However, it has a widedynamicrange,thusitismoresuitableforquan?ta?ngmediumandhighabundanceproteins (Qinet al., 2006). Silver stainingallowshighersensi?vity(inthelowngrange)tobeobtained,asindicatedbythesharpbandsproduced(Chevalletetal.,2006).However, it has a narrow linear dynamic range (the range atwhichthelevelofstainingislineartotheconcentra?on),thusitislesssuitableforquan?fica?on.
(b) Silver-StainedGel
CONCLUSION
Allthreevarie?esusedinthisstudyshowedvaria?onsintermsof agronomic characteris?cs under normal and droughtcondi?ons. Beruang seeds exhibited the highest germina?onpercentage (98%) and vigorousity, were of the best qualityamong all. Under normal cul?va?on using Silabukan soil withNPK rate of 120: 60: 60, early maturing Kelopak variety was
- 78 -
Poey et al. (2019): Effect of water deficit on the agronomic characteristics and protein pattern of Sabah dryland rice varieties
78
17
Transactions of Persatuan Genetik Malaysia, No. 10, 2019
superior because this variety exhibited the longest paniclelength (21.19 cm), the highest spikelet number (1554.8), thehighestgrainyieldperplant (30.279g),andcontributedtothehighestextrapolatedyieldof4.856tonnesha-1.
Leaf rolling symptoms were exhibited in all threevarie?es subjected to drought stress, as a drought escapemechanism.Droughtstressat50%headingstagereducedgrainyield per plant significantly irrespec?ve of rice varie?es. TigaBulan variety experienced the lowest percentage of yieldreduc?on (28%) and gave the highest grain yield per plant(19.438gplant-1)underdroughtstresscondi?on.
Droughttoleranceisamul?genictrait.Threemechanisms exhibited by Tiga Bulan varietywere found to bedirectly involved in reducingyield lossduringdrought stressat50% heading. Thesemechanisms include produc?on of higher?llernumbertocompensateshorterpanicle length,genera?onof greater amount of wax on the leaf surface to delay leafrolling,aswellasabilitytomaintainhighRWCofflagleafunderdroughtstress.
Droughtstressatgrainfillingstageinducedchangesinthe expression of proteome pawerns of Tiga Bulan’s flag leaf.SDS-PAGEanalysisrevealedthatonebandwasupregulatedandtwo bands were downregulated significantly in response todrought.Theseproteinsmaybeinvolvedindroughtmechanism.Recent trend in climate change have predicted a furtherincrease in drought intensity, therefore efforts to developdroughttolerantvarie?esarevitaltosustainthericeproduc?onworldwide.
Droughtisthemajorlimi?ngfactortoriceproduc?onworldwide, thus rice breeding project on developing varie?escapable of tolera?ng, escaping andor avoiding droughtmeritsfurtherawen?on.Sabahhasawidevarietyofdrylandrice,thussimilarstudycanbeconductedinthefuturewithvarie?esotherthan those selected in this study, to provide their agronomyinforma?on and to iden?fy drought tolerant varie?es. Thisinforma?onabletoassistricefarmersintheselec?onofdrylandricevarie?estobeplantedindrought-proneareas.
Although the changes in protein expressions of TigaBulan’s flag leaf during drought stress can be iden?fied usingSDS-PAGE analysis, however, it is unable to prove the roles oftheseexpressedproteinsindroughttolerancewithoutknowingtheir func?ons. Thus, this research can be con?nued usingprotein frac?ona?on which improves the dynamic range ofanalysis.Furtherresearchcanbeconductedusing2DPAGE(Two-dimensionalPolyacrylamideGelElectrophoresis)analysiswhichallows for higher sensi?vity and bewer resolu?on of proteinvisualiza?on. Mass spectrometry can be used for theiden?fica?onofdroughtresponsiveproteins.
ACKNOWLEDGMENT
The author would like to express his gra?tude to AssociateProfessor Dr. Azwan Awang, Dr. Mohamadu Boyie Jalloh, andAssociate Professor Datuk Hj. Mohd. Dandan @ Ame bin Hj.Alidin for their supervision, guidance and support to thisresearch. Special thanks to all the staffs and workmates fromFaculty of Sustainable Agriculture, Universi? Malaysia Sabahwhohadassisteddirectlyandindirectlyinthestudyaswell.
REFERENCES
Brady,N.C.(1990).TheNatureandProper?esofSoils.NewYork,USA:MacmillanPublishingCompany.
Breda,A.,Valadares,N.F.,Souza,O.N.andGarraJ,C.(2007).ChapterA06 Protein structure, modelling and applica?ons. Bioinforma?cs inTropical Disease Research: A Prac?cal and Case-study Approach[Internet].Na?onalCenterforBiotechnologyInforma?on(US).
Bunnag, S. andPongthai, P. (2013). Selec?onof rice (Oryza saGva L.)cul?vars tolerant todrought stress at the vegeta?ve stageunderfieldcondi?ons.AmericanJournalofPlantSciences.4:1701-1708.
Chevallet, M., Luche, S. and Rabilloud, T. (2006). Silver staining ofproteinsinpolyacrylamidegels.NatProtocol.1(4):1852-1858.
Ding,X.,Li,X.andXiong,L. (2013). Insight intoDifferen?alResponsesofUplandandPaddyRicetoDroughtStressbyCompara?veExpressionProfiling Analysis. Interna?onal Journal of Molecular Science. 14(3):5214-5238.
Dingkuhn,M.,Cruz,R.T.,O’Toole,J.C.andDoerffling,K. (1989).Netphotosynthesis, water use efficiency, leaf water poten?al and leafrolling as affected by water deficit in tropical upland rice. AustraliaJournalofAgricultureResources.40(6):1171-1191.
DOA (Department of Agriculture) Peninsular Malaysia. (2014). RiceSta?s?cs of Malaysia - 2013. Department of Agriculture, PeninsularMalaysia.
Graves,P.R.andHaystead,T.A. J. (2002).Molecularbiologist’sguideto proteomics. Microbiology and Molecular Biology Reviews. 66(1):39-63.
Hanafi,M.M.,HarWnie,A.,Shukor, J.andMahmud,T.M.M. (2009).Upland rice varie?es inMalaysia:Agronomyand soil physico-chemicalcharacteris?cs.PertanikaJournalofTropicalAgriculturalScience.32(2):225-246.
Hardke, J. T. (2013). Arkansas Rice Produc?on Handbook – MP192.Arkansas:UniversityofArkansasDivisionofAgriculture.
He, H. and Serraj, R. (2012). Involvement of peduncle elonga?on,anther dehiscence and spikelet sterility in upland rice response toreproduc?ve stage-drought stress. Environmental and ExperimentalBotany.75:120-127.
Huang,C.,Yang,W.,Duan,L.,Jiang,N.,Chen,G.,Xiong,L.andLiu,Q.(2013). Rice panicle length measuring system based on dual-cameraimaging. Journal of Computers and Electronics in Agriculture. 98:158-165.
Intergovernmental Panel on Climate Change (IPCC). (2014). ClimateChange 2014: Impacts, Adapta?on, and Vulnerability. Contribu?on ofWorking Group II to the Fi�h Assessment Report of theIntergovernmental Panel on Climate Change. Cambridge UniversityPress,Cambridge,UK.
ISRIC (InternaWonal Soil Reference and InformaWon Centre). (2015).Acrosils(AC). RetrievedonMarch27,2015,fromhwp://www.isric.org/sites/default/files/major_soils_of_the_world/set6/ac/acrisol.pdf
- 79 -
Poey et al. (2019): Effect of water deficit on the agronomic characteristics and protein pattern of Sabah dryland rice varieties
79
17
Transactions of Persatuan Genetik Malaysia, No. 10, 2019
Komatsu, S. and Tanaka, N. (2005). Rice proteome analysis: A stepforwardfunc?onalanalysisofthericegenome.Proteomics.5:938-949.
Kumar,R.,Venuprasad,R. andAtlin,G.N. (2007).Gene?c analysis ofrainfed lowland ricedrought toleranceundernaturally-occurring stressineasternIndia:HeritabilityandQTLeffects.FieldCropsResearch.103:42-42.
Ligunjang, C. (2010). Spa?al variability of soil pH, exchangeablepotassium, calcium and magnesium of a selected area at Universi?Malaysia Sabah campus in Sandakan. BachelorofAgricultural ScienceDisserta?on.Universi?MalaysiaSabah.
Liu, K., Ye, Y., Tang, C., Wang, Z. and Yang, J. (2008). Responses ofethyleneandACCinrice grains to soil moisture and theirrela?onstograinfilling.Fron?ersofAgriculturein C h i n a . 2 :172-180.
Mackill,D.J.,Coffman,W.R.andGarrity,D.P.(1996).RainfedLowlandRiceImprovement. Manila, Philippines: Interna?onal Rice ResearchIns?tute.
Maisura,Muhamad,A.C.,Iskandar,L.,Ahmad,J.andEhara,H.(2014).Somephysiological character responses of rice under droughtcondi?onsinaricesystem.JournalofInterna?onalSocietyforSoutheastAsianAgriculturalSciences.20(1):104-114.
Marx, E. S.,Hart, J. and Stevens,R.G. (1996). Soil Test Interpreta?onGuide.OregonStateUniversityExtensionService.
Mitra,D. andBiswas, S. (1977).Variability inheadingdura?onamongaus rice varie?es in West Bengal, India. Interna?onal Rice ResearchNotes.2(5):5.
Muthayya, S., Sugimoto, J. D, Montgomery, S. and Maberly, G. F.(2014). An overview of global rice produc?on, supply, trade, andconsump?on.AnnalsoftheNewYorkAcademyofSciences.1324:7-14.
O’Toole, J.C.,Cruz,R.T.andSeiber, J.N. (1979).Epicu?cularwaxandcu?cularresistanceinrice.PhysiologyPlant.47:239-244.
Panagos, P., Jones, A., Bosco, C. and Senthil Kumar, P. S. (2011).Europeandigital archiveon soilmaps (EuDASM): Preserving importantsoil data for public free access. Interna?onal Journal of Digital Earth.4(5):434-443.
Pask,A.J.D.,Pietragalla,J.,Mullan,D.M.andReynolds,M.P.(Eds.).(2011).Physiological BreedingII:AFieldGuidetoWheatPhenotyping.Mexico,D.F.:CIMMYT.
Pessarakli,M.(2011).HandbookofPlantandCropStress,ThirdEdi?on.USA:CRCPress.
Prasetyo, B. H., Suharta, N., Subagyo, H. and Hikmatullah. (2001).Chemicalandmineralogical proper?esoful?solsofSasambaarea,eastKalimantan.IndonesianJournalofAgriculturalScience.2(2):37-47.
Qin,H.,Liu,T.,Liu,B.,Song,X.,Huang,X.,Yang,J.L.,Zhao,X.andWei,Y.Q. (2006).Comparisonbetweenproteindetec?onmethodsfortwo-dimensional gel electrophoresis. Zhongguo Shi YanXueYeXue Za Zhi.14(1):168-172.
Salekdeh,G.H.,Siopongco,J.,Wade,L.J.,Ghareyazie,B.andBenneJ,J. (2002). Proteomic analysis of rice leaves during drought stress andrecovery.Proteomics.2:1131-1145.
Sharma,Y.K.andDubey,R.S.(2005).Droughtinducesoxida?vestressand enhances the ac?vi?es of an?oxidant enzymes in growing riceseedlings.PlantGrowthRegula?on.46:209-221.
Siambun,M.M. (2003). Yield poten?al of aroma?c local dryland ricecul?vars.SabahAgriculturalResearchJournal.1:1-10.
Simon,J.B.(2014).2014ElNino:Willitorwillitnothappen.MalaysiaMetrologicalDepartment.
Singh, B. N. and Mackill, D. J. (1991). Gene?cs of leaf rolling underdrought stress.RiceGene?cs II.Manila, Philippines: Interna?onalRiceResearchIns?tute.
Triantafilis, J.,Bishop,T.,Buchanan,S.,Subasinghe,R.,Ahmed,M.F.and Huang, J. (2007). Ca?on exchange capacity (CEC). University ofNewSouthWales.
Turner,N.C.,O’Toole, J.C.,Cruz,R.T.,Namuco,O.S.andAhmad,S.(1986).Responsesofsevendiversericecul?varstowaterdeficits.FieldCropsResearch.13:257-271.
Wang, J., Huang, J. and Yan, T. (2013). Impacts of climate change onwater and agricultural produc?on in ten large river basins in China.JournalofIntegra?veAgriculture.12:1267-1278.
Yang, H., Yu, J., Ramachandran, S. and Pan, S. (2003). A Holis?cApproach to Rice Research and Gene?c Engineering. Rice Genomics-Vol.I.Singapore:WorldScien?ficPublishingCo.Pte.Ltd.
Yue,B.,Xue,W.,Xiong,L.,Yu,X.,Luo,L.,Cui,K.,Jin,D.,Xing,Y.andZhang,Q.(2005).Gene?cbasisofdroughtresistanceatreproduc?vestageinrice:Separa?onofdroughttolerancefromdroughtavoidance.Gene?cs.172:1213-1228.

- 80 -Transactions of Persatuan Genetik Malaysia, No. 10, 2019
80
- 81 -
Corresponding author:
Transactions of Persatuan Genetik Malaysia, No. 10, 2019 Published by Genetics Society of Malaysia http://www.pgm-my.org
67
81
Relationship between hybrid performance and genetic distance, specific combining ability and heterosis among parental inbred lines in forage corn
GhizanSaleh1,MaizuraAbuSin1,andPedramKashiani21 Department of Crop Science, Faculty of Agriculture, Universiti Putra Malaysia, 43400 Serdang, Selangor, Malaysia2 Department of Agriculture Science, Faculty of Technical and Vocational Education, Universiti Pendidikan Sultan Idris, 35900 Tanjong Malim, Perak, Malaysia
Abstract
Selec?onofsuitableparentallinesforhybridvarietydevelopmentusingresultsofgene?cdistanceanalysishasbeenestablishedandeffec?velyusedinmanycrops.Gene?cdistancesamongparentalcorninbredlinesbasedonsimplesequencerepeat(SSR)markerswereusedtoes?matethemagnitudeofbiomassyieldtraitsincrossesamongthem.Sixselectedmaizeinbredlineswerecrossedinahalf-diallelmannertoproduce15singlecrossF1hybrids.Biomassyieldtraits(freshplantyield,freshleafyield,freshstemyieldand
freshear yield)of thehybridswereevaluatedalongwith theirparents ina randomizedcompleteblockdesign (RCBD)with threereplica?ons,intwoenvironments(Field10andField15,Universi?PutraMalaysia).Combiningabilityanalysisrevealedthatspecificcombiningability(SCA)effectsweresignificantforallbiomassyieldtraitsinbothenvironmentsseparatelyandwhenenvironmentswere pooled. Compared with the average value of the parents for fresh plant yield (25 388 kg/ha), the 15 hybrids showed asignificant(p<0.01)yieldadvantageacrossenvironments,withanaverageof151.9%mid-parentheterosis(MPH)whendatafromtheenvironments were pooled. Highly significant posi?ve correla?ons were observed between specific combining ability (SCA) andhybridperformanceperseforfreshplantyieldinField10,Field15andenvironmentspooled(0.946,0.900and0.796,respec?vely),while posi?ve significant correla?ons (p<0.05) were observed between gene?c distance andMPH in Field 10 and environmentspooled (-0.546and -0.537, respec?vely).Hence, thefindings revealedaweakassocia?onbetweengene?cdistanceandF1hybridperformance,althoughSCAremainedtobeanimportantfactorinthedetermina?onofheterosisandhybridperformanceperse.
Ghizan Saleh, Department of Crop Science, Faculty of Agriculture, Universiti Putra Malaysia, 43400 Serdang, Selangor, MalaysiaEmail: [email protected]
Keywords:Combiningability,heterosis,gene?cdistance,inbredlines,foragecorn
Line
LastKey
Intro
INTRODUCTION
Gene?c improvement for hybrid corn involves selec?on ofpoten?al inbred lines as parents, evalua?on of the hybridprogenies and selec?on of the best hybrids for the traitsinvolved inabreedingprogram.Selected inbred lines couldbetested for their combining ability to es?mate ability of theinbred lines to inherit good genes based on performance oftheirprogenies. According toGuerreroetal. (2014),heterosisexhibitedinthecrossesalsodependsonthegene?cdiversityoftheparents. Thehetero?c responseof thehybrids also largelydepends on the breeding value of the parents and theenvironmental condi?ons under which the hybrids are grown(HallauerandMiranda,1988;YoungandVirmani,1990;Abualiet al., 2012). Based on a study by Guerrero et al. (2014), aposi?ve mid parent heterosis (MPH) was exhibited for freshforage yield, with es?mates ranging from 8.0 to 21.5%, allexceeding theaverageparental yield in the15crossesu?lized.Hybridvigourcanbepredictedbytheuseofmoleculartoolstoobtain maximum efficiency in hybrid breeding programs by
producing promising hybrids. Many studies have u?lizedmolecular markers to predict correla?ons between gene?cdistance of the parental inbred lines and the hybridperformanceintropicalaswellastemperatemaizelines(Lanzaet al., 1997; Melchinger, 1999; Benchimol et al., 2000).Althoughmany inves?gatorshavereportedheterosisandgeneac?on for quan?ta?ve characters in corn, reports on gene?ccontrol for yield traits on forage corn are limited. Produc?onand improvement of forage corn is needed in the country tou?lize this poten?al crop as an alterna?ve source of feed forruminants.Thus,clearbreedinggoalsarenecessarytodevelophybrid varie?es for feed produc?on. Hybrid varie?es shouldacquire superior performance for the relevant forage traits,besides being vigorous, having synchronized and uniformflowering,andtoleranttopestsanddiseases.
MATERIALSANDMETHODS
Sixinbredlinesfromdifferenthetero?cgroupsaswellasthosethat had contras?ng characters for forage traitswere selected
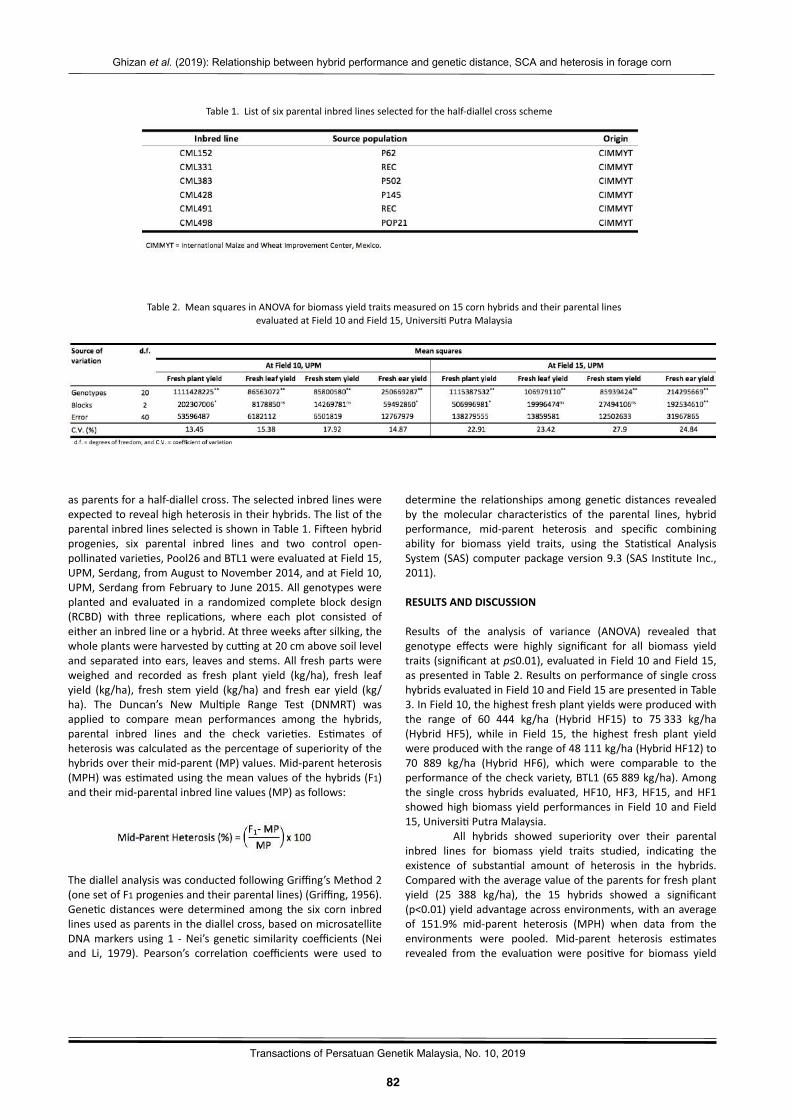
- 82 -
Ghizan et al. (2019): Relationship between hybrid performance and genetic distance, SCA and heterosis in forage corn
82
18
Transactions of Persatuan Genetik Malaysia, No. 10, 2019
asparentsforahalf-diallelcross.Theselectedinbredlineswereexpectedtorevealhighheterosisintheirhybrids.ThelistoftheparentalinbredlinesselectedisshowninTable1.Fi�eenhybridprogenies, six parental inbred lines and two control open-pollinatedvarie?es,Pool26andBTL1wereevaluatedatField15,UPM,Serdang,fromAugusttoNovember2014,andatField10,UPM,SerdangfromFebruarytoJune2015.Allgenotypeswereplanted and evaluated in a randomized complete block design(RCBD) with three replica?ons, where each plot consisted ofeitheraninbredlineorahybrid.Atthreeweeksa�ersilking,thewholeplantswereharvestedbycucngat20cmabovesoillevelandseparated intoears, leavesandstems.All freshpartswereweighed and recorded as fresh plant yield (kg/ha), fresh leafyield (kg/ha), fresh stem yield (kg/ha) and fresh ear yield (kg/ha). The Duncan’s New Mul?ple Range Test (DNMRT) wasapplied to compare mean performances among the hybrids,parental inbred lines and the check varie?es. Es?mates ofheterosiswascalculatedasthepercentageofsuperiorityofthehybridsovertheirmid-parent(MP)values.Mid-parentheterosis(MPH)wases?matedusingthemeanvaluesofthehybrids(F1)andtheirmid-parentalinbredlinevalues(MP)asfollows:
ThediallelanalysiswasconductedfollowingGriffing’sMethod2(onesetofF1progeniesandtheirparentallines)(Griffing,1956).Gene?cdistanceswere determined among the six corn inbredlinesusedasparentsinthediallelcross,basedonmicrosatelliteDNAmarkers using 1 -Nei’s gene?c similarity coefficients (Neiand Li, 1979). Pearson’s correla?on coefficients were used to
Table1.Listofsixparentalinbredlinesselectedforthehalf-diallelcrossscheme
determine the rela?onships among gene?c distances revealedby the molecular characteris?cs of the parental lines, hybridperformance, mid-parent heterosis and specific combiningability for biomass yield traits, using the Sta?s?cal AnalysisSystem(SAS)computerpackageversion9.3 (SAS Ins?tute Inc.,2011).
RESULTSANDDISCUSSION
Results of the analysis of variance (ANOVA) revealed thatgenotype effects were highly significant for all biomass yieldtraits(significantatp≤0.01),evaluatedinField10andField15,aspresentedinTable2.ResultsonperformanceofsinglecrosshybridsevaluatedinField10andField15arepresentedinTable3.InField10,thehighestfreshplantyieldswereproducedwiththe range of 60 444 kg/ha (Hybrid HF15) to 75333 kg/ha(Hybrid HF5), while in Field 15, the highest fresh plant yieldwereproducedwiththerangeof48111kg/ha(HybridHF12)to70 889 kg/ha (Hybrid HF6), which were comparable to theperformanceofthecheckvariety,BTL1(65889kg/ha).Amongthe single cross hybrids evaluated, HF10, HF3, HF15, and HF1showedhighbiomassyieldperformances inField10andField15,Universi?PutraMalaysia.
All hybrids showed superiority over their parentalinbred lines for biomass yield traits studied, indica?ng theexistence of substan?al amount of heterosis in the hybrids.Comparedwiththeaveragevalueoftheparentsforfreshplantyield (25 388 kg/ha), the 15 hybrids showed a significant(p<0.01)yieldadvantageacrossenvironments,withanaverageof 151.9% mid-parent heterosis (MPH) when data from theenvironments were pooled. Mid-parent heterosis es?matesrevealed from the evalua?on were posi?ve for biomass yield
Table2.MeansquaresinANOVAforbiomassyieldtraitsmeasuredon15cornhybridsandtheirparentallinesevaluatedatField10andField15,Universi?PutraMalaysia
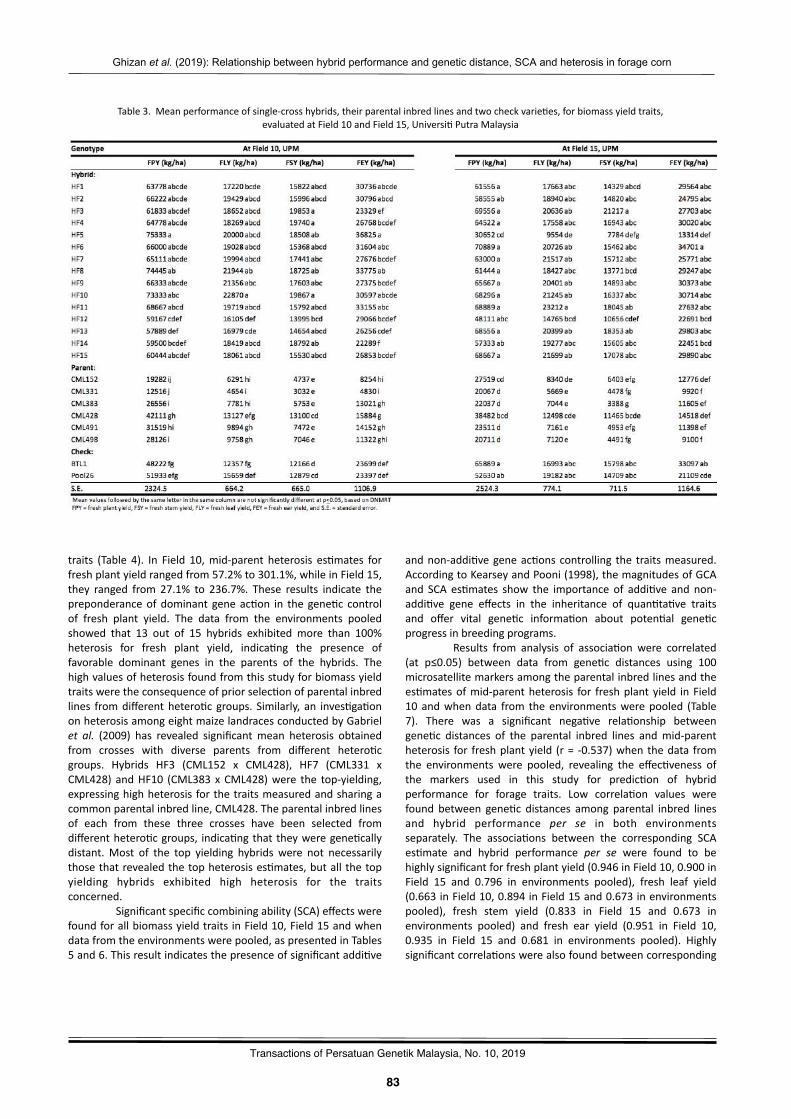
- 83 -
Ghizan et al. (2019): Relationship between hybrid performance and genetic distance, SCA and heterosis in forage corn
83
18
Transactions of Persatuan Genetik Malaysia, No. 10, 2019
Table3.Meanperformanceofsingle-crosshybrids,theirparentalinbredlinesandtwocheckvarie?es,forbiomassyieldtraits,evaluatedatField10andField15,Universi?PutraMalaysia
traits (Table 4). In Field 10,mid-parent heterosis es?mates forfreshplantyieldrangedfrom57.2%to301.1%,whileinField15,they ranged from 27.1% to 236.7%. These results indicate thepreponderanceofdominant geneac?on in the gene?c controlof fresh plant yield. The data from the environments pooledshowed that 13 out of 15 hybrids exhibited more than 100%heterosis for fresh plant yield, indica?ng the presence offavorable dominant genes in the parents of the hybrids. Thehighvaluesofheterosisfoundfromthisstudyforbiomassyieldtraitsweretheconsequenceofpriorselec?onofparentalinbredlines fromdifferenthetero?cgroups. Similarly, an inves?ga?ononheterosisamongeightmaizelandracesconductedbyGabrielet al. (2009) has revealed significantmean heterosis obtainedfrom crosses with diverse parents from different hetero?cgroups. Hybrids HF3 (CML152 x CML428), HF7 (CML331 xCML428) andHF10 (CML383 xCML428)were the top-yielding,expressinghighheterosisforthetraitsmeasuredandsharingacommonparentalinbredline,CML428.Theparentalinbredlinesof each from these three crosses have been selected fromdifferenthetero?cgroups, indica?ngthattheyweregene?callydistant.Most of the top yielding hybrids were not necessarilythosethatrevealedthetopheterosises?mates,butallthetopyielding hybrids exhibited high heterosis for the traitsconcerned.
Significantspecificcombiningability(SCA)effectswerefoundforallbiomassyieldtraits inField10,Field15andwhendatafromtheenvironmentswerepooled,aspresentedinTables5and6.Thisresultindicatesthepresenceofsignificantaddi?ve
andnon-addi?vegeneac?onscontrolling the traitsmeasured.AccordingtoKearseyandPooni(1998),themagnitudesofGCAand SCA es?mates show the importance of addi?ve and non-addi?ve gene effects in the inheritance of quan?ta?ve traitsand offer vital gene?c informa?on about poten?al gene?cprogressinbreedingprograms.
Results from analysis of associa?on were correlated(at p≤0.05) between data from gene?c distances using 100microsatellitemarkersamongtheparentalinbredlinesandthees?matesofmid-parentheterosis for freshplantyield inField10 andwhendata from theenvironmentswerepooled (Table7). There was a significant nega?ve rela?onship betweengene?c distances of the parental inbred lines andmid-parentheterosis for freshplantyield (r= -0.537)whenthedata fromthe environments were pooled, revealing the effec?veness ofthe markers used in this study for predic?on of hybridperformance for forage traits. Low correla?on values werefound between gene?c distances among parental inbred linesand hybrid performance per se in both environmentsseparately. The associa?ons between the corresponding SCAes?mate and hybrid performance per se were found to behighlysignificantforfreshplantyield(0.946inField10,0.900inField 15 and 0.796 in environments pooled), fresh leaf yield(0.663inField10,0.894inField15and0.673inenvironmentspooled), fresh stem yield (0.833 in Field 15 and 0.673 inenvironments pooled) and fresh ear yield (0.951 in Field 10,0.935 in Field 15 and 0.681 in environments pooled). Highlysignificantcorrela?onswerealsofoundbetweencorresponding
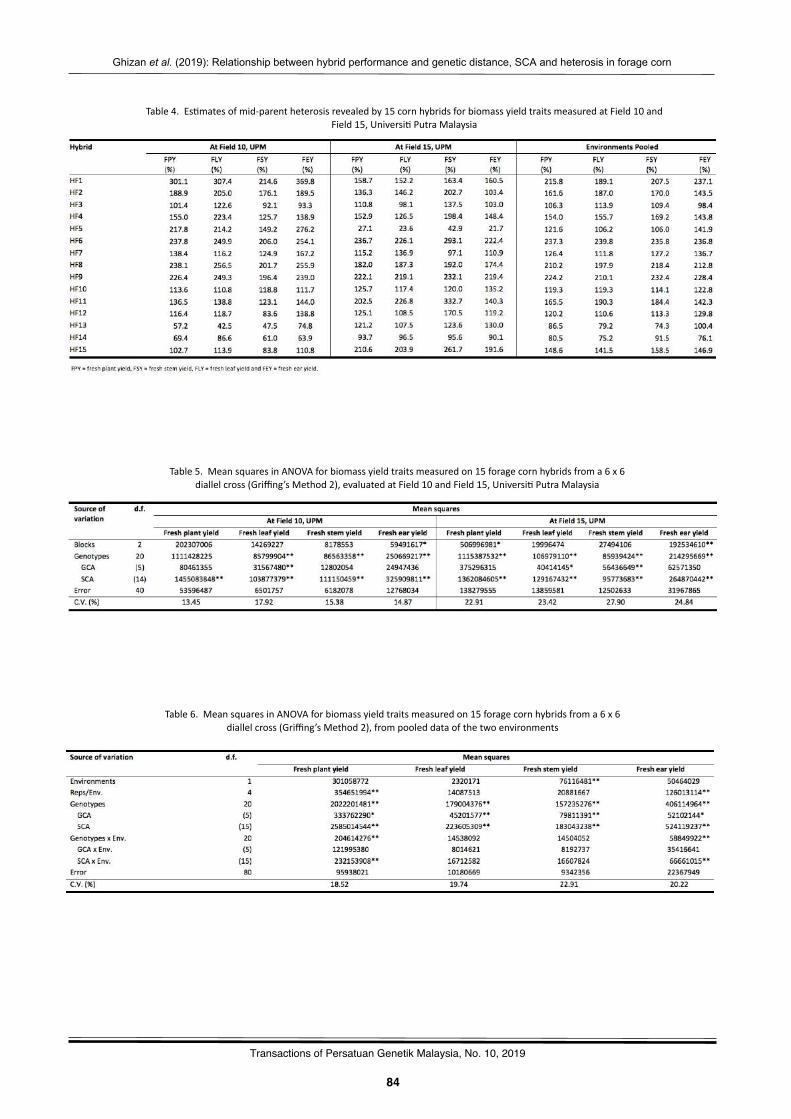
- 84 -
Ghizan et al. (2019): Relationship between hybrid performance and genetic distance, SCA and heterosis in forage corn
84
18
Transactions of Persatuan Genetik Malaysia, No. 10, 2019
Table4.Es?matesofmid-parentheterosisrevealedby15cornhybridsforbiomassyieldtraitsmeasuredatField10andField15,Universi?PutraMalaysia
Table5.MeansquaresinANOVAforbiomassyieldtraitsmeasuredon15foragecornhybridsfroma6x6diallelcross(Griffing’sMethod2),evaluatedatField10andField15,Universi?PutraMalaysia
Table6.MeansquaresinANOVAforbiomassyieldtraitsmeasuredon15foragecornhybridsfroma6x6diallelcross(Griffing’sMethod2),frompooleddataofthetwoenvironments
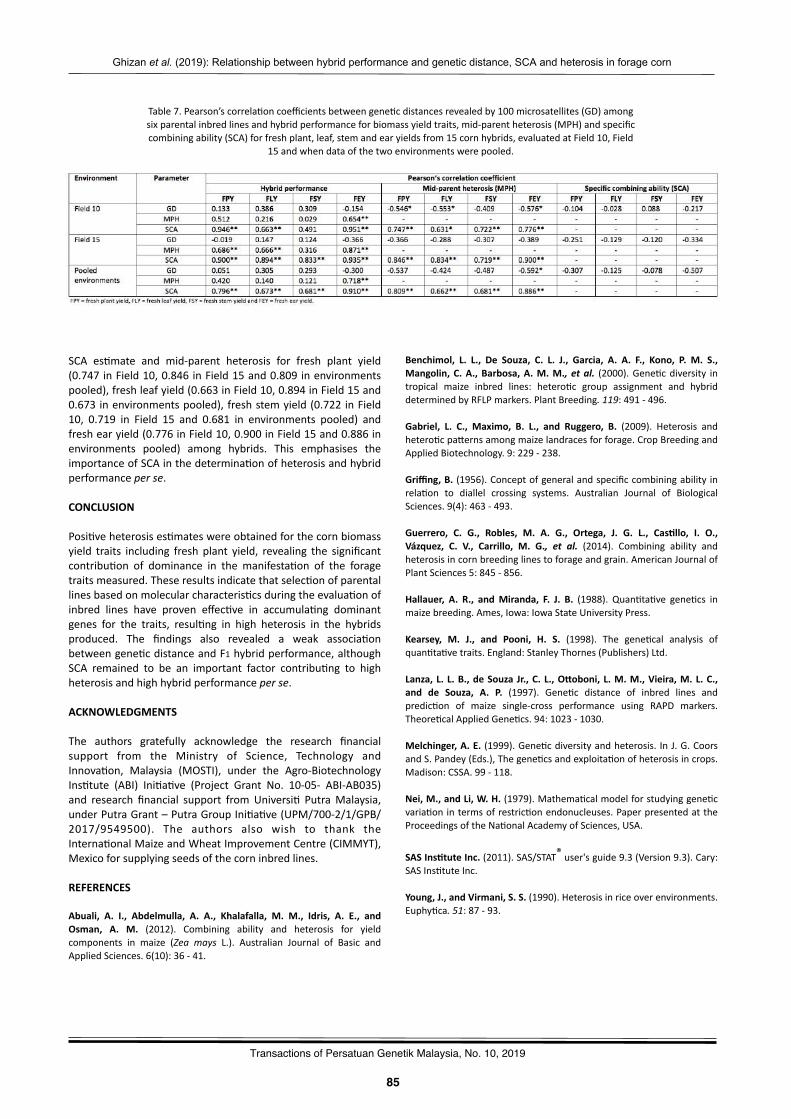
- 85 -
Ghizan et al. (2019): Relationship between hybrid performance and genetic distance, SCA and heterosis in forage corn
85
18
Transactions of Persatuan Genetik Malaysia, No. 10, 2019
SCA es?mate and mid-parent heterosis for fresh plant yield(0.747inField10,0.846inField15and0.809inenvironmentspooled),freshleafyield(0.663inField10,0.894inField15and0.673inenvironmentspooled),freshstemyield(0.722inField10, 0.719 in Field 15 and 0.681 in environments pooled) andfreshearyield(0.776inField10,0.900inField15and0.886inenvironments pooled) among hybrids. This emphasises theimportanceofSCAinthedetermina?onofheterosisandhybridperformanceperse.
CONCLUSION
Posi?veheterosises?mateswereobtainedforthecornbiomassyield traits including fresh plant yield, revealing the significantcontribu?on of dominance in the manifesta?on of the foragetraitsmeasured.Theseresultsindicatethatselec?onofparentallinesbasedonmolecularcharacteris?csduringtheevalua?onofinbred lines have proven effec?ve in accumula?ng dominantgenes for the traits, resul?ng in high heterosis in the hybridsproduced. The findings also revealed a weak associa?onbetweengene?cdistanceandF1hybridperformance,althoughSCA remained to be an important factor contribu?ng to highheterosisandhighhybridperformanceperse.
ACKNOWLEDGMENTS
The authors gratefully acknowledge the research financialsupport from the Ministry of Science, Technology andInnova?on, Malaysia (MOSTI), under the Agro-BiotechnologyIns?tute (ABI) Ini?a?ve (Project Grant No. 10-05- ABI-AB035)and research financial support fromUniversi? PutraMalaysia,underPutraGrant–PutraGroupIni?a?ve(UPM/700-2/1/GPB/2017/9549500). The authors also wish to thank theInterna?onalMaizeandWheatImprovementCentre(CIMMYT),Mexicoforsupplyingseedsofthecorninbredlines.
REFERENCES
Abuali, A. I., Abdelmulla, A. A., Khalafalla, M. M., Idris, A. E., andOsman, A. M. (2012). Combining ability and heterosis for yieldcomponents in maize (Zea mays L.). Australian Journal of Basic andAppliedSciences.6(10):36-41.
Benchimol, L. L., De Souza, C. L. J., Garcia, A. A. F., Kono, P. M. S.,Mangolin,C.A.,Barbosa,A.M.M., etal. (2000).Gene?cdiversity intropical maize inbred lines: hetero?c group assignment and hybriddeterminedbyRFLPmarkers.PlantBreeding.119:491-496.
Gabriel, L. C., Maximo, B. L., and Ruggero, B. (2009). Heterosis andhetero?cpawernsamongmaizelandracesforforage.CropBreedingandAppliedBiotechnology.9:229-238.
Griffing,B. (1956).Conceptofgeneralandspecificcombiningability inrela?on to diallel crossing systems. Australian Journal of BiologicalSciences.9(4):463-493.
Guerrero, C. G., Robles, M. A. G., Ortega, J. G. L., CasWllo, I. O.,Vázquez, C. V., Carrillo, M. G., et al. (2014). Combining ability andheterosisincornbreedinglinestoforageandgrain.AmericanJournalofPlantSciences5:845-856.
Hallauer, A. R., andMiranda, F. J. B. (1988). Quan?ta?ve gene?cs inmaizebreeding.Ames,Iowa:IowaStateUniversityPress.
Kearsey, M. J., and Pooni, H. S. (1998). The gene?cal analysis ofquan?ta?vetraits.England:StanleyThornes(Publishers)Ltd.
Lanza,L.L.B.,deSouzaJr.,C.L.,OJoboni,L.M.M.,Vieira,M.L.C.,and de Souza, A. P. (1997). Gene?c distance of inbred lines andpredic?on of maize single-cross performance using RAPD markers.Theore?calAppliedGene?cs.94:1023-1030.
Melchinger,A.E. (1999).Gene?cdiversityandheterosis. InJ.G.CoorsandS.Pandey(Eds.),Thegene?csandexploita?onofheterosisincrops.Madison:CSSA.99-118.
Nei,M.,andLi,W.H.(1979).Mathema?calmodelforstudyinggene?cvaria?onintermsofrestric?onendonucleuses.PaperpresentedattheProceedingsoftheNa?onalAcademyofSciences,USA.
SASInsWtuteInc.(2011).SAS/STAT®user'sguide9.3(Version9.3).Cary:SASIns?tuteInc.
Young,J.,andVirmani,S.S.(1990).Heterosisinriceoverenvironments.Euphy?ca.51:87-93.
Table7.Pearson’scorrela?oncoefficientsbetweengene?cdistancesrevealedby100microsatellites(GD)amongsixparentalinbredlinesandhybridperformanceforbiomassyieldtraits,mid-parentheterosis(MPH)andspecificcombiningability(SCA)forfreshplant,leaf,stemandearyieldsfrom15cornhybrids,evaluatedatField10,Field
15andwhendataofthetwoenvironmentswerepooled.

- 86 -Transactions of Persatuan Genetik Malaysia, No. 10, 2019
86
- 87 -
Corresponding author:
Transactions of Persatuan Genetik Malaysia, No. 10, 2019 Published by Genetics Society of Malaysia http://www.pgm-my.org
73
87
Genetic parameters estimation and selection of Pisum sativum accessions in lowland
DarmawanSaptadi1,MayangAyudyaHandini2,NurulHikmah2,andBudiWaluyo1
1 Faculty of Agriculture, Universitas Brawijaya, Indonesia2 Undergraduate Program, Faculty of Agriculture, Universitas Brawijaya, Indonesia
Abstract
PeasareclassifiedintheFabaceaefamilywhichhashigheconomicvalue.InIndonesia,peasareonlydevelopedinthehighlands.Effortstoexpandthecul?va?onareaneedtobedonetoincreaseproduc?oncapacity.Breedingneedstobedonetogetthepeagenotypethatadaptstothelowlands.Successfulselec?onrequiresinforma?onaboutgene?cparameterssuchasgene?cvariabilityandheritability.Thisresearchwasconductedtoes?matethevalueofsomegene?cparametersandtoobtaingenotypesthathavehighyieldpoten?alinthelowlands.82accessionsofpeasorigina?ngfromseveralareasinIndonesiawereplantedinexperimentsthatfollowedaugmenteddesigntogetherwiththreecompara?vegenotypes.Basedonthecharacterofdrypodweightperplantanddryseedweightperplant,3accessionswereselectednamely03(16)(2)-1,Batu-1-1andBatu-2.
Budi Waluyo, Faculty of Agriculture, Universitas Brawijaya, IndonesiaEmail: [email protected]
Keywords:Gene?cvariability,heritability,lowland,adapta?on
Line
LastKey
IntroINTRODUCTION
Pea (P. saGvum L.) is a leguminous plant that has quite higheconomicvalueandgoodasa foodsourcebecause ithashighnutri?onal value (Dahletal., 2012). The seeds contain22-25%protein, complexcarbohydrates,andfibercontent,avarietyofvitamins, minerals, and phytochemicals which valuable forhumanfoodandanimalfeed.Thedriedpodsrankthirdforthemost developed bean species in theworld (Poblacioneset al.,2013;Smýkaletal.,2012).
Pea is a winter plant (cool-season), so it will growop?mallyinlow-temperatureareas.InIndonesia,apeacanonlybegrowninthehighlands,soit’sincreasingdemandcannotbeaccompaniedby theavailabilityofpeasbecauseof the limitedarea.
Pea breeding is directed to get high yielding andadap?vevarie?es in lowlandareas through selec?onac?vi?es.The effec?veness of selec?on for character improvement isdetermined by gene?c diversity and heritability value(Handayani andHidayat, 2012; Jameelaet al., 2014). Selec?onac?vi?eswillbeeffec?veifthevalueofgene?cprogressishighwhich is supported by a high value of gene?c diversity andheritability (Herawa?etal.,2009).Thepurposeof thisstudy isto es?mate the diversity and heritability of character of 82accessionsofpeainlowlandareasanddeterminethepoten?alofpeagenotypesdevelopedinthelowlands.
MATERIALANDMETHODS
Eighty-twopeaaccessionswereplantedintheAgroTechnoParkgreenhouse,UniversitasBrawijaya,intherainyseasonof2019.Theresearchloca?onwasatanal?tudeof±400masl.withaminimumtemperatureof24ºCandamaximumtemperatureof31ºC.Gene?cmaterialispeaaccessionsobtainedfromvariousplaces in Indonesia. The plants were planted with standardcul?va?on procedures following an augmented design withthree compara?ve genotypes.Observa?onsweremade on 32quan?ta?veand22qualita?vecharactersbasedontheNa?onalDra� Descriptor Guidelines for the Conduct of Test forDis?nctness,Uniformity,andStabilityofPea(PisumsaGvumL.)(UPOV,2006).
Quan?ta?ve data were analyzed using analysis ofvariance (ANOVA) for augmented design (Sharma, 2006). Iftherearerealdifferences,theleastsignificantincrease(LSI)testisperformedtodeterminewhichgenotypeshavebewerresults
- 88 -
Darmawan et al. (2019): Genetic parameters estimation and selection of Pisum sativum accessions in lowland
88
19
Transactions of Persatuan Genetik Malaysia, No. 10, 2019
Es?ma?on of gene?c and phenotype variance components iscalculatedbytheformula:
Gene?c Coefficient Variance (GCV) and Gene?c CoefficientVariance (PCV)ofeachcharacteraredeterminedbasedon theequa?onofSinghandChaudhary(1979),asfollows:
CriteriaofGCVandPCVbasedonSinghdanChaudhary (1979)are:low(GCVandPCV<10%),moderate(10%≤GCVandPCV≤25%)andhigh(GCVandPCV>25%).
Es?ma?on of broad-sense heritability value was conductedbased on the separa?on of variance components usingequa?onsbyAcquaah,(2012):
Criteriaofheritabilityvalue:
RESULTANDDISCUSSION
The result of the ANOVA showed differences among peaaccessions in some characters. These show that variabilityoccursineachcharacteriscausedbytheeffectofthegenotypicfactor.
GeneWcandphenotypevariability
Variability of 82 pea genotype characters observed from thevariabilityofquan?ta?ve charactersandqualita?ve characters.Thevariabilityofquan?ta?vecharacters isdeterminedthroughthe GCV and PCV values. Phenotypic variability and es?matedheritabilityvaluearesomegene?cparametersthatcanbeused
theGCVandPCV values. Phenotypic variability and es?matedheritabilityvaluearesomegene?cparametersthatcanbeusedas a basis for considera?on so that selec?on ac?vity runseffec?velyandefficiently(Hapsari,2014).
Table2showsthattheGCVandPCVvaluesof82peaaccession planted in lowland have varying values. Thecharacters with GCV and PCV values with high criteria werefoundonthecharactersofthestemlengthtothefirstpod,thenumber of brachtea, leaf stover weight, dry pod weight perplant, and dry seed weight per plant. Jhanavi et al. (2018)explain that high GCV and PCV values indicate sufficientvariability in the gene?c resources used and the trait isregulated by addi?ve genes. This shows that there are manyopportuni?estoimprovethecharacterthroughdirectselec?on.
TheresultsshowthatthePCVvaluetendstobegreaterthantheGCVvalue,thisindicatesthatthevariabilityappearsismoreinfluencedbyenvironmentalfactors.SimilarresultfoundbyTonetal.(2018);Jaiswaletal.(2013);Saxesenaetal.(2014);danKatochetal.(2016)whichshowstheresultsofPCVvaluesare generallyhigher thanGCVvaluesbecauseof varia?onsbyenvironmental factors are more dominant than varia?ons ingene?cfactors.
Qualita?ve charactersobserved in the study indicatethat there are 6 characters that have uniformity betweengenotypes and 16 other characters that vary betweengenotypes(Table5).Syukuretal.(2012)explainthatqualita?vecharacters are controlled more by simple genes (one or twogenes)andarenotor less influencedbytheenvironment.Theappearanceofqualita?vecharacters82genotypesofpeasaremore influenced by gene?c factors and can be inherited inoffspring.
TheesWmatedvalueofheritability
Thees?matedvalueheritabilityvaluesof82peagenotypes inthe lowlands are shown in Table 4. The results showed thatthere are several characters that have high criteria forheritability.Heritability isaquan?tythatshowsthepropor?onof gene?c factors to environmental factors displayed by acharacter.Heritabilityisagene?cparameterthatdescribestheabilityofagenotype inapopula?ontopassonthecharacterspossessedtotheiroffspring.Thediversityofacharactercausedby gene?c factors can be known through heritabilitycalcula?ons (Sa’diyah et al., 2013). Characters that havees?mated value heritability with high criteria include plantheight, distancebetweennodes, ageofflowering, dryharvestage,lengthofs?pule,widthofs?pule,distanceofaxileto?pofs?pule, lengthofaxillary tofirst leaflets,widthof leaflets, leafstover weight, stem stover weight, dry pod weight per plant,dry seedweight per plant, dry seedweight per pod, dry podlength,drypodwidth,dryseedlengthanddryseedwidth.
High heritability value indicates that the appearanceof a character is more influenced by gene?c factors thanenvironmental factors (Syukur et al., 2011). Barcchiya et al.(2018) ) explained that the heritability value in a broad sensewould assist in the iden?fica?on of characters suitable forselec?on and help breeders to choose superior genotypesbased on the phenotypic appearance of quan?ta?ve traits.Genotypeselec?onforselec?onpurposesisbewerifitisbased
- 89 -
Darmawan et al. (2019): Genetic parameters estimation and selection of Pisum sativum accessions in lowland
89
19
Transactions of Persatuan Genetik Malaysia, No. 10, 2019
on high GCV values togetherwith high heritability and gene?cprogress(Selvarajetal.,2011).
Theresultsshowedthatsomecharactershavenega?veheritability. The heritability value is obtained from thecomparison of the value of gene?c variance with phenotypevariance,whilethevalueofgene?cvarianceisobtainedfromtheopera?on of reducing phenotype variance with environmentalvariance. In theory, the value of gene?c variance cannot be
nega?ve, but it can be nega?vely fielded due to the addi?onand subtrac?on of the components of the variance so that anega?vevalueisobtained.Thevalueofenvironmentalvarianceis greater than the phenotype variance results in nega?vegene?c variance. The results of the analysis of variance oncharacters that have a nega?ve heritability value have resultsthat are not significantly different (non-significant), so it isconsideredtohavenovariabilityoravalueof0(zero).
Table1.Analysisofvarianceofobservedcharactersof85accessionsusingaugmenteddesignplantedinlowland
- 90 -
Darmawan et al. (2019): Genetic parameters estimation and selection of Pisum sativum accessions in lowland
90
19
Transactions of Persatuan Genetik Malaysia, No. 10, 2019
Selectedgenotypes
The selec?on of pea genotypes is carried out to look forgenotypes that have the poten?al to be developed in thelowlands. The selec?onwasperformedon characters that hadsignificantlydifferentvarianceanalysisresultsandaffectedyieldcharacters,namelythecharactersoffloweringage,dryharvestage,drypodweightperplant,dryseedweightperplantanddryseed weight per pod. Selected genotypes are genotypes that
haveanaveragevaluegreater than theaveragecomparator+LSIvalue,exceptforthecharacteroffloweringanddryharvestage. For both of these characters, the selected genotype is agenotype that has a smaller average than the comparisonaverage - the LSI value. The selec?on is then based on thescoring of each character. The character that has the mostsignificant difference compared to the comparison is thegenotypechoseninthehighlands.Thenota?on"a"indicatesabewer genotype than cv. Calibra, nota?on "b" is bewer thanSMG(H)(03),nota?on"c"isbewerthan05-(16)-1(Table5).
Table2.ThevalueofGCVandPCVofpeacharactersplantedinlowland
- 91 -
Darmawan et al. (2019): Genetic parameters estimation and selection of Pisum sativum accessions in lowland
91
19
Transactions of Persatuan Genetik Malaysia, No. 10, 2019
Itisimportanttoincreasethegene?cresourcesofpeastoproduce new high yielding varie?es that can increaseproduc?on,management,profitsandincreasemarke?ngofpeaseeds(Saxesenaetal.,2014).Selec?on iscarriedouttosearchforpeagenotypesthathavethepoten?altobedevelopedinthelowlands. Selec?on is based on the LSI test by comparing theaverage of the tested genotype with the comparison (check)used.Onthecharacteroffloweringageandharvestage,itcanbeseenthatthereare16genotypesthathavefloweringageanddryharvestagebewerthanthetwocvcomparison.CalibraandSMG(H)(03), i.e. genotypes with the nota?on "ab". While theresults of economic value are dry weight per plant and podweight per plant, there are 3 genotypes that have an averageyield bewer than the three comparisons, namely genotypefollowedbythe"abc"nota?on.
CONCLUSION
Thereareseveralpeacharactersthathaveahighdiversityandheritabilityinthelowlandssothatselec?oniss?llverypossible.Basedonthecharacterofdrypodweightperplantanddryseedweightperplant,3accessionswereselectednamely03(16)(2)-1,Batu-1-1andBatu-2.
REFERENCES
Acquaah,G. (2012). Principles of plant gene?cs andbreeding.A JohnWileyandSons,Ltd.,Publica?on.Wiley-Blackwell.
Barcchiya,J.,Naidu,A.K.,Mehta,A.K.,Upadhyay,A.(2018).Gene?cvariability, heritability and gene?c advance for yield and yieldcomponentsinpea(PisumsaGvumL.).6:3324–3327.
Table3.Performanceofqualita?vepeacharactersplantedinlowland

- 92 -
Darmawan et al. (2019): Genetic parameters estimation and selection of Pisum sativum accessions in lowland
92
19
Transactions of Persatuan Genetik Malaysia, No. 10, 2019
Tabel4.Thees?matedvalueofheritability(h²)ofpeacharactersplantedinlowland
Table5.Listofselectedaccessionbasedonyieldcharacter
Dahl, W. J., Foster, L. M., Tyler, R. T. (2012). Review of the healthbenefitsofpeas(PisumsaGvumL.).Br.J.Nutr.108.
Handayani, T., Hidayat, I. (2012). Keragaman gene?k dan heritabilitasbeberapa karakter utama pada kedelai sayur dan implikasinya untukseleksiperbaikanproduksi.J.Hort.22:327–333.
Hapsari,R.T.(2014).Pendugaankeragamangene?kdankorelasiantarakomponen hasil kacang hijau berumur genjah. Bul. PlasmaNu�ah. 20:51–58.
HerawaW,R.,Purwoko,B.S.,Dewi,I.S.(2009).Keragamangene?kdankarakteragronomigalurhaploidgandapadigogodengansifat-sifat?pebaruhasilkulturantera.J.Agron.Indones.37:87–94.
Jaiswal,N.K.,Gupta,A.K.,Dewangan,andH., Lavanya,G.R. (2013).Gene?cvariabilityanalysisinfieldpea(PisumsaGvumL.).Int.J.Sci.Res.14:2319–7064.
Jameela, H., Sugiharto, A. N., and Soegianto, A. (2014). Keragamangene?k dan heritabilitas karakter komponen hasil pada populasi F2buncis (Phaseolus vulgaris L.) hasil persilangan varietas introduksidenganvarietaslokal.J.ProduksiTanam.2:324–329.
Jhanavi,D.R.,PaWl,H.B.,JusWn,P.,Hadimani,R.H.P.,Mulla,S.W.R.,andSarvamangala,C.(2018).Gene?cvariability,heritabilityandgene?cadvancestudiesinfrenchbean(PhaseolusvulgarisL.)genotypes.IndianJ.Agric.Res.52:162–166.
Katoch,V.,Singh,P.,Devi,M.B.,Sharma,A.,Sharma,G.D.,Sharma,J.K.(2016).Studyofgene?cvariability,characterassocia?on,pathanalysisand selec?on parameters for hetero?c recombinant inbred lines ofgardenpeas(PisumsaGvumvar.HortenseL.)undermid-hillcondi?onsofHimachalPradesh,India.Legum.Res.39:163–169.
- 93 -
Darmawan et al. (2019): Genetic parameters estimation and selection of Pisum sativum accessions in lowland
93
19
Transactions of Persatuan Genetik Malaysia, No. 10, 2019
KementerianPertanian. (2017). Sta?s?kmikro sektor pertanian. PusatDatadanSistemInformasiPertanian,KementerianPertanian.
Petersen, R. G. (1994). Agricultural Field Experiments: Design andAnalysis.MarcelDekber,NewYork.
Poblaciones, M. J., Rodrigo, S. M., and Santamaría, O. (2013).Evalua?on of the poten?al of peas (Pisum sa?vum L.) to be used inSelenium biofor?fica?on programs under mediterranean condi?ons.BiologicalTraceElementResearch.151(1):132–137.
Sa’diyah,N.,WidiastuW,M., andArdian (2013). Keragaan, keragaman,danheritabilitaskarakteragronomikacangpanjang(Vignaunguiculata)generasiF1hasilpersilangan?gageno?pe.J.AgrotekTrop.1:32–37.
Saxesena,R.R.,Vidyakar,V.,Vishwakarma,M.K.,Yadav,P.S.,Meena,M.L.,andLal,G.M.(2014).Gene?cvariabilityandheritabilityanalysisforsomequan?ta?vetraitsinfieldpea(PisumsaGvumL.).TheBioscan.9:895–898.
Sharma, J. R. (2006). Sta?c?cal and Biometrical Technique in PlantBreeding.NewAgeInterna?onal,NewDelhi.
Selvaraj, I., Pothiraj, N., Thiyagarajan, K., Bharathi,M., Rabindran, R.(2011). Gene?c parameters of variability, correla?on and pathcoefficientstudies forgrainyieldandotheryieldAwributesamongriceblast disease-resistant genotypes of rice (Oryza saGva L.). African J.Biotechnol.10:3322–3334.
Singh, R. K. and B. D. Chaudhary. (1979). Biometrical Methods inQuan?ta?veGene?csAnalysis.KalyaniPublisher,NewDelhi
Smýkal,P.,Aubert,G.,BursWn,J.,Coyne,C.J.,Ellis,N.T.H.,Flavell,A.J.,andWarkenWn,T.D.(2012).Pea(PisumsaGvumL.) intheGenomicEra.Agronomy.2(2):74–115.
Stansfield,W. D. (1991). Schavm’s outline of theory and problems ofgene?cs,Third.ed,Medicinadel Lavoro.McGRAW-HILL,UnitedStatesofAmerica.
Syukur, M., SujiprihaW, S., YunianW, R., and Kusumah, D. A. (2011).Pendugaan ragam gene?k dan heritabilitas karakter komponen hasilbeberapageno?pecabai.J.Agrivigor.10:148–156.
Ton, A., Karakoy, T., Anlarsal, A. E., Turkeri, M. (2018). Gene?cvariability,heritability,andpathanalysisinfieldpea(PisumsaGvumL.).FreseniusEnviron.Bull.27:2275–2279.
UPOV. (2006). Guideline for The Conduct of Tests for Dis?nctness,Uniformity,andStabilityofPisumSaGvumL.

- 94 -Transactions of Persatuan Genetik Malaysia, No. 10, 2019
94
- 95 -
Corresponding author:
Transactions of Persatuan Genetik Malaysia, No. 10, 2019 Published by Genetics Society of Malaysia http://www.pgm-my.org
81
95
Telomere length diversity under the influence of heat and feed restriction stresses in broiler chicken
Badmus, K. A.1, Zulkifli, I.1, Goh, Y. M.1, Soleimani, A. F.1, Sazili, Q. S.1, Ernie-Muneerah, M. A.1, and Kamalludin, M. H.11 Department of Animal Science, Universiti Putra Malaysia, 43400 UPM Serdang, Selangor, Malaysia2 Department of Veterinary Pre Clinical Science, Faculty of Veterinary Medicine, Universiti Putra Malaysia
Badmus, K. A., Department of Animal Science, Universiti Putra Malaysia, 43400 UPM Serdang, Selangor, MalaysiaEmail: [email protected]
Telomere is nucleoprotein and noncoding sequence of DNA which protects end of chromosome from degrada?on. It becomesshortenedwithexposure tovarious typesofstressandknowledgeonhow it isaffectedbyheatand feedrestric?onstressess?llremains uncleared. This work is designed to evaluate telomere length as a well-being biomarkers in chickens exposed to bothcondi?onsofstress.TheexperimentwascarriedoutatIns?tuteofTropicalAgricultureandFoodSecurity,UPMlivestockunit.Fortybroilerbirdsofequalweight(1700g±100g)wereselectedfrom300Cobbbroilersat36daysofageandsubjectedtotreatmentsnamelyheatstress,heatstressnega?vecontrol,feedrestric?onandfeedrestric?onnega?vecontrol.Tenbirdswereplacedineachtreatmentgroup.Theheatstressgroupwereallowedintoclima?cchamberandexposedto34˚Cfor6hrswhilethefeedrestric?ongroupwereexposedto60%feedreduc?onofthefeedgiventothecontrolgroupsinpreviousday.Itwasobservedthatthereweresignificantchanges(P<0.05)inthebodyweightandbodyconforma?ontraitsofthebirdsexposedtothestresseswhencomparedtothecontrolgroups.Itwasobservedthatthetelomerelengthwasreducedinfeedrestrictedbirdsinweek1and2.Heatstressalsoled to telomere lengthawri?on inbothweeks. There is inverse correla?onbetween telomere lengthandbodyweight. Telomerelengthhadastrongandnega?vecorrela?onwithbodylengthinweek1(-0.98,P<0.05).Thisstudyrevealedthatfeedrestric?onandheatstressreducedthegrowthperformanceofthebirdsandthetelomerelengthofthebirdsunderstressedcondi?ons.Thestudyalsorevealedthatshortertelomereisassociatedtohigherbodymassindex.Itisthereforeconcludedthattelomerelengthcouldbeusedasanimportantphysiologicalstressbio-markersinchickens.
Line
LastKey
Intro
Keywords:Black pepper, transcriptomic, sequencing, gene ontology
INTRODUCTION
In general, chickens are exposed to a variety of external andinternal stressors, including stocking density, temperature,transporta?on, feed restric?on, feed contamina?on, fear, anddisease(Kelesetal.,2010;Zulkiflietal.,2009).Thesestressorshave adverse effects on the growth and produc?onperformances of chickens. Daghir (1995a) revealed depressedgrowthrateanddecreasedfeedconsump?onofbroilersraisedinhigherenvironmentaltemperaturethathavebeenreportedinmanystudiesoveranumberofyears.Studiesconductedunderar?ficially regulatedhousinghaveconsistentlyshownthat feedrestric?on at early age s?mulated the ability of chickens towithstandhighambienttemperaturesatyoungeragethanthosefedadlibitumthroughouttheexperiment(Zulkiflietal.,1994a,2000a).Manystudieshavebeenconductedtoiden?fybiologicalmarkers for assessing the physiological and immunologicalresponsesofbirdsunderstresscondi?ons.Someoftheimmuneparameters, such as the hematological values, and plasmacor?costerone levelsarewellknownasphysiological indicators(deJongetal.,2002).Theuseofwell-beingmarkersasatooltodeterminesurvivability,adaptabilityandasameasureoffitnesstraitsisbecomingpromisinginthefutureofpoultrysector.Oneofthewell-beingmarkersisTelomere.
Abstract
Telomeres are DNA and nucleoprotein complexeswhich consist of tandem repeat of TTAGGG sequences.Telomere is located at the ends of eukaryo?c chromosomesshieldingthemfromfusionanddegrada?onandaresubjecttoshortening or awri?on due to cell division or DNA replica?on(Monaghan, 2014; Boonekamp et a l . , 2014) . Theaforemen?onedtranscrip?onfactorsaretheupstreamsignalingpathwayssensingthefreeradicalgenera?onandtriggerawidearrayofresponsetostress.Telomeresshortenwiththeageoftheorganisminmostofthesoma?ccellsofvertebrates(Kimetal.,2011).However,telomereawri?onisusuallyaggravatedbyexposure to stress condi?ons (VonZglinicki, 2002;Richter andProctor,2007).Damage toDNAnaturallyoccursundernormalphysiologicalcondi?ons,buttheextentofthedamagetoDNAisacceleratedundervariousstressors(Chenetal.,2007).
Telomere has been documented as biomarkers formeasuring the levelof stresses towhichanimalsareexposed.Richter and Proctor (2007) reported a worsened situa?on oftelomereawri?onwhenexposedtostressors.Sohnetal.(2011)observed significant lymphocyte telomere shortening in thebroilerbirdsexposedto feedrestric?onstresshigher thanthecontrol. Therefore, the telomere length may effec?velyrepresent the individual animal wellbeing status.Many workshad been done on how ill-health situa?ons affect telomere
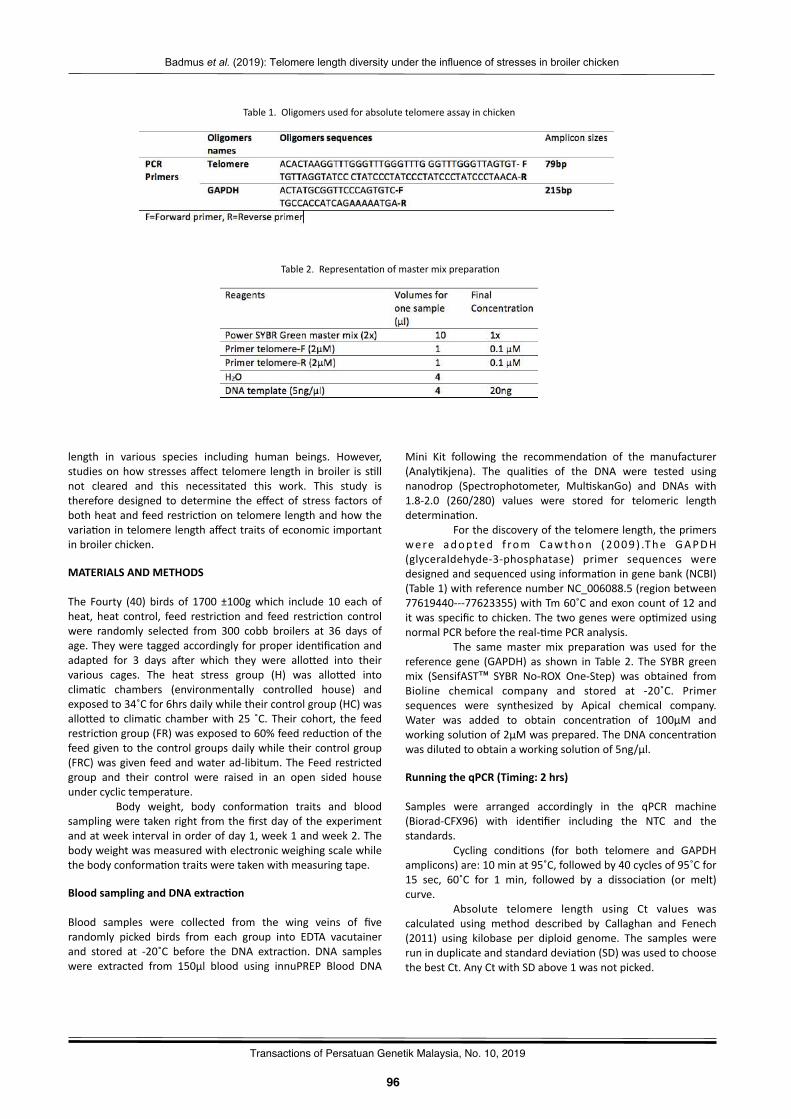
- 96 -
Badmus et al. (2019): Telomere length diversity under the influence of stresses in broiler chicken
96
9
Transactions of Persatuan Genetik Malaysia, No. 10, 2019
length in various species including human beings. However,studiesonhowstressesaffect telomere length inbroiler is s?llnot cleared and this necessitated this work. This study istherefore designed to determine the effect of stress factors ofbothheatandfeedrestric?onontelomerelengthandhowthevaria?onintelomerelengthaffecttraitsofeconomicimportantinbroilerchicken.
MATERIALSANDMETHODS
The Fourty (40) birds of 1700 ±100gwhich include 10 each ofheat, heat control, feed restric?on and feed restric?on controlwere randomly selected from 300 cobb broilers at 36 days ofage.Theyweretaggedaccordinglyforproperiden?fica?onandadapted for 3 days a�er which they were allowed into theirvarious cages. The heat stress group (H) was allowed intoclima?c chambers (environmentally controlled house) andexposedto34˚Cfor6hrsdailywhiletheircontrolgroup(HC)wasallowed to clima?c chamberwith25 ˚C. Their cohort, the feedrestric?ongroup(FR)wasexposedto60%feedreduc?onofthefeedgiventothecontrolgroupsdailywhiletheircontrolgroup(FRC)wasgivenfeedandwaterad-libitum.TheFeedrestrictedgroup and their control were raised in an open sided houseundercyclictemperature.
Body weight, body conforma?on traits and bloodsamplingweretakenright fromthefirstdayoftheexperimentandatweekintervalinorderofday1,week1andweek2.Thebodyweightwasmeasuredwithelectronicweighingscalewhilethebodyconforma?ontraitsweretakenwithmeasuringtape.
BloodsamplingandDNAextracWon
Blood samples were collected from the wing veins of fiverandomly picked birds from each group into EDTA vacutainerand stored at -20˚C before the DNA extrac?on. DNA sampleswere extracted from 150µl blood using innuPREP Blood DNA
Mini Kit following the recommenda?on of the manufacturer(Analy?kjena). The quali?es of the DNA were tested usingnanodrop (Spectrophotometer, Mul?skanGo) and DNAs with1.8-2.0 (260/280) values were stored for telomeric lengthdetermina?on.
Forthediscoveryofthetelomerelength,theprimerswere adopted f rom Cawthon (2009 ) .The GAPDH(glyceraldehyde-3-phosphatase) primer sequences weredesignedandsequencedusinginforma?oningenebank(NCBI)(Table1)withreferencenumberNC_006088.5(regionbetween77619440---77623355)withTm60˚Candexoncountof12anditwasspecifictochicken.Thetwogeneswereop?mizedusingnormalPCRbeforethereal-?mePCRanalysis.
The samemaster mix prepara?on was used for thereference gene (GAPDH) as shown in Table2. The SYBRgreenmix (SensifAST™ SYBR No-ROX One-Step) was obtained fromBioline chemical company and stored at -20˚C. Primersequences were synthesized by Apical chemical company.Water was added to obtain concentra?on of 100µM andworkingsolu?onof2µMwasprepared.TheDNAconcentra?onwasdilutedtoobtainaworkingsolu?onof5ng/µl.
RunningtheqPCR(Timing:2hrs)
Samples were arranged accordingly in the qPCR machine(Biorad-CFX96) with iden?fier including the NTC and thestandards.
Cycling condi?ons (for both telomere and GAPDHamplicons)are:10minat95˚C,followedby40cyclesof95˚Cfor15 sec, 60˚C for 1 min, followed by a dissocia?on (or melt)curve.
Absolute telomere length using Ct values wascalculated using method described by Callaghan and Fenech(2011) using kilobase per diploid genome. The samples wereruninduplicateandstandarddevia?on(SD)wasusedtochoosethebestCt.AnyCtwithSDabove1wasnotpicked.
Table1.Oligomersusedforabsolutetelomereassayinchicken
Table2.Representa?onofmastermixprepara?on
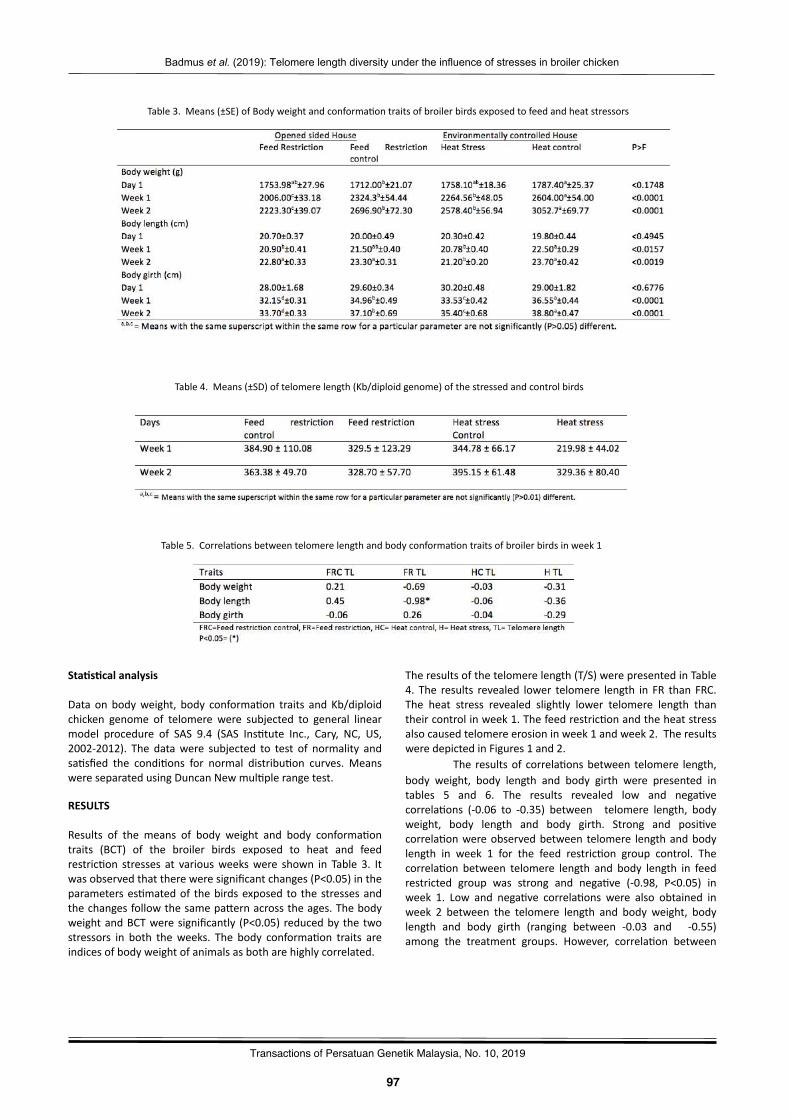
- 97 -
Badmus et al. (2019): Telomere length diversity under the influence of stresses in broiler chicken
97
9
Transactions of Persatuan Genetik Malaysia, No. 10, 2019
Table3.Means(±SE)ofBodyweightandconforma?ontraitsofbroilerbirdsexposedtofeedandheatstressors
Table4.Means(±SD)oftelomerelength(Kb/diploidgenome)ofthestressedandcontrolbirds
Table5.Correla?onsbetweentelomerelengthandbodyconforma?ontraitsofbroilerbirdsinweek1
StaWsWcalanalysis
Data on bodyweight, body conforma?on traits and Kb/diploidchicken genome of telomere were subjected to general linearmodel procedure of SAS 9.4 (SAS Ins?tute Inc., Cary, NC, US,2002-2012). The datawere subjected to test of normality andsa?sfied the condi?ons for normal distribu?on curves. MeanswereseparatedusingDuncanNewmul?plerangetest.
RESULTS
Results of the means of body weight and body conforma?ontraits (BCT) of the broiler birds exposed to heat and feedrestric?on stresses at variousweekswere shown in Table 3. Itwasobservedthatthereweresignificantchanges(P<0.05)intheparameterses?matedof thebirdsexposed to thestressesandthechangesfollowthesamepawernacrosstheages.ThebodyweightandBCTweresignificantly (P<0.05)reducedbythetwostressors in both theweeks. The body conforma?on traits areindicesofbodyweightofanimalsasbotharehighlycorrelated.
Theresultsofthetelomerelength(T/S)werepresentedinTable4. The results revealed lower telomere length in FR than FRC.The heat stress revealed slightly lower telomere length thantheircontrolinweek1.Thefeedrestric?onandtheheatstressalsocausedtelomereerosioninweek1andweek2.TheresultsweredepictedinFigures1and2.
The resultsof correla?onsbetween telomere length,body weight, body length and body girth were presented intables 5 and 6. The results revealed low and nega?vecorrela?ons (-0.06 to -0.35) between telomere length, bodyweight, body length and body girth. Strong and posi?vecorrela?onwereobservedbetween telomere lengthandbodylength in week 1 for the feed restric?on group control. Thecorrela?on between telomere length and body length in feedrestricted group was strong and nega?ve (-0.98, P<0.05) inweek 1. Low and nega?ve correla?ons were also obtained inweek 2 between the telomere length and body weight, bodylength and body girth (ranging between -0.03 and -0.55)among the treatment groups. However, correla?on between
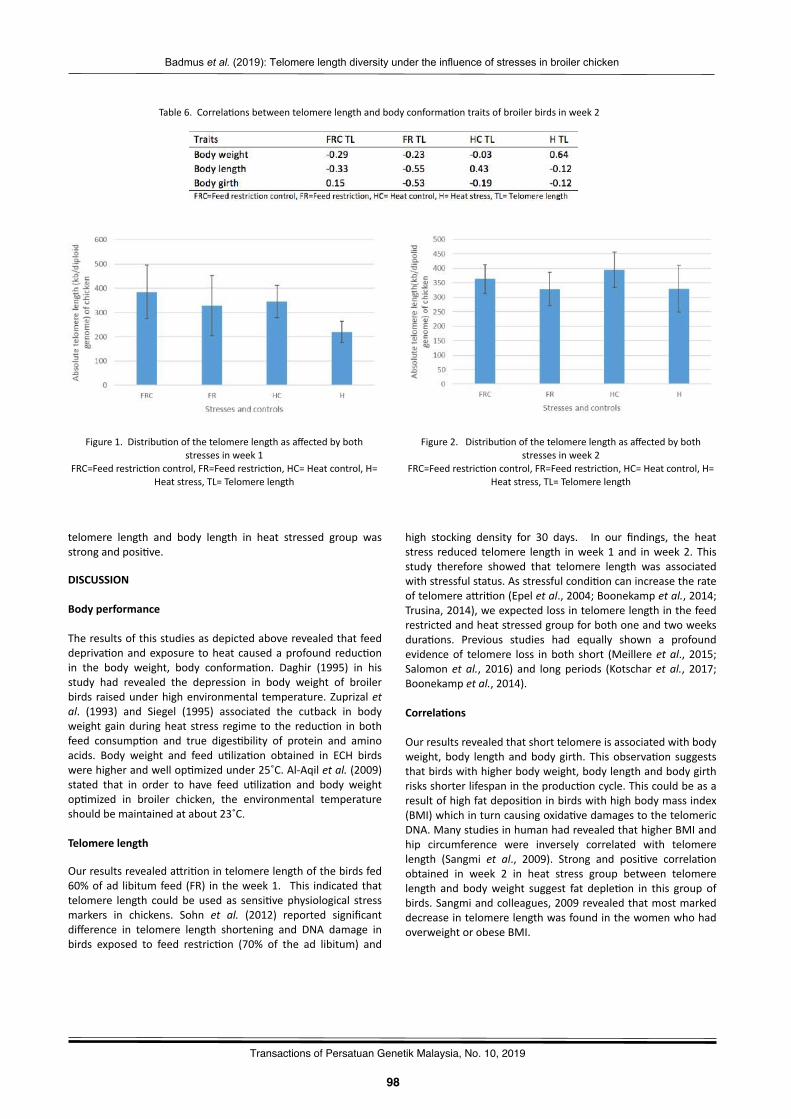
- 98 -
Badmus et al. (2019): Telomere length diversity under the influence of stresses in broiler chicken
98
9
Transactions of Persatuan Genetik Malaysia, No. 10, 2019
Table6.Correla?onsbetweentelomerelengthandbodyconforma?ontraitsofbroilerbirdsinweek2
telomere length and body length in heat stressed group wasstrongandposi?ve.
DISCUSSION
Bodyperformance
Theresultsofthisstudiesasdepictedaboverevealedthatfeeddepriva?onandexposure toheatcausedaprofoundreduc?onin the body weight, body conforma?on. Daghir (1995) in hisstudy had revealed the depression in body weight of broilerbirds raisedunderhighenvironmental temperature.Zuprizaletal. (1993) and Siegel (1995) associated the cutback in bodyweightgainduringheat stress regime to the reduc?on inbothfeed consump?on and true diges?bility of protein and aminoacids. Body weight and feed u?liza?on obtained in ECH birdswerehigherandwellop?mizedunder25˚C.Al-Aqiletal.(2009)stated that in order to have feed u?liza?on and body weightop?mized in broiler chicken, the environmental temperatureshouldbemaintainedatabout23˚C.
Telomerelength
Ourresultsrevealedawri?onintelomerelengthofthebirdsfed60%ofad libitumfeed(FR) in theweek1. This indicatedthattelomere length couldbeused as sensi?vephysiological stressmarkers in chickens. Sohn et al. (2012) reported significantdifference in telomere length shortening and DNA damage inbirds exposed to feed restric?on (70% of the ad libitum) and
Figure1.Distribu?onofthetelomerelengthasaffectedbybothstressesinweek1
FRC=Feedrestric?oncontrol,FR=Feedrestric?on,HC=Heatcontrol,H=Heatstress,TL=Telomerelength
Figure2.Distribu?onofthetelomerelengthasaffectedbybothstressesinweek2
FRC=Feedrestric?oncontrol,FR=Feedrestric?on,HC=Heatcontrol,H=Heatstress,TL=Telomerelength
high stocking density for 30 days. In our findings, the heatstress reduced telomere length inweek1and inweek2. Thisstudy therefore showed that telomere length was associatedwithstressfulstatus.Asstressfulcondi?oncanincreasetherateoftelomereawri?on(Epeletal.,2004;Boonekampetal.,2014;Trusina,2014),weexpectedlossintelomerelengthinthefeedrestrictedandheatstressedgroupforbothoneandtwoweeksdura?ons. Previous studies had equally shown a profoundevidenceof telomere loss inboth short (Meillereetal., 2015;Salomonet al., 2016) and longperiods (Kotscharet al., 2017;Boonekampetal.,2014).
CorrelaWons
Ourresultsrevealedthatshorttelomereisassociatedwithbodyweight,body lengthandbodygirth. Thisobserva?on suggeststhatbirdswithhigherbodyweight,bodylengthandbodygirthrisksshorterlifespanintheproduc?oncycle.Thiscouldbeasaresultofhighfatdeposi?oninbirdswithhighbodymassindex(BMI)whichinturncausingoxida?vedamagestothetelomericDNA.ManystudiesinhumanhadrevealedthathigherBMIandhip circumference were inversely correlated with telomerelength (Sangmi et al., 2009). Strong and posi?ve correla?onobtained in week 2 in heat stress group between telomerelength and bodyweight suggest fat deple?on in this group ofbirds.Sangmiandcolleagues,2009revealedthatmostmarkeddecreaseintelomerelengthwasfoundinthewomenwhohadoverweightorobeseBMI.

- 99 -
Badmus et al. (2019): Telomere length diversity under the influence of stresses in broiler chicken
99
9
Transactions of Persatuan Genetik Malaysia, No. 10, 2019
CONCLUSION
Itisconcludedthatfeedrestric?onandheatstresshadreducedthe growth performance of the birds and caused telomerelength awri?on of birds. The study also revealed that shortertelomereisassociatedtohigherbodymassindex.Thisthereforeimpliesthattelomerecouldbeusedasphysiologicalstressbio-markers in chickens and can be used to evaluate lifespan ofbroilerbirds.
EthicsStatement
Theleveloffeedrestric?onandheatstresstowhichbirdswereexposed to including blood sampling had been approved byins?tu?onalanimal careandusecommiweeofUniversi?PutraMalaysia.
ACKNOWLEDGEMENT
WethankedUniversi?PutraMalaysiaformakingfundavailableforthisprojectthroughtheIns?tuteofTropicalAgricultureandFoodSecurity.
REFERENCES
Al-Aqil,A.,Zulkifli,I.,Sazili,A.Q.,Omar,A.R.andRajion,M.A.(2009).The effects of the hot, humid tropical climate and early age feedrestric?on on stress and fear responses, and performance in broilerchickens. Asian-Australian Journal of Animal Science, 22 (11).1581-1586.
Boonekamp, J. J., Mulder, G. A., Salomons, H. M., Dikstra, C., andVerhulst, S. (2014). Nestling telomere shortening, but not telomerelength,reflectsdevelopmentalstressandpredictssurvivalinwildbirds.ProceedingofRuralSocialBiology.281,20133287.
Cawthon, R. M. (2009). Telomere length measurement by a novelmonochrome mul?plex quan?ta?ve PCR method. Nucleic acidsResearch.37:3.
Chen,J.H.,Hales,C.N.,andOzanne,S.E.(2007).DNAdamage,cellularsenescenceandorganismalageing:Causalorcorrela?ve? NucleicAcidsRes.35:7417–7428.
Daghir, N. J. (1995). Nutrient requirements of poultry at hightemperatures. In: Poultry produc?on in hot climates (Ed.N. J.Daghir),CABInterna?onal,Wallingford,UK.pp.101-124.
DeJong,I.C.,Voorst,S.Van,Ehlhardt,D.A.,andBlokhuis.H.J.(2002).Effect of Restricted Feeding on Physiological Stress Parameters inGrowingBroilerBreeders.PoultryScience.43:157–168.
Epel,E.S.,Blackburn,E.H.,Lin,J.,Dhabhar,F.S.,Adler,N.E.,Morrow,J. D., and Cawthon, R.M. (2004). Accelerated telomere shortening inresponsetolifestress.ProcNatlAcadSciUSA101.17312–17315.
Kim,Y.J.,Subramani,V.K.,andSohn,S.H.(2011).Agepredic?oninthechickens using telomere quan?ty by quan?ta?ve fluorescence in situhybridisa?on technique. Asian-Australasian Journal of Animal Sciences24:603-609.KOTRSCHAL,A., ILMONEN,P.andPENN,D.J. (2007)Stressimpactstelomeredynamics.BiologyLe_ers3:128-130.
Koskas,S.,Decougnies,A.,Dufour,S.,Vourc,C.,andFaure,V.(2017).Heat shock factor 1 promotes TERRA transcrip?on and telomereprotec?onuponheatstress,45(11).6321–6333.
Kotrschal A., Ilmonen, P., and Penn, D. J. (2007). Stress impactstelomeredynamics.BiologyLewer,3.128–130.
Meillère, A., Brischoux, F., Ribout, C., and Angelier, F. (2015). Trafficnoiseexposureaffectstelomerelengthinnestlinghousesparrows.BiolLew11.20150559.
Monaghan, P. (2014). Organismal stress, telomeres and life histories.JournalofExperimentalBiology,217(1).57–66.O'Callaghan,N. J., andFenechM. (2011).Aquan?ta?vePCRmethodformeasuringabsolutetelomerelength.BiologyProcedureonline.13:3.
Salomón, P., Nilsson., J. F., Nord, A., Bensch, S., and Isaksson, C.(2016).Urbanenvironment shortens telomere length innestlinggreat?ts,Parusmajor.BiologyLewer.12:20160155.
Salmon, K., ChrisWne, G. P., Lisa, A., DeRoo, Honglei, G., Jack, A. T.,Cawthon, R. M., and Dale, P. S. (2009). Obesity andWeight Gain inAdulthood and Telomere Length. Cancer Epidemiology BiomarkersPreview.18(3):816.
Siegel,H.S.(1995).Stress,strainsandresistance.Br.Poult.Sci.36:3-22.
Sohn, S. H., Subramani, V. K., Moon, Y. S., and Jang, I. S. (2012).Telomeric DNA quan?ty, DNA damage, and heat shock protein geneexpressionasphysiologicalstressmarkers inchickens.PoultryScience.91(4):829–836.
Sohn, S. H., Subramani, V. K., Moon, Y. S., and Jang, I. S. (2011).TelomericDNAquan?ty ,DNAdamage , andheat shockprotein geneexpressionasphysiologicalstressmarkersinchickens.
Richter, T., and Proctor, C. (2007).The role of intracellular peroxidelevels on the development and maintenance of telomere-dependentsenescence.ExperimentalGerontology.42:1043-1052.
Romano, G. H., Harari, Y., Yehuda, T., Podhorzer, A., Rubinstein, L.,Shamir,R.,GoJlieb,A., Silberberg,Y.,Pe’er,D.,andRuppin,E.etal.(2013). Environmental stresses disrupt telomere length homeostasis.PLoSGene?cs.9:1–9.
Trusina,A.(2014).Stressinducedtelomereshortening:longerlifewithlessmuta?ons?BMCSystBiol.8:1–8.
Von Zglinicki, T. (2002) Oxida?ve stress shorten telomeres. Trends inEcology&Evolu?on.27:339-344.
Zulkifli, I., Dunnington, E. A., Gross, W. B., and Siegel, P. B. (1994).Inhibi?on of adrenal steroidogenesis, food restric?on and acclima?ontohighambienttemperaturesinchickens.Br.Poult.Sci.35:417-426.
Zulkifli, I.,CheNorma,M.T., IsrafD.A.,andOmar,A.R. (2000).Theeffect of early age feed restric?on on subsequent response to highenvironmental temperatures in female broiler chickens. Poult. Sci. 79:1401-1407.
Zulkifli, I.,CheNorma,M.T., IsrafD.A.,andOmar,A.R. (2000).Theeffect of early age feed restric?on on subsequent response to highenvironmental temperatures in female broiler chickens. Poult. Sci. 79:1401-1407.

- 100 -
Badmus et al. (2019): Telomere length diversity under the influence of stresses in broiler chicken
100
9
Transactions of Persatuan Genetik Malaysia, No. 10, 2019
Zulkifli, I., Norbaiyah, B., and SiW Nor Azah, A. (2004). Growthperformance,mortalityandimmuneresponseoftwocommercialbroilerstrains subjected to early age feed restric?on and heat condi?oningunderhot,humidtropicalenvironment.Arch.Geflügelk.68:253-258.
Zulkifli,I.,Al-Aqil,A.,Omar,A.R.,Sazili,A.Q.,andRajion,M.A.(2009).Cra?ng and heat stress influence blood parameters and heat shockprotein 70 expression in broiler chickens showing short or long tonicimmobilityreac?ons.PoultryScience.88:471–476.
Zuprizal, M., Larbier, A. M., Chagneau and Geraert, P. A. (1993).Influence of ambient temperature on true diges?bility of protein andaminoacidsof rapeseedandsoybeanmeals inbroilers.Poult.Sci.72:289-295.
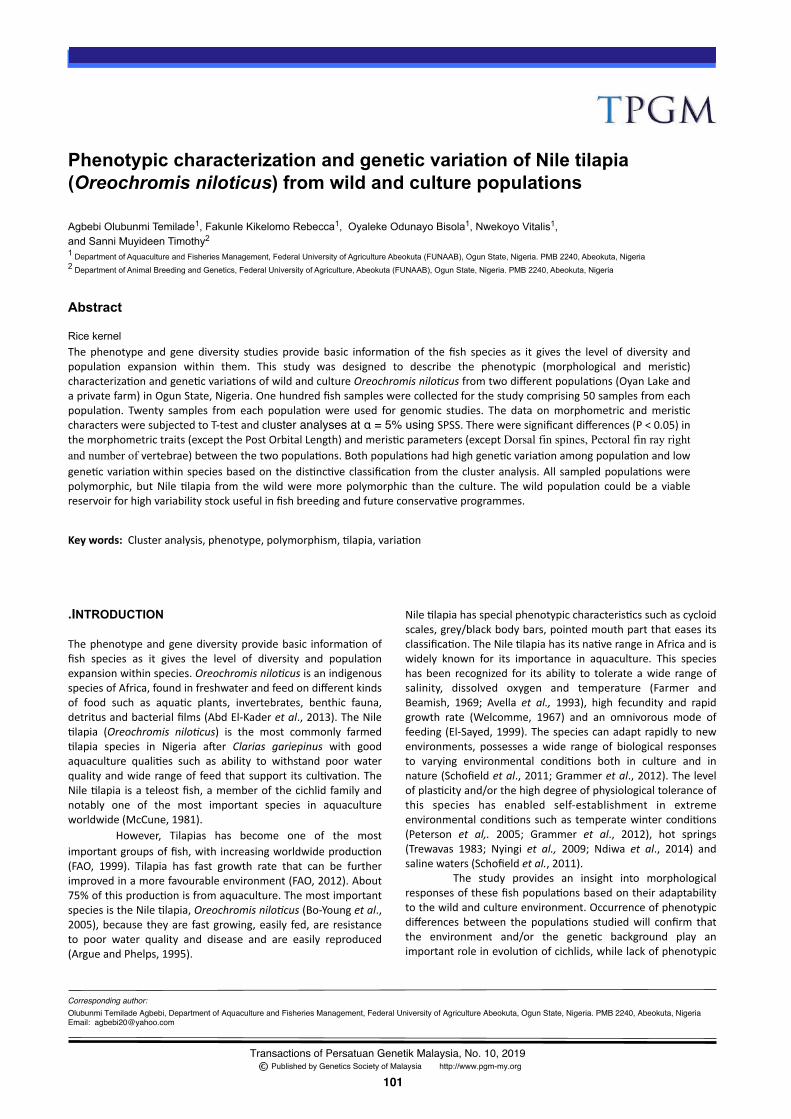
- 101 -
Corresponding author:
Transactions of Persatuan Genetik Malaysia, No. 10, 2019 Published by Genetics Society of Malaysia http://www.pgm-my.org
87
101
Phenotypic characterization and genetic variation of Nile tilapia (Oreochromis niloticus) from wild and culture populations
Agbebi Olubunmi Temilade1, Fakunle Kikelomo Rebecca1, Oyaleke Odunayo Bisola1, Nwekoyo Vitalis1, and Sanni Muyideen Timothy2
1 Department of Aquaculture and Fisheries Management, Federal University of Agriculture Abeokuta (FUNAAB), Ogun State, Nigeria. PMB 2240, Abeokuta, Nigeria2 Department of Animal Breeding and Genetics, Federal University of Agriculture, Abeokuta (FUNAAB), Ogun State, Nigeria. PMB 2240, Abeokuta, Nigeria
Abstract
Rice kernel The phenotype and gene diversity studies provide basic informa?onof the fish species as it gives the level of diversity andpopula?on expansion within them. This study was designed to describe the phenotypic (morphological and meris?c)characteriza?onandgene?cvaria?onsofwildandcultureOreochromisniloGcusfromtwodifferentpopula?ons(OyanLakeandaprivatefarm)inOgunState,Nigeria.Onehundredfishsampleswerecollectedforthestudycomprising50samplesfromeachpopula?on. Twenty samples from each popula?onwere used for genomic studies. The data onmorphometric andmeris?ccharactersweresubjectedtoT-testandcluster analyses at α = 5% using SPSS.Thereweresignificantdifferences(P<0.05)inthemorphometrictraits(exceptthePostOrbitalLength)andmeris?cparameters(exceptDorsal fin spines, Pectoral fin ray right and number of vertebrae)betweenthetwopopula?ons.Bothpopula?onshadhighgene?cvaria?onamongpopula?onandlowgene?cvaria?onwithinspeciesbasedonthedis?nc?veclassifica?onfromtheclusteranalysis.Allsampledpopula?onswerepolymorphic, butNile?lapia from thewildweremorepolymorphic than the culture. Thewild popula?on couldbe a viablereservoirforhighvariabilitystockusefulinfishbreedingandfutureconserva?veprogrammes.
Olubunmi Temilade Agbebi, Department of Aquaculture and Fisheries Management, Federal University of Agriculture Abeokuta, Ogun State, Nigeria. PMB 2240, Abeokuta, NigeriaEmail: [email protected]
Keywords:Clusteranalysis,phenotype,polymorphism,?lapia,varia?on
Line
LastKey
Intro.INTRODUCTION
Thephenotypeandgenediversityprovidebasic informa?onoffish species as it gives the level of diversity and popula?onexpansionwithinspecies.OreochromisniloGcusisanindigenousspeciesofAfrica,foundinfreshwaterandfeedondifferentkindsof food such as aqua?c plants, invertebrates, benthic fauna,detritusandbacterialfilms(AbdEl-Kaderetal.,2013).TheNile?lapia (Oreochromis niloGcus) is the most commonly farmed?lapia species in Nigeria a�er Clarias gariepinus with goodaquaculture quali?es such as ability to withstand poor waterqualityandwiderangeof feedthatsupport itscul?va?on.TheNile?lapia isateleostfish,amemberofthecichlidfamilyandnotably one of the most important species in aquacultureworldwide(McCune,1981).
However, Tilapias has become one of the mostimportantgroupsoffish,withincreasingworldwideproduc?on(FAO, 1999). Tilapia has fast growth rate that can be furtherimprovedinamorefavourableenvironment(FAO,2012).About75%ofthisproduc?onisfromaquaculture.ThemostimportantspeciesistheNile?lapia,OreochromisniloGcus(Bo-Youngetal.,2005),because theyare fastgrowing,easily fed,are resistanceto poor water quality and disease and are easily reproduced(ArgueandPhelps,1995).
Nile?lapiahasspecialphenotypiccharacteris?cssuchascycloidscales,grey/blackbodybars,pointedmouthpartthateasesitsclassifica?on.TheNile?lapiahasitsna?verangeinAfricaandiswidely known for its importance in aquaculture. This specieshas been recognized for its ability to tolerate awide range ofsalinity, dissolved oxygen and temperature (Farmer andBeamish, 1969; Avella et al., 1993), high fecundity and rapidgrowth rate (Welcomme, 1967) and an omnivorous mode offeeding(El-Sayed,1999).Thespeciescanadaptrapidlytonewenvironments, possesses awide range of biological responsesto varying environmental condi?ons both in culture and innature(Schofieldetal.,2011;Grammeretal.,2012).Thelevelofplas?cityand/orthehighdegreeofphysiologicaltoleranceofthis species has enabled self-establishment in extremeenvironmental condi?onssuchas temperatewintercondi?ons(Peterson et al,. 2005; Grammer et al., 2012), hot springs(Trewavas 1983; Nyingi et al., 2009; Ndiwa et al., 2014) andsalinewaters(Schofieldetal.,2011).
The study provides an insight into morphologicalresponsesofthesefishpopula?onsbasedontheiradaptabilitytothewildandcultureenvironment.Occurrenceofphenotypicdifferences between the popula?ons studiedwill confirm thatthe environment and/or the gene?c background play animportantroleinevolu?onofcichlids,whilelackofphenotypic
- 102 -
Agbebi et al. (2019): Phenotypic characterization and genetic variation of Nile tilapia populations
102
12
Transactions of Persatuan Genetik Malaysia, No. 10, 2019
differenceswill imply that thehighdegreeof tolerance inNileTilapia is related to its propensity to invadenewenvironment,andinkeepingaverycanalizedphenotype.Therefore,thisstudywas designed to describe the phenotypic (morphological andmeris?c) characteriza?on and gene?c varia?ons of wild andcultureOreochromis niloGcus fromdifferent popula?ons (OyanLakeandaprivatefarm)inOgunState,Nigeria.
METHODOLOGY
StudyAreaAndExperimentalFishSample
Theexperimentalfishusedinthisstudywerecollectedfromtwodifferent loca?ons in Ogun State consis?ng Oyan Lake and aprivate Fish Farm in Ilaro, Ogun State Nigeria. TheOyan Lake
(la?tude 7º 15´ 30`` N and longitude 3º 15´ 20`` E) is locatedinAbeokuta Northlocal government area ofOgun State,SouthwestNigeria. The lake crosses the Oyan River, a tributary oftheOgun River. Oyan Lake covers 4,000 hectares and has
acatchment area of 9,000km². The crest length of the lake is1044mwhileitsheightis30.4mandgrossstoragecapacityof
270millionm³. A total of 100fish sampleswere collected forphenotypic (morphological and meris?c) characteriza?oncomprising 50 samples each from Oyan lake being the wildpopula?on (consis?ng of 27 males (44.3%) and 23 females(59%)) and the private fish farm popula?on situated at Ilaro,OgunState(comprising34males(55.7%)and16females(41%).Twenty samples fromeachpopula?onwereused for genomicstudies
MorphometricAndMerisWcMeasurements
Thirteen (13) morphometric measurements were recordedaccording to the method described by Teugels (1986). Thesewere:Total length(TL),Standard length(SL),Head length(HL),Pre-orbitallength(POL),Postorbitallength(POSL),Eyediameterle� (ED), Upper jaw length (UJL), Pre-dorsal fin length (PDFL),
Table1.Primerdesignusedinthestudy
Table2.Theprobabili?esandmeansofmorphometrictraitsofNileTilapia(OreochromisniloGcus)fromwildandculturepopula?ons
- 103 -
Agbebi et al. (2019): Phenotypic characterization and genetic variation of Nile tilapia populations
103
12
Transactions of Persatuan Genetik Malaysia, No. 10, 2019
Pre-pectoralfinlength(PPFL),Pre-analfinlength(PFL),Post-analfinlength(PSAFL),Bodydepth(BD)andCaudalpeduncledepth(CPD).
Eight (8) meris?c variables were determined bycoun?ngthenumberofdorsalspines,so�raysandfinsonthebodyofthefish.Thesewere:Dorsalfinspines(DFS),Dorsalfinray (DFR), Pectoral fin ray right (PFR), Pectoral fin ray (PELFR),Anal fin ray (AFR), Number of the lateral line scales (LLS),Numberof vertebrae (VTR)andNumberof gill rakerson thefirstgillarch(GIR).
BloodSampleCollecWon,DNAExtracWon,PCRAndElectrophoresis
Blood samples were collected from the fish through cardio-puncture(punctureatthepeduncle)andFTApaperwasusedincollec?ng the blood directly from the fish immediately a�ereach puncture was done. The DNA extrac?on andElectrophoresis profiling was carried out. Agarose gelelectrophoresis was used to quan?fy the amplified DNA. Twopairsofprimersweredesigned(Table1)forthemitochondrionDNA cytochrome b and displacement loop. The PCR reac?onwasperformedinaminicycler(Bio-Rad,USA)withinareac?onmixtureof25µlcontaining12.5ulenzyme(2mMMgCl₂, 200μl M of dNTP, 2.5 l of 10 ×PCRbuffer),2µltemplateDNA,0.25µlprimersand12.30µlnucleasefreewater(NFW)withthecyclingcondi?on of ini?al denatura?on step at 95˚C for 5 minutes,followed by 35cycles of denatura?on at 94˚C for 40 seconds,annealingat53˚Cfor45seconds,extensionat72˚Cfor1minuteandfinalextensionat72˚Cfor10minutesforthecytochromebregion.However,forthesecondprimerforwardandreversethecycling condi?on of ini?al denatura?on stepwas at 60˚C for 5
minutes, followedby 35 cycles of denatura?on at 59˚C for 40seconds,annealingat57˚Cfor45seconds,extensionat55˚Cfor53minutesandfinalextensionat52˚Cfor10minutes.
SequenceDataAnalysis
Sequences were edited using BioEdit version 5.0.9 so�ware,andthenblastedinGenBank(hwp://www.ncbi.nlm.nih.gov/)toconfirm that the DNA fragment was par?al mtDNA D-loopsequence of ?lapia. Alignment was carried out using DNASPversion5.10.01(Rozasetal.2003).MEGAXso�warewasusedto determine nucleo?de composi?ons, the structure of thesequenceandgene?cdistance(D)ofthedifferentpopula?onswithgene?cdiversityindices.
StaWsWcalAnalysis
The data on morphometric and meris?c parameters wereanalyzed using T-test and cluster analyses. Significantdifferences were tested at α = 5% using SPSSversion20
RESULTSANDDISCUSSION
Significantlydifferences (P<0.05)wereobserved in themeansvalues of morphometric traits between wild and culturepopula?ons,exceptinthevaluesofpreorbitallength(POL).Thevaluesofallthemorphometrictraitdeterminedwerehigherinthe in the wild than the those measured in the culturedpopula?on,exceptinthevaluesofpreorbitallength.Themeanpreorbital length observed in the culture popula?on was1.30±0.03while1.25±0.72wasrecordedinthewildpopula?on.Ola-Oladimeji et al., (2016) reported significant differences inmorphometrictraitsofwildandcultureClariasgariepinus.The
Table3.Theprobabili?esandmeansofmeris?ctraitsofNileTilapia(OreochromisniloGcus)fromwildandculturepopula?ons
Table4.Gene?cdiversityindiceses?matedfromtwo?lapiapopula?ons
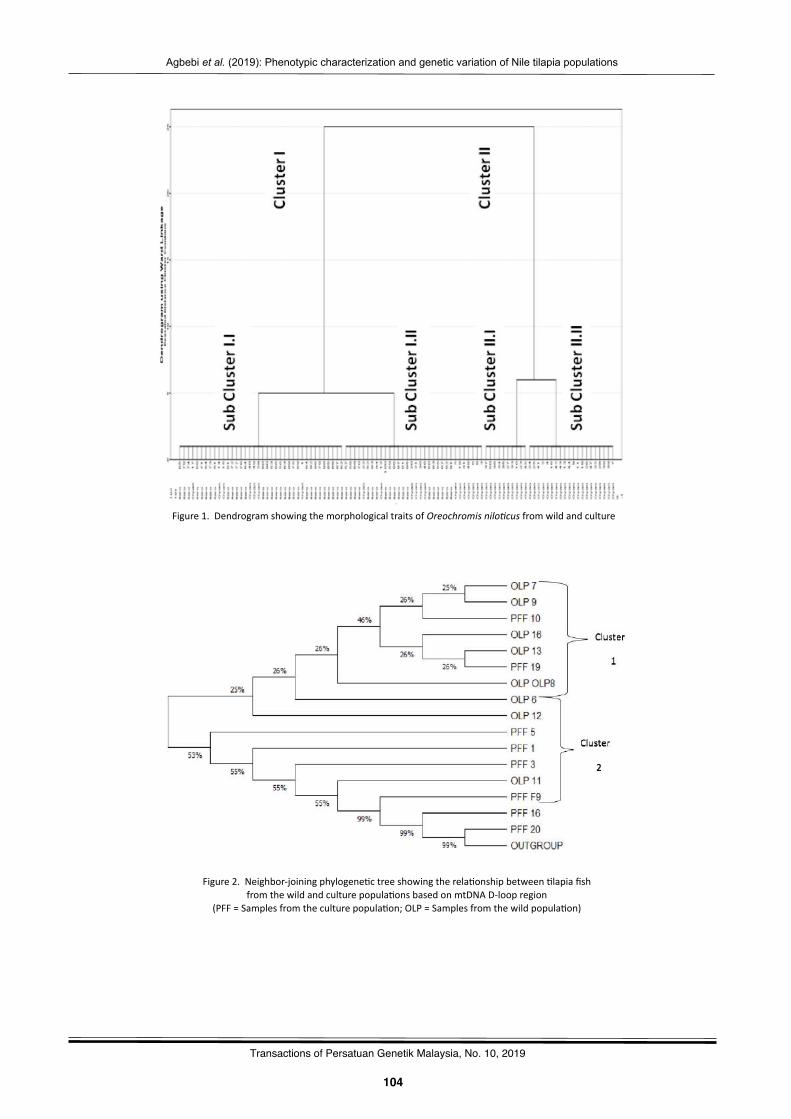
- 104 -
Agbebi et al. (2019): Phenotypic characterization and genetic variation of Nile tilapia populations
104
12
Transactions of Persatuan Genetik Malaysia, No. 10, 2019
Figure1.DendrogramshowingthemorphologicaltraitsofOreochromisniloGcusfromwildandculture
Figure2.Neighbor-joiningphylogene?ctreeshowingtherela?onshipbetween?lapiafishfromthewildandculturepopula?onsbasedonmtDNAD-loopregion
(PFF=Samplesfromtheculturepopula?on;OLP=Samplesfromthewildpopula?on)
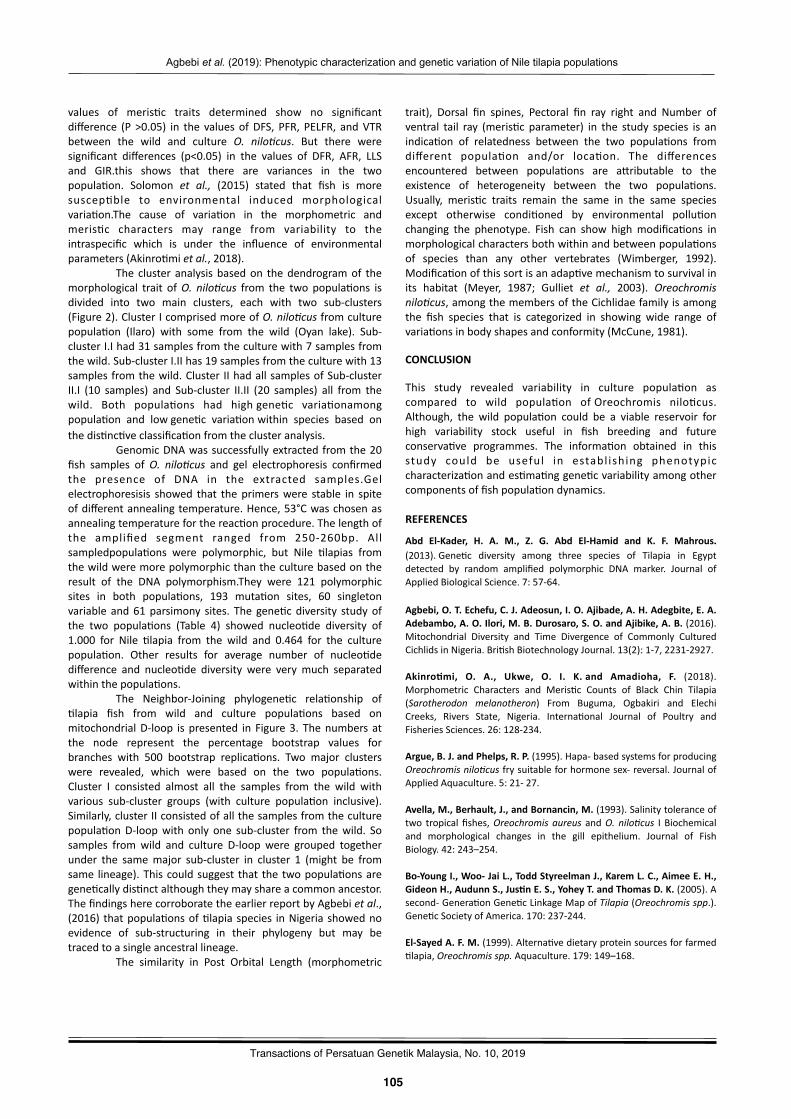
- 105 -
Agbebi et al. (2019): Phenotypic characterization and genetic variation of Nile tilapia populations
105
12
Transactions of Persatuan Genetik Malaysia, No. 10, 2019
values of meris?c traits determined show no significantdifference (P >0.05) in the valuesofDFS, PFR, PELFR, andVTRbetween the wild and culture O. niloGcus. But there weresignificant differences (p<0.05) in the values of DFR, AFR, LLSand GIR.this shows that there are variances in the twopopula?on. Solomon et al., (2015) stated that fish is moresuscep?ble to environmental induced morphologicalvaria?on.The cause of varia?on in the morphometric andmeris?c characters may range from variability to theintraspecific which is under the influence of environmentalparameters(Akinro?mietal.,2018).
The cluster analysis basedon thedendrogramof themorphological trait ofO. niloGcus from the two popula?ons isdivided into two main clusters, each with two sub-clusters(Figure2).ClusterIcomprisedmoreofO.niloGcusfromculturepopula?on (Ilaro) with some from the wild (Oyan lake). Sub-clusterI.Ihad31samplesfromtheculturewith7samplesfromthewild.Sub-clusterI.IIhas19samplesfromtheculturewith13samplesfromthewild.Cluster IIhadallsamplesofSub-clusterII.I (10 samples) and Sub-cluster II.II (20 samples) all from thewild. Both popula?ons had highgene?c varia?onamongpopula?on and lowgene?c varia?on within species based onthedis?nc?veclassifica?onfromtheclusteranalysis.
GenomicDNAwassuccessfullyextractedfromthe20fish samples ofO. niloGcus and gel electrophoresis confirmedthe presence of DNA in the extracted samples.Gelelectrophoresisis showed that theprimerswere stable in spiteofdifferentannealingtemperature.Hence,53°Cwaschosenasannealingtemperatureforthereac?onprocedure.Thelengthofthe amplified segment ranged from 250-260bp. Allsampledpopula?ons were polymorphic, but Nile ?lapias fromthewildweremorepolymorphicthantheculturebasedontheresult of the DNA polymorphism.They were 121 polymorphicsites in both popula?ons, 193 muta?on sites, 60 singletonvariable and61parsimony sites. The gene?cdiversity studyofthe two popula?ons (Table 4) showed nucleo?de diversity of1.000 for Nile ?lapia from the wild and 0.464 for the culturepopula?on. Other results for average number of nucleo?dedifference and nucleo?de diversity were very much separatedwithinthepopula?ons.
The Neighbor-Joining phylogene?c rela?onship of?lapia fish from wild and culture popula?ons based onmitochondrialD-loop ispresented in Figure3. Thenumbers atthe node represent the percentage bootstrap values forbranches with 500 bootstrap replica?ons. Two major clusterswere revealed, which were based on the two popula?ons.Cluster I consisted almost all the samples from the wild withvarious sub-cluster groups (with culture popula?on inclusive).Similarly,clusterIIconsistedofallthesamplesfromtheculturepopula?onD-loopwith only one sub-cluster from thewild. Sosamples fromwild and culture D-loop were grouped togetherunder the samemajor sub-cluster in cluster 1 (might be fromsame lineage).Thiscouldsuggest that thetwopopula?onsaregene?callydis?nctalthoughtheymayshareacommonancestor.ThefindingsherecorroboratetheearlierreportbyAgbebietal.,(2016) thatpopula?onsof?lapiaspecies inNigeriashowednoevidence of sub-structuring in their phylogeny but may betracedtoasingleancestrallineage.
The similarity in Post Orbital Length (morphometric
trait), Dorsal fin spines, Pectoral fin ray right and Number ofventral tail ray (meris?c parameter) in the study species is anindica?on of relatedness between the two popula?ons fromdifferent popula?on and/or loca?on. The differencesencountered between popula?ons are awributable to theexistence of heterogeneity between the two popula?ons.Usually, meris?c traits remain the same in the same speciesexcept otherwise condi?oned by environmental pollu?onchanging the phenotype. Fish can show highmodifica?ons inmorphologicalcharactersbothwithinandbetweenpopula?onsof species than any other vertebrates (Wimberger, 1992).Modifica?onofthissortisanadap?vemechanismtosurvivalinits habitat (Meyer, 1987; Gulliet et al., 2003). OreochromisniloGcus,amongthemembersoftheCichlidaefamilyisamongthe fish species that is categorized in showing wide range ofvaria?onsinbodyshapesandconformity(McCune,1981).
CONCLUSION
This study revealed variability in culture popula?on ascompared to wild popula?on ofOreochromis nilo?cus.Although, the wild popula?on could be a viable reservoir forhigh variability stock useful in fish breeding and futureconserva?ve programmes. The informa?on obtained in thisstudy could be useful in establ ishing phenotypiccharacteriza?onandes?ma?nggene?cvariabilityamongothercomponentsoffishpopula?ondynamics.
REFERENCES
Abd El-Kader, H. A. M., Z. G. Abd El-Hamid and K. F. Mahrous.(2013).Gene?c diversity among three species of Tilapia in Egyptdetected by random amplified polymorphic DNA marker. Journal ofAppliedBiologicalScience.7:57-64.
Agbebi,O.T.Echefu,C.J.Adeosun,I.O.Ajibade,A.H.Adegbite,E.A.Adebambo,A.O.Ilori,M.B.Durosaro,S.O.andAjibike,A.B.(2016).Mitochondrial Diversity and Time Divergence of Commonly CulturedCichlidsinNigeria.Bri?shBiotechnologyJournal.13(2):1-7,2231-2927.
AkinroWmi, O. A., Ukwe, O. I. K.and Amadioha, F. (2018).Morphometric Characters and Meris?c Counts of Black Chin Tilapia(Sarotherodon melanotheron) From Buguma, Ogbakiri and ElechiCreeks, Rivers State, Nigeria. Interna?onal Journal of Poultry andFisheriesSciences.26:128-234.
Argue,B.J.andPhelps,R.P.(1995).Hapa-basedsystemsforproducingOreochromisniloGcusfrysuitableforhormonesex-reversal.JournalofAppliedAquaculture.5:21-27.
Avella,M.,Berhault,J.,andBornancin,M.(1993).Salinitytoleranceoftwo tropical fishes,OreochromisaureusandO. niloGcus I Biochemicaland morphological changes in the gill epithelium. Journal of FishBiology.42:243–254.
Bo-YoungI.,Woo-JaiL.,ToddStyreelmanJ.,KaremL.C.,AimeeE.H.,GideonH.,AudunnS.,JusWnE.S.,YoheyT.andThomasD.K.(2005).Asecond-Genera?onGene?cLinkageMapofTilapia(Oreochromisspp.).Gene?cSocietyofAmerica.170:237-244.
El-SayedA.F.M.(1999).Alterna?vedietaryproteinsourcesforfarmed?lapia,Oreochromisspp.Aquaculture.179:149–168.
- 106 -
Agbebi et al. (2019): Phenotypic characterization and genetic variation of Nile tilapia populations
106
12
Transactions of Persatuan Genetik Malaysia, No. 10, 2019
FAO. (1999). Fish and Fishery products. World apparent consump?onsta?s?csbasedonfoodbalancesheet.FAOFisheriesCircular, (Revision5).
FAO. (2012). Part 1,World reviewof fisheries and aquaculture in: Thestate of world fisheries and aquaculture. Food and AgriculturalOrganisa?onoftheUnitedNa?ons,Rome.
Farmer, G. J. and Beamish, F. W. H. (1969). Oxygen consump?on ofTilapianiloGcainrela?ontoswimmingspeedandsalinity.ZFishRexBdCanada.26(11):2807–2821.
Grammer,G.L.,Slack,W.T.,Peterson,M.S.,andDugo,M.A. (2012).Nile ?lapia (Oreochromis niloGcus) (Linnaeus, 1758) establishment intemperate Mississippi, USA: mul?-year survival confirmed by otolithages.AquatInvasions.7(3):367–376.
Guilliet, J. M., Heins, D. C., and Hood, C. S. (2003). The effect ofphylogeny on interspecific body shape varia?on in Darters (Pisces:Percidae).Systema?cBiology.52:488-500.
McCune,A.R. (1981).Quan?ta?vedescrip?onofbody form infishes:implica?onforspeciesleveltaxonomyandecologicalinfluences.Copeia.4:897-901.
Meyer,A.(1987).Phenotypicplas?cityandheterochronyinCichlasomamanaguense (Pisces, Cichlidae) and their implica?on for specia?on incichlidfishes.Evolu?on.41:1357-1369.
Ndiwa,C.T.,Nyingi,D.,andAgnèse,J.F. (2014).An importantnaturalgene?c resource ofOreochromis niloGcus (Linnaeus, 1758) threatenedbyaquacultureac?vi?esinLoboidrainage,Kenya.PLoSOne.9(9).
Nyingi, D., De-Vos, L., Aman, R., and Agnèse, J. F. (2009). Gene?ccharacteriza?on of an unknown and endangered na?ve popula?on ofthe Nile ?lapia Oreochromis niloGcus (Linnaeus, 1758) (Cichlidae;Teleostei)intheLoboiSwamp(Kenya).Aquaculture.297:57–63.
Ola-Oladimeji, F. A., M. O. Awodiran, O. Fagbuaro and A. O.Akomolafe(2016).MorphologicalCharacteriza?onofWildandCulturedClarias gariepinus (Burchell 1822) Using Principal Component andClusterAnalyses.NotSciBiol2016.8(4):428-436.
Peterson, M. S., Slack, W. T., and Woodley, C. M. (2005). Theoccurrence of non-indigenous Nile Tilapia, Oreochromis niloGcus(Linnaeus) in coastal Mississippi: ?es to aquaculture and thermaleffluent.Wetlands.25:112–121.
Rozas, J., Sanchez-DelBarrio, J. C.,Messenguer, X., Rozas, R., (2003).DnaSP, DNA polymorphism analyses by the coalescent and othermethods.Bioinforma?cs.19:2496–2497.
SchofieldP.J.,PetersonM.S.,LoweM.R.,Brown-PetersonN.J.,andSlackW.T.(2011).Survival,growthandreproduc?onofnonindigenousNile ?lapia (Oreochromis niloGcus (Linnaeus, 1758). I Physiologicalcapabili?es to various temperatures and salini?es. Marine andFreshwaterResearch.62:439–449.
Solomon, S. G., Okomoda, V. T. and Ogbenyikwu, A. I. (2015).Intraspecificmorphologicalvaria?onbetweenculturedandwildClariasgariepinus(Burchell)(Clariidae,Siluriformes).Arch.Pol.Fish.23:53-61.
Teugels, G. G. (1986). A Systema?c Revision of the African Species oftheGenusClarias (Pisces,Clariidae).AnnalesMuseeRoyalde l’AfriqueCentrale.247:1–199.
Trewavas, E. (1983). Tilapiine fishes of the Genera Sarotherodon,OreochromisandDanakilia.London:Bri?shMuseum(NaturalHistory).
Welcomme, R. L. (1967) Observa?ons on the biology of IntroducedspeciesofTilapiainLakeVictoria.RevueZoolBotAfr.76(3–4):249–279.
Wimberger, P. H. (1992). Plas?city of fish body shape - the effects ofdiet,development,familyandageintwospeciesofGeophagus(Pisces:Cichlidae),BiologicalJournaloftheLinneanSociety.45:197-218.
- 107 -
Corresponding author:
Transactions of Persatuan Genetik Malaysia, No. 10, 2019 Published by Genetics Society of Malaysia http://www.pgm-my.org
93
107
Morphometric variations of Oreochromis niloticus from three wild populations in South-west (Eleyele, Owalla and Owena) Nigeria
Agbebi Olubunmi Temilade1, Amadi Chukwuemeka Kennet1, Akinyemi Grace1, and Sanni Muyideen Timothy2
1 Department of Aquaculture and Fisheries Management, Federal University of Agriculture, Abeokuta (FUNAAB), Ogun State, Nigeria. PMB 2240, Abeokuta, Nigeria2 Department of Animal Breeding and Genetics,Federal University of Agriculture, Abeokuta (FUNAAB), Ogun State, Nigeria. PMB 2240, Abeokuta, Nigeria
Abstract
Onehundredandfi�y(150)fishspecimensofOreochromisniloGcusrepresen?ngfi�y(50)fromeachofthepopula?onweresampledfromthefishermenlandingstostudytheirphenotypicvaria?ons.FishsampleswerecollectedfromEleyele,OwallaandOwena(Oyo,OsunandOndoStatesofSouth-West,Nigeriarespec?vely).Dataonmorphometricandmeris?cweresubjectedtoOneWayANOVAat5%levelofsignificanceandPrincipalComponentAnalysis.TheKaiser-Meyer-OlkinMeasureofSamplingAdequacyforEleyele(0.9),Owalla(0.8)andOwena(0.9)wereadequate.Twoprincipalcomponents(PC)wereextractedintwopopula?ons(EleyeleandOwalla)and one principal component in Owena. With Owena popula?ons showing the highest percentage variability for PC1 (83.2%),followed by Owalla and Eleyele popula?ons (78.1% and 71.4%) respec?vely. The existence of morphological varia?ons in wildpopula?onsshowedthatOwenapopula?onisthebiggest,followedbyOwallaandthesmallest,Eleyeleintermsofsize.Thissignifiesthatallmorphometricparameterswere importantfortheclassifica?onofOreochromisniloGcus.Fromthisstudy, itwasconcludedthatbodydepth,totallength,standardlengthandheadlengthhadthehighestanddirectposi?vecontribu?ontotheenhancementofbodysizeoftheOreochromisnilo?cusacrossthethreerivers.
Agbebi Olubunmi Temilade, Dept. of Aquaculture and Fisheries Management, Federal University of Agriculture, Abeokuta, Ogun State, Nigeria. PMB 2240, Abeokuta, NigeriaEmail: [email protected]
Keywords:Fish,meris?c,morphometric,OreochromisniloGcus,popula?on
Line
LastKey
IntroINTRODUCTION
Tilapia is a large genus in cichlid family Cichlidae, whichaccordingtoNelson(2006) isthethird largestfish intheworldandoneof themostdiversefish species.Tilapia is thegenericname of a group of cichlids endemic to Africa. The groupconsists of three aquaculture important genera Oreochromis,Sarotherodon and Tilapia. Several characteris?cs dis?nguishthese three genera, but possibly the most cri?cal relates toreproduc?ve behaviour. All ?lapia species are nest builders;fer?lizedeggsareguardedinthenestbyabroodparent.Thespecies ischosenbecauseof its rela?velyshortgenera?on?meofabout sixmonthsand its suitability for inves?ga?onoftheapplica?onofgene?cs inaquaculturefromconserva?onofgene?c resources to breeding programmes Eknath and Hulata(2009) and breed in cap?vity and they are enjoying wideacceptance as food fish because of their high palatability andhistoryofusefrominlandfisheries.
The species canbediscriminatedphysiologically; it isverydifficultto iden?fythemwithmeris?c indexfortheyhavemany overlapping characters especially at the juvenile stage(Bailey, 1997). However, morphological parameters andbiometrical characteris?cs which involve morphometricmeasurement and meris?c count have over the years beenemployedtoiden?fyfishstocks(Turanetal.,2004).Tothisday
it s?ll remains the simplest and most direct way amongmethodsofspeciesiden?fica?on.Thestudyofdifferencesandvariability in morphometric and meris?c characters of fishstocks is important inphylogene?csandproviding informa?onfor subsequent studieson the gene?c improvementof stocks.Morphometric and meris?c characters are generally used forfi sh i den?fica?on . Morphomet r i c cha ra c te rs a remeasurablecharacters of a fish while themeris?c counts arecountablecharacters. Examples ofmeris?c counts are thenumberofdorsalfinspines,thenumberofdorsalfinrays,thenumber of pectoral fin rays to men?on but a few whilemorphometric characters are total length, standard length,headlengthandsoon(Solomonetal.,2015).
Iden?fica?onofspeciesisaprimarysteptowardsanyresearchwork and plays a key role for the behavioural study.Fish species iden?fica?on is tradi?onally based on externalmorphological features, including body shape, pawern ofcolours, scale size and count, number and rela?ve posi?on offins, number and type of fin rays, or various rela?vemeasurements of body parts (Strauss and Bond, 1990). Gillrakers are some?mes counted to differen?ate very similarspecies ( Iffat, 2002). However when none of theaforemen?oned characters are not available otoliths can beoccasionallyusedtoiden?fyfossilsorstomachcontents(PierceandBoyle,1991;GranadeiroandSilva,2000).
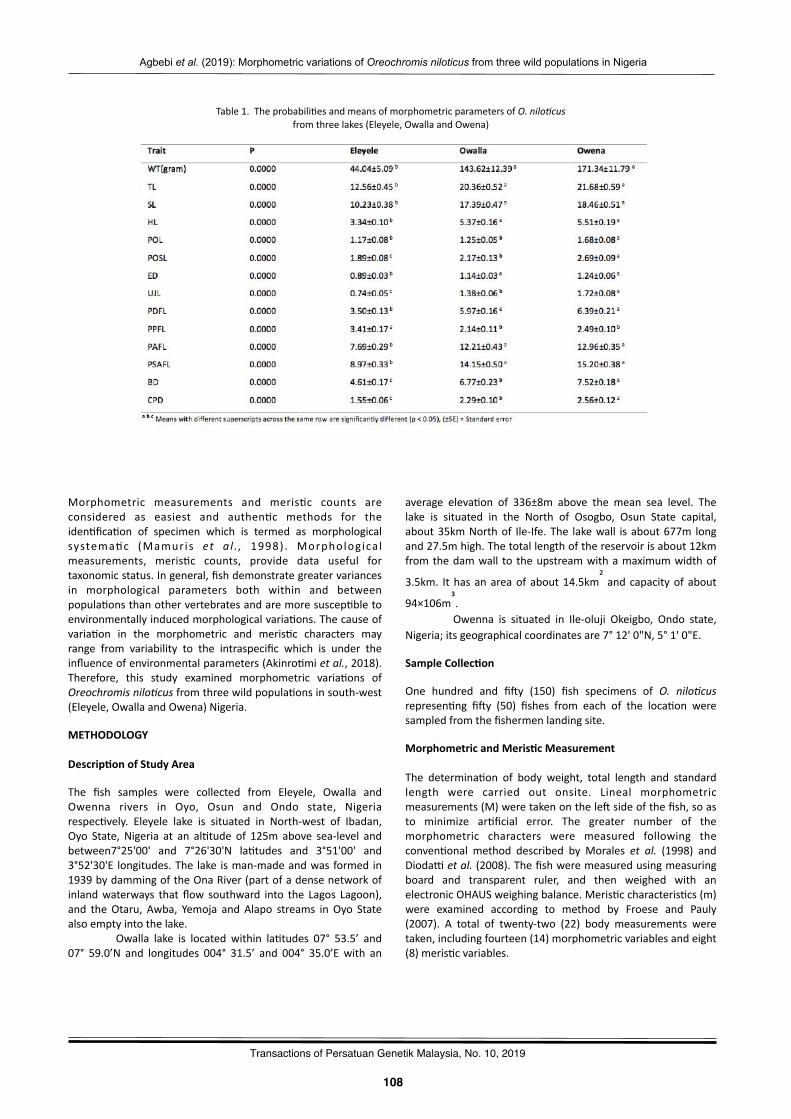
- 108 -
Agbebi et al. (2019): Morphometric variations of Oreochromis niloticus from three wild populations in Nigeria
108
13
Transactions of Persatuan Genetik Malaysia, No. 10, 2019
Morphometric measurements and meris?c counts areconsidered as easiest and authen?c methods for theiden?fica?on of specimen which is termed as morphologicalsystema?c (Mamuris et a l . , 1998) . Morphologica lmeasurements, meris?c counts, provide data useful fortaxonomicstatus.Ingeneral,fishdemonstrategreatervariancesin morphological parameters both within and betweenpopula?onsthanothervertebratesandaremoresuscep?bletoenvironmentallyinducedmorphologicalvaria?ons.Thecauseofvaria?on in the morphometric and meris?c characters mayrange from variability to the intraspecific which is under theinfluenceofenvironmentalparameters(Akinro?mietal.,2018).Therefore, this study examined morphometric varia?ons ofOreochromisniloGcusfromthreewildpopula?onsinsouth-west(Eleyele,OwallaandOwena)Nigeria.
METHODOLOGY
DescripWonofStudyArea
The fish samples were collected from Eleyele, Owalla andOwenna rivers in Oyo, Osun and Ondo state, Nigeriarespec?vely. Eleyele lake is situated in North-west of Ibadan,Oyo State, Nigeria at an al?tude of 125m above sea-level andbetween7°25'00' and 7°26'30'N la?tudes and 3°51'00' and3°52'30'E longitudes.The lake isman-madeandwasformed in1939bydammingoftheOnaRiver(partofadensenetworkofinlandwaterways that flow southward into the Lagos Lagoon),and theOtaru, Awba, Yemoja and Alapo streams inOyo Statealsoemptyintothelake.
Owalla lake is located within la?tudes 07° 53.5’ and07° 59.0’N and longitudes 004° 31.5’ and 004° 35.0’E with an
average eleva?on of 336±8m above the mean sea level. Thelake is situated in the North of Osogbo, Osun State capital,about35kmNorthof Ile-Ife.The lakewall isabout677m longand27.5mhigh.Thetotallengthofthereservoirisabout12kmfromthedamwall to theupstreamwithamaximumwidthof
3.5km. Ithasanareaof about14.5km²andcapacityof about
94×106m³.Owenna is situated in Ile-oluji Okeigbo, Ondo state,
Nigeria;itsgeographicalcoordinatesare7°12'0"N,5°1'0"E.
SampleCollecWon
One hundred and fi�y (150) fish specimens of O. niloGcusrepresen?ng fi�y (50) fishes from each of the loca?on weresampledfromthefishermenlandingsite.
MorphometricandMerisWcMeasurement
The determina?on of body weight, total length and standardlength were carried out onsite. Lineal morphometricmeasurements(M)weretakenonthele�sideofthefish,soasto minimize ar?ficial error. The greater number of themorphometric characters were measured following theconven?onal method described by Morales et al. (1998) andDiodacetal.(2008).Thefishweremeasuredusingmeasuringboard and transparent ruler, and then weighed with anelectronicOHAUSweighingbalance.Meris?ccharacteris?cs(m)were examined according to method by Froese and Pauly(2007). A total of twenty-two (22) body measurements weretaken,includingfourteen(14)morphometricvariablesandeight(8)meris?cvariables.
Table1.Theprobabili?esandmeansofmorphometricparametersofO.niloGcusfromthreelakes(Eleyele,OwallaandOwena)
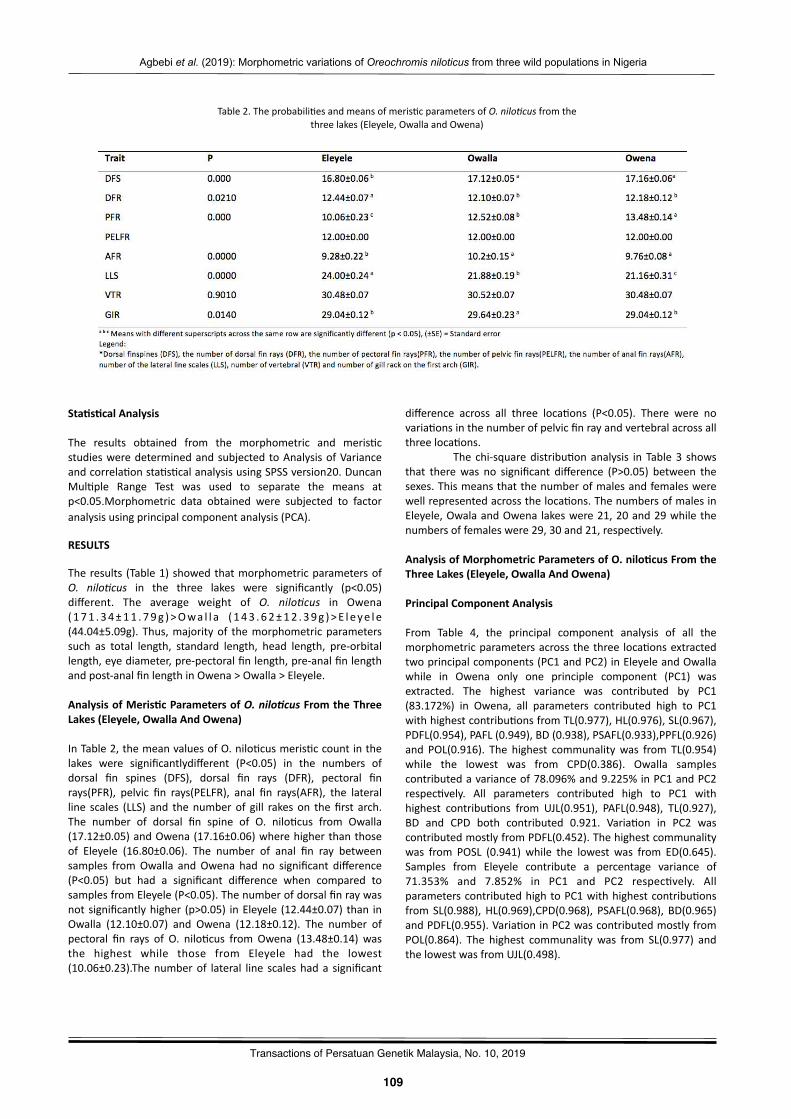
- 109 -
Agbebi et al. (2019): Morphometric variations of Oreochromis niloticus from three wild populations in Nigeria
109
13
Transactions of Persatuan Genetik Malaysia, No. 10, 2019
Table2.Theprobabili?esandmeansofmeris?cparametersofO.niloGcusfromthethreelakes(Eleyele,OwallaandOwena)
StaWsWcalAnalysis
The results obtained from the morphometric and meris?cstudiesweredeterminedandsubjectedtoAnalysisofVarianceandcorrela?onsta?s?calanalysisusingSPSSversion20.DuncanMul?ple Range Test was used to separate the means atp<0.05.Morphometric data obtained were subjected to factoranalysisusingprincipalcomponentanalysis(PCA).
RESULTS
Theresults (Table1)showedthatmorphometricparametersofO. niloGcus in the three lakes were significantly (p<0.05)different. The average weight of O. niloGcus in Owena( 171 .34±11 .79g )>Owa l l a ( 143 .62±12 .39g )>E l eye l e(44.04±5.09g).Thus,majorityof themorphometricparameterssuch as total length, standard length, head length, pre-orbitallength,eyediameter,pre-pectoralfinlength,pre-analfinlengthandpost-analfinlengthinOwena>Owalla>Eleyele.AnalysisofMerisWcParametersofO.nilo1cusFromtheThreeLakes(Eleyele,OwallaAndOwena)
InTable2,themeanvaluesofO.nilo?cusmeris?ccountinthelakes were significantlydifferent (P<0.05) in the numbers ofdorsal fin spines (DFS), dorsal fin rays (DFR), pectoral finrays(PFR), pelvic fin rays(PELFR), anal fin rays(AFR), the lateralline scales (LLS) and thenumberof gill rakeson thefirst arch.The number of dorsal fin spine of O. nilo?cus from Owalla(17.12±0.05)andOwena(17.16±0.06)wherehigherthanthoseof Eleyele (16.80±0.06). The number of anal fin ray betweensamples fromOwalla andOwena had no significant difference(P<0.05) but had a significant difference when compared tosamplesfromEleyele(P<0.05).Thenumberofdorsalfinraywasnotsignificantlyhigher (p>0.05) inEleyele (12.44±0.07) than inOwalla (12.10±0.07) and Owena (12.18±0.12). The number ofpectoral fin rays of O. nilo?cus from Owena (13.48±0.14) wasthe highest while those from Eleyele had the lowest(10.06±0.23).Thenumberof lateral line scaleshada significant
difference across all three loca?ons (P<0.05). There were novaria?onsinthenumberofpelvicfinrayandvertebralacrossallthreeloca?ons.
The chi-squaredistribu?onanalysis in Table3 showsthat therewas no significant difference (P>0.05) between thesexes.Thismeansthatthenumberofmalesandfemaleswerewellrepresentedacrosstheloca?ons.ThenumbersofmalesinEleyele,OwalaandOwena lakeswere21,20and29whilethenumbersoffemaleswere29,30and21,respec?vely.
AnalysisofMorphometricParametersofO.niloWcusFromtheThreeLakes(Eleyele,OwallaAndOwena)
PrincipalComponentAnalysis
From Table 4, the principal component analysis of all themorphometricparametersacrossthethree loca?onsextractedtwoprincipalcomponents(PC1andPC2)inEleyeleandOwallawhile in Owena only one principle component (PC1) wasextracted. The highest variance was contributed by PC1(83.172%) in Owena, all parameters contributed high to PC1withhighestcontribu?onsfromTL(0.977),HL(0.976),SL(0.967),PDFL(0.954),PAFL(0.949),BD(0.938),PSAFL(0.933),PPFL(0.926)and POL(0.916). The highest communalitywas from TL(0.954)while the lowest was from CPD(0.386). Owalla samplescontributedavarianceof78.096%and9.225%inPC1andPC2respec?vely. All parameters contributed high to PC1 withhighest contribu?ons from UJL(0.951), PAFL(0.948), TL(0.927),BD and CPD both contributed 0.921. Varia?on in PC2 wascontributedmostlyfromPDFL(0.452).Thehighestcommunalitywas from POSL (0.941) while the lowest was from ED(0.645).Samples from Eleyele contribute a percentage variance of71.353% and 7.852% in PC1 and PC2 respec?vely. AllparameterscontributedhightoPC1withhighestcontribu?onsfrom SL(0.988),HL(0.969),CPD(0.968), PSAFL(0.968), BD(0.965)andPDFL(0.955).Varia?oninPC2wascontributedmostlyfromPOL(0.864). The highest communalitywas from SL(0.977) andthelowestwasfromUJL(0.498).
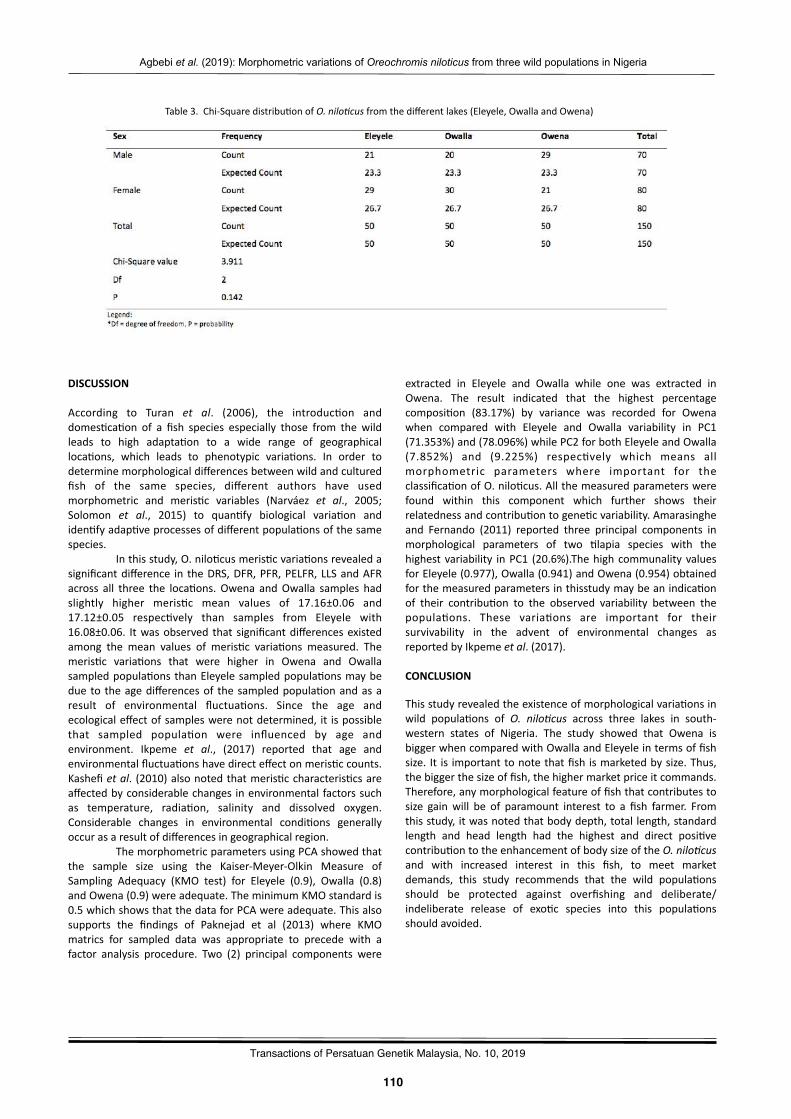
- 110 -
Agbebi et al. (2019): Morphometric variations of Oreochromis niloticus from three wild populations in Nigeria
110
13
Transactions of Persatuan Genetik Malaysia, No. 10, 2019
DISCUSSION
According to Turan et al. (2006), the introduc?on anddomes?ca?on of a fish species especially those from the wildleads to high adapta?on to a wide range of geographicalloca?ons, which leads to phenotypic varia?ons. In order todeterminemorphologicaldifferencesbetweenwildandculturedfish of the same species, different authors have usedmorphometric and meris?c variables (Narváez et al., 2005;Solomon et al., 2015) to quan?fy biological varia?on andiden?fyadap?veprocessesofdifferentpopula?onsofthesamespecies.
Inthisstudy,O.nilo?cusmeris?cvaria?onsrevealedasignificantdifference in theDRS,DFR,PFR,PELFR,LLSandAFRacross all three the loca?ons.Owena andOwalla samples hadslightly higher meris?c mean values of 17.16±0.06 and17.12±0.05 respec?vely than samples from Eleyele with16.08±0.06. Itwasobserved that significantdifferencesexistedamong the mean values of meris?c varia?ons measured. Themeris?c varia?ons that were higher in Owena and Owallasampledpopula?onsthanEleyelesampledpopula?onsmaybedueto theagedifferencesof thesampledpopula?onandasaresult of environmental fluctua?ons. Since the age andecologicaleffectofsampleswerenotdetermined, it ispossiblethat sampled popula?on were influenced by age andenvironment. Ikpeme et al., (2017) reported that age andenvironmentalfluctua?onshavedirecteffectonmeris?ccounts.Kashefietal. (2010)alsonotedthatmeris?ccharacteris?csareaffectedbyconsiderablechanges inenvironmentalfactorssuchas temperature, radia?on, salinity and dissolved oxygen.Considerable changes in environmental condi?ons generallyoccurasaresultofdifferencesingeographicalregion.
ThemorphometricparametersusingPCAshowedthatthe sample size using the Kaiser-Meyer-Olkin Measure ofSampling Adequacy (KMO test) for Eleyele (0.9), Owalla (0.8)andOwena(0.9)wereadequate.TheminimumKMOstandardis0.5whichshowsthatthedataforPCAwereadequate.Thisalsosupports the findings of Paknejad et al (2013) where KMOmatrics for sampled data was appropriate to precede with afactor analysis procedure. Two (2) principal components were
extracted in Eleyele and Owalla while one was extracted inOwena. The result indicated that the highest percentagecomposi?on (83.17%) by variance was recorded for Owenawhen compared with Eleyele and Owalla variability in PC1(71.353%)and(78.096%)whilePC2forbothEleyeleandOwalla(7.852%) and (9.225%) respec?vely which means allmorphometric parameters where important for theclassifica?onofO.nilo?cus.Allthemeasuredparameterswerefound within this component which further shows theirrelatednessandcontribu?ontogene?cvariability.Amarasingheand Fernando (2011) reported three principal components inmorphological parameters of two ?lapia species with thehighestvariability inPC1 (20.6%).ThehighcommunalityvaluesforEleyele(0.977),Owalla(0.941)andOwena(0.954)obtainedforthemeasuredparametersinthisstudymaybeanindica?onof their contribu?on to the observed variability between thepopula?ons. These varia?ons are important for theirsurvivability in the advent of environmental changes asreportedbyIkpemeetal.(2017).
CONCLUSION
Thisstudyrevealedtheexistenceofmorphologicalvaria?onsinwild popula?ons of O. niloGcus across three lakes in south-western states of Nigeria. The study showed that Owena isbiggerwhencomparedwithOwallaandEleyeleintermsoffishsize. It is importanttonotethatfishismarketedbysize.Thus,thebiggerthesizeoffish,thehighermarketpriceitcommands.Therefore,anymorphologicalfeatureoffishthatcontributestosize gainwill be of paramount interest to a fish farmer. Fromthisstudy,itwasnotedthatbodydepth,totallength,standardlength and head length had the highest and direct posi?vecontribu?ontotheenhancementofbodysizeoftheO.niloGcusand with increased interest in this fish, to meet marketdemands, this study recommends that the wild popula?onsshould be protected against overfishing and deliberate/indeliberate release of exo?c species into this popula?onsshouldavoided.
Table3.Chi-Squaredistribu?onofO.niloGcusfromthedifferentlakes(Eleyele,OwallaandOwena)
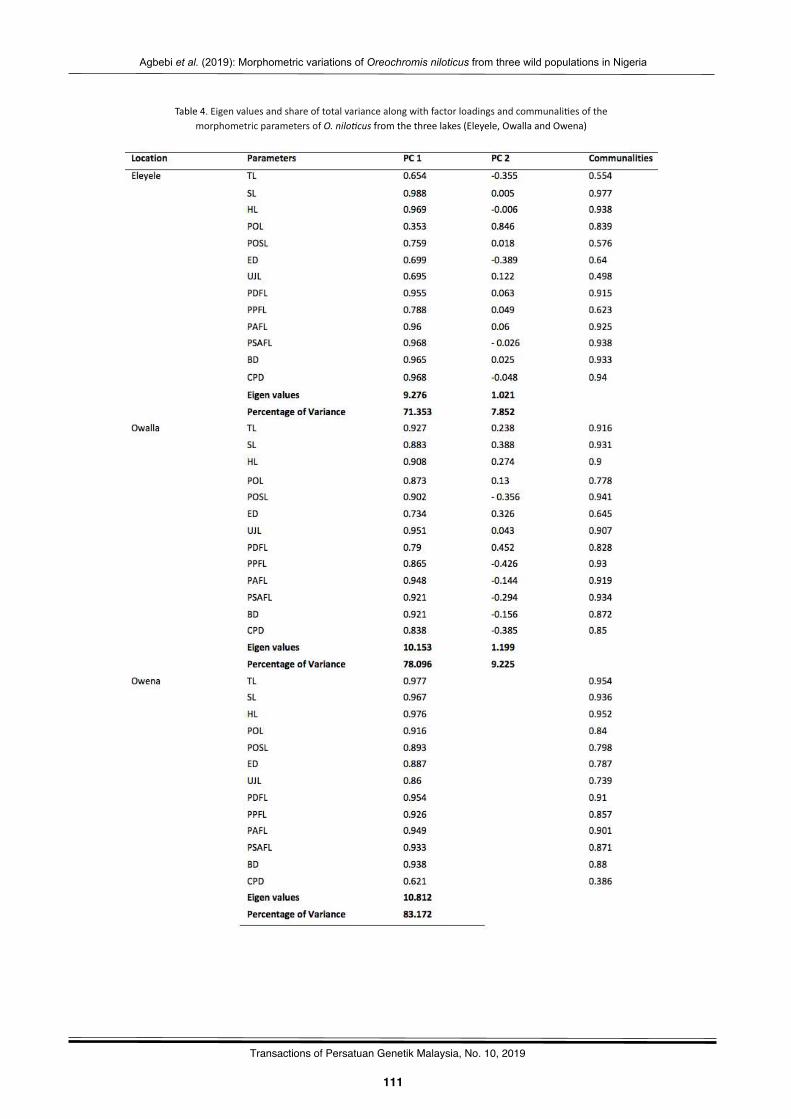
- 111 -
Agbebi et al. (2019): Morphometric variations of Oreochromis niloticus from three wild populations in Nigeria
111
13
Transactions of Persatuan Genetik Malaysia, No. 10, 2019
Table4.Eigenvaluesandshareoftotalvariancealongwithfactorloadingsandcommunali?esofthemorphometricparametersofO.niloGcusfromthethreelakes(Eleyele,OwallaandOwena)
- 112 -
Agbebi et al. (2019): Morphometric variations of Oreochromis niloticus from three wild populations in Nigeria
112
13
Transactions of Persatuan Genetik Malaysia, No. 10, 2019
REFERENCES
AkinroWmi, O. A., Ukwe, O. I. K.and Amadioha, F. (2018).Morphometric Characters and Meris?c Counts of Black Chin Tilapia(Sarotherodonmelanotheron)FromBuguma,OgbakiriandElechiCreeks,Rivers State, Nigeria. Interna?onal Journal of Poultry and FisheriesSciences.26:128-234.
Amarasinghe, U. S. and Fernando, G. K. A.W. (2011).Morphologicaldifferen?a?onof two cichlid species in Sri Lankausing trussnetworks.SriLankaJournalofAqua?cSciences.16:01-10.
Bailey, K. M. (1997). Structural dynamics and ecology of flat fishpopula?ons.JournalSeaResources.37:269-280.
Diodau,F.C.,FonsecadeFreitas,R.T.,Freato,T.A.,PérezRibeiro,P.A., and Solis Murgas, L. D. (2008). Parámetrosmorfométricos en elrendimiento de los component escorporales de ?lapia del Nilo (O.niloGcus).AnalesdeVeterinariadeMurcia.24:45–55.
EknathandHulata.(2009).Useandexchangeofgene?crespourcesofNile?lapiaOreochromisniloGcus. ReviewsinAquaculture.1(3-4):197-213.
Froese, R. andD. Pauly. (2007). FishBase.WorldWideWeb electronicpublica?on.www.fishbase.org,version(09/2007).
Granadeiro, J. P. and Silva, M. A. (2000). The use of otoliths andvertebrae in the iden?fica?on and size-es?ma?on of fish in predator-preystudies,Cybium.24:383–393.
Iffat, F. (2002). Mullets of Korangi Creek, Karachi. Rec ZoolSurv Pak.14:11–18.
Ikpeme, E. V., EkereJe, E. E., Udensi, O. U. andOzoje,M.O. (2017).Assessmentofmorphologicalvaria?oninwildandculturedpopula?onsof ?lapia fish (O. niloGcus). Journal of Advances in Biology &Biotechnology.13(2):1-10.
Kashefi, P., Bani, A., and Ebrahimi, E. (2010). Morphometric andmeris?c varia?ons between non-reproduc?ve and reproduc?ve kutumfemales(RuGlusfrisiikutum,Kamensky,1901),inthesouthwestCaspianSea.ItalianJournalofZoology.79:337-343.
Mamuris, Z., Apostolidis A. P., Panagiotaki P., Theodorou, A. J., andTriantaphllidis,C. (1998).Morphological varia?onbetween redmulletpopula?onsinGreece.JournalofFishBiology.52:107-117.
Morales-VelaB.,Garcia-RodriguezA. I., B.W.BowenB.V.,DomningD,Mignucci-Giannoni A. A., MarmontelM., Montoya-Ospina,R.A.,Rudin,M., and Bonde. (n.d.). R.manatus: howmany popula?onsandhowmanytaxa?MolecularEcology7(9):1137-1149.
Narváez,B.,Acero,A.,andBlanco,J.(2005).Variaciónmorfométricaenpoblacionesnaturalizadas y domes?cadas de la ?lapia del NiloOreochromisniloGcus (Teleostei:Cichlidae) en el norte de Colombia.RevistadelaAcademiaColombianadeCiencias.29:383–394.
Nelson,J.S.(2006).Fishesoftheworld.4|}edi?on.Wiley,NewYork.pp390.
Paknejad,S.,Heidari,A.andMousavi-Sabet,H.(2013).Morphologicalvaria?on of shad fish Alosa brashnicowi (Teleostei, Clupeidae)popula?ons along the southern Caspian Sea coasts, using a trusssystem.Interna?onalJournalofAqua?cBiology.2(6):330-336
Pierce, G. J. and Boyle, P. R. (1991). A review of methods for dietanalysis in piscivorousmarinemammals. OceanogrMar Biol Ann Rev(Lond).29:409–486.
Solomon S. G., Okomoda V. T., and Ogbenyikwu A. I. (2015).Intraspecificmorphologicalvaria?onbetweenculturedandwildClariasgariepinus(Burchell)(Clariidae,Siluriformes).Arch.Pol.Fish.23:53-61.
Strauss,R.E.andBond,C.E.(1990).Taxonomicmethods:morphology.In: Schreck CB, Moyle PB (eds) Methods for fish biology. AmericanFisheriesSociety,Maryland.pp109–140.
Turan, C., Erguden, D., Turan, F. and Gurlek,M. (2004). Gene?c andmorphologicstructureofLizaabu(Heckel,1843)popula?onsfromtheRiversOrontes,EuphratesandTigris.TurkishJournalofVeterinaryandAnimalScience.28:729-734.
Turan, C., Oral, M., Öztürk, B., and Düzgüne, S. E. (2006).Morphometric and meris?c varia?on between stocks of Bluefish(Pomatomussaltatrix)intheBlack,Marmara,AegeanandnortheasternMediterraneanSeasFish.Res.79:139–147.
- 113 -Transactions of Persatuan Genetik Malaysia, No. 10, 2019
113
AAdibahYahya,31AffridaAbuHassan,1AgbebiOlubunmiTemilade,101,107AhmadMukhlisAbdulRahman,25AhmadNorhisyamAbdullah,61AkinyemiGrace,107AmadiChukwuemekaKennet,107AmirulAsrafTumin,47AndiNadiaNurulLathifaHawa,51ArinaYusuf,25AzwanAwang,73
BBadmus,K.A.,95BudiWaluyo,13,87
CChindyUlimaZanewa,13
DDarmawanSaptadi,13,87DewiSukma,51DhabitahKamaruzzaman,7
EErnie-Muneerah,M.A.,95
FFaizAhmad,1FakunleKikelomoRebecca,101
GGhizanSaleh,81GohHuaLek,47Goh,Y.M.,95
HHazwaniHumaira’Zakaria,7
IIsmailMaskromo,51
KKamalludin,M.H.,95KhadijahAwang,57
MMaizuraAbuSin,81MayangAyudyaHandini,87MohamaduBoyieJalloh,73MohammadNazriRomli,1MohdKhairuddinOthman,57MohdNorAwaluddin,57MohdShukriMatAli,57Mohd.AsrulSani,61Mohd.AzinuddinAhmadMokhtar,25Mohd.FaizalAbuBakar,31,41Mohd.FaridAhmad,31Mohd.MusanifGhazali,61Mohd.NoorMatIsa,41Mohd.ShahrilFirdausAbdulRazak,21Mohd.ZakiAbdullah,31,41MuhamadHafizMuhamadHassan,21MuhammadAfiqTajolAriffin,61MuhammadNajibOthmanGhani,21MustaphaAkil,1
NNadiahSalmiNadzri,67NashatulZaimahNoorAzman,67NorAsmahHassan,67NorHasnidaHassan,41NorRashidahMustapa,67NoralizaAlias,67NorliaBasherudin,7,31,41Norwa?Adnan,7Norwa?Muhammad,7,41NurAzlinRazali,61NurNabilahAlias,7,31,41NurulHikmah,87NwekoyoVitalis,101
OOyalekeOdunayoBisola,101
PPauziahMuda,61PedramKashiani,81PoeyShaoJiann,73
RRazaliMustaffa,61RosdiKoter,67RozlailyZainol,61
AUTHOR INDEX

- 114 -Transactions of Persatuan Genetik Malaysia, No. 10, 2019
114
SSalehudinMd.Radzuan,61SamsuddinAhmadSyazwan,31SanniMuyideenTimothy,101,107Sazili,Q.S.,95Si?AisyahAbdullah,61Si?SofiahMohamad,57Soleimani,A.F.,95SudarsonoSudarsono,51
VVijayKumarSubbiah,25
WWanMahfuzahWanIbrahim,61
ZZaitonAhmad,1ZarinaZakaria,25ZulHelmeyMohamadSabdin,21Zulkifli,I.,95ZulmadiSani,1
- 115 -Transactions of Persatuan Genetik Malaysia, No. 10, 2019
115
SUBJECT INDEX
AAcacia,31accessions,87Agrodyke-induced,31Agronomiccharacteris?cs,73Agronomic,1,73Aquilariamalaccensis,67Beseri,,1brinjal,7broiler,95
BBt,7
CCeratocysGs,31characteris?cs,73characteriza?on,101characters,61chicken,95coastal,57coconut,51combiningability,81content,25corn,81cross-pollina?on,61cul?vars,25culturepopula?ons,101culture,101
Ddata,51defense,31deficit,73development,51diversity,13,95dryland,73durian,61DuriozibethinusL.,61
EEE-1,7effect,73Eleyele,10encapsula?on,67Endospermummalaccense,67es?ma?on,87event,7expressed,41
Ffeedrestric?on,95feed,95foragecorn,81forage,81fruit,61
Ggenes,31gene?cdistance,,81gene?cparameterses?ma?on,87gene?cparameters,87gene?cvaria?on,101gene?c,13,87,101genomedata,51genome,51germina?on,67growth,47
HHarumanis,21,25heat,95heterosis,81heterozygosity,25hybridperformance,81hybrid,31,81
Iiden?fica?on,31,41,51invitrogermina?on,67invitropropaga?on,67invitro,67inbredlines,81inbred,81Indonesia,13infec?on,31influence,95informa?on,25inhabi?ng,57Ipomoeasp.,57
Kkenaf,1Kopyormutant,51Kopyor,51
Llandrace,13length,95lines,1,81lowlands,13,87
- 116 -Transactions of Persatuan Genetik Malaysia, No. 10, 2019
116
MMalaysia,57Mangiferaindica,21mango,21,25markerdevelopment,51marker,51markers,25measures,47morphological,13morphometricvaria?on,101morphometric,101MusangKing,61mutant,1,51
NNGSgenomedata,51NGS,51Nigeria,10,47Nile?lapia,101Nile,101nursery,47
OOreochromisniloGcus,101Owalla,10Owena,10
Ppalm,47parameters,87parentalinbredlines,81parentallines,81parental,81paternaleffect,61pathways,31pawern,73pea,13performance,1,81Perlis,1phenotypiccharacteriza?on,101phenotypic,101PisumsaGvumL.,13,87polyembryonic,21polymorphism,25popula?ons,101poten?al,1,13propaga?on,67prospected,47proteinpawern,73protein,73
Rrela?onship,81response,31restric?on,95rice,73root,41
SSabah,73SCA,81SDS-PAGEproteinpawern,73SDS-PAGE,73seedlings,21selected,1selec?on,87sequence,25,51similarity,7South-westNigeria,10species,57specificcombiningability,81SSR,25,51stresses,95study,21,41,61,67
TT-64,7telomerelengthtelomerelengthdiversitytelomere,95
third(3��)cyclederiva?ves,47?lapia,101TongkatAli,41traits,13,47transcrip?onfactor,41transfer,47
Vvalida?on,7values,25varia?on,10,101varie?es,73
Wwaterdeficit,73water,73wildIpomoeasp.,57wildpopula?ons,10,101wild,10,101,57wild,57WRKY,41


Contact Us:
Persatuan Genetik Malaysia (Genetics Society of Malaysia)
Website: www.pgm-org.my