
NMR Structure of Free RGS4 Reveals an Induced Conformational Change upon Binding G
11
NMR Structure of Free RGS4 Reveals an Induced Conformational Change upon Binding GR ‡ Franklin J. Moy, § Pranab K. Chanda, | Mark I. Cockett, | Wade Edris, | Philip G. Jones, | Kim Mason, § Simon Semus, § and Robert Powers* ,§ Departments of Biological Chemistry and Neurosciences, Wyeth Research, 85 Bolton Street, Cambridge, Massachusetts 02140 ReceiVed December 2, 1999; ReVised Manuscript ReceiVed April 10, 2000 ABSTRACT: Heterotrimeric guanine nucleotide-binding proteins (G-proteins) are transducers in many cellular transmembrane signaling systems where regulators of G-protein signaling (RGS) act as attenuators of the G-protein signal cascade by binding to the GR subunit of G-proteins (G iR1 ) and increasing the rate of GTP hydrolysis. The high-resolution solution structure of free RGS4 has been determined using two- dimensional and three-dimensional heteronuclear NMR spectroscopy. A total of 30 structures were calculated by means of hybrid distance geometry-simulated annealing using a total of 2871 experimental NMR restraints. The atomic rms distribution about the mean coordinate positions for residues 5-134 for the 30 structures is 0.47 ( 0.05 Å for the backbone atoms, 0.86 ( 0.05 Å for all atoms, and 0.56 ( 0.04 Å for all atoms excluding disordered side chains. The NMR solution structure of free RGS4 suggests a significant conformational change upon binding G iR1 as evident by the backbone atomic rms difference of 1.94 Å between the free and bound forms of RGS4. The underlying cause of this structural change is a perturbation in the secondary structure elements in the vicinity of the G iR1 binding site. A kink in the helix between residues K116-Y119 is more pronounced in the RGS4-G iR1 X-ray structure relative to the free RGS4 NMR structure, resulting in a reorganization of the packing of the N-terminal and C-terminal helices. The presence of the helical disruption in the RGS4-G iR1 X-ray structure allows for the formation of a hydrogen-bonding network within the binding pocket for G iR1 on RGS4, where RGS4 residues D117, S118, and R121 interact with residue T182 from G iR1 . The binding pocket for G iR1 on RGS4 is larger and more accessible in the free RGS4 NMR structure and does not present the preformed binding site observed in the RGS4-G iR1 X-ray structure. This observation implies that the successful complex formation between RGS4 and G iR1 is dependent on both the formation of the bound RGS4 conformation and the proper orientation of T182 from G iR1 . The observed changes for the free RGS4 NMR structure suggest a mechanism for its selectivity for the GR-GTP-Mg 2+ complex and a means to facilitate the GTPase cycle. A ubiquitous component of signal transduction pathways is a heterotrimeric guanine nucleotide-binding protein (G-protein) 1 coupled to a cell surface receptor (for reviews see refs 1-4). G-proteins relay signals initiated by photons, odorants, and a number of hormones and neurotransmitters where a variety of diseases are caused by defects in G-protein activity. The structure of the G-protein is composed of an R-subunit (GR) that is associated with both the intracellular carboxy-terminal tail of a seven-helical transmembrane receptor and weakly bound to a dimer (Gγ) of a -subunit tightly bound to a γ-subunit. G-proteins transfer signals from more than 1000 receptors where various GR subtypes regulate a variety of distinct downstream signaling pathways and the guanine nucleotide binding, and GTPase function within the GR domain regulates the activity of G-proteins. The G-protein signaling process is typically initiated by the binding of an agonist to the cell surface receptor, resulting in an induced conformational change in the G-protein. The G-protein structural change affects the guanine nucleotide affinity of GR where it preferentially binds GTP and Mg 2+ over GDP. Numerous X-ray structures for G iR1 during the various stages of the GTPase cycle have identified regions of induced conformational changes (5-8). In particular, the GR guanine nucleotide-binding site is composed of three distinct “switch” regions: residues V179-V185 in switch I, residues Q204-H213 in switch II, and residues A235- N237 in switch III, which undergo conformational changes ‡ Atomic coordinates for the 30 final simulated annealing structures and the restrained minimized mean structure of RGS4 have been deposited in the Brookhaven Protein Data Bank (codes 1ezy and 1ezt). * Corresponding author. Telephone: (617)-665-7997. Fax: (617)- 665-8993. E-mail: [email protected]. § Department of Biological Chemistry. | Department of Neurosciences. 1 Abbreviations: G-proteins, heterotrimeric guanine nucleotide- binding proteins; RGS4, regulators of G-protein signaling; GiR1,GR subunit of heterotrimeric G-proteins; GiR1-AlF4 - ,GR subunit of heterotrimeric G-proteins complexed with Mg 2+ , GDP, and AlF4 - stabilized in the transition state for GTP hydrolysis; DTT, DL-1,4- dithiothreitol; GTP, guanosine triphosphate; GDP, guanosine diphos- phate; NMR, nuclear magnetic resonance; 2D, two dimensional; 3D, three dimensional; HSQC, heteronuclear single-quantum coherence spectroscopy; HMQC, heteronuclear multiple-quantum coherence spectroscopy; TPPI, time-proportional phase incrementation; NOE, nuclear Overhauser effect; NOESY, nuclear Overhauser enhanced spectroscopy; COSY, correlated spectroscopy; HNHA, amide proton to nitrogen to CRH proton correlation; HNHB, amide proton to nitrogen to CH proton correlation; CT-HCACO, constant time CRH proton to R-carbon to carbonyl correlation; HACAHB, CRH proton to R-carbon to CH proton correlation. 7063 Biochemistry 2000, 39, 7063-7073 10.1021/bi992760w CCC: $19.00 © 2000 American Chemical Society Published on Web 05/20/2000
-
Upload
independent -
Category
Documents
-
view
0 -
download
0
Transcript of NMR Structure of Free RGS4 Reveals an Induced Conformational Change upon Binding G
NMR Structure of Free RGS4 Reveals an Induced Conformational Change uponBinding GR‡
Franklin J. Moy,§ Pranab K. Chanda,| Mark I. Cockett,| Wade Edris,| Philip G. Jones,| Kim Mason,§
Simon Semus,§ and Robert Powers*,§
Departments of Biological Chemistry and Neurosciences, Wyeth Research, 85 Bolton Street, Cambridge, Massachusetts 02140
ReceiVed December 2, 1999; ReVised Manuscript ReceiVed April 10, 2000
ABSTRACT: Heterotrimeric guanine nucleotide-binding proteins (G-proteins) are transducers in many cellulartransmembrane signaling systems where regulators of G-protein signaling (RGS) act as attenuators of theG-protein signal cascade by binding to the GR subunit of G-proteins (GiR1) and increasing the rate ofGTP hydrolysis. The high-resolution solution structure of free RGS4 has been determined using two-dimensional and three-dimensional heteronuclear NMR spectroscopy. A total of 30 structures werecalculated by means of hybrid distance geometry-simulated annealing using a total of 2871 experimentalNMR restraints. The atomic rms distribution about the mean coordinate positions for residues 5-134 forthe 30 structures is 0.47( 0.05 Å for the backbone atoms, 0.86( 0.05 Å for all atoms, and 0.56( 0.04Å for all atoms excluding disordered side chains. The NMR solution structure of free RGS4 suggests asignificant conformational change upon binding GiR1 as evident by the backbone atomic rms differenceof 1.94 Å between the free and bound forms of RGS4. The underlying cause of this structural change isa perturbation in the secondary structure elements in the vicinity of the GiR1 binding site. A kink in thehelix between residues K116-Y119 is more pronounced in the RGS4-GiR1 X-ray structure relative tothe free RGS4 NMR structure, resulting in a reorganization of the packing of the N-terminal and C-terminalhelices. The presence of the helical disruption in the RGS4-GiR1 X-ray structure allows for the formationof a hydrogen-bonding network within the binding pocket for GiR1 on RGS4, where RGS4 residues D117,S118, and R121 interact with residue T182 from GiR1. The binding pocket for GiR1 on RGS4 is larger andmore accessible in the free RGS4 NMR structure and does not present the preformed binding site observedin the RGS4-GiR1 X-ray structure. This observation implies that the successful complex formation betweenRGS4 and GiR1 is dependent onboth the formation of the bound RGS4 conformation and the properorientation of T182 from GiR1. The observed changes for the free RGS4 NMR structure suggest a mechanismfor its selectivity for the GR-GTP-Mg2+ complex and a means to facilitate the GTPase cycle.
A ubiquitous component of signal transduction pathwaysis a heterotrimeric guanine nucleotide-binding protein(G-protein)1 coupled to a cell surface receptor (for reviewssee refs1-4). G-proteins relay signals initiated by photons,odorants, and a number of hormones and neurotransmitterswhere a variety of diseases are caused by defects in G-proteinactivity. The structure of the G-protein is composed of anR-subunit (GR) that is associated with both the intracellularcarboxy-terminal tail of a seven-helical transmembranereceptor and weakly bound to a dimer (Gâγ) of a â-subunittightly bound to aγ-subunit. G-proteins transfer signals frommore than 1000 receptors where various GR subtypesregulate a variety of distinct downstream signaling pathwaysand the guanine nucleotide binding, and GTPase functionwithin the GR domain regulates the activity of G-proteins.
The G-protein signaling process is typically initiated bythe binding of an agonist to the cell surface receptor, resulting
in an induced conformational change in the G-protein. TheG-protein structural change affects the guanine nucleotideaffinity of GR where it preferentially binds GTP and Mg2+
over GDP. Numerous X-ray structures for GiR1 during thevarious stages of the GTPase cycle have identified regionsof induced conformational changes (5-8). In particular, theGR guanine nucleotide-binding site is composed of threedistinct “switch” regions: residues V179-V185 in switchI, residues Q204-H213 in switch II, and residues A235-N237 in switch III, which undergo conformational changes
‡ Atomic coordinates for the 30 final simulated annealing structuresand the restrained minimized mean structure of RGS4 have beendeposited in the Brookhaven Protein Data Bank (codes 1ezy and 1ezt).
* Corresponding author. Telephone: (617)-665-7997. Fax: (617)-665-8993. E-mail: [email protected].
§ Department of Biological Chemistry.| Department of Neurosciences.
1 Abbreviations: G-proteins, heterotrimeric guanine nucleotide-binding proteins; RGS4, regulators of G-protein signaling; GiR1, GRsubunit of heterotrimeric G-proteins; GiR1-AlF4
-, GR subunit ofheterotrimeric G-proteins complexed with Mg2+, GDP, and AlF4-
stabilized in the transition state for GTP hydrolysis; DTT,DL-1,4-dithiothreitol; GTP, guanosine triphosphate; GDP, guanosine diphos-phate; NMR, nuclear magnetic resonance; 2D, two dimensional; 3D,three dimensional; HSQC, heteronuclear single-quantum coherencespectroscopy; HMQC, heteronuclear multiple-quantum coherencespectroscopy; TPPI, time-proportional phase incrementation; NOE,nuclear Overhauser effect; NOESY, nuclear Overhauser enhancedspectroscopy; COSY, correlated spectroscopy; HNHA, amide protonto nitrogen to CRH proton correlation; HNHB, amide proton to nitrogento CâH proton correlation; CT-HCACO, constant time CRH proton toR-carbon to carbonyl correlation; HACAHB, CRH proton toR-carbonto CâH proton correlation.
7063Biochemistry2000,39, 7063-7073
10.1021/bi992760w CCC: $19.00 © 2000 American Chemical SocietyPublished on Web 05/20/2000
upon GTP hydrolysis. In the active GR-GTP-Mg2+ com-plex, switch II and switch III regions become well ordereddue to ionic interactions between the two switch regionswhere the conformational change in switch I is associatedwith binding Mg2+. The GR surface that binds the Gâγ dimercontains switch I and switch II regions. As a result of theformation of the GR-GTP-Mg2+ complex, modificationsin the structure of the three switch regions facilitate dis-sociation of GR from Gâγ. The released subunits are thenavailable to interact with a variety of target proteins to elicitthe desired response. Termination of the signal results whenthe process is reversed by the hydrolysis of GTP bound toGR. The reassociation of GR with Gâγ then occurs, whichresults in the inactivation of the G-protein. Therefore, theduration of the G-protein signal is directly dependent on theGTPase activity of the GR protein.
Regulators of G-protein signaling (RGS) affect the inten-sity and duration of the G-protein signal cascade by bindingto the active GR-GTP-Mg2+ complex and inducing a 50-fold increase in the rate of GTP hydrolysis (for reviews seerefs 9-13). Conversely, RGS proteins have little to noaffinity for the inactive GR-GDP complex. Thus, RGS actas attenuators of the induced G-protein signal by increasingthe rate of inactivation of the G-protein and termination ofthe signal. The RGS family contains more than 20 memberswhere specificity for GR subtypes has been demonstratedand is probably associated with subtle sequence differences(8, 14). RGS proteins are widely expressed (13). At leastone RGS protein is found in every organ where many tissuesexpress multiple RGS proteins. Additionally, members ofthe RGS family have region-specific expression in the brainwhere RGS42 is perhaps the most widely distributed andhighly expressed RGS subtype (15, 16). The regulation ofRGS expression suggests an adaptive response in the brainsignal transduction pathway to compensate for desensitizationand sensitization of G-protein-coupled receptor function sinceRGS expression has been correlated with a response to aninduced seizure (16). In addition to response to neurotrans-miters, RGS activity has been associated with a variety ofcellular functions including prolifferation, differentiation,membrane trafficking, and embryonic development (9, 10,12, 17).
An X-ray structure of RGS4 bound to GiR1 (8), site-directedmutagenesis data (18-20), and biochemical studies (17, 21)suggest a potential mechanism for the RGS-induced GRhydrolysis of GTP. These results imply that RGS4 bindspreferentially to the GR-GTP-Mg2+ complex and stabilizesthe transition state structure of the switch regions, stimulatingthe intrinsic GTPase activity. Verifying this proposed mech-anism fundamentally requires obtaining structural informationfor both free GiR1 and RGS4. Extensive structural informationis available for GiR1 in five conformations thought to mimicthe various stages of GiR1 in the GTPase cycle (5-8). Thispermits a direct comparison of GiR1 in the complex withRGS4 with other GiR1 conformers. These comparisonsindicate that GiR1 in the RGS4-GiR1 complex exhibits onlya 0.6 Å rms difference with GiR1 in the GiR1-AlF4
- X-ray
structure, where GiR1 is complexed with Mg2+, GDP, andAlF4
- and is trapped in the transition state for GTPhydrolysis. Additionally, the RGS4-GiR1 X-ray structureindicates that RGS4 binding induces a decrease in themobility of the switch regions where critical interactionsoccur between r-N823 from RGS4 with switch regions I andII of GiR1 and between a-T182 from GiR1 with a bindingpocket on RGS4. The RGS4 residue r-N82 has beenidentified as critical for facilitating the intrinsic GiR1 GTPaseactivity presumably by stabilizing the switch regions andsubstrate binding (19, 20). Similar changes in the switchregions are observed between the GR-GTP-Mg2+ complexand the GR-GDP complex (2). Since the functional resultof RGS4 binding to GiR1 is to induce GTP hydrolysis, it isreasonable to anticipate that the conformational change uponcomplex formation primarily occurs in GiR1. Nevertheless,in the absence of a free RGS4 structure it is difficult tospeculate on a conformational contribution for RGS4 in thecomplex and how this may contribute to the selectivity ofRGS4 for the GR-GTP-Mg2+ complex and the inducedGTPase activity and corresponding signal termination.Toward this goal we have previously presented the nearlycomplete1H, 15N, 13C, and13CO resonance assignments andsecondary structure for RGS4 (22), and in this paper, wepresent the determination of the high-resolution solutionconformation of free RGS4.
MATERIALS AND METHODS
NMR Sample Preparation.Uniformly (>95%) 15N- and15N/13C-labeled recombinant RGS4 (19.0 kDa, 166 aminoacids, pI 7.3) was expressed inEscherichia coliand purifiedas described previously (22). The NMR samples contained1 mM RGS4 in a buffer containing 50 mM potassiumphosphate, 2 mM NaN3, and 50 mM deuterated DTT, ineither 90% H2O/10% D2O or 100% D2O at pH 6.0.
NMR Data Collection. All spectra were recorded at 35°C on a Bruker AMX-2 600 spectrometer using a gradient-enhanced triple-resonance1H/13C/15N probe. For spectrarecorded in H2O, water suppression was achieved with theWATERGATE sequence and water flip-back pulses (23, 24).Quadrature detection in the indirectly detected dimensionswas recorded with the States-TPPI hypercomplex phaseincrement (25). Spectra were collected with appropriaterefocusing delays to allow for 0, 0 or-90, 180 phasecorrection.
The RGS4 structure is based on the following series ofspectra: HNHA (26), HNHB (27), 3D long-range13C-13Ccorrelation (28), coupled CT-HCACO (29, 30), HACAHB-COSY (31), and 3D15N- (32, 33) and 13C-edited NOESY(34, 35) experiments. The15N-edited NOESY and13C-editedNOESY experiments were collected with 100 and 120 msmixing times, respectively.
Spectra were processed using the NMRPipe softwarepackage (36) and analyzed with PIPP (37) on a Sun Ultra10 workstation. When appropriate, data processing includeda solvent filter, zero-padding data to a power of 2, linearpredicting back one data point of indirectly acquired data toobtain zero phase corrections, and linear prediction of
2 Numbering for RGS4 is from amino acid residue 1 for the 158-residue RGS core domain form with an N-terminal Met and a six-residue histidine tag at the C-terminus. For comparison to the full-length RGS4 sequence, add 46 to the NMR sequence.
3 Sequence numbers of RGS4 residues are prefixed with “r-”, andthose of GR are prefixed with “a-”.
7064 Biochemistry, Vol. 39, No. 24, 2000 Moy et al.
additional points for the indirectly acquired dimensions toincrease resolution. Linear prediction by means of the mirrorimage technique was used only for constant-time experiments(38). In all cases data were processed with a skewed sine-bell apodization function, and one zero-filling was used inall dimensions.
Interproton Distance Restraints.The NOEs assigned from3D 13C-edited NOESY and 3D15N-edited NOESY experi-ments were classified into strong, medium, weak, and veryweak, corresponding to interproton distance restraints of 1.8-2.7 Å (1.8-2.9 Å for NOEs involving NH protons), 1.8-3.3 Å (1.8-3.5 Å for NOEs involving NH protons), 1.8-5.0 Å, and 3.0-6.0 Å, respectively (39, 40). Upper distancelimits for distances involving methyl protons and nonste-reospecifically assigned methylene protons were correctedappropriately for center averaging (41).
Torsion Angle Restraints and Stereospecific Assignments.The â-methylene stereospecific assignments andø1 torsionangle restraints were obtained primarily from a qualitativeestimate of the magnitude of3JRâ coupling constants fromthe HACAHB-COSY experiment (31) and 3JNâ couplingconstants from the HNHB experiment (27). Further supportfor the assignments was obtained from approximate distancerestraints for intraresidue NOEs involving NH, CRH, andCâH protons (42).
Theφ andψ torsion angle restraints were obtained from3JNHR coupling constants measured from the relative intensityof HR cross-peaks to the NH diagonal in the HNHAexperiment (26), from chemical shift analysis using theTALOS program (43), and from consistency with distancerestraints for intraresidue and sequential NOEs involving NH,CRH, and CâH protons.1JCRHR coupling constants obtainedfrom a coupled 3D CT-HCACO spectrum were used toascertain the presence of non-glycine residues with positiveφ backbone torsion angles (30). The presence of a1JCRHR
coupling constant greater than 130 Hz allowed for aminimum φ restraint of-2° to -178°.
The Ile and Leuø2 torsion angle restraints and thestereospecific assignments for leucine methyl groups weredetermined from3JCRCδ coupling constants obtained from therelative intensity of CR and Cδ cross-peaks in a 3D long-range13C-13C NMR correlation spectrum (44), in conjunc-tion with the relative intensities of intraresidue NOEs (45).Stereospecific assignments for valine methyl groups weredetermined on the basis of the relative intensity of intraresi-due NH-CγH and CRH-CγH NOEs as described byZuiderweg et al. (46). The minimum ranges employed fortheφ, ψ, andø torsion angle restraints were( 30°, ( 50°,and( 20°, respectively (47).
Structure Calculations.The structures were calculatedusing the hybrid distance geometry-dynamical simulatedannealing method of Nilges et al. (48) with minor modifica-tions (49) using the program X-PLOR (50), adapted toincorporate pseudopotentials for3JNHR coupling constants(51), secondary13CR/13Câ chemical shift restraints (52), anda conformational database potential (53, 54). The targetfunction that is minimized during restrained minimizationand simulated annealing comprises only quadratic harmonicterms for covalent geometry,3JNHR coupling constants andsecondary13CR/13Câ chemical shift restraints, square-wellquadratic potentials for the experimental distance and torsionangle restraints, and a quartic van der Waals term for
nonbonded contacts. All peptide bonds were constrained tobe planar and trans. There were no hydrogen-bonding,electrostatic, or 6-12 Lennard-Jones empirical potentialenergy terms in the target function.
Analysis of the a-T182 Binding Site on RGS4.The overallappearance of the NMR structure in the area of the proposeda-T182 binding site is one of greater size and accessibility.To obtain a more quantitative measurement of the differencesin accessibility between the free RGS4 NMR structure andthe X-ray structure of the RGS4-GiR1 complex, MOLCADsurfaces were calculated for both structures, and the surfacearea of each was measured.
The X-ray structure of the RGS4-GiR1 complex (AGR1)was read into SYBYL (Tripos), and all substructures exceptchain E (RGS4) were deleted. Additionally, all waters weredeleted. Polar hydrogens were added and optimized usingthe Kollman united atom force field. This was followed byaddition of all of the remaining hydrogens. MOLCAD wasthen used to generate a surface for all residues thought tobe involved in binding of a-T182. These residues includer-I21, r-I27, r-F30, r-F33, r-L34, r-E37, r-S39, r-N42, r-I43,r-W46, r-I110, r-L113, r-M114, r-D117, r-S118, and r-R121.The surface area was calculated on the basis of theMOLCAD surface. MOLCAD was also used to calculatethe surface area for the identical residues of the free RGS4NMR structure. The surface area for the free RGS4 NMRstructure was calculated to be 404.56 Å2. The surface areafor the crystal structure was calculated to be 321.88 Å2. Thedifference in surface area of 82.67 Å2 is an approximate 20%change in surface area between the two structures. AMOLCAD surface generated on the methyl and hydroxylgroups of a-T182 has a surface area of 57.72 Å2.
RESULTS
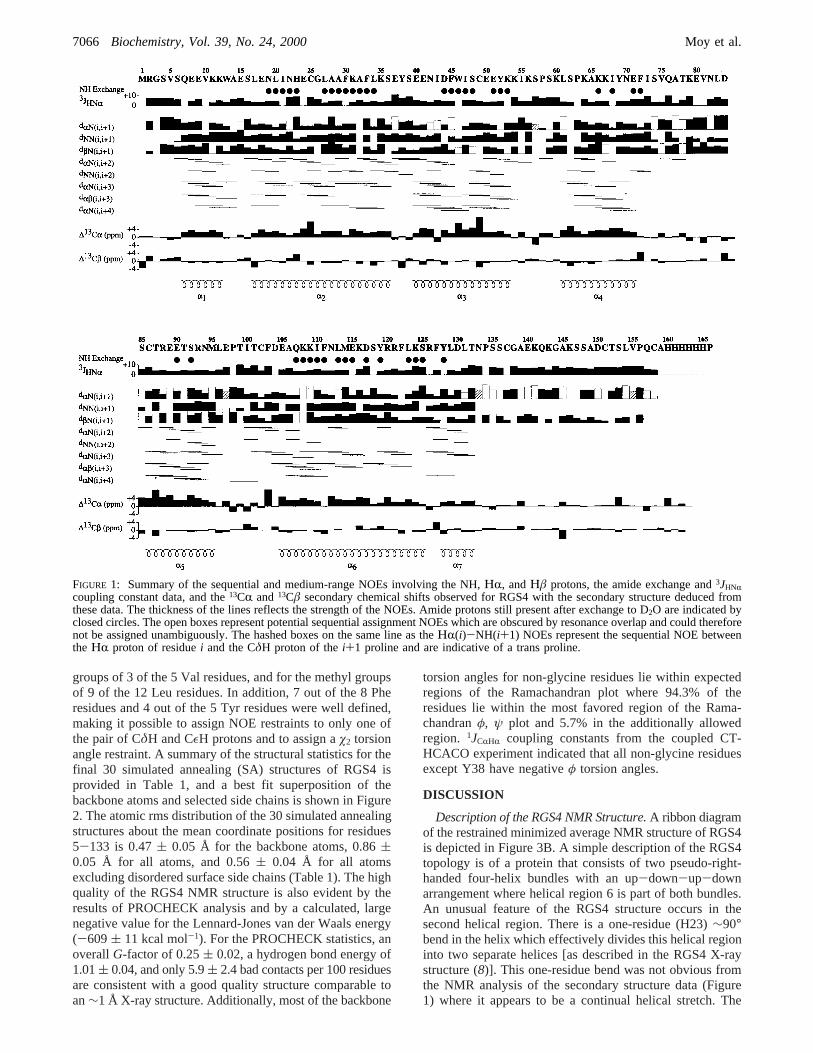
Secondary Structure Analysis.The regular secondarystructure elements of free RGS4 were identified from aqualitative analysis of sequential and interstrand NOEs, NHexchange rates,3JHNR coupling constants, and the13CR and13Câ secondary chemical shifts (55, 56). The sequential andmedium-range NOEs were obtained from a qualitativeanalysis of the15N-edited NOESY and13C-edited NOESYspectra.3JHNR coupling constants were obtained from therelative intensity ofΗR cross-peaks to the NH diagonal inthe HNHA experiment (26). Slowly exchanging NH protonswere identified by recording an HSQC spectrum 2 h afterexchanging an RGS4 sample from H2O to D2O. These data,together with the deduced secondary structure elements, aresummarized in Figure 1. The overall structure of RGS4 iscomposed of seven helical regions corresponding to residuesQ7-K12 (R1), L17-S36 (R2), E40-K53 (R3), L61-E71(R4), C86-M95 (R5), E105-S125 (R6), and Y128-T132(R7).
Structure Determination.The final 30 simulated annealingstructures were calculated on the basis of 2871 experimentalNMR restraints consisting of 1960 approximate interprotondistance restraints, 78 distance restraints for 39 backbonehydrogen bonds, 431 torsion angle restraints comprised of151φ, 154ψ, 97 ø1, and 29ø2 torsion angle restraints, 1323JNHR restraints, and 136 CR and 134 Câ chemical shiftrestraints. Stereospecific assignments were obtained for 58of the 125 residues withâ-methylene protons, for the methyl
Solution Structure of Free RGS4 Biochemistry, Vol. 39, No. 24, 20007065
groups of 3 of the 5 Val residues, and for the methyl groupsof 9 of the 12 Leu residues. In addition, 7 out of the 8 Pheresidues and 4 out of the 5 Tyr residues were well defined,making it possible to assign NOE restraints to only one ofthe pair of CδH and CεH protons and to assign aø2 torsionangle restraint. A summary of the structural statistics for thefinal 30 simulated annealing (SA) structures of RGS4 isprovided in Table 1, and a best fit superposition of thebackbone atoms and selected side chains is shown in Figure2. The atomic rms distribution of the 30 simulated annealingstructures about the mean coordinate positions for residues5-133 is 0.47( 0.05 Å for the backbone atoms, 0.86(0.05 Å for all atoms, and 0.56( 0.04 Å for all atomsexcluding disordered surface side chains (Table 1). The highquality of the RGS4 NMR structure is also evident by theresults of PROCHECK analysis and by a calculated, largenegative value for the Lennard-Jones van der Waals energy(-609( 11 kcal mol-1). For the PROCHECK statistics, anoverallG-factor of 0.25( 0.02, a hydrogen bond energy of1.01( 0.04, and only 5.9( 2.4 bad contacts per 100 residuesare consistent with a good quality structure comparable toan∼1 Å X-ray structure. Additionally, most of the backbone
torsion angles for non-glycine residues lie within expectedregions of the Ramachandran plot where 94.3% of theresidues lie within the most favored region of the Rama-chandranφ, ψ plot and 5.7% in the additionally allowedregion. 1JCRHR coupling constants from the coupled CT-HCACO experiment indicated that all non-glycine residuesexcept Y38 have negativeφ torsion angles.
DISCUSSION
Description of the RGS4 NMR Structure.A ribbon diagramof the restrained minimized average NMR structure of RGS4is depicted in Figure 3B. A simple description of the RGS4topology is of a protein that consists of two pseudo-right-handed four-helix bundles with an up-down-up-downarrangement where helical region 6 is part of both bundles.An unusual feature of the RGS4 structure occurs in thesecond helical region. There is a one-residue (H23)∼90°bend in the helix which effectively divides this helical regioninto two separate helices [as described in the RGS4 X-raystructure (8)]. This one-residue bend was not obvious fromthe NMR analysis of the secondary structure data (Figure1) where it appears to be a continual helical stretch. The
FIGURE 1: Summary of the sequential and medium-range NOEs involving the NH,ΗR, andΗâ protons, the amide exchange and3JHNRcoupling constant data, and the13CR and13Câ secondary chemical shifts observed for RGS4 with the secondary structure deduced fromthese data. The thickness of the lines reflects the strength of the NOEs. Amide protons still present after exchange to D2O are indicated byclosed circles. The open boxes represent potential sequential assignment NOEs which are obscured by resonance overlap and could thereforenot be assigned unambiguously. The hashed boxes on the same line as theΗR(i)-NH(i+1) NOEs represent the sequential NOE betweenthe ΗR proton of residuei and the CδH proton of thei+1 proline and are indicative of a trans proline.
7066 Biochemistry, Vol. 39, No. 24, 2000 Moy et al.
bend only became apparent during the structure refinementprocess. Some observable NOEs that contribute to the bendat H23 occur between residues L20, I21 and residues G26,L27, A29, and F30. The bend at H23 effectively allows forappropriate packing of these hydrophobic side chains.
Additional bends or turns occur throughout the RGS4structure. Helical regionsR1 andR2 are connected by residueS16 that adopts an extended conformation, allowing these
two helices to be essentially parallel. This is very similar tothe turns connecting helical regionsR3 and R4 and helicalregionsR5 and R6. Conversely, helical regionsR2 and R3
are connected by Y38 that has a positiveφ torsion angle,suggesting aâ-type turn. The conformation of Y38 resultsin an angle between helical regionsR2 andR3 of ∼45°, whichalso represents a transition point between the two pseudo-four-helix bundles. The longest loop in the structure occurs
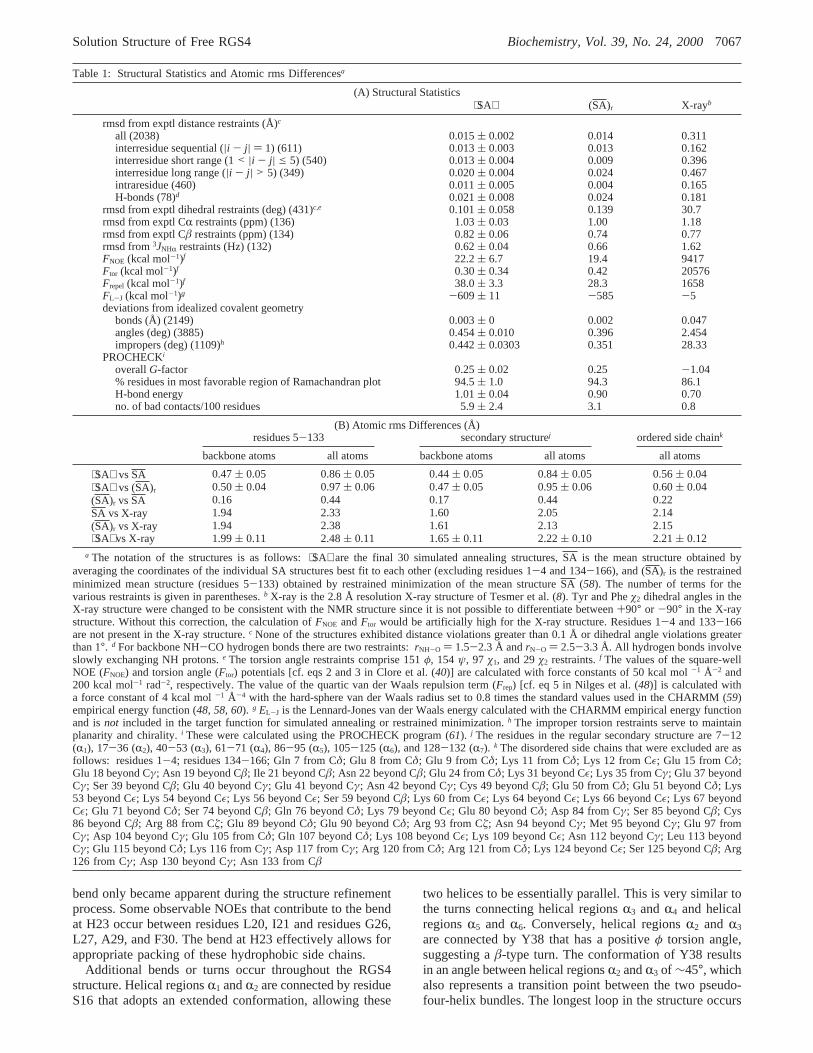
Table 1: Structural Statistics and Atomic rms Differencesa
(A) Structural Statistics⟨SA⟩ (SA)r X-rayb
rmsd from exptl distance restraints (Å)c
all (2038) 0.015( 0.002 0.014 0.311interresidue sequential (|i - j| ) 1) (611) 0.013( 0.003 0.013 0.162interresidue short range (1< |i - j| e 5) (540) 0.013( 0.004 0.009 0.396interresidue long range (|i - j| > 5) (349) 0.020( 0.004 0.024 0.467intraresidue (460) 0.011( 0.005 0.004 0.165H-bonds (78)d 0.021( 0.008 0.024 0.181
rmsd from exptl dihedral restraints (deg) (431)c,e 0.101( 0.058 0.139 30.7rmsd from exptl CR restraints (ppm) (136) 1.03( 0.03 1.00 1.18rmsd from exptl Câ restraints (ppm) (134) 0.82( 0.06 0.74 0.77rmsd from3JNHR restraints (Hz) (132) 0.62( 0.04 0.66 1.62FNOE (kcal mol-1)f 22.2( 6.7 19.4 9417Ftor (kcal mol-1)f 0.30( 0.34 0.42 20576Frepel (kcal mol-1)f 38.0( 3.3 28.3 1658FL-J (kcal mol-1)g -609( 11 -585 -5deviations from idealized covalent geometry
bonds (Å) (2149) 0.003( 0 0.002 0.047angles (deg) (3885) 0.454( 0.010 0.396 2.454impropers (deg) (1109)h 0.442( 0.0303 0.351 28.33
PROCHECKi
overallG-factor 0.25( 0.02 0.25 -1.04% residues in most favorable region of Ramachandran plot 94.5( 1.0 94.3 86.1H-bond energy 1.01( 0.04 0.90 0.70no. of bad contacts/100 residues 5.9( 2.4 3.1 0.8
(B) Atomic rms Differences (Å)residues 5-133 secondary structurej ordered side chaink
backbone atoms all atoms backbone atoms all atoms all atoms
⟨SA⟩ vsSA 0.47( 0.05 0.86( 0.05 0.44( 0.05 0.84( 0.05 0.56( 0.04⟨SA⟩ vs (SA)r 0.50( 0.04 0.97( 0.06 0.47( 0.05 0.95( 0.06 0.60( 0.04(SA)r vsSA 0.16 0.44 0.17 0.44 0.22SA vs X-ray 1.94 2.33 1.60 2.05 2.14(SA)r vs X-ray 1.94 2.38 1.61 2.13 2.15⟨SA⟩ vs X-ray 1.99( 0.11 2.48( 0.11 1.65( 0.11 2.22( 0.10 2.21( 0.12
a The notation of the structures is as follows:⟨SA⟩ are the final 30 simulated annealing structures,SA is the mean structure obtained byaveraging the coordinates of the individual SA structures best fit to each other (excluding residues 1-4 and 134-166), and (SA)r is the restrainedminimized mean structure (residues 5-133) obtained by restrained minimization of the mean structureSA (58). The number of terms for thevarious restraints is given in parentheses.b X-ray is the 2.8 Å resolution X-ray structure of Tesmer et al. (8). Tyr and Pheø2 dihedral angles in theX-ray structure were changed to be consistent with the NMR structure since it is not possible to differentiate between+90° or -90° in the X-raystructure. Without this correction, the calculation ofFNOE andFtor would be artificially high for the X-ray structure. Residues 1-4 and 133-166are not present in the X-ray structure.c None of the structures exhibited distance violations greater than 0.1 Å or dihedral angle violations greaterthan 1°. d For backbone NH-CO hydrogen bonds there are two restraints:rNH-O ) 1.5-2.3 Å andrN-O ) 2.5-3.3 Å. All hydrogen bonds involveslowly exchanging NH protons.e The torsion angle restraints comprise 151φ, 154 ψ, 97 ø1, and 29ø2 restraints.f The values of the square-wellNOE (FNOE) and torsion angle (Ftor) potentials [cf. eqs 2 and 3 in Clore et al. (40)] are calculated with force constants of 50 kcal mol-1 Å-2 and200 kcal mol-1 rad-2, respectively. The value of the quartic van der Waals repulsion term (Frep) [cf. eq 5 in Nilges et al. (48)] is calculated witha force constant of 4 kcal mol-1 Å-4 with the hard-sphere van der Waals radius set to 0.8 times the standard values used in the CHARMM (59)empirical energy function (48, 58, 60). g EL-J is the Lennard-Jones van der Waals energy calculated with the CHARMM empirical energy functionand isnot included in the target function for simulated annealing or restrained minimization.h The improper torsion restraints serve to maintainplanarity and chirality.i These were calculated using the PROCHECK program (61). j The residues in the regular secondary structure are 7-12(R1), 17-36 (R2), 40-53 (R3), 61-71 (R4), 86-95 (R5), 105-125 (R6), and 128-132 (R7). k The disordered side chains that were excluded are asfollows: residues 1-4; residues 134-166; Gln 7 from Cδ; Glu 8 from Cδ; Glu 9 from Cδ; Lys 11 from Cδ; Lys 12 from Cε; Glu 15 from Cδ;Glu 18 beyond Cγ; Asn 19 beyond Câ; Ile 21 beyond Câ; Asn 22 beyond Câ; Glu 24 from Cδ; Lys 31 beyond Cε; Lys 35 from Cγ; Glu 37 beyondCγ; Ser 39 beyond Câ; Glu 40 beyond Cγ; Glu 41 beyond Cγ; Asn 42 beyond Cγ; Cys 49 beyond Câ; Glu 50 from Cδ; Glu 51 beyond Cδ; Lys53 beyond Cε; Lys 54 beyond Cε; Lys 56 beyond Cε; Ser 59 beyond Câ; Lys 60 from Cε; Lys 64 beyond Cε; Lys 66 beyond Cε; Lys 67 beyondCε; Glu 71 beyond Cδ; Ser 74 beyond Câ; Gln 76 beyond Cδ; Lys 79 beyond Cε; Glu 80 beyond Cδ; Asp 84 from Cγ; Ser 85 beyond Câ; Cys86 beyond Câ; Arg 88 from Cú; Glu 89 beyond Cδ; Glu 90 beyond Cδ; Arg 93 from Cú; Asn 94 beyond Cγ; Met 95 beyond Cγ; Glu 97 fromCγ; Asp 104 beyond Cγ; Glu 105 from Cδ; Gln 107 beyond Cδ; Lys 108 beyond Cε; Lys 109 beyond Cε; Asn 112 beyond Cγ; Leu 113 beyondCγ; Glu 115 beyond Cδ; Lys 116 from Cγ; Asp 117 from Cγ; Arg 120 from Cδ; Arg 121 from Cδ; Lys 124 beyond Cε; Ser 125 beyond Câ; Arg126 from Cγ; Asp 130 beyond Cγ; Asn 133 from Câ
Solution Structure of Free RGS4 Biochemistry, Vol. 39, No. 24, 20007067
between helical regionsR4 andR5. This loop region is wellordered on the basis of high order parameters (S2 > 0.6;data not shown). The low mobility for this loop results frominteractions with helical regionsR3 and R6. The observedbend between the longest helical regionR6 and the shortesthelical regionR7 is suggestive of a distortion in this helical
segment to achieve an optimal packing interaction betweenhelical regionsR1 and R7. The end result of these localconformations on the overall topology of RGS4 is to createan elongated structure where the two pseudo-four-helixbundles are nearly perpendicular. The interface between thesetwo pseudo-four-helix bundles is predominately hydrophobicin nature (L17, I21, L27, F30, L34, W46, I47, I110, F111,L113, M114), consistent with the general packing ofhydrophobic residues in the core of the protein with chargedresidues on the protein surface.
Another feature of the RGS4 structure is the observationthat residues M1-S4 and P134-H166 are completelydisordered and dynamically flexible. This is evident by thesharp line widths and the minimal number of observableNOEs. The flexible nature of these residues is furthersupported from15N T1, T2 and NOE measurements whichindicate low-order parameters (S2 < 0.6; data not shown).
As previously described, the primary biological functionfor RGS4 is to bind GiR1 and stimulate its intrinsic GTPaseactivity. Key residues in the RGS4 structure that are involvedin the interaction of RGS4 with GiR1 correspond to RGS4residues r-S39, r-E41, r-N42, r-L113, r-D117, r-S118, andr-R121 that form the binding pocket for a-T182 from GiR1.Similarly, r-N82 from RGS4 binds into the GiR1 active site,interacting with residues a-Q204, a-S206, and a-E207 (8).RGS4 mutational work supports the functional importanceof these residues in the binding and activity of RGS4 withGiR1 while identifying r-N82 to be critical in facilitating GTPhydrolysis (18-20). RGS4 residues r-S39, r-E41, and r-N42are located in the N-terminal end of helical regionR3 whiler-L113, r-D117, r-S118, and r-R121 are located directlyopposite at the C-terminal end of helical regionR6. r-N82 islocated approximately in the center of the structured loopregion between helical regionsR4 andR5, which is positionedrelatively above the a-T182 binding pocket on RGS4.
Comparison of the Free RGS4 NMR Structure with theRGS4 GiR1-Bound Structure.A common paradigm in de-scribing a mechanism behind a biochemical process involvingprotein-protein interactions is to invoke an induced con-
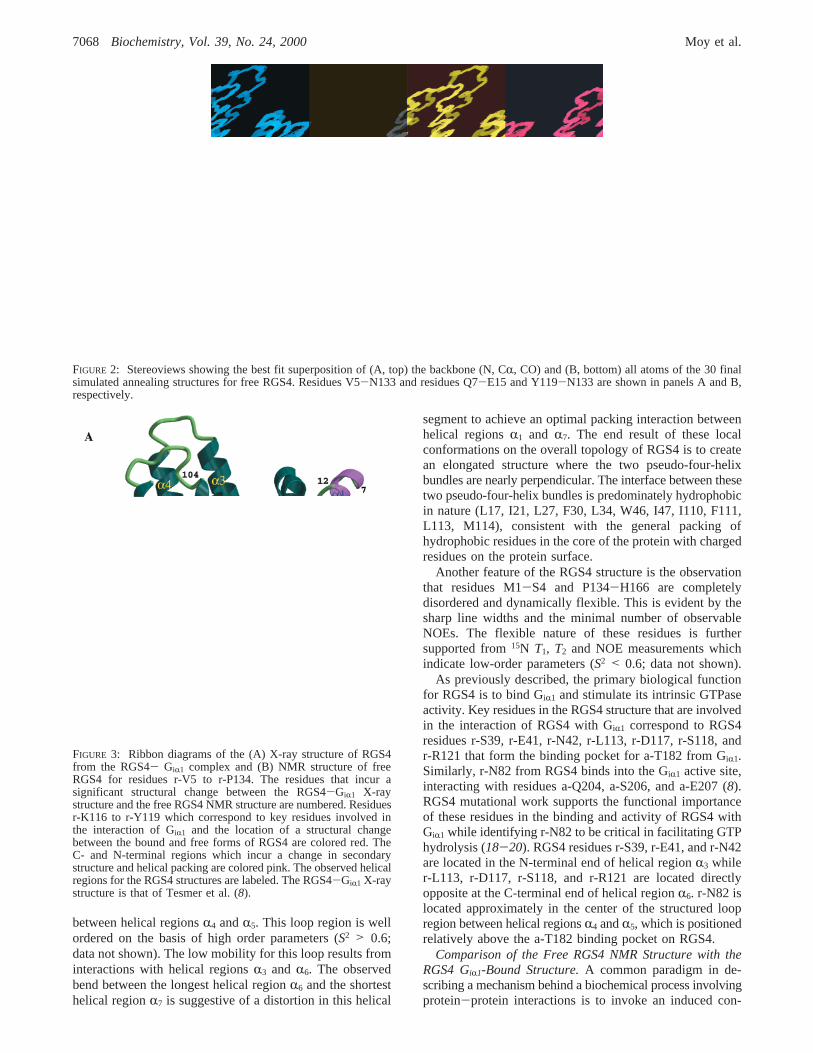
FIGURE 2: Stereoviews showing the best fit superposition of (A, top) the backbone (N, CR, CO) and (B, bottom) all atoms of the 30 finalsimulated annealing structures for free RGS4. Residues V5-N133 and residues Q7-E15 and Y119-N133 are shown in panels A and B,respectively.
FIGURE 3: Ribbon diagrams of the (A) X-ray structure of RGS4from the RGS4- GiR1 complex and (B) NMR structure of freeRGS4 for residues r-V5 to r-P134. The residues that incur asignificant structural change between the RGS4-GiR1 X-raystructure and the free RGS4 NMR structure are numbered. Residuesr-K116 to r-Y119 which correspond to key residues involved inthe interaction of GiR1 and the location of a structural changebetween the bound and free forms of RGS4 are colored red. TheC- and N-terminal regions which incur a change in secondarystructure and helical packing are colored pink. The observed helicalregions for the RGS4 structures are labeled. The RGS4-GiR1 X-raystructure is that of Tesmer et al. (8).
7068 Biochemistry, Vol. 39, No. 24, 2000 Moy et al.
formational change in the protein target. The resultingstructural change in the protein is used to explain amodification in its enzymatic activity or affinity with anotherprotein in the biological system. This is a familiar feature inthe cascade of steps associated with signal transductionpathways. Nevertheless, direct structural evidence from NMRor X-ray data illustrating the proposed conformational changeis rarely available. The obvious value in obtaining suchstructural information is to provide specific details of theinduced conformational change to truly understand thebiochemical process. The analysis of the G-protein signaltransduction pathway is relatively unique in this respectbecause of the extensive structural information available forGiR1 during the various stages of the GTPase cycle (2-5).The observed structural changes for the various GiR1 con-formers provide a fundamental understanding of the GTPasecycle and the mechanism for the signal cascade where RGS4plays a critical role in signal termination. RGS4 has beenidentified as an attenuator of the G-protein signal cascadeby binding specifically to the GiR1-GTP-Mg2+ complex andincreasing the rate of GTP hydrolysis. The observed selectiv-ity of RGS4 for the GR-GTP-Mg2+ complex relative tothe GR-GDP complex is not readily apparent given the closesimilarity in these structures. Understanding the role of RGS4in the G-protein signal cascade and particularly its activityand selectivity fundamentally requires obtaining structuralinformation for RGS4 in both the free and bound forms. Anunexpected result from determining the solution structure ofRGS4 in the absence of GiR1 was the observation of asignificant conformational change between the free andbound forms of RGS4 (8) (Figure 3).
A fundamental factor in the difference between the freeand bound RGS4 structures is a perturbation in the secondarystructure elements. Consistent with the RGS4-GiR1 X-raystructure, the NMR structure of free RGS4 is anR-helicalprotein comprised of two pseudo-four-helix bundles. TheNMR data clearly indicate that the free RGS4 NMR structureis composed of seven helical regions where a majority ofthese data are consistent with the bound RGS4-GiR1 X-raystructure. The significant difference in the secondary structurebetween the GiR1-bound form of RGS4 and the free form ofRGS4 occurs within the C-terminal helical regionsR6 andR7. The bound RGS4-GiR1 X-ray structure indicates thatresidues r-D104-r-K116 and r-Y119-r-L129 are helical,where only residues r-V5-r-T132 are observed in the boundX-ray structure. This contrasts with the free RGS4 NMRstructure where residues r-E105-r-S125 (R6) and r-Y128-r-T132 (R7) are helical and residues r-M1-r-S4 and r-P134-r-H166 are disordered.
A simple view of the observed structural change betweenthe free RGS4 NMR structure and the bound RGS4-GiR1
X-ray structure is a movement of a kink between helicalregionsR6 andR7 toward the C-terminus. The movement ofthis kink results inR6 being longer by nine residues and inR7 being shorter by six residues in the free RGS4 NMRstructure. Additionally,R7 extends three residues beyondwhat was observed as a structural region in the boundRGS4-GiR1 X-ray structure. This observed change in thesecondary structure definition for a few C-terminal residueshas far-reaching effects. A significant modification in theoverall fold for RGS4 results, which is evident by the 1.94Å backbone rms difference between the bound RGS4-GiR1
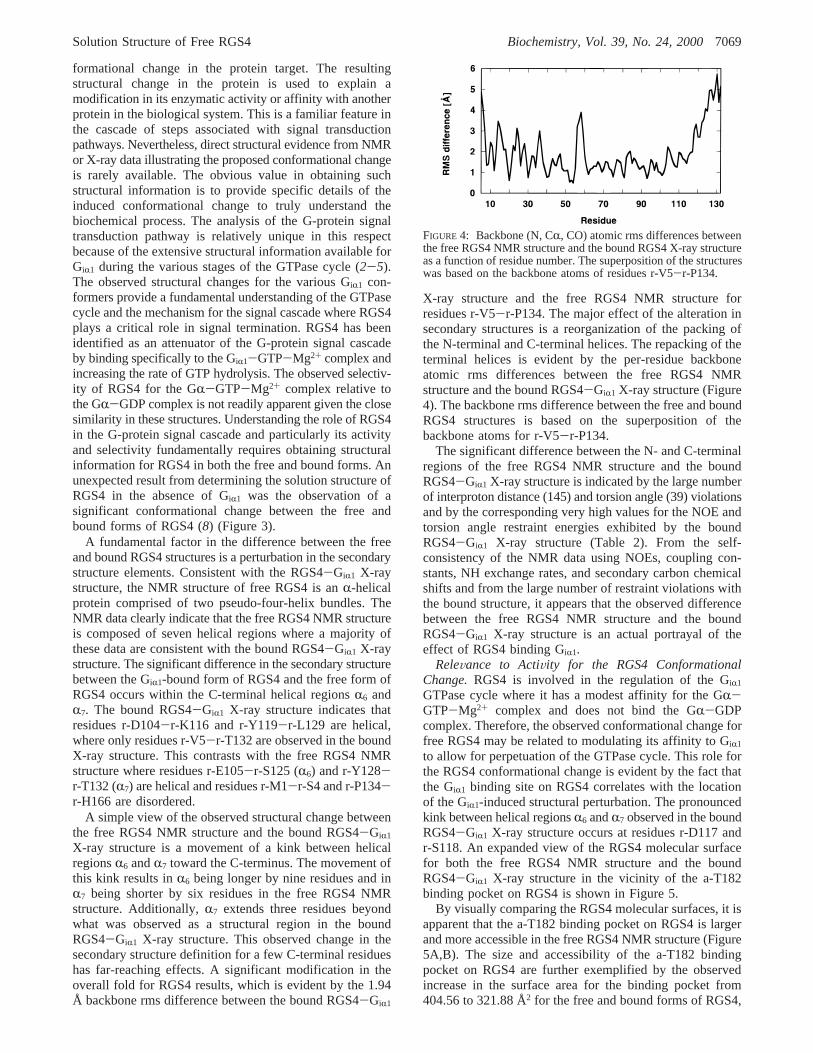
X-ray structure and the free RGS4 NMR structure forresidues r-V5-r-P134. The major effect of the alteration insecondary structures is a reorganization of the packing ofthe N-terminal and C-terminal helices. The repacking of theterminal helices is evident by the per-residue backboneatomic rms differences between the free RGS4 NMRstructure and the bound RGS4-GiR1 X-ray structure (Figure4). The backbone rms difference between the free and boundRGS4 structures is based on the superposition of thebackbone atoms for r-V5-r-P134.
The significant difference between the N- and C-terminalregions of the free RGS4 NMR structure and the boundRGS4-GiR1 X-ray structure is indicated by the large numberof interproton distance (145) and torsion angle (39) violationsand by the corresponding very high values for the NOE andtorsion angle restraint energies exhibited by the boundRGS4-GiR1 X-ray structure (Table 2). From the self-consistency of the NMR data using NOEs, coupling con-stants, NH exchange rates, and secondary carbon chemicalshifts and from the large number of restraint violations withthe bound structure, it appears that the observed differencebetween the free RGS4 NMR structure and the boundRGS4-GiR1 X-ray structure is an actual portrayal of theeffect of RGS4 binding GiR1.
ReleVance to ActiVity for the RGS4 ConformationalChange.RGS4 is involved in the regulation of the GiR1
GTPase cycle where it has a modest affinity for the GR-GTP-Mg2+ complex and does not bind the GR-GDPcomplex. Therefore, the observed conformational change forfree RGS4 may be related to modulating its affinity to GiR1
to allow for perpetuation of the GTPase cycle. This role forthe RGS4 conformational change is evident by the fact thatthe GiR1 binding site on RGS4 correlates with the locationof the GiR1-induced structural perturbation. The pronouncedkink between helical regionsR6 andR7 observed in the boundRGS4-GiR1 X-ray structure occurs at residues r-D117 andr-S118. An expanded view of the RGS4 molecular surfacefor both the free RGS4 NMR structure and the boundRGS4-GiR1 X-ray structure in the vicinity of the a-T182binding pocket on RGS4 is shown in Figure 5.
By visually comparing the RGS4 molecular surfaces, it isapparent that the a-T182 binding pocket on RGS4 is largerand more accessible in the free RGS4 NMR structure (Figure5A,B). The size and accessibility of the a-T182 bindingpocket on RGS4 are further exemplified by the observedincrease in the surface area for the binding pocket from404.56 to 321.88 Å2 for the free and bound forms of RGS4,
FIGURE 4: Backbone (N, CR, CO) atomic rms differences betweenthe free RGS4 NMR structure and the bound RGS4 X-ray structureas a function of residue number. The superposition of the structureswas based on the backbone atoms of residues r-V5-r-P134.
Solution Structure of Free RGS4 Biochemistry, Vol. 39, No. 24, 20007069
respectively. The observed 82.67 Å2 change in the a-T182binding pocket corresponds to an approximate 20% increasein the surface area for the free RGS4 binding pocket. Thebinding surface area of a-T182 indicates the relative signifi-cance of this observed change in surface area. The surfacearea for the methyl and hydroxyl groups of a-T182 is 57.72Å2, which is significantly smaller than the observed changein the surface area between the free and bound RGS4structures.
Also, in the bound RGS4-GiR1 X-ray structure thereappears to be a molecular surface “wall” composed of theRGS4 side chains from residues r-D117, r-S118, and r-R121
which surround the a-T182 binding pocket on RGS4. Theseresidues form an important hydrogen-bonding network whichis critical for the binding of RGS4 with GiR1 where r-D117forms a hydrogen bond with r-R121 and the backbonenitrogen of a-T182. This hydrogen-bonding network iseffectively absent in the free RGS4 NMR structure. The sidechains for r-D117, r-S118, and r-R121 are well beyondhydrogen-bonding distance in the free RGS4 NMR since thehelical kink at residues r-D117 and r-S118 is less pronouncedand the disruption in the helix occurs between residuesr-S125-r-Y128. Thus, the greater accessibility of the a-T182binding pocket on free RGS4 is suggested by the absence
Table 2: Number of Violations Exhibited by the X-ray Structure of RGS4-GiR1 with Respect to the Experimental NMR Interproton Distanceand Torsion Angle Restraintsa
(A) Number of Violations in Interproton Distance Restraints0.1-0.3 Å 0.3-0.5 Å 0.5-1.0 Å 1.0-2.0 Å 2.0-5.0 Å >5.0 Å
all (2038) 41 19 41 28 16 0interresidue sequential (|i - j| ) 1) (611) <16 12 11 0 1 0interresidue short range (1< |i - j| e 5) (540) 11 3 9 11 7 0interresidue long range (|i - j| > 5) (349) 4 3 15 14 7 0intraresidue (460) 10 1 5 2 1 0H-bonds (78) 0 0 1 1 0 0
(B) Violations in Torsion Angle Restraints10-30° 30-60° 60-120° >120°
all (431) 6 0 31 2φ (151) 2 0 0 0ψ (154) 0 0 0 0ø1 (97) 2 0 28 2ø2 (29) 2 0 3 0
a The X-ray structure of RGS4 is the 2.8 Å resolution X-ray structure of Tesmer et al. (8). Residues r-M1-r-S4 and r-N133-r-H166 are notpresent in the X-ray structure. The total number of interproton distance and torsion angle restraints in each category is given in parentheses. Tyrand Pheø2 dihedral angles in the X-ray structure were changed to be consistent with the NMR structure since it is not possible to differentiatebetween+90° or -90° in the X-ray structure. Without this correction, the number of violations would be artificially high for the X-ray structure.
FIGURE 5: Molecular surface of (A) the free RGS4 NMR structure and (B) the RGS4-GiR1 X-ray structure with the side chains for r-D117,r-S118, and r-R121 colored blue and the a-T182 binding pocket colored magenta. Stick and ribbon representation of the expanded view of(C) the free RGS4 NMR structure and (D) the RGS4-GiR1 X-ray structure centered on the a-T182 binding pocket.
7070 Biochemistry, Vol. 39, No. 24, 2000 Moy et al.
of the salt bridges formed by r-E37, r-D117, and r-R121 aswell as the movement of r-S118 away from the bindingpocket. The relative positions of these side chains in boththe bound RGS4-GiR1 X-ray structure and the free RGS4NMR structure are depicted in panels C and D of Figure 5,respectively.
r-N82 has been identified as a critical residue on RGS4for facilitating the intrinsic GiR1 GTPase activity (8, 18-20). The key component of the r-N82 contributions to theRGS4 activity has been attributed to stabilization of GiR1
switch regions and substrate binding. Comparison of the freeRGS4 NMR structure with the bound RGS4-GiR1 X-raystructure in the vicinity of r-N82 does not suggest asignificant conformational change in this region of the proteinwhen RGS4 binds GiR1 (Figure 4). The only observablechange is seen for the side-chain conformation of r-N82. Inthe bound RGS4-GiR1 X-ray structure the side chain forr-N82 extends out from the RGS4 surface to effectivelyinteract with GiR1. Conversely, the side chain for r-N82 pointstoward the a-T182 binding pocket. Since r-N82 is a surface-and solvent-exposed residue in the absence of GiR1, the side-chain conformation for r-N82 in the free RGS4 NMRstructure does not appear to have any significant structuralcontributions and should readily adopt the bound conforma-tion without any consequences.
The observation that RGS4 undergoes a significantstructural change in the presence of GiR1 where the focal pointof this change occurs at key residues in the RGS4-GiR1
interface creates a different picture for the process of RGS4activation of the intrinsic GiR1 GTPase activity. A two-stageprocess composed of a binding and locking step is suggestedfrom comparison of the free and bound forms of RGS4. Thea-T182 binding pocket on RGS4 is clearly larger and moreaccessible in the free RGS4 NMR structure, suggestive ofan “open” conformation (Figure 5A,B). This implies that thebinding step may be driven by the ease of fit of a-T182 intothe open conformation of the pocket. The locking stepcorresponds to an induced change in the RGS4 structure fromthe open binding pocket conformation to a “closed” confor-mation that effectively locks a-T182 into the RGS4 bindingpocket. The locking mechanism is attributed to the formationof the hydrogen-bonding network observed in the RGS4-GiR1 X-ray structure where the pronounced kink occurs inthe helix between residues r-D117 and r-S118 such that theseresidues are brought into close contact with r-R121 anda-T182. Thus the presence of a-T182 in the pocket inducesthe formation of the hydrogen-bonding network and theresulting RGS4 conformational change as opposed to thepreformed binding site observed in the RGS4-GiR1 X-raystructure.
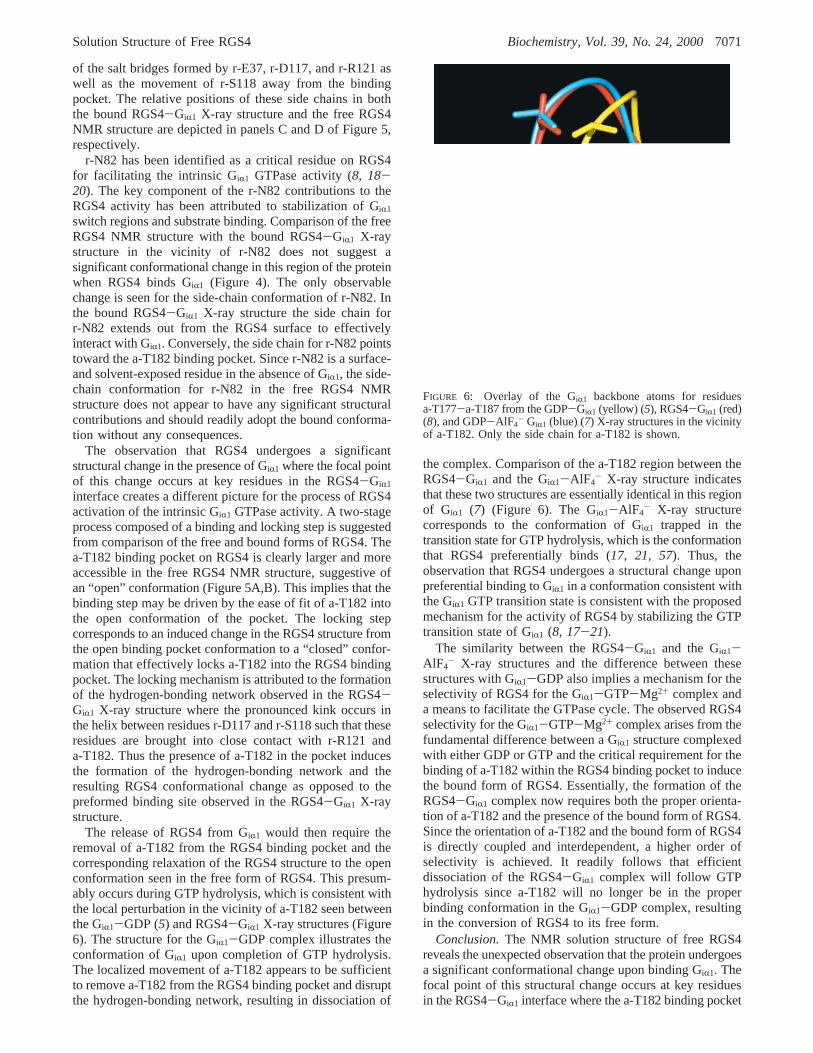
The release of RGS4 from GiR1 would then require theremoval of a-T182 from the RGS4 binding pocket and thecorresponding relaxation of the RGS4 structure to the openconformation seen in the free form of RGS4. This presum-ably occurs during GTP hydrolysis, which is consistent withthe local perturbation in the vicinity of a-T182 seen betweenthe GiR1-GDP (5) and RGS4-GiR1 X-ray structures (Figure6). The structure for the GiR1-GDP complex illustrates theconformation of GiR1 upon completion of GTP hydrolysis.The localized movement of a-T182 appears to be sufficientto remove a-T182 from the RGS4 binding pocket and disruptthe hydrogen-bonding network, resulting in dissociation of
the complex. Comparison of the a-T182 region between theRGS4-GiR1 and the GiR1-AlF4
- X-ray structure indicatesthat these two structures are essentially identical in this regionof GiR1 (7) (Figure 6). The GiR1-AlF4
- X-ray structurecorresponds to the conformation of GiR1 trapped in thetransition state for GTP hydrolysis, which is the conformationthat RGS4 preferentially binds (17, 21, 57). Thus, theobservation that RGS4 undergoes a structural change uponpreferential binding to GiR1 in a conformation consistent withthe GiR1 GTP transition state is consistent with the proposedmechanism for the activity of RGS4 by stabilizing the GTPtransition state of GiR1 (8, 17-21).
The similarity between the RGS4-GiR1 and the GiR1-AlF4
- X-ray structures and the difference between thesestructures with GiR1-GDP also implies a mechanism for theselectivity of RGS4 for the GiR1-GTP-Mg2+ complex anda means to facilitate the GTPase cycle. The observed RGS4selectivity for the GiR1-GTP-Mg2+ complex arises from thefundamental difference between a GiR1 structure complexedwith either GDP or GTP and the critical requirement for thebinding of a-T182 within the RGS4 binding pocket to inducethe bound form of RGS4. Essentially, the formation of theRGS4-GiR1 complex now requires both the proper orienta-tion of a-T182 and the presence of the bound form of RGS4.Since the orientation of a-T182 and the bound form of RGS4is directly coupled and interdependent, a higher order ofselectivity is achieved. It readily follows that efficientdissociation of the RGS4-GiR1 complex will follow GTPhydrolysis since a-T182 will no longer be in the properbinding conformation in the GiR1-GDP complex, resultingin the conversion of RGS4 to its free form.
Conclusion.The NMR solution structure of free RGS4reveals the unexpected observation that the protein undergoesa significant conformational change upon binding GiR1. Thefocal point of this structural change occurs at key residuesin the RGS4-GiR1 interface where the a-T182 binding pocket
FIGURE 6: Overlay of the GiR1 backbone atoms for residuesa-T177-a-T187 from the GDP-GiR1 (yellow) (5), RGS4-GiR1 (red)(8), and GDP-AlF4
- GiR1 (blue) (7) X-ray structures in the vicinityof a-T182. Only the side chain for a-T182 is shown.
Solution Structure of Free RGS4 Biochemistry, Vol. 39, No. 24, 20007071
is larger and more accessible, indicative of an open confor-mation. The RGS4 structural change is correlated with thebinding of a-T182 into the RGS4 binding pocket with thesubsequent formation of a hydrogen bond network, suggest-ing a two-step process composed of a binding and lockingstep. The induced RGS4 conformation in the presence ofGiR1 suggests a mechanism for its selective binding to theGiR1-GTP-Mg2+ complex and the corresponding perpetu-ation of the GTPase cycle. The X-ray structures of variousGiR1-guanine nucleotide complexes indicate a significantconformational change in the vicinity of a-T182 associatedwith GTPase activity. This observation implies that thesuccessful complex formation between RGS4 and GiR1 isdependent onboth the formation of the bound RGS4conformation and the proper orientation of a-T182. Sincethe bound form of RGS4 and the proper orientation of a-T182are intrinsically coupled, a higher order of selectivity isobtained for the binding of RGS4 with the GiR1-GTP-Mg2+
complex. Similarly, the release of RGS4 from GiR1 and thecontinuation of the GTPase cycle are facilitated by thecombination of the a-T182 and RGS4 conformationalchanges. Additionally, since the conformation of a-T182 isidentical in both the GTP hydrolysis transition state and theGiR1-GTP-Mg2+ complex, the RGS4 structural change isconsistent with the proposed mechanism for RGS4 activitybased on stabilizing the GTP hydrolysis transition state. Thus,the described structural change in RGS4 provides an elegantmechanism for the observed binding selectivity between thevarious GR conformers despite the close similarity in thesestructures while supporting the proposed mechanism forRGS4 activity.
REFERENCES
1. Neer, E. J. (1995)Cell 80, 249-257.2. Sprang, S. R. (1997)Annu. ReV. Biochem. 66, 639-678.3. LeVine, H., III (1999)Mol. Neurobiol. 19, 111-149.4. Farfel, Z., Bourne, H. R., and Iiri, T. (1999)N. Engl. J. Med.
340, 1012-1020.5. Berghuis, A. M., Lee, E., Raw, A. S., and Gilman, A. (1996)
Structure 4, 1277-1290.6. Mixon, M. B., Lee, E., Coleman, D. E., and Berghuis, A.
(1995)Science 270, 954-960.7. Coleman, D. E., Berghuis, A. M., Lee, E., and Linder, M. E.
(1994)Science 265, 1405-1412.8. Tesmer, J. J. G., Berman, D. M., Gilman, A. G., and Sprang,
S. R. (1997)Cell 89, 251-261.9. Dohlman, H. G., and Thorner, J. (1997)J. Biol. Chem. 272,
3871-3874.10. Kehrl, J. H. (1998)Immunity 8, 1-10.11. Arshavsky, V. Y., and Pugh, E. N., Jr. (1998)Neuron 20, 11-
14.12. Zerangue, N., and Jan, L. Y. (1998)Curr. Biol. 8, R313-
R316.13. De Vries, L., and Farquhar, M. G. (1999)Trends Cell Biol. 9,
138-144.14. Kozasa, T., Jiang, X., Hart, M. J., Sternweis, P. M., Singer,
W. D., Gilman, A. G., Bollag, G., and Sternweis, P. C. (1998)Science 280, 2109-2112.
15. Nomoto, S., Adachi, K., Yang, L.-X., Hirata, Y., Muraguchi,S., and Kiuchi, K. (1997)Biochem. Biophys. Res. Commun.241, 281-287.
16. Gold, S. J., Ni, Y. G., Dohlman, H. G., and Nestler, E. (1997)J. Neurosci. 17, 8024-8037.
17. Berman, D. M., Kozasa, T., and Gilman, A. G. (1996)J. Biol.Chem. 271, 27209-27212.
18. Srinivasa, S. P., Watson, N., Overton, M. C., and Blumer, K.J. (1998)J. Biol. Chem. 273, 1529-1533.
19. Posner, B. A., Mukhopadhyay, S., Tesmer, J. J., Gilman, A.G., and Ross, E. M. (1999)Biochemistry 38, 7773-7779.
20. Natochin, M., McEntaffer, R. L., and Artemyev, N. O. (1998)J. Biol. Chem. 273, 6731-6735.
21. Watson, N., Linder, M. E., and Druey, K. M. (1996)Nature383, 172-175.
22. Moy, F., Chanda, P. K., Cockett, M. I., Edris, W., Jones, P.G., and Powers, R. (1999)J. Biomol. NMR 15, 339-340.
23. Piotto, M., Saudek, V., and Sklenar, V. (1992)J. Biomol. NMR2, 661-665.
24. Grzesiek, S., and Bax, A. (1993)J. Am. Chem. Soc. 115,12593-12594.
25. Marion, D., Ikura, M., Tschudin, R., and Bax, A. (1989)J.Magn. Reson. 85, 393-399.
26. Vuister, G. W., and Bax, A. (1993)J. Am. Chem. Soc. 115,7772-7777.
27. Archer, S. J., Ikura, M., Torchia, D. A., and Bax, A. (1991)J.Magn. Reson. 95, 636-641.
28. Bax, A., and Pochapsky, S. S. (1992)J. Magn. Reson. 99,638-643.
29. Powers, R., Gronenborn, A. M., Clore, G. M., and Bax, A.(1991)J. Magn. Reson. 94, 209-213.
30. Vuister, G. W., Delaglio, F., and Bax, A. (1992)J. Am. Chem.Soc. 114, 9674-9675.
31. Grzesiek, S., Kuboniwa, H., Hinck, A. P., and Bax, A. (1995)J. Am. Chem. Soc. 117, 5312-5315.
32. Marion, D., Driscoll, P. C., Kay, L. E., Wingfield, P. T., Bax,A., Gronenborn, A. M., and Clore, G. M. (1989)Biochemistry28, 6150-6156.
33. Zuiderweg, E. R. P., and Fesik, S. W. (1989)Biochemistry28, 2387-2391.
34. Zuiderweg, E. R. P., McIntosh, L. P., Dahlquist, F. W., andFesik, S. W. (1990)J. Magn. Reson. 86, 210-216.
35. Ikura, M., Kay, L. E., Tschudin, R., and Bax, A. (1990)J.Magn. Reson. 86, 204-209.
36. Delaglio, F., Grzesiek, S., Vuister, G. W., Zhu, G., Pfeifer, J.,and Bax, A. (1995)J. Biomol. NMR 6, 277-293.
37. Garrett, D. S., Powers, R., Gronenborn, A. M., and Clore, G.M. (1991)J. Magn. Reson. 95, 214-220.
38. Zhu, G., and Bax, A. (1992)J. Magn. Reson. 100, 202-207.39. Williamson, M. P., Havel, T. F., and Wuethrich, K. (1985)J.
Mol. Biol. 182, 295-315.40. Clore, G. M., Nilges, M., Sukumaran, D. K., Bruenger, A. T.,
Karplus, M., and Gronenborn, A. M. (1986)EMBO J. 5,2729-2735.
41. Wuthrich, K., Billeter, M., and Braun, W. (1983)J. Mol. Biol.169, 949-961.
42. Powers, R., Garrett, D. S., March, C. J., Frieden, E. A.,Gronenborn, A. M., and Clore, G. M. (1993)Biochemistry32, 6744-6762.
43. Cornilescu, G., Delaglio, F., and Bax, A. (1999)J. Biomol.NMR 13, 289-302.
44. Bax, A., Max, D., and Zax, D. (1992)J. Am. Chem. Soc. 114,6923-6925.
45. Powers, R., Garrett, D. S., March, C. J., Frieden, E. A.,Gronenborn, A. M., and Clore, G. M. (1993)Biochemistry32, 6744-6762.
46. Zuiderweg, E. R. P., Boelens, R., and Kaptein, R. (1985)Biopolymers 24, 601-611.
47. Kraulis, P. J., Clore, G. M., Nilges, M., Jones, T. A., Pettersson,G., Knowles, J., and Gronenborn, A. M. (1989)Biochemistry28, 7241-7257.
48. Nilges, M., Gronenborn, A. M., Bruenger, A. T., and Clore,G. M. (1988)Protein Eng. 2, 27-38.
49. Clore, G. M., Appella, E., Yamada, M., Matsushima, K., andGronenborn, A. M. (1990)Biochemistry 29, 1689-1696.
50. Brunger, A. T. (1993)X-PLOR Version 3.1 Manual, YaleUniversity, New Haven, CT.
51. Garrett, D. S., Kuszewski, J., Hancock, T. J., Lodi, P. J.,Vuister, G. W., Gronenborn, A. M., and Clore, G. M. (1994)J. Magn. Reson., Ser. B 104, 99-103.
52. Kuszewski, J., Qin, J., Gronenborn, A. M., and Clore, G. M.(1995)J. Magn. Reson., Ser. B 106, 92-96.
7072 Biochemistry, Vol. 39, No. 24, 2000 Moy et al.
53. Kuszewski, J., Gronenborn, A. M., and Clore, G. M. (1996)Protein Sci. 5, 1067-1080.
54. Kuszewski, J., Gronenborn, A. M., and Clore, G. M. (1997)J. Magn. Reson. 125, 171-177.
55. Clore, G. M., and Gronenborn, A. M. (1989)Crit. ReV.Biochem. Mol. Biol. 24, 479-564.
56. Wishart, D. S., and Sykes, B. D. (1994)Methods Enzymol.239.
57. Chen, C.-K., Wieland, T., and Simon, M. I. (1996)Proc. Natl.Acad. Sci. U.S.A. 93, 12885-12889.
58. Nilges, M., Clore, G. M., and Gronenborn, A. M. (1988)FEBSLett. 239, 129-136.
59. Brooks, B. R., Bruccoleri, R. E., Olafson, B. D., States, D. J.,Swaminathan, S., and Karplus, M. (1983)J. Comput. Chem.4, 187-217.
60. Nilges, M., Clore, G. M., and Gronenborn, A. M. (1988)FEBSLett. 229, 317-324.
61. Laskowski, R. A., MacArthur, M. W., Moss, D. S., andThornton, J. M. (1993)J. Appl. Crystallogr. 26, 283-291.
BI992760W
Solution Structure of Free RGS4 Biochemistry, Vol. 39, No. 24, 20007073


![Structure of a [2Fe–2S] ferredoxin from Rhodobacter capsulatus likely involved in Fe–S cluster biogenesis and conformational changes observed upon reduction](https://static.fdokumen.com/doc/165x107/63363fcacd4bf2402c0b6cfb/structure-of-a-2fe2s-ferredoxin-from-rhodobacter-capsulatus-likely-involved.jpg)