NJ Hess Associates: Compensation and Benefits Study
23
COMPENSATION AND BENEFITS STUDY BOROUGH OF HANOVER,PENNSYLVANIA NANCY J HESS NJ HESS ASSOCIATES www.njhessassociates.com NOVEMBER 17, 2021
-
Upload
khangminh22 -
Category
Documents
-
view
0 -
download
0
Transcript of NJ Hess Associates: Compensation and Benefits Study

COMPENSATION AND BENEFITS STUDYBOROUGH OF HANOVER, PENNSYLVANIA
NANCY J HESSNJ HESS ASSOCIATES
www.njhessassociates.com
NOVEMBER 17, 2021

1 |C o m p e n s a t i o n S t u d y | N J H e s s A s s o c i a t e s | 1 1 / 1 7 / 2 0 2 1
Table of Contents EXECUTIVE SUMMARY ..................................................................................................................................... 2
OVERVIEW ........................................................................................................................................................ 3
SUMMARY OF MARKET PAY FINDINGS ............................................................................................................ 4
DISCUSSION .................................................................................................................................................. 5
SUMMARY OF BENEFIT FINDINGS ................................................................................................................... 7
DISCUSSION .............................................................................................................................................. 7
WHAT DOES THE BENEFIT DATA TELL US ABOUT HANOVER BOROUGH BENEFITS? ............................. 8
BUDGET .................................................................................................................................................... 9
PAID TIME OFF ......................................................................................................................................... 9
PROJECTED EMPLOYEE SHARE OF HEALTH PLAN COST FOR 2022 ......................................................... 9
RETIREMENT ............................................................................................................................................ 9
BENEFIT STRATEGIES GOING FORWARD ............................................................................................... 10
FINDINGS AND RECOMMENDATIONS FOR JOB POSITIONS .......................................................................... 11
DISCUSSION ............................................................................................................................................ 11
ADMINISTRATION .................................................................................................................................. 11
ENGINEERING ......................................................................................................................................... 11
FINANCE ................................................................................................................................................. 11
FIRE/EMS ................................................................................................................................................ 12
POLICE .................................................................................................................................................... 12
PUBLIC WORKS ....................................................................................................................................... 12
WATER/SEWER ....................................................................................................................................... 13
LIBRARY .................................................................................................................................................. 13
INTERPRETATION OF FINDINGS ..................................................................................................................... 14
NEXT STEPS ..................................................................................................................................................... 15
PROPOSED PAY POLICY LANGUAGE ............................................................................................................... 16
CLOSING THOUGHTS .................................................................................................................................. 18
APPENDIX ....................................................................................................................................................... 19
Notes on Summary Worksheet .............................................................................................................. 21
ABOUT N.J. HESS ASSOCIATES ....................................................................................................................... 22

2 |C o m p e n s a t i o n S t u d y | N J H e s s A s s o c i a t e s | 1 1 / 1 7 / 2 0 2 1
EXECUTIVE SUMMARY The following recommendations are a summary of highlights from the market study conducted for the
Borough in July and August. A full report follows.
1. The consultant was hired by the Borough to conduct a market study and determine the
relationship of Borough pay to market pay for 23 non‐union positions. In addition, job analysis
was performed to prepare job descriptions and determine best match to a survey benchmark.
Although it is beyond the scope of this study to provide in‐depth analysis of organization
structure, some preliminary observations are provided where misalignment of Borough pay with
the market appear. In such cases, the consultant provides direction for further examination of the
issues.
2. The consultant provides a summary of findings and recommends no action where pay falls within
the market range with a few exceptions.
Market adjustments are recommended as follows:
a. Where an incumbent’s pay falls below the minimum of the market range.
b. Where an incumbent has more than 5‐7 years of service in the same or a similar position
and is not yet at the market average.
3. Additional areas of market discrepancies were identified through discussions with the Borough
Manager and can be summarized as follows:
a. The survey reflects that no data is reported for a number of public works and water /
wastewater positions. This points to a distinguishing feature of Borough organization
structure that may be worth discussion with respect to long range planning.
b. In some cases, gaps with the market may be due to a difference in level of responsibility,
requirements of the job and/or percentage of time spent on management duties.
4. Overall, Hanover Borough provides robust health insurance benefits compared to other local
governments across the state and all sectors nationally but does not differ widely from
Pennsylvania Boroughs of similar size and structure.
5. What may be striking about Hanover Borough is that it is one of the remaining municipalities that
continues to provide a premium health insurance coverage for family with no deductible and one
of a few municipalities that still have grandfathered employees with retiree health benefits and
vacation and sick leave payouts.
6. When comparing to all sectors across the U.S. the cost of single employee coverage at Hanover is
almost twice the U.S average; and the cost of family coverage is 33% higher.
7. When comparing the Borough (and boroughs in general) to townships; the cost of single
employee coverage is 34% higher than surveyed townships; and the cost of family coverage is
22% higher

3 |C o m p e n s a t i o n S t u d y | N J H e s s A s s o c i a t e s | 1 1 / 1 7 / 2 0 2 1
OVERVIEW
The Borough of Hanover conducted a survey of pay and benefits for 2021 during the month of July and
August. The consultant selected Boroughs that were close in population size and structure and additional
municipalities in York County. The survey requested a short turnaround time so there were several
municipalities that responded they were unable to complete the survey due to competing demands on
their time. On the other hand, the 5 responding participants represent a solid core of professionally
managed municipalities and the survey data is reliable given the survey parameters. The participants
represent municipalities between 13,000 – 21,000 in population across the Commonwealth with an
average population of 17,418. A total of 23 benchmark positions were surveyed.
The goal of a market survey is to determine the relationship between pay in the organization and the
external market which can be defined by “Who do we lose people to? Where do we get people from?” In
other words, the market is a representative sampling of comparable organizations for which an employer
could potentially recruit employees or lose them. In the case of larger municipalities, it is more difficult to
find similarly structured and sized organizations and requires a wider search for good matches. Ideally,
the surveying organization should fall somewhere in the middle with respect to size.
The executive report is intended to show the big picture results of the survey and provide
recommendations within the scope of this engagement.
Participants:
Secondary Sources of Data Where available, additional data was provided from other surveys conducted by N.J. Hess Associates,
Economic Research Institute and the Bureau of Labor Statistics. This data will appear underneath the
primary survey data summary in the full report of data.
PARTICIPANT # EES POPULATION
FULL‐TIME
Hanover Borough 150 15,851
Fairview Twp 37 17,555
Borough of Chambersburg 232 21,461
Borough of Lansdale 104 16,675
Borough of Carlise 99 19,153
Borough of Ephrata 101 13,810
AVG 121 17,418
ERI Economic Research ‐ ERI (York, PA) [Average; by org size and government
classification]
BLS Bureau of Labor Statistics ‐ BLS (York, PA) [Average]
4 |C o m p e n s a t i o n S t u d y | N J H e s s A s s o c i a t e s | 1 1 / 1 7 / 2 0 2 1
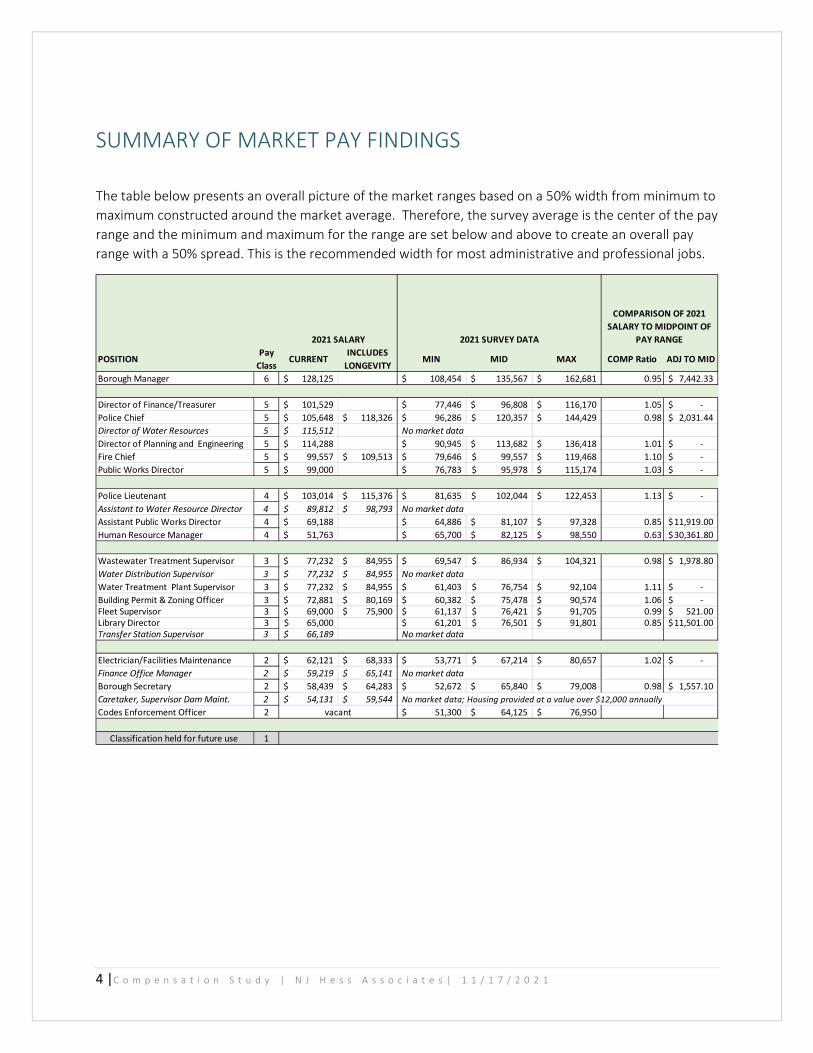
SUMMARY OF MARKET PAY FINDINGS
The table below presents an overall picture of the market ranges based on a 50% width from minimum to
maximum constructed around the market average. Therefore, the survey average is the center of the pay
range and the minimum and maximum for the range are set below and above to create an overall pay
range with a 50% spread. This is the recommended width for most administrative and professional jobs.
2021 SURVEY DATA
POSITION CURRENTINCLUDES
LONGEVITYMIN MID MAX COMP Ratio ADJ TO MID
Borough Manager 6 128,125$ 108,454$ 135,567$ 162,681$ 0.95 7,442.33$
Director of Finance/Treasurer 5 101,529$ 77,446$ 96,808$ 116,170$ 1.05 ‐$
Police Chief 5 105,648$ 118,326$ 96,286$ 120,357$ 144,429$ 0.98 2,031.44$
Director of Water Resources 5 115,512$ No market data
Director of Planning and Engineering 5 114,288$ 90,945$ 113,682$ 136,418$ 1.01 ‐$
Fire Chief 5 99,557$ 109,513$ 79,646$ 99,557$ 119,468$ 1.10 ‐$
Public Works Director 5 99,000$ 76,783$ 95,978$ 115,174$ 1.03 ‐$
Police Lieutenant 4 103,014$ 115,376$ 81,635$ 102,044$ 122,453$ 1.13 ‐$
Assistant to Water Resource Director 4 89,812$ 98,793$ No market data
Assistant Public Works Director 4 69,188$ 64,886$ 81,107$ 97,328$ 0.85 11,919.00$
Human Resource Manager 4 51,763$ 65,700$ 82,125$ 98,550$ 0.63 30,361.80$
Wastewater Treatment Supervisor 3 77,232$ 84,955$ 69,547$ 86,934$ 104,321$ 0.98 1,978.80$
Water Distribution Supervisor 3 77,232$ 84,955$ No market data
Water Treatment Plant Supervisor 3 77,232$ 84,955$ 61,403$ 76,754$ 92,104$ 1.11 ‐$
Building Permit & Zoning Officer 3 72,881$ 80,169$ 60,382$ 75,478$ 90,574$ 1.06 ‐$ Fleet Supervisor 3 69,000$ 75,900$ 61,137$ 76,421$ 91,705$ 0.99 521.00$ Library Director 3 65,000$ 61,201$ 76,501$ 91,801$ 0.85 11,501.00$Transfer Station Supervisor 3 66,189$ No market data
Electrician/Facilities Maintenance 2 62,121$ 68,333$ 53,771$ 67,214$ 80,657$ 1.02 ‐$
Finance Office Manager 2 59,219$ 65,141$ No market data
Borough Secretary 2 58,439$ 64,283$ 52,672$ 65,840$ 79,008$ 0.98 1,557.10$
Caretaker, Supervisor Dam Maint. 2 54,131$ 59,544$
Codes Enforcement Officer 2 51,300$ 64,125$ 76,950$
Classification held for future use 1
2021 SALARY
No market data; Housing provided at a value over $12,000 annually
vacant
Pay
Class
COMPARISON OF 2021
SALARY TO MIDPOINT OF
PAY RANGE

5 |C o m p e n s a t i o n S t u d y | N J H e s s A s s o c i a t e s | 1 1 / 1 7 / 2 0 2 1
DISCUSSION
Current labor market conditions are tight due to pandemic‐related issues and the fact that inflation is
rising1 which means despite pay increases, real compensation is not keeping pace. This is to say increases
are not offsetting the rise in the cost of living. National surveys indicate employers are returning to pre‐
pandemic 3% increases to salary budgets, which were standard for almost decade before the pandemic,
and the increase is showing up across all employment categories and industries. Today employers are
bracing for the impact of inflation which could lead to greater demand from workers and unions for some
cost‐of‐living adjustments.
Employers are responding to a tight job market by making market adjustments to address hard‐to‐recruit
positions and taking steps to keep talent. For many employees, the current tight market may motivate
them to look elsewhere and the ready availability of labor market information makes it easy.
Employers are also looking at ways to reward premium skills and making market adjustments mid‐year
and recognizing high performing employees.
1 Inflation at the wholesale level climbed 8.3 percent from August 2020 to August 2021, the biggest annual gain since the Department of Labor (DOL) started calculating the 12-month number in 2010, the DOL reported on Sept. 10.
The following non‐union positions are outside of this pay classification because they are in transition or subject to futher evaluation.
2021 SURVEY DATA
POSITION CURRENTINCLUDES
LONGEVITYMIN MID MAX COMP Ratio ADJ TO MID
Administrative Assistant, Public Works 49,519$ 54,471$ No market data
Executive Secretary, Fire Commission 53,501$
Caretaker, Laborer Dam Maint. 49,399$ 52,363$
Administrative Assistant, Library 45,455$ 50,000$ No market data
Library Assistant / Volunteer Coord. 36,150$ 39,042$ 32,912$ 41,140$ 49,368$ 0.95 2,098$
Youth Department Manager 37,918$ 46,075$ 57,594$ 69,113$ 0.66 19,676$
Adult Department Manager 34,112$ 46,075$ 57,594$ 69,113$ 0.59 23,482$
Library Assistant 29,848$ 28,711$ 35,889$ 43,067$ 0.83 6,041$
Teen Library Supervisor 29,203$ 32,912$ 41,140$ 49,368$ 0.71 11,937$
Maint. & Sanitation Tech ‐ Part‐time 18.00$ No market data
Interlibrary Loans ‐ Part‐time 16.55$ 15.82$ 19.78$ 23.73$ 0.84 3.23$
Library Assistant ‐ Part‐time 15.61$ 13.80$ 17.25$ 20.71$ 0.90 1.64$
Library Assistant ‐ Part‐time 14.12$ 13.80$ 17.25$ 20.71$ 0.82 3.13$
Library Assistant ‐ Part‐time 10.82$ 13.80$ 17.25$ 20.71$ 0.63 6.43$
Library Assistant ‐ Part‐time 10.51$ 13.80$ 17.25$ 20.71$ 0.61 6.74$
Tech Service Supervisor ‐ Part‐time 10.51$ 15.82$ 19.78$ 23.73$ 0.53 9.27$
Library Assistant ‐ Part‐time 10.00$ 13.80$ 17.25$ 20.71$ 0.58 7.25$
Library Assistant ‐ Part‐time 10.00$ 13.80$ 17.25$ 20.71$ 0.58 7.25$
Library Assistant ‐ Part‐time 10.00$ 13.80$ 17.25$ 20.71$ 0.58 7.25$
No market data
2021 SALARY
No market data; Housing available at a value over $12,000 annually
Pay
Class
COMPARISON OF 2021
SALARY TO MIDPOINT OF
PAY RANGE

6 |C o m p e n s a t i o n S t u d y | N J H e s s A s s o c i a t e s | 1 1 / 1 7 / 2 0 2 1
Therefore, this study is both timely and valuable for organization planning for what may be a long haul
with respect to market conditions. Flux in the market conditions make it important to address pay issues
as they arise and not wait until the following year.
Current market conditions are the first sign of a notable shift in salary budget increases in 10
years, particularly for hourly employees who have long experienced stagnant pay…. Aging Baby
Boomers and pandemic‐related worker shortages have created this scenario where we have more
jobs than we have people willing, or able, to work.2 ‐Chris Fusco, senior vice president of
compensation at Salary.com
Most employees will get a 5.8% increase by changing jobs.3 – ADP Research Institute
Additional research by PayScale shows that 51 percent of workers believe they are paid below
market even when they are paid at or above market. "Workers who perceive they are underpaid
are more likely to seek new opportunities in the next six months, showing that pay perception and
pay communications have a measurable impact on retention."
2 Society for Human Resource Management – 2022 salary increases 3 Workforce Vitality Report

7 |C o m p e n s a t i o n S t u d y | N J H e s s A s s o c i a t e s | 1 1 / 1 7 / 2 0 2 1
SUMMARY OF BENEFIT FINDINGS
DISCUSSION
Health care benefits costs have shown a steady annual increase over the last 20 years. As municipal
governments gradually follow private sector cost sharing practices, the long‐held tradition of public
employers awarding greater benefits to offset lower salaries comes to an end. However, although many
employers are opting to increase employee cost sharing, there remains a perceived and distinct
advantage to attracting and retaining good employees by keeping health benefits competitive with the
private sector.
Health care costs can be difficult to breakdown without an actuarial analysis, but the following summary
provides general findings and trends.
Summary of Health Insurance Premium Costs Overall, Hanover Borough provides robust health insurance benefits compared to other local
governments across the state and all sectors nationally but does not differ widely from
Pennsylvania Boroughs of similar size and structure.
Monthly Single Employee
Family Coverage
Employee Contribution
Deductible
1 Hanover Bor $1156 $2670 $80.94 0
2 Borough survey $1395 $2743 Various $375
3 U.S. Avg $623 $1779 No info
4 PA Twps $766 $2087 $64 / $170 $1625/$2563 (w/offsets)
5 Bureau of Labor Statistics – all sectors
$1441 $5701 $120/$475 No info
6 Bureau of Labor Statisticslocal government
$640 ‐ $1068
No info $89‐$111 single
No info
Explanation:
1. Hanover Borough; single employee monthly premium for health insurance in 2021 is $1156 (83%
of the survey average of $1395); family monthly coverage is $2670 (97% of the survey average ‐
$2743) Note: Survey participants all report health benefit plans that fall under the category of
PPO4
o While cost sharing strategies differ, Hanover is on the low end for employee contribution
to the monthly premium and has no deductible while other participants show a mix of
formulas for contribution and generally low deductibles (avg of $375).
4 A PPO is a health plan that specifically contracts with medical providers (e.g., hospitals and doctors) to create a network of providers in a given area. Consumers pay less when using providers that belong to the PPO network. PPO plans typically have more health care provider options than other plans.

8 |C o m p e n s a t i o n S t u d y | N J H e s s A s s o c i a t e s | 1 1 / 1 7 / 2 0 2 1
2. In 2020, for all sectors across the nation, the average monthly premium for employer‐sponsored
health insurance was $623 for single coverage and $1779 for family coverage5
3. NJ Hess Associates surveyed a group of 15 large Townships across Pennsylvania and found the
average monthly premium for single coverage was $766 with an average monthly contribution of
$64; monthly family coverage $2087 with an average monthly contribution of $170. The average
deductible for single coverage was $1625 with employer offset; the deductible for family
coverage was $2563 with employer offsets.6
4. The Bureau of Labor Statistics (BLS) has not released their latest survey (due in November2021),
but in March 2020 reported a median annual premium amount of $640 ‐ $1,068 for single
coverage in state and local governments. The range includes varying levels of contribution by
employees7
5. The Bureau of Labor Statistics (BLS) has not released their latest survey (due in November2021),
but in March 2020, the median monthly employee contribution (all sectors) for single coverage
was $120 and family coverage $475.8
o In the same report, state and local governments reported a median employee
contribution for single coverage of $89 to $111 or roughly 14% of the costs; while private
industry employees contributed from $127 ‐ $124, or roughly 22% of the cost.
o Overall, according to the 2020 BLS report, 86 percent of workers participated in medical
care plans with an employee contribution requirement where employees paid $138.76
and employers paid $459.70 per month.
WHAT DOES THE BENEFIT DATA TELL US ABOUT HANOVER BOROUGH BENEFITS? Drilling down into cost comparisons between benefit plans is a vastly complicated task and the purpose of
this survey is to take a snapshot of the components of benefit programs that are most important to
employers and employees and can be used to better communicate benefit offerings.
Overall, Hanover Borough is slightly higher in benefit costs in some areas and lower in others. In many
areas there is virtually no difference between municipality offerings. Overall, the participant pool in this
survey is more alike than different in the relative richness of the benefit program.
For example, compared to survey participants,
Hanover Borough single employee premiums are 17% lower than the survey average, but family
coverage premiums are just slightly under the survey average.
Primary and Specialist co‐pays are slightly higher than the average, but emergency and urgent
care co‐pays are lower than the average.
Rx co‐pays are the highest among survey participants and are high compared to the NJ Hess
Township survey conducted in 2020.
5 Kaiser Family Foundation (2021 report expected in November 2021) https://www.kff.org/report-section/ehbs-2020-summary-of-findings/ 6 Survey data was collected in 2020 and adjusted by 4% for 2021 7 https://www.bls.gov/ncs/ebs/benefits/2020/employee-benefits-in-the-united-states-march-2020.pdf 8 https://www.bls.gov/ncs/ebs/factsheet/medical-care-premiums-in-the-united-states.htm

9 |C o m p e n s a t i o n S t u d y | N J H e s s A s s o c i a t e s | 1 1 / 1 7 / 2 0 2 1
Discretionary benefits such as vision, dental, short‐ and long‐term disability vary slightly among
participants but there is no discernable difference.
Plan variations reflect negotiations between each carrier and organization and as a result, it is difficult to
compare. For instance, some premiums roll in discretionary benefits or Rx plans, some plans are separate.
What may be striking about Hanover Borough is that it is one of the remaining municipalities that
continues to provide a premium health insurance coverage for family with no deductible and one of a few
municipalities that still have grandfathered employees with retiree benefits and longevity payouts.
BUDGET When looking at the overall budget for health insurance, the average per employee cost of health
insurance benefits is roughly 4% higher in Hanover. However, when mandatory benefits (social security,
workers compensation and unemployment) and discretionary benefits (dental, vision, disability, life) are
added in, Hanover is right at the average overall cost per employee.
PAID TIME OFF When holidays, sick and personal days are combined, Hanover is slightly below the average (26 days). This
number is virtually identical to the NJ Hess survey conducted for larger Township across the state in 2020.
When it comes to vacation offers, the Borough is slightly below the average for the first 10 years of
employment and slightly above the average for the second decade and beyond.
PROJECTED EMPLOYEE SHARE OF HEALTH PLAN COST FOR 2022 The data on insurance premiums reveal a shift taking place in cost sharing for municipal health insurance
benefits. Although the cost of benefits to employers is still higher in the public sector, the gap is closing as
municipalities move toward cost sharing strategies.
Projected total monthly costs for PPO plans (for all sectors) in 2022 are $650 for single coverage and
$1887 for family.9 The Borough’s costs are significantly higher at $1156 for single coverage and $2670 for
family.
Data on projected employee cost sharing in 2022 for PPO plans (all sectors) indicates employees are
expected to pay up to 24% of organization costs. This is up from 20% reported by BLS in 2021. BLS data
also showed local government trailing the private sector by about 5% so it might be reasonable to project
that local government employees will average about 19% contribution for overall costs. Hanover’s non‐
union employees contributed 7.5 % of the cost of health insurance in 2022.
RETIREMENT Retirement plans have also been subject to great shifts in private and public sector organizations. Many
local governments in Pennsylvania are grandfathering (or freezing) traditional defined benefit plans so
that new hires do have the option of enrolling and in place of these plans they have added defined
contribution plans.10 This trend is more prevalent in townships than in Boroughs.
9 White Paper, Projected Monthly Health Care Costs 2022, erieri.com 10 Defined benefit retirement plans determine payments according to a fixed formula based on salary, years of service, and age. Defined contribution plans determinethevalueofindividualaccountsonthebasisoftheamountofmoneycontributed and the rate of return on the money invested.

10 |C o m p e n s a t i o n S t u d y | N J H e s s A s s o c i a t e s | 1 1 / 1 7 / 2 0 2 1
In 2020, among all sectors, 43% of employees participated in defined contribution plans and 20% in
defined benefit plans.11 In the public sector 21% of employees participated in defined contribution and
79% of public sector employees participated in defined benefit plans.
The Hanover Borough survey revealed that Boroughs are making the shift by offering both.
Hanover Borough offers a defined benefit plan, with eligibility for pension after 10 years of
service and to which employees contribute 3% of gross salary with a benefit formula of:
o For employees hired before March 2014:
Average monthly wage for last 36 months of employment x number of years of
service x 1.5%
Example: Employee, with 15 years of service, averaging at $60,000 annually for
last three years would receive an annual pension of: $13,500
o For employees hired after March 1, 2014
Average monthly wage for last 36 months of employment x number of years of
service x 1.0%
Example: Employee, with 15 years of service, averaging at $60,000 annually for
last three years would receive an annual pension of: $9,000
Other formulas offered by survey participants include:
o 2% last year salary divided by years of service
o Average of highest 3 years of last 5 x 1.5% x years of service converted to number
o Average of 5 consecutive years salaries x 1.4% x years of service.
Retirement benefits for non‐union employees hired after March 2014 appear to be relatively low
for municipal employees.
BENEFIT STRATEGIES GOING FORWARD Some of the important questions for public sector employers to consider is, “what is the strategic
advantage of providing benefits at lower cost to employees than the private sector?” And, if the answer is
that in fact, it is a primary driver in why people are attracted to and stay with the organization, the next
question is, “How can we better communicate this competitive advantage to potential and current
employees?” And finally, “what is the point at which cost sharing crosses over and is no longer a
competitive advantage?”
One of the uses of the data from this survey is to think about how to better communicate benefit goals
and strategies to stakeholders within the organization. Benefits cannot be a strategic advantage without
outreach and education.
11 https://www.bls.gov/ncs/ebs/benefits/2020/employee-benefits-in-the-united-states-march-2020.pdf

11 |C o m p e n s a t i o n S t u d y | N J H e s s A s s o c i a t e s | 1 1 / 1 7 / 2 0 2 1
FINDINGS AND RECOMMENDATIONS FOR JOB POSITIONS DISCUSSION The goal of this project was to conduct an organization study to examine where Borough job positions fall
with respect to the market, address gaps where they appear, take a look at how job positions fit within
the overall structure and make some general observations in light of survey findings.
The methodology for this study includes interviews with job incumbents, job questionnaire data, a state‐
wide survey of select comparable municipalities, compilation and analysis of data and a series of
discussions with the Borough Manager and Human Resource Manager to review and deepen consultant
understanding of historical knowledge of organization positions.
Where market data raises questions and/or other questions have been raised, the PAQ (Position Analysis
Questionnaire) and interview data has been analyzed to provide a recommendation. Where questions are
beyond the scope of this project, the recommendation so states.
ADMINISTRATION BOROUGH MANAGER The pay for Borough Manager is within the range and 5% below the average. Other surveys conducted
across the State and the U.S. confirm survey findings.
HUMAN RESOURCE MANAGER The pay for HR Manager is significantly below the market range. Economic Research Institute (ERI)
database confirms survey findings. This position requires a high level of support to the Borough Manager
and performs duties that match other professional HR positions.
BOROUGH SECRETARY The pay for Borough Secretary is within the range and 2% below the average.
ENGINEERING DIRECTOR OF ENGINEERING The pay for Director of Engineering is within the range and at the market average.
BUILDING PERMIT / ZONING OFFICER The pay for this position is within the market range and at the market average.
CODES ENFORCEMENT OFFICER This position is vacant and may be replaced with a third‐party contractor.
FINANCE DIRECTOR OF FINANCE/TREASURER The pay for Director of Finance/Treasurer is within the range and 5% above the market average.
FINANCE OFFICE MANAGER Insufficient Data. This may suggest that this position is not common or structured in an unusual way.
More analysis is needed but in the survey participant organizations, this position includes accountant

12 |C o m p e n s a t i o n S t u d y | N J H e s s A s s o c i a t e s | 1 1 / 1 7 / 2 0 2 1
level duties and responsibilities. This position performs a combination of bookkeeper duties and
supervises the finance office staff.
FIRE/EMS FIRE CHIEF The pay for Fire Chief is within the range and 10% above the market average.
EXECUTIVE SECRETARY, FIRE AND RESCUE COMMISSION Insufficient Data. This may suggest that this position is not common or structured in an unusual way. This
position performs a combination of bookkeeper duties and payroll administration. This position should be
compared to other administrative support positions in the Borough.
POLICE POLICE CHIEF The pay for Police Chief is within the range and 2% below the average. Other surveys conducted across
the State confirm this finding.
POLICE LIEUTENANT The pay for Lieutenant is within the range and 13% above the market average.
PUBLIC WORKS PUBLIC WORKS DIRECTOR The pay for Public Works Director is within the range and at market average. A survey conducted last year
by NJ Hess Associates for municipalities across PA with 15,000 – 20,000 population indicated an average
of $108,165 for Director of PW where several participants reported a P.E. license for Director. However,
the scope of responsibility associated with this position is consistent with these survey findings.
ASSISTANT PUBLIC WORKS DIRECTOR The pay for the Assistant Public Works Director is within the range but 15% below the market average
and only 5 % above the highest paid employee under the position’s supervision.
FLEET SUPERVISOR The pay for Fleet Supervisor is within range and at the market average.
TRANSFER STATION SUPERVISOR Insufficient Data. This may suggest that this position is not common or structured in an unusual way. This
position could benefit from more analysis. The consultant is finalizing a survey study for a County Refuse
and Recycling organization of significant size and this position does not appear. It may be more likely that
operators report to a foreman and a separate position is set up to handle administrative tasks, contracts,
and customer relationships at the site.
Here is a general job summary for a coordinator of recycling and solid waste: Under general direction,
manage business operations and supervise staff; provide contract management, reporting, supervision,
and recycling education and training associated with recycling. Provide education to the general public on
the importance of recycling and source reduction.

13 |C o m p e n s a t i o n S t u d y | N J H e s s A s s o c i a t e s | 1 1 / 1 7 / 2 0 2 1
ELECTRICIAN / FACILITIES MAINTENANCE The pay for Facilities Maintenance is within the range and at the market average. In 2020 NJ Hess
Associates conducted a survey of large PA municipalities and the Facilities Manager position was paid on
average $82,094. A similar survey showed an average for Facilities Maintenance Supervisor at $67,214.
The disparity in pay among surveys may relate to differing levels of responsibility assigned to this position.
ADMINISTRATIVE ASSISTANT PUBLIC WORKS Insufficient data. This may suggest that this position is not common or structured in an unusual way. This
position performs a variety of administrative tasks for Public Works, Market House, and Parks/Recreation
programs. This position should be compared to other administrative support positions in the Borough.
WATER/SEWER DIRECTOR OF WATER RESOURCES This position is assigned responsibility for both the water and wastewater systems. There is no market
data available regarding pay for this position. For purposes of classification, it may be considered similar
to the Director of Planning Engineering position, although the Director of Water Resources position holds
significantly more responsibility for budget and employee supervision.
ASSISTANT TO WATER RESOURCE DIRECTOR
This is a new and temporary position which will be assessed when the incumbent retires.
WASTEWATER TREATMENT SUPERVISOR The pay for Wastewater Treatment Supervisor is within the range and is 2% below market average.
WATER DISTRIBUTION SUPERVISOR
Insufficient Data. This may suggest that this position is not common or structured in an unusual way. This
position requires some additional analysis; however, it may be considered similar to the Wastewater
Treatment Supervisor and Water Treatment Plant Supervisor in level of responsibility for budget and
employee supervision.
WATER TREATMENT PLANT SUPERVISOR The pay for Water Treatment Plant Supervisor is within the range and 11% above market average.
CARETAKER, SUPERVISOR DAM MAINTENANCE This position is unique to Hanover but appears to be similar to other caretaker positions with added
supervisory responsibilities. In addition to salary, the benefit for this position includes housing at no cost
to the employee, valued at least $12,000 annually.
CARETAKER, LABORER DAM MAINTENANCE This position is unique to Hanover but appears to be similar to a general maintenance worker. In addition
to salary, the benefit for this position includes housing at no cost to the employee, valued at least
$12,000 annually, which the employee has opted out of as of August 2021.
LIBRARY LIBRARY DIRECTOR The Library Director position was filled at a 2021 salary of $65,000 and is within market range.

14 |C o m p e n s a t i o n S t u d y | N J H e s s A s s o c i a t e s | 1 1 / 1 7 / 2 0 2 1
ADMINISTRATIVE ASSISTANT, LIBRARY Insufficient data. This may suggest that this position is not common or structured in an unusual way. This
position performs a variety of administrative tasks for the Library Director and had been the Interim
Director prior to hire. Upon retirement of the incumbent, this position should be compared to other
administrative support positions in the Borough.
LIBRARY DEPARTMENT MANAGER, TEEN LIBRARY SUPERVISOR, & LIBRARY ASSISTANT These full‐time positions are paid from $29,203 to $37,918 annually which is 74% to 119% of the
minimum in the survey. The Adult Department Manager, who carries the most responsibility, is paid
$34,112 or 26% below the survey minimum for their position.
TECHNICAL SERVICES SUPERVISOR & INTERLIBRARY LOANS Technical services are a specialized library skill that is extremely difficult to replace and often requires a
master's degree. This part‐time employee is currently paid under $11 per hour and 34% below the survey
minimum for their position. The interlibrary loans employee is paid within the range.
LIBRARY ASSISTANT The minimum hourly rate for a Library Assistant reported in the survey is $14.21 per hour. Five part‐time
Library Assistants are paid under $11 per hour and two long‐standing part‐time Library Assistants are paid
within the range.
MAINT. & SANITATION TECH Insufficient Data. The Maintenance & Sanitation Technician part‐time position was filled at a 2021 pay
rate of $18.00 per hour.
INTERPRETATION OF FINDINGS Market ranges are constructed around the average but it is important to consider a variety of factors
when determining whether a particular average will be applied and what it means if the Borough pay is
above or below the average. The following guidelines are offered to assist with review and application of
market data.
1. “Market” is often defined as where you get people from and where you lose people to, so it is
important to consider what the market data looks like beyond the immediate area for some hard
to fill positions. Therefore, in some cases the consultant has applied information from other
survey data resources.
2. Market data is like a ballpark in that it encompasses a range of pay and duties. The average can
fluctuate based on several factors but the goal is to consider a few of these as follows:
a. Is the current Borough pay particularly high or low compared to the average for a
particular job? If yes, is there a reason? For example:
i. Does that job demand particular qualifications and skill that are difficult to find
(hard to replace) or pose unique circumstances that are different from other
municipalities in the survey?

15 |C o m p e n s a t i o n S t u d y | N J H e s s A s s o c i a t e s | 1 1 / 1 7 / 2 0 2 1
Key employees who bring strong sets of skill and experience need to
be paid greater than the average or quickly accelerated to a
competitive position in the market range if retention is desired.
ii. Does the job incumbent have more or less years of experience than other job
incumbents?
New employees may be paid less than the market average and at a
rate commensurate with their skill and experience.
Likewise, employees who have more years of experience may be
paid above the average. Although it varies for different job positions,
a general guideline is that employees should be paid at the market
average within five (5) years. Organizations who have a market lag
strategy may take seven (7) years and organizations with a lead
strategy may accelerate pay to ensure employees are paid at the
market average within three (3) years.
iii. Is pay for one area of the organization particularly high or low compared to
others in the organization?
Market position should be similar for most (but maybe not all) job
positions. Exceptions include jobs that are difficult to fill, or a new
position that is difficult to match with the market or a job with an
unusual status such as part‐time or contract. However, where one or
a few positions fall above or below the market and there is no
reasonable explanation, it is important to note and consider market
adjustments to pay.
3. The minimum and maximum of the pay ranges are based on a standard width of 50% where the
market average is the midpoint. However, the data may indicate a need to make the range
narrower or wider based on “best fit”. The factors that influence these decisions are varied and
can be discussed with the consultant.
NEXT STEPS The following discussion points are summarized here for further examination.
1. Currently there are no parameters or limitations regarding provision of health insurance benefits
while employees are on inactive leave. The Borough may wish to take a closer look at how risk is
managed when employees go out on long term leave. Perhaps a strategy for managing such cases
so that employees either return in a modified job as soon as possible is an option. However, it is
recommended that a policy be developed to limit the length of time health insurance is provided
at the same level as active employees. 12 months is typical for local government.
2. The draft pay ranges and in particular, the compra‐ratio column shows where current employee
pay falls in relationship to market pay. The recommended next steps for the Borough is to

16 |C o m p e n s a t i o n S t u d y | N J H e s s A s s o c i a t e s | 1 1 / 1 7 / 2 0 2 1
examine years of service to the organization, years of service in a career area and make
adjustments to current pay where indicated to bring pay in line with market averages.
a. Note that where a new employee does not arrive with many years of experience it is
appropriate that the midpoint will not be reached for several years.
b. Conversely, if an employee has many years of experience with the organization or within
a field, it may be entirely appropriate that pay is at or above the midpoint.
c. Performance expectations should also be aligned with market position so that employees
who are still developing skills are rewarded for their contributions at a different level
than more experienced employees who may be expected to contribute at a higher level
and are also paid higher on the pay range.
3. The recommended steps to implement this pay study are captured in the proposed pay policy
which follows. In particular, the following are guidelines listed in order of priority and may be
adjusted to reflect budgetary parameters:
a. Employees who are not to the minimum of their range will be adjusted to the minimum.
b. Pay for employees with at least 5 years of service will be brought to the midpoint of the
range if not yet there.
c. Pay for employees with 3 years of service will be brought to the 1st quartile of the range,
i.e., the midway point between the minimum and the midpoint if not yet there.
PROPOSED PAY POLICY LANGUAGE The following pay policy represents guiding language which may be modified to reflect organization
needs. The consultant is available to discuss and adapt policy language where requested.
Purpose
The goal of the Borough’s compensation policy is to attract and retain motivated, committed employees
who support the mission of maintaining quality standards in operations and service.
The compensation program is dedicated to the following principles:
1. Promote fair and consistent pay practices.
2. Strive to pay employees a competitive rate within the appropriate labor market.
3. Promote compliance with federal, state and local compensation statutes and regulations.
Pay Ranges
The minimum of the pay range establishes the entry pay rate for candidates who meet minimum
qualifications set forth on the job description. The midpoint represents the relative market average for
jobs within a pay range. The maximum rate establishes the top rate paid to jobs assigned to a pay range.

17 |C o m p e n s a t i o n S t u d y | N J H e s s A s s o c i a t e s | 1 1 / 1 7 / 2 0 2 1
New Hires
A newly hired employee who has the requisite qualifications for a position will be assigned the minimum
rate of pay for the assigned pay range. However, where the newly hired employee has previous
experience and related qualifications or skills that exceed the minimum level of qualifications, the new
employee may start at the rate corresponding to the first quartile of the range. If the market demands a
higher starting rate and the position is difficult to fill, the Borough Manager may approve a starting rate
up to the market midpoint.
In some cases, an employee without the requisite qualifications may be hired at a rate below the
minimum until the employee meets the hiring requirements.
Pay Compression
Where pay compression results in supervisors or managers being paid at or less than the employees they
supervise, the assigned pay will be adjusted to reflect a 7% increase over the highest paid employee
supervised.
1. Pay compression may not exist where the supervisor has relatively few years of experience, the
person they supervise has many of years of experience and the pay represents an outlier
compared to others supervised.
2. Pay compression is generally deemed to exist where a supervisor, with more than five years of
experience, is paid the same or less than a 7% difference, than those being supervised, where
those supervised have up to ten years of experience.
3. For the purposes of examining pay compression, overtime and other discretionary pay may be
included in the total pay.
Annual Pay Awards
Annual salary adjustments will be based on a combination of local or regional economic indicators. Each
year the Borough will review a variety of indicators to determine an appropriate salary budget increase.
One key factor will be the average salary budget or pay increases anticipated in the local or regional
market as indicated by professional surveys.
NOTE: Generally, salary ranges should be adjusted at a slower rate than the current salary rates. A
common standard is to adjust the ranges at a rate that is 1% below the BLS change in the cost of
living for the previous 12 months. For example, if the BLS indicator of the cost of living is 2.7% for
the previous twelve months, an adjustment of 1.7% to the minimum, maximum and midpoint
rates should be applied.
In addition, many organizations increase salary budgets on an annual basis by approximately one
percentage point above the cost‐of‐living indicator for the previous 12 months. For example, if the
BLS indicator is 2.7% for the previous 12 months, the salary budget would be adjusted 3.7%
This is a guideline only and may not be useful when the economy is in an unstable period.
http://www.bls.gov/bls/newsrels.htm#major

18 |C o m p e n s a t i o n S t u d y | N J H e s s A s s o c i a t e s | 1 1 / 1 7 / 2 0 2 1
Progression through the Pay Range
Employees will progress to the midpoint of their assigned range with an overall goal of moving employees
to the midpoint within five (5) to seven (7) years.
Once an employee is paid the midpoint rate, progression through the range will reflect performance
increases awarded by the Borough and any additional discretionary increases including service and other
established factors.
Employees who reach the maximum rate will receive base salary increases up to the maximum of the rate
range when the maximum rate for the range is adjusted. Any increase amounts beyond the maximum
rate will be awarded in a lump sum but will not be included as part of the base pay.
Annual salary adjustments will be recommended by the Borough Manager and will be based on a
combination of local or regional economic indicators and performance‐based factors.
Market Adjustments
The Borough will strive to conduct a salary survey or participate in a survey at least once every three
years in order to make market adjustments to pay. [NOTE; However, it is best practice to always stay
abreast of labor market rates, especially during periods of change within the organization or in the
economy.] As a result of the survey, some job positions may require more adjustment than others. These
adjustments will occur separately from performance increases.
The following are guidelines listed in order of priority and may be adjusted to reflect budgetary
parameters:
1. Employees who are not to the minimum of their range will be adjusted to the minimum.
2. Pay for employees with at least 5 years of service will be brought to the midpoint of the range if
not yet there.
3. Pay for employees with 3 years of service will be brought to the 1st quartile of the range, i.e., the
midway point between the minimum and the midpoint if not yet there.
“Green light positions” may be adjusted in order to align pay with market where there is clear data to
support adjustments. However, the position will remain in the same pay range unless the job role and
demand indicate the need for a new pay range assignment.
CLOSING THOUGHTS
The intent of this report is to provide an overview of survey findings and to initiate productive discussions
and further inquiry regarding pay policy at the Borough. The depth and breadth of the report has been
kept within the parameters of the consulting project but the consultant is available as needed to provide
additional analysis or development of policy, answer questions and assist the Borough with development
of pay strategies and rewards. Finally, communication of pay policy is the single most effective way to
build trust among the workforce with respect to pay and it is hoped that this survey will help the Borough
articulate how current pay relates to “the market” and build effective total compensation strategies for
the future.

19 |C o m p e n s a t i o n S t u d y | N J H e s s A s s o c i a t e s | 1 1 / 1 7 / 2 0 2 1
APPENDIX
2021 SURVEY DATA
POSITION CURRENTINCLUDES
LONGEVITYMIN MID MAX COMP Ratio COMP Ratio COMP Ratio
Borough Manager 6 128,125$ 108,454$ 135,567$ 162,681$ 1.18 0.95 0.79
Director of Finance/Treasurer 5 101,529$ 77,446$ 96,808$ 116,170$ 1.31 1.05 0.87
Police Chief 5 105,648$ 118,326$ 96,286$ 120,357$ 144,429$ 1.23 0.98 0.82
Director of Water Resources 5 115,512$ No market data
Director of Planning and Engineering 5 114,288$ 90,945$ 113,682$ 136,418$ 1.26 1.01 0.84
Fire Chief 5 99,557$ 109,513$ 79,646$ 99,557$ 119,468$ 1.38 1.10 0.92
Public Works Director 5 99,000$ 76,783$ 95,978$ 115,174$ 1.29 1.03 0.86
Police Lieutenant 4 103,014$ 115,376$ 81,635$ 102,044$ 122,453$ 1.41 1.13 0.94
Assistant to Water Resource Director 4 89,812$ 98,793$ No market data
Assistant Public Works Director 4 69,188$ 64,886$ 81,107$ 97,328$ 1.07 0.85 0.71
Human Resource Manager 4 51,763$ 65,700$ 82,125$ 98,550$ 0.79 0.63 0.53
Wastewater Treatment Supervisor 3 77,232$ 84,955$ 69,547$ 86,934$ 104,321$ 1.22 0.98 0.81
Water Distribution Supervisor 3 77,232$ 84,955$ No market data
Water Treatment Plant Supervisor 3 77,232$ 84,955$ 61,403$ 76,754$ 92,104$ 1.38 1.11 0.92
Building Permit & Zoning Officer 3 72,881$ 80,169$ 60,382$ 75,478$ 90,574$ 1.33 1.06 0.89Fleet Supervisor 3 69,000$ 75,900$ 61,137$ 76,421$ 91,705$ 1.24 0.99 0.83Library Director 3 65,000$ 61,201$ 76,501$ 91,801$ 1.06 0.85Transfer Station Supervisor 3 66,189$ No market data
Electrician/Facilities Maintenance 2 62,121$ 68,333$ 53,771$ 67,214$ 80,657$ 1.27 1.02 0.85
Finance Office Manager 2 59,219$ 65,141$ No market data
Borough Secretary 2 58,439$ 64,283$ 52,672$ 65,840$ 79,008$ 1.22 0.98 0.81
Caretaker, Supervisor Dam Maint. 2 54,131$ 59,544$
Codes Enforcement Officer 2 51,300$ 64,125$ 76,950$
Classification held for future use 1
2021 SALARY
COMPARISON
OF 2021
SALARY TO
MAXIMUM
PAY RANGE
No market data; Housing provided at a value over $12,000 annually
vacant
Pay
Class
COMPARISON
OF 2021
SALARY TO
MINIMUM
PAY RANGE
COMPARISON
OF 2021
SALARY TO
MIDPOINT OF
PAY RANGE

20 |C o m p e n s a t i o n S t u d y | N J H e s s A s s o c i a t e s | 1 1 / 1 7 / 2 0 2 1
The following non‐union positions are outside of this pay classification because they are in transition or subject to further evaluation.
2021 SURVEY DATA
POSITION CURRENTINCLUDES
LONGEVITYMIN MID MAX COMP Ratio COMP Ratio COMP Ratio
Administrative Assistant, Public Works 49,519$ 54,471$ No market data
Executive Secretary, Fire Commission 53,501$
Caretaker, Laborer Dam Maint. 49,399$ 52,363$
Administrative Assistant, Library 45,455$ 50,000$ No market data
Library Assistant / Volunteer Coord. 36,150$ 39,042$ 32,912$ 41,140$ 49,368$ 1.19 0.95 0.79
Youth Department Manager 37,918$ 46,075$ 57,594$ 69,113$ 0.82 0.66 0.55
Adult Department Manager 34,112$ 46,075$ 57,594$ 69,113$ 0.74 0.59 0.49
Library Assistant 29,848$ 28,711$ 35,889$ 43,067$ 1.04 0.83 0.69
Teen Library Supervisor 29,203$ 32,912$ 41,140$ 49,368$ 0.89 0.71 0.59
Maint. & Sanitation Tech ‐ Part‐time 18.00$ No market data
Interlibrary Loans ‐ Part‐time 16.55$ 15.82$ 19.78$ 23.73$ 1.05 0.84 0.70
Library Assistant ‐ Part‐time 15.61$ 13.80$ 17.25$ 20.71$ 1.13 0.90 0.75
Library Assistant ‐ Part‐time 14.12$ 13.80$ 17.25$ 20.71$ 1.02 0.82 0.68
Library Assistant ‐ Part‐time 10.82$ 13.80$ 17.25$ 20.71$ 0.78 0.63 0.52
Library Assistant ‐ Part‐time 10.51$ 13.80$ 17.25$ 20.71$ 0.76 0.61 0.51
Tech Service Supervisor ‐ Part‐time 10.51$ 15.82$ 19.78$ 23.73$ 0.66 0.53 0.44
Library Assistant ‐ Part‐time 10.00$ 13.80$ 17.25$ 20.71$ 0.72 0.58 0.48
Library Assistant ‐ Part‐time 10.00$ 13.80$ 17.25$ 20.71$ 0.72 0.58 0.48
Library Assistant ‐ Part‐time 10.00$ 13.80$ 17.25$ 20.71$ 0.72 0.58 0.48
No market data
2021 SALARY
No market data; Housing available at a value over $12,000 annually
Pay
Class
COMPARISON
OF 2021
SALARY TO
MINIMUM
PAY RANGE
COMPARISON
OF 2021
SALARY TO
MIDPOINT OF
PAY RANGE
COMPARISON
OF 2021
SALARY TO
MAXIMUM
PAY RANGE

21 |C o m p e n s a t i o n S t u d y | N J H e s s A s s o c i a t e s | 1 1 / 1 7 / 2 0 2 1
Notes on Summary Worksheet Compra‐ratio (last column on the worksheet) computes the relationship between the market average and the actual pay of the position in the Borough, i.e.,
current pay/survey average.
This gives you information about where your current pay is relative to the market. So, for example, if the compra‐ratio is 1.00, your municipality pays right at
market; .90 means you pay 10% below the market average; 1.09 means you pay 9 % above the market average.
To interpret the data above, a good place to start is to look at the Compra‐ratio which indicates the percentage an employee is paid of the mid‐point of the 2021
market rate for the position the employee holds.

22 |C o m p e n s a t i o n S t u d y | N J H e s s A s s o c i a t e s | 1 1 / 1 7 / 2 0 2 1
ABOUT N.J. HESS ASSOCIATES
NJ Hess Associates helps organizations design and implement effective HR strategies that value
engagement and whole system approaches to work and community.
Nancy J Hess, HR Strategist, has been designing and developing human resource
systems for organizations for over 30 years in the private, non‐profit and public
sectors. Nancy provides expertise and coaches managers in the strategic use of
HR interventions and helps leaders to build effective compensation programs,
competency models and performance systems. Her distinctive competency is
tapping into the internal strengths of an organization, partnering with clients to
engage people in the process of change and helping leaders to design and
implement effective strategies to support high performance workplaces.
In addition to her consulting work, she was part of the adjunct faculty in the
Department of Management at Bloomsburg University for over ten years where
she taught Strategic Compensation, Human Resource Management, Labor Relations and Organization
Behavior courses in the School of Business. She is a speaker at conferences and conducts workshops on
various human resource and organization development topics such as building better employee
engagement and linking pay and performance.
Prior to starting her own practice, Nancy was a Senior Consultant in a Midwest consulting firm where she
conducted management audits, researched employment and labor relation issues and represented
clients at the State Labor Board.
Nancy completed her Masters in Management, Labor and Human Resources at the Ohio State University
and her Bachelors in Psychology and Dance Therapy at Goucher College in Baltimore Maryland.
Hummelstown, Pennsylvania
(717)566‐6115