Nitrogen isotope tracer acquisition in low and tall birch tundra plant communities: a 2 year test of...
18
1 23 Biogeochemistry An International Journal ISSN 0168-2563 Biogeochemistry DOI 10.1007/s10533-013-9930-5 Nitrogen isotope tracer acquisition in low and tall birch tundra plant communities: a 2 year test of the snow–shrub hypothesis Mathew R. Vankoughnett & Paul Grogan
-
Upload
richlandcenter-uwc -
Category
Documents
-
view
4 -
download
0
Transcript of Nitrogen isotope tracer acquisition in low and tall birch tundra plant communities: a 2 year test of...
1 23
BiogeochemistryAn International Journal ISSN 0168-2563 BiogeochemistryDOI 10.1007/s10533-013-9930-5
Nitrogen isotope tracer acquisition in lowand tall birch tundra plant communities: a2 year test of the snow–shrub hypothesis
Mathew R. Vankoughnett & PaulGrogan

1 23
Your article is protected by copyright and all
rights are held exclusively by Springer Science
+Business Media Dordrecht. This e-offprint
is for personal use only and shall not be self-
archived in electronic repositories. If you wish
to self-archive your article, please use the
accepted manuscript version for posting on
your own website. You may further deposit
the accepted manuscript version in any
repository, provided it is only made publicly
available 12 months after official publication
or later and provided acknowledgement is
given to the original source of publication
and a link is inserted to the published article
on Springer's website. The link must be
accompanied by the following text: "The final
publication is available at link.springer.com”.
Nitrogen isotope tracer acquisition in low and tall birchtundra plant communities: a 2 year test of the snow–shrubhypothesis
Mathew R. Vankoughnett • Paul Grogan
Received: 30 January 2013 / Accepted: 4 November 2013
� Springer Science+Business Media Dordrecht 2013
Abstract Deciduous shrub density and landcover
are increasing across many areas of the Arctic. Shrub
growth may be promoted by a snow–shrub feedback
whereby relatively tall shrubs accumulate deeper
snow, raising winter soil temperature minima, increas-
ing microbial activity, and enhancing soil solution
nitrogen (N). Although there is good evidence for the
above components of the hypothesis, it has not yet
been determined if shrubs can access the elevated N
pool generated by deepened snow. We added isotopic
N tracer (15N) in late summer to control and
snowfenced low birch hummock tundra to test the
influence of deepened snow on N cycling. Further-
more, tracer was added to tall birch tundra to compare
N cycling in low and tall shrub ecosystems that have
the same species composition. Experimentally deep-
ened snow in low birch tundra did not significantly
affect 15N uptake by shrubs or any other species
2 years after the tracer addition. However, there were
strong differences between the low and tall birch
ecosystems, with the deciduous shrubs and graminoids
accumulating more 15N than the evergreen shrubs in
the relatively productive tall shrub site, and vice versa
in the relatively infertile low birch site. The greater15N acquisition by birch in the more fertile site,
together with the absence of a deepened snow effect on15N acquisition by any species in the low birch
hummock ecosystem, suggest that climate-change
induced increases in birch shrub growth and expansion
across the landscape will tend to occur most rapidly in
and around existing tall birch shrub patches.
Keywords Arctic � Increased snow �Isotope 15N � Shrub expansion � Snow–shrub
feedback hypothesis �Winter processes
Introduction
Recent satellite imagery indicates that a vegetation
transition coinciding with climate warming may be
occurring across the Arctic (Goetz et al. 2005; Forbes
et al. 2010; Beck and Goetz 2011; Xu et al. 2013).
Repeat aerial photography, plot-level monitoring, and
experimental manipulations suggest that increased
growth and expansion of the deciduous shrubs alder,
willow, and birch is a major component of this
vegetation transition (Chapin et al. 1995; Bret-Harte
Responsible Editor: Chris D. Evans.
Electronic supplementary material The online version ofthis article (doi:10.1007/s10533-013-9930-5) contains supple-mentary material, which is available to authorized users.
M. R. Vankoughnett (&)
Department of Biology, University of Western Ontario,
London, ONN6A 5B7, Canada
e-mail: [email protected]
P. Grogan
Department of Biology, Queen’s University, Kingston,
ONK7L 3N6, Canada
e-mail: [email protected]
123
Biogeochemistry
DOI 10.1007/s10533-013-9930-5
Author's personal copy

et al. 2001; Tape et al. 2006; Myers-Smith et al. 2011;
Tremblay et al. 2011; Elmendorf et al. 2012a;
Elmendorf et al. 2012b; Ropars and Boudreau 2012;
Tape et al. 2012). Increased shrub cover is expected to
reduce both winter and summer albedo, thereby
providing a positive feedback to regional warming
(Chapin et al. 2005; Sturm et al. 2005). Furthermore,
increased shrub cover and associated changes in litter
quality may shift tundra ecosystem carbon balance,
resulting in either a positive or negative feedback to
atmospheric carbon dioxide concentrations depending
on whether net primary production or ecosystem
respiration is most affected (Shaver et al. 1992;
Hobbie et al. 2000).
The Snow–Shrub Feedback Hypothesis predicts
that relatively tall dense shrub areas preferentially
accumulate snow, resulting in higher soil temperature
minima, increased microbial decomposition of soil
organic matter (SOM), and enhanced nutrient supply
to those shrubs (Sturm et al. 2001; 2005). Since
fertilization studies indicate that plant growth (espe-
cially birch) in many low arctic sites is strongly
nutrient-limited (Jonasson et al. 1999; Mack et al.
2004; Zamin and Grogan 2012) the snow–shrub
feedback may contribute to the observed increases in
growth and expansion of deciduous shrubs. Field
studies support many components of the hypothesis.
Shrub tundra communities accumulate deeper snow
than lower stature vegetation (Sturm et al. 2001,
2005), and experimentally deepened snow elevates
soil temperature minima (Schimel et al. 2004; Nob-
rega and Grogan 2007; Buckeridge and Grogan 2008),
enhancing winter soil microbial activity (Schimel
et al. 2004; Nobrega and Grogan 2007; Grogan 2012)
and N mineralization rates (Schimel et al. 2004).
Furthermore, in concurrent research in the same snow
manipulation plots as used here, Buckeridge and
Grogan (2010) demonstrated that deeper snow
increases late thaw pulses of organic and inorganic
nitrogen (N) and phosphorus that occur towards the
end of snowmelt when soils are water-saturated and
very close to 0 �C. Thus, the applicability of the
Snow–Shrub Feedback Hypothesis now rests on
determining if deciduous shrubs can preferentially
acquire the additional nutrients that are made available
in the soil as a result of deepened snow.
Deepened snow alone may not be the only mech-
anism contributing to enhanced N availability in the
Snow-Shrub Feedback Hypothesis. Apart from
preferential snow accumulation, tall shrub vegetation
may also have distinct biological and chemical
characteristics that promote its own growth. For
example, the more easily decomposable and larger
quantities of litter associated with tall versus low shrub
vegetation communities may be as important as snow
depth in determining organic matter decomposition
and N mobilization rates over winter (Buckeridge and
Grogan 2008; Hobbie 1992; Nadelhoffer et al. 1991).
Ultimately, as the arctic climate warms and soil N
availability is enhanced, the extent to which low
stature and relatively scarce deciduous shrubs rise to
biomass dominance within tundra plant communities
will depend on their ability to preferentially acquire
and utilize N for growth (McKane et al. 2002).
Chronic high level fertilization can clearly promote
transitions from low to tall shrub tundra (Chapin
et al. 1995; Mack et al. 2004), but differing naturally
occurring levels of soil fertility may also influence
plant community responses to increased N availabil-
ity. Species differ in physiological capacity for
nutrient uptake (Grogan and Jonasson 2003), in
timing of nutrient uptake (Larsen et al. 2012), in
affinity for different N forms (McKane et al. 2002)
and in rooting biomass and depth. These differences,
which reflect their adaptation to particular fertility
niches, may affect their relative abilities to compete
for N. Thus site N availability may be an important
determinant of success in N acquisition by the
various deciduous, evergreen, and graminoid plant
species within low and tall shrub vegetation com-
munities. In particular, the ability of deciduous
shrubs to outcompete other species for N under
differing naturally occurring levels of soil fertility
has not been investigated despite its importance to
understanding and predicting the potential for shrub
expansion across the low Arctic.
Here, we investigated the impact of deepened snow
on ecosystem partitioning of an added isotopic N (15N)
tracer among soil and plant species pools in low birch
hummock tundra. Specifically, the tracer was added in
late summer to control and snowfenced low birch
hummock tundra plots to test the influence of deep-
ened snow on microbial 15N turnover and soil 15N
availability over one winter, and on plant and micro-
bial 15N acquisition after 2 years. We also added an
equivalent amount of tracer to tall birch (unfenced)
tundra plots to compare species 15N acquisition in low
and tall shrub ecosystems that have the same species
Biogeochemistry
123
Author's personal copy
composition but that differ in site N availability. We
tested the following hypotheses:
I. Deepened snow in low birch hummock tundra
significantly affects soil microbial biomass N,
soluble N, and tracer 15N pools in early spring (i.e.
over a single winter following tracer addition).
II. Deepened snow in low birch hummock tundra
enhances deciduous shrub 15N acquisition 2 years
after tracer addition.
III. Species dominance within the low and tall birch
plant communities correlates with 15N acquisi-
tion, and differs according to site N availability.
Methods
Site description
This study was conducted in low arctic tundra near the
tundra ecological research station (TERS) at Daring
Lake (64�520N, 111�350W) in the Coppermine River
watershed, *300 km northeast of Yellowknife from
late summer 2006–2008. Local climate records
(1996–2009; Bob Reid, Indian and Northern Affairs
Canada, unpublished data) indicate daily mean air
temperatures ranging from -40 �C in winter to 22 �C
in summer, with a mean annual rainfall of 142 mm
(Standard error (SE) ± 14). Snow is present for
*200 days (mid-October–June), with snow depth
\10 cm until November, by which time soil temper-
atures are below freezing (Buckeridge and Grogan
2008). The research area is located in a gently sloping
valley bordered by an esker to the north and Canadian
Shield bedrock outcrops to the south, and contains a
variety of different vegetation types underlain by
continuous permafrost with a soil active layer ranging
from 0.3 to 2 m (Obst 2008). These vegetation types
generally occur along toposequences that extend from
exposed ridges where dry heath is common down to
mesic low birch hummock and ultimately wet sedge at
the base. Tall birch patches are found scattered across
the landscape in areas close to obvious seasonal
surface water flow, but also in apparently mesic
locations including relatively high elevation topo-
graphic areas protected from the prevailing wind
where snow preferentially accumulates (Obst 2008).
Low birch hummock tundra is characterized by
hummocks 10–30 cm high and deciduous dwarf birch
(Betula glandulosa (Michx.), shrubs that range from
10–40 cm tall. The vegetation is dominated by mosses
and lichens and the short evergreen shrubs mountain
cranberry (Vaccinium vitis-idaea L.) and labrador tea
[Rhododendron subarcticum (Harmaja) (formerly Le-
dum decumbens)], with bog blueberry (Vaccinium
uliginosum L.), bog rosemary (Andromeda polifolia
L.), cloudberry (Rubus chamaemorus L.), and grami-
noids (mainly Carex spp.) (Nobrega and Grogan 2007)
(Table S1). Tall birch tundra is dominated by dense
cover of B. glandulosa (Michx.) shrubs *80 cm high.
Species composition in this ecosystem was almost
identical to the birch hummock vegetation (Table S1),
except that occasional tall willow shrubs (Salix spp.)
are present and A. polifolia is absent.
An experimentally deepened snow treatment was
established in replicate patches of low birch hummock
tundra in summer 2004 using snow fences in a
staggered formation *30 to 60 m apart from one
another, and control plots (n = 5) located alongside in
nearby patches of similar vegetation composition and
topography (Nobrega and Grogan 2007). Five plots
were randomly located along a downslope transect
within a large patch (*40 9 130 m) of tall birch
tundra located on a gentle slope without obvious signs
of preferential water flow in the same valley as the low
birch hummock sites (Buckeridge et al. 2010b).
Seasonal soil moisture in this shrub patch is compa-
rable to mesic shrub tundra in Toolik, Alaska (Wein-
traub and Schimel 2005), but is 2–5 times dryer than
‘moist acidic’ tussock tundra (Clemmensen et al.
2008; Sorensen et al. 2008; DeMarco et al. 2011). Soil
active layer depths late in the growing season tend to
be *10 cm deeper in the tall birch site (e.g.
62 ± 2 cm; n = 15; August 12, 2008) than is typical
in the birch hummock site (e.g. 48 ± 5 cm; August
14, 2004), but the snowfence treatment there has not
significantly affected thaw depth (Nobrega and Gro-
gan 2008; Grogan 2012).
Soil temperature and soil water
Soil temperatures at 2, 5, and 10 cm depth were
recorded every 4 h in the control and snowfenced low
birch hummock plots (n = 2 pairs of probes in each of
two plots of each treatment for each depth) and in tall
birch plots (n = 3 probes at each depth) using
thermocouple probes (with an in situ precision coef-
ficient of variation 1.7–7.4 %) connected to CR10X
Biogeochemistry
123
Author's personal copy
dataloggers (Campbell Scientific). Soil moisture was
measured gravimetrically on all soil samples, and
continuously as volumetric water content in two plots
at each site using 30 cm long dielectric permittivity
probes (Campbell Scientific) inserted at an angle to
measure moisture within the top 5 cm of soil, and
connected to the same dataloggers that recorded soil
temperatures.
15N isotope injections
We labeled three sub-plots within each of the five
replicate plots at each site to permit multiple destruc-
tive 15N harvests for this study, and longer term
investigations in future years. Each 15N injection sub-
plot was centered over a randomly selected single
representative discrete birch plant. Sub-plots (n = 3)
were located 2–5 m apart within each of the five birch
hummock control plots, and 1–2 m to the north side of
each the five snowfences, and within each of the five
tall birch plots. We injected each sub-plot with
solutions containing 98 % enriched 15NH4Cl (Cam-
bridge Isotope Laboratories, Andover, MA) between
August 22–24, 2006 to achieve a common label
addition of 50 mg 15N m-2 in all sites (equivalent to
4.3, 3.4, and 3.0 lg 15N g dw soil-1 in the birch
hummock, snowfenced low birch hummock, and tall
birch sites respectively). Injections (5 ml each) were
made using a syringe with a terminally blocked 8.5 cm
needle that had a pair of opposite holes at 8 cm depth
and an orthogonal pair of holes at 7.3 cm depth. The
needle was inserted to 8 cm depth below the green–
brown moss transition and then slowly withdrawn as
the syringe was depressed to distribute the solution
laterally through the soil profile up to just below the
soil surface. Over 80 % of the roots in these ecosys-
tems occur in the top 5 cm of the organic soil layer
(Churchland et al. 2010; Grogan, pers. observation),
and so we anticipate that most of the root biomass
would have had access to the label. The birch
hummock and snowfenced low birch hummock 15N
additions were made using a 35 9 35 cm injection
grid with 8 injections (each 1.66 mM 15NH4Cl) 5 cm
apart, resulting in a total labeled area of 40 9 40 cm
in each of the sub-plots. The size, canopy cover, and
associated root biomass of the individual birch plants
in the tall birch site were much larger than in the birch
hummock sites. In order to account for this plant size
difference, we labeled the soil beneath each tall birch
shrub using the same number of injections as was used
in the low birch sites, but at a larger spatial interval to
account for the larger ground area occupied by that
plant. Therefore, the 15N additions in the tall birch site
were made using a larger injection grid of 70 9 70 cm
with eight injections (each 6.66 mM 15NH4Cl) each
10 cm apart, resulting in a total labeled area of
80 9 80 cm for each sub-plot. We acknowledge that
the different spacing of injections at the low birch and
tall birch ecosystems could result in confounding
differences in uptake by small-sized species whose
root distributions are not similarly distributed at the
two grid spacings used (25 and 100 cm2). However,
this concern does not apply to our comparison of tracer
uptake in the snowfenced and control low birch
vegetation sites. Vascular plants and/or green mosses
were gently pushed aside at each injection location so
that the label could be delivered directly into the soil.
Isotope distribution was predominantly in the organic
layer but variability in its depth within each of the sites
often resulted in the needle penetrating down into the
mineral layer at full insertion.
Sample collection
To determine initial label distribution, intact samples
of soil plus associated vegetation (*10 9 10 cm
area) were removed to a standard depth of 10 cm
(measured from the green–brown moss transition)
with a serrated knife from a corner of one sub-plot
within each of the five replicate plots at the three
sites on August 28, 2006. Only vegetation that was
rooted within the sampling area was included.
Organic layer depths were measured at the four
corners of each sample in the field, and all soil
samples were stored at *5 �C prior to processing
(within 2 days). Where the soil samples contained
some mineral soil at the base, the depth of each soil
type was noted before separating the two types for all
subsequent analyses. To determine changes in 15N
total distribution over the first winter after labeling
(Hypothesis I), similar samples were removed from
different corners of the same sub-plots 10 months
later (June 21–24, 2007).
To determine the 2 year pattern of 15N distribution
among plant species and soil N pools (Hypotheses II
and III), we removed an entire 15N labeled sub-plot
within each tall birch and birch hummock replicate
plot (40 9 40 cm or 80 9 80 cm as appropriate; all to
Biogeochemistry
123
Author's personal copy
10 cm soil depth) just prior to leaf senescence
(between August 9–23, 2008). To calculate species
and growth form biomass per 1 m2 area, we extrap-
olated from the sampled biomasses within each sub-
plot. However, since each sub-plot was deliberately
centered on a birch shrub and the nearest neighbour
distance for B. glandulosa in the low birch hummock
sites clearly exceeded the sub-plot dimensions, we
calculated its overall areal biomass in those sites using
a previously determined density of two birch plant
ramets per m2 (Zamin and Grogan 2012).
Sample processing
Intact vegetation from each sub-plot was gently teased
out from the soil to collect as much of the attached root
system as possible, and then sorted to species and
growth forms. Birch shrubs were sorted into shoot new
growth (all leaves plus apical stem tissue produced in
the most current growing season as determined by
colour change and complete budscars), shoot old
growth (stem biomass from all previous years includ-
ing secondary growth (shoot thickening)); below-
ground stems ([5 mm diameter), coarse roots
(2–5 mm diameter), and fine roots (\2 mm diameter).
Birch belowground stems and coarse roots were not
observed in the mineral layer of any sub-plot.
Other vascular plant shoots were separated into
shoot new growth (apical stem tissue in the current
growing season, and leaves and inflorescences/fruits),
shoot old growth, and fine roots (all were \2 mm
diameter). All evergreen species leaves were included
with stems in the shoot new apical growth category to
restrict sorting time and analytical costs while still
allowing us to determine the effect of the snowfence
treatment on 15N uptake and allocation to photosyn-
thetic tissues over the 2 years. Salix spp. were rare but
had distinctive ‘tap’ roots extending [20 cm down
into the mineral layer. Graminoid species were sorted
as a group into shoot new growth (leaves and
inflorescences), shoot old growth (standing dead
tissue, stem bases and rhizomes), and fine roots (all
\2 mm diameter). The remaining material above the
organic soil layer was sorted into mosses, lichens, and
surface litter (including leaf fragments, small twigs
and dead moss tissue). Organic and mineral soil layer
volumes were measured separately on 4–5 sub-sam-
ples of each sub-plot (10 9 10 cm to a 10 cm depth)
to determine bulk densities. Afterwards, the sub-
samples were cut into small chunks (*27 cm3), and a
random selection was sorted into ‘unidentified fine
roots’ (\2 mm diameter) and ‘bulk soil’ (i.e. with
roots removed). Only living roots (on the basis of
tissue turgor and colour) were included in the former
category. Roots were rinsed in water to remove
attached soil and then immersed in 0.005 M K2SO4
for 5–10 min to remove 15N label adhering to exterior
surfaces (Grogan and Jonasson 2003).
Soil microbial biomass C and N (MBC and MBN)
contents were determined by the chloroform-fumiga-
tion direct-extraction using fresh soil (10 g) from which
roots had been removed and 50 ml 0.5 M K2SO4 for
each extraction (Brookes et al. 1985). Fumigation lasted
24 h in a darkened vacuum desiccator jar. Separate non-
fumigated (10 g) samples were extracted with 50 ml
0.5 M K2SO4 immediately after sorting. All extracts
were manually shaken several times over[1 h, left to
settle for 30 min, and then filtered through a 1.2 lm
glass fibre filter (G4; Fisher Scientific) and frozen for
future analyses. Two blanks without sample were
included to detect contamination during extraction and
filtration each day. All shoot and root samples as well as
organic and mineral soil sub-samples and bulk samples
were dried at 65 �C for 2–5 days.
Chemical analyses
Dissolved total N (DTN) and total organic C (TOC) in
the extracts were determined by oxidative combustion
and infrared and chemiluminescence analyses, respec-
tively (TOC-TN autoanalyzer, Shimadzu Japan). NH4
and NO3–N were determined colorimetrically, using
automated flow analysis and the indophenol and
sulphanilamide methods respectively (Bran–Leubbe
Autoanalyzer III, Germany). Dissolved organic N
(DON) was calculated by subtracting inorganic N
forms from the DTN in the non-fumigated samples.
MBC and MBN contents were calculated as the
differences between fumigated and non-fumigated
extractable C and N samples. Our interpretations of
the microbial C, N, and 15N data assume that the
chloroform fumigation efficiency did not vary
between soil types or sampling times. No Kn or Kc
correction factor was used in the MBN or MBC
calculations (Brookes et al. 1985) because values
specific to the site soil-types have not been deter-
mined. All extract concentrations were corrected for
initial soil moisture contents.
Biogeochemistry
123
Author's personal copy
15N isotopic and total N and C analyses
Oven dried shoot tissues, roots, and organic and
mineral soil were ground for *1 min to a fine powder
with a centrifugal (plant organic tissues), or ball mill
(organic and mineral soils) (Retsch, Germany),
weighed out (*1 mg and *10 mg for organic and
mineral samples respectively) into tin capsules (2 mm,
Elemental Microanalysis Limited, UK) and sent for15N and total N analyses at the University of Waterloo
Environmental Isotope Lab. We also analyzed total N
(and C) in larger samples of the organic and mineral
soils (*0.3 g and *1.2 g) using an elemental
analyzer (LECO CNS 2000, USA). Total N concen-
trations were very closely correlated between the two
analyses (IRMS values = 1.01 9 elemental analyz-
ers values ? 0.006; r2 = 0.99) indicating that the
samples were well homogenized and suggesting high
analytical accuracy. DT15N and MB15N were deter-
mined by drying 3 ml of the non-fumigated and
fumigated extracts at 65 �C for 4–6 days (Dijkstra
et al. 2006). Dried salt samples were ground using a
mortar and pestle and weighed (*120 mg) into tin
capsules (5 mm, as above) and sent for analysis to the
Colorado Plateau Stable Isotope Laboratory (Univer-
sity of Northern Arizona).
15N calculations
15N natural abundances were determined in shoot new
growth, old growth, and root tissues of each species, as
well as from mosses, lichens, surface litter, and soils
sampled from 5–6 random locations[5 m away from
the plots in the low birch hummock and tall birch sites
during the 2008 harvest. Replicate tissue samples for
each species shoot new growth, old growth, and roots
were pooled and ground into a composite sample
representing each species growth category from its
respective site. Natural abundance 15N atom percent-
ages in plants ranged from 0.3645 % (V. vitis-idaea;
new growth) to 0.3666 % (graminoids; old growth).
Natural abundance 15N atom percentages were 0.3668
and 0.3669 % in organic and mineral soils respec-
tively, and 0.3655 % in the organic soil microbial
biomass. Paired t tests across the species and soil pools
indicated no differences in natural abundances
between the low birch and tall birch sites. For
calculating label uptake, we assumed that 15N natural
abundance levels in the control and snowfenced low
birch sites were equivalent at the start of the exper-
iment, and that any changes due to the snowfences
were minimal in magnitude compared to tracer
enrichment levels. Supporting this assumption, the
mean isotopic increase as a result of label addition was
0.09 %, while the range of variation in isotopic
concentration among sample categories used to deter-
mine natural abundance levels was always consider-
ably lower (\0.003 %). 15N pool enhancement (i.e.
added 15N accumulated) in the plant and microbial
pools was calculated as (atom% 15Nmeasured - atom%15Nnatural abundance) X total N pool size. Note that we
report our enhancement data on an areal basis (mg15N m-2) so that plant and soil pools can be directly
compared. Since the same amount of label was added
to all plots (50 mg m-2), the percent recovery of the
added label can be calculated from these data, and the
results from the statistical analyses of both variables
are identical. Furthermore, site differences in tracer
dilution in either the soil or plants caused by differing
N cycling rates among sites should not affect our 15N
results since we are comparing tracer acquisition in
absolute amounts on an areal basis. However, accord-
ingly, interpretation of 15N accumulation as an indi-
cator of species overall N accumulation assumes that
those microbial and soil pools most affecting available
N to plants have been turned over enough times in the
study’s 2 years that any impacts of site differences in
N turnover rate (and therefore label dilution) have long
passed. The rapid label turnover in the soil solution N
pool within days of its addition (see ‘‘Results’’ section)
supports this assumption. Tracer in the soil that was
not present in either root, microbial, or soil solution
pools was calculated by subtracting (MB15N?DT15N)
from the total label 15N in the root-removed soil
samples and termed fixed SOM15N. Note that since no
Kn factor (Brookes et al. 1985) was applied, our fixed
SOM estimates are relatively high and would have
been reduced from *80 to 60 % of the total amount
added had we used a Kn of 0.4 (Jonasson et al. 1999).
Statistical analyses
We tested for significant effects of site, year, and their
interaction on each of the soil microbial and solution C
and N pools, 15N label concentrations, and enhance-
ment pools in organic and mineral soil layers, using
separate repeated measures two-way analyses of
variance (ANOVAs). Multiple comparisons were
Biogeochemistry
123
Author's personal copy

conducted using the Tukey–Kramer HSD test to
identify significant differences between all pairwise
combinations (JMP 7.0.2, SAS Institute). Datasets
were tested for normality, and log transformed as
necessary (all soil 15N data but not total elemental
pools). Site effects on 15N concentrations and
enhancements for each species growth component
were tested using separate one-way ANOVAs. All
plant species 15N concentrations were log transformed
to meet normality tests prior to analyses. Tukey–
Kramer HSD tests were not applied to the 15N pool
data by plant species because the distributions could
not be readily transformed to make them normal.
Mean concentrations of N and 15N label in all plant
and organic soil variables were calculated based on the
actual number of replicate plots in which the compo-
nent was present in each site. By contrast, mean 15N
pool enhancements were based on five replicates.
Means and statistical analyses for mineral soil vari-
ables were based on the number of plots in which
mineral soil was present within the sampling depth of
(n = 3, 4 and 5 for the low birch hummock,
snowfenced low birch hummock and tall birch sites,
respectively).
Results
Site differences in soil 15N concentrations and N
and C pools across years
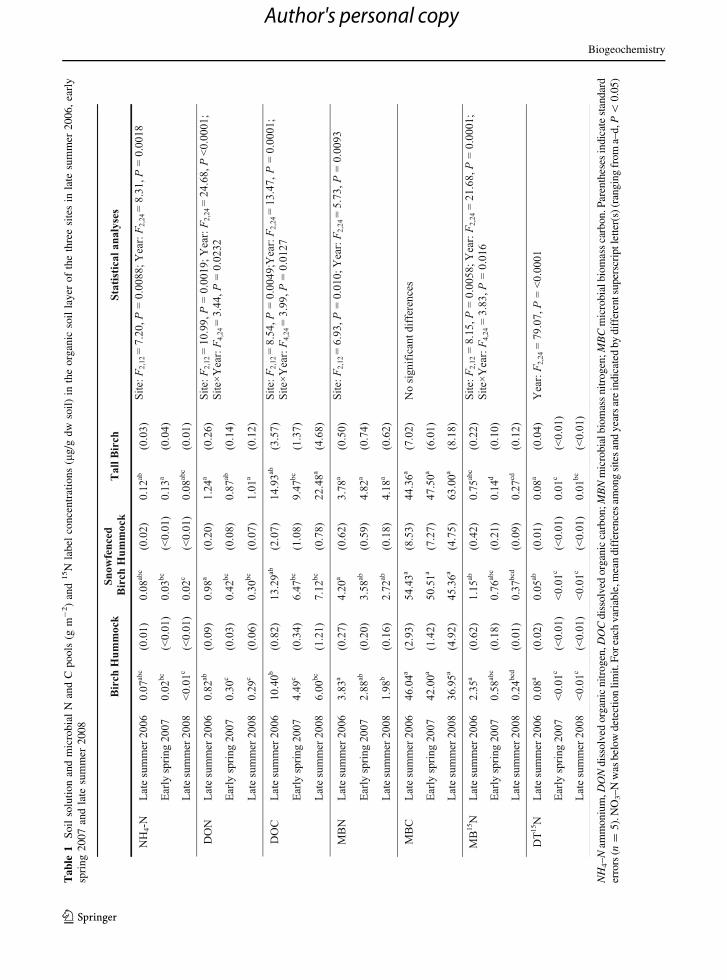
Soil organic layer MB15N tracer concentrations
declined from the initial sampling within 4–6 days
of injection through the following winter and on to the
full 2 year harvest (Table 1). Although initial label
immobilization at the control low birch hummock
tended to be substantially higher than in either of the
other sites, MB15N concentrations were similar among
all sites 2 years later (Table 1). Note that the pattern
for MB15N pool sizes was statistically identical to the
concentrations because variation in isotope concen-
tration was much larger than variation in soil bulk
density (Table S2; Fig. S1). Soil microbes released
*75 % of the acquired label over the first winter after
labeling (i.e. from Fall 2006 to Spring 2007) in the
control low birch hummock and tall birch sites, but
MB15N in the snowfenced plots changed relatively
little over that same period (Table 1; Fig. S1). Mineral
soil MB15N label concentrations and enhancement
pools 2 years after labeling were *10 % of the
overlaying organic layer values, and did not differ
among sites (Table S3). 15N label concentrations
within the dissolved total N (DTN) pool of the organic
layer were *2 % of the concentration added within
4–6 days of injection, indicating rapid turnover in this
pool (Table 1; ‘‘Methods’’ section). Similar to
MB15N, DT15N concentrations declined over the first
winter, but in this case there were no site differences.
The soil organic layer ammonium (NH4–N), dis-
solved organic N (DON), and dissolved organic C
(DOC) pools were generally at least two times larger
in the tall birch site than in the birch hummock site
(especially during the 2007 and 2008 sampling times),
but there were no effects of the snowfence treatment
(Table 1). Correspondingly, the organic layer micro-
bial biomass N (MBN) pool was *18 % larger in the
tall birch site than in either of the birch hummock sites,
in particular during the latter two sampling times. By
contrast, microbial biomass C (MBC) was similar
across sites and years. Microbial biomass and soil
solution pools in the uppermost mineral soil underly-
ing the organic layer in 2008 were \1/3 of the
overlaying organic layer and did not differ statistically
among sites (Table S3).
Site differences in 15N label partitioning
among plant species components
Shoot new growth 15N enhancement (i.e. the amount
of added 15N label accumulated in new shoot apical
growth) differed significantly among the low birch and
tall birch sites for many of the plant species, but there
were no significant snowfence treatment effects
(Fig. 1A). Generally, the deciduous shrub B. glandul-
osa dominated new shoot 15N enhancement in the tall
birch, while the evergreens (R. subarcticum and V.
vitis-idaea) dominated in the birch hummock sites.
New apical shoots of B. glandulosa accumulated at
least sixteen times more 15N in the tall birch than at the
birch hummock sites (F2,12 = 73.5, P = \0.001;
Fig. 1A), partly as a result of 2–4 times larger 15N
label concentrations (Table 2), and therefore the
remainder of this effect being due to larger biomass.
The other common deciduous shrub species V. ulig-
inosum accumulated two times as much 15N in the tall
birch compared to both birch hummock sites
(F2,12 = 5.3, P = 0.004), with no corresponding
differences in 15N label concentrations (Table 2).
Biogeochemistry
123
Author's personal copy
Ta
ble
1S
oil
solu
tio
nan
dm
icro
bia
lN
and
Cp
oo
ls(g
m-
2)
and
15N
lab
elco
nce
ntr
atio
ns
(lg
/gd
wso
il)
inth
eo
rgan
icso
illa
yer
of
the
thre
esi
tes
inla
tesu
mm
er2
00
6,
earl
y
spri
ng
20
07
and
late
sum
mer
20
08
NH
4–
Nam
mon
ium
,DO
Ndis
solv
edorg
anic
nit
rogen
,DO
Cdis
solv
edorg
anic
carb
on
;M
BN
mic
robia
lb
iom
ass
nit
rog
en;M
BC
mic
robia
lbio
mas
sca
rbon.P
aren
thes
esin
dic
ate
stan
dar
d
erro
rs(n
=5).
NO
3–N
was
bel
ow
det
ecti
on
lim
it.F
or
each
var
iab
le,m
ean
dif
fere
nce
sam
ong
site
san
dyea
rsar
ein
dic
ated
by
dif
fere
ntsu
per
scri
ptle
tter
(s)
(ran
gin
gfr
om
a–d,P
\0.0
5)
Biogeochemistry
123
Author's personal copy
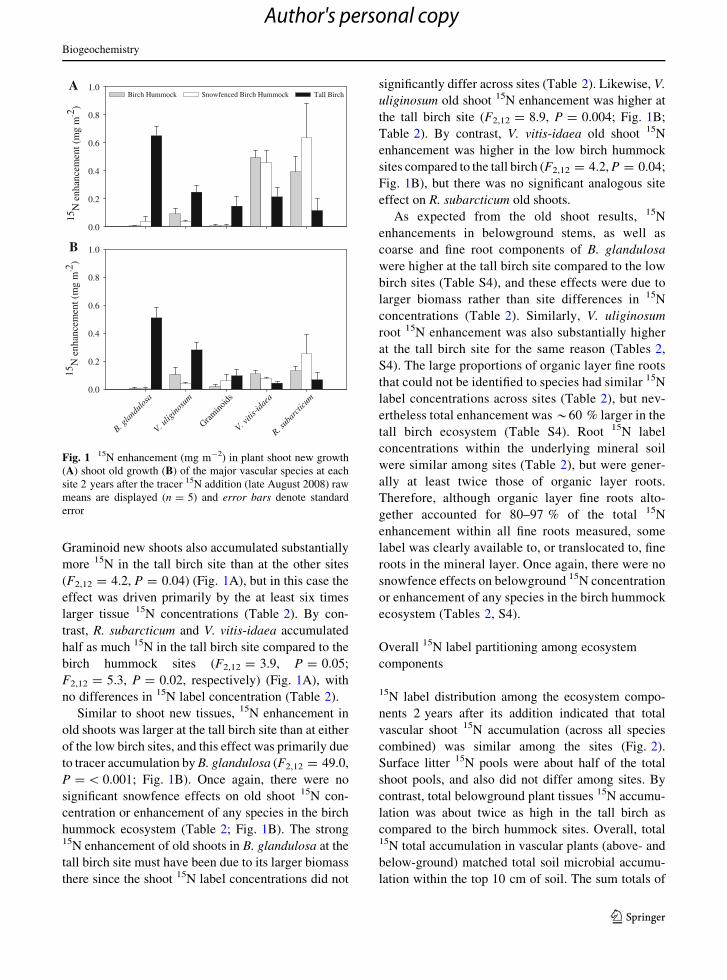
Graminoid new shoots also accumulated substantially
more 15N in the tall birch site than at the other sites
(F2,12 = 4.2, P = 0.04) (Fig. 1A), but in this case the
effect was driven primarily by the at least six times
larger tissue 15N concentrations (Table 2). By con-
trast, R. subarcticum and V. vitis-idaea accumulated
half as much 15N in the tall birch site compared to the
birch hummock sites (F2,12 = 3.9, P = 0.05;
F2,12 = 5.3, P = 0.02, respectively) (Fig. 1A), with
no differences in 15N label concentration (Table 2).
Similar to shoot new tissues, 15N enhancement in
old shoots was larger at the tall birch site than at either
of the low birch sites, and this effect was primarily due
to tracer accumulation by B. glandulosa (F2,12 = 49.0,
P = \ 0.001; Fig. 1B). Once again, there were no
significant snowfence effects on old shoot 15N con-
centration or enhancement of any species in the birch
hummock ecosystem (Table 2; Fig. 1B). The strong15N enhancement of old shoots in B. glandulosa at the
tall birch site must have been due to its larger biomass
there since the shoot 15N label concentrations did not
significantly differ across sites (Table 2). Likewise, V.
uliginosum old shoot 15N enhancement was higher at
the tall birch site (F2,12 = 8.9, P = 0.004; Fig. 1B;
Table 2). By contrast, V. vitis-idaea old shoot 15N
enhancement was higher in the low birch hummock
sites compared to the tall birch (F2,12 = 4.2, P = 0.04;
Fig. 1B), but there was no significant analogous site
effect on R. subarcticum old shoots.
As expected from the old shoot results, 15N
enhancements in belowground stems, as well as
coarse and fine root components of B. glandulosa
were higher at the tall birch site compared to the low
birch sites (Table S4), and these effects were due to
larger biomass rather than site differences in 15N
concentrations (Table 2). Similarly, V. uliginosum
root 15N enhancement was also substantially higher
at the tall birch site for the same reason (Tables 2,
S4). The large proportions of organic layer fine roots
that could not be identified to species had similar 15N
label concentrations across sites (Table 2), but nev-
ertheless total enhancement was *60 % larger in the
tall birch ecosystem (Table S4). Root 15N label
concentrations within the underlying mineral soil
were similar among sites (Table 2), but were gener-
ally at least twice those of organic layer roots.
Therefore, although organic layer fine roots alto-
gether accounted for 80–97 % of the total 15N
enhancement within all fine roots measured, some
label was clearly available to, or translocated to, fine
roots in the mineral layer. Once again, there were no
snowfence effects on belowground 15N concentration
or enhancement of any species in the birch hummock
ecosystem (Tables 2, S4).
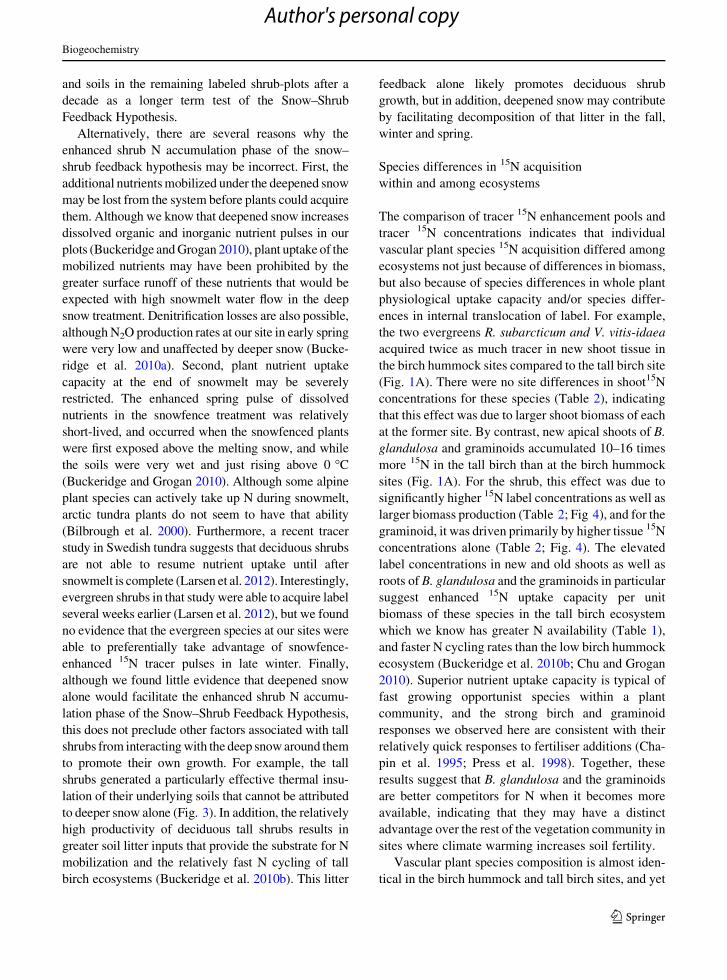
Overall 15N label partitioning among ecosystem
components
15N label distribution among the ecosystem compo-
nents 2 years after its addition indicated that total
vascular shoot 15N accumulation (across all species
combined) was similar among the sites (Fig. 2).
Surface litter 15N pools were about half of the total
shoot pools, and also did not differ among sites. By
contrast, total belowground plant tissues 15N accumu-
lation was about twice as high in the tall birch as
compared to the birch hummock sites. Overall, total15N total accumulation in vascular plants (above- and
below-ground) matched total soil microbial accumu-
lation within the top 10 cm of soil. The sum totals of
15N
enh
ance
men
t (m
g m
-2)
0.0
0.2
0.4
0.6
0.8
1.0Birch Hummock Snowfenced Birch Hummock Tall Birch
B. glan
dulos
a
V. ulig
inosu
m
V. viti
s-ida
ea
R. sub
arcti
cum
15N
enh
ance
men
t (m
g m
- 2)
0.0
0.2
0.4
0.6
0.8
1.0
A
B
Gramino
ids
Fig. 1 15N enhancement (mg m-2) in plant shoot new growth
(A) shoot old growth (B) of the major vascular species at each
site 2 years after the tracer 15N addition (late August 2008) raw
means are displayed (n = 5) and error bars denote standard
error
Biogeochemistry
123
Author's personal copy
the added 15N label in all measured plant, microbial,
and soil solution pools within the organic and sampled
mineral soils (Fig. 2) were 8.1 (SE ± 0.7), 10.5
(SE ± 0.7), and 12.9 (SE ± 2.2) mg 15N m-2 at the
birch hummock, snowfenced low birch hummock, and
tall birch sites, respectively. In other words, *20 % of
the added label was recovered in these pools, and there
were no significant differences among sites. These
data together with our fixed SOM 15N label estimates
in the soil (29.3 (SE ± 5.3), 44.2 (SE ± 6.4), and 74.5
(SE ± 29.4) mg 15N m-2 in the birch hummock,
snowfenced birch hummock, and tall birch soils,
respectively) suggest that most of the added tracer
(50 mg 15N m-2) was retained within the plots (to
10 cm soil depth) at each site over the 2 years.
Site differences in soil environmental and edaphic
characteristics
As expected, the deeper snow in the snowfenced low
birch hummock and tall birch sites resulted in strong
thermal insulating effects in both winters (Fig. 3). The
snowfence treatment effect on soil temperature did not
become evident until late December in winter
2006/2007, and early February in winter 2007/2008,
suggesting an interannual difference in the timing of
snow accumulation. By contrast, soil cooling patterns in
the tall birch site were very similar in the 2 years, and
soil temperatures were generally *5 �C warmer than
the control low birch hummock site from early Decem-
ber to May in both years. Snowfenced low birch
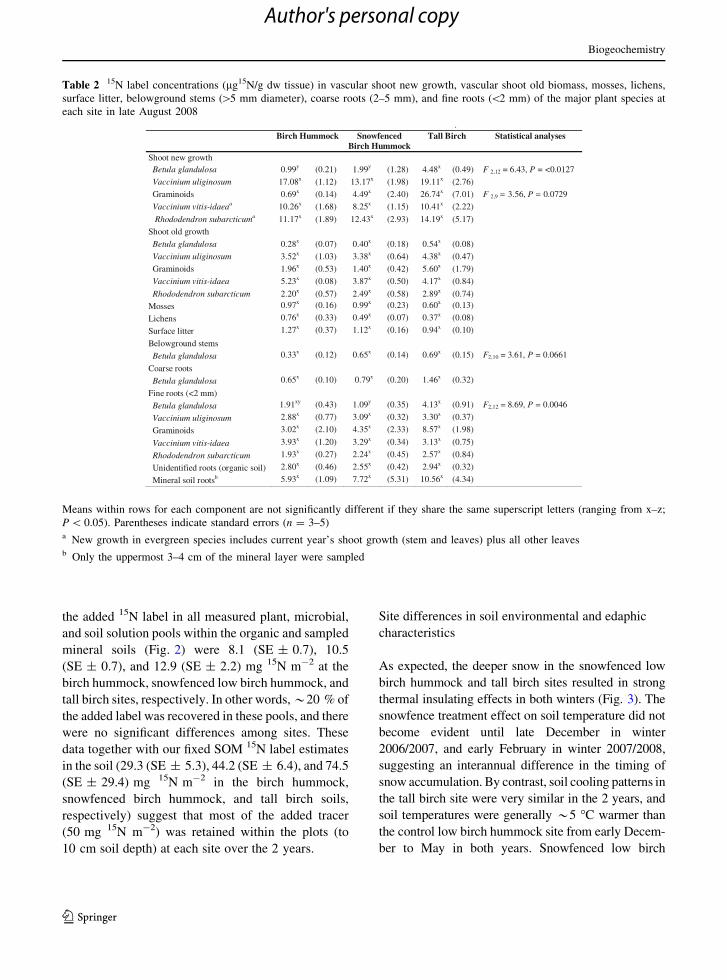
Table 2 15N label concentrations (lg15N/g dw tissue) in vascular shoot new growth, vascular shoot old biomass, mosses, lichens,
surface litter, belowground stems ([5 mm diameter), coarse roots (2–5 mm), and fine roots (\2 mm) of the major plant species at
each site in late August 2008
Means within rows for each component are not significantly different if they share the same superscript letters (ranging from x–z;
P \ 0.05). Parentheses indicate standard errors (n = 3–5)a New growth in evergreen species includes current year’s shoot growth (stem and leaves) plus all other leavesb Only the uppermost 3–4 cm of the mineral layer were sampled
Biogeochemistry
123
Author's personal copy
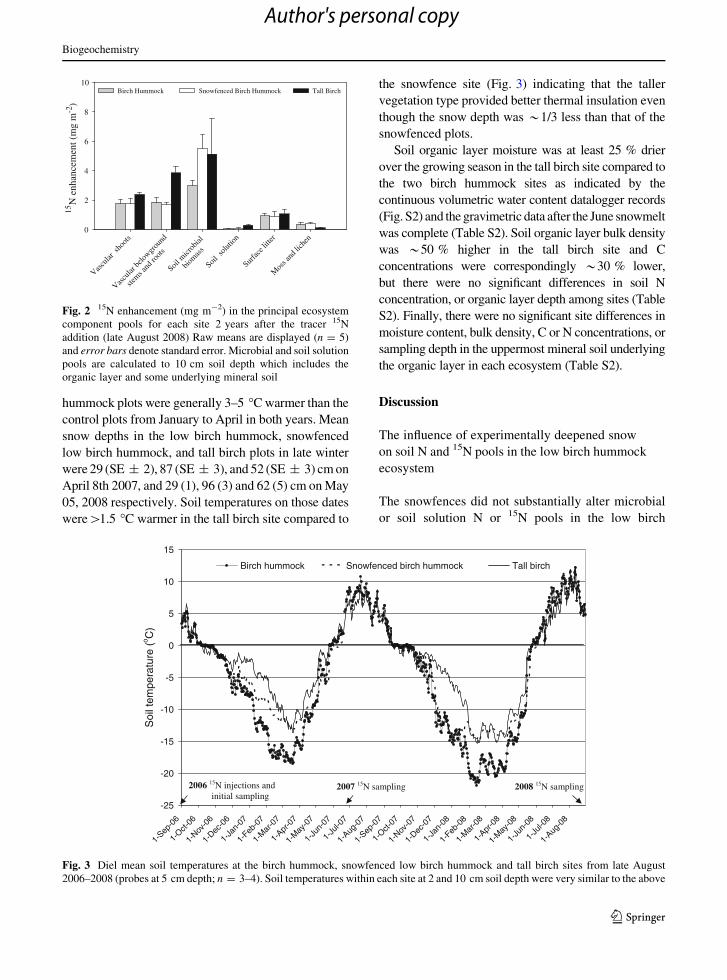
hummock plots were generally 3–5 �C warmer than the
control plots from January to April in both years. Mean
snow depths in the low birch hummock, snowfenced
low birch hummock, and tall birch plots in late winter
were 29 (SE ± 2), 87 (SE ± 3), and 52 (SE ± 3) cm on
April 8th 2007, and 29 (1), 96 (3) and 62 (5) cm on May
05, 2008 respectively. Soil temperatures on those dates
were[1.5 �C warmer in the tall birch site compared to
the snowfence site (Fig. 3) indicating that the taller
vegetation type provided better thermal insulation even
though the snow depth was *1/3 less than that of the
snowfenced plots.
Soil organic layer moisture was at least 25 % drier
over the growing season in the tall birch site compared to
the two birch hummock sites as indicated by the
continuous volumetric water content datalogger records
(Fig. S2) and the gravimetric data after the June snowmelt
was complete (Table S2). Soil organic layer bulk density
was *50 % higher in the tall birch site and C
concentrations were correspondingly *30 % lower,
but there were no significant differences in soil N
concentration, or organic layer depth among sites (Table
S2). Finally, there were no significant site differences in
moisture content, bulk density, C or N concentrations, or
sampling depth in the uppermost mineral soil underlying
the organic layer in each ecosystem (Table S2).
Discussion
The influence of experimentally deepened snow
on soil N and 15N pools in the low birch hummock
ecosystem
The snowfences did not substantially alter microbial
or soil solution N or 15N pools in the low birch
15N
enh
ance
men
t (m
g m
-2)
0
2
4
6
8
10Birch Hummock Snowfenced Birch Hummock Tall Birch
Vascu
lar s
hoots
Vascu
lar be
lowgr
ound
stems a
nd ro
ots
Soil m
icrob
ial
biomas
s
Soil s
olutio
n
Sur
face l
itter
Mos
s and
lich
en
Fig. 2 15N enhancement (mg m-2) in the principal ecosystem
component pools for each site 2 years after the tracer 15N
addition (late August 2008) Raw means are displayed (n = 5)
and error bars denote standard error. Microbial and soil solution
pools are calculated to 10 cm soil depth which includes the
organic layer and some underlying mineral soil
-25
-20
-15
-10
-5
0
5
10
15
1-Sep
-06
1-Oct-
06
1-Nov
-06
1-Dec
-06
1-Ja
n-07
1-Feb
-07
1-M
ar-0
7
1-Apr
-07
1-M
ay-0
7
1-Ju
n-07
1-Ju
l-07
1-Aug
-07
1-Sep
-07
1-Oct-
07
1-Nov
-07
1-Dec
-07
1-Ja
n-08
1-Feb
-08
1-M
ar-0
8
1-Apr
-08
1-M
ay-0
8
1-Ju
n-08
1-Ju
l-08
1-Aug
-08
Soi
l tem
pera
ture
(o C
)
Birch hummock Snowfenced birch hummock Tall birch
2006 15N injections and initial sampling
2007 15N sampling 2008 15N sampling
Fig. 3 Diel mean soil temperatures at the birch hummock, snowfenced low birch hummock and tall birch sites from late August
2006–2008 (probes at 5 cm depth; n = 3–4). Soil temperatures within each site at 2 and 10 cm soil depth were very similar to the above
Biogeochemistry
123
Author's personal copy
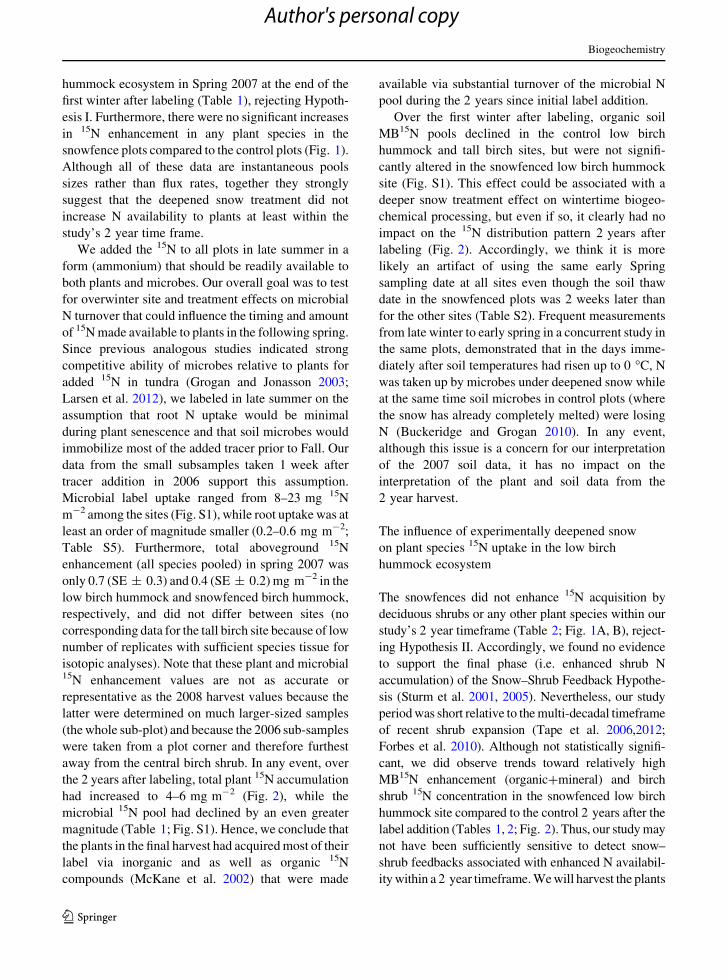
hummock ecosystem in Spring 2007 at the end of the
first winter after labeling (Table 1), rejecting Hypoth-
esis I. Furthermore, there were no significant increases
in 15N enhancement in any plant species in the
snowfence plots compared to the control plots (Fig. 1).
Although all of these data are instantaneous pools
sizes rather than flux rates, together they strongly
suggest that the deepened snow treatment did not
increase N availability to plants at least within the
study’s 2 year time frame.
We added the 15N to all plots in late summer in a
form (ammonium) that should be readily available to
both plants and microbes. Our overall goal was to test
for overwinter site and treatment effects on microbial
N turnover that could influence the timing and amount
of 15N made available to plants in the following spring.
Since previous analogous studies indicated strong
competitive ability of microbes relative to plants for
added 15N in tundra (Grogan and Jonasson 2003;
Larsen et al. 2012), we labeled in late summer on the
assumption that root N uptake would be minimal
during plant senescence and that soil microbes would
immobilize most of the added tracer prior to Fall. Our
data from the small subsamples taken 1 week after
tracer addition in 2006 support this assumption.
Microbial label uptake ranged from 8–23 mg 15N
m-2 among the sites (Fig. S1), while root uptake was at
least an order of magnitude smaller (0.2–0.6 mg m-2;
Table S5). Furthermore, total aboveground 15N
enhancement (all species pooled) in spring 2007 was
only 0.7 (SE ± 0.3) and 0.4 (SE ± 0.2) mg m-2 in the
low birch hummock and snowfenced birch hummock,
respectively, and did not differ between sites (no
corresponding data for the tall birch site because of low
number of replicates with sufficient species tissue for
isotopic analyses). Note that these plant and microbial15N enhancement values are not as accurate or
representative as the 2008 harvest values because the
latter were determined on much larger-sized samples
(the whole sub-plot) and because the 2006 sub-samples
were taken from a plot corner and therefore furthest
away from the central birch shrub. In any event, over
the 2 years after labeling, total plant 15N accumulation
had increased to 4–6 mg m-2 (Fig. 2), while the
microbial 15N pool had declined by an even greater
magnitude (Table 1; Fig. S1). Hence, we conclude that
the plants in the final harvest had acquired most of their
label via inorganic and as well as organic 15N
compounds (McKane et al. 2002) that were made
available via substantial turnover of the microbial N
pool during the 2 years since initial label addition.
Over the first winter after labeling, organic soil
MB15N pools declined in the control low birch
hummock and tall birch sites, but were not signifi-
cantly altered in the snowfenced low birch hummock
site (Fig. S1). This effect could be associated with a
deeper snow treatment effect on wintertime biogeo-
chemical processing, but even if so, it clearly had no
impact on the 15N distribution pattern 2 years after
labeling (Fig. 2). Accordingly, we think it is more
likely an artifact of using the same early Spring
sampling date at all sites even though the soil thaw
date in the snowfenced plots was 2 weeks later than
for the other sites (Table S2). Frequent measurements
from late winter to early spring in a concurrent study in
the same plots, demonstrated that in the days imme-
diately after soil temperatures had risen up to 0 �C, N
was taken up by microbes under deepened snow while
at the same time soil microbes in control plots (where
the snow has already completely melted) were losing
N (Buckeridge and Grogan 2010). In any event,
although this issue is a concern for our interpretation
of the 2007 soil data, it has no impact on the
interpretation of the plant and soil data from the
2 year harvest.
The influence of experimentally deepened snow
on plant species 15N uptake in the low birch
hummock ecosystem
The snowfences did not enhance 15N acquisition by
deciduous shrubs or any other plant species within our
study’s 2 year timeframe (Table 2; Fig. 1A, B), reject-
ing Hypothesis II. Accordingly, we found no evidence
to support the final phase (i.e. enhanced shrub N
accumulation) of the Snow–Shrub Feedback Hypothe-
sis (Sturm et al. 2001, 2005). Nevertheless, our study
period was short relative to the multi-decadal timeframe
of recent shrub expansion (Tape et al. 2006,2012;
Forbes et al. 2010). Although not statistically signifi-
cant, we did observe trends toward relatively high
MB15N enhancement (organic?mineral) and birch
shrub 15N concentration in the snowfenced low birch
hummock site compared to the control 2 years after the
label addition (Tables 1, 2; Fig. 2). Thus, our study may
not have been sufficiently sensitive to detect snow–
shrub feedbacks associated with enhanced N availabil-
ity within a 2 year timeframe. We will harvest the plants
Biogeochemistry
123
Author's personal copy
and soils in the remaining labeled shrub-plots after a
decade as a longer term test of the Snow–Shrub
Feedback Hypothesis.
Alternatively, there are several reasons why the
enhanced shrub N accumulation phase of the snow–
shrub feedback hypothesis may be incorrect. First, the
additional nutrients mobilized under the deepened snow
may be lost from the system before plants could acquire
them. Although we know that deepened snow increases
dissolved organic and inorganic nutrient pulses in our
plots (Buckeridge and Grogan 2010), plant uptake of the
mobilized nutrients may have been prohibited by the
greater surface runoff of these nutrients that would be
expected with high snowmelt water flow in the deep
snow treatment. Denitrification losses are also possible,
although N2O production rates at our site in early spring
were very low and unaffected by deeper snow (Bucke-
ridge et al. 2010a). Second, plant nutrient uptake
capacity at the end of snowmelt may be severely
restricted. The enhanced spring pulse of dissolved
nutrients in the snowfence treatment was relatively
short-lived, and occurred when the snowfenced plants
were first exposed above the melting snow, and while
the soils were very wet and just rising above 0 �C
(Buckeridge and Grogan 2010). Although some alpine
plant species can actively take up N during snowmelt,
arctic tundra plants do not seem to have that ability
(Bilbrough et al. 2000). Furthermore, a recent tracer
study in Swedish tundra suggests that deciduous shrubs
are not able to resume nutrient uptake until after
snowmelt is complete (Larsen et al. 2012). Interestingly,
evergreen shrubs in that study were able to acquire label
several weeks earlier (Larsen et al. 2012), but we found
no evidence that the evergreen species at our sites were
able to preferentially take advantage of snowfence-
enhanced 15N tracer pulses in late winter. Finally,
although we found little evidence that deepened snow
alone would facilitate the enhanced shrub N accumu-
lation phase of the Snow–Shrub Feedback Hypothesis,
this does not preclude other factors associated with tall
shrubs from interacting with the deep snow around them
to promote their own growth. For example, the tall
shrubs generated a particularly effective thermal insu-
lation of their underlying soils that cannot be attributed
to deeper snow alone (Fig. 3). In addition, the relatively
high productivity of deciduous tall shrubs results in
greater soil litter inputs that provide the substrate for N
mobilization and the relatively fast N cycling of tall
birch ecosystems (Buckeridge et al. 2010b). This litter
feedback alone likely promotes deciduous shrub
growth, but in addition, deepened snow may contribute
by facilitating decomposition of that litter in the fall,
winter and spring.
Species differences in 15N acquisition
within and among ecosystems
The comparison of tracer 15N enhancement pools and
tracer 15N concentrations indicates that individual
vascular plant species 15N acquisition differed among
ecosystems not just because of differences in biomass,
but also because of species differences in whole plant
physiological uptake capacity and/or species differ-
ences in internal translocation of label. For example,
the two evergreens R. subarcticum and V. vitis-idaea
acquired twice as much tracer in new shoot tissue in
the birch hummock sites compared to the tall birch site
(Fig. 1A). There were no site differences in shoot15N
concentrations for these species (Table 2), indicating
that this effect was due to larger shoot biomass of each
at the former site. By contrast, new apical shoots of B.
glandulosa and graminoids accumulated 10–16 times
more 15N in the tall birch than at the birch hummock
sites (Fig. 1A). For the shrub, this effect was due to
significantly higher 15N label concentrations as well as
larger biomass production (Table 2; Fig 4), and for the
graminoid, it was driven primarily by higher tissue 15N
concentrations alone (Table 2; Fig. 4). The elevated
label concentrations in new and old shoots as well as
roots of B. glandulosa and the graminoids in particular
suggest enhanced 15N uptake capacity per unit
biomass of these species in the tall birch ecosystem
which we know has greater N availability (Table 1),
and faster N cycling rates than the low birch hummock
ecosystem (Buckeridge et al. 2010b; Chu and Grogan
2010). Superior nutrient uptake capacity is typical of
fast growing opportunist species within a plant
community, and the strong birch and graminoid
responses we observed here are consistent with their
relatively quick responses to fertiliser additions (Cha-
pin et al. 1995; Press et al. 1998). Together, these
results suggest that B. glandulosa and the graminoids
are better competitors for N when it becomes more
available, indicating that they may have a distinct
advantage over the rest of the vegetation community in
sites where climate warming increases soil fertility.
Vascular plant species composition is almost iden-
tical in the birch hummock and tall birch sites, and yet
Biogeochemistry
123
Author's personal copy
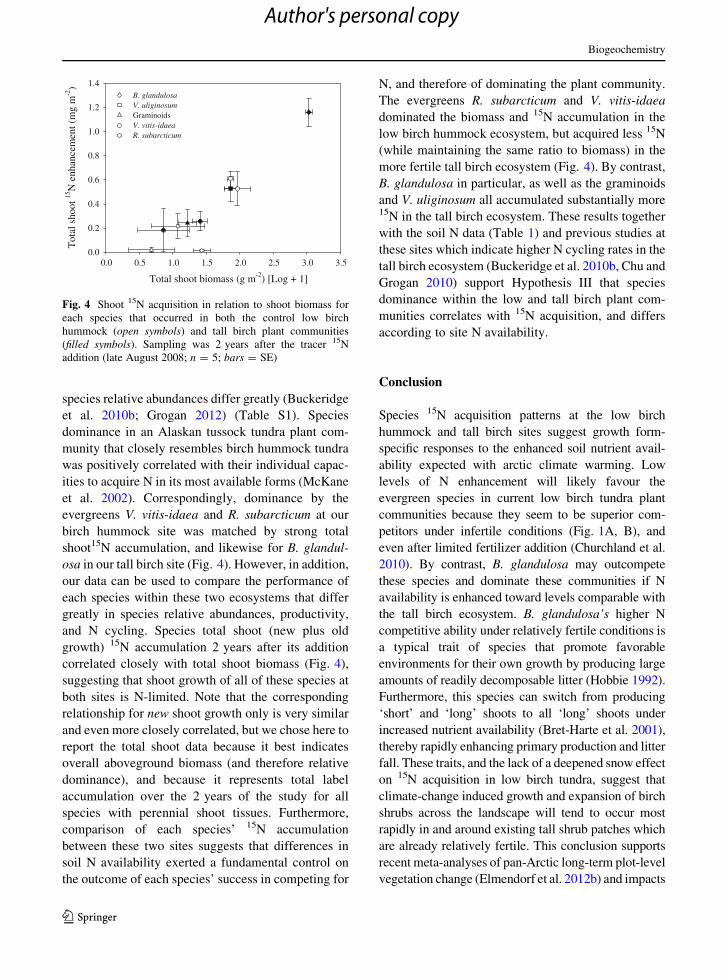
species relative abundances differ greatly (Buckeridge
et al. 2010b; Grogan 2012) (Table S1). Species
dominance in an Alaskan tussock tundra plant com-
munity that closely resembles birch hummock tundra
was positively correlated with their individual capac-
ities to acquire N in its most available forms (McKane
et al. 2002). Correspondingly, dominance by the
evergreens V. vitis-idaea and R. subarcticum at our
birch hummock site was matched by strong total
shoot15N accumulation, and likewise for B. glandul-
osa in our tall birch site (Fig. 4). However, in addition,
our data can be used to compare the performance of
each species within these two ecosystems that differ
greatly in species relative abundances, productivity,
and N cycling. Species total shoot (new plus old
growth) 15N accumulation 2 years after its addition
correlated closely with total shoot biomass (Fig. 4),
suggesting that shoot growth of all of these species at
both sites is N-limited. Note that the corresponding
relationship for new shoot growth only is very similar
and even more closely correlated, but we chose here to
report the total shoot data because it best indicates
overall aboveground biomass (and therefore relative
dominance), and because it represents total label
accumulation over the 2 years of the study for all
species with perennial shoot tissues. Furthermore,
comparison of each species’ 15N accumulation
between these two sites suggests that differences in
soil N availability exerted a fundamental control on
the outcome of each species’ success in competing for
N, and therefore of dominating the plant community.
The evergreens R. subarcticum and V. vitis-idaea
dominated the biomass and 15N accumulation in the
low birch hummock ecosystem, but acquired less 15N
(while maintaining the same ratio to biomass) in the
more fertile tall birch ecosystem (Fig. 4). By contrast,
B. glandulosa in particular, as well as the graminoids
and V. uliginosum all accumulated substantially more15N in the tall birch ecosystem. These results together
with the soil N data (Table 1) and previous studies at
these sites which indicate higher N cycling rates in the
tall birch ecosystem (Buckeridge et al. 2010b, Chu and
Grogan 2010) support Hypothesis III that species
dominance within the low and tall birch plant com-
munities correlates with 15N acquisition, and differs
according to site N availability.
Conclusion
Species 15N acquisition patterns at the low birch
hummock and tall birch sites suggest growth form-
specific responses to the enhanced soil nutrient avail-
ability expected with arctic climate warming. Low
levels of N enhancement will likely favour the
evergreen species in current low birch tundra plant
communities because they seem to be superior com-
petitors under infertile conditions (Fig. 1A, B), and
even after limited fertilizer addition (Churchland et al.
2010). By contrast, B. glandulosa may outcompete
these species and dominate these communities if N
availability is enhanced toward levels comparable with
the tall birch ecosystem. B. glandulosa’s higher N
competitive ability under relatively fertile conditions is
a typical trait of species that promote favorable
environments for their own growth by producing large
amounts of readily decomposable litter (Hobbie 1992).
Furthermore, this species can switch from producing
‘short’ and ‘long’ shoots to all ‘long’ shoots under
increased nutrient availability (Bret-Harte et al. 2001),
thereby rapidly enhancing primary production and litter
fall. These traits, and the lack of a deepened snow effect
on 15N acquisition in low birch tundra, suggest that
climate-change induced growth and expansion of birch
shrubs across the landscape will tend to occur most
rapidly in and around existing tall shrub patches which
are already relatively fertile. This conclusion supports
recent meta-analyses of pan-Arctic long-term plot-level
vegetation change (Elmendorf et al. 2012b) and impacts
Total shoot biomass (g m-2) [Log + 1]
0.0 0.5 1.0 1.5 2.0 2.5 3.0 3.5
Tot
al s
hoot
15N
enh
ance
men
t (m
g m
-2)
0.0
0.2
0.4
0.6
0.8
1.0
1.2
1.4B. glandulosaV. uliginosumGraminoidsV. vitis-idaeaR. subarcticum
Fig. 4 Shoot 15N acquisition in relation to shoot biomass for
each species that occurred in both the control low birch
hummock (open symbols) and tall birch plant communities
(filled symbols). Sampling was 2 years after the tracer 15N
addition (late August 2008; n = 5; bars = SE)
Biogeochemistry
123
Author's personal copy
of moderate experimental warming (Elmendorf et al.
2012a) which both indicated that deciduous shrub
growth is most responsive to warming in tundra habitats
that are inherently relatively warm and that have moist-
wet soils (i.e. where fertility would be expected to be
relatively high).
Acknowledgments We gratefully acknowledge Meghan
Laidlaw, Ian McCormick, Linda Cameron, Christy Barbeau,
Andy Kritsch, Tamara Hansen, Tyanna Steinwand and Ryan
Mercredi for their assistance in the field and laboratory. We
thank Donie Bret-Harte, Michelle Mack, Kate Buckeridge, Tara
Zamin, Shelley Arnott, Melissa Lafreniere, Ryan Danby and
several anonymous reviewers who provided thoughtful insights.
We are thankful for assistance from Steve Matthews in the
Division of Environment and Natural Resources, NWT
Government, and from the North Slave Metis Association.
NSERC (P.G.), NSF (P.G.) and DIAND-NSTP (M.V.),
provided funding for this research.
References
Beck PSA, Goetz SJ (2011) Satellite observations of high
northern latitude vegetation productivity changes between
1982 and 2008: ecological variability and regional differ-
ences. Environ Res Lett 6:045501
Bilbrough CJ, Welker JM, Bowman WD (2000) Early spring
nitrogen uptake by snow-covered plants: a comparison of
arctic and alpine plant function under the snowpack. Arct
Antarct Alp Res 32:404–411
Bret-Harte MS, Shaver GR, Zoerner JP, Johnstone JF, Wagner
JL, Chavez AS, Gunkelman RF, Lippert SC, Laundre JA
(2001) Developmental plasticity allows Betula nana to
dominate tundra subjected to an altered environment.
Ecology 82:18–32
Brookes PC, Landman A, Pruden G, Jenkinson DS (1985)
Chloroform fumigation and the release of soil-nitrogen—a
rapid direct extraction method to measure microbial bio-
mass nitrogen in soil. Soil Biol Biochem 17:837–842
Buckeridge KM, Grogan P (2008) Deepened snow alters soil
microbial nutrient limitations in arctic birch hummock
tundra. Appl Soil Ecol 39:210–222
Buckeridge KM, Grogan P (2010) Deepened snow increases late
thaw biogeochemical pulses in mesic low arctic tundra.
Biogeochemistry 101:105–121
Buckeridge KM, Cen Y-P, Layzell D, Grogan P (2010a) Soil
biogeochemistry during the early spring in low arctic mesic
tundra and the impacts of deepened snow and enhanced
nitrogen availability. Biogeochemistry 99:127–141
Buckeridge KM, Zufelt E, Chu H, Grogan P (2010b) Soil
nitrogen cycling rates in low arctic shrub tundra are
enhanced by litter feedbacks. Plant Soil 330:407–421
Chapin FS III, Shaver GR, Giblin AE, Nadelhoffer KJ, Laundre
JA (1995) Responses of arctic tundra to experimental and
observed changes in climate. Ecology 76:694–711
Chapin FS III, Sturm M, Serreze MC, McFadden JP, Key JR,
Lloyd AH, McGuire AD, Rupp TS, Lynch AH, Schimel JP,
Beringer J, Chapman WL, Epstein HE, Euskirchen ES,
Hinzman LD, Jia G, Ping CL, Tape KD, Thompson CDC,
Walker DA, Welker JM (2005) Role of land-surface
changes in arctic summer warming. Science 310:657–660
Chu H, Grogan P (2010) Soil microbial biomass, nutrient
availability and nitrogen mineralization potential among
vegetation-types in a low arctic tundra landscape. Plant
Soil 329:411–420
Churchland C, Mayo-Bruinsma L, Ronson A, Grogan P (2010)
Soil microbial and plant community responses to single
large carbon and nitrogen additions in low arctic tundra.
Plant Soil 334:409–421
Clemmensen KE, Sorensen PL, Michelsen A, Jonasson S,
Stroem L (2008) Site-dependent N uptake from N-form
mixtures by arctic plants, soil microbes and ectomycor-
rhizal fungi. Oecologia 155:771–783
DeMarco J, Mack MC, Bret-Harte MS (2011) The effects of
snow, soil microenvironment, and soil organic matter
quality on N availability in three alaskan arctic plant
communities. Ecosystems 14:804–817
Dijkstra P, Ishizu A, Doucett R, Hart SC, Schwartz E, Menyailo
OV, Hungate BA (2006) 13C and 15N natural abundance of
the soil microbial biomass. Soil Biol Biochem
38:3257–3266
Elmendorf SC, Henry GHR, Hollister RD, Bjork RG, Bjorkman
AD, Callaghan TV, Collier LS, Cooper EJ, Cornelissen
JHC, Day TA, Fosaa AM, Gould WA, Gretarsdottir J,
Harte J, Hermanutz L, Hik DS, Hofgaard A, Jarrad F,
Jonsdottir IS, Keuper F, Klanderud K, Klein JA, Koh S,
Kudo G, Lang SI, Loewen V, May JL, Mercado J, Mi-
chelsen A, Molau U, Myers-Smith IH, Oberbauer SF,
Pieper S, Post E, Rixen C, Robinson CH, Schmidt NM,
Shaver GR, Stenstrom A, Tolvanen A, Totland O, Troxler
T, Wahren C-H, Webber PJ, Welker JM, Wookey PA
(2012a) Global assessment of experimental climate
warming on tundra vegetation: heterogeneity over space
and time. Ecol Lett 15:164–175
Elmendorf SC, Henry GHR, Hollister RD, Bjork RG, Boulan-
ger-Lapointe N, Cooper EJ, Cornelissen JHC, Day TA,
Dorrepaal E, Elumeeva TG, Gill M, Gould WA, Harte J,
Hik DS, Hofgaard A, Johnson DR, Johnstone JF, Jonsdottir
IS, Jorgenson JC, Klanderud K, Klein JA, Koh S, Kudo G,
Lara M, Levesque E, Magnusson B, May JL, Mercado-
Diaz JA, Michelsen A, Molau U, Myers-Smith IH, Obe-
rbauer SF, Onipchenko VG, Rixen C, Schmidt NM, Shaver
GR, Spasojevic MJ, Porhallsdottir PE, Tolvanen A, Troxler
T, Tweedie CE, Villareal S, Wahren C-H, Walker X,
Webber PJ, Welker JM, Wipf S (2012b) Plot-scale evi-
dence of tundra vegetation change and links to recent
summer warming. Nat Clim Change 2:453–457
Forbes BC, Fauria MM, Zetterberg P (2010) Russian Arctic
warming and ‘greening’ are closely tracked by tundra
shrub willows. Glob Change Biol 16:1542–1554
Goetz SJ, Bunn AG, Fiske GJ, Houghton RA (2005) Satellite-
observed photosynthetic trends across boreal North
America associated with climate and fire disturbance. Proc
Natl Acad Sci USA 102:13521–13525
Grogan P (2012) Cold season respiration across a low arctic
landscape: the influence of vegetation type, snow depth,
and interannual climatic variation. Arct Antarct Alp Res
44:446–456
Biogeochemistry
123
Author's personal copy

Grogan P, Jonasson S (2003) Controls on annual nitrogen
cycling in the understory of a subarctic birch forest.
Ecology 84:202–218
Hobbie SE (1992) Effects of plant-species on nutrient cycling.
Trends Ecol Evol 7:336–339
Hobbie SE, Schimel JP, Trumbore SE, Randerson JR (2000)
Controls over carbon storage and turnover in high-latitude
soils. Glob Change Biol 6:196–210
Jonasson S, Michelsen A, Schmidt IK, Nielsen EV (1999)
Responses in microbes and plants to changed temperature,
nutrient, and light regimes in the arctic. Ecology 80:
1828–1843
Larsen KS, Michelsen A, Jonasson S, Beier C, Grogan P (2012)
Nitrogen uptake during fall, winter and spring differs
among plant functional groups in a subarctic heath eco-
system. Ecosystems 15:927–939
Mack MC, Schuur EAG, Bret-Harte MS, Shaver GR, Chapin FS
(2004) Ecosystem carbon storage in arctic tundra reduced
by long-term nutrient fertilization. Nature 431:440–443
McKane RB, Johnson LC, Shaver GR, Nadelhoffer KJ, Ra-
stetter EB, Fry B, Giblin AE, Kielland K, Kwiatkowski BL,
Laundre JA, Murray G (2002) Resource-based niches
provide a basis for plant species diversity and dominance in
arctic tundra. Nature 415:68–71
Myers-Smith IH, Forbes BC, Wilmking M, Hallinger M, Lantz
T, Blok D, Tape KD, Macias-Fauria M, Sass-Klaassen U,
Levesque E, Boudreau S, Ropars P, Hermanutz L, Trant A,
Collier LS, Weijers S, Rozema J, Rayback SA, Schmidt
NM, Schaepman-Strub G, Wipf S, Rixen C, Menard CB,
Venn S, Goetz S, Andreu-Hayles L, Elmendorf S, Ravo-
lainen V, Welker J, Grogan P, Epstein HE, Hik DS (2011)
Shrub expansion in tundra ecosystems: dynamics, impacts
and research priorities. Environ Res Lett 6:045509
Nadelhoffer KJ, Giblin AE, Shaver GR, Laundre JA (1991)
Effects of temperature and substrate quality on element
mineralization in six arctic soils. Ecology 72:242–253
Nobrega S, Grogan P (2007) Deeper snow enhances winter
respiration from both plant-associated and bulk soil carbon
pools in birch hummock tundra. Ecosystems 10:419–431
Nobrega S, Grogan P (2008) Landscape and ecosystem-level
controls on net carbon dioxide exchange along a natural
moisture gradient in Canadian low arctic tundra. Ecosys-
tems 11:377–396
Obst J (2008) Classification of land cover, vegetation commu-
nities, ecosystems and habitats in east daring lake basin,
Northwest Territories. Department of Environment and
Natural Resources, Wildlife Division Government of the
Northwest Territories, Yellowknife
Press MC, Potter JA, Burke MJW, Callaghan TV, Lee JA (1998)
Responses of a subarctic dwarf shrub heath community to
simulated environmental change. J Ecol 86:315–327
Ropars P, Boudreau S (2012) Shrub expansion at the forest–
tundra ecotone: spatial heterogeneity linked to local
topography. Environ Res Lett 7:015501
Schimel JP, Bilbrough C, Welker JA (2004) Increased snow
depth affects microbial activity and nitrogen mineraliza-
tion in two arctic tundra communities. Soil Biol Biochem
36:217–227
Shaver GR, Billings WD, Chapin FS III, Giblin AE, Nadelhoffer
KJ, Oechel WC, Rastetter EB (1992) Global change and
the carbon balance of arctic ecosystems. Bioscience
42:433–441
Sorensen PL, Clemmensen KE, Michelsen A, Jonasson S, Strom
L (2008) Plant and microbial uptake and allocation of
organic and inorganic nitrogen related to plant growth
forms and soil conditions at two subarctic tundra sites in
Sweden. Arct Antarct Alp Res 40:171–180
Sturm M, McFadden JP, Liston GE, Chapin FS, Racine CH,
Holmgren J (2001) snow–shrub interactions in arctic tundra:
a hypothesis with climatic implications. J Clim 14:336–344
Sturm M, Schimel J, Michaelson G, Welker JM, Oberbauer SF,
Liston GE, Fahnestock J, Romanovsky VE (2005) Winter
biological processes could help convert arctic tundra to
shrubland. Bioscience 55:17–26
Tape K, Sturm M, Racine C (2006) The evidence for shrub
expansion in northern alaska and the pan-arctic. Glob
Change Biol 12:686–702
Tape KD, Hallinger M, Welker JM, Ruess RW (2012) Land-
scape heterogeneity of shrub expansion in arctic alaska.
Ecosystems 15:711–724
Tremblay B, Levesque E, Boudreau S (2011) Recent expansion
of erect shrubs in the low arctic: evidence from eastern
Nunivak. Environ Res Lett 7:11
Weintraub MN, Schimel JP (2005) The seasonal dynamics of
amino acids and other nutrients in alaskan arctic tundra
soils. Biogeochemistry 73:359–380
Xu L, Myneni RB, Chapin FS, Callaghan TV, Pinzon JE, Tucker
CJ, Zhu Z, Bi J, Ciais P, Tommervik H, Euskirchen ES,
Forbes BC, Piao SL, Anderson BT, Ganguly S, Nemani
RR, Goetz SJ, Beck PSA, Bunn AG, Cao C, Stroeve JC
(2013) Temperature and vegetation seasonality diminish-
ment over northern lands. Nat Clim Change 3:581–586
Zamin TJ, Grogan P (2012) Birch shrub growth in the low arctic:
the relative importance of experimental warming,
enhanced nutrient availability, snow depth and caribou
exclusion. Environ Res Lett 7:034027
Biogeochemistry
123
Author's personal copy