Nitrate elimination by denitrification in hardwood forest soils of the Upper Rhine floodplain –...
12
Open Archive TOULOUSE Archive Ouverte (OATAO) OATAO is an open access repository that collects the work of Toulouse researchers and makes it freely available over the web where possible. This is an author-deposited version published in : http://oatao.univ-toulouse.fr/ Eprints ID : 5686 http://dx.doi.org/10.1023/A:1015527611350 To cite this version: Brettar, Ingrid and Sanchez-Pérez, José-Miguel and Trémolières, Michèle Nitrate elimination by denitrification in hardwood forest soils of the Upper Rhine floodplain – correlation with redox potential and organic matter. (2002) Hydrobiologia, vol. 469 (n°1-3). pp. 11-21. ISSN 0018- 8158 Any correspondance concerning this service should be sent to the repository administrator: [email protected]. To link to this article: 10.1023/A:1015527611350
-
Upload
helmholtz-hzi -
Category
Documents
-
view
1 -
download
0
Transcript of Nitrate elimination by denitrification in hardwood forest soils of the Upper Rhine floodplain –...

Open Archive TOULOUSE Archive Ouverte (OATAO)
OATAO is an open access repository that collects the work of Toulouse researchers and makes it freely available over the web where possible.
This is an author-deposited version published in : http://oatao.univ-toulouse.fr/ Eprints ID : 5686
http://dx.doi.org/10.1023/A:1015527611350
To cite this version: Brettar, Ingrid and Sanchez-Pérez, José-Miguel and Trémolières, Michèle Nitrate elimination by denitrification in hardwood forest soils of the Upper Rhine floodplain – correlation with redox potential and organic matter. (2002) Hydrobiologia, vol. 469 (n°1-3). pp. 11-21. ISSN 0018-8158
Any correspondance concerning this service should be sent to the repository administrator: [email protected].
To link to this article: 10.1023/A:1015527611350
Nitrate elimination by denitrification in hardwood forest soils of the UpperRhine floodplain – correlation with redox potential and organic matter
Ingrid Brettar1, Jose-Miguel Sanchez-Perez2 & Michele Tremolieres3
1GBF – German Centre for Biotechnology, Dept. Environmental Microbiology, Mascheroder Weg 1,D-38124 Braunschweig, GermanyTel: +49-531-6181-440. Fax: +49-531-6181-411. E-mail: [email protected] (UMR CNRS), 29 rue Jeanne Marvig, F-31055 Toulouse Cedex, France3Centre d’Etudes et de Recherches Eco-Geographiques (CEREG) (UMR 7007 CNRS/ULP), 28, rue Goethe,F-67083 Strasbourg, France
Key words: hardwood forest, floodplain soil, redox potential, denitrification, nitrate reduction, Upper Rhine valley
Abstract
Denitrification in floodplains is a major issue for river- and groundwater quality. In the Upper Rhine valley,floodplain forests are about to be restored to serve as flood retention areas (polders). Besides flood attenuationin downstream areas, improvement of water quality became recently a major goal for polder construction. Redoxpotential monitoring was suggested as a means to support assessment of nitrogen elimination in future floodplainsby denitrification during controlled flooding. To elucidate the relationship between redox potential and denitri-fication, experiments with floodplain soils and in situ measurements were done. Floodplain soil of two depthprofiles from a hardwood forest of the Upper Rhine valley was incubated anaerobically with continuous nitratesupply. Reduction of nitrate was followed and compared with redox potential and organic matter content. Theredox potential under denitrifying conditions ranged from 10 to 300 mV. Redox potential values decreased withincreasing nitrate reduction rates and increasing organic matter content. Furthermore, a narrow correlation betweenorganic matter and nitrate reduction was observed. Experiments were intended to help interpreting redox potentialsgenerated under in situ conditions as exemplified by in situ observations for the year 1999. Results obtained byexperiments and in situ observations showed that monitoring of redox potential could support management of theflooding regime to optimize nitrogen retention by denitrification in future flood retention areas.
Introduction
Floodplains are of great relevance for the water qualityof river- and groundwater. The potential of floodplainsto retain or eliminate nitrogen has been demonstratedby several studies (e.g. Lowrance et al., 1984; Peter-john & Correll, 1984; Haycock et al., 1993). The highnitrogen load of the Rhine is a major problem affect-ing groundwater and the North sea as the recipientecosystem (Trémolières et al., 1992; Behrendt et al.,1999; Caraco & Cole, 1999). Nitrogen elimination infloodplains could be a means to reduce the nitrogenload of the Rhine. At the Upper Rhine, a major reduc-tion of the nitrogen load in floodplains would resultfrom elimination of groundwater derived nitrogen thatfinally would reach the river. Especially, in the light of
the actual situation that floodplain forests are about tobe restored at a large scale in the Upper Rhine valley(Dister, 1991; Ministerium Umwelt & Verkehr Baden–Württemberg, 1996), enlarged floodplain area wouldbe available for N-elimination. In the 19th and 20thcentury, the pristine floodplain had been reduced byabout 90% due to regulation and channelization meas-ures of the Upper Rhine, thereby reducing the pristinefloodplain forests to about 1% of their pristine exten-sion and resulting in increased flooding downstream ofthe regulated sector. To counteract flooding, flood re-tention areas (polders) are now about to be built alongboth sides of the Upper Rhine. Besides the goal toretain floods, restoration of floodplain forests, mainlyhardwood forests, and improvement of water qualityare major issues for the polders.
Denitrification can be a major factor for elimin-ating nitrogen in forested floodplains (Brinson et al.,1984; Lockaby & Wallbridge, 1998). Denitrificationcan contribute to reduction of the N-load of the flood-plain soil, the ground- and surface waters (run off,flood water), and thus protect the river from landderived N-load. As denitrification is enhanced by oxy-gen defiency, wetting of floodplain soils by floodingor rising groundwater supports denitrification due toreduced oxygen supply (Megonical et al., 1993). Man-agement of flooding in a way to optimize nitrogenelimination by denitrification could be an appealingtask that could be approached in the future restoredfloodplain forests of the Upper Rhine. As a tool toassess denitrification, measurements of redox poten-tials can be conceived. Redox measurements can berun in a continuous way, are non-destructive and donot influence the conditions prevailing in the soil, asall sampling and sample handling tends to do (Patricket al., 1996). Some authors attributed ranges of redoxpotential to specific biogeochemical processes suchas denitrification, iron reduction, or methanogenesis(Masscheleyn et al., 1993; Patrick et al., 1996). Fur-thermore, the organic matter is of interest as a ma-jor regulatory factor of denitrification in floodplains(DeLaune et al., 1996).
The relationship between nitrate elimination by de-nitrification, redox potential and organic matter wasanalyzed in experiments with soils of the Upper Rhinefloodplain forests. A major goal was to test the util-ity of redox potential as a tool to assess denitrific-ation during controlled flooding of the upper Rhinefloodplain forests. Besides these experiments, redoxpotential measurements in a hardwood forest of theUpper Rhine were performed during dry and floodedperiods and interpreted by using the experimentallyderived relationships. Possible applications of redoxpotential for managing the flooding regime of poldersfor nitrogen elimination will be discussed.
Materials and methods
Study site and sampling
The study area is a hardwood forest station in thenatural reserve of Rhinau, France, 50 km south ofStrasbourg. The natural reserve of Rhinau comprisesone of the few relicts of natural floodplain forestsof the Upper Rhine valley with a nival flooding re-gime. Major floods occur in summer due to snow
melting in the alpine watershed, resulting in a riseof the groundwater table by 2–3 m. The vegetationof the hardwood forest is dominated by oak (Quercusrobur), ash (Fraxinus excelsior) and poplar (Populusalba). The soil are very calcareous (25% total carbon-ate, pH>7.5) and young (Fluvent A/C type, USDA).The soils are silty to silty-clayey in the upper horizonswith increasing sand content with depth; they becomecoarse-textured with greater depth (>1 m: sand andgravel). More details on the study site are given else-where (Sanchez-Perez et al., 1993; Trémolières et al.,1998).
This study concentrated on the levées (or ridges,as called by Lockaby & Wallbridge, 1998), i.e. thesandy terraces that represent the major fraction of thearea of the hardwood forests. Groundwater table ison average at 1.30 m below soil surface unless dur-ing flooding. Details on general soil characteristics aregiven in Table 1.
Samples were obtained from two depth profiles(A,B) of the levées (0–105 cm depth) sampled in adry summer period (late June) with soil temperaturesaround 15 ◦C. Soil was dry and oxic with redox po-tential values ranging from 450 to 510 mV, with lowervalues in the top soil. Samples were stored 4 weeks inglass jars at 2–3 ◦C until the start of the experiments.More details on the sampled levée soils are given inTable 2.
Experimental set up and activity measurements
Samples obtained from four depths (0, 30, 60 and100 cm, see Table 2) of two depth profiles (A,B) ofthe levées were used to set up experiments on thedenitrification capacity of the floodplain soil underconditions of permanent nitrate surplus.
Per sample, 500 g of soil were freed from rootsand homogenized. Subsamples were frozen for lateranalysis (N-compounds, organic matter). Twenty g ofsoil sample was added to a 150 ml gas tight glassjar equipped with a butyl rubber stopper. The experi-ment was started by adding 50 ml of nitrate (KNO3,10 mg N/l) and flushing the samples with purifiednitrogen (>99.995). The experiment was run in fivereplicates per soil sample, i.e. a total of 40 assaysconsisting of five replicates of four depths taken fromtwo profiles. Incubation was done in the dark on arotary shaker at 20 ◦C. Nitrate solutions were addedby syringe through rubber stoppers in a way that thenitrate supply always exceeded consumption. High ni-trate additions at the beginning of the experiment were
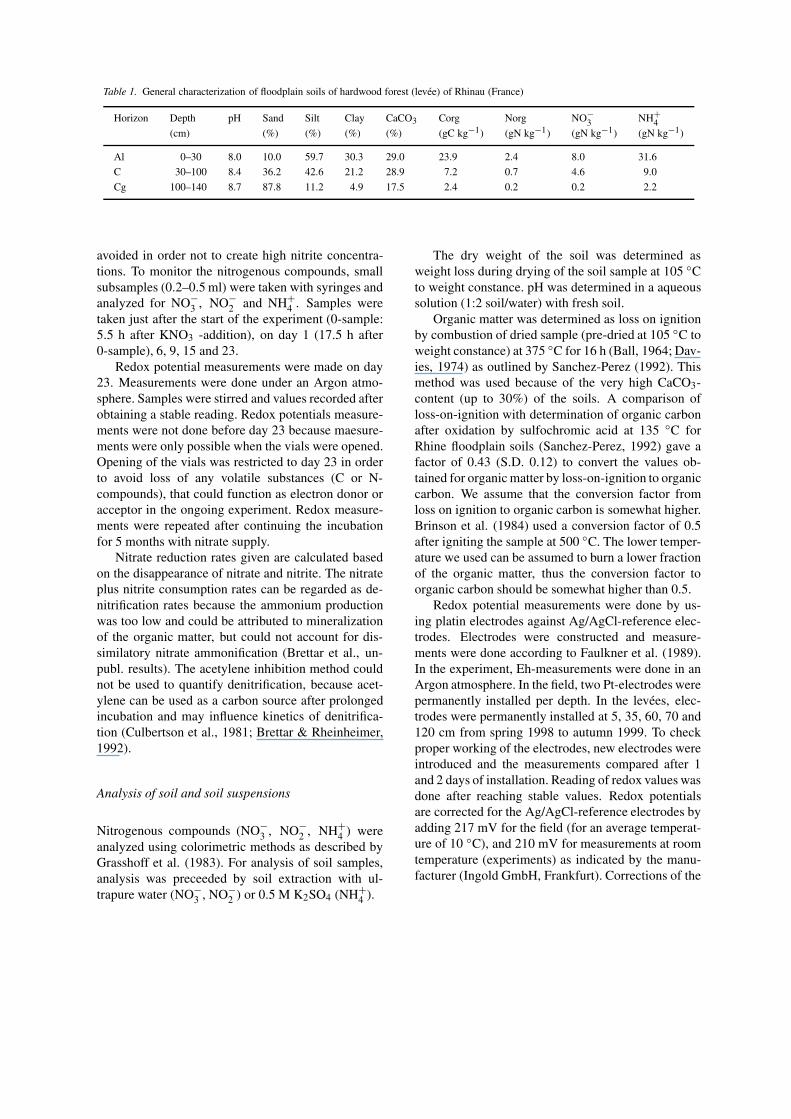
Table 1. General characterization of floodplain soils of hardwood forest (levee) of Rhinau (France)
Horizon Depth pH Sand Silt Clay CaCO3 Corg Norg NO−3 NH+
4(cm) (%) (%) (%) (%) (gC kg−1) (gN kg−1) (gN kg−1) (gN kg−1)
Al 0–30 8.0 10.0 59.7 30.3 29.0 23.9 2.4 8.0 31.6
C 30–100 8.4 36.2 42.6 21.2 28.9 7.2 0.7 4.6 9.0
Cg 100–140 8.7 87.8 11.2 4.9 17.5 2.4 0.2 0.2 2.2
avoided in order not to create high nitrite concentra-tions. To monitor the nitrogenous compounds, smallsubsamples (0.2–0.5 ml) were taken with syringes andanalyzed for NO−
3 , NO−2 and NH+
4 . Samples weretaken just after the start of the experiment (0-sample:5.5 h after KNO3 -addition), on day 1 (17.5 h after0-sample), 6, 9, 15 and 23.
Redox potential measurements were made on day23. Measurements were done under an Argon atmo-sphere. Samples were stirred and values recorded afterobtaining a stable reading. Redox potentials measure-ments were not done before day 23 because maesure-ments were only possible when the vials were opened.Opening of the vials was restricted to day 23 in orderto avoid loss of any volatile substances (C or N-compounds), that could function as electron donor oracceptor in the ongoing experiment. Redox measure-ments were repeated after continuing the incubationfor 5 months with nitrate supply.
Nitrate reduction rates given are calculated basedon the disappearance of nitrate and nitrite. The nitrateplus nitrite consumption rates can be regarded as de-nitrification rates because the ammonium productionwas too low and could be attributed to mineralizationof the organic matter, but could not account for dis-similatory nitrate ammonification (Brettar et al., un-publ. results). The acetylene inhibition method couldnot be used to quantify denitrification, because acet-ylene can be used as a carbon source after prolongedincubation and may influence kinetics of denitrifica-tion (Culbertson et al., 1981; Brettar & Rheinheimer,1992).
Analysis of soil and soil suspensions
Nitrogenous compounds (NO−3 , NO−
2 , NH+4 ) were
analyzed using colorimetric methods as described byGrasshoff et al. (1983). For analysis of soil samples,analysis was preceeded by soil extraction with ul-trapure water (NO−
3 , NO−2 ) or 0.5 M K2SO4 (NH+
4 ).
The dry weight of the soil was determined asweight loss during drying of the soil sample at 105 ◦Cto weight constance. pH was determined in a aqueoussolution (1:2 soil/water) with fresh soil.
Organic matter was determined as loss on ignitionby combustion of dried sample (pre-dried at 105 ◦C toweight constance) at 375 ◦C for 16 h (Ball, 1964; Dav-ies, 1974) as outlined by Sanchez-Perez (1992). Thismethod was used because of the very high CaCO3-content (up to 30%) of the soils. A comparison ofloss-on-ignition with determination of organic carbonafter oxidation by sulfochromic acid at 135 ◦C forRhine floodplain soils (Sanchez-Perez, 1992) gave afactor of 0.43 (S.D. 0.12) to convert the values ob-tained for organic matter by loss-on-ignition to organiccarbon. We assume that the conversion factor fromloss on ignition to organic carbon is somewhat higher.Brinson et al. (1984) used a conversion factor of 0.5after igniting the sample at 500 ◦C. The lower temper-ature we used can be assumed to burn a lower fractionof the organic matter, thus the conversion factor toorganic carbon should be somewhat higher than 0.5.
Redox potential measurements were done by us-ing platin electrodes against Ag/AgCl-reference elec-trodes. Electrodes were constructed and measure-ments were done according to Faulkner et al. (1989).In the experiment, Eh-measurements were done in anArgon atmosphere. In the field, two Pt-electrodes werepermanently installed per depth. In the levées, elec-trodes were permanently installed at 5, 35, 60, 70 and120 cm from spring 1998 to autumn 1999. To checkproper working of the electrodes, new electrodes wereintroduced and the measurements compared after 1and 2 days of installation. Reading of redox values wasdone after reaching stable values. Redox potentialsare corrected for the Ag/AgCl-reference electrodes byadding 217 mV for the field (for an average temperat-ure of 10 ◦C), and 210 mV for measurements at roomtemperature (experiments) as indicated by the manu-facturer (Ingold GmbH, Frankfurt). Corrections of the
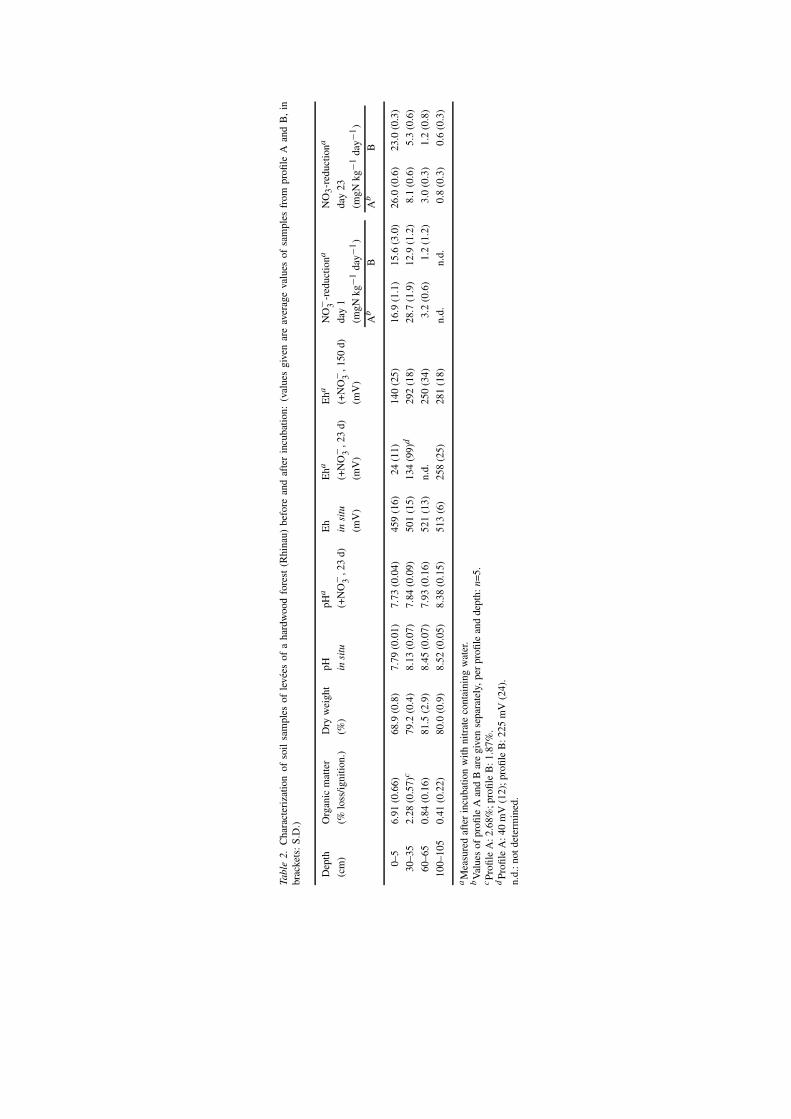
Tabl
e2.
Cha
ract
eriz
atio
nof
soil
sam
ples
ofle
vees
ofa
hard
woo
dfo
rest
(Rhi
nau)
befo
rean
daf
ter
incu
batio
n:(v
alue
sgi
ven
are
aver
age
valu
esof
sam
ples
from
profi
leA
and
B,
inbr
acke
ts:
S.D
.)
Dep
thO
rgan
icm
atte
rD
ryw
eigh
tpH
pHa
Eh
Eha
Eha
NO
− 3-r
educ
tiona
NO
3-r
educ
tiona
(cm
)(%
loss
/igni
tion.
)(%
)in
situ
(+N
O− 3
,23
d)in
situ
(+N
O− 3
,23
d)(+
NO
− 3,1
50d)
day
1da
y23
(mV
)(m
V)
(mV
)(m
gNkg
−1da
y−1)
(mgN
kg−1
day−
1)
Ab
BA
bB
0–5
6.91
(0.6
6)68
.9(0
.8)
7.79
(0.0
1)7.
73(0
.04)
459
(16)
24(1
1)14
0(2
5)16
.9(1
.1)
15.6
(3.0
)26
.0(0
.6)
23.0
(0.3
)
30–3
52.
28(0
.57)
c79
.2(0
.4)
8.13
(0.0
7)7.
84(0
.09)
501
(15)
134
(99)
d29
2(1
8)28
.7(1
.9)
12.9
(1.2
)8.
1(0
.6)
5.3
(0.6
)
60–6
50.
84(0
.16)
81.5
(2.9
)8.
45(0
.07)
7.93
(0.1
6)52
1(1
3)n.
d.25
0(3
4)3.
2(0
.6)
1.2
(1.2
)3.
0(0
.3)
1.2
(0.8
)
100–
105
0.41
(0.2
2)80
.0(0
.9)
8.52
(0.0
5)8.
38(0
.15)
513
(6)
258
(25)
281
(18)
n.d.
n.d.
0.8
(0.3
)0.
6(0
.3)
aM
easu
red
afte
rin
cuba
tion
with
nitr
ate
cont
aini
ngw
ater
.b
Val
ues
ofpr
ofile
Aan
dB
are
give
nse
para
tely
,per
profi
lean
dde
pth:
n=5.
cPr
ofile
A:2
.68%
;pro
file
B:1
.87%
.d
Profi
leA
:40
mV
(12)
;pro
file
B:2
25m
V(2
4).
n.d.
:not
dete
rmin
ed.
Eh measurements for pH were not done as suggestedby Patrick et al. (1996).
All data on soil refer to fresh weight of soil. Thedry weight of the samples is given in Table 2. Freshweight was preferred over dry weight because additionof soil to the single assays was on a fresh weight basis(20 g fresh soil per glass jar). In this way, the para-meters can be directly related to the concentrations inthe single assays. This was of specific interest for theredox potential that was supposed to be related to theactual concentrations in the assays.
Statistical analysis
All data evaluation was done with the Statgraph-ics statistical graphics systems (Statistical GraphicsCorp.). All regressions (least-squares) were calcu-lated with a 95% confidence limit (=inner line (longdashes); outer line (dots)=95% prediction limits).
Results and discussion
Experiments with floodplain forest soil
Nitrate reduction vs. sample originNitrate reduction, measured as consumption of nitrateand nitrite, was followed for 23 days in soils fromtwo depth profiles of a hardwood forest of the Up-per Rhine valley. The nitrate reduction rates decreasedwith soil depth, i.e. the surface samples showed higherconsumption rates than samples derived from deeperlayers (Table 2). Nitrate reduction rates were constantover time for this time period to a major extent, ex-cept for day 1. Nitrate reduction during the observationperiod of 23 days ranged from 24.5 mg N (S.D. 0.5 mgN) per day and kg fresh soil for 0–5 cm samples to 0.7mg N (S.D. 0.3 mg N) for samples from 100 to 105cm, respectively. On day 1, nitrate reduction rates ofsamples from 0 to 5 cm and 30 to 35 cm differed fromobservations on the following days: rates of samplesfrom 0 to 5 cm were lower (by a factor of 1.5), whilesamples from 30 cm were higher (by a factor of 3.5for depth profile A, and 2.4 for profile B, respectively)(Table 2).
Nitrate reduction rates vs. redox potentialRedox potential was measured after 23 days in assaysof samples from 0, 30 and 100 cm. Redox potentialsranging from 10 to 50 mV were obtained for assaysof samples from 0 to 5 cm depth from both profiles
and for one sample from 30 cm (profile A, sample A-30). Assays of samples from 100 cm and one samplefrom 30 cm (profile B) had redox potentials rangingfrom 190 to 290 mV. Plots of redox potential vs. ni-trate reduction show as a general tendancy, that highernitrate reduction rates resulted in a lower redox poten-tial (Fig. 1a). After a 5 months incubation with nitrate,redox potentials increased for surface samples to about140 mV; while samples from deeper horizons rangedbetween 250 and 290 mV (Table 2); nitrate reductionrates had dropped to about 5.2 mg (S.D. 2.2) N/kgfresh soil×day for the surface samples, and were closeto detection limit for deeper horizons.
For a comparison, redox potential (measured onday 23) was plotted vs. nitrate reduction for allsampling days (1–23). All sampling days except dayone (Fig. 1b) showed a similar pattern as day 23. Asan example, day 6 is given in Figure 1c. On day 1 (Fig.1b), the increased reduction rates of sample A-30 andthe decreased ones of the surface samples (0–5 cm)measured on day one resulted in a different pattern.The opposite was observed for all following samplingdays, i.e. the nitrate reduction rates of the surfacesamples were higher than those of sample A-30.
Figure 2 displays the nitrate reduction rates per dayand kg fresh soil of all sampling days vs. the redox po-tential measured on day 23. This figure demonstratesthe dynamics of the nitrate reduction rates during theincubation period, mainly caused by the change of ni-trate reduction rates between day 1 and the followingdays. The latter days gave a rather condensed pattern,because the nitrate reduction rates were rather constantfrom day 6 to 23. The major field of dynamics is inthe area with low redox potential values, where onecan observe the upward moving of the nitrate reduc-tion rate of the surface samples, and the downwardmoving of sample A-30. On the other hand, this figuredemonstrates that all samples had a time slot within the23 days where they were very close to the calculatedregression line. This means that the nitrate reductionrate is related to the redox potential, on the one hand.On the other hand, it must be taken into considerationthat the redox potential might reflect a higher nitratereduction rate that had occurred some time before theredox measurement was taken.
Redox potential vs. organic matterA comparison of redox potential with the contentof organic matter shows lower redox potentials forsamples with higher content of organic matter (Fig.3). Regression analysis reveals a similar relationship
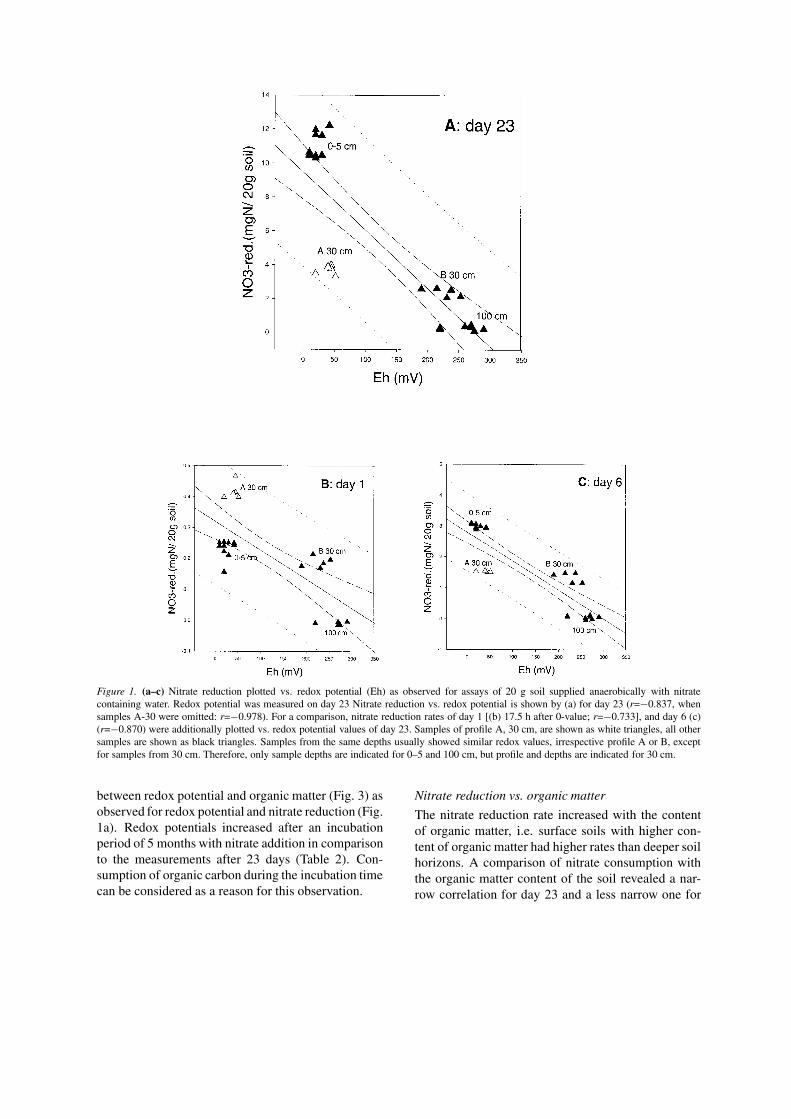
Figure 1. (a–c) Nitrate reduction plotted vs. redox potential (Eh) as observed for assays of 20 g soil supplied anaerobically with nitratecontaining water. Redox potential was measured on day 23 Nitrate reduction vs. redox potential is shown by (a) for day 23 (r=−0.837, whensamples A-30 were omitted: r=−0.978). For a comparison, nitrate reduction rates of day 1 [(b) 17.5 h after 0-value; r=−0.733], and day 6 (c)(r=−0.870) were additionally plotted vs. redox potential values of day 23. Samples of profile A, 30 cm, are shown as white triangles, all othersamples are shown as black triangles. Samples from the same depths usually showed similar redox values, irrespective profile A or B, exceptfor samples from 30 cm. Therefore, only sample depths are indicated for 0–5 and 100 cm, but profile and depths are indicated for 30 cm.
between redox potential and organic matter (Fig. 3) asobserved for redox potential and nitrate reduction (Fig.1a). Redox potentials increased after an incubationperiod of 5 months with nitrate addition in comparisonto the measurements after 23 days (Table 2). Con-sumption of organic carbon during the incubation timecan be considered as a reason for this observation.
Nitrate reduction vs. organic matter
The nitrate reduction rate increased with the contentof organic matter, i.e. surface soils with higher con-tent of organic matter had higher rates than deeper soilhorizons. A comparison of nitrate consumption withthe organic matter content of the soil revealed a nar-row correlation for day 23 and a less narrow one for
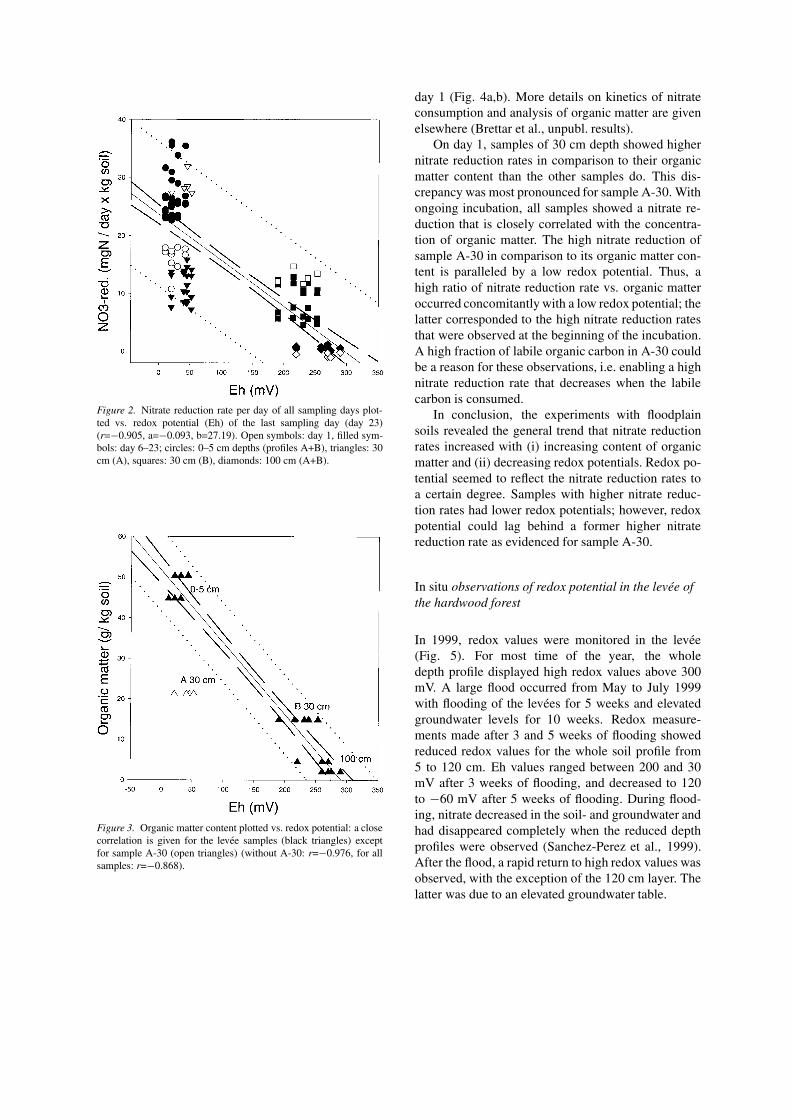
Figure 2. Nitrate reduction rate per day of all sampling days plot-ted vs. redox potential (Eh) of the last sampling day (day 23)(r=−0.905, a=−0.093, b=27.19). Open symbols: day 1, filled sym-bols: day 6–23; circles: 0–5 cm depths (profiles A+B), triangles: 30cm (A), squares: 30 cm (B), diamonds: 100 cm (A+B).
Figure 3. Organic matter content plotted vs. redox potential: a closecorrelation is given for the levee samples (black triangles) exceptfor sample A-30 (open triangles) (without A-30: r=−0.976, for allsamples: r=−0.868).
day 1 (Fig. 4a,b). More details on kinetics of nitrateconsumption and analysis of organic matter are givenelsewhere (Brettar et al., unpubl. results).
On day 1, samples of 30 cm depth showed highernitrate reduction rates in comparison to their organicmatter content than the other samples do. This dis-crepancy was most pronounced for sample A-30. Withongoing incubation, all samples showed a nitrate re-duction that is closely correlated with the concentra-tion of organic matter. The high nitrate reduction ofsample A-30 in comparison to its organic matter con-tent is paralleled by a low redox potential. Thus, ahigh ratio of nitrate reduction rate vs. organic matteroccurred concomitantly with a low redox potential; thelatter corresponded to the high nitrate reduction ratesthat were observed at the beginning of the incubation.A high fraction of labile organic carbon in A-30 couldbe a reason for these observations, i.e. enabling a highnitrate reduction rate that decreases when the labilecarbon is consumed.
In conclusion, the experiments with floodplainsoils revealed the general trend that nitrate reductionrates increased with (i) increasing content of organicmatter and (ii) decreasing redox potentials. Redox po-tential seemed to reflect the nitrate reduction rates toa certain degree. Samples with higher nitrate reduc-tion rates had lower redox potentials; however, redoxpotential could lag behind a former higher nitratereduction rate as evidenced for sample A-30.
In situ observations of redox potential in the levée ofthe hardwood forest
In 1999, redox values were monitored in the levée(Fig. 5). For most time of the year, the wholedepth profile displayed high redox values above 300mV. A large flood occurred from May to July 1999with flooding of the levées for 5 weeks and elevatedgroundwater levels for 10 weeks. Redox measure-ments made after 3 and 5 weeks of flooding showedreduced redox values for the whole soil profile from5 to 120 cm. Eh values ranged between 200 and 30mV after 3 weeks of flooding, and decreased to 120to −60 mV after 5 weeks of flooding. During flood-ing, nitrate decreased in the soil- and groundwater andhad disappeared completely when the reduced depthprofiles were observed (Sanchez-Perez et al., 1999).After the flood, a rapid return to high redox values wasobserved, with the exception of the 120 cm layer. Thelatter was due to an elevated groundwater table.
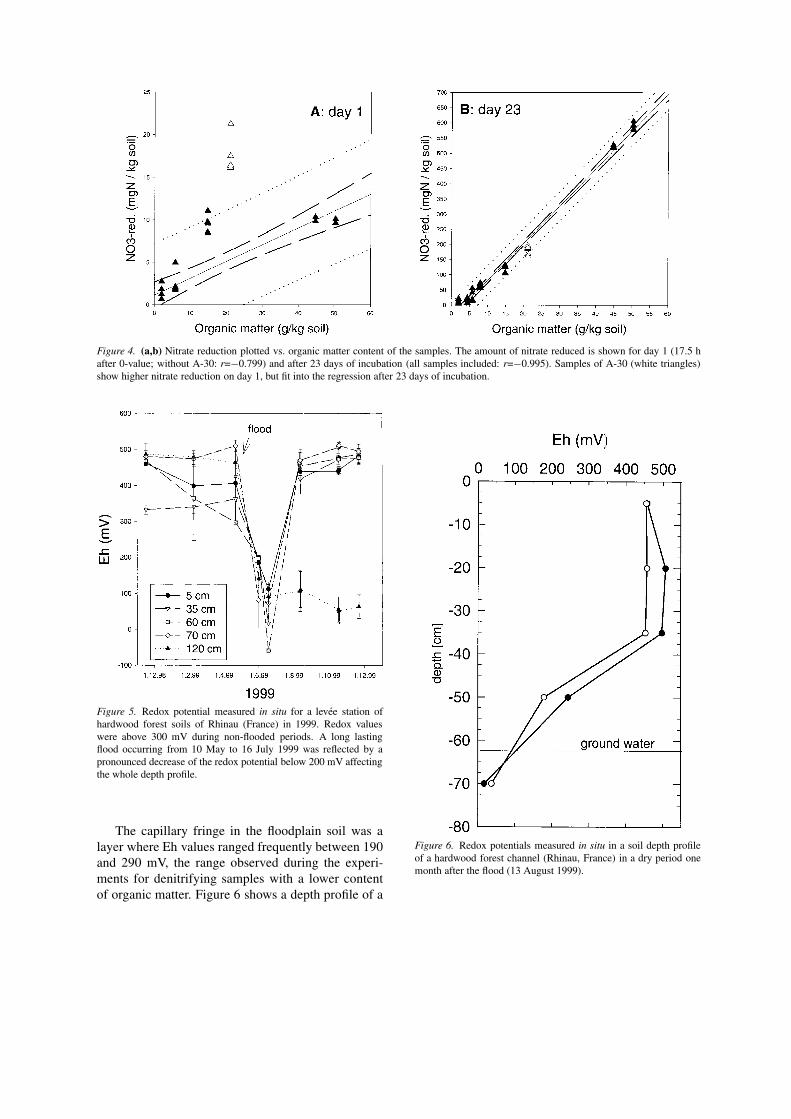
Figure 4. (a,b) Nitrate reduction plotted vs. organic matter content of the samples. The amount of nitrate reduced is shown for day 1 (17.5 hafter 0-value; without A-30: r=−0.799) and after 23 days of incubation (all samples included: r=−0.995). Samples of A-30 (white triangles)show higher nitrate reduction on day 1, but fit into the regression after 23 days of incubation.
Figure 5. Redox potential measured in situ for a levee station ofhardwood forest soils of Rhinau (France) in 1999. Redox valueswere above 300 mV during non-flooded periods. A long lastingflood occurring from 10 May to 16 July 1999 was reflected by apronounced decrease of the redox potential below 200 mV affectingthe whole depth profile.
The capillary fringe in the floodplain soil was alayer where Eh values ranged frequently between 190and 290 mV, the range observed during the experi-ments for denitrifying samples with a lower contentof organic matter. Figure 6 shows a depth profile of a
Figure 6. Redox potentials measured in situ in a soil depth profileof a hardwood forest channel (Rhinau, France) in a dry period onemonth after the flood (13 August 1999).
channel in August 1999, 1 month after the flood hadretreated. While the surface soil displayed high redoxvalues, they decreased to around 210 mV in 50 cmdepth with the impact of the capillary fringe; in thegroundwater saturated layers, redox potentials below150 mV were usually observed.
Relationship between redox potential, nitratereduction and organic matter
In our experiments, the denitrifying soil samples fromthe hardwood forest showed redox potentials rangingfrom 300 to 10 mV. This range was confirmed by mi-crocosm studies with soils from levées and channelsof the same site. These observations are in agreementwith studies by several authors that indicate the on-set of denitrification at around 300 mV as outlined byPatrick et al. (1996). A redox potential of 300 mVis assumed as a value where the O2 content in soilair is less than 5% and the soils are essentially an-aerobic (Faulkner & Patrick, 1992; Megonical et al.,1993). Patrick et al. (1996) considered redox poten-tials as an indicator of biogeochemical processes insoil. Masscheleyn et al. (1993) assigned specific redoxpotentials to the onset of different biogeochemical pro-cesses, e.g. denitrification started at 300 mV, ironreduction at 200 mV and methane production at −150mV. For hardwood forest soils of the Upper Rhine,we also assume the onset of denitrification around 300mV. However, with increasing carbon content (e.g. topsoil, accumulations of organic matter as in oxbows),the redox potential in denitrifying soils is expected todecrease down to 0 mV.
Our experimental studies showed that with in-creasing nitrate reduction rates the redox potentialdecreased. This relationship is consistent with stud-ies by Masscheleyn et al. (1993) that showed thatdenitrification rates increased with decreasing redoxpotentials when nitrate was added to soil solutionswith redox potentials from 300 to −200 mV.
Redox potential values in our studies decreasedwith increasing carbon content of the sample. Addi-tionally, nitrate reduction rates were very closely andpositively correlated with the organic matter contentof the samples. Due to the latter close correlation, weassume that the organic carbon directly determined thenitrate reduction rates, after lag and growth phases ofthe denitrifying bacteria have been overcome. The ni-trate reduction rate was reflected by redox potentialsfrom 10 to 290 mV that decreased with increasingnitrate reduction rates. From our observations, we as-
sume that there is a rather rapid response of the nitratereduction rate to the actual carbon availability, but adelayed response of the redox potential to a decreaseof the nitrate reduction rate. This could explain the un-expectedly low redox potentials of the sample from 30cm (A-30) that were not in agreement with the actualnitrate reduction rate but with higher rates measuredearlier in the experiment.
The observations in the floodplain soil experimentscan allow interpretation of redox potential in a fol-lowing way: redox potentials ranging from 0 to 300mV can indicate denitrification with lower redox po-tentials occurring in soils with higher organic carboncontent. In our experiments, top soils with a highercontent of organic matter (>2.5% organic matter orapprox. >1.3% organic carbon) showed a broad redoxrange of 10–300 mV within 5 weeks of incubation,while deeper soil horizons with lower organic carboncontent (<2% organic matter) ranged from 150 to 300mV (<2% organic matter, or approx. <1% organiccarbon) (Table 2). Below the indicated ranges, we as-sume that nitrate is already consumed, i.e. below 0mV for top soil and below 150 mV for deeper soilhorizons. We suggest to interpret a redox potential be-low 0 mV in top soils and a value below 100 mV fordeeper horizons as to be free or very low in nitrate. Asa correlation between the nitrate reduction and redoxpotential was shown, redox potentials within the rangeof 0–300 mV can additionally be interpreted as a hinton nitrate reduction rates, with lower redox potentialsindicating higher rates.
The in situ-measurements in 1999 of the hardwoodforest levée interpreted in the light of the findings ofthe experiments indicate that (i) during dry periodsdenitrification was very low or non-existent for alldepths and that (ii) during flooding only the surfacesoils were still denitrifying, while for deeper soil hori-zons nitrate can be considered to have been consumed.This is consistent with former findings of high deni-trification rates in the surface soils measured after andduring floods (Brettar et al., 1998), and with the obser-vations that nitrate had disappeared from soil (below25 cm) and groundwater at the time of redox meas-urements during the flooding period (Sanchez-Perezet al., 1999). In situ measurements of redox potentialin the depth profile of the channel can be interpretedin a way that denitrification was most pronounced inthe layer just above the groundwater during unfloodedperiods.
Utility and limits of redox potential measurements formanagement of Upper Rhine floodplains fordenitrification
Our finding of the correlation of redox potential withnitrate reduction and organic matter content of thefloodplain soils of the upper Rhine can be used to helpmanagement of floodplains for nitrogen elimination bydenitrification. The flood retention areas (polders) willbe flooded in a controlled way, i.e. the flooding regimecan be regulated deliberately. Flooding of the polderscould be done with the feedback of redox potentialmeasurements. Provided that the content of the or-ganic matter of the site where the redox electrodes areinstalled are known as well as their representativity forthe area, redox potential can be used to assess denitri-fication. Flooding can be continued as long as neededto get denitrification started and continued as long asdenitrification is likely to proceed. When redox poten-tials drop below the range estimated for denitrificationin the respective soil horizon, elimination of nitrate insoil can be assumed to a large extend and flooding canbe stopped. Calibration of the redox potential meas-urements in the flood retention areas can be achievedby nitrate analysis of soil and groundwater. In this way,redox monitoring could allow for optimization of floodduration by helping to restrict reduced soil conditionsto the time needed for denitrification and avoid toolong periods of reduced soil conditions that can causetree damage (Pezeshki, 1993).
Redox potential could be used to monitor siteswith high and rather homogeneous denitrification ratesas occurring during floods. Low denitrification ratesin unsaturated soils that depend on anoxic and lowoxic microniches, e.g. as observed in the organic richtop soil of the hardwood forest under non-floodedconditions, can not be assessed by redox potentialmeasurements (Brettar et al., 1998, 2000). However,N-elimination by denitrification during dry periods islow in comparison to flooded preriods.
In general, the relationship between nitrate reduc-tion rates, carbon content and redox potential canfurthermore support modelling of denitrification in thehardwood forest of the upper Rhine, and help to pre-dict nitrogen elimination, e.g., under different floodingscenarios for the artificially flooded retention areas(polders).
Acknowledgements
Manfred G. Höfle is greatly acknowledged for labor-atory support and critical reading of the manuscript.Benoît Sittler is acknowlegded for great support of thefield work. We thank Steve Faulkner for support withthe construction of the redox electrodes.
References
Culbertson, C. W., A. J. B. Zehnder & R. S. Oremland, 1981.Anaerobic oxidation of acetylene by estuarine sediments andenrichment cultures. Apl. envir. Microbiol. 41: 396–403.
Ball, D. F., 1964. Loss on ignition as an estimate of organic matterand organic carbon in non-calcareous soils. J. Soil Sci. 15: 84–92.
Behrendt, H., 1999. Nährstoffbilanzen der Flußgebiete Deutsch-lands. Texte, UBA 75/99, Berlin.
Brettar, I. & G. Rheinheimer, 1992. Influence of carbon availabilityon denitrification in the central Baltic Sea. Limnol. Oceanogr. 37:1146–1163.
Brettar, I., J. M. Sanchez-Perez, J. Kern, M. Trémolières & H.Rennenberg, 1998. Stickstoffretention in Auenwäldern des Ober-rheins. Deutsche Gesellschaft für Limnologie, Tagungsberichte,Krefeld: 647–651.
Brettar, I., J. M. Sanchez-Perez & M. Trémolières, 2000. Auenund Polder als Stickstoffsenken: Redoxdynamik in Auenwald-böden des Oberrheins. Deutsche Gesellschaft für Limnologie,Tagungsberichte, Tutzing: 439–443.
Brinson, M. M., H. D. Bradshaw & E. S. Kane, 1984. Nutrientassimilative capacity of an alluvial floodplain swamp. J. appl.Ecol. 21: 1041–1057.
Caraco, N. & J. J. Cole, 1999. Human impact on nitrate export: ananalysis using major world rivers. Ambio 28: 167–170.
Davies, B. E., 1974. Loss on ignition as an estimate of soil organicmatter. Soil Sci. Soc. am. Proc. 38: 150–151.
DeLaune, R. D., R. R. Boar, C. W. Lindau & B. A. Kleiss, 1996. De-nitrification in bottomland hardwood wetland soils of the CacheRiver. Wetlands 16: 309–320.
Dister, E., 1991. La maîtrise des crues par la renaturation des plainesalluviales du Rhin supérieur. Bull. Soc. Industr. Mulhouse 824:73–82.
Faulkner, S. P., W. H. Patrick & R. P. Gambrell, 1989. Field tech-niques for measuring wetland soil parameters. Soil Sci. Soc. am.J. 53: 883–890.
Faulkner, S. P. & W. H. Patrick, 1992. Redox processes and dia-gnostic wetland indicators in bottomland hardwood forests. SoilSci. Soc. am. J. 56: 856–865.
Grasshoff, K., M. Ehrhardt & K. Kremling, 1983. Methods ofSeawater Analysis. Verlag Chemie Weinheim, New York.
Haycock, N. E., G. Pinay & C. Walker, 1993. Nitrogen in rivercorridors: european perspective. Ambio 22: 340–346.
Lockaby, B. G. & M. R. Wallbridge, 1998. Biogeochemistry.In Messina, M. G. & W. H. Conner (eds), Southern Fores-ted Wetlands: Ecology and Management. Lewis, Boca Raton:149–172.
Lowrance, R., R. Todd, J. Fail, O. Hendrickson, R. Leonard & L.Asmussen, 1984. Riparian filters as nutrient filters in agriculturalwatersheds. Bioscience 34: 374–377.
Masscheleyn, P. H, R. D. DeLaune & W. H. Patrick, 1993. Meth-ane and nitrous oxide emissions from laboratory measurements

of rice soil suspension: effect of soil oxidation-reduction status.Chemosphere 26: 251–260.
Megonical, J. P., W. H. Patrick & S. P. Faulkner, 1993. Wetlandidentification in seasonally flooded forest soils. Soil Sci. Soc. am.J. 57: 140–149.
Ministerium für Umwelt und Verkehr Baden–Württemberg, 1996.Rahmenkonzept des Landes Baden–Württemberg zur Umset-zung des Integrierten Rheinprogrammes, Materialien IntegriertesRheinprogramm 7, Stuttgart: 94 pp.
Patrick, W. H., R. P. Gambrell & S. P. Faulkner, 1996. Redox Meas-urements of Soils. Soil Sci. Soc. Am. & Am. Soc. Agronomy,Methods of Soil Analysis, Part 3. Chemical Methods – SSSABook Series no.5, Madison, WI, U.S.A.: 1255–1273.
Peterjohn, W. T. & D. L. Correll, 1984. Nutrient dynamics in an ag-ricultural watershed: observations on the role of a riparian forest.Ecology 65: 1466–1475.
Pezeshki, S. R., 1993. Differences in patterns of photosyntheticresponses to hypoxia in flood-tolerant and flood-sensitive treespeciea. Photosynthetica 28: 423–430.
Sanchez-Perez, J. M., 1992. Fonctionnement hydrochimique d’unécosystème forestier inondable de la plaine du Rhin. Ph.D.Thesis, CEREG, Univ. Louis Pasteur, Strasbourg: 176 pp.
Sanchez-Perez, J. M., M. Trémolières, A. Schnitzler, B. Badre & R.Carbiener, 1993. Nutrient content in alluvial soils submitted toflooding in the Rhine alluvial deciduous forest. Acta Oecologica14: 371–387.
Sanchez-Perez, J. M., M. Trémolières, Y. Grosshans, D. Hartz, R.Hranitsky & P. Killian, 1999. Rôle de la zone non saturée du soldans le transfert des nitrates vers les eaux souterraines en zonealluviale inondable. 24e journées GFHN, Strasbourg.
Trémolières, M., I. Eglin, U. Roeck & R. Carbiener, 1993. Theexchange process between river and groundwater on the centralAlsace floodplain (Eastern France). I. The case of the canalisedriver Rhine. Hydrobiologia 254: 133–148.
Trémolières, M., J. M. Sanchez-Perez, A. Schnitzler & DianeSchmidt, 1998. Impact of river management history on the com-munity structure, species composition and nutrient status in theRhine alluvial hardwood forest. Plant Ecology 135: 59–78.