Nine Mile Point Unit 1 and 2, Letter Submitting Leaves Issued by ...
514
1 ROCVESTER GAS C.HD ELECTRIC CORPORATIOH ~ ~ ~ a a~q 'I PE 'i D ~ lalC ~ ~ 89 Et ST AVEHUE, ROCHESTER, H.Y. )/6/9 J 'O~::i 4 . K + l4iEDY Yltj PRES la)fh ~ ~ May. 26, 1978 ~ ( VCLC><0>t i~c*cooL 7io 5l6 2IOO Hr. 'amuel R. Madison, Secret ary Public Se Tvi ce Commission Zmpire State Plaza Alb any, New. Yor3c 12223 Dear Hr. Madison: The enclosed leaves, issued by Rochester Gas 2nd 'electric Corpora iion, are transmitted for filing in comDliance with The reouiremenis of the 'Public Service Commission of the Siate of New York: P. S. C. No. 9 - El ectrici i P. S. C. No. 13 - elect icitv 2n d. 1 5th 15ih 15 ih 8ih 1 57.h '14th 9ti 9th Revised Revised Revised Revised Revis e.d Revised Revised Revised Revised Leaf No. Leaf No. Leaf No. Leaf No. Leaz No ~ Leaf No. Le2f No Leaf No. Leaf No. 19 31 55 36 38 45 46 47 1 57. Qri 1st. 157. 1s t. 1sT. 1st ls Revise Leaz No. ginal Leaf No. Revised Lea-. No. Revised Leaf No. Revised Lea ~ No. Revised Leaf No. Revised Leaf No. Revise'd'eaf. No. 11-A 21 22 2D 24 25 26 P. S. C. No. 10 - Gas 5in Revise Lea= No. 40 5ih Revised Leaf No. 42 "ect've June 26, 1978 Tne above .revisions a. e being filed or the purpose of increasing revenues approximately $ 34,999,000, or 18.2:, from our electric operaT.ions and $ 9,997',000, or 9. 1:, from our gas operations, based on sales daia or ihe 12-monih period ended December 31, 1977. The average number of customers servec during ine 12-month period endec December 31, 977 ~'as 277,540 electric customers anc 206,479 gas customers. The proDosed'raies would have resulted in increases for all bills rendered during ihat period. Ln 2ccoTd2nce. with 16 w~ ih t'ai'enty" rouT copies Qf Th each ibi7, s whi ch wi 1 1 comp i s e elccTT:c anQ gas 27e f""~ ng. ihai Taie relief is necessary v'able posit'on to provide th expect. NYCRR 2. 3, ihe e prepared writ iis direci case Th's material i — ihe Comp-ny e ouality of se Com'p2ny submiTs here- ten testimony 2nd in suppor i of ihis clearly d emons ira ies i S to rerrlain "n 2 rv 3. Ce OUT CUSTomers
-
Upload
khangminh22 -
Category
Documents
-
view
1 -
download
0
Transcript of Nine Mile Point Unit 1 and 2, Letter Submitting Leaves Issued by ...
1
ROCVESTER GAS C.HD ELECTRIC CORPORATIOH
~ ~ ~ a a~q'IPE
'i D~ lalC
~
~ 89 Et ST AVEHUE, ROCHESTER, H.Y. )/6/9J
'O~::i 4 . K + l4iEDYYltj PRES la)fh ~ ~ May. 26, 1978
~ (
VCLC><0>ti~c*cooL 7io 5l6 2IOO
Hr. 'amuel R. Madison, Secret aryPublic Se Tvice CommissionZmpire State PlazaAlbany, New. Yor3c 12223
Dear Hr. Madison:
The enclosed leaves, issued by Rochester Gas 2nd 'electricCorpora iion, are transmitted for filing in comDliance with Thereouiremenis of the 'Public Service Commission of the Siate ofNew York:
P. S. C. No. 9 - El ectrici i P. S. C. No. 13 - elect icitv2n d.
1 5th15ih15 ih
8ih1 57.h'14th
9ti9th
RevisedRevisedRevisedRevisedRevis e.dRevisedRevisedRevisedRevised
Leaf No.Leaf No.Leaf No.Leaf No.Leaz No ~
Leaf No.Le2f NoLeaf No.Leaf No.
1931
553638454647
1 57.Qri1st.157.1s t.1sT.1stls
Revise Leaz No.ginal Leaf No.Revised Lea-. No.Revised Leaf No.Revised Lea ~ No.Revised Leaf No.Revised Leaf No.Revise'd'eaf. No.
11-A21222D242526
P. S. C. No. 10 - Gas5in Revise Lea= No. 405ih Revised Leaf No. 42
"ect've June 26, 1978
Tne above .revisions a. e being filed or the purpose ofincreasing revenues approximately $ 34,999,000, or 18.2:, from ourelectric operaT.ions and $ 9,997',000, or 9. 1:, from our gas operations,based on sales daia or ihe 12-monih period ended December 31, 1977.The average number of customers servec during ine 12-month periodendec December 31, 977 ~'as 277,540 electric customers anc206,479 gas customers. The proDosed'raies would have resulted inincreases for all bills rendered during ihat period.
Ln 2ccoTd2nce. with 16w~ ih t'ai'enty" rouT copies Qf Theach ibi7, s whi ch wi 1 1 comp is eelccTT:c anQ gas 27e f""~ ng.ihai Taie relief is necessaryv'able posit'on to provide thexpect.
NYCRR 2. 3, ihee prepared writiis direci case
Th's materiali— ihe Comp-ny
e ouality of se
Com'p2ny submiTs here-ten testimony 2ndin suppor i of ihisclearly d emons ira iesi S to rerrlain "n 2
rv 3. Ce OUT CUSTomers

li
lROCHESTER CC5 C I'O ELECTRIC CORP.o<TE ~Jay ~6 1S78
~'.r. Samuel R. Madison
SHEET t'O. 2
view of the Commission' Order', issued Harch 8, 1978,in Case 27501, allowing che use of experimental hearing procedures,the Company suDDorts the "concept of using written interrogatoriesand responses', together" v"'iih 'a consolidated h aring procedure, toexDedite the development o a clear 'and. concise record. TheCovii,pany is of the opinion that revised procedures,'uch zs thoseused in. Cases 27094 and. 270SS, will reduce the time required tocomplete the record enabling the Commission to reach a final de-cision more efficiently.'ccordingly, the Company hereby requeststhat the experimental'procedures, including the advance use of ..appropr" aTe daTa reouests and interrogatories, and the filing ofall testimony and exhibits prio~ to any hearings for cross-exam'nation. be used in these proceedings.
A notice to the Dublic regarding these revisions will bemad e in accordance with 16 NYCRR li6. 70 and 6 NYCRR 270. 70.
Very truly yours,ROCHZST"R GAS. Ah'D H.~CHIC CORPORATION
John I. KenneoyVice President
JLk:m)rencl c .
P.S.C. No. 9 — ELE(.TR I(:IIY
ROCHESTER GAS AND ELECTRIC CORPORATION0IIICINALI.EAF hO....,..................
........,2Dd....... REvlsED LEAF N0.........19............
S(II'ERSEDINC ....1.St.............. LEAF NO....'.....l9...........
GENERAL INFORMATION
3.:XT".HSION OF COMPANY'FACILITIES TO SERVE CUSTOY:-R (Cont'd)
3.5 Tr".ANS ORMR VAULTS
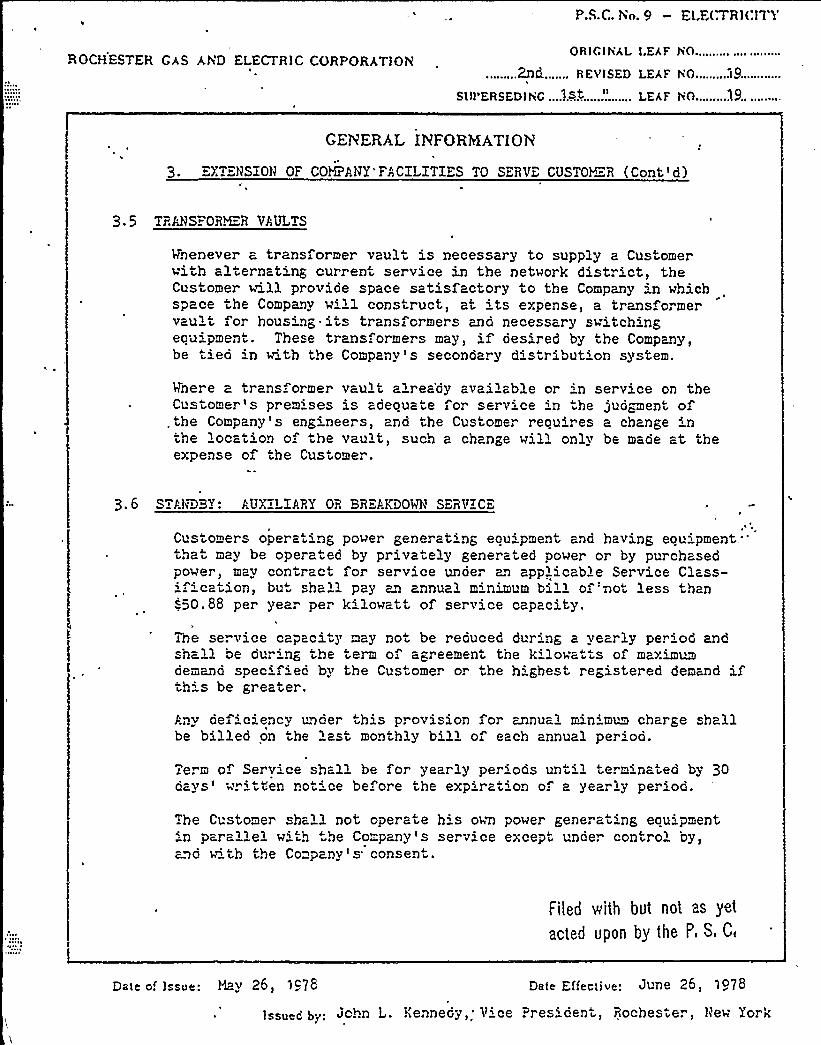
Vnenever a transformer vault is necessary to supply a Customerwith alternating current service in the network district, theCustomer will provide space satisfactor y to the Company in whichspace the Company will construct, at its expense, a transformervault for housing its transformers and necessary switchingeouipment. These transformers may, if desired by the Company,be t'ed 'n v'th the Company's secondary distribut'on system.
Vnere a trans. ormer vault alrea'dy available or in service on theCustomer's prem'ses is adeouate for service 'n he jud~ment of
, the Company ' engineers, and the Customer reoui. es a change inthe location of the vault, such a change will only be made at theexpense of the Customer.
3.6 STANDBY: AUXILIARY OR BREAKDOWN Sr"RVZCr
Customers operating power generat'ng eouipment and having eouipment."that may be operated by privately generated power or by purchasedpower, may contract for service under an applicable Service Class-if'cation, but shall pay an annual m'nimum bill of'Tarot less than<50.88 per year per kilowatt of service capacity.
The service capacity may no be reduced dur'ng a yearly period andshall be cur'g the term of agreement the k'lowatts of maximm~demand specified by the Cus orner or the h'ghest r egistered demand i.th s be greater.
Anv def'c'ency unoer this provision or z.nual minimum charge shallbe billed on he last monthly bill of each annual period.
Term of Service shall be for yearly periods until terminated by 30c vs w. itten notice before the expiration of a year ly period.
The Customer shall not operate his own power generat'ng eou'pment:n parallel w'th the Co™pany's service except under control by,and v' the Company's consent.
Filed v:ith but not as yet
acted Upon by the P, 8, C
Date of Issue: May 26, lc78 Date Effective: June 26, i/78
Issueo by. John L. Kennedy, V'e Pr es' ent, Rochester, llew Yor k
\
P.S.C. No. 9 — ELECTRICITY
ROCHESTER GAS A.ND ELECTRIC CORPORATIONORIGINAL LEAF HO......................
......1.5.th......... REvlsED I EAF I 0..........3.).......
SUPERSEDINC 13th "I.EAF NO 31
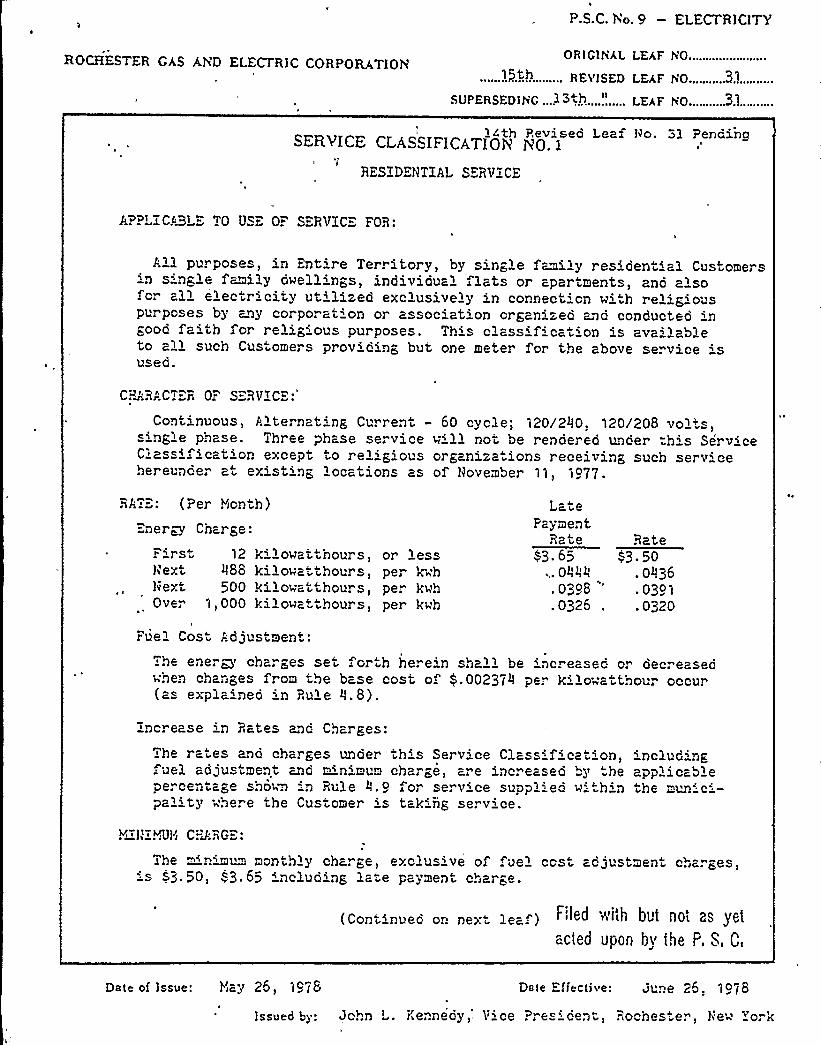
14th Reviseo Leaf Ho. 3l Penc1inaSERVICE CI.ASSIFICATION ÃO. 1
RESZDENTXAL SERVICE
A?PLACABLE TO VS" O." SERVXC FOR:
All purposes, in Entire Territory, by single f~ilty residential Customersin s'ngle family dwellings, individual flats or apartments, ano alsofor all electricity ut'ized exclusively in connection wi h religiouspurposes by ~ay corpo. at'n or association organized and conducted 'ngood faith fo. religious purposes. This classification is ava'lableto all such Customers providing but one meter for the above service 'sused.
CP~.HACT>ER Or SERVICE
Continuous, Alternating Current — 60 cycle; 120/2IIO) 120/208 volts,ingl)e phase. Three phase service w'll not be renoered under th"'s Serv'ce
Ciassification except to rel'ious organizations receiving such serv'ehereuncer at existing 'ocations as of l)ovember 11, 1977.
rirstNextlvextOver
12i88
5001> 000
kilowatthours,kilowatthours,kilowatthou. s,kilowatthours,
RATE: (Per ?')onth)
Energy Char ge
or lessper kwhper kwhper kwh
LatePayment
Rate~3. 65
Orig>I)
. 0398
.0326 .
Bate~e3. 50
. Olt36
. 0391
.0320
ruel Cost Ad„'ustment:
The ener@) charges set forth here'n shall be 'nc. eased cr decreasecwhen chaniges from the base cost o $ .00237'er kilowatthour occur(as expla'neo in Rule l).8).
increase 'n Rates and Charges:
The ra'es and charges under this Serv'ce Classificat'on,uel adjustment and minimum charge, are 'ncreased by he
percen>tage sho'~a in Rule Il.9 fo" serv'ce supplied wi -h'npality where the Customer 's tak'ng se. v'ce.
includ'ngapplicablethe muni c'—
I iI'UI~i C?3;RG
The ~'nimum monthly charge, exclus've o .uel ccs adjustment chiarges,'s 4.50, '3.65 'ncluding late payment charge.
(continued or. nex leaf) r'leu ')t'lttt but not as yetacted upon by the F. S, C,
Date of Isst)e: I'>ay 26, 1978 Date Effective: gute 25. 1o78
Iss))ed by: John L. Kennedy) Vice ?res'ent, Rochester) llew 'York
P.S.C. Yo. 9 — ELECTRICITY
ROCHESTER GAS AND ELECTRIC CORPORATIONORIGIhAL LEAF NO..................
......:6.ih......... REVISED LEAF ho........&~......
SUPERSEDlh'C....l3th..."....... LEAF h0........33.;....
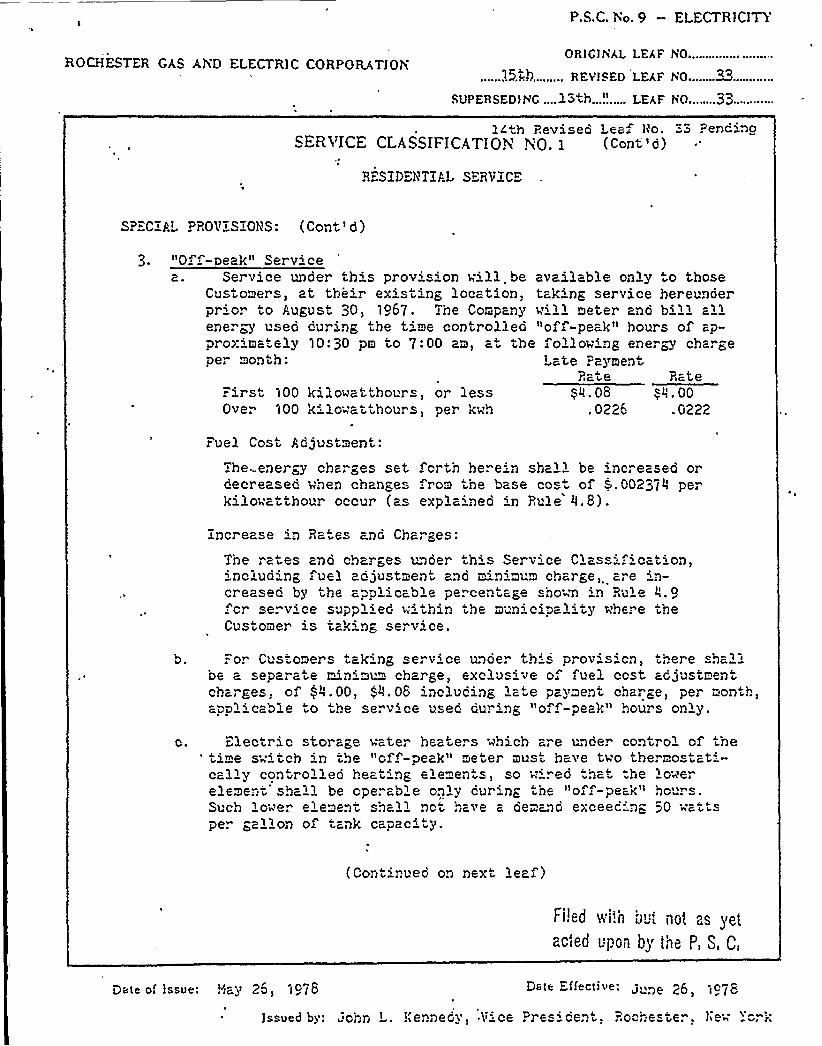
14th Revised Leaf h'o. ".3 PendinoSERVrCE CLASSIFrCATIpy, h;p. y (Cont'd)
RESZDEIiTZAL SERVZCE
SP"CZA'ROV"SZONS: (Cont'd}
~«! . 00.0222
t irst t00 kilowatthours, or lessOver 100 kilowatthours, per kwh
»Of -Deak» Servicea. Service under this prov's'on will be available only to those
Customers, at their existing location, taking ser vice her eunderpr'." to August 30, lo67. The Company w'll meter ano b'll allenergy used dur'ng the t'me controlleo»off-peak» hours of ap-proxima. ely l0:30 pm to 7:00 am, a'he follow'ng energy chargeper month: Late Payment
Rate Rate~~4. 08
~ 0226
r uel Cost C djustment:
The...energy charges set forth herein shall be increased ordecreased when changes rom the base co of >.00237IJ perkilowatthour occur (as explained in Rule JJ.8).
Zncr ease in Ra es and Charges:
The rates ano charges under this Serv'e Class=: ication,'nclud'ng fuel adjustment and minimum charge are in-creasec by the applicable percentage shown 'n Rule «.o
or serv'ce supplied w'thin the mun'cipal'ty t"here theCustomer is tak'ng service.
b..=or Customers tak'ng service unoe. th's prov's'cn, here sha'be a separate minimum charge, exclus've o. fuel ccst adjustmentcharges, of $ IJ.00, <~.08 'ncluding late pavment charge, per month,
vq;c ble to qe se v„ce used du ing»o, P peaI » . ou„s on'ty
Electric storage water heaters which are unoer controlt of'hetime switch in the»off'-peak» eter must have two thermo tati-cally controlled heating elemen s, so w'red tha":he lowerelement sha'l be oDerable onlv dur'ng th~ »off-peak" hours.Such lower element shall nct have a ae and exceed'ng 50 wattsper gallon of ank capacity.
(Contir:ued on next lea.f)
Iried V'I'.ll b~:i rot BS yetacted upon b~ toe p $ Q
Dale of Issue: Y>ay 25, t o78 Date Effective: gune 26 'tc78
Jssoed by: 'ohn. L. !(ennedy ) Vice ~ r6s Gent, Ro hest 6.. Iie ' k
P.S.C. No. 9 — ELECTRICITY
ROCHESTER GAS AND ELECTRIC CORPORATIONOR{C{NAL LEAF h0...................
......1.5.~5......... REYlSED LEAF h0........35..."-
SUPERSED)NC ....." "'. 'a......... LEAF Y0........35......
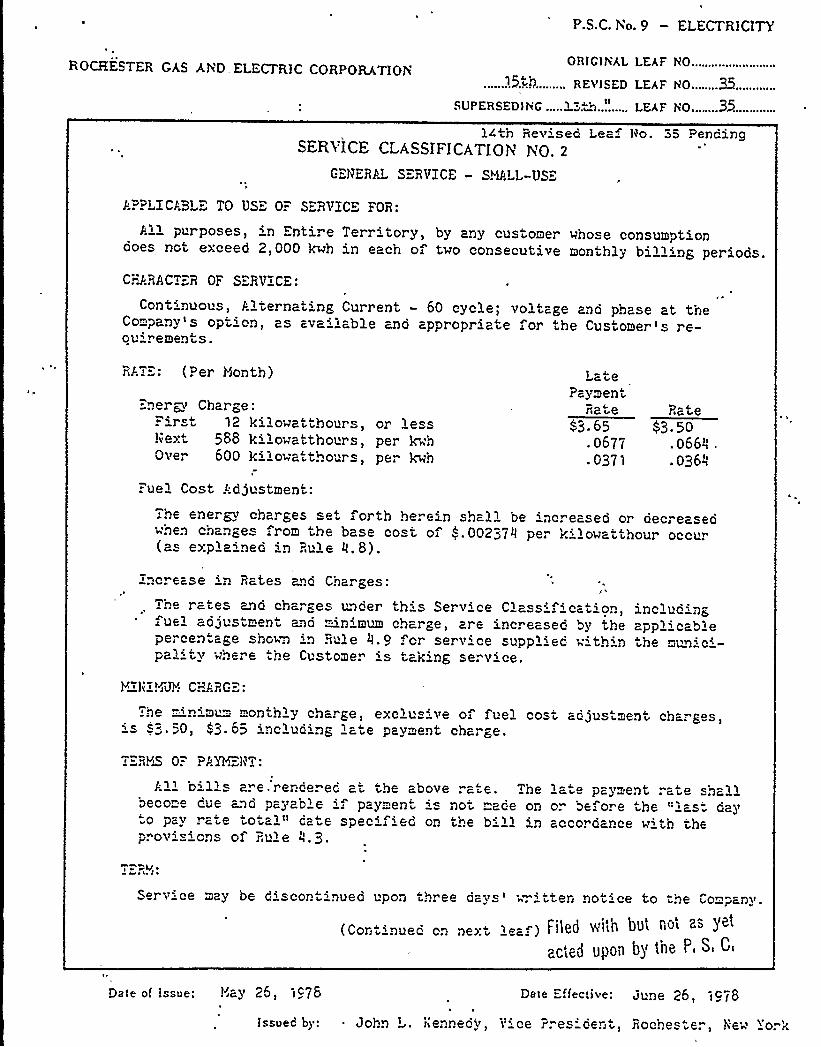
14th Rev'sed Lea~ {<o. 35 PendingSERVICE CLASSIFICATION NO. 2
G:.NERPt SERVICE - SY!ALL-US".
APPLICABL" TO US" 0." S:RVICE FOR:
All purposes, in Enti. e Territory, by any customer whose consumptionooes not exceed 2,000 kwh in each of two consecutive monthly billing per iods.
CATARACT.R OF S:RVICE:
Cont'nuous, A ter nating Current - 60 cyclei voltage and phase at theCompany s option as available aDo appropriate for the Customer's re-ou'rements.
RA!".: (Per Honth)
"=nergy Charge:Fir st 12 kilowa t thours, or lesshe>:t 588 kilowatthours, per kvhOver 600 k'owatthours per kt h
LatePayment
Rate83.65
.067/
. 037'l
Rate$3. 50
066{,.036/,
Fuel Cost P.djustmeni:
The ener~ charges set forth here'n shall be 'Dc. eased or decreaseowhen changes rom the base cost of <.00237{{ per k'owatthour occu.(as expla'ned in Rule !{.8).
Increase 'n Rates and Charges:
The rates and charges under this Service Class''ation~ ue adJustment and minimum charge, are increased by thepercentage shown in Rule i{.o for service supplied withinpa '> where the Customer ' tak'ng serv'e.
lncl ud~ Dgapplicable
he mun'e
Y hI{~iJI. CHJRG=:
:he "'nimu™ monthly charge, exclus've of fuel cost adjustment charges,' 3. 50, 43. 65 including late payment charge.
T" RY!S OF PP.YY~=liT:
b'ls a. e.rercerec at the above ra. e. Thebeco"e cue ano payab e f payment s Dot mace on.o pav rate total<~ cate specifi ed on the billp ovi i oDs of Rul e
la e pay ent rate shallor befo. e he ':l-s: dayaccorcance w'th the
'oM ~2 ~ s
Set ~ri ce may be discontinued upon th. ee days' .'tten not'e to he Company.
p- Vg(Cort'nuec on De> „ leaf) Fll{!0 5'{t{l uut nu
ac'ed upon b~ t'ne P, S, C,
Date of issue: Ya5'6, 1c78 Dale Effective: June 26, to/8
Issued by: John L. i(ennedy, t" ce Pres cent, Roches" er, New York
P.S.C. No. 9 — ELECTRICITY
ROCHESTER GAS AND ELECTRIC CORPORATIONORlClNAL LEAF HO...................
......8th........... REviSED LEAF no.........36......
SUPERSED)HC ........tn............ LEAF h0.........3........
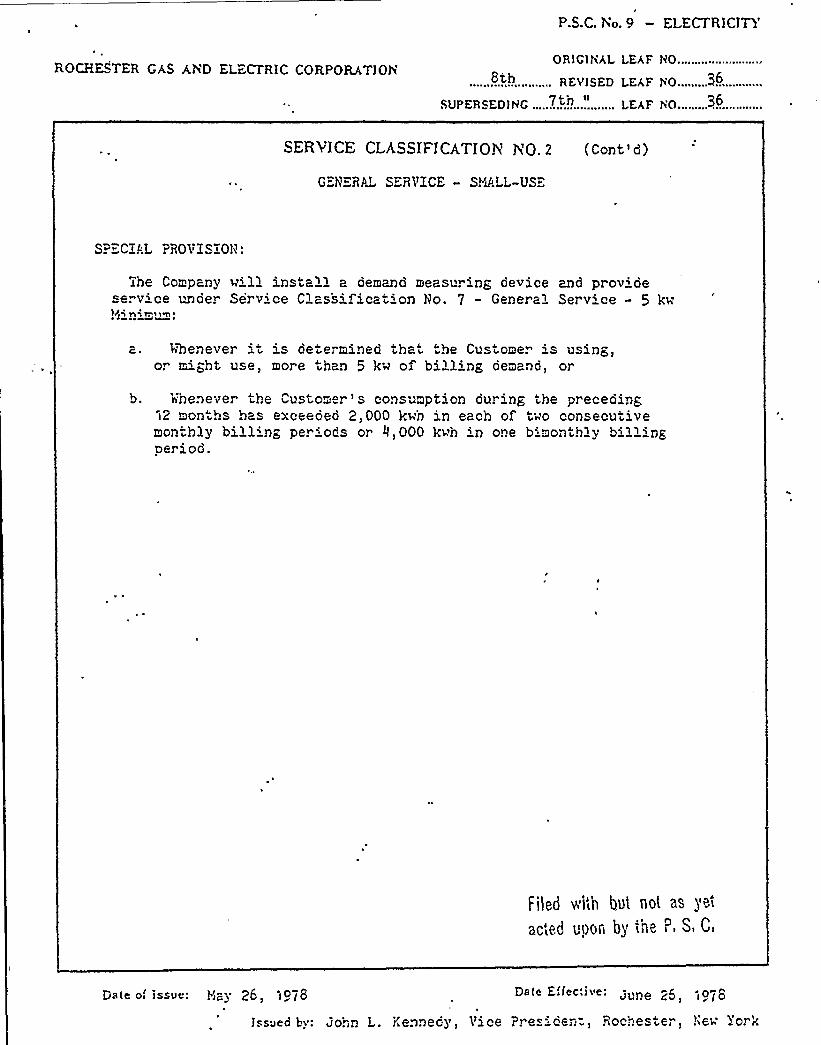
SERVICE CLASSIFICATION YO. 2 (Cont'd)
G"NERAL SERVICE - SHALL-US"-"
SPECIAL PRO'VXSXOH:
The Company vill install a demand measuring device and prov'deserv'ce under Serv'ce Classification No. 7 - General Serv'ce - 5 kt"
a. I henever it is determined that the Customer is using,or might use, more than 5 kw of billing pemand, or
b. whenever the Customer's consumption dur ing the preceding12 months has exceeded 2,000 kt:h in each of t'o consecutivemonthly billing per'ods or II,000 kt"h in one b.:monthly billingpe. iod.
Filed v'ith but not as yet
acted U!)On by the P, S, C,
Date o,'ssue: Hay 2g t p78 Date Elfec',iue: June 25 t p7
o.';. L.: en..edy Vi ce pre~; ce-,- poc'~es e t et,. vork
P.S C. Yo. 9 — ELECTRICITY
ROCHESTER GAS AND ELECTRIC CORPORATIONORIGINAL LEAF hO......."..."".
15th REvlsED LEAF Ho 38
SUPERSEDINC ..3.3. N........... LEAF N0.......3%....
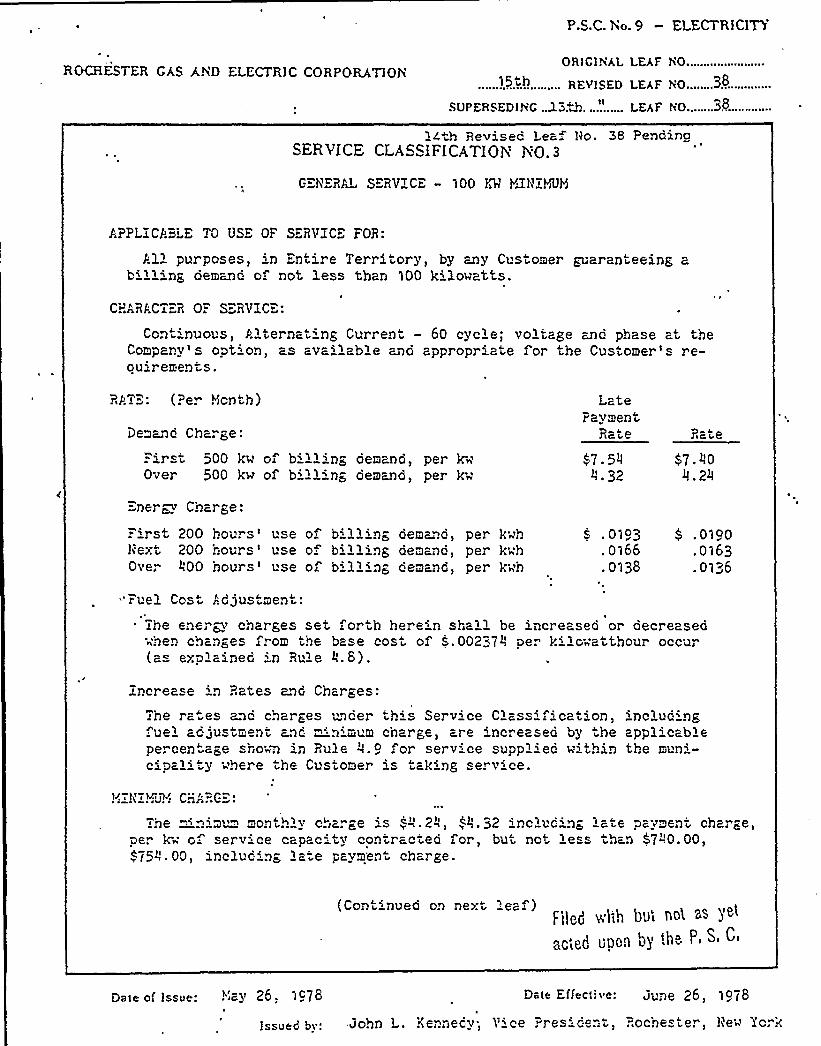
1Cth Revisec Leaf Ho. 38 PendinaSERVICE CLASSIFICATIOY No. 3
GENERAL SERVICE - 100 KM YJliZYUH
APPLiCPiLE TO USE OF SERViCL FOR:
S.'ll purposes, in Entire Territory, by any Customer guaranteeing abilling demand of not less than 100 ki3.ovatts.
cHARrlcTER 0: s. RvIGE:
Con 'nuous, P.lternat ng Current - 60 cycle; voltage ano phase at theCompaDV s option as available ano appropI iate for the CustomeI' re-ou'remen s.
RJIT"": (Per Yionth)
Demand Charge:" i I'st 5QQ kh'f billiDg oemaDG
> perkh'ver
500 k~ of billing demcnd, per kw
LatePaymeDt
Rc.t.e
$7.544. 32
Rcte
Ener~~ Charge:
Firs 200 hours'se o b'lling de"and, per khhNext 200 hours'se o billing demano, per kh'hOVe. ~!00 hOUI S 'Se Of b'' lling demcDd> peI'h'h
S . 0193 $ . 0190. o166 . o163. 0138 . 0136
"Fuel Cost J:djustment.'he
energy charges set, forth here'n shall be increased or decreased"hen changes from the base cost of „'.002374 per kilo"att!lour occu1(a explained 'n Ru'e 4.8).
increase in Rates and Charges:
The ra es and charges under th's Service Classification, includinguel ad Justment and ~'nimum charge, are 'nc. eased by "he applicable
percen"age shohw in Rule 4.9 for service supplied hithin the muni-cipal'ty 'here the Customer is taking service.
l~'Ii:!~u"I C~ARG
lhe "'Dim~ ~ mcnihly Chcrge 'S ~".2~»~~.g2 inc uding 'cte pcVment Charge,per k" o serv'ce capac'ty contracted for, but not less than 57Il0.00,„754. 00, 'nclucing a'e pay" en chaI ge.
(Con 'nueo o.. nex" 'ea. )F'IIgd W'Ith b'J< Ilg SS
)'c'qd
Ilpofl g)'h8 P
Dale of Issue: YIBy 26, 1978 Dale Errecl:ve: June 26, i978
IaaUed bv: John L. Kennedy; V'ce PI esident, Rochester, llew York
P.S.C. No. 9 — EL'ECTRICITY
ROCHESTER GAS AND ELECTRIC CORPORATIONOR)CITAL LEAF VO.....-" "."""""
.......1...th........ REvIsED LEAF 50.........~5........".
SVPERSED)HC ....,.l3.~h..."...... LEAF hO..........(5....,......
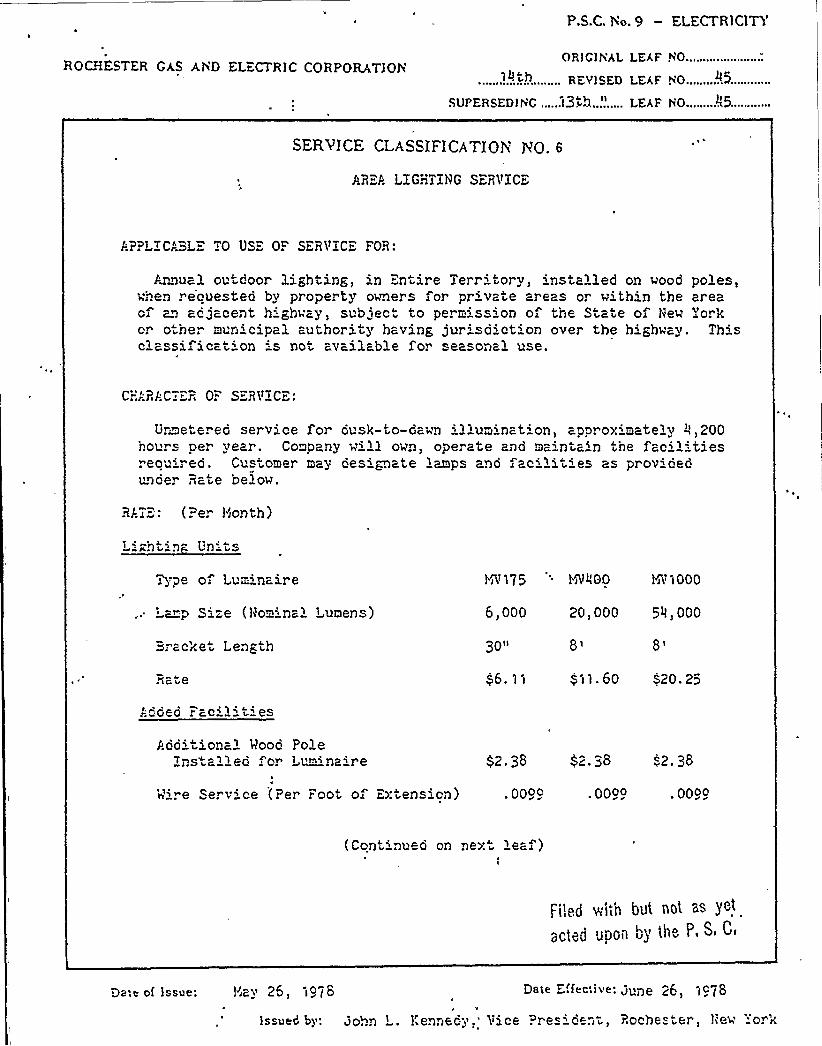
SERVICE CLASSIFICATION NO. 6
AR:A LIGHTING SERVICE
J-;PPLICPZL:" TO US OF SERVICE FOR:
JJ )ual outdoor lighting, in ""ntire Ter ritory, installed on wood poles,when reouested by property owners for private areas or within the areaof an adjacent hi>hway, subject to permis 'on of the State of New Yorkor other muri'cipal authority having jurisdiction over the highway. Thisclassification ":s not available for seasonal use.
C:":ARE.C™"R 0." SERVICE:
Unmetered service for ousk-to-Qahn illumination aporoximately 0 200hours pe. year. Company will own, operate and maintain the facil'iesreouir ed. Customer may designate lamps ano facilities as providedunider Rate below.
RAT=: (Per Yionth)
htin Units
Type of Luminaire
'~p Size (Hominal Lumens)
YrV175
6,000
YiVIlGO YiV1000
20) 000 5Il ) 000
"racke Length 30 Ii 8i
$ 6. 11 ~ i1. 60 $20. 25
Added ..acil't'es
P.dditional Mood PoleIns alled ~ or L~~.'naire $2.38 52. 38 '2. 38
Pire Serv'ce (Per Foot of Extension) .0099 .0099 . 0099
(Continueo on ne>:t le"f)
P~!:.d V,I,h bUt no~ aS
3Ctod UPGil b)'hG P< Si Ci
Dale of issue: Iiay 26 i978~
D'< -' 'Ive: gune 26, 1ct8
Issued bi zo+z» ezaec 3 ace o~e~~ ce Poche e'er Iie o~<
P.S.C. Yo. 9 — ELECTRICITY
ROCHESTER GAS AND ELECTRIC CORPORATIONORIClhAL LEAF YO..............:,....
REvisED LEAF h0.........06.......
SVPERSEDlhC .....l..~h,........,... LEAF h0........%6.......
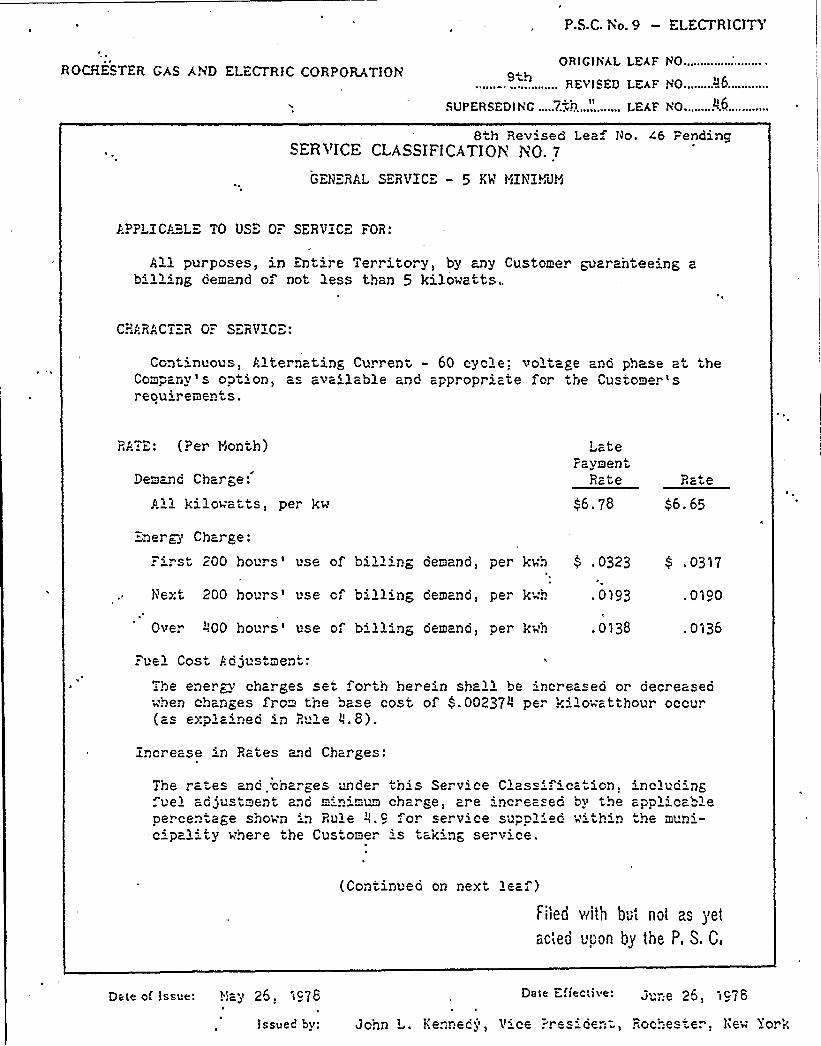
8 h Revisea Leaf Jlo. 46 PendingSERVICE CLASSIFICATIOY, YO. 7
GEH"RAL SERVIC" - 5 KV Y~Ih'IHUH
P.PPLICP.""LE TO USE 0." SERVICE FOR:
All purposes, in Entire Territory, by any Customer guarahtee'ng abilling demand of not less than 5 kilowatts..
C-"fRc'T" R G" S R'PIC":
Continuous, Plternating Current - 60 cycle:. voltage ano phase at theCompanv s opt on) c. avc. lcble and appropri ate fo. the Cu tomel sreouirements.
RATE: (Per I'month)
Demand Charge:
P.ll kilowatts, per kw
LateFayment
Rate
66. 78
Ra e
q6. 65~
~
ner~> Charge:
. 'rst 200 hours'se of billing demand per kwh $ .0323 $ .0317
Next 200 hours'se cf b'lling cemand> per kwh .0)93 . 0 "i 90
Over -".00 hours'se of billing demand) per kwh .oi38 .0~36
Fuel Cos P.cjustment:
'he ener~~ charges se" forth herein shall be increased or decreaseawhen changes from the base cosa of $ .002374 pe k'watthour occur(as explained in R le Il.8).
Increase in Rates and Char ges:
The ra"es and 'charges under th' Service Classi ica ion,.uel adjustment and mini "um charge, are increased by thepercentage shown in Rule ~u. 9 or service suppl'c within-cipality where the Cus'orner 's tak'ng service.
xnclud~ ngappl'ablethe muni-
(Continuea on next leaf)Filed with but not as yet
acted upon by the P, S. C,
Date of Issue: !!ay 25. I978 Da<e E'fecliue: June '25 IQ/8
Issued by: John L. Kennecj, Vice .=resi cen=-, Rochester. hew vork
P.S.C. No. 9 — ELECTRICITY
ROCHESTER GAS AND ELECTRIC CORPORATIOÃORJCI YAL LEAF hO...................
.......9.TIE.......... RFvlSED LEAF hO.........R7......
SUPERSEDlnC ...Z.".:.'.............. LEAF WO.........R7
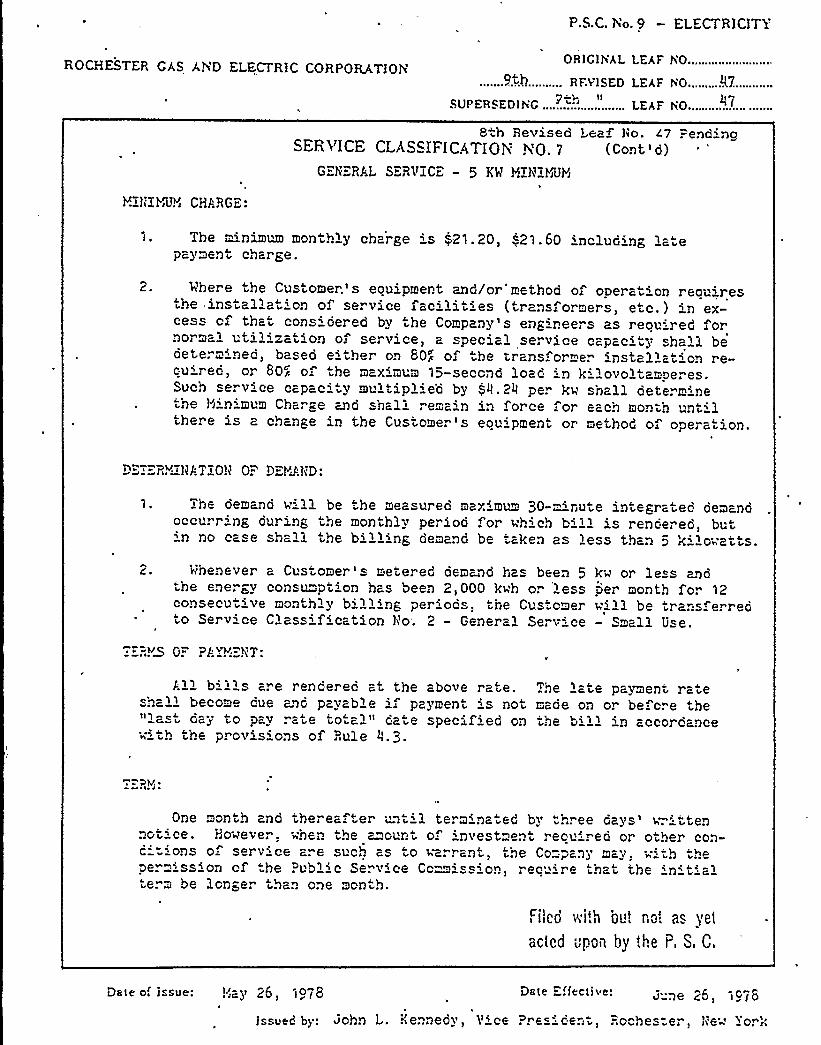
8 h Revised Leaf ho. L7 .-end'ncSERVICE CLASSIFICATIP>X NP. 7 (Cont')
GEhERAL SERVZCE — 5 KW HZh'ZYiUYi
YZhZYiUYi CHARGE:
Tbe minimum monthly charge ' )21. 20, <21 . 60 including latepayment charge.
Mbere the Customer.'s ecuipment, and/or'method of operation reouiresthe installation o se. vice facilities (transformers etc.) in ex-cess c that consioered by the Company's eng'r.eers as reouired fornorma uti ization o. service, a special service capacity shall bedet erm'ed, baseo e'her on 80> of be transfor mer installation re-cu'ed, or 80+ of he maximum 15-second load ' kilovoltamperes.Such se. vice capac' multiplie'a by 54. 24 per kv, shall dete. m'nethe Y!inimum Charge and shall remain in force "or each month untilthere is a change in the Custome. ' eouipment or method of opera" ion.
D".TERY l)A ZOH O." DERED:
1. The Qemand vill be the measured max'mum 30- 'ut 6 integrated demandoccurr'g dur ing the mon hly perioo for vh'b b'l 's renoered but'n no case shall tbe billing demand be taken as less than 5 kilo'~'atts.
2. whenever a Customer's metered demand bas been 5the energy cons~~ ption has been 2,000 kvh o. lessconsecutive monthly b'lling periods, the Custcmerto Serv'e Classification No-. 2 - General Service
k~ or le s andDer month for 12vill be transferred
Small Use.
T"'RYD 0." P '.YY;=!'T:
All b'' l' are renoered at the above rate.shall become cue and payable if payment is notlast Qay tQ pav rate tQtal da e specified on
vith the provisions of Rule 4.3.
Tbe 'te payment ra er'aoe on or be cre thethe bill in accoI Qance
One month and thereafter '-;til termina 6d by .. ec Gays '4 'ennotice. Ho~ever, eben the amount of 'nvestment reouired or other con-c''ns o serv'e are suc.. as ~o varrant, the Company may, v'b th'Qer=ission Qf the Public Serv'e Cc~ission recui re tha" >6 initialterm be longer than one month.
Filed with 0Ut Rot as yet
acted 'pan by the P, S, C,
Dale of I sue:,',ay 26, >Q78 Dele Effective:
IssUed b».. pobn l Kenneov Vicc Presi c nt "0 bes 6.. ice'~'ork
P.S.C. Vo. )3 — ELECTRICITY
ROCHESTER GAS AiD ELECTRIC CORPORATION0 R I G) ~iAL LEAF YO.................
......LIPS........... REvisED LEAF io........3.......
SL:PERSED! iG ......o.r.-'S.-'.JP.l........ LEAF 80.....;..3.......
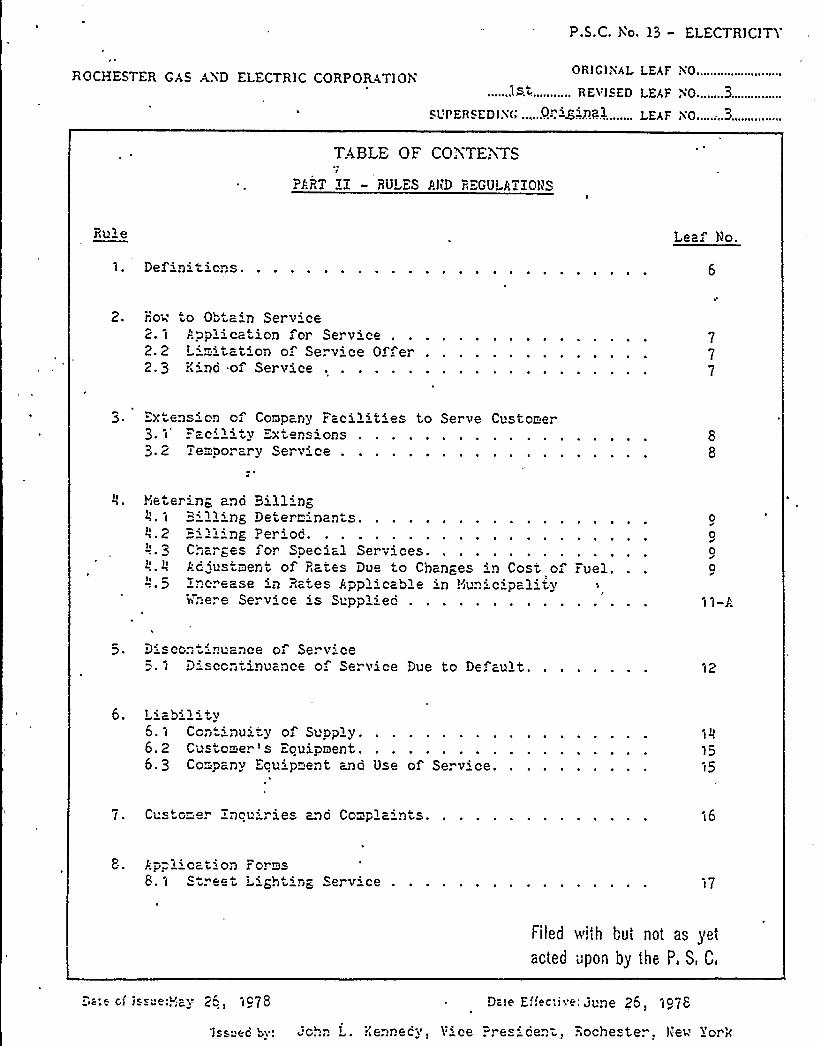
TABLE OF CONTEXTSf
PART ZX — RULES PhD REGULATIOIIS
Pule Leaf No.
1. Def'n'ions.
iso'o Obtain Service2. I Application or Service2. 2 Limitation o Serv'e Of er2.3 Zinc of Service
~ 0 ~ ~ ~
777
3. ="xtens'on of Company Pac3 ~ I "acil itv Extens~ ons3. 2 Temporary Service .
il't'es to Serve Customer
Net erin+ anQ Billing='ll'~ Determinan4.2 "i'l'ng Per'00.
Chas ~es for SpecialAc lustment of Rates
-"..5:ncrease 'n Ra-'es A
4nere Service is S"
Services.Due to Chan~es in Cost of Puel.
pplicabl e in Huni ci pal '.ypp 'ec
000
0
5. D'soon =:nuance of Serv:ce5. I Discontinuance o Service Due to De; ault
6. I iagilitv5. I Cont" nu' of Supply.6.2 Customer's Eouipment.6.3 Co"'pany Ecuip"ent wd Use of Service.
I .
15I5
7. Gusto=e. ncu'rie anc Complaints I6
8.1 S ree L'I",h in< Serv'ce l7
Filed vith but not as yetacted upon by the P, S, C,
Dc'c (I Icc: ~ e lP y 25 I078 D Ie E.';ac;ivy: Ju"Ie 26 I075
'ch.. L. ilennecy, >'ice Pre i cen-, Rochester. he~ For w
ROCHESTER GAS AND ELECTRIC CORPORATION
SL'PERSED) i<'........,
P.S.C. No. 13 — ELECTRICITY
OR!GlYAL LEAF YO........J.l.-.." .......
REVlSED LEAF 40
................ LEAF iO.....
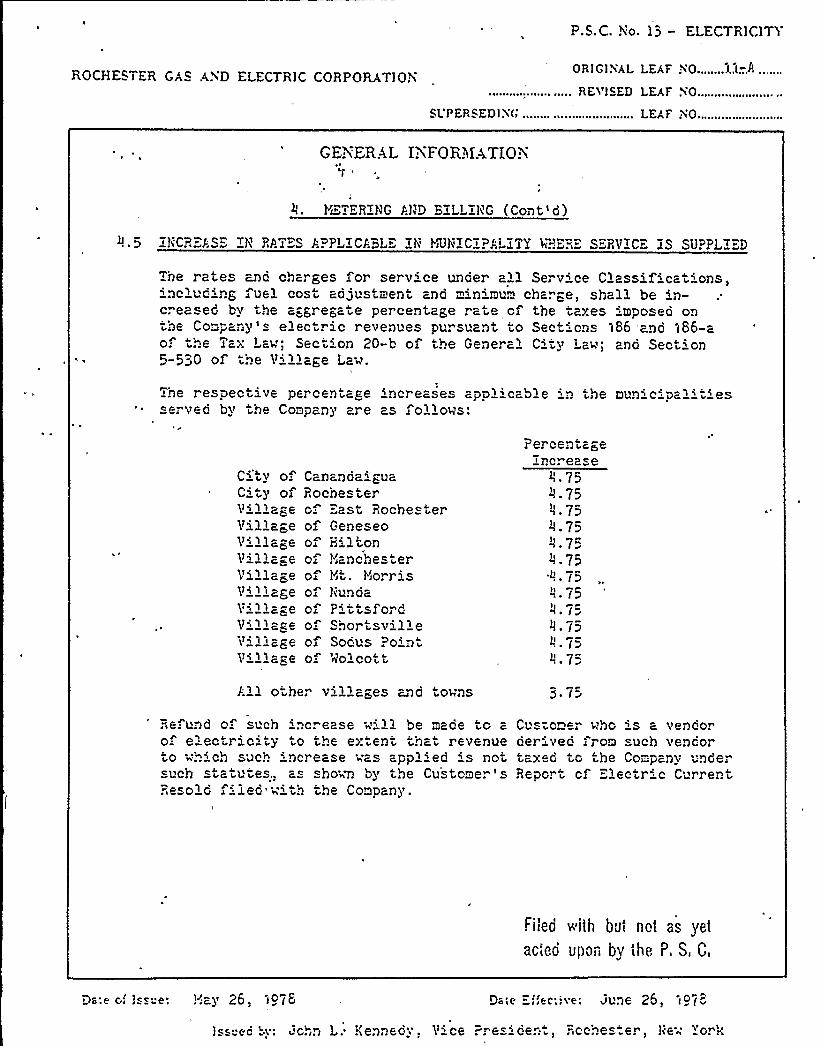
t EYERAL INFOFDIATIQihLp
YiETERING AND BILLIliG (Cont'd)
0 ~ 5 I!iCRES.'SE Il'P. ES APPLICA"L IN YUNICIPA'L TY 1"~iER S RVICE IS SUPPLZ" D
The rates md char ges for service under all Service Classifica ''ons,including fuel cost adJustment and minimum charge shall be in-creased by the aggregate percentage rate of the taxes 'mposed onthe Compaiiy's elec ric revenues pursuant to Sections 186 ano 1S6-ao the Tax LavI'Section 20-b of the General City Law; and Sect'on5-530 of the Village La<
The respective percentage increases applicable in the municipalitiesserved by the Company are as follovs:
Citv ofCity of
Village
t" llag
CaDanda"guaRochesterof East Rochesterof Geneseoof till7 onof !'anches erof Nt. Yiorrisof hunQaof PL 7 t sfordof Shor tsvil'of Soous Po~ Dt0-'iiolcot t
PercentageIncrease
4.754.75II
4.75h 7P
!..7SQi
~ IDli P
4. 75li
4.75
All o-her villages and tovns 5 'rRe.unc of such 'ncrease vill be mace to aof e" ectr'ity to the extent that revenueto ih'ch such 'Der ease vas applied is notsuch statutes. as sho~~ by the Custome. 'sResole filed'vith the Company.
Cus-orner hi)o "s a vencorderi. ec :"rom such vencortaxed to the Co pany underReport cf Electric Current
Filed v;ith but riot as yet
acted upon by the P. S, C,
)e;e G )«;e: !;ay 26, lo78 ec'ive'Iu je 25 I
Iss ed 'v: 'chn L. Ilennedyi Vice .. esicen i Rcches.er, !ie" "or<
P.S.C. Yo. 15 - ELECTRlCl7Y
RGCHESTER GAS A4D ELECTRIC CORPORAT10NOR1ClVAL LEAF YO.........................
.......!.s.t........... RES'lSED LEAF 40........2:i.............
SUPERSEDIY(: .....,o. -..g.":.nal........ LEAF ~'O... 2!
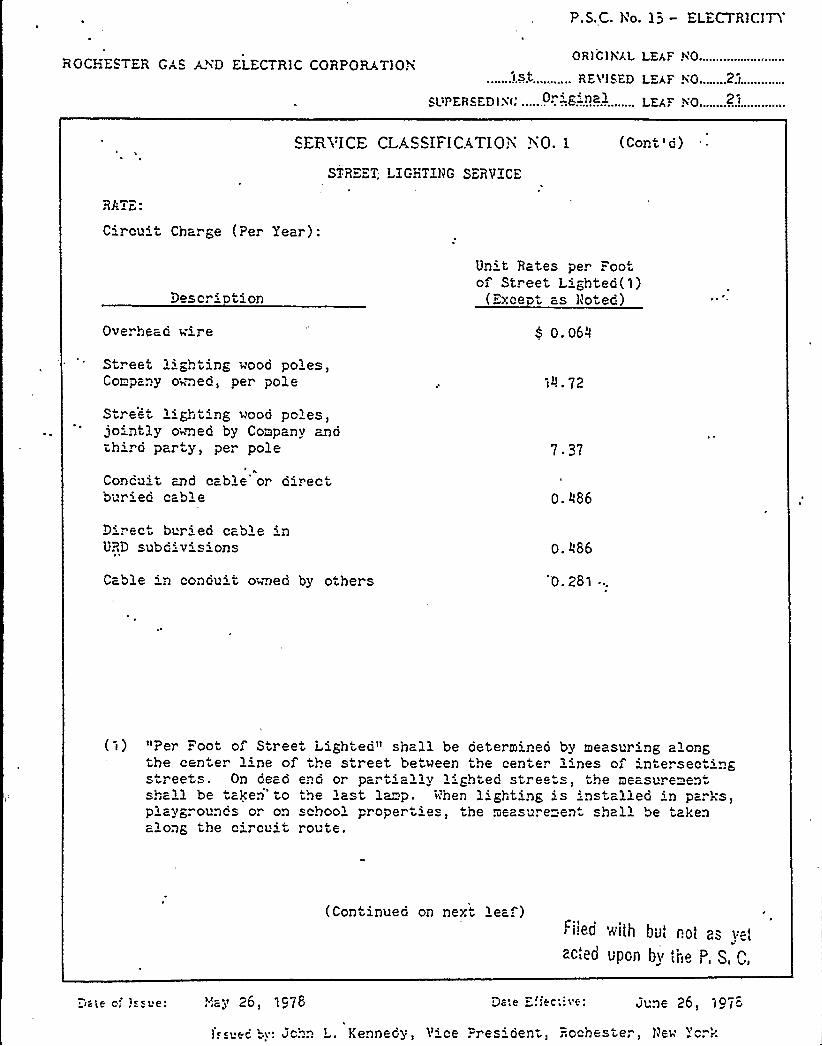
<EBVICE CLA,c:SIFICATIOY 40. 1
STRE" T. LIGHTING SERVICE
(Cont'd)
RATE.'ircu't Charge (Per Year):
Description
Unit Rates per Footof Street Lighted(1)
(Except as Noted)
Overhead wire t o.o6<
St. eet »gh ing wood poles,Company o'~wed, per pole 1>. 72
Stre t lighting wood po'es,jointly o wed by Company ~dthi. d par y, per pole 7 37
Concu't and cable or d'rectbur'ed cable o Ai86
Direc bur'ed cable inURD subd'is'ns o 486
Cable in conduit owned by o hers 'o. 281 ...
"Per ."oot of Street Lighted" shall be determined by measuring alongthe center line o. the street between the center lines of intersectingstreets. On dead enc or part'lly l'hted streets, the measurementshall be takei'o the 'ast lamp. Vhen l'hting is installed 'n pari's,playgrounds or on school properties, the measure=en- shal'e akenalong the c'cu' rou e.
(Continued on nex~ leaf)"i!e.d v;ith bul r.ot as
v=.'Cied
UPG|l bV tlto P, $ , C,
~ g''e@ lg y 26 1078 .)CCi:"6: June 26 ) 1 97
i. ec LF: ichn L. Kennedy, Vice .""resident Rochester, New Yerk
P.S.C. Yo. 15 - ELECTPJCJTY
ROCHESTER GAS AND ELECTRJC CORPORATIONORIG) NAL LEAF YO.........................
.........1.%t...,..... REvlSED LEAF NO.......22.............
gg:pEpcEDly~, 'r'g"na LEg,F qO, 22
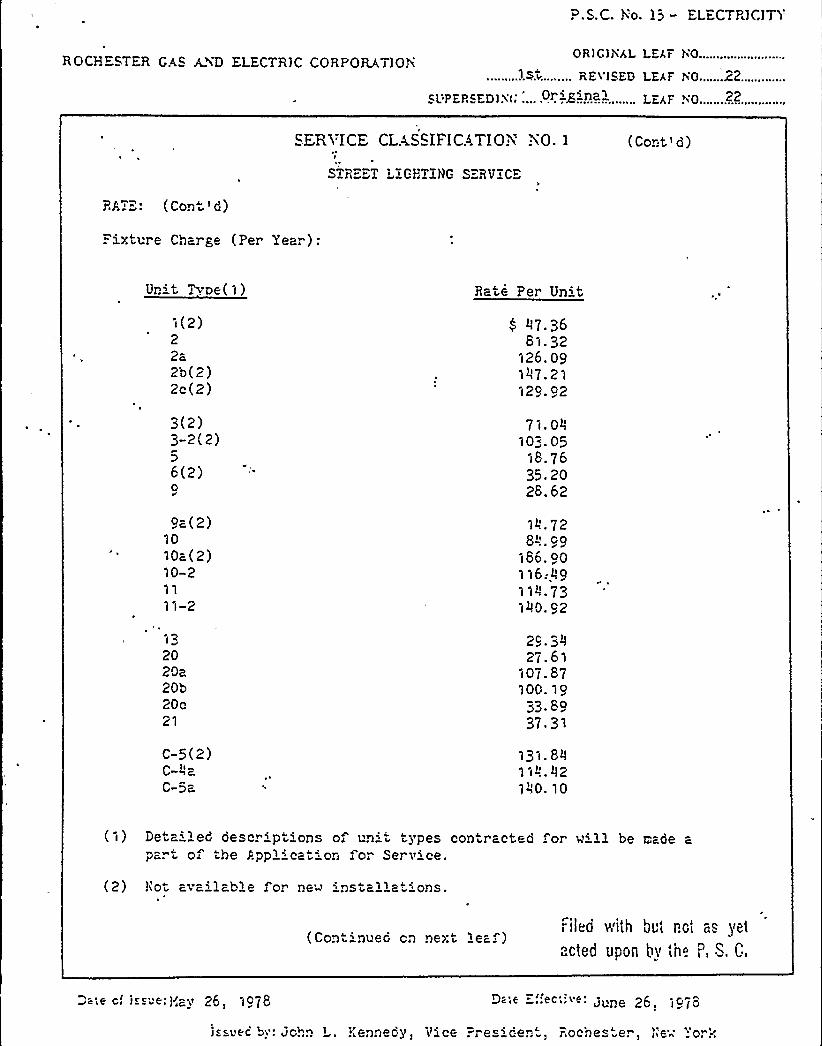
SERA ICE CLA.SSIFICATIOY'0. I (Cont'd)
STREET LZGJ''TING SERVICE
RAT=": ( Con ')."ixture Charge (Per Year):
Un't Tvoe(1) Rate Per Un't
i(2)22a2b(2)2c(2)
4 II7.3681. 32
'l26. 091ll7. 21129. 92
3(2)3-2(2)56(2)0
71. 04103. 05
18. 7635. 2028. 62
9a(2)1010a(2)10-211
1 l-2
10. 728-':.. 99
(86 90»6:49»4.731>0. 92
l32020a20b20c21
C-5(2)C-IlaC-5a
2c. 3II27. 6'I
107.87100. 19
33. 8937 31
131.8'1-"..42
1~0. 10
(1) Deta'led descr'pt'ons of un't types contracted "or w'll be made apart of the Pppl.'cat=:on for Ser v~ce.
(2) ho ava>lable for ne- 'nstalla 'ns.
(Continued cn ne>:t leaf)""i(ed vrith bl,t net as yet
".cted U".on hy the P, S. C,
DelE ci jK UE'; I,av 26 1978 D '~ ='~c"'~: June 26. 1978
i suec '"y: ~ohn L. !:ennec)>, Vice Pres'cent Roches.e. >ie'; 'o."'~
P.S.C. Yo.. I 3 — ELECTRICIT>
ROCHESTER GAS AND ELECTRIC CORPORATION0 R I G I!lAL LEAr YO.....
.........1.st......... REYIGED LEAr r'Q.......23.....
c.l'PERSEDIN'('.„..Q.—..g-..n.al......... LEAF 4'0..........3.....
SERVlCE CLASSIFICATION NQ. 1
S RE T LZGIiTING SERUZCE
(Cont'd)
RATE: (Cont'd)
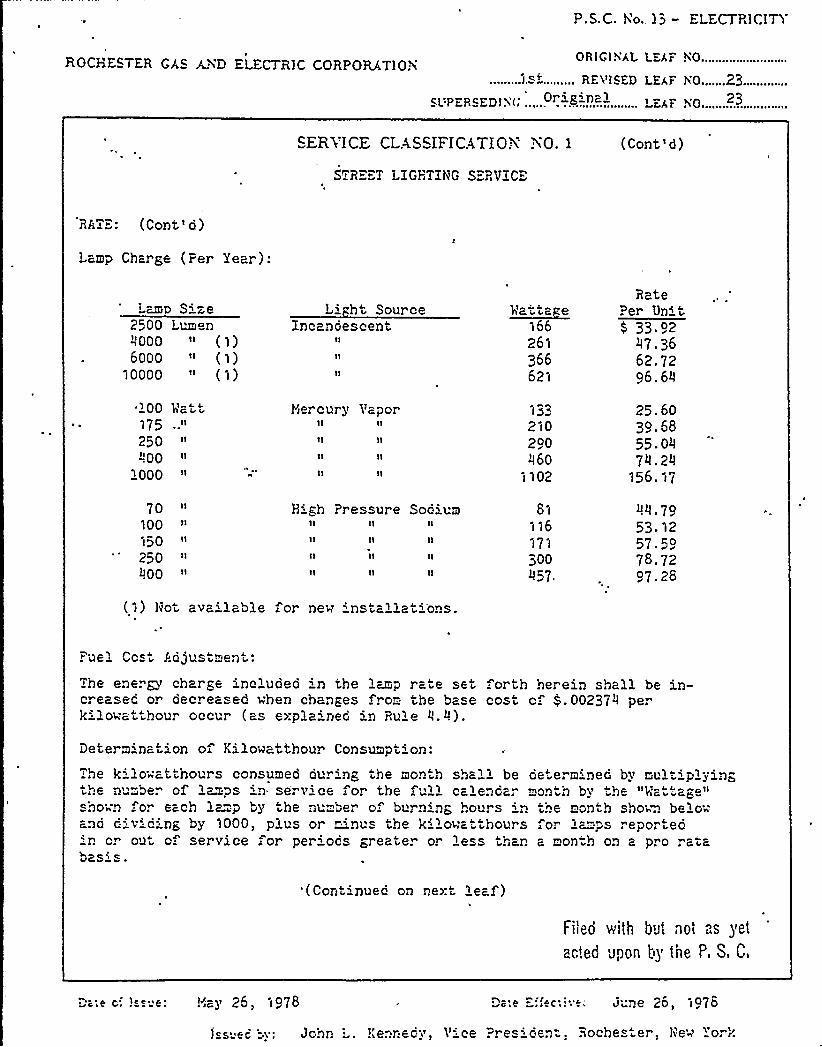
Lamp Charge (Per Year):
Lano Size2500 Lumen"000 'I ( 1)6000 'I (1)
10000 " (1)
Li ht SourceXncandescent
~IlR-:t- e16626I366621
RatePer Unit0 33 92
47.3662.7296.
6I,'oo
Vatt175 II
25Q II
IIQQ
looo
YIercury Vapor11 11
133210290460
1102
25.6039.6855. QII
7II. 2II156. 17
70 Il
10015Q 11
25Q 11
IOQ
Pressure SodiumII II
81116171300457.
I.I!.7953. 12
57.5978.7297.28
(1) Hot ava'lable for new 'nstallat'ons.
Fuel Cost Adjustment
The energy charge included 'n the lamp rate set forth herein shall be in-creasec or oecreased when changes f. on the base cost of $ .00237II perk'lowathour occur (as explained in Rule Il.>).
Determ'nation of Kilowatthour Consumption:~ he kilowatthours consumed dur'ng the month shall be de'erm'ned by multiplyingthe n ~nber of lmvs in serv'ce for the ~ ull calendar mon h bv "Ae "Ma tage"shown for each lamp by he nu ber of burn'ng hours 'n the month sho~~ belowand c'ie'g by 1000, plus or "'us the k' owa "hours ."or lamps reported'n or ou o ser vice or periods greater or less than a month on a prorata
'(Cont'nued on net leaf)
F!)ed vith but not "..s yet
ac!ed JPo!I by the P. 8, C,
cue G: l~~"e'~ay 25, 1978
Jss" ec
D~ e E ''~c;~.'une 26, lG78
Jchn ' !kennedy, Vice 'Pr es'en: I Rochester, hew "ork
P.S.C. Vo. 13 -ELECTR)CITY'OCHESTER
GAS AYD ELECTRIC CORPORATIONOR)CIYAL LEAF YO....
.....,.1.s~.......... REvl&ED LEAF h0..........24....
CL'PERcEDI~'(: .. 0 ig-na-......... I.EAF s'0........2.".....
SERVICE CLAScIFICATIQN YQ
STRE" T LIGHTING S:-RV'|CE
(Con 'd)
RAT"-: {Cont'd)
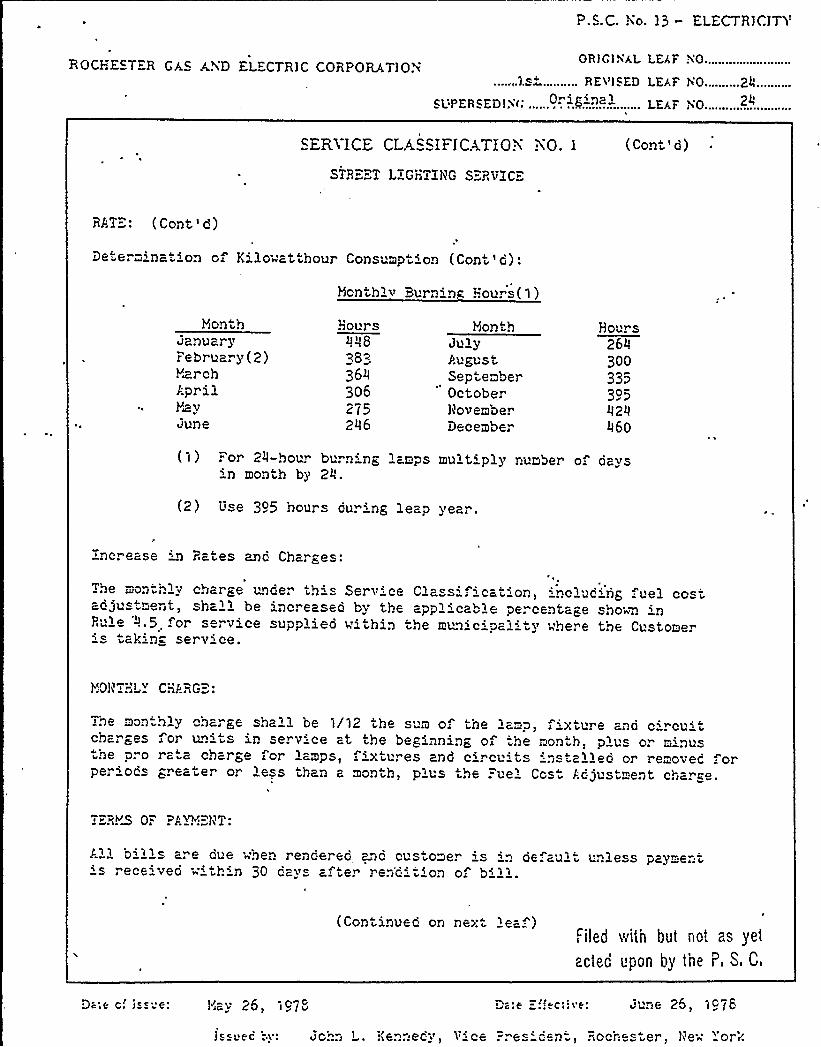
De~e. m nav on of Kilo~atthour Consumption (Cont'o):
Hon hlv Burnin Hours(1)
YionthJanuary".ebruary(2)YwrchaprilYayJune
80UI'S> "83833643062752II6
YiontnJulyPugu stSeptemberOctoberHovemberDecember
Ho'-rs26II30033530502IIII60
{1) .«or 2II-hour bvrn'ng lamps mult'ply number of daysin month by 2'.
(2) Use 395 hours during leap year.
increase Rates anc Cha. ges
The monthlv charge under this Serv'ce Class'f'cation 'nclud'ng .uel costadjustment, shall be increased by the applicable percentage sho'a 'nP~ule '-'!.5 for service supplied within the municipality vhere the Customer' taking se. v'e.
I'.GIANT: L~ CHP.'RG":
The mon.h'y charge shall be 1/12 the sum of the lamp, f'xtvre and c'rcu'tcharges for units in serv'e at the beginning of "he month plus or minusthe pro rata charge for lamps, ixtv.. es and circuits 'nstalled or removed orper'ds greater or ess than a month, pivs the ."-ue'est Adjustment chiarge.
0 '08YMili
Vl bills are oue hen rendered aric customer 's '.. default vnless payment's rece''ved "'thin 30 davs a ter ren'dition of bill.
(Con inueo on next lea )Filed ivith but riot zs yet
acted upoI by the I', S, C,
Yay 25, io78 De 'I c E: i 8 c'a "ne 25, 1o78
Is& 'Pc F: Joh.i L. Kennedy, Vice .. es 'en' .«rochester live„~'or'ii
P.S.C. Yo. 15 - ELECTR)C1TY
ROCHESTER GAS AND ELECTRIC CORPORAT10%ORIGI>4AL LEAF 40...................
......„.1.S>.„....., REVIsED LEAF ~0........2$ ......",-.cI)I ERcEDIi'I: .. O -..G.-:.'-?a.-......... LEAF i0........2$ .............
ER3 ICE CLA.SSII=ICATIQX ~0. 1 (Cont'0)
STREET LXGHTZHG SERVICE,
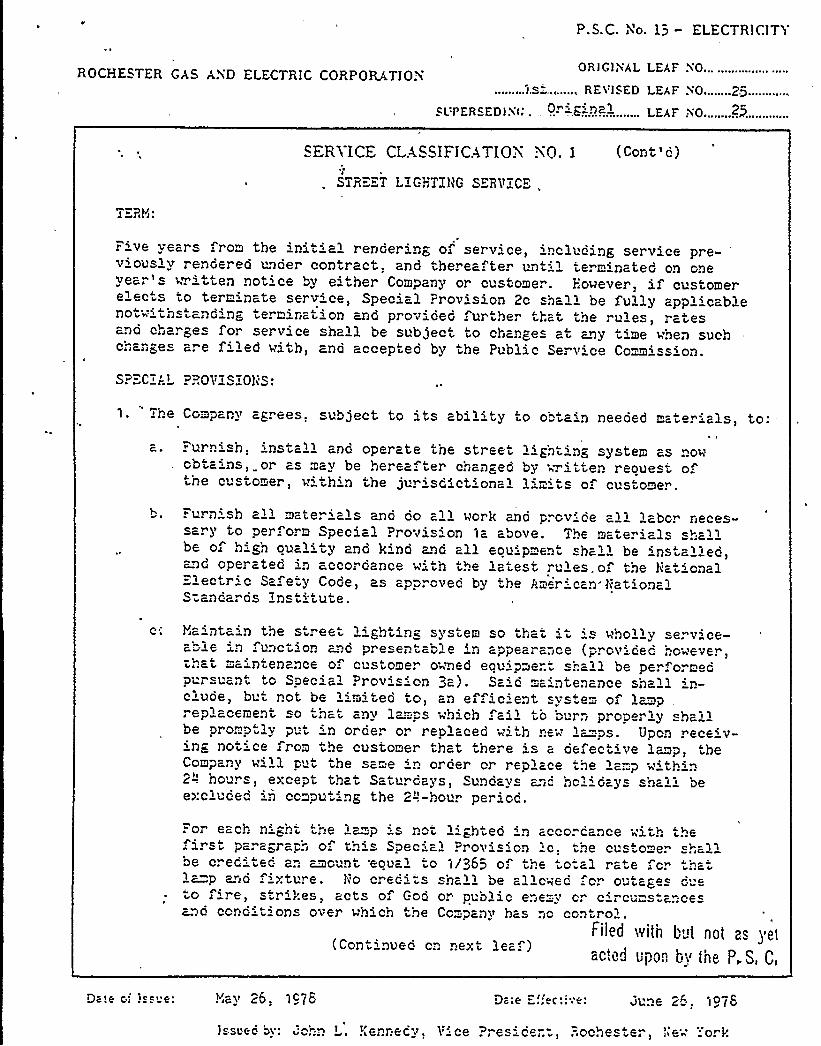
?Y'ive
years from the initial rendering of service, including service pre-'iouslyrendered under contract, and thereafter unt'' terminated on one
year's written Dot'e by either Company or customer. However, i customerelects to terminate serv'ce, Special?rovision 20 shall be fully appl'cableDot« i "ls Da ng t e. Killat" QD cnd provi 060 'l t le that the ules rc tesand charges for service sha~l be subject to chan<es ai any t'me when suchchan>es are f'led with) and accepted by the Public Service Commission.
S?" C:J L ? r,OVZSiOli'S:
Ccmpanv ag. ees, subject to its abil'ty to obtain neeoed materials, to:
c ~ rurnish, install and operate the streetobtains, or a may be herea ter chan<edthe customer ) with'n the jurisd't'nal
-- gh t -Dg sy stem cs Do'n
by n~itten reouest ofli ' of custome..
al 1 mate i al s and OQ cl 1 wor k ana ". Qv'6 al 1 1 aborsary to perform Special?rovis'on 1a above. The materials shallbe. of high puality ana kind ana cll epui pment shell be 'ns all ed~ad operated in accordance "'th the latest ."'les.o. the lpga ional
ectric Safety Code, as approved by the Pmerican'RationalS cnac OS )Ds itui e.
pJ a nta iD t,'
6 s tr6 6 t 1 " $h t i n z $y$ t 6 m s 0 th c t i t, is wh 0 1 1 y s 6 vic 6ab-'6 in -'nCtion end Pl 6Sentcble in cPPec a.)Ce (ProVi Cec ho'«'6V6.
)~hat ma'ntenance of customer o'ned eauipme.".t shall be per;ormed
Special Prov's'n 3a). Sc'd ma'ntenance sh" 11 'D-c'uoe, but r.ot. be limited to, an efficient syste" of 'amp
6p acement so that c Dv lal". s wh ch 'i i 0 burn pl ope ly shalbe promp.lv p)t in oraer or replaced w'th new 1~ps. Upon rece'v-in< notice from the customer that there 's a defect've lamp, theCompany will put the same 'n order or replace the lamp .«" th'n2-"! hours) except that Saturdays, cundays ""c hcl'acys shell beexcluded in computin> the 2-'!-hour perioa.
trQ1Filed with b„)t not ps ~etac!ea UpO.", by tne P,S, C,
(Continuec cn next leaf)
:or ecch ni~ht the l~~p is not lighted 'n accorcance w'th thei. t parae,raph o th'pec=:- Prol'on c) -"he cu tomerbe credi.ec an ~~o nt 'eoucl -o 1/365 o; the ".otal rate ,cr
.ha'p
ana ixture. Ho creci ts shall be allc<ec for outaees d 6to f'e, strikes) acts of Goa or public enemy cr circu stances~ad concitions over which the Company has n)o con
!)av 26 107B Ju )6 2~ 1078
l .suec by: 'chn L. !lennecy, Vice ?res'de;.:) .=.ochester»ew 'ork
P.S.C. Yo. 13 - ELECTR)CITY
ROCHESTER GAS AiD ELECTRIC CORPORATIO>OR IC IiAL LEAF 4 O.........................
......,1.s,~... „... RE> ISED LEAF >O.........~G..........,
FI>PERSEDIs'i: ....,. OriE.-.'.Dal....... LEAF 40.........8..............
SERA ICE CLA.SSIFICATIOi iO. 1 (Con 'd)
STREET LZGHTIh'G S~RVZCE'I
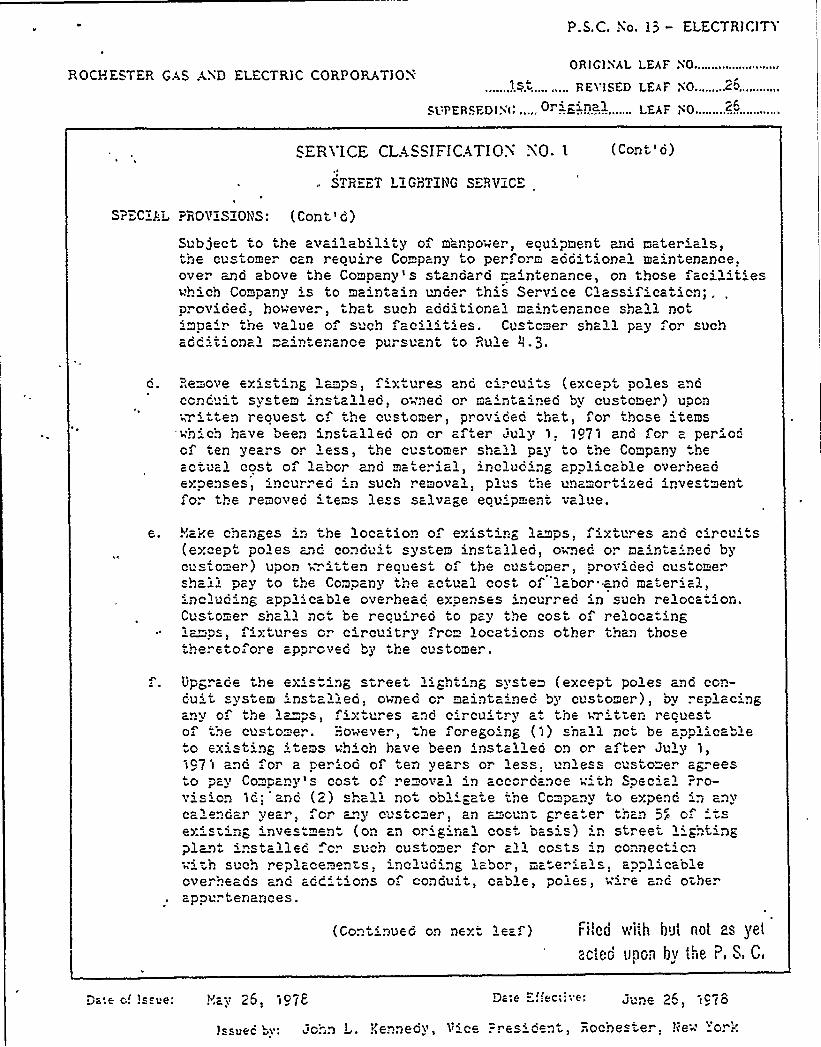
S""C"Ai. P?>OVZSZOÃS: (Cont'd)
Subject to the avci1 ab''y of manpower> ecuipnent and mater'cls,the customer can reou'e Company to perform aoditional maintenance.over a~d above the Company's standard Laintenance, on those facil't'eshhich Company is to maintain Unde? this Service Classificaticn', .
proviGed, hoiN'ever, that such additiona > ma'r.tenance shall ?30tizpa'r the value o s ch fac'lit'es. Custcmer sha11 pay for suchcccii. Gna ma"'D'ncnCB PU, Suant co, U 6
G. Bzove Gxi s in' cmps>
' Ures aqd ci ~cui t s (except Dol Gs aqdco. >c 'i svctem i mstc 1 1 60 0~"16d or mc. >tc. DGG bv cus'mer) UDGD
ten reouest 0 the customer, pro riced th>at, for those 'tems"h'.ch have been 'nstcllec on cr af er uly 1, 1071 ar.d for a periocof ten years or 'ss, the customer shell pay to the Company .heactual cost of labor and material, 'Deluding applicable overheadGXpen 6-
>DCi'. ~ GG iD SUCh . 620Vc.
> p l'S t..6 Unamol t idled DVB tmeni~ 0 the r6mo'vec t 6ms 1 ess s 1 vc e eouipment val'.
e.."lake changes 'D the 1ocation o. exist'D" lamps fixtures and c'rcv.'( except poles an>c conduit syst em iDst a > 160 0'r nec 0. Ha Dtc'ec bycustomer) upon h-.itten recuest of the c's.orner prov'Ged customershal > pav t0 the Company the cc i l al cost of 1 cbor 'DQ mat Gric1'nc Uding app" c" b1e overheac expenses 'ncvrred in such re1ocat'o? .
CUSi G "6. Shc1 1 DG i be BCuired t0 pav ti16 CGS Of relOCc iDg~ 1~~ps> f'xtures cr circuitry rom locations other than> those
theretofore apprcvec by the customer.
UPe,. cc6 the GX'S in/ Street 'ighting SyS> em (eXCePt POleS c, 3d CGin-cu't system 'ns alled> owned or maintainec by customer) bv replacingcnv 0-'i>6 azPS . 'tl'res c Dc c 'cu 'ry a'he hri tr Bn recuestof the cus orner..-'.Oaeve.
>the foregoing ( >) snail no be app>'cab>e
o existing, 'tems hhich have been installed on or after July 1>
i 71 anQ or a per'od of ten years or 1ess, un1ess custome. agreeso pay Company's cost of re oval 'D accor dance "'th S Gcial ."ro-
vision )c.: 'and (2) sha11 not obli-ate tne Ccmpcny to Gxpenc in anvc cCa G..Gc?'ea;
>i 01" c~y CUSi 0 er, ar> amGUD ~. Ga Br thiaD r> 0' S
Gxis iin~ 'vestmen. (on an ori ginal cos". bas') ' stree-pl~a 'nstallec cr uch cu ~orner or a1'osts in connec 'cn
uch rep1 ccemen '>
s n 1udinhr 1 abQr>
ma" e. ' 'l s>
aggl '. ccbl 6
Gve hec Qs c'1c cQcii 0 .s 0 coDGui ccble po '>
hir6 anc 07 he.appvrtenances.
(Co.>tiDUGG Gn next 16a ' Filed v;i';h hei not as yet
BCICG IIDO;I bV '.:">e I, S, C,
D~:e 0! >Be>!e: !'.Gy 26, >078 Dele E;eci>eel june p6 >c78
1ecl>ee +V: >'Ghn I . l>ennedy 3'iCc, rGSi Gent>
OCDBS er'> J>>G 'r
1).S.(:. Ni). jP — CiAS
ROCHESTER GJ S A4D ELECTR1C CORPORATIO.).......5..ill.......... RE'V')SED LEAF 40.........LO...,
sl:PER<ED)iG .........ro................... LEAF ).0.........~0.....
4 ih Reviseo Lea ho. 40 Pena'no
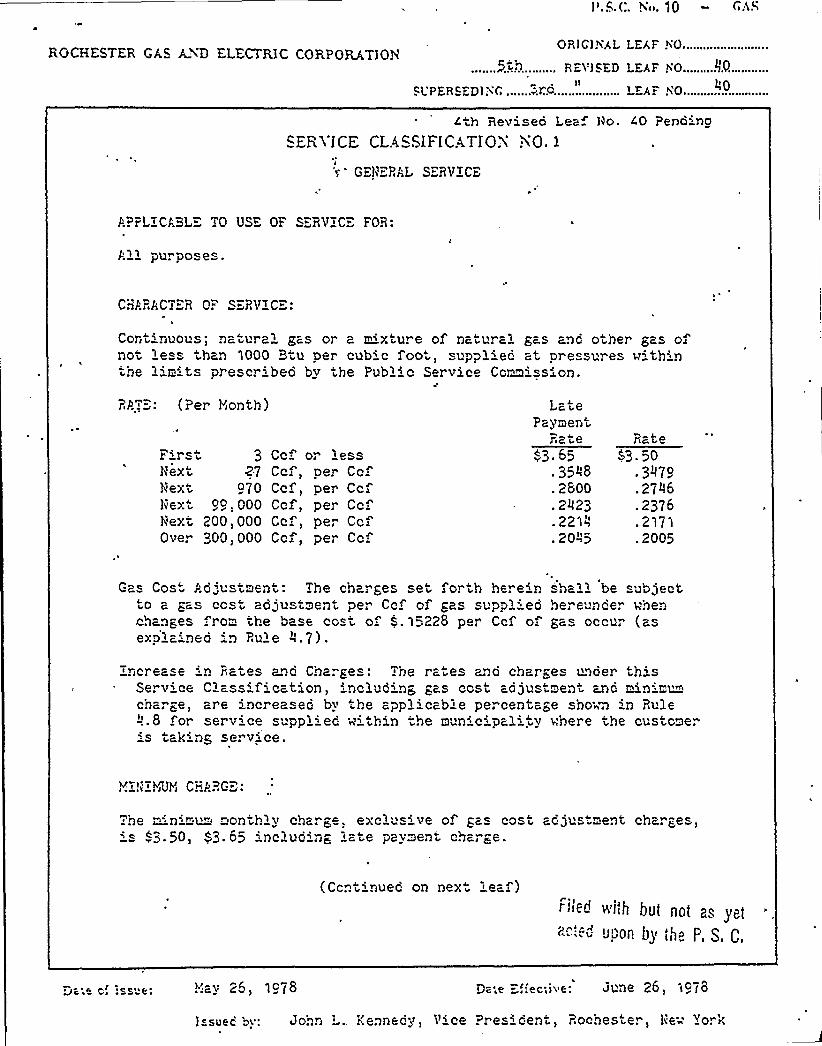
SERi ICE CLA.SSIFICATIOX YQ. 1
GEN.RPL SERViCE
P.PPLiCABLE TO USE OF SEPViCE FOR
P11 purpoc es
CHF.'RPCTER OF SERViCE:
Coritinuous) natur21 gas or 2 mixture of natural gas 2no other gas oinot 'e than 1000 Btu per cub' foo, supplied at pressures vithinthe l'm's prescribed by the Public Service Commission.
RP.! (Per Honth)
First 3Next Z.7
Next G70Next 99)000Next 200)000Over 300) 000
CcCcf)Ccf,Ccf,Ccf)Ccf)
or lessper Ccfper Ccfper Ccfper Cc.per Cc.
1atePaymer t,
Rate:3. 65
. 3548
. 2800
. 2023
. 22 ls20 "5
Rate53. 50
3~79.2706.2376. 2'l7 l
.2005
Gas Cost Pd„'ustment: The charges set forth hereinto a ~as cost adjustment per Cc of gas suppl'dchanEes .rom the base cost of $ . 15228 per Ccf ofexo'lained in Ru1e A.7).
sha" l be subjecthereuncer whengas occur (as
increase 'n Rates ano Charges: .he rates 2nd charades unoer thisSe. vice C ass'ication, includinp, gas cost adjustment 2nd minimumchar~e, are increased by ..he applicable pe. centare sho'n~ 'in Rule>.8 "or service suppliec nithin the municipal::ty where the customeris tak'ng service.
Yi!i'Yii3YiCHPRG
~ he miinimu" month'y charge exc'us'e of gas cost ad)ustment cha. ".es's ~3.50, $3.65 includin< 1a e payment char~e.
(Ccritinued on nex i eaf)Priled v ith but not as yeta..!-:„. u.'on by the P, S C,
Jc16 Ci !SS" ~ ! ..ay 26, i9 ~8 i qc jv~ June 26)
1 suec by: John L., Kennedy, V'ce Presicent, Rochester, Ne 'rr',
RCtCHESTER Ghc AYD ELECTRIC CORPORATION....5 ..'n.
cUPERcED) YG ...~.'.c
OR)GlhhL LEAF hO................
REJOICED LEAF NO, "!Z
...................... LEAF hlO
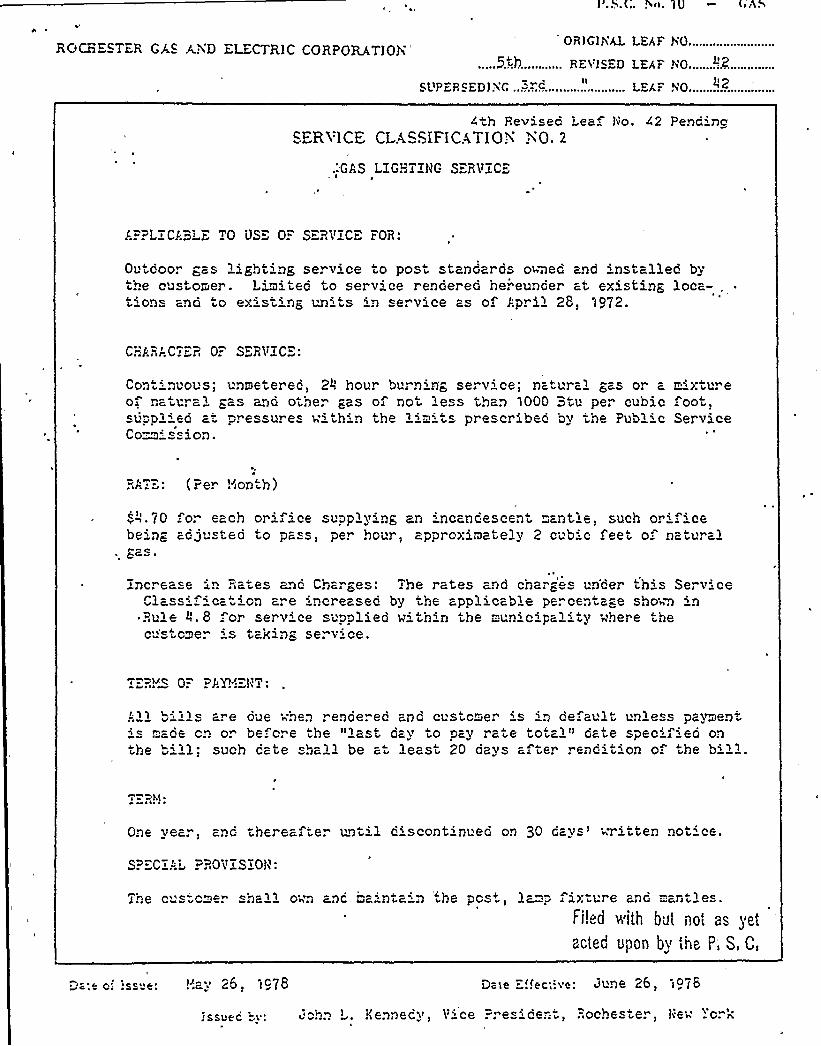
4th Revised Lea IHo. 42 PendincBERVlCE CLACSIFICATIOY YO
.:GAS LXG™ ZHG SERVi'C""
j. PLYCSBLE TO US" 0." SERVICE FOR:
Outcoor gas iight'ng ser vice to post standar ds owned and installed bythe customer. Limited to serv'ce rendered he. eunder at existing loca-t'ons and to existing units in service as of J-'.pril 28, 1972.
C::P.. '.CTiR O.. S"RVTC"
Continuous; unmetered, 2'our burnin'g service; natural gas or aoa natural gas and ot'ie. gas of not less than 'l 000 ~tu per cub'Opplied at p. e res w'thin the lim' prescribed 'oy the Public
C ommi s s ion ~
~'xtureOo~
Ser vice
RAT=-: (Per !'month)
„'~. 70 or each orif'e suppi ying an 'ncancescent -ant le, such orificebeing adq steo to pass, per hour, approximately 2 cub'c feet o natural
inc. ease ' Rates ~ad Charges: The rates and char<es un'der this ServiceClassi ication are increased by the applicable percentage shown inRule ll. 8 or serv'e supplied wi th'n the municipality where thec'ver 's taking serv'ce.
tP& hrc 0 h 'PP+Jw)$ %
!11 b'iis are due when rendered and customer 's in de ault unless paymen-is mace cn o. be o. 6 the "last dav 0 pay rate
total�
'~ Gat 6 specifi 6Q onthe b'll: suc» cate shall be at least 20 oays after renci 'on o. he b'll.
s i 'Ph',
One vear, and thereafter until c'scontinued on 30 days'ritter. not'e.
SP".C:AL:ROV r SZOI'.
Th6 CuS Ome. S "ia" 1 OWn a;iC Lai nta 'e POS r 1c - s ix ure and mant 16S
F'iit'.d with but i~ot ac yetact8d Upoll bv tilB P) S) C<
!';ay 25, 1978
IssUec hy: Yiennecv
D-ie E!~ac;:.ve: dune 26, io78
Vice ."res'en-'., Rochester Iiew 'ork

4
+n '
I
P
I
k\f
Y
jl'
L
I,l
V
N
4 ~I4
I
i
1;
Y =
C
V
V1 p
'+..l~ttg
T
Rochester Gas and Electric Corporation
Direct Testimony
of
WILLIAMW. STODDART
Assistant Division ManagerGeneral Accounting Department

0
Stoddart
Qo
A:
Would you please state your name and business address?
My name is William W. Stoddart. My business address is
Q-
89 East Avenue, Rochester, New York 14649.
Mr. Stoddart, what is your position with Rochester Gas
10
A:
Qe
A:
Q-
and Electric Corporation?
I am Assistant Division Manager of the General Accounting
Department.
How long have you held that position?Since 1970.
What are the duties and responsibilities of thatposition?
12 A: I- am responsible for coordinating the activities of the
13
14
General Accounting Department relative to the collectionand preparation of data utilized to maintain the financial
15 records of the Company. The Property Records, Stores
16 Records, Accounts Payable, Payroll, Accounting Control17
18
19
20
21
22
Q ~
A:
Q ~
and other General Accounting functions come within the
scope of my responsibilities.How long have you been employed by the Company?
Approximately 19 years.
Will you briefly outline your experience .and quali-fications?
23
24
A: I am a graduate of the State University of New York atBuffalo. In 1959 I was employed by the Company as an

J'
Stoddart
10
Q ~
A:
Q ~
accountant in the General Accounting Department.
Subsequently I have held the position of Corporate Tax
Representative and now my present position.Mr. Stoddart, are you generally familiar with the
requests for additional revenue in the Company's
electric and gas filings?Yes, I am.
Have you prepared certain exhibits of a financial and
accounting nature in conjunction with and support ofthese proposed increases?
12
13
14
15
16
17
18
20
21
22
23
24
A:
Q ~
A:
Q-.
Yes. Exhibits l through 7 were prepared by me or under
my supervision and direction utilizing data taken from
the books and records of the Company.
Will you describe Exhibit 1 and state what it purportsto show?
Exhibit l sets forth the comparative balance sheets forthe Company as of December 31, for the yeax;s 1974,
l975, 1976 and 1977, in the form prescribed by the
Commission. These balance sheets are stated on a
corporate basis and include data applicable to all ofthe operating departments of the Company.
Does the Company maintain its accounting records inaccordance with the Uniform System of Accounts prescribed
by the Commission?

I
Stoddart
A: Yes.
Qo Are there any particular accounts upon which you wish
to comment?
A: The balances in account 101, Electric Plant in Service,
10
12
13
14
15
16
17
increased by $ 81<540,839 over We three year period.The majority of the plant additions have been for theCompany's transmission and distribution system to meet
ll
the reliability and growth needs of our system. During
1977 there were also major additions to our nuclearproduction plant.
The balances in account 101, Gas Plant in Service,increased by $ 4,000,985 between December 31, 1974 and
December 31, 1975, decreased by $ 1,499,088 between
December 31, 1975 and December 31, 1976 and then
increased by $ 4,492,009 between December 31, 1976 and
December 31, 1977. Plant additions for the three-yearperiod were for improvement of distribution facilitiesnecessary to assure reliability of service and for
19 continued improvement in safety standards. The decrease
20
21
22
23
24
at, December 31, 1976 reflects the retirement from
service of the Company's gas manufacturing'acilitiestotalling $ 5,350,924.
Account 118.1, Common Utility Plant in Service,consists of office buildings, operations and service

Stoddart
centers and transportation, tools, office,'ommunications
and other equipment. The amounts applicable to the
Electric Department are shown in Exhibit 6 and the
amounts applicable to the Gas Department are shown in
Exhibit 7.
6 The balance in Account 105, Plant Held for Future
10
12
13
Use, is made up of $ 306,365 representing land located
south of the City of Rochester and $ 33,765 representing
land located adjacent to Station 'N5. The current
balance in this account is applicable to the ElectricDepartment.
The Electric Department portion of accounts 107
and 118.1, Construction Work in Progress, at December 31,
14
15
1974, 1975, 1976 and 1977 was $ 36,757,449, $ 77,134,659,
$ 118,228,084 and $ 158,673,781, respectively. The
16 increases 'in this balance through December 31, 1977
18
primarily, reflect the Company's share of expenditures
incurred for three new generating facilities. Expenditures
19
20
21
22
23
24
for licensing and preliminary engineering for its 28%
interest in the 1150 MW nuclear plant to be located inSterling, New York and to be owned by the Company
jointly with Niagara Mohawk Power Corporation, Orange
and Rockland Utilities, Inc. a'nd Central Hudson .Gas and
Electric Corporation amounted to $ 29,054,512 including

0
Stoddart
fuel at December 31, 1977. The Company is also participating
10
in the ownership of two Niagara Mohawk generating
stations: Oswego N6, an 850 MW fossil unit in which
the Company will have a 24% ownership interest and,Nine
Mile Point 42, an 1100 MW nuclear unit in which the
Company will have a 14% ownership interest. Expenditures
on these two units through December 31, 1977, includingfuel, totalled $ 43,589,026 and $ 54,774,342, respectively.
The Gas Department Construction Work in Progress
balance at December 31, 1974, 1975, 1976 and 1977 was
$ 1,645,707, $ 1,228,345, $ 1,255,286 and $ 1,395,385. The
12 lower balances in 1975 through 1977 compared to 1974
13
14
are due primarily to reduced distribution main construction.There are also small balances of Common Utility
15 Plant — Construction Work in Progress applicable to the
17
Electric Department and Gas Department. These amounts
are shown in Exhibits 6 and 7, respectively.18
20
21
22
23
24
Account 114, Plant Acquisition Adjustment, does
not appear in the balance sheet at December 31, 1974.
.At that point in time, $ 3,132,171, representing the
value of certain water rights on the Genesee River
which were acquired on June ll, 1904 in the consoli-dation of Rochester Light and Power Company and Rochester
Gas and Electric Company, was reflected in Account 101,

J
Stoddart
I'Plant in Service. The Commission ordered the Company,
,in a prior Electric rate case, Case 26522," to begin
amortizing these water rights over a forty year period.
The Company transferred the $ 3,132,171 to Account 114,
Plant Acqusition Adjustment, on January 1, 1975 and
commenced amortization in accordance with the order inCase 26522. The balances are applicable to the ElectricDepartment,.
10
The balances in Account 120, Nuclear Fuel, atDecember 31, 1976 and December 31, 1977, represent the
12
original cost of the nuclear fuel components for the
Ginna nuclear plant. The balance at December 31, 1974
includes the Company's share of prepayments for nuclear
14
15
fue'1 applicable to the Sterling nuclear plant in theh
amount of $ 438,167. The balance at December 31, 1975
includes the Company's share of prepayments for nuclear
17 fuel applicable to the Sterling and"'Nine Mile Point
18 nuclear plants in the amounts of $ 736,120 and $ 1,131,017,
19 respectively.
20 The balances in Account 120.'5 reflect the accumulated
21
22
provision for amortization of fuel applicable to Ginna
Station.
23 Qo Turning now to Account 108, Accumulated Provision for24 Depreciation of Electric Plant in Service, will you

Stoddart
A:
comment on the balances shown?
Accumulated Provision for Depreciation of ElectricPlant in Service was $ 109,396,951 at December 31, 1974
and $ 138,106,010 at December 31, 1977. The ratio ofthis provision to Plant in Service at December 31,
10
12
13
14
1974, 1975, 1976 and 1977 was 25.0%, 25.7%, 26.6% and
26.'6%, respectively.Account 108, Accumulated Provision for Depreciation
of Gas Plant in Service was $ 33,663,094 at December 31,
1974 and $ 35,049,799 at December 31, 1977. -The ratioof this provision to Plant in Service at December 31,
1974, 1975, 1976 and 1977 was 23.0%, 23.2%, 21.3% and
22.8%, respectively. The reduction in this account
from December 31, 1975 to December 31, 1976 reflects15
16
the retirement of the Company's gas manufacturing
facilities in the amount of $ 5,350,924.
19
20
Depreciation accruals are provided by applying
1/12 of the annual depreciation rates to the monthly
book balances of the primary plant accounts. The
Company reviews annually its rates used for depreciation21
22
23
24
accruals. Depreciation studies are made each year tohelp the Company gauge the appropriateness of its book
accruals. These studies are based, in part, on an
actuarial analysis of plant history to -determine average
Stoddart
service lives. The annual accrual rates used are based
upon these actuarial studies, salvage studies, theoretical
6
10
12
13
14
A:
reserves and managerial judgment. These studies have
been regularly made available to the staff of the
Commission. The balances shown in Exhibit 1 result
from accrual rates approved by the Commission in several
proceedings, commencing with Case 16510 through, most
recently, the Company's last electric and gas rate
cases, Cases 27108 and 27109.
Would you please continue with your explanations of
this exhibit?
The balances in Account 123.1, Investment in Subsidiary
Companies, represents our investment in Canadea Power
Corporation computed under the equity method of accounting.
The Company adopted the equity method of accounting for
16
18
19.
20
21
22
23
its investment in this wholly-owned subsidiary, effective
January 1, 1973, pursuant to the Federal Power Commission
Order No. 469.
Account 131, Cash, has fluctuated between a high
balance of $ 5,912,089 and a low balance of $ 4,844,109
at the year end dates shown in the exhibit. The variations
in cash balances between balance sheet dates occur forseveral reasons such as cash collections, bill payments
24 and prospective bills due and compensating balance
Stoddart
requirements. These changing conditions are reflectedin the balances shown.
Account 133, Dividend Special Deposits, represents
funds on deposit for payment of dividends on common and
preferred stock. The balance in this account increased
$ 322,079 between December 31, 1974 and December 31,
1975. This increase primarily reflects the increase in
10
dividends due to the October 1975 sale of 220,000
shares of preferred stock. The balance in this account
decreased by $ 1,622,729 at December 31, 1976. This was
12
caused by eliminating a one month lag in reporting ofdisbursements by the disbursing agent which was reflected
13
14
in the prior year balances. The increase in thisbalance of $ 27, 782 at December 31, 1977 primarily
15 reflects the issuance of 1, 000, 000 shares of common
16
17
18
19
20
21
22
stock on September 29, 1977.
The balances in Account 134, Other Special Deposits,
at December 31, 1974 and 1975 reflect funds advanced by
the participants in the Sterling nuclear unit for itsconstruction. The balance at December 31, 1976 representsa deposit in lieu of mortgaged property sold. The
~ large increase at December 31, 1977 represents the par23
24
value, call premium and accrued dividends on the Company's
Series "0" preferred stock which was called for redemption
Stoddart
'subsequent to a request. by the Company and approval by
the Commission in Case 27269. These amounts totalled
$ 28,131,950.
Account 142, Customer Accounts Receivable, decreased
by $ 2,161,285 from December 31, 1974 to December 31,
1975, increased $ 10,485,155 at, December 31, 1976 and
10
then decreased by $ 3,064,937 at December 31, 1977.
These changes were due primarily to the variance insales in the month of December of each year. For
instance, December 1977 sales were approximately $ 3,000,000
lower than December 1976 sales which, in turn, were
12 over $ 10,000,000 higher than December 1975 sales.
13
14
Account 143, Other Accounts Receivable, increased
by $ 1,026,617 to $ 1,119,364 at December 31, 1975 and
15
16
then decreased to $ 318,287 and $ 105,994 at December 31,r
1976 and 1977, respectively. The l975 and 1976 balancesr
primarily related to amounts due from other utilities18 participating in the construction of the Company's
19
20
21
Sterling nuclear generating facility.r
The balances in Account 144, Accumulated Provision
for Uncollectible'ccounts — Credit, have increased by
22
23
24
approximately $ 97,000 in 1976 and $ 250,000 in 1977.
The Company determined that this provision should be
increased due to increases in the amount of customer
10
Stoddart
10
Qe
A:
billings and its history of uncollectibles. Prior to
1976 the Company had maintained the reserve at the
$ 100,000 level for a considerable number of years.
Would you please continue with your explanation of this
exhibit?Account 150, Materials and Supplies, increased by
approximately $ 2,660,000 from December 31, 1974 to
December 31, 1975. This net increase was due primarily
to a $ 3,360,000 increase in fuel stock due to higher
unit costs and a $ 700,000 decrease in other materials
and supplies. The balance in this account decreased- by
12 approximately $ 1,467,'000 at, December 31, 1976 due
13
14
15
16
17
18
20
21
22
primarily to a decrease in fuel stock, while the balance
at December 31, 1977 increased approximately $ 303,000
due primarily to an increase in other materials and
supplies.
The balances in account 165, Prepayments, decreased
approximately $ 200,000 at December 31, 1975 and $ 11,000
at December 31, 1976. The balance increased approximately
,$ 280,000 at December 31, 1977.
The 1975 decrease resulted from the elimination of
a prepayment of $ 262,000 for poles offset by an increase
23
24
in prepayments for insurance under the Employees Welfare .
Association Plan and general insurance. The increase

j
I~ . ~
'
Stoddart
10
12
13
14
15
16
17
19
20
21
22
23
at December 31, 1977 results primarily from increases
in general insurance. Excess public liability insurance
premiums, for instance, doubled during 1977 due to
general premium increases and our recent experience of
claims reserved and paid by our insurance carriers.
Account 181, Unamortized Debt Discount and Expense,
has increased from December 31, 1974 to December 31,
1975 by $ 302,283 reflecting a change in method of
reporting. Prior to the latter date Unamortized
Discount was included in Account 181. However, effective
with that date, it is now reported in Account 226.
Likewise, Unamortized Premium on Debt, previously
reported in Account 251, is now reported in Account 225
as shown on page 2 o'f this exhibit. The further increases
in the balance of this account at December 31, 1976 and
December 31, 1977 reflect $ 514,600 of expense incurred
in the issuance of $ 50,000,000 of Series BB 9 1/4%
bonds in June 1976 and $ 896,700 of expense incurred in
the issuance of $ 50,000,000 of Series CC 8 3/8't bonds
in November 1977.
Account 183, Preliminary Survey and Investigation
Charges, decreased from a balance of $ 1,796,503 at
December 31, 1974 to $ 1,159,495 at December 31, 1975
24 and then increased to $ 1,604,033 at December 31, 1976e
12

4
Stoddart
10
and $ 2,304,943 at December 31, 1977. Expenditures
incurred in obtaining environmental certification of
our proposed 765 KV transmission line comprised a large
portion of the balance in each year shown. The December. 31,
1974 balance also reflects substantial expenditures
incurred to review piping system designs at Ginna Station.
The balance in Account 186, Miscellaneous Deferred
Debits, increased from a balance of $ 3,851,923 at,
December 31, 1974 to $ 3,895,452 at December 31, 1975,
then decreased to $ 3,807,897 at December 31, 1976 and
increased to $ 6,665,154 at December 31, 1977. Of the
12
13
14
15
16
17
19
20
21
$ 3,851,923 balance at December 31, 1974, $ 3,736,605 isapplicable to fuel costs deferred resulting from the
adoption of deferred fuel cost accounting by the Company
in 1974, in accordance with the Statement of Commission
Policy Concerning Fuel Adjustment Clauses of ElectricUtilities. The Order in Case 26547 extended the accounting
provision to Steam Utilities.The balances of $ 3,895,452 at December 31, 1975,
$ 3,807,897 at December 31, 1976 and $ 6,665,154 at
December 31, 1977 further reflect the Commission's
22 ~ Opinion No. 75-10 issued May 1, 1975 together with a
23
24
Resolution adopted April 29, 1975 whereby 16 NYCRR 270
was changed to require a surcharge-refund provision for

P
N
il 4 II
'1
Stoddart
over or under-recoveries of Gas Adjustment Clause
Revenues. Also included in the latter three balances
are Steam Department deferrals arising from a reduction
in fuel cost adjustment revenues which are being amortized
pursuant to the Commission's Order in PSC Case 26766.
These items together with the aforementioned fuel cost
deferrals total $ 3,739,009 at December 31, 1975, $ 3,451,627
10
12
13
14
15
16
17
18
19
20
at December 31, 1976 and $ 6,338,424 at December 31,
1977.
The deferred Federal income taxes applicable to
the deferred steam fuel currently being amortized are
likewise reflected in the December 31, 1975, 1976,and
1977 balances in Account 253, Other Deferred Credits,
in the respective amounts of $ 1,016,200, $ 902,800 and
$ 779,100.
Account 190, Accumulated Deferred Income Taxes,
has a balance only at December 31, 1976 and December 31,
1977. The balance at December 31, 1976 reflects deferred
tax accounting applicable to Contributions in Aid ofConstruction, in accordance with the accounting prescribed
21
22
by the Commission in PSC Case 26848 and 26849, and to
over-recoveries of Gas Adjustment Clause Revenues. The
23 balance at December 31, 1977 increased $ 3,424,600 from
24 December 31, 1976 including a $ 3,346,000 deferral

Stoddart
10
12
13
14
15
16
18
19
20
21
22
23
24
A:
representing the adoption of deferred tax accounting
for nuclear fuel storage costs. This change will be
further described in Exhibit 8. The remainder of the
balance primarily reflects deferred tax accounting
applicable to Contributions in Aid of Construction.
Turning to Page 2 of this exhibit, will you continue
with your comments?
Account 201, Common Stock Issued, has increased from
$ 47,346,950, at December 31, 1974 to $ 54,399,465 at
December 31, 1975, then increased to $ 56,830,555 at
December 31, 1976 and $ 64,448,155 at December 1, 1977.
Credits to this account from common stock issuances
during this period from new offerings and under our
Automatic Dividend Reinvestment Plan were: 1974,
38,511 shares for $ 192,555; 1975, 1,126,457 shares for
$ 5,632,285; 1976, 159,784 shares for $ 798,920 and 1977,
1,182,536 shares for $ 5,912,680.
Stock dividends were issued totalling 274,690
shares in 1974, 284,082 shares in 1975, 326,398 shares
in 1976 and 340,984 sh'ares in 1977. Transfers from
Unappropriated Retained Earnings in connection with the
stock dividends were credited to this account in the
amount of $ 1,373,450, $ 1,420,410, $ 1,631,990 and $ 1,704,920
for the years 1974 through 1977, respectively.
15

Jl
PI I
Stoddart
10
12
13
14
Account 204, Preferred Stock Issued, increased by
$ 22,000,000 from December 31, 1974 to December 31,
1975, increased an additional $ 3, 000, 000 to December 31,
1976 and then decreased $ 24,720,000 at December 31,
1977. These changes reflect the sale of 220,000 shares
of Series 0, 11% preferred stock in October 1975, the
delayed sale of an additional 30,000 shares of Series 0
preferred stock in March 1976 and the announced call ofthe Series 0, 11% preferred stock and sale of 280,000
shares of Series A, 7.60% preference stock, par value
$ 1, in December 1977.
As a result of common stock issuances during thisperiod from new offerings and under our Automatic
Dividend Reinvestment Plan, Account 207, Premium on
15
16
17
19
20
21
22
23
24
Capital Stock, was credited with the following amounts:
1974, $ 301,889; 1975 $ 11,625,384; 1976, $ 1,826,515 and
1977, $ 18,666,651. Transfers from Unappropriated
Retained Earnings in connection with the stock dividends
were credited to this account as follows: 1974, $ 3,570,970;
1975, $ 1,704,492; 1976, $ 3,590,328 and 1977, $ 5,114,760.
An amount totalling $ 27,720,000 was also credited tothis account in 1977 as a result of the issuance ofpreference stock.
The balances in Accounts 211, Miscellaneous Paid
16

t gi" ~
Stoddart
in Capital, and 216.1, Unappropriated Undistributed
Subsidiary Earnings, reflect equity accounting for the
Company's investment in Canadea Power Corporation.
The increase in the debit balance of Account 214,
10
Capital Stock Expense, from December 31, 1974 to December 31,-
1976'reflects the expenses of issuance of common and
preferred stock and for stock dividends during thatperiod. The increase in this balance from December 31,
1976 to December 31, 1977 primarily reflects a $ 2,750,000
call premium on the Series 0, 11%, preferred stock and
12
$ 105,008 issuance cost of the Series A, 7.60% preference
stock. These amounts, totalling $ 2,855,008, will be
13
15
16
17
19
20
amortized in equal'nnual installments to the maturityof the Series A, 7.60% preference stock in 1985 as
authorized by the Commission in Case 27269.
The increases during the past two years in the
balances of 'Account 221, Bonds, have resulted from the
sale of $ 50,000,000 of 9 1/4% Bonds in June 1976 and
$ 50,000,000 of 8 3/8% Bonds in September 1977, offsetby the redemption of $ 333,000 of 10 3/4% Bonds and
21
22
$ 6,000,000 of matured 4 1/2% Bonds in August and September
1977, respectively.23 The balances in Account 224, Other Long Term Debt,
24 represent the non-current liability for deferred purchase
17

yl
Stoddart
contracts for land at Sterling.The balances in Account 225, Unamortized Premium
on Debt, and Account 226, Unamortized Discount on Debt,
reflect a change in the method of reporting as stated
previously in my explanation of Account 181, Unamortized
Debt Discount and Expense. The increase in the balance I
of Account 225 at December 31, 1976 reflects the premium
received from'the sale of bonds in June 1976 in the
10
amount of $ 117,500.
The balance in Account 231; Notes Payable, fluctuates
12
13
14
15
16
18
20
21
22
24
between $ 9,000,000 and $ 21,500,000 at the balance sheet
dates shown. When it is necessary for us to go intothe open market to obtain funds, we first issue eithercommercial paper which generally matures in 30-45 days
or notes to banks which usually mature in 9 months.
Subsequently, we issue long-term securities and use the
proceeds to the extent necessary to extinguish the
outstanding short-term borrowings. This procedure
provides us a degree of flexibility in the timing oflong-term financing.
The balance in Account 232, Accounts Payable, was
$ 9,286,801 at December 31, 1974. The balance increased
by $ 3,469,850-during 1975 with $ 1,756,617 of thatincrease representing the Company's obligations in
18

"F
Stoddart
10
jointly owned generation facilities. The balance
increased an additional $ 3,371,395 during 1976. This
increase was primarily due to an increase of $ 3,077,575
in the balance payable to the Company's natural gas
supplier and an increase of $ 996,399 in the balance
owed for coal, freight and demurrage. During 1977, the
increase of $ 618,517 was caused primarily by an amount
payable of $ 2,997,148, representing a liability forrepayment of nuclear materials to Combustion Engineering
Corporation, coupled with decreases of $ 2,195,443 and
12
$ 597,020 in the balances payable to various coal companies
and to our natural gas supplier, respectively.
13 The balance in Account 236, Taxes Accrued, increased
14 from $ 2,427,741 at, December, 31, 1974 by $ 4,077,033 to
15 $ 6, 504, 774 at December 31, 1975, decreased by $ 3, 545, 499
16
17
19
20
21
22
23
in 1976 and then increased by $ 1,651,680 at year end
1977. The changes in the balances in this account over
the period shown are due primarily to changes in Federal
income tax accrued, which, at December 31, 1974, was
approximately $ 6,700,000 lower than the prior year.
The Company operated at a tax loss for the year 1974
and accrued a negative income tax which, together witha March 1974 payment on the 1973 Federal income tax
24 liability, caused the decrease in this account during
19
Stoddart
4
1974. The balance in this account at December 31, 1975
was approximately $ 4,000,000 higher than 1974 reflectingcurrent year accruals offset by refunds applicable to
the 1974 loss of $ 630,000. The balance at December 31,
1976 was approximately $ 3,750,000 lower than 1975 due
10
12
13
14
17
18
19
20
21
22
23
24
to investment tax credit carrybacks to prior years,
refunds received applicable to 1974 and 1975 and a
March 1976 payment on our 1975 income tax liability.The December 31, 1977 balance in Federal income tax
accrued increased approximately $ 1,650,000 reflecting1977 accruals offset by refunds applicable to previous
years.
Taxes accrued other than Federal income taxes
increased over this period from a balance of $ 1,393,873
at December 31, 1974 to a balance of $ 1,714,594 atDecember 31, 1977. Balances at December 31, 1975 and
1976 were $ 1,509,432 and $ 1,714,542, respectively.Account 237, Interest Accrued, shows a decrease of
$ 667,233 at December 31, 1975 from the balance atDecember 31, 1974, due primarily to a decrease ofinterest accrued on notes payable. The balances inthis account showed increases of $ 205,533 at December 31,
1976 and $ 1,049,498 at December 31, 1977 reflectingaccrued interest on Series BB 9 1/4% Bonds issued in
'20

p 'I
Stoddart
1976 and Series CC, 8 3/8% Bonds issued in 1977.
10
12
13
14
15
16
17
18
Qo
A:
Would you please continue by explaining the changes inthe balances of Account 238, Dividends Declared?
This account represents the balance of dividends
declared but not paid. The increase at December 1975
results from an increase of dividends due to the additional
preferred stock sold in 1975. The large decrease atDecember 31, 1976 was primarily caused by the eliminationof a one month lag in the recording of the bank statement,
as suggested in my testimony concerning Account 133,
Dividend Special Deposits. Prior to 1976, the balances
in these accounts did not reflect dividend checks
presented for payment in the month of December due to
the timing of the receipt of December bank statements.
Commencing in 1976, December activity is reflected inthe year end balances.
The increase in the balance at December 31, 1977
reflects the declaration of a dividend on the Company's
19
20
21
Series "0" preferred stock for the period January 1
through January 19, 1978. The Series "0" preferredstock was called for .redemption on December 20, 1977
22 with a January 20, 1978 redemption date.
23 The balances in Account 241, Tax Collections
24 Payable, have remained relatively constant over this
~ 21

I
s
Stoddart
period. The increase of approximately $ 230,000 from
December 31, 1975 to December 31, 1976 was primarilydue to the New York State Sales and Use Tax payable, as
-was the approximate decrease of $ 120,000 at December 31,
1977.
Q: Would you please explain the large increase in theI
balance of Account 242 at December 31, 1977?
A: The balance in Account 242, Miscellaneous Current and
9
10
Accrued Liabilities, increased by about $ 27,800,000 atDecember 31, 1977. This increase includes $ 27,750,000
reflecting the principal and call premium of the Company's
12
13
,Series "0" preferred stock redeemed January 20, 1978.
Q: Would you please continue by explaining the balance in14
16
A:
Account 255, Accumulated Deferred Investment Tax Credit?
The Company adopted deferred tax accounting for the
increase in investment tax credits arising from the TaxF
Reduction Act of 1975 in accordance with the statements
of policy issued by the Commission. The balance in19 this account of $ 6,247,400 at December 31, 1977 reflects20
21
22
23
Q-.
.the deferrals applicable to these increased investment
tax credits arising from that act.Would you comment on Account 282, Accumulated Deferred
Income Taxes — Liberalized Depreciation and Account
24 283, Accumulated Deferred Income Taxes — Other?
22

'f 1
4
Stoddart
A: The Company adopted. deferred tax accounting for ADR
depreciation in 1971, removal costs in 1972, fuel costs
in 1974 and 1975, and mortgage recording taxes in 1976,
all in accordance with the Commission's statements of
policy for these items. In addition, in 1975 the
10
12
13
14
Public Service Commission approved a Company petitionto adopt deferred tax accounting for liberalized
nuclear fuel depreciation. The balance appearing in
Account 282 for the first time at December 31, 1975
reflects the transfer of deferred taxes relating to ADR
depreciation from Account 283 in accordance with
amendments to the Uniform System of Accounts and also
includes deferred taxes resulting from nuclear fuel
depreciation. At December 31, 1977 the respective
15 deferred tax balances for ADR depreciation and nuclear
17
fuel depreciation were $ 4,918,200 and $ 787,100. The
December 31, 1977 balance in Account 283 includes
19
20
$ 1,475,700 of deferred taxes related to cost of removal,
$ 2',,264,100 of deferred .taxes related to fuel costs,
$ 2,'160,000 of deferred taxes related to the Sterling
22
fossil plant and $ 342,400 of deferred taxes related to
the mortgage recording tax on the Company's 1976 and
23 1977. bond issues.
24
23
Stoddart
Q: Will you please describe Exhibit 2 and state what itpurports to show?
A: Exhibit 2 sets forth Statements of Income for the
twelve months 'ended December 31, 1974, 1975, 1976 and
1977, respectively, in the form prescribed -by the
Commission. This exhibit has been prepared to show
10
12
13
14
15
16
17
18
Q-
A:
Company-wide operating income as well as the operation
of each of the Company's operating departments. Below-
the-line items are shown on a Company-wide basis.
Are details of certain of the accounts shown in Exhibit 2
given in later exhibits as they relate to the Electric
and Gas Departments?
Yes. Account 400, Operating Revenue, Account 401,
Operating Expense, Account 402, Maintenance Expense,
Account 402.1, Joint Expenses and'Account 408.1, Taxes
Other Than Income Taxes are detailed in Exhibit 4 for
the Electric Department and in Exhibit 5 for the Gas
Department. I should point out that certain account
numbers and the format of the Statement of Income
20
21
22
23
24
Q-
,changed throughout the period. However, these changes
are readily apparent and are not commented upon further.
Will you refer now to Accounts 419.1, Allowance for
Other Funds Used During Construction and 432, Allowance
for Borrowed Funds Used During Construction, (Account
'4

p
ll
Stoddart
10
12
13
14
16
19
20
21
22
23
24
A:
419.1, Allowance for Funds Used During Construction)
and indicate the amounts which are applicable to the
Electric and Gas Departments?
Allowance for Funds Used During Construction (AFUDC)
applicable to the Electric Department was $ 1,717,994,
$ 3,549,033, $ 7,512,067 and $ 11,297,104, for the twelve
months ended December 31, 1974, 1975, 1976 and 1977,
respectively. The increases in the amount of AFUDC
over the periods shown primarily reflect AFUDC interestaccrued on the Sterling, Nine Mile Point and Oswego
plants.AFUDC applicable to the Gas Department was $ 24,691,
$ 20,789, $ 13,584 and $ 17,304 for the four periods.
Over the period shown in this exhibit the rateused in AFUDC was 8% through May 31, 1974, 10% effectiveJune 1, 1974, 8.25% effective July 1, 1975 and 8.75%
effective May 1, 1976. Account 419.1, Allowance forFunds Used During Construction, was used for recording
AFUDC in the years 1974 through 1976. Zn 1977, Account
432, Allowance for Borrowed Funds Used During Construction,and Account 419.1, Allowance for Other Funds Used
During Construction, were utilized to record AFUDC.
Also, commencing in December 1977, amounts recorded inAccount 432 reflected AFUDC on the Nine Mile Point
25

Stoddart
and Oswego projects on a net of tax basis as provided
in Case 27108. This rate was 7.04% in that month.
Nuclear fuel for the Sterling and Nine Mile Point
projects is included in the base for determining AFUDC
as provided in Case 26848.
10
12
13
A:
Will you comment on the interest charges beginning withAccount 427?
.Charges to Account 427, Interest on Long-Term Debt,
totalled $ 14,965,352 for the twelve months ended December 31,
1974. This amount reflects the partial year's interestof $ 1,227,292 on our Series AA, 10 3/4% Bonds issued inAugust 1974 plus the annual interest on the other bond
issues outstanding at year end 1974. At the end of14 1975 these charges had increased by $ 1,997,708 reflecting
19
20
21
22
23
24
a full year's interest on the 1974 bonds.
The charges to this account increased by $ 2,415,278
during 1976 as a result of the issuance in June 1976 ofSeries BB, 9 1/4% Bonds. A further increase of $ 3,163,313
occurred in 1977 reflecting annual interest on the 1976
.issue together with a partial year's interest on our
Series CC, 8 3/8% Bonds issued in September 1977.
Account 431, Other 'Interest Expense, had charges
for the twelve months ended December'1, 1974, 1975,
1976 and 1977 of $ 2,369,990, $ 2,659,701, $ 1,154,156 and
26

1"
1l
Stoddart
2 ~
$ 1,657,048, respectively. These charges primarilyrepresent interest on short-term borrowings during this
period. Interest, on notes payable and commercial paper
were $ 2,255,000 in 1974, $ 1,568,000 in 1975, $ 1,054,000,
in 1976 and $ 1,319,000 in 1977. These changes are
attributable to variations in the balances of short-
8
10
12
13
14
15
16
term borrowings outstanding and in interest rates.
Other interest charges, in addition to interest on
short-term borrowings, reflected'n the yearly amounts
shown included $ 966,079 in 1975 representing interestexpense on payments to Niagara Mohawk Power Corporation
for the Company's purchase of a partial ownership of
Nine Mile Point 52 and Oswego N6 generating stations.
Also included is $ 258,837 in 1977 representing interestexpense pertaining to leased nuclear fuel.
17
18
19
20
21
22
23
24
27

i
0
0
Stoddart
Qo Will you describe Exhibit 3 and state what it purports
to show?
A: Exhibit 3 is a Statement of Unappropriated Retained
10
12
13
Earnings for the twelve months ended December 31, 1974,
1975, 1976 and 1977. The exhibit shows the balance of
retained earnings at the beginning of each period, the
addition of net income which has been transferred to
retained earnings, the appropriations for cash dividends
on preferred and common stock, the common stock dividends
and the balance of retained earnings at the end of each
period.
In addition, the exhibit shows the adjustments to
retained earnings in connection with the adoption of
14
15
equity accounting for Canadea Power Corporation and, in1977, a charge to retained earnings pursuant to the
18
order in Case 27269 for the capital stock expense ofour Series "0" Preferred Stock which was called forredemption.
Undistributed subsidiary earnings reflects the
20
21
annual earnings of Canadea Power Corporation less
dividends paid to the Company.
22
23
24
28
Stoddart
Q-
A:
Will you discuss Exhibit 4 and state what it purports
to show?
Exhibit 4 is a Statement of Electric Department Operating
Income and Detail of Revenues, Expenses and Taxes, inAmount and Equivalent Cents for the twelve months ended
December 31, 1974, 1975, 1976 and 1977. The exhibit isdesigned to facilitate comparison of the revenues and
operating expenses of the Electric Department by primary
accounts for the periods shown. I would like to explain
10 the methods used in preparing this exhibit by referring
12
13
14
'15
to pages 1 and 2. A summary of the Operating Revenues,
Operation and Maintenance Expenses, Depreciation, Taxes
and Operating Income for each of four periods is shown
on the upper portion'f page l. You will note that Ihave not made any equivalent "cent computation for the
various components. The'eason for this, is thatbecause of the large variations in contract and incidental
18 power sales, it was not meaningful to utilize a single
19
20
21
22
23
24
unit basis such as total kilowatt hours sold to arriveat equivalent cents for the four periods for the detailof revenues, expenses and taxes. Therefore, in order
to obtain a meaningful comparison of the details ofoperating revenues, expenses and taxes, it was necessary
to use different bases to determine the equivalent cents.
29

"I
Stoddart
3
10
12
13
14
15
17
18
19
20
21
22
23
24
For example, the lower portion of page l shows operating
revenues by accounts, and the upper portion of page 2
shows equivalent cents per kilowatt hour sold foroperating revenues. The kilowatt hours sold applicable
to each revenue account is shown on the lower portionof page 2. Page 4 shows Steam Power Generation operation
and maintenance expenses on the basis of the equivalent
cents per kilowatt hour of net steam generation.
Likewise, page 6 details Nuclear Power Generation
operation and maintenance expenses on the basis ofequivalent cents per kilowatt hour of net nuclear
generation. Page 8 shows the detail of Hydraulic Power
Genera'tion expenses on the basis of equivalent cents
per kilowatt hour of net hydro generation. Page 10
shows Other Power Generation expenses on the basis ofequivalent cents per kilowatt hour of other generation,
and Other Power Supply Expenses on the basis of equivalentcents per kilowatt hour of energy purchased. Pages llthrough 19 detail the other expense subdivisions forthe Electric Department with the dollar amounts being
shown first, followed by the equivalent cents per
'ilowatt hour sold, less kilowatt hours sold for resale.
Pages 20 and 21 are a detail of Taxes Other than Income
Taxes and equivalent cents per kilowatt hour sold less
30

Stoddart
10
12
13
14
15
16
18
A:
sales for resale.
Do you have any comments relative to the summary of
operating income or any of the detail account figures
for operating revenues or expenses shown in this exhibit?
Electric operating revenues have increased by $ 64,086,182
from 1974 to the twelve months ended December 31, 1977.
During this period the Company has received annual
increases in permanent electric rates of $ 11,002,000
effective April 21, 1976 and $ 10,186,000 effectiveNovember ll, 1977.
Revenues also increased during this period because
of revenues collected under our fuel cost adjustment
and due to growth and increases in customer loads. You
will note that there is a decline of total KWH sales
for the twelve months ended December 31, 1976 and that1977 KWH sales are approximately equal to 1975 KWH
sales. This is primarily attributable to a variance insales for resale. KWH sales for each of the other
19, classifications have increased year to year throughout
20
21
, the period shown in the exhibit.Turning to Page 3 of this exhibit, Account 500,
22
23
24
Supervision and Engineering, Operation, has increased
approximately $ 30,000 from December 31, 1976 to December 31,
1977 while Account 510, Supervision and Engineering,
31

'll
J
E
Stoddart
Maintenance, has decreased approximately $ 20,000 over
the same period. These changes have occurred due to a
reallocation of payroll between operation and maintenance.
Account 501, Fuel, increased annually over the
period shown from $ 33,869,919 in 1974 to $ 42,002,252 in
10
12
14
16
1977. The increases between each of the twelve month
periods shown result from changes in the unit price as
well as in the quantity of fuel purchased by the Company.
Stated in terms of Btu, these dollars represent
25,244,758 million Btu in 1974, 22,506,938 million Btu
in 1975, 25,698,109 million Btu in 1976 and 27,581,463
million Btu in 1977. Cost per million Btu increased
from 130.06 cents in 1974 to 151.35 cents in 1975,
decreased to 145.83'cents in 1976, then increased to
147.65 cents in 1977.
Account 504, Steam Transferred — Credit, reflectsthe cost, of steam produced at Beebee Station No. 3
18 which is subsequently transferred as a by-product to
20
21
22
23
24
the Steam Department where it is utilized for commercial
steam sales. These credits have remained relativelyconstant over the period shown having decreased slightlyfrom 1974 to 1975 and from 1975 to 1976 followed by an
increase from 1976 to 1977. However the average high
pressure steam transfer rate per M lbs. was $ 3.93,
32

I'
Stoddart
$ 4.16, $ 4.29 „and $ 4.92 for 1974, 1975, 1976 and 1977,
respectively, reflecting a steady increase primarilydue to fuel costs. The average low pressure steam
transfer rate per M lbs. was $ 3.54, $ 3.75, $ 3.84 and
10
12
13
14
15
17
19
20
$ 4.44 for the respective periods.
Account 506, Miscellaneous Steam Power Expenses,
shows increases approximating $ 150,000 in 1976 and
'80,000in 1977. These were caused primarily by research
and development expenditures of $ 99,000 and $ 37,000
concerning suspension burning of refuse derived fuel inm
conventional boilers in 1976 and 1977, respectively.Also, beginning in 1976, expenses for the heating ofStation No. 7 which had previously been charged toAccount 501, Fuel Expenses, were charged to this account.
Turning to pages 5 and 6 of this exhibit, Nuclear
Power Generation Expenses, you will notice a considerable
increase in total cost of operation in 1975 when compared
to 1974 and in 1977 when compared to 1976. This isprimarily due to the fact that Ginna Station was shutdown
for 125 days for refueling, maintenance and replacement
21
22
23
of a broken turbine b'lade in 1974 and was shutdownm
twice in 1976 for a total of 99 days for refueling,maintenance and repairs to the turbine necessitated by
24 further turbine blade damage. The plant was down for
33
Stoddart
, more normal refueling and. maintenance for 69 and 38
10
days during 1975 and 1977, respectively, as compared to
the 125 and 99 days in 1974 and 1976. A substantial
increase is shown in Account 518.1, Nuclear Fuel,4
between the 1976 and 1977 periods. This increase was
caused by the'nteraction of approximately fifty per
cent greater generation and increased amortization
rates during 1977 compared to 1976.
The differences in shutdown periods and nuclear
fuel cause variations within .total nuclear power generation
expense. Deducting Account 518.1, Nuclear Fuel, from
12 total nuclear power generation expense is helpful in13
14
15
16
18
19
20
21
discerning the trend of expense other than nuclear
fuel. This calculation shows total nuclear power
generation expense, exclusiv'e of nuclear fuel,'f$ 5,396,166, $ 6,600,299, $ 7,360,701 and $ 7,944,138 forthe years 1974 through 1977, respectively.
There are, of course, variations within the operation
and maintenance accounts. Account 517, Supervision and
Engineering, increased approximately $ 165,000 in 1976
and $ 56,000 in 1977. The 1976 variance included increases
22 of about $ 10,000 in operator training costs, $ 21,000
23 for engineering and consulting costs to evaluate nuclear
24 fuel bids and $ 43,000 from a reallocation of the Electric

Stoddart
,3
System Planning and Operation Department payroll. The
1977 variance included a $ 40,000 increase in operator
training costs.
Account 519, Coolants and Water, increased about
$ 166,000 during 1977 due primarily to increasing costs
10'ssociatedwith environmental studies. We expect this
trend to continue as these studies continue to become
more sophisticated and require more detailed analysis.
Account 524, Miscellaneous Nuclear Power Expenses,
increased approximately $ 600,000 during 1977. The
12
variance was primarily caused by an increase of $ 291,000
in plant security expenses together with an increase of13
14
15
$ 168,000 in research and development expenses.
Account 528, Supervision and Engineering, increased
approximately $ 79,000 during 1977. This was caused
primarily through payroll charges which increased over
17
18
$ 72,000. Approximately $ 52,000 of the payroll increase
represents increased labor charges of plant personnel
19
20
while the remaining $ 20,000 represents increased labor
charges to this account, by employees assigned to other
21
22
departments.
Account 531, Electric Plant, indicates a marked
23
24
increase during 1975. This change reflects increased
costs for maintenance of the turbo-generator during
35
Stoddart
overhaul, maintenance of accessory electric equipment
during overhaul and inspection and testing of the
intake heating screens and power cable to the screens.
These 1975 job costs reflect increased expenditures
over the year 1974 in the amounts of $ 201,000, $ 43,000
10
12
Q ~
A:
and $ 134,000, respectively.'ouldyou please continue with your explanations of
this exhibit?.
Account 543, Reservoirs, Dams and Waterways, increasedh
approximately $ 99,000 in 1977. Hydro Station N5 expenditures
increased about $ 93,000 due mainly to costs associated
with maintenance on the tunnel at that station.
13
14
15
17
18
19
20
21
22
23
Account 547, Fuel, reflects the cost of N2 oil and
natural gas used inhour gas turbine operations at
Station N3 and Station 59. Total MWH generated from
these peaking units was 12,806 in 1974, 2,198 in 1975,
2,797 in 1976 and 850 in 1977.
On page 9, Account 555, Purchased Power, increased
by approximately $ 6 million from 1975 to 1976 and then
decreased about $ 4.6 million from 1976 to 1977. The
variations in this account are primarily due to changes
in -the quantities and unit costs of power purchased
from other utilities as a result of maintenance requirements
24 on the Company's generating plant.
36
Stoddart
Account 559, Fuel Costs Deferred — Net, reflectsI
the accounting for deferred fuel costs adopted by the
10
12
13
14
15
19
20
21
22
23
24
Q-
A:
Company in January 1974. The difference in amounts for
the periods shown is the result of the price of fuel
and the generation mix.
Will you conti.'nue with your comments on this exhibit?
Looking at Account 561, Load Dispatching and Account
562, Station Expenses, you will notice an increase
approximating $ 128,000 in the former account between
1975 and 1976 while the latter account shows a decrease
of around $ 41,000 for the same period. This was partiallycaused by an amount of $ 34,904 erroneously being charged
to Account 562 in 1975. A correcting entry in 1976
properly charged that amount to account, 561. The
increase in Account 561 from 1976 to 1977 also reflectsincreased payroll charges approaching $ 64,000 together
with an increase in payments of about $ 56,000 to the
New York Power Pool representing the increase in thisCompany's share of NYPP expenses.
Account 563, Overhead Line Expenses, reflects a
substantial increase in 1976 while 1977 expenditures
have remained at the same approximate level. Both
years reflect increased expenses for tree trimming.
Account 566, Miscellaneous Transmission Expenses,
37

Stoddart
10
12
13
shows a credit amount in 1976. This resulted primarily
from charges of $ 30,814 to a research and development
job for accoustical research offset by a refund of
$ 51,000 from the Empire State Electrical Energy Research
Corporation for amounts expended in 1976 and prioryears on the accoustical research study. Research and
development expenditures charged to this account decreased
in 1977 with only minor amounts charged for biological
assessment of electrical and magnetic fields and for
soil investigation.Account 570, Station Equipment, increased about
$ 104,000 during 1977 due mainly to $ 48,000 increased
charges for transformer repairs.
14 Account 583, Overhead Line Expenses, also reflects'
increased tree trimming act'ivity the past two years and
charges for removing and resetting transformers which
represent approximately $ 53,000 of the $ 59,000 increaseL
in 1977.
20
21
Account 585, Street Lighting and Signal System
Expenses, reflects, a decrease in charges during 1975.
The decrease resulted from an austerity program in
22
23
effect at that time whereby globe washing by contractors
was eliminated, bulb life 'was extended from twelve
24 months to eighteen months and overtime work was discontinued.
38

tt
h
Construction
10
12
13
14
15
16
17
Account 586, Meter Expenses, decreased about
$ 17,000 in 1976 and increased almost $ 70,000 in 1977.
The 1976 decrease was caused predominately by a reduction
in expense of testing watthour meters located oncustomers'remises
due to a lengthening of the period between
required tests (16 NYCRR 92.12). The 1977 increase
reflects increased turn on and 'shut off activity.Account 587, Customer Installation Expenses, reflects
a reduction in expense of $ 93,000 in 1977. This reduction
was due primarily to the discontinuation of servicing
television, radio, hi-fi and small appliances on June 14,4
1976. Expenses of paid servicing were $ 25,000 lower in1977 while charges to Company Account 587-31, All Other
Services on Customeis Premises, were $ 54,000 below
1976.
Account 590, Supervision and Engineering, decreased
$ 171,000 during 1976. This decrease resulted from a
19
reallocation of labor costs between capital and expense.
Company studies indicated that. a significant amount of20
21
engineering labor costs related to construction were
being charged to expense as, in many cases, construction22 jobs were not issued until much of the preliminary23
24
engineering work was completed. Effective January 1,
1976 we began charging construction related engineering
39

a
Stoddart
10
12
13
14
15
18
19
20
21
22
23
24
A:
costs to a permanent job from which an engineering
overhead charge is allocated to construction jobs.
Account 592, Station Equipment, increased $ 119,000
in 1977. The increase was primarily due to increased
payroll charges and a $ 25,000 repair of a transformer
which failed at Substation 556.
Account 904, Uncollectible Accounts, increased
$ 240,000 in 1975, $ 925,000 in 1976 and then decreased
slightly in 1977. The 1975 and 1976 increases were
primarily caused by the implementation of an accelerated
write-off program to more accurately reflect our accounts
receivable. We now charge off as uncollectible any
accounts receivable which have aged over 120 days. The
1977 decrease reflects a return to more normal write-
offs tempered by a $ 150,000 increase in the reserve
balance.4
Account 906, Rents, reflects a large decrease in
1975. This resulted from a transfer of charges from
this account to Account 903, Customer Records and
Collection Expenses, representing rental costs of data
processing equipment.
Will you continue with your comments on this exhibit?
Turning to page 18, Administrative and General Expenses,
I would like to comment upon the basis for the charges
40
Stoddart
10
12
13
14,
1S
17
18
19
20
21
22
23
24
to these accounts. Costs applicable to these accounts
'are charged directly to the class of operation involved
whenever possible. However, where costs are non-
direct, 60% of the charges to the respective accounts
are generally allocated to the Electric Department.
This percentage was derived as a matter of judgment
after considering the number of customers, distributionoperating expenses, the trend of the Company's operations
and the time expended for each department. Account
926.1, Employee Pension, and Account 926.2, Employee
Welfare Expense are an exception to the 60% allocationof non-direct charges. All of Account 926.1 and a
portion of Account 926.2 is allocated monthly to the
Electric Department on the basis of the ratio of ElectricDepartment operating expense payroll to the totaloperating expense payroll for the prior twelve months.
The average percentages used were 67.4%, 65.3%, 66.1%
and 65.9% for the years 1974, 1975, 1976 and 1977,
respectively.Account 925, Injuries and Damages, increased
$ 158,000 in 1976 and $ 64,000 in 1977. The 1976 change
was predominately due to a $ 65,000 increase in Workmen'
Compensation premiums resulting from the elimination ofthe $ 300 per employee deductible feature coupled with a
41

Stoddart
Q-.
A:
rate increase. The 1977 change was due mainly to a
$ 46,000 increase in the cost of excess public liabilityinsurance.
Turning to page 20 and 2l of this exhibit, are there
any comments you would like to make?
Yes. Total taxes other than Federal income taxes forthe year 1974 totalled $ 22,783,829. Increases occurred
in each year shown on the exhibit in the amount. of
10
12
13
14
$ 2,586,015 for 1975, $ 3,173,203 for 1976 and $ 2,986,646
for 1977. These increases evolve primarily from additions
to the Company's electric plant coupled with increases
in property tax rates and from growth in the taxable
base upon which revenue taxes are determined. Property
taxes increased $ 5;443,704 over the three year period
while gross income and gros's earn>".ngs taxes increased
$ 2,322,435 over the same period. These amounts represent
increases of 35.9% and 43.4%, respectively.
18
20
21
22
23
24
42

Stoddart
10
12
13
14
Q ~
A:
Will you describe Exhibit 5 and state what it purports"to show?
Exhibit 5 is a Statement of Gas Department. Operating
Income and Detail of Revenues, Expenses and Taxes inAmount and Equivalent Dollars per Therm (000's) Sold
for the twelve months ended December 31, 1974, 1975,
1976 and 1977. This exhibit has been prepared in a
manner similar to Exhibit 4.
Page 1 of this exhibit shows the details of operating
income in summary form. Page 2 shows a breakdown ofoperating revenues by account. Pages 3 through 14
details operating expenses by functional accounts while
pages 15 and 16 are details of Account 408.1, Taxes
Other Than Income Taxes. The exhibit is self explanatory
for the most part and is designed to facilitate the
comparison of the revenue and operating expense of the
19
Gas Department for the period shown.
Do you have any comments concerning the summary ofoperating income on page 1 of this exhibit?
20
21
A: Operating revenues have increased from $ 75,462,995 in1974 to $ 105,796,864 in 1977, an increase of $ 30,333,869
22
23
24
over that period. During this period the Gas Department
has received permanent rate increases on an annual
basis of 94,854,000 effective October 23, 1974, 94,983,000
43

1
lt
Stoddart
effective April 20, 1976 and $ 2,536,000 effectiveNovember ll, 1977. A temporary rate increase of $ 2,497,000,
10
12
13
14
17
18
on an annual basis, was received effective July 25,
1974 and subsequently made part of the October 23, 1974
permanent increase. Revenues were reduced $ 1,536,370
in 1977 as a result of a decision by the Company to
provide a $ 10 credit on the billing of each residentialgas spaceheating account. Revenue deductions have
increased by $ 30,884,560 over the same period from
$ 66,727,356 in 1974 to $ 97,611,925 in 1977. Operating
income decreased $ 550,691 from $ 8,735,630 in 1974 to
$ 8,184,939 in 1977.
Revenue deductions in 1977 included amortization
in the amount of $ 154,706 representing the net loss
from the abandonment of our manufactured gas facilities.This charge was recorded pursuant to a Commission order
dated April 12, 1977.
The Company completed the conversion of all of itsmanufactured gas customers to straight natural gas
20
21
effective June 30, 1976. Therefore no expenses relatingto the production of manufactured gas appear on pages
22 3, 4 and 5 for the year 1977 and those expenses recorded
23 in 1976 are below those balances shown for 1974 and
24 1975. Besides the accounts on those pages, the use of
Stoddart
10
Accounts 812 and 840 through 846 on pages 6 and 7 and
Accounts 872 and 873 on pages 8 and 9 were terminated
due to the cessation of manufactured gas production.
As shown on page 6 of this exhibit, Account 804,
Natural Gas City Gate Purchases were $ 37,341,565 in1974, $ 47,247,241 in 1975, $ 56,191,880 in 1976 and
$ 62,085,820 in 1977. The changes in these amounts
reflect the increase in the cost of this gas to the
Company and volume variations due to weather. The
average cost per therm of gas purchased increased from
12
7.80C in 1974 to 9.53C in 1975, to 11.05C in 1976 and
to 14.42C in 1977.
13
14
Turning now to page 8, many of the account variationsare primarily due to the conversion of the Company's
15
16
17
18
19
mixed gas system to natural gas in connection with the
phasing out. of the manufactured gas plant.Account 878, Measuring and Regulating Station
Expenses, reflects a $ 30,000 decrease in 1977. This
reduction was the result of the cessation of manufactured
20
21
22
23
24
gas production.
Account 879, Customer Installation Expenses,
increased $ 571,000 in 1975, increased $ 225,000 in 1976
and decreased $ 735,000 in 1977. This reflects the
increased costs incurred in converting our mixed gas
45

Stoddart
10
12
13
14
1S
16
customers to natural gas during 1975 and 1976.
Account 894, Other Equipment, increased $ 34,300 in1977. This was primarily caused by expenditures incurred
in moving propane gas tanks from our Blossom Road
holder to other locations.
Turning to page 10, Account 904, Uncollectible
Accounts, increased substantially in 1975 and 1976 and
then decreased in 1977. As stated in my testimony on
this account in the Electric Department, these changes
were caused by an accelerated write-off program which
was in effect in 1975 and 1976. The year 1977 reflectsa return to more normal write-offs offset by a $ 98,750
increase in the reserve.
The reduction'from the 1974 level in Account 906,
Rents, reflects the transfer of data processing rentalcosts from this account to Account 903, Customer Records
and Collection Expenses.
A:
Will you continue with your comments on this exhibit?Pages 13 and 14 is a schedule of Administrative and
20
21
22
23
24
General Expenses. As I discussed in connection withExhibit 4, the amounts represent both direct and non-
direct charges applicable to this group of accounts.
The non-direct charges, except for Account 926.1 and
portions of Account 926.2, were allocated to the Gas
46

N
o
Stoddart
Department by utilizing 39.5%'f the total amount
charged to these accounts, such percentage based on the
criteria previously described. Account 926.1 and a
portion of Account 926.2 are allocated monthly to the
Gas Department on the basis of the ratio of the Gas
Department operating expense payroll to the totaloperating expense payroll for the previous twelve
months. The average allocation percentages used for
1974, 1975, 1976 and 1977 were 29.3S, 28.4%, 27.9% and
10 28.0%, respectively.
12
13
14
15
17
18
Account 925, Injuries and Damages, reflects an
increase of.$ 76,000 in 1976 and $ 133,000 'in 1977. The
1976 change was composed primarily of a $ 28,000 increase
in premiums for excess public liability insurance, a
$ 23,000 increase in Workmen's Compensation premiums and
an $ 11,000 increase in allocations of non-direct charges.
The 1977 change reflects a $ 93,000 increase in excess
public liability insurance premiums, an $ 18,000 increase
20
21
22
23
24
in Workmen's Compensation costs and a $ 23,000 increase
in allocated expenditures.
Account 930, Miscellaneous General Expenses, shows.
a $ 126,000 increase in 1976 and a decrease of $ 64,000
in 1977. An amount of $ 47,909 was incorrectly charged
to this account in 1976 which'should have been charged
47
Stoddart
to Account 928, Regulatory Commission Expenses. A
correcting entry was made in 1977. Absent the incorrect
charge, the 1976 and 1977 expenditures in this account
would have been approximately $ 598,000 and $ 630,000,
respectively, rather than the $ 646,337 and $ 582,582
10
12
13
14
15
16
18
20
21
Qo
A:
shown.
Turning to pages 15 and 16 of this exhibit, are there
any comments you would like to make?
Total operating taxes for the year 1974 were $ 7,937,088.
These increased by $ 777,485 for 1975, $ 1,014,527 for
1976 and $ 360,254 for 1977. The decrease in property
tax from 1976 to 1977 was primarily caused by the
physical removal of our former gas manufacturing
facility. The year to year increases in total operating
taxes reflect some additions to the Company's gas plant
but, more significantly, reflect increases in tax rates
and an expanding revenue tax base derived from customer
charges including GCA revenues,. Property taxes increased
$ 741,102 while gross income and gross revenue taxes
increased $ 1,245,304 over the three year period. These
amounts represent increases of 18.7% and 39.7% respectively.
22
23
24
48
Stoddart
9
10
12
Qo
A:
Will you describe Exhibit 6 and state what it purports
to show?
Pages 1 and 2 of this exhibit show the book cost of
Electric Plant in Service by primary accounts and the
Electric Construction Work in Progress as of December 31,
1974, 1975, 1976 and 1977. Pages 3 and 4 show the
Accumulated Provision for Depreciation of Electric
Plant in Service by primary accounts and the amount of
Retirement Work in Progress for the Electric Department.
Page 5 shows the Electric portion of Common UtilityPlant in Service by primary accounts and the Electric
portion of Common Construction Work in Progress.
13
14
Page 6 shows the Accumulated Provision for Depreciation
of the Electric poition of Common Utility Plant inService by primary accounts and the amount of Retirement
Work in Progress for that plant. The methods of allocation
of Common Utility Plant and the Accumulated Provision
18 for Depreciation of Common Utility Plant in Service
19 will be explained in conjunction with a later exhibit.
20 I believe this exhibit is self explanatory.
21
22
23
24
49

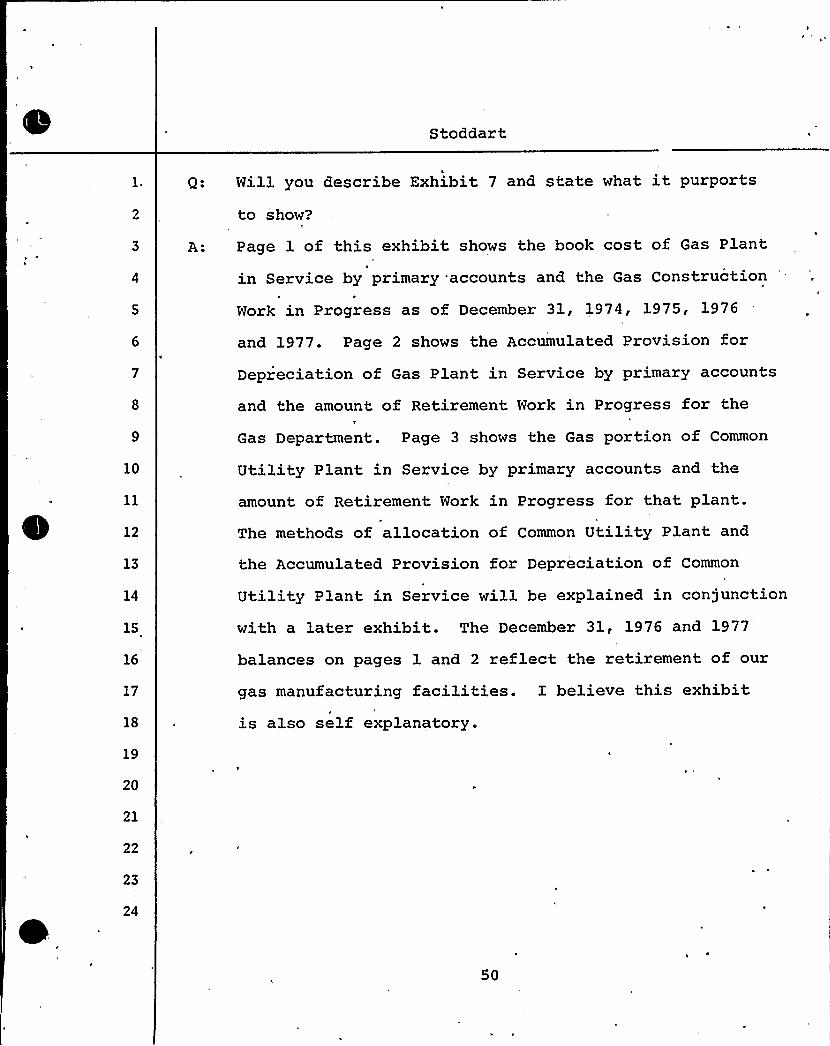
Stoddart.
Qe Will you describe Exhibit 7 and state what it purports
to show?
A: Page 1 of this exhibit shows the book cost of Gas Plant
in Service by primary accounts and the Gas Const'ruction
Work in Progress as of December 31, 1974, 1975, 1976
and 1977. Page 2 shows the Accumulated Provision for
10
Depreciation of Gas Plant in Service by primary accounts
and the amount. of Retirement Work in Progress for the4
Gas Department. Page 3 shows the Gas portion of Common
UtilityPlant in Service by primary accounts and the
12
13
14
1S
18
19
amount of Retirement Work in Progress for that plant.
The methods of allocation of Common Utility Plant and
the Accumulated Provision for Depreciation of Common
Utility Plant in Service will be explained in conjunction
with a later exhibit. The December 31, 1976 and 1977
balances on pages 1 and 2 reflect the retirement of our
gas manufacturing facilities. I believe this exhibit
is also self explanatory.
20
21
22
23
24
50

I
Rochester Gas and Electric Corporation
Direct Testimony
ROBERT C. HENDERSON
Assistant Controller

a
DIRECT TESTIMONYOP
ROBERT C. HENDERSON
4 Q: Would you please state your name and business address'?
5 A: Robert C. Henderson. My business address is 89 East
Avenue, Rochester, New York 14649.
7 Q: Mr. Henderson, what is your position and what are your
responsibilities with Rochester Gas and Electric Cor-
porationV
12
13
14
15
16
17
A: I am an Assistant Controller. I am responsible foraccounting and financial research, analysis of financialand accounting problems, federal income taxes, long
range financial planning and studies and the planning
and preparation of financial and accounting data
required for rate increase applications. I also par-
ticipate in the determination and implementation of the
Company's financing plans and goals.
18 Q: Would you briefly outline your experience and qualifica-19 tions'?
'0 A: I received a bachelors degree in accounting from the
21
22
23
24
University of Rochester in 1962 and I am presently com-
pleting the requirements for a masters degree in busi-ness administration from the University of Rochester's
Graduate School of Management. In 1963, I was employed

P
by the Company as an accountant in the general account-
ing department. Subsequently, I have held the position
of Cax analyst, corporate tax representative, senior
staff assistant and manager of the financial analysis
department. In October, 1976, I was elected to my
present position. I have testified in our last fiverate case proceedings. I have also testified before the
Nuclear Regulatory Commission in relation to the Com-
pany's application to build the Sterling, Nuclear Plant
10 as well as other proceedings before the PSC.
What is the purpose of your testimony in this pro-
12
13
14
15
16
17
18
19
20
21
ceeding'?
A: First, I will discuss exhibits 8 and 9 relating to the
Electric and Gas Departments, respectively. These
exhibits cover revenues and expenses for the historicaltest year (calendar 1977), and set forth known, pro
forma adjustments to establish the impact of changes inthe rate year, that is, the first year in which rates
would be effective. Secondly, I will discuss Exhibitsl0 and ll, the forecast exhibits prepared in response tothe Commission's "Statement of Policy on Test Periods in
22
23
24
Ma)or Rate Proceedings". Ny testimony will also include
a discussion of the manner in which we have addressed
the subjects of executive compensation and labor produc-
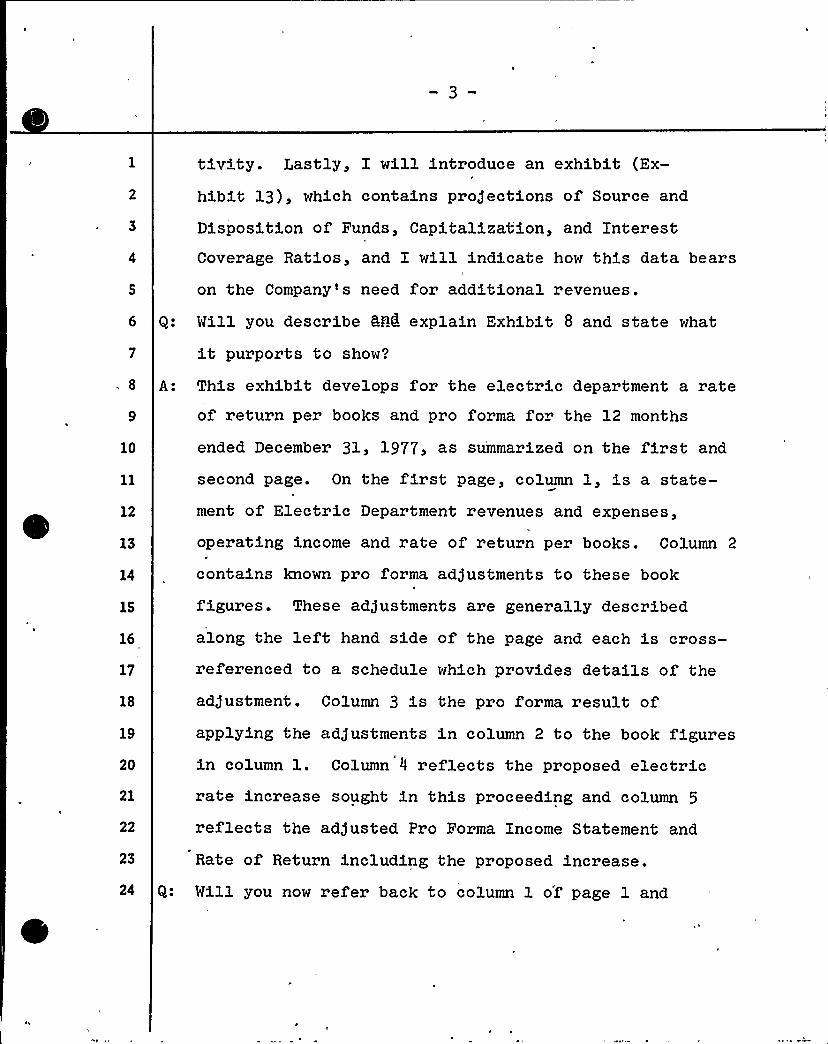
tivity. Lastly,' will introduce an exhibit (Ex-
hibit 13), which contains progections of Source and
Disposition of Funds, CapitalizaCion, and InterestCoverage Ratios, and I will indicate how this data bears
on the Company's need for additional revenues.
Q: Will you describe SAC explain Exhibit 8 and state what
it purports to show'?
10
12
13
14
A: This exhibit develops for the electric department a rateoi return per books and pro forma for the l2 months
ended December 3l, 1977, as summarized on the first and
second page. On Che first page, column 1, is a state-ment of Electric Department revenues and expenses,
operating income and rate of return per books. Column 2
contains known pro forma adjustments Co these book
figures. These adjustments are generally described
16
17
18
19
20
21
22
along the left hand side of Che page and each is cross-referenced to a schedule which provides details of the
ad)ustment. Column 3 is Che pro forma result of
applying Che adjustments in column 2 Co the book figuresin column l. Column 4 reflects the proposed electricrate increase sought in this proceeding and column 5
reflects Che ad)usted Pro Forma Income Statement and
23
24
Rate of Return including the proposed increase.
Q: Will you now refer back to column l of page l and
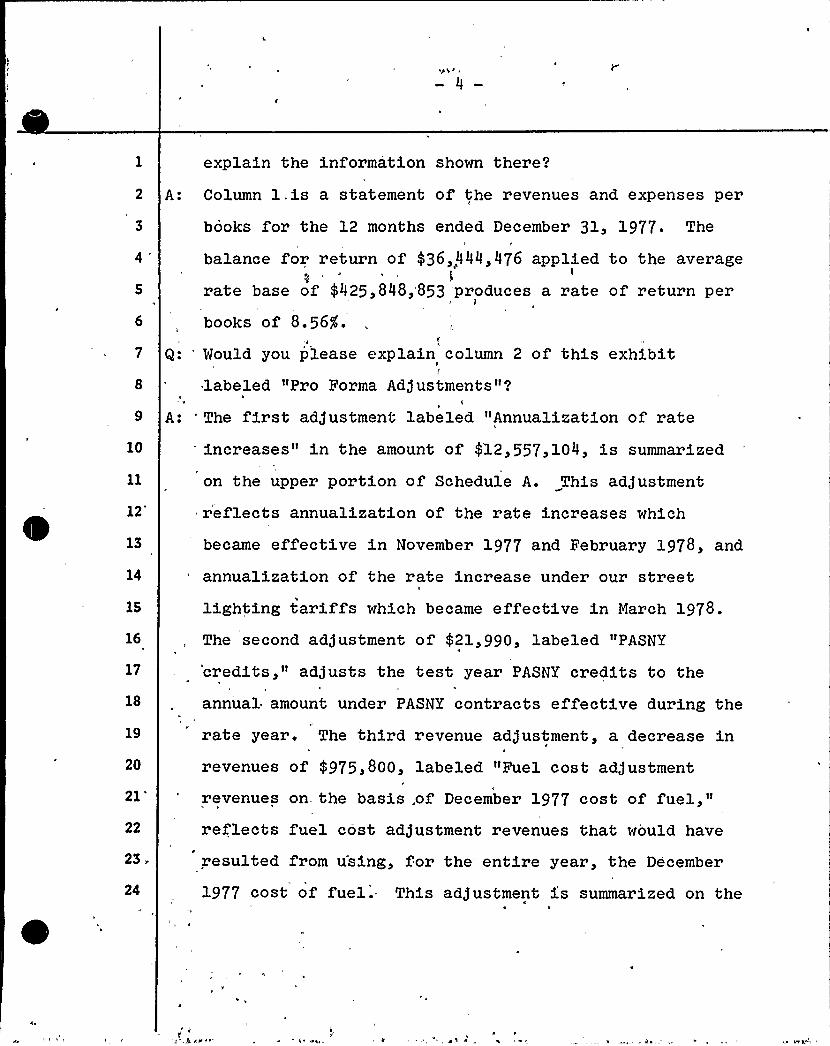
explain the information shown Chere'?
2 A: Column l,is a statement of the revenues and expenses per
10
12"
13
14
16
17
18
19
20
21'2
23
24
books for the 12 months ended December 31, 1977. The
balance for return of 436,,444,476 applied to the averageI
rate base of $ 425,848,'853 'produces a rate of return perI
books of 8.56$ .
Q: 'ould you please explain column 2 of this exhibitlabeled "Pro Forma Adjustments"'?
A: 'he first ad)ustment labeled "Annualization of rateincreases" in t'e amount of $12,557,104, is summarized
on the upper portion of Schedule A. This ad)ustment
reflects annualization of the rate increases which
became effective in November 1977 and February 1978, and
annualization of the rate increase under our street;
lighting tariffs which became effective in March 1978.
The second ad)ustment of $ 21,990, labeled "PASNY
'credits," adjusts the test year PASNY credits to the
annual amount under PASNY contracts effective during the
rate year. The third revenue ad)ustment, a decrease inrevenues of $ 975,800, labeled "Fuel cost ad)ustment
revenues on the basis, of December 1977 cost of fuel,"reflects fuel cost ad)ustment revenues that would have
resulted from using, for the entire year, the December
1977 .cost of fuel. This ad)ustment is summarized on the

~,
I
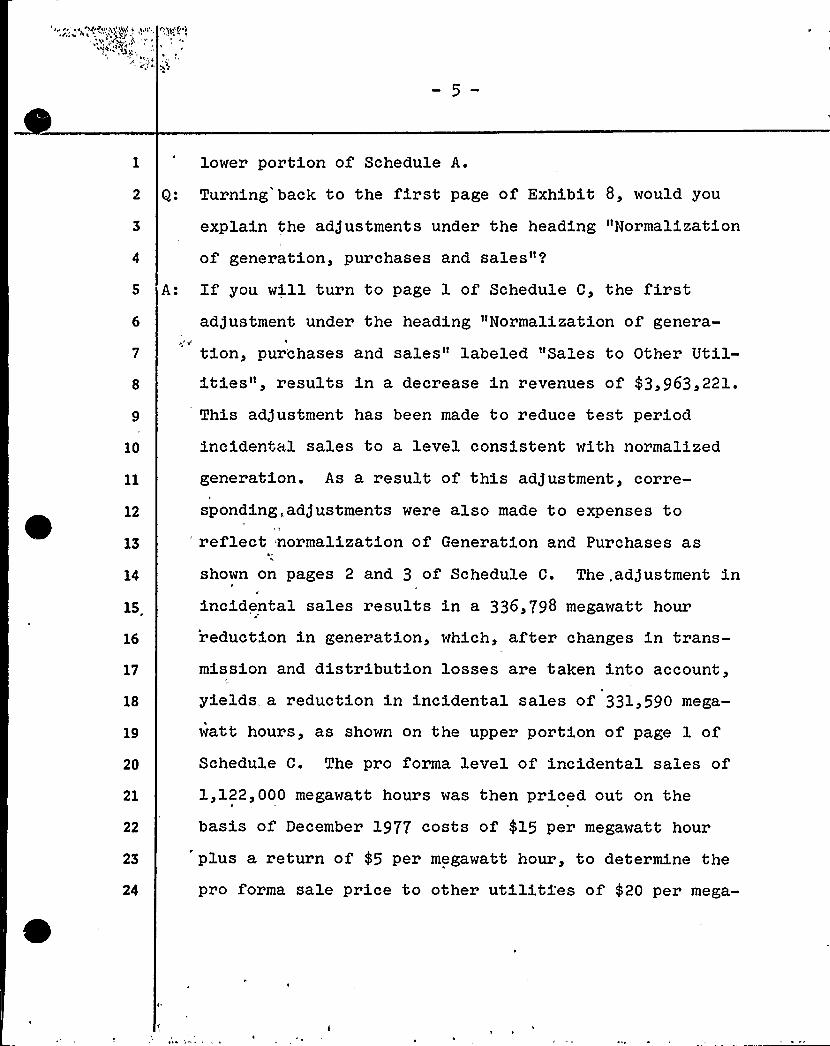
lower portion of Schedule A.
2 Q: Turning back to Che first page of Exhibit 8, would you
explain Che adjustments under Che heading "Normalization
of generation, purchases and sales"'?
5 A: If you will Curn Co page l of Schedule C, the first;ad)ustment under the heading "Normalization of genera-
tion, pur'chases and sales" labeled "Sales Co Other Util-
9
10
ities", results in a decrease in revenues of $ 3,963,22l.
This ad)ustment has been made to reduce test period
incidental sales Co a level consistent with normalized
generation. As a result of this ad)ustment, corre-
12
13
14
15
16
17
18
19
20
21
22
23
24
sponding„adjustments were also made Co expenses to'eflect normalization of Generation and Purchases as
shown on pages 2 and 3 of Schedule C. The.ad)ustment inincidental sales results in a 336,798 megawatt hour
reduction in generation, which, after changes in trans-mission and distribution losses are taken into account,
yields, a reduction in incidental sales of 331,590 mega-
watt hours, as shown on Che upper portion of page l ofSchedule C. The pro forma level of incidental sales of1,122,000 megawatt hours was Chen priced out on Che
basis of December 1977 costs of fl5 per megawatt hour
plus a return of $ 5 per megawatt hour, Co determine the
pro forma sale price Co other utilities of $ 20 per mega-

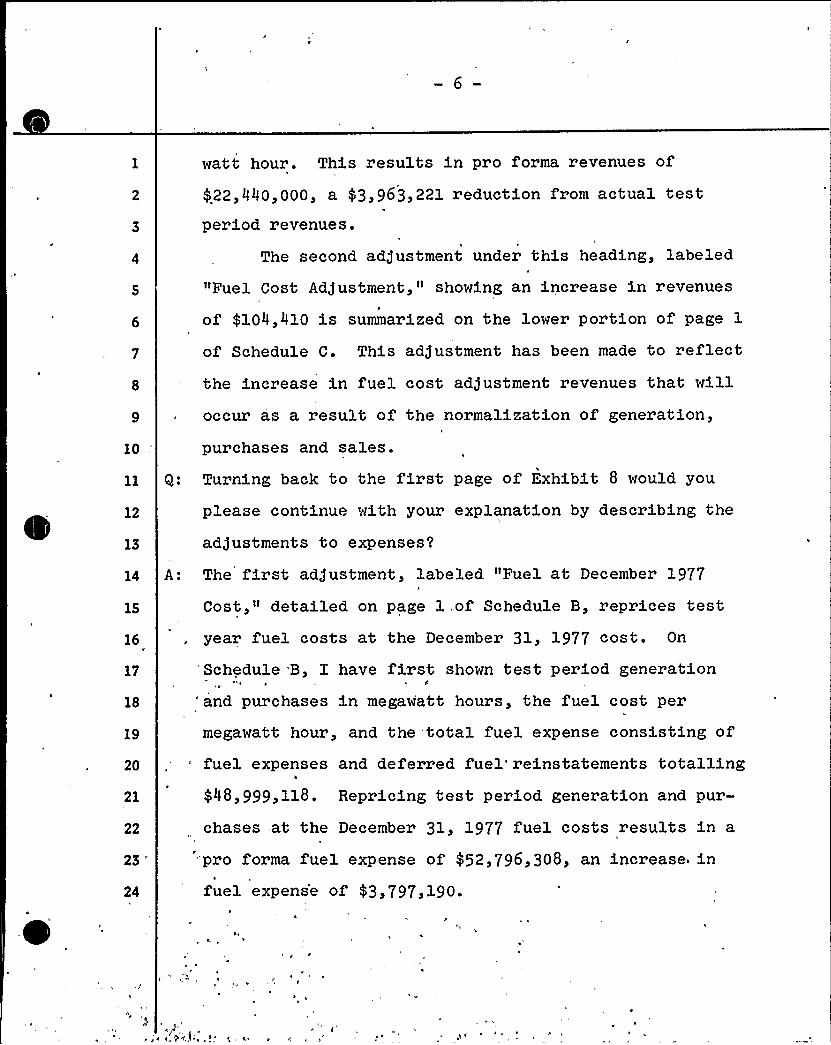
watt hour. This results in pro forma revenues of
$ 22,440,000, a 43,963,22l reduction from actual t;est
period revenues.
The second adjustment under this heading, labeled
"Fuel Cost; Ad)ustment," showing an increase in revenues
of gl04,410 is summarized on the lower portion of page lof Schedule C. This ad/ustment has been made to reflectthe increase in fuel cost adjustment revenues that will
10,
Q:
occur as a result of the normalization of generation,
purchases and. sales.
Turning back to the first page of Exhibit 8 would you
12 please continue .~ith your explanation by describing the
13 adjustments to expenses'?
14
15
A: The first ad)ustment, labeled, "Fuel at December 1977
Cost," detailed on page l,of Schedule B, reprices test
16
17
18
19
20
21
year fuel costs at the December 3l, 1977 cost. On
Schedule B, T. have first shown test period generation
and purchases in megaw'att hours, the fuel cost per
megawatt hour, and the total fuel expense consisting offuel expenses and deferred fuel'einstatements totalling$ 48,999,l18. Repricing test period generation and pur-
22
23"'4
chases at the December 31, l977 fuel costs results in a
pro forma fuel expense of $ 52,796,308, an increase infuel expense of $ 3,797,190.

r
E '-~
The next two adjustments Co expense are under Che
10'2
heading "Steam Produced by the Electric Department.
The first, labeled "Steam Transferred," reflects reduc-
Cion in expense of $1,773, and Che second, labeled "Fuel
used for steam production," a reduction of 4246,340.
Both adjustments are shown on page 2 of Schedule B. The
ad)ustment labeled "Steam transferred" is made to
reprice, at Che December 1977 cost, Che test year steam
produced by the electric department and transferred as a
by-product Co Che Steam Department. On the lower por-tion of the page, I have shown Che ad)ustment Co
reprice, at the December 1977 fuel costs, the fuel used
13 for steam production.
14
16
17
18
19
Two adjustments under the heading "Normalization ofGeneration, Purchases and Sales" are shown on Schedule
C. The first ad)ustment, labeled "PASNY Capacity and
Transmission Charges", reflects an increase of 4389,932
in- capacity and transmission charges for firm capacity
purchases under our Niagara, Gilboa and Fitzpatrick20
21
22
23
24
contracts. Schedule C, page 2, shows the per book
expenses in 1977 for the PASNY capacity and transmission
charges. The lower portion of Che page sets forth Che
contractual charges under our contracts effective duringthe rate year. The pro forma Niagara "firm demand" and
transmission charges reflect a contractual reduction inpurchases Co 130,000 Megawatts, effective March 1, 1978.
10
The pro forma PitzPatrick demand charges reflect; an
increase in the contract rates from 43.50 to $ 6.00 per
megawatt per month, effective September 1, 1977.
An expense ad/ustment of f3,999,265 attributable Co
"Generation and energy purchases", is summarized on
page 3 of Schedule C. This ad)ustment is based upon pro
forma changes in Che levels of generation and purchases.
Mr. Laniak will explain the basis for these adjustments.
12
13
14 "
16
17
18
19
20
21
22
23
24
Q~
A:
I have simply priced Che normalized generation and
energy purchases, as shown on Che lower portion ofpage 3, at Che Decembe'977 cost. This results in a
pro forma expense of 452,088,069, which, when subtracted
from the test period generation and purchases expenses
at December 1977 costs of 456,087,334, produces a pro
forma reduction of $ 3,999,265.
Will you continue with your explanation of Che adjust-ments Co expenses'
The next ad)ustment, in Che amount of 46,571,611,
labeled "Wage and Salary Adjustments," is detailed on
Schedule D. This item adjusts test period payrollcharged Co Che Electric department to reflect currentcomplement at estimated wage rates arid fringe benefit

t
r
4
'I L'
— 9-
10
12
13
14
costs Chat will be effective in the rate year. If you
will turn to Schedule D, you will notice that line 1
reflects Che company's current annual payroll on Che
basis of the February 1978 complement and wage rates.Line 2 reflects the 'company's actual 1977 overtime
expenses. Lines 3 and 4 develop Che increase in expense
currently estimated for wage increases effective on
February 1, 1979 and 1980. Line 5 reflects Che testperiod part time and miscellaneous payroll. The
$ 63,729,993 shown on line 6 is our estimated pro forma
annual payroll for the rate year. Of this amount,
81.145 is applicable Co operating expense (line 7), and
66.35$ of this operating expense payroll is applicable
Co Che Electric Department (line 8). The difference
15
16
17
18
19
20
21
between the pro forma estimated wage expense of
$ 34,309,927 and actual test period payroll expense of
$ 28, 617, 753 is $ 5, 692, 174. The ad) ustment s Co the
related welfare expenses shown on lines 11 through 13,
reflect Che net increase attributable Co three changes:
First, an ad)ustment Co reflect current allocations;second, an ad)ustment Co reflect cost consistent with
22
23
24
the wage levels for Che rate year; and third, in the
case of hospitalization insurance, Co reflect Che cur-
rent cost for this insurance. These 'adjustments total

0
4879,437 and, when added Co the wage and salary adjust-
ment,, result in Che total adjustment of $ 6,571,611.
Q: Mr. Henderson, you indicated Chat these increases forwages effective February 1979 and l980 are estimated, isChat correct'?
6 A: That is correct. Our company has historically given a
cost of living, or inflation, increase in wage rates to
10
12
13
14
hourly paid employees on February 1st of each year. Xn
addition, certain of our hourly employees are eligiblefor merit increases during Che year. Salaried employees
are evaluated on this date for merit increases. While
our salaried employees do not get a general increase,
their merit increases approximate Che overall percentage
increase achieved by hourly employees.
15 Q: Mr. Henderson, how and when are Che wage and salary
16 increases actually established'
17 A: The increases are established in December prior Co Che
18
19
20
21
22
23
24
granting of the wage increase based on data prepared by
our Employee Relations Department and recommended by
management Co Che Board of Directors. The Board ofDirectors can approve or modify the proposed increase.
The increase will, of course, vary depending on several
factors. Recently, inflation has had the most signi-ficant effect on the raises awarded our employees.

.0lt
Therefore, for rate purposes, I have estimated these
increases at 8g or slightly over 1C in excess of the
inflation rate I am using for expense escalation in thisproceeding. The derivation of this inflation rate willbe explained later in my testimony.
Q: Will you please continue with your explanation of Che
remaining expense adjustments?
8 A: The next ad)ustment, labeled "Account 426.10 Donations,"
10
12
13
14
16
17
18
19
20
21
22
23
24
in Che amount of 4298,564, is detailed at Schedule E.
On Schedule E, I have shown total company test period
charges to Account 426.10 in Che amount of 4369,053. Of
these charges, 80.9g, or $ 298,564, has been allocated Co
the electric department, on the basis of net plant as ofDecember 31, 1977.
The next ad)ustment summarized on Schedule E,
labeled "PSC Assessment," shows a decrease of $ 75,993 Co
reflect Che current annual assessment of the Public
Service Commission.
The next ad)ustment to expenses, labeled "Research
and Development," reflects an increase in Che level ofresearch and development expenditures charged to
Electric operations. The detail shows 1978 Research and
Development expenditures of $ 2,393,100, less Chat
portion of Che PSC assessment attributable Co Research

O.
f f
1
'I ~
C
I pV
12—
and Development and internal expenses, which have
already been pro formed in the prior ad)ustment and on
Schedule D. The net adjusted expenditures for Research
and Development are $1,911,100. The difference between
Che pro forma and Che test period expenditures forResearch and Development is 4169,548.
The next ad)ustment Co Expenses labeled "Ginna
security," also summarized on Schedule E, reflects Che
10
12
13
14
16
17
18
19
20
21
22
23
increased cost of security at Ginna Station. Under Che
Nuclear Regulatory Commission's regulations, 10 CFR
73.55, effective August 1, 1977, the Company has been
required Co modify its security operations at Ginna
Station. The annual expenditures necessary to comply
with these regulations will exceed test period expendi-'tures by $ 529,994.
The next three adjustments Co Expenses are sum-
marized on Page 2 of Schedule E. The first, labeled"Insurance," reflects a $ 58,266 increase in the cost ofexcess public liability insurance. "Telephone charges"
increase $ 32,075 Co reflect repricing of test periodtelephone charges on Che basis of current telephone
rates. The third ad)ustment, "Non-recurring expenses"
eliminates test period expenditures totalling $ 33,214
24 that will not be applicable to Che rate year.
— 13—
9„
10
12
13
14
15
16
17
18
19
20
21
22
23
24
The next adjustment under expenses, labeled "Uncol-
lectible Accounts," summarized on page 3 of Schedule E,
reflects Che pro forma adjustments made to customer
revenues. Applying Co pro formed customer revenues the
current .710$ ratio of uncollectible accounts Co cus-.
tomer revenues results in a provision for uncollectable
accounts of $1,360,701. This amount exceeds the testperiod provision for uncollectable accounts by $ 82,375.
In a similar manner, Che adjustment Co "Injuriesand damages accrual" also reflects Che Pro forma changes
in customer revenues. This adjustment is also shown on
page 3 of Schedule E.
The adjustment labeled "Interdepartmental charges,"
an increase of $ 26,758, is summarized on Schedule F.
This adjustment reprices test period use of electricityby other departments and steam by the Electric Depart-
ment at December, 1977 costs. It also reflects gas used
by the. Electric Department at January 2, 1978 costs.
The lash adjustment Co expenses, labeled "Allowance
for Escalation" totals 44,369,255. This adjustment has
been made Co reflect Che estimated increase in testperiod operating expenses for which a specific Pro forma
adjustment has not been made. This adjustment seeks toaccount for general increases in expenses Chat will

L
— 14--
result from inflation. The details of this adjustment
are shown in Schedule E of Exhibit; 10. A more detailedexplanation of this adjustment will be given in my
testimony relating to that Exhibit and Schedule.\
Q: Will you return Co the first page of this Exhibit; and
explain your adjustments under "Depreciation".A: The first adjustment Co Depreciation, labeled "Accruals
effective December 1, 1977," in t'e amount of $ 199,674,
reflects the changes in depreciation accruals, effective10
12
13
14
15
16
17
18
19
December 1, 1977, pursuant to Che Commission Order incase 27108. The det;ail of these changes are shown on
page 1 of Schedule H.
The second adjustment, labeled "Accruals effectiveMay 1, 1979," increases depreciation expenses by
$ 213,678. The changes in depreciation- rates reflectedin this adjustme'nt are based on our most recent depre-
ciation studies which included updated net salvage
studies similar to Che ones performed by staff in Case
27108. We are proposing Co place in effect increased20 depreciation rates concurrently with the implementation21
22
23
24
of rates established in this proceeding. These changes
are summarized on page 2 of Schedule H.
The third adjust;ment to depreciation is labeled"Ginna Normalization" and has been made to reflect; Che

—'l5—
annualization of depreciation expense on the new low
pressure rotor Chat was installed at Ginna Station inChe spring of 1978. The normalization of generation
described in Schedule C includes the increased Ginna
rating to 470 megawatts, an increase made possible by
the installation of the rotor. The cost of Che rotor is
10
12
13
14
an appropriate addition to rate base. Correspondingly,
an appropriate level of depreciation expense related tothe rotor is reflected in this ad)ustment.'he deriva-tion of this ad)ustment, as well as the ad)ustment torate base, are shown on Schedule N.
The last ad)ustment Co depreciation, "Non revenue
producing capital expenditures," is consistent with Che
Pro forma ad/ustment Co rate base for non-'revenue
16
17
18
19
20
21
22
23
24
producing capital expenditures. I have reflected Chee
increase of $ 571,800 of depreciation expense appliable
to these additions. This adjustment is summarized atSchedule N.
Q: Returning Co the first page of this exhibit, under the
caption "Taxes Other Than In'come", would you please
explain the ad)ustment labeled "Real property 8 specialfranchise taxes and water pollution control charges,"
reflecting an increase in taxes of fl,420,508'?
A: This ad)ustment is shown on page 1 of 'Schedule I and
-16-
updates these test period expenses to the levels anti-cipated for the year 1978. On the upper portion of Chat
page, I have shown, by Che various taxing Jurisdictions,Che 1977 total Company Cax and Che allocation of Chat
tax to the Electric, Gas and Steam departments. The
amounts for Che City of Rochester, School and Water
pollution are estimated 1978 taxes. All of the others
are actual 1978 taxes. This is Che same information
10
12
13
filed with Che Commission Co support our supplemental
rate filing which became effective in February, 1978.
This filing was authorized pursuant to Che Order, inCases 27108*and 27109, and was designed to recover wage
and tax increases.
14
15
Q: Mr. Henderson, could you explain how the Company allo-cates its property taxes to departments.
16 A: Yes. The amount of taxes directly applicable to each
17 department is determined by detailed analysis of depart-
18
19
20
21
mental. use of each of the Company's various individualproperty units. Common properties are allocated on the
basis of common utility plant allocation percentages
which I will explain later.22 Q: Would you continue with your explanations of the adgust-
23 ments Co taxes other than income.
24 A: A reduction in "Water use charges" of $ 5,969 has been

I
— 17—
made Co reflect the current lower Cax charged on water
consumption, effective January l, 1978. The details ofthis ad)ustment are shown on page 2 of Schedule I.
An increase of 4059,658 in "Revenue Taxes,"
detailed at page 3 of Exhibit I, reflects revenue taxes
applicable Co the pro forma revenues shown in thisexhibit.
10
The ad)ustment labeled "Payroll taxes", an increaseof 4673,793, is shown on page 4 of Schedule I, and
reflects Che payroll taxes applicable in Che zate year.
12
13
14
This schedule shows Che taxable wage base for Social
Security and Medicare in effect for Che calendar year
1979 and l980, as well as Che current taxable wage baset
for federal and New York State unemployment insurance.
16
17
18
19
20
21
22
23
24
From the taxable wage base and Che pro forma wages
applicable to each period, I have derived Che pro forma
taxable wages for each of Che periods. Using Che Cax
rates under current law, I have derived Che pro forma
taxes for Che rate year. Of these company taxes, 83.02$
are allocated Co operating expense, of which-66.35$ , or
$ 2,110,780, is applicable Co the electric department.
The difference between pro forma and actual payrolltaxes is 4673,793.
The next Ad)ustment relates to "Sales and Use

'1
3
10
12
13
14
15
16
17
,Taxes." I have increased the allowance for "Sales and
Use Taxes" to reflect Che fact Chat as the Company's
cost for materials and supplies escalate, the liabilityfor sales and use Cax will also increase. Applying our
estimated escalation rate of l6.1545% for materials and
supplies derived in Exhibit 10, I have estimated Chat
the rate year sales and use taxes wi|.l increase to
$ 2,40l,674. Using Che percentage applicable first Co
operating expense, in general,'nd then Che percentage
'pplicable Co the Electric department, in particular,the pro forma figure of 4798,919 is derived. Sub-
Cracting Che test period charges of 47l9,236 from the
pro forma taxes results in Che increase of $ 79,683.
This calculation is set forth at page 5, Schedule I.The last ad)ustment under "Taxes — Other Than
Income", labeled "Excess dividends Cax," reflects Che
rate year level of excess dividends taxes applicable to18
19
20
21
22
23
24
Che Electric department. The ac+ustment, as derived on
page 6 of Schedule I, sets out Che estimated equitybalance as of April 30, l980, which will be used Co
determine Che excess dividends tax. The excess
dividends Cax is applied to dividends which exceed 4$ ofChe equity balance. Thus, applying the 4g rate to our
April 30; 1980 equity balance results'n a base for

-19-
dividend comparison of 416,240,855. RGhE's anticipateddividends for Che 12 months ended April 30, 1980 are
$ 40,163,205, resulting in a taxable base of $ 23,922,350.
Applying the current excess dividends tax rate of 4.5g
results in a pro forma excess dividends Cax of$ 1,076,505, $ 281,817 greater than the comparable testperiod expense. Of this Cax increas'e, 87.785, or
$ 247,378, has Chen been allocated Co Che electricdepartment.
10
12
13
14
15
16
17
18
19
20
21
22
23
24
Q: The next adjustment is a downward revision Co Federal
Income Tax in the amount of $5,487,000. Mould you
please explain this ad)ustment'?
A: This ad)ustment is detailed on page 1 of Schedule J ofExhibit 8. This schedule is a computation of Che
federal income Cax applicable Co Che Electric depart-ment. Page 1, Column 1, of Schedule J reflects Che testperiod Electric Department per books computation offederal income Cax. Column 2 reflects adjustments made
Co Che books'igures which are required Co translatefederal income Cax per books into an allowance forfederal income Cax related Co pro forma Electric Depart-ment operations. Column 3 simply reflects the pro forma
income tax resulting from the adjustments made in column
2 ~

f'
20—
Q: Would you please comment on the adjustments shown inColumn 2'?
A: These adjustments are primarily of three general types.The first adjusts for a change in Cax deductions
directly related to .known changes made in Che statement
of income, such as the change in fuel cost resultingfrom the elimination of fuel cost deferrals. Other
10
12
13
14
examples of this kind of an ad)ustment are Che4
following: "pension costs capitalized;" and "taxes
charged to construction" which are both related Co
changes in wages and salaries; and "additional deduc-
tible depreciation," which reflects changes in book
depreciation accruals. The second type of adjustment
reflects current departmental allocations. The third
16
17
18
19
20
21
22
23
24
ad)ustment shown on Schedule J reflects a change ininterest charges on Che basis of Che company's rate year
capital structure.Q: Mr. Henderson, are there any of Che components of Che
Cax computation which are shown for Che first time inthe year l977'?
A: Yes, Chere are Cwo such items. The first is Che itemlabeled "Nuclear Fuel Storage Costs," which increasestaxable income by 46,97l,000. The second is the itemlabeled "Fossil Plant Abandonment," which reduces

1
21
10
taxable income by 44,500,000. "Nuclear Fuel Storage
Costs," reflect the amortization of nuclear fuel expense
applicable Co future storage cost for nuclear fuel which
is non-deductible for tax purposes. In 1977, as a
result of a change in federal policy which now pro-
scribes nuclear fuel reprocessing, the Company revised
its calculations to provide for Che cost of estimated
permanent storage for spent nuclear fuel. We are,
however, unable Co Cake a current tax deduction forthese estimated. future storage costs. We reflected thisin the Company's 1977 results of operations .and also
12
13
14
16
17
18
19
adopted prepaid Cax accounting for Che timing difference
that results from Che different treatment of thisexpense for book and tax purposes. The Company cur-
rently has a petition pending before the Public Service
Commission Co approve this use of prepaid Cax account-
ing.,The next item, labeled "fossil Plant Abandonment,"
is also new in Che year 1977 and again is Che subject of20
21
22
23
a Petition for approval of accounting treatment pending
before Che Commission. In 1977, we have taken a tax
deduction for costs attributable to the Sterling FossilN
Plant. We have requested deferred Cax accounting for24 this to allocate such tax benefit as 'an offset Co Che

,
22—
ultimate expenses attributable t'o recapture of the loss.
This is, of course, a non-recurring item and has been
10
12
13
14
eliminated in the determination of pro forma Federal
income tax.
Q: Returning to page l of the Exhibit, would you please
continue by explaining the next adjustment under the
heading "Provision for Deferred income Taxes Net", a
decrease of 42,959,528.
A: This ad)ustment has been made to eliminate the deferred
taxes applicable to deferred fuel accounting followed
for book accounting purposes. ln addition, adjustments
have been made to proform deferred income taxes related
to non revenue producing capital expenditures as well as
to, eliminate the deferral applicable to the nonrecurring
16
17
18
19
20
21
22
23
24
fossil plant abandonment tax deduction which I have
gust discussed.
Q: The next ad)ustment shown on Page l of Exhibit 8 isentitled Xnterperiod Tax Allocation." Wou3,d you please
explain this ad)ustment'?
A: The ad)ustment has been made to reflect, for rate pur-
poses, the use of net of tax, AFUDC accounting for the
investment in Oswego ¹6, Nine Mile Point ¹2, and
Sterling. The Company, in Case 27108, was authorized toadopt net of tax, AFUDC accounting for Oswego ¹6 and

't
H
-23-
10
12
13
14
Nine Mile Point ¹2. In this p'roceeding, we ar'
requesting permission to extend net of Cax, AFUDC
accounting to our investment in the Sterling Plant. On
Page 3 of Schedule J, I have shown Che test period AFUDC
accruals for the three plants, adjusted in the case of
Oswego ¹6 and Nine Mile Point ¹2 Co exclude Che impact
of net of tax, AFUDC for December 1977. Applying 46.5$ ,h
the interest portion of our current AFUDC rate, to the
test period accruals of 49,074,818 results in 44,219,790
as the interest portion of Che test period accruals.
Application of Che 48$ federal income tax rate to the
interest portion of Che accrual, results in the pro
forma adjustment of $ 2,025,500.
Q: How was the adjustment for Investment Tax Credit
15 derived?
16
17
18
19
20
21
A: The next ad)ustment, labeled "Investment Tax Credit
Ad)ustment", an increase of $ 1,935,500, has been made Co
reflect an appropriate pro forma adjustment to Che
investment tax credit utilized in computing pro forma
federal income tax expense. On page 4 of Schedule J,you will see that on the upper portion I have shown Che
22
24
investment Cax credit generated in 1977 in the amount of
$ 6,816,000. However, as shown in Che Exhibit one linebelow, the Company was only able Co utilize 44,615,000 .

.0
24—
10
12
14
16
17
18
of investment Cax credits in 1977. The difference of
$ 2,201,000 is shown as an adjustment to Federal income
Cax on Schedule J, Page 1.
In accordance with Che Commission's statement of
policy, 50$ of Che 4g credit, which is accounted for on
a flow through basis, is shared between customers and
shareholders. The Company elected under Section 46 of
the Internal Revenue Code Co have Che additional 6g
investment tax credit; Chat became available under the
1975 Tax Reform act Co be Created on a normalized basis.
This adjustment is summarized on the lower portion of
the page and is carried forward Co page 1 of the
Exhibit.
Q: Returning to the first page of Exhibit; 8, will you
explain Che adjustment labeled "Adjustment of Allowance
for Funds Used During Construction'"
A: This adjustment, reflects Che fact; that'he Company has
not taken into consideration all of Che construction
19
20
work in progress balances when computing the allowance
for funds used during construction on its books. The
21 adjustment recognizes the fact that Che Company should
22
23
be permitted Co reflect in balance for return an allow-
ance for the amount of interest on these non-interest
24 bearing construction expenditures. This adjustment in

0I 'I
II
Che amount of $ 704,105 is summarized on Schedule K ofthis exhibit.
3 Q: Would you please explain the ad)ustment entitled "Divi-dends Received from Canadea Power Corporation?"
5 A: This ad/ustment, in Che amount of $ 120,000, represents
dividends received from Che Company's subsidiary,Canadea Power Corporation. Tn accordance with Che
10
Uniform Systems of Accounts, these dividends are not
included in operating income. The Company leases a dam
from this corporation and the lease payments are
12
13
14
15
16
17
included as part of Che Company's operating expenses.
Accordingly, we are including, for rate purposes, Che
dividends received from this corporation as an ad)ust-ment to operating income.
The net effect of Che known adjustments itemized incolumn 2 of page 1 of Exh. 8 is a decrease of $ 4,405,313
in "Balance for return."18 Q: Directing your,attention now Co column 1 on the first19
20
page of Exhibit 8, please explain the development of Che
average rate base figure of $ 425,848,853.
21 A: The details of this computation are shown on Schedule L.
22
23,
. 24
Page l of Schedule L shows the monthly balances of the
net Electric plant in service for Che period December
1976 through December l977. The average Electric plant

-26-
10
in service of 4408,431,266 is computed using the average
of the monthly averages. To this'igure, 434,030,875 isadded for electric department working capital,$ 7,176,778 is deducted for accumulated deferred income
taxes, and $ 4,695,142 is deducted for accumulated
deferred investment tax credits. This results in an
average rate base before ad)ustment for excess capital-ization of 4430,590,221. I have then deducted
44,741,368, Che amount of earnings base in excess ofcapitalization, to arrive at Che net average rate base
12
"
13
as shown on Che first page of this exhibit. The deriva-tion of the monthly balances of Che net electric plantin service are detailed on page 2 of this schedule. The
14
15
derivation of working capital is detailed on pages 5
through 9. Computation of the deferred income taxes and
16
17
18
investment Cax credits, are shown on page 10 and a
summary of Che earnings base in excess of capitalizationis shown on page ll of this exhibit.
19 Q: Mould you explain Che formulas used for allocating20
21
common utility plant in service Co Che electric depart-ment?
22 A: Common utility plant in service is divided into two
23 categories: ~tTransportation Equipment~t and npther n
24 The dollar value of transportation equipment in Account

~
-27-
10
392 is assigned to the Electric, Gas or Steam Depart-
ments based upon the use of vehicles by each of these
departments. This figure is computed at the end of each
calendar year and the resulting percentages are used forthat December and for the ensuing 11 months. At Decem-
ber 31, 1976 the percentage of transportation equipment
applicable to the electric department was 74.2$ and at
December 31, 1977, 75.3$ .
The remaining amounts of common utility plant are
allocated to the Electric, Gas and Steam Departments,
giving consideration to space occupied, number of cus-
12
13
14
15
16
17
18
19
20
21
22
23
tomers, number of employees, and departmental clearingof shop expenses. Again, these allocations are made at
the end of each calendar year and the resulting percent-
ages are used for that December and the ensuing llmonths. The composite percentage at December 31, 1976
applicable to the electric department was 66.5C and at
December 31, 1977, 67.9g. These percentages are shown
on the lower portions of pages 3 and 4, respectively, ofSchedule L.
Q: Was the same method of allocating common utility plantin service to the electric department also used to allo-cate the common utility "Field completed construction
24 work in progress'?"

0
28
A: Yes, but the construction work in progress amounts, are
analyzed and computed separately in arriving at com-
posite percentages.
4 Q: Mould you turn to page 5 of this schedule and continue
10
12
with your explanation.
A: Page 5 is a summary of the computation of the ElectricDepartment's "Allowance for working capital" which
totals 434,030,875. The Company has computed the
working capital allowance under the method traditionallyused by the Commission. The first component of working
capital, "Materials and Supplies", in the amount of
$ 7,094,24l, is shown on page 6. An average of the
monthly average balances for the 12 months of 1977 is14
15
16
17
18
19
20
21
22
23
24
derived from the monthly balances of the various
specific electric stock divisions. A similar com-
putation is made for general materials and supplies
accounts, which are then allocated to departments on the
basis of net plant as of December 31, 1977.
The next component, oil stock, in the amount of$ 1,635,725 is shown on page 7. The average oil stock
for the 12 months ending December l977 for stations 3, 7
and 9 and the pro)ected minimum reserve stock of number
6 and number 2 oil is shown. The percentage of oilstock applicable to the Electric Department is based on

0
29
10
12
13
14
16
17
18
19
20
21
usage during the test period. The December 31, 1977
cost of fuel has been used to determine Che working cap-
ital allowance.
The next; component of working capital, coal stock
is detailed at page 8. The average coal stock for Che
12 months ending December 31, 1977 was 166,313 Cons.
However, for computation of working capital on a
prospective basis, l have used the pro)ected average of
210,000 Cons which Che company intends to maintain.
Again, using December 1977 cost of $ 30.37 per Con, Iderived the coal stock working capital allowance of
$ 6,378,120.
The allowance for "Coal is transit", is shown on
Che lower portion of page 8. Using Che average testyear amount of coal in transit of 35,979 tons at Che
December 1977 cost results in a 41,092,754 working
capital allowance.
The computation of Prepayments is set forth on
page 9. The average of thirteen monthly balances,
December 1976 through December 1977; are used to arriveat Che average balance of 45,760,130. Applying the
22
23
24
ratio at December 31, 1977 of the electric department
net plant; Co total company net plant (80.9$ ), yields a
Prepayments balance of 44,659,945.

0
30—
10
12
13
14
15
The last component of working capital, operation
and maintenance expense, is shown on the lower portion
of page 9 in Che amount of 413,170,090. This represents
l/8 of Che Electric Department's operation and main-
tenance expense, excluding Che cost of purchased power.
The next two items in Che development of average
rate base are shown on page 10 of Schedule L, and are
both reductions. The first represents the average
balance of accumulated deferred income taxes of$ 7,176,778. The second is a reduction equal to the
average balance of accumulated deferred investment taxcredits of 44,695,l42. These totals reflect the average
of the monthly averages of the balances in each account.
The last item used Co derive Che average rate base
is Che ad)ustment for earnings base in excess of16 capitalization. This adjustment is shown on page ll of17
18
Schedule L. T. have shown Che total company test periodEarnings Base of 4712,768,922, allocated by department.
19
20
The allocation of capitalization was derived by
utilizing the same percentages. Since Earnings Base
21
22
23
24
exceeds Capitalization, a net reduction in rate base
applicable Co Che Electric Department of $ 4,74l,368 was
necessary.
Q Mr. Henderson, has the derivation of the capitalization
31—
been computed in the manner adopted by this Commission'
2 A: Yes, it has. We have used daily balances in derivationof total company capitalization for the following items:
long-term debt, short-term debt and temporary cash
investments. All of Che other components of capitaliza-tion are based on monthly average balances.
7 Q: Mr. Henderson, are you in agreement Chat the derivationof capitalization as shown on this page is the proper
means of determining capitalization for this ad/ustment?
10 A: No, I am not. Although this issue was litigated in
12
13
prior proceedings, I still believe that this method ofmixing average daily and average mont;hly balances isboth invalid and illogical. However, based on t;he
14
15
16
Commission's policy requesting that parties in rate case
proceedings not relitigate issues once decided, we shallnot pursue the issue in this proceeding.
17 Q: Would you continue by explaining Che'known adjustments
18 t o average rate base.
19 A: The first ad)ustment, a reduction Co average rat;e base,
20
21
22
23
24
is labeled "Accruals Effective December 1, 1977." This
ad)ustment, summarized on page 1 of Schedule H, reduces
average rate base consistent with the pro forma adgust-
ment for Che increase in depreciation accruals effectiveDecember 1, 1977 which I have already discussed.

0
-32-
ln a similar manner, the next adjustment, labeled
"Accruals Effective May 1, 1979," a reduction of
$ l06,839, has been made to reduce average rate base
consistent with the pro forma adjustment for the
increase in depreciation accruals, also discussed
earlier. This adjustment is summarized on the lower
7'0
12
portion of Page 2 of Schedule H.
The next adjustment labeled "Ginna Normalization",
an increase of $ 4,088,059, reflects the investment for
the new rotor necessary to allow the plant to return to
its normal capacity. This adjustment is shown on the
upper portion of Schedule M.
13
14
15
16
17
1e
19
20
21
22
The next adjustment to average rate base, labeled"Non Revenue Producing Capital Expenditures," totals$ 28,797,100. The derivation of this adjustment is shown
on Schedule N. In our last electric rate case, the Com-
mission authorized us to include in rate base two non-
revenue producing plant additions totalling $ 21,600,000.
These two additions which went into service in l977 are
reflected in the average test period net plant inservice in the amount of $ 6,296,000 and a reduction istherefore appropriate. A further reduction of $ 285,900
23
24
or one half of the increased depreciation expense isalso shown. Reducing the gross figure by the amount
-33-
5
10
12
13
14
'15
16
17
18
included in net plant in service results in a pro forma
increase in average rate base of $ 15,018,l00.t
The next component of this ad)ustment in Che amount
of $ 4,378,000, represents a transfer Co rate base, aso9
"plant held for future use," Chat portion of the
Sterling plant site c'urrently recorded in construction
work in progress not certified in case 80005. Xn a
prior rate proceeding, Case No. 26848, Che Commission
ordered that all land purchased for the Sterling nuclear
plant be'placed in interest-bearing construction work inprogress. Accordingly, at the conclusion of that case
we did transfer from "plant held for future use" to
"construction work in progress," Che land purchased forthe Sterling nuclear plant. The Siting Board certifiedl244 acres of Che 2800 acre site as applicable Co Che
Sterling plant. Therefore, consistent with thiscertification, we are pr oposing that Che balance of thisland investment be transferred to plant held for future
19
20
use, when the rates established in this proceeding
become effective. This procedure has two benefits.21
22
First, it will alleviate some of the tremendous cash
flow problems Che company is facing, which I will dis-23
24
cuss later. Second, it will stop increasing Che Com-I
pany's investment in this property through the accrual
10
12
13
14
15
16
17
18
19
of additional AFUDC.
The next component of non-revenue producing capitalexpenditures is labeled "Sterling fossil unit" in Che
amount of 47,37l,000. As previously mentioned, in 1977
Che Company claimed this project as a loss for Cax pur-poses. The Company has petitioned the Commission fordeferred income Cax accounting for Che resulting reduc-
tion in Federal income taxes. This proposed tax defer-ral is included in the deferred taxes shown on page 10
of Schedule L; in Curn, those deferred taxes are used Co
reduce rate base as shown on page 1 of Schedule L. Thus
the ratepayer is to have the benefit, in this proceed-
ing, of the Cax loss attributable to this project. Itwould seem appropriate that Che capital dollars which
give rise Co Chat Cax loss likewise be included in ratebase. Further, so long as these dollars remain in Con-
struction Work In Progress, they will continue to accrue
AFUDC. Putting Che current; balance for Che project inrate base at this time will stop Che build-up of Che
20 investment. This will benefit; ratepayers in the long21
22
23
24
run since less will be added Co rate base now than would
be added later if Che project remains in CWIP.
The last component of this adjustment, labeled Che
"Hojack Line right-of-way," reflects," for rate purposes,
10
12
13
14
15
the annualization and inclusion in rate base of thisitem. The Hogback Line right-of-way was purchased for$ 2,030,000 in January of l978 and is currently recorded
in Electric Plant in Service.
The next ad)ustment Co average rate base shown on
Schedule 0, labeled Canadea Power Corporation, has been
made to include in rate base the company's investment inits, wholly-owned subsidiary, Canadea Power Corporation.
On Schedule 0, i have shown Canadea's average,
capitalization for the test period consisting of4684,000 of long term debt, a reduction of $ 33,843 forCanadea's investment in RG&E's preferred stock,41,447,166 of retained earnings and a reduction of$ 585,000 for temporary cash investments, resulting in a
total average capitalization of $ 1,5l2,323.
16
17
18
19
20
Q: Was the inclusion of RG&E's investment in Canadea Power
Corporation in rate base a contested item in Che Com-
pany's last rate proceeding'?
A: Yes, it was. ln that proceeding, Che Company claimed
Chat RG&E's investment in Canadea Power Corporation
21
22
23
24"
should be included in rate base. Staff and the Com-
mission disagreed on the basis Chat an original cost
study had not been performed for Canadea Power Corpora-
tion. Me have subsequently supplied 'Staff with a copy

I 0
— 36—
of Che Canadea original cost documents.
The last adjustment, labeled. "Working capital,"represents the ad)ustment Co Che working capitalallowance .esulting from the known adjustments made Co
expenses, as shown on the Schedule P.
As a result of the adjustments Co rate base, Che
average pro forma rate base is 4461,171,084. The Pro
forma rate of return is 6.95% as shown in Column 3 on
Che first page of this exhibit.
12
Q: Mr. Henderson, would you please describe Che adjustmentsshown in column 4 under the heading "Proposed Revenue
Increase"'?
14
15
16
17
18
19
20
21
'22
23
24
A: Column 4 shows Che revenue increase which will resultfrom the rates proposed in this proceeding; as sh'own on
4
Exhibit 17, and Che corresponding changes in expenses,
taxes, and rate base. Page 2 of Exhibit 8 sets forththe details of the adjustments shown in column 4.
The ad)ustment labeled "Attrition", demonstratesChe impact of growth in the rate year which is dispropor-tionate Co Che historical proportion of revene 'growth Co
expense increases and rate base growth. The rates requestedhave taken this factor into account and, absent this, Che
proposed rates would not produce Che requested rate ofreturn in Che rate year.

k ~
0:
— 37—
10
This adjustment is required to reflect the impact
of overall costs increasing at a rate greater than the
increase in revenues. In essence, absent this adjustment,
not all of the rate year changes, as detailed in Exhibit 10
which I will subsequently discuss, will be reflected in
this Exhibit 8 presentation. Many of the specific changes
which underly this Attrition adjustment are readily dis-cernable from a review of Exhibit 10. If rates were set
in this proceeding without taking this adjustment intoaccount, such rates could not produce the requested rate
12
13
14
15
16
17 ~
of return in the rate year.
Column 5, labeled "Adjusted Pro Porma" is the sum
of the adjustments shown in columns 3 and 4. The adjusted
Pro Forma Balance for return in column 5, of 446,351,2ll,
applied to the adjusted Pro Porma Average rate base of
4461,206,084, produces a rate of return of 10.054.
18
19
20
21
22
23
24

4
1
L
38
Q: Will you please describe and explain .Exhibit 9 and state
what it purports to show'?
A: This exhibit develops, for the Gas department, a rate of
return per books and pro forma for the twelve months
ended December 31, 1977. The format is the same as
Exhibit 8. Column 1 of page 1 is a statement of Gas
Department revenues, expenses, operating income and rateof return per books. Column 2 contains pro 'forma
10
12
13
14
adjustments to these book figures. These adjustments
are'escribed along the left hand side of the page and
cross-referenced to a schedule providing details of the
adjustment. Column 3 is the pro forma result of apply-ing Che adjustments in Colum» 2 to the book figures inColumn 1. Column 4 reflects the proposed gas rate
15 increase sought in this proceeding and column 5 reflects16
17
'the ad)usted Pro Forma Income Statement and Rate of*
Return including the proposed increase.18 Q: Will you now refer to column 1 and explain the
19 information shown Chere?
20 A: Column 1 is a statement of the revenues and expenses per21
22
24
books for the 12 months ended December 31, 1977. The
Balance for return of $ 8,184,939 applied to the average
rate base of $127,832,611 produces a rate of return perbooks of 6.40$ .
-39-
Q: Mould you please explain column 2 of this exhibit,labeled "Pro Forma ad jus tment s"?
A: Yes.'owever, be fore I explain the ad) ustments shown in
10
column 2, .I would like to point out Chat many of Che
adjustments in- this exhibit were prepared in exactly Che
same manner and for Che same reasons that corresponding
adjustments were prepared for Che Electric Department,
as shown in Exhibit 8. Therefore, in most cases, unless
Che adjustment is unique to Che Gas Department or Che)f
rationale for the ad)ustment differs from Chat appli-
12
13
14
15
cable to the Electric Department, I will not discuss the
particular adjustment.
The first, adjustment to revenues, labeled
annualization of rate increases, in Che amount of
$ 2,$ 16,322, is summarized on Che upper portion of
16
17
18
'Schedule A. This'ad)ustment reflects annualizat'ion ofChe rate increases effective November 1977 and February,
l978.
19
20
21
The next adjustment, labeled "Unbilled revenues", a
decrease in revenues in the amount of 4l,437,063, is,also summarized'on Schedule A. Unbilled, revenues are
22
23
24
revenues attributable to sales during a calendar year
(December) which are not recorded and billed until Che
following year (January). The adjustment for unbilled
revenues reflects Che difference between such amounts as
of January 1977 and January 1978.
The next adjustment, labeled "Weather Normali-
zation", reflects Che fact Chat Che weather during Che
test period was warmer than normal. Consistent withCommission policy, we have adjusted revenues for ratecase purposes Co reflect normal (i.e. colder) weather.
10
This adjus'tment is summarized on the upper portion ofpage 1 of Schedule B.
The next adjustment Co revenues, an increase of$ 3,021,804, labeled GCA revenues at January 2, 1978 cost
12
13
14
of gas, reflects the GCA revenues Chat would have been
received by annualizing Che January 2', 1978 cost of pur-chased gas. The details of this adjustment are sum-
15
16
17
18
marized on the lower portion of page 1 of Schedule B.
The adjustment Co revenues labeled "Purchased gas
curtailment," shown on page 2 of Schedule B, reflectsthe fact that due to volumetric limitations and force
19
20
21
22
23
24
majeure curtailment during Che test period, gas sales
were 1,218,678 thousand cubic feet lower Chan normal.
These sales at rates effective February 1978 would have
produced $ 2,954,169 of additional revenue.
The last adjustment tn revenues, labeled "Space-
heating refund," reflects the Company's $ 10 rebate Co

(I
all space heating customers. As shown on Che lower por-
tion of page 2 of Schedule B, the number of February
1977 spaceneating bills Co which this $ 10 rebate applied
was 1/3,637, resulting in a total revenue reduction,
after applying Rule 4.7, of 41,600,437.
Q: Returning Co the first page of this exhibit, would you
10
A:
explain your known adjustments to expense-'?
The adjustment, "Weather. normalization," shown onJ
Schedule D, reflects increased gas purchases over Chose
which occurred during Che warmer than normal test
12
13
14
15
16
17
18
19
20
21
22
23
period. The increased purchases, priced at the Janu-
ary 2, 1978 cost of purchased gas, result in Che pro
forma increase of $ 12,090.
Also summarized on Schedule D is an adjustment of$ 2,629,392, representing an increase in Che cost of pur-'chased gas. This adjustment reprices test period pur-chases at Che January 2, 1978 cost of gas, consistent
with Che adjustment Co revenues labeled "GCA revenues atJanuary 2, 1978 cost of gas."
.The next adjustment Co expenses summarized on Che
lower portion of Schedule D, "Purchased .gas curtailment",has been made Co reflect additional purchased gas
expense Chat would have been incurred but for Che
24 purchased gas eurtailments.

*a O.
-42-
The last unique ad)ustment is labeled "Leak detec-
Cion, recording and repair," in, Che amount of $ 350,000.
This reflects an est;imate of Che annual incremental
costs to comply with revised Commission mandated proce-
dures for the surveying for, recording of data inconnection with, Che repair of, and Che post-repairsurveying of, leaks in Che gas distribution system. The
estimate is Che best available est;imate which could be
10
12
13
made at Che time of Che Company's filing. By Che time
of cross-examination X expect to be able to provide more
det;ail "n connection with t;his ad)ustment. This adjust-ment is shown on schedule E, page 2.
Q: Nr. Henderson, would you "eturn Co Che first page of Che
14 Exhibit and explain the pro forma ad)ustment labeled15
16
"Amortization of Extraordinary Property Losses", an
ad) ust;ment of 4l54, 706?
17
18
A: Yes. During 1977 the Company completed Che accounting
for the retirement and abandonment of its manufacturing19
20
21
22
23
24
gas facilities. The net result of the retirement was a
loss of gl54,706. This was charged Co account No. 407.10
in accordance with PSC Order dated April 12, 1977. Since
Che loss is a nonrecurring item, it is being adjusted orat
of Che test period for ratemaking purposes.
Q. Would you please continue with your explanation of this

t
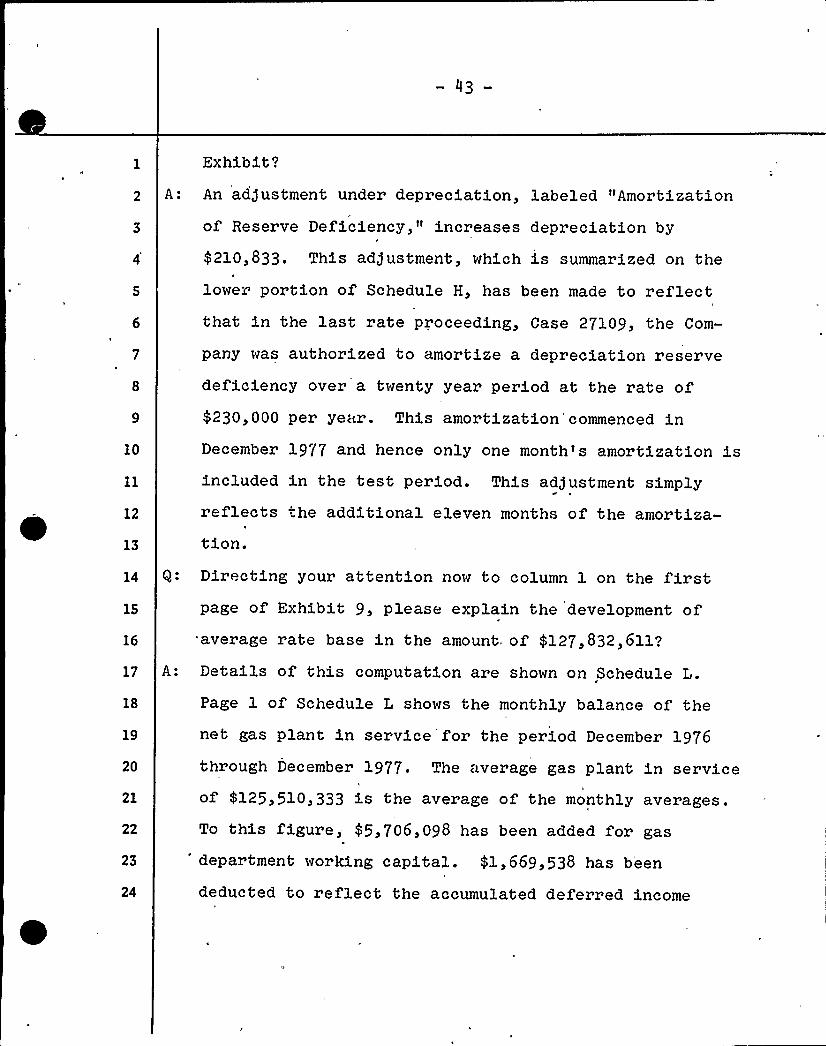
43
Exhibit'
2 A: An adjustment under depreciation, labeled "Amortization
10
12
of Reserve Deficiency," increases depreciation by
$ 210,833. This adjustment, which is summarized on the
lower portion of Schedule H, has been made to reflectChat in Che last rate proceeding, Case 27109, Che Com-
pany was authorized Co amortize a depreciation reserve
deficiency over a twenty year period at the rate of$ 230,000 per year. This amortization'commenced inDecember 1977 and hence only one month's amortization isincluded in Che test period. This adjustment simplyreflects Che additional eleven months of Che amortiza-tion.
l4 Q: Directing your attention now Co column 1 on Che first15
16
page of Exhibit 9, please explain Che development of'average rate base in Che amount, of $ 127,832,611?
17 A: Details of this computation are shown on Schedule L.
18
19
20
21
22
23
Page 1 of Schedule L shows Che monthly balance of thenet gas plant in service for Che period December 1976
through December 1977. The average gas plant in serviceof $125,510,333 is the average of Che monthly averages.
To this figure,- 45,706,098 has been added for gas
department working capital. 41,669,538 has been
24 deducted Co reflect Che accumulated deferred income

1
,a
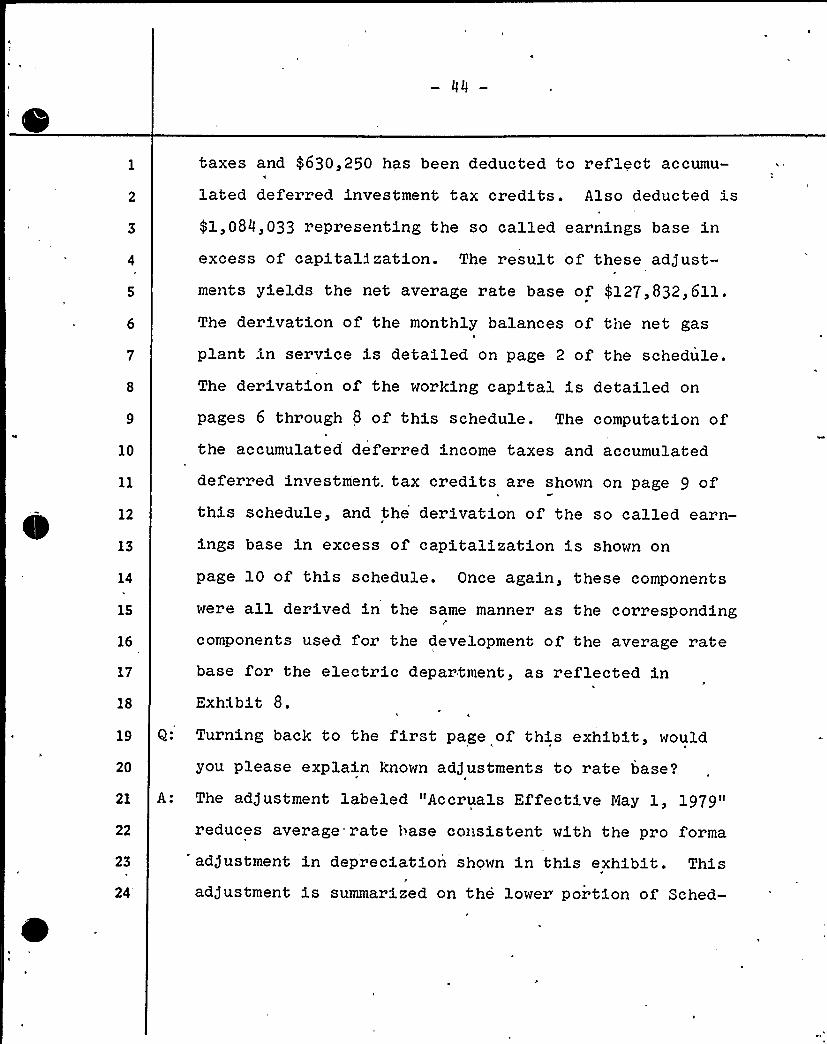
-44-
t'axes and 4630,250 has been deducted Co reflect accumu-
lated deferred investment Cax credits. Also deducted is$ 1,084,033 representing Che so called earnings base inexcess of capitald zation. The result of these adjust-ments yields'the net average rate base of $ 127,832,6ll.The derivation of Che monthly balances of Cise net gas
1
plant in service is detailed on page 2 of the schedule.
10
The derivation of Che working capital is detailed on
pages 6 through 8 of this schedule. The computation ofChe accumulated deferred income taxes and accumulated
12
deferred investment. tax credits are shown on page 9 ofthis schedule, and the derivation of Che so called earn-
13
14
15
ings base in excess of capitalization is shown on
page 10 of this schedule. Once again, these component:s
were all derived in Che same manner as the corresponding
16
17
18
components used for the development of Che average ratebase for Che electric department, as reflected inExhibit 8.
19 Q: Turning back Co the first page of this exhibit, would
20 you please explain known adjustments to rate base?
21 A: The adjustment labeled "Accruals Effective May 1, l979"
22
23
24
reduces average. rate base consistent with the pro forma
adjustment in depreciation shown in this exhibit. This
adjustment is summarized on the lower portion of Sched-

I I
1
j
I l
I
VV
I'
I
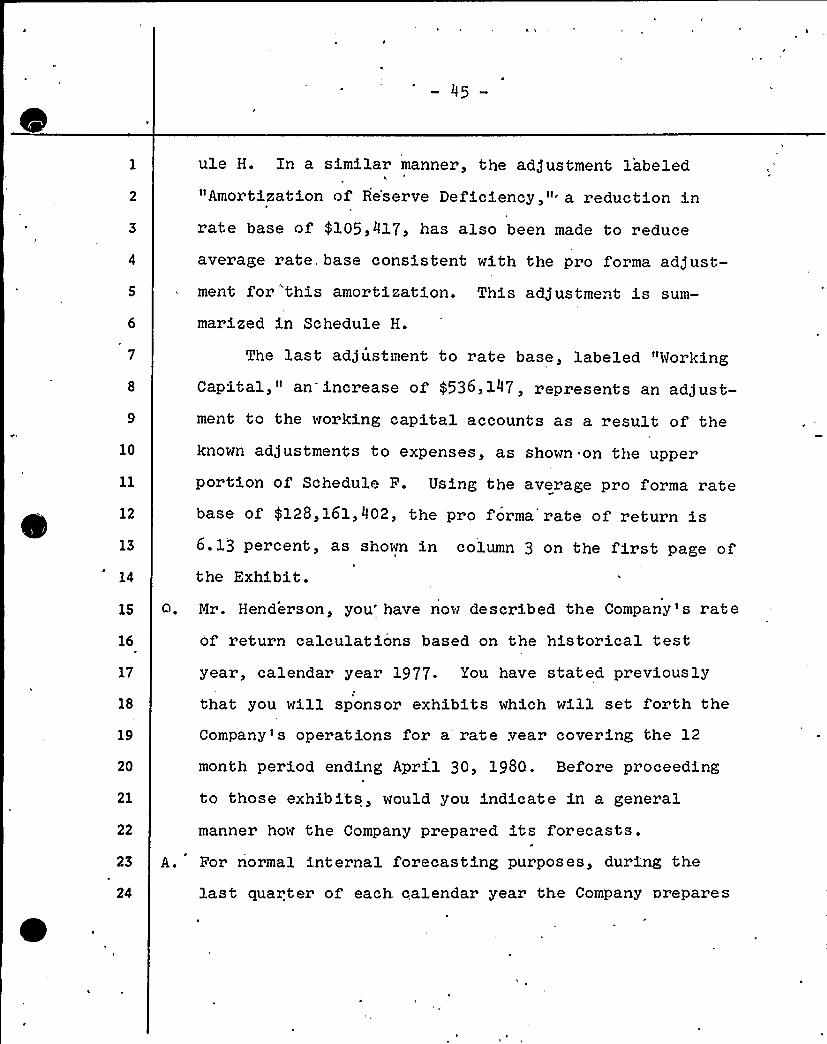
45
ule H. ln a similar manner, the adjustment labeledIl
"Amortization of Re'serve Deficiency," a reduction inrate base of 4105,417, has also been made to reduce
average rate, base consistent with the pro forma adjust-ment for this amortization. This adjustment is sum-
7
10
12
13
14
marized in Schedule H.
The last adjustment to rate base, labeled "Norking
Capital," an increase of 4536,l47, represents an adjust-ment to the working capital accounts as a result of the
known adjustments to expenses, as shown on the upper
portion of Schedule F. Using the average pro forma ratebase of $ 128,161,402, the pro forma* rate of return is6.13 percent, as shown in column 3 on the first page ofthe Exhibit.
15 O. Mr. Henderson, you'ave now described the Company's rate
16
17
18
19
20
21
of return calculations based on the historical testyear, calendar year 1977. You have stated previously
that you will sponsor exhibits which will set forth the
Company's operations for a'ate vear covering the 12
month period ending Aprf..l 30, l980. Before proceeding
to those exhibits, would you indicate in a general
22
23
24
manner how the Company prepared its forecasts.
A. For normal internal forecasting purposes, during the
last quarter of each calendar year the Company prepares

4
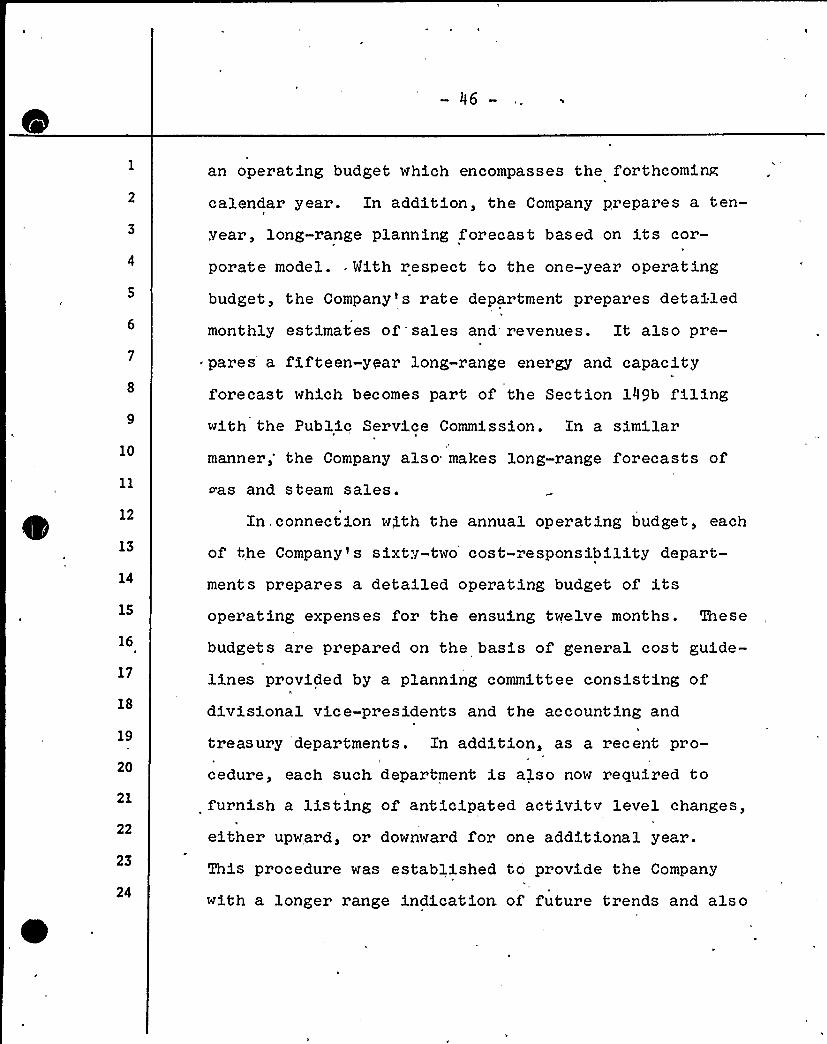
— 46—
an operating budget which encompasses the forthcoming
calendar year. In addition, the Company prepares a ten-
vear, long-range planning forecast based on its cor-
porate model. . Mith respect to the one-year operating
budget, the Company's rate department prepares detailed
monthly estimates of'sales and revenues. It also pre-
pares a fifteen-year long-range energy and capacity
forecast which becomes part of the Section 149b filing
10
with the Public Service Commission. In a simi.lar
manner,'he Company also makes long-range forecasts of
12
13
14
15
16
17
18
19
20
21
22
23
24
<as and steam sales.
In. connection with the annual operating budget, each
of the Company's sixty-two cost-"esponsibility depart-
ments prepares a detailed operating budget of itsoperating expenses for the ensuing twelve months. These
budgets are prepared on the basis of general cost guide-
lines provided by a planning committee consisting ofdivisional vice-presidents and the accounting and
treasury departments. In addition, as a recent pro-
cedure, each such department is also now required tofurnish a listing of anticipated activitv level changes,
either upward, or downward for one additional year.
This procedure was established to provide the Company
with a longer range indication. of future trends and also

a
lf '"
Co provide a check as Co Che reasonableness of Che ten-
vear forecasts referred to earlier. In addition, Che
Company requires each department to provide a ten-vear
forecast of capital expenditures which is Chen utilizedfor both Che short and long-term forecasts.
All components of Che one-year forecast; are reviewed
by Che appropriate divisional'vice president; and Chen by
Che Executive Vice President, the President and Che
10
12
13
14
Chairman of Che Board. This review, among other things,includes a check for internal consistency,'compliance
with earlier cost guidelines and justification for major
departures from trends established in orior periods.
Where necessary, as a result of Che reviewing process,
revisions are made to Che forecast before presentation
16
17
18
19
20
21
22
23
24
of Che operating budget and capital expenditures forapproval Co Che Board. of Directors.
Q. How have Che forecasts which you have described been
utilized in Che preparation of Exhibits lO and ll'?
A. As Che Commission's Policy Statement envisioned, it has
been necessary to modify the Company's forecast data Co
meet Che detailed requirements established under t he
Policy Statement. The total departmental expenses, forexample, have been shown by cost components and by func-
Cional locations as opposed Co Che Internal forecasts

0
1
I
4
— 48—
which are developed on a cost-responsibility depart-
mental basis. In addition, where more recent infor-mation has become available since the preparation of the
t
original internal Company forecasts, that informat ion
has been used in preparation of Exhibits 10 and ll.Q. Will you please describe and explain Exhibit l0 and
state what it purports to show'?
A. This Exhibit is a forecast of the Electric Department
income statement and a rate of return for the "rate
10 vear," tge twelve months ended April 30, 1980. This
12
13
14
15
16
17
18
19
20
21
22
23
24
exhibit, and its counterpart for the Gas Department, Ex-
hibit ll, have been prepared in response to the Commis-
sion "Statement of Policy on Test Periods in Major Rate
Proceedings" issued November 23, l977. Zf you will turn
to the first page of Exhibit 10, in Column l I have
shown the income statement and rate of return for the
year l977 for the Electric Department as recorded on the
books of the Company. Column 2 reflects adjustments to
normalize l977 operations. Column 3, Che sum of Columns
l and 2, reflects l977 "normalized" operations. Column
4, labeled "Rate year adjustments", shows the changes inRevenues, Expenses, Taxes and Rate Base that will occur
between normalized 1977 and the rat e year. Column 5
shows the forecasted rate year, including the revenue

0 '
- 49-
increase requested in this proceeding.
Q. Will you please refer Co Column 1 and explain the infor-mation shown there'P
A. As I stat;ed, Column 1 is our Elect;ric Depart;ment, per-
books Income Statement and Rate of Return for the year
1977. This column-shows, in a slightly different;format, Che same information Chat was shown in Column 1
of page 1, Exhibit 8.
Q. Will you now refer Co Column 2 and explain Che Nor-
10 malization Adjustments made there'?
12
13
14
16
17
18
19
20
21
22
23
24
A. Yes. However before explaining the specific adjust-ments, E would like to explain Che method used todevelop the normalizing ad)ustments. All of Che nor-
malizing adjustments are included, partially or wholly,as a Pro Porma ad)ustment in column. 2 of Exhibit 8, and
Co Chat ext;ent Che method of computation and Che reasons
for t;he adjustments are Che same as T. described inconnection with Chat Exhibit;. Therefore Che schedules
supporting Che normalizing adjustments in Exhibit 10
will, for the most part, simply refer Co Che appropriateschedule and amount of Che ad)ustment in Exhibit 8. The
normalizing adjustments shown in Exhibit 10 differ from
Che pro forma ad)ustments in Exhibit 8 in Chat,
generally, only increases known Co occur which would
affect 1977 data are reflected as normalizing adjust-
ments in Exhibit l0. The remainder of those adjustments
which were factored into 1977 pro forma data (Exhibit 8)
are shown in Exhibit 10 as "Rate Year Adjustments".
The adjustments Co revenues, labeled "Customer,"
(fll,707,000), and "Sales Co other utilities"( 43,963,000), are summarized on Schedule A.
Q. Now, turning Co the normalization adjustments under
exoenses, would vou please explain Che ad)ustments you
10 have made therel
12
13
14
15
16
17
18
A. Yes, before getting Co Che detail of the adjustments to
expenses, I would like Co briefly describe Che format
and layout of Schedule B. If you will Curn to page l ofSchedule B, you will notice that the five columns are
identical Co Chose shown on Che first page of Exhibit10. Page l of Schedule B is Che Electric Depa'rtment
summary of expenses, by various cost componenCs as
~eguired in Che Commission's Statement of Policy. These
19 cost compo'nents are Chen shown in detail by functional
20
21
22
23
24
locations an Che'following eleven pages of Schedule B.
Page 2 details Steam Power Generation by cost compo-
nents. Page 3 details Nuclear Power Generation by cos tcomponents, etc. Since page 1 is a summary, if you were
Co Cake any cost component shown on'page l from any of

ri.
i
t
5l
12
13
14
1S
16
17
18
19
20
21
22
23
24
Che columns you will find that it is simply a summation
of Che detail shown on Che applicable, subsequent pages
of Che schedule. The normalization adjustments made Co
expenses, with but two exceptions, are identical to Che
similarly labeled Pro Forma adjustments made to expenses
on Exhibit 8. The first exception is Chat; Che Pro Forma
ad)ustment for wages and salaries shown in Exhibit .8
includes wage and fringe benefit increases through Che
end of Che.rate year. The normalization adjustments inExhibit 10 for payroll and related fringe benefitsreflect wage rates, complement, and benefits costs only
as of February 1, 1978, thereby omitting, as a nor-
malizing ad)ustment, Che February 1979 and -February 1980
wage increases. The other exception 1s Chat Che Pro
Forma ad)ustment for escalation shown on Exhibit 8 isnot reflected as a normalizing adjustment in thisExhibit.
The detail of the other normalizing adjustments to
Expenses, and the reconciliation of these adjustments totheir counterparts in Exhibit 8, are shown on pages .1
and 3 of Schedule C of Exhibit 10.
The Normalization ad)ustment Co Depreciation
expense is an increase of $ 577,000. This ad)ustment issummarized on Che upper portion of p'age 0 of Schedule C.

0
8
52
The normalization ad)ustments to "Taxes-Other Than
Income," other than payroll ta'xes, are identical to Pro
Forma adjustments made for the same items in Exhibit; 8,
and are summarized on the lower portion of Gage 4 of
Schedule C. The normalization ad)ustment labeled
"Payroll Taxes" is detailed on Gage 5 of Schedule C and
has been made to reflect normalized payroll taxes in a
10
manner consistent with the normalization adjustment to
payroll expense.
The net of all of the normalization adjustments I
12
13
14
15
have described so far to Revenues, Expenses, Depre-
ciat;ion and Taxes-Other Than" Income result in an
incr ease in Operating Income before Federal income t;ax
of 4489,000.
Q. Mould you please turn to Schedule D,and explain t;he com-
16
17
18
19
20
21
22
23
24
putation of the normalization ad)ustment to Federal
income tax, shown as. a negative $ 445,0002
A. Yes, if you will turn to page 1 of Schedule D, you willnotice .that, except for rounding to the nearest; $ 1,000,
the 1977 per books computation is identical to that;
shown on page 1 of Schedule J in Exhibit 8. The
normalization ad)ustments, shown in column 2 of Schedule
D, >re the same as the the Pro Forma adjustments in Ex-
hibit 8 except for, the following items: Interest on

~ '0 ~ ~
L'
— 53—
long term debt hys been adjusted for updated depart-
mental allocations only; it also does not reflect an
adjustment for our Pro Forma capital- structure.Similarly, "Taxes charged to construction", "Pension
costs capitalized" and "Additional deductible depre-
ciation" reflect only the impact of the corresponding
normalization adjustments to Dayroll, fringe benefitsand
depreciation.'0
Q. Returning to the first page of Exhibit 10, would vou
continue with your explanation of the normalization
12
13
14
1S
16
17
18
19
20
21
22
23
24
~djustments2
A. Yes, the next three adjustments, that is, the adjustment
labeled "Provision for deferred income taxes — net", a
credit of $ 2,960,000, the adjustment labeled "Inter-period tax allocation", an.amount of 42,025,000, and the
adjustment labeled'Investment tax credit adjustment",
in the amount of 41,936,000, are the same as the Pro
Forma adjustments made in Exh.ibit 8. In a similarmanner, the adjustments labeled "Adjustment of allowance
~or funds used during construction" and "Dividends
received from Canadea Power Corporation" are the same as
the Pro Forma adjustments made in Exhibit 8. The net
'effect of all of the normalization adjustments is a
decrease in Balance for return of $ 651,000.

n,
4 ~ t
54
Q. Would you please explain the normalization adjustments
made to Average rate baseV
A. The first adjustment labeled "Depreciation accruals", a
reduction of average rate base in.an amount of 4288.000,
has been made to reflect the impact on rate base of Che
normalization adjustments to depreciat;ion expense. This
adjustment is summarized on the upper portion of oage 6
of Schedule C.
10
12
13
The next two adjustment;s, the first. labeled "Canadea
Power Corporation", an increase of 41, 512, 000, and Che
second labeled "Ginna normalization", an increase of44,170,000, are the same as .the corresponding Pro Porma
adjustments shown in Exhibit; 8 and are also summarized
14
16
17
18
19
20
21
22
23
24
on page 6 of Schedule C. The last normalizing adjust-ment to average rate base, labeled "Working capital", isan increase of 4116,000. This adjustment has been made
to reflect the increase in working capital required as a
result of t;he normalization adjustments made to
expenses, and is summarized 'on page 6 of Schedule C. On
Che basis of normalized 1977 operat;ions, as shown'n
.column 3 on the first page of Exhibit 10, the resulting035,792,000 operat;ing income, when applied to the
average rat;e base of 4431,359,000, produces a rate ofreturn of 8.30$ .

0'I
,.I
-55-
10
12
13
14
16
17
Q. Nr. Henderson, that column does reflect the fullannualized impact of the revenue increases granted by
the Commission in November 1977 and February 1978, does
it not'?
A. Yes it does.
Q. Have you made any computation of the- additional revenue
which would be necessary on the basis of normalized
operations to earn the return authorized by the Commis-
sion 1n Case 27108'?
A. Yes, I have. The Electric department, on the basis of
normalized 1977 operations, would need additional
revenue of $ 8,800,000 to produce the 9.3lg rate of
return authorized by the Commission in our last pro-
ceeding, an amount almost identical to the difference in
the revenue increase requested by the Company (ad)usted
to the allowed return on equity), and that authorized by
the Commission.
18
19
20
~ 21
22
23
24
Q. Returning now to the first page of Exhibit 10, would you
explain the adjustments in the column labeled "Rate Year
Adjustments"?
A. Yes, these ad)ustments, shown in column 4, have been
made to bridge the gap from the normalized 1977 year to
the rate year —the twelve months ended April 30, 1980
—shown in Column 5. The first ad)ustment is an
— 56-
increase in customer revenues in the amount of
$ 22,537,000. The derivation of rate vear customer
revenues is shown in Exhibit 14, which is sponsored by
Mr. Laniak. The second ad)ustment to Revenues, labeled
"Sales Co Other Utilities," a decrease in revenues of
$ 10,062,000, will also be explained by Mr. Laniak. The
revenue ad]ustment, labeled "Proposed revenue increase"
and in the amount of 437,946,000, is the additional rate
year revenue Chat will be produced by the rate increase
10 requested in this proceeding. The derivation of this
12
13
14
15
ad)ustment is shown in Exhibit 19, sponsored by Mr.
Hobday. The last revenue adjustment, in the amount of
4985,000, relat;es to Oswego. ¹6. For convenience, I'illsubsequently discuss all of Che adjustments related Co
Oswego ¹6 toget;her .
16
17
18
19
20
21
22
24
The ad)ustments Co Expenses produce a total increase
in expenses of gll,031,000. Again, the components
making up this ad)ustment are shown in column 4 on page
1 ~f Schedule B, except for Che Oswego ¹6 adjustment.
All of the other component, adjustments amounting to
410,805,780,'re shown by functional locations on Che
subsequent pages in Schedule B. The computation ofthese expense adjustments is shown in Schedule E. Ifvou will Curn Co page 1 of Schedule 'E', you will see that

I
k
P
L
— 57 '-
all of the rate year adjustments shown on page 1 of
10
12
13
14
Schedule B are listed. along with a reference to the
page of Schedule E which describes in more detail Che
method of determining Che adjustment. For cross-refer-
ence, page 2 of Schedule E shows each of the component
rate year adjustments Chat were reflected in summary on
Schedule G of Exhibit 8 as a Pro Forma adjustment
labeled "Allowance for escalations" in the amount of
$ k,369,255. Page 2 of Schedule E also refers Co Che
subsequent pages of Schedule E, which show the detail of
each adjustment. Page 3 of Schedule E shows Chose ofthe normalized 1977 expenses that have been escalated to
rate year levels by use of a general inflation rate.On Che upper portion of the page I have shown the
inflation rates which were utilized to make these
16
17
18
19
20
21
22
23
24
adjustments. The rates utilized for 1978 and 1979 are
based on the arithmetic average of three separate
sources which forecast prospective inflation in 1978 and
Cwo which forecast Che rate of inflation in 1979. We
also reviewed other sources to cross-check the reason-
ableness of these forecasts. From these inflation rates
Che inflation factor of .161545 was calculated. The
normalized 1977 expenses Co which this general inflationfactor was applied, and the resulting rate year adjust-

~'I
ment to each of these expenses, are shown on the lower
portion of the page.
Q. Mr. Henderson, would you propose to modify the inflationfactor vou have used during the course of this oro-
ceeding'?
A. Yes I would. As the actual rate of inflation for 1978
10
and more current estimates of subsequent inflation-become known, I would plan to update this adjustment forany changes, whether upward or downward, in the rate ofinflation.
Q. Please continue with the explanation of the remaining
12
13
adjustments shown in Schedule E.
A. On page 4 we have shown the adjustment to postage
14
15
16
17
expense, first on the basis of the newly increased
Dostal rates applied to test ocr iod mailings and then by
addinz the additional bills which, based on the sales
forecasts in Exhibit 14, will be rendered in the rate18
19
20
21
22
23
24
~ear, also at the new postal rates. This produces an
upward adjustment of $ 49,408 for postage expense.
On the lower portion of page 4 the prospectiveincreases in the Company's PSC Assessment are
calculated, with the portion applicable to research and
development broken out. As indicated, the general
assessment has been increased at the derived inflation

~ \ ~
1
P
0
-59-
10
12
rates, whereas, Che research and development portions ~s
based upon Company forecasts. The result of these com-
nonents is an upward adjustment of $ 169,689.
Three adjustments are shown on aage 5 of Schedule E.
The first;, labeled "Water for Power", is derived by
applying Co Che test period expense Che average, annual
rate of increase in this expense, as actually experi-enced over Che period 1972 through 1977. The result isan adjustment of 419,642.
The next adjustment on this page, labeled "Workmen'-s
Compensation", adjusts for the increase in Che Company's
workmen's compensation premiums Chat will result from
13 Che rate year wage and salary level. The adjustment
14
15
16
factor used is based on Che ratio of Che rate year wages
to the normalized 1977 wages, and produces the $ 13,686
adjustment shown.
17
18
The last adjustment on this page, labeled "New York
State Power Pool Assessment", adjusts the Company's 1978
19 share of Che Power Pool's estimated costs to Che level20
21
22
23
24
anticipated in the rate year. The adjustment factor is,r
based upon Che historic trend of this expense. The
resulting adjustment, Co bring this expense to Che rateyear level, is 458,488.
On page 6, an adjustment in Che amount of $ 226,142,

I'
- 60-
increases the Company' "Insurance" expense Co that
level expected in the rate year. The estimates for 1979
and 1980 were made by those persons in the Company who
administer and oversee Che Company's insurance Drogram,
after analysis of Che available data.
1012'he
lower portion of this page contains the adjust-
ment for the Company's research and development expendi-
tures, exclusive of amounts included as part of the Com-
pany's PSC Assessment and Company payroll. This adjust-ment is based upon Che forecasts of these expenditures
by Che Company's R8D Committee for 1979 and 1980,
respectively. The forecasts are based upon project-by-
13
14
15
16
17
project estimates. The rate year increase over the testperiod amounts Co 4636,734.
Page 7 of Schedule E contains Che adjustment Co
increase "Contractor service" expense Co the levelexpected in Che rate year. As shown, the Cwo major,
18
19
20
21
identifiable components of this expense —for fly ash
hauling and for Cree-trimming —are shown separately,
and the balance is shown under the heading "Other". The
factor of increase which. is applied to these expenses is22
23
24
based on a weighted average of Che rates of increases
for the labor component (755), and for materials and
supplies component (255 ) . The rate of incr ease used for
-61-
10
12
13
14
16
17
18
19
20
21
22
23
24
materials and supplies was Che general inflation factor
Co which I have previously referred. The rate of
increase used for labor was that actually experienced
for 1977, 7. 675%. By contrast, the rate of increase for
cont;ractor labor experienced in 1976 was 8. 55%, and in
1975 was 8.45%.
On page 8 of Schedule E, three ad)ustments are
shown. The first, labeled "Purchased electricity«,adjusts only for Che additional capacity and energy to
be purchased during Che rate year planned outage of
Ginna station. Such increases are due solely Co Che
increased sales to customers reflected in Exhibit 14.
The pricing of these purchases is discussed by Nr.
Laniak.
The next adjustment shown, labeled "Payroll, Pen-
sions and Life Insurance", adjusts Che normalized wage
expense, which is shown on page 2 of Schedule C of this
Exhibit, up to Che rate year wage expense, as shown on
Schedule D of Exhibit 8. The last ad)ustment on this
page, "Payroll taxes«, increases Che applicable payroll
taxes to the level which results from the higher rate
year wages.
The final t;wo adjustments shown in Schedule E, on
page 9, adjust "Uncollectibles" and'«Inguries and

4.
I
l
J
U
-62-
Damages" to the proper rate year level. The accrual
rates are those presently in effect. The adjustment isderived by applying those accrual rates Co Che higher
revenues forecast and proposed in this proceeding.
Q. Returning Co the first page of Exhibit l0, would you
please explain the next; rate year adjustment in column
labeled "Depreciai;ion" in Che amount of $ 2,995,000'?
A. Since this adjustment', and the adjustment to "Taxes-
Other Than Income", are directly related Co increases in10
12
plant in service, I would like first to describe Che
rate year adjustment to average rate base labeled "Plant
additions", an increase of $ 84,732,000.
13
14
15
16
17
18
19
20
Schedule G of this exhibit details by month our
forecast of plant additions for Che period January l978
through April l980. On this schedule I have shown,
project-by-project, our forecasted plant additions. InChe column labeled "Reason for Project" Che reason forChe project is shown by code in order Co save space.
The explanation of Che code keys is shown on page 10 ofSchedule G. In Che next columns I have shown the esti-
21 mated cash cost, expected AFDC accruals, forecast t;otal22
23
24
cost, actual expenditures as of December 31, l977, and
the est;imated i'n service dat;e, for each project. The
monthly additions are Chen shown,'totaled by months and
-63-
10
12
13
14
ls
16
17
18
19
20
21
22
23
24
by functional locations.
Pages 1 through 6 show the detail of 1978 plant „
'dditionsand pages 7 through 9 show the detail of
forecast;ed 1979 and January through April 1980 plant
additions. The upper portion of page 10 gives Che
explanation of the coding for the reason for Che plant
addit;ions, and the lower port;ion shows the slippage
factors that have been appli'ed to Che forecast additions
used in developing the rate year average rate base inSchedule H. The slippage factors shown are developed
from our historical experiences and reflect the fact;
that Che dollar amount of actual plant additions willgenerally be less Chan forecast. Such slippage results
from several factors, such as non-expenditure of con-
tingency amounts, deferrals, delays due Co weather, and
material deliveries, etc.
Turning now to Schedule H of this exhibit page 1
summarizes the net; electric plant in service, by month,
for Che rate year, arriving at an average net electricplant in service. The rate year ad/ustment is the
difference between the rate year average net electricplant in service and the 1977 normalized, average net
electric plant in service. Page 2 of Schedule H shows,
again in summary, Che forecast depreciation aceruals, by

— 64.—
month, for Che rate year.
The workpapers showing the derivation" of this data
are a voluminous computer printout. >le have furnished a
copy of these workpapers Co Staff and will do likewise
10
12
13
14
15
16
17
18
19
20
21
22
23
24
to any party Co the proceeding who requests a copy. Xn
lieu of including all of these pages as an exhibit, we
have included, as page 3 of Schedule H, one of the pages
from Che workpapers showing the manner in which we have
calculated the forecast net electric plant in service.
The development of Che net plant in service was done
by month, by functional location. On page 3 of Schedule
H, the calculation of "Fossil Generation Plant" isshown, for the months of January through June of 1978.
The first line, labeled "Retirement Factor," is the
historical relationship we use for forecasting purposes
relating the percentage of retirements of existing plantin service Co plant additions. The next, ratio shown isthe "Book Depreciation Rate." This is Che monthly ratefor depreciation based on Che actual accruals ad)usted
to reflect Che normalizing adjustments Co depreciation.The next factor shown, labeled "Salvage Rate," is again
based on our historical experience and is the ratio of .
net salvage to plant retirements. The next line,labeled "Plant Xn-Service-B.O.P." is the existing gross

plant in-service as of the beginning of each month. The
next line, labeled "Plant Additions", sets forth the
5
plant additions by month that were developed in
Schedule G, after factoring for slippage. The next
line, "Retirements", is computed by the application of
the retirement factor to the plant additions. The
"Plant In Service-E.O.P." is simply the sum of the plant
at the beginning of the month, plus plant additions,
10
12
13
14
less plant retirements to arrive at the end-of-month
plant in service. The next line, labeled "Accumulated
Provision For Depr. Of Plant In Service-B.O.P.", shows
the accumulated provision for depreciation as of the
beginning of the month. The "Provision For Deprecia-
tion" is determined by applying the depreciation rate to
15
16
17
the plant in-service balance as of the beginning of the
month. The "Retirements", or the adjustment to the
reserve for retirements, is the same adjustment made to
18 plant in service, and "Net Salvage" is determined by
19 applying the salvage factor to the retirements. The net
20 of these three items added to the depreciation reserve
21
22
at the beginning of the month, results in the "Accumu-
lated Provision For Depr. Of Plant In Service-E.O.P."
23
24
which is the depreciation reserve as of the end of that
month. Subtracting the reserve fro'm the plant in
-66-
6
10
12
13
14
15
16
17
18
19
20
21
22
23
24
service gives us the "Net Plant For Rate Base." In this
manner, utilizing the data in Schedule G, the net plant-
for rate base is developed on a monthly basis through
April, l980, by functional location.
Q. Returning to the first page of Exhibit 10, I understand
that, as you have previously indica<'~d, you will discuss
the Oswego ¹6 depreciation subsequently. Mould you
please now explain the rate year adjustments to "Taxes—
Other Than Income"'?
A. The first adjustment labeled "Real property and special
franchise taxes and water pollution control charges," is
an increase of $ 5,430,000, and is developed on
Schedule F. If you will turn to the first page of
Schedule F, the upper portion contains a summary of
forecasted rate year "Real property and special fran-
chise taxes and water pollution control charges." The
total estimate of these taxes, including sales and use
taxes, is $ 28,358,000. The development of this amount
is shown on page 2. Next the estimated sales and use
taxes of $ 799,000, is already provided for in Sche-
dule C, page 4. The normalized 1977 taxes, in the
amount o f $ 22,129,000, are then subtracted. This
results in the rate year adjustment of $ 5,430,000. The
detail of the derivation of the forecast level of taxes

IP
— 67—
is developed on page 2 of Schedule F. Ne have found
that a regression analysis, relating taxes to plant in.
service, has been an extremely accurate method of fore-
casting these taxes., On pages 3 and 0 of Schedule F you
will see that I have shown the historical amount, by
year, of the taxes paid during each calendar year, the
plant in service and the derived percentage o f taxes as
related to plant in service. Mhile I have not included
the results of our statistical program with which we
actually do the computations, we do, in that program,
test four to six various regression formulas and bands
12
13
14
of data prior to selecting the "best fit curve" for
forecasting purposes. After the historical data, I have
shown the regression formula and the R value of the
15 curve for each category.
16
17
18
19
20
21
22
23
24
On page 2 o f Schedule F, I have shown, by
functional location, the forecasted plant in service
that. was developed in Schedule H, and the forecasted
rate year ratio of taxes that have been utilized,thereby deriving the rate year taxes totalling428~3580000.
Turning now to the lower portion of page l of
Schedule F, the rate year ad)ustment to "Revenue taxes"
reflects the 'net increase in these taxes because of the

1 .0
1
-68-
rate year adjustments to revenues.
Q. Please continue with your explanation o f the rate year
adjustments which are shown on Che first page of Ex-
hibit 10.
A. As I previously described, Che increase for "Payroll
taxes", an amount of $ 103,000, reflects the increase in
payroll taxes attributable to Che 1979 and 1980 wage
increases insofar as they are applicable Co Che rate
10
year. Again, I will subsequently discuss the taxes
applicable Co Oswego ¹6.
12
13
14
1S
16
17
18
19
20
21
22
23
24
The rate year adjustment to federal income tax, isdetailed on page 1 of Schedule D. The rate year adjust-
ments to interest deductions for long and short term
debt reflect both changes in the rate year capitaliza-tion and changes in departmental allocations on Che
basis of that capitalization. The computation of these
changes in interest deductions is shown on page 2 of
Schedule D. The adjustment for "Additional deductible
depreciation," shown on page 1 of Schedule D has been
made Co conform this deduction Co Che rate year plant inservice.
The rate year adjustments for the "Interperiod tax
allocation", is summarized on page 3 of Schedule D.
Q. Mould you please continue with your'xplanation by

II
1 ~
— 69—
describing your rate year adjustments to average rate
base'?
A. The first adjustment labeled "Norking capital" reflects
the working capital increase as a result of the rate
10
year adjustments made Co operating expenses, and is sum-
marized on Che upper portion of Schedule I. The next
adjustment shown on Che first page of Exhibit 10,
labeled "Plant additions", has already been discussed.
The next two adjustments, "Sterling Land" and
"Sterling Fossil", as shown on Schedule I are the same
12
as the similarly labeled Pro Forma adjustments made in
Exhibit 8.
13
14
The last two adjustments labeled "Accumulated
deferred income taxes", an adjustment of $ 4,923,000 and
the other labeled "Accumulated deferred investment Cax
16
17
18
19
credits," a credit adjustment of $ 2,356,000, have been
made to reflect an appropriate rate year rate base.
These adjustments are summarized on Schedule I.Q. Mould you now please explain Che Oswego No. 6 adjust-
20 ments shown in Che Rate Year Adjustments column on the
21
22
23
24
first page of Exhibit 10'?
A. The Oswego No. 6 unit is scheduled to go into service on
November l, l979. The five adjustments for Oswego No. 6
are shown on Schedule J.

I , 0
-70-
2
The first adjustment is to Revenues. As indicated
on page l of Schedule J, the additional revenue isattributable to the increased incidental sales which are
estimated as the result of having the Company's share of
the Oswego No. 6 capacity available during the last six
months of -the rate year. The data on mWh of sales and
,7 the revenue per mWh, net of fuel, were provided by Mr.
Laniak.
12
13
14
1S
16
17
18
19
20
21
22
23
24
The second adjustment is to expenses. The two
components of this adjustment are shown on page l ofSchedule J. One component consists of an estimate ofthe Company's share of the operation and maintenance
expenses, excluding fuel, for the plant. This estimate
was provided by the operator of the plant, Niagara
Mohawk Power Corporation. Another component, a negative
amount of 4800,000, reflects the reduction in replace-ment capacity which the Company would otherwise be
required to purchase during the rate year portion of the
scheduled shutdown of the Gonna Nuclear Station. The
planned outage is scheduled to commence March 16, 1980.
This estimate is supported by data supplied in Mr.
Laniak's testimony.\j
The next adjustment, also shown on page l of Sche-
dule J, is for the increase in depr'eciation attributable

I
-71-
to the Company's portion of the Oswego No. 6 plant. The
calculation'f this depreciation adjustment is shown on;
Che upper port;ion of page 2 of Schedule J.
10
12
13
14
15
16
The final adjustment, shown on page 1 of Schedule
J, reflects t;he addition of Oswego No. 6 to average rate
base for six months of the rate year. The calculation
of Average Net Plant is shown on the bottom porC'.on of
page 2 of Schedule J.
I should also add Chat, although it is not separ-
ately shown, Che deferred income taxes attributable to
Oswego No. 6 are included,in the rate year ad)ustment
labeled "Provision for deferred income taxes — net" on
the first page of Exhibit 10. Likewise, Che impact of
Oswego No. 6 is included in Che Rate Year Adjustments to
"Federal income t'ax" and "Interperiod t'ax allocation"
shown on the first page of Exhibit 10. The calculation
17
18
19
of Che latter adjustments is somewhat complex and we1
have not, therefore, broken out the Oswego No. 6 por-
tions separately.
-20
21
Q. Mould you please summarize the results of your Rate Year
Adjustments on Exhibit 10?
22
23
24
A. The rate year balance for return of 457,017,000, based-.
on the increased rates request;ed in this proceeding,
when applied Co the rate year average rate base of

0
-72-
$ 567,116,000 will produce a rate of return of 10.05$ .
Q. Will you please describe Exhibit ll and state what itpurports Co show?
10
A. This Exhibit develops a forecast Gas Department income
statement and rate of return for Che rate year, Che
twelve months ended April 30, 1980.
Exhibit ll has been prepared in Che same way, using
the same format, as Exhibit 10 which I have justcovered. Thus the only items which I will discuss rela-.tive Co Exhibit 11 are those which differ from the Ex-
hibit 10 adjustments.
12
13
The only adjustment in the "Normalization Adjust-ments" column of Exhibit 11, which is not covered by my
14
16
explanation of Exhibit 10, is the adjustment labeled
"Amortization of extraor dinary property losses". As
indicated on page 4 of Schedule C, this adjustment was
17
18
19
20
covered in my testimony regarding page 3, of Exhibit 9.
In Che Rate Year Adjustments column of Exhibit ll,the rate year increase in "Customer revenues," exclusiveof Che proposed revenue increase, was furnished Co me by
21
22
Mr. Lauterbach and is explained in his testimony and Ex-
hibits 21 through 25.
23
24
As shown in the "Pro Forma- Rate Year" column, the
result of all of the Normalization Adjustments, Che Rate
r
E )
l
-73-
Year Adjustments, and the proposed Gas Department rate
year revenue increase of $ 10,789,000 is a Balance for.return of $ 14,266,000. When the Balance for return isapplied to the average rate base of $ 140,520,000, itproduces a rate of return of 10.15$ .
Q. I note that, in the 1977 Normalized column of Ex-
hibit ll, you show a rate=of return of 7.22%. Have you,
as you did for the Electric Department, made a computa-
tion of the additional revenue which would have been
10
12
13
14
15
16
17
18
19
20
21
22
23
24
necessary to earn the return authorized by the Commis-
sion in Case 27109?
A. Yes, I have. The Gas Department, on the basis of nor-
malized 1977 operations, would have required additionalrevenues of approximately $ 5,400,000 to produce the
9.31$ rate of return authorized by the Commission in our
last proceeding.
Q. Has the Company addressed the subject of executive com-
pensation'?
A. Yes, it has done so in Exhibit 12. This three page
document is a summary of a Stone & Webster analysis ofthe compensation paid to the Company's top threeofficers. This analysis is an update of a similar studysubmitted in the Company's last rate case. The exhibit,which is self-explanatory, reflects Stone 5 Webster'

I
74
2
view that Che Company's executive compensation is
appropriate.
Q. Has the Company addressed Che subject of labor pro-
ductivity in its filing'A. The sub)ect of labor productivity is implicit;ly
'
10
12
addressed in Che forecast rate year presentation. While
customer sales are increased in Che rate year over Chose
in Che historical 1977 period, no increase in numbers of
employees or overtime is made, other Chan the employees
indirectly added through Che Company's partial ownership
of Oswego No. 6, a matter over which Che Company has no
direct control. We believe Chat, in so structuring Che
13
'14
15
16
forecast presentat;ions, Co provide for Che volume growth
in customer sales revenues without any increase in labor
complement is, if anything, a very opt;imistic posture
with respect Co productivity.
17
18
19
20
21
22
23
24
Q. You stated at the outset of your testimony that you
would introduce an exhibit which contained pro)ected
data showing Che source and distribution of funds,
capitalization, and coverage rat;ios, and Chat you would
indicate how these data bear on the Company's need for
additional revenues. Will you please do so at thistime'?
A. Exhibit 1$ is a t;hree page exhibit, the cover page of

E
'i
-75-
10
12
which is entitled "l978-1982 Pro) ections, Capitaliza-
tion, Financing and Financial Statistics". Page l of
the exhibit develops, the Company's projected capital
structures and capitalization ratios starting with l977
actual, and pro)ecting the annual changes through to the
year 1982. As can be seen at the lower portion of the
page, the Company is attempting to move its common
equity ratio to approximately 40$ of total permanent
capitalization, excluding short-term debt, while main-
taining a preferred and preference stock ratio of
approximately l3 to 14$ , and a long-term debt ratio in
the range of 46 to 47$ . We feel that these capital
13
14
1S
16
17
18
19
20
21
22
23
24
ratios are appropriate for several reasons, among which
are the following:
(l) Zt recognizes our view that the utility busi-
ness in general is more of a risk today than
it was gust recently, thus calling for a
higher portion of common stock equity in the
capitalization structure;
(2) to attempt to maintain adequate coverage
ratios and internal generation of funds,
again by means of a higher portion of Common
stock equity, a measure which is in partnecessitated because of the lack of substan-
— 76—
tial cash flow provisions, such as allowance
in rate base of major amounts of construction
work in progress; and
(3) in light of our perception of the likelytrend in capital markets, with the potentialupward direction in interest rates.
The appropriateness of these capital ratios is also
addressed by Messrs. Monteau and Fraser .
Q. Please explain how the dollar figures have been
10 developed on page l of Exhibit 13.
12
13
14
15
16
17
18
19
20
21
22
23
24
A. The lines of the Exhibit showing total capitalizationincluding and excluding short-term debt are. derived from
the Company's forecast construction expenditures. The
Company uses a forecasting model starting with construc-
tion expenditures and develops therefrom the additions
to total capitalization based on the objective capital-ization ratios which I mentioned. The model then
develops the amounts of each type of financing that isrequired on an annual basis.
One of the variables in such a forecast is the
amount of retained earnings. For these purposes, the
calculations on page 1 of the Exhibit are based on the
assumption of a continuation of the Company's currentreturn on equity of approximately lOg through May 1,

— 77—
10
1979, and of a 13.'8$ return thereafter through t;he year
1982. This is so, notwithstanding the fact that t;he
rates established in this proceeding will not be ade-
quate to produce the earnings as shown beyond the mid-
point of 1980. The assumed maintenance of the 13.8~~>
return on equity used in this exhibit is based on an
assumption of additional rate relief in future years to
sustain the same level of earnings. Of course, t;he
ret;ained earnings are also a function of the Company's
dividend policy. As shown on page 3, for purposes of
12
13
14
16
17
18
these calculations, we have assumed the continuation of
the current dividend rat;e through the year 1979. There-
after, we have assumed a 5$ annual increase in that
rate, provided that such an increase does not result in
an increase in the dividend payout ratio above 50$ ,
which is our approximate payout goal. The calculations
also assume a continuation of the Company's stock divi-dend policy. The calculation is performed, as I have
19
20
21
22
stated, by a computerized planning model. The details
of this calculation is part of the supporting work
papers to this exhibit and will be made available as
needed.
23
24
Page 2 of Exhibit 13 is entitled "Pro)ected Source
and Disposition of Punds 1978 - 1982". This schedule
-78-
again reflects the Company's most current projections ofI
planned capital expenditures an'd financing, based on the
same assumptions as stated earlier in connection with
page 1. However, any change in allowed return on equity
will affect the course of outside financing and pro-
jected capitalization, as will any significant aberra-
tions in the capital markets.
Turning to page 3 of Exhibit 13, the upper portion
10
12
of the page shows the assumptions which I described3
earlier as factored into the development of the retained
earnings figures used on page 1 of the exhibit. On the
lower port;ion of page 3, I have calculated the interest
14
15
16
17
18
19
20
21
22
23
coverage ratios developed on the different bases shown.
Coverage calculations vary depending on the applicable
st;andards, such as the Company's bond indenture, applic-able SEC regulations, or those of rating agencies.
Coverage calculations performed by rating agencies, as
explained by Mr. Fraser, are simply based on the totalincome before income taxes divided by actual interestcharges. As can be seen by looking at these coverage
ratios, under the Company's indenture, in the years 1978
and 1979, we maintain a reasonable coverage when com-
pared to the two times minimum test in that document;
and, assuming the Company earns the equity returns

IIII
UI
II
— 79—
I
requested in this proceeding, we would have adequate
indenture interest coverage through 1982.
I should note however, that, as shown in Mr.
Praser 's exhibits, the Company has been consistently
unable to earn its allowed return on equity. Ne are
hopeful that, in this proceeding, the Commission will
10
12
13
14
15
16
17
18
19
20
21
22.
23
24
make adequate provision in rates to permit the achieve-
ment of the allowed return on equity. Of course, as Iwill discuss, if the return allowed is less than that
requested, none of the coverages shown can be achieved.
Turning t;o the rating agency coverage test which
is, of course, one of the crit;eria used in the deter-
mination of the Company's credit rating, the coverage
for the years 1978 and 1979 are 1.84x and 1.80x, respec-
tiyely. Such coverage ratios are completely inadequate.
Even assuming that the Company is able to earn t;he
returns requested in this proceeding, rating agency
coverage is barely adequate in 1980 and 1981 and again
falls to substandard levels in 1982, as is indicated by
the coverage ratio of only 1.99x. The Company will need
additional improvements in cash flow from subsequent
rate filings t;o maintain a reasonable coverage.
Q. Xn view of the rating agency coverage rat;ios shown,
together with Mr. Praser's testimony on the need to

-8o-
~ 2
10
maintain adequate coverage in order Co retain Che Com-
pany's current A Bond credit; rating, why has Che Company
not requested additional revenues to provide further
cash flow improvements and thereby bolster coverage
ratios?
A. The Company in this filing has attempted to satisfy itsfinancial objective of maintaining a healthy financialstructure. At the same time, we are acutely aware of
the impact on customers of ever-increasing rates.
Therefore, we have limited our request Co Che approxi-
mate 18$ electric rate increase in an attempt to satisfy
12 both criteria.13 Q. In Che event; that Che Commission determines Chat
14
15
16
17
investor requirements with respect to return on equity
are something less Chan what is requested in this pro-
ceeding, how would thai; impact upon the interest cover-
ages shown on page 3 of Exhibit 13?
18
19
20
21
22
23
24
A. If Che required return on equity is determined Co be
lower Chan Che 13.8$ requested, this reduction would, of
course, reduce Che coverage ratios shown. In fact,is Che Company's position Chat Che requested return on
equity is supported as reasonable because of the
minimally acceptable coverage figures which it will pro-
duce. However, should Chere be any reduction in Che
8
10
12
13
revenue requirement due to a reduced cost of equity
capital deemed appropriate by the Commission, or due t;o
other changes that may be proposed in this proceeding,
it is still the Company's intention to seek the fullamount of the revenue increase requested via an inclu-
sion of certain amounts of construction work in progress
in rate base in lieu of AFDC. In other words, the
minimal coverage ratios must at least be maintained ifnot improved. Any reduction in the allowed return on
equity would simply have to be made up by other cash
flow measures that would at least sustain or improve the
ratio figures which we have indicated. This, in effect,
would require an appropriate allowance in rate base of
14
16
17
18
19
20
sufficient amounts of construction work in progress to
achieve the same result. Accordingly,. it is the Com-
pany's proposal that the rate relief for which it has
filed be allowed regardless of any issues that may
develop in this case with respect to the fair return on
equity.As is also shown on the bottom of page 3, the
21
22
23
ratio of AFDC earnings to total earnings for common
stock is 45/ in, 1978, 54$ in 1979, 42$ in 1980, 5lg in
1981 and 625 in 1982. These ratios, in themselves,
24 would indicate that the Company should be asking for

82—
additional rate relief at this time to reduce these
abnormally high levels of AFDC. However, as I pre-
viously discussed, that would raise the requested per-
centage increase in this proceeding to levels which the
Company feels should be avoided at this time.
Q. Does that conclude your direct testimony'
A. Yes it does.
10
12
13
14
15
16
17
18
19
20
21
22
23
24

Rochester Gas and Electric Corporation
Direct. Testimony
DAVXD K. LANIAK
Division Superintendent of Electric SystemPlanning and Operations
Testimony of
David. K. Laniak
Q. Would you state your name and business address please?
A. My name is David K. Laniak and my business address is89'ast
Avenue, Rochester, New York l4649.
10
12
13
14
Q. By whom and in what capacity are you regularly employed?
A. I am employed by Rochester Gas and Electric Corporation
as Division Superintendent of Electric System Planning
and Operations. I am responsible for directing the Com-
pany's activities in electric system planning and elec-
tric system operation. I have particular responsi-
bility, among other things, for„long-range electricsystem planning, including long range demand and energy
forecasts, and for related regulatory and administrative
matters.
Q. Please summarize your educational background and busi-
ness experience.
16
17
18
19
20
21
22
23
24
A. I graduated from Rochester Institute of Technology in
l958 with a Bachelor of Science degree in ElectricalEngineering. I /oined RG&E as a Technical Engineer in
1958 and was assigned to the Electric Laboratory. My
work involved testing, specifying, and standardizing
products and methods related to the Transmission and
Distribution Division of the Company. In 1967, I was
designated Standards Engineer. I became Assistant
Superintendent of the Electric Meter and Laboratory

. 0
h
I
10
Department in 1968, and became Superintendent of Chat
department in 1971.
I am a member of Che Rochester Engineering Society
and Che Institute of Electric and Electronics Engineers.
I am the Company's member and chairman of Che New York
Power Pool Operating Committee, and Che Company's alter-nate member of Che New York Power Pool Planning Com-
mittee. Prom 1963 to,1966 I taught electric machinery
theory and lab in the Evening College at RIT.
Q. What is the purpose of your testimony in this pro-
ceeding'?
12
13
A. The purpose of my testimony in this proceeding is Co
describe Che short term electric load forecast and
14
15
16
17
18
19
20
21
22
24
supporting exhibit. In addition I will also discuss Che
forecast -of incidental sales and the need for Beebee
Station Old House capacity by Che Electric Department.
Q. Turning first to Che electric load forecast would you
please describe Che purpose and methodology of such a
forecast?
A. This forecast simply attempts to predict, based upon
available indicators, the level of sales in RGRE's fran-chise Cer'ritory during Che rate year ending April 30,
1980. The sales forecast for Che years 1978 through
1980 described in this testimony has 'been developed for

the short run, a term I will define subsequently. Based
upon information available this forecast predicts modest
'conomicgrowth in the Rochester area resulting'nmoderate customer and load growth.
The forecast of electric sales is based on theW
aggregation of forecasts by class of business. These
classes are: residential, commercial, municipal, indus-
trial and street-lighting. The forecast has then been
restated by rate classification for each month of the
10
12
subject year s.
Before discussing the actual forecast, it is neces-
sary to distinguish between short term and long-term
13
14
16
17
forecasts. Long term forecasts of electric energyF
demand tend to be based on relatively stable trends
reflecting the dominant influence of such slowly
changing factors as population growth, economic growth,
and price and supply conditions in energy markets. In
18 the short run, electric energy requirements fluctuate
19 around the long run trend, reflecting the effects of
20
21
22
23
24
seasonal or cyclical factors such as weather or business
conditions. Short term forecasts are therefore based
upon factors which have immediate short term effects,
such as plant expansion, increased new home sales and
the like. The information developed through 1980
reflects the use of the short term forecasting metho-
dology e
3 Q. Would you please describe Exhibit 14'?
4 A. Exhibit l4 consists of twelve pages, the first page of
12
13
14
15
16
17
18
19
which summarizes, by years from 1970-1980, the number of
residential customers, both regular and spaceheating and
the respective mWh sales. Page 2 contains a summary of
mWh sales to commercial, customers including heating,
nonheating and municipals. Page 3 contains the same
information for Industrial customers broken down between
the Company's 17 largest customers and all other cus-
Comers. Page 4 contains a summary of the mWh sales for
all of the foregoing classes as well as street lightingcustomers. Page 5 contains a summary of the customers,
mWh sales and associated revenues for the years l977,
l978, 1979 and the twelve months ending April 30, 1980,
by months. The balance of the Exhibit pages 6-l2, con-
tains a breakdown of the data shown on page 5, by
Service Classification.20 Q. Would you now describe the development of the resi-21 dential sales forecast.
23
24
A. In developing the forecast of short run residentialclass sales, the following parameters are used: livingunits to be added, the number of those to be heated

Ih
e
electrically, the nature of the electric heating "system
used and the average use value for the various types of
residential customers. The number of customers of each
type is estimated and the consumption for each group is1
then determined by applying the appropriate average use
value. The results are summed to derive the total sales
forecast for the residential class.
The number of new residential heating customers is
10
12
estimated on the basis of the availability of competing
fuels, their relative costs and builder preference.
Page l of Exhibit l4 shows the historic and forecast
sales for residential space heating customers. The
13
14
15
16
17
18
19
20
21
22
24
average use value is determined from surveys of electricspace heating customers. Total estimated use is deter-
mined by multiplying the average number of customers by
the average per customer use value.
The balance of the new customers estimated to be
added in the short run are categorized as regular cus-
tomers. The average use for this type of customer isdetermined by using appliance saturation data along with
specific appliance consumption data. This average use
value for regular customers is then multiplied by the
number of customers to obtain the total estimated con-
sumption. Page l shows the historic and estimated sales
for both space heating and regular residential customers
together with the aggregate forecast sales for the resi- „
dential class.
Q. Would you please describe the forecast of sales attrib-utable to the commercial class'
A. As shown on page 2, the forecast for the commercial
class is composed of three basic sections, (1) commer-
cial customers who heat electrically,'2) commercial
regular (non-heating) customers, who compose the bulk of
1O 'he class and (3) municipal customers.
12
13.
14
16
17
Sales to commercial customers who heat with elec-
tricity rose significantly in the 1973-l977 period
(5,000 mWh to 92,000 mWh), primarily because of the
unavailability of, or limitations on gas supply. The
forecast for the 1978-l980 period for this group of cus-
tomers is based on local economic conditions and
specific customer information.
18
19
20
21
22
23
24
All other commercial sales were forecast by adjust-
ing the long run commercial growth estimate for improve-
ments in utilization efficiency and local economic
conditions.
The forecast of municipal sales was based on normal
growth and known ma/or new loads. Normal growth was
estimated to be approximately 3 percent (3g) per year

,0
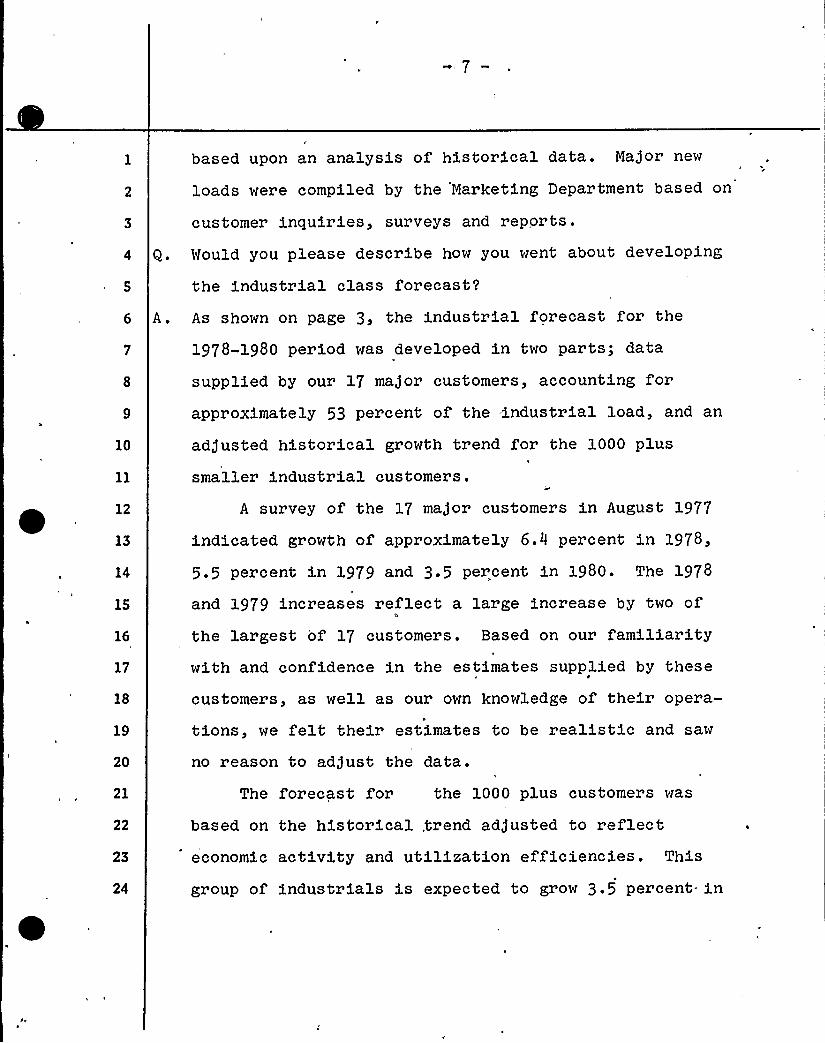
7—
based upon an analysis of historical data. Major new
loads were compiled by the Marketing Department based on
customer inquiries, surveys and reports.
Q. Would you please describe how you went about developing
the industrial class forecast?
A. As shown on page 3, the industrial forecast for the
1978-1980 period was developed in two parts; data
supplied by our 17 major customers, accounting for
10
approximately 53 percent of the .industrial load, and an
adjusted historical growth trend for the l000 plus
12
13
14
15
16
17
18
19
20
21
22
23
24
smaller industrial customers,
A survey of the 17 major customers in August 1977
indicated growth of approximately 6.4 percent in l978,
5.5 percent in 1979 and 3.5 percent in l980. The l978
and 1979 increases reflect a large increase by two of
the largest of l7 customers. Based on our familiaritywith and confidence in the estimates supplied by these
customers, as well as our own knowledge of their opera-
tions, we felt their estimates to be realistic and saw
no reason to adjust the data.
The forecast for the 1000 plus customers was
based on the historical, trend adjusted to reflecteconomic activity and utilization efficiencies. This
group of industrials is expected to grow 3.5 percent. in

O.
t
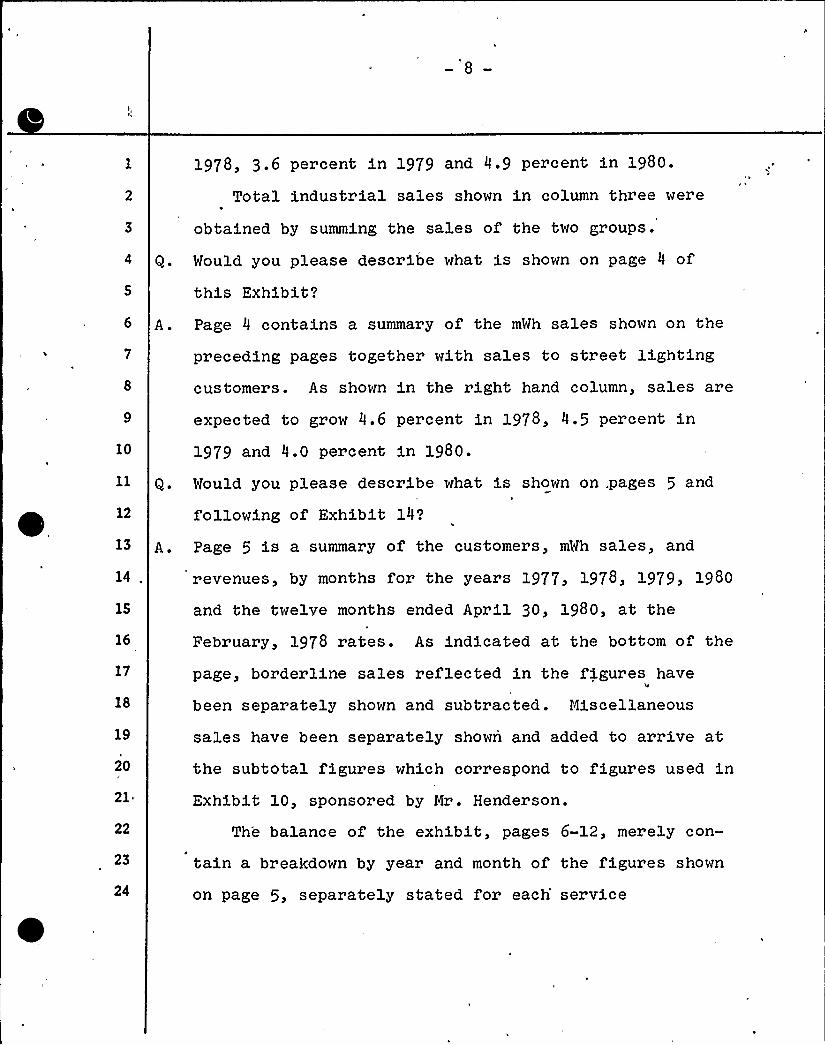
1978, 3.6 percent; in 1979 and 4.9 percent in 1980.
Total industrial sales shown in column three were
obtained by summing the sales of the Cwo groups.
Q. Would you please describe what is shown on page 4 of
this Exhibit'
10
A. Page 4 contains a summary of the mWh sales shown on the
preceding pages together with sales to street lightingcustomers. As shown in the right hand column, sales are
expected to grow 4.6 percent in 1978, 4.5 percent in
1979 and 4.0 percent in 1980.
12
Q. Would you please describe what is shown on .pages 5 and
following of Exhibit 14?
14 „
15
16
17
18
19
20
21
22
23
24
A. Page 5 is a summary of the customers, mWh sales, and
revenues, by months for the years 1977, 1978, 1979, 1980
and the twelve months ended April 30, 1980, at the
February, 1978 rates. As indicated at the bottom of the
page, borderline sales reflect;ed in the figures have
been separately shown and subtracted. Miscellaneous
sales have been separately shown and added to arrive at
the subtotal figures which correspond Co figures used inExhibit 10, sponsored by Mr. Henderson.
The balance of the exhibit, pages 6-12, merely con-
tain a breakdown by year and mont:h of the figures shown
on page 5, separately stated for each'ervice
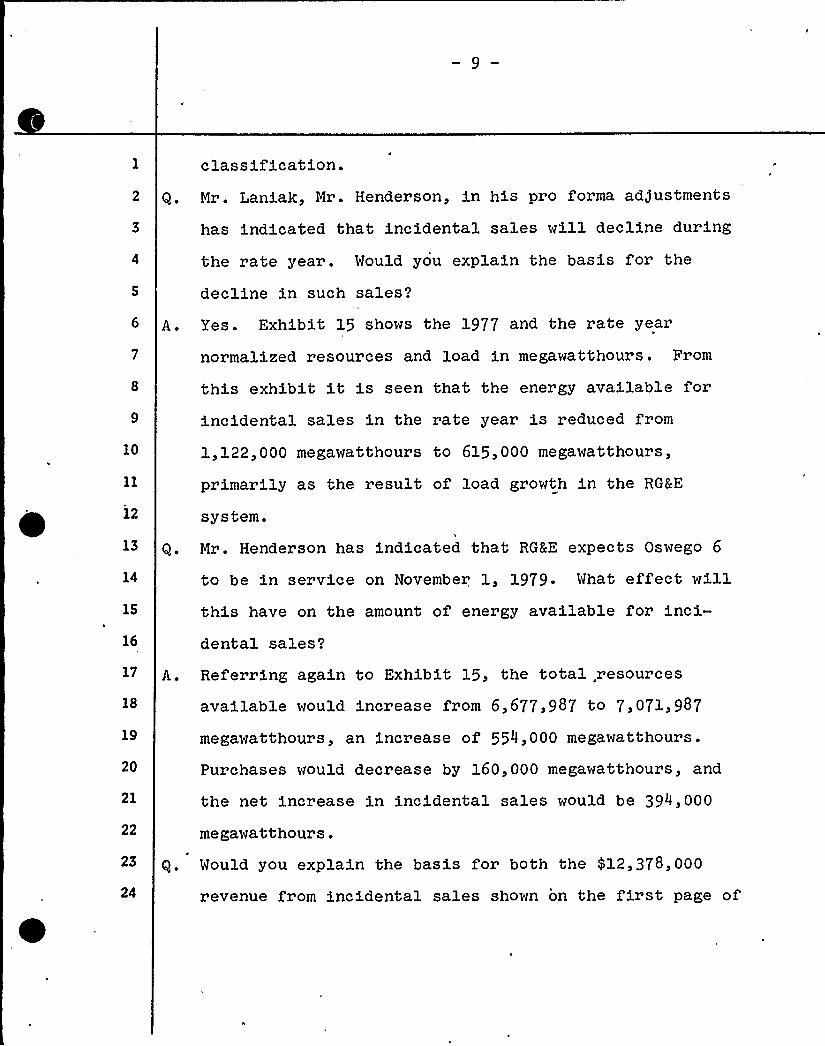
class ification.
Q. Mr. Laniak, Mr. Henderson, in his pro forma adjustments
has indicated that incidental sales will decline during
the rate year. Mould you explain Che basis for the
decline in such sales?
A. Yes. Exhibit 15 shows the 1977 and the rate year
normalized resources and load in megawatthours. From
10
12
13
14
1S
16
this exhibit it is seen that the energy available for
incidental sales in the rate year is reduced from
1,122,000 megawatthours to 615,000 megawatthours,
primarily as the result of load growth in the RG&E
system.
Q. Mr. Henderson has indicated that RG&E expects Oswego 6
to be in service on November 1, 1979. What effect willthis have on the amount of energy available for inci-dental sales'
18
19
20
21
22
23
24
A. Referring again to Exhibit 15, the total, resources
available would increase from 6,677,987 to 7,071,987
megawatthours, an increase of 554,000 megawatthours.
Purchases would deerease by 160,000 megawatthours, and
the net increase in incidental sales would be 394,000
megawatthours.
Q. Would you explain the basis for both the 412,378,000
revenue from incidental sales shown on the first page of

0
It
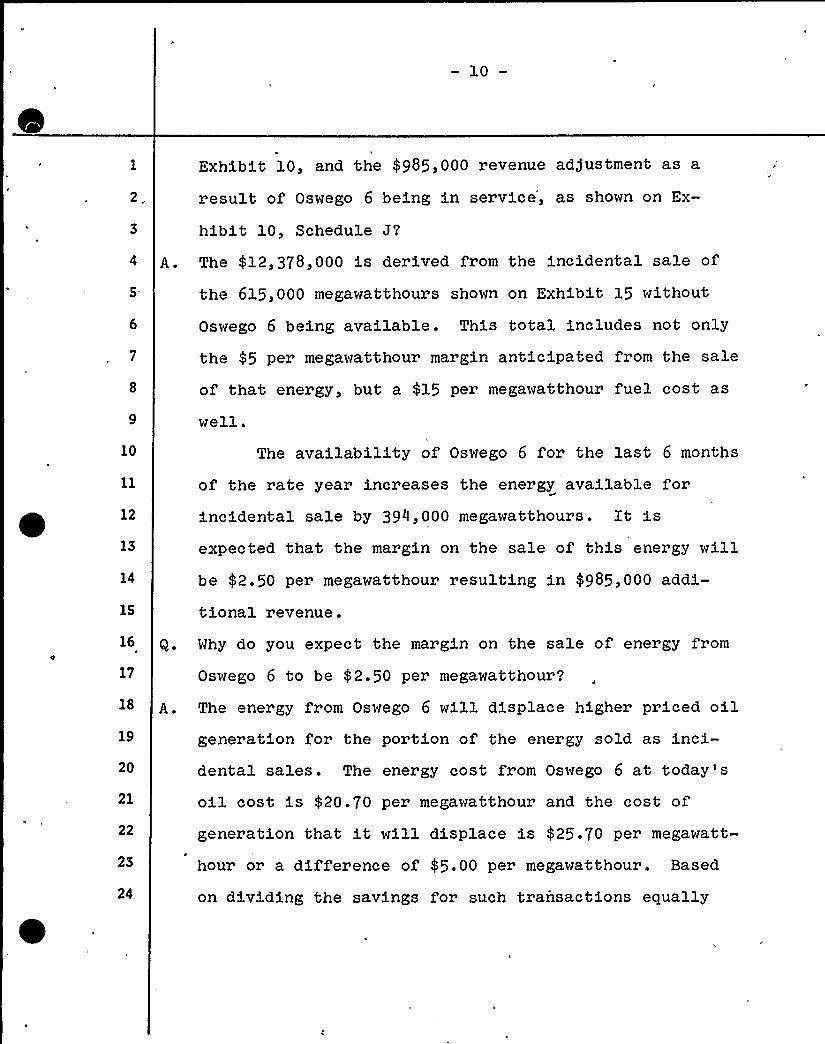
10—
2
10
12
13
14
16
17
18
19
20
21
22
23
24
Exhibit 10, and the 4985,000 revenue adjustment as a
result of Oswego 6 being in service, as shown on Ex-
hibit 10, Schedule J?
A. The $ 12,378,000 is derived from the incidental sale of
the 615,000 megawatthours shown on Exhibit 15 without
Oswego 6 being available. This total includes not only
the $ 5 per megawatthour margin anticipated from the sale
of that energy, but a $ 15 per megawatthour fuel cost as
well.The availability of Oswego 6 for the last 6 months
of the rate year increases the energy available forincidental sale by 394,000 megawatthours. It isexpected that the margin on the sale of this energy willbe $ 2.50 per megawatthour resulting in $ 985,000 addi-
tional revenue.
Q. Why do you expect the margin on the sale of energy from
Oswego 6 to be 42.50 per megawatthour'?
A. The energy from Oswego 6 will displace higher priced oilgeneration for the portion of the energy sold as inci-dental sales. The energy cost from Oswego 6 at today'
oil cost is $ 20.70 per megawatthour and the cost of
generation that it will displace is 425.70 per megawatt-
hour or a difference of $ 5.00 per megawatthour. Based
on dividing the savings for such transactions equally

O.
Jl,
11—
between the buyer and seller the margin would be 42.50
per megawatthour..
Q. Nr. Henderson, on page 8 of Schedule E in Exhibit l0,shows an increase of 88,000 megawatthours purchased
during the Ginna outage. Mhat is the reason for thisincrease'?
A. The load in the rate year is greater than the load in
the test period and because of this it is necessary to
10
purchase more energy during the period Ginna is on main-
tenance. During the Ginna shutdown we do not make
12
13
14
15
16
17
18
19
20
22
23
24
significant incidental sales. By including the higher
rate year customer requirements in a computer program
designed to simulate the dispatch of available genera-
tion resources, we derived the increased purchases
required to meet the higher rate year load during the
rate year portion of the Ginna shutdown. The total pur-
chases required will be 244,000 megawatthours in that
period. Deducting the normalized 1977 purchases of
156,000 megawatthours results in the rate year adjust-
ment of 88,000 megawatthours.
Q. How was the cost of $ 25.00 per megawatthour, which isshown on page 8 of Schedule E in Exhibit 10, determined?
A. The $ 25.00 per megawatthour is based on an analysis of
the costs incurred in purchasing energy and capacity

12—
during the 1977 Ginna shutdown.
Q. On page 1 of Schedule J in Exhibit 10 Mr. Henderson
shows an $ 800,000 reduction in purchased power expense
during the rate year portion of the 1980 Ginna shutdown
because of the availability of Oswego No. 6. Please
explain the derivation of this savings.
A. There are two components to this reduction: the reduc-
10
12
13
14
16
17
18
19
20
21
22
23
24
0ion in megawatthours required to be purchased and the
savings per megawatthour.
The reduction in megawatthours was determined by the
use of the same computer program for simulating the dis-
patch of available generation resources to meet the rate
year load during the Ginna shutdown. However, in thisrun the Company's 204 megawatt share of Oswego No. 6 was
included as an available generation resource. The
result of this run showed the reduction of 160,000 mega-
watthours in purchases from outside resources.
The savings of $ 5.00 per megawatthour of purchased
capacity represents only non-fuel-related costs. Xt isagain based upon an analysis of the costs incurred inmaking purchases during the 1977 Ginna shutdown. As
stated in Mr. Henderson's testimony, the Oswego No. 6
operation and maintenance costs, provided for on page 1
of Schedule J of Exhibit 10, do not include fuel

10
12
13
14
16
17
18
19
20
21
22
23
24
expense. Since, in substituting the Oswego No. 6
energy for purchased energy, the Company will obviously
incur fuel costs, it would be necessary to include the
latter if the fuel-related purchase energy costs were to
be deducted. In lieu of doing so, it was assumed that
the two costs would approximately cancel out. Hence
,only the'apacity-related costs were utilized to price-
out the purchase power savings.
Q. Mr. Laniak, in the Company's last electric rate proceed-
ing, the Commission called upon the Company to indicate
the impact, upon the Company's Steam Department, of
transferring fixed costs of Beebee Station Old House
from the Electric Department to the Steam Department.
The Commission also instructed the Company to provide
the current basis upon which Beebee Station Old House isneeded by the Electric Department. Please address your-
self to this issue.
A. >/ith regard to the potential impact, upon the Company's
steam customers, of transferring Old House fixed costs
to the Steam Department, the Company, through Mr.
Henderson, has previously provided 'data to Staff which
shows that impact. My testimony goes solely to the
Electric Department's need for, and benefit from, the
Old House capacity.
S
10
12
13
14
15
16
17
18
19
20
21
22
23
24
The Beebee Old House capacity provides fuel source
diversity, capacity that is used to meet installed
reserve and spinning reserve criteria and operational
flexibility in meeting electric system peak demands. Itshould be noted that, because the Beebee Old House
turbines are connected to a common steam header that is
also used to supply the district steam system, a ready
supply of steam is available, facilitating the use of
these units for spinning reserves and for meeting peak
demands.
The use of Old House capacity for reserve and reli-ability is best demonstrated by actual generation and
operating data. Exhibit 16 shows the RGEE required
reserve based on the New York Power Pool agreement. Italso shows Old House turbine generation, and turbine
hours run by turbine number, for the years 1972 to 1977.
It also shows the utilization of Old House for spinning
reserve.
It is apparent that Beebee Old House continues to
provide a meaningful contribution to the Electric system
in helping to meet peak demand, and in complying with
installed and spinning reserve requirements of the New
York Power Pool.
The Old House units represent peaking capacity that

0
10
provides an economic advantage in New York Power Pool
short term energy transactions. Exhibit 16 shows at the
bottom, the contribution of the Old House in meeting
peak demands for the years 1972 to 1977. Our simula-
tions of RG&E units, using a version of General Elec-
tric's time sharing Production Costing Program, continue
to show a need for Old House generation in the years
1978 to 1983. During this period from 100,000 to
250,000 megawatthours per year may be expected to be
dispatched from the Old House.
12
Further, the Old House units are centrally located
in the RGRE system, increasing reliability during
13 periods of high load or transmission system contin-
14
15
16
17
gencies.
From all of the foregoing reasons, I conclude that
the Old House capacity continues to be needed by the
Electric Department.
18 Q. Does that complete your direct testimony in this pro-
19 ceeding'?
20 A. Yes it does.
21
22
23
24
Rochester Gas and Electric Corporation
DIRECl'ESTIMONY
of
Robert J. Hobday
Supervisor-Rate Research
Hobday
Q. Mr. Hobday, will you please state your full name and
business address for the record?
A. Robert J. Hobday, 89 East Avenue, Rochester, New York
14649.
10
12
13
14
15
16
17
18
19'0
21
22
23
24
Q. Mr. Hobday, will you also please state by whom you are
employed and in what capacity?
A. I am employed by Rochester Gas and Electric Corporation
and hold the position of Supervisor-Rate Research in the
Rate and Economic Research Department.
Q. Please describe briefly your education and business ex-
perience.
A. I am a graduate of Union College. In 1965, I was employed
by the Company as a statistician in the Rate and Economic
Research Department. I was promoted to Senior Statisticianin 1971 and to my present position in 1972.
Q. Please describe the scope of your testimony in this pro-
ceeding.
A. My testimony covers the proposed revisions to P.S.C. No. 9-Electricity, P.S.C. No. 10 - Gas, and P.S.C. No. 13
Electricity, which have been filed with the Public Service
Commission, and the information contained in Exhibits 17-20,
which were prepared under my supervision and direction.
Q. Will you explain briefly what revisions have been made
and expl'ain what the changes have been designed to accomplish?,

IP
Hobda
A. The primary objective was to effect revisions which would
produce an overall revenue increase of approximately
$ 34,999,000, or 18.24, in the Electric Department and
$ 9,997,000, or 9.14, in the „Gas Department based on
sales for the 12-month period ended December 31,
1977.
10
12
13
14
15
16
17
19
20
21
22
23
24
Would you please tell us why the Company has not proposed
time-of-day rates for electricity in this filing?A. Let me begin by outlining a brief history of the Rulings
and Orders in Case 26806. In a Procedural Ruling dated
December 2, 1975, Rochester Gas and Electric Corporation
was directed to prepare and submit a marginal cost study
by October 1, 1976,. subsequently extended to November 15,
1976.
In an Order issued January 7, 1976, the Commission
ordered the electric utilities to propose time-of-day
rate designs, based on marginal or average cost, for cus-
tomers whose meters are capable of measuring load according
to time or who could reasonably be provided with such
meters. Subsequently, in Opinion No. 76-15 issued August 10,
1976, the Commission concluded that marginal costs do
provide a reasonable basis for electric rate structures,
and directed each electric utility to develop marginal
cost studies, load data studies and other pertinent studies

w
r
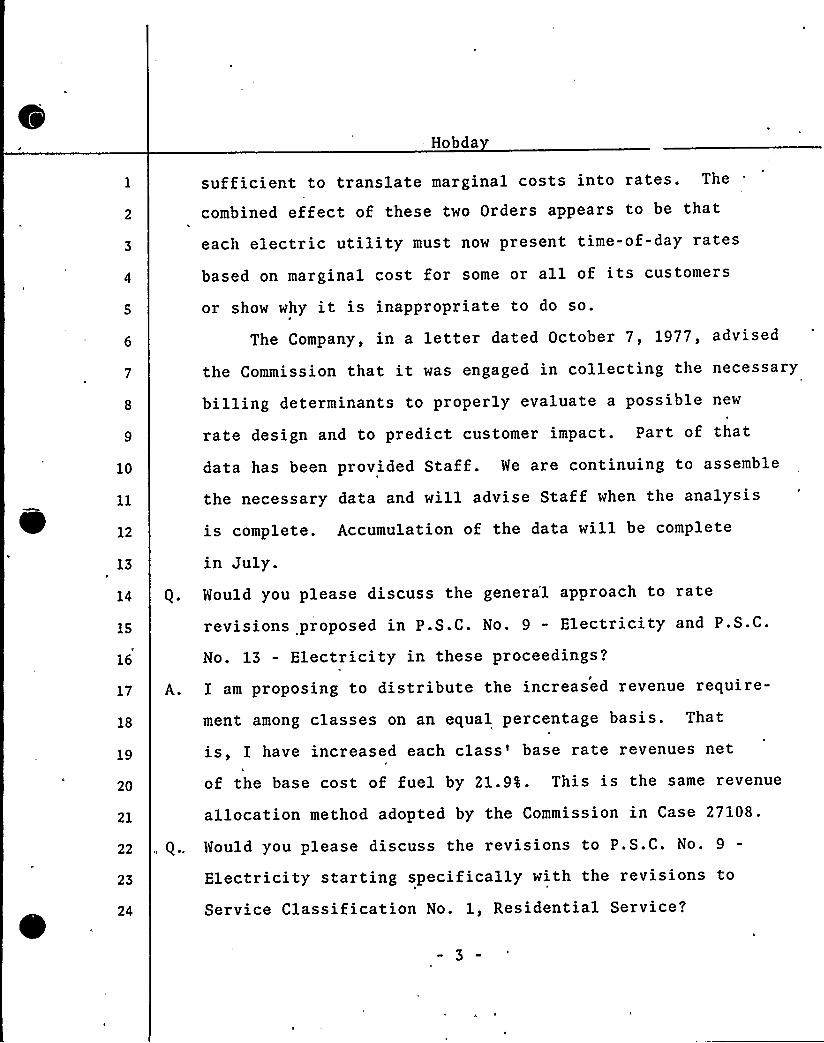
Hobda
10
12
13
sufficient to translate marginal costs into rates. The
combined effect of these two Orders appears to be that
each electric utility must now present time-of-day rates
based on marginal cost for some or all of its customers
or show why it is inappropriate to do so.
The Company, in a letter dated October 7, 1977, advised
the Commission that it was engaged in collecting the necessary
billing determinants to properly evaluate a possible new
rate design and to predict customer impact. Part of that
data has been provided Staff. We are continuing to assemble
the necessary data and will advise Staff when the analysis
is complete. Accumulation of the data will be complete
in July.
14 Q. Would you please discuss the genera'l approach to rate
1S
16
17
18
19
20
21
revisions proposed in P.S.C. No. 9 - Electricity and P.S.C.
No. 13 - Electricity in these proceedings?
A. I am proposing to distribute the increased revenue require-
ment among classes on an equal percentage basis. That
is, I have increased each class'ase rate revenues net
of the base cost of fuel by 21.94. This is the same revenue
allocation method adopted by the Commission in Case 27108.
22 „ Q.. Would you please discuss the revisions to P.S.C. No. 9
23
24
Electricity starting specifically with the revisions to
Service Classification No. l, Residential Service.
3

II
~ 4
4P
t
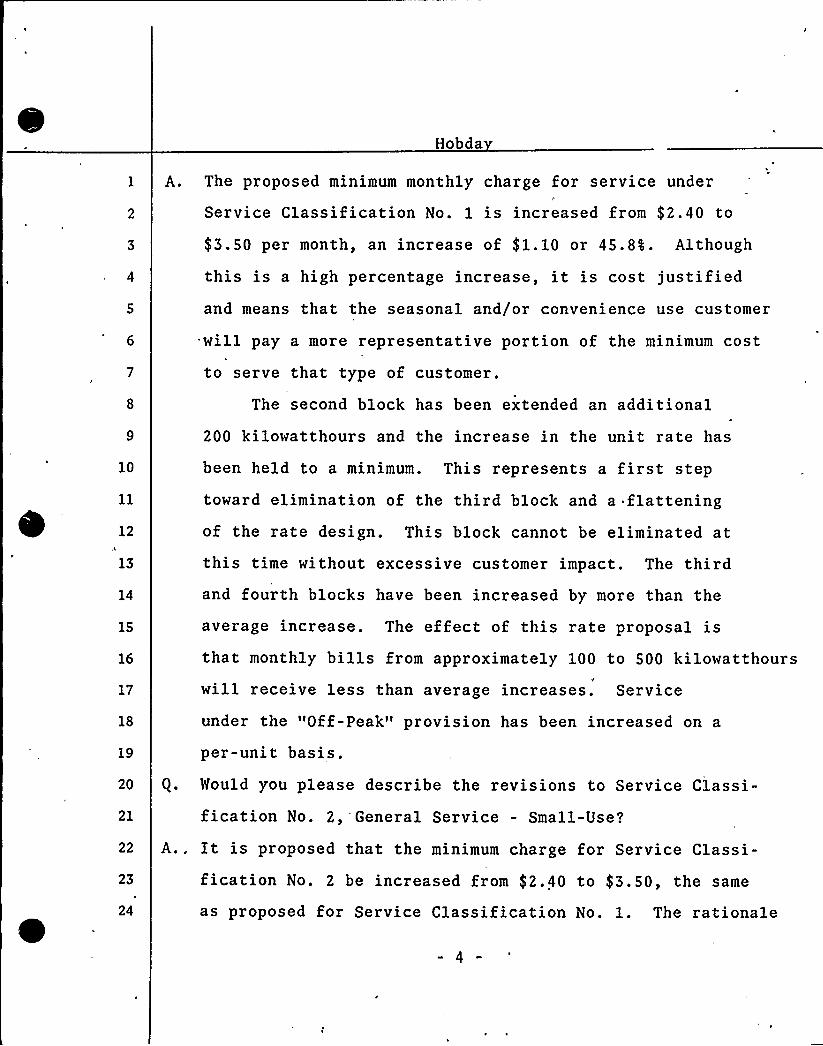
Hobda
12
13
14
1S
16
17
18
19
20
21
22
23
24
A. The proposed minimum monthly charge for service under
Service Classification No. l is increased from $ 2.40 to
$ 3.50 per month, an increase of $ 1.10 or 45.84. Although
this is a high percentage increase, it is cost justifiedand means that the seasonal and/or convenience use customer
will pay a more representative portion of the minimum cost
to serve that type of customer.
The second block has been extended an additional200 kilowatthours and the increase in the unit rate has
been held to a minimum. This represents a first step
toward elimination of the third block and a flatteningof the rate design. This block cannot be eliminated at
this time without excessive customer impact. The thirdand fourth blocks have been increased by more than the
average increase. The effect of this rate proposal isthat monthly bills from approximately 100 to 500 kilowatthourswill receive less than average increases. Service
under the "Off-peak" provision has been increased on a
per-unit basis.
Q. Would you please describe the revisions to Service Classi-
fication No. 2,'General Service - Small-Use?
A.. It is proposed that the minimum charge for Service Classi-
fication No. 2 be increased from $ 2.40 to $ 3.50, the same
as proposed for Service Classification No. l. The rationale
4

e
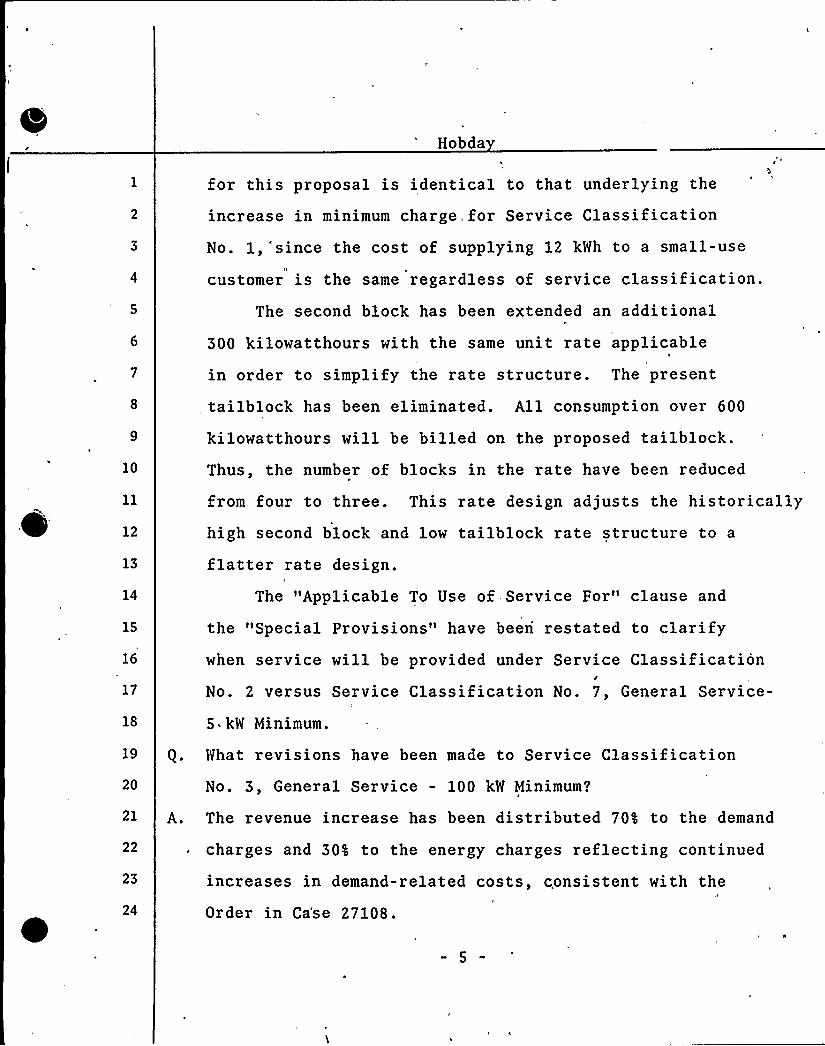
Hobda
10
12
13
14
15
16
17
18
for this proposal is identical to that underlying the
increase in minimum charge for Service Classification
No. l,'since the cost of supplying 12 kWh to a small-use1t
customer is the same regardless of service classification.The second block has been extended an additional
P'00kilowatthours with the same unit rate applicable
in order to simplify the rate structure. The present
, tailblock has been eliminated. All consumption over 600
kilowatthours will be billed on the proposed tailblock.Thus, the number of blocks in the rate have been reduced
from four to three. This rate design adjusts the historicallyhigh second block and low tailblock rate structure to a
flatter rate design.
The "Applicable To Use of Service For" clause and
the "Special Provisions" have been restated to clarifywhen service will b'e provided under Service Classification
INo. 2 versus Service Classification No. 7, General Service-
5 kW Minimum.
19 What revisions have been made to Service Classification20
21
22
23
24
No. 3, General Service - 100 kW Minimum?
A. The revenue increase has been distributed 704 to the demand
charges and 304 to the energy charges reflecting continued
increases in demand-related costs, consistent with the
Order in Ca'se 27108.

0
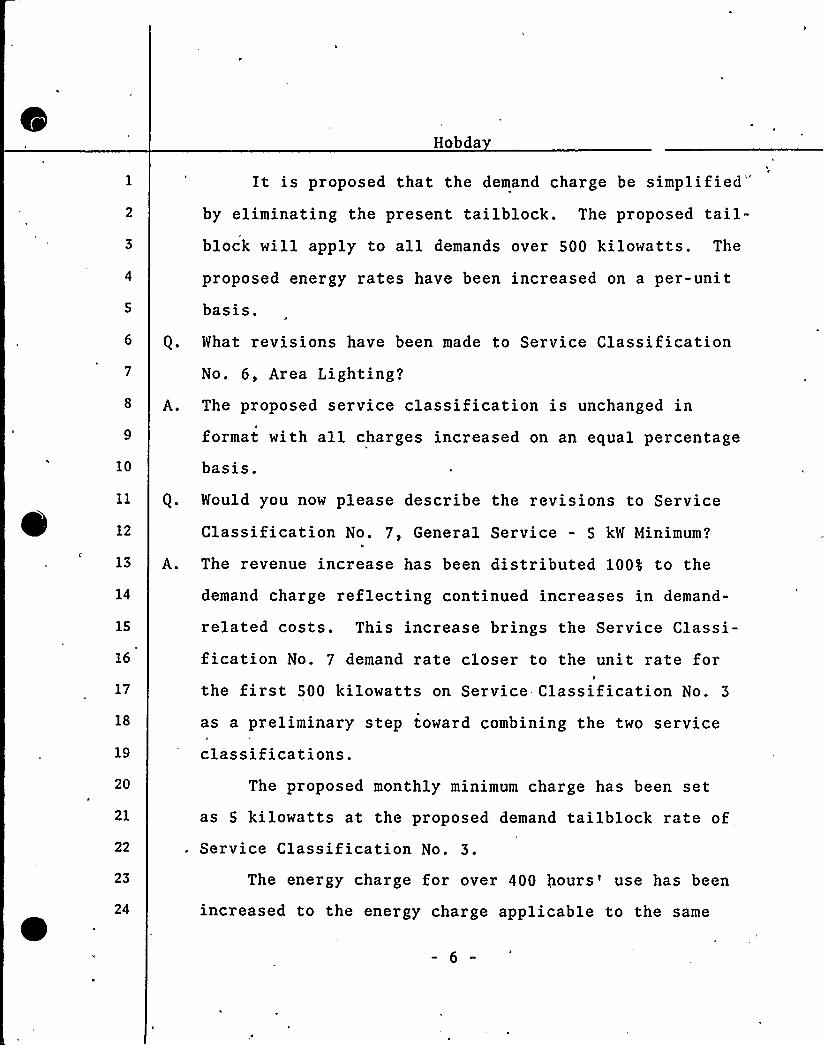
Hobda
It is proposed that the demand charge be simplified"
by eliminating the present tailblock. The proposed tail-block will apply to all demands over 500 kilowatts. The
proposed energy rates have been increased on a per-unitbasis.
What revisions have been made to Service Classification
10
No. 6, Area Lighting?
A. The proposed service classification is unchanged in
format with all charges increased on an equal percentage
basis.
11 g. Would you now please describe the revisions to Service
12
13
Classification No. 7, General Service - 5 kW Minimum?
A. The revenue increase has been distributed 1004 to the
14
16
17
demand charge reflecting continued increases in demand-
related costs. This increase brings the Service Classi-
fication No. 7 demand rate closer to the unit rate forthe first 500 kilowatts on Service Classification No; 3
18
19
as a preliminary step toward combining the two service
classifications.20
21
22
The proposed monthly minimum charge has been set
as 5 kilowatts at the proposed demand tailblock rate of. Service Classification No. 3.
23
24
The energy charge for over 400 hours'se has been
increased to the energy charge applicable to the same
6

I
1
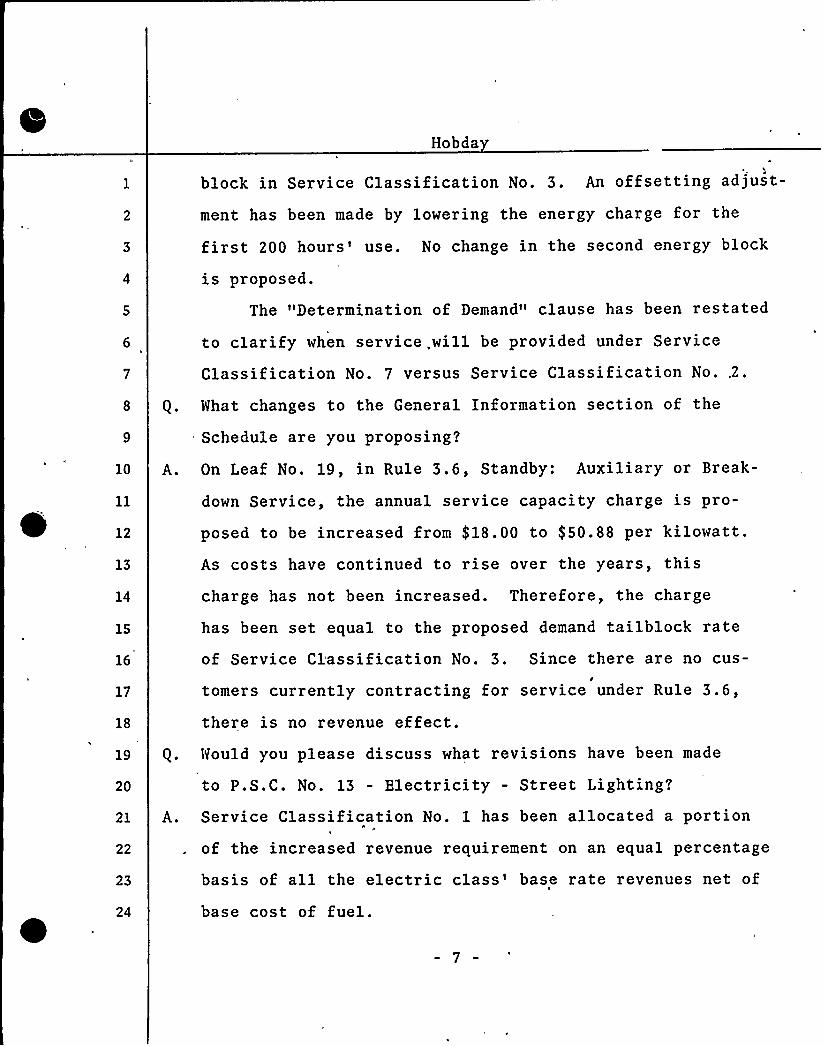
Hobda
block in Service Classification No. 3. An offsetting adjust-
ment has been made by lowering the energy charge for the
first 200 hours'se. No change in the second energy block
is proposed.
The "Determination of Demand" clause has been restated
to clarify when service. will be provided under Service
Classification No. 7 versus Service Classification No.,2.
8 Q. What changes to the General Information section of the
Schedule are you proposing?
10 A. On Leaf No. 19, in Rule 3.6, Standby: Auxiliary or Break-
12
13
14
1S
16
17
down Service, the annual service capacity charge is pro-
posed to be increased from $ 18.00 to $ 50.88 per kilowatt.
As costs have continued to rise over the years, this
charge has not been increased. Therefore, the charge
has been set equal to the proposed demand tailblock rate
of Service Classification No. 3. Since there are no cus-t
tomers currently contracting for service under Rule 3.6,
there is no revenue effect.19 Q. Would you please discuss what revisions have been made
20
21
22
23
24
A.
to P.S.C. No. 13 - Electricity - Street Lighting?
Servi,ce Classification No. l has been allocated a portion
of the increased revenue requirement on an equal percentage
basis of all the electric class'ase rate revenues net of
base cost of fuel.
7

'
0
0
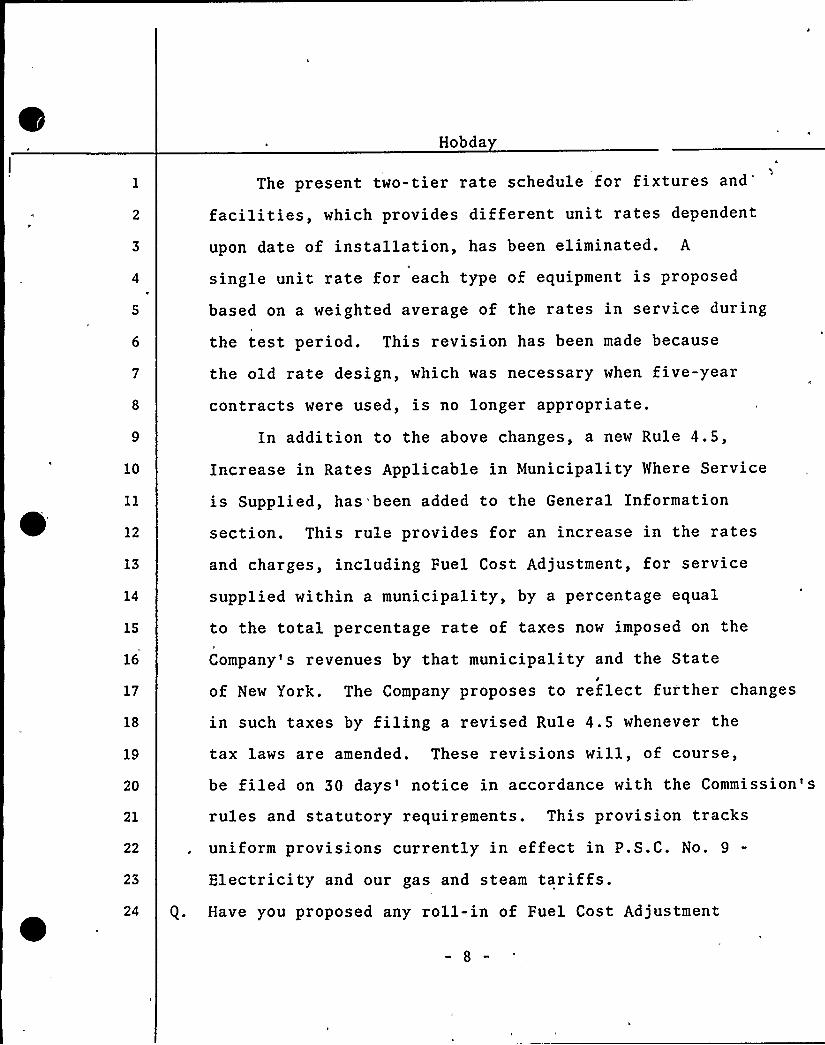
Hobda
10
12
13
14
15
16
17
18
19
20
21
22
23
24
The present two-tier rate schedule for fixturesand'acilities,which provides different unit rates dependent
upon date of installation, has been eliminated. A
single unit rate for each type of equipment is proposed
based on a weighted average oE the rates in service during
the test period. This revision has been made because
the old rate design, which was necessary when five-year
contracts were used, is no longer appropriate.
In addition to the above changes, a new Rule 4.5,
Increase in Rates Applicable in Municipality Where Service
is Supplied, has been added to the General Information
section. This rule provides for an increase in the rates
and charges, including Fuel Cost Adjustment, for service
supplied within a municipality, by a percentage equal
to the total percentage rate of taxes now imposed on the
Company's revenues by that municipality and the StateI
oE New York. The Company proposes to reElect further changes
in such taxes by filing a revised Rule 4.5 whenever the
tax laws are amended. These revisions will, of course,
be filed on 30 days'otice in accordance with the Commission's
rules and statutory requirements. This provision tracks
uniform provisions currently in effect in P.S.C. No. 9
Electricity and our gas and steam tariffs.Have you proposed any roll-in of Fuel Cost Adjustment

n
0v
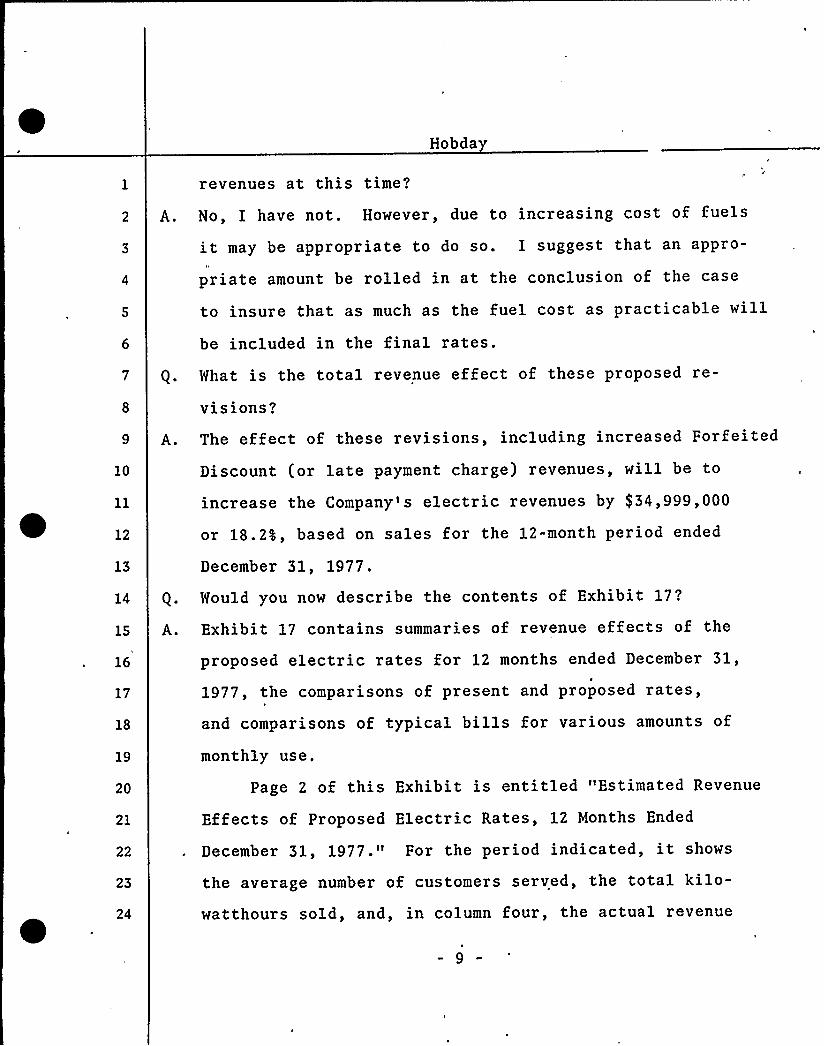
Hobda
revenues at this time?
A. No, I have not. However, due to increasing cost of fuels
it may be appropriate to do so. I suggest that an appro-
priate amount be rolled in at the conclusion of the case
to insure that as much as the fuel cost as practicable willbe included in the final rates.
Q. What is the total revenue effect of these proposed re-
visions?
10
12
13
14
15
A. The effect of these revisions, including increased Forfeited
Discount (or late payment charge) revenues, will be to
increase the Company's electric revenues by $ 34,999,000
or 18.24, based on sales for the 12-month period ended
December 31, 1977.
Would you now describe the contents of Exhibit 17?
A. Exhibit 17 contains summaries of revenue effects of the
16
17
18
19
20
21
22
23
proposed electric rates for 12 months ended December 31,
1977, the comparisons of present and proposed rates,
and comparisons of typical bills for various amounts of
monthly use.
Page 2 of this Exhibit is entitled "Estimated Revenue
Effects of Proposed Electric Rates, 12 Months Ended
December 31, 1977." For the period indicated, it shows
the average number of customers served, the total kilo-watthours sold, and, in column four, the actual revenue

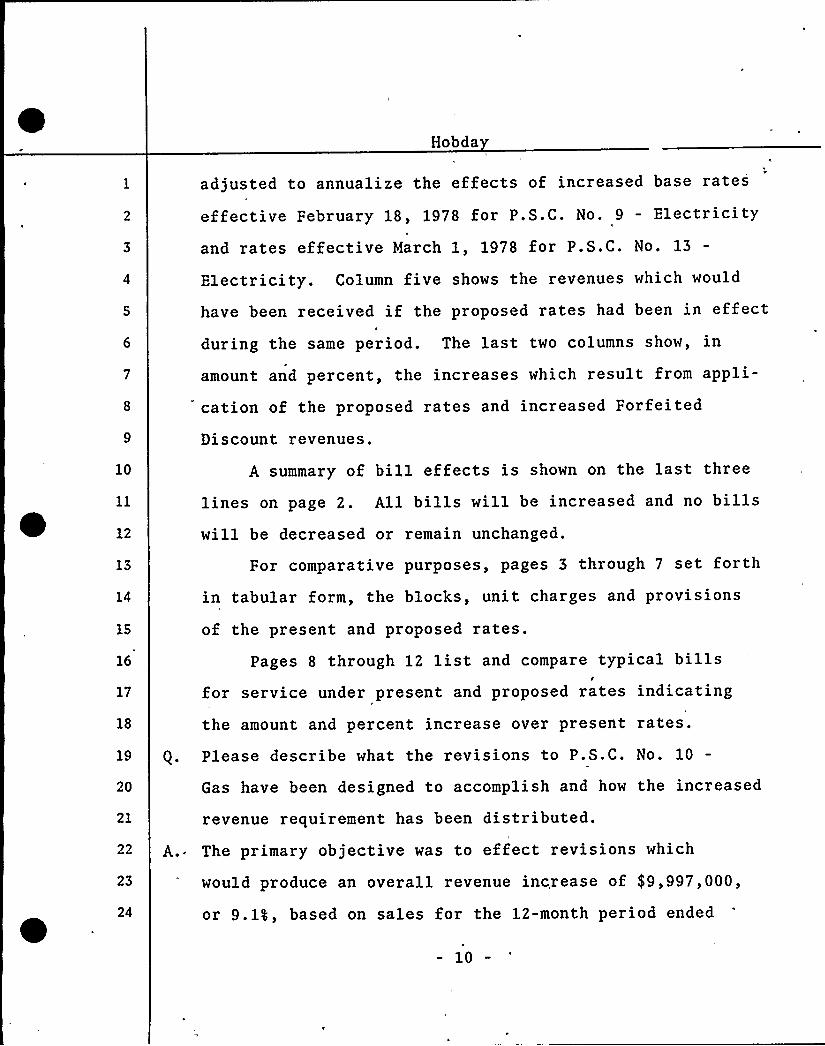
Hobda
adjusted to annualize the effects of increased base rates
effective February 18, 1978 for P.S.C. No. 9 - Electricityand rates effective March 1, 1978 for P.S.C. No. 13
10
12
13
14
16
17
18
Electricity. Column five shows the revenues which would
have been received if the proposed rates had been in effect
during the same period. The last two columns show, in
amount and percent, the increases which result from appli-
cation of the proposed rates and increased Forfeited
Discount revenues.
A summary of bill effects is shown on the last three
lines on page 2. All bills will be increased and no billswill be decreased or remain unchanged.
For comparative purposes, pages 3 through 7 set forth
in tabular form, the blocks, unit charges and provisions
of the present and proposed rates.
Pages 8 through 12 list and compare typical billsfor service under present and proposed rates indicating
the amount and percent increase over present rates.
19 g. Please describe what the revisions to P.S.C. No. 10
20
21
22
23
24
A. ~
Gas have been designed to accomplish and how the increased
revenue requirement has been distributed.
The primary objective was to effect revisions which
would produce an overall revenue increase of $ 9,997,000,
or 9.14, based on sales for the 12-month period ended
10

1
Hobda
10
December 31, 1977.
In accomplishing that objective, we have sought to
bring about further rate simplification of Service
Classification No. 1 through elimination of one block.
The present fourth block, 1001 to 5000 Ccf, and the present
fifth block, 5001 to 100,000 Ccf, have been combined.
The proposed minimum monthly charge for service under
Service Classification No. 1 is increased from $ 2.56 to
$ 3.50, or 36.74. This is to bring the minimum charges
more closely in line with the cost of serving a minimum-
use customer.
12
13
14
15
The remaining increased revenue requirement then
was distributed to the remaining proposed blocks of Service
Classification No. 1 by an across-the-board increase on
a per-unit basis.
16
17
18
19
20
21
22
23
24
Proposed Service Classification No. 2, Gas Lighting
Service, has been 'modified by increasing the noncommodity
portion'included in the present rate by the overall per-
centage increase. The result of this component
increase is'an increase in the Service Classification
No. 2 flat rate from $ 4.51 to $ 4.70 per month.
I have not proposed any roll-in of Gas Cost Adjust-
ment revenues at this time. However, I suggest that an
appropriate amount be rolled in at the conclusion of the
11

I'VII
l
I'
Hobday
case based on the cost of gas at that time to insure that
as much as is practicable will be included in final base
rates. Similarly, I suggest that the Service Classification
No. 2 rate be increased by the amount of all further in-
creases in purchased gas cost which have occurred by the
time new rates become effective.7 Q. On April 11, 1978, the Commission issued an Order in Case
27325 - Bath Electric, Gas and Water Systems - Gas Rate
10
12
14
1S
16
17
18
19
20
21
22
23
24
Increase in which it adopted a rate design with an initialr
charge to recover customer costs and flat rates thereafter.
Is it your understanding that a flat rate for the Gas
Department would be cost justified?A. Definitely not. A flat rate would not track the costs
involved to serve customers of different sizes.
The costs necessarily incurred in supplying a
customer can be divided into three basic functions:
capacity cost - reflecting an allocation of the costs
relatedrto transmission and distribution mains and regu-
lators and the demand cost of purchased gas; commodity
cost - reflecting the commodity cost of purchased
gas; and customer cost - reflecting meter reading, cus-
tomer accounting and collecting, meters and services,
etc. A general review of these three costs may be useful.
Capacity costs are those controlled by the size of
12

l~'r
IV
t
t
Hobda
the delivery facilities and ar'e a function of the hourly
10
12
13
14
15
16
17
or daily use of gas. In the gas industry, economies of
scale are inherent in the use of large pipe sizes. For
example, the cost, of six-inch pipe is 9 times the cost
of a one-inch pipe yet capacity is increased more than
800 times. Thus, cost per Ccf of capacity decreases as
pipe size is increased. Accordingly, total costs per
Ccf of capacity decrease quite sharply as customer loads
increase.
Commodity costs are specifically related to the commodity
cost of purchased gas and are in direct correlation to the
amount of gas used. This cost, on a per Ccf basis, does
not vary with customer use.
Customer costs include the capital costs and expenses
of meters and services, operating expenses connected with
customer accounting and collecting, and other general costst
that vary directly by the number of customers served.
18
19
The expenses incurred by the Company to read
bill the customer and collect the revenue do
the meter,
not vary
20
21
22
23
24
significantly from a residential customer to an industrialcustomer. Thus, as customers'se increases, the cus-
tomer costs involved, per Ccf, decline. The costs in-
volved with meters and services do vary with the customer'
size but as was the case with capacity costs, the expen'se,
13
Hobda
on a Ccf basis, decreases as the volume of gas used by
a customer increases.
10
12
13
14
1S
Therefore, it can be seen from this discussion of
the three cost components that the overall costs necessary
to serve a customer decrease, on a per Ccf basis, as the
customer's load increases. This reduction in cost,
per Ccf, is reflected in the price differentialsbetween the blocks in a declining block rate structure.
Q. If a flat rate were to be instituted for Rochester Gas
and Electric, would the effect of weather on revenues
be magnified?
A. Yes. Weather effects, already a disrupting factor in
revenue received, would have an intensified effect on
total revenue and on revenue stability. Assuming that
the revenues used to set the flat rate were based on normal
16
17
18
19
20
21
22
23
24
weather, moving from a normal year to a colder-than-normal
or warmer-than-normal year would create wider swings in
the amount of money received by the Company. The revenue
fluctuation would be more pronounced with a flat rate
than with the current rate design because with a flattl
rate the price for weather sensitive usage would include
a larger portion of fixed costs. Therefore, weather pattern
changes from year to year would have a more serious im-
pact on revenue stability.
14

~,
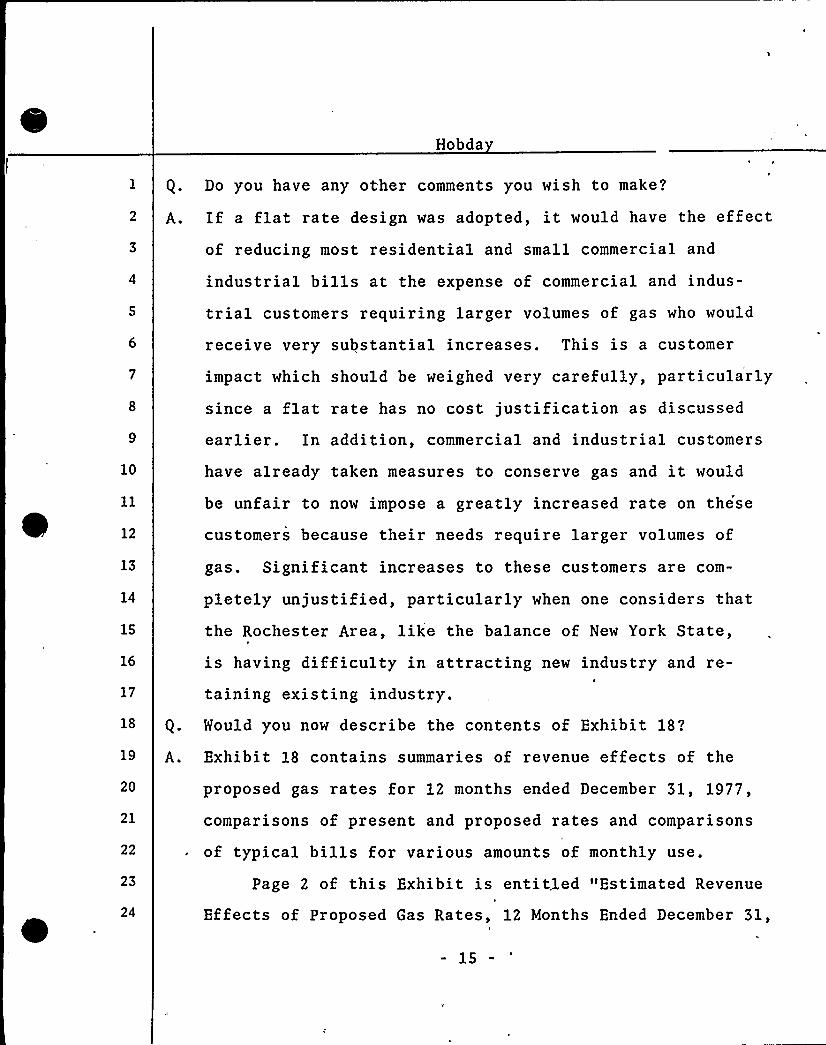
Hobda
10
12
13
14
15
16
17
18
19
20
21
22
23
24
Q. Do you have any other comments you wish to make?
A. If a flat rate design was adopted, it would have the effect
of reducing most residential and small commercial and
industrial bills at the expense of commercial and indus-
trial customers requiring larger volumes of gas who would
receive very substantial increases. This is a customer
impact which should be weighed very carefully, particularlysince a flat rate has no cost justification as discussed
earlier. In addition, commercial and industrial customers
have already taken measures to conserve gas and it would
be unfair to now impose a greatly increased rate on these
customers because their needs require larger volumes of
gas. Significant increases to these customers are com-
pletely unjustified, particularly when one considers that
the Rochester Area, like the balance of New York State,
is having difficulty in attracting new industry and re-
taining existing industry.
Q. Would you now describe the contents of Exhibit 18?
A. Exhibit 18 contains summaries of revenue effects of the
proposed gas rates for 12 months ended December 31, 1977,
comparisons of present and proposed rates and comparisons
of typical bills for various amounts of monthly use.
Page 2 of this Exhibit is entitled "Estimated Revenue
Effects of Proposed Gas Rates, 12 Months Ended December 31,
15
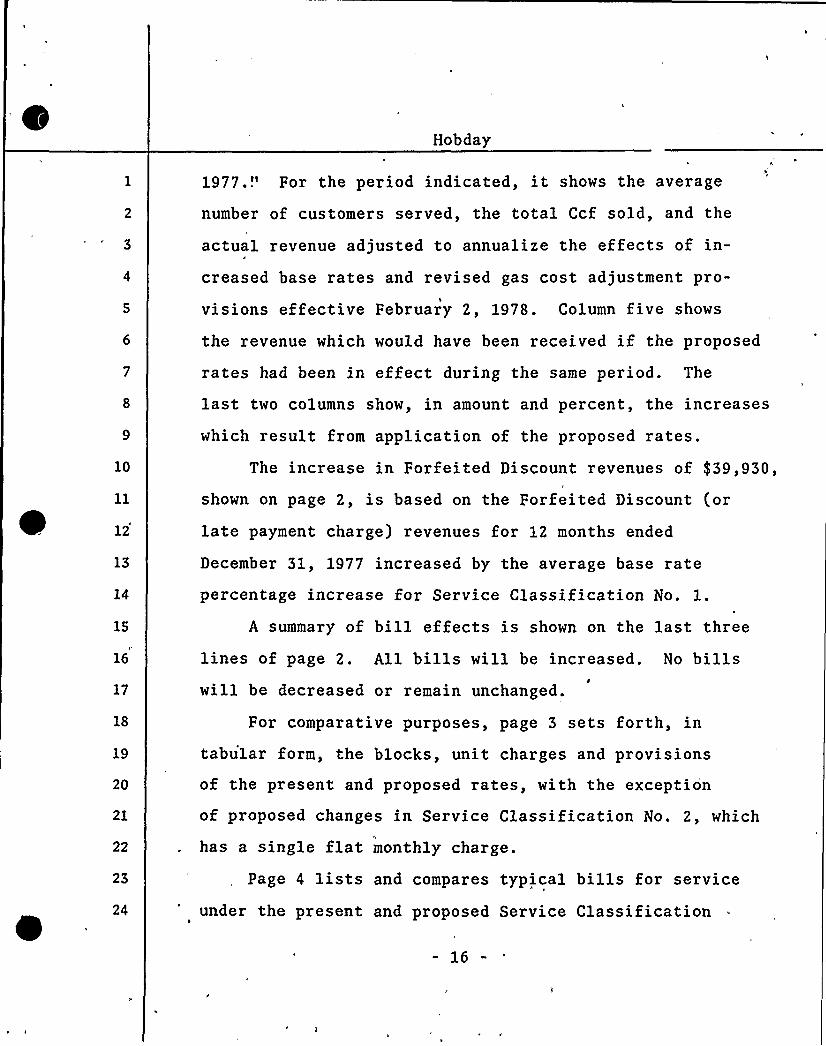
Hobday
10
12
13
14
15
16
17
18
19
20
21
22
23
24
1977.t'or the period indicated, it shows the average
number of customers served, the total Ccf sold, and the
actual revenue adjusted to annualize the effects of in-
creased base rates and revised gas cost adjustment pro-
visions effective February 2, 1978. Column five shows
the revenue which would have been received if the proposed
rates had been in effect during the same period. The
last two columns show, in amount and percent, the increases
which result from application of the proposed rates.
The increase in Forfeited Discount revenues of $ 39,930,
shown on page 2, is based on the Forfeited Discount (or
late payment charge) revenues for 12 months ended
December 31, 1977 increased by the average base rate
percentage increase for Service Classification No. 1.
A summary of bill effects is shown on the last three
lines of page 2. All bills will be increased. No billswill be decreased or remain unchanged.
For comparative purposes, page 3 sets forth, intabular form, the blocks, unit charges and provisionsof the present and proposed rates, with the exception
of proposed changes in Service Classification No. 2, which
has a single flat monthly charge.
Page 4 lists and compares typical bills for service
under the present and proposed Service Classification
16

l»
'h
V
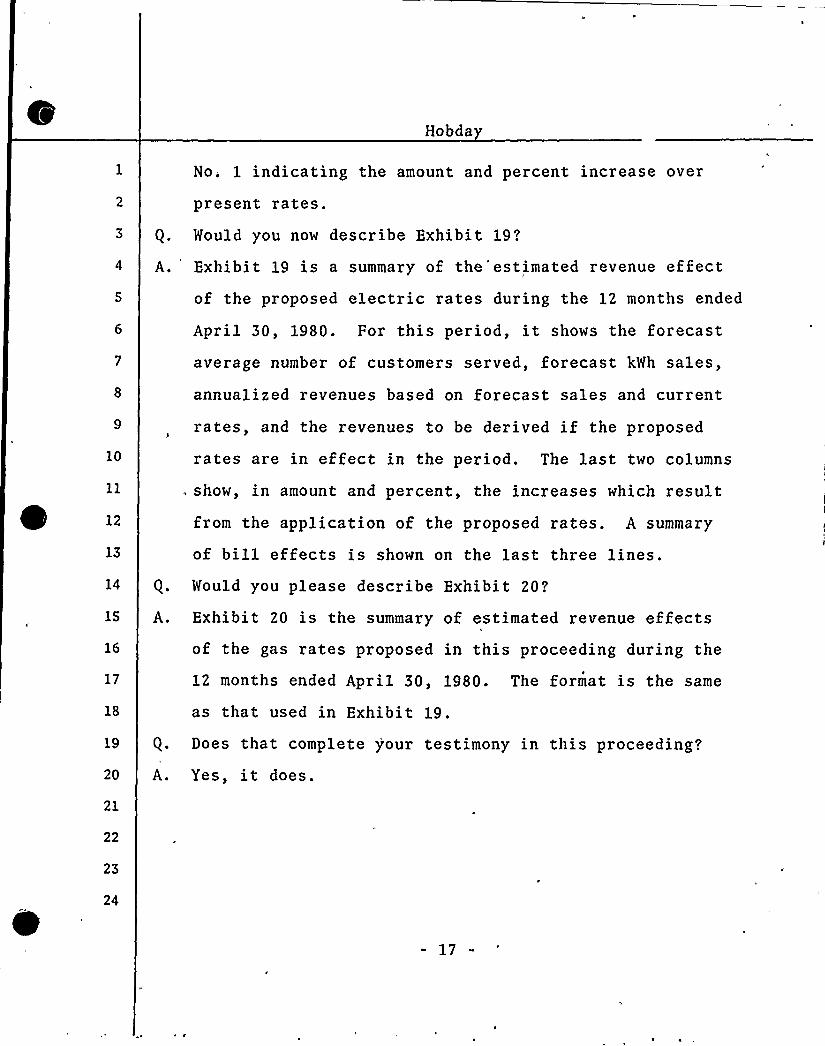
Hobda
No. 1 indicating the amount and percent increase over
present rates.
Would you now describe Exhibit 19?
4 A. Exhibit 19 is a summary of the"estimated revenue effect
10
12
13
of the proposed electric rates during the 12 months ended
April 30, 1980. For this period, it shows the forecast
average number of customers served, forecast kWh sales,
annualized revenues based on forecast sales and current
rates, and the revenues to be derived if the proposed
rates are in effect in the period. The last two columns
. show, in amount and percent, the increases which resultfrom the application of the proposed rates. A summary
of bill effects is shown on the last three lines.14 Q. Would you please describe Exhibit 20?
1S A. Exhibit 20 is the summary of estimated revenue effectsof the gas rates proposed in this proceeding during the
18
12 months ended April 30, 1980. The format is the same
as that used in Exhibit 19.
19 Q. Does that complete your testimony in this proceeding?
20
21
A. Yes, it does.
22
23
24
17
Rochester Gas and Electric Corporation
DIRECT TESTIMONY
of
Robert B. Lauterbach
Senior Statistician

Lauterbach
Q: Would you please state your name andaddress?':
My name is Robert B. Lauterbach and my business addressE
is 89 East Avenue, Rochester., New York.
Q: Mr. Lauterbach, will you also please state by whom you
are employed, your position'nd duties'
A: I am employed by Rochester Gas and Electric Corporation
as a Senior Statistician in the Rate and Economic
Research Department. My primary responsibilitiesinvolve the preparation of the Company's annual gas
10
12
13
14
sales and revenue forecasts and the continual review ofour gas supplier's rates, charges, tariffs and forecastsas each affects the Company. I have also undertaken
special studies regarding gas supply and have prepared
periodic statistical reports for management.
Q: Please describe briefly your education and business
16
17
18
19
20
21
22
experience.
A: I am a graduate of the Rochester Institute of Technology
with a B.S. degree in Accounting. I was employed by the
Company in June, l967, as a co-op student working in the
Customer Accounting Department. Upon graduation, Iassumed full time responsibilities in the Rate and
~
'conomicResearch Department.
23
24
Q: 'Would you please describe the purpose of your testimony
in this proceeding'?

~ r
I
I
M
Lauterbach
A: I have prepared the Gas Sales and Revenue Forecast for
1978, l979, 1980 and the rate year ending April 30,
1980. The purpose of my testimony is to explain this
forecast.
Q: Could you explain for us the general purpose of such a
for ecast?
A: The forecast is designed to determine the volume of
10
11
12
13
14
15
16
17
18
19
20
21
22
23
24
sales, expressed in Mcf for the year in which rates are
being set. From the volume of sales, the current tariffrate is applied Co derive forecasted revenue, assuming
no increase in rates.
Q: Would you briefly describe for us the format which you
have developed for this forecast'
A: Yes, Che forecast is divided by classes into monthly
bills, Ccf per bill, and Mcf sales for the calendar
years 1978, 1979 and l980. The forecast spans 16 months
prior to Che commencement of the rate year and continues
some eight, months after its conclusion. However, forpurposes of consistency, and Co establish a demonstrable
link between the historical and forecast period, I feltit was best to give a complete calendar year picture.In addition, the use of the calendar year l978 willpermit us to compare actual data as and when it becomes
available.
2
L'auterbach
Q: Would you briefly describe these exhibits'?
A: Yes. Exhibit 21 is a summary of actual 1977 and fore-
casted 1978, 1979 and 1980 customers, sales in MMcf, and
revenues for SC-1 by month. Xt also shows annual
9
10
12
13
14
figures for SC-2 and Code 15„sales. Exhibits 22, 23 and
24 are detailed monthly forecasts for SC-1 by class of
service for 1978, 1979 and 1980,"'respectively. Ex-
hibit 25 is a Summary of Non-Residential applications
for new or additional load between November 1, 1977, and
April 20, 1978.
Q: Before we discuss the specifics of your forecast, could
you explain to us the general methodology of the fore-cast?
A: Pirst, the number of monthly bills (or customers), foreach customer class was forecast. The number of bills
16
17
18
19
20
21
22
23
24
for each class was further broken down into subclasses,
t hat is, existing customers, new customers, conversions
and customer losses to reflect changes over the forecast
period. The monthly consumption per bill for each sub-
class was also forecast. By multiplying the estimated
number of bills by the consumption per bill I determined
the sales 'for each class.
Q:. Would you describe how you determine the number ofbills'
3

'I ' W ~ + 1
W
~ t
I
M
i
I
Lauterbach
A: If you look at page 2 of Exhibit 22 you will find the
components to which I previously referred, shown in the
left-hand column.
10
11
12
13
14
16
17
18
19
20
21
22
23
24
Lines 1560 through 1700 show the breakdown of the
residential class. Lines 1560 and 1640 show the number
of existing customers as of December 31, 1977. Lines
1590 and 1670 show the number of customers lost through
attrition, that is demolitions, fires, and so forth.Since we were not permitted to attach new customers
during 1976 and 1977 through November, it was possible
to determine the actual number of losses experienced inthat period. By comparing the number of bills for com-
parable months in 1976 and 1977 I was able to determine
the annual number of'osses. which, for forecasting futureperiods, I spread ratably over„ the year. Conversions,
,lines 1600 and 1680, represent the "residential regular"customers who have converted from an alternate heating
fuel to gas heating. The number of conversions was
based on estimates supplied by our Residential Marketing
Department. Conversions also were spread ratably over
the 12 months. Finally, line 1650 reflects the number
of new homes.
Q: . Mould you tell us how you determine the number of new
homes which you have pro)ected in the forecast.

l~
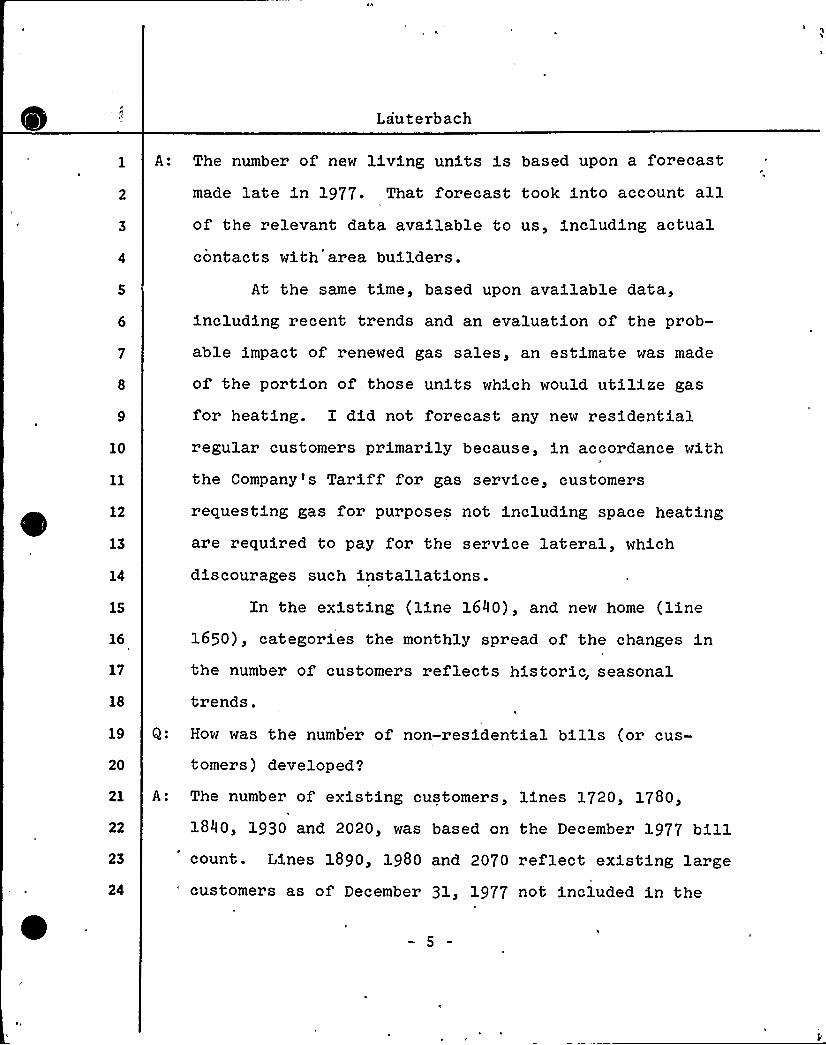
Lauterbach
A: The number of new living units is based upon a forecast
made late in l977. That forecast took into account allof the relevant data available to us, including actual
10
contacts with area builders.
At the same time, based upon available data,
including recent trends and an evaluation of the prob-
able impact of renewed gas sales, an estimate was made
of the portion of. those units which would utilize gas
for heating. I did not forecast any new residentialregular customers primarily because, in accordance with
12
13
15
16
17
18
19
20
21
22
23
24
Qo
A:
the Company's Tariff for gas service, customers
requesting gas for purposes not including space heating
are required to pay for the service lateral, which
discourages such installations.Xn the existing (line 1640), and new home (line
1650), categories the monthly spread of the changes inthe number of customers reflects historic, seasonal
trends.
How was the number of non-residential bills (or cus-
tomers) developed?
The number of existing customers, lines 1720, 1780,
l840, l930 and 2020, was based on the December 1977 billcount. Lines 1890, 1980 and 2070 reflect existing large
'ustomers as of December 31, 1977 not included in the
5
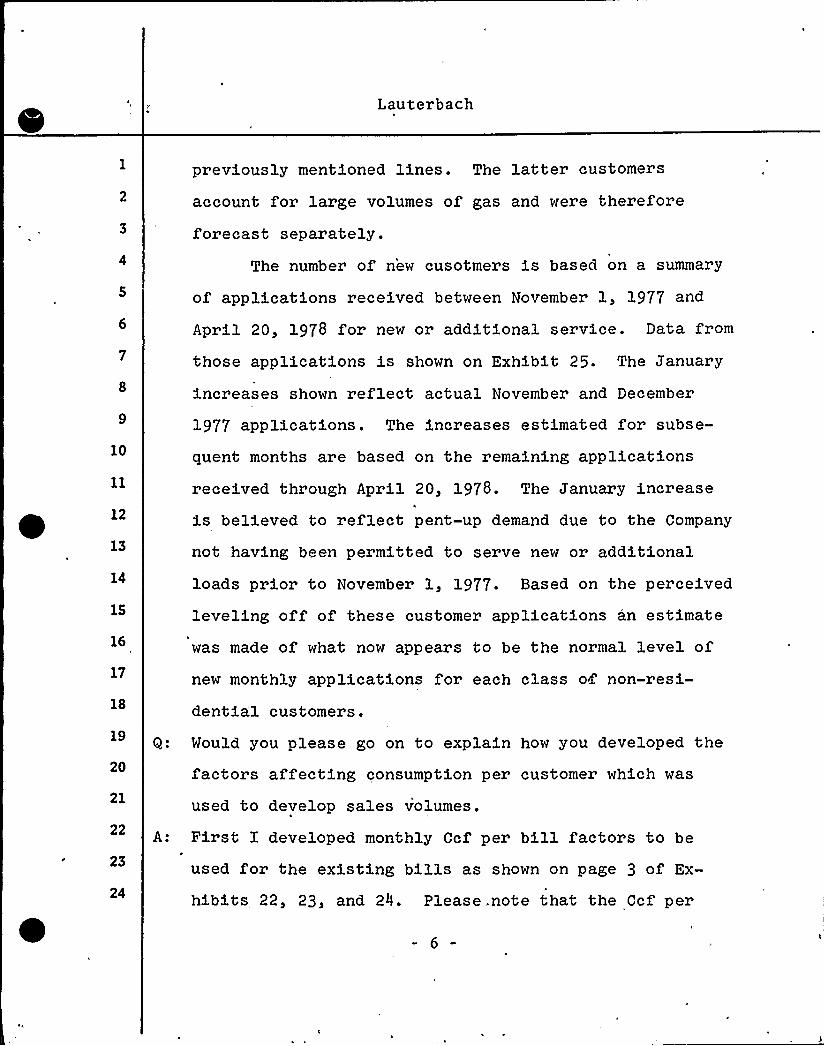
Lauterbach
previously mentioned lines. The latter customers
account for large volumes of gas and were therefore
forecast separately.
The number of new cusotmers is based on a summary
of applications received between November 1, 1977 and
April 20, 1978 for new or additional service. Data from
those applications is shown on Exhibit 25. The January
increases shown reflect actual November and December
10
12
13
14
16
17
18
1977 applications. The increases estimated for subse-
quent months are based on the remaining applications
received through April 20, 1978. The January increase
is believed to reflect pent-up demand due to the Company
not having been permitted to serve new or additional
loads prior to November 1, 1977. Based on the perceived
leveling off of these customer applications an estimate
was made of what now appears to be the normal level of
new monthly applications for each class oi non-resi-
dential customers.
20
21
22
23
24
Q: Would you please go on to explain how you developed the
factors affecting consumption per customer which was
used to develop sales volumes.
A: First I developed monthly Ccf per bill factors to be
used for the existing bills as shown on page 3 of Ex-
hibits 22, 23, and 24. Please. note that the Ccf per
6

Pl
1
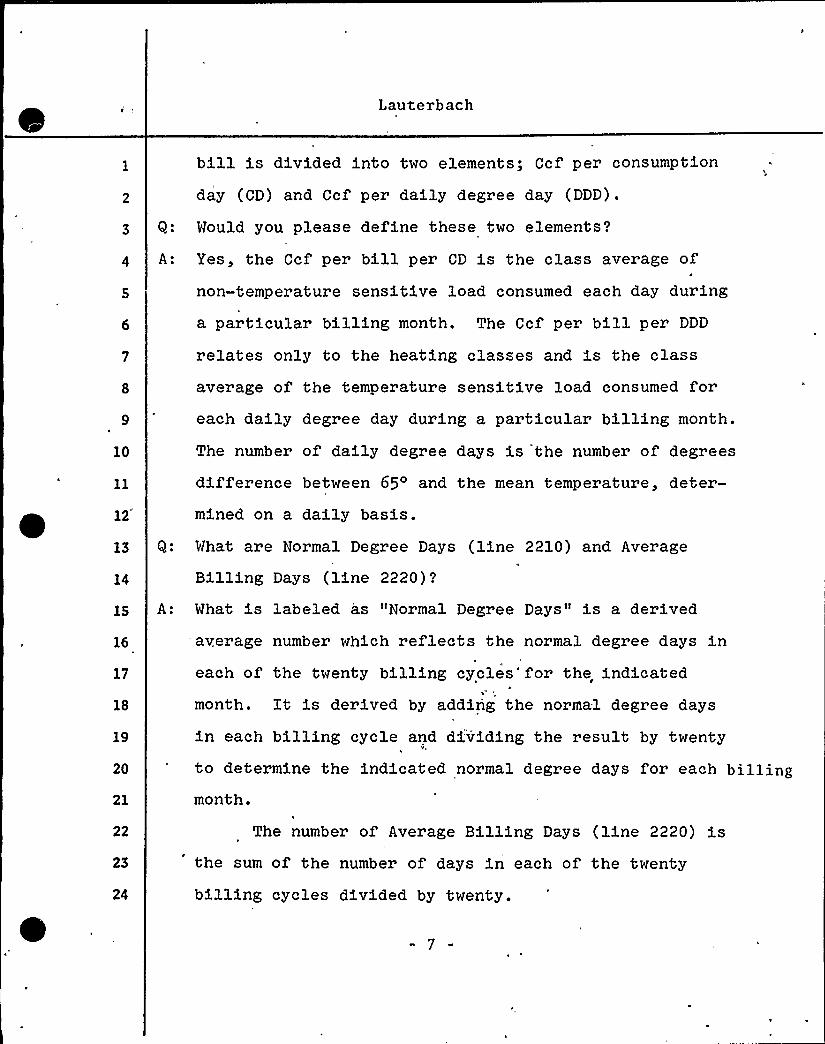
Lauterbach
10
12
13
14
15
16
17
18
bill is divided into two elements; Ccf per consumption
day (CD) and Ccf per daily degree day (DDD).
Q: Would you please define these two elements?
A: Yes, the Ccf per bill per CD is the class average of
non-temperature sensitive load consumed each day during
a particular billing month. The Ccf per bill per DDD
relates only to the heating classes and is the class
average of the temperature sensitive load consumed foreach daily degree day during a particular billing month.
The number of daily degree days is the number of degrees
difference between 65 and the mean temperature, deter-
mined on a daily basis.
Q: What are Normal Degree Days (line 2210) and Average
Billing Days (line 2220)'?
A: What is labeled as "Normal Degree Days" is a derived
average number which reflects the normal degree days ineach of the twenty billing cycles'for .the indicated
month. It is derived by adding the normal degree days
19
20
21
in each billing cycle and dividing the result by twenty
to determine the indicated normal degree days for each billingmonth.
22
23
24
The number of Average Billing Days (line 2220) isthe sum of the number of days in each of the twenty
billing cycles divided by twenty.
7

f ~0
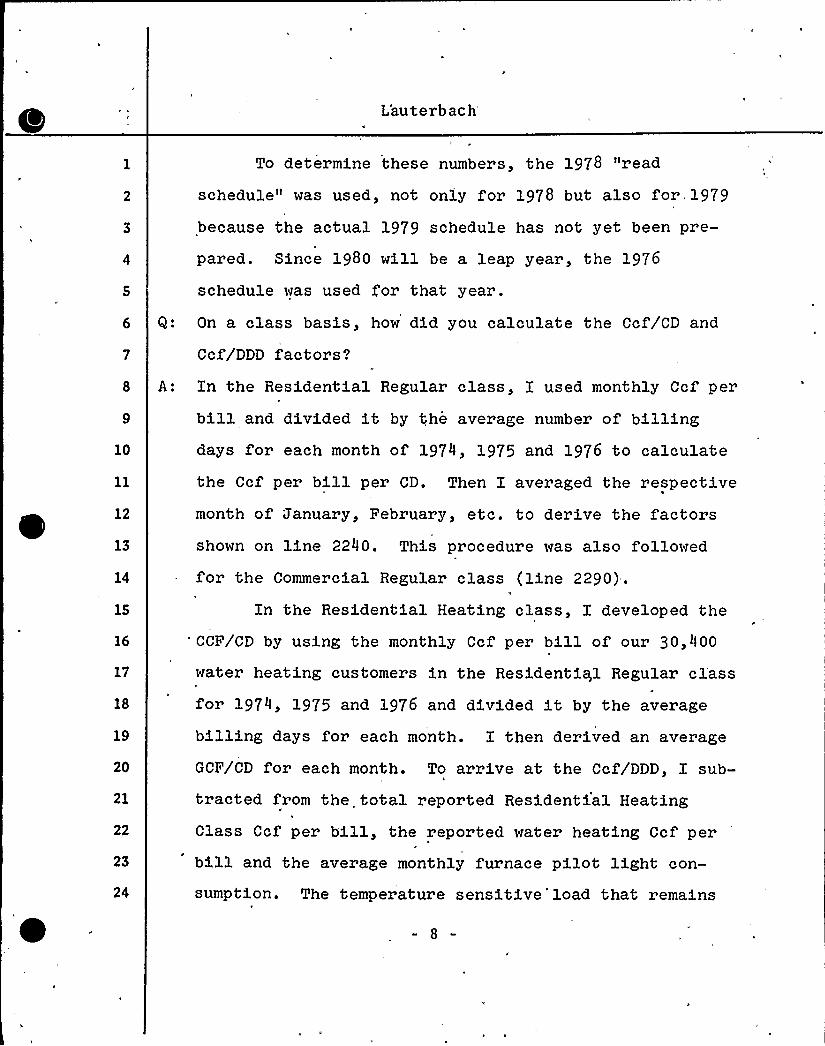
L'auterbach
To determine these numbers, the 1978 "read
schedule" was used, not only for 1978 but also for,1979
because the actual 1979 schedule has not yet been pre-
pared. Since 1980 will be a leap year, the 1976
schedule was used for that year.
6 Q: On a class basis, how did you calculate the Ccf/CD and
Ccf/DDD factors'
A: In the Residential Regular class, I used monthly Ccf per
bill and divided it by the average number of billing10
12
13
15
16
17
18
19
20
21
days for each month of 1974, 1975 and 1976 to calculate
the Ccf per bill per CD. Then I averaged the respective
month of January, February, etc. to derive the factorsshown on line 2240. This procedure was also followed
for the Commercial Regular class (line 2290).
In the Residential Heating class, I developed the
*CCF/CD by using the monthly Ccf per bill of our 30,400
water heating customers in the Residential Regular class
for 1974, 1975 and 1976 and divided it by the average
billing days for each month. I then derived an average
GCF/CD for each month. To arrive at the Ccf/DDD, I sub-
tracted from the total reported Residential Heating
22
23
24
Class Ccf per bill, the reported water heating Ccf per
bill and the average monthly furnace pilot light con-
sumption. The temperature sensitive'load that remains
8

.4
l
Lauterbach
6
is divided by the actual number of billing Degree Days
for each month to arrive at monthly Ccf/DDD. Line 2270
was arrived at by averaging the respective months of the
three years.
For the Commercial Heating class, the Ccf/CD (line
2310), was calculated by taking an average of the lowest
month's Ccf/CD in each of the historical years and
12
13
14
15
16
17
18
19
20
21
22
23
24
profiling it back over the other months based on the
Ccf/CD in the Commercial Regular class. These factors
were multiplied by the number of billing days to develop
the Ccf/bill to be subtracted from the total reported
Commercial Heating Ccf/bill. The remaining load was
then divided by the Actual Monthly Degree Days to get
temperature sensitive Ccf/DDD. An average o f the
respective months in the three years is found on line'320.
The industrial Regular Class was divided into two
parts, the largest 14 accounts (about 80$ of the class
sales) and the remaining accounts. For each part, the
monthly 1974, 1975 and 1976 Ccf/bill was divided by the
average billing days in each month and an average was
determined for the respective months to determine the
Ccf/CD (Lines 2360,and 2350 respectively).The Industrial Heating class was also divided, into

~ ~ rr-
1
IH
Lauterbach
10
12
13
14
16
17
18
19
20
21
22
24
Cwo parts, the largest 6 customers (about 555 of Che
Class sales) and the remaining accounts. For each part,Che Ccf/CD was calculated by Caking an average of Che
lowest month's Cci/bill and dividing by Che number of
billing days for 1974 through 1976. Since I do not have
any base for determining a monthly profile of this use,
in contrast to Che Residential and Commercial classes,
which have homogeneous base usage, I left this factorconstant throughout Che year (lines 2380 and 2400). The
Ccf/DDD (lines 2390 and 2410) was Chen calculated using
Che same methodology as in the Commercial Heating class.
The municipal class was also broken down into two
part s. The total class less one large account was cal-culated using Che same method as in the Industrial Heat-
ing class (lines 2430 and 2440). The one large account
'is essentially a base load account, also using gas forspace conditioning in Che summer months and was forecast
separately (line 2450).
Q: Nr. Lauterbach, please explain how you arrived at Che
normalized Ccf/bill used in Che forecast for Che exist-ing classes of customers'?
A: To obtain Che existing classes'onthly Ccf/bill based
on the normal degree days and average billing days, Iutilized the following
computations.'0

h
Lauterb'ach
l. Non-heating classes: Ccf/bill/CD xaverage billing days
2. Heating Classes: (Ccf/bill/CD x averagebilling days) + (Ccf/bill/DDD x normalbilling degree days). Xn the residentialheating class, the monthly pilot lightCcf was also added.
10
The products of these calculat;ions are shown on lines2890, 2960,
2500, 2580, 2720, 2780, 2840,/ 2910,/2980 and 3030 ofI'age
4 of Exhibits 22, 23, and 24'.
Q: Mould you please explain how you developed the Ccf/billfactors for conservation, customer losses, conversions
and new customers'?
12
13
14
15
16
17
A: Let's turn first to conservation due to energy efficientwater heaters in the residential classes, (lines 2515
and 2600). Xn recent years, water heaters which are
more energy-efficient have become available. AfterJuly 1, 1978,- only the more efficient units may be sold
in this State. The new efficient unit uses approxi-
mately 18$ (or 5.25 Ccf/mo.) less gas than a non-con-
19
20
21
22
23
24
servation model according to the estimates made by the
RGRE's Energy Utilization Department. The average lifeof a water heater is approximately 10 years or 120
months. Therefore, if all customers had a new efficientwater heater, the class average, would drop 5.25 Ccf per
month by the middle of 1987. To achieve that figure in1987, the incremental monthly savin~ for each month for
11

t
Lauterbach
the class would be .04375 Ccf per month (5.25 Ccf + 120
months), per bill after July 1, 1978. The Residential
Regular class (line 2515), shows only 75$ of this effectbased on the level of gas water heater saturation within
. the class. In Che Residential Heating class, all cus-
10
12
13
14
15
16
17
18
19
20
21
22
23
24
tomers are assumed Co have gas water heaters, so Che
full effect of the new efficient water heaters is used
(line 2600).
The Ccf/bill used for customer losses and for con-
versions in the Residential Regular class is derived by
taking the existing Ccf/bill less the impact of thiswater heater conservation.
In Che Residential Heating class, in addition t;o
the conservation due Co new water heaters, I also esti-mated the conservation due to factors which I have not
been able Co quantify but which I believe to be ofincreasing significance in this area. First, there isthe effect of reduced thermostat settings. This has
most likely accounted for significant portions of past
conservation. I believe Chat more of our customers willreduce Chermostats as conservat;ion cont'inues Co become a
topic of increasing importance. Second, I note thatChere are increasing uses of alternate fuels.„, The use
of wood burning stoves in our service territory is
12

~ 'g'I t
14
k
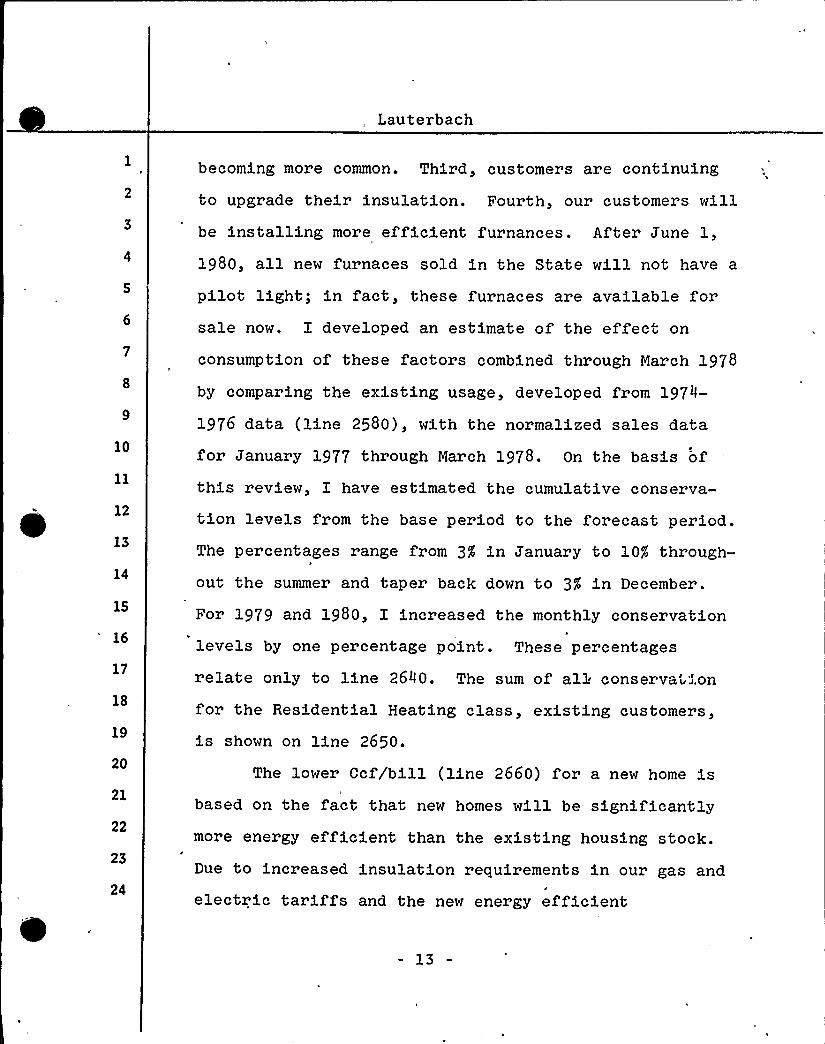
Lauterbach
10
12
13
14
16
17
18
19
20
21
22
23
24
becoming more common. Third, customers are continuing
Co upgrade their insulation. Fourth, our customers willbe installing more efficient furnances. After June 1,
1980, all new furnaces sold in the State will not have a
pilot light; in fact, these furnaces are available forsale now. I developed an estimate of the effect on
consumption of these factors combined through March 1978
by comparing the existing usage, developed from 1974-
1976 data (line 2580), with Che normalized sales data
for January 1977 through March 1978. On Che basis ofthis review, I have estimated Che cumulative conserva-
tion levels from the base period to the forecast period.The percentages range from 3$ in January to 105 through-
out the summer and Caper back down Co 3g in December.
For 1979 and 1980, I increased the monthly conservation
levels by one percentage point. These percentages
relate only Co line 2640. The sum of all conserva'vion
for Che Residential Heating class, existing customers,
is shown on line 2650.
The lower Ccf/bill (line 2660) for a new home isbased on the fact that new homes will be significantlymore energy efficient Chan the existing housing stock.Due Co increased insulation requirements in our gas and
electric tariffs and Che new energy efficient
13

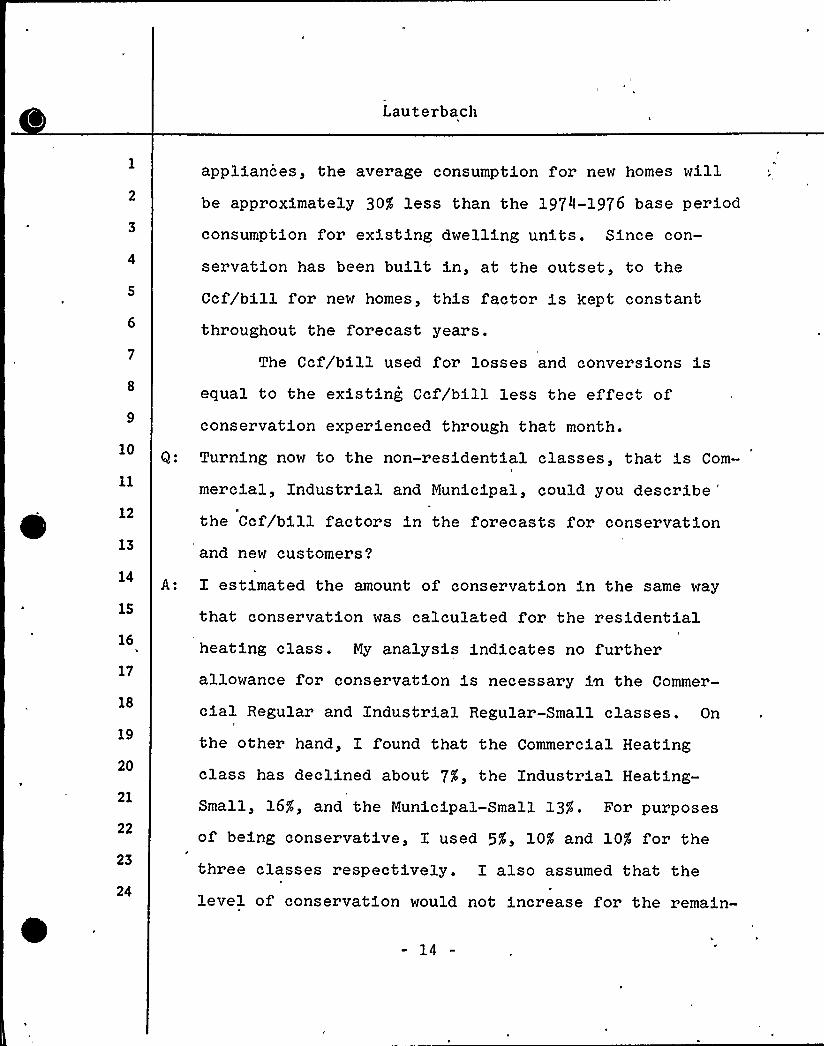
Lauterbach
appliances, the average consumption for new homes willbe approximately 301. less than the 1974-1976 base period
consumption for existing dwelling units. Since con-
servation has been built in, at the outset, to the
10
Ccf/bill for new homes, this factor is kept constant
throughout the forecast years.
The Ccf/bill used for losses and conversions isequal to the existing Cci/bill less the effect ofconservation experienced through that month.
Q: Turning now to the non-residential classes, that is Com-
12
13
14
16
17
18
19
20
21
22
23
24
mereial, Industrial and Municipal, could you describe'heCcf/bill factors in the forecasts for conservation
and new customers'?
A: I estimated the amount of conservation in the same way
that conservation was calculated for the residentialheating class. My analysis indicates no furtherallowance for conservation is necessary in the Commer-
cial Regular and Industrial Regular-Small classes. On
the other hand, I found that the Commercial Heating
class has declined about 7g, the Industrial Heating-
Small, 16$ , and the Municipal-Small 13$ . For purposes
of being conservative, I used 5g, 10$ and 10$ for the
three classes respectively. I also assumed that the
level of conservation would not increase for the remain-
14

0
'IC
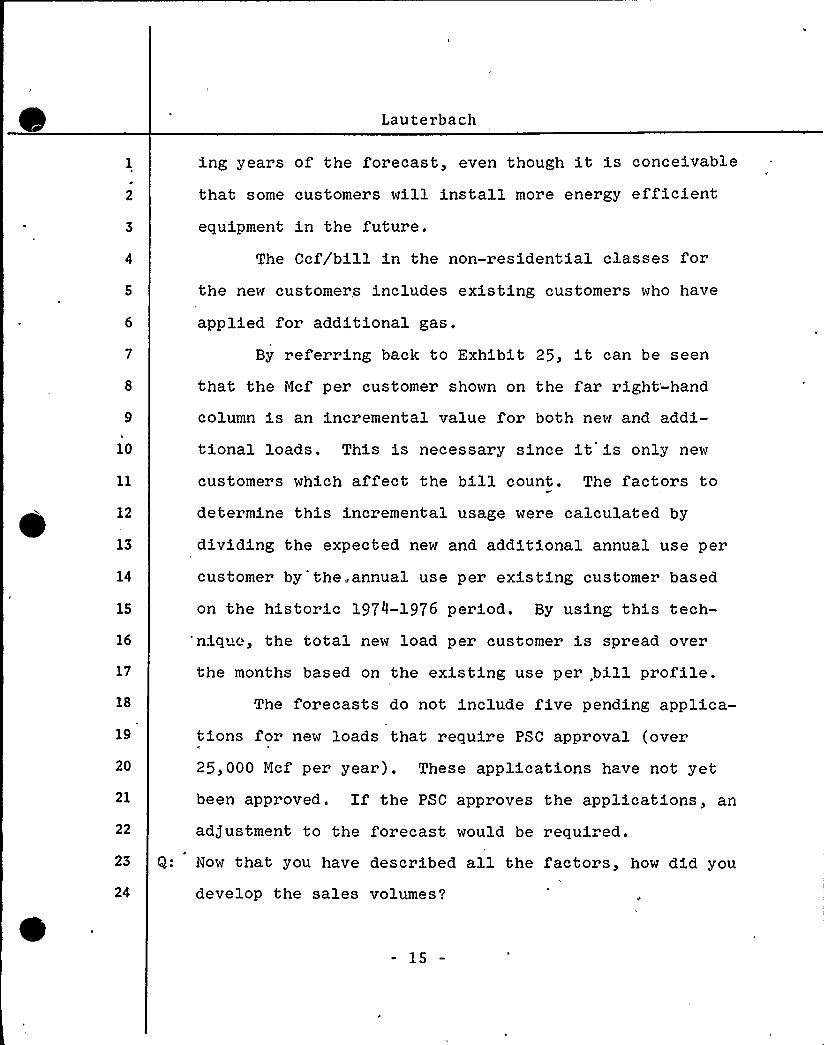
Lauterbach
10
12
13
14
16
17
18
19
20
21
22
ing years of the forecast, even though it is conceivable
that some customers will install more energy efficientequipment in the future.
The Ccf/bill in the non-residential classes forthe new customers includes existing customers who have
applied for additional gas.
By referring back to Exhibit 25, it can be seen
that the Mcf per customer shown on the far right'-hand
column is an incremental value for both new and addi-
tional loads. This is necessary since it is only new
customers which affect the bill count. The factors to
determine this incremental usage were calculated by
dividing the expected new and. additional annual use per
customer by the. annual use per existing customer based
on the historic 1974-1976 period. By using this tech-
'nique, the total new load per customer is spread over
the months based on the existing use per,bill profile.The forecasts do not include five pending applica-
tionss
for new loads that require PSC approval (over
25,000 Mcf per year). These applications have not yet
been approved. If the PSC approves the applications, an
ad/ustment to the forecast would be required.23 Q: Now that you have described all the factors, how did you
24 develop the sales volumes'
15

0
I
b
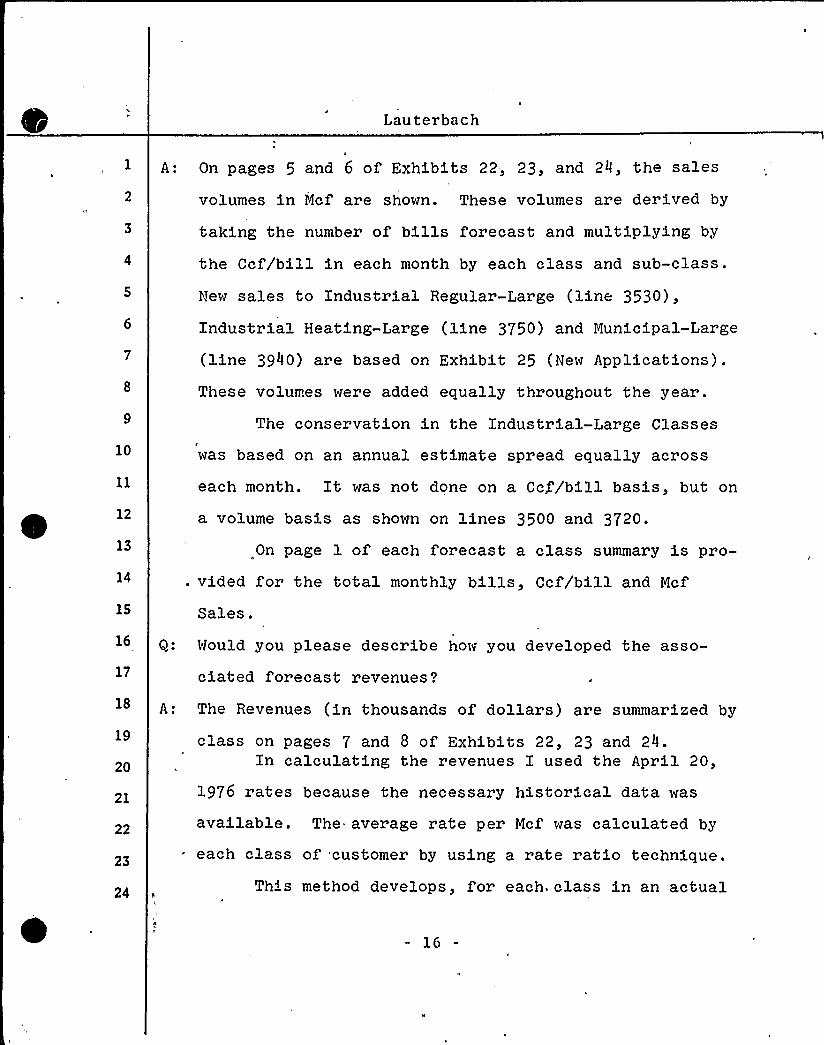
Lauterbach
A: On pages 5 and 6 of Exhibits 22, 23, and 24, the sales
volumes in Mcf are shown. These volumes are derived by
taking the number of bills forecast and multiplying by
the Ccf/bill in each month by each class and sub-class.
New sales to Industrial Regular-Large (line 3530),
Industrial Heating-Large (line 3750) and Municipal-Large
(line 3940) are based on Exhibit 25 (New Applications).These volumes were added equally throughout the year.
10
12
13
14
15
16
17
The conservation in the Industrial-Large Classes
was based on an annual estimate spread equally across
each month. It was not done on a Ccf/bill basis, but on
a volume basis as shown on lines 3500 and 3720.
On page l of each forecast a class summary is pro-
. vided for the total monthly bills, Ccf/bill and Mcf
Sales.
Q: Would you please describe how you developed theasso-'iated
forecast revenues'?
19
20
21
22
23
24
A: The Revenues (in thousands of dollars) are summarised by
class on pages 7 and 8 of Exhibits 22, 23 and 24.In calculating the revenues I used the April 20,
1976 rates because the necessary historical data was
available. The average rate per Mcf was calculated by
each class of customer by using a rate ratio technique.
This method develops, for each. class in an actual
16
Lauterbach
period, the ratio of actual average base rate revenue
per unit of sales experienced to Che theoretical base
10
12
13
14
16
17
18
19
20
21
22
23
24
rate average revenue per unit of sale.: which would have
been obtained from an average use customer by applying
such average usage to Che actual base rate schedule.
Using Che twe"ve months ended August 3l, l977 for each
month the actual average revenue per unit of sales was
derived by dividing the total class base rate revenue inthat month by Che total class sales in Che same month.
Using Che same period, again month-by-month, the
theoretical average base rate revenue per unit of sales
was calculated by applying the average use per customer
in Che month for the class to the April 20, 1976 base
rate schedule Co derive the theoretical revenue per
average customer; Chat; theoretical base rate revenue was
then divided by the same average use per customer toarrive at Che theoretical average base rate revenue per
unit of sales for Che month. For the same month, the
ratio of Che actual unit revenue to the theoretical unitrevenue is then developed.
Xn Che forecast month Che average use per customer
is known. This average use is applied Co Che same
April 20, 1976 base rate schedule to arrive at
theoretical base rate revenues from an average customer
17

t
Lauterbach
in the class; this theoretical revenue is Chen divided
by Che same average use to arrive at the theoretical
average base rate revenue per unit; of sales for the
class in Chat month. The rate ratio for t;hat month, pre-
10
12
13
14
15
16
17
18
19
20
21
22
23
24
viously derived as already explained, is then applied to thistheoretical unit revenue to calculate what can be expected to
be Che act;ual unit base:rate revenue in the forecast month.
Of course, Che total class base rate revenue is then easilyderived by multiplying theexpected actual unit revenue forChe month by the total class sales for Che same month.
The results of these calculat;ed Base Rate Revenues
are shown on pages 7 and 8 of Exhibits 22, 23 and 24.
The rate increases were then added to the Base
Rate Revenue Co adjust Che rate levels Co the Febru-
ary 2, 1978 rates (exclusive of rolled-in gas costs).This was done partially on a per bill basis (due Co the
minimum charge increase), and Che remainder on a per Ccf
basis (due t;o Che unit increase in the balance of Che
raCes). Also, I added five cents per Ccf for the roll-in of purchased gas consts that occurred in the Novem-
ber ll, 1978 rate increase. The subtotal is base ratedollars based on the February 2, 1978 rates.
The Gas Cost Ad)ustment revenue is based on the
pro forma average cost of gas as of January 2, 1978.
18

"0
Lauterbach
Consistent with Exhibits 9 and ll, it is kept at a con-
stant unit rate throughout the three years.
Revenue tax (4.17$ ) was then added based on the
year-end 1977 Average Revenue tax percentage. The sum
of these revenues is the total forecasted revenue RAKE
would expect to receive from Service Classification No.
1 in the forecast period, at February 1978 base rates
and January 1978 GCA.
10
Q: Mr. Laterbach, please explain how you forecasted S.C.
No. 2 sales'
12
13
14
16
17
18
19
A: S.C. No. 2 is a gas lighting service limited Co existinglocations and exi.sting units in service as of April 28,
1972. Since this service classification is very small
with annual sales of approximately 2,000 Mcf and annual
revenues of approximately 46,000, the forecast was done
on an annual basis. Although Chere is some attrition inthis class, because of Che minor impact, I based the
forecast on the Pro Forma 1977 sales volumes and the
rates in effect on February 2, 1978, and held them con-
20
21
22
23
24
Q ~
A:
stant throughout the three forecast years. This isreflected on Exhibit 21.
On Exhibit 21, I also notice Code 15 Sales. Mould you
please explain this item'?
Code 15 Sales are sales to 4 customers from whom the
19

W
II
P
Lauterbach
Company leases gas wells on a contract basis. lincluded them so the total customer count would balance
to other reported data. The annual Mcf sales are less
Chan 1,000 Mcf and Che annual revenues are less Chan
41,000.
Q: Finally, would you explain the item miscellaneous
revenues, shown on Exhibit 21'?
8 A: Miscellaneous revenues are revenues derived from for;
10
12
13
14
feited discounts and rents. When miscellaneous revenues
are added Co the revenues from S.C. No. l, S.C. No. 2,
and Code l5 sales, Che total revenue. for Che rate year
ending April 30, 1980, is derived on Che basis of pre-
sent: rates. This revenue figure corresponds Co the
figure used by Mr. Henderson in Exhibit 11.
17
Q: Does this conclude your testimony'?
A: Yes, it does.
18
19
20
21
22
23
24
20

1 ~
l'
DIRECT TESTIMONY
of
WAYNE D. MONTEAU
for
ROCHESTER GAS AND ELECTRIC CORPORATION

HAYKI': D. MONTE'AU
Q. Please state your name and address.
A. Hy name is Mayne D. Monteau. I live in Oceanport, New Jersey.
By whom are you employed and in what capacity?
A. I am an Assistant Vice President for Stone & Webster Management
Consultants, Inc., 90 Broad Street, New York, New York.
Please explain briefly the nature of the financial and advisory services
provided by Stone & Mebster Management Consultants, Inc.
8
10
A. Stone & Webster performs a wide array of services for corporate clients.
These services include rate analysis and design; financial planning;
consultation on management policies; computer-feasibility, systems design,
and installation studies; acquisitions and mergers; economic feasibility
studies; market studies; organization studies; executive training;
13
16
17
18
20
22
23
personnel policies; labor relations', insurance and pension plans; public
relations; tax services; and many more.
Our Accounting and Financial Division assists its clients in the
formation of long-range financial planning, in merger and acquisition
studies, in economic feasibility studies, in analysis of decision
alternatives, in valuation studies, in the development of earnings, cash
and financing estimates, and the performance of cost of capital and ob-
Jective function studies.
The preparation of studies of this nature requires the compilation of
vast amounts of statistical data for both the company being analyzed and
for other companies in that industry. Recently, we have formalized this
procedure by incorporating much of this data in a comprehensive Utility
Monteau

0
HONTEAU
Financial Data Base. This data, together with our general Eamili arity
with the securities and money markets, and our long business experience,
form the basis for all of the'financial and advisory services performed
by Stone & Webster Management Consultants, Inc.
Q. Would you outline your educational background'?
A. I have a BS degree in Accounting (magna curn laude) from Pennsylvania
10
12
State University. I have done graduate work toward a master's degree in
business administration at the Graduate School of Business Administration
at Pennsylvania State University. In addition, I have taken Liberal
Arts courses at Colgate University and Mathematics at Utica College of
Syracuse University. Furthermore, while a graduate student I was an
instructor in an undergraduate course in Managerial Accounting and was
13 a research assistant in Public Utility Accounting.
15
What has been your business experience?
A. A significant part of my work is and has been in the development and
16 preparation of studies relating to cost of capital and rate of return for
17 presentation before various utility regulatory bodies. In my capacity
18
19
20
21
as a senior financial and accounting consultant, I have worked on a num-
ber of special assignments for both utility and nonutility client com-
panies which are located throughout the United States, in Canada, and
Mexico. I have developed several dynamic mathematical models for use
22 in the study of debt management and rate regulation of public utilities.23
24
I have spoken before the'Institute of Electrical and Electronic Engineers
on the combined subjects of Debt Management and Federal Price Regulation.

k 1+
kl
1
HONTEAU 3
Over the past several years, I developed the Stone & Webster ULility
Financial Data Base computer program which is designed to maintain
a 20-year history of detailed financial information for all utilitycompanies on which there is public information available. Finally, Iam the instructor at the Stone 6 Webster Management Training Course in
the cost of capital and fair rate of return for public utilities.Have you testified as, an expert witness prior to this case?
A. Yes. I have presented testimony on the subject of cost of capital and
10
12
13
14
15
rate of return before utility regulatory agencies in the states of
Alabama, Connecticut, Massachusetts, Michigan, Hississippi, Montana,P
New Hampshire, New Mexico, New York, South Dakota, and Texas as well
as the U. S. Federal Power Commission, and in Canada before the public
utility boards of Alberta, Manitoba, Ontario, and Quebec as well as the
Canadian National Energy Board.
Have you made a study to determine the fair rate of return for Rochester
Gas and Electric Corporation (Rochester) ?
17
18
A. Yes, I.have made such an analysis.
What investigations have you made in formulating your opinion as to
19 fair rate of return?
20 A. I have reviewed the financial statements of the Company for the years
21
22
ended December 31, 1966 through 1977. Furthermore, I examined other
financial data as far back as the early 1950's.
23 In addition to my analysis of Rochester, I reviewed the available
24 financial and operating information of a number of utility and nonutility
HONTEAU
companies in the United States and reviewed the money markets generally.
Before discussion of your study in detail, will you outline your general
approach to the problem?
A. One of the basic questions to be resolved in this hearing is the fair
return for Rochester. This is the number of dollars remaining after
expenses and taxes, which are required to enable the company to
service its debt obligations, to operate successfully to maintain its
financial integrity, to attract capital, and to compensate its investors
10
for the risks assumed. This is as stated by the United States Supreme
Court in Federal Power Commission vs. Ho e Natural Gas Com an , 320 U.S.
12
591 (1944). Furthermore, the Court went on to say that from the investor
or company point of view, it is important that there be enough revenue
13 not only for operating expenses but also for the capital costs of the
14
15
business. These include service on the debt and dividends on the stock.
By that standard the return to the equity owner should be, commensurate
16
17
18
19
with returns on investments in other enterprises having corresponding
risks.
The Supreme Court had earlier stated in Bluefield Water Works 6 Im rove-I'3
ment Co. vs. West Vir inia Public Service Commission 262 U.S. 679, (1923)
20
21
the proposition that "A public utility is entitled to such rates as willpermit it to earn a return on the value of the property which it employs
22
23
for the convenience of the public equal to that'enerally being made at
the same time and in the same general part of the country on investments
24 in other business undertakings which are attended by corresponding risks

I lOiXTEAU
and uncertainties; but it has.no constitutional right. Lo pri>lit.; such
as are realized or anticipated in highly profitable enterprises or
speculative ventures. "
It is upon these principles that I have based my studies of the cost of
capital of Rochester. From these studies I have derived a recommended
fair rate of return which will, in my opinion, provide the Company with
earnings comparable to alternative investment opportunities of corre-
sponding risks, allow the Company to attract capital in the future on
reasonable terms, and maintain its financial integrity.
10 In attempting to measure the fair rate of return, I directed my attention
to the right-hand side of the balance sheet; that is, to the capital
12 supplied by the investors in the Company. After determining what the
13
14
Company needs to pay each class of investor, it becomes a direct math-
ematical calculation to establish the overall return requirements on total
15
16
17
18
19
20
21
22
capital supplied, and thus, the recommended fair rate of return to be
applied to rate base. Finally, as the costs attached to the senior
securities of a company are fairly well set by the cost historically
contracted for and paid by the Company, the problem of fair rate of
return becomes largely a problem of determining a fair residual return1
to the Company's common equity investors. Therefore, I approached this
problem from the point of view of the capital employed by the Company.
I have measured the cost of each element of capital and then combined
23
24
the elements to derive an overall cost of capital to the enterprise..I
Q. I show you an Exhibit marked for identification which consists of
HONTEAU
24 schedules, the title page of which reads "Study on Cost ol. Capital
and Fair Rate of Return." Were these schedules prepared by you or
under your direction7
4 A. Yes, they were. I might add that in making my analysis I studied many
10
facts and figures. I have included only those which I considered parti-
cularly significant in illustrating the basis for my conclusions. The
first three schedules cover the Preliminary Study of the Company;4
Schedules 4 through 12, the Comparable Earnings Study; Schedules 13
through 19, the Discounted Cash Flow Study; Schedules 20 through 22, the
Market Appraisal Study; Schedules 23 and -24, the Cost of Capital Summary.
12
13
14
15
16
17
18
19
20
21
22
23
24

0
kfONTEAU
Please comment on the Preliminary Study of Rochester which covers
Schedules 1 through 3.
A. A summary balance sheet at each year ended December 31, 1967 through
1977 for Rochester is shown on Schedule 1. From 1967 to 1973, gross
10
12
13
utility plant grew by 52% (a compound annual growth rate of 7.2%).
In recent years,. however, gross utility plant growth has accelerated.
Over the 4 years since 1973, gross utility plant has grown by 48% (a
compound annual growth rate of 10.3%).
The source of the funds which financed the. existing plant is the
capitalization of the Company and is shown beginning on line 12. The
total permanent capital consists of long-term debt, preferred and
preference stock, and common stock equity. In addition, the Company
has had short-term debt outstanding at the end of all but one year
14 during the studied period. During the 1967 to 1977 period, total
16
permanent and short-term capital (line 22) grew 118%, an annual com-
pound rate of 8.1%. Since 1973, however, this'annual growth rate has
17
18
increased to 10.3%. In contrast, common stock equity has grown 139%I
since 1967 year-end, an overall compound growth rate of 9.1% through
19
20
21
22
23
1977 year-end. During the 1973 to 1977 period, common stock equity
has grown at an annual compound growth rate of 9.0%. Thus, common
equity growth has continued at a rate near its historical pattern
while senior capital, i.e., long-term debt and preferred stock capital,
has accelerated since the end of 1973. This explains the slight decline
in common equity participation since 1973, as indicated by the common
HONTEAU
equity ratios (line 31). Over the entire period, nvnulhulc: , t.llu
Company has significantly and prudently increased its common equity
participation in total capital.
Q. Would you describe the permanent financing accomplished by Rochester
Gas and Electric during the 1968 to 1977 period?
A. Yes. During the ten years the Company issued approximately $ 374,211,000
of additional permanent capital as follows: Hortgage Bonds,
$ 220,000,000; Preferred Stock, $ 45,000,000; Preference Stock,
$ 28,000,000; and Common Stock, $ 81,211,000., During 1977, $ 25,000,000
10 of 11.0% Series 0 Preferred Stock was refunded with the proceeds of
12
the $ 28,000,000, 7.6% Series A Preference Stock issue. Of the
$ 81,211,000 of Common Stock sold, $ 70,195,000 was sold to the public
13 or existing shareholders through rights offerings, $1,609,000 was
14 sold to employees and $ 9,407,000 resulted from the Automatic Dividend
Reinvestment Program.
Each issue of bonds and preferred stock that was offered was offered at
17 a coupon or stated rate which exceeded the Company's embedded cost.
18
19
20
21
22
Thus, each issue throughout the period raised Rochester's embedded
cost of senior capital.
'oreover, as older low coupon bonds continue to mature and new higher
rate issues continue to be required the embedded costs will likewise
continue to rise. This is not unusual in our present economy. As long
23 as the investor continues to demand higher rates on senior capital than
24 the average historical rates paid by utility companies their embedded
MOVE TEAU
costs will continue to rise.
In addition, in continuation of their dividend policy which began in
1960, Rochester Gas and Electric paid 3% stock dividends in each
year of the studied period. This resulted in the capitalization as
common stock of an additional $ 53,068,000 of earnings during the 1968 to
1977 period. Since its inception the stock dividend policy has
provided $ 83,037,000 of additional common stock. In fact, because of
10
12
13
14
it, from 1960 until 1972, the Company was able to maintain appropriate
levels of common equity participation without issuing common in the
market. I should note that I have studied the effects of their stock
dividend policy upon the Company's shareholders in the past. I willdiscuss the conclusions of my most recent study at a later point in
this testimony.
Will you please continue with your description of Schedule 1?
15
16
17
18
'021
A. Yes. Returning to Schedule 1, on lines 25-32, I show the relationship
of each element of permanent capital to the total permanent capital.
As a group, these relationships are generally referred to as
Capitalization Ratios. I have excluded notes payable from totalcapital in making this analysis because notes represent interim
financing which, in the normal course, is funded into each form of
permanent capital: debt, preferred and common equity. hs can be
22 observed on line 31, the common stock equity ratio of Rochester has
23 ranged from an inadequate low of 31.32% at December 31, 1970 to a
24 high point of 39.80% at December 31, 1973 'and averaged 35.90% for the
eleven eriods shown. Since December 1973, the

i~fOiVTEAU10
Company has increased its common equity investment by $ 82,601,000
or 41% while it has increased its senior capital participation by
7
$151,667,000 or 50%. While Rochester's common equity is near the
40% level I recommend and much improved over the 1967-1971 level,
the Company still faces a construction program estimated to exceed
$430 million through 1980. The Company plans to issue additional
common stock offerings during 1978 and beyond as reflected on
Schedule 24, where I determined the capitalization for the rate
period adopted by the Company is this proceeding. In order to do so,
it is essential that the Company establish a solid record of improved
and adequate earnings, restore its bond rating to a strong A, if not an
12
13
14
AA, gradually increase its cash dividend and increase the market-to-book
ratio of its common stock to the point where common stock can be safely
issued without dilution of either earnings or equity, before the
Company returns to the market.
16 Q. Will you describe the data shown on Schedule 27
17
18
19
, A. Yes. On Schedule 2, I show a summary income statement and certain other
financial data. Total operating revenues (line 1) increased from
$ 115 million in 1967 to more than $ 331 million for the year ended
20 December 31, 1977, or by 188%. Total operating expenses (line 7)
21
22
23
however, similarly have increased: from $ 94 million in 1967 to
$ 286 million for the year ended December 31, 1977, a 205% increase.
Total interest charges (line 16) have increased 262% through year-end
1977 from $ 6.7 million in 1967 to $ 24.4 million in 1977. Horeover,
HOilTEAU
preferred stock dividends increased from $ 2,050,000 in 1967 to
$ 6,512,000 in 1977, a 218% increase.
Q. Please describe the data shown below the income statement on Schedule 2?
A. Earnings per share (line 22) for Rochester have varied between $ 1.64
in 1974 and $ 2.29 in 1976 and declined to $ 2.06 in 1977. The cash
dividend payout ratio (line 24) represents clear evidence of the changesA
in the financial conditions of Rochester. Only in four years, all ~
10
12
13
14
of declining earnings, has the payout ratio exceeded 55% of common
earnings —well below the industry average. In 1977, the 60.3% payout
was the second highest of any year studied. This obviously reflects
the conservatism inherent in the same management policy which generated,
~ internally, sufficient common equity in'vestment through retention of
earnings and stock dividends through 1971. Faced with the largest
construction program in its history, the Company for the first time =
15
'16
since 1959 issued common stock in 1972 and on several occasions since.3
Obviously, the construction requirements of Rochester are such that
it's inadequate retained earnings and the stock dividend cannot provide
18
19
20
21
all the common equity investment needed to support it. Horeover, Irecognize the emphasis placed by investors on current cash yields and
the necessity of utilities to increase cash dividends in response to
these demands.
22
23
The rate of return earned on average common equity has been wholly
inadequate since 1969 and in 1977 was only 9.97%. The return on total24 capital also, fell to 7.9% during 1977 from 8.2% in 1976, the Company's

HONTEAU 12
highest during the studied period. Both returns, however, were well
below the rates of return allowed by the Commission.
The interest and fixed charge coverage ratios shown on lines 28 and
29 declined continuously through 1971, improved during 1973 and 1976
but in 1977 again fell close to the 1971 levels. Since 1970 the return
10
12.
13
14
on common equity has ranged within the narrow range of 11.16% to 9.82%
except for 1974 when it fell to 8.31%. 'Thus, the maintenance of
coverage, even at their inadequate levels, has resulted from increased
common equity participation, not earnings. Note that there are onlyr
two means available to financial managers to maintain or to increase
coverage levels in times of rising senior capJtal costs. The manager
can attempt to increase earnings while holding the capital structure
constant, for it is the common equity earnings which provide the
coverage. Or, he can increase the equity participation intotal'apital,
which, over the long run (if earnings are maintained), will
16 have the same effect. In the case of Rochester, a ten percent return
18
on a common equity participation of 31% (as in 1970) would result in
drastically low coverage. If I assume the same embedded cost as
20
21
existed in 1977 and the same relative split between debt and preferred,
a 9.97% return on equity (as earned in 1977), on a common equity
participation of 31% would have provided an after-tax fixed charge
coverage of only 1.65 times. Thus, the difference between that 1.65
23 and the 1.86 times shown'on line 28 of Schedule 2 for 1977resulted'4
solely from increased common equity participation, not increased

vv
ailONTEAU
13
earnings. The difference between the l. 91 in 1970 and the l. 65
resulted from all other factors including decreased earnings.
Finally, line 35 shows a key relationship in regards to the common
stock investors'ppraisal of the Company as an investment opportunity.
As can be observed, the Harket-to-Book Ratio has declined from a high
of 1.59 times book value in 1968 to a low of 0.67 times book value in
1975. The improvement to 0.92 times in 1977 is not really comforting
when one considers that the average utility company's ratio has improved
to a value greater than 1.0 during the same period. This ratio reflects
10 currently and directly the common stock investors'valuation of the
Company as a potential investment. Since it is the investor himself who
12 sets the price in reaction to each company's earnings, the market-to-book
13
14
ratio also represents an intercompany index of the adequacy of returns
from the viewpoint of the investor.
Q. Will you continue with your preliminary study of Rochester Gas and
16 Electric2
17
18
19
20
21
A. Yes. Schedule 3 is a graphical representation of the relationship
between the returns experienced by Rochester itself and those exper-
ienced by investors in the common stock of~Rochester. Although a
common shareholder legally owns the return on common equity generated
by a company, he, in fact, does not get it. The common shareholder
22 obtains his return in the combined form of dividends paid on, and
23 market appreciation of his common shares over specific time periods.
For example, assume a common shareholder bought a share of stock for
NONTEAU 14
$ 10. 00 in 1972, received a $1. 00 cash dividend, and sold the share one
year later, in 1973, for $ 10.50. He realized a $1.50 gain on this $ 10.00
investment or an annual realized return of 15%. Assume, on the other
hand, this same investor held the share for two years, receiving the
same $ 1.00 cash dividend each year, but sold it for only $ 9.00 at the
end of the second year. He would have realized a net gain of only $ 1.00
($ 2.00 dividends 'less $1.00 loss in market price) on his $ 10.00 initial
investment. In this latter instance, his annual rate of return would
be only 4.89%. Limiting the analysis to increments of annual holding
10 periods, a similar study can be performed for all possible holding
12
13
14
15
16
17
18
periods for any number of years and any publicly traded company.
In Schedule 3, which graphically depicts such a study, the line which is
entitled "Return Realized by Common Shareholders" represents the average
annual rates of return realized by investors in Rochester's common
stock for the ten-year periods prior to each year shown. Thus, the
average return on the 55 possible investments during the ten-year
period ended 1968 was 11.2%; it was 8.7% during the ten-year period
ended 1969; and it was 2.8% during the ten-year period ended 1977.
The actual average returns realized by Rochester investors are shown
20
21
22
on Schedule 12, which I will discuss later. The important fact to con-
sider at this time, is the comparison between the three lines shown on
Schedule 3. Both the return experienced by Rochester on average common
23
24
equity and on average total capital, though totally inadequate since
1969, have remained relatively stable and even increased in several

0
—~
lf
i
HONTEAU
years. The returns actually realized by the cotmnon stuck investors,
however, during the same period have fallen below zero and remain
below what is available to them in most savings accounts. Even moree
discouraging is the fact that the average dividend yield itself in
each year since 1972 has exceeded these average returns realized by
many of Rochester's common stock investors. In other words, the
erratic and often depressed market prices over the past decade have
prevented such investors from realizing a return even equal to their
dividend yield.
10 Q. Please summarize the results of your preliminary study of Rochester.
11 A. .Hy preliminary study brought out the following points which I consider
12
13
14
16
17
18
19
20
21
22
23
24
significant in relation to rate of return:
1. That gross plant investment has grown by 125% in the 1967 to 1977
period, requiring additional capital investment at borrowing rates
substantially higher than the historical borrowing rates.
2; That gross plant investment growth has accelerated in recent years
and has been matched by accelerated growth in the capital which
supports the plant investment.
3. That common equity investment has increased as .a portion of total
capital averaging 38.8% for the most recent five years.
4. That Rochester has been forced to issue Common Stock four times
in the past six years. The last two issues were at a price below
book value.
5. That fixed charges have increased and coverage of fixed charges

P
HONTEAU
l6
decreased since the end of 1967 due both to the increased cost
of senior capital financings as well as the inadequate earnings
on Rochester's common equity base.
6. That a major reappraisal of Rochester by common stock investors has
occurred throughout the period as reflected by its Harket-to-Book
ratio. In 1977, Rochester's 'market price stood at 92% of book value—
a clearly unacceptable level.
10
7. That the average returns on book values of Rochester have remained
at inadequate levels throughout the period. An improvement exper-
ienced in l976 has not been maintained and the Company has failed
to even achieve rates of return allowed by regulation.
12 8. That certain investors in the common stock of Rochester lost money
13
14
on their investments on average during the ten years ended 1974 and
1975. That investors have not realized a total rate of return even
15
16
17
equal to the dividends received during the past six years;
What conclusion did you reach from your preliminary study?
A. I concluded that, despite almost continuous rate case activity, the
18
19
20
21
Company -is presently earning a return which is simply inadequate. The
events- of recent years have seriously undermined the Company's invest-
ment position in the eyes of both bond and common stock investors.
Further, I concluded that in the last seven years, at least, the Company
22 has not been able to earn its allowed returns, let alone reasonable
23
24
returns. I therefore proceeded with my study toward a recommendation
of a fair rate of return which would enable the Company to maintain its

V
H
1
I
t I:
4
MONTEAU 17
4
financial integrity, to attract debt capital on reasonable terms,
to obtain additional common equity capital without dilution of itsearnings or equity positions, and to properly compensate its investors
for the risks assumed.
Q. What method have you used in your study of Rochester Gas and Electric7
A. As previously mentioned, the basic problem in arriving at a fair rate
of return is that of determining a fair'residual return to the common
equity investors. To determine the fair return to the common equity
investor, I employed three basic methods in my determination of fairrate of return: the Comparative Earnings or Relative Risk Study, the
13
Market Appraisal Study, and the Discounted Cash Flow Study.f
In addition, I supplemented the Comparative Earnings Study with an
investigation of returns experienced by a group of highly rated industrial
14 companies.
15
16
Before you describe your studies, what exactly is a market-to-book ratio2
A. The market-to-book ratio is computed by dividing the average market
17
18
price per common share by the dollar common equity investment on a per
share basis. It is a key indicator of the investor's appraisal of a
19 company's past and future operating results. If the market price falls
20
21
23
below book value per share, that is, the market-to-book ratio falls
below 1.0, it is clear indication that the investor does not consider
his return to be adequate.
One important aspect of the market-to-book ratio is that it is investor
24 determined. In the open market, there is only one means available to

)
d
0
kfONTEAU
5"
an investor (in the short run) for increasing this rate of return.
He must decrease the market price of the stock. For example, the
one dollar return which yields a five percent rate of return on a
$ 20 investment, will yield a ten percent return only if the investment
(price) is reduced to $10. Thus, when the investor is unwilling to
pay, at least, the dollar investment already made in an enterprise
10
12
13
14
(the book value) he is indicating dramatically that he is not ex-
pecting the monies already invested to produce a return sufficientto attract his capital.
Q. Please explain your Comparative Earnings Study.
A. The Comparative Earnings Study looks at rate of return from the point
of vj.ew of the returns earned by investors in comparable companies.
This classic approach to rate of return is also called the Relative
Risk Study. It recognizes that risks vary between industries. in the
15 economy and between individual companies within each industry and that
16
17
18
19
20
21
22
23
24
such variations affect the rate of return required to attract capital.This approach also recognizes that all enterprises, regulated and
nonregulated, are in competition for the investor's dollar and that
investors will not continue to be attracted to an enterprise unless the
return is commensurate with thc risks involved.
If competition, higher costs, or other forces reduce return for an
industry in the nonregulated field to an inadequate or noncompensatory
level, capital will be diverted from that industry to other industries
where the return is considered compensatory. Similarly, in a regulated

J'I
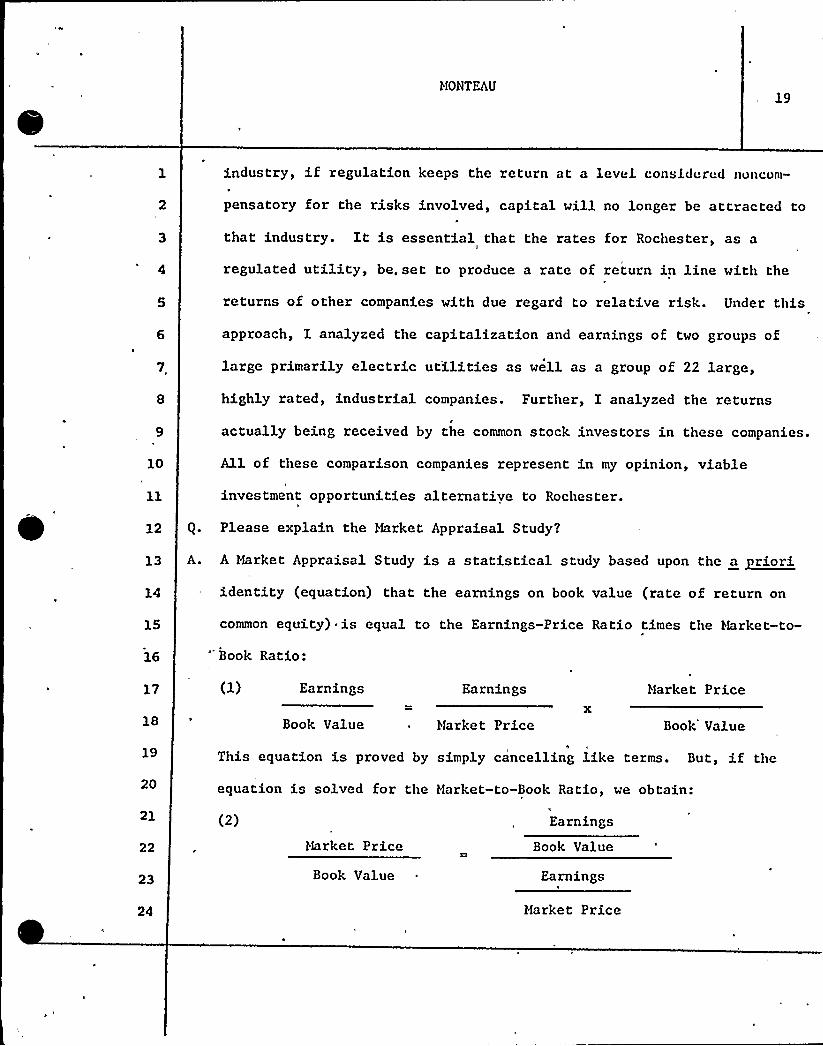
HONTEAU19
industry, if regulation keeps the return at a level consid«rud noncom-
pensatory for the risks involved, capital will no longer be attracted to
that industry. It is essential that the rates for Rochester, as a
regulated utility, be, set to produce a rate of return in line with the
returns of other companies with,due regard to relative risk. Under this
7,
approach, I analyzed the capitalization and earnings of two groups of
large primarily electric utilities as well as a group of 22 large,
highly rated, industrial companies. Further, I analyzed the returns
10
actually being received by the common stock investors in these companies.
All of these comparison companies represent in my opinion, viable
investment opportunities alternative to Rochester.
12 g. Please explain the Market Appraisal Study?
13 A. A Market Appraisal Study is a statistical study based upon the a priori14 identity (equation) that the earnings on book value (rate of return on
common equity) ~ is equal to the Earnings-Price Ratio times the Market-to-
'ook Ratio:
17 Earnings Earnings Market Price
18 Book Value Market Price Book'alue
19
20
This equation is proved by simply cancelling like terms. But, if theI
equation is solved for the Market-to-Book Ratio, we obtain:
21
22
23
Market Price
Book Value
Earnings
Book Value
Earnings
Market Price
HONTEAU
20
Thus, there is theoretically a direct mathematical relationship betweenJ
what an investor will pay for a share of common stock and what the in-
vestment earns. Furthermore, there should be an inverse (opposite
direction) relationship between the Harket-to-Book Ratio and the
Earnings-Price Ratio.
This study is characterized as statistical because a statistical study4
is required to prove or disprove the existence of this relationship and
to test its validity. This approach recognizes that the investors in
the common stock of a growing utility expect to realize a return on their
10
12
13
14
investments in the form of dividends and market appreciation. It agrees
with the concept that the price an investor pays represents the present
value of the anticipated cash flow of dividends and price appreciation at
the investor's required rate of return. Both dividends and price appre-f
ciation, however, are regarded as flowing from earnings on book value and
15
16
17
the investor's appraisal of those earnings at any given point in time is
reflected in the market price he is willing to pay.
You have characterized this study as statistical. knave you performed
18 such a s ta tis tical s tudy?
19 A. Yes. I performed a statistical study which was designed to establish
20
21
the existence of this relationship and to test its validity.
Q. Please explain tkie Discounted Cash Flow Study.
22 Ac This approach is also founded on the principle that the investors in the
23
24
common stock of a growing utility expect to realize a re'turn on their
investments in the form of cash dividends and market price appreciation.

I
'1
MONTEAU21
It is based on the concept that the price 'an investor pays at any
point in time represents the present value of the total anticipated
cash flow (stream) of dividends and price appreciation discounted at
the investor's required rate of return. Therefore, if an'ssumption
is made as to the future cash flow in dividends and price appreciation,
10
it is possible, on the basis of the market price paid, to determine
the investor's required rate of return. If it is assumed that there
will be a constant dividend growth rate and that the price-earnings
multiple remains unchanged, the return to (required by) the investor
will be represented by the sum of the current yield and the growth
12
rate. Under this approach, the current yield is usually adjusted to
reflect selling costs and pressure involved in the marketing of common
13 stock. The growth rate of dividends per share assumed is often (based)
on the actual growth rate realized by the company in the past over
15 an extended period of years. While it is the growth rate in dividends
p'er share that is required in the formula, the growth rate to be applied
17
18
19
20
21
may be based on past earnings per share as representing the source
of dividends, or on past book value per share as representing the
source of earnings. In my study, I determined the growth rates for
Rochester and for each of the comparison utilities in earnings per share,
dividends per share, and book value per share for several periods
22 during the twelve-year period from 1966,to 1977. Since there is no
23 guarantee that historical growth trends will continue, or the historical
growth trends necessarily reflect future expectation, I checked and

III
r,
~ l
I
II
HOiXTEAU 22
~ adjusted each rate for each company by examining a number ot'actors
which impact upon growth trends such as construction programs, both
past and future, and financings planned and accomplished.
n
10
12
13
14
17
18
19
20
21
23
24

MONTEAU23
Q. For comparison purposes, have you selected a group of utility companies
which represent alternative investment opportunities of corresponding
risks'
A., Yes, Rochester Gas and Electric is a combination (primarily electric)
utility company operating in the city of Rochester and eight western
10
12
13
14
15
16
counties of New York State with annual revenues in 1977 of $ 304.7
million. It is a publicly owned company with its common stock listed
on the New York Stock Exchange. My selection of 15 comparison companies
is shown on Schedule 4. It includes companies with annual operating
revenues in excess of $ 100 million that I consider comparable in
risk to Rochester Gas and Electric Corporation. I generally refer
to the New York State Companies as a group as the "New York State
Companies" and the five most similar as to growth in revenues, as to
common equity component of return and as to growth rate in earnings
per share as the .".Rochester Type Companies." I refer to the entire
group combined as the "Comparison Companies."
17 Q. Have you included in your Exhibit a study of the capital structure of
18 the comparison utility companies?
19
20
A. Yes. Schedule 4 shows the capitalization ratios of the group of
comparison companies and Rochester Gas and Electric for the 1967-
21 1977 period.
22
23
24
Q ~
A.
In calculating the ratios shown on Schedule 4 did you include bank .
loans as part of —,the total capital?
No, bank loans are not included in developing the capitalization ratios
HONTEAU24
since they represent interim financing and are typically converted
into all three classes of permanent capital (debt, preferred stock and
common equity) over a period of time.
Q. Please discuss the capitalization ratios shown on the Schedule.
A. As shown on the schedule the comparison group companies as a whole
have followed moderately conservative financing policies throughout the
1967-1977 period, with the Rochester - Type companies being the most
10
12
13
'415
16
and the New York companies the least conservative, in the sense of the
companies with a higher equity ratio being the more conservative.
Yet all, have shown significant changes. For the eleven-year period,
the group of fifteen utilities averaged 53.2% long-term debt, 12.9%
preferred stock equity, and 33.9% common stock equity. For the same
period, the group of Rochester — Type utilities averaged 52.7% debt,
12.0% preferred and 35.3% common equity. Thus, the latter group used
slightly less preferred and debt, and therefore on average was more
conservative in its capital structure. The New York companies averaged
17
18
19
20
21
22
24
53.4% debt, 13.4% preferred, and 33.2% common equity. This latter
structure verges on the unacceptable in today's money market. Two
significant trends, however, did appear. All three groups have in-
creased the preferred equity components of total capital over the
eleven years.'his stems from the utilities'nability during the
period to maintain adequate interest coverage levels in the face of
tremendous increases in embedded debt costs. As preferred dividends
are included in total income but not counted as interest, the issuing

HONTEAV 25
of preferred stock permits a level of senior capl tal lever»;;u»ut.
otherwise attainable under the existing constraints on earnings.
More important, comparing the first three years with the last three
years, the group of fifteen utilities on average maintained its common
equity ratio. Conversely, the group of Rochester — Type companies
reduced those ratios from an average of 36.7% for the first three
years to an average of 35.1% during the last three. The New York
companies, on the other hand, increased from 32.5% during 1967-1969
to 34.6% during 1975-1977. During the period in question, utility10 companies were required to raise staggering amounts of new capital
from investors demanding even higher returns to offset the effects
12 of inflation. Unable to get from their regulatory commissions the
13
15
rate increases required to produce the earnings demanded by common
equity investors, many utility companies chose to decrease their
common equity capitalizations and, it follows, to increase their
leverage. In making that choice, these utilities accepted a higher
financial risk in order to continue construction programs to meet
the needs of their service territories.19 Q. How do the capitalization ratios which you have just given compare
20 with those of Rochester?
A. As can be seen on Page' of Schedule 4, the long-term debt ratios of
22
23
Rochester have been consistently below each group of comparison
utilities and have averaged 50.2% during the eleven years shown.
24 On the other hand, the Company has historically utilized more preferred

i~lONTEAU26
stock financing than have the comparison companies but not inuiil,h lor
its senior capital ratio (debt plus preferred) to have averaged aboveP
the comparison companies. For the entire period, the senior capital
ratio for Rochester averaged 64.1%. Conversely, the eleven-year
average common equity ratio for Rochester at 35.9% has been above
the average for the three groups of comparison utilities. The thinnest
common equS.ty rat'io for Rochester occurred in 1970 and the thickest
in 1973. During the final six years of the study, Rochester has
10
averaged 38.3% common equity, significantly higher than the average
of all three comparison groups. As previously noted, at December 31,
1977, the Company's common equity ratio was 38.36%. In my opinion,
13
this broadening of the Company's common equity participation has made
an important contribution to its financial integrity as well as
14 .forming the base upon which to maintain its investors'onfidence
15 during the immediate future.
16 What did you conclude from this phase of the comparative earnS.ngs
17 study?
18
19
20
A. I concluded that the capitalization ratios of the comparison companies
are appropriate to use as a guide in measuring the cost of common
equity capital'or Rochester if due regard is given to Rochester's
21 thicker common equity participation. This means that throughout the
23
remainder of my study due allowance was made for the relative value of
the thicker common equS.ty base of Rochester Gas and Electric.
Will you continue with the Comparative Earnings Study?
NONTEAU 27
A. Yes. On Schedule 5, I show, the returns earned on av«rage \'olllmon
3
4
10
equity for the comparison utility companies and for Rochester. Observe
on line 16'hat, on average, the returns for comparison utilities
have ranged between a high of 13.3% in 1967 and a low of 10.6% in 1974
and have averaged 11.9% for the 1967 to 1977 period. For the Rochester—
Type utilities again the high (12.3%) occurred in 1967 but the low
(9.1%) occurred in 1975. Foi the 1967 — 1977 period, the Rochester—
Type companies averaged 11.2%, somewhat lower than the total group.
For the New York companies the high (12.7%) occurred in 1967 and the
low (10.1%) in 1974. For the entire period the New York companies
averaged 11.4%. In all cases, the returns have declined generally
12 throughout the period.
13
14
Q. How do these returns compare with those ofRochester'.
The return earned on average common equity by Rochester is shown on
15
16
17
18
19
20
21
line 19. During the 1967 to 1977 period, Rochester earned an average
return on its common equity of 10.7%. This is lower than all three
groups of comparison utilities. Rochester ranked well below the
overall average 'for the comparison utilities throughout the study.
In seven years, the Company's returns have been below all three
comparison groups. For the year ended December 1977, Rochester fell,for the fourth time, below 10% return on book value.
22 Have you examined the common dividend payout ratios of the comparison
23 utilities and of Rochest'er Gas and Electric?
24 A. Yes. The dividend payout ratios are shown on Schedule 6. The fifteen
t fONTEAU 28
utilities have paid out in cash dividends an overall average of 70,9%
of their Balance Available for Common Stock over the eleven year
period; the Rochester — Type companies, 68.6%; and the New York
companies, 72.0%. Two groups have exceeded their average during the
most recent five years; 73.7% for the comparison companies as a
whole and 75.4% for the Rochester — Type companies. The New York
companies have been able to reduce their payout ratios to an average
of 68.5% for the most recent 3 years. Rochester, on the other hand,
10
averaged a payout of 53.7% during the eleven years. Although this
has increased to an average of 56.9% since 1973,'t remains well
12
13
below the averages for the comparison companies. I should caution
that high payout ratios are not indicative of financial health and
low ratios are not indicative of financial illness. Often, as in this
'4 case, high payouts result from low earnings, as companies attempt to
16
17
18
19
20
21
22
23
maintain dollar dividend levels in the face of declining earnings.
Investors look past the dividend to the Company and the earnings
which support it in making their decisions. For this very reason,
there exists no statistical relationship between market-to-book
ratios and dividend payout ratios.
Q. Can you explain why Rochester Gas and Electric's payout ratio is so
low in comparison to the other utilities and how this has affected
~ their shareholders'P
A. Yes. In the case of Rochester Gas and Electric, the low payout is the
result of the same management policy which has issued 2% or 3% stock

rh
j,
. 0
HONTEAU
dividends every year since 1960. Stone & Webster was asked in L913
and again in 1976 by Rochester Gas and Electric to make a study of this
dividend policy and to give our conclusion as to whether or not the policy1
has benefited its stockholders. I performed these studies for Stone &
Webster, concluding that the dividend policy adopted by Rochester Gas &
Electric has contributed to a more stable market price with less extreme
7 fluctuati'ons in the price/earnings multiple. In my opinion, therefore,
the policy has been a sound one under conditions that prevailed during
'10
12
13
most of the studied period. The low cash dividend payout ratios and can-
comitant low dividend yields fo Rochester have been more than offset by
higher than average market appreciation of its common stock. This extra
growth potential of the Company's common stock must be and is recognized
in the Discounted Cash Flow Study which I will discuss later.
14 Q. Have you studied the investor's general market appraisal of the utilities
16 A.
selected for study?
Yes, I examined the relative standing of the companies as shown by their
17 market-to-book ratios (Schedule 7).
Q. Would you please discuss the data shown on Schedule 7?
19 A. Yes. Harket-to-Book ratios deteriorated seriously throughout the 1967
20 to 1975 period, on the average, for each comparison company, and for
21 Rochester'. In 1976 and 1977 this trend has moderated but the market prices
22
23
for the majority of the companies, including Rochester Gas and Electric,
still remain below book value. This market price deterioration represents
24
25
26
a long-term reappraisal of utility stocks by investors. There are many
reasons for this reappraisal. Included among them are: rampant inflation
caused in part by a restricted money supply coupled

HONTE 30
with an unprecedented demand for funds, a recession, a sky-rocketing
increase in the cost of money, the failure of utilities to earn an
adequate rate of return; and the energy crisis, in general, and the
gas and oil supply situation, in particular.
Q. How does the market-to-book ratio for Rochester compare with the ratios
of the comparison companies?
A. The market-to-book ratio for Rochester is and has been at or signi-
ficantly below the average for all three groups of comparison companies
in almost every year studied. In 1977, the Company's market-to-book
10
12
ratio was 0.92 which was equal to the average experienced by the
Rochester — Type utility group, and below the averages for both the
overall group and the New York State group.
13
14
15
Q. Has this market reappraisal of utility common stocks had any
upon the returns realized by investors in utility companies,
and in Rochester in particular?
ef feet
in general,
16
17
18
A. Yes. This is shown numerically on Schedule 8. The averages for the
overall group are compared graphically to Rochester on Schedule 12.
The average returns realized for by all utility common stock investors
19 have declined generally throughout the studied period. Again, by realized~
20
21
23
24
return, I mean yield plus appreciation or total return. The price
improvements in 1976 and 1977 for utility stocks in general have
resulted in improved returns being realized by the average investor
in the market but these 'returns remain dismally inadequate. It is
demonstrated graphically on Schedule 13 that the average returns realized

C
\
I IONTEAV
by utility common stock investors until 1966 on average equalled
or exceeded the return experienced by utility companies on'verage/
common equity. Nore recently, the average returns actually realized
by common shareholders have fallen to such an extent that, on average,
investors in 12 of th» 15 comparison companies shown on Schedule 8,
actually lost money for the period 1965 to 1975. In fact, not a single/
average common stock investor has earned even 5.0% on his investment
in any of the, companies since the ten-year period ended 1972. Observe
on Schedule 8 that the Rochester investor has received higher returns
10
12
than the average of the fifteen utilities in each year studied. Only
the five Rochester — Type companies have on average equalled or/
exceeded Rochester investor's realized returns, and that occurred
= 13
14
in only five of the eleven periods studied. Since 1974, the realized
returns for Rochester have exceeded by wide margins all groups of
comparison companies. Again, this has occurred despite the lower earn-
16 ings, the lower cash payouts and the lower market to book ratios of
17 Rochester Gas and Electric.
18
19
20
21'2
23
24
Since common stock investors in the past have rightfully demanded and
received realized returns equivalent to the percent earned on book value
of common equity by utilities, there is certainly no reason to think
that their expectations, which ultimately represent the cost of common
stock equity to the utility, have diminished in today's money market.
The decade of general decline in utility market prices reflected re-
evaluations by investors to bring the prices in line with the returns

'h
Vil
I
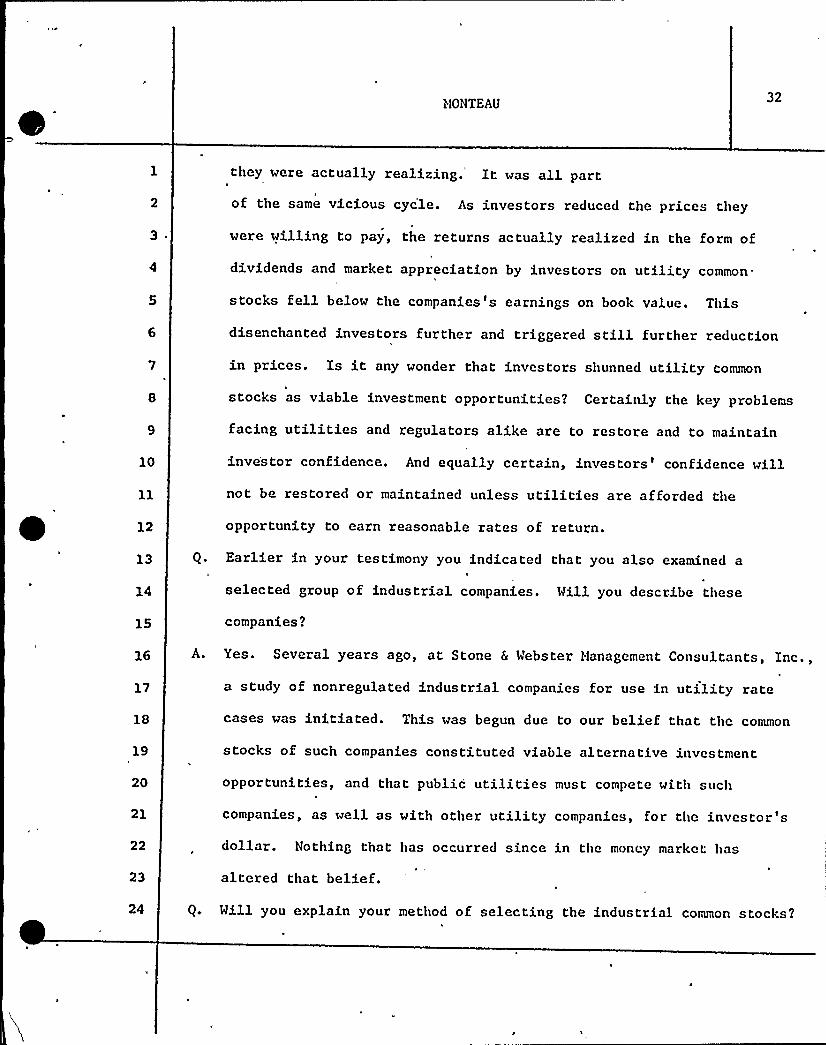
NONTEAU 32
they were actually realizing. It was all part
of the same vicious cyc'le. As investors reduced the prices they
10
12
were willing to pay, the returns actually realized in the form of
dividends and market appreciation by investors on utility common.
stocks fell below the companies's earnings on book value. This
disenchanted investors further and triggered still further reduction
in prices. Is it any wonder that investors shunned utility common
stocks as viable investment opportunities? Certainly the key problems
facing utilities and regulators alike are to restore and to maintain
inve'stor confidence. And equally certain, investors'onfidence willnot be restored or maintained unless utilities are afforded the
opportunity to earn reasonable rates of return.
13
14
Earlier in your testimony you indicated that you also examined a
selected group of industrial companies. Will you describe these
15 companies?
16
17
18
19
20
21
22
23
A. Yes. Several years ago, at Stone & Webster Hanagement Consultants, Inc.,
a study of nonregulated industrial companies for use in utility rate
cases was initiated. This was begun due to our belief that the common
stocks of such companies constituted viable alternative investment
opportunities, and that public utilities must compete with such
companies, as well as with other utility companies, for the investor's
dollar. Nothing that has occurred since in the money market has
altered that belief.
24 Q. Will you explain your method of selecting the industrial common stocks?

.0
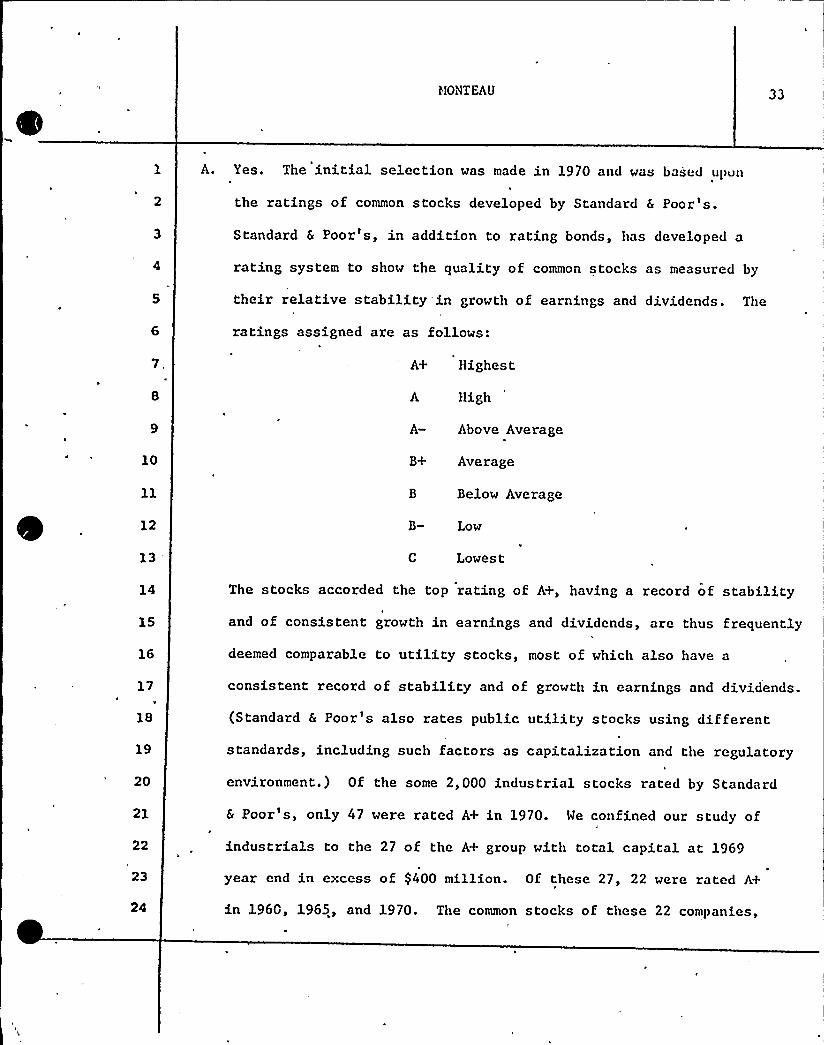
HOiNTEAU 33
A. Yes. The initial selection was made in 1970 and was based Upon
the ratings of common stocks developed by Standard & Poor's.
Standard & Poor's, in addition to rating bonds, has developed a
rating system to show the quality of common stocks as measured by
their relative stability'in growth of earnings and dividends. The
ratings assigned are as follows:
7,
10
12
A+ Highest
A High
A- Above Average
B+ Average
B Below Average
B- Low
13' Lowest
14
15
The stocks accorded the top rating of A+, having a record of stabilityi
and of consistent growth in earnings and dividends, are thus frequently
deemed comparable to utility stocks, most of which also have a
17
18
19
consistent record of stability and of growth in earnings and dividends.
(Standard & Poor's also rates public utility stocks using different
standards, including such factors as capitalization and the regulatory
20 environment.) Of the some 2,000 industrial stocks rated by Standard
21
22
& Poor's, only 47 were rated A+ in 1970. We confined our study of
industrials to the 27 of the A+ group with total capital at 1969
23 year end in excess of $ 400 million. Of these 27, 22 were rated A+
in 1960, 1965, and 1970. The common stocks of these 22 companies,

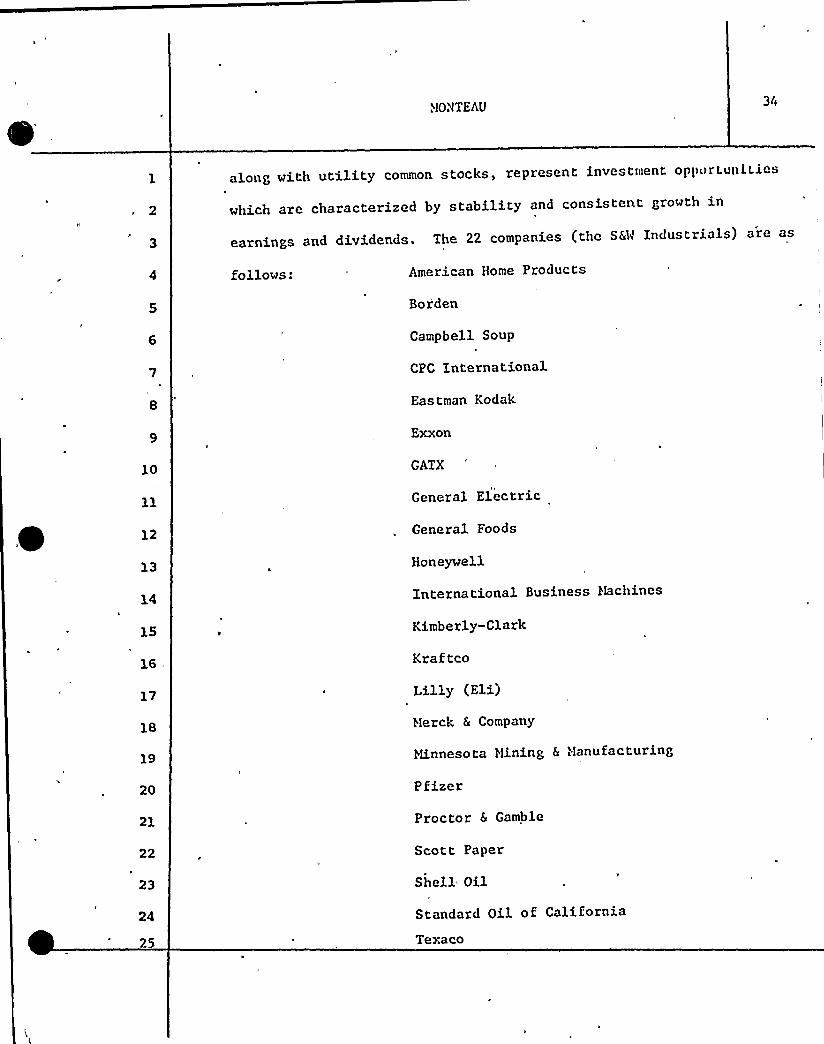
ifONTEAU
2
3
along with utility common stocks, represent investment opportunities
which are characterized by stability and consistent growth in
earnings and dividends. The 22 companies (the S&!4 Industrials) a'e as
follows: American Home Products
Borden
8
Campbell Soup
CPC International
Eastman Kodak
Exxon
10 GATX
12
13
14
15
16
18
19
20
21
General Electric
General Foods
Honeywell
International Business 1hchines
Kimberly-Clark
Kraftco
Lilly (Eli)
tterck & Company
M.nnesota Hining & ".1anufacturing
Pfizer
Proctor & Gamble
Scott Paper
23 Shell Oil
25
Standard Oil of California
Texaco

II
I
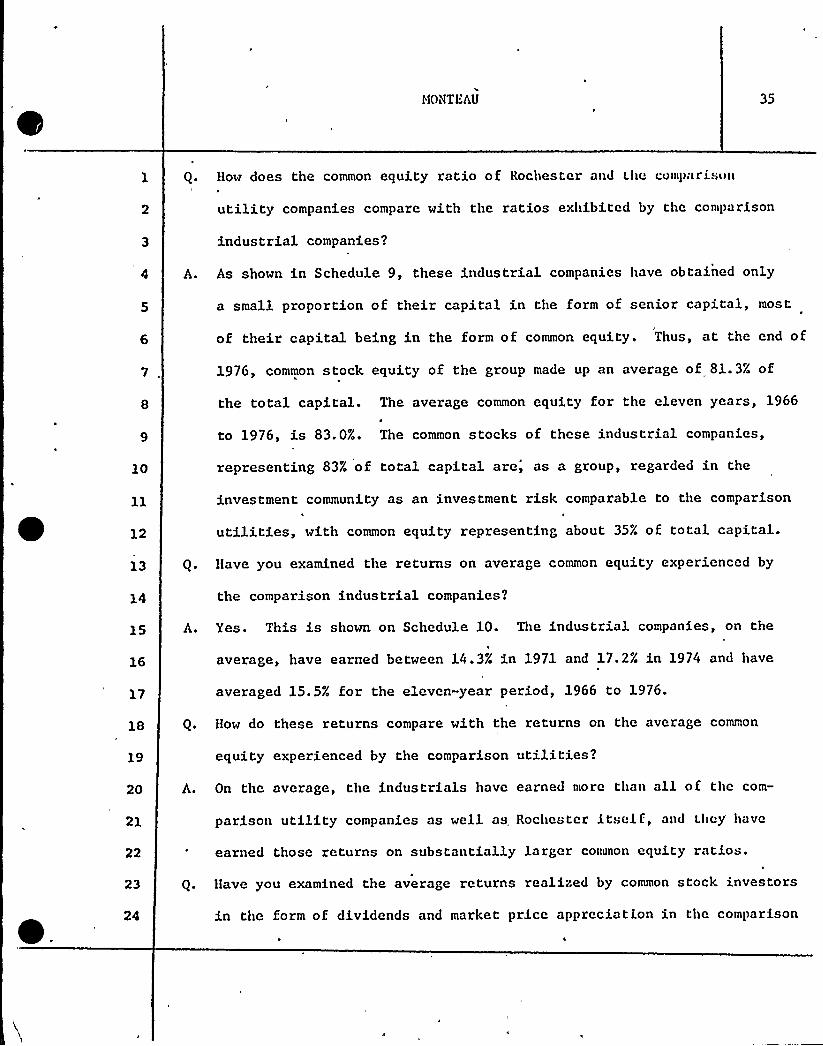
HOilTEAU
How does the common equity ratio of Rochester and the cunq>ari son
utility companies compare with the ratios exhibited by the comparison
industrial companies?
A. As shown in Schedule 9, these industrial companies have obtained only
a small proportion of their capital in the form of senior capital, most
of their capital being in the form of common equity. Thus, at the end of
1976, common stock equity of the group made up an average of 81.3/ of
the total capital. The average common equity for the eleven years, 1966
to 1976, is 83.0%. The common stocks of these industrial companies,
10 representing 83% of total capital are,'s a group, regarded in the
12
investment community as an investment risk comparable to the comparison
utilities, with common equity representing about 35% of total capital.
13 Have you examined the returns on average common equity experienced by
14 the comparison industrial companies?
16
A. Yes. This is shown on Schedule 10. The industrial companies, on the
average, have earned between 14.3% in 1971 and 17.2% in 1974 and have
17 averaged 15.5% for the eleven-year period, 1966 to 1976.
18 How do these returns compare with the returns on the average common
19 equity experienced by the comparison utilities?
20
21
22
23
24
A. On the average, the industrials have earned more than all of the com-
parison utility companies as well as Rochester itself, and they have
earned those returns on substantially larger connnon equity ratios.
Have you examined the average returns realized by common stock investors
in the form of dividends and market price appreciation in the comparison

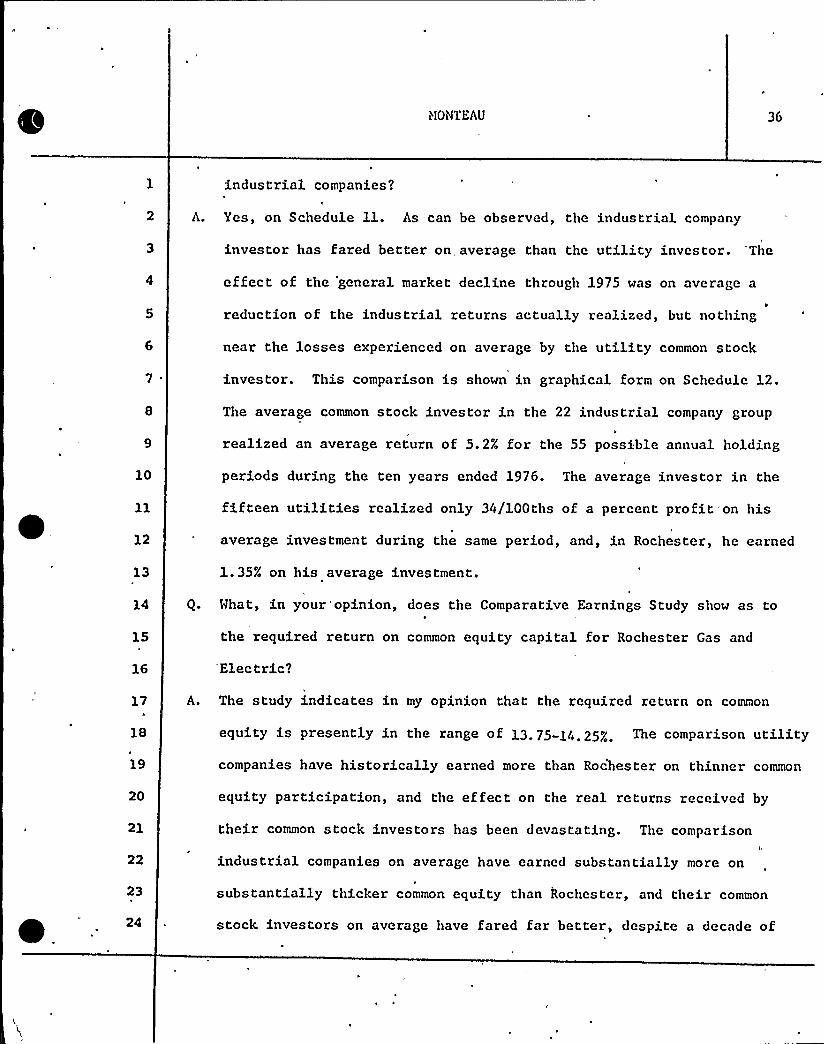
i~fONTEAU
indus trial companies?
A. Yes, on Schedule ll. As can be observed, the industrial company
investor has fared better on, average than the utility investor. 'The
effect of the 'general market decline through 1975 was on average a
reduction of the industrial returns actually realized, but nothing
near the losses experienced on average by the utility common stock
investor. This comparison is shown in graphical form on Schedule 12.
The average common stock investor in the 22 industrial company group
12
13
realized an average return of 5.2% for the 55 possible annual holding
periods during the ten years ended 1976. The average investor in the
fifteen utilities realized only 34/100ths of a percent profit on his
average investment during the same period, and, in Rochester, he earned
1.35% on his average investment.
Q. What, in your 'opinion, does the Comparative Earnings Study show as to
15 the required return on common equity capital for Rochester Gas and
16 'Electric?
17 A. The study indicates in my opinion that the required return on common
18
19
20
equity is presently in the range of 13.75-14.25% The comparison utilitycompanies have historically earned more than Rochester on thinner common
equity participation, and the effect on the real returns received by
21
22
their common stock investors has been devastating. The comparison
industrial companies on average have earned substantially more on
23 substantially thicker common equity than Rochester, and their common
stock investors on average have fared far better, despite a decade of
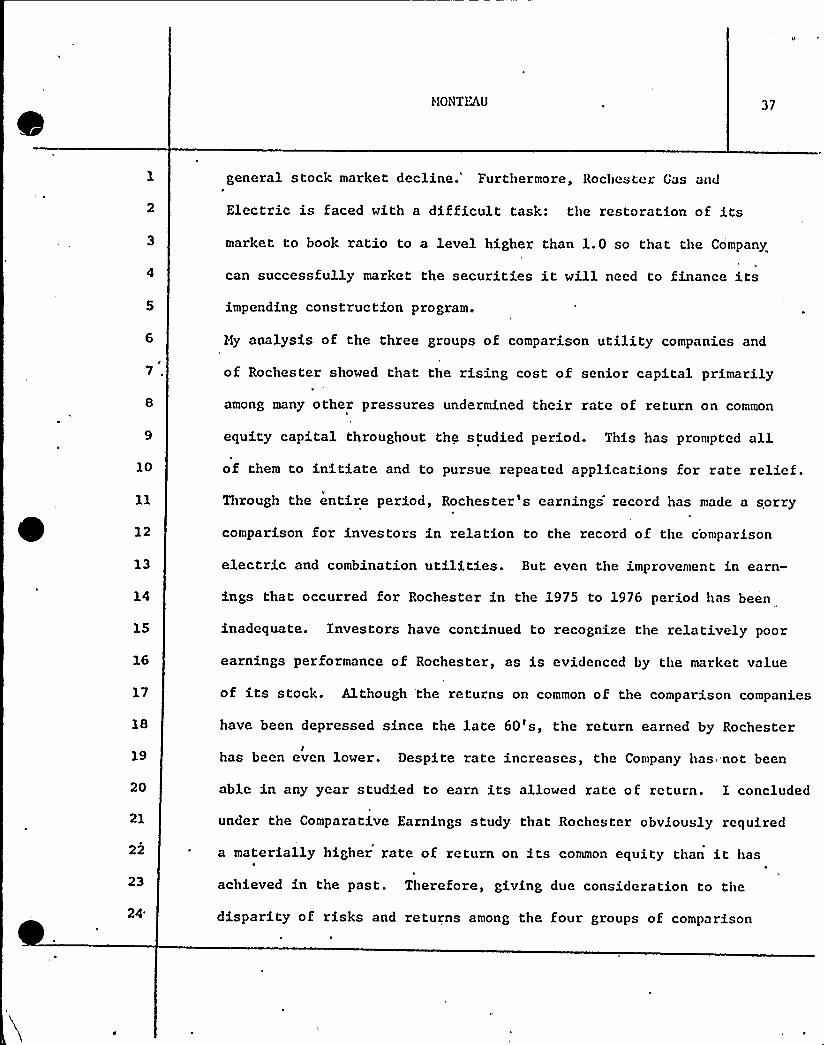
HONTLAU 37
general stock market decline.'urthermore, Rochester Gas and
Electric is faced with a difficult task: the restoration of itsmarket to book ratio to a level higher than 1.0 so that the Company
can successfully market the securities it will need to finance itsimpending construction program.
My analysis of the three groups of comparison utility companies and
of Rochester showed that the rising cost of senior capital primarily
among many other pressures undermined their rate of return on common
equity capital throughout the studied period. This has prompted all10 of them to initiate and to pursue repeated applications for rate relief.
Through the entire period, Rochester's earnings record has made a sorry
12 comparison for investors in relation to the record of the c'omparison
13
14
15
16
18
20
21
22
23
24'lectric
and combination utilities. But even the improvement in earn-
ings that occurred for Rochester in the 1975 to 1976 period has been
inadequate. Investors have continued to recognize the relatively poor
earnings performance of Rochester, as is evidenced by the market value
of its stock. Although 'the returns on common of the comparison companies
have been depressed since the late 60's, the return earned by RochesterI
has been even lower. Despite rate increases, the Company has= not been
able in any year studied to earn its allowed rate of return. I concluded
under the Comparative Earnings study that Rochester obviously required
a materially higher rate of return on its common equity than it has
achieved in the past. Therefore, giving due consideration to the
disparity of risks and returns among the four groups of comparison

0
~ I
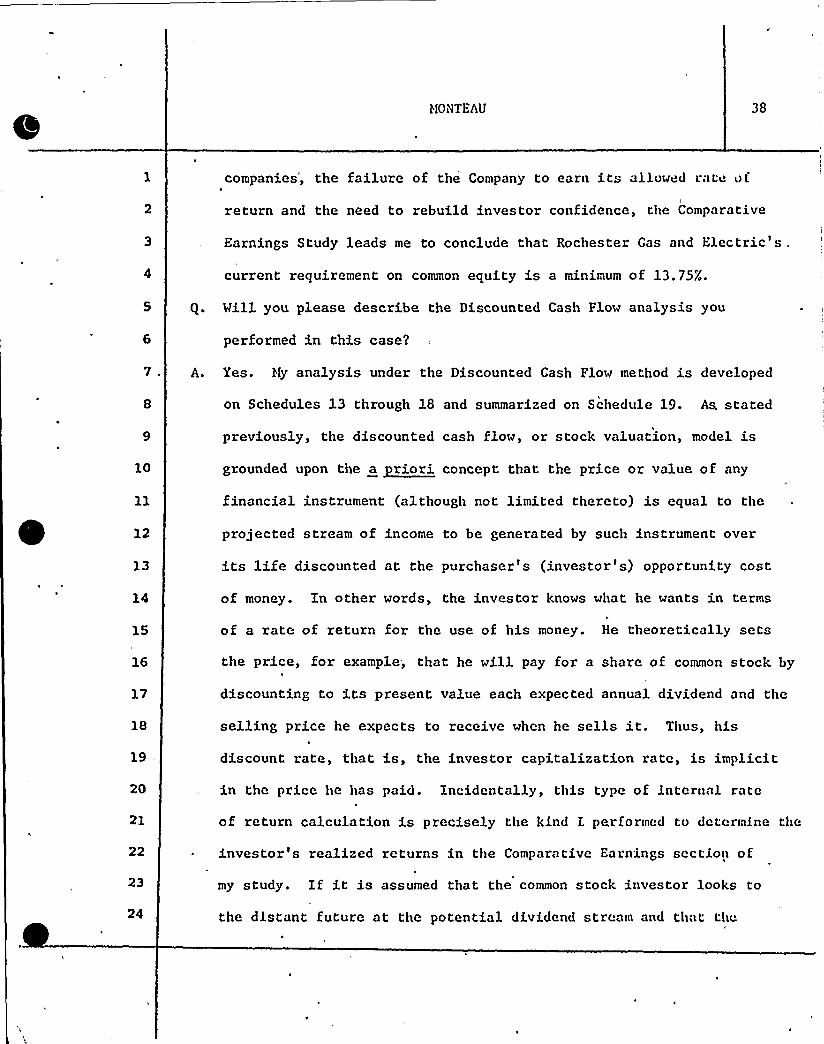
HOiNTEAU 38
companies', the failure of the Company to earn its allowed rate of
return and the need to rebuild investor confidence, the Comparative
Earnings Study leads me to conclude that Rochester Gas and Electric's
current requirement on common equity is a minimum of 13.75%.
Q. Will you please describe the Discounted Cash Flow analysis you
performed in this case?
7 ~ A. Yes. kfy analysis under the Discounted Cash Flow method is developed
on Schedules 13 through 18 and summarized on Schedule 19. As. stated
previously, the discounted cash flow, or stock valuation, model is
10 grounded upon tha a ~riori concept that the price or value of any
financial instrument (although not limited thereto) is equal to the
12
14
16
17
18
projected stream of income to be generated by such instrument over
its life discounted at the purchaser's (investor's) opportunity cost
of money. In other words, the investor knows what he wants in terms
of a rate of return for the use of his money. He theoretically sets
the price, for example; that he will pay for a share of common stock by
discounting to its present value each expected annual dividend and the
selling price he expects to receive when he sells it. Thus, his
19 discount rate, that is, the investor capitalization rate, is implicit
20 in the price he has paid. Incidentally, this type of internal rate
of return calculation is precisely the kind I performed to determine the
22
23
24
investor's realized returns in the Comparative Earnings scctio~> of
my study. If it is assumed that the common stock investor looks to
the distant future at the potential dividend stream and that thu

t
4
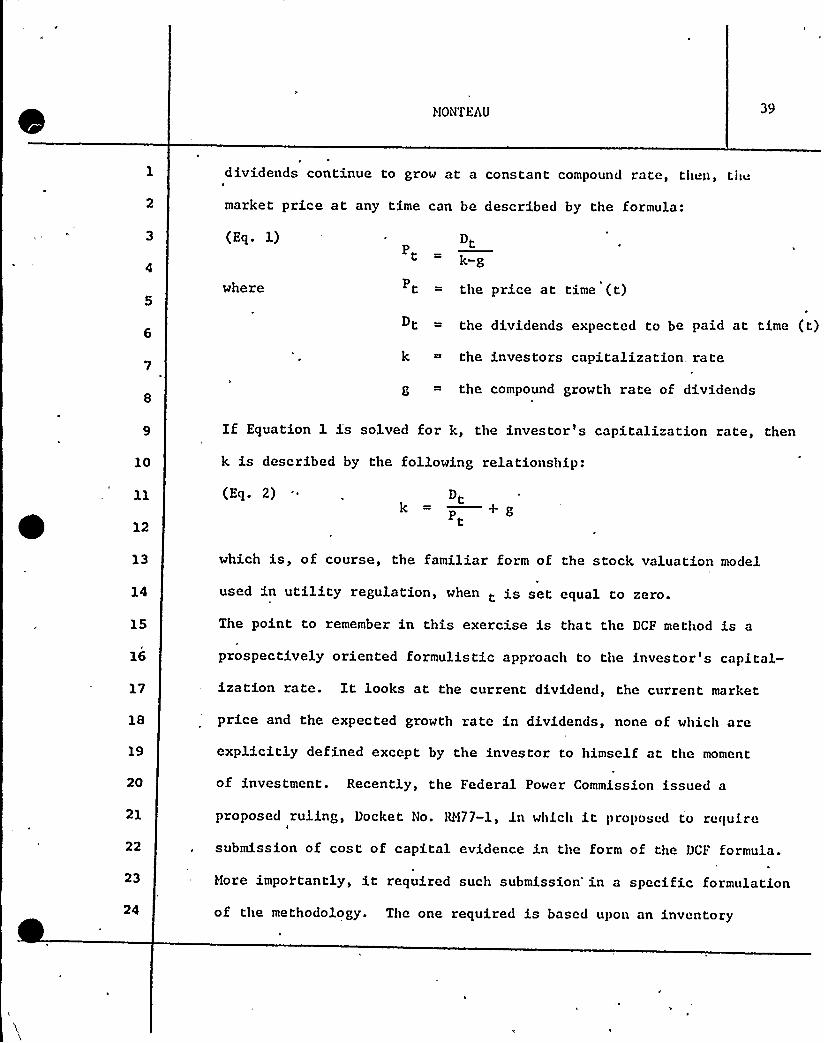
MONTEAU
dividends continue to grow at a constant compound rate, then, Li«
market price at any time can be described by the formula:
(Eq. l) DtP
k-g
where t = the price at time (t)
Dt = the dividends expected to be paid at time (t)k = the investors capitalization. rate
g = the compound growth rate of dividends
10
If Equation 1 is solved for k, the investor's capitalization rate, then
k is described by the following relationship:
12
(Eq. 2) Dtk = —+ gPt
13
14
which is, of course, the familiar form of the stock valuation model
used in utility regulation, when t is set equal to zero.
15 The point to remember in this exercise is that the DCF method is a
16
17
18
19
20
22
23
24
prospectively oriented formulistic approach to the investor's capital-
ization rate. It looks at the current dividend, the current market
price and the expected growth rate in dividends, none of which are
explicitly defined except by the investor to himself at the moment
of investment. Recently, the Federal Power Commission issued a
proposed ruling, Docket No. RM77-1, in which it proposed to require
submission of cost of capital evidence in the form of the DGF formula.
More importantly, it required such submission'n a specific formulation
of the methodology. The one required is based upon an inventory
HONTEAU 40
forecasting model which, simply stated, weights current data wit.h
a factor which decays as it is applied to data further in the past.
The details of that particular method are not important at this
point as I have produced similar results using unweighted current yields.
On Schedule 13, I show the estimations of the cost of common equity
produced by applying this FPC procedure on a consistent basis over a
long period to each of the companies contained in Hoody's 24 Utilities
Index. Compared to the DCF results on'chedule 13 are the actual
10
12
13
14
15
16
17
18
19
20
21
22
23
24
operating results of the Hoody's 24 Companies during the same period.
An examination of the graph reveals several trends of note.
First, the DCF determined cost of equity during the period 1960-1967
was significantly less than both the average of the historical returns
earned on common equity and the actual returns realized in the market
place by investors. Further, as the returns earned on common equity
and realized in the market declined, the DCF cost of common ro'se. These
opposing trends have persisted throughout the remainder of the period.
By 1973, the DCF estimate crossed both return lines and as of 1975
(the last year studied by the FPC) would set the cost rate signifi-
cantly higher than that being earned on equity by the average of the
Moody's 24 Utilities.
Second, the return actually realized by common shareholders has tracked
very closely the Market-to-Book Ratios of the 24 Utilities and moved
almost directly opposite to the DCF capitalization rate trend.
Finally, the returns realized and the market-to-book ratios have

0
HONTEAU 41
declined generally during the period of decline in thecompanies'eturns
on equity. I will discuss this relationship further in my
market appraisal study.
„ What have you concluded from this phase of your study?
A. I have concluded that a formulistic application on a consistent basis
of the DCF method does not work. The discounted cash flow method as
often applied appears disarmingly simple. It is not. Neither does itsatisfy the constitutional criteria of relative risk and comparability
of returns nor even test financial integrity. It is a market oriented .
10 method approaching only the problem of capital attraction. It does not
12
even directly answer the problem of translating the market determined
investor capitalization rates into the cost of common equity. Yet, the
13 ,only time when the two are equal is when the market price of common
14
16
17
18
stock exactly equals its underlying book value per share. It does not
even come close to fully explaining investor behavior. If it did, we
would be able to explain 100% of the variations in historical dividend
yields by looking at historical growth rates. The difficulty is that
historical growth rates do not necessarily match 'expected growth rates.
19 It can never be used alone, no matter how elaborate, as the sole
20 determinate of the cost of common equity because if fails even to
21 investigate let alone answer two of,the three criteria for a fairreturn.
23 Have you investigated the historical growth patterns of =public utilities?24 A. Yes. On Schedules 14 and 15. I present my analysis of the growth rates
SIONTEAU 42
in earnings, dividends, and book value per share for lioody's 24
Utilities over the past twenty years. As can be observed on Schedule 14
which shows 10-year growth rates, and again on Schedule 15, which
shows 5-year growth rates, the growth rates of book value constituted
the most stable estimate of growth throughout the studied period.
9
10
The growth in dividends lagged behind the growth in earnings but
tracked it closely. Both growth rates, earnings and dividends, attained
high points in the middle sixties but have since fallen to below 3%.
The growth rates in book value remained at or near 5% over the entire
period. Only in the most recent years, have the book value growth
rates declined in any meaningful manner. This, of course, x'esulted
12
13
16
17
18
19
20
21
22
24
from u'tilities being squeezed between depressed earnings for common
equity and the absolute necessity of increasing dividend payout ratios
just to maintain their'xisting dividend levels, as well as from the
forced issuance of common shares at prices below their underlying
book values. Such a scenario simply cannot be attractive to investors.
Note that it matters a great deal which growth rate is used to
pxoject dividends in the DCF methodology. A basic assumption of the
model is that investors expect dividends will grow at a constant rate.
For this to be true all three growth rates, book value, earnings and
dividends must; grow at the same rate. The relationships among the
three growth rates are determined by the enterprise not the investor.
If the company, for example, pays higher, dividends without equally
increased earnings to support such payment, then book value growth is

HOiNTEAU43
diminished. Thus, the inves'tors growth estimate must consider
all three variables. A final point revealed by these two schedules
is that the five-year growth rates have shown wider variations than
the ten-year growth calculations. Pith .this in mind, I investigated
the effects of period length on growth rates.
Have you presented a schedule which describes your analysis of growth
7. rate periods?
8
10
12
13
14
15
16
17
18
19
20
21
A. Yes, Schedule 16. On this schedule I present a graph of growth rates
for Hoody's 24 Utilities over varying periods all ending 1975. The
growth rates which are plotted at 1956 are thus 20 years in length,
the ones plotted at 1957 are 19 years long and the ones plotted at 1974
are one 'year growth rates. As is apparent, the shorter period growth
rates vary all over the lot. In contrast, the longer the period
the more stable the rates become and the more closely the three rates
approximate each other and 5%. I have studied other ending points as
well and in each case a similar pattern appears.
Q. i%at have you concluded from your study of growth rate estimations?
A. I have concluded that neither a single variable nor a single historical
growth period can be determined which will unerringly predict the proper
growth rate for any utility company. I have further concluded that
the DCF method, to have any meaning, must consider a capitalization
22 ~ rate determined by investors themselves in the market place which
23 reflects and therefore offsets the currently depressed earnings of
24 public utilities. For these reasons, I determined the growth rate

1
t lOiNTEAU 44
estimates in my DCF study by analyzing the growth of all three
variables over a number of periods adjusted for a number of
specific factors which will impact upon its continuance in the
future;
Could you describe the discounted cash flow study you conducted in this
ease?
A. Yes. On Schedule 17 I list the growth rates in earnings per share,
dividends per share and book value per share for each of nine periods
for Rochester Gas and Electric and for comparative purposes for each
10 of the 15 utilities which I selected in my, comparative earnings study.J
After analyzing the individual growth rates and their pattern for each
12
13
14
company I determined an estimate of growth in each category. In making
my estimates I examined for each company current earnings, dividends
and book value levels, current market-to-book ratios and trends,
dividend payout ratios and yields, beta factors, investment ratings,
16 fuel mix, regulatory climates, realized return levels — past and present,
17
18
19
20
21
22
23'istoricaland projected growth in plant together with the financings
which have or will support such growth, capital requirements, recent
dilutions of earnings, recent population changes in service territoriesand finally current common equity ratios.
Hy final growth estimates in each category for each company are shown
in the first three columns of Schedule 19.
Q. Have you presented a schedule of the current dividend yields which you
24 employed in your study?

P
HONTEAU 45
.A. Yes, on Schedule 18. For the current yield I used the indicat«d
dividend rate and the weighted average high, and low market prices for
the three months: January, February and Harch 1978, as shown in
Standard & Poor's Stock Guides. This analysis is detailed on the
schedule. Observe that the Current Dividend Yield for. Rochester is
7.36% (line 19). This is the lowest of all 16 comparison companies
shown. Thus, the common stock investors themselves currently demand
a much lower return in the form of cash dividends from Rochester than .
from the average of any group of comparison companies. This is true,
10 as it is the common stock investors themselves in the short run, who
by adjusting the current market price adjust the current dividend
12
13
14
yield from investment in a company. In other words, investors in
Rochester's common stock are fully aware of the benefits which accrue
to them from the Company's stock dividend policy and obviously expect
-16
much higher growth (in the form of market appreciation) from thei'r
investment than from the average utility.17 Q. Will you continue with the explanation of your Discounted Cash Flow
18 analysis2
19 A. The summary of the results of my discounted cash flow analysis is shown
20 on Schedule 19. As shown on Schedule 19 (line 18), the average expected
21 growth rate in earnings per share for the 15 comparison utilities is
4.14%. The average growth rate in dividends per share is 4.14% and,
23 in book value per share, 4.17%. For Rochester (line 19), the expected
24 growth rate in earnings per share is 6.00%; 7.25% in dividends per

I
4
t
ll
HONTLgAU
share; and 5.50% in book value per share.
The primary reasons that I believe investors expect the growth premiums
I indicate for Rochester over the growth rates for the comparison
utilities are as follows:
1. That since .the institution of the stock dividend policy in 1960,
Rochester's investors have actually received more than 200 basis
points higher market appreciation (growth) than companies in
Rochester's earnings category.
2. That the stock dividend policy con'stitutes an automatic annual
10 3% ratchet upward on growth rates.
12
3. That both the extra market appreciation and the stock dividendP
f
shares represent capital income rather than ordinary income for
13 the tax purposes of investors.
14 4 ~ That the Company, simply must increase its cash dividends growth
15
16,
, rate in the immediate future as it did in 1977 (9.4%) to respond
to the demands for current earnings by common stock investors if17 it intends to finance successfully its construction requirements.
18 5. That, assuming as a result of this rate case the Company indeed
19
20
does earn its allowed rate of return, let alone its current cost
of common equity, it can not fail to achieve the rates of growth
21 I indicate on Schedule 19;
22 Will you please continue with your description of Schedule 19?
23
24
A.~ Yes. As'shoun on Schedule 19 (column 4. lines 16 and 19), the average
current yield for the 15 comparison companies is 8.98% and for Rochester

1
'i
P
>fOilTEAU 47
it is 7.36%.
Implicit in the Discounted Cash Flow model is that in the long run,
when a company earns its indicated cost of capital, the market price
5
per share of its common will equal the book value per share. In other
words, when necessary to issue common the model assumes that no investor
will pay more than the amount already invested per share. This causes
a problem when the company needs to raise common equity capital in the
,marketplace. If the company does require the external infusion of
common equity capital, it is at a disadvantage. The additional costs
10
12
13
of financing, plus the effects of market pressure on the market price,
will force the company to sell its stock below book value. Since this,
in turn, causes dilution of earnings and confiscation of existing
shareholder's book value, it should be avoided. For this reason, I
14
15
have adjusted the current dividend yield upward slightly. The costs/
of financing and pressure vary considerably for different compai!les
16
17
under different conditions. But, after performing and observing a
number of such studies, I have concluded that a 10% adjustment to the
18
19
ratio .presently suffices as a reasonable estimate of the effect of these
costs. This adjustment was made by dividing the current dividend yields
20 in column 4 of Schedule 19 by 90.0% and produces the adjusted dividend
21
23-
24
yields shown in column five. For the 15 utilities the average adjusted
yield is 9.98% and for Rochester it is 8.18%.
The last three columns of Schedule 19 shows the indicated capitalization
rate of common equity based on each growth rate. Thus, on line 16

A
l
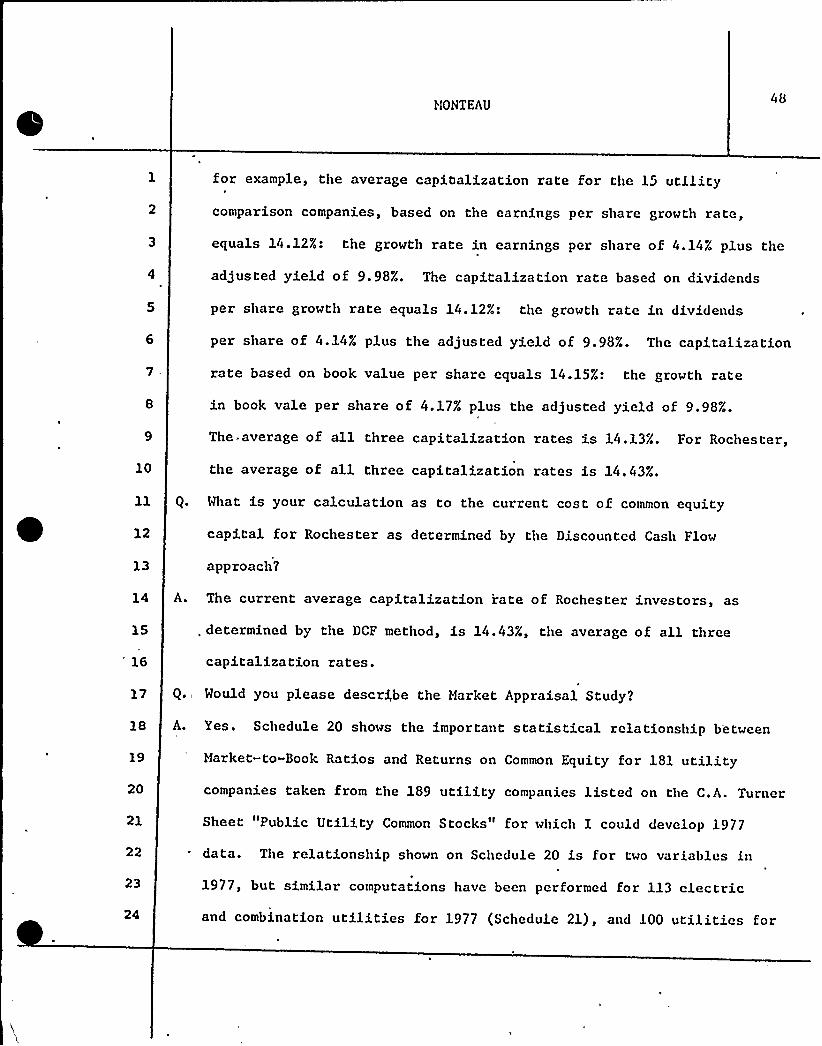
MONTEAU48
for example, the average capitalization rate for the 15 utilitycomparison companies, based on the earnings per share growth rate,
equals 14.12%: the growth rate in earnings per share of 4.14% plus the
adjusted yield of 9.98%. The capitalization rate based on dividends
per share growth rate equals 14.12%: the growth rate in dividends
per share of 4.14% plus the adjusted yield of 9.98%. The capitalization
rate based on book value per share equals 14.15%: the growth rate
in book vale per share of 4.17% plus the adjusted yield of 9.98%.
The average of all three capitalization rates is 14.13%. For Rochester,
10
12
14
15
16
the average of all three capitalization rates is 14.43%.
What is your calculation as to the current cost of common equity
capital for Rochester as determined by the Discounted Cash Flow
approach?
A. The current average capitalization rate of Rochester investors, as
, determined by the DCF method, is 14.43%, the average of all three
capitalization rates.
Would you please descry,be the Market Appraisal Study?
18 A. Yes. Schedule 20 shows the important statistical relationship b'etween
19
20
21
22
Market-to-Book Ratios and Returns on Common Equity for 181 utilitycompanies taken from the 189 utility companies listed on the C.A. Turner
Sheet "Public Utility Common Stocks" for which I could develop 1977
data. The relationship shown on Schedule 20 is for two variables in
23 1977, but similar computations have been performed for 113 electric24 and combination utilities for 1977 (Schedule 21), and 100 utilities for

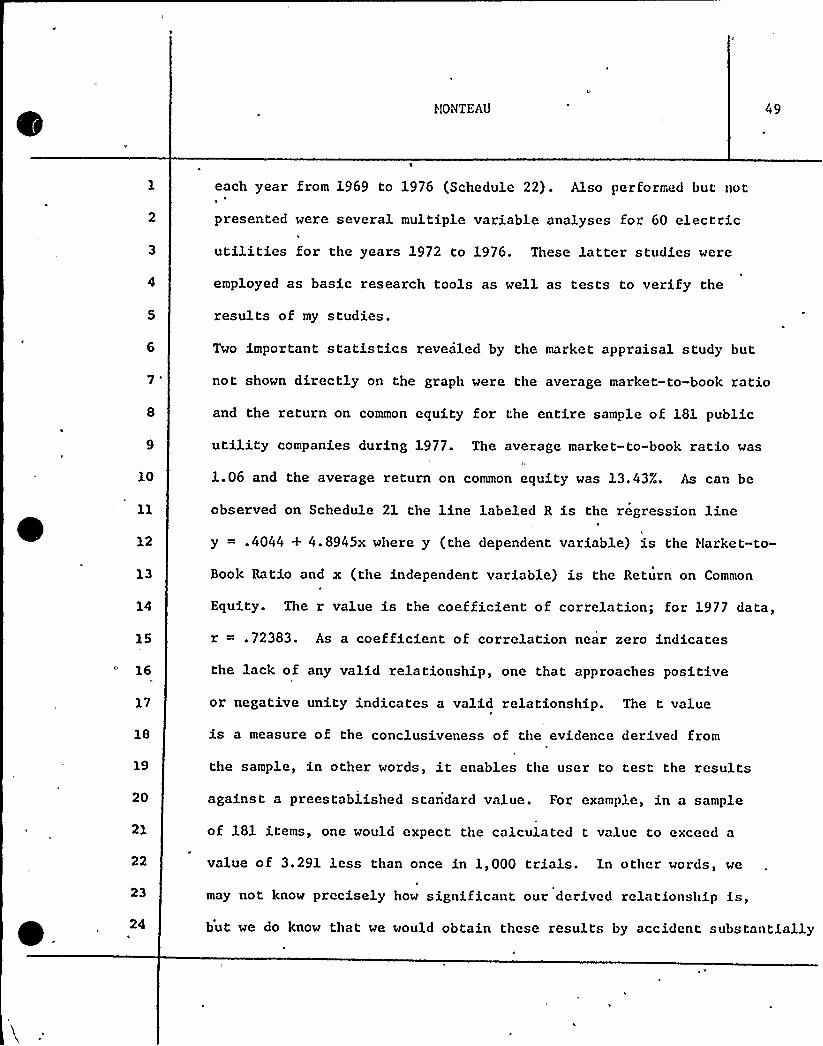
l fOiNTEAU 49
each year from 1969 to 1976 (Schedule 22). Also performed but not
presented were several multiple variable analyses for 60 electric
utilities for the years 1972 to 1976. These latter studies were
employed as basic research tools as well as tests to verify the
results of my studies.
Two important statistics revealed by the market appraisal study but
not shown directly on the graph were the average market-to-book ratio
and the return on common equity for the entire sample of 181 public
10
utility companies during 1977. The average market-to-book ratio wasI
1.06 and the average return on common equity was 13.43%. As can be
observed on Schedule 21 the line labeled R is the regression line
12 y = .4044 + 4.8945x where y (the dependent variable) is the Harket-to-
l3
16
17
18
19
20
21
22
23
Book Ratio and x (the independent variable) is the Return on Common
Equity. The r value is the coefficient of *correlation; for 1977 data,
r = .72383. As a coefficient of correlation near zero indicates
the lack of any valid relationship, one that approaches positive
or negative unity indicates a valid relationship. The t value
is a measure of the conclusiveness of the evidence derived from
the sample, in other words, it enables the user to test the results
against a preestablished standard value. For example, in a sample
of 181 items, one would expect the calculated t value to exceed a
value of 3.291 less than once in 1,000 trials. In other words, we
may not know precisely how significant our derived relationship is,but we do know that we would obtain these results by accident substantially

I
lV
ii
jt
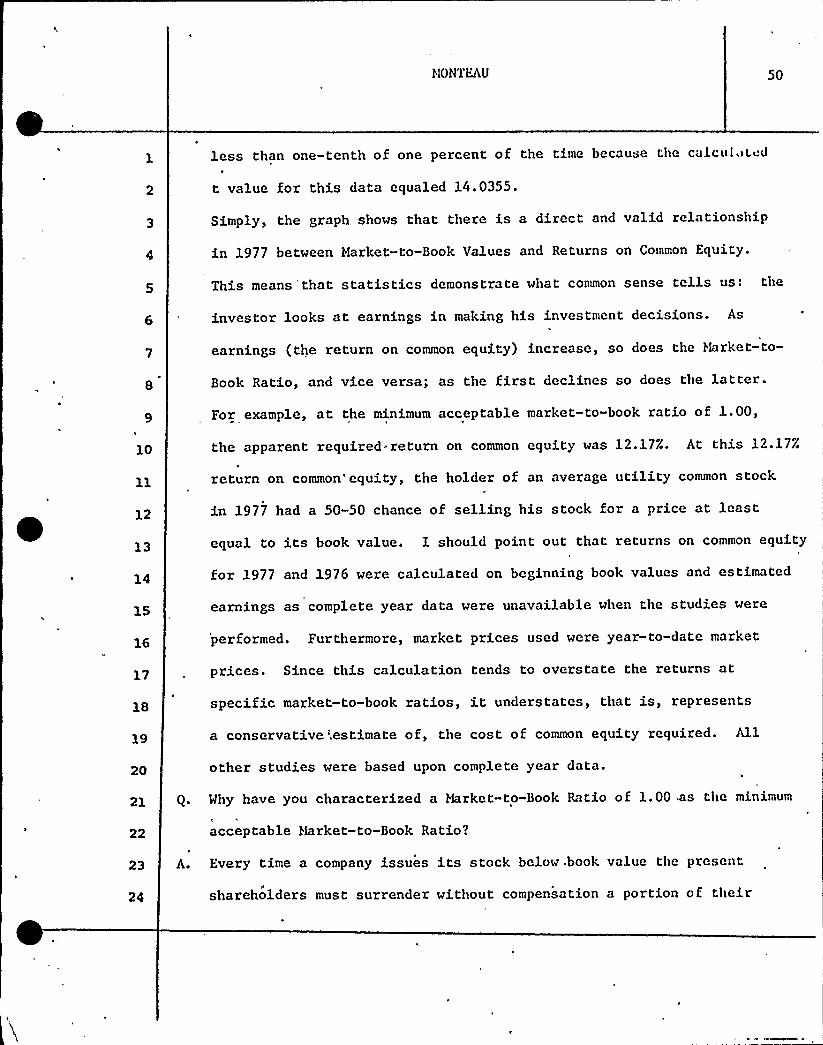
HONTEAU 50
less than one-tenth of one percent of the time because the calcul.~t.ud
t value for this data equaled 14.0355.
Simply, the graph shows that there is a direct and valid relationship
in 1977 between Market-to-Book Values and Returns on Common Equity.
10
This means that statistics demonstrate what common sense tells us: the
investor looks at earnings in making his investment decisions. As
earnings (the return on common equity) increase, so does the Harket-to-
Book Ratio, and vice versa; as the first declines so does the latter.
For example, at the minimum acceptable market-to-book ratio of 1.00,
the apparent required. return on common equity was 12.17%. At this 12.17/
12
return on common'equity, the holder of an average utility common stock
in 1977 had a 50-50 chance of selling his stock for a price at least
13 equal to its book value. 1 should point out that returns on common equity
14 for 1977 and 1976 were calculated on beginning book values and estimated
16
18
20
earnings as complete year data were unavailable when the studies were
'performed. Furthermore, market prices used were year-to-date market
prices. Since this calculation tends to overstate the returns at
specific market-to-book ratios, it understates, that is, represents
a conservative'.estimate of, the cost of common equity required. All
other studies were based upon complete year data.
21 Vhy have you characterized a Market-to-Book Ratio of 1.00,as the minimum
22 acceptable Market-to-Book Ratio?
23 A. Every time a company issues its stock below, book value the presentll
shareholders must surrender without compensation a portion of their

4
l
'(
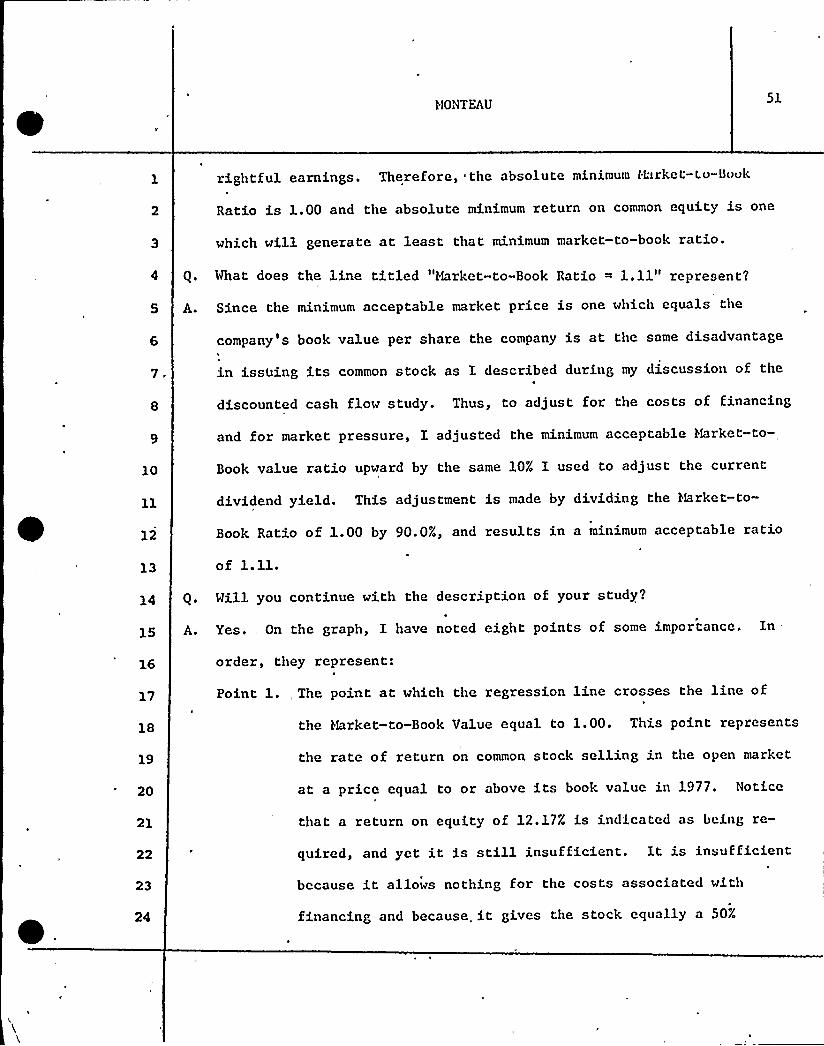
HONTEAU
rightful earnings. Therefore, the absolute minimum Market-Lo-Bunk
Ratio is 1.00 and the absolute minimum return on common equity is one
which will generate at least that minimum market-to-book ratio.
Q. What does the line titled "Market-to-Book Ratio = 1.11" represents
A. Since the minimum acceptable market price is one which equals the
company's book value per share the company is at the same disadvantage'
in issUing its common stock as I described during my discussion of the
10
discounted cash flow study. Thus, to adjust for the costs of financing
and for market pressure, I adjusted the minimum acceptable Market-to-
Book value ratio upward by the same 10% I used to adjust the current
dividend yield. This adjustment is made by dividing the Market-to-
12 Book Ratio of 1.00 by 90.0%, and results in a minimum acceptable ratio
13 of 1.11.
14
15
Q. Will you continue with the description of your study'7
A. Yes., On the graph, I have noted eight points of some importance. In
16 order, they represent:
17 Point 1., The point at which the regression line crosses the line of
18
19
20
21
22
23
24
the Harket-to-Book Value equal to 1.00. This point represents
the rate of return on common stock selling in the open market
at a price equal to or above its book value in 1977. Notice
that a return on equity of 12.17% is indicated as being re-
quired, and yet it is still insufficient. It is insufficient
because it allows nothing for the costs associated with
financing and because it gives the stock equally a 50%

II
HONTEAU
chance of selling below book value.
10
12
13
Point 2. This represents the point at which the average company willhave a 50-50 chance of issuing stock at or above book value.
This, then, is the indicated cost of common equity for the
average utility company during 1977. Note the required return
is 14.44%, still giving the company only the flip-of-a-coin
chance of selling stock at or above book value.
Point 3. This represents the point at which the company will have a
75% chance of issuing stock at or above book value. The
required return on common equity is 17.50%.
Point 4. This represents the point at which the company will have a
90% chance of issuing stock at or above book value. The re-
quired return on common equity is 20.28%.
14
15
~Point 5. This represents the point at which the company will have a
(
95% chance of issuing stock at or above book value. The re-
16 quired returns on common equity is 21.95%.
17 Point 6. This represents the point at which the company will have a
18
19
20
21
22
23
24
5% chance of issuing stock at or above book value, and
conversely, will have a 95% chance of issuing it below book
value. The required return on common equity is only 6.95%.
The effect on the present shareholders is devastating; 19
out of 20 times, the company's common will sell below book
value.
Point 7. This represents the point at which the company will have a one-
HOiNTEAU 53
out-of-ten chance of issuing stock at or above book value, and
a nine-out-of-ten chance of issuing its stock below book value.
The required return on common equity is only 8.62%. Again,
the effect on shareholders is disastrous.
Point 8. This represents the point at which the company will have a 25% .
chance of issuing its shares at or above book value, a 75%
chance of issuing below book value. The required return on
common equity is 11.39%.
10
Q. Will you describe Schedule 21?,
A. Yes. Schedule 21 shows a study identical to the 181 company market
13
14
15
appraisal study except that all primarily gas utility companies have
- been removed. The first item to note is that the co'nfidence intervals
(lines AA', BB', and CC') are much closer to the trend line itself. This
indicates that the remaining data points cluster more closely about the
trend line. Also, the correlation coefficient is minutely higher. This
16
17
indicates that the new relationship is slightly stronger than the relation-)
ship for the larger group of utilities. The t statistic is 11.3573,
18 still extremely significant. The fact that it is lower than the t value
19 of the 181 company study results only from our use of a smaller sample.
20 The indicated average cost of equity capital is represented at point 2
21
23
24
is 13.79% for this group of 113 electric and combination companies. The
data values for Rochester itself place it almost exactly on the trend
line. This can only mean that investors view the Company's earnings
similar in risk to the average utility despite lower dividend payout.

P
l1
ll
l10NTEAU
Will you please describe Schedule 22'P
A. Yes, Schedule 22 presents the results of another market appraisal study.
Z'his earlier study investigated the changing annual relationships'I
between Market-to-Book Ratios and Returns on Common Equity over an
eight-year period. As can be observed, the slope of each curve in
10
12
13
14
15
succession decreased from 1969 through 1975. This meant that as the
period progressed, the utility common stock investor demanded a greater
and greater rate of return in compensation for the same investment.
During 1976 the situation improved and the cost of common recovered to
a point near the returns demanded in 1973. Upon comparison of Schedules
20 and 21 with Schedule 22, it becomes apparent that the returns demanded
by common equity investors in 1977 also remained close to the returns
demanded in 1973.
The Market Appraisal Study indicates that the 1977 cost of common equity
for an average utility company in the United States was at least 14.44%
16 and that for an average electric or combination company at least 13.79%.
18
The study also establishes that recent costs of common equity reflect a
fundamental change in investor attitudes towards public utilities and
19 perhaps a far reaching alteration of the basic historical risk return
20
21
relationships for utility companies in the financial community.
Q. What, in your opinion,. does the Market Appraisal Study show as to the
22
23
24
cost of common equity capital for Rochester Gas and Electric?
A.'t, My study indicates that the 1977 cost of common equity for an average
utility company in the United States ranged between 13.79% and 14.44%.

0
HOiNTEAU
55
If the risk for an individual company can be shown to be greater t.han
the 1977 average, then, certainly the cost for that company would exceed
the indicated range.
Rochester differs from the average electric utility company in that its
present common equity ratio is thicker than average and its common divi-
dend yield is significantly lower because of a long standing policy of
annually issuing stock dividends. Rochester data falls so close to the
trend line that it is indistinguishable therefrom, both in risk andN
investment rating. Therefore, in my opinion, the Market Appraisal
10
12
Study demonstrates that the Cost of Common Equity for Rochester Gas and
Electric falls with the range from 13.79% to 14.44%.
Can you at this point concluded as to what the current cost of common
13 equity capital is for Rochester Gas and Electric?
14
16
17
18
19
20
22
23
24
A. Yes. The Comparative Earnings approach demonstrated a cost of common
equity based, upon historical data of at least 13.75%. The Discounted
Cash Flow approach substantiated an investor expected return of 14.43%
based upon projected growth rates and current market data. The statisti-cal Market Appraisal Study indicated a rate of return on common equity
within a range from 13.79% to 14.44%. Thus, the three studies separately
~ all produced estimated costs of common equity which fell within the range
of from 13.75% to 14.50%. Therefore, .it is my opinion that a return
on common equity within a range of from 13.75% to 14.5% is required at
this time.
Q. slave you calculated the current embedded cost of senior capital of

4
0II
Jf
1
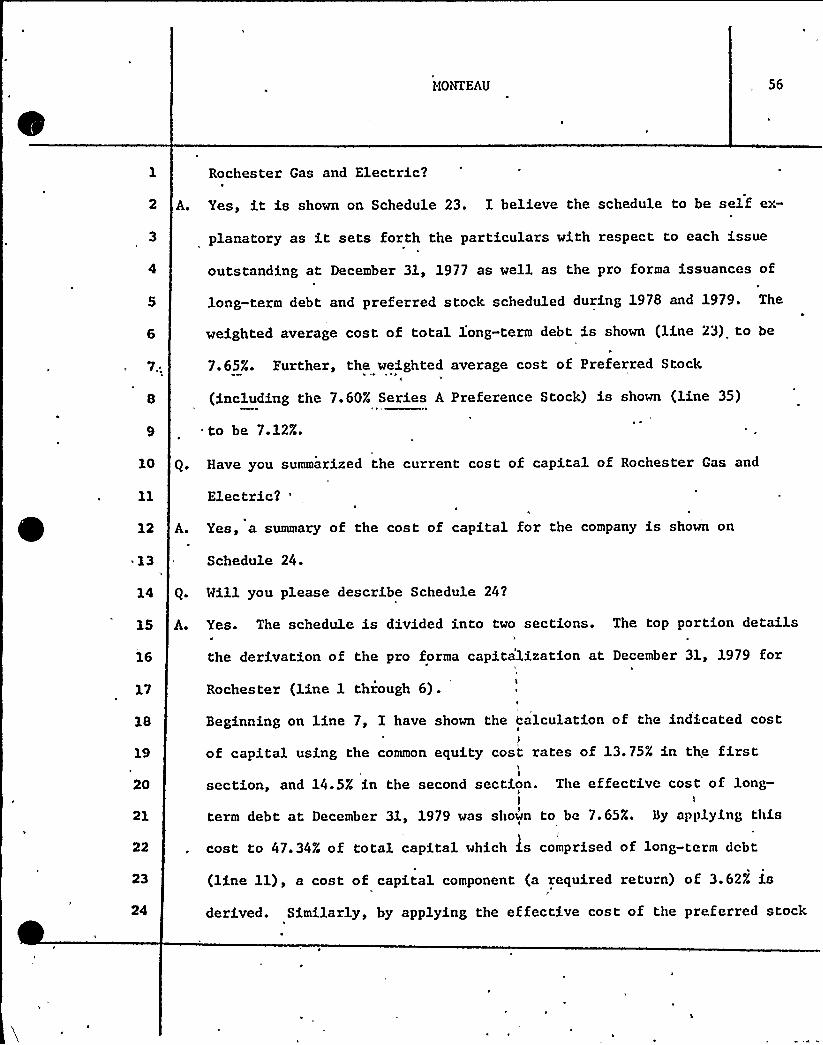
MONTEAU 56
Rochester Gas and Electric?
A. Yes, it is shown on Schedule 23. I believe the schedule to be self ex-
planatory as it sets forth the particulars with respect to each issue
outstanding at December 31, 1977 as well as the pro forma issuances of
long-term debt and preferred stock scheduled during 1978 and 1979. The
weighted average cost of total long-term debt is shown (line 23) to be
7i 7.65%. Further, the weighted average cost of Preferred Stock
(including the 7.60% Series A Preference Stock) is shown (line 35)
to be 7.12%.
10 Q. Have you summarized the current cost of capital of Rochester Gas and
Electric2
12 A. Yes, a summary of the cost of capital for the company is shown on
~ 13 Schedule 24.
Mill you please describe Schedule 242
15
16
17
18
19
20
21
A. Yes. The schedule is divided into two sections. The top portion details
the derivation of the pro forma capitalization at December 31, 1979 for
Rochester (line 1 through 6). I
H
Beginning on line 7, I have shown the calculation of the indicated costI
l
of capital using the common equity cost rates of 13.75% in the firstI
section, and 14.5% in the second section. The effective cost of long-Il
term debt at December 31, 1979 was shown to be 7.65%. By applying this
cost to 47.34% of total capital which is comprised of long-term debt
24
(line ll), a cost of capital component (a required return) of 3.62% is
derived. Similarly, by applying the effective cost of the preferred stock
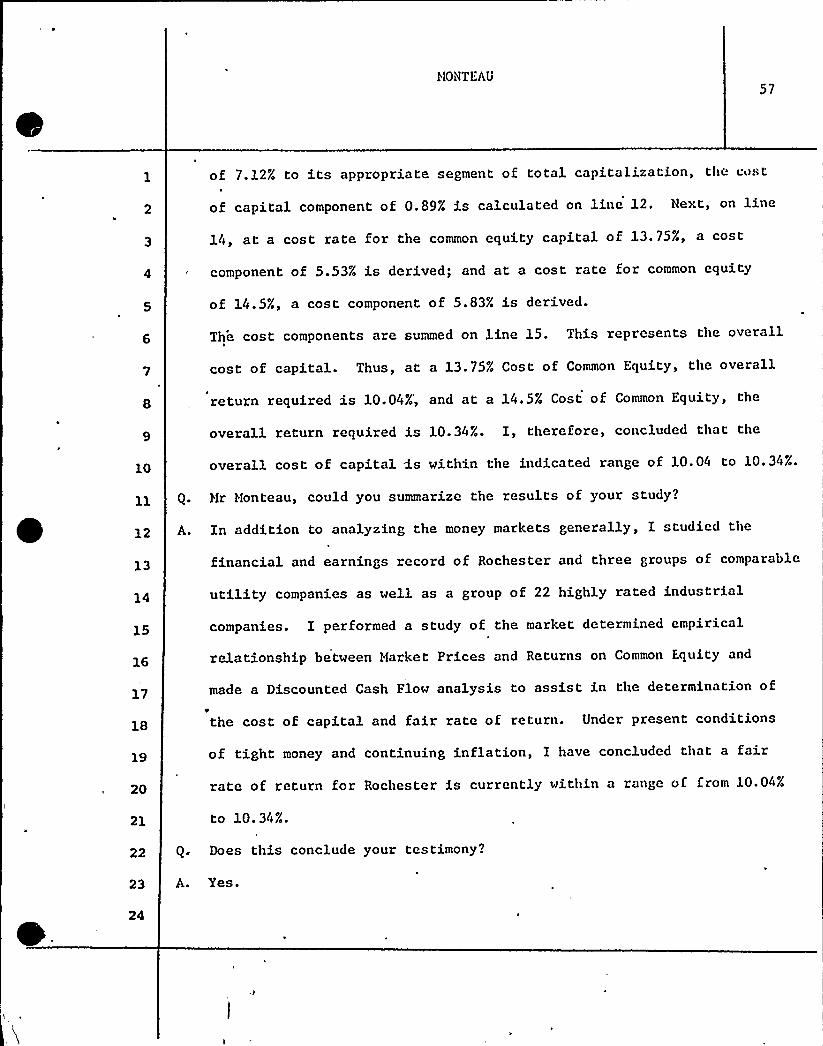
HONTEAU
of 7.12% to its appropriate segment of total capitalization, the cost
of capital component of 0.89% is calculated on line 12. Next, on line
10
12
14, at a cost rate for the common equity capital of 13.75%, a cost
component of 5.53% is derived; and at a cost rate for common equity
of 14.5%, a cost component of 5.83% is derived.
The cost components are summed on line 15. This represents the overallI
cost of capital. Thus, at a 13.75% Cost of Common Equity, the overall
return required is 10.04%', and at a 14.5% Cost of Common Equity, the
overall return required is 10.34%. I, therefore, concluded that the
overall cost of capital Xs within the indicated range of 10.04 to 10.34%.
Q. Hr Honteau, could you summarize the results of your study?
A. In addition to analyzing the money markets generally, I studied the
13
14
16
18
19
20
21
financial and earnings record of Rochester and three groups of comparable
utility companies as well as a group of 22 highly rated industrial
companies. I performed a study of the market determined empirical
relationship between Market Prices and Returns on Common Equity and
made a Discounted Cash Flow analysis to assist in the determination of
the cost of capital and fair rate of return. Under present conditions
of tight money and continuing inflation, I have concluded that a fair
rate of return for Rochester is currently within a range of from 10.04%
to 10. 34%.
22 Q. Does this conclude your testimony?
A. Yes.
DIRECT TESTIMONY
OF
H. RUSSELL FRASER
FOR
ROCHESTER GAS AND ELECTRIC COMPANY
MAY 1978
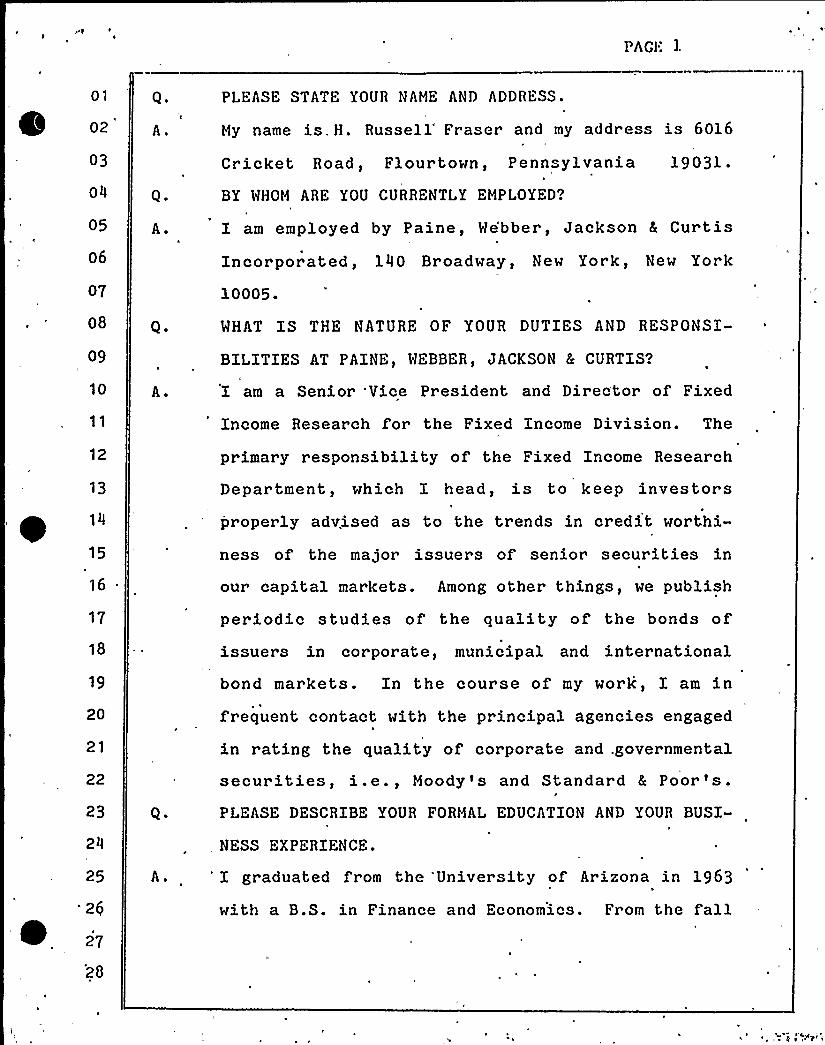
PhGI'.
01
02
03
04
05
06
07
08
09
10
12
13
15
16
17
18
19
20
21
22
25
'26
Q.
Q ~
Q ~
A.
Q ~
PLEASE STATE YOUR NAME AND ADDRESS.
My name is. H. Russell'raser and my addr ess is 6016
Cricket Road, Flour town, Pennsylvania 1903l.
BY WHOM ARE YOU CURRENTLY EMPLOYED?
I am employed by Paine, We'bber, Jackson & Curtis
Incorporated, 140 Broadway, New York, New York
10005.
WHAT IS THE NATURE OF YOUR DUTIES AND RESPONSI-
BILITIES AT PAINE, WEBBER, JACKSON 5 CURTXS?
I am a Senior 'Vice President and Director of Fixed
Income Research for the Fixed Xncome Division. The
primary responsibility of the Fixed Xncome Research
Department, which I head, is to keep investors
properly advised as to the trends in credit worthi-
ness of the major issuers of senior securities in
our capital markets. Among other things, we publish
periodic studies of the quality of the bonds ofissuer s in cor porate, municipal and internationalbond markets. Xn the course of my work, I am infrequent contact with the principal agencies engaged
in rating the quality of corporate and .governmental
securities, i.e., Moody's and Standard 5 Poor's.
PLEASE DESCRIBE YOUR FORMAL EDUCATION AND YOUR BUSX-
, NESS EXPERIENCE.
' graduated from the 'University of Arizona in 1963
with a B.S. in Finance and Economics. From the fall

* ~
0
PA(iE 2
01
02
03
04
05
06
07
08
09
10
12.
13
15
16
17
18
19
20
21
22
23
24
26
27
28
of 1963 to January 1967, I .was employed by Philadel-
phia Life Insurance Company as an Investment Analyst.
Xn Januar y 1967, I was employed by Standard 8 Poor 's
Corporation as an Analyst in their Bond Depar tmcnt.
'In June 1969, I became Manager of S&P's Cor por ate
Bond Department. In Apr il 1971, I became Vice
Pr esident of the Corporate Finance Department
of Standard 8 Poor 's Corpor ation. On September 22,
1975, I joined Paine, Webber, Jackson & Curtis,Inc.
was also the first President of the Fixed Income
Analysts Society in New York from September 1976 to
August 1977.,
PLEASE DESCRXBE MORE FULLY YOUR DUTXES AND RESPONSI-
BILXTXES MHXLE YOU MERE AT STANDARD Ec POORS?
As Vice President of the Corporate Finance Depart-
ment, I was responsible for all corporate bond,
preferred stock, and commercial paper ratings. Iwas in charge of four publications: first, The Fixed
Xncome Investor, which is 'a weekly publication
setting forth evaluations of 'new issues of inter-national, municipal, and corporate bonds, preferred
stock, and commercial paper; second, Commercial
Pa er Re orts, which presents two and three page
r eports ev'aluating the credit standings of leading
issuers in the commercial paper market; third,'or tunities in Convertible Bonds, which is a
weekly publication presenting coverage of new
offerings. in this area; and fourth, Convertible Bond

0
'l'
01
02
03
04
05
06
07
08
09
Q ~
A.
~Re or te, which wa" an alphabetically arranged guide
to information about all convertibles in which there
was active interest.IN THE COURSE OF YOUR EMP'LOYMENT MXTH. STANDARD &,
POOR'S, MERE YOU INVOLVED IN THE CREDIT RATXNG OF
PUBLXC UTILITIES XNCLUDING ROCHESTER GAS AND ELECTRIC
COMPANY (RG&E)?
Yes. I was involved in the credit rating of public
utilities, including RG&E, for 'just over eight10
12
13
15
16
18
19
20
2]
22
23
24
years.
Q., XN HOM MANY SECURITY RATINGS DXD YOU PARTXCIPATE
DURXNG YOUR TENURE WXTH STANDARD & POOR'S?
From January 1968 to about the middle of 1973, Iparticipated in every cor porate bond, preferred
stock, and commercial paper rating that was issued
by Standard & Poor's Corporation. From the middle
of 1973 to September of 1975, I personally partici-pated in about 50$ of the ratings issued by Standard
Poor's on corporate bonds, preferred stock, and
commercial paper. In an average year, we would
rate approximately 500 different issuers of securi-
ties, in addition to reviewing the ratings out-
standing on more than 1,900 companies.
Q. HAVE YOU EVER PREVIOUSLY TESTXFXED XN ANY JURISDXC-
25
26
27
28
A.
TXON BEFORE A COMMISSION, COURT OR LEGISLATIVE
COMMXTTEE?
During my near ly nine year s'f employment with

0
i
~ ~ ~ ~ ~ ~ ~
~ ~ ~
~ ~
~ ~ ~ II
~ ~ ~
~ ~ ~ ~ ~ ~
~ ~
~ l I ~ ~ ~ ~ ~ ~
~ I
~ I ~
I ~ ~ ~ ~ ~ ~
ll ~ ~ ~ l
~ ~ ~
~ l ~ ~
~ ll ~ ll
~ l
~ ~ ~ ~
I ~ I ~
I - ~
~ ~ ~ ~ ~
~ ~
~ L
~ ~
~ ~ ~ l ~

01
03
04
05
06'7
08,
09
10
j]12
13
16
17
18
19
20
21
22
Q ~
Federal Reserve. I have testified twice before the
U. S., Senate Banking Committee, and once befor e the
U. S. House, Ways.and Means Committee's Sub-Committee
on Health.
Since commencing my employment with Paine, Webber,
Jackson & Curtis, I have testified before the
California Public Utilities Commission, the Con-
necticut Public Utility Control'uthority, thePublic Service Commission of Delawaie, the Flora.da
Public Service Commission, the Illinois Commer ce
Commission, the Indiana Pubic Service Commission,
the Michigan Public Service Commission, the Minne-
sota Public Utility Commission, the New Mexico
Public Utility Commission, the Pennsylvania PublicUtilities Commission, the South Dakota PublicUtilities Commission, the Public Utility Commission
of Texas, the West Virginia Public Service Commis-
sion, the Florida State House of„Repr esentatives '
Committee on Growth and Energy, and the Canadian
National Energy Board.
WOULD YOU PLEASE DESCRIBE THE ACTIVITIES OF PAINE,
WEBBER) JACKSON & CURTIS?
24
25
26
27
28
Paine, Webber, Jackson & Curtis is one of the fivelargest securities firms serving individual in-vestors, ranks as one of the largest firms thatserving institutional investors, and acts as an
investment banker to corporations.
Paine Webber's network of 130 branch offices covers
PAGE 6
01
oz
03
04
05
06
'llregions of the United States and includes
five;- overseas offices. The firm employs approxi-
mately 2,200 registered representatives, including
mare than 130 full time institutional salesmen, and
serves approximately 650,000 retail and institu-tional clients.
07
08
09
10
In its role as an investment banker, the firm has
, been particularly. active in the telephone and
electric utility industries for many years. Me'ctas the, primary investment banker for General Tele-
12
.13.
phone and Electronics Corporation and CentralTelephone and Utilities Corporation. In recent
years, we have frequently served as a co-manager ofBell System debt issues.
16
17
18
19
20
21
22
23
24
25
26
We're one of Tampa Electric Company's primaryinvestment bankers as we are for many other investorowned electric utilities. In addition to our roleas an underwriter and a mar keter 'of new issues, we
actively trade debt and preferred issues of tele-phone companies, electric utilities, and othercorporations in the over-the-counter market and on
the stock exchange.
Paine, Webber maintains two research departments,
one for equities. and one for,fixed income securi-l
ties, both of which are among the largest of. theirtype in the securities industry. Both of those
28
departments a'e active in evaluating securities of
RG&E, and in offering advice to clients with 'regard
~~
01
02
03
05
06
07
08
09
10
12
18
20
22
26/
27
A.
Q.
A.
to these se'curities.
HAVE YOU,WRITTEN ARTICLES OR DELIVERED SPEEClll;S
RELATED TO YOUR WORK?
I have spoken at the seminars, annual conventions,
and financial conventions of the Fdison Electr icInstitute, the American Gas Association, the Xn-
dependent 'Telephone .Association, the National Asso-
ciation of Regulatory Utility Commissioner s, the
National Consumer Finance Association, the National
Water Company 'Conference, the Pacific Coast Elec-
trical Association, and various other associations.
I have also spoken at seminars and conferences in
London, England; Montreal, Canada; Tokyo, Japan;
'Hamilton, Bermuda; and San Juan, Puerto Rico. Ihave authored articles'hich have appeared in Public
Utilities Fortni htl , and other trade publications,
including one published by the American Gas Associa-
Cion.
DOES PAXNE, WEBBER, JACKSON A CURTIS HAVE ANY DIRECT
RELATIONSHIP WITH RGEcE?
No. The only relationship my firm has had with RGhE
has been as a participant in the under writing of itssecurities for offering to the public, and as an
owner of its securities.WHAT IS THE PURPOSE OF YOUR 'TESTIMONY XN THIS
PROCEEDXNG?
RGKE has asked me to explain the nature and use ofsecurity ratings'nd to state my views with respect

01
02
03
04
05
06
07
08
09
10
to: RG8 E's financial position, the 'ppropri «teness
of the company's capital stiucture and fixed charge
cover age, the importance to RG&E and its customers
of maintaining at least an "A/A" bond rating, and
the conditions required for RGAE to retain itspresent "A/A" bond rating. In addition, I will
I
express my opinion concerning the appropriateness of
the company's requested return on common equity and
the effect that the requested rate increase willhave on the company's overall financial health.
12 A.
WHAT IS THE PURPOSE OF BOND RATINGS?l
Bond ratings are intended to be an indication of the
relative degree of probability of payment of in-
16
~ 18
19
20
21
22
23
24
.25
26
27
28
terest and principal on time. Please note. an
important requisite in the definition is the phrase
"on time". The quality of a company's bond ratingdepends heavily on its 'ability to perform itsobligations. in full when required. Under the
quality rating system used by Standard 8 Poor's,interest-.paying bonds are given one of eight ratings,
fA
ranging from "AAA" through !'CCC". . Bonds on whicht
interest is not being paid are given one of fourratings, ranging fr om "C" through "D". Ratings
by Moody's Investors Service, Inc. are, ver y similarto those given by Standard 5 Poor's. Exhibit HRF
No. 1 which is entitled "Key tq Moody's Bond Rat-
ings," describes in a nutshell the characteris-ties of bonds with various ratings from Moody's.

,
0
Ph(il 9
0?
03
04
05
06
07
08
09
10
12
~ 13
14
15
16
17
18
19
20
21
22
23
25
26
pp
28
Q ~
Again, the guidelines used by Standard & Poor's are
quite similar .
MHAT UTXLIZATXON XS MADE OF SUCH RATINGS BY THI;
FINANCIAL COMMUNXTY?
Ratings are a designation which immediately relates
to the investor and to other members of the finan-
cial community the quality of the debt instrument
being bought or sold and, therefore, the interestrate on the instrument.
DO RATXNGS SERVE AS THE LEGAL BASXS FOR XNVESTMENTS
BX XNSTXTUTXONS XN SOME STATES?
Yes, most fiduciary type institutions have specificlegal requirements on the type of investments they
may hold. Generally commmercial banks, when buying
securities'for their trust accounts, are not al'lowed
to buy anything rated lower than "BBB". Xn addition,most institutions have their own guidelines for the
quality of securities they are willing to own.
Xnvestors today are much more sophisticated than inthe past. In today's credit conscious world, 'in-
dividuals and professionals are more and more raisingthe minimum levels of risk they are willing toaccept. Hence, the lower the quality of the secur-
ity, the smaller the potential mar ket for thatpar t icular security. This becomes an especiallyacute problem for issuer s needing substantialamounts of capital. The lower thc quality, thcsmall'er the potential market, and thus, the
01
02
03
04
05
06
07
08
09
10
11
12.
14
15
16
17
18
19
20
22
23
24
26
27
28
Q ~
Q ~
higher the pr ice that particular is: ucr (borr ower)
must pay to attract the quantity of money r equircd.
As the bond rating declines, the number of potential
investors becomes limited. In adverse markets, a
company with a low rating may be unable to raiseI
money on any reasonable basis.
ARE RATINGS MORE IMPORTANT TO UTXLITIES THAN MOST
NONREGULATED COMPANXES?
Yes, ratings are extremely impor tant to companies
who are capital intensive and require fr equent
visits to the capital markets. In addition, public
utilities face an even larger problem. They have a
responsibility to expand to meet the growing needs
of t',he public whet;her or not. it i's in the company's
best interests. On many occasions during the lastdecade, public utilties have been forced to go to
the market to raise large sums of capital when itmay have been advantageous to stop construction and
~avoid borrowing. They wer'e not free to follow.
options available to nonutility companies. These
situations tend to occur just; at a time when our
capital markets may be in complete disarray.I
I
Furthermot e, these periods not only seem to comeI
more frequently but also are lasting longer than
they did in previous years.
WHAT "XS THE VALUE TO A UTXLITY IN MAINTAINING A
HXGH SECURITY RATING?

i
0
02
03
04
05
06
07
08
09
10
12
~13
.14
15
16
17
18
19
20
21
23
A ~ First of all, it afford.. the utility the oppor tunity
of obtaining a lower cost of money. The financing
cost differential between strong and weak credits
has become greater in recent years than in the past
and it appears that this situation will be with us
for the foreseeable future.
Secondly, a high rating af for ds the utility greater
availability of capital which in turn incr eases the
company's financial flexibility. There is a great
deal of competition 'for investment capital. The
utilities in New York, for .instance, must compete
with the utilities in every other state and with any
other potential users of the capital markets. This
includes the Federal government, one of the largest
competitors for capital in recent years. The
stronger a company's credit, the more people are
willing to purchase and own that company's securi-
ties. Xt is as simple as that. The companies with
the strongest credit standings have the most chan-
nels of capital open to them when they need it. A
third advantage of 'a high credit rating is the
superior position of the company in negotiating the
terms of an offering. The stronger the credit, the
26
28
less onerous are the terms lenders usually require
attached to such financings. I have seen low-rated
companies forced into accepting short bond maturity
periods because investors- were unwilling to risklong-term,funds, on their securities. I have also,

4
01
02
03
00
05
06
07
08
09
10
12
13
14
16
17
18
19
20
21
22
23
Q ~
A.
witnessed low-rated companies able'o market pre-
ferred stock only with the most stringent sinkingfund provisions.
ARE THERE ANY REASONS MHY RG&E SHOULD STRIVE
'TO MAINTAIN AT LEAST AN "A/A" BOND RATING?
First of all, RG&:E will face a difficult problem inthe total volume of money it will have to raiseexternally to pr ovide the 'quantity and the qualityof services required by its customers. Secondly,
RG&:E also faces a complicated problem known as
"market saturation." Most major bond portfolios inthe country contain some of RG&:E's securities.These investors have both legal and self-imposedrequirements to diversify and maintain the qualityof their portfolios. Any further lowering of the
R
company's credit rating will lessen the likelihoodthat these institutions will purchase additionalRGhE securities. Also, as I mentioned previously,there is a trend of increasing credit consciousness
by all investors. Only a few years ago "BB" and
"BBB" rated companies could. easily borrow largeamounts of money for long periods of time withrelative ease and with very little differential in
25
26
27
28
cost. More and more, these issuers, ho~ever, ar e
being excluded from the mar ketplace. Today, to have
adequate capital-attracting capability and theminimum finane ial f le xi bi 1 ity which I con.".i dernecessary, a company must have a strong credit
01
02
03
04
05
06
07
08,
09
10
Q ~
A.
WHAT FACTORS ARE TAKEN INTO CONSIDEHATION BY AN
AGENCY WHEN RATING A UTILITY?
Rating securities will never be a precise science.
Ther e are simply too many var iables to be con-
sidered. The rating agencies ar e called upon, to
judge a tremendous variety and combination ofbusinesses. Xf they were to attempt to derive a
formula applicable to just one business, we know
from experience that exceptions would destroy .the
rule.
12
13
15
16
17
18
19
20
21
22
23
24
25
26
27
28
Q.
There are., however, five important factors con-
sidered in establishing ratings. Xt is important torecognize which ones have an impact'n regulationand which ones regulation impacts. These fiveimportant factors are:
l. Issuing documents
2. Earnings
3. Asset protection4. Management
5. Financial resources
PLEASE DESCRIBE THE XMPORTANCE OF XSSUXNG DOCUMENTS.
Of the various documents which a'ccompany the is-suance of bonds, the trust indenture is usually the
basic legal document that spells out the contractbetween the issuer and the bondholder . As a con-
tract, it is examined as to both the nature ofthe covenants agreed to and'he remedies provided
for lack .of compliance. The stan'dard provisions

A'
01
02
03
04
05
06
07
08
09
10
12
13
15
16'7
18
Q.
looked for include provisions for and.the protection
against issuing additional bonds with the same
security, the property liens which may be provided,
and the flow of funds. Of particular interest,so far as liquidity is concerned, ar e the r equire-
ments imposed upon the issuer to deposit funds in
the interest payment account and in the sinking fund
or property fund accounts, and the penalties imposed
if such 'payments are not met.'stablishing the
machinery which will become operative in the event
of a default is the purpose of the indenture.
In determining a rating, the indenture is far lessr
important than 0he other four factors being con-
sidered . This is. not to say, however, that .the
indenture does not have a great bearing on bond
ratings.PLEASE DISCUSS THE SECOND IMPORTANT FACTOR, WHICH IS
EARNINGS.
19
20
21
22
23'4
25
26
27
28
The. past earnings record and foreseeable potential
is, in most cases, the single most important factor
in credit 'rating. High levels of earnings. fre-quently preclude liquidity problems, because short-
term cash needs can be more readily accommodated.
Remember, that a bond rating attempts to quantify'he
liklihood of timely payment of pr incipal and in-r
.terest. Str ong cash flows generated by high and
continuing earnings, combined with an adcquatc
depreciation policy and tax normalization, contri-r
I

n,
01
02
03
04
05
06
07
08
09
10
bute a healthy positive factor to - the: determination
of a bond rating.In order to project earnings power, a rating agency
examines all the factors that can affect the com-
pany's ability to generate earnings. These factors
include the industry the company is in and itsfinancial position. The cost of" the product,
k
research and .development, its pricing policies, itstax practices and any of the myriad of influenceq on
profits. Two very important factors considered for
12
13
14
17
18
19
20
21
22
23
24
25
26
~ .
28
a utility company such as RGE E are the level ofAFUDC included in earnings and the extent to which
it normalizes tax defer rais.It is obvious that for utilities regulation has a
very important impact on this fundamental criterionof credit worthiness.. One fact that is rar elybrought out, however, is the im'portance of con-
sistency and certainty of earnings. This is true
not orlly for the individual company, involved. Itcan impact the credit rating, investors'pinionand, in turn, the cost of capital for all of the
utilities regulated by a particular commission or
board. A negative impression of the regulatoryclimate, as it pertains to one company, as perceived
by analysts and investors, whether correct or not,
can have .an adverse .impact on the cost of capital ofall of the utilties oper ating within the juridiction of that particular regulator y body. For
~ ~
*
01
02
03
04
05
06
07
08
09
10
12 Q.
exÃmple, investors opinion of the Alabama regulatoryenvironement is such that despite a recent 56$
improvement in coverages between 1976 and 1977
('over ages r ose from" l . 25x to l.95x) Alabama Power
Co. in its March 1978 bond financing was required to
pay 9.50$ nearly 20-30 basis points more than the
typical yield on "Baa/BBB" electric utility bonds
during this period. Investors'erception ofregulation and the regulatory body's willingness tor
grant, timely and adequate r ate r elief have become
extremely 'impor tant in a company's earnings outlook.MR. FRASER, HOW IS ASSET PROTECTION IMPORTANT IN
DETERMINING CREDIT RATINGS?
15
16
17
18
20
21
22
'3
25
'26
028
Q.
A.
Asset protection generally. is more important as a
long-term consideration. The analysis is primarilystatistical and, hence, highly objective. Of
primary interest are: 1) the ratio of the company's
current and proposed debt to net plant assets; 2)
the ratio of working capital to debt; 3) the ratioof debt to total capitalization; and 4) the ratio oftotal net tangible assets to debt. The relativeimportance of these major ratios varies depending on
the type of industry involved. They are relativelyunimportant, for example, in a publishing company,
but are quite important in a heavy industrial firmand, of course, a utility.HOW DOES MANAGEMENT AFFECT A COMPANY'S BOND RATING?
Busines'ses are run by people and certainly the

bi
IJ
01
O2
03
04
05
06
07
08
09
10
12
13
management of a company cnn have a gr eat influence
on 'ts debt rating.. Management's demon"1.r«ted
ability, perception, planning, and the execution of
its. plans are all parts of the evaluation. Of
particular relevance to 0he company's ability to
maintain liquidity is management's aw'areness of itsresponsibility to meet its obligations on time.
Equally important is management's ability to conduct
the company's business„ so as to always be ip a
position of having the necessary reserves to callupon.
Evaluating management is one of the most difficultchores a rating agency faces, but it is also one of
Q.
the most important facets of a successful operation.
PLEASE DISCUSS THE FIFTH FACTOR, WHICH IS FINANCIAL
17
18
19
20
21
22
23
RESOURCES.~ I
A. Financial resources are, of course, the largestsingle determinant of liquidity and have a directimpact on long-term debt ratings. Xn looking at the
financial. resources of a company, one is concerned
not only with a company's cash position but also itsability to obtain cash as well as its cash require-ments. Mhen a company has several options to obtain
cash at its disposal, it is less likely to be forced
into accepting unreasonable credit terms or paying26
27
28
Q ~
unusually high costs of money.
ktOULD YOU RELATE THESE FIVL FACTORS SPECIFICALLY TO
THE ELECTRIC UTILITY INDUSTRY? „

Wi~W
0
a
el
C
01
02
03
0li
05
06
07
08
09
10
12
13
15
16
17
18
19
20
21
22
23
25
26
28
A ~ F, ~r the sake of simplicity', I will use a wagon wheel
Like the. hub of a wheel, th'f. or „illustration.I'llcart or focal point of any company is its manage-
m ent. Xt is impor tant to r ealize that with the
b; illions of dollars the electric utility industr y
h-as invested in plant, it is still a business
c'llasses is important; Also considered is the growth
irn demand for electricity by customers. Customer
r~lations and public image are considerations. Any
iraformation indicating. the quality of service is.i~aportant - customer complaints, reliability ofs>stem, etc. Efficiency of operations as measued by
s„;"atistical indices are also important., These
irsdices include oper ating r atios; employees per
1,000 customers, etc. The co'mpany's maintenance
s ';andards are important considerations. Such
qzikestions as whether management, is postponing
myintenance to sustain profits must be resolved.A,ccounting practices are also considered — flow-
t ->r ough versus normalization, depreciation pr ac-
t'ai.ces,
ctc. Finally, the adequacy of the company's
fyci'lities„ and any competitive features 'f its
c~onducted by„ people and without good management,
~ t .his industry, or any given company, has no future.
Thhe spokes of the wheel include several factors:(l) The type of company, its operations and
'«uality of service. The mix of the company business
b tween residential, commercial, and industrial

~ '
} p ~ ~ 'S~ Wl'
PA(iE i 9
N
II
i01
02
03
04
05
06
07
08
~ 09
10
13
14
'5->6
17
18
19
20
21
22
23
24
25
P7
28
business are examined.
(2). A second spoke of the wheel is the company's
territory and its economy. What are the advantages
and disadvantages of its geogr aphic location?Customer density is a consideration and whether
customers are largely rural or urban. Other factors
include economic and population growth 'ates,political atmosphere, and economic mix.
(3) A third spoke is the company's construction
program. Considerations here are the company's
accui acy in forecasting expenditures,'he quality ofplanning, and the timing and position of the pro-
, gram. Environmental considerations and planning by
the company. are very important too.
(4) Another spoke of the wheel is the company's
P'apitalization and financing requir ements. A
company with a conservative capital 'structure, nott
,'heavily weighted with debt, is" a plus. Future
, capital needs are considered along with a projectionof the percentage of these needs that can- be gene-
rated internally. Any co'ntingent liabilities are
,considered, along with the extent of dependence on
short-term debt.
(5) The fifth spoke would be a detailed, analysisI
of'he utility's fuel program. .Is sufficient fuelavailable? How .much will it cost?
(-6) Onc of the mor e impor tant areas is regu-t
I'ation.Is there an adequate dcgr'ec of communi-

,l
,'"z» ~
I~
~ H
PhGI 20
01
02
03
04
05
06
07
08
09
10
12
13
'cation between companies, regulators and consumers?
Do regulators understand the company's needs?
Provisions in the r egulatory pr ocess which reduce
regulatory lag are favorable.
(7) Another spoke of the wheel is the indenture
itself. As I have already discussed, the indenture
contains the terms whereby investors are protected
from default.. Of course there are other spokes, but these are the
areas of primary concern.
The rim of the wheel represents the company's
financial results. Therefore, a statistical approach
rounds out the analysis. The quantity of statis-
15
tical protection required, and by statisticalprotection we are referring to fixed charge cover-
17
18
19
20
21
22
23
24
25
~ 26
28
ages, debt ratio, internal cash generation as a
percent of construction expenditures, etc., however,
for each company to retain any given rating willvary depending on the str engths and/or weaknesses of
the numerous spokes.
Mhen looking at statistical. pr otection, the ratingagencies concern themselves with two types: earnings
I
protection, which is basically fixed charge cover-
age, and asset protection. Naturally, it is appro-
priate to have a balance between. the two. Strong
asset protection allows analysts time to look beyond
a temporary decline in'arnings to when a companyP
might r ecover . Mhich area of pr otection is morel

N'
02
03
04
05
06
07
08
09
10
12
.13
4t15
16
17
18
19
20
21
22
23
24
25
Q.
A.
Q.
Q.
important? A low debt ratio is good, 'but where1
assets are earning little or nothing, how secure is
debt service? Therefore, earnings must be the
pnimary key.
MHY XS QUALITY OF SERVICE AT REASONABLE COST PART OF
YOUR WAGON WHEEL ANALYSIS?
It is my opinion that a utility that p'rovides good
service at a reasonable cost to the consumer is more
likely to obtain reasonable and adequate rate reliefwhen
required.'HAT
XS THE WEIGHT GIVEN TO EARNINGS XN ASSESSXNG
THE QUALXTY OF A UTXLXTY SECURITY?
Xn my opinion, a utility's earnings record (not only
growth but consistency and quality) is the most
'„important measurement of the quality of a utility'ssecurities, whether it be bonds, preferred stock or
common stock. ' emphasize "recor d" — not only
historical record, but also the probable prospective
record. It is not the spot earnings, even ifadequate, that count in assessing the quality of a
utility's securities. Xt must be demonstrated that
a company can maintain or improve such earnings
over a reasonable future period.
MOULD YOU COMMENT ON THE SXGNXFXCANCE ASSIGNED FIXED
CHARGE COVERAGE BY A RATING AGENCY?
As I have stated, one of the most important factor"
in rating utility securit'ies is thc company's
earnings record. Even more important, in my view,

* \ ~ I
1'AGE 22
01
02
03
04
05
06
07
08
09
10
12.
13
~ 14
15
16 ~
17
18
20
21
22
23
25'6
28
Q.
A."
Q ~
is what could be described as earnings protection.
The most frequently used measurement of earnings
protection is fixed charge cover age or times in-terest earned. While other factors are also im-
'portant, no other number or" ratio has more impact on
a utility's credit rating, or its ability to attractcapital in the marketplace, than its record and
future potential of fixed charge coverage.
IS XT CONCEXVABLE RG&E COULD ISSUE DEBT DESPITE A
DROP XN COVERAGES BELOW THE 2.00 MXNXMUUM COVERAGES
AND IF SO HOM MOULD THXS EFFECT RG&E?
It is possible for RG&E to issue debt with cover-
ages in the 1.7x range. However, it should be
made clear that with cover age protection at suchlow'evels
the cost of debt'inancing will be very high
as investor perception of credit protection will be
at a low level.HOW'O RATXNG AGENCIES AND OTHER CREDXT ANALYSTS
VIEW XNCLUSXON OF CONSTRUCTXON WORK XN PROGRESS XN
THE RATE BASE?
Rating agencies and credit analysts consider theinclusion of construction work in progress in the
'ate
base as a favorable indication that the regu-
lators understand the problem of cash flow and how a
difficiency in cash flow eats away at .the company's
financial strength, flexibility and its viabilityI
over the longer term. While thc capitalization of.interest on funds used during construction is a
Ph(il'. 2 3
01
oz
03
04
05
06
07
08
09
10
per fectly le gi t isa te account. ing pr inc i pl e, i tcreates non-cash earnings which are lar gely ignored
in terms of fixed char ge cover age. In measur ing\
financial safety for the prospective purchaser, we
continue'to emphasize earnings rather than asset
protection. In fact, there are two r atios that both
analysts and rating agencies and other sectors use
to measur e the adequacy of cash flow and cash
earnings. These are the calculations of fixedchar ge coverage excluding AFUDC and the calculationof internally retained and gener ated funds as a
percentage of capital expenditures.
13
14
15
16
18
19
20
21
23
Q ~
Q.
WOULD YOU DESCRIBE EXHIBITS HRF NO. 3A AND 3B?
This exhibit lists four key statistical measurements
of credit worthiness. These ratios are considered
prime tools utilized by credit analysts for measur-
ing debt protection risks. The exhibit gives the
year end rate of return on common'quity, the
percent of capital expenditures financed. externally,the embedded cost of debt, and -fixed charge coverage
for each of the years.
HOW DO THOSE FACTORS YOU,JUST OUTLXNED RELATE TO THE
DOWNGRADXNGS OF ELECTRXC UTILITY COMPANIES XN RECENT
YEARS?
25
26
A. The: downgrading of electr ic utility companies and
many other types of utility companies has occurredl
as a result of 'he industry. being faced with a host
of adverse, fundamental factor s. These included
I'h(if;
2'.
01
02
03
04
05
06
07
08
09
10
12
13
16
17
18
20
21
22
23
2ll
26
27
A.
r apidly expanding construction expenditures due to
rising power requirements of their customers, the
histor ically high level of inflation and required
environmental control equipment; increasing external
financing requirements; the rising level of interest
expense and the increasing embedded cost of debt;
skyrocketing operating and maintenance costs; plus
the inability to offset these rising expenses with
adequate rate relief in a timely manner.
These factors 'dversely affected this industry to
a point wher e the aver age rate of return on t;he
capital employed fell below any reasonable level,and many companies were pushed into nonviable
financial positions which seriously handicapped
their ability to attract permanent capital. The
financial results of the ut;ility industry on a
statistical basis appear on Exhibit HRF No. 3B.
These are composite figures for the industry. As in
t;he case of all averages, some companies earn below
and some companies earn substanti:ally above the
particular figure given, but, I believe this com-
posite clearly shows the basic problem from 1970-
1976.
MOULD YOU DESCRIBE EXHIBIT HRF NO.. 2~
Exhibit No. 2 lists a group of high grade electricutilities which have experienced consecutive down-
l
gradings over a relatively short pcr iod of time. In
this study, «e recor ded the internal cash generation
01
o~
.03
04
05'
06
07
08
. 09
10
12.
13
15
16
18
.19
20
21
, '23
24
25
26
, A.
Q.
.A.
as a percent of the total construction program ,just
prior to and during the actual time of downgrading.
HOM DOES RG&E COMP'ARE MXTH THE INDUSTRY AVERAGES
SHOMN IN EXHXBIT HRF NO. 3B?
During the 1970-76 period RG8 E's coverages under—
per formed the industry in each year except l973 and
l975 (in the latter year the differential was.
immaterial}. The industr y's return on equity during
this seven year period averaged 10.8$ while RGEE's
realized return averaged only 9.84$ (See Exhibit HRF
t 3a & 3b). Comparison of Exhibits HRF /$ 3a and 3b
also reveals the fact that while the industry'sexternal financing needs have declined moderately,
RGAE's external financing requirements have in-creased dramatically and are expected to remain at
these higher levels'or the foreseeable future.In order to achieve and maintain an acceptable
level of financial integrity and reasonable finan-cial flexibility, RG5E over the next few year s must
maintain an above average track record relative to
the industry.HASN'T RGRE HXSTORXCAI LX ALMAXS BEEN ABLE TO FINANCE
ITS CONST RUCTXON P ROG RAM?
~ Xes, however, during the 1978-82 period thc company
will be spending more than double the approximate
$ 350 million spent in the 1973-77 period. Further—
more, ROLE's internal generation; of cash as a
percent of expenditures will decline from 44.2$ - to

1 ~ ~
I
~ ~ ~
~ ~
~ ~ ~ ~
~ ~ ~ ~ ~
I ~
II ~ ~ ~ ~ I ~
~ ~ ~ ~ ~ I ~ ~ ~ ~ ~ ~ ~ ~
~ ~
~ ~
~ ~ ~ ~ 0
'I ~ I ~
~ I
~ ~ ~ I ~
~ ~ ~ ~ ~ ~ ~ I I I I
~ I ~ ~ ~ ~
~~
~ ) ~ ( ~ ~ I ~ ~~
~ ~ ~ ~ ~ 1 ~ ~
~ ~ ~
~ I ~ ~

t
II
I
01
02
03
05
06
07
08
09
10
11
12
13
15
16
17
18
19
. 20
21
22
23
25
26
27
Q ~
equity ratio i" well above the average. Analysts
and investors view this capital structure as favor-
able because it allows some flexibility in the event
that market conditions deteriorate.HOW WOULD THE PROJECTED INCREASE XN EXTERNAL
FINANCING DURING - THE l978-82 PERIOD AFFECT RG&E'S
FINANCIAL FLEXIBILITY AND XTS "A/A" CREDXT
RATING?
During the 1973-77 period RG&E depended on external
financing for 55.8$ of its capital requirements and
according to its current projections this dependence
is expected to increased to 69.8g for the 1978-82
period.'t this projected level, RG&E will have
little, if any, financial flexibility. In fact; itis questionable whether the construction program,
assuming no improvement in financial parameters, can
be financed. In other words, without immediate and
adequate rate relief, RG&E s financial integrity isin serious question. With the required increased
visits to the capital markets, the pressures of an
even higher external financing program will not go
unnoticed by either the market place or the ratingagencies.
It should be noted here that even if future external
financings were maintained at the 55.8$ level, the
absolute dollar amount of external financings would
incr ease materially'ecause of the higher base offunds required. Therefore, the increase to the

,l
~ ~ ~ I ~ ~
~ I ~ I ~~
~ ~ ~ ~
~ ~
~ ~ ~ I
~ ~ I
~ ~
~ ~
~ I ~ ~
~ ~ I ~
~ ~~ ~~ ~ ~
~ ~
~ ~ ~
~ ~ ~
~ ~
~ ~ ~ ~
~ ~ ~
~ ~
~ ~ ~

I'A(>E ? 9
01
0~
03
oil
05
06
07
08
09
10
13
1>l
15
16
17
19
20
21
22
2L)1
p5
26
~ .
A.
A.
Q.
enabling the company to earn mor e and provide
stronger financial parameter from both an equity and
credit analysis standpoint.
IS IT IMPORTANT THAT COMPANIES, SUCH AS RGAE,
MAINTAIN A HXGH LEVEL OF INTERNALLY GENERATED
RETAXNED EARNXNGS?
Yes, no matter what quality, credit rating a borrower
carr ies, the more frequent ly t his issuer visits the
marketplace, the more expensive the borrower's funds
become. Even'he United States Government has to
pay mor e for its money as the owner ship of itssecurities pr oliferates in the mar ketplace. Hence,
if ther e can be a reasonable balance between in-tevnally and externally generated funds, the funds
required from externally financing will cost less.
In fact, it is no coincidence that many high grade
electric utility companies, which have experienced
consecutive downgradings over recent years, allexhibited inadequate levels of cash flow at the time
of downgrading, (See Exhibit HRF 8 2).WERE YOU XNVOLVED XN THE DOWNGRADINGS OF ELECTRIC
UTXLXTXES IN RECENT YEARS BY STANDARD K POOR'S?
Yes. I was involved in downgrading from 1968 to the
fall of 1975. All of those unfortunate but neces-
sary downgradings of electric utilities weve
pvimar ily my responsibility.HAVE YOU ANALYZED RGaE S FXNANCXAl. POSITION AND
EVALUATED ITS C RED XT WO RTH XNESS?
I'AG I'.:30
01
02
03
04
05
06
07
08
. 09
10
A ~
Q.
Ye" I have.
WllAT DATA DID YOU EXAMINE AND WHAT FACTORS DIl) YOU
CONSIDER?
In evaluating any electric utility company, we
typically review the last five years'inancials.If there is a ser ious question of deter ioration, we
discuss with the company its current and future
financial position. In arriving at our conclusion
concerning. RG&E, we considered many factors, as Ihave discussed in describing the credit analysis
process. These include capital and .financing12.
~ 13
14
15
16
17
18
19
" 20
21
22
23
24
25
27
Q ~
requirements, the need for rate relief, the level of
earnings, the interest charge coverage, the capital'- structure, the embedded cost of debt, the financial
flexibility of the company, the ability of the
company to obtain capital, the percent of capital
the company will be generating internally, the
quality of service, the company's future objectives,
and whether their objectives appeared realistic and
attainable.WHAT CONCLUSIONS ABOUT RG&E'S CREDIT WORTHINESS HAVE
YOU REACH AT THIS TIME?
Without substantial r ate relief, RG&E's credit
position will continue to deter ior ate. Inter est
coverage for the 12 months ended December 31, 1977
has deteriorated to 2.00x (.before taxes) and headed
south.„ In view of the company 's pending bur densome
financial r equirements and the fact the company's

0
01
02
03
04
05
06
07
08
09
10
mediocre "Baa/BBB" at best. Furthermore, itspr esent "A" bond r ating is in per il of an almost
by both rating agencies.
Also, I believe, without immediate and decisiveimmediate downgrading
action on the part of the New York Public Service
Commission, affording RGLE substantial r ate reliefover the next few years, RGEE's credit position willcontinue to deteriorate to the point that our
credit position has been considerably weal<encd in0
recent years, in my opinion it is no mor e than
a'2
13
15
16
17
18
19
20
21
22
24
25
.~ 26)
27
28
Q.
A.
capital markets under less favorable conditions
will undoubtedly close their doors.
ONCE DOMNRATED, MHAT IS YOUR OPINION AS TO THE
ACTION REQUXRED BY A COMPANY TO REGAIN ITS FORMER
RATXNG AND THE PERIOD OF TIME INVOLVED?
It is my opinion that once a major utility company
has been downrated, a very substantial period oftime is required for that company to regain itsrating. Furthermore, dur ing that period of time the
company's rate of return on invested capital and
fixed charge covera'ge must improve to the pointwhere they more than justify the rating category to
be .regained. The rating agencies need to be con-
vinced that the impr ovement is not transitory innature. Establishing such improvements necessitates
massive rate relief.Downrating is not only expen.,ivc a.", far as time is
concerned, but expensive when it comes to rate of
01 return and to the consumer. Once lost, thc rating
0„'
it
05
06
07
08
09
10
12
13
15
16
17
18
19
20
21
Q.
agency usually wants to see'. coverage 0.25 tim».', to
0.50 times in excess of the minimum, so that the.y
will feel reassured that the company will not be
facing a possible downgrading again in a relativelyshort period of time. One of the problems a rating
agency faces is maintaining consistency. Therefore,
just as they are very slow to react and downgrade a
company, making sure the downgrading is justifiable,when raising the rating, they likewise want to make
sure that the company will be able to maintain that
rating in good standing for some time to come so as
to avoid the embarrassment of again reducing it.Rapidly changing ratings do not benefit the con-
sumer, issuer; investor, or the rating agency.
HAVING EXPERXENCED A'OHNRATING, WHAT XS A COMPANY'S
ABILITY TO FORESTALL A FURTHER DONNRATING AND
DETERXORATION OF CREDIT?
Xt is difficult to avoid a further deterioration incredit rabing after an initial downgrading. In my
opinion, based in part on mor e than nine years
22
23
24
25
~ 26
27
28
experience at Standard 8 Poor's, credit deteriora-
tion is much like a snowball gathering momentum as
~ it goes downhill. Once set in motion, it is ex-
tremely difficult to halt and even mor e difficultand expensive to- rever'se. For example, for a
company to maintain the same .level of fixed charg»
coverage wh'en it is continuously paying anywherei

. 01
02
03
04
05
06
07
08
09
10
12
13
from 50 to 100 basis points mor e for i ts fixed rate
capital it'must earn these increased charges by thc
same number of times as in the r ecent past to
maintain even the new lower cr edit r ating. There-
fore, it has a multiplier effect on the increased
cost to the company. If these increased costs are
not r eflected in the uti.lity's r ates in a timelyfashion, which many times happens, then the creditcontinues to deteriorate and further downgrading islikely. For example', if RGE E or any other electricutility has embedded interest expense of $ 12 millionannually, it would take pretax ( pr e-interest)income of $ 36 million annually to produce three
times coverage on the outstanding gl80 million of
16
17
18
19
20
21
23
24
25
26
27
28
long-term debt. For this example, assume the lastissue sold was $ /0 million at 9$ for an annual
interest expense of 42.7 million which is included
in the $12 million of total interest expense. If,however, because of a downgrading of its credit
1
rating, this issue was sold at a 10$ interest rate,the total interest expense for the company would
then be raised by approximately $ /00,000 each year.
The impact on the r equired net'ncome, however;.
befog e inter est and taxes, to maintain 'hree times
coverage would be $ 900,000. Because 'this is on a
pretax basis, it would likewise require an ad-
ditional $ 900,000 of revenue each year. I'Jea."c
nemember this is just one yea'r and only onc issue.

I
+'
01
02
03
0!)
05
06
07
08
'09
10
Assuming this issue at a 30-year rate, then the
consumer would he required to pay $ 27 million more
over the life of the $ 30 million bond issue. Or>e
can imagine how expensive this can become for the
consumer if such a company continues to see addi-
tional issues. Naturally, this does not take into't
consider ation the cost of improving coverage to 3.5
times or 4 times which would be the minimum required
for the company to regain its p'revious creditrating. Fur thermore, if the company does not
12.
13
receive the additional revenue r equir ed to maintain
the 3 times coverage, then the company's cover age
continues to deteriorate as does its overall credit14 worthiness.
15
16
'17
18
19
20
21
22
23
24
25
26
27

1
II
I
I '0