![u[sonic] Modbus - Lambrecht meteo](https://static.fdokumen.com/doc/165x107/6334bd04a6138719eb0b33dc/usonic-modbus-lambrecht-meteo.jpg)
New Sonic Technology as an Aid in Formation Evaluation and ...
13
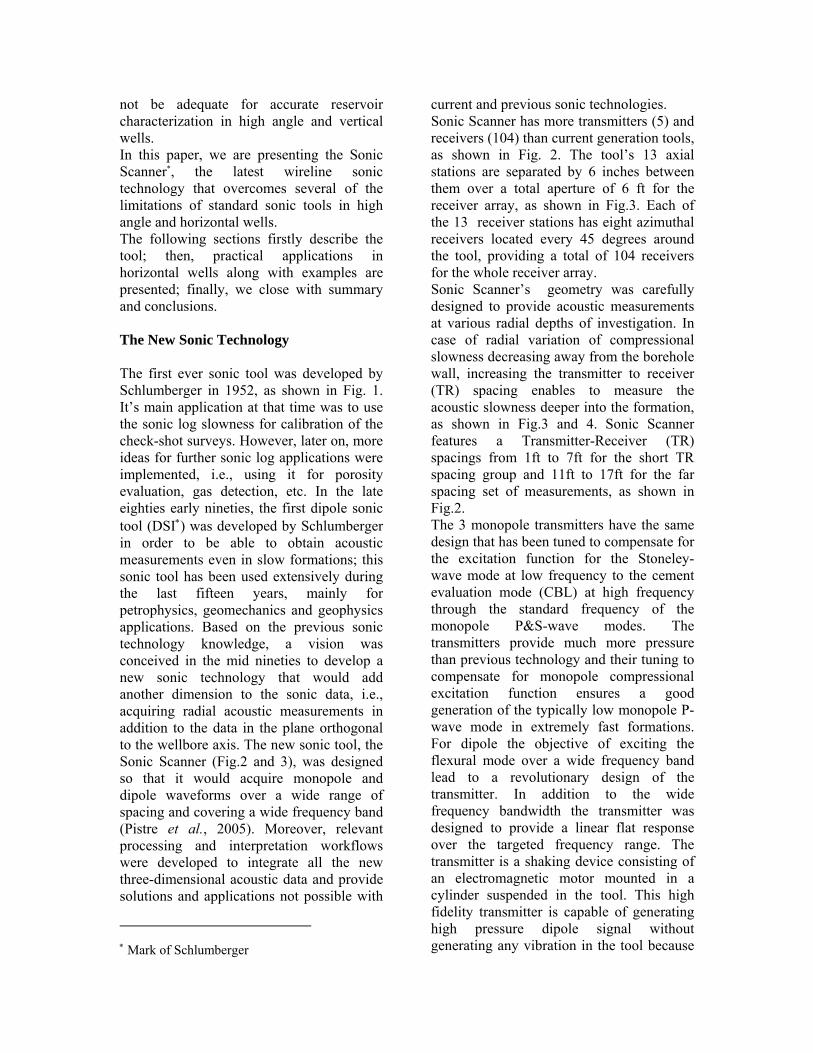
New Sonic Technology as an Aid in Formation Evaluation and Completion Optimization of High Angle and Horizontal wells T.Klimentos, Schlumberger Copyright 2007, held jointly by the Society of Petrophysicists and Well LogAnalysts (SPWLA) and the submitting authors. This paper was prepared for presentation at the SPWLA Symposium held in Mumbai, India, March 19-20, 2007. Abstract During the last two decades years, the number of horizontal wells drilled annually worldwide has increased dramatically. While the drilling technology has advanced to the point where high angle and horizontal wells have become routine, the development of horizontal well formation evaluation and log interpretation has lagged behind the drilling technology. Till to date, in many ways the vertical well interpretation practices predominate. Moreover, horizontal wells are more sensitive to formation damage induced by drilling fluids. This is attributed to the fact that in horizontal wells, the reservoir formations are in contact with the drilling fluids for long period of time and there are generally long intervals which are difficult to clean up. Unlike in vertical wells, damage encountered in horizontal wells, usually completed as open hole, can not be bypassed by perforation. Therefore, formation damage evaluation in horizontal wells for an optimum completion strategy may be considered as one of the main tasks in any field development. In this paper we are presenting practical applications of the latest wireline sonic technology that overcomes several of the limitations of standard sonic tools in high angle and horizontal wells. It acquires simultaneous radial measurements, in true 3D, and at multiple depths of investigation, to help us better understand and characterize the reservoirs. We will start with the main application of sonic imaging in horizontal wells, which allows us to see important reservoir features( boundaries, faults, etc) tens of feet away from the borehole. A second important new sonic technology application in HA/HZ wells is the ability to derive the formations’ elastic anisotropy parameters which can then be used to enhance the processing and interpretation of seismic data. A third sonic application that will be presented is derivation of the formation alteration that can then be used to optimize the completion strategy. Introduction Comparing log responses from nearby vertical wells to responses in high angle and horizontal wells, we often see significant differences, even in the same studied formations. This is true, not only for resistivity measurements, but also for other logs, i.e., nuclear and sonic. Most of the causes for such different log responses are due to the fact that many logging tools were designed for vertical wells with nearly horizontal beds. In high- angle to horizontal wells, our interpretation models should be modified to account for 1) formation anisotropic effects on resistivity, acoustic, and nuclear responses, 2) geometry of beds relative to the borehole, 3) circumferential direction of the measurement, 4) unusual invasion profiles, and 5) gravity causing eccentering of tools and cuttings bed accumulation on the bottom of the wellbore. Therefore, conventional formation evaluation methods for vertical wells may SPWLA India, 1 st Annual Logging Symposium, March 19-20, 2007
-
Upload
khangminh22 -
Category
Documents
-
view
1 -
download
0
Transcript of New Sonic Technology as an Aid in Formation Evaluation and ...
New Sonic Technology as an Aid in Formation Evaluation and Completion Optimization of
High Angle and Horizontal wells T.Klimentos, Schlumberger Copyright 2007, held jointly by the Society of Petrophysicists and Well LogAnalysts (SPWLA) and the submitting authors. This paper was prepared for presentation at the SPWLA Symposium held in Mumbai, India, March 19-20, 2007.
Abstract During the last two decades years, the number of horizontal wells drilled annually worldwide has increased dramatically. While the drilling technology has advanced to the point where high angle and horizontal wells have become routine, the development of horizontal well formation evaluation and log interpretation has lagged behind the drilling technology. Till to date, in many ways the vertical well interpretation practices predominate. Moreover, horizontal wells are more sensitive to formation damage induced by drilling fluids. This is attributed to the fact that in horizontal wells, the reservoir formations are in contact with the drilling fluids for long period of time and there are generally long intervals which are difficult to clean up. Unlike in vertical wells, damage encountered in horizontal wells, usually completed as open hole, can not be bypassed by perforation. Therefore, formation damage evaluation in horizontal wells for an optimum completion strategy may be considered as one of the main tasks in any field development. In this paper we are presenting practical applications of the latest wireline sonic technology that overcomes several of the limitations of standard sonic tools in high angle and horizontal wells. It acquires simultaneous radial measurements, in true 3D, and at multiple depths of investigation, to help us better understand and characterize the reservoirs. We will start with the main application of sonic imaging in horizontal wells, which allows us to see important
reservoir features( boundaries, faults, etc) tens of feet away from the borehole. A second important new sonic technology application in HA/HZ wells is the ability to derive the formations’ elastic anisotropy parameters which can then be used to enhance the processing and interpretation of seismic data. A third sonic application that will be presented is derivation of the formation alteration that can then be used to optimize the completion strategy. Introduction Comparing log responses from nearby vertical wells to responses in high angle and horizontal wells, we often see significant differences, even in the same studied formations. This is true, not only for resistivity measurements, but also for other logs, i.e., nuclear and sonic. Most of the causes for such different log responses are due to the fact that many logging tools were designed for vertical wells with nearly horizontal beds. In high-angle to horizontal wells, our interpretation models should be modified to account for
1) formation anisotropic effects on resistivity, acoustic, and nuclear responses,
2) geometry of beds relative to the borehole,
3) circumferential direction of the measurement,
4) unusual invasion profiles, and 5) gravity causing eccentering of tools
and cuttings bed accumulation on the bottom of the wellbore.
Therefore, conventional formation evaluation methods for vertical wells may
SPWLA India, 1st Annual Logging Symposium, March 19-20, 2007
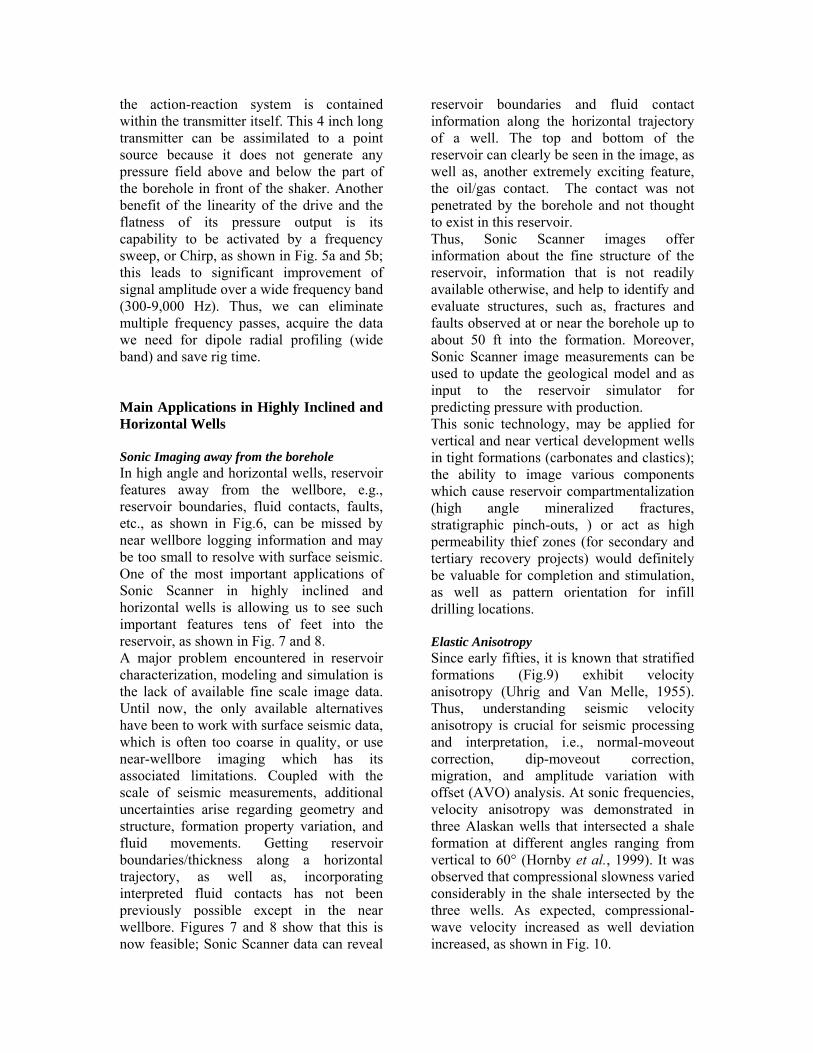
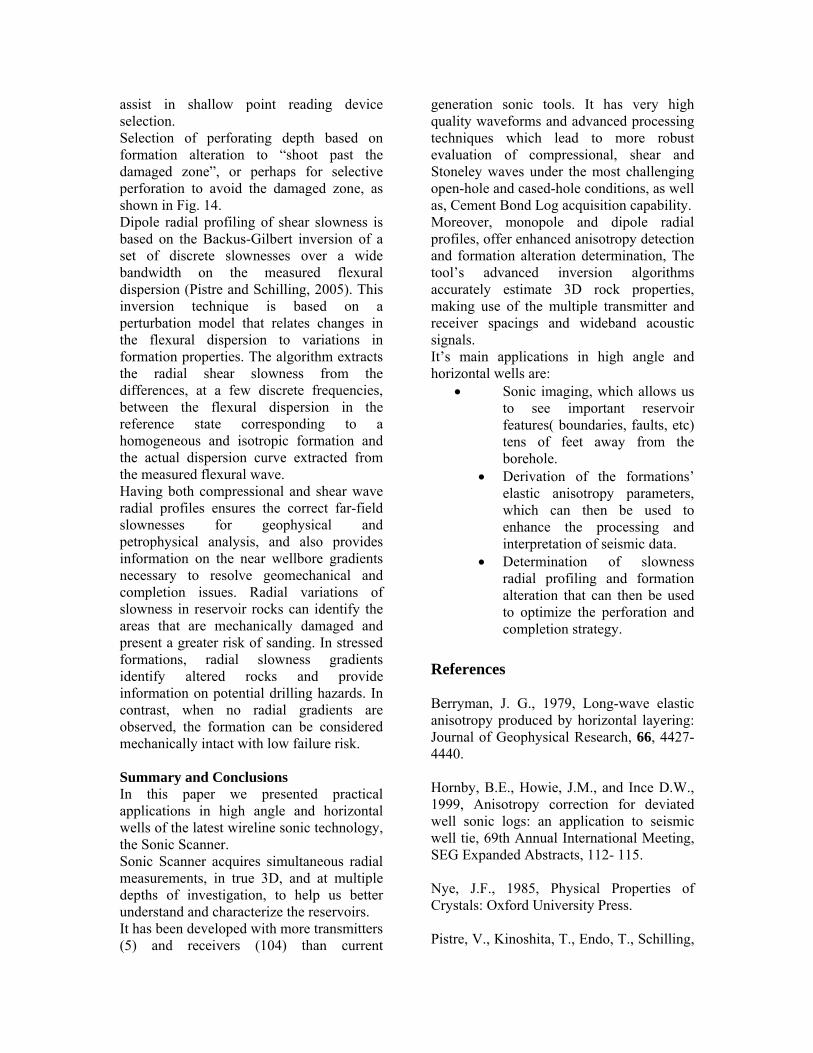
not be adequate for accurate reservoir characterization in high angle and vertical wells. In this paper, we are presenting the Sonic Scanner*, the latest wireline sonic technology that overcomes several of the limitations of standard sonic tools in high angle and horizontal wells. The following sections firstly describe the tool; then, practical applications in horizontal wells along with examples are presented; finally, we close with summary and conclusions. The New Sonic Technology The first ever sonic tool was developed by Schlumberger in 1952, as shown in Fig. 1. It’s main application at that time was to use the sonic log slowness for calibration of the check-shot surveys. However, later on, more ideas for further sonic log applications were implemented, i.e., using it for porosity evaluation, gas detection, etc. In the late eighties early nineties, the first dipole sonic tool (DSI∗) was developed by Schlumberger in order to be able to obtain acoustic measurements even in slow formations; this sonic tool has been used extensively during the last fifteen years, mainly for petrophysics, geomechanics and geophysics applications. Based on the previous sonic technology knowledge, a vision was conceived in the mid nineties to develop a new sonic technology that would add another dimension to the sonic data, i.e., acquiring radial acoustic measurements in addition to the data in the plane orthogonal to the wellbore axis. The new sonic tool, the Sonic Scanner (Fig.2 and 3), was designed so that it would acquire monopole and dipole waveforms over a wide range of spacing and covering a wide frequency band (Pistre et al., 2005). Moreover, relevant processing and interpretation workflows were developed to integrate all the new three-dimensional acoustic data and provide solutions and applications not possible with
∗ Mark of Schlumberger
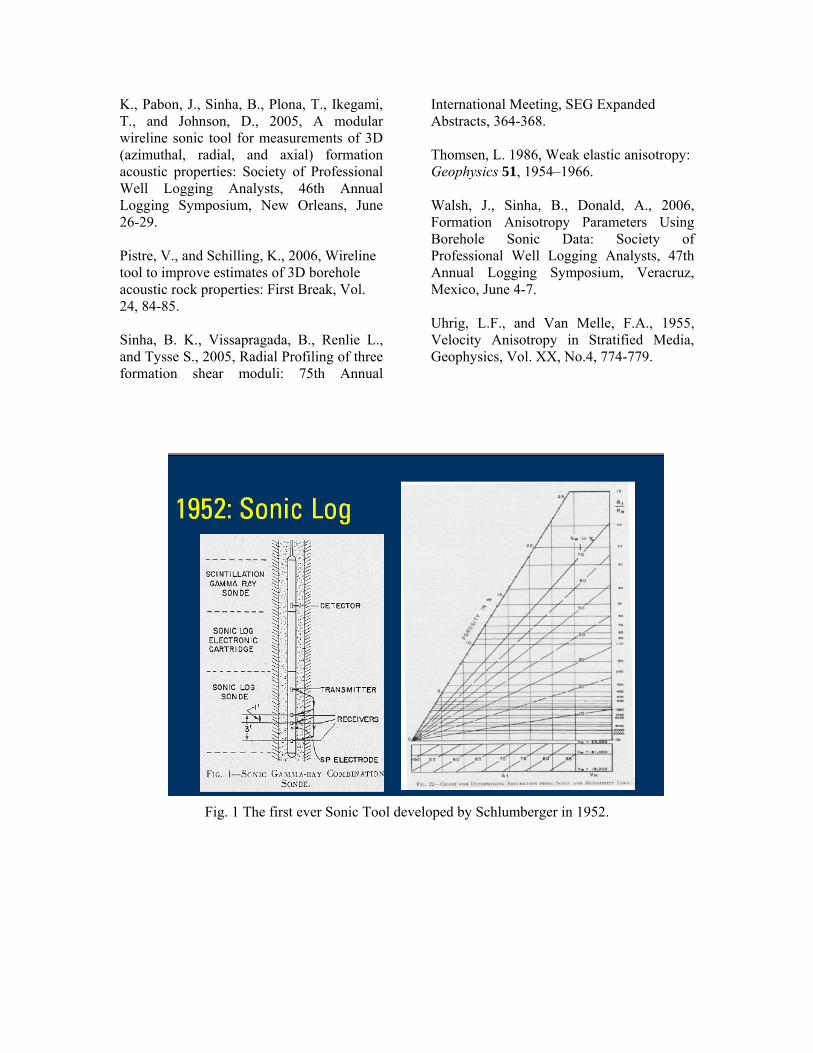
current and previous sonic technologies. Sonic Scanner has more transmitters (5) and receivers (104) than current generation tools, as shown in Fig. 2. The tool’s 13 axial stations are separated by 6 inches between them over a total aperture of 6 ft for the receiver array, as shown in Fig.3. Each of the 13 receiver stations has eight azimuthal receivers located every 45 degrees around the tool, providing a total of 104 receivers for the whole receiver array. Sonic Scanner’s geometry was carefully designed to provide acoustic measurements at various radial depths of investigation. In case of radial variation of compressional slowness decreasing away from the borehole wall, increasing the transmitter to receiver (TR) spacing enables to measure the acoustic slowness deeper into the formation, as shown in Fig.3 and 4. Sonic Scanner features a Transmitter-Receiver (TR) spacings from 1ft to 7ft for the short TR spacing group and 11ft to 17ft for the far spacing set of measurements, as shown in Fig.2. The 3 monopole transmitters have the same design that has been tuned to compensate for the excitation function for the Stoneley-wave mode at low frequency to the cement evaluation mode (CBL) at high frequency through the standard frequency of the monopole P&S-wave modes. The transmitters provide much more pressure than previous technology and their tuning to compensate for monopole compressional excitation function ensures a good generation of the typically low monopole P-wave mode in extremely fast formations. For dipole the objective of exciting the flexural mode over a wide frequency band lead to a revolutionary design of the transmitter. In addition to the wide frequency bandwidth the transmitter was designed to provide a linear flat response over the targeted frequency range. The transmitter is a shaking device consisting of an electromagnetic motor mounted in a cylinder suspended in the tool. This high fidelity transmitter is capable of generating high pressure dipole signal without generating any vibration in the tool because
the action-reaction system is contained within the transmitter itself. This 4 inch long transmitter can be assimilated to a point source because it does not generate any pressure field above and below the part of the borehole in front of the shaker. Another benefit of the linearity of the drive and the flatness of its pressure output is its capability to be activated by a frequency sweep, or Chirp, as shown in Fig. 5a and 5b; this leads to significant improvement of signal amplitude over a wide frequency band (300-9,000 Hz). Thus, we can eliminate multiple frequency passes, acquire the data we need for dipole radial profiling (wide band) and save rig time. Main Applications in Highly Inclined and Horizontal Wells Sonic Imaging away from the borehole In high angle and horizontal wells, reservoir features away from the wellbore, e.g., reservoir boundaries, fluid contacts, faults, etc., as shown in Fig.6, can be missed by near wellbore logging information and may be too small to resolve with surface seismic. One of the most important applications of Sonic Scanner in highly inclined and horizontal wells is allowing us to see such important features tens of feet into the reservoir, as shown in Fig. 7 and 8. A major problem encountered in reservoir characterization, modeling and simulation is the lack of available fine scale image data. Until now, the only available alternatives have been to work with surface seismic data, which is often too coarse in quality, or use near-wellbore imaging which has its associated limitations. Coupled with the scale of seismic measurements, additional uncertainties arise regarding geometry and structure, formation property variation, and fluid movements. Getting reservoir boundaries/thickness along a horizontal trajectory, as well as, incorporating interpreted fluid contacts has not been previously possible except in the near wellbore. Figures 7 and 8 show that this is now feasible; Sonic Scanner data can reveal
reservoir boundaries and fluid contact information along the horizontal trajectory of a well. The top and bottom of the reservoir can clearly be seen in the image, as well as, another extremely exciting feature, the oil/gas contact. The contact was not penetrated by the borehole and not thought to exist in this reservoir. Thus, Sonic Scanner images offer information about the fine structure of the reservoir, information that is not readily available otherwise, and help to identify and evaluate structures, such as, fractures and faults observed at or near the borehole up to about 50 ft into the formation. Moreover, Sonic Scanner image measurements can be used to update the geological model and as input to the reservoir simulator for predicting pressure with production. This sonic technology, may be applied for vertical and near vertical development wells in tight formations (carbonates and clastics); the ability to image various components which cause reservoir compartmentalization (high angle mineralized fractures, stratigraphic pinch-outs, ) or act as high permeability thief zones (for secondary and tertiary recovery projects) would definitely be valuable for completion and stimulation, as well as pattern orientation for infill drilling locations. Elastic Anisotropy Since early fifties, it is known that stratified formations (Fig.9) exhibit velocity anisotropy (Uhrig and Van Melle, 1955). Thus, understanding seismic velocity anisotropy is crucial for seismic processing and interpretation, i.e., normal-moveout correction, dip-moveout correction, migration, and amplitude variation with offset (AVO) analysis. At sonic frequencies, velocity anisotropy was demonstrated in three Alaskan wells that intersected a shale formation at different angles ranging from vertical to 60° (Hornby et al., 1999). It was observed that compressional slowness varied considerably in the shale intersected by the three wells. As expected, compressional-wave velocity increased as well deviation increased, as shown in Fig. 10.
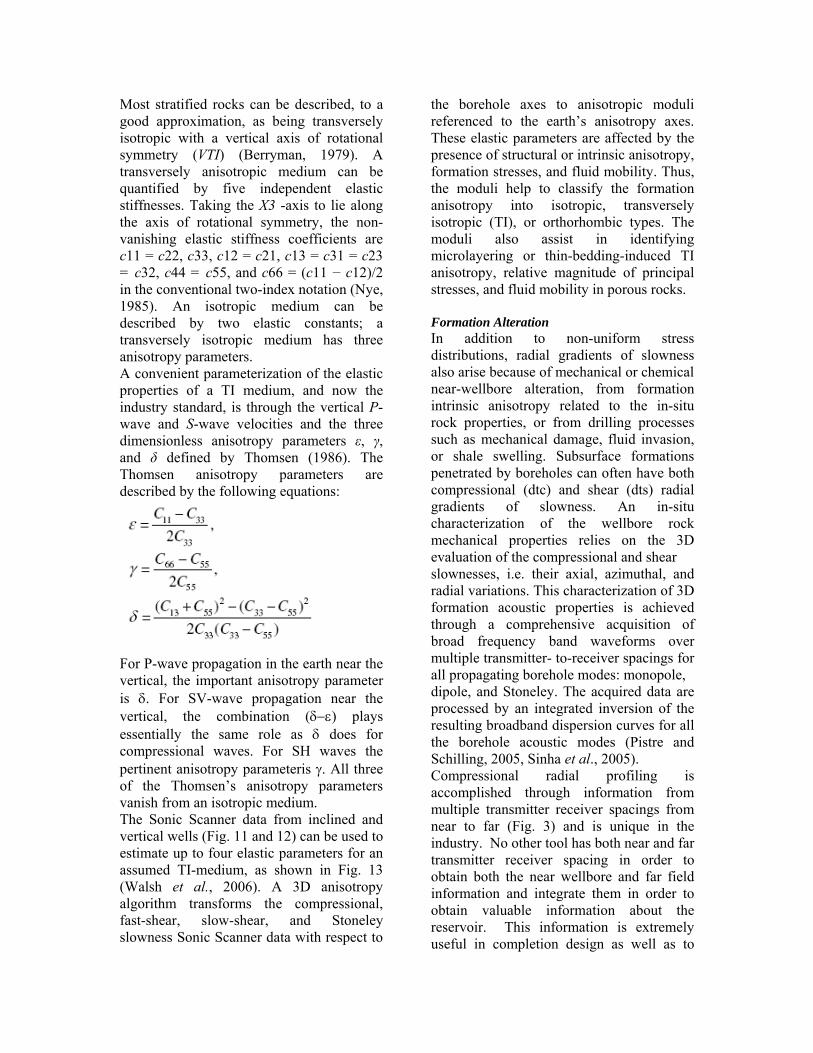
Most stratified rocks can be described, to a good approximation, as being transversely isotropic with a vertical axis of rotational symmetry (VTI) (Berryman, 1979). A transversely anisotropic medium can be quantified by five independent elastic stiffnesses. Taking the X3 -axis to lie along the axis of rotational symmetry, the non-vanishing elastic stiffness coefficients are c11 = c22, c33, c12 = c21, c13 = c31 = c23 = c32, c44 = c55, and c66 = (c11 − c12)/2 in the conventional two-index notation (Nye, 1985). An isotropic medium can be described by two elastic constants; a transversely isotropic medium has three anisotropy parameters. A convenient parameterization of the elastic properties of a TI medium, and now the industry standard, is through the vertical P-wave and S-wave velocities and the three dimensionless anisotropy parameters ε, γ, and δ defined by Thomsen (1986). The Thomsen anisotropy parameters are described by the following equations:
For P-wave propagation in the earth near the vertical, the important anisotropy parameter is δ. For SV-wave propagation near the vertical, the combination (δ−ε) plays essentially the same role as δ does for compressional waves. For SH waves the pertinent anisotropy parameteris γ. All three of the Thomsen’s anisotropy parameters vanish from an isotropic medium. The Sonic Scanner data from inclined and vertical wells (Fig. 11 and 12) can be used to estimate up to four elastic parameters for an assumed TI-medium, as shown in Fig. 13 (Walsh et al., 2006). A 3D anisotropy algorithm transforms the compressional, fast-shear, slow-shear, and Stoneley slowness Sonic Scanner data with respect to
the borehole axes to anisotropic moduli referenced to the earth’s anisotropy axes. These elastic parameters are affected by the presence of structural or intrinsic anisotropy, formation stresses, and fluid mobility. Thus, the moduli help to classify the formation anisotropy into isotropic, transversely isotropic (TI), or orthorhombic types. The moduli also assist in identifying microlayering or thin-bedding-induced TI anisotropy, relative magnitude of principal stresses, and fluid mobility in porous rocks. Formation Alteration In addition to non-uniform stress distributions, radial gradients of slowness also arise because of mechanical or chemical near-wellbore alteration, from formation intrinsic anisotropy related to the in-situ rock properties, or from drilling processes such as mechanical damage, fluid invasion, or shale swelling. Subsurface formations penetrated by boreholes can often have both compressional (dtc) and shear (dts) radial gradients of slowness. An in-situ characterization of the wellbore rock mechanical properties relies on the 3D evaluation of the compressional and shear slownesses, i.e. their axial, azimuthal, and radial variations. This characterization of 3D formation acoustic properties is achieved through a comprehensive acquisition of broad frequency band waveforms over multiple transmitter- to-receiver spacings for all propagating borehole modes: monopole, dipole, and Stoneley. The acquired data are processed by an integrated inversion of the resulting broadband dispersion curves for all the borehole acoustic modes (Pistre and Schilling, 2005, Sinha et al., 2005). Compressional radial profiling is accomplished through information from multiple transmitter receiver spacings from near to far (Fig. 3) and is unique in the industry. No other tool has both near and far transmitter receiver spacing in order to obtain both the near wellbore and far field information and integrate them in order to obtain valuable information about the reservoir. This information is extremely useful in completion design as well as to
assist in shallow point reading device selection. Selection of perforating depth based on formation alteration to “shoot past the damaged zone”, or perhaps for selective perforation to avoid the damaged zone, as shown in Fig. 14. Dipole radial profiling of shear slowness is based on the Backus-Gilbert inversion of a set of discrete slownesses over a wide bandwidth on the measured flexural dispersion (Pistre and Schilling, 2005). This inversion technique is based on a perturbation model that relates changes in the flexural dispersion to variations in formation properties. The algorithm extracts the radial shear slowness from the differences, at a few discrete frequencies, between the flexural dispersion in the reference state corresponding to a homogeneous and isotropic formation and the actual dispersion curve extracted from the measured flexural wave. Having both compressional and shear wave radial profiles ensures the correct far-field slownesses for geophysical and petrophysical analysis, and also provides information on the near wellbore gradients necessary to resolve geomechanical and completion issues. Radial variations of slowness in reservoir rocks can identify the areas that are mechanically damaged and present a greater risk of sanding. In stressed formations, radial slowness gradients identify altered rocks and provide information on potential drilling hazards. In contrast, when no radial gradients are observed, the formation can be considered mechanically intact with low failure risk. Summary and Conclusions In this paper we presented practical applications in high angle and horizontal wells of the latest wireline sonic technology, the Sonic Scanner. Sonic Scanner acquires simultaneous radial measurements, in true 3D, and at multiple depths of investigation, to help us better understand and characterize the reservoirs. It has been developed with more transmitters (5) and receivers (104) than current
generation sonic tools. It has very high quality waveforms and advanced processing techniques which lead to more robust evaluation of compressional, shear and Stoneley waves under the most challenging open-hole and cased-hole conditions, as well as, Cement Bond Log acquisition capability. Moreover, monopole and dipole radial profiles, offer enhanced anisotropy detection and formation alteration determination, The tool’s advanced inversion algorithms accurately estimate 3D rock properties, making use of the multiple transmitter and receiver spacings and wideband acoustic signals. It’s main applications in high angle and horizontal wells are:
• Sonic imaging, which allows us to see important reservoir features( boundaries, faults, etc) tens of feet away from the borehole.
• Derivation of the formations’ elastic anisotropy parameters, which can then be used to enhance the processing and interpretation of seismic data.
• Determination of slowness radial profiling and formation alteration that can then be used to optimize the perforation and completion strategy.
References Berryman, J. G., 1979, Long-wave elastic anisotropy produced by horizontal layering: Journal of Geophysical Research, 66, 4427-4440. Hornby, B.E., Howie, J.M., and Ince D.W., 1999, Anisotropy correction for deviated well sonic logs: an application to seismic well tie, 69th Annual International Meeting, SEG Expanded Abstracts, 112- 115. Nye, J.F., 1985, Physical Properties of Crystals: Oxford University Press. Pistre, V., Kinoshita, T., Endo, T., Schilling,
K., Pabon, J., Sinha, B., Plona, T., Ikegami, T., and Johnson, D., 2005, A modular wireline sonic tool for measurements of 3D (azimuthal, radial, and axial) formation acoustic properties: Society of Professional Well Logging Analysts, 46th Annual Logging Symposium, New Orleans, June 26-29. Pistre, V., and Schilling, K., 2006, Wireline tool to improve estimates of 3D borehole acoustic rock properties: First Break, Vol. 24, 84-85. Sinha, B. K., Vissapragada, B., Renlie L., and Tysse S., 2005, Radial Profiling of three formation shear moduli: 75th Annual
International Meeting, SEG Expanded Abstracts, 364-368. Thomsen, L. 1986, Weak elastic anisotropy: Geophysics 51, 1954–1966. Walsh, J., Sinha, B., Donald, A., 2006, Formation Anisotropy Parameters Using Borehole Sonic Data: Society of Professional Well Logging Analysts, 47th Annual Logging Symposium, Veracruz, Mexico, June 4-7. Uhrig, L.F., and Van Melle, F.A., 1955, Velocity Anisotropy in Stratified Media, Geophysics, Vol. XX, No.4, 774-779.
Fig. 1 The first ever Sonic Tool developed by Schlumberger in 1952.
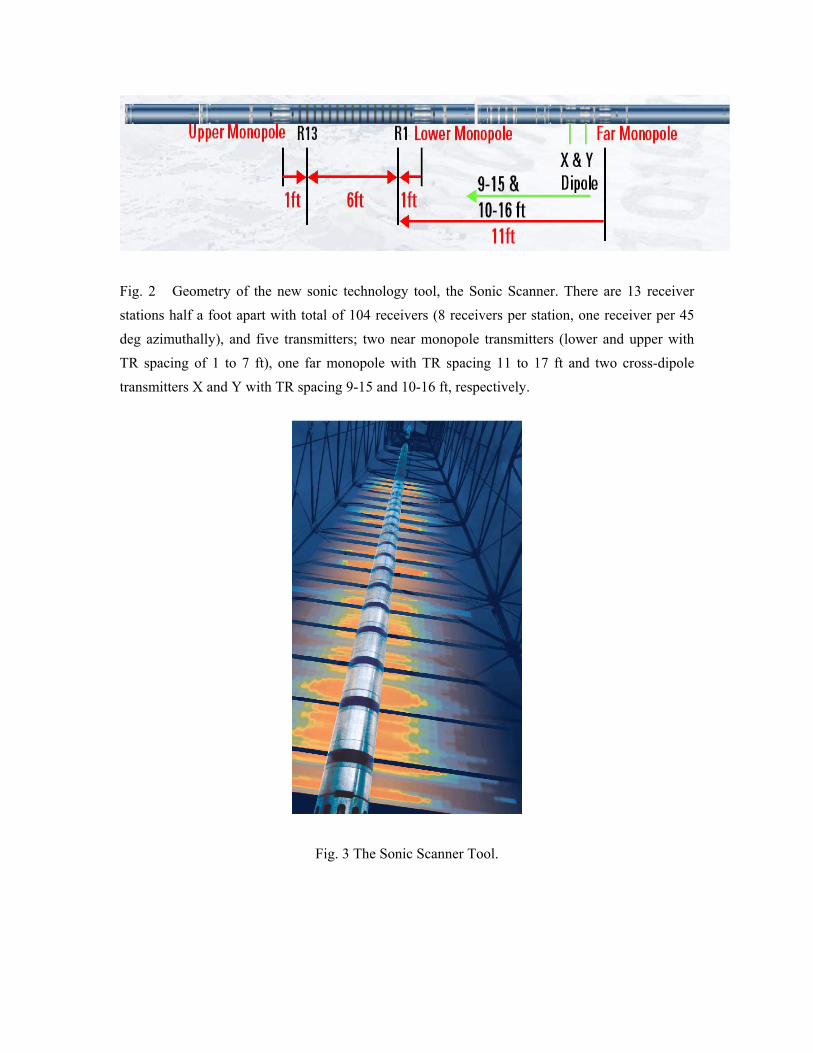
Fig. 2 Geometry of the new sonic technology tool, the Sonic Scanner. There are 13 receiver stations half a foot apart with total of 104 receivers (8 receivers per station, one receiver per 45 deg azimuthally), and five transmitters; two near monopole transmitters (lower and upper with TR spacing of 1 to 7 ft), one far monopole with TR spacing 11 to 17 ft and two cross-dipole transmitters X and Y with TR spacing 9-15 and 10-16 ft, respectively.
Fig. 3 The Sonic Scanner Tool.
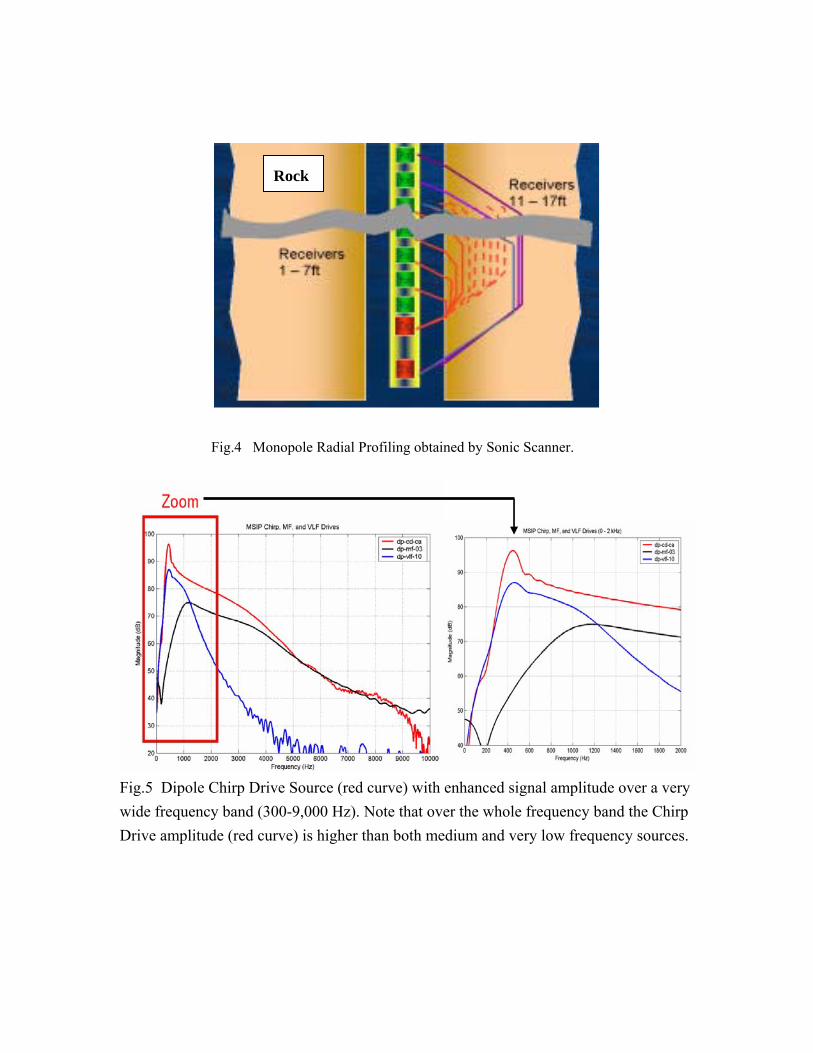
Fig.4 Monopole Radial Profiling obtained by Sonic Scanner.
Fig.5 Dipole Chirp Drive Source (red curve) with enhanced signal amplitude over a very wide frequency band (300-9,000 Hz). Note that over the whole frequency band the Chirp Drive amplitude (red curve) is higher than both medium and very low frequency sources.
Rock
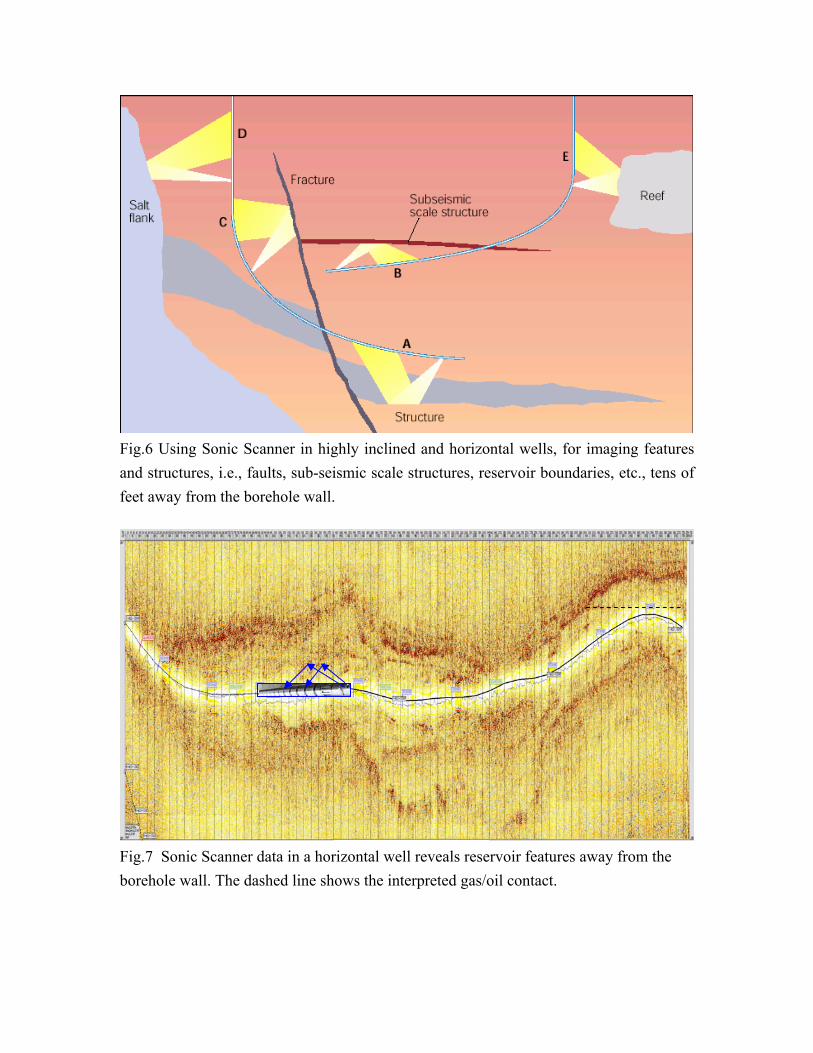
Fig.6 Using Sonic Scanner in highly inclined and horizontal wells, for imaging features and structures, i.e., faults, sub-seismic scale structures, reservoir boundaries, etc., tens of feet away from the borehole wall.
Fig.7 Sonic Scanner data in a horizontal well reveals reservoir features away from the borehole wall. The dashed line shows the interpreted gas/oil contact.
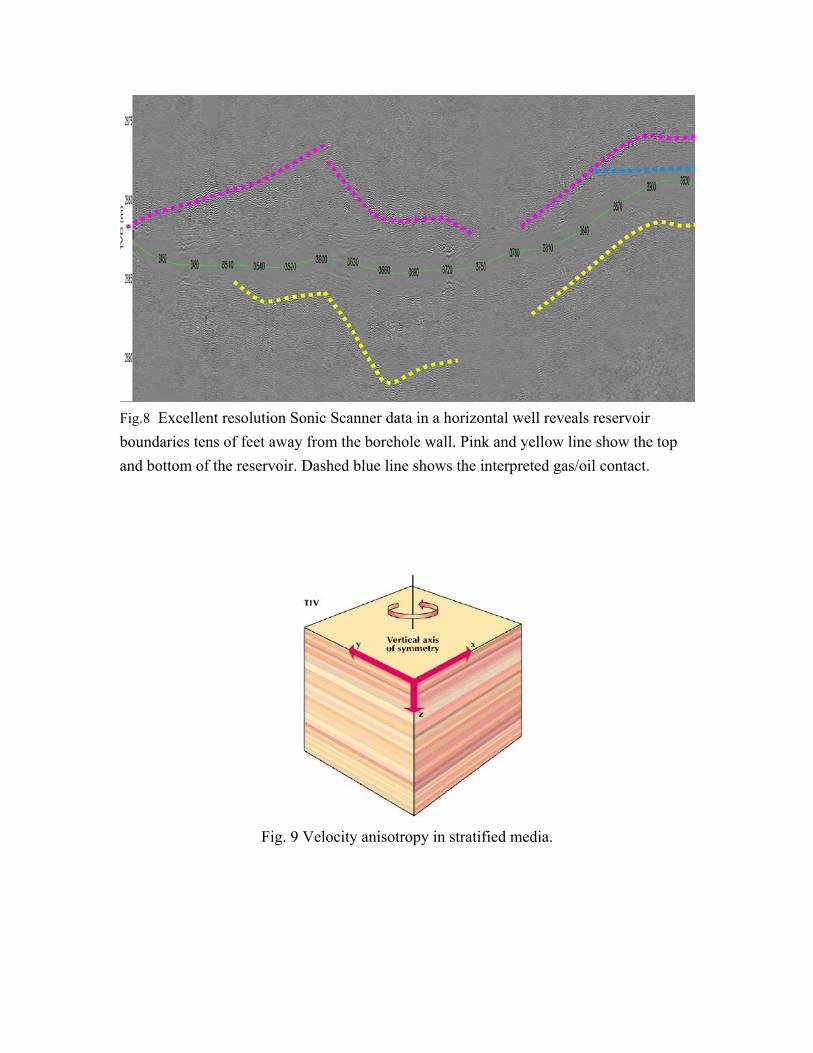
Fig.8 Excellent resolution Sonic Scanner data in a horizontal well reveals reservoir boundaries tens of feet away from the borehole wall. Pink and yellow line show the top and bottom of the reservoir. Dashed blue line shows the interpreted gas/oil contact.
Fig. 9 Velocity anisotropy in stratified media.
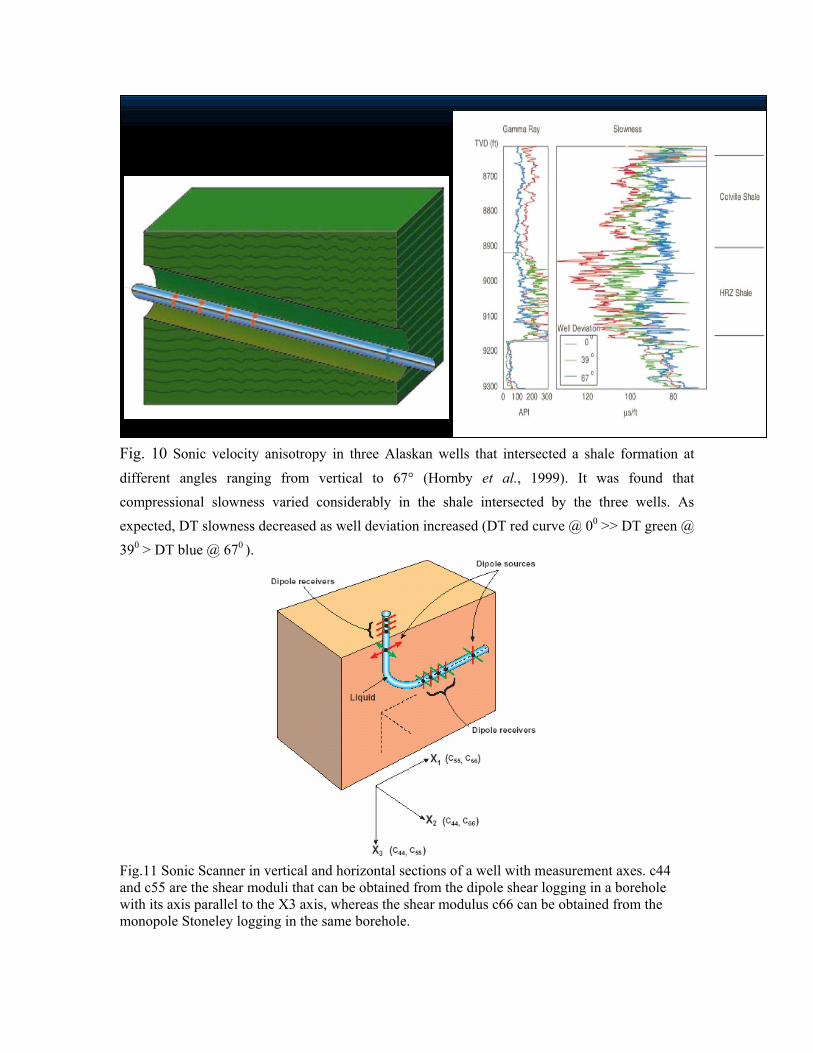
Fig. 10 Sonic velocity anisotropy in three Alaskan wells that intersected a shale formation at
different angles ranging from vertical to 67° (Hornby et al., 1999). It was found that compressional slowness varied considerably in the shale intersected by the three wells. As expected, DT slowness decreased as well deviation increased (DT red curve @ 00 >> DT green @ 390 > DT blue @ 670 ).
Fig.11 Sonic Scanner in vertical and horizontal sections of a well with measurement axes. c44 and c55 are the shear moduli that can be obtained from the dipole shear logging in a borehole with its axis parallel to the X3 axis, whereas the shear modulus c66 can be obtained from the monopole Stoneley logging in the same borehole.
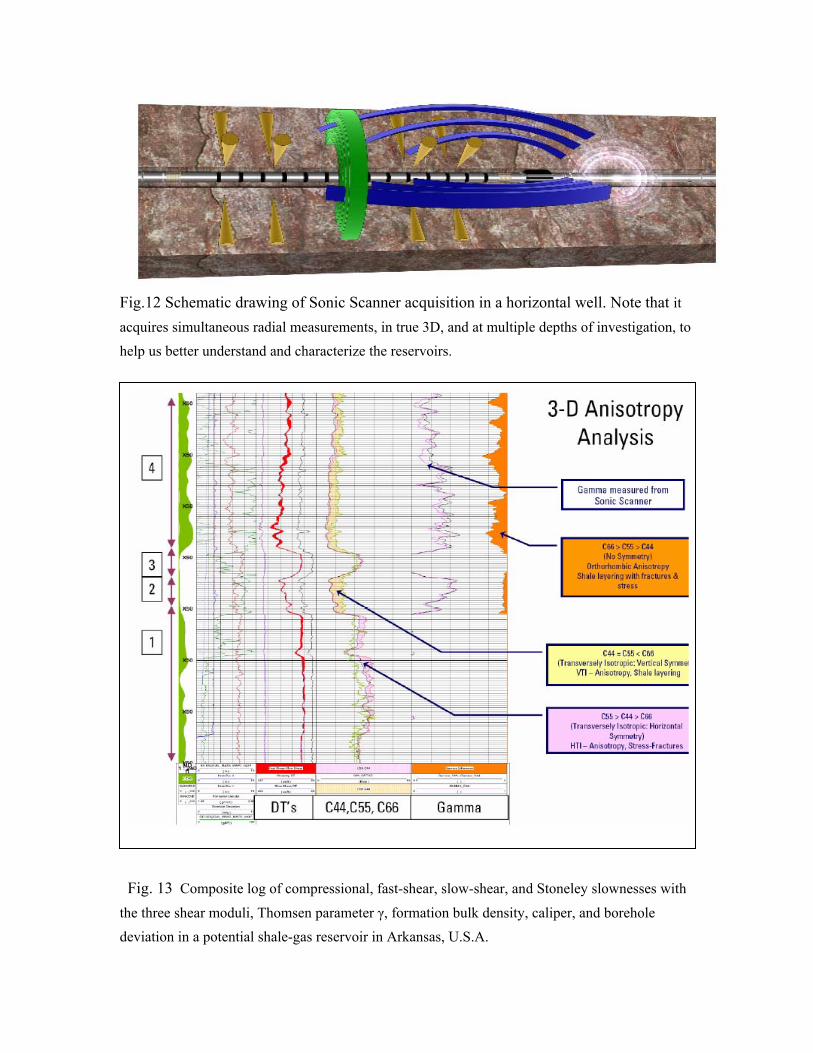
Fig.12 Schematic drawing of Sonic Scanner acquisition in a horizontal well. Note that it acquires simultaneous radial measurements, in true 3D, and at multiple depths of investigation, to help us better understand and characterize the reservoirs.
Fig. 13 Composite log of compressional, fast-shear, slow-shear, and Stoneley slownesses with
the three shear moduli, Thomsen parameter γ, formation bulk density, caliper, and borehole deviation in a potential shale-gas reservoir in Arkansas, U.S.A.
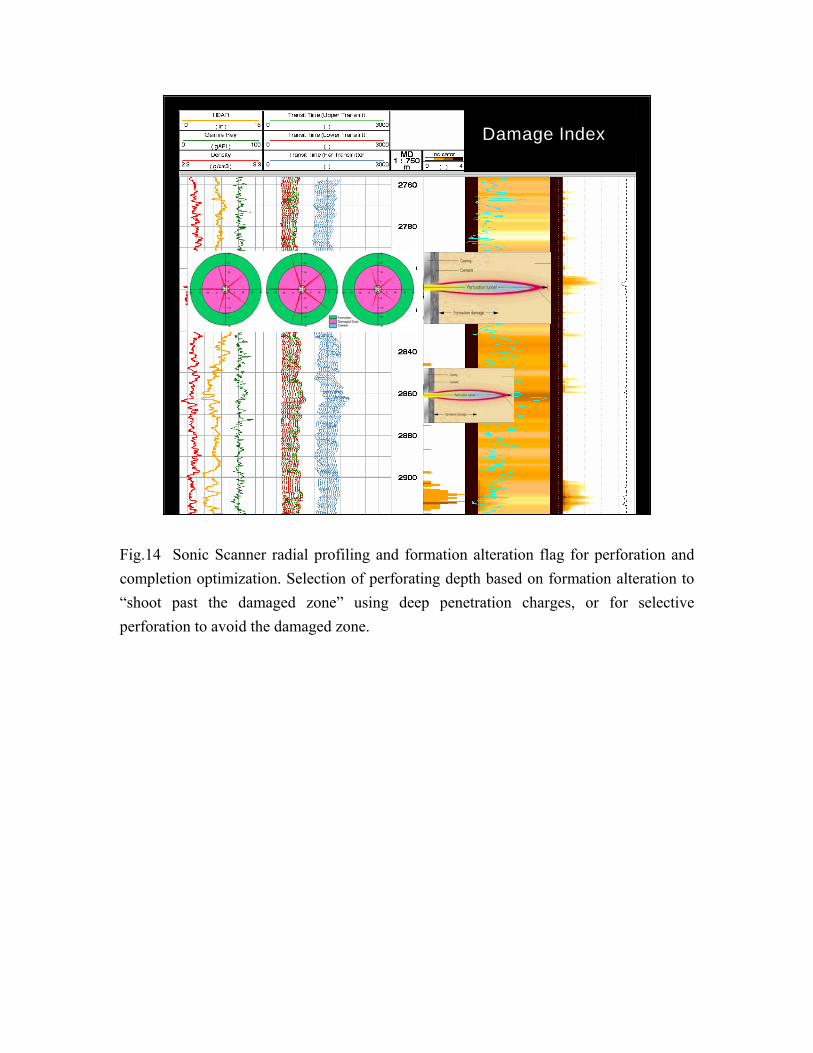
Fig.14 Sonic Scanner radial profiling and formation alteration flag for perforation and completion optimization. Selection of perforating depth based on formation alteration to “shoot past the damaged zone” using deep penetration charges, or for selective perforation to avoid the damaged zone.
Damage Index