New Perspective on Brand Portfolio Management - European ...
29
European Research Studies Journal Volume XXV, Issue 1, 2022 pp. 846-874 New Perspective on Brand Portfolio Management Submitted 12/12/21, 1st revision 03/01/22, 2nd revision 28/01/22, accepted 20/03/22 Robert Kozielski 1 , Magdalena Kalińska-Kula 2 Michał Medowski 3 Abstract: Purpose: The purpose of the paper is to confront the STP (Segmentation, Targeting, Positioning) model and the EBM (Evidence-Based-Approach) concept concerning brand portfolio management (BPM) and aims to identify an approach that enhances an organization’s ability achieve better market performance. Design/methodology/approach: The quantitative and qualitative research methods were adopted for this study and applied to the analysis. The main study was preceded by qualitative research (in-depth interview (IDI) method) – the aim of which was to verify the research construct with academicians and practicians as well as pilot studies. The quantitative research was conducted using the computer assisted web interview (CAWI) method and conducted among 342 managers leading companies operating on the Polish market. Findings: The findings indicated that STP is more popular approach to BPM than the EBM model, but not enough to be considered as a dominant one. At the same time, there were no analysis to support the thesis that organizations managing a brand portfolio based on the EBM concept achieve higher market performance and efficiency of marketing activities than organizations based on the STP approach. Practical Implications: The most pivotal practical implication is that the explicitness and consistency of the implemented strategy are of significant importance for both the organization’s market performance and the brand portfolio management . Originality/Value: The research presented in the article contributes to the current literature and research on brand portfolio and provides insights into brand strategy development. Keywords: Brand portfolio management, evidence-based marketing, STP approach, brand strategy. JEL classification: M431. Paper type: A research study. Funding: The publication was financed by a subsidy for the Faculty of Management of University of Lodz for the maintenance and development of research potential. 1 University of Lodz, Faculty of Management, Lodz, Poland, ORCID ID: 0000-0002-0200- 1504, [email protected]; 2 The same as in 1, ORCID ID: 0000-0003-4809-1901, [email protected]; 3 The same as in 1, ORCID ID0000-0001-6357-1087, [email protected];
-
Upload
khangminh22 -
Category
Documents
-
view
0 -
download
0
Transcript of New Perspective on Brand Portfolio Management - European ...

European Research Studies Journal
Volume XXV, Issue 1, 2022
pp. 846-874
New Perspective on Brand Portfolio Management Submitted 12/12/21, 1st revision 03/01/22, 2nd revision 28/01/22, accepted 20/03/22
Robert Kozielski1, Magdalena Kalińska-Kula2 Michał Medowski3
Abstract:
Purpose: The purpose of the paper is to confront the STP (Segmentation, Targeting,
Positioning) model and the EBM (Evidence-Based-Approach) concept concerning brand
portfolio management (BPM) and aims to identify an approach that enhances an
organization’s ability achieve better market performance.
Design/methodology/approach: The quantitative and qualitative research methods were
adopted for this study and applied to the analysis. The main study was preceded by
qualitative research (in-depth interview (IDI) method) – the aim of which was to verify the
research construct with academicians and practicians as well as pilot studies. The
quantitative research was conducted using the computer assisted web interview (CAWI)
method and conducted among 342 managers leading companies operating on the Polish
market.
Findings: The findings indicated that STP is more popular approach to BPM than the EBM
model, but not enough to be considered as a dominant one. At the same time, there were no
analysis to support the thesis that organizations managing a brand portfolio based on the
EBM concept achieve higher market performance and efficiency of marketing activities than
organizations based on the STP approach.
Practical Implications: The most pivotal practical implication is that the explicitness and
consistency of the implemented strategy are of significant importance for both the
organization’s market performance and the brand portfolio management.
Originality/Value: The research presented in the article contributes to the current literature
and research on brand portfolio and provides insights into brand strategy development.
Keywords: Brand portfolio management, evidence-based marketing, STP approach, brand
strategy.
JEL classification: M431.
Paper type: A research study.
Funding: The publication was financed by a subsidy for the Faculty of Management of
University of Lodz for the maintenance and development of research potential.
1University of Lodz, Faculty of Management, Lodz, Poland, ORCID ID: 0000-0002-0200-
1504, [email protected]; 2The same as in 1, ORCID ID: 0000-0003-4809-1901, [email protected]; 3The same as in 1, ORCID ID0000-0001-6357-1087, [email protected];

Robert Kozielski, Magdalena Kalińska-Kula, Michał Medowski
847
1. Introduction
A discussion regarding the essence of marketing activities, their ambiguity and,
above all, their weaknesses has a long history and rich literature (Barksdale and
Darden, 1971; Bartles, 1951; Converse, 1945; Hunt, 1976; Kotler and Levy, 1969;
Levitt, 1960; McKitterick, 1957). This debate intensified in the 1990s and at the
beginning of the 21st century (Brady and Davis, 1993; Brownlie et al., 1994; Kohli
and Jaworski, 1993; Reibstein et al., 2009; Rust et al., 2010; Sheth and Sisodia,
2005; Slater and Narver, 1994; Webster, 1992; Webster, 2005). The traditional
approach was contrasted with the need for changes in marketing philosophy, strategy
and operational solutions.
As a result of the various critical opinions, new concepts and proposals emerged
over the years, with the ambition to be considered a response to the search for a new
marketing identity (Brownlie et al., 1999; Harrigan and Hulbert, 2011; Kourdi,
2011; Shaw, 1998; Sheth and Sisodia, 2006). One of the directions of these
explorations is evidence-based management, specifically evidence-based marketing.
Evidence-based marketing (EBM) is defined as “a marketing activity in which
decisions are based on reliable and generalised knowledge of how the world works,
how customers buy and how marketing incentives and interventions affect them”
(Sharp, 2013).
The EBM concept is part of a broader current called evidence-based practice (EBP),
understood as practice fed by the best and most up-to-date knowledge, including
knowledge from research (Rowley, 2012) or as the integration of the best research
evidence on a given topic with existing practical experience, expertise and user
preferences (Tranfield et al., 2004). The idea of evidence-based management –
understood as making better business decisions by integrating business expertise
with the conscious, open and prudent use of the best evidence and taking into
account the perspective of those affected (Collins et al., 2008) – directly stems from
the aforementioned concept.
In its assumptions, evidence-based management emphasises the role of research
results in enriching existing expertise and practice, which ultimately leads to better
decisions, better process and product innovation, improved business performance
and scientific evidence support in the event of legal or commercial disputes
(Brennan and Ankers, 2004; Brennan, 2008; Lee and Greenley, 2010; Reibstein et
al., 2009; Rowley, 2012). At the same time, EBM criticised the segmentation,
targeting, positioning (STP) concept.
The STP model is one of the key marketing theories and, at the same time, is also
one of the most often discussed and criticised concepts (Blois and Dibb, 2000). The
origins of the concept and process of segmentation date back to the turn of the 19th
and 20th centuries (Fullerton, 2012). However, it was only in the 1950s that
segmentation gained its first full expression (Smith, 1956). Its dynamic development

New Perspective on Brand Portfolio Management
848
began in the 1970s and 1980s (Dickson and Ginter, 1987; Jones, 1973; Piercy and
Morgan, 1993; Wind, 1978) and has continued to this day (Canhoto et al., 2013;
Hunt, 2011; McDonald and Dunbar, 2012; Thoeni et al., 2016). Although STP is
now the foundation of modern marketing science and practice, it is also subject to
lively discussion and criticism.
One of the critics of the STP model is Byron Sharp, who bases his assessment
mainly on the concept of evidence-based marketing and accuses the STP concept of
lacking support in the real world and practical confirmation (Sharp, 2010).
According to Sharp, STP is not a denial of reality, but its poor representation.
Adopting Sharp’s point of view means that segmentation may at best be a kind of
‘market picture’ at the time of the study and provides some information about its
structure at the moment but – due to its instability – this tool should not be the basis
for the marketing strategies of a company.
In turn, according to Sharp, the idea of targeting and positioning the offer to only
selected parts of the market is a limiting concept and, additionally, it simply does not
work in practice. Sharp’s arguments are supported by a number of studies by other
EBM authors which confirmed that brands competing in a given market have
relatively similar consumer bases, regardless of their efforts related to the targeting
and positioning of their offerings to specific market segments (Hammond et al.,
1996; Kennedy and Ehrenberg, 2000; Kennedy and Ehrenberg, 2001). The idea of
targeted marketing, criticised by Sharp, is contrasted with the concept of
‘sophisticated mass marketing’ and the new paradigm of brand growth based on
evidence-based marketing.
The criticism of the traditional approach to STP mainly concerns the growth
potential of a single brand. It does not apply directly to an entire brand portfolio. At
the same time, the number of brands in company portfolios has been growing
significantly in recent years and management has focused more on the running of an
entire portfolio rather than a single brand.
Globalisation, internationalisation of trade or increasing openness of markets to trade
generally force companies to introduce new products and brands to the market and,
consequently, to manage multi-brand portfolios. Brand portfolios managed by
companies are expanded both as a result of organic growth (introduction of new
lines and sub-brands) and as a result of mergers and acquisitions.
Consequently, an important and current challenge is to improve brand portfolio
management that would allow for more effective competition. Taking into account
the above, the aim of this article is to compare the STP model and the EBM concept
concerning brand portfolio management and an organisation’s ability to compete
effectively and to gain better market performance.

Robert Kozielski, Magdalena Kalińska-Kula, Michał Medowski
849
2. Theoretical Background
2.1 The STP Concept – A Critical Approach
The origins of the concept and process of segmentation date back to the 19th century
(Fullerton, 2012). Steinen’s belief (1912) that the market has more than one
component or Kliemann’s view (1928) of the need to group people together in order
to develop appropriate advertising methods for different market segments
represented a turning point in looking at the market and laid the foundations for the
segmentation concept. Despite previous segmentation-related work, Smith’s
approach (1956) is considered to be the beginning of formal thinking about the
market in terms of segmentation and, thus, the STP concept and targeted marketing.
Smith (1956) saw the heterogeneous market as a set of smaller homogeneous areas
that address diverse customer preferences and respond to the desire to achieve
greater satisfaction from their varied needs. This paradigm shift started a revolution
in marketing and laid the foundations for a discussion about the choice between
mass or targeted marketing. The former assumes treating all customers as if they
were the same and, therefore, offering them the same product and marketing mix.
The aim of such activity is to achieve the effect of the economy of scale and
maintain simplicity and control over the business. In this sense, mass marketing
assumes homogeneity of demand, which results in a homogeneous marketing mix.
This is not the case if one assumes that demand is heterogeneous. A company then
has two strategies to choose from (Smith, 1956). The first is the strategy of
convergence or demand concentration, which is primarily associated with product
differentiation strategies aimed at – as Smith himself calls it – bending the demand
curve to the will of supply. The second is the strategy of divergence i.e., accepting
the dispersed and heterogeneous nature of demand – these are the strategies of
segmentation, which means adjusting the supply structure to the shape and structure
of the market.
Segmentation, targeted marketing and STP are concepts well established in the
world of marketing. The concept of market segmentation is one of the leading
business ideas from the second half of the 20th century (Dibb and Simkin, 2001) – on
the basis of which the strategies of many companies and brands were built. At the
same time, the STP concept and the idea of market segmentation were being
criticised. The numerous conditions for effective segmentation – as well as the
multitude of options available for the selection of criteria, strategies and tools –
make the risks associated with conducting the segmentation process seem significant
and the list of possible reasons for the failure of targeted marketing is vast.
More than 20 years ago, Hooley and Saunders (2004) identified a number of
potential problems related to the implementation of segmentation-based marketing.
Areas and issues such as organisational structure (functional organisational silos

New Perspective on Brand Portfolio Management
850
may effectively block decisions and actions around market segments) or the
phenomenon of political intra-company games (lack of cooperation between
functions may prevent the effective implementation of STP) were emphasised. The
organisational culture and strong attachment to values and modes of operation other
than STP may hinder or prevent the implementation of STP. It was also indicated
that reporting and information systems may be incompatible with the structure of
segments, thus making it impossible, for example, to assess their attractiveness and
not providing market feedback on the marketing activities undertaken.
Decision-making processes can also be a problem for segmentation. In order to
operate effectively, STP must become a part of the standard processes of planning,
decision making, resource allocation etc. within the company. STP is also limited by
limited corporate capabilities. Companies may not have sufficient resources to
successfully perform segmentation and reach either the selected or the most
attractive segments. Finally, the implementation of STP may fail if it is not
supported by all the other systems which exist in the company and these should be
properly prepared and modified prior to the planned implementation.
The indicated weaknesses and limitations of STP show the scale of scientific
uncertainty and implementation controversies. Nevertheless, STP is a well-
assimilated concept and firmly rooted in the world of marketing. The vision of a
structured and orderly market divided into distinctive segments which are
appropriated by individual brands that communicate specifically to selected
segments – with clear differentiators and positioning strategies – is intellectually
attractive to the marketer and researcher.
Therefore, STP is a pillar on which many elements have been built, such as
communication strategies, pricing strategies, brand growth philosophies or decisions
and rules for building and managing a brand portfolio. The STP philosophy
permeated the world of 20th-century marketing. The problem is that, according to
many of the researchers cited above, the concept of STP may be questionable. There
is little evidence of a successful, effective and stable implementation of
segmentation and there are numerous voices criticising the theoretical ‘normative
segmentation’ described above.
2.2 The EBM Model
The criticism of STP, together with the current of empirical generalisations, made it
possible to build an alternative approach to brand development. The EBM model
(Sharp, 2010) is probably the only comprehensive proposal, on a theoretical and
practical level, which addresses the weaknesses of the STP concept and being a real
option for it. Understanding the brand growth model promoted by Sharp and other
authors requires an analysis of its basic assumptions on such evaluation areas as
consumer behaviour, brand performance and advertising.
Robert Kozielski, Magdalena Kalińska-Kula, Michał Medowski
851
In the EBM approach, customers are perceived as cognitively distracted individuals
with little involvement in brand purchases, driven by heuristics and attached to their
shopping habits. Consumers are busy with brand purchases and are reluctant to learn
new information. The key to accessing their minds is emotions that help to break
through the cognitive barrier and gain attention. At the same time, brands once
accepted often remain on the shopping list, however, this does not mean 100%
loyalty.
According to EBM, brands grow thanks to the constant recruitment of new
customers and, in doing so, compete with all brands in a given category. The degree
of competition is proportional to the scale of the brand. In order to compete
effectively, brands need to be easy to find, which is helped by a distinctive style, and
the constant recruitment of new consumers can be achieved by means of
sophisticated mass marketing tools such as advertising that builds relevant
associations and memory structures and is carried by emotions. Sharp stresses the
importance of building mental availability for the widest possible range of
consumers, which – in addition to the right advertising message – can be ensured by
continuous media presence and coverage. Marketing activities in the EBM approach
are objective and their results can be measured using metrics that result from
empirical generalisations i.e., free from deviations resulting, for example, from the
current brand scale.
The brand growth model by EBM can be reduced to several key pillars such as
penetration, availability (physical and mental) and distinctiveness. The first pillar is
penetration. Based on the double-jeopardy law, Sharp proves that the basis for brand
growth is to increase its penetration (Sharp and Romaniuk, 2016). According to this
law, brands with small market shares generate fewer sales because they have fewer
customers (first threat – lower penetration), who were additionally slightly less loyal
(second threat – lower loyalty) compared to brands with a large market share
(Ehrenberg, 1972; Ehrenberg et al., 1990; Ehrenberg and Goodhardt, 2002). The
increase in penetration can theoretically be achieved by acquiring new customers
and/or reducing the churn of existing customers.
According to the EBM principles, a brand growth strategy should focus on building
penetration through the acquisition of new customers as customer retention, like
other indices, is subject to the double-jeopardy law. All brands lose customers (this
is a normal process), while churn rates decrease as the brand’s market share
increases. Additionally, it was confirmed that even 60% of the loss of buyers is
beyond the marketer’s control (Bogomolova and Romaniuk, 2009).
When recruiting new buyers, special attention should be paid to light buyers (i.e.,
buyers who rarely buy in a given time perspective) in a specific category. The
acquisition of new customers – especially light buyers – is crucial for the growth of
the brand and marketing activities should focus on that. Additionally, as Harrison
proves, the activities aimed at gaining new customers automatically reach the

New Perspective on Brand Portfolio Management
852
brand’s current customers who have more frequent contact with the brand and its
communication and are more open to its marketing activities (Harrison, 2013).
Brands should, therefore, increase their penetration and constantly search and recruit
customers, which directly implies a demand to be accessible to all, everywhere and
in every dimension both physically and mentally – which are the pillars of the brand
growth model according to EBM. Physical availability is sometimes confused with
the issue of distribution level. This is a mistake because physical availability is a
much broader concept, including not only aspects related to the presence in the
relevant channels and stores but also full-time accessibility, accessibility in financial
terms as well as visibility and shopping navigation (Sharp and Romaniuk, 2016).
Sharp and Romaniuk (2016) lists three components of physical availability i.e.,
presence (related to decisions on channel selection, shops), relevance (related to
decisions on other elements affecting ease of purchase e.g., price, packaging size
etc.) and prominence (related to decisions on location of products at the point of sale
and their communication, which translates into easy product finding).
Alongside physical availability, a key element of the EBM model is mental
availability. It is defined as the tendency of the consumer to notice and/or think
about the brand in shopping situations (Romaniuk and Sharp, 2004). Mental
availability of a brand is necessary but it is not a sufficient condition for the purchase
of a product. It is about whether the buyer is able to recall the brand and consider it
as a shopping option in a shopping situation (Romaniuk, 2018). Mental availability
as the key to fighting for a purchase transaction was indicated in research on the so-
called ‘consideration set’ i.e., the repertoire of brands that buyers are considering on
a given purchase occasion. It was confirmed that the consideration set is narrow (in
the service market it may even be only one brand) and that the best way to find
oneself in the repertoire of the brands under consideration is high mental availability.
This is largely independent, for example, from the actual level of competitiveness of
the offer as most consumers do not make detailed comparisons in the purchasing
process and move only within the repertoire of brands in the consideration set
(Dawes et al., 2009). The role of mental availability in building a brand’s scale was
also proven by the links between mental availability and the churn rate, which (as is
known from the double-jeopardy law described above) is directly related to the
brand sales volume. It was proven that the higher the mental availability of a brand,
the lower the consumer churn rate (Romaniuk and Sharp, 2003). The measure of
mental brand availability is, therefore, not brand awareness but mental market share,
mental penetration and network size (Sharp and Romaniuk, 2016).
The third key pillar of the EBM model, which at the same time makes it easier for
the consumer to find and recognise a brand in a crowded media and commercial
environment despite the above-mentioned distributors, is distinctiveness. To
understand the concept of distinctiveness, it needs to be juxtaposed and

Robert Kozielski, Magdalena Kalińska-Kula, Michał Medowski
853
distinguished from the concept of differentiation, which is part of STP.
Differentiation is a concept derived from classical economic theory and means
offering the consumer a significant difference in what is offered (which is added
value) that competitors do not give. Distinctiveness is brand identification and the
way it is recognised, containing all sensory elements (visual, audio, fragrance, touch
etc.) that stimulate brand recognition (Sharp and Romaniuk, 2016). Both concepts
are linked by the goal of making the consumer choose the offer of a given brand.
Differentiation and distinctiveness, however, offer a completely different perspective
on how to get there.
The concept of distinctiveness proposed by Sharp is an alternative to differentiation.
Shopping choices are not dictated by differentiation or emotion in relation to the
brand, but its physical and mental availability as well as effective branding, whose
primary purpose is to be able to identify the brand as the source of a product or
service and gain a special role in a situation of communication congestion. This is
facilitated by the characteristic style and distinctive assets (DA) which can, for
example, include (Sharp, 2010):
− colours – for example, red for Coca-Cola
− logo – for example, McDonald’s golden arches
− taglines – for example, Nike’s ‘Just do it’
− symbols/figures – for example, Mickey Mouse
− celebrities – for example, Tiger Woods for Nike
− advertising styles – for example, the animated Red Bull style
and also (Sharp, 2016):
− music, jingles, sonic elements
− fonts, printing styles
− shapes and types of packaging closures
− and many other elements.
Distinctiveness in the EBM model combines with mental and physical availability
and, consequently, with the level of brand penetration and provides a coherent model
for brand growth. These key elements are treated as intangible assets of the
organisation – the so-called ‘market-based assets’ – and their role in building not
only brand growth but also the value of the entire organisation is emphasised (Sharp,
2010). The mental and physical availability and distinctive style of the brand all
increase the effectiveness of the company, for example, through better recognisable
advertising referring to the existing memory structures of the consumers (mental
availability). These resources also bring security and stability to the organisation and
make it independent of market fluctuations. It was proven that large brands have
much lower flexibility to respond to economic fluctuations and mix marketing
changes, and the above-mentioned market-based assets act as a market buffer
protecting the brand.

New Perspective on Brand Portfolio Management
854
The EBM brand growth concept is an alternative proposed as a consequence of the
criticism of the STP concept. The EBM model, although relatively new, is also
subject to criticism. The EBM’s postulates and Sharp’s proposals, similarly to STP,
caused a lot of controversy, discussion and polemics. For example, the company
Kroger proved that it achieved growth for 52 consecutive quarters by targeting its
heavy buyers. In turn, Nielsen Catalina published the results of a meta-analysis of
500 brands of packed goods showing that targeting heavy buyers in TV and digital
campaigns brings higher sales growth. Sharp is also accused of overlooking issues
related to consumer experience with the product, influencers or online reviews (Neff,
2017).
An interesting approach to the EBM model was adopted by Biglione (2016), who –
while agreeing with Sharp on the main theses – indicates some special cases. For
example, by agreeing to the principle of broad presence, she also shows that a
company with a very limited budget (e.g., starting a business) may benefit from
narrow targeting because it cannot afford to achieve a broader reach.
It is certainly necessary to observe the ongoing discussion. The fact that the EBM
concept is relatively new also implies its poor application. EBM is primarily
concerned with brand growth in a competitive environment but the theses, and –
above all – the empirical generalisations underlying them, can be applied in other
areas – especially in the area of brand portfolio management.
2.3 Brand Portfolio Management and the EBM Model – Implications and
Consequences
The EBM brand growth model described by Sharp refers primarily to the growth and
construction of a single brand and the ways in which brands compete with each
other. The multiplicity of brands in the market is an obvious element of this model
but, usually, they are brands that create a competitive environment and, therefore,
are hostile to each other and fight for the same consumers. On the other hand, the
number of companies that manage more than two brands is growing rapidly. This
creates a natural need to increase the efficiency and effectiveness of brand portfolio
management (BPM).
Although brand portfolio management has a tradition of more than 100 years (Low
and Fullerton, 1994), the development of BPM tools intensified in the middle of the
20th century and this is an area that continues to evolve. The current brand portfolios
are distinguished by the fact that they are highly developed, tend to expand further
and that only a small proportion of the brands in the portfolio are highly profitable
(Kall and Hajdas, 2010). This is confirmed by market data. An average Fortune 1000
company currently manages a portfolio of more than 240 brands in various product
categories (Davis, 2005).

Robert Kozielski, Magdalena Kalińska-Kula, Michał Medowski
855
The phenomena described above clearly show that the conditions for BPM processes
are becoming increasingly more demanding for enterprises and the changes that are
occurring at a rapid pace result in increased complexity and, simultaneously, reduced
decision time and increased risk (Poulis, 2021). Companies, therefore, make
mistakes but learn by stimulating the dynamic development of BPM knowledge and
processes at the same time. Chailan even claims that the development of BPM
portfolios and methods is a natural part of the company’s ‘biology’, which evolves
with the changing environment and the company itself (Chailan, 2010).
This natural process forces the identification of key areas related to portfolio
management. The analysis of BPM-related literature allows for key areas such as
portfolio expansion, brand extension, portfolio simplification or allocation of funds
to be identified. References to these areas can also be found in Sharp’s work.
As regards the issues related to brand launches, Sharp claims that, firstly, new
brands grow in the same way as existing ones i.e., through increased penetration.
First of all, new brands are bought by category heavy buyers, who are the most
receptive group to new products in a given category. These consumers usually have
the longest repertoire of the brands they buy and the lowest level of loyalty to a
single brand; hence, in order to grow, a new brand needs to reach for light category
buyers (build penetration).
Secondly, the loyalty levels of new brands are lower as compared to what would
result from the double jeopardy law i.e., lower than the loyalty levels of existing
brands with similar market shares. Sharp justifies this with the usual introductory
strategy of marketing hits and resulting in a short-term ‘purchase’ of mental and
physical availability, which quickly falls after the campaign. The brand thus gains a
short leap in penetration but then loses a disproportionate number of customers. In
the context of the above information, Sharp and Romaniuk propose a market launch
model focused on building new brand penetration through (Sharp and Romaniuk,
2016):
− quickly ensuring the physical availability of the brand – at least on a scale
that enables financing of sustainable marketing communications;
− providing sustained, wide-ranging marketing communications to reach
medium and light category buyers according to their purchasing cycles;
− focusing on building memory structures that will primarily help in building
the basis for the brand’s mental availability – what the brand is, what it is
called, to which category it belongs etc.;
− strong branding enabling the construction of a distinctive brand style and its
recognition;
− making sure that brand purchase barriers are identified and removed on an
ongoing basis.

New Perspective on Brand Portfolio Management
856
With more than one brand in its portfolio, a company has to face decisions on the
allocation of resources between brands. The dilemma of optimal allocation concerns
all company resources (finances, people, equipment etc.) – especially marketing
resources i.e., marketing budget. EBM does not offer direct guidance on how to
manage the marketing budget when there are multiple brands in the portfolio.
Indirectly, however, some clues can be drawn from the work of researchers. For
example, considering the issue of budget allocation according to the criteria of the
marketing target, the growth of penetration is the priority according to EBM.
Brands grow thanks to the growth of penetration (or, more specifically, acquisition),
not the frequency of purchases, purchase per action, the percentage of repetitive
transactions or other loyalty measures. It can, therefore, be stated that the company’s
goal is to build the broadest possible penetration of its brand portfolio. When
looking at budget allocation from the point of view of the tools used and the
marketing mix, based on the above-described works by Sharp and other authors,
priority should consequently be given to the tools that build mental (e.g.,
advertising) and physical availability (e.g., distribution or building visibility in the
store).
At the same time, Sharp is critical of the effectiveness (especially in the long run) of
often used price promotions, strongly emphasising the need to invest in advertising.
The golden proportion based on records is 60-40 i.e., 60% of the budget should be
allocated to advertising and mental brand availability and 40% to possible short-term
interventions such as It can, therefore, be concluded that the priority in terms of tools
for the company should be advertising and measures to build the mental availability
of brands in the portfolio. Only after addressing this issue (and in the context of the
financial capacity and financial situation of the organisation) should the company
invest in price promotions.
An alternative strategy of portfolio building to the introduction of a new brand is the
extension of existing brands. The priority in brand extension is to maintain the
distinctiveness and consistency of the parent brand and avoid the risk of ‘dilution’ of
the brand’s DA hence the need for consistency in terms of the DA used – especially
the so-called ‘fixed elements’ (packaging colour, name, logo), which cannot differ
between the parent brand and variants.
The number of variants and brands introduced should be determined by their ability
to build additional portfolio penetration and possible constraints are related to the
company’s ability to build additional mental and physical availability (avoiding
excessive cannibalisation) and the appropriate level of portfolio support (financial
capacity and efficiency) as well as maintaining the characteristics of the parent
brand(s). In particular, Sharp warns against hasty decisions to simplify the portfolio.
In his opinion, any decision to divest a brand from the portfolio should be dictated
solely by its lifetime (scale, growth capacity etc.) and financial/operational issues

Robert Kozielski, Magdalena Kalińska-Kula, Michał Medowski
857
and, in no case, by its similarity (common target) to the other brands in the portfolio
(Sharp, 2010).
It can be concluded that the relatively new evidence-based marketing translates into
aspects related to brand construction and management. The empirical evidence does
not support the logic of using STP. According to empirical generalisations, brands
grow thanks to continuous effective acquisition of new consumers and building
penetration, not by increasing sales to existing, selected (targeted) groups of
consumers (segments). Competing brands have similar customer profiles and share a
customer base and, when competing, match what they offer rather than differentiate
it.
Customer attitudes are probabilistic, not constant over time and the basis for
distinguishing a brand from its competitors is not positioning but its distinctive style.
Consumer loyalty is a key factor in choice, but the form of this loyalty is
behavioural, habitual (as opposed to loyalty as a conscious effect of the offer
selection process) and aims to simplify the consumer’s decision. The adopted
principles of brand growth can be applied to brand portfolio management.
3. Empirical Research Design
3.1 Research Objectives, Hypotheses and Construct
The criticism of STP and the proposal of a new approach to brand portfolio
management creates an alternative and provides an opportunity to increase the
effectiveness of brand portfolio management. Therefore, the main objective of this
research is to determine the degree of variation in the results of brand portfolio
management achieved by organisations that use the STP model and those that are
based on the EBM model. Criteria specific to the STP model and to the EBM model
were defined based on analysis of the relevant literature. The favourability of the
expected results was achieved based on the declared market performance. Two
hypotheses were formulated for the defined objective:
H1: Brand portfolio management (BPM) in the surveyed organisations is mostly
based on the traditional STP model.
H2: Organisations managing a brand portfolio based on the EBM concept achieve
higher declared market performance than organisations based on the STP approach.
The adopted goal and research hypotheses determined the shape of the intellectual
research construct – identification of the key variables, the relations between them
and a definition and description of the independent (STP model – STP, EBM model
– EBM) and dependent variable (Market Performance – MP). The starting point for
the development of the independent variables was to select areas of brand portfolio
management where both concepts would be compared.

New Perspective on Brand Portfolio Management
858
On the basis of literature studies (Aaker, 2004; Morgan and Rego, 2009; Uggla,
2013), two basic directions of brand portfolio changes were identified – expansion
and optimisation, for which the key areas of the organisation’s activity were then
identified. When describing the area of expansion, the focus was on areas of organic
growth of the brand portfolio i.e., the introduction of a new brand or the expansion
of an existing brand, while alliances or the purchase of brands were not taken into
account (Riezebos, 2003).
The reason for this decision was to strive for maximum simplification of the model
in light of the diversity and natural complexity of the surveyed area, which affected
the level of complexity of the tools used (questionnaire) and, consequently, the
potential quality of the data obtained. In describing activities related to portfolio
optimisation, the focus was on issues linked with the allocation of the marketing
budget as well as the area of brand portfolio reduction. In the case of portfolio
reduction, the simplification involved limiting the considerations to the issue of
removing the brand, leaving aside the strategy of milking, brand consolidation or
brand sale issues.
In addition to the above-mentioned pursuit of maximum simplicity, the reason for
these decisions was also to focus on aspects that emphasise the differences in the
STP model versus the EBM model, which are the criteria for selecting a brand to be
removed from the portfolio and the assumptions concerning the effects of such an
operation. For the defined areas, the key features of the STP and EBM concepts for
brand portfolio management (BPM) were summarised – as shown in Table 2.
Table 2. Summary of key features of the STP and EBM concepts in the areas of
brand portfolio management
STP model EBM model
Launching
new brands
New segment (market niche) as a
prerequisite for launching a new
brand
The ability to build physical
availability (distribution) and then
mental availability as a prerequisite
for launching a new brand
Unique positioning as a key
condition for the success of a new
brand
Distinctiveness as a key condition
for the success of a new brand
The new brand will take over
customers from its closest competitor
in the segment
The new brand will take over the
turnover from all players in the
category, in proportion to their scale,
mainly from the leader
One segment – one brand principle Penetration as a primary objective
Precision of positioning as a tool to
increase brand scale
Distinctiveness of the brand (ease of
recognition) is more important than
positioning (uniqueness)
Brand
extension
The basis for brand extension is the
ability to enter a new, previously
unsupported segment
The basis for brand extension is the
possibility of building additional
penetration

Robert Kozielski, Magdalena Kalińska-Kula, Michał Medowski
859
The brand should not enter a
segment served by another brand in
the portfolio
Brands may be present in the same
segment as long as they are
distinct/characteristic
The limits of brand extension are
determined by its positioning
The limits of brand extension are
determined by maintaining the
characteristic style (distinctiveness)
and financial parameters
Budget
allocation
Differentiated investment priorities
focused on targeted users (frequency
of purchases, volume of purchases,
loyalty)
Investment priorities related to
building mental and physical
availability (advertising, distribution)
Key objective – increasing the share
of requirements (SOR) of key users
Key objective: increase market
presence – penetration
Additional funds invested in unique
brands (with clear USPs) as those
with the greatest chances for growth
Additional funds invested to achieve
incremental brand portfolio
penetration
Price promotions build consumption
and buying habits
Price promotions are a short-term
tool and do not build a customer base
for the future
Brand
portfolio
simplificatio
n
Elimination of internal competition
of brands in the given segment as a
legitimate reason for removing a
certain brand from the portfolio
The only reason for removing a
brand from the portfolio is financial
parameters
In the case of the necessity to
remove a brand from the portfolio,
the priority is given to duplicating
brands present in the same segments,
with similar positioning
In the case of the necessity to
remove a brand from the portfolio,
the priority is given to the smallest
brands (with the lowest penetration
and turnover) and the least
distinctive ones
The consumption of the removed
brand will be transferred to other
brands in the portfolio (reverse
cannibalisation)
The consumption of the removed
brand will be taken over by all
brands on the market in proportion to
their scale
Source: Own elaboration.
3.2 Research Methods and Sampling
The main study was preceded by qualitative research (in-depth interview (IDI)
method) – the aim of which was to verify the research construct with academicians
and practicians as well as pilot studies. The quantitative research was conducted in
the second half of 2018 using the computer assisted web interview (CAWI) method.
The general population consisted of companies who conduct their market activity in
Poland and manage at least three brands in their portfolios. The selection of the
sample for the study was made using targeted selection (the selection criteria were
the number of brands in the portfolio). After the formal technical and content-related
analysis of the answers provided, 342 units were selected for final statistical

New Perspective on Brand Portfolio Management
860
analysis. The vast majority were industrial organisations as well as medium and
large companies, with revenues ranging from EUR 2 to 10 million, that operate
internationally (Table 3). In terms of portfolio size, all organisations in the sample
managed a minimum of three brands (which was the result of targeted selection), of
which 44% managed a portfolio of more than five brands. People taking an active
part in brand portfolio management in the surveyed organisations were asked to
participate in the survey.
Table 3. Sample structure Sector Revenues
Industry 51% Less than EUR 2 million 20%
Agri-food processing 10% EUR 2 - 10 million 41%
Agriculture and fisheries 2% EUR 10.1 - 50 million 28%
Construction industry 5% More than EUR 50 million 11%
Banks 5% Scale of operations
Insurance, finance, law 4% International 58%
FMCG, trading 10% Polish 32%
Services 4% Local 10%
Communications, IT,
advertising, media
5%
Administration, education,
health care
4%
Company size
Up to 10 employees 1%
11 - 50 17%
51 - 250 30%
251 - 500 39%
Above 500 13%
Source: Own research, 2018 (N=342).
The theoretical construct built made it possible to translate the key features of
individual models into questions in the questionnaire, which allowed for the
subsequent construction of an operational model and identification of independent
variables - brand portfolio management models (EBM and STP) implemented by the
organisation. It is worth noting that the STP and EBM models are alternative
concepts for brand growth but they are not dichotomous in terms of individual
behaviour. It is therefore possible that in one organisation there are behaviours that
are characteristic of the STP model and, at the same time, the behaviours that are
characteristic of the EBM model.
The difference lies largely in the composition and role of the individual components.
Based on this information, it was therefore decided that the independent variables
(dimensions describing the EBM and STP models) would be analysed as non-
dichotomous variables (the possibility that the behaviour of the STP and EBM
models occurs in a single organisation), which formed the basis for the subsequent
construction of the measurement tool and for the analysis.

Robert Kozielski, Magdalena Kalińska-Kula, Michał Medowski
861
The participants were required to complete the survey, designed in the form of
structured close-ended questions, which comprises of four sections. Section A was
related on the portfolio expansion, section B gathered the respondents’ opinions on
the allocation of funds, section C asked the respondents their perception on brand
extension and finally, section D was related to portfolio simplification. Statements
reflecting the organisation's business practices and attitudes were measured on a
five-point Osglood scale and statements reflecting the decisions-making criteria that
the company would use were measured on a nominal scale.
The 0-1 system was adopted as the encoding rule for the nominal scales. For the
Osgood scales, as an encoding rule, it was assumed that the value ‘1’ would be
assigned to attitudes clearly positive to the statement (i.e., scores 4 and 5 expressed
by respondents based on a scale of 1-5), while negative or neutral attitudes (i.e.,
scores from 1 to 3) would be assigned ‘0’. This type of attribution directly results
from the assumption that there is no dichotomy of independent variables – a negative
attitude of the respondent towards the key statement for the EBM model does not
mean that they agree to the statements according to the STP model, likewise a
positive attitude towards statements specific to the EBM model does not exclude a
positive attitude towards other statements - characteristic of the STP model. As a
result, each of the models could receive from 0 to 16 points and the identification of
the independent variables was designed as follows:
− STP variable (STP) – understood as the obtained number of indications to
the dimensions describing the STP model (also expressed as a percentage of
obtained points from the maximum 16);
− EBM variable (EBM) – understood as the obtained number of indications to
the dimensions describing the EBM model (also expressed as a percentage
of obtained points from the maximum 16).
In order to separate groups of entities implementing a specific model, the
classification method was used which introduced a grouping variable called the
Implemented Model (IM). When grouping, the possibility of the simultaneous
occurrence of behaviour characteristic of both models in a given organisation was
taken into account, as it was assumed that the IM variable would have four classes
(groups):
− Integrating Model (M-INT) – organisations for which both the STP variable
(STP) and the EBM variable (EBM) received more than 50% of the
indications;
− STP model (M-STP) – organisations for which the STP variable (STP)
received more than 50% of the indications and, at the same time, no more
than 50% of the indications to the Sharp variable (EBM) was recorded;

New Perspective on Brand Portfolio Management
862
− EBM model (M-EBM) – organisations for which the EBM variable (EBM)
received more than 50% of the indications and, at the same time, no more
than 50% of the indications to the STP variable (STP) was recorded;
− General Model (M-GEN) – organisations for which both the STP variable
(STP) and the EBM variable (EBM) received less than 50% of the
indications.
The identification of dependent variables – market performance and efficiency of
market activities – was made on the basis of constructed indices i.e., market
performance (MP) and efficiency of market activities (EMA). The first one (MP)
consisted of the evaluation of revenues, profits, market shares and brand strength.
Each of the elements was assessed on the Osgood scale in three perspectives: in
relation to the previous year, in relation to the key competitor and in relation to
market average, which in total gave twelve items constituting the aggregated MP
index (calculated as an average of sub-ratings).
An exploratory factor analysis (EFA) was conducted to assess the internal structure
of the MP scale. The degree of similarity between individual variables was
determined using Pearson’s correlation coefficient. The coefficients on the diagonal
of the correlation preimage matrix exceeded the threshold value of 0.5. The
Bartlett’s test of sphericity was 2741.710 (approximate χ2) at 66 degrees of freedom
and the value of p=0.000 and the Kaiser-Meyer-Olkin (KMO) measure was 0.938.
As a result of the exploratory factor analysis conducted using the method of
generalised least squares, the twelve input variables were reduced to one dimension.
The total explained variance was 56.77% thus more than half of the overall input
data variability was explained by the factor created. The factor loadings’ matrix was
rotated using the Varimax method with Kaiser normalisation. All factor loadings
included in the separated factor were greater than 0.7. An analysis of the reliability
of the scale showed that the consistency of the construct was very good –
Cronbach’s alpha was 0.938 and removing any of the variables would have reduced
the reliability of the scale.
4. Results
4.1 STP or EBM – Predominant Approach
The first research hypothesis was the statement that brand portfolio management in
the examined organisations is mostly based on the STP model. An average moment
of assertion was assumed for the hypothesis, which resulted from the fact that it was
created on the basis of a deduction process based on a literature analysis. When
examining the values of the STP and EBM variables obtained by individual
organisations, it was found that 46% of the surveyed companies were characterised
by a higher intensity of the STP variable than the EBM variable.
Robert Kozielski, Magdalena Kalińska-Kula, Michał Medowski
863
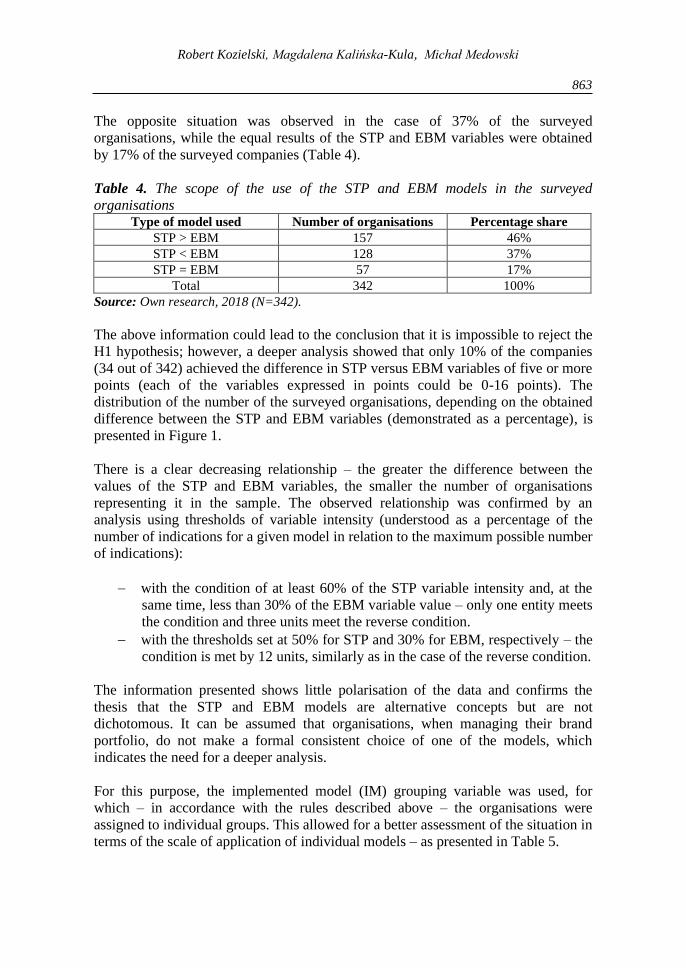
The opposite situation was observed in the case of 37% of the surveyed
organisations, while the equal results of the STP and EBM variables were obtained
by 17% of the surveyed companies (Table 4).
Table 4. The scope of the use of the STP and EBM models in the surveyed
organisations Type of model used Number of organisations Percentage share
STP > EBM 157 46%
STP < EBM 128 37%
STP = EBM 57 17%
Total 342 100%
Source: Own research, 2018 (N=342).
The above information could lead to the conclusion that it is impossible to reject the
H1 hypothesis; however, a deeper analysis showed that only 10% of the companies
(34 out of 342) achieved the difference in STP versus EBM variables of five or more
points (each of the variables expressed in points could be 0-16 points). The
distribution of the number of the surveyed organisations, depending on the obtained
difference between the STP and EBM variables (demonstrated as a percentage), is
presented in Figure 1.
There is a clear decreasing relationship – the greater the difference between the
values of the STP and EBM variables, the smaller the number of organisations
representing it in the sample. The observed relationship was confirmed by an
analysis using thresholds of variable intensity (understood as a percentage of the
number of indications for a given model in relation to the maximum possible number
of indications):
− with the condition of at least 60% of the STP variable intensity and, at the
same time, less than 30% of the EBM variable value – only one entity meets
the condition and three units meet the reverse condition.
− with the thresholds set at 50% for STP and 30% for EBM, respectively – the
condition is met by 12 units, similarly as in the case of the reverse condition.
The information presented shows little polarisation of the data and confirms the
thesis that the STP and EBM models are alternative concepts but are not
dichotomous. It can be assumed that organisations, when managing their brand
portfolio, do not make a formal consistent choice of one of the models, which
indicates the need for a deeper analysis.
For this purpose, the implemented model (IM) grouping variable was used, for
which – in accordance with the rules described above – the organisations were
assigned to individual groups. This allowed for a better assessment of the situation in
terms of the scale of application of individual models – as presented in Table 5.

New Perspective on Brand Portfolio Management
864
Figure 1. The number of organisations surveyed depending on the difference
between the STP and EBM variables.
10
20
30
40
50
60
70
80
90
100
Nu
mb
er o
f org
an
isati
on
s
Source: Own research, 2018 (N=342).
Table 5. Distribution of the number of groups in the implemented model (IM)
variable IMPLEMENTED
MODEL Frequency Percentage Valid percent’
Cumulative
percent'
M-INT 72 21.1 21.1 21.1
M-STP 74 21.6 21.6 42.7
M-EBM 39 11.4 11.4 54.1
M-GEN 157 45.9 45.9 100.0
Total 342 100.0 100.0
Source: Own research, 2018 (N=342).
When comparing only the popularity of the STP model with the EBM model, it can
be concluded that the STP model is significantly more frequently used than the EBM
model (21.6% frequency in the case of M-STP versus 11.4% for M-EBM). In order
to verify the hypothesis regarding the frequency of use of the STP model in relation
to the EBM model among the surveyed companies, the equality test of two structure
indices was used, for which the materiality level of p=0.0002 was obtained.
Therefore, the hypothesis of the equal frequency of use of the STP and EBM models
was rejected in favour of the hypothesis that STP is used more often than EBM. It
should be noted, however, that the frequency of occurrence of the integrating model
with a relatively high intensity of behaviours characteristic of both concepts (M-
INT) is 21.1%; hence, it is almost as high as for STP. At the same time, the results of
the analysis indicate the General group (M-GEN), whose size is almost half of the
surveyed sample (45.9%), as the most numerous group of entities in which – based
on the adopted construct – neither STP nor the EBM model can be assigned.
On the basis of the above conclusions, it should be concluded that in the light of the
results obtained, the STP model is not the model on which brand portfolio
management in the surveyed organisations is currently mostly based. It can be
Robert Kozielski, Magdalena Kalińska-Kula, Michał Medowski
865
concluded that behaviours identified as characteristic of STP (M-STP group size)
occur more frequently than behaviours characteristic of the EBM model (M-EBM
group size), but not to the extent that it is possible to assign most of the entities
surveyed to the STP model. It was, therefore, concluded that the H1 research
hypothesis should be rejected.
4.2 Model Applied and Market Performance
The analysis of the scale of application of particular BPM models made it possible to
identify a general or explicit BPM strategy as the main division between the
surveyed organisations. The explicit strategy includes the integrating model (M-
INT), the EBM model and the STP model. The scale of particular models’
application actually varies depending on the area of brand portfolio management.
This may indicate inconsistencies in the organisations’ choices with regard to the
adopted BPM models and is the reason for a small variation in the data. It should be
noted that both strategies (explicit and general) are strongly based on financial and
operational issues but the explicit strategy additionally strongly takes into account
market and brand aspects related to BPM. Almost half of the companies surveyed
apply the general strategy i.e., the one in which there is insufficient intensity of
characteristic features of either the STP or the EBM approach.
These conclusions were taken into account in the next stage of the research work by
analysing the relationship between the defined BPM models and the market
performance of the organisations surveyed. This was intended to verify the H2
research hypothesis that organisations applying the EBM approach to brand portfolio
management achieve higher declared market performance than the organisations that
use the STP model.
In order to verify the H2 hypothesis, the differences between the examined groups of
the IM variable at the level of the aggregated market performance (MP) index were
analysed. To this end, a one-way between-group analysis of variance (ANOVA) was
conducted. The results of the analysis showed that the compared groups differ
significantly statistically: FWelch’s4 (3; 114.94) = 21.33; p < 0.001; η2 = 0.18, which
means that the type of the implemented model (IM) differentiates values of the
aggregated MP index and the observed effect is a relatively strong one (Cohen,
1988).
This also explains 18% of the total variability of the results obtained in the measured
value of the aggregated MP index. The values of the MP index for particular groups
(models) are presented in Table 6.
4The Levene’s test of homogeneity of variance showed that variances in the compared groups
are heterogeneous (p<0.001) hence a correction on the number of Welch’s degrees of
freedom was applied.

New Perspective on Brand Portfolio Management
866
Table 6. Implemented BPM model versus aggregated MP index
Index M-INT
N = 72
M-STP
N = 74
M-EBM
N = 39
M-GEN
N = 157
MP M SD M SD M SD M SD
4.00 0.80 3.77 0.56 3.54 0.60 3.34 0.44
Source: Own research, 2018 (N=342).
To determine which differences were statistically significant, post hoc tests were
conducted. In light of the results of the Levene’s test (uneven variances), the Games-
Howell adjustment was adopted for the post hoc tests – as shown in Table 7.
Table 7. Multiple comparison (Games-Howell post-hoc test) for the aggregated
market performance index MP
(I) IMPLEMENTED
MODEL
(J) IMPLEMENTED
MODEL
Mean
difference
(I-J)
Standard
error Significance
M-INT
M-STP 0.23079 0.11424 0.186
M-EBM 0.45922* 0.13380 0.005
M-GEN 0.65427* 0.10025 0.000
M-STP
M-INT -0.23079 0.11424 0.186
M-EBM 0.22843 0.11552 0.206
M-GEN 0.42347* 0.07412 0.000
M-EBM
M-INT -0.45922* 0.13380 0.005
M-STP -0.22843 0.11552 0.206
M-GEN 0.19504 0.10171 0.234
M-GEN
M-INT -0.65427* 0.10025 0.000
M-STP -0.42347* 0.07412 0.000
M-EBM -0.19504 0.10171 0.234
Note: * The mean difference is significant at the 0.05 level.
Source: Own research, 2018 (N=342).
The highest value of the aggregated MP index was recorded in the group of the
surveyed entities implementing the M-INT integrating model – the average result in
this group was statistically significantly higher than in the surveyed enterprises that
apply the M-EBM (p < 0.0) and the companies that apply the M-GEN model (p <
0.001). Moreover, the companies which implemented the M-STP model achieved
higher values of the MP index than the companies from the M-GEN group
(p<0.001). It can be seen that the surveyed companies which implemented the M-
GEN model achieved the lowest result of MP. A more conservative Tamhane’s T2
test was also performed for comparison. The results of the Tamhane’s test are
consistent with those of the Games-Howell test although the materiality level varies
slightly. Therefore, we can conclude – with a fairly high degree of certainty – that
the average values in the indicated groups differ significantly statistically.
The results of the analysis showed that the organisations applying an explicit
strategy, i.e., using the M-INT integrating model or one of the M-EBM or M-STP

Robert Kozielski, Magdalena Kalińska-Kula, Michał Medowski
867
models, achieve significantly higher declared market performance values
(aggregated MP) than the organisations which apply a general strategy (M-GEN
group). At the same time, the results indicate that organisations which base their
brand portfolio management on the EBM model do not achieve the declared market
performance significantly higher than organisations using the STP model. The
results of the aggregated MP index for the M-STP and M-EBM groups do not differ
in a statistically significant way, meaning that the H2 research hypothesis should be
rejected.
In light of the above conclusions, it seems that it is the explicitness of the BPM
strategy that is the key factor influencing the declared market performance of the
organisation and this factor is much more important than the type of model used.
Moreover, if the values achieved by the STP and EBM variables are taken
simultaneously as a kind of ‘intensity of explicitness’ of the BPM strategy, it can be
seen that the higher the intensity, the better the declared market performance. The
lowest values of the aggregated MP index were obtained by the M-GEN group i.e.,
organisations not assigned to any model. The second place (higher than M-GEN) in
the order of indication of the aggregated MP index was obtained by groups assigned
to one of the models; however, the type of assignment was not very important (the
difference of M-GEN compared to the STP model is statistically significant but the
difference between STP and the EBM model is not statistically significant hence the
conclusion that there are no differences for aggregated MP between those models).
The highest indications of the aggregated MP index were obtained by the M-INT
group, where assignment rates for both models (values of the STP and EBM
variables) were higher than 50%. This can be interpreted by treating the explicitness
of the BPM strategy as a kind of measure of ‘market orientation’ in terms of brand
portfolio management.
5. Discussion and Conclusion
The aim of the research was to identify the brand portfolio management (BPM)
model characterised by more favourable results for the organisation. Two alternative
(but not dichotomous) models were compared – the one based on the STP concept
and the one based on the EBM brand growth concept. In the context of the ongoing
scientific discussion on brand growth models, as well as the EBM concept available
as an alternative to STP, research hypotheses were constructed on the predominant
scale of application of the STP model (H1), higher market performance (H2) of the
organisations that manage their brand portfolio according to the EBM concept
compared to those closer to STP.
The analysis made it possible to reject research hypotheses. In the case of the first
hypothesis, STP is a more popular approach to BPM than the EBM model, but not
enough to be considered the dominant behaviour model in this area. The low level of
formal knowledge of BPM models (and EBM in particular) may be the reason why

New Perspective on Brand Portfolio Management
868
organisations do not make an informed choice of the model but rather make
individual decisions based on the available knowledge (often related to traditional
elements of STP) and, above all, market experience. This explains the clearly greater
popularity of behaviours characteristic of the STP model in the area of brand
introduction to the market (where STP suggests a structure of thinking about the
market) and behaviours characteristic of the EBM model in the area of budget
allocation (the model guidelines are probably intuitively consistent with the
experience of companies). At the same time, this model of behaviour makes
organisations inconsistent and, in fact, often follow a mixed model.
The research and analysis also resulted in the rejection of the second hypothesis that
companies using the EBM approach achieve better market results. At the same time,
however, there is a strong link between the explicitness of the strategy and market
performance. The most explicit group (M-INT) achieved the highest aggregated
values of the MP index. It can be assumed that it was possible due to the strong
orientation and importance given to the issues related to the market aspects of brand
portfolio management (the model used) and its results. This is in line with the
conclusions from previous observations on the scale of application of the BPM
models, which stated that it is the explicitness of the strategy (or lack thereof) is the
main dividing line between the surveyed organisations.
It is somewhat surprising that, as part of an explicit strategy, there is no significant
difference in the declared market performance for the EBM and STP models.
Certainly, the small number of organisations mentioned above, characterised by a
large difference between the STP and EBM variables, is of importance. This means
that organisations implement different models in individual BPM areas and the final
assignment to a given model is not the result of a consistent strategy but the result of
the behaviour/models adopted in specific areas. This also explains why, for most
organisations, the final values of STP and EBM variables are not so distant, while
the variation within individual BPM areas is much higher.
Finally, the proximity of the values of STP and EBM variables explains the
proximity of the MP results. In other words, one can be tempted to say that it is not
the type of strategy itself that is crucial, but its explicitness – understood as the
consequences and intensity of implementation.
An interesting research problem that emerges for future research is to check how the
adopted BPM model affects the results of the organisation’s activities in a given area
(brand introduction, budget allocation, brand extension, portfolio simplification). It
can be assumed that the STP results versus the EBM results will be more diverse.
The conducted research does not allow for this because the analysis of the
correlation between the BPM model adopted in a given area and the organisation’s
market performance would require an assessment of the area’s role in the shaping of
market performance as a moderating variable, which would require additional

Robert Kozielski, Magdalena Kalińska-Kula, Michał Medowski
869
research. In addition, the analysis made at the level of individual areas would require
a more individualised selection of performance indices and time horizon as portfolio
simplification, for example, in the annual perspective will usually have a negative
effect on revenues, regardless of the adopted BPM model.
6. Practical Implications, Research Limitations and Future Studies
In terms of practical applications of the results of the research, the conclusion that
the explicitness and consistency of the implemented strategy are of significant
importance for the organisation’s market performance and, also, in the area of brand
portfolio management seems to be crucial. This conclusion leads to
recommendations for companies concerning the building of marketing knowledge
and competencies that enable explicit BPM strategies to be created and implemented
i.e., those that are oriented towards market and brand aspects, and not only financial
and parametric issues. The assumption of investing in building marketing
competencies is not new but – in the context of the analysed research results – it
received additional support. Before drawing final conclusions, it is also necessary to
check how the implemented brand portfolio management strategy and the adopted
models translate into the efficiency of the organisation’s market activities.
As far as recommendations for practice are concerned, the results obtained do not
allow to clearly indicate the model of brand portfolio management that should be
implemented. The basic recommendation for business practice should be a greater
focus on the market aspects of BPM-related decisions, not being limited to financial
aspects alone and the overall business context. In other words, the recommendation
would be to increase the explicitness of the adopted strategy of brand portfolio
management, regardless of the adopted BPM model (which, in fact, may vary from
area to area – brand introduction, budget allocation, brand extension, portfolio
simplification).
In the context of the interpretations adopted in the paper, it can be proposed that the
realisation of the postulation to increase the explicitness of the strategy should be
made on two levels. The first is to increase the level of formal knowledge of existing
BPM models, guidelines and techniques, and – in particular – to accelerate the
diffusion of new knowledge in this area. The second level is to build a base for the
organisation’s own unique knowledge resulting from the market experience gathered
and conclusions.
A number of solutions supporting knowledge management in an organisation are
available on the market, based both on formal systems (e.g., SAP) enabling, for
example, post-evaluation of conducted promotional campaigns, and on systems
facilitating the flow of knowledge within the organisation (e.g., Yammer). The
combination of both levels of knowledge building will enable organisations to create
a resource of conscious knowledge, a habit of reflection and, consequently, a

New Perspective on Brand Portfolio Management
870
resource of tacit knowledge and business intuition enabling the best patterns of
behaviour to be developed.
The above conclusions pave the way for continuing and undertaking new research in
the area of brand portfolio management. An indication of possible directions for
further research is also determined by the awareness of research limitations, which
were the basis of our analyses and conclusions. The first limitation is the way the
organisation’s performance is measured. Although, based on the conclusions of
Ambler and Kokkinaki (1997), perception data was considered to be an acceptable
way of measuring the organisation’s business performance, the supplementation of
knowledge with directly transactional information resulting from customers’
purchasing behaviour would allow for greater objectivity and precision of
assessment as well as (with a properly selected methodology) enabling a more
detailed analysis in particular areas of brand portfolio management.
Another limitation of the research was also the deliberate selection of the sample.
Although the sample size of 342 units was significant, the lack of randomness of the
selection and the lack of a larger sample size makes it impossible to treat the results
of the survey as representative. A natural limitation of the research is the intellectual
construct itself. The latent nature of the independent variables made it necessary to
introduce certain assumptions about the EBM and STP models. This means that the
research results obtained can only be considered in the context and framework
defined by the adopted construct.
The postulated direction of further research would certainly be a more detailed
analysis of particular areas of BPM and the relations between the behaviours
implemented by organisations in a given area and their performance. Such research
would require the development of a separate methodology as well as supplementing
the intellectual construct with more precise descriptions of behaviours (markers)
characteristic of particular BPM models. It seems to be an interesting idea to
examine the interdependence of individual practices with the performance of the
organisation in a given area. Perhaps this would make it possible to determine the
key (associated with the best results) behaviours of the organisation and check which
models they belong to.
As a consequence, it could lead to the creation of a completely new model consisting
of the ‘most efficient’ BPM behaviours. Certainly, further work on the issues raised
and possible research projects should be conducted on larger samples selected at
random and through direct forms of transactional data collection. This obviously
requires a lot more resources. Due to the level of costs, the first step seems to be to
conduct case studies, which will make it possible to refer to both the conclusions of
the research already conducted and, above all, to design further quantitative studies
more precisely.
Robert Kozielski, Magdalena Kalińska-Kula, Michał Medowski
871
References:
Aaker, D.A. 2004. Leveraging the Corporate Brand. California Management Review, 46(3),
6-18. https://doi.org/10.1177/000812560404600301.
Ambler, T., Kokkinaki, F. 1997. Measures of Marketing Success. Journal of Marketing
Management, 13, 665-678. https://doi.org/10.1080/0267257X.1997.9964503.
Barksdale, H.C., Darden, B. 1971. Marketer’s Attitude Towards the Marketing Concept.
Journal of Marketing, 35, 29-36. https://doi.org/10.1177/002224297103500406.
Bartles, R. 1957. Can Marketing Be a Science? Journal of Marketing, 15, 319-328.
https://doi.org/10.1177/002224295101500306.
Barwise, P., Meehan, S. 2004. Simply Better: Winning and Keeping Customers by
Delivering What Matters Most. Boston: Harvard Business School Press.
Biglione, S. 2016. To target or not to target, that is not the question. LinkedIn, 15.
https://www.linkedin.com/pulse/target-question-shann-biglione.
Blois, K., Dibb, S. 2000. Market Segmentation. Oxford Textbook of Marketing, Oxford.
Bogomolova, S., Romaniuk, J. 2009. Brand defection in a business-to-business financial
service. Journal of Business Research, 62(3), 291-296.
https://doi.org/10.1016/j.jbusres.2008.05.008.
Brady, J., Davis, I. 1993. Marketing’s Mid-Life Crisis. The McKinsey Quarterly, 2.
Brennan, R. 2008. Theory and practice across disciplines: implications for the field of
management. European Business Review, 20(6), 515-528.
https://doi.org/10.1108/09555340810913520.
Brennan, R., Ankers, P. 2004. In search of relevance: is there an academic–practitioner
divide in business-to-business marketing? Marketing Intelligence & Planning, 22(5),
511-519. https://doi.org/10.1108/02634500410551897.
Brownlie, D., Saren, M., Whittington, R., Wensley, R. 1999. Rethinking Marketing –
Towards Critical Marketing Accountings. London: Sage Publications.
Brownlie, D., Saren, M., Whittington, R., Wensley, R. 1994. The New Marketing Myopia:
Critical Perspectives on Theory and Research in Marketing–Introduction. European
Journal of Marketing, 28(3), 6-12.
Canhoto, A.I., Clark, M., Fennemore, P. 2013. Emerging Segmentation Practices in the Age
of the Social Customer. Jornal of Strategic Marketing, 21(5), 414-425.
https://doi.org/10.1080/0965254X.2013.801609.
Chailan, C. 2010. From an aggregate to a brand network: a study of the brand portfolio at
L'Oréal. Journal of marketing management, 26(1-2), 74-89.
https://doi.org/10.1080/02672570903461130.
Cohen, J. 1988. Statistical Power Analysis for the Behavioral Science. New York: Routledge.
Collins, J., Denyer, D., Turnbull, J.K. 2008. Educating the Evidence-based Manager: the
Executive Doctorate and its Impact on Management Practice. Organization Knowledge
Learning and Capabilities Conference. Copenhagen.
Converse, P.D. 1945. The Development of the Science of Marketing – An Exploratory
Survey. Journal of Marketing, 10, 14-23. https://doi.org/10.1177/002224294501000103.
Davis, S. 2005. Fixing Brand Bloat: Put Focus on Consumer-Centric Portfolio Strategy.
Point, 5 July.
Dawes, J., Mundt, K., Sharp, B. 2009. Consideration sets for financial services brands.
Journal of Financial Services Marketing, 14(3), 190-202.
https://doi.org/10.1057/fsm.2009.19.

New Perspective on Brand Portfolio Management
872
Dibb, S., Simkin, L. 2001. Market segmentation: diagnosing and treating the barriers.
Industrial Marketing Management, 30(8), 609-625. https://doi.org/10.1016/S0019-
8501(99)00127-3.
Dickson, P.R., Ginter J.L. 1987. Market segmentation, product differentiation, and marketing
strategy. Journal of Marketing, 51(2), 1-10.
https://doi.org/10.1177/002224298705100201.
Ehrenberg, A. 1972. An Experimental Approach To Consumer Dynamics. Public Opinion
Quarterly, 36(3), 435-435.
Ehrenberg, A., Goodhardt, G.J., Barwise, T.P. 1990. Double Jeopardy Revisited. Journal of
Marketing, 54(3), 82-91. https://doi.org/10.1177/002224299005400307.
Ehrenberg, A., Goodheardt, G. 2002. Double jeopardy revisited, again. Marketing Research,
14(1), 40-41.
Fullerton, R. 2012. The historical development of segmentation: the example of the German
book trade 1800‐1928. Journal of Historical Research in Marketing, 4(1).
Hammond, K., Ehrenberg, A., Goodhardt, G. 1996. Market segmentation for competitive
brands. European Journal for Marketing, 30, 39-49.
https://doi.org/10.1108/03090569610153291.
Harrigan, P., Hulbert, B. 2011. How Can Marketing Academics Serve Marketing Practice.
Journal of Marketing Education, 33(3), 253-272.
https://doi.org/10.1177/0273475311420234.
Hooley, G., Saunders, J. 2004. Marketing Strategy and Competitive Positioning. London:
Prentice Hall.
Hunt, S.D. 1976. The Nature and Scope of Marketing. Journal of Marketing, 40, 17-28.
https://doi.org/10.2307/1249990.
Hunt, S.D. 2011. The Theory of Monopolistic Competition, Marketing’s Intellectual History,
and the Product Differentiation versus Market Segmentation Controversy. Journal of
Macromarketing, 31(1), 73-84. https://doi.org/10.1177/0276146710382119.
Kall, J., Hajdas, M. 2010. Zarządzanie portfelem marek. Warszawa: Oficyna Wolters Kluwer
Business.
Kennedy, R., Ehrenberg, A. 2001. Competing retailers generally have the same sort of
shoppers. Journal of Marketing Communications, 7(1), 19-26.
Kennedy, R., Ehrenberg, A. 2000. Brand User Profiles Seldom Differ, Report 7 for
Corporate Members. Ehrenberg-Bass Institute for Marketing Science.
Kliemann, H. 1928. Wie und wo erfasse ich Kaeuferschichten? Einteilung der
Kaeufermassen in Interessenschichten als Grundlage des Verkaufs-unf
Productionsplanes. Vienna, Berlin, Leipzig, C. Barth.
Kohli, A., Jaworski, B.J., Kumar, A. 1993. MARKOR – A Measure of Market Orientation.
Journal of Marketing Research, 30, 467-477.
https://doi.org/10.1177/002224379303000406.
Kotler, Ph., Levy, S. 1969. Broadening the Concept of Marketing. Journal of Marketing,
33(1), 10-15. https://doi.org/10.1177/002224296903300103.
Kourdi, J. 2011. The Marketing Century – How Marketing Drives Business and Shapes
Society. London, John Wiley & Sons.
Lee, N., Greenley, G. 2010. The theory-practice divide: thoughts from the Editors and Senior
Advisory Board of EJM. European Journal of Marketing, 44(1/2), 5-20.
https://doi.org/10.1108/03090561011020147.
Levitt, T. 1960. Marketing Myopia. Harvard Business Review, 38.

Robert Kozielski, Magdalena Kalińska-Kula, Michał Medowski
873
Low, G., Fullerton, R. 1994. Brands, Brand Management, and the Brand Manager System:
A Critical-Historical Evaluation. Journal of Marketing Research, XXXI, 173-190.
https://doi.org/10.1177/002224379403100203.
McDonald, M., Dunbar, I. 2012. Market Segmentation. How to Do It and How to Profit
From It. London, John Wiley&Sons.
McKitterick, J.B. 1957. What is Marketing Management Concept. In: F.M., Bass, Frontiers
of Marketing Thought and Science. American Marketing Association.
Morgan, N., Rego, L. 2009. Brand Portfolio Strategy and Firm Performance. Journal of
Marketing. https://doi.org/73. 10.1509/jmkg.73.1.59.
Neff, J. 2017. The World According To Sharp. Advertising Age, 88(13).
Piercy, N., Morgan, N. 1993. Strategic and operational market segmentation. A managerial
analysis. Journal of Strategic Marketing, 1, 123-140.
https://doi.org/10.1080/09652549300000008.
Poulis, K. 2021. Complexity as an empirical tendency: Promoting non-measurement as a
means to enhanced understanding. European Management Journal, 39/4, 487-496.
Reibstein, D.J., Day, G., Wind, J. 2009. Is marketing academia losing its way? Journal of
Marketing, 73(4), 1-3. https://doi.org/10.1509/JMKG.73.4.1.
Riezebos, R. 2003. Brand Management: A Theoretical and Practical Approach. Harlow,
Prentice Hall-Financial Times.
Romaniuk, J. 2018. Building distinctive brand assets. Oxford, University Press.
Romaniuk, J., Sharp, B. 2003. Brand salience and customer defection in subscription
markets. Journal of Marketing Management, 1(2), 25-44.
https://doi.org/10.1080/0267257X.2003.9728200.
Romaniuk, J., Sharp, B. 2004. Conceptualizing and measuring brand salience. Marketing
Theory, 4(4), 327-342. https://doi.org/10.1177/1470593104047643.
Rowley, J.J. 2012. Evidence-based marketing. A perspective on the ‘practice-theory divide.
International Journal of Market Research, 54(4), 521.
Rust, R.T., Moorman, C., Balla, G. 2010. Rethinking marketing. Harvard Business Review,
88(1), 1-9.
Sharp, B. 2010. How Brands Grow. What Marketers Don't Know. Oxford, University Press.
Sharp, B. 2013. Marketing. Theory, Evidence, Practice. Oxford, University Press.
Sharp, B., Romaniuk, J. 2016. How brands grow. Part 2: Including emerging markets,
services and durables, new brands and luxury brands. Oxford, University Press.
Shaw, R. 1998. Improving Marketing Effectiveness. London, The Economist Newspaper
Ltd.
Sheth, J.N., Sisodia, R.S. 2005. Does Marketing Need Reform? Journal of Marketing, 69.
Sheth, J.N., Sisodia, R.S. 2006. Does Marketing Need Reform? Fresh Perspective on the
Future. London, Routledge.
Slater, S.F., Narver, J.C. 1994. Does Competitive Environment Moderate the Market
Orientation-Perfomance Relationship. Journal of Marketing, 58, 46-55.
https://doi.org/10.1177/002224299405800104.
Smith, W.R. 1956. Product Differentiation and Market Segmentation as Alternative
Marketing Strategies. Journal of Marketing, 21(1), 3-8.
https://doi.org/10.1177/002224295602100102.
Steinen, H. 1912. Das moderne Buch, published PhD dissertation, Steinen, Heidelberg. In:
R., Fullerton, 2012. The historical development of segmentation: the example of the
German book trade 1800‐1928. Journal of Historical Research in Marketing, 4(1), 56-67.

New Perspective on Brand Portfolio Management
874
Thoeni, A., Marshall, G., Campbell, S. 2016. A resource-advantage theory typology of
strategic segmentation. European Journal of Marketing, 50(12), 2192-215.
https://doi.org/10.1108/EJM-08-2015-0585.
Tranfield, D., Denyer, D., Marcos, J., Burr, M. 2004. Co-producing management knowledge.
Management Decision, 42(3/4), 375-386. https://doi.org/10.1108/00251740410518895.
Uggla, H. 2013. The Sins of Brand Portfolio Management. The IUP Journal of Brand
Management, X(4).
Webster, F.E. 2005. Back to the Future – Integrating Marketing as a Tactics, Strategy, and
Organizational Culture. Journal of Marketing, 69.
Webster, F.E. 1992. The Changing Role of Marketing in the Corporation. Journal of
Marketing, 56, 1-17. https://doi.org/10.1177/002224299205600402.
Wind, Y. 1978. Issues and Advances in Segmentation Research. Journal of Marketing
Research, 15(3), 317-337. https://doi.org/10.1177/002224377801500302.
Wind, Y., Sharp, B. 2009. Advertising Empirical Generalisations: Implications for Research
and Action. Journal of Advertising Research, June, 246-252.
https://doi.org/10.2501/S0021849909090369.