Community Health Improvement Plan - Kenton Hardin Health ...
Upload
khangminh22Category
view
0download
0
Charting a Course to Improve the Health of New Hampshire
NewHampshire
State HealthImprovementPlan2013-2020

New HampsHire state HealtH improvemeNt plaN
2013-2020
Charting a Course to Improve the Health of New Hampshire
margaret wood Hassan, Governor
Nicholas toumpas, Commissioner, Department of Health and Human services
José thier montero, mD, mpH, mHCDs, Director, Division of public Health services
lisa Bujno, msN, aprN, Deputy Director, Division of public Health services
october 2013

I
Ack
now
led
ge
me
nts
The NH State Health Improvement Plan, Charting a Course to Improve the Health of New Hampshire, is a product of the NH Department of Health and Human Services (DHHS), Division of Public Health Services (DPHS), but incorporates the input of a number of our public health partners. We are grateful to the many individuals and organizations that took the time to be involved in the development of this plan and thank the Community Health Institute for their assistance with general logistics, coordination and facilitation of the community input sessions, the Alliance of Healthy Community Coalitions Summit and the re-assessment of the National Public Health Performance Standards.
Overall responsibility for planning and coordination rested with the Bureau of Public Health Systems, Policy and Performance (BPHSPP) under the direction of Lisa Bujno, Bureau Chief. Strategic direction was provided by José Montero, Joan Ascheim and Lisa Bujno. Creative direction, design and publication management of the report were executed by Laura Holmes with graphic support by Christin D’Ovidio and Tyler Brandow. Each section in the report was written by content experts from DHHS. Data analysis was completed by DPHS staff, epidemiolo-gists and data analysts. Graphs were prepared by Michael Laviolette.
Editors:Lisa Bujno, Bureau Chief, Bureau of Public Health Systems, Policy and Performance
José T. Montero, Director, Division of Public Health Services
Michael Dumond, Bureau Chief, Bureau of Public Health Protection
Laura Holmes, Performance Improvement Manager, Bureau of Public Health Systems, Policy and Performance
Contributors:From DPHS and other DHHS Programs:Audrey Knight, Maternal and Child Health SectionBeverly Drouin, Healthy Homes & Environment SectionCheryl Storey, Bureau of Public Health Systems, Policy and PerformanceChristine Adamski, Bureau Chief, Bureau of Infectious Disease ControlColleen Smith, Food Protection ProgramDavid J. Laflamme, Maternal and Child Health Section Dennis Holt, Environmental Public Health Tracking ProgramDonna M. Fleming, Tobacco Prevention and Control ProgramElizabeth R. Daly, Infectious Disease Surveillance SectionHeather Barto, Infectious Disease Surveillance SectionJean Cadet, Heart Disease and Stroke Prevention ProgramJeffrey Metzger, Bureau of Drug and Alcohol ServicesJill Fournier, Maternal and Child Health SectionJoan Ascheim, Bureau of Public Health Systems, Policy and Performance JoAnne Miles, Maternal and Child Health SectionJohn Dreisig, Infectious Disease Surveillance SectionJoseph P. Harding, Bureau of Drug and Alcohol ServicesJoyce Welch, Food Protection SectionKate Frey, Bureau of Public Health Systems, Policy and Performance Kathy Berman, Diabetes Education ProgramKatrina Hansen, Healthcare-Associated Infections ProgramLia Baroody, Heart Disease and Stroke Prevention Program
acknowledgements

II
Ludmila Anderson, Chronic Disease Prevention and Screening Section Marcella Bobinsky, Immunization SectionMargaret Murphy, Healthy Eating & Physical Activity SectionMarisa D. Lara, Diabetes ProgramMichael Laviolette, Health Statistics and Data Management SectionMichelle Ricco Jonas, Family Planning Program Nancy Martin, Oral Health ProgramNeil Twitchell, Community Health Development SectionPatricia Tilley, Bureau Chief, Bureau of Community Health ServicesRebecca Bukowski, Chronic Disease Prevention and Screening SectionRegina Flynn, Obesity Prevention ProgramRhonda Siegel, Injury Prevention Program Sharon Alroy-Preis, State Epidemiologist Stacey Smith, Breast & Cervical Cancer ProgramSteffany Cavallo, Infectious Disease Epidemiology SectionSusan Knight, Asthma ProgramThomas Lambert, Health Statistics and Data Management SectionValerie Morgan, Bureau of Drug and Alcohol ServicesWhitney Hammond, Comprehensive Cancer Control Program
From community agencies and other partners:Public Health Improvement Services Council Community Health InstituteParticipants in Community Input Sessions held August-September, 2012
Ack
now
led
ge
me
nts
III
Dear Colleagues: Times are changing and we need to not only adapt but to lead the change. To maximize the positive impact on the population’s health, to improve it, the public health system must work in effective partnerships. We need to be able to strategically partner across sectors and with the health care system. To do that properly we need clear and shared priorities, objectives and measurable goals.
The Division of Public Health Services (DPHS) at the New Hampshire Department of Health and Human Services provides crucial services and expertise for individuals and communities – providing care, linking people to appropriate care, being the steward of the quality of the health care provided, responding to emergencies, conducting surveillance, analyzing data from providers to detect trends, and proposing regulations and policies based on that analysis. Health reform implementation, beyond the discus-sion about coverage expansion, has already increased coverage of disease screening and clinical preven-tive services, and is changing the way preventive and other clinical services are provided and reimbursed. But Public Health is much more than providing clinical preventive services, we ensure that all the other services vital to good health do not fall through the cracks--that the unique public health expertise and “wrap-around” services are still available to all who need them. At these times of transition and budgetary constrains we are challenged by difficult decisions about which services we should continue to provide. As stakeholders in public health, we need to maximize our limited resources more effectively–both financial and workforce–by working together to provide comprehensive preventive services
With input from partners from the diverse sectors, agencies and organizations that address population health, the state public health system identified 10 priority areas for improvement with measureable objec-tives and targets for health outcomes, areas for needed attention in public health capacity, and recommen-dations for evidence-based interventions and actions. Reaching these targets requires a statewide initiative, and success is possible only through strategic and coordinated state, regional, and local efforts. The New Hampshire State Health Improvement Plan (NH SHIP) priorities and objectives are intended to provide support, guidance, and focus for public health activities throughout the state. The NH SHIP is the state’s public health roadmap, providing evidence-based strategies to guide the direction of many of our actions. The NH SHIP objectives are our destination; reaching them will mean that we have significantly improved the health of our people.
This plan lays out the top health and public health system priorities for New Hampshire in the next five years. It includes measurable objectives, recommended strategies for improvement, and performance measures with time-framed targets for each priority. Because the opportunities and challenges in each area are not identical, efforts in each are at a unique point in the improvement process. Because New Hampshire is a small state with limited human and financial resources, it is imperative that the public health system remain focused on those areas where our collective actions will leverage the most improve-ment. And while mental health is a key component of a healthy population, and is referenced in this plan, we recognize that mental health has a historically distinct group of stakeholders and DPHS has not systematically addressed it as part of its portfolio. For guidance in identifying mental health priorities, we defer to the New Hampshire mental health plan, Addressing the Critical Mental Health Needs of NH’s Citizens: A Strategy for Restoration (http://www.dhhs.state.nh.us/dcbcs/bbh/documents/restoration.pdf).
Various state level plans and actions intended to impact several of the NH SHIP priorities are already in place. For some priorities, like oral health, strategic plans have been in place for many years and we recognize that it is time to revisit and refresh those plans. For others, like heart disease and stroke preven-tion, work at the DPHS is new, so no statewide plan yet exists. For still others, plans have been in place for several years but work is needed to assure that activities will continue to have a measurable impact on key indicators of success.
le
tter fr
om th
e dir
ector
IV
lett
er f
rom
th
e d
ire
ctor
As part of this process, DPHS encourages all our partners to adopt the NH SHIP objectives and implement evidence-based strategies for population health improvement, such as those identified in the National Prevention Strategy and referenced throughout the document. In addition, DPHS will work diligently to engage, involve and empower our communities to focus our efforts on reaching our shared vision together.
Dedicated staff from across DPHS are currently involved in many of the state level groups that are implementing specific health plans. These linkages should continue so that the work of the state health agency is aligned with, and supportive of, the work of external partners and communities. And we should continue to form new linkages; for example, the work of New Hampshire’s public health networks and regional substance use networks are now funded through a single State contract. Through this collabora-tion, Regional Public Health Advisory Councils in each public health region will come together to identify health priorities for their service areas, an unprecedented opportunity for regions to build new partner-ships and address new health issues in alignment with NH SHIP priorities.
The DPHS, with the input of the Public Health Improvement Services Council (PHISC), will monitor the implementation of the NH SHIP. Linkages already exist between the PHISC and other state level groups working on specific health issues, such as obesity, substance misuse and regional public health emergency preparedness. Moving ahead and forging links with groups addressing every NH SHIP priority is critical to assuring a coordinated and collaborative implementation phase. To assess our progress toward our targets, DPHS will produce and publish an annual NH SHIP performance dashboard on the DHHS website using our Web-based Interactive System for Data and Outcome Measures (NH Health WISDOM). Through building on the successful partnerships and coordinated interventions our commu-nity of health and response professionals have demonstrated in every event, and in rising to meet every challenge, together we can create a better state of health in New Hampshire.
The integrated health care system of the future requires shared objectives that guide empowered indi-viduals and communities on their quest to be active participants in their own health. By providing a clear population health framework this document is a key step in that direction. I am truly pleased to present to you New Hampshire’s State Health Improvement Plan, “Charting a Course to Improve the Health of New Hampshire”. We developed it together and together we will make its implementation a successful reality.
Respectfully,
José T. Montero, MD, MPH, MHCDSDirector, Division of Public Health Services, NH Department of Health and Human Services
V
tA
ble of c
onte
nts
table of Contents
Executive Summary .......................................................................................................................... 1
NH State Health Improvement Plan Priority Areas ............................................................................2
Introduction ...................................................................................................................................... 3
Tobacco .......................................................................................................................................... 10
Obesity/Diabetes ............................................................................................................................ 16
Heart Disease & Stroke....................................................................................................................24
Healthy Mothers & Babies ............................................................................................................... 30
Cancer Prevention ........................................................................................................................... 43
Asthma ........................................................................................................................................... 50
Injury Prevention ............................................................................................................................. 56
Infectious Disease ........................................................................................................................... 65
Emergency Preparedness ................................................................................................................ 74
Misuse of Alcohol and Drugs ...........................................................................................................80
Appendix A: State Public Health System Assessment ......................................................................89
Appendix B: State Health Assessment .............................................................................................92
Appendix C: What Forces of Change are Impacting New Hampshire? .............................................. 95
Appendix D: Themes and Strengths Assessment Summary .............................................................98
Appendix E: How Health Priorities Were Determined .................................................................... 100
Appendix F: Community Input ....................................................................................................... 104
Appendix G: Alignment with Healthy People 2020 Objectives ........................................................ 106
Appendix H: NH SHIP Implementation Cross-Walk: Links to Statewide Plans ................................ 109
Appendix I: Flowchart of the NH SHIP Process ...............................................................................111

1NH state Health improvement plan 2013-2020
ex
ecu
tive s
um
mA
ry
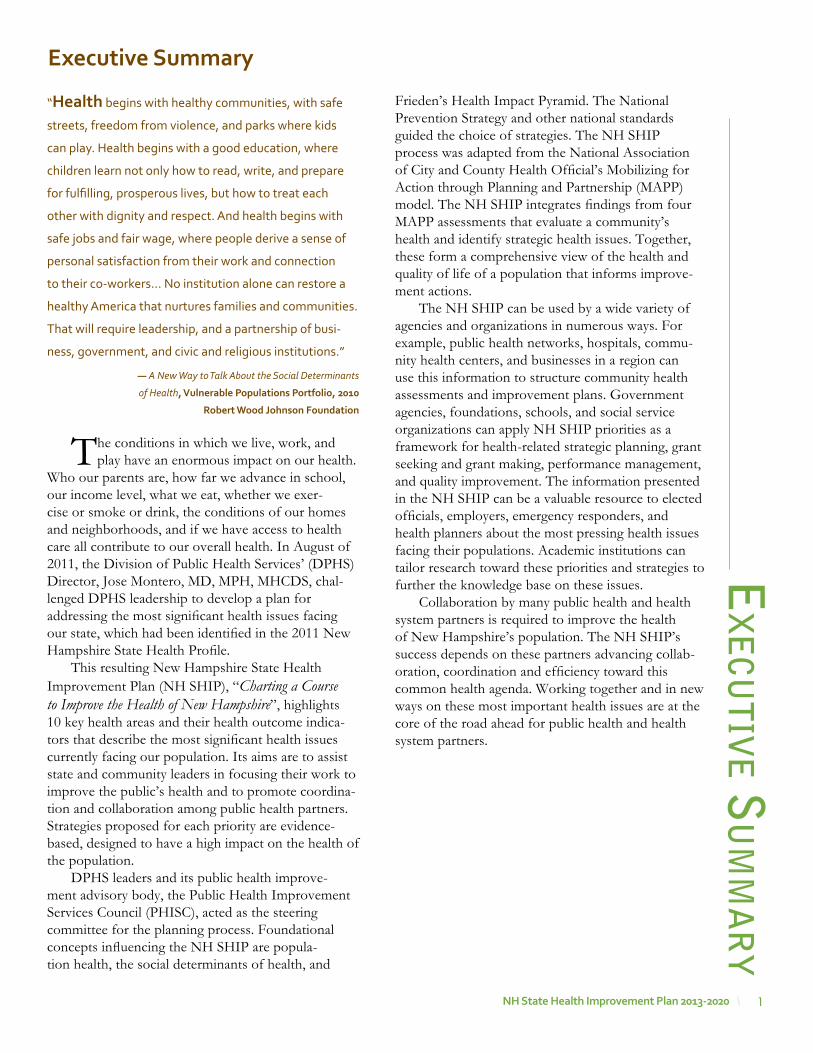
The conditions in which we live, work, and play have an enormous impact on our health.
Who our parents are, how far we advance in school, our income level, what we eat, whether we exer-cise or smoke or drink, the conditions of our homes and neighborhoods, and if we have access to health care all contribute to our overall health. In August of 2011, the Division of Public Health Services’ (DPHS) Director, Jose Montero, MD, MPH, MHCDS, chal-lenged DPHS leadership to develop a plan for addressing the most significant health issues facing our state, which had been identified in the 2011 New Hampshire State Health Profile.
This resulting New Hampshire State Health Improvement Plan (NH SHIP), “Charting a Course to Improve the Health of New Hampshire”, highlights 10 key health areas and their health outcome indica-tors that describe the most significant health issues currently facing our population. Its aims are to assist state and community leaders in focusing their work to improve the public’s health and to promote coordina-tion and collaboration among public health partners. Strategies proposed for each priority are evidence-based, designed to have a high impact on the health of the population.
DPHS leaders and its public health improve-ment advisory body, the Public Health Improvement Services Council (PHISC), acted as the steering committee for the planning process. Foundational concepts influencing the NH SHIP are popula-tion health, the social determinants of health, and
Frieden’s Health Impact Pyramid. The National Prevention Strategy and other national standards guided the choice of strategies. The NH SHIP process was adapted from the National Association of City and County Health Official’s Mobilizing for Action through Planning and Partnership (MAPP) model. The NH SHIP integrates findings from four MAPP assessments that evaluate a community’s health and identify strategic health issues. Together, these form a comprehensive view of the health and quality of life of a population that informs improve-ment actions.
The NH SHIP can be used by a wide variety of agencies and organizations in numerous ways. For example, public health networks, hospitals, commu-nity health centers, and businesses in a region can use this information to structure community health assessments and improvement plans. Government agencies, foundations, schools, and social service organizations can apply NH SHIP priorities as a framework for health-related strategic planning, grant seeking and grant making, performance management, and quality improvement. The information presented in the NH SHIP can be a valuable resource to elected officials, employers, emergency responders, and health planners about the most pressing health issues facing their populations. Academic institutions can tailor research toward these priorities and strategies to further the knowledge base on these issues.
Collaboration by many public health and health system partners is required to improve the health of New Hampshire’s population. The NH SHIP’s success depends on these partners advancing collab-oration, coordination and efficiency toward this common health agenda. Working together and in new ways on these most important health issues are at the core of the road ahead for public health and health system partners.
“Health begins with healthy communities, with safe
streets, freedom from violence, and parks where kids
can play. Health begins with a good education, where
children learn not only how to read, write, and prepare
for fulfilling, prosperous lives, but how to treat each
other with dignity and respect. And health begins with
safe jobs and fair wage, where people derive a sense of
personal satisfaction from their work and connection
to their co-workers... No institution alone can restore a
healthy America that nurtures families and communities.
That will require leadership, and a partnership of busi-
ness, government, and civic and religious institutions.”
— A New Way to Talk About the Social Determinants
of Health, vulnerable populations portfolio, 2010
robert wood Johnson Foundation
executive summary
2 NH state Health improvement plan 2013-2020
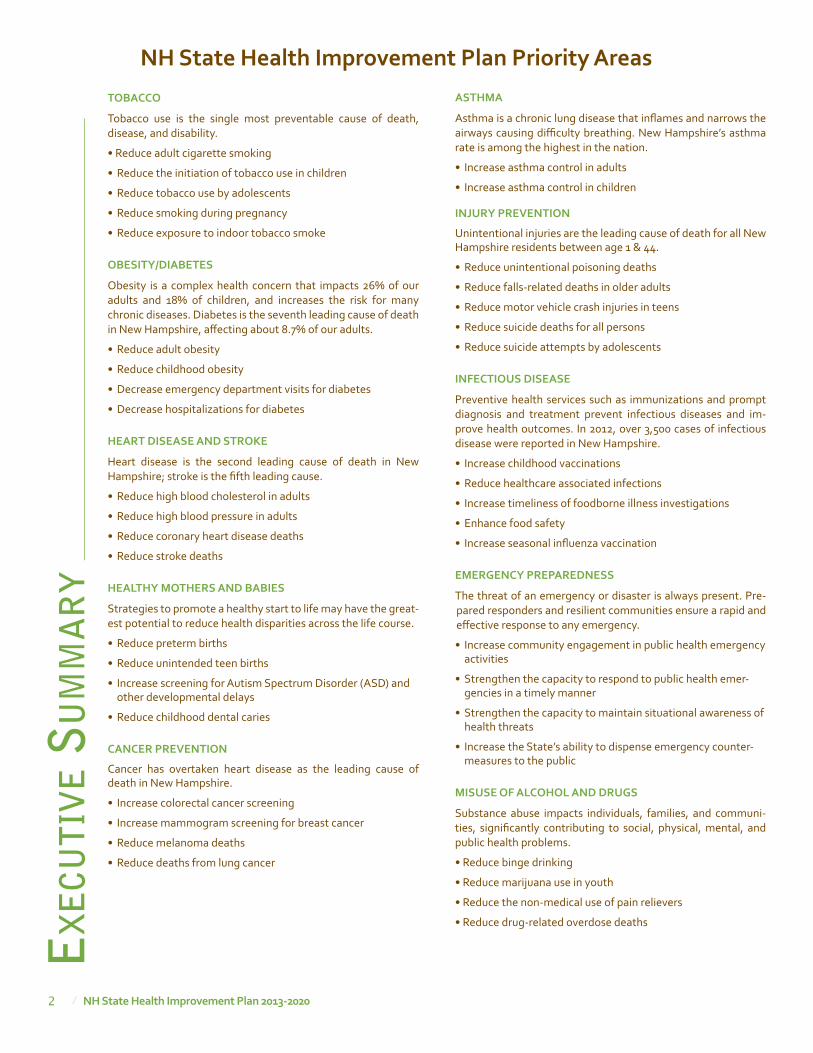
toBaCCo
Tobacco use is the single most preventable cause of death, disease, and disability.
• Reduce adult cigarette smoking
• Reduce the initiation of tobacco use in children
• Reduce tobacco use by adolescents
• Reduce smoking during pregnancy
• Reduce exposure to indoor tobacco smoke
oBesitY/DiaBetes
Obesity is a complex health concern that impacts 26% of our adults and 18% of children, and increases the risk for many chronic diseases. Diabetes is the seventh leading cause of death in New Hampshire, affecting about 8.7% of our adults.
• Reduce adult obesity
• Reduce childhood obesity
• Decrease emergency department visits for diabetes
• Decrease hospitalizations for diabetes
Heart Disease aND stroKe
Heart disease is the second leading cause of death in New Hampshire; stroke is the fifth leading cause.
• Reduce high blood cholesterol in adults
• Reduce high blood pressure in adults
• Reduce coronary heart disease deaths
• Reduce stroke deaths
HealtHY motHers aND BaBies
Strategies to promote a healthy start to life may have the great-est potential to reduce health disparities across the life course.
• Reduce preterm births
• Reduce unintended teen births
• Increase screening for Autism Spectrum Disorder (ASD) and other developmental delays
• Reduce childhood dental caries
CaNCer preveNtioN
Cancer has overtaken heart disease as the leading cause of death in New Hampshire.
• Increase colorectal cancer screening
• Increase mammogram screening for breast cancer
• Reduce melanoma deaths
• Reduce deaths from lung cancer
astHma
Asthma is a chronic lung disease that inflames and narrows the airways causing difficulty breathing. New Hampshire’s asthma rate is among the highest in the nation.
• Increase asthma control in adults
• Increase asthma control in children
iNJUrY preveNtioN
Unintentional injuries are the leading cause of death for all New Hampshire residents between age 1 & 44.
• Reduce unintentional poisoning deaths
• Reduce falls-related deaths in older adults
• Reduce motor vehicle crash injuries in teens
• Reduce suicide deaths for all persons
• Reduce suicide attempts by adolescents
iNFeCtioUs Disease
Preventive health services such as immunizations and prompt diagnosis and treatment prevent infectious diseases and im-prove health outcomes. In 2012, over 3,500 cases of infectious disease were reported in New Hampshire.
• Increase childhood vaccinations
• Reduce healthcare associated infections
• Increase timeliness of foodborne illness investigations
• Enhance food safety
• Increase seasonal influenza vaccination
emerGeNCY prepareDNess
The threat of an emergency or disaster is always present. Pre-pared responders and resilient communities ensure a rapid and effective response to any emergency.
• Increase community engagement in public health emergency activities
• Strengthen the capacity to respond to public health emer-gencies in a timely manner
• Strengthen the capacity to maintain situational awareness of health threats
• Increase the State’s ability to dispense emergency counter-measures to the public
misUse oF alCoHol aND DrUGs
Substance abuse impacts individuals, families, and communi-ties, significantly contributing to social, physical, mental, and public health problems.
• Reduce binge drinking
• Reduce marijuana use in youth
• Reduce the non-medical use of pain relievers
• Reduce drug-related overdose deaths
NH state Health improvement plan priority arease
xe
cuti
ve s
um
mA
ry
3NH state Health improvement plan 2013-2020
introductionwhat is the state Health improvement plan?
When public health systems are working well, there is little fanfare. In fact, it seems that we don’t realize that they are at work. Yet our drinking water and food in our restaurants is safe, our children’s teeth are without cavities, fewer teens are smoking and fewer people are dying as a result of motor vehicle crashes or tuberculosis, because public health are performing as expected. The Institute of Medicine defines public health as, “What we as a society do collectively to assure the conditions in which people can be healthy.”1 New Hampshire embraces this defi-nition, acknowledging that the public health system extends far beyond the boundaries of any health department and it is deeply intertwined with the systems designed to provide care for the ill.
Within New Hampshire’s institutional struc-ture, the Department of Health and Human Services, Division of Public Health Services (DPHS) bears statutory responsibility for protecting the public’s health; its staff has taken a leading role in devel-oping this State Health Improvement Plan. This New Hamsphire State Health Improvement Plan (NH SHIP), “Charting a Course to Improve the Health of New Hampshire”, sets priorities to improve the health status of New Hampshire’s people. It highlights 10 key health areas and associated health outcome indicators that reflect the most significant health issues currently facing our population. Its aims are to assist state and community leaders in focusing their work to improve the public’s health and to promote coordination and collaboration among public health partners. The strat-egies proposed for each priority area are based on evidence and designed to have a high impact on the health of the population.
The NH SHIP can be used by a wide variety of state and local agencies and organizations in numerous ways. For example, public health networks, hospitals, community health centers, social service agencies and businesses in a region can use this infor-mation to structure their community health assess-ments and health improvement plans. Government agencies, foundations, schools, and health and social service organizations can apply NH SHIP priorities as a framework for health-related strategic planning, grant seeking and grant making, performance manage-ment, and quality improvement. The information presented in the NH SHIP can be a valuable resource to elected officials, employers, emergency responders, and health planners about the most pressing health issues facing their populations. Academic institu-
tions can tailor research toward these priorities and strategies to further the knowledge base on these issues.
DPHS, with input from its public health improvement advisory committee, the Public Health Improvement Services Council (PHISC), will also be responsible for ongoing monitoring of the strat-egies being imple-mented. However, many other partners contribute to the health of the population and are essential to the public health system and the success of this plan.
The NH SHIP is intended to be a living docu-ment to guide health improvement work throughout our state. The plan can serve as a catalyst for new partners to work together toward this common health agenda. Implementation of NH SHIP strategies over the next few years will bring together public health system partners to coordinate and collaborate in meeting our state’s health goals. The commitment of partners to systematically address shared priorities will yield greater improvements in the population’s health than individual or disjointed efforts.
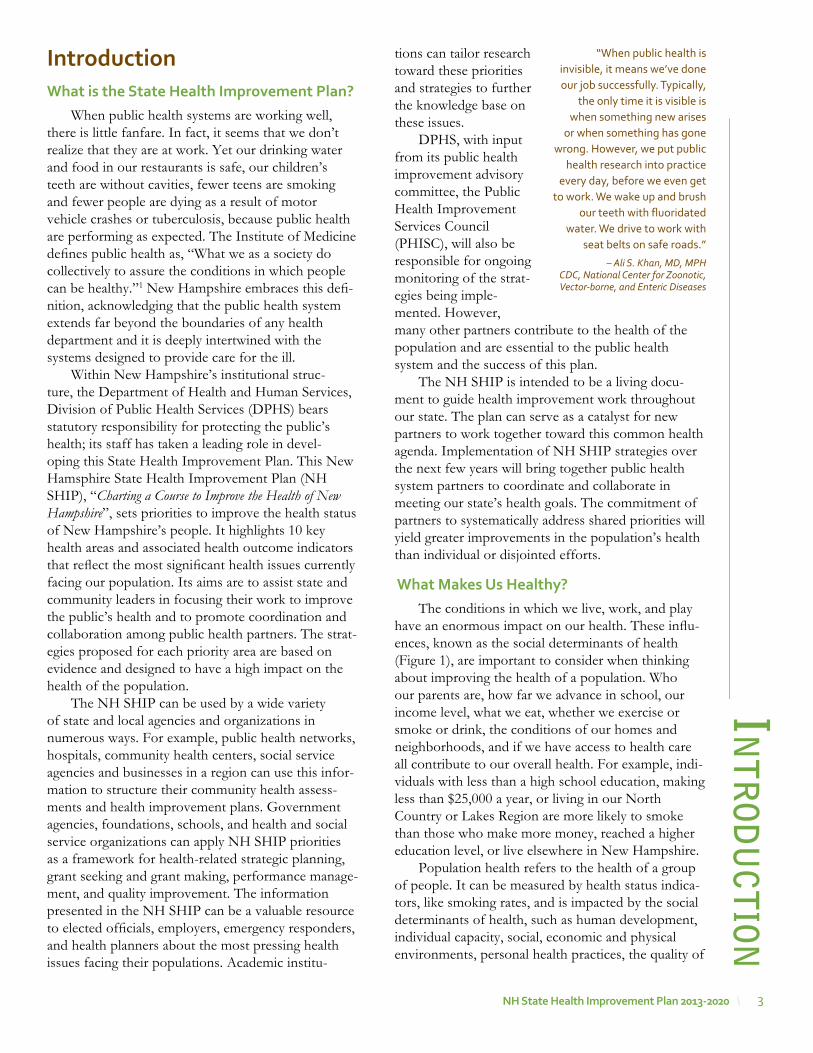
what makes Us Healthy? The conditions in which we live, work, and play
have an enormous impact on our health. These influ-ences, known as the social determinants of health (Figure 1), are important to consider when thinking about improving the health of a population. Who our parents are, how far we advance in school, our income level, what we eat, whether we exercise or smoke or drink, the conditions of our homes and neighborhoods, and if we have access to health care all contribute to our overall health. For example, indi-viduals with less than a high school education, making less than $25,000 a year, or living in our North Country or Lakes Region are more likely to smoke than those who make more money, reached a higher education level, or live elsewhere in New Hampshire.
Population health refers to the health of a group of people. It can be measured by health status indica-tors, like smoking rates, and is impacted by the social determinants of health, such as human development, individual capacity, social, economic and physical environments, personal health practices, the quality of
intr
odu
ction“When public health is
invisible, it means we’ve done our job successfully. Typically,
the only time it is visible is when something new arises
or when something has gone wrong. However, we put public
health research into practice every day, before we even get
to work. We wake up and brush our teeth with fluoridated
water. We drive to work with seat belts on safe roads.”
– Ali S. Khan, MD, MPHCDC, National Center for Zoonotic, Vector-borne, and Enteric Diseases
4 NH state Health improvement plan 2013-2020
Key Determinants of Health1. Income and Social Status
2. Social Support Networks
3. Education
4. Employment/Working Conditions
5. Social Environments
6. Physical Environments
7. Personal Health Practices and Coping Skills
8. Healthy Child Development
9. Biology and Genetic Endowment
10. Health Services
11. Gender
12. Culture
Source: http://www.phac-aspc.gc.ca/ph-sp/approach-approche/appr-eng.php#key_elementsin
trod
uct
ion
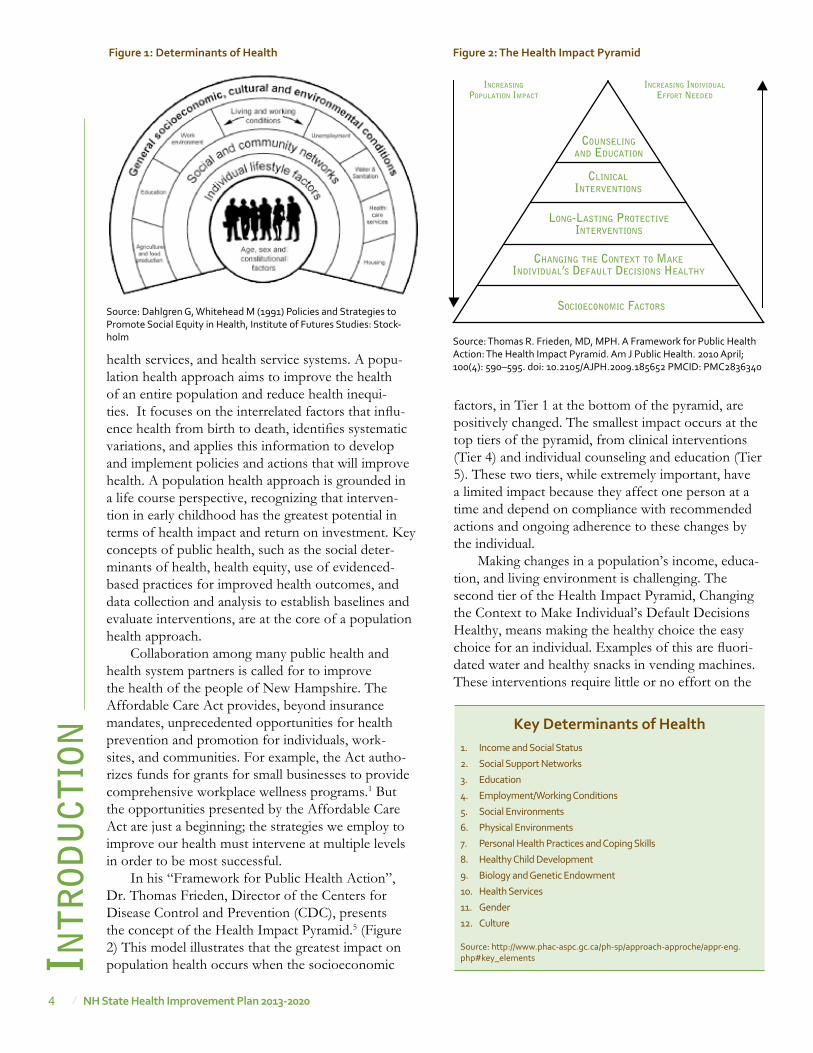
Figure 2: the Health impact pyramid
chAnging the context to mAkeindividuAl’s defAult decisions heAlthy
long-lAsting Protectiveinterventions
socioeconomic fActors
clinicAlinterventions
counselingAnd educAtion
increAsing
PoPulAtion imPAct
increAsing individuAl
effort needed
Source: Thomas R. Frieden, MD, MPH. A Framework for Public Health Action: The Health Impact Pyramid. Am J Public Health. 2010 April; 100(4): 590–595. doi: 10.2105/AJPH.2009.185652 PMCID: PMC2836340
health services, and health service systems. A popu-lation health approach aims to improve the health of an entire population and reduce health inequi-ties. It focuses on the interrelated factors that influ-ence health from birth to death, identifies systematic variations, and applies this information to develop and implement policies and actions that will improve health. A population health approach is grounded in a life course perspective, recognizing that interven-tion in early childhood has the greatest potential in terms of health impact and return on investment. Key concepts of public health, such as the social deter-minants of health, health equity, use of evidenced-based practices for improved health outcomes, and data collection and analysis to establish baselines and evaluate interventions, are at the core of a population health approach.
Collaboration among many public health and health system partners is called for to improve the health of the people of New Hampshire. The Affordable Care Act provides, beyond insurance mandates, unprecedented opportunities for health prevention and promotion for individuals, work-sites, and communities. For example, the Act autho-rizes funds for grants for small businesses to provide comprehensive workplace wellness programs.1 But the opportunities presented by the Affordable Care Act are just a beginning; the strategies we employ to improve our health must intervene at multiple levels in order to be most successful.
In his “Framework for Public Health Action”, Dr. Thomas Frieden, Director of the Centers for Disease Control and Prevention (CDC), presents the concept of the Health Impact Pyramid.5 (Figure 2) This model illustrates that the greatest impact on population health occurs when the socioeconomic
factors, in Tier 1 at the bottom of the pyramid, are positively changed. The smallest impact occurs at the top tiers of the pyramid, from clinical interventions (Tier 4) and individual counseling and education (Tier 5). These two tiers, while extremely important, have a limited impact because they affect one person at a time and depend on compliance with recommended actions and ongoing adherence to these changes by the individual.
Making changes in a population’s income, educa-tion, and living environment is challenging. The second tier of the Health Impact Pyramid, Changing the Context to Make Individual’s Default Decisions Healthy, means making the healthy choice the easy choice for an individual. Examples of this are fluori-dated water and healthy snacks in vending machines. These interventions require little or no effort on the
Figure 1: Determinants of Health
Source: Dahlgren G, Whitehead M (1991) Policies and Strategies to Promote Social Equity in Health, Institute of Futures Studies: Stock-holm

5NH state Health improvement plan 2013-2020
intr
odu
ctionpart of an individual to make a healthy choice. The middle or 3rd tier, long-lasting protective interven-tions, refers to one-time or infrequent actions that afford long-term protection or prevention, such as immunizations and dental sealants. The Health Impact Pyramid provides a sound model for plan-ning across public and private sectors at the state and community levels to improve our performance on our public health problems.
who Contributes to the Health of New Hampshire’s residents?
The New Hampshire public health system includes a diverse array of partners from many sectors. (Figure 3) For example, health care providers, community health centers, mental health agencies and hospitals provide health care services directly to indi-viduals. Social service agencies work to impact the social determinants of health by offering programs for vulnerable people, such as access to affordable housing, heating assistance or transportation. Health insurers assure access to health services and promote health through programs for their insured popula-tions and the community at large. Businesses provide health insurance and workplace safety and employee wellness programs. Legislators create policies to protect residents and promote healthy environments. Others, such as emergency responders, health coali-tions and associations, philanthropic organizations, schools, child care agencies, academic centers and the media each contribute to the population’s health in their own ways. The NH SHIP’s success depends on these key public health system partners, and new part-ners, to advance collaboration, coordination and effi-ciency as the plan’s strategies are implemented. (See Appendix I for a flowchart depicting the steps we and our public health partners took in developing the NH SHIP).
How was the state Health improvement plan Developed?
New technologies are making a clear impact on the capacity of organizations to improve their own capacities and methods for population based data collection and analysis. As a leading public health organization, DPHS has the responsibility to adapt those new tech-nologies and methods to improve the health of the population in New Hampshire. At the same time, with the changes related to the way we provide and pay for health care, espe-cially for illnesses that affect our population, it is evident that we need to prioritize our actions and develop clear ways to measure our performance. Within this mind frame the DPHS leadership challenged itself to lead such a prioritization process and develop specific targets that will show the progress we are making in improving and maintaining the health of the state’s population. The steps we took toward that direction started in 2009 and by 2011, with the publication of the New Hampshire State Health Profile, the stage was set. Upon the publication of this report, DPHS committed itself to a planning initiative to identify the Division’s goals, objectives and priorities. Referred to as the “GO Plan”, this Goals and Objectives (GO) planning process occurred between September 2011 and June 2012 and included four steps: identifying the overarching broad goals for the Division, identifying specific goals for each broad goal, analyzing gaps in the Division’s strategies and activities, and a priori-tization process to identify the health outcomes that would require greater emphasis in the years ahead.
As the GO Plan evolved into the State Health Improvement Plan, DPHS leaders and PHISC members acted as the steering committee for the planning process. Members of the PHISC are repre-sentative of statewide organizations, private foun-dations, and regional public health networks. Established in 2007 by HB 491, the group’s charge was to oversee public health improvement efforts that began with the Public Health Improvement Action Plan Advisory Committee in 2006. While the legisla-tive charge to the Council is no longer in effect, the group continues to meet regularly. Within the context
“The public health system...describes a complex network of individuals and organizations that have the potential to play critical roles in creating the conditions for health. They can act individually, but when they work together toward a health goal, they act as a system—a public health system”
– IOM (Institute of Medicine) 2003 The Future of Public Health in the
21st Century, Washington, DC, National Academy Press
Schoolss
Community Centers
Employers
Transit
Elected Officials
Healthcare
Providers
EMS
Law Enforcement
Nursing Homes
Fire
Corrections
Mental Health
Faith Institutions
CCiivviicc GGrroouuppss
Non-Profit Organizations
Neighborhood Organizations
Laboratories
Home Health
CHCs
Hospitals
Tribal Health
Drug
Treatment
Public Health Agency
Figure 3: public Health system model
Source: CDC
6 NH state Health improvement plan 2013-2020
of building public health infrastructure and the NH SHIP process, the PHISC’s purpose is to: provide expert advice on public health matters, create an inde-pendent forum for discussion, share knowledge, and link with other DPHS advisory and planning groups to coordinate communication across the public health system.
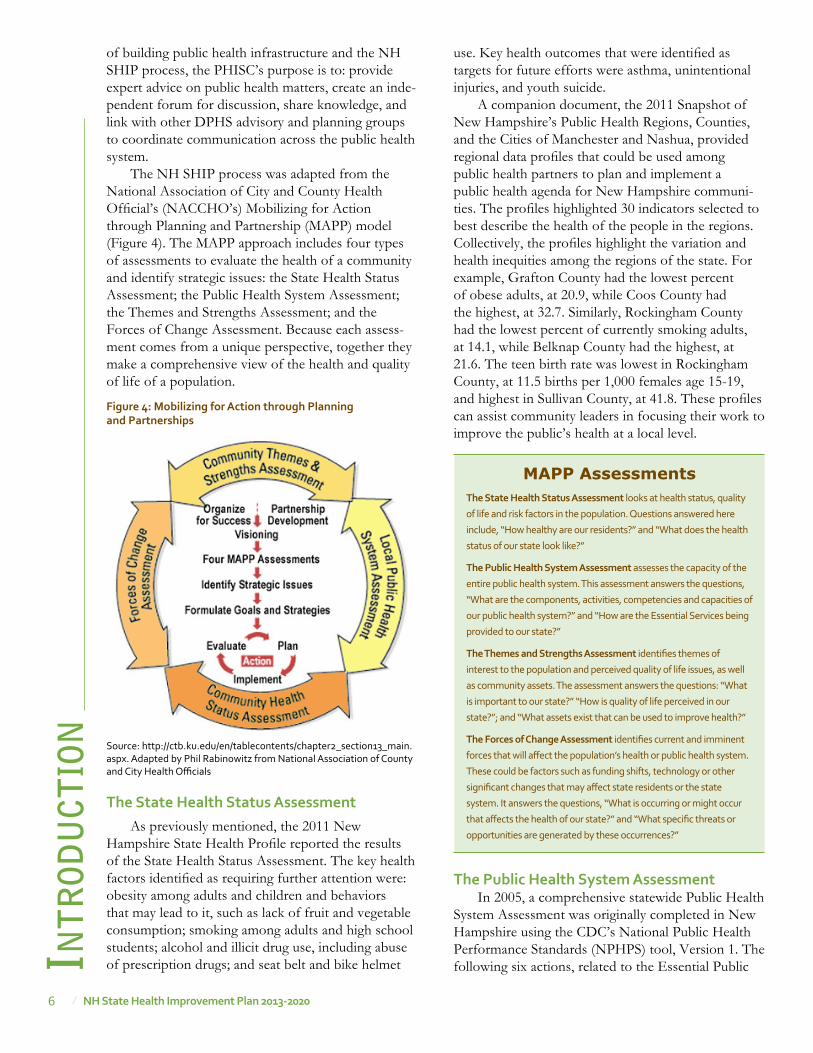
The NH SHIP process was adapted from the National Association of City and County Health Official’s (NACCHO’s) Mobilizing for Action through Planning and Partnership (MAPP) model (Figure 4). The MAPP approach includes four types of assessments to evaluate the health of a community and identify strategic issues: the State Health Status Assessment; the Public Health System Assessment; the Themes and Strengths Assessment; and the Forces of Change Assessment. Because each assess-ment comes from a unique perspective, together they make a comprehensive view of the health and quality of life of a population.
the state Health status assessmentAs previously mentioned, the 2011 New
Hampshire State Health Profile reported the results of the State Health Status Assessment. The key health factors identified as requiring further attention were: obesity among adults and children and behaviors that may lead to it, such as lack of fruit and vegetable consumption; smoking among adults and high school students; alcohol and illicit drug use, including abuse of prescription drugs; and seat belt and bike helmet intr
odu
ctio
nuse. Key health outcomes that were identified as targets for future efforts were asthma, unintentional injuries, and youth suicide.
A companion document, the 2011 Snapshot of New Hampshire’s Public Health Regions, Counties, and the Cities of Manchester and Nashua, provided regional data profiles that could be used among public health partners to plan and implement a public health agenda for New Hampshire communi-ties. The profiles highlighted 30 indicators selected to best describe the health of the people in the regions. Collectively, the profiles highlight the variation and health inequities among the regions of the state. For example, Grafton County had the lowest percent of obese adults, at 20.9, while Coos County had the highest, at 32.7. Similarly, Rockingham County had the lowest percent of currently smoking adults, at 14.1, while Belknap County had the highest, at 21.6. The teen birth rate was lowest in Rockingham County, at 11.5 births per 1,000 females age 15-19, and highest in Sullivan County, at 41.8. These profiles can assist community leaders in focusing their work to improve the public’s health at a local level.
the public Health system assessmentIn 2005, a comprehensive statewide Public Health
System Assessment was originally completed in New Hampshire using the CDC’s National Public Health Performance Standards (NPHPS) tool, Version 1. The following six actions, related to the Essential Public
Source: http://ctb.ku.edu/en/tablecontents/chapter2_section13_main.aspx. Adapted by Phil Rabinowitz from National Association of County and City Health Officials
Figure 4: mobilizing for action through planning and partnerships
MAPP Assessmentsthe state Health status assessment looks at health status, quality
of life and risk factors in the population. Questions answered here
include, “How healthy are our residents?” and “What does the health
status of our state look like?”
the public Health system assessment assesses the capacity of the
entire public health system. This assessment answers the questions,
“What are the components, activities, competencies and capacities of
our public health system?” and “How are the Essential Services being
provided to our state?”
the themes and strengths assessment identifies themes of
interest to the population and perceived quality of life issues, as well
as community assets. The assessment answers the questions: “What
is important to our state?” “How is quality of life perceived in our
state?”; and “What assets exist that can be used to improve health?”
the Forces of Change assessment identifies current and imminent
forces that will affect the population’s health or public health system.
These could be factors such as funding shifts, technology or other
significant changes that may affect state residents or the state
system. It answers the questions, “What is occurring or might occur
that affects the health of our state?” and “What specific threats or
opportunities are generated by these occurrences?”
7NH state Health improvement plan 2013-2020
intr
odu
ctionHealth Services, were chosen as strategic public health priorities aimed at improving New Hampshire’s public health system; workgroups addressed these most significant capacity gaps over the next several years.
1. Inform, educate and empower people about health issues
2. Monitor health status to identify and solve community health problems
3. Mobilize community partnerships and actions to identify and solve health problems
4. Develop policies and plans that support individual and community health efforts
5. Develop a communication plan to convey the importance and value of public health
6. Develop a plan to assure a competent public health workforce
Subsequently, 12 of the then 15 New Hampshire public health networks completed their own capacity assessments using a revised version of the National County and City Health Officials’ Local Health Department Self-Assessment Tool (NACCHO– Rev.1). In the aggregate, the networks’ capacity was rated as greater than moderate for these four Essential Services (ES): Link People to Services (ES 7), Inform and Educate (ES 3), Diagnose and Investigate (ES 2); and Mobilize Partnerships (ES 4). Moderate capacity was perceived for: Monitoring Health Status (ES 1), Evaluation and Improvement (ES 9), and Assuring a Competent Workforce (ES 8).
Minimal to moderate capacity was noted for: Developing Policies and Plans (ES 5); Research (ES 10); and Enforcing Laws (ES 6).2
A reassessment of the state-level public health system occurred over the spring and summer of 2013, using the CDC’s NPHPS tool, Version 3. The analysis of this reassessment is slated to be complete in the fall of 2013. Public health system partners will then prioritize capacity needs and develop action plans to move forward.
the themes and strengths assessmentThe Themes and Strengths Assessment is
comprised of feedback from public input sessions in the fall of 2012 and two separate meetings, one with DPHS staff and another with the PHISC members. Three main themes were identified that participants perceived contribute to the strength of our public health system: • partnerships; • the strength of the current infrastructure; and• state characteristics, such as the size of the state and
health of its population.
Participants also discussed issues and events that have brought New Hampshire communities together successfully to improve the health and quality of life in our state. Notable situations in which this has occurred included: working to build the regional public health infrastructure; addressing specific health issues; and currently, responding to health system transformation.
The collective information from these assess-ments paints a vibrant picture of a state’s overall health landscape and drives the development of a strategic health plan. The process helps communities achieve optimal health by identifying and using their resources wisely, taking into account their unique circumstances and needs, and forming effective partnerships for strategic action.3 Appendices A–D provide summaries of the assessments, the methods used and their results.
the Forces of Change assessmentThe Forces of Change Assessment was conducted
in two meetings in 2012: one with DPHS staff and another with the PHISC. Participants provided exper-tise on the breadth of the health priority issues, as well as their unique perspectives from state and local public health agencies, non-profits, foundations, and public health research organizations. The forces of change identified through these meetings were: • state demographic trends; • the economic climate and political landscape; • health system transformation; • public health system capacity; and• emerging issues, such as flu pandemic and radiolog-
ical emergency response.
Developing Health prioritiesThe previously described GO Plan process iden-
tified the top objectives to address New Hampshire’s most significant health issues. DPHS leaders met in late 2011 and prioritized these objectives through a weighted voting system. Criteria used included:
• the severity of the problem’s health consequences;
• the number of individuals affected;
• whether there are disproportionate effects in popu-lation subgroups;
• the problem’s economic and social cost; whether the problem is cross-cutting, with an effect across the life span;
• and the feasibility of addressing the problem. Appendix E describes the prioritization process in more detail.
8 NH state Health improvement plan 2013-2020
The ranked objectives were then grouped into 10 priority areas, becoming the basis for this State Health Improvement Plan. After the priority areas were chosen, DPHS subject matter experts further defined the key objectives. In order to be consistent with national objectives, the National Prevention Strategy was used to guide our choice of strategies for the NH SHIP. Other national standards and evidence-based activities were also considered, such as the CDC’s Community Guide, Bright Futures, Healthy People 2020, and the National Health Security Strategy.
Community and partner inputIn the fall of 2012, public input meetings were
held in five regions of the state to introduce the prior-ities and gather community feedback. These meetings resulted in a wealth of information about communi-ties’ perceptions of the 10 NH SHIP health priori-ties. Participants at each meeting ranked the priori-ties through interactive polling using an Audience Response System. Individually, all community meet-ings chose Obesity/Diabetes as the number one priority for their regions, except the one held in Sullivan County. Partners from within and around Sullivan County chose Misuse of Alcohol and Drugs as the highest priority, with Obesity/Diabetes as second. For all groups, except the one that met in Sullivan County, Asthma was the lowest priority in the rankings. Sullivan County ranked asthma 8th, followed by Infectious Disease and Emergency Preparedness, respectively. A summary of these meetings can be found in Appendix F.
In May of 2013, DPHS convened a statewide meeting of Representatives from public and private organizations serving various roles in community health-related coalitions throughout the state attended the meeting, the Alliance of Healthy Community intr
odu
ctio
nCoalitions Summit. The goals of this summit were to develop strategies to address the health priority areas defined in the NH SHIP and bring together coalitions across the state in a coordinated public health effort to further these priorities. Breakout sessions provided an opportunity for stakeholders to provide input on how to move forward, and discuss key evidence-based strategies and action steps.
The following pages describe the 10 NH SHIP priority areas. Each section offers detail on the priority, such as the scope and cost of the health issue, current available data, and populations dispro-portionately affected. Suggested evidence-based approaches to address each priority are included, as these are at the core of the work ahead for public health and health system partners to improve the health of New Hampshire’s population. Where appli-cable, alignment is noted with national standards, objectives or measures (See Appendix G). Partner input and information and feedback obtained from the community has been incorporated into each priority area section.
NH sHip implementation and oversightThe NH SHIP lays out the top health and public
health system priorities for New Hampshire in the next five years. It includes measurable objectives, recom-mended strategies for improvement, and performance measures with time-framed targets for each priority. Because the opportunities and challenges in each area are not identical, efforts in each are at a unique point in the improvement process. Because New Hampshire is a small state, with limited human and financial resources, it is imperative that the public health system remain focused on those areas where our collective actions will leverage the most improvement.
The table in Appendix H depicts the status of state level plans and actions intended to impact the NH SHIP priorities. As mentioned by Dr. Montero in his letter, strategic plans for some of the priority areas have been in place for many years and need updating; for other areas no statewide plan exists. For all plans, current and future, we must ensure that the activities in the plans will have a measurable impact on key indicators of success.
The DPHS, with the input of the PHISC, will monitor the implementation of the NH SHIP. Linkages already exist between the PHISC and other state level groups working on specific health issues, such as obesity, substance misuse and regional public health emergency preparedness. Moving ahead, forging links with groups addressing every NH SHIP priority is critical to assuring a coordinated, collaborative implementation phase.
The Ten Priority AreasTobacco
Obesity and Diabetes
Heart Disease and Stroke
Healthy Mothers and Babies
Cancer Prevention
Asthma
Injury Prevention
Infectious Disease
Emergency Preparedness
Misuse of Alcohol and Drugs
9NH state Health improvement plan 2013-2020
references
1. IOM (Institute of Medicine) 1988 The Future of Public Health, Washington, DC, National Academy Press
2. Creating a Regional Public Health System in New Hampshire: Results of Assessments to Inform the Planning Process, Executive Summary, New Hampshire Department of Health and Human Services, Division of Public Health Services, Bureau of Public Health Systems, Community Health Institute/JSI, 2011
3. http://www.naccho.org/topics/infrastructure/mapp/framework/mappbasics.cfm, Accessed: July 4, 2013
4. Promoting Prevention through the Affordable Care Act, Koh, HK, Sebelius, KG, New England Journal of Medicine, September 7, 2010
5. A Framework for Public Health Action: the Health Impact Pyramid, Frieden, TR, American Journal of Public Health, April 2010, 100(4)
Staff from across DPHS are currently involved in many of these state level groups that are implementing specific health plans (see Appendix H). These linkages will continue so that the work of the state health agency is aligned with, and supportive of, the work of external part-ners and communities.
Ten Recommendations for NH SHIP Implementation1. Expand PHISC membership so that entities are
represented that oversee key state level plans addressing each NH SHIP priority, creating an Alliance of Healthy Communities Coalition.
2. Maintain DPHS staff involvement with priority state level planning activities that involve NH SHIP priority areas.
3. Conduct regular, focused discussions on progress toward meeting NH SHIP objectives at PHISC meetings, through inclusion of specific subject matter experts, state and local level planning group members, and pertinent DPHS staff and managers.
4. Include selected, top priorities from the National Public Health Performance Standards assessment as additional NH SHIP goals, with measurable objectives for each.
5. Promote alignment of comprehensive public health plans across New Hampshire’s public health system with NH SHIP priorities and objec-tives where feasible.
6. Improve the ability of priority areas to effectively progress toward meeting NH SHIP objectives, by supporting the creation or revision of state and regional priority area plans.
7. Support regional public health planning and implementation efforts through DPHS technical assistance and leveraging financial resources to further NH SHIP objectives.
8. Create synergies across priority areas and their respective strategic plans and activities by strategi-cally capitalizing on opportunities to advance NH SHIP priorities.
9. Monitor progress toward targets utilizing WISDOM’s Health Topics module.
10. Evaluate NH SHIP implementation annually and revise the NH SHIP by 2018.
vision for the FutureWe look forward to working together with all
partners to leverage and integrate resources towards increasing the health and safety of our population. The State Health Improvement Plan: Charting a Course to Improve the Health of New Hamsphire is a product of our collaborative work and will set the course for our state to move ahead and meet the health and safety challenges described in this plan.
intr
odu
ction
10 NH state Health improvement plan 2013-2020
tob
Acc
o
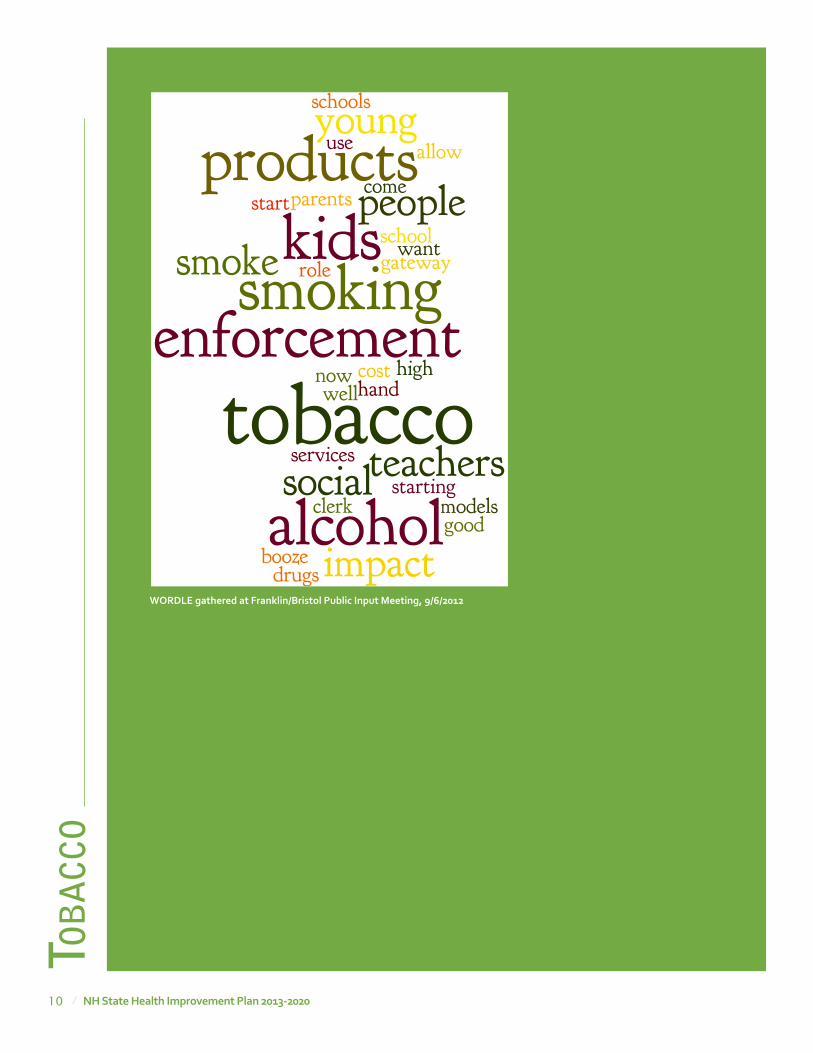
worDle gathered at Franklin/Bristol public input meeting, 9/6/2012
11NH state Health improvement plan 2013-2020
tob
Acco
tobacco
Tobacco use and dependence remains the single most preventable cause of death and disability in New Hampshire. Helping those who are tobacco depen-dent and preventing kids from starting tobacco use can save many lives and health care dollars.
Tobacco related diseases kill more people than alcohol, Acquired Immune Deficiency Syndrome (AIDS), car crashes, illegal drugs, murders, and suicides combined.1 In New Hampshire, more than 1,764 deaths are attributable to tobacco use each year2, which includes 556 lung cancer and 490 respi-ratory deaths each year. Exposure to secondhand and third-hand smoke is linked to thousands of additional deaths.
why is tobacco Use and exposure important?Smoking harms nearly every organ in the body,
causes cardiovascular diseases, multiple cancers, pulmonary diseases, adverse reproductive outcomes, and exacerbates other chronic conditions.3 The prevalence of adult cigarette smoking in New Hampshire is 19.4% (18.0-20.9).4 New Hampshire ranks 17th lowest in the nation, with Utah (11.8%) ranking the lowest and Kentucky ranking the highest (29.0%)5.
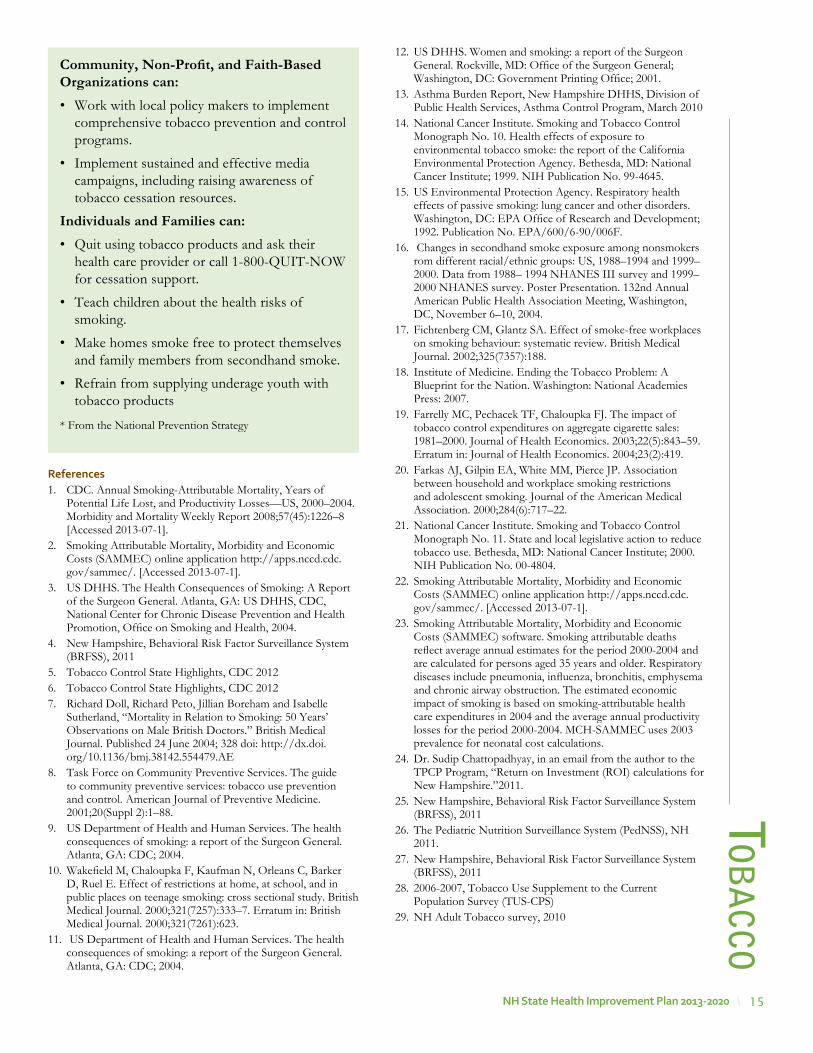
Smoking during pregnancy is associated with higher risk for poor birth outcomes often requiring hospitalization for the infant, mother or both. According to 2011 NH Birth Data, 13.6% of women, or about 1,738, report smoking during pregnancy. 26.3% of teenage preg-nant women (up to 19 years of age) report smoking during pregnancy, compared to 13% of women age 20 or older. Pregnant women enrolled in Medicaid smoke at a rate of 31.9%. 25.0% of New Hampshire women enrolled in Women, Infants and Children Program (WIC) report smoking during pregnancy. Smoking is higher among unmarried women (29.9%) compared to married women (5.2%).
More than 80% of adult tobacco users start when they are young and carry their nicotine addiction into adulthood, risking chronic disease and premature death. New Hampshire’s youth smoking prevalence,
at 19.8%5, is the highest among the New England states with approximately 1,700 children less than 18 years of age becoming new daily smokers each year. New Hampshire ranks 35th in the nation for youth cigarette smoking with Utah ranking first at 5.9% (4.9-7.2).6 16.4% of high school students currently use cigars, cigarillos or little cigars. 8.4% of male students use smokeless or spit tobacco. 8.9% of high school students report smoking before age 13.
Tobacco depen-dence is a chronic disease and successful quits lead to improved health outcomes. Since the addic-tive make-up of cigarettes makes successful quitting a formidable challenge for those that smoke, most successful quits are the result of combined therapies. To quit using nicotine, two issues must be addressed: (1) physiological addiction and (2) behavioral need. Evidence demonstrates that smokers die 8-13 years earlier than non-smokers.7 However, life expectancy can increase dramatically if abstinence is achieved before age 30. Quitting smoking without medication or counseling gives only a 5%-7% likelihood of being successful. Healthcare providers can truly tip the scale in favor of successful quits by engaging with patients around tobacco use and dependence.
Exposure to environmental tobacco smoke (ETS) is another preventable cause of significant morbidity and mortality associated with tobacco use. ETS exposure can lead to lung cancer, heart disease and other pulmonary diseases in adults and many serious health problems, such as lower respiratory infec-tions, asthma, sudden infant death syndrome, and ear infections, in children.8 ,9, 10 Evidence also indicates that tobacco smoke is especially harmful to pregnant women and to fetal development.11, 12 Approximately 30% of middle school students with current asthma and 17% of high school students with asthma reported that smoking was allowed in the home.13
Reducing exposure to ETS can prevent diseases and save lives.14, 15, 16, 17 Smoke-free policies improve indoor air quality, reduce negative health outcomes, decrease cigarette consumption, encourage smokers to quit, and change social norms regarding the accept-ability of smoking.18 Research shows that smokers in workplaces with smoke-free policies may reduce the number of cigarettes they smoke or quit smoking altogether.19, 20 In addition, young people who live in households with tobacco-free policies and ride in smoke-free cars are less likely to smoke than those who live in households in which people smoke.21
New Hampshire’s youth smoking prevalence, at 19.8 percent5, is the highest among the New England states with approximately 1,700 children less than 18 years of age becoming new daily smokers each year.
According to 2011 NH Birth Data, 13.6 percent of women, or about 1,738, report smoking during pregnancy. 26.3% of teenage pregnant women (up to 19 years of age) report smoking during pregnancy, compared to 13% of women age 20 or older. Pregnant women on Medicaid smoke at a rate of 31.9%. 25.0 % of New Hampshire women enrolled in WIC report smoking during pregnancy.
12 NH state Health improvement plan 2013-2020
tob
Acc
oThird-hand smoke is generally considered to be
residual nicotine and other chemicals left on a variety of indoor surfaces by tobacco smoke that builds up over time. This residue is thought to react with common indoor pollutants to create a toxic mix. Third-hand smoke residue contains cancer-causing substances, posing a potential health hazard to those exposed to it, especially children. Studies show that third-hand smoke clings to hair, skin, clothes, furni-ture, drapes, walls, bedding, carpets, dust, vehicles and other surfaces, even long after smoking has stopped. Infants, children and adults may be at risk of tobacco-related health problems when they inhale, ingest or touch substances containing third-hand smoke. Third-hand smoke is a relatively new concept, and researchers are still studying its possible dangers.
the CostThe economic consequences of tobacco use
are in the billions of dollars. Lost work produc-tivity attributable to death from tobacco use in New Hampshire accounts for more than $419 million per year.22 Economic costs due to premature death attrib-utable to smoking are estimated to be $483 million each year. In New Hampshire, the direct private and public health care cost attributable to smoking is $564 million annually, including $115 million in state Medicaid costs. The estimated smoking attributable neonatal health care costs annually in New Hampshire are $585,00023. These amounts do not include health costs caused by exposure to secondhand smoke, smoking-caused fires, smokeless tobacco use, or cigar and pipe smoking.
Recent research indicates that tobacco preven-tion and treatment programs not only reduce smoking and save lives, but also save money by reducing tobacco-related health care costs. A recent study in the American Journal of Public Health found that for every dollar spent by Washington State’s tobacco prevention and control program between 2000 and 2009, more than five dollars were saved by reducing hospitalizations for heart disease, stroke, respiratory disease and cancer caused by tobacco use. Over the 10-year period, the program prevented nearly 36,000 hospitalizations, saving $1.5 billion compared to $260 million spent on the program. Earlier studies showed that after Massachusetts implemented comprehen-sive coverage of tobacco treatment services for all Medicaid beneficiaries, the smoking rate among bene-ficiaries declined by 26% in the first two and a half years. A 2013 study published in PLOS ONE found that between 1989 and 2008 California’s tobacco control program reduced health care costs by $134
billion, far more than the $2.4 billion spent on the program. Researchers attribute these savings to reduc-tions in smoking rates and cigarette consumption per smoker, generating significant savings in health care expenditures.
The prices and taxes of cigarettes are lower in New Hampshire relative to its bordering states. While the state collected $215 million in cigarette tax revenue in state fiscal year 2012, it spent no general funds for tobacco prevention and control activities. The CDC-recommended level of funding is $19.2 million or $10.53 per smoker. This is equivalent to 8% of the tobacco tax revenue. If New Hampshire were to spend that recommended level on tobacco prevention, based on six different econometric models, the range of cost savings would be from $330 million to $470 million (based on 2008 dollars) Thus, the benefits are approximately 18 to 30 times the cost of program implementation; any effort in this direc-tion can result in substantial benefits24.
The findings of a 2004 study indicate that if every state funded its tobacco prevention efforts at the minimum amount recommended by CDC, the related declines in youth smoking alone would lock in future reductions in smoking-caused healthcare costs of more than $31 billion.
where we are
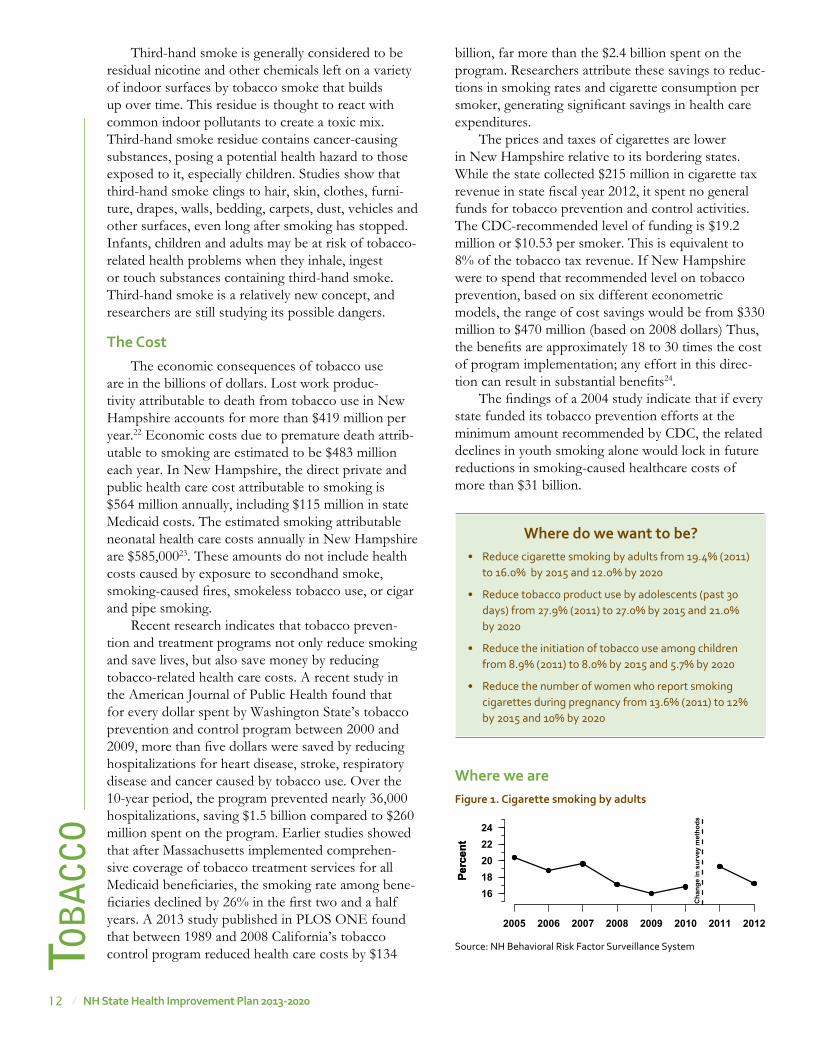
where do we want to be?• Reduce cigarette smoking by adults from 19.4% (2011)
to 16.0% by 2015 and 12.0% by 2020
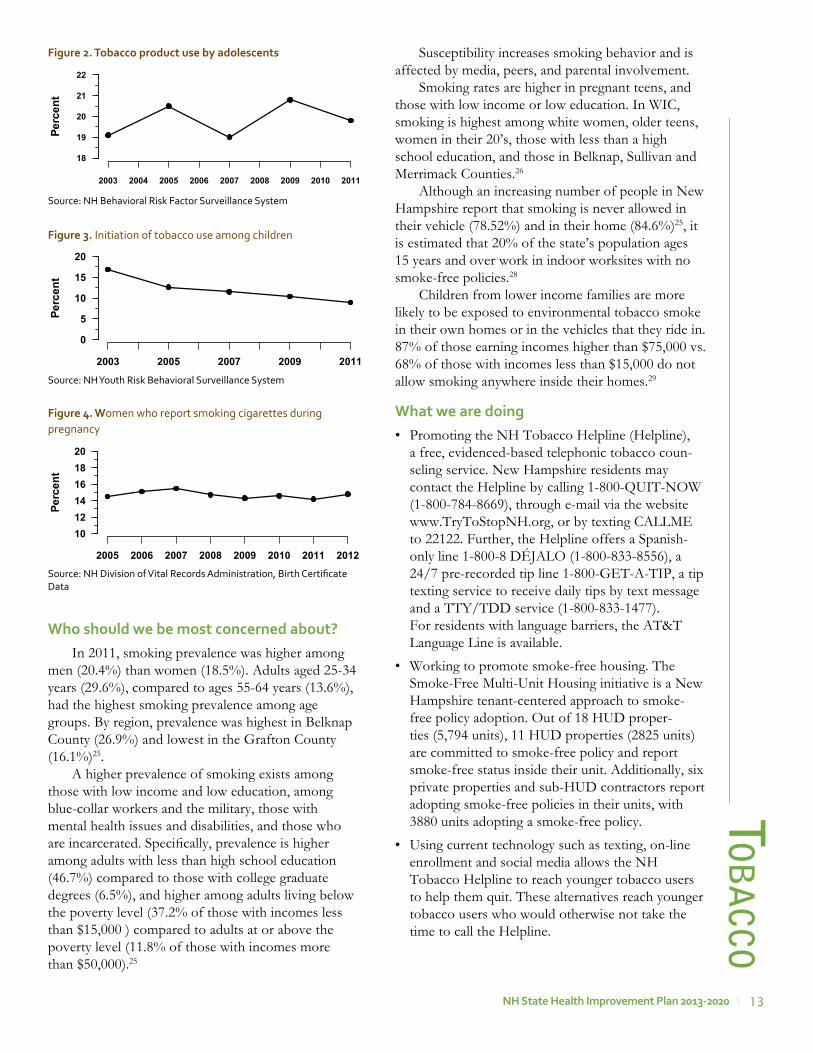
• Reduce tobacco product use by adolescents (past 30 days) from 27.9% (2011) to 27.0% by 2015 and 21.0% by 2020
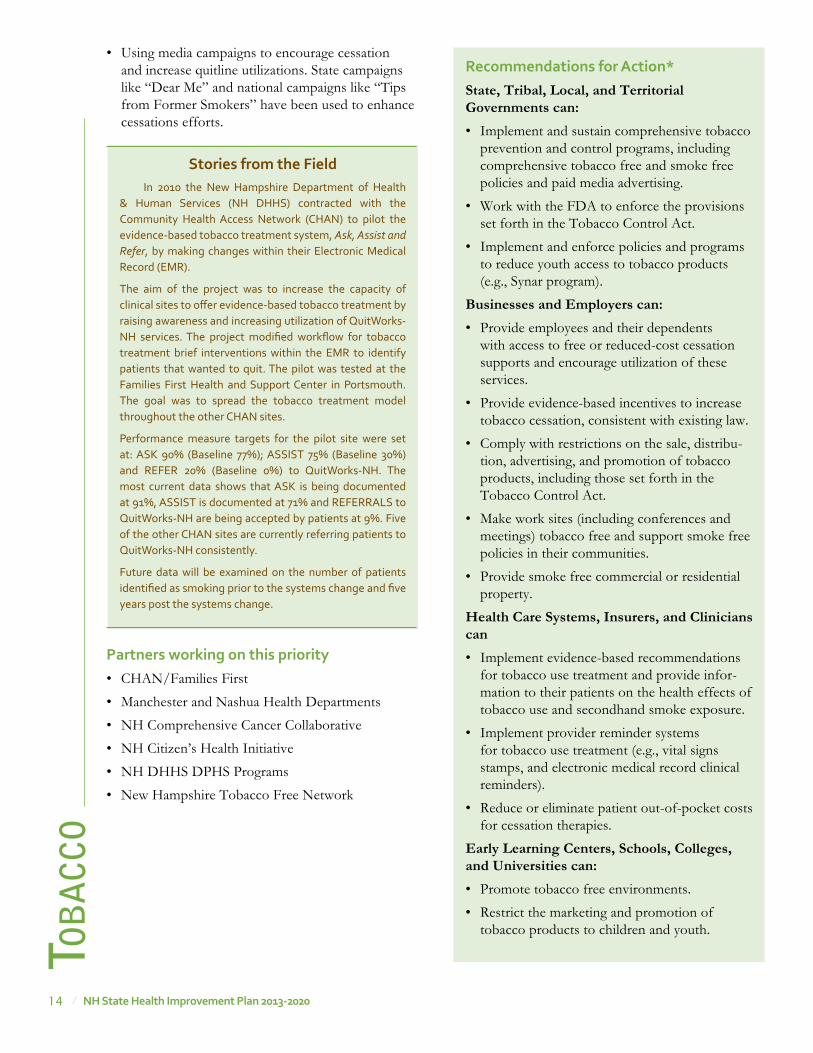
• Reduce the initiation of tobacco use among children from 8.9% (2011) to 8.0% by 2015 and 5.7% by 2020
• Reduce the number of women who report smoking cigarettes during pregnancy from 13.6% (2011) to 12% by 2015 and 10% by 2020
Figure 1. Cigarette smoking by adults
Source: NH Behavioral Risk Factor Surveillance System
Perc
ent
Perc
ent
2005 2006 2007 2008 2009 2010 2011 2012
1618202224
Cha
nge
in s
urve
y m
etho
ds
13NH state Health improvement plan 2013-2020
who should we be most concerned about?In 2011, smoking prevalence was higher among
men (20.4%) than women (18.5%). Adults aged 25-34 years (29.6%), compared to ages 55-64 years (13.6%), had the highest smoking prevalence among age groups. By region, prevalence was highest in Belknap County (26.9%) and lowest in the Grafton County (16.1%)25.
A higher prevalence of smoking exists among those with low income and low education, among blue-collar workers and the military, those with mental health issues and disabilities, and those who are incarcerated. Specifically, prevalence is higher among adults with less than high school education (46.7%) compared to those with college graduate degrees (6.5%), and higher among adults living below the poverty level (37.2% of those with incomes less than $15,000 ) compared to adults at or above the poverty level (11.8% of those with incomes more than $50,000).25
tob
Acco
Susceptibility increases smoking behavior and is affected by media, peers, and parental involvement.
Smoking rates are higher in pregnant teens, and those with low income or low education. In WIC, smoking is highest among white women, older teens, women in their 20’s, those with less than a high school education, and those in Belknap, Sullivan and Merrimack Counties.26
Although an increasing number of people in New Hampshire report that smoking is never allowed in their vehicle (78.52%) and in their home (84.6%)25, it is estimated that 20% of the state’s population ages 15 years and over work in indoor worksites with no smoke-free policies.28
Children from lower income families are more likely to be exposed to environmental tobacco smoke in their own homes or in the vehicles that they ride in. 87% of those earning incomes higher than $75,000 vs. 68% of those with incomes less than $15,000 do not allow smoking anywhere inside their homes.29
what we are doing• Promoting the NH Tobacco Helpline (Helpline),
a free, evidenced-based telephonic tobacco coun-seling service. New Hampshire residents may contact the Helpline by calling 1-800-QUIT-NOW (1-800-784-8669), through e-mail via the website www.TryToStopNH.org, or by texting CALLME to 22122. Further, the Helpline offers a Spanish-only line 1-800-8 DÉJALO (1-800-833-8556), a 24/7 pre-recorded tip line 1-800-GET-A-TIP, a tip texting service to receive daily tips by text message and a TTY/TDD service (1-800-833-1477). For residents with language barriers, the AT&T Language Line is available.
• Working to promote smoke-free housing. The Smoke-Free Multi-Unit Housing initiative is a New Hampshire tenant-centered approach to smoke-free policy adoption. Out of 18 HUD proper-ties (5,794 units), 11 HUD properties (2825 units) are committed to smoke-free policy and report smoke-free status inside their unit. Additionally, six private properties and sub-HUD contractors report adopting smoke-free policies in their units, with 3880 units adopting a smoke-free policy.
• Using current technology such as texting, on-line enrollment and social media allows the NH Tobacco Helpline to reach younger tobacco users to help them quit. These alternatives reach younger tobacco users who would otherwise not take the time to call the Helpline.
Figure 2. tobacco product use by adolescents
Source: NH Behavioral Risk Factor Surveillance System
Figure 4. women who report smoking cigarettes during pregnancy
Source: NH Division of Vital Records Administration, Birth Certificate Data
Figure 3. Initiation of tobacco use among children
Source: NH Youth Risk Behavioral Surveillance System
�
�
�
�
�
Perc
ent
2003 2004 2005 2006 2007 2008 2009 2010 2011
18
19
20
21
22
Perc
ent
2003 2005 2007 2009 2011
0
5
10
15
20
Perc
ent
2005 2006 2007 2008 2009 2010 2011 2012
101214161820
14 NH state Health improvement plan 2013-2020
tob
Acc
o• Using media campaigns to encourage cessation
and increase quitline utilizations. State campaigns like “Dear Me” and national campaigns like “Tips from Former Smokers” have been used to enhance cessations efforts.
partners working on this priority• CHAN/Families First
• Manchester and Nashua Health Departments
• NH Comprehensive Cancer Collaborative
• NH Citizen’s Health Initiative
• NH DHHS DPHS Programs
• New Hampshire Tobacco Free Network
recommendations for action*State, Tribal, Local, and Territorial Governments can: • Implement and sustain comprehensive tobacco
prevention and control programs, including comprehensive tobacco free and smoke free policies and paid media advertising.
• Work with the FDA to enforce the provisions set forth in the Tobacco Control Act.
• Implement and enforce policies and programs to reduce youth access to tobacco products (e.g., Synar program).
Businesses and Employers can: • Provide employees and their dependents
with access to free or reduced-cost cessation supports and encourage utilization of these services.
• Provide evidence-based incentives to increase tobacco cessation, consistent with existing law.
• Comply with restrictions on the sale, distribu-tion, advertising, and promotion of tobacco products, including those set forth in the Tobacco Control Act.
• Make work sites (including conferences and meetings) tobacco free and support smoke free policies in their communities.
• Provide smoke free commercial or residential property.
Health Care Systems, Insurers, and Clinicians can • Implement evidence-based recommendations
for tobacco use treatment and provide infor-mation to their patients on the health effects of tobacco use and secondhand smoke exposure.
• Implement provider reminder systems for tobacco use treatment (e.g., vital signs stamps, and electronic medical record clinical reminders).
• Reduce or eliminate patient out-of-pocket costs for cessation therapies.
Early Learning Centers, Schools, Colleges, and Universities can:• Promote tobacco free environments.
• Restrict the marketing and promotion of tobacco products to children and youth.
stories from the Field In 2010 the New Hampshire Department of Health & Human Services (NH DHHS) contracted with the Community Health Access Network (CHAN) to pilot the evidence-based tobacco treatment system, Ask, Assist and Refer, by making changes within their Electronic Medical Record (EMR).
The aim of the project was to increase the capacity of clinical sites to offer evidence-based tobacco treatment by raising awareness and increasing utilization of QuitWorks-NH services. The project modified workflow for tobacco treatment brief interventions within the EMR to identify patients that wanted to quit. The pilot was tested at the Families First Health and Support Center in Portsmouth. The goal was to spread the tobacco treatment model throughout the other CHAN sites.
Performance measure targets for the pilot site were set at: ASK 90% (Baseline 77%); ASSIST 75% (Baseline 30%) and REFER 20% (Baseline 0%) to QuitWorks-NH. The most current data shows that ASK is being documented at 91%, ASSIST is documented at 71% and REFERRALS to QuitWorks-NH are being accepted by patients at 9%. Five of the other CHAN sites are currently referring patients to QuitWorks-NH consistently.
Future data will be examined on the number of patients identified as smoking prior to the systems change and five years post the systems change.
15NH state Health improvement plan 2013-2020
references1. CDC. Annual Smoking-Attributable Mortality, Years of
Potential Life Lost, and Productivity Losses—US, 2000–2004. Morbidity and Mortality Weekly Report 2008;57(45):1226–8 [Accessed 2013-07-1].
2. Smoking Attributable Mortality, Morbidity and Economic Costs (SAMMEC) online application http://apps.nccd.cdc.gov/sammec/. [Accessed 2013-07-1].
3. US DHHS. The Health Consequences of Smoking: A Report of the Surgeon General. Atlanta, GA: US DHHS, CDC, National Center for Chronic Disease Prevention and Health Promotion, Office on Smoking and Health, 2004.
4. New Hampshire, Behavioral Risk Factor Surveillance System (BRFSS), 2011
5. Tobacco Control State Highlights, CDC 20126. Tobacco Control State Highlights, CDC 20127. Richard Doll, Richard Peto, Jillian Boreham and Isabelle
Sutherland, “Mortality in Relation to Smoking: 50 Years’ Observations on Male British Doctors.” British Medical Journal. Published 24 June 2004; 328 doi: http://dx.doi.org/10.1136/bmj.38142.554479.AE
8. Task Force on Community Preventive Services. The guide to community preventive services: tobacco use prevention and control. American Journal of Preventive Medicine. 2001;20(Suppl 2):1–88.
9. US Department of Health and Human Services. The health consequences of smoking: a report of the Surgeon General. Atlanta, GA: CDC; 2004.
10. Wakefield M, Chaloupka F, Kaufman N, Orleans C, Barker D, Ruel E. Effect of restrictions at home, at school, and in public places on teenage smoking: cross sectional study. British Medical Journal. 2000;321(7257):333–7. Erratum in: British Medical Journal. 2000;321(7261):623.
11. US Department of Health and Human Services. The health consequences of smoking: a report of the Surgeon General. Atlanta, GA: CDC; 2004.
tob
Acco
12. US DHHS. Women and smoking: a report of the Surgeon General. Rockville, MD: Office of the Surgeon General; Washington, DC: Government Printing Office; 2001.
13. Asthma Burden Report, New Hampshire DHHS, Division of Public Health Services, Asthma Control Program, March 2010
14. National Cancer Institute. Smoking and Tobacco Control Monograph No. 10. Health effects of exposure to environmental tobacco smoke: the report of the California Environmental Protection Agency. Bethesda, MD: National Cancer Institute; 1999. NIH Publication No. 99-4645.
15. US Environmental Protection Agency. Respiratory health effects of passive smoking: lung cancer and other disorders. Washington, DC: EPA Office of Research and Development; 1992. Publication No. EPA/600/6-90/006F.
16. Changes in secondhand smoke exposure among nonsmokers rom different racial/ethnic groups: US, 1988–1994 and 1999–2000. Data from 1988– 1994 NHANES III survey and 1999–2000 NHANES survey. Poster Presentation. 132nd Annual American Public Health Association Meeting, Washington, DC, November 6–10, 2004.
17. Fichtenberg CM, Glantz SA. Effect of smoke-free workplaces on smoking behaviour: systematic review. British Medical Journal. 2002;325(7357):188.
18. Institute of Medicine. Ending the Tobacco Problem: A Blueprint for the Nation. Washington: National Academies Press: 2007.
19. Farrelly MC, Pechacek TF, Chaloupka FJ. The impact of tobacco control expenditures on aggregate cigarette sales: 1981–2000. Journal of Health Economics. 2003;22(5):843–59. Erratum in: Journal of Health Economics. 2004;23(2):419.
20. Farkas AJ, Gilpin EA, White MM, Pierce JP. Association between household and workplace smoking restrictions and adolescent smoking. Journal of the American Medical Association. 2000;284(6):717–22.
21. National Cancer Institute. Smoking and Tobacco Control Monograph No. 11. State and local legislative action to reduce tobacco use. Bethesda, MD: National Cancer Institute; 2000. NIH Publication No. 00-4804.
22. Smoking Attributable Mortality, Morbidity and Economic Costs (SAMMEC) online application http://apps.nccd.cdc.gov/sammec/. [Accessed 2013-07-1].
23. Smoking Attributable Mortality, Morbidity and Economic Costs (SAMMEC) software. Smoking attributable deaths reflect average annual estimates for the period 2000-2004 and are calculated for persons aged 35 years and older. Respiratory diseases include pneumonia, influenza, bronchitis, emphysema and chronic airway obstruction. The estimated economic impact of smoking is based on smoking-attributable health care expenditures in 2004 and the average annual productivity losses for the period 2000-2004. MCH-SAMMEC uses 2003 prevalence for neonatal cost calculations.
24. Dr. Sudip Chattopadhyay, in an email from the author to the TPCP Program, “Return on Investment (ROI) calculations for New Hampshire.”2011.
25. New Hampshire, Behavioral Risk Factor Surveillance System (BRFSS), 2011
26. The Pediatric Nutrition Surveillance System (PedNSS), NH 2011.
27. New Hampshire, Behavioral Risk Factor Surveillance System (BRFSS), 2011
28. 2006-2007, Tobacco Use Supplement to the Current Population Survey (TUS-CPS)
29. NH Adult Tobacco survey, 2010
Community, Non-Profit, and Faith-Based Organizations can:• Work with local policy makers to implement
comprehensive tobacco prevention and control programs.
• Implement sustained and effective media campaigns, including raising awareness of tobacco cessation resources.
Individuals and Families can:• Quit using tobacco products and ask their
health care provider or call 1-800-QUIT-NOW for cessation support.
• Teach children about the health risks of smoking.
• Make homes smoke free to protect themselves and family members from secondhand smoke.
• Refrain from supplying underage youth with tobacco products
* From the National Prevention Strategy
16 NH state Health improvement plan 2013-2020
worDle gathered at Greater manchester public input meeting, 9/17/2012
obe
sity
/diA
be
tes

17NH state Health improvement plan 2013-2020
ob
esity/d
iAb
ete
sobesity/Diabetes
oBesitYObesity is a complex health problem that impacts
one in four New Hampshire adults (26.2%). Obesity also increases the risk for developing many chronic diseases. The state ranks 35th lowest in the nation for adults who are obese; 15 other states have a lower prevalence of obese adults.
Approximately 18.0% of the state’s 3rd grade students are obese.1 New Hampshire ranks 19th in the nation for children aged 10-17 years who are obese (15.5%). Obesity during childhood is predic-tive of obesity later in life, and is of great concern.
why is this important?Overweight in adults is defined as a body mass
index (BMI) of 25 or higher and obesity is defined as a BMI of 30 or higher. BMI is a number calculated from a person’s weight in relation to their height; it approximates body fat but does not directly measure it. BMI in children is also measured by height and weight but CDC Growth Charts are used to deter-mine the corresponding BMI for age and sex percen-tile. For children and adolescents (aged 2-19 years): Overweight is defined as a BMI at or above the 85th percentile and lower than the 95th percentile for chil-dren of the same age and sex. Obesity is defined as a BMI at or above the 95th percentile for children of the same age and sex.
Obesity in adults and children increases the risk of chronic diseases including type-2 diabetes, heart disease, and high blood pressure. Only 4.1% of adults with healthy weight have diabetes compared with 17.5% of adults who are obese. In adults who are neither overweight nor obese, 3.2% have had a heart attack compared with 6.2% of obese adults. Obesity is also associated with nonalcoholic fatty liver disease, gallstones, orthopedic problems, and depression. For children, poor nutrition and physical activity habits acquired at a young age can predispose them to over-weight and obesity as adults.2
the costBased on 2006 data, obesity-related medical costs
in the US totaled $147 billion annually, nearly 10% of all medical spending.3 Childhood obesity in the US is responsible for $3 billion of that total in annual direct costs.4 The average annual health expenditure
for a child enrolled in Medicaid treated for obesity is $6,730, while the average annual cost to treat all children enrolled in Medicaid is $2,446. The average annual health expenditure for obesity-related treat-ment for children with private insurance is $3,743, while the average annual health expenditure for all children covered by private insurance is $1,108.5
Hospitalizations of children and youths diagnosed with obesity nearly doubled between 1999 and 2005, while total costs for children and youths hospitalized for obesity-related conditions increased from $125.9 million in 2001 to $237.6 million in 2005 US dollars.6
Childhood obesity increases risk of remaining obese throughout adulthood7 and increases risk for many chronic diseases such as asthma, heart disease, stroke, diabetes, and cancer.8 One study suggests that obesity may play an important role in the development of gall-bladder stone disease in children and adolescents.9
where we are
Data collected from the New Hampshire Third Grade Healthy Smiles - Healthy Growth Survey, conducted between September 2008 and June 2009, found that 33.4% of third graders were overweight or obese.1 This survey collected the heights and weights of third grade students from 81 randomly selected New Hampshire public schools (3,151 third grade students). For more information about this survey, go to http://www.dhhs.nh.gov/dphs/nhp/data.htm.
who should we be most concerned about?New Hampshire residents with lower educa-
tion and lower income suffer disproportionally from obesity. In Coos County, 32.9% of adults are obese and an additional 31.4% are overweight. More third graders in Belknap, Merrimack, and Coos Counties (24% and 22% ) were obese than in any other New Hampshire region in 2009.10
Childhood obesity increases risk of remaining obese in adulthood12 and increases risk for many chronic diseases such as: asthma, heart disease, stroke, diabetes, and cancer.13
where do we want to be?• Reduce the proportion of adults considered obese from
25.5% (2010) to 24% by 2015 and 23% by 2020
• Reduce the proportion of children considered obese from 18.1 % (2008) to 17.2% by 2015 and 16.2% by 2020
Figure 1. adults considered obese
Source: NH Behavioral Risk Factor Surveillance System
Perc
ent
2000 2002 2004 2006 2008 2010 2012
0
10
20
30
Cha
nge
in s
urve
y m
etho
ds
18 NH state Health improvement plan 2013-2020
obe
sity
/diA
be
tes
Obesity rates are higher in schools with greater than 50% of students participating in the Free and Reduced Lunch Program compared to schools with less than 25% of students participating (27.3% vs. 16.3% respectively)11. In Coos County, 45.9% of boys were either overweight or obese. In the Belknap/Merrimack Region, 43.1% of girls were either over-weight or obese.12
what we are doing • Supporting communities in implementing healthy
eating and physical activity strategies in their regions.
• Working with child care centers to improve their policies on healthy eating and active living.
• Supporting the implementation of the following New Hampshire initiatives:
o NH Fruit and Vegetable Quantity Cookbook in institutional settings, hospitals and worksite cafeterias to improve consumption of fruits and vegetables.
o Nutritional guidance systems, such as FitPick, to reduce consumption of sugar-sweetened beverages and increase consumption of low energy dense foods.
o Livable Walkable Community design, complete streets ordinances, and joint use agreements to encourage daily physical activity.
o The NH School Nutrition Rules regarding all foods made available to students outside of the federal meals programs.
• Working to improve school nutrition standards.• Promoting the use of the NH Fruit and Vegetable
Quaintly Cookbook in schools and early care and education settings to improve consumption of fruits and vegetables.
• Promoting the World Health Organization’s Baby Friendly Hospital Initiative which implements evidence based maternity care practices that lead to better breastfeeding outcomes.
• Recognizing employers that implement policies to support and encourage breastfeeding.
• Developing a Breastfeeding Friendly Child Care designation.
• Providing breastfeeding training and technical assistance to child care programs.
partners working on this priority• Children’s Alliance of New Hampshire
• Healthy Eating Active Living (HEAL) NH
• HEAL Community Coalitions (Ashland, Berlin, Capital Region Wellness Coalition, Lakes Region
Partnership for Public Health, Nashua Division of Public Health and Community Services, Manchester Health Department, Steppin’ Up Seacoast)
• Early Learning NH
• NH Regional Planning Commissions
• SPARK NH
DiaBetesDiabetes is a group of diseases marked by high
levels of blood glucose resulting from defects in insulin production, insulin action, or both.
Diabetes is the seventh leading cause of death in New Hampshire.1 Diabetes is also a leading cause of blindness, kidney failure, and lower limb amputa-tion.2 Persons with diabetes should receive a number of clinical preventive services as many complications of diabetes can be prevented through proper care.
According to BRFSS 2011, the prevalence of diabetes among New Hampshire adults was 8.7%, and another 5.9% reported ever being diagnosed with prediabetes. Prediabetes is often undiagnosed. Up to 35% of New Hampshire adults could have predia-betes based on estimates from the National Health and Nutrition Examination Survey.2 According to America’s Health Rankings, New Hampshire ranked 18th in the country for diabetes prevalence in 2011.3
why is this important?Adults with diabetes have heart disease and stroke
death rates about two to four times higher than adults without diabetes.2 Approximately 65% of deaths among people with diabetes are due to heart disease or stroke.2 In 2011, 16.0% of adults with diabetes in New Hampshire reported having coronary heart disease, 17.8% reported having had a heart attack, and 8.5% reported having had a stroke. Further increasing their risk for coronary heart disease, 14.1% reported cigarette smoking.4
the costThe total annual cost of diagnosed diabetes in the
US is estimated to be $245 billion and about $1 billion for New Hampshire.5 The average annual health care cost for a person with diabetes is $11,744, compared with $2,935 for a person without diabetes.6 Each year,
In 2007, hospitalizations in the U.S. attributable to diabetes cost $58 billion or 50% of the total direct medical expenditure for diabetes. Nevertheless, a large portion of hospitalizations for diabetes may be preventable if primary care is effectively delivered.20
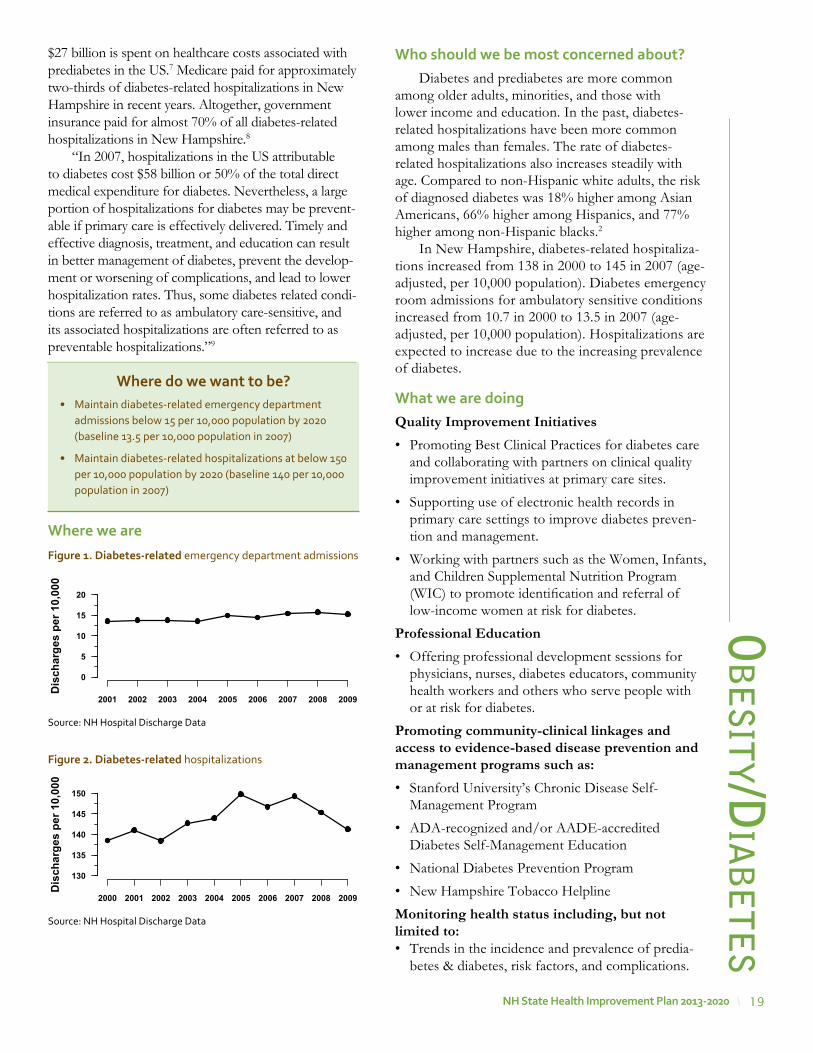
19NH state Health improvement plan 2013-2020
ob
esity/d
iAb
ete
s$27 billion is spent on healthcare costs associated with prediabetes in the US.7 Medicare paid for approximately two-thirds of diabetes-related hospitalizations in New Hampshire in recent years. Altogether, government insurance paid for almost 70% of all diabetes-related hospitalizations in New Hampshire.8
“In 2007, hospitalizations in the US attributable to diabetes cost $58 billion or 50% of the total direct medical expenditure for diabetes. Nevertheless, a large portion of hospitalizations for diabetes may be prevent-able if primary care is effectively delivered. Timely and effective diagnosis, treatment, and education can result in better management of diabetes, prevent the develop-ment or worsening of complications, and lead to lower hospitalization rates. Thus, some diabetes related condi-tions are referred to as ambulatory care-sensitive, and its associated hospitalizations are often referred to as preventable hospitalizations.”9
where we are
where do we want to be?• Maintain diabetes-related emergency department
admissions below 15 per 10,000 population by 2020 (baseline 13.5 per 10,000 population in 2007)
• Maintain diabetes-related hospitalizations at below 150 per 10,000 population by 2020 (baseline 140 per 10,000 population in 2007)
Figure 1. Diabetes-related emergency department admissions
Source: NH Hospital Discharge Data
Dis
char
ges
per 1
0,00
0
2001 2002 2003 2004 2005 2006 2007 2008 2009
0
5
10
15
20
Figure 2. Diabetes-related hospitalizations
Source: NH Hospital Discharge Data
who should we be most concerned about?Diabetes and prediabetes are more common
among older adults, minorities, and those with lower income and education. In the past, diabetes-related hospitalizations have been more common among males than females. The rate of diabetes-related hospitalizations also increases steadily with age. Compared to non-Hispanic white adults, the risk of diagnosed diabetes was 18% higher among Asian Americans, 66% higher among Hispanics, and 77% higher among non-Hispanic blacks.2
In New Hampshire, diabetes-related hospitaliza-tions increased from 138 in 2000 to 145 in 2007 (age-adjusted, per 10,000 population). Diabetes emergency room admissions for ambulatory sensitive conditions increased from 10.7 in 2000 to 13.5 in 2007 (age-adjusted, per 10,000 population). Hospitalizations are expected to increase due to the increasing prevalence of diabetes.
what we are doing Quality Improvement Initiatives • Promoting Best Clinical Practices for diabetes care
and collaborating with partners on clinical quality improvement initiatives at primary care sites.
• Supporting use of electronic health records in primary care settings to improve diabetes preven-tion and management.
• Working with partners such as the Women, Infants, and Children Supplemental Nutrition Program (WIC) to promote identification and referral of low-income women at risk for diabetes.
Professional Education• Offering professional development sessions for
physicians, nurses, diabetes educators, community health workers and others who serve people with or at risk for diabetes.
Promoting community-clinical linkages and access to evidence-based disease prevention and management programs such as:• Stanford University’s Chronic Disease Self-
Management Program
• ADA-recognized and/or AADE-accredited Diabetes Self-Management Education
• National Diabetes Prevention Program
• New Hampshire Tobacco Helpline
Monitoring health status including, but not limited to:• Trends in the incidence and prevalence of predia-
betes & diabetes, risk factors, and complications.
Dis
char
ges
per 1
0,00
0
2000 2001 2002 2003 2004 2005 2006 2007 2008 2009
130
135
140
145
150

20 NH state Health improvement plan 2013-2020
obe
sity
/diA
be
tes
recommendations for action*State, Tribal, Local, and Territorial Governments can:• Ensure that foods served or sold in govern-
ment facilities and government-funded programs and institutions (e.g., schools, prisons, juvenile correctional facilities) meet nutrition standards consistent with the Dietary Guidelines for Americans.
• Strengthen licensing standards for early learning centers to include nutritional require-ments for foods and beverages served.
• Work with hospitals, early learning centers, health care providers, and community-based organizations to implement breastfeeding policies and programs.
• Ensure laboratories, businesses, health care, and community partners are prepared to respond to outbreaks of foodborne disease.
• Use grants, zoning regulations, and other incentives to attract full-service grocery stores, supermarkets, and farmers markets to under-served neighborhoods, and use zoning codes and disincentives to discourage a dispropor-tionately high availability of unhealthy foods, especially around schools.
• Design safe neighborhoods that encourage physical activity (e.g., include sidewalks, bike lanes, adequate lighting, multi-use trails, walk-ways, and parks).
• Convene partners (e.g., urban planners, archi-tects, engineers, developers, transportation, law enforcement, public health) to consider health impacts when making transportation or land use decisions.
• Support schools and early learning centers in meeting physical activity guidelines.
Businesses and Employers can: • Increase the availability of healthy food (e.g.,
through procurement policies, healthy meeting policies, farm-to-work programs, farmers markets).
• Adopt lactation policies that provide space and break time for breastfeeding employees (in accordance with the Affordable Care Act) and offer lactation management services and support (e.g., breastfeeding peer support programs).
• Provide nutrition information to customers (e.g., on menus), make healthy options and appropriate portion sizes the default, and limit marketing of unhealthy food to children and youth.
• Reduce sodium, saturated fats, and added sugars and eliminate artificial trans fats from products.
• Implement proper handling, preparation, and storage practices to increase food safety.
• Adopt policies and programs that promote walking, bicycling, and use of public transpor-tation (e.g., provide access to fitness equipment and facilities, bicycle racks, walking paths, and changing facilities with showers).
• Changes in the percentages of patients with diabetes who receive care in accordance with the recommended national guidelines.
partners working on this priority• Community Health Access Network
• NH Departments of Education and Administrative Services
• Federally Qualified Health Centers
• Granite State Diabetes Educators
• Minority Health Coalition
• NH Bureau of Elderly and Adult Services
• Southern & Northern NH Area Health Education Centers
stories from the Fieldthe wow trail – promoting safe accessible physical activity
Community partners in the Lakes Region have worked together to develop the Winnipesauke, Opeechee and Winnisquam trail system. The trail system provides opportunities for Lakes Region residents and visitors to walk, run, cross country ski and bike. One portion of the trail was overgrown and uninviting. Partners worked with the property owner to clean up debris and brush from a building adjacent to the trail. Working with a local artist, community members helped paint the building using a whimsical train theme “Get on the health train” that fit well with the building’s shape. Smiling vegetables wave from the train window, and provide a message about healthy eating. The trail is now a more inviting place to enjoy the outdoors and be physically active.
21NH state Health improvement plan 2013-2020
ob
esity/d
iAb
ete
s• Design or redesign communities to promote
opportunities for active transportation (e.g., include places for physical activity in building and development plans).
• Sponsor a new or existing park, playground, or trail, recreation or scholastic program, or beau-tification or maintenance project.
Health Care Systems, Insurers, and Clinicians can: • Use maternity care practices that empower
new mothers to breastfeed, such as the Baby-Friendly Hospital standards.
• Screen for obesity by measuring body mass index and deliver appropriate care according to clinical practice guidelines for obesity.
• Assess dietary patterns (both quality and quan-tity of food consumed), provide nutrition education and counseling, and refer people to community resources (e.g., Women, Infants, and Children (WIC); Head Start; County Extension Services; and nutrition programs for older Americans).
• Conduct physical activity assessments, provide counseling, and refer patients to allied health care or health and fitness professionals.
• Support clinicians in implementing physical activity assessments, counseling, and referrals (e.g., provide training to clinicians, implement clinical reminder systems).
Early Learning Centers, Schools, Colleges, and Universities can: • Implement and enforce policies that increase
the availability of healthy foods, including in a la carte lines, school stores, vending machines, and fundraisers.
• Update cafeteria equipment (e.g., remove deep fryers, add salad bars) to support provision of healthier foods.
• Eliminate high-calorie, low-nutrition drinks from vending machines, cafeterias, and school stores and provide greater access to water.
• Implement policies restricting the marketing of unhealthy foods.
• Provide nutrition education.
• Provide daily physical education and recess that focuses on maximizing time physically active.
• Participate in fitness testing (e.g., the President’s Challenge) and support individualized self improvement plans.
• Support walk and bike to schools programs (e.g., “Safe Routes to School”) and work with local governments to make decisions about selecting school sites that can promote physical activity.
• Limit passive screen time.
• Make physical activity facilities available to the local community.
Community, Non-Profit, and Faith-based Organizations can:• Lead or convene city, county, and regional food
policy councils to assess local community needs and expand programs (e.g., community gardens, farmers markets) that bring healthy foods, espe-cially locally grown fruits and vegetables, to schools, businesses, and communities.
• Implement culturally and linguistically appro-priate social supports for breastfeeding, such as marketing campaigns and breastfeeding peer support programs.
• Offer low or no-cost physical activity programs (e.g., intramural sports, physical activity clubs).
• Develop and institute policies and joint use agree-ments that address liability concerns and encourage shared use of physical activity facilities (e.g., school gymnasiums, community recreation centers).
• Offer opportunities for physical activity across the lifespan (e.g., aerobic and muscle strength-ening exercise classes for seniors).
Individuals and Families can: • Eat less by avoiding oversized portions, make
half of the plate fruits and vegetables, make at least half of the grains whole grains, switch to fat-free or low-fat (1%) milk, choose foods with less sodium, and drink water instead of sugary drinks.
• Balance intake and expenditure of calories to manage body weight.
• Breastfeed their babies exclusively for the first 6 months after birth when able.
• Prevent foodborne illness by following key safety practices— clean (wash hands and surfaces often), separate (do not cross-contaminate), cook (cook food to proper temperatures), and chill (refrigerate promptly).
• Engage in at least 150 minutes of moderate-intensity activity each week (adults) or at least one hour of activity each day (children).
*From the National Prevention Strategy
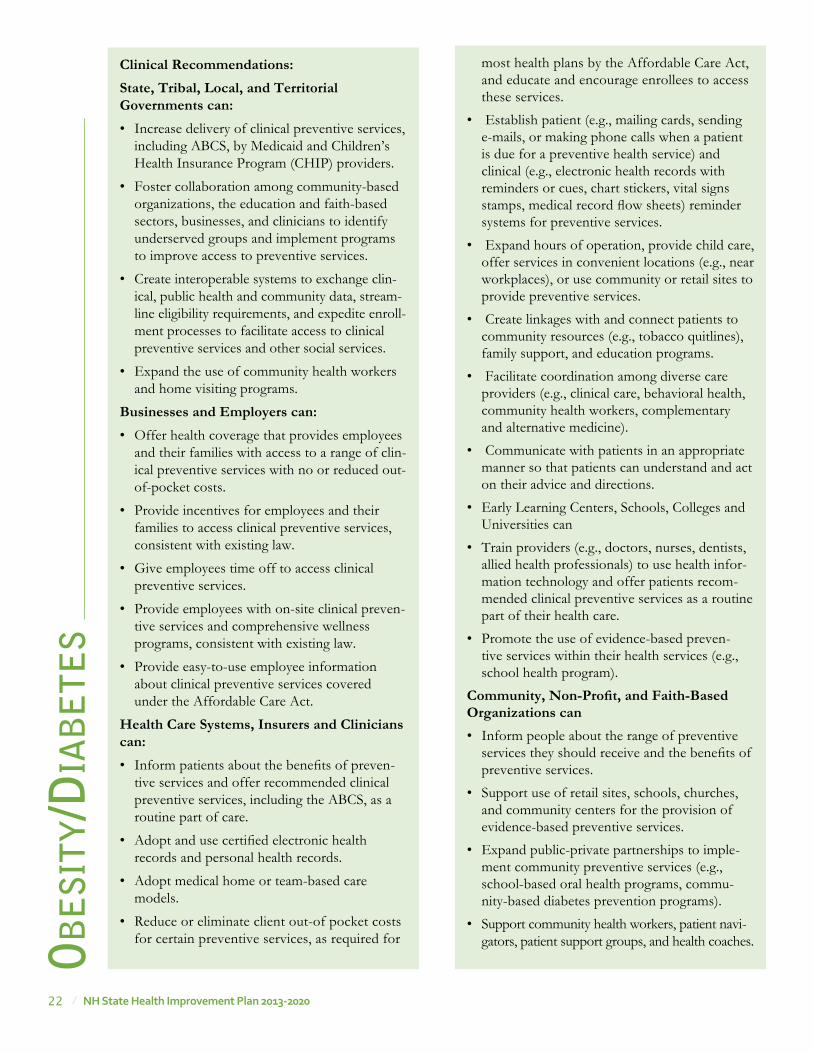
22 NH state Health improvement plan 2013-2020
Clinical Recommendations:State, Tribal, Local, and Territorial Governments can: • Increase delivery of clinical preventive services,
including ABCS, by Medicaid and Children’s Health Insurance Program (CHIP) providers.
• Foster collaboration among community-based organizations, the education and faith-based sectors, businesses, and clinicians to identify underserved groups and implement programs to improve access to preventive services.
• Create interoperable systems to exchange clin-ical, public health and community data, stream-line eligibility requirements, and expedite enroll-ment processes to facilitate access to clinical preventive services and other social services.
• Expand the use of community health workers and home visiting programs.
Businesses and Employers can:• Offer health coverage that provides employees
and their families with access to a range of clin-ical preventive services with no or reduced out-of-pocket costs.
• Provide incentives for employees and their families to access clinical preventive services, consistent with existing law.
• Give employees time off to access clinical preventive services.
• Provide employees with on-site clinical preven-tive services and comprehensive wellness programs, consistent with existing law.
• Provide easy-to-use employee information about clinical preventive services covered under the Affordable Care Act.
Health Care Systems, Insurers and Clinicians can:• Inform patients about the benefits of preven-
tive services and offer recommended clinical preventive services, including the ABCS, as a routine part of care.
• Adopt and use certified electronic health records and personal health records.
• Adopt medical home or team-based care models.
• Reduce or eliminate client out-of pocket costs for certain preventive services, as required for
most health plans by the Affordable Care Act, and educate and encourage enrollees to access these services.
• Establish patient (e.g., mailing cards, sending e-mails, or making phone calls when a patient is due for a preventive health service) and clinical (e.g., electronic health records with reminders or cues, chart stickers, vital signs stamps, medical record flow sheets) reminder systems for preventive services.
• Expand hours of operation, provide child care, offer services in convenient locations (e.g., near workplaces), or use community or retail sites to provide preventive services.
• Create linkages with and connect patients to community resources (e.g., tobacco quitlines), family support, and education programs.
• Facilitate coordination among diverse care providers (e.g., clinical care, behavioral health, community health workers, complementary and alternative medicine).
• Communicate with patients in an appropriate manner so that patients can understand and act on their advice and directions.
• Early Learning Centers, Schools, Colleges and Universities can
• Train providers (e.g., doctors, nurses, dentists, allied health professionals) to use health infor-mation technology and offer patients recom-mended clinical preventive services as a routine part of their health care.
• Promote the use of evidence-based preven-tive services within their health services (e.g., school health program).
Community, Non-Profit, and Faith-Based Organizations can• Inform people about the range of preventive
services they should receive and the benefits of preventive services.
• Support use of retail sites, schools, churches, and community centers for the provision of evidence-based preventive services.
• Expand public-private partnerships to imple-ment community preventive services (e.g., school-based oral health programs, commu-nity-based diabetes prevention programs).
• Support community health workers, patient navi-gators, patient support groups, and health coaches.ob
esi
ty/d
iAb
ete
s
23NH state Health improvement plan 2013-2020
Individuals and Families can• Visit their health care providers to receive clin-
ical preventive services.
• Use various tools to access and learn about health and prevention and ways they can better manage their health (e.g., personal health records, text reminder services, smart phone applications).
references - obesity1. New Hampshire Department of Health and Human
Services. 2008-2009 Third Grade Survey. Available from: http://www.dhhs.nh.gov/dphs/nhp/children/documents/thirdgradeoralhealth.pdf. Accessed on 08/01/2013.
2. New Hampshire Department of Health and Human Services. NH Obesity Data Book, 2010. Available from: http://www.dhhs.state.nh.us/DPHS/nhp/documents/obesity2010.pdf. Accessed on 08/01/2013.
3. Estimates. Health Affairs. 28: w822-w831.4. Trasande L. and Chatterjee S. “The Impact of Obesity on
Health Service Utilization and Costs in Childhood.” Obesity, 17(9):1749–54, 2009.304.
5. Marder W and Chang S. Childhood Obesity: Costs, Treatment Patterns, Disparities in Care, and PrevalentMedical Conditions. Thomson Medstat Research Brief, 2006. http://www.medstat.com/pdfs/childhood_obesity.pdf
6. Trasande L, Liu Y, Fryer G, et al. “Effects of Childhood Obesity On Hospital Care and Costs, 1999–2005.” Health Affairs, 28(4): w751–60, 2009.
7. Deshmukh-Taskar, P., Nicklas, T. A., Morales,M.,Yang, S. J., Zakeri, I.,&Berenson, G. S. (2006). Tracking of overweight status from childhood to young adulthood: The Bogalusa Heart Study. European Journal of Clinical Nutrition, 60, 48–57.
8. Freedman, D. S., Mei, Z., Srinivasan, S. R., Berenson, G. S., & Dietz, W. H. (2007). Cardiovascular risk factors and excess adiposity among overweight children and adolescents: The Bogalusa Heart Study. The Journal of Pediatrics, 150, 12–17. Kaechele, V.,Wabitsch, M., Thiere, D., Kessler, A. L., Haenle, M. M., Mayer, H., et al. (2006).
9. Kaechele, V., Wabitsch, M. Thiere, D. Kessler, A., Haenle, M., Mayer, H. and Kratzer, W. Prevalence of Gallbladder Stone Disease in Obese Children and Adolescents: Influence of the Degree of Obesity, Sex, and Pubertal Development. (2006). Journal of Pediatric Gastroenterology and Nutrition, 42:66–70.
10. New Hampshire Department of Health and Human Services. 2008-2009 Third Grade Survey. Available from: http://www.dhhs.nh.gov/dphs/nhp/children/documents/thirdgradeoralhealth.pdf. Accessed on 08/01/2013.
references - Diabetes
1. Centers for Disease Control and Prevention, National Center for Health Statistics. Deaths, percent of total deaths, and death rates for the 15 leading causes of death: United States and each state, 2010. Available from: http://www.cdc.gov/nchs/data/dvs/LCWK9_2010.pdf. Accessed on 9/18/2013.
2. Centers for Disease Control and Prevention. National diabetes fact sheet: national estimates and general information on diabetes and prediabetes in the US, 2011. Atlanta, GA: U.S. Department of Health and Human Services, Centers for Disease Control and Prevention, 2011.
3. United Health Foundation. America’s health rankings – a call to action for individuals & their communities, 2011 edition. Available from: http://www.americashealthrankings.org/NH/2011. Accessed on 9/18/2013.
4. New Hampshire Department of Health and Human Services. Diabetes in New Hampshire Data Brief. Available from: http://www.dhhs.nh.gov/dphs/cdpc/diabetes/documents/2011-diabetes-brief-mar2013.pdf. Accessed on 08/01/2013.
5. American Diabetes Association. Economic costs of diabetes in the U.S. in 2012. Diabetes Care. 2013 Apr;36(4):1033-46.
6. American Diabetes Association. Economic costs of diabetes in the United States in 2007. Diabetes Care. 2008;31(3):1-20.
7. UnitedHealth. The US of diabetes: challenges and opportunities in the decade ahead. Minnetonka, MN: United Health Center for Health Reform & Modernization;2010.
8. New Hampshire Department of Health and Human Services. New Hampshire 2007 Diabetes Data. Available from: http://www.dhhs.state.nh.us/dphs/cdpc/diabetes/documents/data07.pdf. Accessed on 09/18/2013.
9. Wang J, Imai K, Engelgau MM, Geiss LS, Wen C, Zhang P. Secular trends in diabetes-related preventable hospitalizations in the United States, 1998–2006. Diabetes Care. 2009: 32;1213–1217.
ob
esity/d
iAb
ete
s
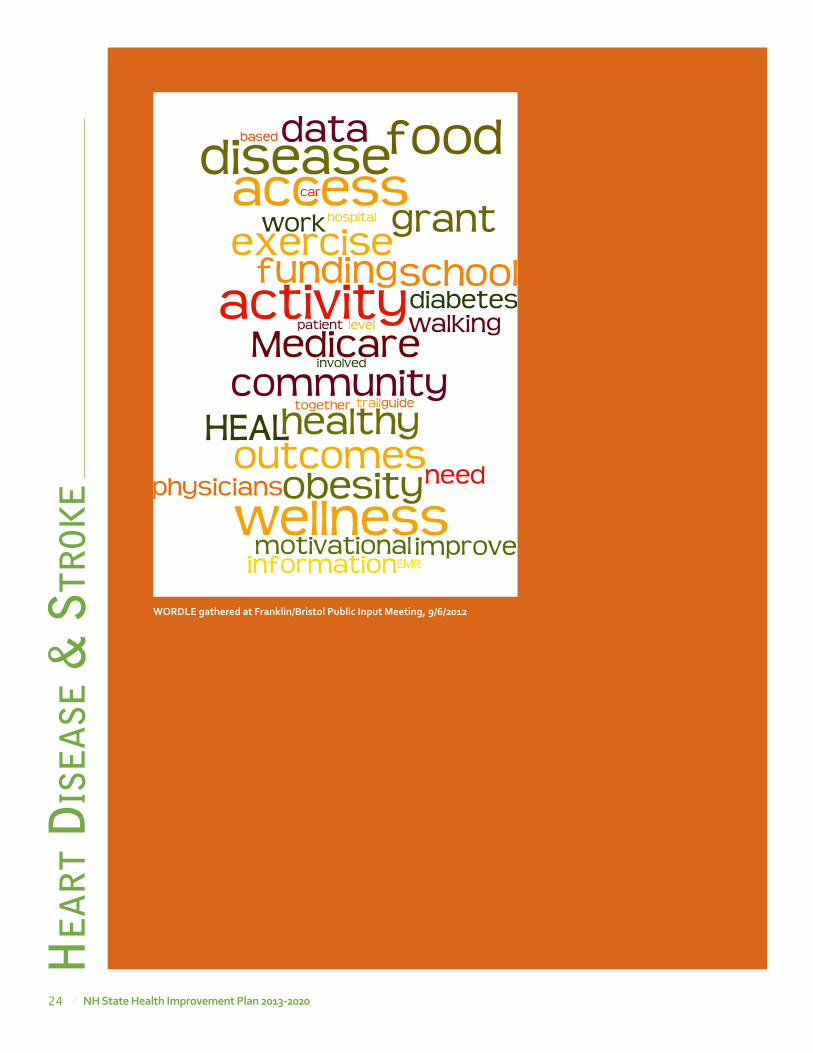
24 NH state Health improvement plan 2013-2020
he
Ar
t d
ise
Ase
& s
trok
e
worDle gathered at Franklin/Bristol public input meeting, 9/6/2012
25NH state Health improvement plan 2013-2020
he
Ar
t dise
Ase &
str
oke
Heart Disease & stroke
Coronary Heart DiseaseCoronary heart disease (CHD), also called coronary
artery disease, occurs when a substance called plaque - usually made up of cholesterol, calcium and other substances - builds up in the arteries (called coronary arteries) that supply blodd to the heart muscle.
Coronary heart disease is the most common type of heart disease that can lead to a heart attack.1 Heart disease is the leading cause of death for both men and women in the US.2 In New Hampshire, it was the second leading cause of death in 2008, when over 1,700 deaths3 occurred and 5,583 people were hospital-ized due to heart disease. The age-adjusted death rate for coronary heart disease was 115.9 per 100,000 popula-tion. Modifiable risk factors for coronary heart disease include high blood pres-sure, high blood cholesterol, diabetes, overweight and obesity, tobacco use, alcohol use, physical inactivity, and a diet that is rich in saturated fat, trans fat, and cholesterol.4 New Hampshire is ranked 29th lowest in the country for coronary heart disease.
StrokeIn the US, every four minutes someone dies of
stroke.5 A stroke occurs when blood flow to a part of your brain stops due to either a blood clot or the bursting of a blood vessel in the brain.6 Recurrent stroke is frequent; about 25% of people who recover from a first stroke will have another stroke within five years.7 In 2008, stroke was the fourth leading cause of death in the the US8 and in New Hampshire9, where 484 deaths occurred and 1,670 people were hospi-talized.3 The age-adjusted death rate for stroke was 33.2 per 100,000 population. Modifiable risk factors for stroke include high blood pressure, high blood cholesterol, diabetes, overweight and obesity, tobacco use, alcohol use, physical inactivity, and unhealthy diet. Other risks factors are previous stroke, sickle cell disease, and heart disease.10, 11
High Blood Pressure and High Blood CholesterolHigh blood pressure and high blood cholesterol
are major risk factors for heart disease and stroke.10,
11, 12, 13 The CDC reports that nationally, approxi-mately 68 million adults 18 years and older have high blood pressure, and only 46% of them have it under control.14 In 2009, nearly 29% of New Hampshire’s
residents reported having high blood pressure, and about a quarter (24.6%) of them did not take their prescribed medications for it.* Modifiable risk factors for high blood pressure include high blood choles-terol, diabetes, overweight and obesity, pre-hyperten-sion, tobacco use, alcohol use, physical inactivity, and unhealthy diet.15, 16, 17, 18, 19
In 2009, over 38% of New Hampshire’s residents were estimated to have high blood cholesterol–the second highest rate among the New England States.20 High blood cholesterol is associated with physical inactivity, overweight, diets that are rich in saturated fats, trans fatty acids (trans fats), dietary cholesterol, or triglycerides.
why is this important?Coronary heart disease can lead to chest pain,
heart failure, and abnormal heart rhythm21, which is a risk factor for stroke. In addition, it can lead to sudden cardiac death,22 and may also be asso-ciated with greater declines in global cognition, verbal memory, and executive function.23 Stroke is a leading cause of serious long-term disability13. People who survive stroke usually live with impair-ments, including vision problems, paralysis or weak-ness, speech/language problems, and memory loss. Stroke is associated with permanent brain damage and deaths. It can also lead to emotional problems and depression.7
Uncontrolled high blood pressure can lead to coronary artery disease, heart attack, heart failure, and stroke–an important cause of long term disability. In addition, high blood pressure causes more than 25,000 new cases of kidney failure annu-ally in the US.24 Other possible health consequences include bleeding from the large blood vessel (aorta) that supplies blood to the body and vision prob-lems.12, 18, 19, 25 Uncontrolled high blood cholesterol (LDL) carries a 10-year risk of developing coronary heart disease and heart attack.26 It also increases the risk of stroke.10, 13
the costIn 2010, the estimated cost of heart disease
(which also includes coronary heart disease) in the US was $316.4 billion27 and the estimated cost of stroke was $53.9 billion.13 The estimated cost of hyperten-sion is more than $93.5 billion per year.28 These esti-mates include the cost of health care services, medica-tions, and lost productivity.
In 2008, stroke was the fourth leading cause
of death in the the US8 and in New Hampshire9,
where 484 deaths occurred and 1,670
people were hospitalized due to stroke.3
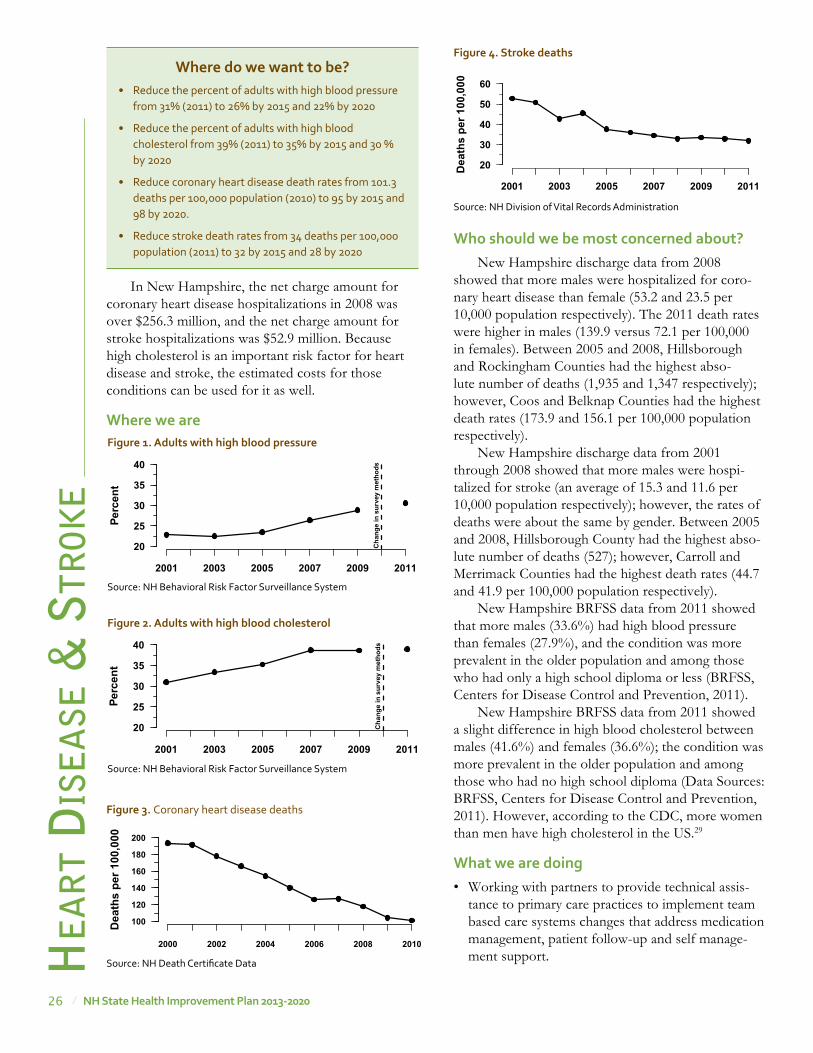
26 NH state Health improvement plan 2013-2020
he
Ar
t d
ise
Ase
& s
trok
e
In New Hampshire, the net charge amount for coronary heart disease hospitalizations in 2008 was over $256.3 million, and the net charge amount for stroke hospitalizations was $52.9 million. Because high cholesterol is an important risk factor for heart disease and stroke, the estimated costs for those conditions can be used for it as well.
where we are
who should we be most concerned about?New Hampshire discharge data from 2008
showed that more males were hospitalized for coro-nary heart disease than female (53.2 and 23.5 per 10,000 population respectively). The 2011 death rates were higher in males (139.9 versus 72.1 per 100,000 in females). Between 2005 and 2008, Hillsborough and Rockingham Counties had the highest abso-lute number of deaths (1,935 and 1,347 respectively); however, Coos and Belknap Counties had the highest death rates (173.9 and 156.1 per 100,000 population respectively).
New Hampshire discharge data from 2001 through 2008 showed that more males were hospi-talized for stroke (an average of 15.3 and 11.6 per 10,000 population respectively); however, the rates of deaths were about the same by gender. Between 2005 and 2008, Hillsborough County had the highest abso-lute number of deaths (527); however, Carroll and Merrimack Counties had the highest death rates (44.7 and 41.9 per 100,000 population respectively).
New Hampshire BRFSS data from 2011 showed that more males (33.6%) had high blood pressure than females (27.9%), and the condition was more prevalent in the older population and among those who had only a high school diploma or less (BRFSS, Centers for Disease Control and Prevention, 2011).
New Hampshire BRFSS data from 2011 showed a slight difference in high blood cholesterol between males (41.6%) and females (36.6%); the condition was more prevalent in the older population and among those who had no high school diploma (Data Sources: BRFSS, Centers for Disease Control and Prevention, 2011). However, according to the CDC, more women than men have high cholesterol in the US.29
what we are doing• Working with partners to provide technical assis-
tance to primary care practices to implement team based care systems changes that address medication management, patient follow-up and self manage-ment support.
where do we want to be?• Reduce the percent of adults with high blood pressure
from 31% (2011) to 26% by 2015 and 22% by 2020
• Reduce the percent of adults with high blood cholesterol from 39% (2011) to 35% by 2015 and 30 % by 2020
• Reduce coronary heart disease death rates from 101.3 deaths per 100,000 population (2010) to 95 by 2015 and 98 by 2020.
• Reduce stroke death rates from 34 deaths per 100,000 population (2011) to 32 by 2015 and 28 by 2020
Perc
ent
2001 2003 2005 2007 2009 2011
20
25
30
35
40
Cha
nge
in s
urve
y m
etho
ds
Figure 1. adults with high blood pressure
Source: NH Behavioral Risk Factor Surveillance System
Perc
ent
2001 2003 2005 2007 2009 2011
20
25
30
35
40
Cha
nge
in s
urve
y m
etho
ds
Figure 2. adults with high blood cholesterol
Source: NH Behavioral Risk Factor Surveillance System
� �
�
�
�
�
� �
�
� �Dea
ths
per 1
00,0
00
2000 2002 2004 2006 2008 2010
100
120
140
160
180
200
Figure 3. Coronary heart disease deaths
Source: NH Death Certificate Data
Dea
ths
per 1
00,0
00
2001 2003 2005 2007 2009 2011
20
30
40
50
60
Figure 4. stroke deaths
Source: NH Division of Vital Records Administration
27NH state Health improvement plan 2013-2020
he
Ar
t dise
Ase &
str
oke
• Implementing public information campaigns and education to increase awareness of preventive measures to prevent cardiovascular disease and stroke (cholesterol and blood pressure screening).
• Providing leadership to the Stroke Steering Committee to develop and strengthen evidenced based stroke systems of care (certified primary stroke centers, American Heart Association guide-lines).
• Working to implement a cardiac partnership to expand activities around the Million Hearts Campaign
• Collaborating with other state agencies to improve healthy food options in state agency worksites.
partners working on this priority• American Heart Association (AHA)
• American Stroke Association (ASA)
• NH Department of Administrative Services
• NH Department of Safety, Emergency Medical Services (EMS)
• NH Department of Transportation
• NH Vocational Rehabilitation - Blind Services
• NH Health Care Quality Foundation (NHQIO)
• NorthEast Cerebrovascular Consortium (NECC)
• Anthem
recommendations for action*State, Tribal, Local, and Territorial Governments can: • Increase delivery of clinical preventive services,
including ABCS (Aspirin, Blood Pressure Control, Cholesterol Management, Smoking Cessation) by Medicaid and Children’s Health Insurance Program (CHIP) providers
• Drive awareness of the importance of heart health
Businesses and Employers can: • Align existing employee health initiatives
and programs with Million Hearts™ goals. Examples include education programs, tobacco prevention, worksite wellness programs, and employee or community recognition programs.
• Educate employees. Educate employees about the importance of healthful living and the risk factors for heart disease and stroke to empower your employees to take control of their heart health.
• Create healthy workplaces. Promote heart health through workplace wellness programs.
Health Care Systems, Insurers and Clinicians can: • Inform patients about the benefits of preven-
tive services and offer recommended clinical preventive services, including the ABCS, as a routine part of care.
• Adopt medical home or team-based care models.
• Reduce or eliminate client out-of pocket costs for certain preventive services, as required for most health plans by the Affordable Care Act, and educate and encourage enrollees to access these services.
• Establish patient (e.g., mailing cards, sending e-mails, or making phone calls when a patient is due for a preventive health service) and clinical (e.g., electronic health records with reminders or cues, chart stickers, vital signs stamps, medical record flow sheets) reminder systems for preventive services.
• Expand hours of operation, provide child care, offer services in convenient locations (e.g., near workplaces), or use community or retail sites to provide preventive services.
• Create linkages with and connect patients to community resources (e.g., tobacco quitlines), family support, and education programs.
stories from the Field The NH Stroke Steering Committee formed in December 2010 and has built partnerships across the state to address stroke. The Committee is looking at identifying interventions, from primary prevention through rehabilitation, that improve stroke systems of care in New Hampshire. Several hospitals are looking at approved stroke programs such as Get With the Guidelines (GWTG) Stroke program for “improving stroke care by promoting consistent adherence to the latest scientific treatment guidelines”. Hospitals are also beginning to share model plans of systems for stroke care and sharing ideas for acute care protocols. Steering committee members are offering to serve as a resource to hospitals seeking support in making changes to improve stroke care.
28 NH state Health improvement plan 2013-2020
he
Ar
t d
ise
Ase
& st
rok
ereferences
1. CDC. Heart Disease. 2012 [cited 2012 April 30th]; Available from: http://www.cdc.gov/heartdisease/.
2. CDC. 10 Leading Causes of Death by Age Group, US – 2009. 2012 [cited 2012 May 9th]; Available from: http://www.cdc.go=v/Injury/wisqars/pdf/10LCD-Age-Grp-US-2009-a.pdf.
3. CDC-NCHS. Compressed Mortality File 1999-2008. CDC WONDER Online Database, compiled from Compressed Mortality File 1999-2008. 2011 [cited 2012 Mar 21]; Available from: http://wonder.cdc.gov/cmf-icd10.html.
4. CDC. Coronary Artery Disease (CAD). Heart Disease. 2009 [cited 2012 May 11th]; Available from: http://www.cdc.gov/heartdisease/coronary_ad.htm.
5. AHA/ASA. Impact of Stroke (Stroke statistics) [cited 2012 May 8th]; Available from: http://www.strokeassociation.org/STROKEORG/AboutStroke/Impact-of-Stroke-Stroke-statistics_UCM_310728_Article.jsp.
6. CDC. Stroke Fact Sheet. Division of Heart Disease and Stroke Prevention. 2011 [cited 2011 November 02]; Available from: http://www.cdc.gov/dhdsp/data_statistics/fact_sheets/fs_stroke.htm.
7. NINDS. National Institute of Neurological Disorders and Stroke. Stroke Information Page. 2012 [cited 2012 May 9th]; Available from: http://www.ninds.nih.gov/disorders/stroke/stroke.htm.
8. CDC-WISQARS, Leading Causes of Death Reports, National and Regional, 1999 - 2009
9. New Hampshire HealthWRQS.10. CDC-HDSP. Stroke Risk Factors. Stroke. 2010 [cited 2012
May 10th]; Available from: http://www.cdc.gov/stroke/risk_factors.htm.
11. Mayo_Clinic. Know Your Risk Factors for Stroke. Cleveland Clinic. 2012 [cited 2012 May 10th]; Available from: http://my.clevelandclinic.org/disorders/Stroke/hic_Know_Your_Risk_Factors_for_Stroke.aspx.
12. CDC. High Blood Pressure Facts. 2012 [cited 2012 May 9th]; Available from: http://www.cdc.gov/bloodpressure/facts.htm.
13. CDC. Stroke Facts. 2011 [cited 2012 May 8th]; Available from: http://www.cdc.gov/stroke/facts.htm.
14. CDC, Vital Signs: Prevalence, Treatment, and Control of Hypertension --- US, 1999--2002 and 2005--2008. MMWR. 2011. 60(4): p. 103 - 8.
15. Robbins, C., et al., Lifestyle Interventions for Hypertension and Dyslipidemia Among Women of Reproductive Age. Preventing Chronic Disease, 2011. 8(6): p. A123.
16. CDC. High Blood Pressure: Risk Factors. 2010 [cited 2012; Available from: http://www.cdc.gov/bloodpressure/risk_factors.htm.
17. CDC. Sodium Reduction: Time for Choice. Public Health Grand Rounds 2011 [cited 2011 April 25th]; Available from: http://www.cdc.gov/about/grand-rounds/archives/2011/April2011.htm.
18. NHLBI. Your Guide to Lowering High Blood Pressure: Prevention. 2011; Available from: http://www.nhlbi.nih.gov/hbp/prevent/prevent.htm.
19. MedicinePlus. Hypertension. 2011 [cited 2012 May 9th]; Available from: http://www.nlm.nih.gov/medlineplus/ency/article/000468.htm.
20. CDC. Behavioral Risk Factor Surveillance System. 2013; Available from: http://www.cdc.gov/brfss/index.htm.
21. Mayo_Clinic. Coronary Heart Disease. Complications 2011 [cited 2012 May 9th]; Available from: http://www.mayoclinic.com/health/coronary-artery-disease/ds00064/dsection=complications.
• Facilitate coordination among diverse care providers (e.g., clinical care, behavioral health, community health workers, complementary and alternative medicine).
• Communicate with patients in an appropriate manner so that patients can understand and act on their advice and directions.
Early Learning Centers, Schools, Colleges and Universities can: • Train providers (e.g., doctors, nurses, dentists,
allied health professionals) to use health informa-tion technology and offer patients recommended clinical preventive services as a routine part of their health care.
• Promote the use of evidence-based preventive services within their health services (e.g., school health program).
Community, Non-Profit, and Faith-Based Organizations can: • Inform people about the range of preventive
services they should receive and the benefits of preventive services.
• Support use of retail sites, schools, churches, and community centers for the provision of evidence-based preventive services.
• Expand public-private partnerships to implement community preventive services (e.g., school-based oral health programs, community-based diabetes prevention programs).
• Support community health workers, patient navigators, patient support groups, and health coaches.
Individuals and Families can” • Know your ABCS:
Appropriate Aspirin Use: Ask your doctor if aspirin will reduce your risk for heart attacks. Blood Pressure Control: You can control your blood pressure and reduce your risk for heart disease and stroke. Cholesterol Management: Your health care profes-sional has advice to help you lower your choles-terol levels if they’re high. Smoking Cessation: Ask your health care profes-sional to connect you with tools to help you quit smoking.
*From the Million Hearts Campaign and National Prevention Strategy

29NH state Health improvement plan 2013-2020
22. 22 Caused by Coronary Heart Disease. Circulation. 2012. 125(8): p. 1043-1052.
23. Zheng L Fau - Mack, W.J., et al., Coronary artery disease is associated with cognitive decline independent of changes on magnetic resonance imaging in cognitively normal elderly adults. 2012(1532-5415 (Electronic)).
24. NIH/NIDDK. High Blood Pressure and Kidney Disease. National Institute of Diabetes and Digestive and Kidney Diseases. National Kidney and Urologic Diseases Information Clearinghouse. National Institutes of Health. 2010.
25. Mayo_Clinic. High Blood Pressure: Complications. 2012 [cited 2012 April 4th]; Available from: http://www.mayoclinic.com/health/high-blood-pressure/DS00100/DSECTION=complications.
26. NHLBI/NIH, Detection, Evaluation, and Treatment of High Blood Cholesterol in Adults (Adult Treatment Panel III), 2004.
27. CDC. Heart Disease Fact Sheet. Division of Heart Disease and Stroke Prevention. 2011 [cited 2011 November 02]; Available from: http://www.cdc.gov/dhdsp/data_statistics/fact_sheets/fs_heart_disease.htm.
28. Heidenreich, P.A., et al., Forecasting the Future of Cardiovascular Disease in the US. Circulation, 2011.
29. CDC. Cholesterol Facts. 2012 [cited 2012 May 9th]; Available from: http://www.cdc.gov/cholesterol/facts.htm.
30 NH state Health improvement plan 2013-2020
worDle gathered at Greater sullivan public input meeting, 9/4/2012
he
Alt
hy m
oth
er
s &
bA
bie
s
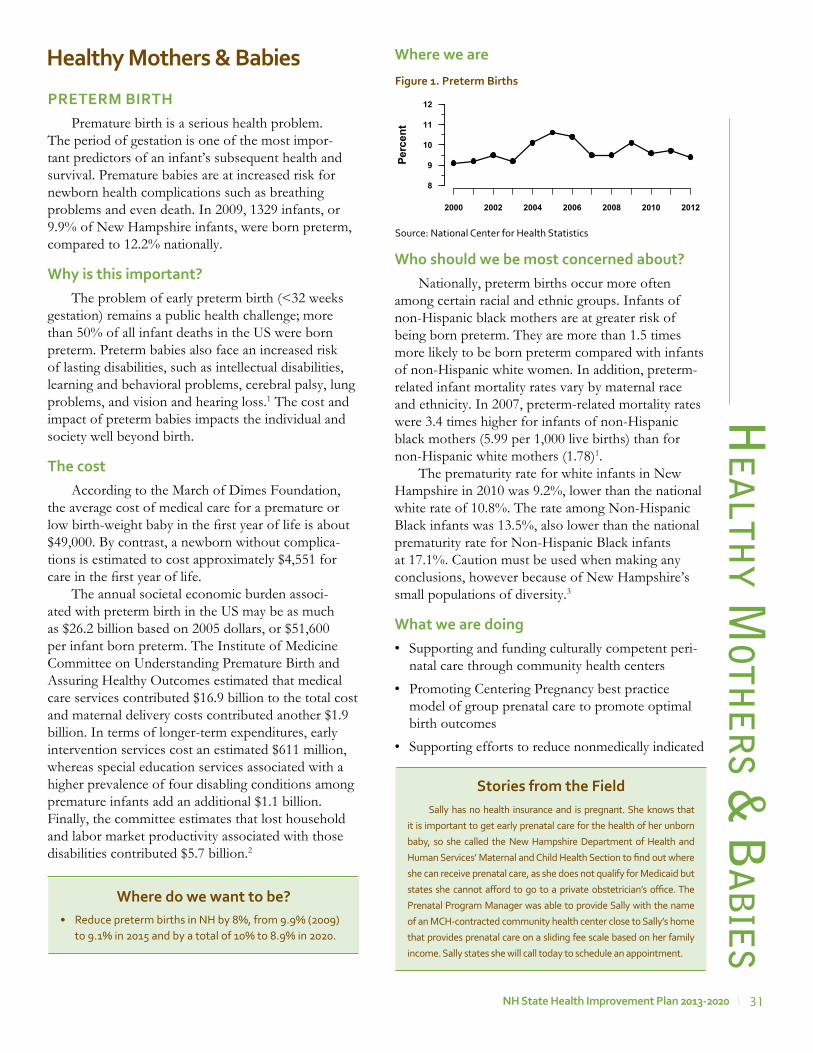
31NH state Health improvement plan 2013-2020
he
Alth
y moth
er
s & b
Ab
ies
Healthy mothers & Babies
preterm BirtHPremature birth is a serious health problem.
The period of gestation is one of the most impor-tant predictors of an infant’s subsequent health and survival. Premature babies are at increased risk for newborn health complications such as breathing problems and even death. In 2009, 1329 infants, or 9.9% of New Hampshire infants, were born preterm, compared to 12.2% nationally.
why is this important?The problem of early preterm birth (<32 weeks
gestation) remains a public health challenge; more than 50% of all infant deaths in the US were born preterm. Preterm babies also face an increased risk of lasting disabilities, such as intellectual disabilities, learning and behavioral problems, cerebral palsy, lung problems, and vision and hearing loss.1 The cost and impact of preterm babies impacts the individual and society well beyond birth.
the costAccording to the March of Dimes Foundation,
the average cost of medical care for a premature or low birth-weight baby in the first year of life is about $49,000. By contrast, a newborn without complica-tions is estimated to cost approximately $4,551 for care in the first year of life.
The annual societal economic burden associ-ated with preterm birth in the US may be as much as $26.2 billion based on 2005 dollars, or $51,600 per infant born preterm. The Institute of Medicine Committee on Understanding Premature Birth and Assuring Healthy Outcomes estimated that medical care services contributed $16.9 billion to the total cost and maternal delivery costs contributed another $1.9 billion. In terms of longer-term expenditures, early intervention services cost an estimated $611 million, whereas special education services associated with a higher prevalence of four disabling conditions among premature infants add an additional $1.1 billion. Finally, the committee estimates that lost household and labor market productivity associated with those disabilities contributed $5.7 billion.2
where do we want to be?• Reduce preterm births in NH by 8%, from 9.9% (2009)
to 9.1% in 2015 and by a total of 10% to 8.9% in 2020.
where we are
who should we be most concerned about?Nationally, preterm births occur more often
among certain racial and ethnic groups. Infants of non-Hispanic black mothers are at greater risk of being born preterm. They are more than 1.5 times more likely to be born preterm compared with infants of non-Hispanic white women. In addition, preterm-related infant mortality rates vary by maternal race and ethnicity. In 2007, preterm-related mortality rates were 3.4 times higher for infants of non-Hispanic black mothers (5.99 per 1,000 live births) than for non-Hispanic white mothers (1.78)1.
The prematurity rate for white infants in New Hampshire in 2010 was 9.2%, lower than the national white rate of 10.8%. The rate among Non-Hispanic Black infants was 13.5%, also lower than the national prematurity rate for Non-Hispanic Black infants at 17.1%. Caution must be used when making any conclusions, however because of New Hampshire’s small populations of diversity.3
what we are doing• Supporting and funding culturally competent peri-
natal care through community health centers
• Promoting Centering Pregnancy best practice model of group prenatal care to promote optimal birth outcomes
• Supporting efforts to reduce nonmedically indicated
stories from the Field Sally has no health insurance and is pregnant. She knows that
it is important to get early prenatal care for the health of her unborn
baby, so she called the New Hampshire Department of Health and
Human Services’ Maternal and Child Health Section to find out where
she can receive prenatal care, as she does not qualify for Medicaid but
states she cannot afford to go to a private obstetrician’s office. The
Prenatal Program Manager was able to provide Sally with the name
of an MCH-contracted community health center close to Sally’s home
that provides prenatal care on a sliding fee scale based on her family
income. Sally states she will call today to schedule an appointment.
Figure 1. preterm Births
Source: National Center for Health Statistics
Perc
ent
2000 2002 2004 2006 2008 2010 2012
8
9
10
11
12
32 NH state Health improvement plan 2013-2020
he
Alt
hy m
oth
er
s &
bA
bie
s
recommendations for action*State and Local Governments can: • Increase access to comprehensive precon-
ception and prenatal care, especially for low-income and at-risk women.
• Strengthen delivery of quality reproductive and sexual health services (e.g., family planning, HIV/STI testing).
• Implement evidence-based practices to prevent teen pregnancy and HIV/STIs and ensure that resources are targeted to communities at highest risk.
• Use social marketing, support services and policies to increase the number of people tested and linked to care for HIV, viral hepa-titis, and other STIs.
Businesses and Employers can: • Provide health coverage and employee assis-
tance programs that include family planning and reproductive health services.
• Provide time off for pregnant employees to access prenatal care.
• Implement and enforce policies that address sexual harassment.
early-term deliveries prior to 39-weeks gestation.
• Supporting use of evidence-based practice to iden-tify, reduce, and prevent problematic use, abuse, and dependence on alcohol and illicit drugs
• Promoting and funding smoking cessation activities
• Supporting social media and othering efforts to increase awareness of preterm birth outcomes including text4baby and Healthy Babies are Worth the Wait.
• Providing technical assistance to decrease non-medically indicated early and preterm deliveries
partners working on this priority• March of Dimes
• The American College of Obstetrics and Gynecologists (ACOG)
• Northern New England Perinatal Quality Improvement Newtwork (NNEPQIN)
• Community Health Centers
Health Care Systems, Insurers, and Clinicians can: • Advise patients about factors that affect birth
outcomes, such as alcohol, tobacco and other drugs, poor nutrition, stress, lack of prenatal care, and chronic illness or other medical problems.
• Include sexual health risk assessments as a part of routine care, help patients identify ways to reduce risk for unintended pregnancy, HIV and other STIs, and provide recommended testing and treatment for HIV and other STIs to patients and their partners when appropriate.
• Provide vaccination for Hepatitis B virus and Human Papillomavirus, as recommended by the Advisory Committee on Immunization Practices.
• Offer counseling and services to patients regarding the range of contraceptive choices either onsite or through referral consistent with Federal, state, and local regulations and laws.
• Implement policies and procedures to ensure culturally competent and confidential repro-ductive and sexual health services.
Schools, Colleges, and Universities can: • Support medically accurate, developmentally
appropriate, and evidence-based sexual health education.
• Support teen parenting programs and assist parents in completing high school, which can promote health for teen parents and children.
• Provide students with confidential, affordable reproductive and sexual health information and services consistent with Federal, state, and local regulations and laws.
• Implement mentoring or skills-based activities that promote healthy relationships and change social norms about teen dating violence.
Community, Non-Profit, and Faith-Based Organizations can: • Support pregnant women obtaining prenatal
care in the first trimester (e.g., transportation services, patient navigators).
• Educate communities, clinicians, pregnant women, and families on how to prevent infant mortality (e.g., nutrition, stress reduction, post-partum and newborn care).
33NH state Health improvement plan 2013-2020
• Promote and offer HIV and other STI testing and enhance linkages with reproductive and sexual health services (e.g., counseling, contra-ception, HIV/STI testing and treatment).
• Provide information and educational tools to both men and women to promote respectful, nonviolent relationships.
• Promote teen pregnancy prevention and posi-tive youth development, support the develop-ment of strong communication skills among parents, and provide supervised after-school activities.
Individuals and Families can: • Eat healthfully, take a daily supplement of folic
acid, stay active, stop tobacco use and drinking alcohol and see their doctor before and during pregnancy.
• Discuss their sexual health history, getting tested for HIV and other STIs, and birth control options with potential partners.
• Notify their partner if they find out they have HIV or another STI.
• Discuss sexual health concerns with their health care provider.
• Use recommended and effective prevention methods to prevent HIV and other STIs and reduce risk for unintended pregnancy.
• Communicate with children regarding their knowledge, values, and attitudes related to sexual activity, sexuality, and healthy relation-ships.
• Make efforts to know where their children are, and what they’re doing and make sure they are supervised by adults in the after-school hours.
*From the National Prevention Strategy,
references
1. http://www.marchofdimes.com/baby/premature_indepth.html, June 2012
2. Preterm Birth: Causes, Consequences, and Prevention, Richard E. Behrman, Adrienne Stith Butler, Editors, Committee on Understanding Premature Birth and Assuring Healthy Outcomes, Institute on Medicine, 2007.
3. National Vital Statistics Report, August 28, 2012
he
Alth
y moth
er
s & b
Ab
ies
where do we want to be?• Among newly diagnosed cases of Autism Spectrum
Disorders (ASD), increase the proportion diagnosed by 36 months of age from 33.6% in 2012 to 40% by 2015 and to 50% by 2020
aUtismAutism spectrum disorder (ASD) is a range of
complex neurodevelopment disorders, characterized by social impairments, communication difficulties, and restricted, repetitive, and stereotyped patterns of behavior. Experts estimate that 1 out of 88 children age eight will have an ASD.1
why is this important?Children with character-
istics of an ASD may have co-occurring conditions, including Fragile X syndrome (which causes mental retardation), tuberous sclerosis, epileptic seizures, Tourette syndrome, learning disabilities, and atten-tion deficit disorder. About 20% to 30% of children with an ASD develop epilepsy by the time they reach adulthood. For many children, symptoms of ASD improve with treatment and with age. Children whose language skills regress early in life–before the age of 3–appear to have a higher than normal risk of devel-oping epilepsy or seizure-like brain activity. During adolescence, some children with an ASD may become depressed or experience behavioral problems, and their treatment may need some modification as they transition to adulthood. People with an ASD usually continue to need services and supports as they get older, but many are able to work successfully and live independently or within a supportive environment.1
the costAutism’s costs to the nation are estimated to have
reached $126 billion per year. This figure includes indirect costs such as lost family income and produc-tivity in addition to the direct costs of autism-asso-ciated care. Lifetime costs are estimated to be more than $2.3 million for a person with an autism spec-trum disorder (ASD) and intellectual disability and $1.4 million for a person with ASD and no intellec-tual disability. Intellectual disabilities affect around 40 percent of those with autism.2
Autism’s costs to the nation are estimated to have reached $126 billion per year. This figure includes indirect costs such as lost family income and productivity in addition to the direct costs of autism-associated care.
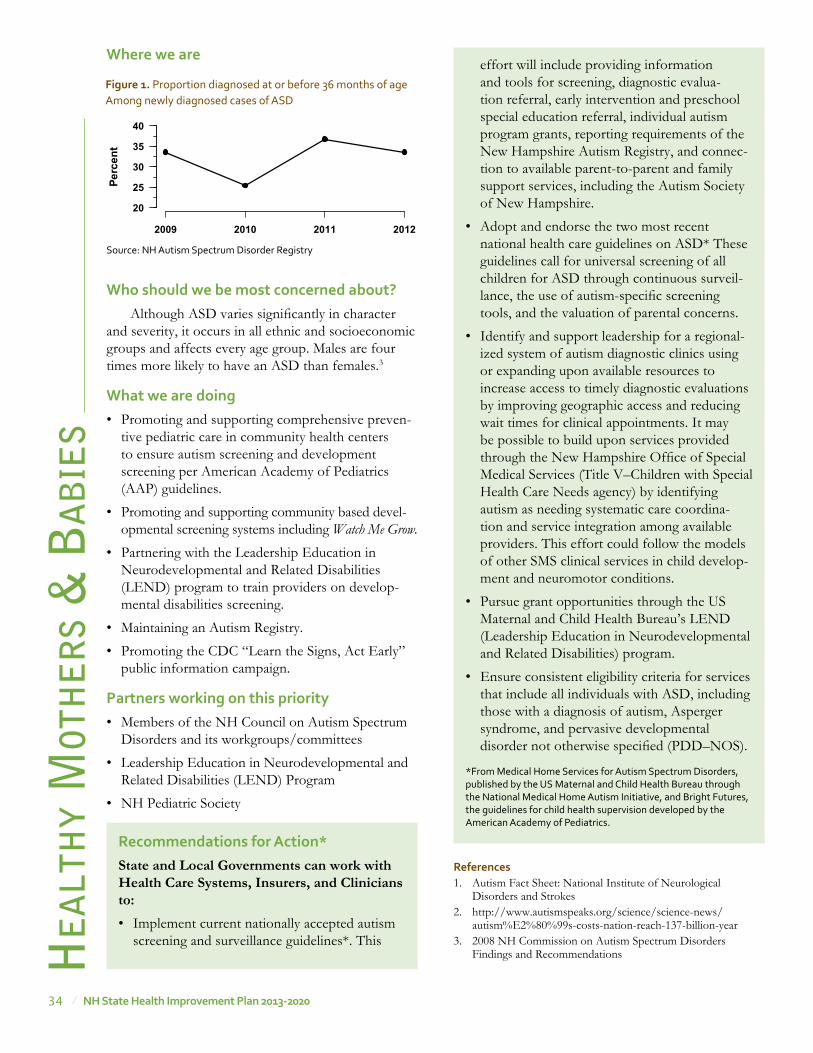
34 NH state Health improvement plan 2013-2020
he
Alt
hy m
oth
er
s &
bA
bie
s
recommendations for action*State and Local Governments can work with Health Care Systems, Insurers, and Clinicians to: • Implement current nationally accepted autism
screening and surveillance guidelines*. This
references1. Autism Fact Sheet: National Institute of Neurological
Disorders and Strokes 2. http://www.autismspeaks.org/science/science-news/
autism%E2%80%99s-costs-nation-reach-137-billion-year3. 2008 NH Commission on Autism Spectrum Disorders
Findings and Recommendations
where we are
who should we be most concerned about?Although ASD varies significantly in character
and severity, it occurs in all ethnic and socioeconomic groups and affects every age group. Males are four times more likely to have an ASD than females.3
what we are doing• Promoting and supporting comprehensive preven-
tive pediatric care in community health centers to ensure autism screening and development screening per American Academy of Pediatrics (AAP) guidelines.
• Promoting and supporting community based devel-opmental screening systems including Watch Me Grow.
• Partnering with the Leadership Education in Neurodevelopmental and Related Disabilities (LEND) program to train providers on develop-mental disabilities screening.
• Maintaining an Autism Registry.
• Promoting the CDC “Learn the Signs, Act Early” public information campaign.
partners working on this priority• Members of the NH Council on Autism Spectrum
Disorders and its workgroups/committees
• Leadership Education in Neurodevelopmental and Related Disabilities (LEND) Program
• NH Pediatric Society
effort will include providing information and tools for screening, diagnostic evalua-tion referral, early intervention and preschool special education referral, individual autism program grants, reporting requirements of the New Hampshire Autism Registry, and connec-tion to available parent-to-parent and family support services, including the Autism Society of New Hampshire.
• Adopt and endorse the two most recent national health care guidelines on ASD* These guidelines call for universal screening of all children for ASD through continuous surveil-lance, the use of autism-specific screening tools, and the valuation of parental concerns.
• Identify and support leadership for a regional-ized system of autism diagnostic clinics using or expanding upon available resources to increase access to timely diagnostic evaluations by improving geographic access and reducing wait times for clinical appointments. It may be possible to build upon services provided through the New Hampshire Office of Special Medical Services (Title V–Children with Special Health Care Needs agency) by identifying autism as needing systematic care coordina-tion and service integration among available providers. This effort could follow the models of other SMS clinical services in child develop-ment and neuromotor conditions.
• Pursue grant opportunities through the US Maternal and Child Health Bureau’s LEND (Leadership Education in Neurodevelopmental and Related Disabilities) program.
• Ensure consistent eligibility criteria for services that include all individuals with ASD, including those with a diagnosis of autism, Asperger syndrome, and pervasive developmental disorder not otherwise specified (PDD–NOS).
*From Medical Home Services for Autism Spectrum Disorders, published by the US Maternal and Child Health Bureau through the National Medical Home Autism Initiative, and Bright Futures, the guidelines for child health supervision developed by the American Academy of Pediatrics.
Perc
ent
2009 2010 2011 2012
20
25
30
35
40
Figure 1. Proportion diagnosed at or before 36 months of age Among newly diagnosed cases of ASD
Source: NH Autism Spectrum Disorder Registry
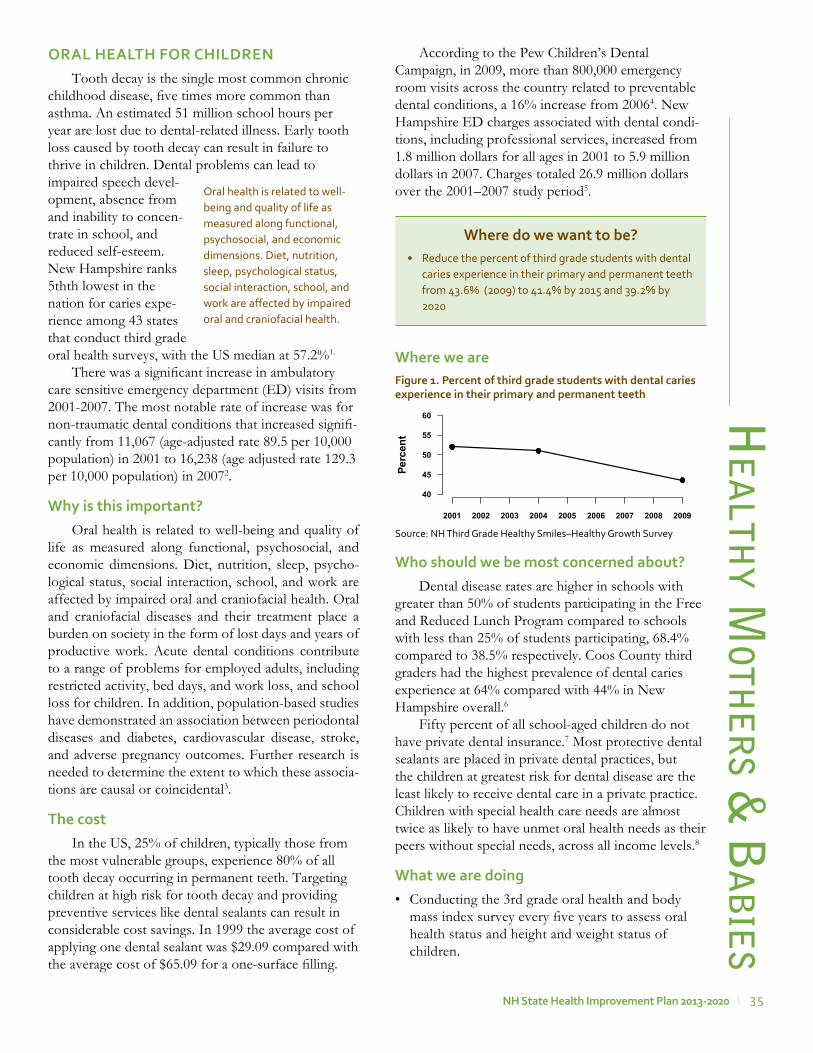
35NH state Health improvement plan 2013-2020
oral HealtH For CHilDreNTooth decay is the single most common chronic
childhood disease, five times more common than asthma. An estimated 51 million school hours per year are lost due to dental-related illness. Early tooth loss caused by tooth decay can result in failure to thrive in children. Dental problems can lead to impaired speech devel-opment, absence from and inability to concen-trate in school, and reduced self-esteem. New Hampshire ranks 5thth lowest in the nation for caries expe-rience among 43 states that conduct third grade oral health surveys, with the US median at 57.2%1.
There was a significant increase in ambulatory care sensitive emergency department (ED) visits from 2001-2007. The most notable rate of increase was for non-traumatic dental conditions that increased signifi-cantly from 11,067 (age-adjusted rate 89.5 per 10,000 population) in 2001 to 16,238 (age adjusted rate 129.3 per 10,000 population) in 20072.
why is this important?Oral health is related to well-being and quality of
life as measured along functional, psychosocial, and economic dimensions. Diet, nutrition, sleep, psycho-logical status, social interaction, school, and work are affected by impaired oral and craniofacial health. Oral and craniofacial diseases and their treatment place a burden on society in the form of lost days and years of productive work. Acute dental conditions contribute to a range of problems for employed adults, including restricted activity, bed days, and work loss, and school loss for children. In addition, population-based studies have demonstrated an association between periodontal diseases and diabetes, cardiovascular disease, stroke, and adverse pregnancy outcomes. Further research is needed to determine the extent to which these associa-tions are causal or coincidental3.
the costIn the US, 25% of children, typically those from
the most vulnerable groups, experience 80% of all tooth decay occurring in permanent teeth. Targeting children at high risk for tooth decay and providing preventive services like dental sealants can result in considerable cost savings. In 1999 the average cost of applying one dental sealant was $29.09 compared with the average cost of $65.09 for a one-surface filling.
he
Alth
y moth
er
s & b
Ab
ies
According to the Pew Children’s Dental Campaign, in 2009, more than 800,000 emergency room visits across the country related to preventable dental conditions, a 16% increase from 20064. New Hampshire ED charges associated with dental condi-tions, including professional services, increased from 1.8 million dollars for all ages in 2001 to 5.9 million dollars in 2007. Charges totaled 26.9 million dollars over the 2001–2007 study period5.
where we are
who should we be most concerned about?Dental disease rates are higher in schools with
greater than 50% of students participating in the Free and Reduced Lunch Program compared to schools with less than 25% of students participating, 68.4% compared to 38.5% respectively. Coos County third graders had the highest prevalence of dental caries experience at 64% compared with 44% in New Hampshire overall.6
Fifty percent of all school-aged children do not have private dental insurance.7 Most protective dental sealants are placed in private dental practices, but the children at greatest risk for dental disease are the least likely to receive dental care in a private practice. Children with special health care needs are almost twice as likely to have unmet oral health needs as their peers without special needs, across all income levels.8
what we are doing• Conducting the 3rd grade oral health and body
mass index survey every five years to assess oral health status and height and weight status of children.
where do we want to be?• Reduce the percent of third grade students with dental
caries experience in their primary and permanent teeth from 43.6% (2009) to 41.4% by 2015 and 39.2% by 2020
Oral health is related to well-being and quality of life as measured along functional, psychosocial, and economic dimensions. Diet, nutrition, sleep, psychological status, social interaction, school, and work are affected by impaired oral and craniofacial health.
��
�
Perc
ent
2001 2002 2003 2004 2005 2006 2007 2008 2009
40
45
50
55
60
Figure 1. percent of third grade students with dental caries experience in their primary and permanent teeth
Source: NH Third Grade Healthy Smiles–Healthy Growth Survey
36 NH state Health improvement plan 2013-2020
• Supporting and analyzing assessment of annual oral health status of children in schools to determine need for preventive and restorative services.
• Supporting the provision of on-site preventive services and referrals for restorative treatment in local dental practices.
• Promoting oral health education of parents and providing on-site preventive services and assess-ment of young children’s oral health status in WIC and Head Start and childcare settings.
• Identifying and sustaining funds to support early oral health intervention.
• Promoting education and dental treatment for pregnant mothers to avoid transmission of dental disease to babies.
• Promoting the assessment of child fluoride status to determine need for supplementation.
• Supporting and promoting the integration of child oral health assessment, treatment and education in community health centers and other medical prac-tices, based on recommendations in Bright Futures.
partners working on this priority• NH Medicaid
• NH Oral Health Coalition
• NH Office of Head Start Collaboration
• Local WIC programs
• New Hampshire Dental Society
• HNH Foundation
• Northeast Delta Dental Foundation
• DPHS funded community and school-based oral health programs
stories from the Field The New Hampshire DPHS Oral Health Program is partnering with WIC and Alice Peck Day Hospital to provide on-site oral health screenings, education and fluoride varnish applications for young children from families enrolled in WIC. In July 2012 a young Hispanic father brought his 10 month-old daughter to a WIC dental screening. He was so enthusiastic about his dental visit at the WIC site that he allowed us to take pictures. When he showed up in July 2013 for his WIC dental visit with his daughter and a new infant son we were amazed and convinced that, given the knowledge gained from a good dental experience, high-risk families with young children who have never been to a dental office can become great dental patients!
he
Alt
hy m
oth
er
s &
bA
bie
srecommendations for action*State and Local Governments can:• Increase delivery of clinical preventive services,
including childhood immunizations and influ-enza vaccination as recommended by the Centers for Disease Control and Prevention’s (CDC) Advisory Committee on Immunization Practices (ACIP), by Medicaid and Children’s Health Insurance Program (CHIP) providers.
• Foster collaboration among community-based organizations, the education and faith-based sectors, businesses, and clinicians to identify underserved groups and implement programs to improve access to preventive services.
• Create interoperable systems to exchange clinical, public health and community data, streamline eligibility requirements, and expe-dite enrollment processes to facilitate access to clinical preventive services and other social services.
• Expand the use of community health workers and home visiting programs.
• Support and promote school-based and school-linked dental sealant delivery programs to prevent or reduce tooth decay among chil-dren. (CDC Guide to Community Prevention Services. April 2013.)
• Promote early intervention to prevent dental disease in young children. (American Academy of Pediatric Dentistry, Clinical Guidelines on Periodicity of Exams, Preventive Dental Services, Anticipatory Guidance. 2013)
• Promote the inclusion of children’s oral health in overall health care (US Surgeon’s General Report, 2000)
• Promote community water fluoridation in Nashua and mid-sized NH communities as the most cost effective way to prevent tooth decay across the lifespan. (CDC Guide to Community Prevention Services. April 2013).
Businesses and Employers can: • Offer health coverage that provides employees
and their families with access to a range of clin-ical preventive services with no or reduced out-of-pocket costs.
• Provide incentives for employees and their families to access clinical preventive services, consistent with existing law.
37NH state Health improvement plan 2013-2020
he
Alth
y moth
er
s & b
Ab
ies
• Give employees time off to access clinical preventive services.
• Provide employees with on-site clinical preven-tive services and comprehensive wellness programs, consistent with existing law.
• Provide easy-to-use employee information about clinical preventive services covered under the Affordable Care Act.
Health Care Systems, Insurers and Clinicians can: • Inform patients about the benefits of preven-
tive services and offer recommended clinical preventive services, including immunizations, as a routine part of care.
• Adopt and use certified electronic health records and personal health records.
• Adopt medical home or team-based care models.
• Reduce or eliminate client out-of pocket costs for certain preventive services, as required for most health plans by the Affordable Care Act, and educate and encourage enrollees to access these services.
• Establish patient (e.g., mailing cards, sending e-mails, or making phone calls when a patient is due for a preventive health service) and clinical (e.g., electronic health records with reminders or cues, chart stickers, vital signs stamps, medical record flow sheets) reminder systems for preventive services.
• Expand hours of operation, provide child care, offer services in convenient locations (e.g., near workplaces), or use community or retail sites to provide preventive services.
• Create linkages with and connect patients to community resources (e.g., tobacco quitlines), family support, and education programs.
• Facilitate coordination among diverse care providers (e.g., clinical care, behavioral health, community health workers, complementary and alternative medicine).
• Communicate with patients in an appropriate manner so that patients can understand and act on their advice and directions.
Early Learning Centers, Schools, Colleges and Universities can: • Train providers (e.g., doctors, nurses, dentists,
allied health professionals) to use health infor-
mation technology and offer patients recom-mended clinical preventive services as a routine part of their health care.
• Promote the use of evidence-based preven-tive services within their health services (e.g., school health program).
Community, Non-Profit, and Faith-Based Organizations can: • Inform people about the range of preventive
services they should receive and the benefits of preventive services.
• Support use of retail sites, schools, churches, and community centers for the provision of evidence-based preventive services.
• Expand public-private partnerships to imple-ment community preventive services (e.g., school-based oral health programs, commu-nity-based diabetes prevention programs).
• Support community health workers, patient navigators, patient support groups, and health coaches.
Individuals and Families can: • Visit their dental providers to receive clinical
preventive services.
• Use various tools to access and learn about health and prevention and ways they can better manage their health (e.g., personal health records, text reminder services, smart phone applications).
*From the National Prevention Strategy, the Community Guide, and the American Association of Pediatric Dentistry
References1. US Department of Health and Human Services. Centers
for Disease Control and Prevention. National Oral Health Surveillance System. Available from ://www.cdc.gov/nohss/. Accessed on 04/15/2013.
2. Anderson L, Cherala S, Traore E, Martin NR. Utilization of Hospital Emergency Departments for non-traumatic dental care in New Hampshire, 2001-2008. J Community Health. 2011 Aug;36(4):513-6. doi: 10.1007/s10900-010-9335-5.
3. US Department of Health and Human Services. Oral Health in America: A Report of the Surgeon General. Rockville, MD: US Department of Health and Human Services, National Institute of Dental and Craniofacial Research, National Institutes of Health, 2000
4. “Cost Effective Investments in Children’s Oral Health”- National Coalition of State Legislators’ Webinar-May 18, 2012.)
5. (Anderson L., Cherela S., Traore E., Martin N., Utilization of Hospital Emergency Departments for Non-Traumatic Dental Care in New Hampshire, 2001-2007. Journal of Community Health, December 2010.
38 NH state Health improvement plan 2013-2020
he
Alt
hy m
oth
er
s &
bA
bie
steeN preGNaNCY preveNtioN
Compared with older women or adult parents, unintended pregnancy in teens poses increased risks to themselves and their children. These include delays in the initiation of prenatal care, reduced likelihood of breastfeeding, less healthy children, maternal depres-sion, increased risk for child abuse and neglect and lower academic achievement for the teen parents and the child.1
There are over 178,000 teenagers in New Hampshire, or 13.5% of the population. According to data from the National Center for Health Statistics, New Hampshire’s teen birth rate for 2011 was 15.7 per 1,000 births (among 15-19 year-olds). About three-quarters of the teen births occur among 18-19 year-olds.
why is this important?Births resulting from unintended pregnancies can
have negative consequences, including birth defects and low birth weight. Children from unintended preg-nancies are more likely to experience poor mental and physical health during childhood, have lower cogni-tive attainment and proficiency scores in kindergarten entry, exhibit more behavioral problems, have chronic medical conditions, rely more heavily on publicly provided health care, and be incarcerated at some time during adolescence. Teen mothers are less likely to graduate from high school or attain a GED by the time they reach age 30, and on average earn approxi-mately $3,500 less per year compared with those who delay childbearing until their 20s. In addition, they receive nearly twice as much federal aid for nearly twice as long. Similarly, early fatherhood is associated with lower educational attainment and lower income.2
the costNationally, teen childbearing costs taxpayers
at least $10.9 billion each year. An updated analysis from The National Campaign to Prevent Teen and Unplanned Pregnancy shows that teen childbearing in New Hampshire costs taxpayers at least $25 million in 2008. Of the total teen childbearing costs in New Hampshire in 2008, 45% were federal costs and 55% were state and local costs.
Most of the public sector costs of teen child-bearing are associated with negative consequences for the children of teen mothers during both their child-
6. New Hampshire Department of Health and Human Services. New Hampshire 2008-09 Third Grade Healthy Smiles – Healthy Growth Survey. Availalble from: www.dhhs.nh.gov/dphs/bchs/rhpc/oral/.../thirdgradesurvey.pdf. Accessed on 04/15/2013.
7. (Bloom B, Gift HC, Jack SS, 1992. Dental Services and Oral Health; US 1989. Hyattsville, MD: US Department of Health and Human Services, National Center for Health Statistics.)
8. Beil H, Mayer M, Rozer RG.2009Dental care untilization and expenditures in children with special health care needs. Journal of the American Dental Association 140(9); 1147-1155.)
Teen mothers are less likely to graduate from high school or attain a GED by the time they reach age 30, and on average earn approximately $3,500 less per year compared with those who delay childbearing until their 20s.
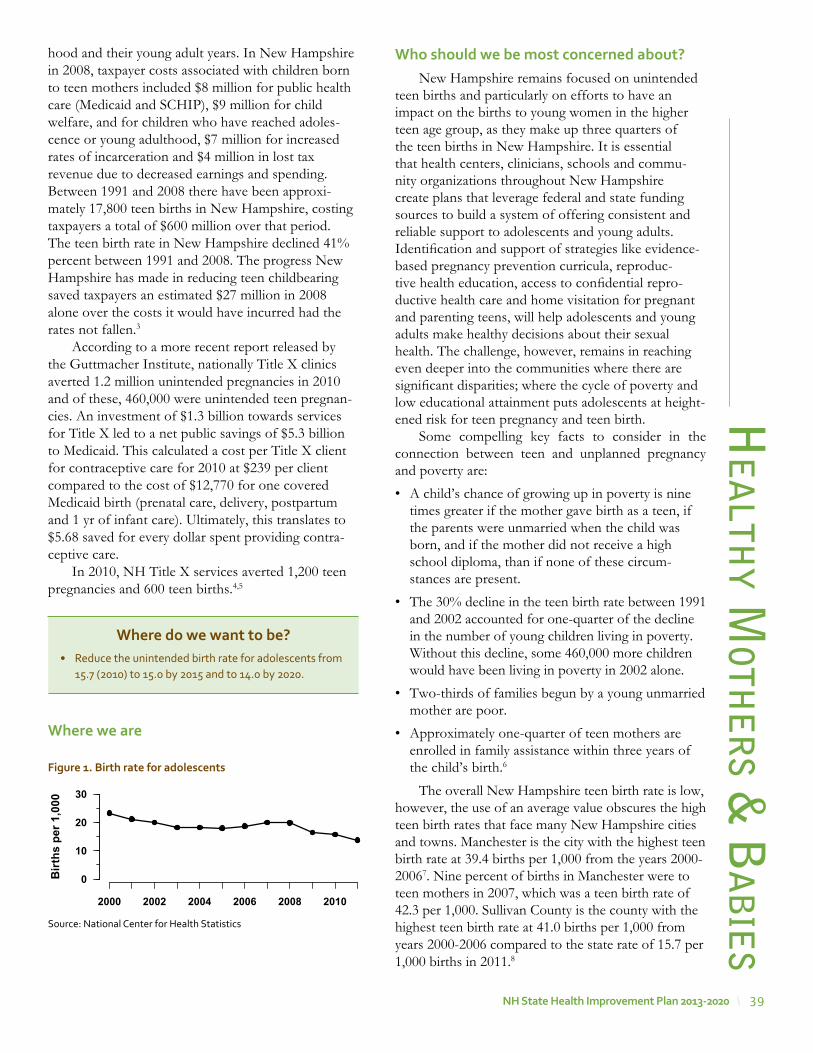
39NH state Health improvement plan 2013-2020
he
Alth
y moth
er
s & b
Ab
ies
hood and their young adult years. In New Hampshire in 2008, taxpayer costs associated with children born to teen mothers included $8 million for public health care (Medicaid and SCHIP), $9 million for child welfare, and for children who have reached adoles-cence or young adulthood, $7 million for increased rates of incarceration and $4 million in lost tax revenue due to decreased earnings and spending. Between 1991 and 2008 there have been approxi-mately 17,800 teen births in New Hampshire, costing taxpayers a total of $600 million over that period. The teen birth rate in New Hampshire declined 41% percent between 1991 and 2008. The progress New Hampshire has made in reducing teen childbearing saved taxpayers an estimated $27 million in 2008 alone over the costs it would have incurred had the rates not fallen.3
According to a more recent report released by the Guttmacher Institute, nationally Title X clinics averted 1.2 million unintended pregnancies in 2010 and of these, 460,000 were unintended teen pregnan-cies. An investment of $1.3 billion towards services for Title X led to a net public savings of $5.3 billion to Medicaid. This calculated a cost per Title X client for contraceptive care for 2010 at $239 per client compared to the cost of $12,770 for one covered Medicaid birth (prenatal care, delivery, postpartum and 1 yr of infant care). Ultimately, this translates to $5.68 saved for every dollar spent providing contra-ceptive care.
In 2010, NH Title X services averted 1,200 teen pregnancies and 600 teen births.4,5
where we are
where do we want to be?• Reduce the unintended birth rate for adolescents from
15.7 (2010) to 15.0 by 2015 and to 14.0 by 2020.
who should we be most concerned about?New Hampshire remains focused on unintended
teen births and particularly on efforts to have an impact on the births to young women in the higher teen age group, as they make up three quarters of the teen births in New Hampshire. It is essential that health centers, clinicians, schools and commu-nity organizations throughout New Hampshire create plans that leverage federal and state funding sources to build a system of offering consistent and reliable support to adolescents and young adults. Identification and support of strategies like evidence-based pregnancy prevention curricula, reproduc-tive health education, access to confidential repro-ductive health care and home visitation for pregnant and parenting teens, will help adolescents and young adults make healthy decisions about their sexual health. The challenge, however, remains in reaching even deeper into the communities where there are significant disparities; where the cycle of poverty and low educational attainment puts adolescents at height-ened risk for teen pregnancy and teen birth.
Some compelling key facts to consider in the connection between teen and unplanned pregnancy and poverty are:
• A child’s chance of growing up in poverty is nine times greater if the mother gave birth as a teen, if the parents were unmarried when the child was born, and if the mother did not receive a high school diploma, than if none of these circum-stances are present.
• The 30% decline in the teen birth rate between 1991 and 2002 accounted for one-quarter of the decline in the number of young children living in poverty. Without this decline, some 460,000 more children would have been living in poverty in 2002 alone.
• Two-thirds of families begun by a young unmarried mother are poor.
• Approximately one-quarter of teen mothers are enrolled in family assistance within three years of the child’s birth.6
The overall New Hampshire teen birth rate is low, however, the use of an average value obscures the high teen birth rates that face many New Hampshire cities and towns. Manchester is the city with the highest teen birth rate at 39.4 births per 1,000 from the years 2000-20067. Nine percent of births in Manchester were to teen mothers in 2007, which was a teen birth rate of 42.3 per 1,000. Sullivan County is the county with the highest teen birth rate at 41.0 births per 1,000 from years 2000-2006 compared to the state rate of 15.7 per 1,000 births in 2011.8
Birt
hs p
er 1
,000
2000 2002 2004 2006 2008 2010
0
10
20
30
Figure 1. Birth rate for adolescents
Source: National Center for Health Statistics
40 NH state Health improvement plan 2013-2020
he
Alt
hy m
oth
er
s &
bA
bie
sChildren and adolescents in poverty are at
increased risk for unintended pregnancy. Children and adolescents in the state are disproportionately affected by poverty, with 10.8% of New Hampshire resi-dents under age 18 living below 100% of the federal poverty level in the previous 12 months, compared to 8.1% of individuals aged 18 to 64 years old and 6.7% of residents aged 65 and older.9 Poverty and uninsured among those in late adolescence (18-24 years) is also significantly higher than among other age groups: 16% of youth ages 18-24 (16,000 youth) live in poverty and 30% of adolescents ages 18-24 lack health insurance.10 Child poverty rates in the state have been increasing.11
Statewide efforts through Title X Personal Responsibility Education Program (PREP), Community Health Centers, and other community and health care providers, aim to increase access to resources, education and healthcare services specifi-cally to teens and low income women and men for the intended purpose of preventing unintended pregnancies.
what we are doingNew Hampshire funds 10 Title X agencies (20
clinics) that provide clinical and educational repro-ductive health services to women and men. In 2010, 5,230 teens were seen in the Title X clinics.
New Hampshire funds two agencies to conduct specific teen pregnancy prevention education. The areas of concentration, based on having the highest teen birth rates, are the City of Manchester and Sullivan County. Through the PREP, the contracted agencies deliver an evidence-based program (FOCUS) to area female teens (ages 16-19 and pregnant/parenting up to age 21). The curriculum also includes adult preparatory subjects: healthy relationships, healthy life skills, and education and career success.
The Adolescent Health and Wellness Task Force meets quarterly and has been working on a strategic approach to adolescent health and wellness. This group also plays a key advisory role to the PREP and to Title X, in the capacity of reviewing material that is handed out in Title X clinics.
To date, the group has worked to define the group’s mission, vision and guiding principles. The group has developed a logic model style workplan that includes a goal statement of assuring that all adolescents (10-19) and young adults (20-25) have access to quality health care services, as well as, skills, information and supports that promote healthy life choices. One of the identified outcomes is to “decrease teen birth rate, unintended pregnancies and sexually transmitted infections.”
An initial objective that is being considered includes: to improve cultural attitudes about sexual health. An activity to accomplish this is to increase awareness and engagement with parents, educators, and health professionals.
partners working on this priorityTitle X Agencies• Ammonoosuc CHC
• Belknap Merrimack CAP
• Coos County CHC
• Child Health Services
• Concord Hospital
• Goodwin CHC
• Lamprey CHC
• Indian Stream
• Weeks CHC
• White Mountain CHC
PREP Agencies• Child Health Services
• Good Beginnings
Adolescent Health & Wellness Task Force• NH Dept. of Education
stories from the FieldIn 2012, the New Hampshire Department of Health & Human Services (NH DHHS) contracted with Child Health Services (CHS) in Manchester and Good Beginnings in Sullivan County to implement the FOCUS curriculum.
The aim of the curriculum is to service communities in NH with the highest teen birth rate. Whereas Manchester had a rate of 34.5% and Sullivan County had a rate of 32.5% and of those teen births, three quarters are to 18-19 year olds, CHS and Good Beginnings are targeting young women between the ages of 16-19, as well as pregnant and parenting young women up to the age of 21. The goal of the program is to help teens prevent unintended pregnancy, including subsequent unintended pregnancies, by providing teens a healthy foundation for adult life.
FOCUS is an evidence-based effective program that has been shown to help reduce sexual activity, increase contraceptive use in already sexually active youth, and ultimately reduce teen pregnancy. In addition, FOCUS works with teens to build important life skills such as financial literacy; education and employment preparation skills; and healthy communication skills.
41NH state Health improvement plan 2013-2020
he
Alth
y moth
er
s & b
Ab
ies
recommendations for action*State, Tribal, Local, and Territorial Governments can: • Increase access to comprehensive precon-
ception and prenatal care, especially for low-income and at-risk women.
Businesses and Employers can: • Provide health coverage and employee assis-
tance programs that include family planning and reproductive health services.
Health Care Systems, Insurers, and Clinicians can: • Include sexual health risk assessments as a part
of routine care, help patients identify ways to reduce risk for unintended pregnancy, HIV and other STIs, and provide recommended testing and treatment for HIV and other STIs to patients and their partners when appropriate.
• Offer counseling and services to patients regarding the range of contraceptive choices either onsite or through referral consistent with Federal, state, and local regulations and laws.
• Implement policies and procedures to ensure culturally competent and confidential repro-ductive and sexual health services.
Schools, Colleges, and Universities can: • Support medically accurate, developmentally
appropriate, and evidence-based sexual health education.
• Support teen parenting programs and assist parents in completing high school, which can promote health for teen parents and children.
• Provide students with confidential, affordable reproductive and sexual health information and services consistent with Federal, state, and local regulations and laws.
• Implement mentoring or skills-based activities that promote healthy relationships and change social norms about teen dating violence.
Community, Non-Profit, and Faith-Based Organizations can:• Promote and offer HIV and other STI testing
and enhance linkages with reproductive and sexual health services (e.g., counseling, contra-ception, HIV/STI testing and treatment).
• Provide information and educational tools to both men and women to promote respectful, nonviolent relationships.
• Promote teen pregnancy prevention and posi-tive youth development, support the develop-ment of strong communication skills among parents, and provide supervised after-school activities.
Individuals and Families can: • Eat healthfully, take a daily supplement of folic
acid, stay active, stop tobacco use and drinking alcohol and see their doctor before and during pregnancy.
• Discuss their sexual health history, getting tested for HIV and other STIs, and birth control options with potential partners.
• Discuss sexual health concerns with their health care provider.
• Use recommended and effective prevention methods to prevent HIV and other STIs and reduce risk for unintended pregnancy.
• Communicate with children regarding their knowledge, values, and attitudes related to sexual activity, sexuality, and healthy relation-ships.
• Make efforts to know where their children are, and what they’re doing and make sure they are supervised by adults in the after-school hours.
*From the National Prevention Strategy,
• NH WIC Program
• NH STD/HIV Program
• Catholic Medical Center
• Belknap Merrimack CAP
• Planned Parenthood of Northern New England
• Child Health Services
• Good Beginnings
• Feminist Health Center
• Jane Lovering Health Center
• White Mt. Community Health Center
• Communities United Regional Network
• Lamprey Community Health Center
• Dartmouth-Hitchcock Clinic – Concord Pediatrics
42 NH state Health improvement plan 2013-2020
references
1. http://healthypeople.gov/2020/topicsobjectives2020/overview.aspx?topicid=13 and http://www.healthcommunities.com/teen-pregnancy/children/risks-to-baby-in-teen-pregnancy.shtml
2. Hoffman SD. Kids having kids: economic costs and social consequences of teen pregnancy. The Urban Institute Press, 2008.
3. www.TheNationalCampaign.org/costs4. http://www.guttmacher.org/pubs/win/contraceptive-
needs-2010.pdf5. http://www.guttmacher.org/pubs/win/2010/WIN-2010-
NewHampshire.pdf6. http://www.thenationalcampaign.org/resources/pdf/Briefly_
Policy_Brief_Link_Reducing_TUP_Poverty%20.pdf7. New Hampshire Birth Data, Maternal and Child Health
Section, Analyzed 2010.8. New Hampshire Birth Data, Maternal and Child Health
Section, Analyzed 20109. U.S. Census Bureau, 2009, American Community Survey
2009 economic estimate. http://factfinder.census.gov/servlet/ADPTable?_bm=y&-geo_id=04000US33&-qr_name=ACS_2009_1YR_G00_DP3&-context=adp&-ds_name=&-tree_id=309&-_lang=en&-redoLog=false&-format=, accessed 11/08/10.
10. Data provided by national Kids Count Program, Annie E. Casey Foundation. http://datacenter.kidscount.org/data/bystate/Default.aspx?state=NH, accessed 11/08/10.
11. New Hampshire Birth Data, Maternal and Child Health Section, Analyzed 2010
he
Alt
hy m
oth
er
s &
bA
bie
s
43NH state Health improvement plan 2013-2020
cA
nce
r Pr
ev
en
tion
worDle gathered at Capital area public input meeting, 9/18/2012
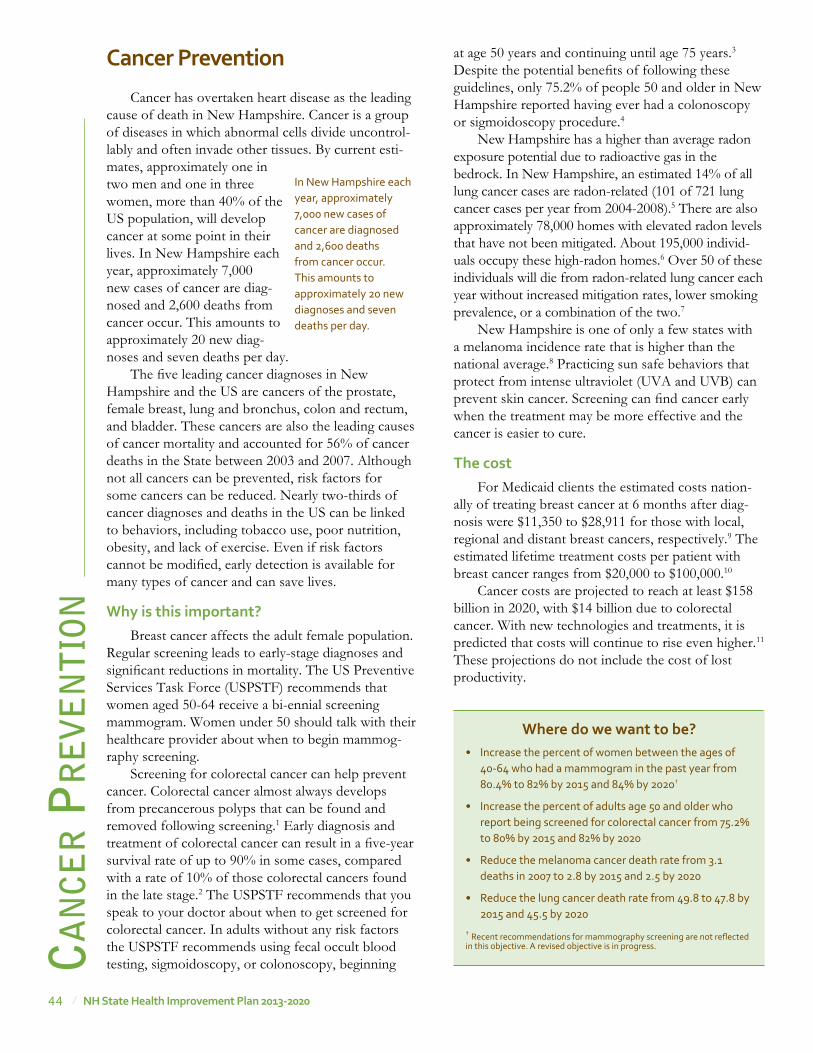
44 NH state Health improvement plan 2013-2020
Cancer has overtaken heart disease as the leading cause of death in New Hampshire. Cancer is a group of diseases in which abnormal cells divide uncontrol-lably and often invade other tissues. By current esti-mates, approximately one in two men and one in three women, more than 40% of the US population, will develop cancer at some point in their lives. In New Hampshire each year, approximately 7,000 new cases of cancer are diag-nosed and 2,600 deaths from cancer occur. This amounts to approximately 20 new diag-noses and seven deaths per day.
The five leading cancer diagnoses in New Hampshire and the US are cancers of the prostate, female breast, lung and bronchus, colon and rectum, and bladder. These cancers are also the leading causes of cancer mortality and accounted for 56% of cancer deaths in the State between 2003 and 2007. Although not all cancers can be prevented, risk factors for some cancers can be reduced. Nearly two-thirds of cancer diagnoses and deaths in the US can be linked to behaviors, including tobacco use, poor nutrition, obesity, and lack of exercise. Even if risk factors cannot be modified, early detection is available for many types of cancer and can save lives.
why is this important?Breast cancer affects the adult female population.
Regular screening leads to early-stage diagnoses and significant reductions in mortality. The US Preventive Services Task Force (USPSTF) recommends that women aged 50-64 receive a bi-ennial screening mammogram. Women under 50 should talk with their healthcare provider about when to begin mammog-raphy screening.
Screening for colorectal cancer can help prevent cancer. Colorectal cancer almost always develops from precancerous polyps that can be found and removed following screening.1 Early diagnosis and treatment of colorectal cancer can result in a five-year survival rate of up to 90% in some cases, compared with a rate of 10% of those colorectal cancers found in the late stage.2 The USPSTF recommends that you speak to your doctor about when to get screened for colorectal cancer. In adults without any risk factors the USPSTF recommends using fecal occult blood testing, sigmoidoscopy, or colonoscopy, beginning
Cancer preventioncA
nce
r P
re
ve
nti
onat age 50 years and continuing until age 75 years.3 Despite the potential benefits of following these guidelines, only 75.2% of people 50 and older in New Hampshire reported having ever had a colonoscopy or sigmoidoscopy procedure.4
New Hampshire has a higher than average radon exposure potential due to radioactive gas in the bedrock. In New Hampshire, an estimated 14% of all lung cancer cases are radon-related (101 of 721 lung cancer cases per year from 2004-2008).5 There are also approximately 78,000 homes with elevated radon levels that have not been mitigated. About 195,000 individ-uals occupy these high-radon homes.6 Over 50 of these individuals will die from radon-related lung cancer each year without increased mitigation rates, lower smoking prevalence, or a combination of the two.7
New Hampshire is one of only a few states with a melanoma incidence rate that is higher than the national average.8 Practicing sun safe behaviors that protect from intense ultraviolet (UVA and UVB) can prevent skin cancer. Screening can find cancer early when the treatment may be more effective and the cancer is easier to cure.
the costFor Medicaid clients the estimated costs nation-
ally of treating breast cancer at 6 months after diag-nosis were $11,350 to $28,911 for those with local, regional and distant breast cancers, respectively.9 The estimated lifetime treatment costs per patient with breast cancer ranges from $20,000 to $100,000.10
Cancer costs are projected to reach at least $158 billion in 2020, with $14 billion due to colorectal cancer. With new technologies and treatments, it is predicted that costs will continue to rise even higher.11 These projections do not include the cost of lost productivity.
In New Hampshire each year, approximately 7,000 new cases of cancer are diagnosed and 2,600 deaths from cancer occur. This amounts to approximately 20 new diagnoses and seven deaths per day.
where do we want to be?• Increase the percent of women between the ages of
40-64 who had a mammogram in the past year from 80.4% to 82% by 2015 and 84% by 2020†
• Increase the percent of adults age 50 and older who report being screened for colorectal cancer from 75.2% to 80% by 2015 and 82% by 2020
• Reduce the melanoma cancer death rate from 3.1 deaths in 2007 to 2.8 by 2015 and 2.5 by 2020
• Reduce the lung cancer death rate from 49.8 to 47.8 by 2015 and 45.5 by 2020
† Recent recommendations for mammography screening are not reflected in this objective. A revised objective is in progress.
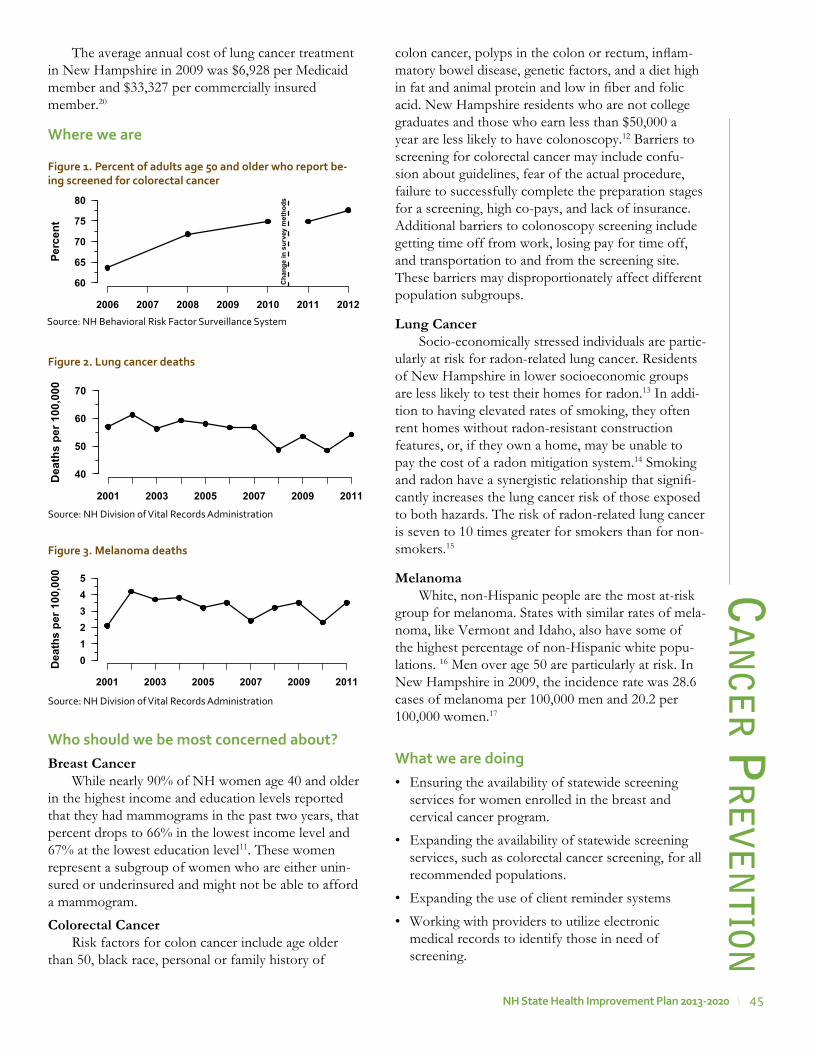
45NH state Health improvement plan 2013-2020
The average annual cost of lung cancer treatment in New Hampshire in 2009 was $6,928 per Medicaid member and $33,327 per commercially insured member.20
where we are
who should we be most concerned about?Breast Cancer
While nearly 90% of NH women age 40 and older in the highest income and education levels reported that they had mammograms in the past two years, that percent drops to 66% in the lowest income level and 67% at the lowest education level11. These women represent a subgroup of women who are either unin-sured or underinsured and might not be able to afford a mammogram.
Colorectal CancerRisk factors for colon cancer include age older
than 50, black race, personal or family history of
cA
nce
r Pr
ev
en
tioncolon cancer, polyps in the colon or rectum, inflam-matory bowel disease, genetic factors, and a diet high in fat and animal protein and low in fiber and folic acid. New Hampshire residents who are not college graduates and those who earn less than $50,000 a year are less likely to have colonoscopy.12 Barriers to screening for colorectal cancer may include confu-sion about guidelines, fear of the actual procedure, failure to successfully complete the preparation stages for a screening, high co-pays, and lack of insurance. Additional barriers to colonoscopy screening include getting time off from work, losing pay for time off, and transportation to and from the screening site. These barriers may disproportionately affect different population subgroups.
Lung CancerSocio-economically stressed individuals are partic-
ularly at risk for radon-related lung cancer. Residents of New Hampshire in lower socioeconomic groups are less likely to test their homes for radon.13 In addi-tion to having elevated rates of smoking, they often rent homes without radon-resistant construction features, or, if they own a home, may be unable to pay the cost of a radon mitigation system.14 Smoking and radon have a synergistic relationship that signifi-cantly increases the lung cancer risk of those exposed to both hazards. The risk of radon-related lung cancer is seven to 10 times greater for smokers than for non-smokers.15
MelanomaWhite, non-Hispanic people are the most at-risk
group for melanoma. States with similar rates of mela-noma, like Vermont and Idaho, also have some of the highest percentage of non-Hispanic white popu-lations. 16 Men over age 50 are particularly at risk. In New Hampshire in 2009, the incidence rate was 28.6 cases of melanoma per 100,000 men and 20.2 per 100,000 women.17
what we are doing• Ensuring the availability of statewide screening
services for women enrolled in the breast and cervical cancer program.
• Expanding the availability of statewide screening services, such as colorectal cancer screening, for all recommended populations.
• Expanding the use of client reminder systems
• Working with providers to utilize electronic medical records to identify those in need of screening.
Perc
ent
2006 2007 2008 2009 2010 2011 2012
60
65
70
75
80
Cha
nge
in s
urve
y m
etho
ds
Figure 1. percent of adults age 50 and older who report be-ing screened for colorectal cancer
Source: NH Behavioral Risk Factor Surveillance System
Dea
ths
per 1
00,0
00
2001 2003 2005 2007 2009 2011
40
50
60
70
Figure 2. lung cancer deaths
Source: NH Division of Vital Records Administration
Dea
ths
per 1
00,0
00
2001 2003 2005 2007 2009 2011
012345
Figure 3. melanoma deaths
Source: NH Division of Vital Records Administration
46 NH state Health improvement plan 2013-2020
cAn
cer P
re
ve
nti
on
stories from the FieldProgram Directors from each CDC-funded Breast and Cervical Cancer Program nationally organized through the Cancer Council and prepared a document entitled Letters From the Heart. Each state contributed letters from women who were screened through the state programs. The document was presented to the National Program Director at the annual Program Directors’ meeting in 2012. Below is a sample of some of New Hampshire’s letters:
“I would like to express my sincere gratitude for being provided preventive healthcare today through your program. I never imagined that I would be in the financial and career situation that I am in and that I would need to accept charity.”
“Thank you so much for letting me a part of your ‘Let No Woman be Overlooked’ program during my hard times. It was great for me having that program as I probably would have let my mammograms slide because I couldn’t afford them. Thank you for always being kind and gracious and making me feel special.”
“The BCCP is responsible for my early diagnosis of breast cancer. Dealing with cancer at any stage I’m sure can be overwhelming to anyone….Your program does a great service for women like myself who probably wouldn’t have been back to a doctor for a long time. Thank you for your kindness and help in many ways.”
“Just a note to thank you for your excellent care! I had no idea that such services were available until I heard from you. What a great, great service you provide for those of us who go without because of cost or no insurance. My sincere appreciation to all of you for what you do.”
• Working with insurers and worksites to expand interventions to increase screening.
• Expanding the use of community health workers and patient navigators to ensure the utilization of screening services.
• Implementing and sustaining tracking of radon and lung cancer via web-based data portal to monitor trends in exposure and guide decision-making.
• Promoting testing for radon to environmental and health professionals.
• Promoting the community based educational program “Your Skin is In” for primary and middle schools.
• Promoting the Teens on Tanning forums for high school students.
• Working with recreational and tourism settings to increase sun-protective knowledge, attitudes, and intentions, and affect behaviors among adults and children.
• Expanding distribution of free radon testing kits to homeowners by NH Healthy Homes Program
• Promoting awareness among environment and health professionals relative to radon risks and public misperceptions of radon and health impacts.
• Working with private industry to build radon-resis-tant materials, test homes for radon, and install radon reducing systems in homes.
partners working on this priority• NH Breast Cancer Coalition
• Dartmouth Hitchcock Medical Center
• Melanoma Foundation of New England
• Lakes Region Partnership for Public Health
• Capital Region Public Health Network
• American Cancer Society
stories from the Field The NH Comprehensive Cancer Control Program in partnership with the NH Comprehensive Cancer Collaboration’s (CCC) sun safety workgroup has partnered with the Melanoma Foundation of New England (MFNE) to provide programming related to increasing high school students knowledge about melanoma, risks and sun safety behaviors. As part of these efforts the MFNE has hosted a number of “Teens-on-tanning” forums that bring together high school students to gain knowledge about melanoma, develop leadership skills and advocacy plans. Additionally, a number of NH high schools are participating in the “Your Skin is In” pledge campaign that focuses on getting students to pledge not to tan for their upcoming proms.
recommendations for action*State and Local Governments can:• Facilitate collaboration among diverse sectors
(e.g., planning, housing, transportation, energy, education, environmental regulation, agriculture, business associations, labor organizations, health and public health) when making decisions likely to have a significant effect on health.
• Include health criteria as a component of deci-sion making (e.g., policy making, land use and transportation planning).
• Promote the use of interoperable systems to support data-driven prevention decisions and implement evidence-based prevention poli-cies and programs, such as Multi-component

47NH state Health improvement plan 2013-2020
cA
nce
r Pr
ev
en
tionCommunity Wide Interventions to prevent skin cancer.
• Strengthen and enforce housing and sanitary code requirements and ensure rapid remedia-tion or alternative housing options.
• Increase delivery of clinical services that comply with the US Public Services Task Force recommendations for clinical screening for cancers.
• Foster collaboration among community-based organizations, the education and faith-based sectors, businesses, and clinicians to identify underserved groups and implement programs to improve access to preventive services.
• Create interoperable systems to exchange clinical, public health and community data, streamline eligibility requirements, and expe-dite enrollment processes to facilitate access to clinical preventive services and other social services.
• Implement and sustain comprehensive tobacco prevention and control programs and protect people from secondhand smoke exposure.
• Implement and sustain comprehensive efforts to promote healthy eating to reduce cancer risk
Businesses and Employers can: • Ensure that homes and workplaces are healthy,
including eliminating safety hazards (e.g., trip hazards, unsafe stairs), ensuring that buildings are free of water intrusion, indoor environ-mental pollutants (e.g., radon, mold, tobacco smoke), and pests, and performing regular maintenance of heating and cooling systems.
• Adopt practices to increase physical activity and reduce pollution (e.g., workplace flexibility, rideshare and vanpool programs, park-and-ride incentives, travel demand management initia-tives, and telecommuting options).
• Identify and implement green building siting, design, construction, operations, and mainte-nance solutions that over time will improve the environment and health.
• Adhere to best practices to promote safety and health, including participatory approaches to hazard identification and remediation as well as supervisory and worker training.
• Offer health coverage that provides employees and their families with access to a range of
clinical preventive services with no or reduced out-of-pocket costs.
• Provide incentives for employees and their families to access clinical preventive services, consistent with existing law.
• Give employees time off to access clinical preventive services.
• Provide employees with on-site clinical preven-tive services and comprehensive wellness programs, consistent with existing law
• Support smoke free work site and individual tobacco cessation interventions
• Increase the availability of healthy food and policies that support healthy eating practices.
Health Care Systems, Insurers, and Clinicians can: • Partner with state, tribal, local, and territorial
governments, business leaders, and community-based organizations to conduct comprehen-sive community health needs assessments and develop community health improvement plans.
• Support integration of prevention and public health skills into health care professional training and cross train health care practitio-ners to implement prevention strategies.
• Increase the use of certified electronic health records to identify populations at risk and develop policies and programs.
• Inform patients about the benefits of preven-tive services and offer recommended clinical preventive services, including the ABCS, as a routine part of care.
• Adopt and use certified electronic health records and personal health records.
• Adopt medical home or team-based care models.
• Reduce or eliminate client out-of pocket costs for certain preventive services, as required for most health plans by the Affordable Care Act, and educate and encourage enrollees to access these services.
• Establish patient (e.g., mailing cards, sending e-mails, or making phone calls when a patient is due for a preventive health service) and clinical (e.g., electronic health records with reminders or cues, chart stickers, vital signs stamps, medical record flow sheets) reminder systems for preventive services.
48 NH state Health improvement plan 2013-2020
cAn
cer P
re
ve
nti
on• Expand hours of operation, provide child care,
offer services in convenient locations (e.g., near workplaces), or use community or retail sites to provide preventive services.
• Create linkages with and connect patients to community resources (e.g., tobacco quitlines), family support, and education programs.
• Facilitate coordination among diverse care providers (e.g., clinical care, behavioral health, community health workers, complementary and alternative medicine).
• Communicate with patients in an appropriate manner so that patients can understand and act on their advice and directions.
• Implement tobacco use treatment strategies to assist patients’ cessation efforts.
• Implement healthy eating strategies to improve patients’ dietary patterns.
Early Learning Centers, Schools, Colleges, and Universities can: • Integrate appropriate core public health
competencies into relevant curricula (e.g., nursing, medicine, dentistry, allied health, phar-macy, social work, education) and train profes-sionals to collaborate across sectors to promote health and wellness.
• Include training on assessing health impact within fields related to community planning and development (e.g., urban planning, archi-tecture and design, transportation, civil engi-neering, agriculture) and encourage innovation in designing livable, sustainable communities.
• Implement policies and practices that promote healthy and safe environments (e.g., improving indoor air quality; addressing mold prob-lems; reducing exposure to pesticides and lead; ensuring that drinking water sources are free from bacteria and other toxins; implementing and enforcing tobacco free policies).
• Train providers (e.g., doctors, nurses, dentists, allied health professionals) to use health infor-mation technology and offer patients recom-mended clinical preventive services as a routine part of their health care.
• Promote the use of evidence-based preven-tive services within their health services (e.g., school health program).
• Promote tobacco prevention interventions
• Implement and enforce of healthy food poli-cies and interventions
Community, Non-Profit, and Faith-Based Organizations can: • Convene diverse partners and promote strong
cross-sector participation in planning, imple-menting, and evaluating community health efforts.
• Implement processes to ensure that people are actively engaged in decisions that affect health.
• Inform people about the range of preventive services they should receive and the benefits of preventive services.
• Support use of retail sites, schools, churches, and community centers for the provision of evidence-based preventive services.
• Expand public-private partnerships to imple-ment community preventive services (e.g., school-based oral health programs, commu-nity-based diabetes prevention programs).
• Support community health workers, patient navigators, patient support groups, and health coaches.
• Work with local policy makers to implement comprehensive tobacco prevention and control programs.
• Work with local policy makers to implement healthy food interventions.
Individuals and Families can: • Conduct home assessments and modifications
(e.g., installing smoke and carbon monoxide detectors, testing for lead, checking for mold and radon).
• Visit their health care providers to receive clin-ical preventive services.
• Use various tools to access and learn about health and prevention and ways they can better manage their health (e.g., personal health records, text reminder services, smart phone applications).
• Quit using tobacco products and ask their health care provider or call 1-800-QUIT-NOW for cessation support.
• Teach children about the health risks of smoking.
• Make homes smoke free to protect themselves and family members from secondhand smoke.
49NH state Health improvement plan 2013-2020
references
1. http://www.cdc.gov/cancer/colorectal/basic_info/screening/, Accessed April 23, 2013.
2. Howlader N, Noone AM, Krapcho M, Neyman N, Aminou R, Altekruse SF, Kosary CL, Ruhl J, Tatalovich Z, Cho H, Mariotto A, Eisner MP, Lewis DR, Chen HS, Feuer EJ, Cronin KA (eds).SEER Cancer Statistics Review, 1975-2009 (Vintage 2009 Populations), National Cancer Institute. Bethesda, MD, http://seer.cancer.gov/csr/1975_2009_pops09/, based on November 2011 SEER data submission, posted to the SEER web site, 2012
3. http://www.uspreventiveservicestaskforce.org/uspstf/uspscolo.htm, Accessed April 14, 2013
4. Centers for Disease Control and Prevention (CDC). Behavioral Risk Factor Surveillance System Survey Data. Atlanta, Georgia: U.S. Department of Health and Human Services, Centers for Disease Control and Prevention, 2010.
5. N.H. Environmental Public Health Tracking Program (2012). Geographic patterns of radon exposure risk and radon testing in New Hampshire. January 2010.
6. https://www.nh.gov/epht/publications/documents/radon-issue.pdf
7. N.H. Behavioral Risk Factor Surveillance System (BRFSS) (2006; 2008). Unpublished results from analysis of radon questions from statewide surveys in 2006 and 2008.
8. Steck DJ (2010). Radon-related lung cancer deaths and mitigation cost effectiveness in a radon-prone region. http://www.aarst.org/proceedings/2010/08_RADON_RELATED_LUNG_CANCER_DEATHS_AND_MITIGATION_COST_EFFECTIVENESS_IN_A_RADON-PRONE_REGION.pdf
9. State Cancer Profiles, Cancer Control P.L.A.N.E.T. http://cancercontrolplanet.cancer.gov/. Accessed on April 22, 2013. Agency for Healthcare Research and Quality, American Cancer Society, Centers for Disease Control and Prevention, the Commission on Cancer, National Cancer Institute, and Substance Abuse and Mental Health Services Administration.
10. Cost of breast cancer treatment and follow-up care in Medicaid beneficiaries: Implications for state programs providing coverage for low-income women. American Society for Clinical Oncology. http://www.asco.org/ascov2/Meetings/Abstracts?&vmview=abst_detail_view&confID=74&abstractID=53368. Retrieved June 5, 2012.
11. The costs of treating breast cancer in the US: a synthesis of published evidence.
12. US National Library of Medicine National Institute of Health. http://www.ncbi.nlm.nih.gov/pubmed/19354340. Retrieved June 5, 2012
cA
nce
r Pr
ev
en
tion13. Mariotto AB, Yabroff KR, Shao Y, Feuer EJ, and Brown ML.
Projections of the Cost of Cancer Care in the US: 2010-2020. Jan 19, 2011, JNCI, Vol. 103, No. 2.
14. Centers for Disease Control and Prevention (CDC). Behavioral Risk Factor Surveillance System Survey Data. Atlanta, Georgia: U.S. Department of Health and Human Services, Centers for Disease Control and Prevention, 2010.
15. N.H. Environmental Public Health Tracking Program (2012). Geographic patterns of radon exposure risk and radon testing in New Hampshire. January 2010.
16. Field, RW (2008). Testimony to President’s Cancer Panel; Environmental Factors in Cancer: Radon. December 4, 2008.
17. U.S. Environmental Protection Agency (2012). Health Risks of Radon in Indoor Air. http://www.epa.gov/radon/healthrisks.html
18. http://www.census.gov/popfinder/, Accessed April 24, 2013.19. State Cancer Profiles, Cancer Control P.L.A.N.E.T. http://
cancercontrolplanet.cancer.gov/. Accessed on April 22, 2013. Agency for Healthcare Research and Quality, American Cancer Society, Centers for Disease Control and Prevention, the Commission on Cancer, National Cancer Institute, and Substance Abuse and Mental Health Services Administration.
20. A. Chalsma, Office of Medicaid Business and Policy, NH Department of Health and Human Services, personal communication, May 6, 2011)
• Refrain from supplying underage youth with tobacco products
• Eat less by avoiding oversized portions, make half of the plate fruits and vegetables, make at least half of the grains whole grains, switch to fat-free or low-fat (1%) milk, choose foods with less sodium, and drink water instead of sugary drinks.
*From the National Prevention Strategy, the Community Guide and the US Public Services Task Force Clinical Preventive Services

50 NH state Health improvement plan 2013-2020
worDle gathered at Greater sullivan public input meeting, 9/4/2012
Ast
hm
A

51NH state Health improvement plan 2013-2020
Asthma is a chronic lung disease that inflames and narrows the airways causing difficulty breathing. Asthma can be effectively treated. Treating symptoms early is important to prevent the symptoms from wors-ening and causing a severe asthma attack. Severe asthma attacks may require emer-gency care, and they can be fatal.1
New Hampshire’s asthma rate is among the highest in the nation. Approximately 110,000 adults (2010)2,3 and 25,000 children (2006 – 2008)4 in the state have asthma. Each year about 10% of adults and 8% of children are diag-nosed with asthma, amounting to approximately 7,000 new cases.4 The prevalence of asthma among New Hampshire adults increased significantly from 2000 to 2009, by 27%.4
In 2009, 55% of New Hampshire adults and 66% of New Hampshire children had their asthma well controlled.5 Compared to other states that have collected asthma control data, New Hampshire’s percentage of adults with well-controlled asthma was 3rd best out of the 36 states and, among children, was 9th best out of 35 participating states.6,7
why is this important?Compared to those without asthma, New
Hampshire residents with asthma experience decreased quality of life, increased limitations to regular activities, and increased health care utiliza-tion.5,8,9 Asthma is significantly associated with several other chronic conditions. Adults with asthma have a higher prevalence of obesity and obese individuals have a higher prevalence of asthma. This increases the risk of obesity related co-morbidites.10 Both adults and children with asthma have a higher prevalence of depression.9
Among the possible reasons for poor asthma control are inadequate insurance coverage, including coverage for drugs, limited access to primary care providers, and lack of adherence to national guide-lines by both patients and providers. Tobacco use and exposure to secondhand smoke are an impor-tant risk factor for uncontrolled asthma. Since appro-priate treatment is important for asthma control, reduced health care access increases the risk of loss of control.9
asthma the costDirect costs in the US due to asthma have been
estimated at $50.1 billion a year (2007, adjusted to 2009 dollars) and indirect costs (lost productivity) at $5.9 billion a year (2007, adjusted to 2009 dollars).11, 12
where we are
The percent of children (age <18 years) with current asthma that is “Well Controlled” is 66% for the period 2006-2008.
who should we be most concerned about?Among adults, asthma prevalence in New
Hampshire is significantly higher among females compared to males (14% versus 6%) and individuals with lower income and education levels (16% among those with incomes of less than $25,000 compared to 9% among higher income adults). Approximately 35% of New Hampshire adults with Medicaid reported current asthma compared to 9.5% of adults whose insurance source is an employer.4,8
Until about age 14, boys have a significantly higher prevalence of asthma and a higher asthma hospitalization rate than girls. Beginning in the mid-teen years, girls have a significantly higher preva-lence of asthma and higher rates of asthma hospital-ization than boys. Children in households with lower incomes have a significantly higher prevalence of asthma.4,8
where do we want to be?• Increase the percent of adults with current asthma
who have well-controlled asthma from 54.7% (2010) to 61.9% by 2015 and 69% by 2020
• Increase the percent of children with current asthma who have well-controlled asthma from 66% (2008) to 74.5% by 2015 and 83% by 2020
Asth
mA
New Hampshire’s asthma rate is among the highest in the nation. Approximately 110,000 NH adults (2010) 2,3 and 25,000 NH children (2006 – 2008)4 have asthma.
Perc
ent
2006 2007 2008 2009 2010
50
55
60
65
70
Figure 1. adults with current asthma who have well-controlled asthma
Source: NH Behavioral Risk Factor Surveillance System, asthma callback
52 NH state Health improvement plan 2013-2020
what we are doing• Organizing and facilitating the work of a network
of asthma experts from around New Hampshire reduce the burden of asthma.
• Asthma Educator Institutes and Certified Asthma Educator Exam Preparation Workshops have updated more than 300 participants on current best practices and prepared them to take the national asthma educator certification exam. The number of nationally certified asthma educators in the state has increased from four to thirty-four since the start of the program.
• Improving Asthma Management series. Sessions on diagnosing and managing asthma have been offered to community health centers and private practices around New Hampshire. To date, over 1,093 health care providers at approximately 80 different sites have received continuing medical education credits for 42 different education sessions.
• Funding asthma quality improvement projects. Health centers and private medical practices assess their practices relative to national guidelines, iden-tify needs, set priorities, and implement a work plan to improve their management of asthma and patient health outcomes. Small grants, training and technical assistance have been provided by the NH Asthma Control Program and NH Asthma Collaborative (NHAC) partners.
• Reducing environmental asthma triggers in homes: The first New Hampshire Healthy Homes Strategic Action Plan was developed by the Statewide Healthy Homes Program Steering Committee in 2009. Priority actions from the plan have been implemented – among them the “One-Touch” home visiting approach, a Healthy Homes website, and regional healthy homes strategic planning for priority target communities.
• Organizing a smoke-free housing initiative with housing authorities and multi-unit property owners in New Hampshire, with at least 10,000 units to date going smoke-free.
• Asthma Healthy Schools: Building and maintaining healthy school environments, the NH Partners for Healthy Schools, a working group of the NHAC, providing webinars to school administration, faculty and facilities managers and working with school districts in New Hampshire to assess school buildings and provide both technical and material assistance to improve indoor air quality, building maintenance practices and asthma management in New Hampshire’s schools. Ast
hm
Astories from the Field
Camp spinnaker- empowering Children with asthma
Partners in the NH Asthma Collaborative, with the direction of Zebra Crossings and New Hampshire’s Hospital for Children, provided a unique opportunity for 22 children with asthma, most with moderate or severe illness. These children experienced a week of camp on the shores of Lake Winnipesaukee. Each camper identified an initial goal they would like to accomplish by the end of camp. They had lots of “first time opportunities” including soccer, archery, canoeing, street hockey, junk band and crafts while learning to manage their asthma well. The camp was supported by medical staff from New Hampshire’s Hospital for Children and many other volunteers from multiple partners. Asthma education was an integral part of the camp with campers building their airway models to reflect their understanding of asthma control. At the close of camp, all campers had improved their knowledge of asthma, including airway changes due to asthma, asthma triggers, and use of medications, and every camper was able to identify a goal they had reached during the week.
• Analyzing and monitoring available public health data on asthma to describe the asthma burden and inform efforts to reduce its impact.
partners working on this priority• American Lung Association of New England
• Ashfield Health Care
• BREATHE New Hampshire
• Bridge the Gap, LLC
• Manchester Health Department
• NH Housing Authority
• NH Bureau of Special Medical Services
• Workwise NH
• Elliot Hospital
recommendations for action*State and Local Governments can: • Facilitate collaboration among diverse sectors
(e.g., planning, housing, transportation, energy, education, environmental regulation, agriculture, business associations, labor organizations, health and public health) when making decisions likely to have a significant effect on health.
• Include health criteria as a component of deci-sion making (e.g., policy making, land use and transportation planning).
53NH state Health improvement plan 2013-2020
Asth
mA
• Promote the use of interoperable systems to support data-driven prevention decisions and implement evidence-based prevention policies and programs, such as those listed in the Guide to Community Preventive Services.
• Strengthen and enforce housing and sanitary code requirements and ensure rapid remedia-tion or alternative housing options.
• Increase delivery of clinical services that comply with National Heart, Lung, and Blood Institute Guidelines for the Diagnosis and Management of Asthma.
• Foster collaboration among community-based organizations, the education and faith-based sectors, businesses, and clinicians to identify underserved groups and implement programs to improve access to preventive services.
• Create interoperable systems to exchange clin-ical, public health and community data, stream-line eligibility requirements, and expedite enroll-ment processes to facilitate access to clinical preventive services and other social services.
• Implement strategies to reduce tobacco use.
Businesses and Employers can: • Ensure that homes and workplaces are healthy,
including eliminating safety hazards (e.g., trip hazards, unsafe stairs), ensuring that buildings are free of water intrusion, indoor environ-mental pollutants (e.g., radon, mold, tobacco smoke), and pests, and performing regular maintenance of heating and cooling systems.
• Adopt practices to increase physical activity and reduce pollution (e.g., workplace flexibility, rideshare and vanpool programs, park-and-ride incentives, travel demand management initia-tives, and telecommuting options).
• Identify and implement green building siting, design, construction, operations, and mainte-nance solutions that over time will improve the environment and health.
• Adhere to best practices to promote safety and health, including participatory approaches to hazard identification and remediation as well as supervisory and worker training.
• Offer health coverage that provides employees and their families with access to a range of clin-ical preventive services with no or reduced out-of-pocket costs.
• Provide incentives for employees and their families to access clinical preventive services, consistent with existing law.
• Give employees time off to access clinical preventive services.
• Provide employees with on-site clinical preven-tive services and comprehensive wellness programs, consistent with existing law
• Implement strategies to reduce tobacco use
Health Care Systems, Insurers, and Clinicians can: • Partner with state, tribal, local, and territorial
governments, business leaders, and commu-nity-based organizations to conduct compre-hensive community health needs assessments and develop community health improvement plans.
• Support integration of prevention and public health skills into health care professional training and cross train health care practitio-ners to implement prevention strategies.
• ncrease the use of certified electronic health records to identify populations at risk and develop policies and programs.
• Inform patients about the benefits of preven-tive services and offer recommended clinical preventive services, including the ABCS, as a routine part of care.
• Adopt and use certified electronic health records and personal health records.
• Adopt medical home or team-based care models.
• Reduce or eliminate client out-of pocket costs for certain preventive services, as required for most health plans by the Affordable Care Act, and educate and encourage enrollees to access these services.
• Establish patient (e.g., mailing cards, sending e-mails, or making phone calls when a patient is due for a preventive health service) and clinical (e.g., electronic health records with reminders or cues, chart stickers, vital signs stamps, medical record flow sheets) reminder systems for preventive services.
• Expand hours of operation, provide child care, offer services in convenient locations (e.g., near workplaces), or use community or retail sites to provide preventive services.
54 NH state Health improvement plan 2013-2020
Ast
hm
A• Create linkages with and connect patients to
community resources (e.g., tobacco quitlines), family support, and education programs.
• Facilitate coordination among diverse care providers (e.g., clinical care, behavioral health, community health workers, complementary and alternative medicine).
• Communicate with patients in an appropriate manner so that patients can understand and act on their advice and directions.
• Implement evidence-based recommendations for tobacco use treatment and provide infor-mation to their patients on the health effects of tobacco use and secondhand smoke exposure.
Early Learning Centers, Schools, Colleges, and Universities can: • Integrate appropriate core public health
competencies into relevant curricula (e.g., nursing, medicine, dentistry, allied health, phar-macy, social work, education) and train profes-sionals to collaborate across sectors to promote health and wellness.
• Include training on assessing health impact within fields related to community planning and development (e.g., urban planning, archi-tecture and design, transportation, civil engi-neering, agriculture) and encourage innovation in designing livable, sustainable communities.
• Implement policies and practices that promote healthy and safe environments (e.g., improving indoor air quality; addressing mold prob-lems; reducing exposure to pesticides and lead; ensuring that drinking water sources are free from bacteria and other toxins; implementing and enforcing tobacco free policies).
• Train providers (e.g., doctors, nurses, dentists, allied health professionals) to use health infor-mation technology and offer patients recom-mended clinical preventive services as a routine part of their health care.
• Promote the use of evidence-based preven-tive services within their health services (e.g., school health program).
• Promote tobacco free environments.
Community, Non-Profit, and Faith-Based Organizations can: • Convene diverse partners and promote strong
cross-sector participation in planning, imple-
menting, and evaluating community health efforts.
• Implement processes to ensure that people are actively engaged in decisions that affect health.
• Inform people about the range of preventive services they should receive and the benefits of preventive services.
• Support use of retail sites, schools, churches, and community centers for the provision of evidence-based preventive services.
• Expand public-private partnerships to imple-ment community preventive services (e.g., school-based oral health programs, commu-nity-based diabetes prevention programs).
• Support community health workers, patient navigators, patient support groups, and health coaches.
• Implement comprehensive tobacco prevention and control programs
Individuals and Families can: • Conduct home assessments and modifications
(e.g., installing smoke and carbon monoxide detectors, testing for lead, checking for mold and radon).
• Visit their health care providers to receive clin-ical preventive services.
• Use various tools to access and learn about health and prevention and ways they can better manage their health (e.g., personal health records, text reminder services, smart phone applications).
• Quit using tobacco products and ask their health care provider or call 1-800-QUIT-NOW for cessation support.
• Teach children about the health risks of smoking.
• Make homes smoke free to protect themselves and family members from secondhand smoke.
• Refrain from supplying underage youth with tobacco products
* From the National Prevention Strategy and National Heart, Lung and Blood Institute
55NH state Health improvement plan 2013-2020
Asth
mA
references1. National Heart Lung and Blood Institute. What is Asthma?
National Institutes of Health, Department of Health and Human Services. June 2012. Available at: http://www.nhlbi.nih.gov/health/health-topics/topics/asthma/. Accessed April 2013.
2. Centers for Disease Control and Prevention (CDC). Behavioral Risk Factor Surveillance System Survey Data. Atlanta, Georgia: U.S. Department of Health and Human Services, Centers for Disease Control and Prevention, 2010.
3. U.S. Census Bureau. State & County QuickFacts. U.S. Department of Commerce. March 14, 2013. Available at: http://quickfacts.census.gov/qfd/states/33000.html. Accessed April 2013.
4. Traore EA. Chapter 1: Asthma Prevalence and Incidence. Asthma Burden Report - New Hampshire 2010. New Hampshire Department of Health and Human Services, Division of Public Health Services, Asthma Control Program. February, 2010.
5. Traore EA. Chapter 2: Asthma Control, Management and Quality of Life. Asthma Burden Report - New Hampshire 2010-2011. New Hampshire Department of Health and Human Services, Division of Public Health Services, Asthma Control Program. February 2012.
6. New Hampshire Asthma Control Program, Unpublished Analysis.
7. Centers for Disease Control and Prevention (CDC). Behavioral Risk Factor Surveillance System Survey, Asthma Callback Data. Atlanta, Georgia: U.S. Department of Health and Human Services, Centers for Disease Control and Prevention, 2009.
8. Traore EA, Miles J. Chapter 4: Utilization of Health Care Services. Asthma Burden Report - New Hampshire 2010 - 2011. New Hampshire Department of Health and Human Services, Division of Public Health Services, Asthma Control Program. November, 2010.
9. Traore EA. Chapter 3: Asthma Risk Factors and Co-Morbidities. Asthma Burden Report - New Hampshire 2010. New Hampshire Department of Health and Human Services, Division of Public Health Services, Asthma Control Program. June, 2010.
10. New Hampshire Asthma Control Program. Asthma and Obesity in New Hampshire. NH Department of Health and Human Services, Division of Public Health Services. March 2013
11. American Lung Association. Trends in Asthma Morbidity and Mortality. American Lung Association, Epidemiology and Statistics Unit, Research and Health Education Division. September 2012. Available at: http://www.lung.org/finding-cures/our-research/epidemiology-and-statistics-rpts.html. Accessed April 2013.
12. Barnett SB, Nurmagambetov TA. Costs of asthma in the US: 2002-2007. J Allergy Clin Immunol. 2011 Jan;127(1):145-52.

56 NH state Health improvement plan 2013-2020
inju
ry P
re
ve
nti
on
worDle gathered at strafford public input meeting, 8/8/2012
57NH state Health improvement plan 2013-2020
inju
ry P
re
ve
ntion
injury prevention
why is this important?More people ages 1-44 die of injuries in New
Hampshire than of any other cause.1,2 Many others are injured and sometimes the effects of their injuries are felt for a lifetime. Injuries are not unpredictable acts of fate; they can be prevented through a combination of strategies including behavioral and cultural change, education, the re-engineering of environments and technology, and effective policy and enforcement. Injuries can affect everyone.
Older Adult FallsEvery 15 seconds, an older adult is seen in a US
emergency department for a fall-related injury. In New Hampshire, injuries are seen in the emergency department at a rate of 4,622.8 per 100,000 people, which mirrors the national rate.3 Falls are the leading cause of both fatal and non-fatal injuries for New Hampshire residents 65 and older. Approximately 105 older Granite Staters die every year because of a fall. This rate has remained stagnant over the past 10 years.4 Twenty to 30% of older adults who fall sustain moderate to serious inju-ries such as hip fractures and traumatic brain injuries. These injuries can make it impossible to live inde-pendently and are associated with functional decline leading to an early death.11 Among older adults living in the community, falls can be a strong predictor of placement in a nursing home.12, 13 But falls are not an inevitable consequence of aging; they can be prevented.
Motor Vehicle Crashes Involving AdolescentsSpeed and the inexperience of novice drivers
(16 and 17 years of age) are the major causes of fatal crashes amongst adolescents in New Hampshire.5 Adolescent novice drivers are also involved in more motor vehicle crashes per licensed driver than any other age group in the state.6 Despite the fact that the state has a primary seat belt law for people under the age of 18, surveys show that adolescents don’t always buckle up. Results from the 2011 Youth Risk Behavior Survey (YRBS) indicate that, of the respon-dents, 10.7% never or rarely wore a seat belt when riding in a car driven by someone else. Although the New Hampshire rate has gone down from 27.6% in 1993, it has been stable since 2003.7 According to the 2012 New Hampshire Highway Safety Agency’s annual seat belt by physical observation survey,
adolescent drivers are less likely to buckle up than adult drivers, at 57.1% compared to 71.2%.
In the ten year period from 2001-2010, motor vehicle crashes were the number one cause of fatalities for New Hampshire’s adolescents ages 10-24.14 They are also a leading cause of emergency department visits and hospitalizations for this age group. Serious disabling injuries from motor vehicle crashes are common and include trau-matic brain injuries that can have a lifelong effect on cognitive ability. Not wearing a seatbelt is also cause for alarm. The use of a seatbelt is the most effective way to protect oneself from serious injury and death in a roadway crash.15
SuicideSuicide is a major public health problem both
nationally and in New Hampshire. Suicide is the second leading cause of death in New Hampshire for those ages 15-34 and has historically outnumbered homicides by eight to one.8 Firearms are the leading mechanism for suicide in New Hampshire, followed by poisoning and hanging.9 Family and friends of those who died by suicide have an increased risk of ending their own lives. Many others are affected in a variety of ways, including those providing emer-gency care to the victims and those who may feel that they failed to prevent a death. Thus, it could be said that suicide has a rippling effect in the community in which it occurs, affecting many people.
In an average year in New Hampshire, approxi-mately 156 people die by suicide, 186 are hospitalized, and close to 945 are treated in the emergency depart-ment for self-inflicted injuries.16 Self-inflicted injuries are only a proxy for suicide attempts and it is thought that the number of actual attempts is much higher. Suicide is a complicated issue and never can be attrib-uted to just one precipitating factor. However, it is generally preventable. In a 2008 University of New Hampshire poll, three-quarters or 75% of respon-dents agreed that suicide was preventable. In that same poll of New Hampshire adults, 81% agreed that if someone were thinking about, threatening, or had attempted suicide, they would know how to find help. These results mimic that of a similar survey in 2006.17
Unintentional PoisoningA poison is any substance, including medications,
that is harmful to your body if too much is eaten, inhaled, injected, or absorbed through the skin. An unintentional poisoning occurs when a person taking
Falls are the leading cause of both fatal and non-fatal injuries for New Hampshire residents 65 and older.
Suicide is the second leading cause of death in New Hampshire for those ages 15-34 and has historically outnumbered homicides by eight to one.8
58 NH state Health improvement plan 2013-2020
or giving too much of a substance did not mean to cause harm. Nationally, 87 people die each day as a result of unintentional poisoning; another 2,277 are treated in emergency departments.10 In 2009, there were approximately 132 deaths in New Hampshire due to unintentional poisoning, a rate of 10.0 deaths per 100,000 population. Nearly half of these deaths were due to narcotics and other drug misuse.
Over the past decade, there has been a tremen-dous rise in the mortality and morbidity associated with unintentional poisonings in New Hampshire and throughout the US. Since 2000, the rate of deaths from poisoning has seen a three-fold increase in our state and a doubling in the country as a whole.18 There are numerous factors contributing to this dramatic increase including the rapid rise in the prescribing and misuse of opioid painkillers. In addition, there has been an increase in reported occupational poisoning exposures.19 Likewise, there are a number of strate-gies for addressing and preventing these incidents that include: surveillance, prescription drug monitoring, use of less hazardous chemicals at work, public and professional education, and effective and timely treat-ment for those who intentionally or unintentionally suffer an overdose or other poisoning.
the costOlder Adult Falls
Falls are very costly. In 2009 in New Hampshire, the total approximate cost for emergency and inpa-tient hospital visits due to falls in the older adult was $105.6 million dollars.20 Most of these costs are borne by Medicare and Medicaid. Between 2005 and 2009, the average cost for a fall-related emergency depart-ment visit was $1,959 per patient and $25,047 for an inpatient stay.21 Hospital fees may include treat-ment for other chronic diseases, like diabetes or heart disease, which are often co-occurring conditions in the older adult.
Motor Vehicle Crashes involving AdolescentsNationally, young people ages 15-24 repre-
sent only 14% of the US population. However, they account for 30% ($19 billion) of the total costs of motor vehicle injuries among males and 28% ($7 billion) of the total costs of motor vehicle injuries among females.22 Because of the potential hospital and aftercare associated with motor vehicle crashes, the costs can be significant. In New Hampshire, for all ages, the costs for crash related death alone are estimated to be $143 million, including medical and work productivity losses. Adolescents ages 15-19 make up 18% of those costs.23
SuicideNationally, suicide results in an annual medical
cost and productivity lost estimate of $34.6 billion; nonfatal, self inflicted injuries are another $6.5 billion.24 In New Hampshire, it is estimated that the medical costs due to suicide deaths alone are $379,000 annually and loss of work productivity costs another $161 million. Self-inflicted injuries add a cost of $7 million. Much of the costs associated with suicides are those in lost work productivity or the cost of the potential work productivity lost.
Unitentional PoisoningsIn New Hampshire, the total costs for all deaths
due to unintentional poisonings is $154 million including medical and lost work productivity. The annual total medical cost savings attributed to poison centers for avoided medical utilization and reduced hospital length of stay is $1.19 billion on an annual basis. Poison centers save $307.6 million in Medicare dollars and $382.4 million in Medicaid dollars, for a total of $689.6 million in savings to federally supported programs each year. For every $1 invested in poison centers, another $13.39 is saved in medical costs and lost productivity. Ninety percent of people who call from home are treated at home.26
where do we want to be?• Prevent an increase in fall-related deaths among adults
age 65 years and older to 66.7 deaths per 100,000 population by 2015 and 2020
• Reduce the rate of emergency department discharges due to motor vehicle crashes in 15-19 year olds from 1925.4 per 100,000 population (2009) to 1906.1 by 2015 and 1837.0 by 2020
• Reduce the number of suicide attempts by adolescents (self-inflicted emergency department discharges as a proxy) from 55.9 per 10,000 population (2009) to 53.3 by 2015 and 51.1 by 2020
• Reduce the suicide death rate for all persons from 11.6 suicide deaths per 100,000 population (2009) to 11.0 by 2015 and 9.0 by 2020
• Prevent an increase in poisoning deaths caused by unintentional or undetermined intent among all persons to 10.6 deaths per 100,000 population by 2015 and 2020
inju
ry P
re
ve
nti
on

59NH state Health improvement plan 2013-2020
inju
ry P
re
ve
ntion
who should we be most concerned about?Older Adult Falls
Injuries and fatalities increase in the oldest of the state’s older population, those over 85 years of age. Common risk factors for falls in the older adult are: • Having had a fall • Taking four or more medications daily• Unstable gait and/or balance• Vision problems • Fear of falling• Chronic neurological or medical problem that
results in dizziness and/or loss of feeling, particu-larly in the foot
• Depression
Motor Vehicle Crashes Involving AdolescentsAmong adolescent drivers, those at especially
high risk for motor vehicle crashes are:
• Males: In 2010, the motor vehicle death rate for male drivers and passengers ages 16 to 19 was almost two times that of their female counter-parts.27
• Adolescents driving with passengers their same age: The presence of adolescent passengers increases the crash risk of unsupervised young drivers. This risk increases with the number of adolescent passengers.28
• Newly licensed adolescent: Crash risk is particularly high during the first months of licensure.29, 30
Many things make adolescents particularly vulner-able to getting into and getting hurt from motor vehicle crashes, including, but not limited to, their lower use of seatbelts, their greater likelihood to speed and to underestimate dangerous or hazardous situations.
SuicideThe numbers of suicides are highest in the
40-50 year age group, but rates are highest in New Hampshire residents over the age of 80.31
where we are
�
��
��
��
��
��
�
Dea
ths
per 1
00,0
00
2000 2002 2004 2006 2008 2010
0
20
40
60
80
100
Figure 1. Fall-related deaths among adults age 65 years and older
Source: NH Hospital Discharge Data
��
� �
��
�
� �
Dis
char
ges
per 1
0,00
0
2001 2002 2003 2004 2005 2006 2007 2008 2009
100150200250300350400
Figure 2. emergency department discharges due to motor vehicle crashes in 15-19 year olds
Source: NH Hospital Discharge Data
� �� �
�� � �
�
Dis
char
ges
per 1
0,00
0
2001 2002 2003 2004 2005 2006 2007 2008 2009
010203040506070
Figure 3. suicide attempts by adolescents (self-inflicted emergency department discharges as a proxy)
Source: NH Division of Vital Records Administration
Figure 4. suicide death rate for all persons
Source: NH Division of Vital Records Administration
Figure 5. poisoning deaths caused by unintentional or undetermined intent among all persons
Source: NH Division of Vital Records Administration
�
��
�� � �
��
Dea
ths
per 1
00,0
00
2001 2002 2003 2004 2005 2006 2007 2008 2009
0
5
10
15
20
�
�� �
� �
�
��
Dea
ths
per 1
00,0
00
2001 2002 2003 2004 2005 2006 2007 2008 2009
0
5
10
15
20
60 NH state Health improvement plan 2013-2020
Males are generally more at risk for suicide than females, but this may be because of their general choice of using firearms, the most lethal method for suicide. The suicide death rate in males rises rapidly from ages 10-14 to 15-19 and then again from ages 15-19 to 20-24. Similarly, male elderly suicide rates increase substantially at 80-84 years compared to the younger age groups, indicating another vulnerable time of life for men. Those at greatest risk are males over the age of 80, followed by males in their 70’s and early 50’s.32
In contrast, females attempt suicide at higher rates than of males. The 2011 NH Youth Risk Behavior Survey (YRBS) reports approximately 1.6 times as many female youth attempt suicide as males each year (7.5 % of females and 4.8% of males). Emergency department visits for self-inflicted inju-ries by females 15-19 mirror the results of the YRBS in that rates are 760/100,000, about 172 times the suicide death rate for this population and gender.33
It has been estimated that as many as 90% of individuals who take their own life had a diagnos-able mental illness, the most common diagnoses being depression and substance abuse disorders. Yet a much smaller percentage is receiving treatment. In New Hampshire, approximately one of every 84 residents received treatment at a community mental health center for depression during 2010. Of those in treat-ment for depression, approximately two thirds were female and one third were male.34
Unintentional PoisoningsWhile unintentional poisoning can affect people
at all ages and from all walks of life, certain groups are at a greater risk of dying by unintentional poisoning:
• Many more men than women die of unintentional poisonings.
• Middle-aged adults have the highest unintentional poisoning death rates than any other age group.
• American natives have the highest death rate due to unintentional poisoning, then whites and then blacks.35
• For children, those age1-3 are of greatest risk for poisonings due to their mobility and curiosity. In this age group, monitoring is key and risk is dimin-ished by close caregiving relationships with strict oversight.35
what we are doingOlder Adult Falls• Continuing the New Hampshire Falls Risk
Reduction Task Force, co-facilitated by the inju
ry P
re
ve
nti
onDPHS Injury Prevention Program and the Injury Prevention Center at Dartmouth, facilitating an annual professional conference on evidence-based practices in the community, long term and acute care settings.
• Co-facilitating trainings on falls screening in the primary care setting according to the American Geriatrics Society’s best practice guidelines.
• Informing older adults with a health communica-tions campaign, “You CAN Reduce Your Risk of Falls”, which teaches efficacious ways of reducing risk such as engaging in strength and balance exer-cises, monitoring medication, taking Vitamin D and assessing environments for modifiable risk.
• Reviewing and monitoring outcome data related to falls, including, but not limited to hospitalizations, deaths, emergency department visits, emergency medical services’ runs, E-911, Behavioral Risk Factor Surveillance System results, OASIS (home care) and MDS (long term care).
• Training partners in community evidence based exercise programs, such as “Tai Chi: Moving for Better Balance” and supporting these programs with technical assistance as they’re brought to all corners of the state.
Motor Vehicle Crashes Involving Adolescents• Working with the New Hampshire Driving Toward
Zero Coalition. The Coalition is comprised of multiple State agencies and organizations and is working towards the implementation of the New Hampshire Strategic Highway Safety Plan, 2012-2016, which has a component focusing on adoles-cents.
• Working towards both strengthening and under-standing the State’s Graduated Drivers Licensing laws. Graduated Drivers Licensing or GDL involves stepped licensing of novice drivers and has been proven to be effective in reducing the number of crashes and fatalities .
• Increasing parental involvement in encouraging safe teen driving practices. This includes the use of contracts between parents and novice drivers .
• Targeting educational outreach to novice drivers through work concentrated work with high schools in the State, thereby increasing their culture of safe driving. Derry Local Access Television produced a special on teen drivers, which was circulated statewide.
• Updating Drivers Educators’ skills and competencies.
61NH state Health improvement plan 2013-2020
• Supporting enforcement of the primary seatbelt law, which currently exists up to the age of 18.
• Working with partners to review adolescent motor vehicle crash outcome data.
Suicide• Working with the New Hampshire Suicide
Prevention Council, a legislatively created public-private partnership whose mission is to reduce the incidence of suicide by:
1. Raising public and professional awareness of suicide prevention
2. Addressing the mental health and substance abuse needs of all residents
3. Addressing the needs of those affected by suicide; and
4. Promoting policy change.
• Working to implement the State Suicide Prevention Plan, recently revised in 2013.
• Promoting awareness that suicide is generally preventable.
• Reducing the stigma associated with mental health, substance misuse and suicide prevention services.
• Promoting safe messaging, media reporting and portrayal of suicidal behavior.
• Supporting survivors of suicide attempts and survi-vors of suicide loss.
• Improving and expanding suicide surveillance systems.
• Promoting effective clinical and professional prac-tices.
• Supporting sustainability and infrastructure of suicide prevention best practices.
• Promoting the integration and coordination of suicide prevention activities across multiple sectors and settings.
• Developing and implementing public policy initia-tives to ensure the sustainability of suicide preven-tion efforts.
Unintentional Poisoning: • Sustaining funding for NH’s portion of the costs
of a Regional Poison Control Center.
• Increasing educational efforts regarding the health care and related savings in lives lost and lost productivity associated with effective poison prevention services
• Maintaining the proportion of unintentional pedi-atric (5 years of age and under) poisonings resolved
inju
ry P
re
ve
ntion
stories from the Fieldolder adult Falls
Tai Chi – Moving for Better Balance is an evidence based exercise program researched and taught by Dr. Fuzhong Li40 from the Oregon Pacific Research Institute. In 2012 and 2013, Dr. Li came to New Hampshire and taught 30 instructors in the method who are now teaching across the State. In an initial analysis of data from these instructors41, 73% of participants who finished the 12-week course decreased their scores in the Timed Up and Go (TUG) test upon completion. An increase in the TUG is associated with falls risk. 85% of the participants also increased their functional reach assessment test on completion of the course.
at home through assistance by Regional Poison Control Center at 90%
• Collaborating with partners at the Poison Center, and those involved with suicide and substance abuse prevention to develop and implement collab-orative programs that can prevent and effectively treat poisonings.
• Working with occupational health partners to ensure workers are educated about toxic substances at work.
• Disseminating poison prevention curriculum for non-English speakers.
• Working with partners to address the increasing mortality and morbidity resulting from the misuse of prescription medications.
• Increasing public awareness that prescription drugs are the most common cause of unintentional poisoning in NH including disparate communities (older adults, teens, refugees and immigrants, low income and those with mental illness).
• Collaborating with partners to implement a sustain-able prescription drug-monitoring program (PDMP).
partners working on this priorityOlder Adult Falls: • Foundation for Healthy Communities, Partnership
for Patient Safety
• Northern New England Geriatric Education Center
• Injury Prevention Center at Dartmouth College
• Northeast HealthCare Quality Foundation
• NH Hospital Association
62 NH state Health improvement plan 2013-2020
recommendations for action*State Governments can:• Strengthen and enforce transportation safety
policies and programs (e.g., primary seat belt laws, child safety and booster seat laws, gradu-ated driver licensing systems for young drivers, motorcycle helmet use laws, ignition interlock policies).
• Implement traffic engineering strategies (e.g., sidewalks and pedestrian safety medians) that allow pedestrians, bicyclists, motorists, and public transportation users to safely move along and across streets.
• Implement countermeasures for impaired driving (e.g., alcohol sobriety checkpoints) and enhance enforcement of speeding and other safety regulations.
• Implement per se drug impairment laws (pres-ence of any illegal drug in one’s system), train law enforcement personnel to identify drugged drivers, and develop standard screening meth-odologies to detect the presence of drugs. in
jur
y P
re
ve
nti
on• NH Home Care Association
• NH Health Care Association
• Dartmouth Hitchcock Medical Center
• Cheshire Medical Center
• Elliot Hospital
• Catholic Medical Center
• Concord Hospital
• Capital Region Visiting Nurse Association\
• NH State Fire Marshal’s Office
• Bureau of Emergency Medical Services
• Bureau of Elderly and Adult Services
• Community Health Institute
• St. Joseph’s Hospital
• VA Medical Center, Manchester
• Belknap Merrimack County CAP
• Grafton County Senior Citizens Council
Motor Vehicle Crashes Involving Adolescents: • NH Driving Towards Zero Coalition, www.nhdtz.
com
• NH Department of Transportation
• NH Department of Safety
• NH Highway Safety Agency
• Injury Prevention Center at Dartmouth College
• AAA of Northern New England
• NH Department of Justice
• NH’s Regional Planning Commissions
• NH Pediatric Society
• AllState Foundation
• Brain Injury Association of New Hampshire
Suicide: • Child and Family Services of New Hampshire
• Disabilities Rights Center
• Bureau of Behavioral Health
• Bureau of Drug and Alcohol Services
• Bureau of Community Based Military Programs
• Eliot Hospital
• Genesis Behavior Health
• Injury Prevention Center at Dartmouth
• Lakes Region Partnership for Public Health
• National Alliance on Mental Illness NH
• New Futures
• NH Association of Counties
• NH Community Behavioral Health Association
• NH Department of Corrections
• NH Department of Safety
• NH Medical Society
• NH National Guard
• Office of the Chief Medical Examiner
• VA Medical Center
• Unintentional Poisoning:
• Northern New England Poison Center
• Bureau of Drug and Alcohol Services
• NH Board of Pharmacy
• New Futures
• Injury Prevention Center at Dartmouth
• Center of Excellence at the Community Health Institute
• Safe Kids New Hampshire
• NH Department of Education
• NH Public Health Association
• NH Department of Safety
63NH state Health improvement plan 2013-2020
• Develop systems to increase access to trauma care.
• Implement policies to support modifications to the physical environment to deter crime (e.g., crime prevention through environmental design).
Businesses and Employers can: • Implement and enforce safety policies for all
drivers (e.g., seat belts or restraint use, zero tolerance for distracted driving).
• Implement comprehensive workplace injury prevention programs that include management commitment, employee participation, hazard identification and remediation, worker training, and evaluation.
• Expand and improve occupational injury and illness reporting systems.
Health Care Systems, Insurers, and Clinicians can: • Conduct falls-risk assessments for older adults,
including medication review and modification and vision screening.
• Implement and test models for increasing falls-risk assessments (e.g., physician education, and linkages with community-based services).
• Include occupational and environmental risk assessment in patient medical history-taking.
Early Learning Centers, Schools, Colleges, and Universities can: • Encourage youth to use seat belts, bicycle
helmets, and motorcycle helmets, and not drive while distracted or under the influence of alcohol or drugs.
• Collect and report statistics on crimes that occur and result in injuries on or around campuses and issue timely warnings to campus communities about crimes that may threaten safety and health.
• Implement policies, practices, and envi-ronmental design features to reduce school violence and crime (e.g., classroom manage-ment practices, cooperative learning tech-niques, student monitoring and supervision, limiting and monitoring access to buildings and grounds, performing timely maintenance).
references1. Injuries in the State of New Hampshire 2001-2009, http://www.
dhhs.nh.gov/dphs/bchs/mch/documents/nh-injuries-2001-2009-report.pdf accessed August 2, 2013.
2. Centers for Disease Control and Prevention, National Center for Injury Prevention and Control. Web-based Injury Statistics Query and Reporting System (WISQARS), www.cdc.gov/injury/wisqars/index.html accessed August 10, 2013.
3. Injuries in the State of New Hampshire 2001-2009, http://www.dhhs.nh.gov/dphs/bchs/mch/documents/nh-injuries-2001-2009-report.pdf accessed August 2, 2013.
4. Ibid5. New Hampshire Strategic Highway Safety Plan, Driving Towards
Zero, 2012-2016 on http://www.nhdtz.com/resources/detail/18 accessed August 10, 2013.
6. Ibid.7. New Hampshire 2011 Youth Risk Behavior Survey, http://www.
education.nh.gov/instruction/school_health/hiv_data.htm accessed August 10, 2013.
inju
ry P
re
ve
ntion
Community, Non-Profit, and Faith-Based Organizations can: • Promote safer and more connected commu-
nities that prevent injury and violence (e.g., by designing safer environments, fostering economic growth).
• Build public awareness about preventing falls, promote fall prevention programs in home and community settings, and educate older adults on how to prevent falls.
• Implement programs that assist juveniles and adults who are re-entering their communi-ties following incarceration that support their returning to school, securing employment, and leading healthy lifestyles.
Individuals and Families can: • Refrain from driving while under the influ-
ence of alcohol or drugs or while drowsy or distracted (e.g., texting).
• Use seat belts, bicycle helmets, motorcycle helmets, and protective sports gear.
• Establish clear expectations and consequences with teenagers about safe driving, including speeding, seat belt use, alcohol-or drug-impaired driving, and distracted driving.
• Engage in regular physical activity to increase strength and balance to help prevent falls.
*From the National Prevention Strategy
64 NH state Health improvement plan 2013-2020
8. New Hampshire Suicide Prevention Council. 2013 Revised Suicide Prevention Plan at http://www.dhhs.nh.gov/dphs/suicide/index.htm accessed August 11, 2013.
9. Ibid.10. Centers for Disease Control and Prevention. Prevent
Unintentional Poisoning; http://www.cdc.gov/Features/PoisonPrevention/ accessed August 12, 2013.
11. Stevens JA, Corso PS, Finkelstein EA, Miller TR. The costs of fatal and nonfatal falls among older adults. Injury Prevention 2006b;12:290–5.
12. Tinetti ME & Williams CS. Falls, injuries due to falls, and the risk of admission to a nursing home. New England Journal of Medicine, 1997:337(18):1279-84.
13. Gill TM, Murphy TE, Gahbauer EA & Allore HG.Association of injurious falls with disability outcomes and nursing home admissions in community-living older persons. American Journal of Epidemiology, 2013 Aug 1;178(3):418-25
14. Centers for Disease Control and Prevention, National Center for Injury Prevention and Control. Web-based Injury Statistics Query and Reporting System (WISQARS), www.cdc.gov/injury/wisqars/index.html accessed August 10, 2013.
15. National Highway Traffic Safety Agency, http://www.nhtsa.gov/Driving+Safety/Occupant+Protection. accessed August 10, 2013.
16. New Hampshire Suicide Prevention Council. 2013 Revised Suicide Prevention Plan, http://www.dhhs.nh.gov/dphs/suicide/index.htm accessed August 11, 2013.
17. New Hampshire’s 2011 Suicide Prevention Annual Report, Suicide Across the Lifespan, http://www.dhhs.nh.gov/dphs/suicide/report.htm accessed August 11, 2013.
18. Injuries in the State of New Hampshire 2001-2009, http://www.dhhs.nh.gov/dphs/bchs/mch/documents/nh-injuries-2001-2009-report.pdf accessed August 11, 2013.
19. Armenti K. Occupational Illness and Injury in New Hampshire: 2011 Data Report to Inform Programs and Policies, http://www.dhhs.nh.gov/dphs/hsdm/ohs/documents/ohs2011.pdf accessed August 11, 2013.
20. 2005-2009 Elder Falls Issue Brief, http://www.dhhs.nh.gov/dphs/bchs/mch/documents/elder-falls-brf-2005-2009.pdf accessed August 8, 2013.
21. Ibid22. Finkelstein EA, Corso PS, Miller TR, Associates. Incidence
and Economic Burden of Injuries in the US. New York: Oxford University Press; 2006.
23. Centers for Disease Control and Prevention, New Hampshire: Cost of Deaths for Motor Vehicle Crashes, http://www.cdc.gov/Motorvehiclesafety/statecosts/nh.html accessed August 10, 2013.
24. Centers for Disease Control and Prevention, National Center for Injury Prevention and Control. Web-based Injury Statistics Query and Reporting System (WISQARS), www.cdc.gov/injury/wisqars/index.html accessed August 10, 2013.
25. Ibid.26. American Association of Poison Control Centers. Final Report
on the Value of The Poison Center, http://www.aapcc.org/about/lewin-group-report/ accessed August 12, 2013. Centers for Disease Control and Prevention, National Center for Injury Prevention and Control. Web-based Injury Statistics Query and Reporting System (WISQARS), www.cdc.gov/injury/wisqars/index.html accessed August 10, 2013.
27. Chen L, Baker SP, Braver ER, Li G. Carrying passengers as a risk factor for crashes fatal to 16- and 17-year old drivers. Journal of the American Medical Association 2000;283(12):1578–82.
28. Mayhew, D.R.; Simpson, H.M.; and Pak, A. 2003. Changes in collision rates among novice drivers during the first months of driving. Accident Analysis and Prevention 35:683-91. inju
ry P
re
ve
nti
on29. McCartt, A.T.; Shabanova, V.I. and Leaf, W.A. 2003. Driving
experiences, crashes, and teenage beginning drivers. Accident Analysis and Prevention 35:311-20.
30. New Hampshire’s 2011 Suicide Prevention Annual Report, Suicide Across the Lifespan, http://www.dhhs.nh.gov/dphs/suicide/report.htm accessed August 11, 2013.
31. Ibid.32. Ibid.33. Ibid.34. Centers for Disease Control and Prevention. Prevent
Unintentional Poisoning http://www.cdc.gov/Features/PoisonPrevention/ accessed August 12, 2013.
35. Schmertmann M, Black D, Wilson L. Risk Factors for unintentional poisoning in children aged 1-3 yeas in NSW Australia: A case-control study. BMC Pediatrics, 2013 May 24;13:88.
36. www.nhfalllstaskforce.org accessed August 8, 2013.37. Baker SP, Chen L, Li G. Nationwide review of graduated
driver licensing. Washington (DC): AAA Foundation for Traffic Safety; 2007.
38. The Children’s Hospital of Philadelphia Research Institute, Teen Driving Source, Research Put Into Action at http://www.teendriverssource.org/index.php accessed August 20, 2013.
39. Li F, et.al. Tai Chi: Moving For Better Balance-Development of a Community Based Falls Prevention Program. Journal of Physical Activity and Health. 2008 May;5(3):445-55.
40. www.nhfallstaskforce.org accessed August 9, 2013.41. Somebody Loves You, Somebody Needs You accessed at http://
www.youtube.com/watch?v=k1pfvGwnXHs on August 11, 2013.
42. Suicide Prevention Resource Center, Recommendations for Reporting on Suicide, http://reportingonsuicide.org/Recommendations2012.pdf accessed August 11, 2013.
43. http://www.healthynh.com/partnership-for-patients.html accessed August 8, 2013.
44. http://med.dartmouth-hitchcock.org/nne_geriatric_education_center.html accessed August 8, 2013.
65NH state Health improvement plan 2013-2020
worDle gathered at Capital area public input meeting, 9/18/2012
infe
ctious d
iseA
se
66 NH state Health improvement plan 2013-2020
Children’s Vaccination SeriesThe national immunization program currently
provides childhood and teen vaccines that prevent sixteen diseases. As late as 2007, 374 children in New Hampshire were diagnosed with chickenpox, which dropped to 139 by 2012 as vaccination rates improved. Diseases such polio, diphtheria, measles, rubella and mumps continue to be a rarity in our state. However, pertussis, or whooping cough, is of great concern across the country. In 2012 New Hampshire had a surge of 267 cases, up from 22 in 2010, but according to the National Immunization Survey, the state ranked second highest in the nation for immu-nization coverage among children 19-35 months of age (80.1% coverage in New Hampshire compared to Hawaii’s 80.2%). The sixteen diseases prevent-able through the child-hood vaccination series can all cause great long-term disability to the survivor and can often cause death.
Adult Flu VaccineInfluenza is a disease that crosses generations
and is contagious before it makes itself known. Flu seasons are unpredictable and can be severe. Over a period of 30 years, between 1976 and 2006, estimates of flu-associated deaths in the US range from a low of about 3,000 to a high of about 49,000 people annu-ally. In 2010, 43.6% of adults age 19-64 and 70.8% of those ages 65+ received their influenza vaccine in New Hampshire.
Foodborne Illness Anyone can get sick from eating bad food. The
Centers for Disease Control and Prevention (CDC) estimates that foodborne diseases cause approxi-mately 76 million illnesses, 325,000 hospitalizations, and 5,000 deaths in the US each year.1 Depending on the pathogen, for every case of foodborne illness that is reported, anywhere from 2 to 142 cases are not reported or lab-confirmed.2
Healthcare Associated InfectionsA healthcare associated infection (HAI) is an
infection that a patient acquires during the course of receiving treatment for another condition within a healthcare setting. It is estimated that healthcare-asso-ciated infections (HAIs) affect 5% of patients hospi-infe
ctio
us
dis
eA
seinfectious Disease talized in the US each year, causing an estimated 1.7
million infections and 99,000 deaths each year in the US.3 By these estimates, HAIs are among the top 10 leading causes of death in the nation.
The most common HAIs are catheter-associated urinary tract infections (CAUTI), surgical site infec-tions (SSI), central line–associated bloodstream infec-tions (CLABSI), and ventilator-associated pneumonia (VAP).4 CAUTI are the most frequent, accounting for more than 30% of HAI reported by acute care hospitals. Surgical site infections develop in about 1 to 3 out of every 100 patients who have surgery.5 In 2009, an estimated 23,000 CLABSIs occurred among patients in inpatient wards and, in 2008, an estimated 37,000 CLABSIs occurred among patients receiving outpatient hemodialysis.6
why is this important?Childhood Vaccination Series
Some vaccine preventable childhood diseases can have long-term effects. Meningitis can cause brain damage and many sufferers lose their limbs. Hepatitis B can be contracted at birth and may cause liver damage and even death at an early age. Measles can cause blindness. Congenital rubella syndrome in a pregnant mom can cause birth defects. Each of the vaccine-preventable diseases has been a scourge to humans and most have successfully been eliminated or reduced significantly in the US.
Adult Flu VaccineInfluenza can cause severe complications or death
for any individual but appears to have a more severe impact on infants, those with chronic disease and the elderly. Complications of flu can include bacterial pneumonia, ear infections, sinus infections, dehydra-tion, and worsening of chronic medical conditions, such as congestive heart failure, asthma, or diabetes.
Foodborne IllnessMore than 30 million people in the US are likely
to be particularly susceptible to foodborne disease. Very young, elderly, and immune-compromised persons experience the most serious foodborne illnesses.7 It is estimated that chronic, secondary complications resulting from foodborne illness occur in 2-3% of cases.8
Healthcare Acquired InfectionsHAIs cause increased morbidity and can be fatal.
Some HAI, like ventilator-associated pneumonia, have high morbidity and mortality rates. Central line-associated blood stream infections have a reported mortality of 12% to 25%. Others, like CAUTI are
Over a period of 30 years, between 1976 and 2006, annual estimates of flu-associated deaths in the US range from a low of about 3,000 to a high of about 49,000 people.
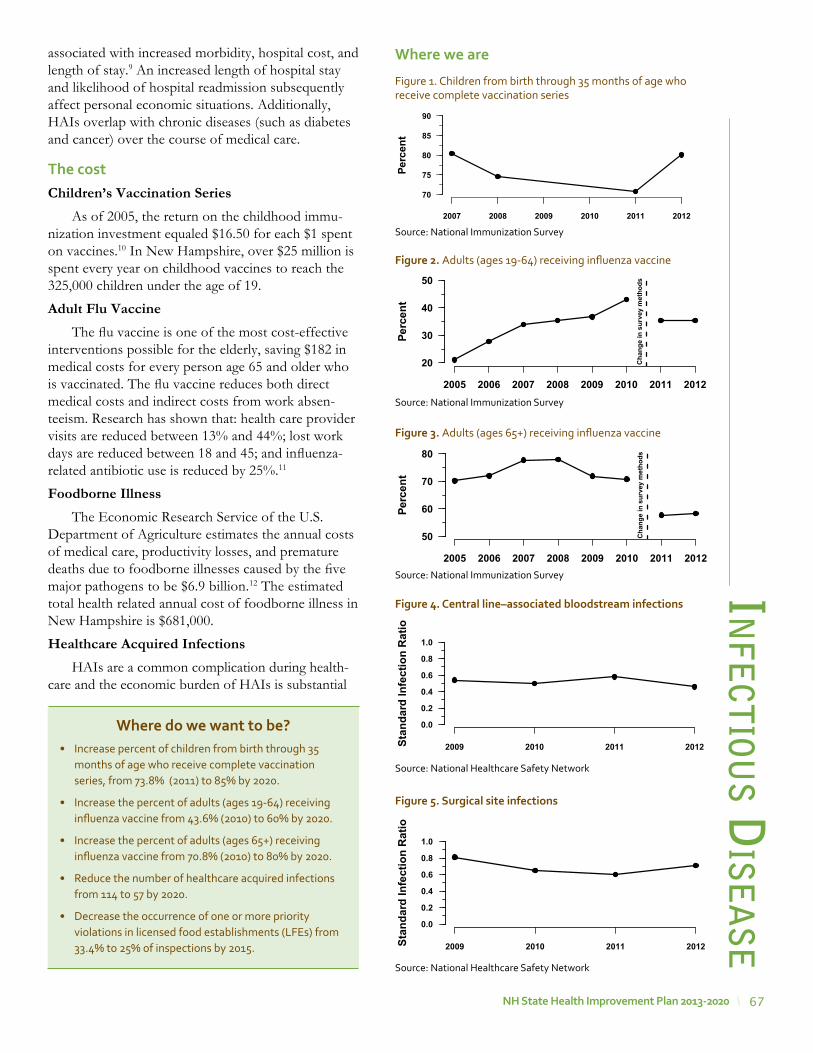
67NH state Health improvement plan 2013-2020
associated with increased morbidity, hospital cost, and length of stay.9 An increased length of hospital stay and likelihood of hospital readmission subsequently affect personal economic situations. Additionally, HAIs overlap with chronic diseases (such as diabetes and cancer) over the course of medical care.
the costChildren’s Vaccination Series
As of 2005, the return on the childhood immu-nization investment equaled $16.50 for each $1 spent on vaccines.10 In New Hampshire, over $25 million is spent every year on childhood vaccines to reach the 325,000 children under the age of 19.
Adult Flu VaccineThe flu vaccine is one of the most cost-effective
interventions possible for the elderly, saving $182 in medical costs for every person age 65 and older who is vaccinated. The flu vaccine reduces both direct medical costs and indirect costs from work absen-teeism. Research has shown that: health care provider visits are reduced between 13% and 44%; lost work days are reduced between 18 and 45; and influenza-related antibiotic use is reduced by 25%.11
Foodborne IllnessThe Economic Research Service of the U.S.
Department of Agriculture estimates the annual costs of medical care, productivity losses, and premature deaths due to foodborne illnesses caused by the five major pathogens to be $6.9 billion.12 The estimated total health related annual cost of foodborne illness in New Hampshire is $681,000.
Healthcare Acquired InfectionsHAIs are a common complication during health-
care and the economic burden of HAIs is substantial
infe
ctious d
iseA
se
where do we want to be?• Increase percent of children from birth through 35
months of age who receive complete vaccination series, from 73.8% (2011) to 85% by 2020.
• Increase the percent of adults (ages 19-64) receiving influenza vaccine from 43.6% (2010) to 60% by 2020.
• Increase the percent of adults (ages 65+) receiving influenza vaccine from 70.8% (2010) to 80% by 2020.
• Reduce the number of healthcare acquired infections from 114 to 57 by 2020.
• Decrease the occurrence of one or more priority violations in licensed food establishments (LFEs) from 33.4% to 25% of inspections by 2015.
�
�
�
�
Perc
ent
2007 2008 2009 2010 2011 2012
70
75
80
85
90
Figure 1. Children from birth through 35 months of age who receive complete vaccination series
Source: National Immunization Survey
where we are
Figure 5. surgical site infections
Source: National Healthcare Safety Network
�
��
�
Stan
dard
Infe
ctio
n R
atio
2009 2010 2011 2012
0.0
0.2
0.4
0.6
0.8
1.0
��
�
�
Stan
dard
Infe
ctio
n R
atio
2009 2010 2011 2012
0.0
0.2
0.4
0.6
0.8
1.0
Figure 4. Central line–associated bloodstream infections
Source: National Healthcare Safety Network
Perc
ent
2005 2006 2007 2008 2009 2010 2011 2012
20
30
40
50
Cha
nge
in s
urve
y m
etho
ds
Figure 2. Adults (ages 19-64) receiving influenza vaccine
Source: National Immunization SurveyPe
rcen
t
2005 2006 2007 2008 2009 2010 2011 2012
50
60
70
80
Cha
nge
in s
urve
y m
etho
ds
Figure 3. Adults (ages 65+) receiving influenza vaccine
Source: National Immunization Survey
68 NH state Health improvement plan 2013-2020
and increasing. The total cost of HAIs has been estimated at $33 billion per year in US hospitals. However, recent studies suggest that implementing existing prevention practices can lead to a 70% reduc-tion in certain HAIs. The financial benefit of using such prevention practices is estimated to be $25.0 billion to $31.5 billion in medical cost savings.13
A total of 198 HAI were reported in 2012 in New Hampshire Hospitals (SIR 0.75). The overall observed number of HAI was 25% fewer than expected based on national data. This difference is statistically signifi-cant, which means the overall number of HAI in the state is lower than the number seen nationally. The number of reported infections is higher than previous years due to new reporting requirements in 2012, which added CAUTI and SSI following abdominal hysterectomy procedures.
A total of six SSIs were reported in 2012 in New Hampshire Ambulatory Surgery Centers (SIR 0.84). The overall observed number of SSI in New Hampshire ASCs was 16% fewer than expected based on national data. This difference is not statistically significant, which means the overall number of SSI in the state is similar to the number seen nationally.
Go to http://www.dhhs.New Hampshire.gov/dphs/cdcs/hai/publications.htm for more details about data collection, analysis methods, and HAI reporting.
who should we be most concerned about?Children Vaccination Series
Approximately 3% or 3,000 children enter kinder-garten in the state without having received all of the required vaccinations due to religious or medical exemptions. This population is at risk of contracting vaccine preventable diseases from a community member who carries the disease, or from a tourist from Europe or Asia who may be unknowingly ill. Others at risk are those children and adults who, for medical reasons, cannot be immunized, or infants who are not old enough to vaccinate. Other groups may be adults who do not seek preventive medical care or do not have access to it, and populations who are uncomfortable seeking medical care.
Adult Flu VaccineIt’s estimated that 90% of seasonal flu-related
deaths and more than 60% of seasonal flu-related hospitalizations in the US each year occur in people 65 years and older. Flu is also more likely to cause severe illness in pregnant women than in women who are not pregnant. Changes in the immune system, heart, and lungs during pregnancy make pregnant
women more prone to severe illness from flu as well as hospitalizations and even death. Pregnant woman with flu also have a greater chance for serious prob-lems for their unborn baby, including premature labor and delivery. In addition, individuals with chronic health conditions, such as AIDS, diabetes, and cancer, are also more likely to experience serious complica-tions with the flu.
Foodborne IllnessAnyone can get sick from eating bad food, the
CDC estimates that each year one in six Americans (48 million people) get sick. But foodborne illness is a serious health risk for pregnant women, children, older adults, and people with certain health condi-tions like AIDS, diabetes, and cancer. People older than age 50 are at greater risk for hospitalizations and death from intestinal pathogens commonly trans-mitted through foods (http://www.foodsafety.gov/poisoning/risk/index.html). Safer food promises healthier and longer lives, less costly health care, and a more resilient food industry.
Healthcare Acquired InfectionsPatients can acquire HAI during the course of
medical treatment for another condition within a healthcare setting. Medical treatment is dynamic and patients often receive their care in various settings, such as acute care hospitals, community based-settings, outpatient or long-term care facilities, and ambulatory surgery centers. Furthermore, individ-uals with certain other medical conditions, such as a compromised immune system, are at greater risk for HAI due to frequent hospitalizations, readmissions, facility transfers, and other underlying factors.
what we are doingChildren’s Vaccination Series• Implementing and evaluating school based influ-
enza clinics.
• Identifying the need for provision of additional childhood vaccines in school settings.
• Conducting surveys of immunizations in schools and child care annually to determine compliance with required vaccinations.
Adult Flu Vaccine• Providing technical assistance and education to
vaccination providers to improve vaccination coverage.
• Implementing reminder and recall interventions to improve vaccination coverage.in
fect
iou
s d
ise
Ase
69NH state Health improvement plan 2013-2020
• Providing consolidated immunization histories for use by a vaccination provider in determining appro-priate client vaccinations.
• Aggregating data on vaccinations for use in surveil-lance and program operations, and in guiding public health action.
Foodborne Illness• Ensuring compliance with safe food protocols
through licensing and inspection of food establish-ments.
• Providing on-site education to food establishments for long-term adherence to safe food practices.
• Ensuring that food safety regulations are modeled after most current science and federal regulations.
• Providing education to the general public on safe food practices and alerts of recalls.
• Educating healthcare providers and laboratories to enhance knowledge of reportable foodborne illness.
stories from the FieldFood safety
Television shows like Restaurant Impossible and Bar Rescue have gained a lot of attention for exposing deplorable conditions in food establishments. The New Hampshire Department of Health of Health and Human Services Food Protection Section wants consumers to know these conditions are not common place. New Hampshire state food inspectors complete more than 5,000 inspections each year of everything from restaurants and mobile food units to grocery stores, cafeterias, and schools. Eight food inspectors cover almost 5,000 food establishments across the state.
Sharon Wogaman, who has been with the health department for 19 years, is responsible for inspecting 600 food establishments in northern New Hampshire. Sharon makes the best use of the limited time she has to conduct inspections. As high risk establishments may only be inspected once a year, she tries to make sure the managers understand the most risky elements of the food service so they are doing the right things when she is not there.
Armed with thermometers, chemical test strips and a flashlight, Sharon focuses on making sure food is cooked to and held at proper temperatures, employees are practicing good hygiene and food is being produced under sanitary conditions. “If I find that a refrigerator is not working, I work to correct the problem during the inspection and make sure employees understand that temperature control is important to keep from making their customers sick. We also discuss ways that temperatures can be monitored daily at the restaurant.”
New Hampshire state food inspectors spend time to educate food service workers on how to control the things that could to lead to someone getting sick from the food that they make. “For many reasons, it is often lack of awareness that there is a problem. No one wakes up in the morning with the plan of making their customers sick,” says Sharon. Although she admits it’s not always an easy job, Sharon recognizes that by helping people to better understand how to keep their food operations in check she is protecting the health of the public by reducing the risk of foodborne illness.
infe
ctious d
iseA
se
stories from the FieldHealthcare aquired infections (Hai)
In late September, the NH HAI program received a call from a New Hampshire ambulatory surgery center (ASC) about a recall of glucocorticoid steroid injections compounded by New England Compounding Center. Information about this recall, and an associated outbreak of fungal meningitis, was also received from the Centers for Disease Control and Prevention (CDC) through subsequent national calls.
Immediately, the HAI program and other Bureau of Infectious Disease Control (BIDC) staff initiated an investigation. By collaborating with the local ASC to notify exposed patients, alerting infectious disease and other clinicians about this national outbreak and locally exposed patients, ensuring symptomatic patients had access to care, and coordinating specimen testing through the public health lab and CDC, people exposed to this contaminated product were notified and advised of risks and treatment options.
In New Hampshire, 14 cases were identified out of 752 patients exposed to the affected compound. Nationally, 20 states identified cases of fungal infection. Currently, there are 749 cases and 61 deaths out of 13,534 patients at risk (as of July 1st, 2013).
This response was unprecedented in its scope, duration, and clinical complexity and is the largest HAI outbreak in US history. Investigation is still ongoing because the predominant organism has an unknown clinical course in healthy individuals.
This outbreak highlights the importance of public health departments and private partnerships in preventing and investigating HAI outbreaks. In New Hampshire, the HAI program infrastructure helped activate investigation activities, provided epidemiology capacity, and worked closely with other BIDC sections and state partners. BIDC staff continue to work with the NH Board of Pharmacy when notified of concerning drug recalls and are currently developing an investigation protocol that can be used during future outbreak investigations involving contaminated medication.
70 NH state Health improvement plan 2013-2020
recommendations for action*State and Local Governments can: • Increase delivery of clinical preventive services,
including childhood immunizations and influ-enza vaccination as recommended by the Centers for Disease Control and Prevention’s (CDC) Advisory Committee on Immunization Practices (ACIP), by Medicaid and Children’s Health Insurance Program (CHIP) providers.
• Foster collaboration among community-based organizations, the education and faith-based sectors, businesses, and clinicians to identify underserved groups and implement programs to improve access to preventive services.
• Create interoperable systems to exchange clinical, public health and community data, streamline eligibility requirements, and expe-dite enrollment processes to facilitate access to clinical preventive services and other social services.
• Expand the use of community health workers and home visiting programs.
Businesses and Employers can: • Offer health coverage that provides employees
and their families with access to a range of clin-ical preventive services with no or reduced out-of-pocket costs.
• Provide incentives for employees and their families to access clinical preventive services, consistent with existing law.
• Give employees time off to access clinical preventive services.
• Provide employees with on-site clinical preven-tive services and comprehensive wellness programs, consistent with existing law.
• Provide easy-to-use employee information about clinical preventive services covered under the Affordable Care Act.
Health Care Systems, Insurers and Clinicians can: • Inform patients about the benefits of preven-
tive services and offer recommended clinical preventive services, including immunizations, as a routine part of care.
• Adopt and use certified electronic health records and personal health records.
• Adopt medical home or team-based care models. infe
ctio
us
dis
eA
se• Monitoring and evaluating suspect or probable
cases and clusters of foodborne illness.
• Supporting outbreak investigations through timely provision of laboratory and epidemiological infor-mation.
Healthcare Acquired Infections• Tracking and providing reported healthcare asso-
ciated infections data to hospitals and ambulatory surgical centers.
• Supporting outbreak investigations through provi-sion of clinical guidance and epidemiological support.
• Promoting and providing infection prevention training to healthcare providers on topics such as injection safety and standard precautions.
• Collaborating with partners to expand opportuni-ties for provider and public education concerning infection prevention.
partners working on this priorityImmunization:• Hospital Systems
• Medical Providers
• School Systems
• NH Medical society and New Hampshire Nurses Association
• NH Vaccine Association
• Childcare Agencies
Healthcare Acquired Infections• NH Hospital Association
• NH Ambulatory Surgery Association
• Northeast Healthcare Quality Foundation
• Foundation for Healthy Communities / Partnership for Patients
• NH Patient Voices
• NH Infection Control and Epidemiology Professionals
• Infection Control Practitioners (ICPs) and HAI reporting contacts in New Hampshire hospitals, Ambulatory Surgery Centers (ASCs), and long-term care facilities.
71NH state Health improvement plan 2013-2020
• Reduce or eliminate client out-of pocket costs for certain preventive services, as required for most health plans by the Affordable Care Act, and educate and encourage enrollees to access these services.
• Establish patient (e.g., mailing cards, sending e-mails, or making phone calls when a patient is due for a preventive health service) and clinical (e.g., electronic health records with reminders or cues, chart stickers, vital signs stamps, medical record flow sheets) reminder systems for preventive services.
• Expand hours of operation, provide child care, offer services in convenient locations (e.g., near workplaces), or use community or retail sites to provide preventive services.
• Create linkages with and connect patients to community resources (e.g., tobacco quitlines), family support, and education programs.
• Facilitate coordination among diverse care providers (e.g., clinical care, behavioral health, community health workers, complementary and alternative medicine).
• Communicate with patients in an appropriate manner so that patients can understand and act on their advice and directions.
Early Learning Centers, Schools, Colleges and Universities can: • Train providers (e.g., doctors, nurses, dentists,
allied health professionals) to use health infor-mation technology and offer patients recom-mended clinical preventive services as a routine part of their health care.
• •Promote the use of evidence-based preventive services within their health services (e.g., school health program).
Community, Non-Profit, and Faith-Based Organizations can: • Inform people about the range of preventive
services they should receive and the benefits of preventive services.
• Support use of retail sites, schools, churches, and community centers for the provision of evidence-based preventive services.
• Expand public-private partnerships to imple-ment community preventive services (e.g., school-based oral health programs, commu-nity-based diabetes prevention programs).
• Support community health workers, patient navigators, patient support groups, and health coaches.
Individuals and Families can: • Visit their health care providers to receive clin-
ical preventive services.
• Use various tools to access and learn about health and prevention and ways they can better manage their health (e.g., personal health records, text reminder services, smart phone applications).
*From the National Prevention Strategy
recommendations for action for Hai**State Action Plans• The 2009 Omnibus Appropriations Act
required states receiving Preventive Health and Health Services Block Grant funds to certify that they would submit a plan to reduce HAIs to the Secretary of HHS in order to receive the full allotment of grant funds. The purpose of the State Action Plans was primarily to outline strategies to leverage and enhance state capacity to reduce and prevent HAIs, focusing on achievement of the Action Plan goals. States were asked to address four areas in their State Action Plans:
• Program Infrastructure;• Surveillance, Detection, Reporting, and
Response;• Prevention; and,• Evaluation, Oversight, and
Communication.
Frontline Clinicians can:• Reduce Inappropriate/Unnecessary Device
Use: A large proportion of HAIs are associ-ated with the use of indwelling medical devices, especially intravascular catheters, urinary cath-eters, and devices associated with mechan-ical ventilation. Although optimal practices concerning insertion, maintenance, and care of such devices greatly reduces the risk of HAIs, avoiding the insertion of such devices and their prompt removal as soon as clinically appro-priate is the best strategy for preventing device-associated infections.
• Improving Adherence to Hand Hygiene and Barrier Precautions: Mechanically preventing the spread of pathogenic microor-
infe
ctious d
iseA
se
72 NH state Health improvement plan 2013-2020
in prevention – even, and perhaps especially – in clinical settings can have a profound impact on our ability to eliminate HAIs.
Government, Advocates, Clinical Leaders, and Administrators can:• Enhancing Financial Incentives and
Regulatory Oversight: The growth of the patient safety and HAI prevention and elimi-nation effort has both prompted, and been advanced by, an increasing alignment of finan-cial incentives by public and third party payers. These incentives provide a greater margin of reimbursement for care that does not incur adverse healthcare events such as HAIs. Similarly, accreditation, certification, and other regulatory oversight increasingly incorporate adherence to proven HAI prevention practices in the inspection process. This has promoted adherence to best practices and facilitated deci-sion-making that rewards prevention.
• Implementing System-Based Approaches and Evidence-Based Guidelines: A number of authors and organizations have demon-strated the value of system-based approaches to improving healthcare and preventing medical errors and adverse healthcare events, including HAIs. These approaches, based on human factors research in the social sciences as much as on the traditional medical sciences, have led to significant improvements in patient outcomes in many different types of facilities in a variety of settings. Introducing checklists and standardizing care or protocols for procedures associated with HAI incidence (i.e., catheter insertion) have been helpful in reducing infec-tions and promoting stronger healthcare teams.
• Achieving Better Use of Technology: Technological advances are very powerful tools in the effort to eliminate HAIs. Improvements in medical devices, supplies, equipment, and antimicrobial compounds can impede colo-nization of indwelling catheters, improve the effectiveness of barrier precautions, enhance compliance with and the effectiveness of hand hygiene, and decrease the risk of cross-infec-tion due to contamination of the environment.The advance of information technology and the rapidly increasingly application of digital technologies to medical records, healthcare management, and healthcare administration are of particular importance now. Thoughtful
ganisms, especially to high-risk patients and particularly for antimicrobial resistant microor-ganisms, is a simple and powerful prevention tool that requires the consistent and universal adoption of these proven prevention practices in every patient interaction and in ongoing vigi-lance of the environment.
• Implementing and Improving Antimicrobial Stewardship: Efforts to ensure optimally appropriate antimicrobial use have been a hallmark of quality improve-ment activity in both inpatient and outpa-tient care setting in recent decades. Ongoing research is allowing for greater precision and understanding of the best use of antimicrobial agents balancing clinical necessity and optimal patient care with the negative consequences of overuse and inappropriate use of antimicro-bial agents, including the spread of antimicro-bial resistant pathogens, adverse drug reactions in patients, and excess financial cost. Providers and patients must partner to use antibiotics only when needed and completing scheduled doses appropriately.
Clinical Leaders, Executives, and Administrators can:• Engaging Leadership Support at the
Highest Levels of the Facility: A central role for leadership in supporting practice improve-ments is vital to efforts in preventing HAIs and other adverse patient safety events. Strong support, both in terms of personal commit-ment and allocated resources, from health-care executives and administrators is frequently cited by front-line healthcare workers as one of the most important factors in implementa-tion of successful HAI prevention strategies in healthcare facilities and health systems.
• Implementing a Culture of Safety: All parts of the health system need to move towards a culture of safety that includes patients and families as members of the healthcare team. The broadening of responsibility and account-ability for patient safety, including recogni-tion of a role for patients and their families, has been one of the most impactful develop-ments in the patient safety movement. Making the prevention of HAIs as important a part of the clinical decision-making process as any other aspect of patient care, and continuing to acknowledge the role of consumers as partners in
fect
iou
s d
ise
Ase

73NH state Health improvement plan 2013-2020
applications of computer-based records and systems (e.g., computerized physician order entry) have shown their value in improving patient care and patient safety, including HAI prevention and elimination. In addition, infor-mation technology tools need to be appropriate for smaller, rural, or under-resourced hospitals and the timeliness of data feedback must be improved for real-time improvements.
• Improving Public Reporting of Credible Data: Elimination of HAIs will require “a clear national will to succeed in this area.”[25] Public reporting of HAI data has been a vital factor in focusing the attention of both the general public and healthcare professionals and admin-istrators on the scope and magnitude of the problem. Assuring the validity of reported and published data is a responsibility of all parties in the data collection and reporting process. The continued dissemination of trusted, reli-able, and credible data can provide an ongoing stimulus for the HAI prevention effort. The goal is to report actionable, timely data that multi-sector stakeholders can readily use for multiple purposes.
• Enhancing Traditional and Non-Traditional Partnerships: The modern patient safety movement has succeeded in engaging the attention of everyone who works in or seeks care from the health system. Continuing awareness of this problem is prompting an ever-growing network of committed individuals and organizations. Some of these partners have been traditional advo-cates for infection control for many decades; others, including consumers, are newly empow-ered and exercising an increasingly important role. The network and partnerships involving care providers, health professionals, public health officials, academia, industry, payers, employers, and patients and their families have provided both the capacity and commitment that has led to the call for the elimination of HAIs. Meaningful partnerships across sectors could uncover innovative ways to improve patient safety across the continuum of care.
• Integrate information systems to monitor and report HIAs
• Create policy options for linking payment incentives or disincentives to quality of care
infe
ctious d
iseA
se
references
1. HHS, CDC, Food Safety Office2. Multipliers for estimating actual illness based on reported
illnesses vary from 2 to 24, depending on the pathogen. Multipliers are derived from: Scallan E, Hoekstra RM, Angulo FJ, Tauxe RV, Widdowson M-A, Roy SL, et al. Foodborne illness acquired in the US—major pathogens. Emerg Infect Dis [serial on the Internet]. 2011 Jan [Accessed:July 22, 2013]. http://dx.doi.org/10.3201/eid1701.P11101
3. Klevens, RM, Edwards RJ, Richards CL, Jr, et al. Estimating health care-associated infections and deaths in U.S. Hospitals, 2002. Public Health Rep 2007:122(2):160-166. http://www.cdc.gov/ncidod/dhqp/pdf/hicpac/infections_deaths.pdf
4. Scott R, Douglas. The direct medical costs of healthcare-associated infections in US hospitals and the benefits of prevention. March 2009. http://www.cdc.gov/ncidod/dhqp/pdf/Scott_CostPaper.pdf
5. Frequently asked questions about Surgical Site Infections. http://www.cdc.gov/HAI/ssi/ssi.html
6. Srinivasan, A MD et.al. Vital Signs: Central Line--Associated Blood Stream Infections --- US, 2001, 2008, and 2009. March 2011. http://www.cdc.gov/mmwr/preview/mmwrhtml/mm6008a4.htm
7. Council for Agricultural Science and Technology. “Foodborne Pathogens: Risks and Consequences.” Task Force Report No. 122, (1994).
8. Council for Agricultural Science and Technology, (1994).9. HICPAC. CAUTI Guidelines Fast Facts. April 2010. http://
www.cdc.gov/hicpac/CAUTI_fastFacts.html10. Zhou, et al. Arch Pediatr Adolesc Med. 2005 Dec;159
(12):1136-4411. The Council of State Governments‘ (CSG) Healthy States
Initiative. Increasing Vaccination Rates in Adults. (2007).12. S.R. Crutchfield, T. Roberts, “Food Safety Efforts Accelerate
in the 1990s.” 23 FoodReview 44: 49 (2000).13. Scott R, Douglas. The direct medical costs of healthcare-
associated infections in US hospitals and the benefits of prevention. March 2009. http://www.cdc.gov/ncidod/dhqp/pdf/Scott_CostPaper.pdf
14. Centers for Disease Control and Prevention. Incidence and Trends of Infection with Pathogens Transmitted Commonly Through Food—Foodborne Diseases Active Surveillance Network, 10 US Sites, 1996-2012. MMWR. 2013;62(15):283-87
and enhancing regulatory oversight of hospi-tals;
• Develop a national messaging and communica-tions plan to raise awareness of HAIs among the general public
• Implement HAI prevention strategies among healthcare personnel
**National Action Plan to Prevent Health Care-Associated Infec-tions: Strategies for States and HC Systems
74 NH state Health improvement plan 2013-2020
em
er
ge
ncy
Pr
eP
Ar
ed
ne
ss
worDle gathered at Franklin/Bristol public input meeting, 9/6/2012
75NH state Health improvement plan 2013-2020
emergency preparednessPublic health threats are all around us. They may
be natural, accidental, or even intentional. Being prepared to prevent, respond to, and rapidly recover from a public health threat is critical for protecting the public’s health. Public health emergencies and natural disasters with public health, healthcare, and behavioral health system impact do not discriminate, so the effect is across the life span.
New Hampshire’s primary preparedness strategy is to identify opportunities to align currently existing resources in order to meet operational needs. New Hampshire is well positioned to coordinate all state-wide activities in order to support the State’s response during an emergency. Collaborative work among agencies is crucial and already exists in the coordina-tion of response among the Department of Health and Human Services’ Emergency Services Unit (ESU) and Division of Public Health Services (DPHS); the Department of Safety’s Division of Homeland Security and Emergency Management (HSEM); and regional and local partners.
In the event of a public health emergency, multiple entities mount a response in a coordinated manner. Emergency preparedness has been demon-strated in several instances; the distribution of H1N1 pandemic vaccine in 2009 through hospital systems and public health clinics dispensing over 200,000 vaccinations, a response to a case of gastrointestinal anthrax in Durham which unified multiple local, state and federal agencies to manage the response including the closure and subsequent decontamination of a building; in 2012 over 700 patients were exposed to a contaminated medication from a compound phar-macy resulting in 14 cases of fungal infection, and most recently, in 2012 the Hepatitis C outbreak affecting 32 patients at Exeter Hospital, involving over 150 statewide responders and lasting for one year ending in June 2013.
Emergency Preparedness activities are broad and span across many disciplines statewide. Key goals for emergency preparedness in the NH SHIP include: engagement of key stakeholders; information sharing to promote and maintain situational awareness during an event; and timely and effective response, specifi-cally related to dispensing and distribution of coun-termeasures. Every emergency response is unique and each event varies in scope, impact, resource demand and required expertise.
em
er
ge
ncy P
re
PA
re
dn
ess
why is this important?Health security relies on actions by individ-
uals and communities as well as governments. An essential component of being prepared is to assure that community partners are aware of their poten-tial risks and have public health emergency response plans that address the needs of their communities (National Health Security Strategy). For DPHS, plan-ning, training and coordinating a systematic response during a public health emergency is crucial. DPHS staff completed trainings from Federal Emergency Management Agency (FEMA) for the national inci-dent management system (NIMS) incident command system (ICS). FEMA offers trainings to local fire and safety officials as well other agencies. NIMS provides a common and consistent framework during a response while ICS provides the structure and organi-zation of roles. Having the proper training and knowl-edge of ICS will ensure the execution of a systematic approach to managing a public health threat or inci-dent. DPHS has identified an Incident Management Team (IMT) of staff with assigned ICS roles. The IMT has been activated for both drills and real events and unannounced assembly of the IMT has occurred in less than 18 minutes.
As a result of the combined efforts of many agen-cies, prepared communities are aware of their poten-tial risks and what is expected from community members before and after an adverse incident and, in turn, of what they can expect from local, state, and federal government and other responders, including non-governmental organizations. Empowered communities have contingency plans, communi-cations plans, and provisions in place to shelter, sustain, and provide medical and other care for the entire community, including at-risk individuals; they also have community members who are actively engaged in local decision-making. Empowered indi-viduals have the information and skills they need to protect their health and safety. A foundation of effec-tive routine health promotion and access to health services is needed to support healthy and resilient individuals and communities and thereby support national health security.
NH is structured into 13 Public Health Networks (PHN) in order to build community capacity to respond during emergencies. The PHN is comprised of community-based partnerships involving broad public health interests, including local health depart-ments and health officers, health care providers, social service agencies, schools, fire, police, emergency medical services, media and advocacy groups, behav-ioral health, and leaders in the business, government,
76 NH state Health improvement plan 2013-2020
and faith communities, working together to address complex public health issues.
A key capability that is needed during an emer-gency is the capacity to request, collect and analyze health data to maintain situational awareness of the health threats in order to improve the effectiveness of the response. (National Health Security Strategy) DPHS performs surveillance during weather related events, such as looking at carbon monoxide expo-sures and people who visit the emergency depart-ment. This data is tracked using a surveillance system called Automated Hospital Emergency Department Data (AHEDD). Reports are built using real time syndromic surveillance data. Additionally, data are analyzed and reports are provided during extreme heat and cold conditions to describe potential or actual health impact. For example, with extreme heat conditions, data is analyzed for the number of people who visit an emergency department with dehydra-tion. This data provides information to stakeholders so they can assess resources in a community, such as if a shelter or a cooling center needs to be opened. Surveillance data reports are an important piece of information to responders.
Regardless of whether an emergency results from a natural disaster, an infectious disease outbreak, or a chemical or radiological release, key response enti-ties must ensure a coordinated response. The ability to quickly notify and assemble state and local part-ners is essential to improve our capacity statewide and achieve an optimal response to an incident. In the context of health incidents, operational situational awareness captures information related to health threats and health system resources and thus informs and improves prevention, protection, response, and recovery operations and, ultimately, health outcomes. Situational awareness requires the ability to tap into data from relevant sources; the efficient use of appropriate information technologies and means of data exchanges; health surveillance and laboratory capacity that can be stepped up to meet surge needs during an incident; effective coordination of infor-mation sharing across federal, state, and local entities to create a common operating picture; and the active use of information to make timely and well-informed decisions. A robust and integrated biosurveillance capability and effective leveraging of information in the private sector health care delivery system is espe-cially important.
While continued information technology systems development is aimed at establishing standard-ized data elements for information sharing that may occur in the future, the principal mechanism to share
information is the Health Alert Network (HAN) Communicator!NXT system. The Communicator! NXT is used to send important health alerts via elec-tronic devices to specified groups. Recipients of the health alert messages include over 8,000 individuals, such as physicians, nurses, physician assistants, nurse practitioners, hospital emergency departments, local health departments, local public health responders, public health volunteers, specialists, and health offi-cers. In 2012, thirty-one health alert messages were sent by DPHS.
New Hampshire, like every state, continues to work to improve the capacity to receive, manage, and administer vaccines or medications to the public and emergency responders in response to public health threats (National Health Security Strategy). Medical countermeasures are the drugs, vaccines, diagnostics, and nonpharmaceutical countermeasures that may be needed to lessen the adverse health effects caused by a health incident. In order to ensure the efficiency of effort and prudent investments, an integrated vision is needed for all of the requirements associated with medical countermeasures-from fundamental research to manufacturing, dispensing, and tracking of safety and effectiveness. It will also be critical for states and local authorities to set priorities for how such resources will be allocated when there is a limited supply of medical countermeasures for their popula-tions. New Hampshire has exceeded national bench-marks established to distribute and dispense counter-measures during an event.
the costNatural disasters may cause mass displacement
of people and disrupt supplies of food, shelter, water and health care. Costs of natural disasters and public health emergency events may vary widely depending upon the cause, scope, duration and impact. A large-scale public health event such as the Hepatitis C outbreak at Exeter Hospital in 2012-2013 utilized resources across the State. The investigation and response efforts involved approximately 150 staff and included epidemiologists, public health nurses, labora-tory workers, emergency service unit workers, admin-istrators, support staff, and many others. The investi-gation and response efforts cost nearly $400,000. The majority of the costs were incurred for the labora-tory testing and overtime hours for staff necessary to conduct public blood screening clinics over 8 days, serving 1,190 people. Being able to assess a financial impact from an event allows for decision making and allocation of resources.
em
er
ge
ncy
Pr
eP
Ar
ed
ne
ss

77NH state Health improvement plan 2013-2020
where do we want to be?
• Decrease the Incident Management Team assembly time from 18 minutes to 15 minutes by 2014 to respond and fill key ICS roles
• Increase the proportion of key organizations identified by PHN that engaged in a significant public health emergency planning, exercising or training activity from 74% to 80% in 2015 and 85% in 2020
• Increase the CDC Medical Countermeasure Distribution and Dispensing composite score from 71 in 2013 to 90 by 2015 and to 95 by 2020. (NH exceeds the national benchmark of 52.)
where we areEmergency preparedness must include evalua-
tion of responses to identify lessons learned and form the evidence base to make improvements. Following each public health emergency event an After Action Report (AAR) is developed which identifies strengths, weaknesses and typically assesses capabilities based on national standards. Once the AAR is completed, an Improvement Plan (IP) is developed within a target time of 60 days from the close of the real incident or exercise. The IP facilitates reevaluation of response capabilities following completion of corrective actions outlined in an AAR/IP. The overarching intent is to inform and improve future responses. The AAR/IP measure, among several performance measures, have evolved since the recent publication (2011) of the 15 Public Health Preparedness Capabilities. New Hampshire will continue to address and build perfor-mance measures data in response to and in accor-dance with federal guidance. New Hampshire has consistently submitted best demonstrations for AAR/IPs for previous events including anthrax and H1N1 pandemic. As of this writing, the AAR is in final draft for the HCV Outbreak, 2012-13.
Following the Hepatitis C outbreak at Exeter Hospital, a comprehensive public report was produced to describe the outbreak, including exten-sive documentation of the public health response. Reports are helpful to summarize the response, activi-ties, and identify areas for improvements.
who should we be most concerned about?As with any disaster, close consideration should
be given to the populations most at risk. Most disas-
em
er
ge
ncy P
re
PA
re
dn
ess
ters, and other types of emergencies, whether biolog-ical, chemical or radiological do not discriminate but, rather, affect the entire population. However there are some events, such as emerging infectious diseases or a pandemic, that may affect certain populations dispro-portionately (such as how H1N1 affected young adults/children). Improving readiness to respond promptly and ensuring responders are trained and their safety and health protected will enhance capacity to better respond to any event whether natural disaster or large-scale outbreak.
what we are doingThe National Health Security Strategy framework
has two broad goals: to build community resilience and to strengthen and sustain health and emergency response systems. To achieve these goals, 10 strategic objectives identify in greater detail what is needed to achieve these goals and the overall vision of national health security:
• Supporting and funding Regional Public Health Networks statewide to convene and facilitate regional public health emergency planning and response activities.
• Publishing hazard vulnerability assessments to identify the priority risks to the health care, public health and behavioral health systems through collaboration with state and regional partners.
• Collaborating with the Division of Homeland Security and Emergency Management to ensure integration of health and medical vulnerabilities in state hazard vulnerability and mitigation plans.
• Providing information and training to the public to promote personal and family preparedness.
• Supporting and funding Regional Public Health Networks and health care coalitions statewide to ensure the capability to collect and report situ-ational awareness information to state agencies during emergencies.
• Maintaining the capability of the Health Alert Network (HAN) system to provide electronic information sharing with key partners.
• Providing training and technical assistance to hospital and laboratory users of the HAN system.
• Continuing to develop the capacity to send and receive data electronically using national data exchange standards.
• Maintaining a state plan to rapidly receive and distribute large quantities of vaccine and medica-tion to the public.
78 NH state Health improvement plan 2013-2020
recommendations for action*The National Health Security Strategy has two broad goals: to build community resilience and to strengthen and sustain health and emergency response systems. To achieve these goals, 10 strat-egies are provided:• Foster informed and empowered individuals and
communities• Develop and maintain the workforce needed for
national health security• Foster integrated, scalable health care delivery
systems• Ensure situational awareness• Ensure timely and effective communications• Promote an effective counter-measure enter-
prise• Ensure prevention and mitigation of environ-
mental and other emerging threats to health • Incorporate post-incident health recovery into
planning and response• Work with cross-border and global partners to
enhance national, continental and global health security
• Ensure that all systems that support national health security are based upon the best available science, evaluation, and quality improvement methods
The following are a list of capabilities that are necessary to achieve national health security: • Community Resilience and Recovery• Infrastructure• Situational Awareness• Incident Management• Disease Containment and Mitigation
Community Resilience and Recovery • Public education to inform and prepare indi-
viduals and communities
• Public engagement in local decision making
• Local social networks for preparedness and resilience
• Integrated support from non-governmental organizations
• Emergency public information and warning
• Post-incident social network re-engagement
• Case management support or individual assis-tance
• Reconstitution of the public health, medical, and behavioral health infrastructure: e
me
rg
en
cy P
re
PA
re
dn
ess
• Supporting and funding public health networks to maintain regional mass dispensing plans.
• Demonstrating the ability to receive, manage, and administer vaccines or medications through state and regional exercises.
partners working on this priority• Public Health Networks
• Hospitals and other health care entities
• State Emergency Management and Emergency Services Unit
• Local Emergency Management
stories from the Field On August 6, 2013, the Bureau of Infectious Disease Control received a report of a confirmed a case of Hepatitis A infection in a food worker. The food worker worked in two local food establishments in Contoocook. Based upon the epidemiological investigation, a determination to offer prophylaxis to the patrons of those establishments was made by the DPHS Outbreak Team. On August 7, the DPHS IMT was activated, using the Communicator! NXT. All ICS positions were filled within l8 minutes of the notification. The Commissioner within NH DHHS declared a public health incident. The IMT responded to the event, the Capital Region Multi Agency Coordinating Entity (MACE) was activated and within 48 hours, state, regional and local partners mobilized public health clinics. The clinics provided prophylaxis to over 1,100 individuals. On August 28, 2013 a second case of Hepatitis A infection in a food worker employed at one of the same establishments of the initial case was identified. NH state, regional and local responders again mobilized public health clinics held on August 30, 2013 and August 31, 2013 and provided prophylaxis to an additional 109 potentially exposed persons.
79NH state Health improvement plan 2013-2020
• Mitigated hazards to health and public health facilities and systems:
• Support services network for long-term recovery
Infrastructure• Interoperable and resilient communications
systems
Situational Awareness• Risk assessment and risk management
• Epidemiological surveillance and investigation
• Animal disease surveillance and investigation
• Agriculture surveillance and food safety
• Chemical, biological, radiological, nuclear, and explosives (CBRNE) detection and mitigation
• Monitoring of available health care resources
Laboratory testing• Near-real-time systems for capture and analysis
of health security-related data
• Information gathering and recognition of indi-cators and warning
• Coordination with U.S. and international part-ners
Disease Containment and Mitigation • Research, development, and procurement of
medical countermeasures
• Management and distribution of medical coun-termeasures
• Administration of medical countermeasures
• Community interventions for disease control
Disease Containment and Mitigation • Research, development, and procurement of
medical countermeasures
• Management and distribution of medical coun-termeasures
• Administration of medical countermeasures
• Community interventions for disease control
Source: The National Health Security Strategy
em
er
ge
ncy P
re
PA
re
dn
ess
80 NH state Health improvement plan 2013-2020
mis
ue
s of
Alc
ohol
& d
ru
gs
81NH state Health improvement plan 2013-2020
Alcohol Use–Binge Drinking in Youth and Adults Excessive alcohol use is the third leading prevent-
able cause of death in the US1. Binge drinking is defined as consuming four or more alcoholic drinks on one or more occasion for women and five or more drinks on one or more occasion for men. More than half of alcohol consumed by adults in the US is in the context of binge drinking. More than 38 million adults nationally binge drink, about four times a month, and the largest number of drinks per binge is eight, on average. New Hampshire ranks sixth highest among states in rate of binge drinking for those 18-25 years old.
Marijuana UseIn 2012, marijuana was the most commonly used
illicit drug, with 18.9 million users. It was used by 79.0% of current illicit drug users. About two thirds (62.8%) of illicit drug users used only marijuana in the past month.2 In 2010, there were 364,449 admissions of people into drug treatment programs nationally with marijuana as their primary drug of addiction3, a 254% increase since 1992.
Prescription Pain Medication UseThe death toll from overdoses of prescription
painkillers has more than tripled in the past decade, with more than 40 people dying every day from over-doses of opioids like hydrocodone and oxycodone.4 This epidemic is blamed largely on misuse of prescrip-tions for nonmedical reasons, but increasing use of drugs for pain control is also a contributing factor. From 1991 to 2009, prescriptions for opioid analge-sics almost tripled, to over 200 million. In 2010, about 12 million people age 12 or older nationally reported non-medical use of prescription pain medication in the past year. In New Hampshire, the percentage of individuals entering state-funded substance abuse treatment for oxycodone increased by over 60% between 2008 and 2010, from 11.6% to 18.7%. In 2010, oxycodone became their second most prevalent drug of abuse after alcohol.
New Hampshire’s young adults age 18-25 are abusing pain medication at a significantly higher rate (16.78%) than young adults nationwide (11.94%)5. New Hampshire’s rate is second highest in the nation. In 2011 approximately one in five (20.4%) New Hampshire high school students reported having taken a prescription drug without a doctor’s prescrip-
misuse of alcohol and Drugsm
isue
s of Alcoh
ol & d
ru
gs
tion at least once in their lifetime, while one in ten (10.4%) reported having taken a prescription drug without a doctor’s prescription at least once in the past 30 days.6
why is this important?Binge Drinking
Drinking too much, including binge drinking, causes 80,000 deaths in the US each year. Alcohol consumption and binge drinking can have a wide range of adverse effects – medical, personal and social. These depend on both the overall amount of alcohol consumed and on the pattern of consump-tion. Medical problems resulting from binge drinking can include brain damage, alcohol poisoning, gastro-intestinal tract and skeletal muscle damage, cancer and cardiovascular disease, such as high blood pres-sure and stroke. In addition, accidents, violence and criminal behavior, poor functioning and performance, and psychological problems, particularly anxiety and neurosis, can all result from binge drinking. Binge drinking in adolescence has been associated with an increased risk of health, social, educational and economic problems continuing into later adult life.
Marijuana UseMarijuana addiction can result in health and social
consequences, memory and learning problems, prob-lems at home and work, and dose-related impairments of psychomotor performance.7 For example, mari-juana use is linked to cancers of the head and neck.8 Smoking three or four marijuana joints a day can produce the same risk of bronchitis or emphysema as twenty or more tobacco cigarettes. In addition, the risk of a heart attack is five times higher than usual in the hour following the smoking of a joint.9 Regular use of marijuana may exacerbate mental health prob-lems.10 Marijuana smokers are four times more likely to report symptoms of depression–including suicidal thoughts–as compared to those who never used the drug.11 Pregnant marijuana users risk having children more prone to hyperactivity, impulsivity, inattentive-ness, and delinquency.12
Prescription Pain Medication UseWhile prescription pain medications are crucial
for pain management, their wide availability may also result in increasing opportunities for abuse, as well as a host of serious medical consequences, including addiction. Opioids used in the treatment of pain can be highly addictive. Opioids, used alone or in combi-nation with alcohol or other drugs, can depress respi-ration and lead to death. In New Hampshire the number of deaths involving overdoses of prescribed
New Hampshire ranks sixth highest among states in rate of binge drinking for those 18-25 years old.
82 NH state Health improvement plan 2013-2020
mis
ue
s of
Alc
ohol
& d
ru
gs
drugs has almost doubled between 2008 and 2009 and the number of deaths resulting from oxycodone has more than tripled since 2000. In 2009, oxycodone became the third leading cause of drug-related deaths in New Hampshire behind methadone and heroin.
the costBinge Drinking
The cost of excessive alcohol consumption in the US in 2006 reached $223.5 billion or about $1.90 per drink13. Almost three-quarters of these costs were due to binge drinking. Researchers estimate that exces-sive drinking cost $746 per person in the US in 2006. About $94.2 billion (42%) of the total economic costs of excessive alcohol consumption were borne by federal, state, and local governments while $92.9 billion (41.5%) was borne by excessive drinkers and their family members.
Marijuana UseOne of most costly factors of marijuana use is
cost related to criminal activity, including police, judi-cial, and corrections costs. New Hampshire taxpayers spend $20 million a year for prosecution and incar-ceration related to marijuana laws14. Nationwide, in 2005, the rate of hospital stays for cannabis was third highest (93 stays per 100,000) of all drug hospitaliza-tions, following cocaine and opioid abuse hospitaliza-tions.15 The National Bureau of Economic Research reports cannibis has a longer mean length of stay than for alcohol, heroin and cocaine discharges. The mean charge per marijuana discharge is nearly twice that of any of the other substances. In 2011, according to the Drug Abuse Warning Network (DAWN) there were 455,668 marijuana related admissions into hospital emergency rooms, 36.4% of all emergency room visits for illicit drugs16
Prescription Pain Medication UseNon-medical use of opioid pain medication costs
insurance companies up to $72.5 billion annually in health-care costs.17 This includes up to $24.9 billion annually for private insurers. Individual plans each lose between $8.6 million and $857 million a year, depending on the plan’s size. Large diversion losses affect both traditional health insurers and workers compensation insurers. Doctor shopping by addicted health-plan members is the largest form of drug diversion, and takes the largest financial toll on insur-ance companies. Almost half of Aetna, Inc.’s 1,065 member fraud cases in 2006, for example, involved prescription benefits. Most of those were doctor-shopping cases. But insurance costs go well beyond
prescription payments. Insurers also pay for related emergency room treatment, hospital stays, physician office visits, diagnostic tests and rehabilitation.
A typical doctor shopper costs insurers $10,000 to $15,000 a year. Behind such cost breakdowns are large add-on expenses. In one study, WellPoint, Inc., the nation’s largest publicly traded commer-cial health insurer, paid $41 in related medical claims for every $1 it paid in narcotic prescriptions for suspected doctor-shopper plan members.
In a study published in 2009, total government spending as a consequence of drug use other than alcohol that can be differentiated by substance was estimated at $18.7 billion nationally.18 Of that, $16.4 billion was federal spending: $7.8 billion in dedicated drug enforcement, $39.5 million in drug court costs, $2.6 billion for drug interdiction, $2.5 billion for prevention, treatment, research and evaluation, and $3.8 billion in health care costs. Of the $1.9 billion in state spending, $336 million was allocated for public safety costs for drug enforcement programs, $138 million for drug courts, and $1.5 million linked to illicit and controlled prescription drugs in state spending on Medicaid. $342.3 million was attributed to local health care spending.
General Health CareTreating substance use disorders is shown to
reduce overall healthcare costs, since substance use disorders increase the use of healthcare in general. For example, a study of California’s Medicaid program showed a 30% decline in costs for beneficiaries strug-gling with a substance use disorder who received outpatient treatment. Outpatient treatment has been shown to have an 11 to 1 ratio of benefits to costs to society. Research also suggests that alcohol and other drug treatment services reduce emergency department visit costs by $200 per person and decrease inpa-tient services and mental health service needs. New Hampshire specific research has shown that emer-gency department use has been increasing for patients with mental health and substance use issues, especially among those aged 15-49.
Treating substance use disorders is shown to reduce overall healthcare costs, since substance use disorders increase the use of healthcare in general.
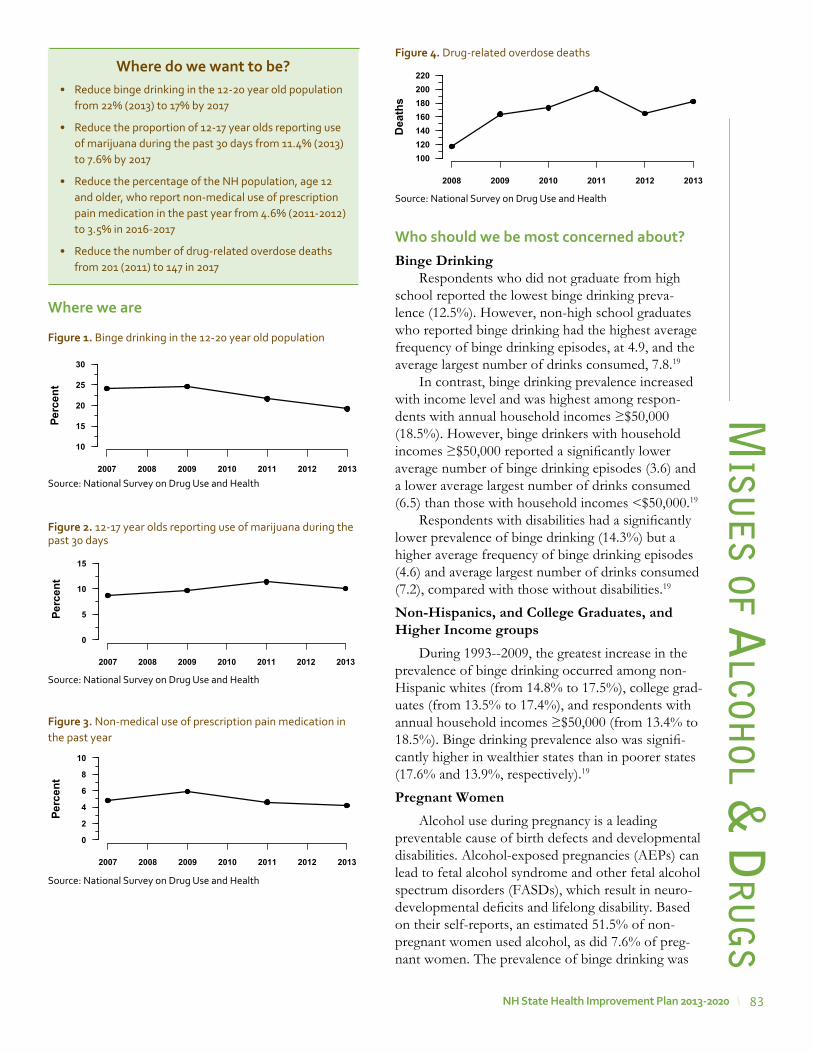
83NH state Health improvement plan 2013-2020
misu
es of A
lcohol &
dr
ug
s
where we are
where do we want to be?• Reduce binge drinking in the 12-20 year old population
from 22% (2013) to 17% by 2017
• Reduce the proportion of 12-17 year olds reporting use of marijuana during the past 30 days from 11.4% (2013)to 7.6% by 2017
• Reduce the percentage of the NH population, age 12 and older, who report non-medical use of prescription pain medication in the past year from 4.6% (2011-2012) to 3.5% in 2016-2017
• Reduce the number of drug-related overdose deaths from 201 (2011) to 147 in 2017
who should we be most concerned about?Binge Drinking
Respondents who did not graduate from high school reported the lowest binge drinking preva-lence (12.5%). However, non-high school graduates who reported binge drinking had the highest average frequency of binge drinking episodes, at 4.9, and the average largest number of drinks consumed, 7.8.19
In contrast, binge drinking prevalence increased with income level and was highest among respon-dents with annual household incomes ≥$50,000 (18.5%). However, binge drinkers with household incomes ≥$50,000 reported a significantly lower average number of binge drinking episodes (3.6) and a lower average largest number of drinks consumed (6.5) than those with household incomes <$50,000.19
Respondents with disabilities had a significantly lower prevalence of binge drinking (14.3%) but a higher average frequency of binge drinking episodes (4.6) and average largest number of drinks consumed (7.2), compared with those without disabilities.19
Non-Hispanics, and College Graduates, and Higher Income groups
During 1993--2009, the greatest increase in the prevalence of binge drinking occurred among non-Hispanic whites (from 14.8% to 17.5%), college grad-uates (from 13.5% to 17.4%), and respondents with annual household incomes ≥$50,000 (from 13.4% to 18.5%). Binge drinking prevalence also was signifi-cantly higher in wealthier states than in poorer states (17.6% and 13.9%, respectively).19
Pregnant WomenAlcohol use during pregnancy is a leading
preventable cause of birth defects and developmental disabilities. Alcohol-exposed pregnancies (AEPs) can lead to fetal alcohol syndrome and other fetal alcohol spectrum disorders (FASDs), which result in neuro-developmental deficits and lifelong disability. Based on their self-reports, an estimated 51.5% of non-pregnant women used alcohol, as did 7.6% of preg-nant women. The prevalence of binge drinking was
Figure 1. Binge drinking in the 12-20 year old population
Source: National Survey on Drug Use and Health
Figure 2. 12-17 year olds reporting use of marijuana during the past 30 days
Source: National Survey on Drug Use and Health
Figure 4. Drug-related overdose deaths
Source: National Survey on Drug Use and Health
Figure 3. Non-medical use of prescription pain medication in the past year
Source: National Survey on Drug Use and Health
� �
�
�
Perc
ent
2007 2008 2009 2010 2011 2012 2013
10
15
20
25
30
��
��
Perc
ent
2007 2008 2009 2010 2011 2012 2013
0
5
10
15
�
�
��
Perc
ent
2007 2008 2009 2010 2011 2012 2013
0
2
4
6
8
10
�
��
�
�
�
Dea
ths
2008 2009 2010 2011 2012 2013
100120140160180200220
84 NH state Health improvement plan 2013-2020
15.0% among non-pregnant women and 1.4% among pregnant women. Among pregnant women, the highest prevalence estimates of reported alcohol use were among those who were aged 35–44 years (14.3%), white (8.3%), college graduates (10.0%), or employed (9.6%).
ElderlySecondary analysis of the 2005 and 2006 National
Survey on Drug Use and Health was conducted for 10,953 respondents aged 50 years and older. Among respondents, 6,717 were 50 to 64 years of age and 4,236 were ≥65 years. Overall, 66% of male respon-dents and 55% of female respondents reported alcohol use during the past year. At-risk alcohol use and binge drinking were more frequent among respondents 50 to 64 years of age relative to respon-dents aged 65 years or older. In the ≥65 years old age group, 13% of men and 8% of women reported at-risk alcohol use, and more than 14% of men and 3% of women reported binge drinking.
Among men, binge drinking was associated with higher income and being separated, divorced, or widowed, while being employed and nonmedical use of prescription drugs were associated with binge drinking among women. Binge drinking was associ-ated with the use of tobacco and illicit drugs. Among women who reported using alcohol, being African American and less educated were associated with binge drinking, but race/ethnicity and educational level were not associated with binge drinking in men who reported using alcohol.
Prison PopulationIn 2006, an estimated 1.6 million individuals age
18 and over were on parole or other restricted release from state or federal prison and were in the process of reentry and reintegration after having served a prison term of at least one year. These offenders are twice as likely to have used drugs and/or engaged in binge drinking in the past 30 days as members of the general population who were not on parole or other restricted release (55.7% vs. 27.5 percent), and four times more likely to have substance use disorders (36.6% vs. 9.0%).
Marijuana Use Marijuana use is disproportionately used and
widespread among adolescents and young adults. Marijuana use increased in the past decade among 8th-, 10th-, and 12th-graders, but recently showed signs of leveling off. After four straight years of increasing use among teens, annual marijuana use showed no further increase in any of the three grades surveyed in 2012. The 2012 annual prevalence rates (i.e., percent using in the prior 12 months) were 11%, 28%, and 36% for 8th, 10th, and 12th graders, respec-tively.20
Marijuana use may have profound physical or psychological effects especially for the following: individuals engaging in activities that could place themselves and others at risk for personal injury such as operating machinery, use of firearms, swim-ming, boating, driving, etc.; women who are preg-nant or trying to conceive; people who have a family history of chemical dependency (especially children of addicted parents); individuals using other drugs including alcohol and/or prescription medications; individuals who are predisposed to emotional issues and problems; children and adolescents; and indi-viduals who demonstrate some degree of chemical dependency on any substance.
Pain MedicationSince 2008, drug deaths have increased in three
age categories: 31-40 yrs, 41-50 yrs, and 51-60 yrs.
stories from the FieldCreative Funding that supports prevention activities
The town of Moultonboro established a dedicated fund from the town’s collection of fines related to alcohol violations, committing a portion of the revenue generated to prevention activities for local youth. Local governments can explore this or other creative strategies to financially support local prevention and early intervention efforts.
stories from the Fieldscreening and Brief intervention and referral
Goodwin Community Health Center in New Hampshire adopted the evidence-based Screening, Brief Intervention and Referral to Treatment (SBIRT) approach for all adolescent and adult patients. Goodwin Community Health, a Federally Qualified Health Center, initiated SBIRT adoption in the spring of 2012 and is currently embedding screening tools into their electronic medical record and training clinicians and medical staff this fall. Their intention is to utilize medical assistants and care coordination teams who will initiate screening of patients 13 and older for alcohol or substance abuse risk. When a patient is screened and identified to have a high risk use threshold, they are provided an opportunity to have their primary care provider discuss their screening outcome within the patient visit and brief counsel on the health implications of high risk use is then provided as well as motivational interviewing to help the patient identify barriers to reducing or ceasing use. If a patient’s use history indicates a high level of use, behavioral health staff are integrated into the primary care setting and are able to provide ongoing brief treatment.mis
use
of
Alc
ohol
& d
ru
gs
85NH state Health improvement plan 2013-2020
More males than females die of drug-related deaths in New Hampshire. Since 2005, however, drug deaths among females have increased by 65% (from 46 deaths in 2005 to 71 deaths in 2010) while drug deaths among males decreased slightly over the same time period. The increased use of opioid painkillers by people older than 65 is associated with an increase in falls and fractures. Opioid painkillers were associated with a four-fold higher risk for falls than non-opioid painkillers.
what we are doing• Supporting and funding Regional Public Health
Networks to engage local enforcement authorities to reduce access to alcohol among under age youth and binge drinking among youth and young adults.
• Collaborating with the Governor’s Commission on Alcohol and Other Drug Abuse Prevention Intervention and Treatment to support polices around underage and binge drinking among youth and young adults.
• Collaborating with the Division of Liquor Enforcement to prevent underage access to alcohol.
• Collaborating with New Futures on efforts to reduce underage drinking and binge drinking among youth and young adults.
• Supporting use of evidence-based practice by community health centers (TWEAK, SBIRT) to identify, reduce, and prevent problematic use, abuse, and dependence on alcohol and illicit drugs.
• Supporting and funding Regional Public Health
stories from the Fieldprevention targets older adults
The Referral Education Assistance & Prevention (REAP) Program seeks to improve the quality of life for older adults in the entire state of New Hampshire through free preventative home and community-based counseling and education services. Founded in 1992 through a unique collaboration between the NH Finance Housing Authority, the NH Bureau of Behavioral Health, and the NH Bureau of Drug and Alcohol Services, REAP is the only program of its kind in the state working towards helping elders who have problems with alcohol, drugs, mental health problems, or other life changes. Initially offered to people living in low-income senior housing, REAP services were expanded in 2002 to include people over the age of 60 living in their own homes and in 2007 to caregivers of “at risk” elders to educate them on how to intervene if an elder becomes unable or unwilling to accept help.
misu
se of Alcoh
ol & d
ru
gs
Networks to promote SBIRT practice among primary care providers.
• Promoting collaboration between primary care physicians and alcohol and other drug treatment providers in the treatment of opioid addiction
• Working with Medicaid Care Management to deter-mine feasiblity of covering SBIRT benefits for beneficiaries.
• Implementing and sustaining “A Call to Action: Responding to NH’s Prescription Drug Abuse Epidemic” at the state and community levels through permanent take back sites, a prescrip-tion drug monitoring program, and prescriber/dispenser education.
• Supporting and funding Regional Public Health Networks to educate the public in securing and proper disposal of pain medication.
partners working on this priority• 13 Regional Public Health Network Leadership
Teams
• 13 Public Health Advisory Councils
• NH Providers Association
• NH New Futures
• Governor’s Commission on Alcohol and Drug Abuse Prevention, Intervention and Treatment
• Collective Action – Collective Impact 5 year plan
• Governor’s Commission Prevention Task Force
• Center for Excellence / Community Health Institute
• Clearinghouse and Lending Library
• Drug Free NH (Drugfreenh.org)
stories from the Fieldprescription take Back event
The Drug Enforcement Agency (DEA) facilitates two take back events each year. BDAS Regional Public Health Networks assist with these events at the regional level by educating NH citizens about the dangers of non-prescription drug abuse and the risk of unused prescription drugs left in home medicine cabinets. This is a collaborative effort with local police departments in establishing permanent 24/7 public prescription drop off box for unused prescription drugs. Since September of 2010 the number of collection sites has increased from 50 to 91 across NH. A total of 24,284 pounds of unused medications have been collected.
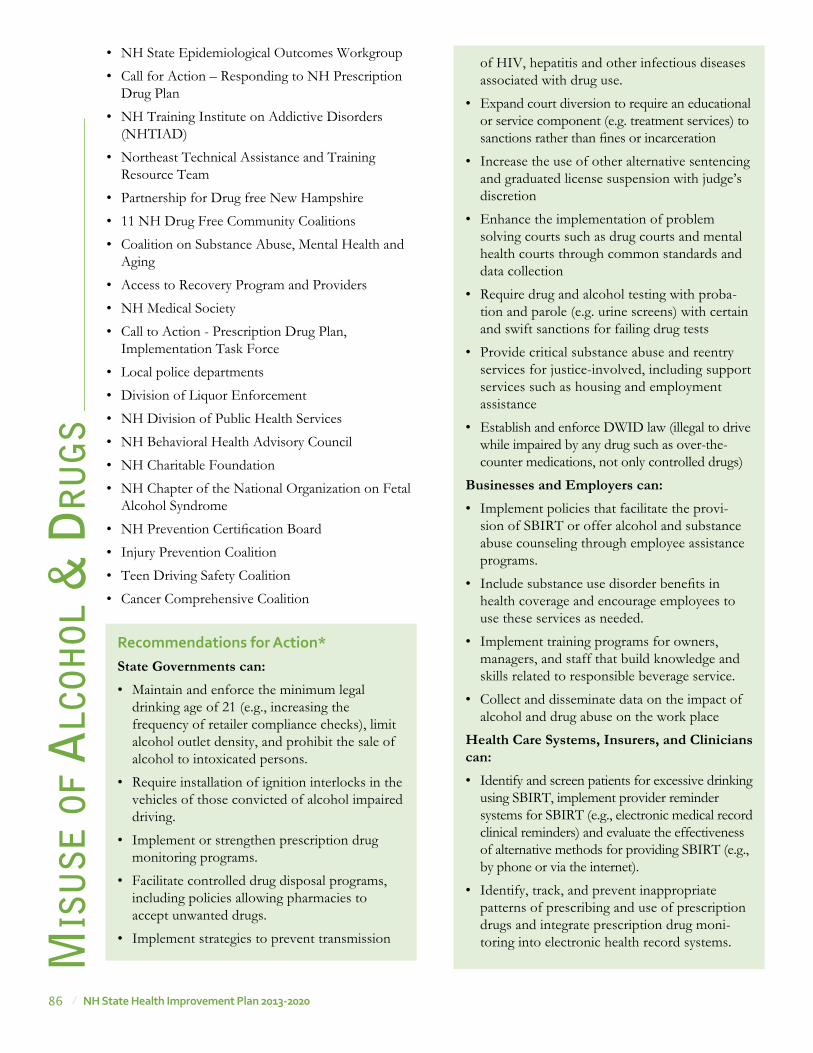
86 NH state Health improvement plan 2013-2020
recommendations for action*State Governments can: • Maintain and enforce the minimum legal
drinking age of 21 (e.g., increasing the frequency of retailer compliance checks), limit alcohol outlet density, and prohibit the sale of alcohol to intoxicated persons.
• Require installation of ignition interlocks in the vehicles of those convicted of alcohol impaired driving.
• Implement or strengthen prescription drug monitoring programs.
• Facilitate controlled drug disposal programs, including policies allowing pharmacies to accept unwanted drugs.
• Implement strategies to prevent transmission
of HIV, hepatitis and other infectious diseases associated with drug use.
• Expand court diversion to require an educational or service component (e.g. treatment services) to sanctions rather than fines or incarceration
• Increase the use of other alternative sentencing and graduated license suspension with judge’s discretion
• Enhance the implementation of problem solving courts such as drug courts and mental health courts through common standards and data collection
• Require drug and alcohol testing with proba-tion and parole (e.g. urine screens) with certain and swift sanctions for failing drug tests
• Provide critical substance abuse and reentry services for justice-involved, including support services such as housing and employment assistance
• Establish and enforce DWID law (illegal to drive while impaired by any drug such as over-the-counter medications, not only controlled drugs)
Businesses and Employers can: • Implement policies that facilitate the provi-
sion of SBIRT or offer alcohol and substance abuse counseling through employee assistance programs.
• Include substance use disorder benefits in health coverage and encourage employees to use these services as needed.
• Implement training programs for owners, managers, and staff that build knowledge and skills related to responsible beverage service.
• Collect and disseminate data on the impact of alcohol and drug abuse on the work place
Health Care Systems, Insurers, and Clinicians can: • Identify and screen patients for excessive drinking
using SBIRT, implement provider reminder systems for SBIRT (e.g., electronic medical record clinical reminders) and evaluate the effectiveness of alternative methods for providing SBIRT (e.g., by phone or via the internet).
• Identify, track, and prevent inappropriate patterns of prescribing and use of prescription drugs and integrate prescription drug moni-toring into electronic health record systems. m
isu
se o
f A
lcoh
ol &
dr
ug
s• NH State Epidemiological Outcomes Workgroup
• Call for Action – Responding to NH Prescription Drug Plan
• NH Training Institute on Addictive Disorders (NHTIAD)
• Northeast Technical Assistance and Training Resource Team
• Partnership for Drug free New Hampshire
• 11 NH Drug Free Community Coalitions
• Coalition on Substance Abuse, Mental Health and Aging
• Access to Recovery Program and Providers
• NH Medical Society
• Call to Action - Prescription Drug Plan, Implementation Task Force
• Local police departments
• Division of Liquor Enforcement
• NH Division of Public Health Services
• NH Behavioral Health Advisory Council
• NH Charitable Foundation
• NH Chapter of the National Organization on Fetal Alcohol Syndrome
• NH Prevention Certification Board
• Injury Prevention Coalition
• Teen Driving Safety Coalition
• Cancer Comprehensive Coalition

87NH state Health improvement plan 2013-2020
• Develop and adopt evidence-based guidelines for prescribing opioids in emergency depart-ments, including restrictions on the use of long-acting or extended-release opioids for acute pain.
• Train prescribers on safe opioid prescription practices and institute accountability mecha-nisms to ensure compliance. For example, the use of long-acting opioids for acute pain or in opioid-naïve patients could be minimized.
• Adopt policies and practices to integrate primary care, behavioral health and substance abuse prevention, intervention and treatment
• Improve treatment services and access to services by reducing or eliminating wait times, increasing availability of treatment services for adolescents, providing affordable treat-ment, and providing a comprehensive array of services to general and special populations
• Increase data analysis and reporting, integrated community action, and cross-disciplinary training relative to the co-occurrence of alcohol and other drug misuse and mental health and suicidality
• Promote data collection, analysis and reporting relative to the incidence of fetal alcohol syndrome disorders
• Promote the integration of mental health promotion and alcohol and other drug misuse prevention efforts, including professional development and service delivery
Early Learning Centers, Schools, Colleges, and Universities can:• Adopt policies and programs to decrease the
use of alcohol or other drugs on campuses, such as athletic and co-curricular policies.
• Implement programs for reducing drug abuse and excessive alcohol use (e.g., student assis-tance programs, parent networking, or peer-to-peer support groups).
• Promote the expansion of evidence-based education of school-aged youth in alcohol and other drug risks and consequences, with specific attention to education that takes place over multiple years and at key transition periods
• Collect and disseminate data on alcohol and other drug misuse among school-aged and
misu
se of Alcoh
ol & d
ru
gs
college populations, the impact of alcohol and drug abuse on educational attainment, school attachment, and education costs
• Increase collaboration between schools and colleges and health, mental health, safety and treatment services
Community, Non-Profit, and Faith-Based Organizations can: • Support implementation and enforcement of
alcohol and drug control policies.
• Increase youth leadership in preventing alcohol and other drug misuse
• Educate youth and adults about the risks of drug abuse (including prescription misuse) and excessive drinking.
• Work with media outlets and retailers to reduce alcohol marketing to youth.
• Increase awareness on the proper storage and disposal of prescription medications.
• Increase law enforcement patrols and surveil-lance (e.g. patrols, sobriety checkpoints)
Individuals and Families can: • Avoid binge drinking, use of illicit drugs, or
the misuse of prescription medications and, as needed, seek help from their clinician for substance abuse disorders.
• Safely store and properly dispose of prescrip-tion medications and not share prescription drugs with others.
• Avoid driving if drinking alcohol or after taking any drug (illicit, prescription, or over-the-counter) that can alter their ability to operate a motor vehicle.
• Refrain from supplying underage youth with alcohol and ensure that youth cannot access alcohol in their home.
*From the National Prevention Strategy and Collective Action: Collective Impact, NH’s Strategy for Reducing the Misuse of Alco-hol and Other Drugs and Promoting Recovery 2013-2017
88 NH state Health improvement plan 2013-2020
mis
use
of
Alc
ohol
& d
ru
gs
references1. CDC2. 2012 National Survey on Drug Use and Health3. US Department of Health and Human Services Treatment
Episode Data Set4. CDC5. 2008-2009 National Survey on Drug Use and Health6. New Hampshire Youth Risk Behavior Survey 2009 accessed
at http://www.education.nh.gov/instruction/school_health/documents/yrbs_report.pdf
7. February 2001, British Journal of Psychiatry8. December 1999 article in Cancer Epidemiology Biomarkers &
Prevention9. March 6, 2000, Dr. Murray Mittleman of the Harvard
School of Public Health told an American Heart Association conference
10. February 2001, British Journal of Psychiatry11. American Journal of Psychiatry, December 200012. May-June 2000 study in Neurotoxicology and Teratology13. http://www.cdc.gov/Features/AlcoholConsumption/14. Miron, J.A., 2005. The Budgetary Implications of Marijuana
Prohibition. The Marijuana Policy Project15. Kassed, C.A. Levit, K.R., and Hambrick, M.M., 2007,
Hospitalizations Related to Drug Abuse, 2005. Agency for Healthcare Research and Quality
16. http://www.samhsa.gov/data/DAWN.aspx17. 2007 report by the Coalition Against Insurance Fraud18. Shoveling Up II: The Impact of Substance Abuse on Federal,
State, and Local Budgets, National Center on Addiction and Substance Abuse at Columbia University, May 2009).
19. Behavioral Risk Factor Surveillance System, 2009 BRFSS in a MMWR supplment publication from CDC written in 2011 (January 14, 2011 / 60(01);101-104).
20. Johnston, L. D., O’Malley, P. M., Bachman, J. G., & Schulenberg, J. E. (December 19, 2012). “The rise in teen marijuana use stalls, synthetic marijuana use levels, and use of ‘bath salts’ is very low.” University of Michigan News Service: Ann Arbor, MI
89NH state Health improvement plan 2013-2020
appendix a: state public Health system assessment
process summaryBackground
The Essential Public Health Services were devel-oped in 1994 by national public health experts to provide consensus language and definition of the roles of public health.1 The Centers for Disease Control and Prevention’s National Public Health Performance Standards Program (NPHPSP) is a collaborative effort to enhance the nation’s public health systems.
The stated mission of the NPHPSP is to improve the quality of public health practice and the perfor-mance of public health systems. Use of the NPHPSP assessment tool can help public health entities to identify areas for system improvement, strengthen state and local partnerships, and assure system capacity to effectively respond to public health issues.
methodsIn October 2005, the New Hampshire
Department of Health and Human Services, Division of Public Health Services (DHHS, DPHS), convened a meeting of over 100 health and human service professionals, from both public and private sectors, to assess the performance of the public health system in New Hampshire. Using the NPHPSP State Public Health System Assessment, version 1, participants rated New Hampshire’s capacity to carry out the Ten Essential Public Health Services.
Public health partners used the NPHPSP stan-dardized tool to identify areas for system improve-ment, strengthen state and local partnerships, and assure a strong system that can respond effectively to day-to-day public health issues such as obesity and to public health emergencies such as H1N1.2
Following the assessment, in February 2006, the DPHS convened the Public Health Improvement Action Plan Advisory Committee (PHIAP) to guide a process to improve the public health system’s capacity to provide essential public health services, with the fundamental purpose of improving the public’s health. PHIAP was co-chaired by Dr. James Squires, then President of the Endowment for Health, and Mary Ann Cooney, then Director of the Division of Public Health Services. PHIAP membership included representatives of the public health community and various geographic regions of the state.
Key Findings PHIAP members considered the rankings from
the NPHPSP assessment along with other past and present public health initiatives and assessments to set six strategic public health priorities aimed at improving New Hampshire’s public health system.
Those priorities are:
• Inform, educate and empower people about health issues
• Monitor health status to identify and solve commu-nity health problems
• Mobilize community partnerships and actions to identify and solve health problems
• Develop policies and plans that support individual and community health efforts
• Develop a communication plan to convey the importance and value of public health
• Develop a plan to assure a competent public health workforce
Six workgroups convened to develop action plans to carry out the six strategic priorities. Key accom-plishments of the workgroups are presented below. The full report, New Hampshire’s Public Health Improvement Action Plan Progress Report 2011, can be accessed on the Division of Public Health Services’ website at www.dhhs.nh.gov/dphs/iphnh/index.htm.
resultsStrategic Priority: Inform, educate and empower people about health issues
The broad aim of this workgroup was to commu-nicate prioritized health promotion messages to the New Hampshire population in a coordinated manner based on evidence of effectiveness.
Key accomplishments were:
• Developed a collaborative process with the New Hampshire Citizens Health Initiative (CHI), Health Promotion and Disease Prevention Committee to assure coordination and consistent delivery of health messages.
• Administered a survey to public health partners to inventory health promotion best practices specifi-cally addressing the concerns central to the leading causes of death as cited in CHI’s report, A Pound of Prevention. These are: tobacco, alcohol, physical activity and nutrition.
Ap
pe
nd
ix A
90 NH state Health improvement plan 2013-2020
Ap
pe
nd
ix A
• Created a website that provided access to the data inventory and other PHIAP information.
Strategic Priority: Monitor health status to iden-tify and solve community health problems
The broad aim of this workgroup was to develop a user-driven, web-based, flexible system that can be used to access relevant public health data.
Key accomplishments were:
• Agreed on key contributors to illness and death as initial data inventory indicators including: tobacco, alcohol, physical activity and nutrition.
• Agreed to use the County Health Rankings indica-tors and social determinants of health as a basis to select health indicators.
• With funds from the CDC Assessment Initiative, New Hampshire HealthWRQS, a web reporting and querying system, (nhhealthwrqs.org) developed a library of reports and some health data queries.
• A state health profile was developed and published in 2011 to serve as the key data resource that could be expanded and built upon.
Strategic Priority: Mobilize community partner-ships and actions to identify and solve health problems
The broad aim of this workgroup was to improve the effectiveness and collaboration of community coalitions/partnerships to deliver essential public health services.
Key accomplishments were:
• Developed, piloted, and evaluated a survey to inventory coalitions and community partnerships, and gather information about partnerships, local community needs and priorities.
• The Public Health Improvement Service Council endorsed a document, A Call to Action, which recommended the support of long-term, broad-based partnerships rather than single focused coali-tions.
• The Division of Public Health Services began funding prevention initiatives through Public Health Networks.
Strategic Priority: Develop policies and plans that support individual and community health efforts
The broad aim of this workgroup was to insti-tutionalize a public health improvement planning process.
Key accomplishments were:
• Researched what other states have done to institu-tionalize public health improvement planning.
• Developed Regional Health Profiles to show vari-ability in state communities and to identify dispari-ties in health status.
• Completed capacity assessments of the 15 public health networks to show current local or regional public health planning processes/improvement processes.
• Secured funding from the Endowment for Health, the Centers for Disease Control and the Multi-State Learning Collaborative to assist in sustaining the planning process.
• Monitored and made recommendations regarding the public health regionalization initiative to build local public health infrastructure, through the Public Health Improvement Services Council.
Strategic Priority: Develop a communication plan to convey the importance and value of public health
The broad aim of this workgroup was to commu-nicate the importance of public health to various audi-ences to improve the public’s health.
Key accomplishments were:
• Conducted focus groups across the state to assess perceptions of public health in New Hampshire.
• Reviewed national market research through the Association of State and Territorial Health Officials and others.
• Identified public health providers as partners to spread the message when materials are developed.
• Funding obtained to develop communication mate-rials and place in newspapers and radio.
• Logo, tag line, ads, posters and PowerPoint presen-tations developed and disseminated.
• Campaign launched in the fall of 2009.
Strategic Priority: Develop a plan to assure a competent public health workforce
The broad aim of this workgroup was to develop a public health workforce development plan to assure a competent workforce to address public health needs.
Key accomplishments were:
• Staffing needs of a regional public health workforce were partially identified through the public health regionalization plan.
• Agreed to encourage the use of TRAIN, a web-based public health education system, to coordinate public health trainings offered throughout New Hampshire.
91NH state Health improvement plan 2013-2020
Challenges & successes Several challenges were noted during the course
of assessing state public health system capacity and implementing action plans to address priority gaps. First, since the NPHPS is based on input from public health system partners, any limits to participation in the assessment could have influenced the results. For example, participants who attended one breakout could not participate in another breakout that occurred at the same time. Challenges were also noted in terms of sustaining work groups over time, espe-cially since this depended on efforts in areas where additional resources were not readily available.
Despite these challenges, workgroup successes have improved the capacity of New Hampshire’s public health system. For example, materials created to promote the importance of public health are still available on the New Hampshire Public Health Association’s website. The State Health Profile and Regional Profiles have provided essential informa-tion about the status of our population’s health. Workforce efforts have provided a foundation for current work by the New Hampshire Public Health Training Center, the New Hampshire Institute for Health Policy and Practice, the Citizens Health Initiative and others.
Reassessment, using the NPHPSP State Public Health System Assessment, version 3, occurred through three meetings in May, June and July of 2013. The results of this assessment are currently under analysis and will further inform implementation of the State Health Improvement Plan.
The original NPHPS assessment results, the 2005 Public Health Improvement Action Plan, and the 2011 PHIAP Progress reports can all be found at the following webpage: http://www.dhhs.nh.gov/dphs/iphnh/publications.htm.
references
1. Institute of Medicine 2003 The Future of Public Health in the 21st Century, Washington, DC, National Academy Press
2. US Department of Health and Human Services, National Public Health Performance Standards Program, Users’ Guide, April 2004
Ap
pe
nd
ix A
92 NH state Health improvement plan 2013-2020
Ap
pe
nd
ix B
appendix B: state Health assessment
process summaryBackground
The Health Status Assessment is one of the four Mobilizing for Action through Planning and Partnerships (MAPP) assessments. It is designed to analyze the health status, quality of life and risk factors in the population. Information gathered from this assessment defines the key health issues facing the population and identifies health disparities. Data contained in this assessment can serve as a baseline for health improvement efforts.
MethodsPlanning for the health status assessment began
in December 2009, when a State Health Report group was formed to guide the process. The group used the Public Health Accreditation Board definition of community health assessment and the County Health Rankings methods as a framework for planning. The purpose of the assessment was to describe key public health indicators to drive the improvement of health outcomes in our state. One main goal was to integrate various key indicators that are tied to the most signifi-cant public health challenges.
The State Health Report group met several times during the spring of 2010. They reviewed a variety of other states’ health status reports, and discussed all aspects of the assessment, from indicator selection to report production and dissemination. The following core principles were adopted to guide the develop-ment of the assessment. The group determined that the health status assessment should:
• show the inter-relationship between health outcomes, health behaviors and key social determi-nants of health, such as socioeconomic status and education level;
• show the health status differences in local geographic areas, or show that there are no differences and, therefore, no need to present regional or local level data;
• offer interpretation and guidance for our public health constituents;
• build a bridge between administrative data sets and other sources, such as survey, claims, and screening data; and
• describe the state of the public’s health, be easy to grasp, and tell the story of the public’s health in New Hampshire.
The State Health Report group developed a comprehensive list of possible indicators for inclu-sion in the assessment. With direction from Dr. Jose Montero, Director of the Division of Public Health Services (DPHS), it was decided to keep the focus on the social determinants of health that had been incorporated into the previous New Hampshire state health assessment. Main areas for inclusion were injury prevention, maternal and child health, chronic and infectious diseases, access to care, and social/environmental influences.
By September of 2010, the State Health Report group had finalized the indicator list, created an outline of the report, made assignments for the writing and analysis of each health area, determined the layout for text and graphics, and created a style manual with instructions on submitting content and graphics. On September 17, 2010, a meeting was held to brief staff on their assignments for the project and set in motion the process that would result in a new NH State Health Report. Between September and December, DPHS content experts and epidemiolo-gists worked on their sections of the New Hampshire State Health Profile.
Overall responsibility for planning and coor-dinating the New Hampshire State Health Profile rested with the Bureau of Public Health Statistics and Informatics (BPHSI) under the direction of Brook Dupee, Bureau Chief. Dr. Montero and Joan Ascheim, Bureau Chief of the Bureau of Public Health Systems, Policy and Performance, provided strategic direction. Dr. Sharon Alroy-Preis, State Epidemiologist, was responsible for working with DPHS programs to write the indicators and present the data. Karla Armenti oversaw day-to-day coordi-nation of the report, and data analysis was completed by BPHSI staff and other DPHS epidemiologists. Creative direction and design were executed by Laura Holmes with graphic support by Christin D’Ovidio. Michael Laviolette prepared graphs and charts. Maps were prepared by Tylor Young. Publication manage-ment was done by Tina Piaseczny.
Key Findings Results
The key health factors identified in the 2011 New Hampshire State Health Profile as requiring further attention were: 1. Obesity among adults and children and behaviors
that may lead to it, such as lack of fruit and vege-table consumption
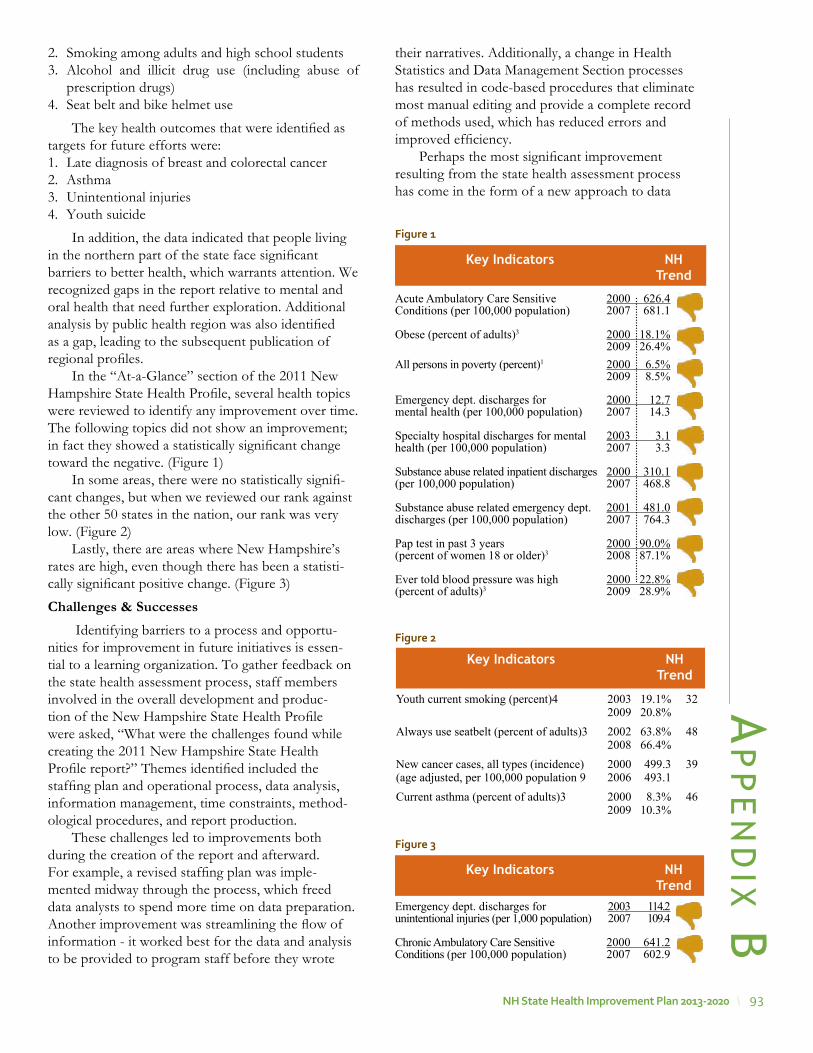
93NH state Health improvement plan 2013-2020
2. Smoking among adults and high school students3. Alcohol and illicit drug use (including abuse of
prescription drugs)4. Seat belt and bike helmet use
The key health outcomes that were identified as targets for future efforts were: 1. Late diagnosis of breast and colorectal cancer 2. Asthma 3. Unintentional injuries4. Youth suicide
In addition, the data indicated that people living in the northern part of the state face significant barriers to better health, which warrants attention. We recognized gaps in the report relative to mental and oral health that need further exploration. Additional analysis by public health region was also identified as a gap, leading to the subsequent publication of regional profiles.
In the “At-a-Glance” section of the 2011 New Hampshire State Health Profile, several health topics were reviewed to identify any improvement over time. The following topics did not show an improvement; in fact they showed a statistically significant change toward the negative. (Figure 1)
In some areas, there were no statistically signifi-cant changes, but when we reviewed our rank against the other 50 states in the nation, our rank was very low. (Figure 2)
Lastly, there are areas where New Hampshire’s rates are high, even though there has been a statisti-cally significant positive change. (Figure 3)
Challenges & Successes Identifying barriers to a process and opportu-
nities for improvement in future initiatives is essen-tial to a learning organization. To gather feedback on the state health assessment process, staff members involved in the overall development and produc-tion of the New Hampshire State Health Profile were asked, “What were the challenges found while creating the 2011 New Hampshire State Health Profile report?” Themes identified included the staffing plan and operational process, data analysis, information management, time constraints, method-ological procedures, and report production.
These challenges led to improvements both during the creation of the report and afterward. For example, a revised staffing plan was imple-mented midway through the process, which freed data analysts to spend more time on data preparation. Another improvement was streamlining the flow of information - it worked best for the data and analysis to be provided to program staff before they wrote
Key Indicators NH Trend
Acute Ambulatory Care Sensitive 2000 626.4Conditions (per 100,000 population) 2007 681.1
Obese (percent of adults)3 2000 18.1% 2009 26.4%All persons in poverty (percent)1 2000 6.5% 2009 8.5%
Emergency dept. discharges for 2000 12.7mental health (per 100,000 population) 2007 14.3
Specialty hospital discharges for mental 2003 3.1health (per 100,000 population) 2007 3.3
Substance abuse related inpatient discharges 2000 310.1(per 100,000 population) 2007 468.8
Substance abuse related emergency dept. 2001 481.0discharges (per 100,000 population) 2007 764.3
Pap test in past 3 years 2000 90.0%(percent of women 18 or older)3 2008 87.1%
Ever told blood pressure was high 2000 22.8%(percent of adults)3 2009 28.9%
Figure 1
Youth current smoking (percent)4 2003 19.1% 32 2009 20.8%Always use seatbelt (percent of adults)3 2002 63.8% 48 2008 66.4%New cancer cases, all types (incidence) 2000 499.3 39(age adjusted, per 100,000 population 9 2006 493.1Current asthma (percent of adults)3 2000 8.3% 46 2009 10.3%
Key Indicators NH Trend
Figure 2
Emergency dept. discharges for 2003 114.2unintentional injuries (per 1,000 population) 2007 109.4
Chronic Ambulatory Care Sensitive 2000 641.2Conditions (per 100,000 population) 2007 602.9
Key Indicators NH Trend
Figure 3
their narratives. Additionally, a change in Health Statistics and Data Management Section processes has resulted in code-based procedures that eliminate most manual editing and provide a complete record of methods used, which has reduced errors and improved efficiency.
Perhaps the most significant improvement resulting from the state health assessment process has come in the form of a new approach to data
Ap
pe
nd
ix B

94 NH state Health improvement plan 2013-2020
Ap
pe
nd
ix B
across the Division. DPHS has always recognized its leading role in providing information on health indicators to guide policies, plans and actions at the state and community levels. However, providing this data in timely and efficient way has been challenging. Access to population health data has been inade-quate and requires the use of multiple data source siloes, many of which have limited information and require repeated, labor-intensive data analysis. In addition, demands on DPHS to improve the delivery and impact of public health services have grown in recent years. This has created a need for easy access to comprehensive information that will integrate different data sources to provide a 360-degree picture of the population’s health, including the role DPHS programs play in measuring and improving it.
To meet this need, DPHS is creating a new Web-based Interactive System for Direction and Outcome Measures, or NH Health WISDOM, which will vividly illustrate the health status of our commu-nities, the actions DPHS is taking toward improving the health of the population, and provide resources for communities to improve their health status. This will mark a fundamental shift in how DPHS uses data to develop health indicators that either inform or measure healthy choices at the community and indi-vidual levels, and will permanently change how the DPHS plans for, develops, markets, and tracks the use of its health indicators.
The full 2011 New Hampshire State Health Profile can be found on the following webpage: http://www.dhhs.nh.gov/dphs/documents/ 2011statehealthprofile.pdf
95NH state Health improvement plan 2013-2020
appendix C: what Forces of Change are impacting New Hampshire?
process summaryBackground
The Forces of Change Assessment is one of the four Mobilizing for Action through Planning and Partnerships (MAPP) assessments. It is designed to help identify what is occurring or might occur that affects the health of a state, and what specific threats or opportunities are generated by these occurrences. This information defines the context within which the public health system must operate to effect improve-ments in health outcomes.
MethodsTwo brainstorming sessions, facilitated by Joan
Ascheim, then Chief of the Bureau of Public Health Systems, Planning and Performance, New Hampshire Division of Public Health Services, comprised the Forces of Change Assessment. One session was held with Division of Public Health Services staff on July 9, 2012. An additional session was held with Public Health Improvement Services Council (PHISC) members on October 18, 2012. The groups were asked to focus on what was occurring or might occur in New Hampshire that affects the state public health system and our goal to undertake a public health improvement planning process. Input from these sessions was synthesized and overarching forces of change themes were identified.
Key Findings ResultsDemographic Trends
New Hampshire’s population is aging. The state’s overall population grew 6.5%to 1.3 million people between 2000 and 2010, making it the region’s fastest growing state over the last decade. It also became one of the oldest–the state’s median age jumped from 37 to 41, two years older than the median age in Massachusetts and Rhode Island, and a year older than Connecticut.1 New Hampshire residents had the 4th highest median age of all states in the 2010 Census.
New Hampshire’s population is becoming more diverse. The 2010 census showed that New Hampshire’s minority populations grew over the last decade, increasing from 4% of the population in 2000 to 6.2% in 2010. The state’s Hispanic or Latino popu-lation jumped by close to 80% in this time period,
the Asian population rose by 76% and the number of African-Americans climbed 66%.2 This increasing diversity is also apparent in New Hampshire births. For example, on 16.6% of New Hampshire resident birth records in 2010 one or both parents reported their race as other than white, non-Hispanic. This is an increase from 7.6% in 1998 birth records.3
These demographic changes are projected to continue, changing New Hampshire’s population, its health status and its public health needs. The effects will be seen across many sectors, including health-care, the labor force, and housing. Forces of Change assessment participants identified New Hampshire’s transportation system as a potential challenge for older citizens and saw identifying new strategies to address the needs of an aging population as a crucial issue. Participants felt there were opportunities as well to develop new services and new ways to deliver them.
Economic Climate The state of the economy has been an issue of
national interest since the 2008 recession. In New Hampshire, unemployment claim filings had increased in almost all industries by the fourth quarter of 2008.4 Increasing caseloads were seen for several years across the human services sector, such as the Medicaid, TANF and SNAP programs. However, this trend has slowed. By December 2012, New Hampshire’s seasonally adjusted unemployment rate was 5.7% compared to the national rate of 7.8%.5 Although the recovery has not been strong, it has continued to move forward. But while economic indi-cators continue to show New Hampshire’s recovery from the Great Recession, the prospect for govern-ment budgets–both national and state–continue to be of concern to many.
In the Forces of Change assessment, partici-pants noted that the economic climate could produce major changes in public health program efforts, with reductions in funding at both the federal and state levels. Some DPHS programs, such as the childhood lead poisoning prevention program, have already seen funding reductions. This can create a false sense that an issue is resolved and requires a closer look at targeting intervention strategies. Reductions will require public health partners to do more with less, and may create challenges in maintaining partnerships within communities.
Ap
pe
nd
ix C
96 NH state Health improvement plan 2013-2020
Ap
pe
nd
ix C
Opportunities identified were developing new ways to deliver services, thinking creatively about new sources of funding, and creating efficiencies to decrease the cost of public health services. For example, the DPHS NH Health WISDOM system, once implemented, will provide accessible, up-to-date health data online, changing the focus of work for Division epidemiologists. Clarifying choices and tracking the impact where dollars are added or reduced will be essential in navigating budgetary changes. In addition, using New Hampshire’s central location and expertise towards regionalizing functions can be capitalized on as a significant strength of our public health system.
Political LandscapeThe Forces of Change Assessment was completed
in October of 2012, with national, state and local elections less than a month away. At that time, New Hampshire’s Legislature was predominantly conser-vative and long-time Democratic Governor, John Lynch, was not running for re-election. President Barack Obama was running for a second term, but the polls were not projecting a clear victory for the incumbent. Uncertainty about these elections, and the potential impacts on public health policy, was a central issue during the Forces of Change discussions.
Discussions focused on the prospect of changing priorities in new administrations. Concerns included whether public health issues would be supported and whether resources would be reallocated, resulting in reductions in important public health areas. Other identified challenges were information technology advances, such as the shift to electronic medical records, and the trend toward smaller government.
Participants also spoke of several opportuni-ties that could occur in the wake of the elections. A changing political landscape forces public health part-ners to be sharper and work to educate legislators and the public about public health and the impact of prevention. Other opportunities that were discussed included: the belief that increased efforts can improve efficiency and the ability to address public health needs; the potential to continue with people-focused policy; and the prospect of people of differing polit-ical viewpoints finding new ways to work together.
Health System TransformationThe signing of the Patient Protection and
Affordable Care Act (ACA) in March of 2010 signaled a new chapter in the history of American healthcare delivery. Heralded as an unprecedented opportunity to transform healthcare in our nation by some, and a travesty by others, the future of the ACA was uncer-
tain at first. However, the Supreme Court ruling that the individual mandate may be upheld on June 28, 2012 was a significant step forward in assuring the law’s implementation.
Concurrently, in New Hampshire, the transfor-mation of the State’s Medicaid program to a care management system is underway. In response to growing Medicaid expenditures, SB 147 (Chapter 125, Laws of New Hampshire 2011) was passed in 2011. This law directed DHHS to develop a comprehensive statewide care management program for all Medicaid enrollees which would focus on improving the value, quality, and efficiency of services, stimulate innova-tion, and generate savings for the Medicaid Program.
Participants discussed the widespread changes expected with the ACA and Medicaid care manage-ment implementations, the opposition to ACA provi-sions, and the federal focus on systems development in the face of health care reform. Identified chal-lenges included uncertainty about whether Medicaid expansion would occur in New Hampshire and concerns about ongoing support for direct services. Some questioned whether clients would be able to receive the same level of care with the same providers when Medicaid care management is implemented and worried that access to health care services could decrease if providers become reluctant to accept Medicaid patients.
Opportunities identified were the ability to further develop local level systems, to expand comprehensive insurance coverage across the state and to improve care management services. With more people covered by insurance and better coordination of care, partici-pants felt that the population’s health status could increase.
Limited Public Health Capacity and Ability to Respond to Emerging Issues
The limited capacity of governmental public health agencies was articulated in the Institute of Medicine’s 2002 report, The Future of the Public’s Health in the 21st Century.6 The report noted that “the governmental public health infrastructure has been neglected, and an overhaul of its components (e.g., workforce, laboratories, public health law) is needed to ensure quality of services and optimal performance”. Investments in public health infra-structure were made in the wake of this report, but these investments have declined in recent years. Since July 2008, state health agencies have implemented a variety of cost-saving strategies to cut expenses and reduce layoffs. Strategies used most frequently are travel restrictions, delayed hires, hiring freezes and cutting vacant positions. State and local health depart-
97NH state Health improvement plan 2013-2020
Ap
pe
nd
ix Cments have cut more than 45,700 jobs across the country since 2008.7 Erosion of capacity affects the public health system’s ability to assure the health of the population.
Forces of Change Assessment participants iden-tified flu pandemic, disaster response, and radiologic emergency response as issues where public health capacity is a critical factor in safeguarding the health of the population. Pandemic situations are resource intensive, tax staff and can preclude participation in other Division initiatives. Other issues identified in important, if more routine, public health work included: managing requests for data and responding to funding opportunities with limited staff; challenges to survey work due to the decrease in land lines; the need for accessible county-level data; and the need to streamline some DPHS administrative processes. Opportunities to work in different ways were identi-fied, such as cross-training staff to assist with inves-tigations, and developing web-based applications to survey younger populations. Public health regionaliza-tion was also noted as a positive, as communication between the state and regional levels has improved.
references
1. May 13. 2011 11:00PM Census: New Hampshire population aging, growing Paul Feely, New Hampshire Union Leader
2. 2010 Census3. NH DHHS, MCH, unpublished data4. NH Economic Conditions, 109(04), April 20095. http://www.nhes.nh.gov/elmi/, accessed Feb 23, 20136. Institute of Medicine, The Future of the Public’s Health in the
21st Century, 2002, accessed April 26, 2013, http://www.iom.edu/Reports/2002/The-Future-of-the-Publics-Health-in-the-21st-Century.aspx
7. Association of State and Territorial Health Officials. Budget Cuts Continue to Affect the Health of Americans: Update August 2012. http://www.astho.org/Research/Data-and-Analysis/ASTHO-Budget-Cuts-Impact-Research-Brief-Update-(August-2012)/ (accessed April 24, 2013)
98 NH state Health improvement plan 2013-2020
Ap
pe
nd
ix d
appendix D: themes and strengths assessment summary
process summaryBackground
The Themes and Strengths Assessment is one of the four Mobilizing for Action through Planning and Partnerships (MAPP) assessments. It is designed to provide information about what is important to a community and what assets are available that can be used to improve community health. This assessment results in a strong understanding of community issues and concerns, perceptions about quality of life, and community assets.
MethodsTwo brainstorming sessions, facilitated by Joan
Ascheim, then Chief of the Bureau of Public Health Systems, Planning and Performance, New Hampshire Division of Public Health Services, comprised the Themes and Strengths Assessment. One session was held with Division of Public Health Services staff on July 9, 2012. An additional session was held with Public Health Improvement Services Council (PHISC) members on October 18, 2012. The groups were asked two questions:
1. What do you see as assets of our state that contribute to a strong public health system and will help move forward a strong state public health improvement plan?
2. What are some issues or events that have brought communities together successfully to improve the health and quality of life in our state and that we can learn from as we move forward in a planning process?
Input from these sessions was synthesized and overarching themes and strengths of New Hampshire’s statewide public health system were identified.
Key Findings Results
Three main themes were identified that partici-pants perceived contribute to the strength of our public health system. They are:
• partnerships; • the strength of the current public health infrastruc-
ture; and • state characteristics, such as the size of the state
and health of its population.
PartnershipsParticipants noted the strong community part-
nerships that exist in New Hampshire and the good working relationship between private and public health systems. This includes partnerships within communities as well as between the DPHS and local communities. Improvement in coordination across systems was mentioned as well. Other strengths of New Hampshire’s public health system were the investments made by private funders and a history of multi-sectoral approaches to community health improvement. In addition, the State health depart-ment was seen as effective at working in partnership with communities, as well as having strong connec-tions to national resources.
Strengths of the Current Public Health System The expertise and commitment of public health part-ners was viewed as the biggest strength of the system. This was noted in terms of a strong State health department as well as the expertise among faculty from the University of New Hampshire, the Institute for HPP and other academic public health programs. Participants felt that partners understand the value of public health systems. Another strength noted was the presence of a fledgling public health infrastructure through the State’s Public Health Networks and the new alignment of public health and substance misuse prevention networks. It was noted that preexisting multi-stakeholder organizations are a critical element of public health work. Another asset mentioned was an improved data capacity. Finally, participants felt that declining resources encourages collaboration across the system.
State CharacteristicsNew Hampshire is a small state of only 1.3
million residents. It has a small and healthy popula-tion, and is often at the top of the national rankings in terms of health. The size of the state allows for close relationships among stakeholder groups and makes for accessibility in terms of public health system part-nerships.
Participants discussed many issues and events that have brought New Hampshire communities together successfully to improve the health and quality of life in our state. Notable situations in which this has occurred included: working to build the regional public health infrastructure; addressing specific health issues; and, currently, responding to health system transformation.
99NH state Health improvement plan 2013-2020
Ap
pe
nd
ix dBuilding on Public Health Infrastructure
Work done on Community Health Assessments in the public health regions showed our capacity to bring communities together. The growth of a public health emergency preparedness movement and newly recog-nized threats brought a new recognition among the public and partners, including elected and appointed municipal officials, of public health’s central role in mitigating and responding to emergencies. The infra-structure built since 9/11 in terms of capacity and communications was capitalized on and became public health opportunities. Events that previously had not been seen as public health issues have become so, such as with the ice storm of 2008 and the need for safe sheltering alternatives.
Addressing Health IssuesOne example of addressing emerging health issues
is prescription drug abuse, which has brought people together across sectors to address it and has resulted in an active state plan. Alcohol, tobacco and other substance misuse prevention efforts have been institu-tionalized using a public health approach. The Healthy Eating Acting Living (HEAL) initiative is another example of multi-sectoral partners coming together to address a health issue. The Oral Health Coalition has been active for several years to address oral health concerns and work on priorities of the state oral health plan. Infectious disease threats such as West Nile Virus, EEE, Hepatitis C and fungal menin-gitis have shown the need for connections between traditional medicine, public health, and emergency response. Finally, the HIV/AIDS infrastructure and work to address lead poisoning in Manchester were noted as examples of the system’s success.
Responding to Health System TransformationThe Affordable Care Act, participants noted,
helped health care providers think about how we deliver health care outside of traditional health systems. The escalating cost of health insurance helps people understand the importance of prevention in cost reduction.
100 NH state Health improvement plan 2013-2020
Ap
pe
nd
ix e
appendix e: How Health priorities were Determined
process summaryBackground
The New Hampshire State Health Profile 2011 provided information about the health status of New Hampshire’s residents. The data presented was intended for use by the Division of Public Health Services and public health partners to plan and imple-ment a public health agenda for New Hampshire. Especially in resource scarce environments, priori-tizing goals is essential so that public health efforts are focused and result in a greater impact on the popula-tion’s health.
MethodsIn August of 2011, the Division of Public Health
Services’ Director, Dr. Jose Montero challenged DPHS leadership to develop a plan for addressing the most significant health issues facing our state, which had been identified in the 2011 New Hampshire State Health Profile. Led by Dr. Sharon Alroy-Preis, State Epidemiologist, the Division developed the Goals and Objectives (GO) plan to identify the Division’s goals, objectives and priorities. The GO plan process was held between September 2011 and June 2012 and included 4 steps:
1. Identify the overarching broad goals for the Division: DPHS senior managers and its stra-tegic planning team developed eight broad goals to improve population health in New Hampshire. These were:
Broad Goal 1: Reduce the Burden of Chronic Diseases
Broad Goal 2: Reduce the Transmission and Impact of Infectious Diseases
Broad Goal 3: Assure Optimal Response to PH Emergencies
Broad Goal 4: Prevent Injury and Disability
Broad Goal 5: Improve Health Across the Lifespan
Broad Goal 6: Promote Health Equity
Broad Goal 7: Support a Healthy Physical Environment
Broad Goal 8: Strive to be an Effective and Efficient Leadership Organization
2. Identify specific goals for each broad goal. A workgroup was created for each of the broad goals and included DPHS management and staff from
different Division’s bureaus. DPHS workgroups met frequently over several months, developing logic models that detailed how to reach each goal. Workgroups outlined what we should be doing to address the goals and identified health outcome based objectives for the areas. Examples of specific goals for Broad Goal 1 included improve healthy food choices and consumption, improve physical activity, reduce tobacco use and exposure, reduce obesity, reduce cardiovascular disease etc.
3. Gap analysis: each workgroup examined the gaps between the work we should be done based on the logic model discussion and the work that is being done. Gaps identified in that process were brought to a strategic planning team discussion and recon-ciliation.
4. Prioritization process to identify the health outcomes that require emphasis in the years ahead. The top health objectives best suited to make the most significant impact on our health issues was culled from the GO Plan results. The result was a list of over 90 possible health objectives. DPHS leaders met in June 11th and 12th, 2012 and priori-tized these through a weighted voting system.
The following criteria were used in the prioritiza-tion process:
Criterion #1: Problem/Issue has severe health Consequences
This means that the problem identified could result in severe disability or death.
RATING SCALE:1=Problem is not life threatening or disabling to indi-viduals or community
2=Problem is not life threatening but is sometimes disabling
3=Problem can be moderately life threatening or disabling
4=Problem can be moderately life threatening but there is a strong likelihood of disability
5=Problem has a high likelihood of death and disability
Criterion #2: Large Number of Individuals are Affected by the Problem
This criterion considers the absolute number of people (the MCH population) affected. It includes the concept that targeting a problem affecting a large
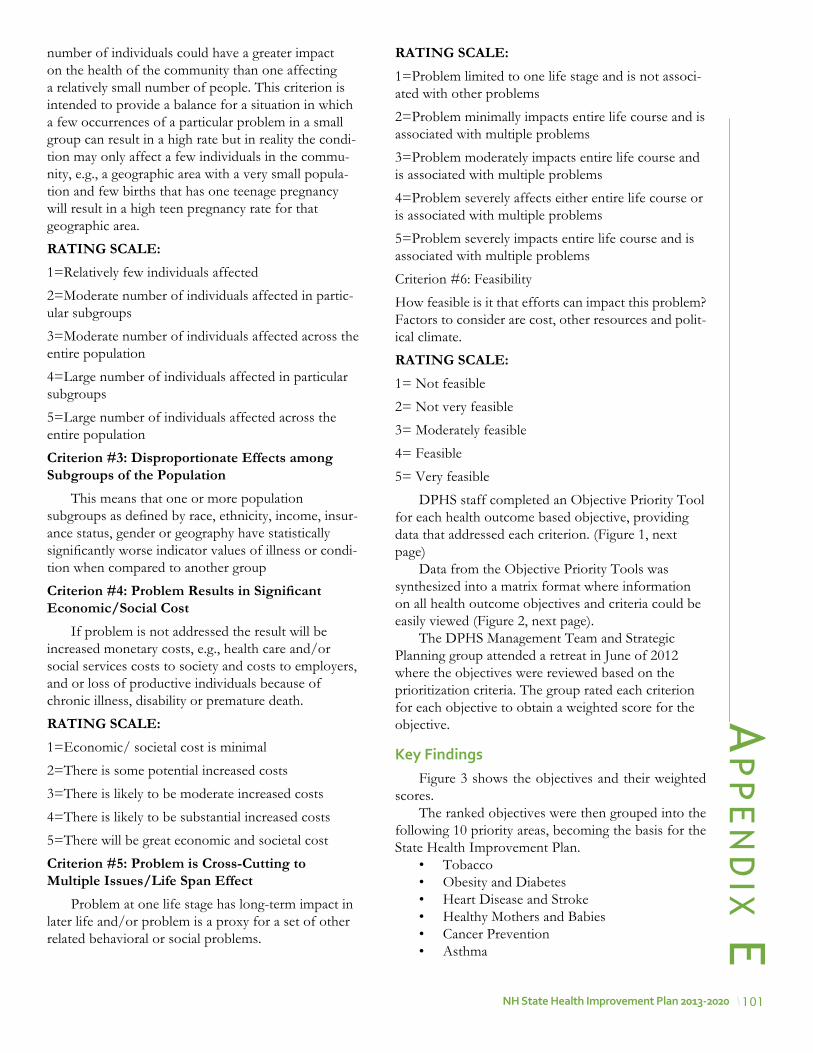
101NH state Health improvement plan 2013-2020
number of individuals could have a greater impact on the health of the community than one affecting a relatively small number of people. This criterion is intended to provide a balance for a situation in which a few occurrences of a particular problem in a small group can result in a high rate but in reality the condi-tion may only affect a few individuals in the commu-nity, e.g., a geographic area with a very small popula-tion and few births that has one teenage pregnancy will result in a high teen pregnancy rate for that geographic area.
RATING SCALE:1=Relatively few individuals affected
2=Moderate number of individuals affected in partic-ular subgroups
3=Moderate number of individuals affected across the entire population
4=Large number of individuals affected in particular subgroups
5=Large number of individuals affected across the entire population
Criterion #3: Disproportionate Effects among Subgroups of the Population
This means that one or more population subgroups as defined by race, ethnicity, income, insur-ance status, gender or geography have statistically significantly worse indicator values of illness or condi-tion when compared to another group
Criterion #4: Problem Results in Significant Economic/Social Cost
If problem is not addressed the result will be increased monetary costs, e.g., health care and/or social services costs to society and costs to employers, and or loss of productive individuals because of chronic illness, disability or premature death.
RATING SCALE:1=Economic/ societal cost is minimal
2=There is some potential increased costs
3=There is likely to be moderate increased costs
4=There is likely to be substantial increased costs
5=There will be great economic and societal cost
Criterion #5: Problem is Cross-Cutting to Multiple Issues/Life Span Effect
Problem at one life stage has long-term impact in later life and/or problem is a proxy for a set of other related behavioral or social problems.
RATING SCALE:1=Problem limited to one life stage and is not associ-ated with other problems
2=Problem minimally impacts entire life course and is associated with multiple problems
3=Problem moderately impacts entire life course and is associated with multiple problems
4=Problem severely affects either entire life course or is associated with multiple problems
5=Problem severely impacts entire life course and is associated with multiple problems
Criterion #6: Feasibility
How feasible is it that efforts can impact this problem? Factors to consider are cost, other resources and polit-ical climate.
RATING SCALE:1= Not feasible
2= Not very feasible
3= Moderately feasible
4= Feasible
5= Very feasible
DPHS staff completed an Objective Priority Tool for each health outcome based objective, providing data that addressed each criterion. (Figure 1, next page)
Data from the Objective Priority Tools was synthesized into a matrix format where information on all health outcome objectives and criteria could be easily viewed (Figure 2, next page).
The DPHS Management Team and Strategic Planning group attended a retreat in June of 2012 where the objectives were reviewed based on the prioritization criteria. The group rated each criterion for each objective to obtain a weighted score for the objective.
Key Findings Figure 3 shows the objectives and their weighted
scores. The ranked objectives were then grouped into the
following 10 priority areas, becoming the basis for the State Health Improvement Plan.
• Tobacco• Obesity and Diabetes• Heart Disease and Stroke• Healthy Mothers and Babies• Cancer Prevention• Asthma
Ap
pe
nd
ix e
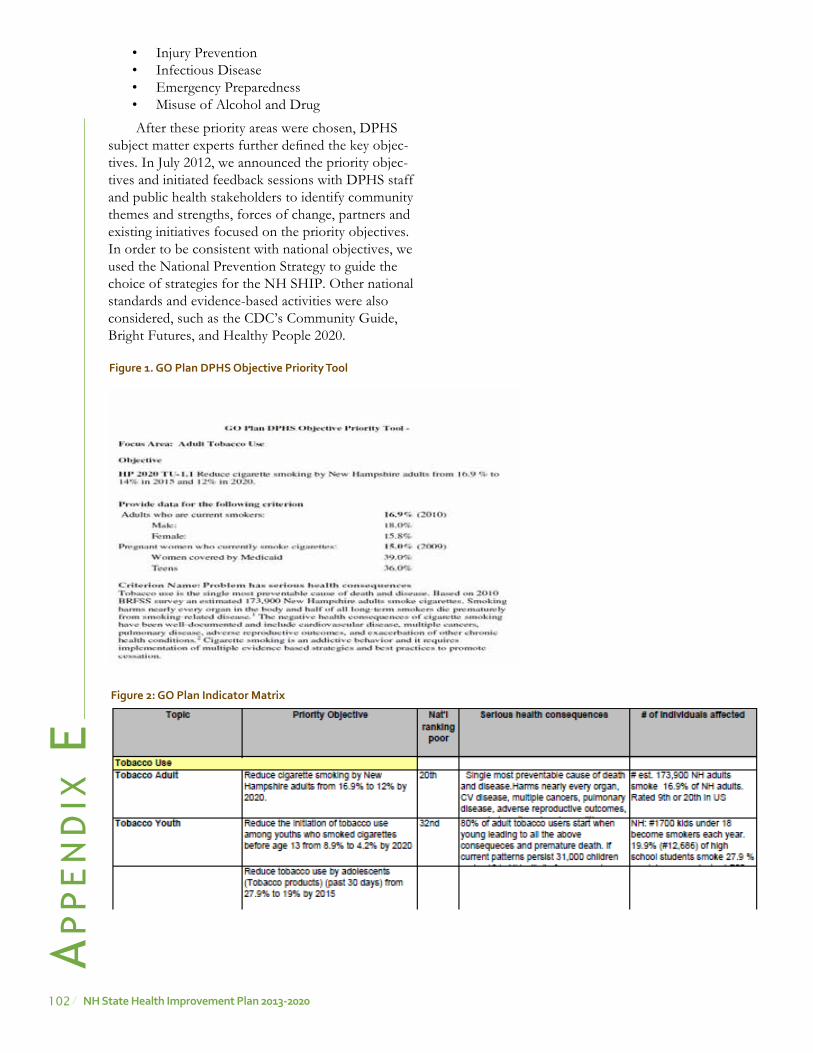
102 NH state Health improvement plan 2013-2020
• Injury Prevention• Infectious Disease • Emergency Preparedness• Misuse of Alcohol and Drug
After these priority areas were chosen, DPHS subject matter experts further defined the key objec-tives. In July 2012, we announced the priority objec-tives and initiated feedback sessions with DPHS staff and public health stakeholders to identify community themes and strengths, forces of change, partners and existing initiatives focused on the priority objectives. In order to be consistent with national objectives, we used the National Prevention Strategy to guide the choice of strategies for the NH SHIP. Other national standards and evidence-based activities were also considered, such as the CDC’s Community Guide, Bright Futures, and Healthy People 2020.
Figure 1. Go plan DpHs objective priority tool
Figure 2: Go plan indicator matrix
Ap
pe
nd
ix e

103NH state Health improvement plan 2013-2020
Figure 3: rating Using prioritization Criteria
Ap
pe
nd
ix eFigure 3: Rating Using Prioritization Criteria
C1 below corresponds to Criterion #1 above, C2 to Criterion #2, etc. The agreed upon weights are shown in the line below each criterion number.
Problem/Issue C1 C2 C3 C4 C5 C6
Total Score 3 2 2 1 3 1
Obesity - child 4 5 5 5 4 54 Diabetes 5 5 4 5 4 3 53 Obesity - adult 4 5 4 5 5 3 53 Tobacco - adults 5 4 4 4.5 4 3 50.5 Cardiovascular disease 5 4 4 4 4 3 50 Tobacco - youth 5 4 3 5 4 3 49 Preterm births 4 3 4 4 4 3 45 Tobacco - pregnancy 4 3.5 3.5 4 4 3 45 HIV 4 2 4 4 4 4 44 Childhood immunizations 4 4 3 3 3.5 4 43.5 HIV Care Program 4 2 4 4 4 3 43 Colorectal cancer 4 4 3 4 3 3 42 Breast cancer 5 3 2 3.5 3 4 41.5 Melanoma 4 4 3 3 3 3 41 Asthma 3 3 3 4 4 3 40 ASD 3 3 3 4 4 3 40 Suicide - all 5 2 3 3 3 3 40 Injuries/deaths from falls (> 65 years) 3.5 4 3.5 4 2 3 38.5 Radon related lung cancer 3 3 3 3 4 2 38 HepC 4 2.5 3 3 3 3 38 Teen pregnancy 3 2 3 4 4 3 38 Breastfeeding 3 3 3 3 3.5 3 37.5 Sexual violence in adolescents 3 3 3 3 3 3 36 Oral health - adults 3 3 3 3 3 3 36 Oral health - children 2 4 3 3 3 4 36 Cervical cancer 3.5 2 3 2 3 4 35.5 Crash related deaths 3.5 3 2 3 3 3 35.5 ETS 3 3 3 3.5 3 2 35.5 Work related injuries 3 3 3 3 3 2 35 Lead exposure - children 3 2 3 3 3 3 34 Emotional abuse: adolescents in school 2 4 3 2 3 2 33 Injuries/illness from PH emergencies 3 3 2.5 3 2 4 33 Adult flu vaccine 3 3 3 3 2 3 33 Suicide - adolescents 3 2 2.5 2 3 3 32 Chlamydia 2 2 3 2 3 4 31 Adult pertussis (Tdap) vaccine 3 2 2 2.5 2.5 3 30 Injuries from sports 2.5 2 2 2.5 3 2 29 Lead exposure, work - adult 3 2 2 2.5 2.5 2 29 Adolescent injuries/deaths from falls 2 2 2 3 2 3 26 Foodborne illness 2 3 1 2 2 3 25 Unintentional poisonings 0
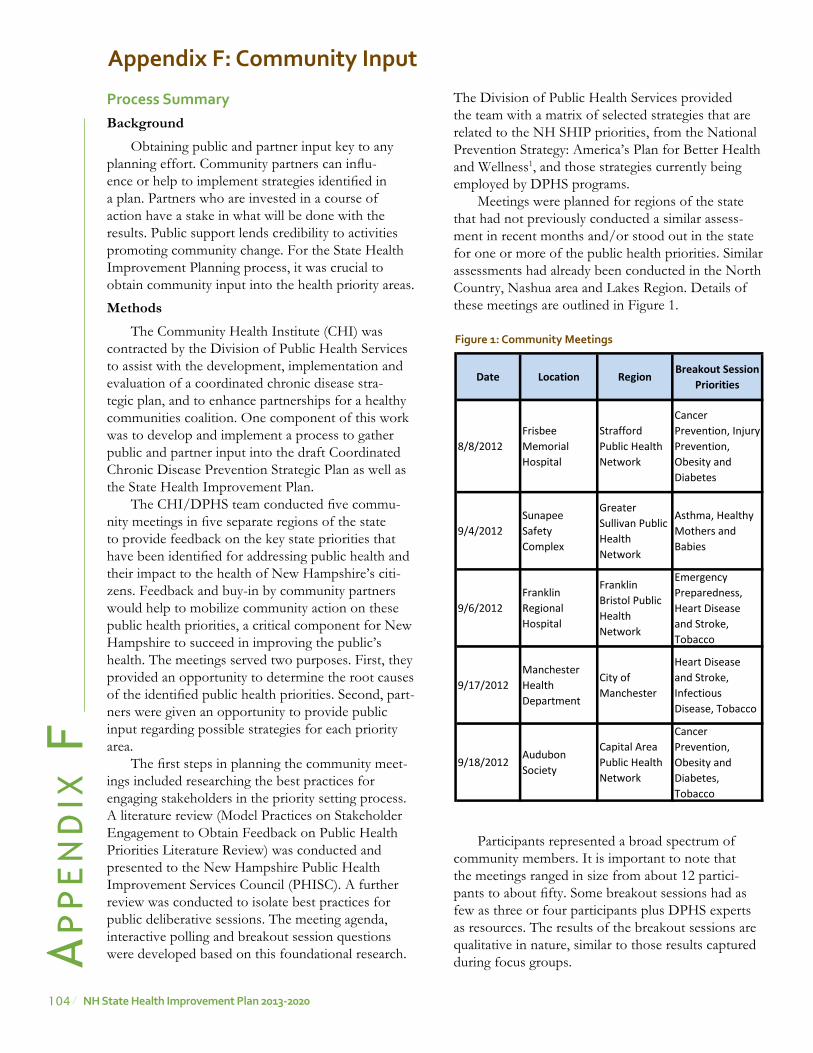
104 NH state Health improvement plan 2013-2020
Ap
pe
nd
ix F
appendix F: Community input
process summaryBackground
Obtaining public and partner input key to any planning effort. Community partners can influ-ence or help to implement strategies identified in a plan. Partners who are invested in a course of action have a stake in what will be done with the results. Public support lends credibility to activities promoting community change. For the State Health Improvement Planning process, it was crucial to obtain community input into the health priority areas.
MethodsThe Community Health Institute (CHI) was
contracted by the Division of Public Health Services to assist with the development, implementation and evaluation of a coordinated chronic disease stra-tegic plan, and to enhance partnerships for a healthy communities coalition. One component of this work was to develop and implement a process to gather public and partner input into the draft Coordinated Chronic Disease Prevention Strategic Plan as well as the State Health Improvement Plan.
The CHI/DPHS team conducted five commu-nity meetings in five separate regions of the state to provide feedback on the key state priorities that have been identified for addressing public health and their impact to the health of New Hampshire’s citi-zens. Feedback and buy-in by community partners would help to mobilize community action on these public health priorities, a critical component for New Hampshire to succeed in improving the public’s health. The meetings served two purposes. First, they provided an opportunity to determine the root causes of the identified public health priorities. Second, part-ners were given an opportunity to provide public input regarding possible strategies for each priority area.
The first steps in planning the community meet-ings included researching the best practices for engaging stakeholders in the priority setting process. A literature review (Model Practices on Stakeholder Engagement to Obtain Feedback on Public Health Priorities Literature Review) was conducted and presented to the New Hampshire Public Health Improvement Services Council (PHISC). A further review was conducted to isolate best practices for public deliberative sessions. The meeting agenda, interactive polling and breakout session questions were developed based on this foundational research.
The Division of Public Health Services provided the team with a matrix of selected strategies that are related to the NH SHIP priorities, from the National Prevention Strategy: America’s Plan for Better Health and Wellness1, and those strategies currently being employed by DPHS programs.
Meetings were planned for regions of the state that had not previously conducted a similar assess-ment in recent months and/or stood out in the state for one or more of the public health priorities. Similar assessments had already been conducted in the North Country, Nashua area and Lakes Region. Details of these meetings are outlined in Figure 1.
Participants represented a broad spectrum of community members. It is important to note that the meetings ranged in size from about 12 partici-pants to about fifty. Some breakout sessions had as few as three or four participants plus DPHS experts as resources. The results of the breakout sessions are qualitative in nature, similar to those results captured during focus groups.
Figure 1: Community meetings
Date Location RegionBreakout Session
Priorities
8/8/2012Frisbee Memorial Hospital
Strafford Public Health Network
Cancer Prevention, Injury Prevention, Obesity and Diabetes
9/4/2012Sunapee Safety Complex
Greater Sullivan Public Health Network
Asthma, Healthy Mothers and Babies
9/6/2012Franklin Regional Hospital
Franklin Bristol Public Health Network
Emergency Preparedness, Heart Disease and Stroke, Tobacco
9/17/2012Manchester Health Department
City of Manchester
Heart Disease and Stroke, Infectious Disease, Tobacco
9/18/2012Audubon Society
Capital Area Public Health Network
Cancer Prevention, Obesity and Diabetes, Tobacco
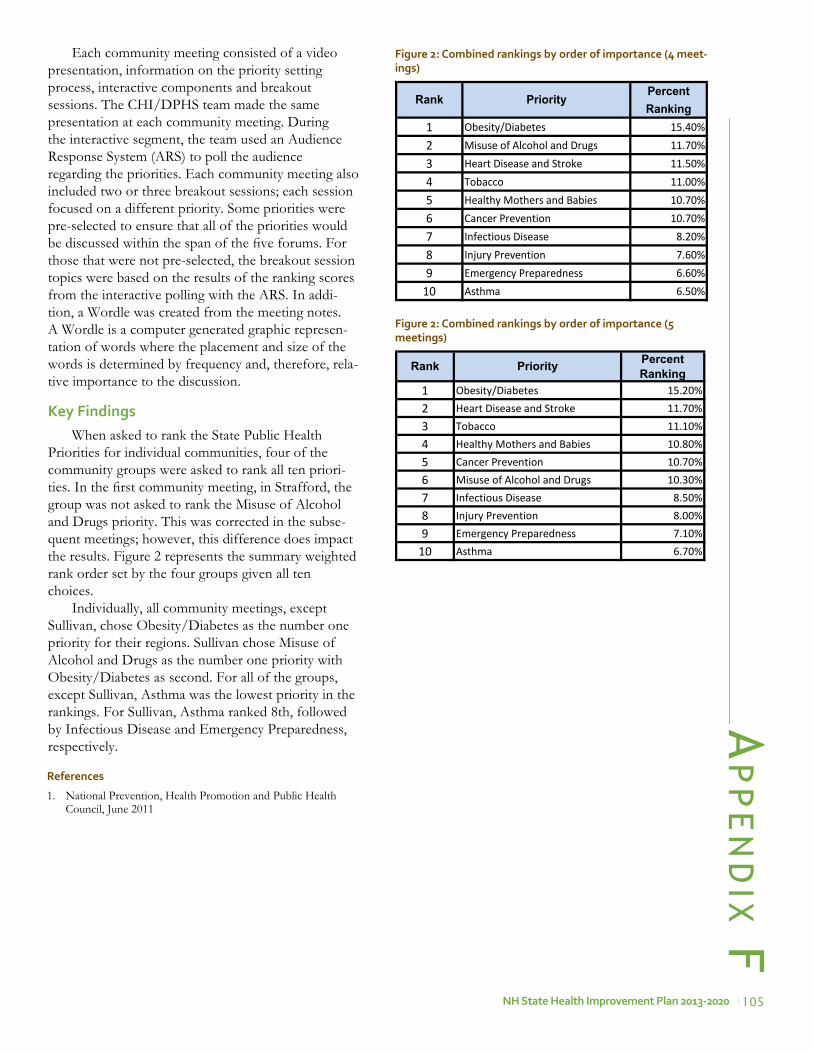
105NH state Health improvement plan 2013-2020
Ap
pe
nd
ix FEach community meeting consisted of a video
presentation, information on the priority setting process, interactive components and breakout sessions. The CHI/DPHS team made the same presentation at each community meeting. During the interactive segment, the team used an Audience Response System (ARS) to poll the audience regarding the priorities. Each community meeting also included two or three breakout sessions; each session focused on a different priority. Some priorities were pre-selected to ensure that all of the priorities would be discussed within the span of the five forums. For those that were not pre-selected, the breakout session topics were based on the results of the ranking scores from the interactive polling with the ARS. In addi-tion, a Wordle was created from the meeting notes. A Wordle is a computer generated graphic represen-tation of words where the placement and size of the words is determined by frequency and, therefore, rela-tive importance to the discussion.
Key FindingsWhen asked to rank the State Public Health
Priorities for individual communities, four of the community groups were asked to rank all ten priori-ties. In the first community meeting, in Strafford, the group was not asked to rank the Misuse of Alcohol and Drugs priority. This was corrected in the subse-quent meetings; however, this difference does impact the results. Figure 2 represents the summary weighted rank order set by the four groups given all ten choices.
Individually, all community meetings, except Sullivan, chose Obesity/Diabetes as the number one priority for their regions. Sullivan chose Misuse of Alcohol and Drugs as the number one priority with Obesity/Diabetes as second. For all of the groups, except Sullivan, Asthma was the lowest priority in the rankings. For Sullivan, Asthma ranked 8th, followed by Infectious Disease and Emergency Preparedness, respectively.
PercentRanking
1 Obesity/Diabetes 15.40%2 Misuse of Alcohol and Drugs 11.70%3 Heart Disease and Stroke 11.50%4 Tobacco 11.00%5 Healthy Mothers and Babies 10.70%6 Cancer Prevention 10.70%7 Infectious Disease 8.20%8 Injury Prevention 7.60%9 Emergency Preparedness 6.60%
10 Asthma 6.50%
Rank Priority
Figure 2: Combined rankings by order of importance (4 meet-ings)
Figure 2: Combined rankings by order of importance (5 meetings)
PercentRanking
1 Obesity/Diabetes 15.20%2 Heart Disease and Stroke 11.70%3 Tobacco 11.10%4 Healthy Mothers and Babies 10.80%5 Cancer Prevention 10.70%6 Misuse of Alcohol and Drugs 10.30%7 Infectious Disease 8.50%8 Injury Prevention 8.00%9 Emergency Preparedness 7.10%
10 Asthma 6.70%
Rank Priority
references
1. National Prevention, Health Promotion and Public Health Council, June 2011
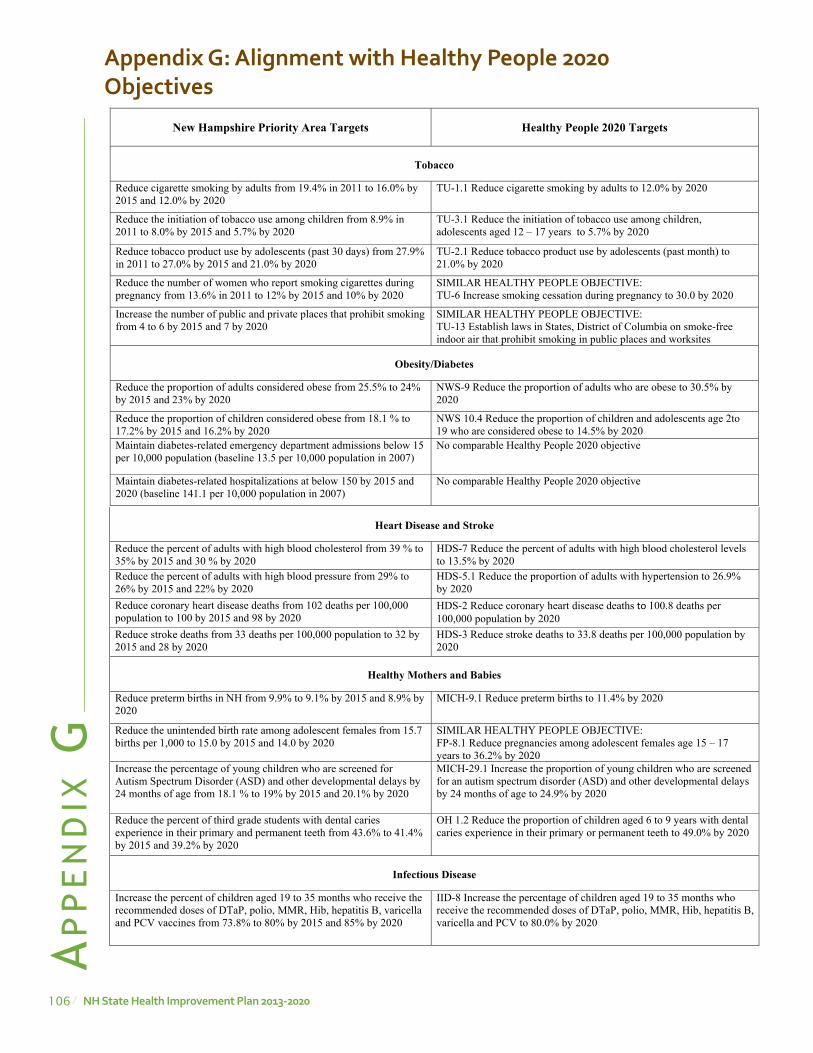
106 NH state Health improvement plan 2013-2020
Ap
pe
nd
ix G
appendix G: alignment with Healthy people 2020 objectives Appendix G: Alignment with Healthy People 2020 Objectives
New Hampshire Priority Area Targets Healthy People 2020 Targets
Tobacco
Reduce cigarette smoking by adults from 19.4% in 2011 to 16.0% by 2015 and 12.0% by 2020
TU-1.1 Reduce cigarette smoking by adults to 12.0% by 2020
Reduce the initiation of tobacco use among children from 8.9% in 2011 to 8.0% by 2015 and 5.7% by 2020
TU-3.1 Reduce the initiation of tobacco use among children, adolescents aged 12 – 17 years to 5.7% by 2020
Reduce tobacco product use by adolescents (past 30 days) from 27.9% in 2011 to 27.0% by 2015 and 21.0% by 2020
TU-2.1 Reduce tobacco product use by adolescents (past month) to 21.0% by 2020
Reduce the number of women who report smoking cigarettes during pregnancy from 13.6% in 2011 to 12% by 2015 and 10% by 2020
SIMILAR HEALTHY PEOPLE OBJECTIVE: TU-6 Increase smoking cessation during pregnancy to 30.0 by 2020
Increase the number of public and private places that prohibit smoking from 4 to 6 by 2015 and 7 by 2020
SIMILAR HEALTHY PEOPLE OBJECTIVE: TU-13 Establish laws in States, District of Columbia on smoke-free indoor air that prohibit smoking in public places and worksites
Obesity/Diabetes
Reduce the proportion of adults considered obese from 25.5% to 24% by 2015 and 23% by 2020
NWS-9 Reduce the proportion of adults who are obese to 30.5% by 2020
Reduce the proportion of children considered obese from 18.1 % to 17.2% by 2015 and 16.2% by 2020
NWS 10.4 Reduce the proportion of children and adolescents age 2to 19 who are considered obese to 14.5% by 2020
Maintain diabetes-related emergency department admissions below 15 per 10,000 population (baseline 13.5 per 10,000 population in 2007)
No comparable Healthy People 2020 objective
Maintain diabetes-related hospitalizations at below 150 by 2015 and 2020 (baseline 141.1 per 10,000 population in 2007)
No comparable Healthy People 2020 objective
Heart Disease and Stroke
Reduce the percent of adults with high blood cholesterol from 39 % to 35% by 2015 and 30 % by 2020
HDS-7 Reduce the percent of adults with high blood cholesterol levels to 13.5% by 2020
Reduce the percent of adults with high blood pressure from 29% to 26% by 2015 and 22% by 2020
HDS-5.1 Reduce the proportion of adults with hypertension to 26.9% by 2020
Reduce coronary heart disease deaths from 102 deaths per 100,000 population to 100 by 2015 and 98 by 2020
HDS-2 Reduce coronary heart disease deaths to 100.8 deaths per 100,000 population by 2020
Reduce stroke deaths from 33 deaths per 100,000 population to 32 by 2015 and 28 by 2020
HDS-3 Reduce stroke deaths to 33.8 deaths per 100,000 population by 2020
Healthy Mothers and Babies
Reduce preterm births in NH from 9.9% to 9.1% by 2015 and 8.9% by 2020
MICH-9.1 Reduce preterm births to 11.4% by 2020
Reduce the unintended birth rate among adolescent females from 15.7 births per 1,000 to 15.0 by 2015 and 14.0 by 2020
SIMILAR HEALTHY PEOPLE OBJECTIVE: FP-8.1 Reduce pregnancies among adolescent females age 15 – 17 years to 36.2% by 2020
Increase the percentage of young children who are screened for Autism Spectrum Disorder (ASD) and other developmental delays by 24 months of age from 18.1 % to 19% by 2015 and 20.1% by 2020
MICH-29.1 Increase the proportion of young children who are screened for an autism spectrum disorder (ASD) and other developmental delays by 24 months of age to 24.9% by 2020
Reduce the percent of third grade students with dental caries experience in their primary and permanent teeth from 43.6% to 41.4% by 2015 and 39.2% by 2020
OH 1.2 Reduce the proportion of children aged 6 to 9 years with dental caries experience in their primary or permanent teeth to 49.0% by 2020
Infectious Disease
Increase the percent of children aged 19 to 35 months who receive the recommended doses of DTaP, polio, MMR, Hib, hepatitis B, varicella and PCV vaccines from 73.8% to 80% by 2015 and 85% by 2020
IID-8 Increase the percentage of children aged 19 to 35 months who receive the recommended doses of DTaP, polio, MMR, Hib, hepatitis B, varicella and PCV to 80.0% by 2020
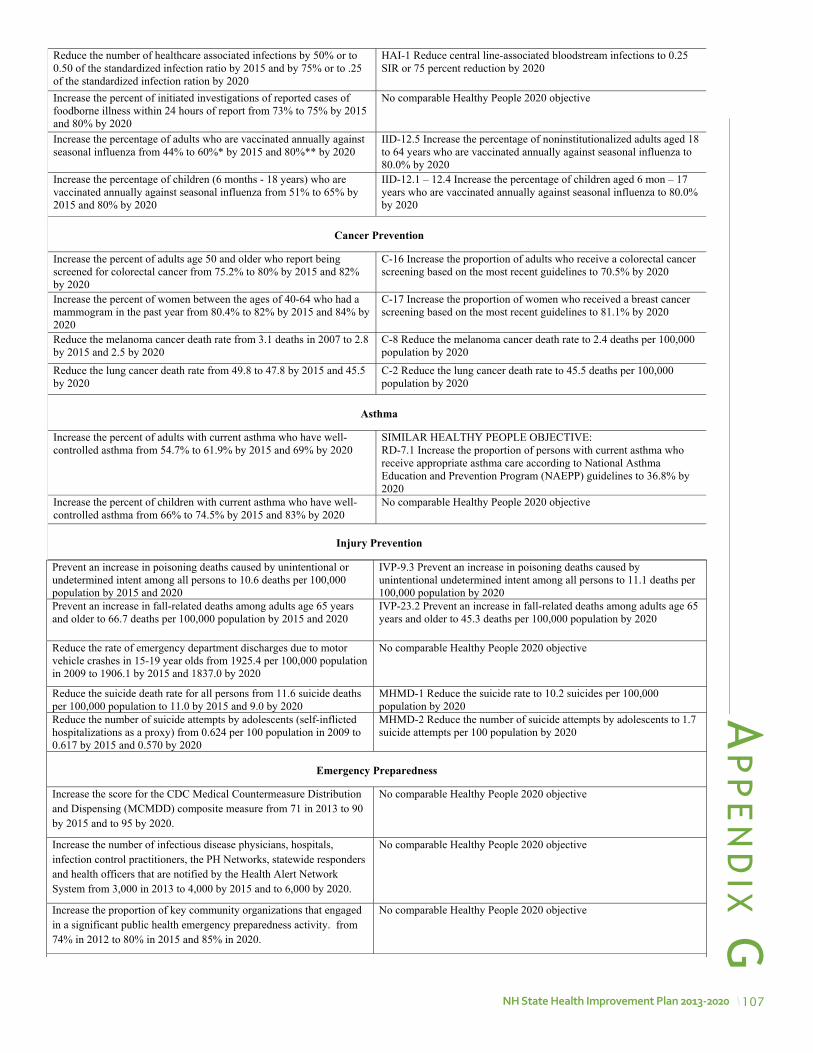
107NH state Health improvement plan 2013-2020
Ap
pe
nd
ix GReduce the number of healthcare associated infections by 50% or to 0.50 of the standardized infection ratio by 2015 and by 75% or to .25 of the standardized infection ration by 2020
HAI-1 Reduce central line-associated bloodstream infections to 0.25 SIR or 75 percent reduction by 2020
Increase the percent of initiated investigations of reported cases of foodborne illness within 24 hours of report from 73% to 75% by 2015 and 80% by 2020
No comparable Healthy People 2020 objective
Increase the percentage of adults who are vaccinated annually against seasonal influenza from 44% to 60%* by 2015 and 80%** by 2020
IID-12.5 Increase the percentage of noninstitutionalized adults aged 18 to 64 years who are vaccinated annually against seasonal influenza to 80.0% by 2020
Increase the percentage of children (6 months - 18 years) who are vaccinated annually against seasonal influenza from 51% to 65% by 2015 and 80% by 2020
IID-12.1 – 12.4 Increase the percentage of children aged 6 mon – 17 years who are vaccinated annually against seasonal influenza to 80.0% by 2020
Cancer Prevention
Increase the percent of adults age 50 and older who report being screened for colorectal cancer from 75.2% to 80% by 2015 and 82% by 2020
C-16 Increase the proportion of adults who receive a colorectal cancer screening based on the most recent guidelines to 70.5% by 2020
Increase the percent of women between the ages of 40-64 who had a mammogram in the past year from 80.4% to 82% by 2015 and 84% by 2020
C-17 Increase the proportion of women who received a breast cancer screening based on the most recent guidelines to 81.1% by 2020
Reduce the melanoma cancer death rate from 3.1 deaths in 2007 to 2.8 by 2015 and 2.5 by 2020
C-8 Reduce the melanoma cancer death rate to 2.4 deaths per 100,000 population by 2020
Reduce the lung cancer death rate from 49.8 to 47.8 by 2015 and 45.5 by 2020
C-2 Reduce the lung cancer death rate to 45.5 deaths per 100,000 population by 2020
Asthma
Increase the percent of adults with current asthma who have well-controlled asthma from 54.7% to 61.9% by 2015 and 69% by 2020
SIMILAR HEALTHY PEOPLE OBJECTIVE: RD-7.1 Increase the proportion of persons with current asthma who receive appropriate asthma care according to National Asthma Education and Prevention Program (NAEPP) guidelines to 36.8% by 2020
Increase the percent of children with current asthma who have well-controlled asthma from 66% to 74.5% by 2015 and 83% by 2020
No comparable Healthy People 2020 objective
Injury Prevention
Prevent an increase in poisoning deaths caused by unintentional or undetermined intent among all persons to 10.6 deaths per 100,000 population by 2015 and 2020
IVP-9.3 Prevent an increase in poisoning deaths caused by unintentional undetermined intent among all persons to 11.1 deaths per 100,000 population by 2020
Prevent an increase in fall-related deaths among adults age 65 years and older to 66.7 deaths per 100,000 population by 2015 and 2020
IVP-23.2 Prevent an increase in fall-related deaths among adults age 65 years and older to 45.3 deaths per 100,000 population by 2020
Reduce the rate of emergency department discharges due to motor vehicle crashes in 15-19 year olds from 1925.4 per 100,000 population in 2009 to 1906.1 by 2015 and 1837.0 by 2020
No comparable Healthy People 2020 objective
Reduce the suicide death rate for all persons from 11.6 suicide deaths per 100,000 population to 11.0 by 2015 and 9.0 by 2020
MHMD-1 Reduce the suicide rate to 10.2 suicides per 100,000 population by 2020
Reduce the number of suicide attempts by adolescents (self-inflicted hospitalizations as a proxy) from 0.624 per 100 population in 2009 to 0.617 by 2015 and 0.570 by 2020
MHMD-2 Reduce the number of suicide attempts by adolescents to 1.7suicide attempts per 100 population by 2020
Emergency Preparedness
Increase the score for the CDC Medical Countermeasure Distribution and Dispensing (MCMDD) composite measure from 71 in 2013 to 90 by 2015 and to 95 by 2020.
No comparable Healthy People 2020 objective
Increase the number of infectious disease physicians, hospitals, infection control practitioners, the PH Networks, statewide responders and health officers that are notified by the Health Alert Network System from 3,000 in 2013 to 4,000 by 2015 and to 6,000 by 2020.
No comparable Healthy People 2020 objective
Increase the proportion of key community organizations that engaged in a significant public health emergency preparedness activity. from 74% in 2012 to 80% in 2015 and 85% in 2020.
No comparable Healthy People 2020 objective
Misuse of Alcohol and Drugs
Reduce binge drinking in the youth population from 24% to 20% by 2017
SA-14.4 Reduce the proportion of persons engaging in binge drinking during the past 30 days adolescents aged 12 to 17 years to 24.4% by 2020
Reduce the proportion of adolescents reporting use of marijuana during the past 30 days from over 28% to 24% by 2017
SA13.2 Reduce the proportion of adolescents reporting use of marijuana during the past 30 days to 6.0% by 2020
Reduce the percentage of NH individuals age 12 and older who report SA19.1 Reduce the past year non-medical use of pain relievers
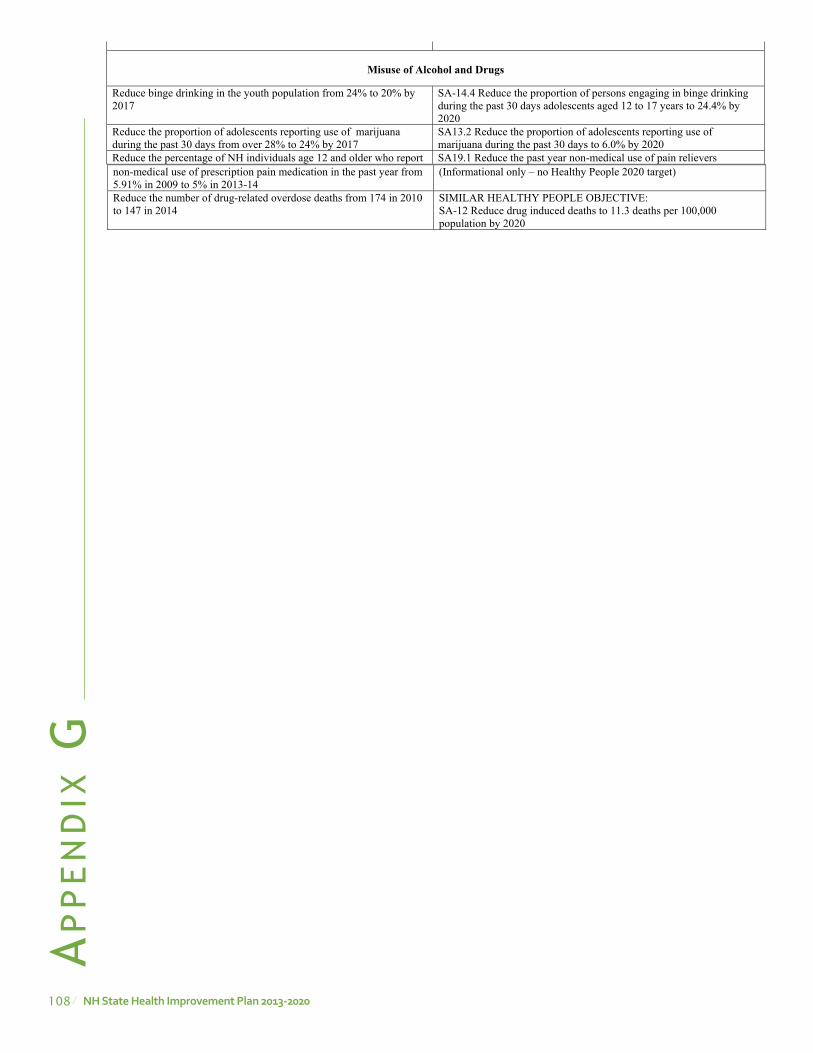
108 NH state Health improvement plan 2013-2020
Ap
pe
nd
ix G
non-medical use of prescription pain medication in the past year from 5.91% in 2009 to 5% in 2013-14
(Informational only – no Healthy People 2020 target)
Reduce the number of drug-related overdose deaths from 174 in 2010 to 147 in 2014
SIMILAR HEALTHY PEOPLE OBJECTIVE: SA-12 Reduce drug induced deaths to 11.3 deaths per 100,000 population by 2020
Prevent an increase in poisoning deaths caused by unintentional or undetermined intent among all persons to 10.6 deaths per 100,000 population by 2015 and 2020
IVP-9.3 Prevent an increase in poisoning deaths caused by unintentional undetermined intent among all persons to 11.1 deaths per 100,000 population by 2020
Prevent an increase in fall-related deaths among adults age 65 years and older to 66.7 deaths per 100,000 population by 2015 and 2020
IVP-23.2 Prevent an increase in fall-related deaths among adults age 65 years and older to 45.3 deaths per 100,000 population by 2020
Reduce the rate of emergency department discharges due to motor vehicle crashes in 15-19 year olds from 1925.4 per 100,000 population in 2009 to 1906.1 by 2015 and 1837.0 by 2020
No comparable Healthy People 2020 objective
Reduce the suicide death rate for all persons from 11.6 suicide deaths per 100,000 population to 11.0 by 2015 and 9.0 by 2020
MHMD-1 Reduce the suicide rate to 10.2 suicides per 100,000 population by 2020
Reduce the number of suicide attempts by adolescents (self-inflicted hospitalizations as a proxy) from 0.624 per 100 population in 2009 to 0.617 by 2015 and 0.570 by 2020
MHMD-2 Reduce the number of suicide attempts by adolescents to 1.7suicide attempts per 100 population by 2020
Emergency Preparedness
Increase the score for the CDC Medical Countermeasure Distribution and Dispensing (MCMDD) composite measure from 71 in 2013 to 90 by 2015 and to 95 by 2020.
No comparable Healthy People 2020 objective
Increase the number of infectious disease physicians, hospitals, infection control practitioners, the PH Networks, statewide responders and health officers that are notified by the Health Alert Network System from 3,000 in 2013 to 4,000 by 2015 and to 6,000 by 2020.
No comparable Healthy People 2020 objective
Increase the proportion of key community organizations that engaged in a significant public health emergency preparedness activity. from 74% in 2012 to 80% in 2015 and 85% in 2020.
No comparable Healthy People 2020 objective
Misuse of Alcohol and Drugs
Reduce binge drinking in the youth population from 24% to 20% by 2017
SA-14.4 Reduce the proportion of persons engaging in binge drinking during the past 30 days adolescents aged 12 to 17 years to 24.4% by 2020
Reduce the proportion of adolescents reporting use of marijuana during the past 30 days from over 28% to 24% by 2017
SA13.2 Reduce the proportion of adolescents reporting use of marijuana during the past 30 days to 6.0% by 2020
Reduce the percentage of NH individuals age 12 and older who report SA19.1 Reduce the past year non-medical use of pain relievers
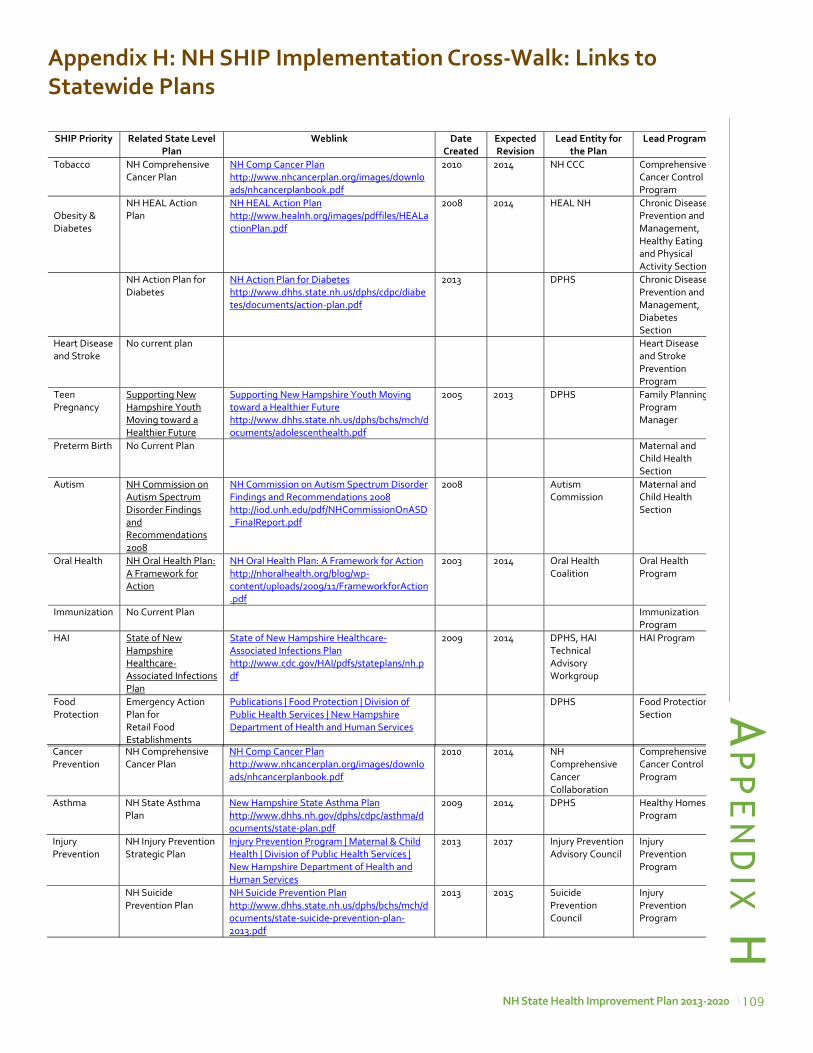
109NH state Health improvement plan 2013-2020
Ap
pe
nd
ix Happendix H: NH sHip implementation Cross-walk: links to statewide plans
SHIP Priority Related State Level Plan
Weblink Date Created
Expected Revision
Lead Entity for the Plan
Lead Program
Tobacco
NH Comprehensive Cancer Plan
NH Comp Cancer Plan http://www.nhcancerplan.org/images/downloads/nhcancerplanbook.pdf
2010 2014 NH CCC Comprehensive Cancer Control Program
Obesity & Diabetes
NH HEAL Action Plan
NH HEAL Action Plan http://www.healnh.org/images/pdffiles/HEALactionPlan.pdf
2008 2014 HEAL NH Chronic Disease Prevention and Management, Healthy Eating and Physical Activity Section
NH Action Plan for Diabetes
NH Action Plan for Diabetes http://www.dhhs.state.nh.us/dphs/cdpc/diabetes/documents/action‐plan.pdf
2013 DPHS Chronic Disease Prevention and Management, Diabetes Section
Heart Disease and Stroke
No current plan Heart Disease and Stroke Prevention Program
Teen Pregnancy
Supporting New Hampshire Youth Moving toward a Healthier Future
Supporting New Hampshire Youth Moving toward a Healthier Future http://www.dhhs.state.nh.us/dphs/bchs/mch/documents/adolescenthealth.pdf
2005 2013 DPHS Family Planning Program Manager
Preterm Birth
No Current Plan Maternal and Child Health Section
Autism
NH Commission on Autism Spectrum Disorder Findings and Recommendations 2008
NH Commission on Autism Spectrum Disorder Findings and Recommendations 2008 http://iod.unh.edu/pdf/NHCommissionOnASD_FinalReport.pdf
2008 Autism Commission
Maternal and Child Health Section
Oral Health
NH Oral Health Plan: A Framework for Action
NH Oral Health Plan: A Framework for Action http://nhoralhealth.org/blog/wp‐content/uploads/2009/11/FrameworkforAction.pdf
2003 2014 Oral Health Coalition
Oral Health Program
Immunization No Current Plan Immunization Program
HAI
State of New Hampshire Healthcare‐Associated Infections Plan
State of New Hampshire Healthcare‐Associated Infections Plan http://www.cdc.gov/HAI/pdfs/stateplans/nh.pdf
2009 2014 DPHS, HAI Technical Advisory Workgroup
HAI Program
Food Protection
Emergency Action Plan for Retail Food Establishments
Publications | Food Protection | Division of Public Health Services | New Hampshire Department of Health and Human Services
DPHS Food Protection Section
Cancer Prevention
NH Comprehensive Cancer Plan
NH Comp Cancer Plan http://www.nhcancerplan.org/images/downloads/nhcancerplanbook.pdf
2010 2014 NH Comprehensive Cancer Collaboration
Comprehensive Cancer Control Program
Asthma NH State Asthma Plan
New Hampshire State Asthma Plan http://www.dhhs.nh.gov/dphs/cdpc/asthma/documents/state‐plan.pdf
2009 2014 DPHS Healthy Homes Program
Injury Prevention
NH Injury Prevention Strategic Plan
Injury Prevention Program | Maternal & Child Health | Division of Public Health Services | New Hampshire Department of Health and Human Services
2013 2017 Injury Prevention Advisory Council
Injury Prevention Program
NH Suicide Prevention Plan
NH Suicide Prevention Plan http://www.dhhs.state.nh.us/dphs/bchs/mch/documents/state‐suicide‐prevention‐plan‐2013.pdf
2013 2015 Suicide Prevention Council
Injury Prevention Program
NH Strategic Highway Safety Plan
New Hampshire Strategic Highway Safety Plan http://www.google.com/url?sa=t&rct=j&q=&esrc=s&frm=1&source=web&cd=4&ved=0CDUQFjAD&url=http%3A%2F%2Fwww.nhdtz.com%2Fnews‐events%2Fdownload%2Finformation%2F21&ei=L0QzUvX8H‐HA4AOo0ICABA&usg=AFQjCNHlV3oFfh146Ky2dJn8DgpDpr5rXg
2013
2015 Department of Transportation, Driving Towards Zero Coalition
Injury Prevention Program
Substance Misuse
Collective Action/Collective Impact
Collective Action/ Collective Impact http://www.dhhs.state.nh.us/dcbcs/bdas/documents/collectiveaction.PDF
2013 2018 Governor's Commission, Bureau of Drug and Alcohol Services
DHHS Prevention Services, Bureau of Drug and Alcohol Services
Emergency Preparedness
Public Health Emergency Preparedness and Response Plan
Division of Public Health Services | New Hampshire Department of Health and Human Services
2008 Advisory Council on Emergency Preparedness and Security Advisory Board Subcommittee
Community Health Development Section, Bureau of Infectious Disease Control
Coordinated Chronic Disease
Coordinated Chronic Disease Strategic Plan http://www.dhhs.nh.gov/dphs/cdpc/index.htm
2013
Behavioral Health
Addressing the Critical Mental Health Needs of NH’s Citizens A Strategy for Restoration
http://www.dhhs.state.nh.us/dcbcs/bbh/documents/restoration.pdf
NH DHHS, NH Hospital, Bureau of Behavioral Health, the Community Behavioral Health Association
Bureau of Behavioral Health
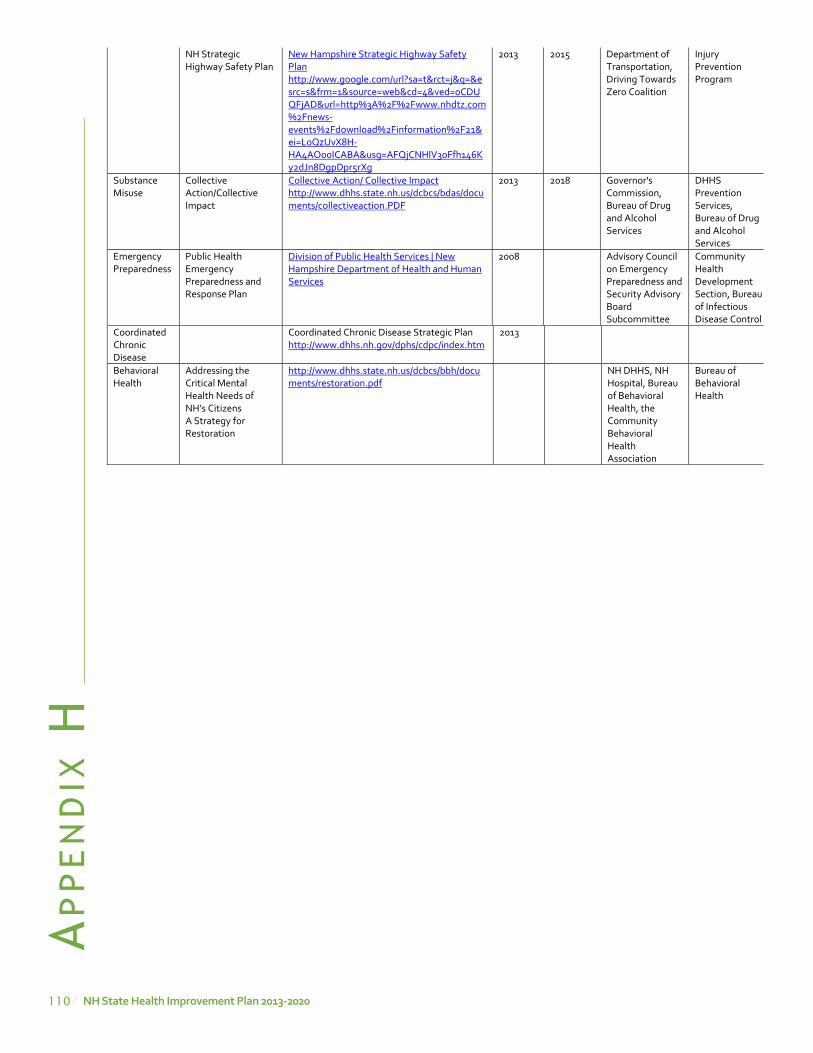
110 NH state Health improvement plan 2013-2020
Ap
pe
nd
ix H
Cancer Prevention
NH Comprehensive Cancer Plan
NH Comp Cancer Plan http://www.nhcancerplan.org/images/downloads/nhcancerplanbook.pdf
2010 2014 NH Comprehensive Cancer Collaboration
Comprehensive Cancer Control Program
Asthma NH State Asthma Plan
New Hampshire State Asthma Plan http://www.dhhs.nh.gov/dphs/cdpc/asthma/documents/state‐plan.pdf
2009 2014 DPHS Healthy Homes Program
Injury Prevention
NH Injury Prevention Strategic Plan
Injury Prevention Program | Maternal & Child Health | Division of Public Health Services | New Hampshire Department of Health and Human Services
2013 2017 Injury Prevention Advisory Council
Injury Prevention Program
NH Suicide Prevention Plan
NH Suicide Prevention Plan http://www.dhhs.state.nh.us/dphs/bchs/mch/documents/state‐suicide‐prevention‐plan‐2013.pdf
2013 2015 Suicide Prevention Council
Injury Prevention Program
NH Strategic Highway Safety Plan
New Hampshire Strategic Highway Safety Plan http://www.google.com/url?sa=t&rct=j&q=&esrc=s&frm=1&source=web&cd=4&ved=0CDUQFjAD&url=http%3A%2F%2Fwww.nhdtz.com%2Fnews‐events%2Fdownload%2Finformation%2F21&ei=L0QzUvX8H‐HA4AOo0ICABA&usg=AFQjCNHlV3oFfh146Ky2dJn8DgpDpr5rXg
2013
2015 Department of Transportation, Driving Towards Zero Coalition
Injury Prevention Program
Substance Misuse
Collective Action/Collective Impact
Collective Action/ Collective Impact http://www.dhhs.state.nh.us/dcbcs/bdas/documents/collectiveaction.PDF
2013 2018 Governor's Commission, Bureau of Drug and Alcohol Services
DHHS Prevention Services, Bureau of Drug and Alcohol Services
Emergency Preparedness
Public Health Emergency Preparedness and Response Plan
Division of Public Health Services | New Hampshire Department of Health and Human Services
2008 Advisory Council on Emergency Preparedness and Security Advisory Board Subcommittee
Community Health Development Section, Bureau of Infectious Disease Control
Coordinated Chronic Disease
Coordinated Chronic Disease Strategic Plan http://www.dhhs.nh.gov/dphs/cdpc/index.htm
2013
Behavioral Health
Addressing the Critical Mental Health Needs of NH’s Citizens A Strategy for Restoration
http://www.dhhs.state.nh.us/dcbcs/bbh/documents/restoration.pdf
NH DHHS, NH Hospital, Bureau of Behavioral Health, the Community Behavioral Health Association
Bureau of Behavioral Health
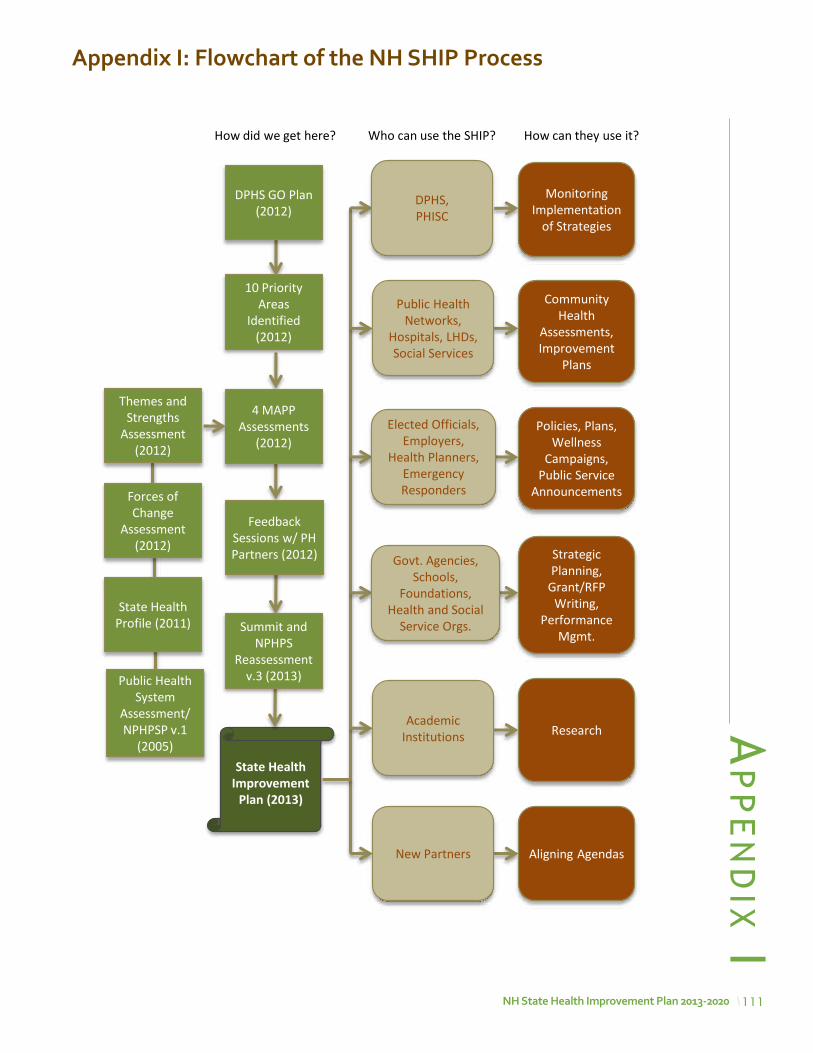
111NH state Health improvement plan 2013-2020
Ap
pe
nd
ix iappendix i: Flowchart of the NH sHip process
State Health Improvement
Plan (2013)
Monitoring Implementation
of Strategies
Community Health
Assessments, Improvement
Plans
Policies, Plans, Wellness
Campaigns, Public Service
Announcements
Strategic Planning,
Grant/RFP Writing,
Performance Mgmt.
Research
Aligning Agendas
4 MAPP Assessments
(2012)
10 Priority Areas
Identified (2012)
Who can use the SHIP? How can they use it? How did we get here?
Feedback Sessions w/ PH Partners (2012)
DPHS GO Plan (2012)
State Health Profile (2011)
Public Health System
Assessment/ NPHPSP v.1
(2005)
Themes and Strengths
Assessment (2012)
Forces of Change
Assessment (2012)
Summit and NPHPS
Reassessment v.3 (2013)
Academic Institutions
New Partners
Public Health Networks,
Hospitals, LHDs, Social Services
DPHS, PHISC
Elected Officials, Employers,
Health Planners, Emergency Responders
Govt. Agencies, Schools,
Foundations, Health and Social
Service Orgs.


2013-2020 state Health improvement planNH Department of Health and Human services
Division of public Health services29 Hazen Drive
Concord, NH 03301
www.dhhs.nh.gov/dphs/index.htm
published october 2013
Copyright © 2022 FDOKUMEN