Neutrophil transcriptional profile changes during transit from bone marrow to sites of inflammation
15
RESEARCH ARTICLE Neutrophil transcriptional profile changes during transit from bone marrow to sites of inflammation Flavia S Lakschevitz 1,2 , Michelle B Visser 2,3 , Chunxiang Sun 2 and Michael Glogauer ; 1,2 It has recently been established that neutrophils, the most abundant leukocytes, are capable of changes in gene expression during inflammatory responses. However, changes in the transcriptome as the neutrophil leaves the bone marrow have yet to be described. We hypothesized that neutrophils are transcriptionally active cells that alter their gene expression profiles as they migrate into the vasculature and then into inflamed tissues. Our goal was to provide an overview of how the neutrophil’s transcriptomechangesas they migrate through different compartments using microarray and bio-informatic approaches. Our study demonstrates that neutrophils are highly plastic cells where normal environmental cues result in a site-specific neutrophil transcriptome. We demonstrate that neutrophil genes undergo one of four distinct expression change patterns as they move from bone marrow through the circulation to sites of inflammation: (i) continuously increasing; (ii) continuously decreasing; (iii) a down-up-down; and (iv) an up-down-up pattern. Additionally, we demonstrate that the neutrophil migration signaling network and the balance between anti-apoptotic and pro-apoptotic signaling are two of the main regulatory mechanisms that change as the neutrophil transits through compartments. Cellular & Molecular Immunology advance online publication, 00 Month 2014; doi:10.1038/cmi.2014.37 Keywords: fMLP signaling pathway; microarray; neutrophil; transcriptome INTRODUCTION As the main cellular component of the innate immune system, neutrophils are responsible for responding to bacterial infec- tions. They are rapidly recruited to sites of infection where they eliminate bacteria through both reactive oxygen dependent and independent mechanisms. 1 Their removal from the inflammat- ory site alongside elimination of deleterious stimulus is indis- pensable for maintaining host health. 1,2 It has been established that neutrophils are capable of changes in gene expression dur- ing inflammatory responses. 3 Subrahmanyam demonstrated that while neutrophils synthesize lower levels of protein and RNA, they are able to markedly change their gene expression following bacterial exposure. 4 The concept that neutrophils are static quiescent cells that merely kill bacteria has been replaced by the idea that neutrophils play a more active role in the host response. For example, activated neutrophils are able to secrete a variety of cytokines, 5 act as antigen-presenting cells expressing MHC Class II, 6 allow activation of T cells 7 and play an active regulatory role in angiogenesis 8 and tumoural fate. 9 Neutrophils undergo spontaneous apoptosis in order to maintain homeostasis, but also to regulate efficient resolution of inflammation. 2,10,11 Impaired clearance as well as delays in apoptotic events is critical to the progression of chronic inflam- mation. 3,12,13 A complex signaling interaction regulates neu- trophil apoptosis and is initiated by two distinct pathways: the extrinsic pathway (death receptor pathway) and the intrinsic pathway (mitochondria pathway), where both pathways lead to activation of the characteristic caspase cascade 4,10 It is very likely that tight regulation of neutrophil apoptosis at different locations is a key feature of normal neutrophil function. To investigate gene expression profiles in the mouse neutro- phil, as they leave the bone marrow (BM), enter the circulation, and finally arrive in the site of inflammation, we used three approaches: first using microarrays we identified differences in the gene expression profile of neutrophils as they transit through different compartments. Secondly, using a bioinfor- matics approach, we examined whether the differences in gene expression are associated with specific pathways. Finally, we Cellular & Molecular Immunology cmi201437.3d 16/5/14 20:45:14 1 Department of Periodontology, Faculty of Dentistry, University of Toronto, Toronto, Ont., Canada; 2 Matrix Dynamics Group, Faculty of Dentistry, University of Toronto, Toronto, Ont., Canada and 3 Current address: Department of Oral Biology, School of Dental Medicine, University at Buffalo, The State University of New York, Buffalo, NY, USA Correspondence: Dr. M Glogauer, Faculty of Dentistry, University of Toronto, Room 221 Fitzgerald Building, 150 College Street, Toronto, Ont. M5S 3E2, Canada. E-mail: [email protected] Received: 17 October 2013; Revised: 2 May 2014; Accepted: 2 May 2014 Cellular & Molecular Immunology (2014), 1–13 ß 2014 CSI and USTC. All rights reserved 1672-7681/14 $32.00 www.nature.com/cmi
Transcript of Neutrophil transcriptional profile changes during transit from bone marrow to sites of inflammation
RESEARCH ARTICLE
Neutrophil transcriptional profile changes during transitfrom bone marrow to sites of inflammation
Flavia S Lakschevitz1,2, Michelle B Visser2,3, Chunxiang Sun2 and Michael Glogauer;1,2
It has recently been established that neutrophils, the most abundant leukocytes, are capable of changes in gene
expression during inflammatory responses. However, changes in the transcriptome as the neutrophil leaves the bone
marrow have yet to be described. We hypothesized that neutrophils are transcriptionally active cells that alter their gene
expression profiles as they migrate into the vasculature and then into inflamed tissues. Our goal was to provide an
overview of how the neutrophil’s transcriptomechangesas they migrate through different compartments using microarray
and bio-informatic approaches. Our study demonstrates that neutrophils are highly plastic cells where normal
environmental cues result in a site-specific neutrophil transcriptome. We demonstrate that neutrophil genes undergo one
of four distinct expression change patterns as they move from bone marrow through the circulation to sites of
inflammation: (i) continuously increasing; (ii) continuously decreasing; (iii) a down-up-down; and (iv) an up-down-up
pattern. Additionally, we demonstrate that the neutrophil migration signaling network and the balance between
anti-apoptotic and pro-apoptotic signaling are two of the main regulatory mechanisms that change as the neutrophil
transits through compartments.
Cellular & Molecular Immunology advance online publication, 00 Month 2014; doi:10.1038/cmi.2014.37
Keywords: fMLP signaling pathway; microarray; neutrophil; transcriptome
INTRODUCTION
As the main cellular component of the innate immune system,
neutrophils are responsible for responding to bacterial infec-
tions. They are rapidly recruited to sites of infection where they
eliminate bacteria through both reactive oxygen dependent and
independent mechanisms.1 Their removal from the inflammat-
ory site alongside elimination of deleterious stimulus is indis-
pensable for maintaining host health.1,2 It has been established
that neutrophils are capable of changes in gene expression dur-
ing inflammatory responses.3 Subrahmanyam demonstrated
that while neutrophils synthesize lower levels of protein and
RNA, they are able to markedly change their gene expression
following bacterial exposure.4 The concept that neutrophils are
static quiescent cells that merely kill bacteria has been replaced
by the idea that neutrophils play a more active role in the host
response. For example, activated neutrophils are able to secrete
a variety of cytokines,5 act as antigen-presenting cells expressing
MHC Class II,6 allow activation of T cells7 and play an active
regulatory role in angiogenesis8 and tumoural fate.9
Neutrophils undergo spontaneous apoptosis in order to
maintain homeostasis, but also to regulate efficient resolution
of inflammation.2,10,11 Impaired clearance as well as delays in
apoptotic events is critical to the progression of chronic inflam-
mation.3,12,13 A complex signaling interaction regulates neu-
trophil apoptosis and is initiated by two distinct pathways: the
extrinsic pathway (death receptor pathway) and the intrinsic
pathway (mitochondria pathway), where both pathways lead
to activation of the characteristic caspase cascade4,10 It is very
likely that tight regulation of neutrophil apoptosis at different
locations is a key feature of normal neutrophil function.
To investigate gene expression profiles in the mouse neutro-
phil, as they leave the bone marrow (BM), enter the circulation,
and finally arrive in the site of inflammation, we used three
approaches: first using microarrays we identified differences
in the gene expression profile of neutrophils as they transit
through different compartments. Secondly, using a bioinfor-
matics approach, we examined whether the differences in gene
expression are associated with specific pathways. Finally, we
Cellular & Molecular Immunology cmi201437.3d 16/5/14 20:45:14
1Department of Periodontology, Faculty of Dentistry, University of Toronto, Toronto, Ont., Canada; 2Matrix Dynamics Group, Faculty of Dentistry, Universityof Toronto, Toronto, Ont., Canada and 3Current address: Department of Oral Biology, School of Dental Medicine, University at Buffalo, The State University ofNew York, Buffalo, NY, USACorrespondence: Dr. M Glogauer, Faculty of Dentistry, University of Toronto, Room 221 Fitzgerald Building, 150 College Street, Toronto, Ont. M5S 3E2,Canada.E-mail: [email protected]: 17 October 2013; Revised: 2 May 2014; Accepted: 2 May 2014
Cellular & Molecular Immunology (2014), 1–13� 2014 CSI and USTC. All rights reserved 1672-7681/14 $32.00
www.nature.com/cmi
sought to investigate if these different gene expression profiles
result in differences in the neutrophil phenotype. Using a
combination of transcriptomic, bio5informatic and func-
tional approaches, we highlight the importance of altered gene
expression in the apoptosis pathway and N-formyl-Met-Leu-
Phe (fMLP) receptor pathways as the neutrophil migrates from
storage compartments into inflamed sites.
MATERIAL AND METHODS
Mice
Experiments were carried out in accordance with the Guide for the
Humane Use and Care of Laboratory Animals and were approved
by the University of Toronto Animal Care Committee (protocol #
20009597). C57BL/6 male mice (Charles River< ), 8–12 weeks of age,
were housed in the animal facility at the University of Toronto,
and fed mouse chow and water ad libitum.
Neutrophil isolation
We sought to identify the best neutrophil isolation method for
each compartment in mice that would result in adequate yield,
viability and purity. With that in mind, we tested different
methods for each of the three compartments: For isolation of
PMN-BM and PMN-B we used Percoll gradient separation14 or
immunomagnetic separation.15Additionally, for PMN-B we
used the FACS-sorted samples, while peritoneal exudate (PE)
PMN were collected with or without Percoll purification as
detailed below.
Preparation of BM PMN (PMN-BM)
Percoll gradient separation was performed as previously
described. In brief, BM cells were resuspended14 in 4 ml of a-
MEM and overlaid on Percoll gradients (82%/65%/55%). After
centrifugation (2500 r.p.m., 4 uC, 30 min) the lower band was
collected and washed with PBS. Erythrocytes were eliminated
by addition of 5 ml of Pharm Lysis buffer (BD Biosciences,
Mississauga, ON, Canada) followed by centrifugation
(2500 r.p.m., 4 uC, 5 min) as per manufacturer’s instructions.
Immunomagnetic negative selection using a Mouse Neutrophil
Enrichment Kit (Stemcell Technology, Vancouver, BC,
Canada) was also performed following the manufacturer’s
instructions, on either the whole BM cell or cell populations
following Percoll gradient separation. Sample purity was con-
firmed by flow cytometry. Neutrophils were identified based on
the following gating strategy: FSC vs. SSC, then Singlet1, fol-
lowed by eFluor 5062 and CD11b1Ly6G1. Flow cytometry
gating was performed based on fluorescence-minus one con-
trols (Supplementary Figures 1 and 2). Viability was confirmed
using eFluor 506 (eBioscience, San Diego, CA, USA), which
stains necrotic cells, during flow cytometric analysis and/ortry-
pan blue exclusion test. Following gradient separation alone, a
yield of 93106 cells/mouse with a purity of 85%63% and
95%65% viability. Negative selection from BM cell resulted
in purity similar to the Percoll gradient alone (80%65%) while
negative selection following Percoll resulted in the highest pur-
ity (98%62%) (Table 1). However, it produced a very low cell
yield (1623106 cells/mouse), which is in accordance with the
literature.15 For microarray analysis and functional assays, we
used the Percoll method alone for neutrophil isolation. For
Quantitative real-time PCR (qRT-PCR) analysis and western
blot analysis, Percoll gradient followed by additional purifica-
tion using immunomagnetic negative selection was performed.
Preparation of blood PMN
Methods similar to those for PMN-BM were performed for
isolation of blood neutrophils (PMN-B). Blood from twelve
mice were pooled to obtain appropriate numbers of cells.
Mice were anesthetized by intraperitoneal injection of keta-
mine (Ketaset 125 mg/kg) and xylazine (10 mg/kg). Blood
(1 ml) was collected by cardiac puncture using a sodium citrate
coated syringe and transferred to a 15 ml falcon tube with 100ml
of sodium citrate. Erythrocyte lysis was immediately performed
by addition of 5 ml of Pharm Lysis buffer (BD Biosciences) as
described above. The cell pellet was resuspended in 2 ml of a-
MEM and laid on the top of a three-layer Percoll gradient, as
described for PMN-BM isolation. Following gradient separa-
tion, a yield of 0.53106 cells/mouse with purity of 85% and
viability of 95% was obtained. Purity and viability was assessed
as described for PMN-BM. Additionally, we used flow cyto-
metric analysis to sort cells based on expression of Ly6G (1A8).
Gating was performed based on fluorescence-minus one con-
trols. Neutrophils were identified based on the following gating
strategy: FSC vs. SSC, then Singlet1, followed by eFluor 5062
and CD11b1Ly6G1. Cells were kept on ice during all proce-
dures. For microarray analysis and functional assays, we used
Percoll separation alone for neutrophil isolation. For qRT-PCR
analysis and western blot analysis, FACS-sorted and Percoll
gradient separation with and without an additional purification
by negative selection, was performed as described for PMN-
BM. After immunomagnetic separation, a yield of 0.33106
cells/mouse with purity of 98% and viability of .95% was
Cellular & Molecular Immunology cmi201437.3d 16/5/14 20:45:16
Table 1 Neutrophil isolation and purity (%6s.d.)
Compartment (%)
BM Blood PE
Isolation method Percoll only 85.263.6 84.763.6 95.961.7
Percoll1negative selection 97.662.1 98.264.4 n/a
Negative selection only 80.165.1 73.968.6 93.764.1
FACS 93.965.2 94.462.2 92.063.7
Abbreviations: BM, bone marrow; PE, peritoneal exudate.
Neutrophil gene expression profiles changes
FS Lakschevitz et al
2
Cellular & Molecular Immunology
obtained. For FACS-sorted cells, we obtain a yield of 0.13106
cells/mouse with purity of 94% and viability of .95%.
Preparation of PE PMN
Inflammation was induced by injecting 1 ml of 5 mM sodium
periodate (Sigma, Oakville, ON, Canada) solution into the
peritoneal cavity of the mouse. Similar to thioglycollate,
sodium periodate induces cell death in the peritoneum which
is the triggering event for neutrophil recruitment, which is
highly relevant for neutrophil recruitment in diseases with
underlying endogenously triggered inflammation including
myocardial infarction, atherosclerosis, type 2 diabetes mellitus
and some autoimmune diseases.16,17 PE cells were harvested 3 h
after injection by two lavages of the peritoneal cavity with 5 ml
of cold PBS (Sigma). Collected cells were then washed by cent-
rifugation (2500 r.p.m., 5 min, 4 uC), followed by erythrocyte
lysis with Pharm Lysis buffer (BD Biosciences). Additional
purification was performed by resuspending collected cells in
100% Percoll solution and ultracentrifugation (23 000 r.p.m.,
20 min, 4 uC). PMN were collected from the lower opaque layer
and washed twice by adding 10 ml of PBS then centrifuged at
2500 r.p.m. for 5 min at 4 uC. Purity and viability was assessed
as described above. Sodium periodate injection into peritoneal
cavity gave a yield of 13106 cells/mouse with PMN purity of
95% and viability .95%. For neutrophil chemotaxis and apop-
tosis assays, we collected peritoneal cells without further puri-
fication. Microarray and qRT-PCR analysis was performed
with cells isolated with Percoll purification. All the other
experiments were carried out as described. For some experi-
ments, purification was performing using negative selection as
described for PMN-BM.
RNA isolation from purified PMN
Neutrophils (1.03107 cells) from BM, PE and blood from sepa-
rate pools of up to 12 C57BL/6 male mice were immediately
prepared for RNA isolation, to avoid degradation, with MirVana
kit (Ambion, Austin, TX, USA) as described by the manufac-
turer. RNAse free techniques were utilized during all procedures
with surface and equipment decontamination by a surface
decontamination solution (RNAse Zap solution; Ambion).
Genomic DNA was eliminated by RNase-free DNase I digestion
(Qiagen, Mississauga, ON, Canada) during the isolation proced-
ure. Isolated total RNA was stored at 280 uC and later analyzed
on an Agilent 2100 bioanalyzer using a RNA 6000 picolabchip
kit (Agilent Technologies, Santa Clara, CA, USA) to certify that
all samples are with minimal degradation as possible. Isolated
RNA presenting RIN above 8 was selected for further analysis.18
Microarray analysis
Total RNA was measured for gene expression by microarray
using the Illumina Mouse-6 v2 Expression BeadChip (48 000
gene transcripts) at the Centre for Applied Genomics (Sick
Kids Hospital, Toronto, ON, Canada), and all experiments
were performed in triplicate.
Raw mouse microarray data were analyzed using lumi R
package. Background correction was done in Beadstudio
(Illumina, San Diego, CA, USA). The quantile normalization
method implemented in lumi R package was used to normalize
the data. We use LIMMA (linear models for microarray data)
to identify differentially expressed genes. To compare gene
expression in multiple groups, we used an empirical Bayes
approach to assess differentially expressed genes, allowing for
multiple testing adjustments. This method does not require the
data to be normally distributed.19 Briefly, it starts by fitting a
linear model for each gene in the data, and then empirical Bayes
method is used to moderate the standard errors for estimating
the moderated t-statistics for each gene, which shrinks the
standard errors towards a common value. The corresponding
P-values for the modified t-statistics were adjusted using the
multiple testing procedures developed by Benjamini and
Hochberg.20 Genes of interest were selected by setting the false
discovery rate at the level of 0.01 and by fold change of 2.
Further analyses were carried out using Ingenuity Pathway
Analysis (IPA—http://www.ingenuity.com) software (Ingenuity
Systems, Redwood City, CA, USA). Additional analysis were
performed using DAVID 6.7 (http://david.abcc.ncifcrf.gov)
(the database for annotation, visualization and integrated dis-
covery) bioinformatics resources as described elsewhere21 and
using GOEAST (http://omicslab.genetics.ac.cn/GOEAST/)
(Gene Ontology Enrichment Analysis Software Toolkit) bioin-
formatics tools.22 For cluster analysis and to generate heat-
maps, we used MultiExperiment Viewer (http://www.tm4.
org/mev/).23,24
Accession codes
The microarray data complies with MIAME guidelines, and the
data set was deposited at Gene Expression Omnibus (National
Center for Biotechnology Information), accession number
GSE43513.
qRT-PCR
Selected genes were analyzed using quantitative RT-PCR on
the same RNA samples used for microarray analysis. qRT-
PCR was performed in triplicates using a CFX96TM Real-
Time System (Bio-Rad, Hercules, CA, USA). The protocol
was followed according to Wang et al.,25 with a slight modi-
fication. Total RNA (0.12 mg) was reverse transcribed into
cDNA using Superscript II (Invitrogen Life Technologies,
Burlington, ON, Canada) and Oligo dT18VN primer (ACGT
Corp., Toronto, ON, Canada) in a 20 ml reaction volume. Two
negative controls were used to ensure there was no contam-
inating DNA: one without template RNA and another lacking
the reverse transcriptase. A reaction mixture was also prepared
containing: 5 ml of template cDNA, 15 ml of master mix (1 ml of
forward and 1 ml of reverse primer (both 10 mM stock), 10 ml of
BioRadSsofastEvaGreen Super Mix (BioRad) and 3 ml of
RNase-free distilled water was used. Primers were designed
from the PrimerBank ID number (Supplementary Table 2)
and GAPDH was used to normalize the expression data. For
data analysis, CFX manager software (Bio-Rad) was used. To
investigate the effect of neutrophil isolation method on gene
expression profiles, we compared gene expression of selected
Cellular & Molecular Immunology cmi201437.3d 16/5/14 20:45:17
Neutrophil gene expression profiles changes
FS Lakschevitz et al
3
Cellular & Molecular Immunology
genes across multiple methods (Supplementary Tables 2 and 3).
Comparisons performed included: BM isolation by Percoll vs.
immunoselection, FACS-sorted blood-PMN isolation with min-
imal manipulation vs. Percoll and FACS-sorted blood-PMN from
mice with and without induction of peritonitis (Supplementary
Table 4). Results are reported using the DCt method, which cal-
culates the difference between the reference and target Ct values
for each sample. First, we determined the relative expression of
each gene for each compartment (BM, blood and PE) using the
following equation: 2(Ct(GAPDH)2Ct(Target gene))5relative express-
ion. Then, the ratio of expression was determined by dividing
the relative expression of each target gene from each site (blood
or PE) to the relative expression of each target gene from BM
samples. The graphic illustrates the relationships of obtained from
Blood to BM and PE to BM.
Western blots
Protein lysates from neutrophils were prepared with SDS
buffer. The lysates were clarified by centrifugation (5 min,
13 000 r.p.m. at 4 uC). Total protein concentration was mea-
sured with a BCA protein assay kit (Pierce= ). Fifteen micrograms
of heat-denatured protein was loaded on a 12% polyacrylamide
gel followed by transfer to nitrocellulose membrane (Amersham> ).
After transfer,the membrane was incubated for 1 h in blocking
buffer (5% nonfat milk powder in Tris-buffered saline and
0.1% Tween 20 (TBST)). The membrane was incubated over-
night in primary antibody in TBST with 5% bovine serum
albumin, washed with TBST (3310 min) and incubated for
60 min in horseradish peroxidase-conjugated secondary anti-
body/5% nonfat milk powder/TBST at room temperature.
After washing with TBST (3310 min), the membrane was
developed with Western Lightning solution (PerkinElmer? )
and exposure to film (Kodak@ ). Images obtained were quanti-
tated using ImageJ software as described elsewhere.26 The fol-
lowing antibodies were purchased from Cell SignalingA : ARP2,
Wiskott–Aldrich syndrome protein (WASp), CDC42, caspase-
9 and Bcl-xL.
Neutrophil chemotaxis assays
Neutrophils from the three compartments (BM, blood and PE)
were suspended in HBSS with 1% gelatin. Neutrophils (13106/
ml) were allowed to attach to bovine serum albumin-coated
glass coverslips (22340 mm) at 37 uC for 15 min. The coverslip
was inverted onto a Zigmond chamber, and 100 ml HBSS media
was added to the left chamber with 100 ml HBSS media contain-
ing fMLP (1026) was added to the right chamber. Time-lapse
video microscopy was used to examine neutrophil movement
in Zigmond chambers. The microscope (Nikon Eclipse E400)
was equipped with differential interference contrast optics and
a 320 objective. Images were captured at 15-s intervals for
10 min with a Nikon Coolpix 995 camera. Cell-tracking soft-
ware (Retrac version 2.1.01 Freeware) was used to characterize
cellular chemotaxis and the percentage of cells migrating
toward chemoattractant source was calculated from the cap-
tured images.
Quantification of neutrophil apoptosis
Neutrophil apoptosis was quantified in the three different
compartments by flow cytometry using FlowJo software for
analysis. Neutrophils were identified based on the following
gating strategy: FSC vs. SSC, then Singlet1, followed Ly6G1.
Apoptotic cells were gated based on exclusion of eFluor506
staining and Annexin V staining. Cells, which stained positive
for Annexin V only, were considered early apoptotic and cells
that stained for eFluor506 and Annexin V were considered late
apoptotic events.
Caspase 9 cleavage Assay
Neutrophils were isolated from each compartment (BM, blood
and PE) and cultured overnight in complete medium to induce
apoptosis, followed by a 30 minutes incubation using Fluo-
rescein Active Caspase-9 Staining kit (eBioscience). Cells were
then harvested, washed and stained with Annexin V. Finally,
the cells were analyzed in the presence of DAPI Staining
Solution. Viable cells were gated based on exclusion of DAPI
staining and then these gated events were analyzed for staining
of Annexin V and Fluorescein Active Caspase-9.
Statistical analysis
For experiments in which there were multiple observations per
sample, numerical results were expressed as mean6s.e.m. Each
experiment was performed at least three times, and within
each experiment, each data point had a sample size of no3.
Statistical analysis was performed using Student’s two-tailed t-
test, unless specified otherwise. Pf0.05 was considered statist-
ically significant, by GraphPad B(http://www.graphpad.com).
RESULTS
Neutrophil isolation and purity
Neutrophils from BM, blood and inflamed tissues are part of
mixed cell populations. Since transcriptome profiling and phe-
notyping assays could be influenced by contaminating cell
populations we optimized our neutrophil isolation protocols
(Table 1) and verified that the isolation protocols and contam-
inating cells themselves did not significantly alter the gene
expression profiles of the isolated neutrophils. qRT-PCR ana-
lyses were performed to evaluate how the method of PMN
isolation may affect the neutrophil transcriptome. Com-
parison of PMN-BM isolated by Percoll gradient separation
with immunomagnetic separation, PMN-B FACS sorted (to
minimize manipulation) with Percoll gradient separation yielded
no significant differences in gene expression (Supplementary
Tables 2 and 3).
The neutrophil is a transcriptionally active cell that alters its
gene expression profile as it migrates from storage
compartments into sites of inflammation
Following purification of neutrophils from the three compart-
ments in mice (BM, blood and PE) (Supplementary Figures 1
and 2) we performed gene expression analysis using an Illu-
mina gene array. Of the 45 282 probe sets, we identified 1216
genes that were differentially expressed when we compared
Cellular & Molecular Immunology cmi201437.3d 16/5/14 20:45:18
Neutrophil gene expression profiles changes
FS Lakschevitz et al
4
Cellular & Molecular Immunology
neutrophils from BM (PMN-BM) with neutrophils isolated from
blood (PMN-B), 1468 genes when we compared PMN-B and
neutrophils from PE (PMN-PE) and 1545 genes when comparing
PMN-BM vs. PMN-PE, using a cutoff of twofold change (FC)
and a P-value of 0.001 (Table 2 and Supplementary Table 1). We
confirmed these results using a second statistical approach, the
significance analysis of microarray technique, and similar gene
numbers and significance levels were found (data not shown).
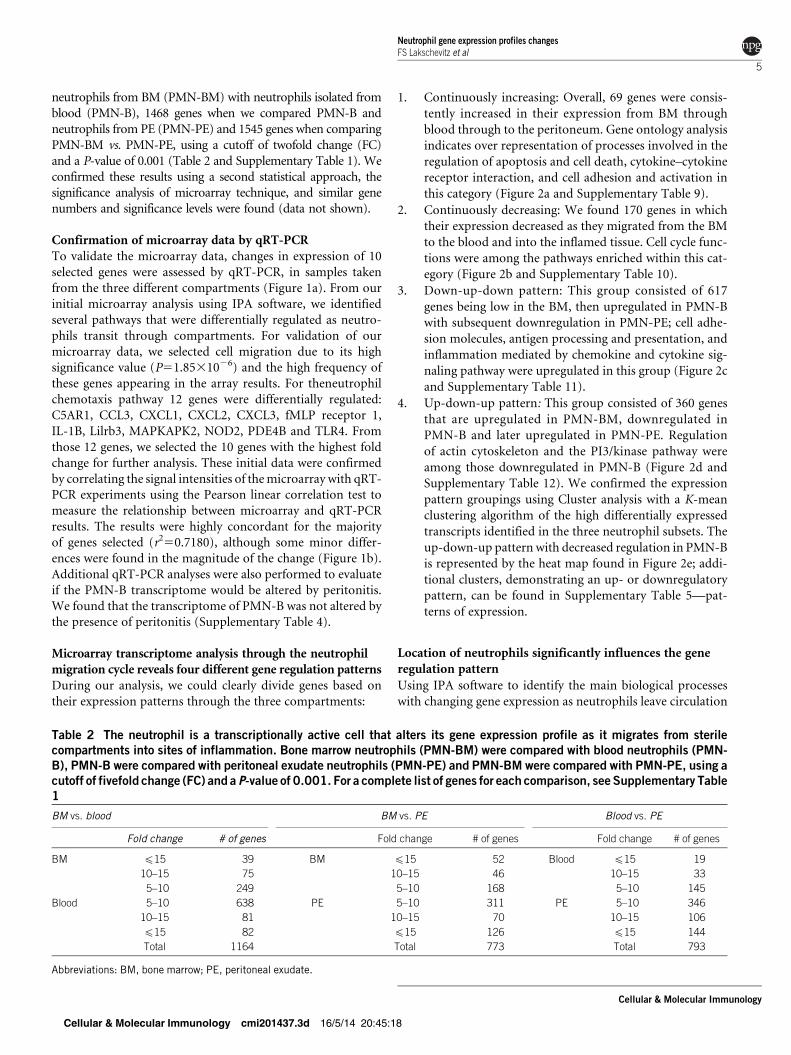
Confirmation of microarray data by qRT-PCR
To validate the microarray data, changes in expression of 10
selected genes were assessed by qRT-PCR, in samples taken
from the three different compartments (Figure 1a). From our
initial microarray analysis using IPA software, we identified
several pathways that were differentially regulated as neutro-
phils transit through compartments. For validation of our
microarray data, we selected cell migration due to its high
significance value (P51.8531026) and the high frequency of
these genes appearing in the array results. For theneutrophil
chemotaxis pathway 12 genes were differentially regulated:
C5AR1, CCL3, CXCL1, CXCL2, CXCL3, fMLP receptor 1,
IL-1B, Lilrb3, MAPKAPK2, NOD2, PDE4B and TLR4. From
those 12 genes, we selected the 10 genes with the highest fold
change for further analysis. These initial data were confirmed
by correlating the signal intensities of the microarray with qRT-
PCR experiments using the Pearson linear correlation test to
measure the relationship between microarray and qRT-PCR
results. The results were highly concordant for the majority
of genes selected (r250.7180), although some minor differ-
ences were found in the magnitude of the change (Figure 1b).
Additional qRT-PCR analyses were also performed to evaluate
if the PMN-B transcriptome would be altered by peritonitis.
We found that the transcriptome of PMN-B was not altered by
the presence of peritonitis (Supplementary Table 4).
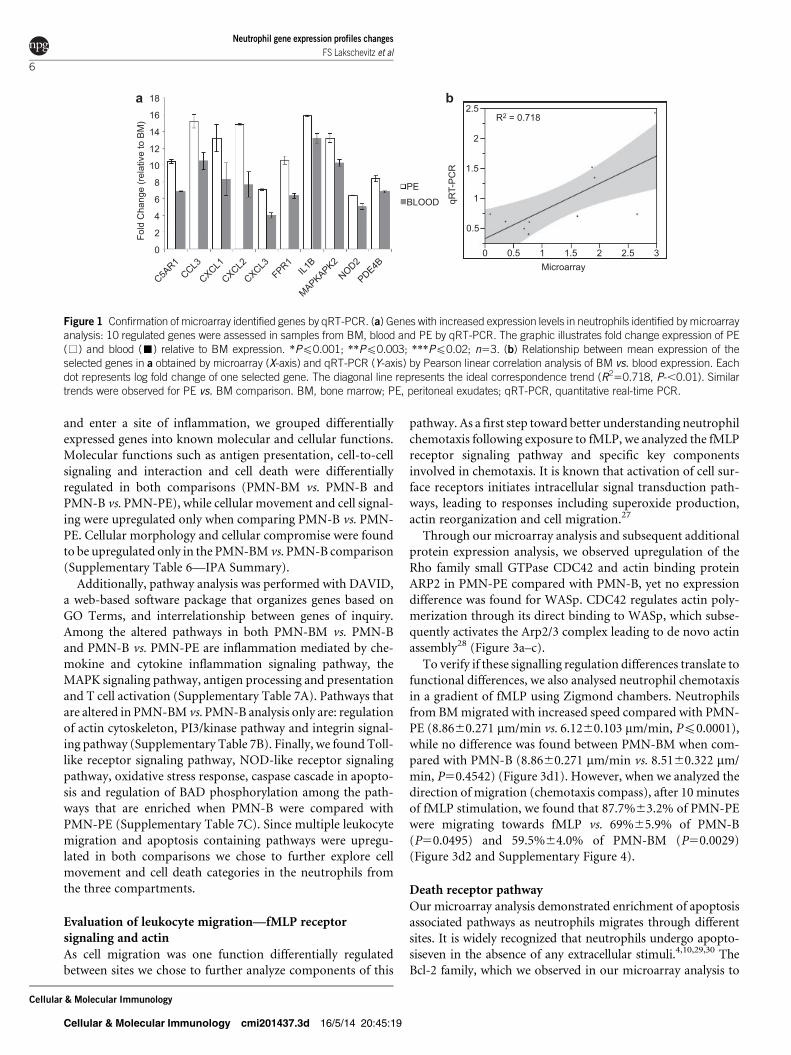
Microarray transcriptome analysis through the neutrophil
migration cycle reveals four different gene regulation patterns
During our analysis, we could clearly divide genes based on
their expression patterns through the three compartments:
1. Continuously increasing: Overall, 69 genes were consis-
tently increased in their expression from BM through
blood through to the peritoneum. Gene ontology analysis
indicates over representation of processes involved in the
regulation of apoptosis and cell death, cytokine–cytokine
receptor interaction, and cell adhesion and activation in
this category (Figure 2a and Supplementary Table 9).
2. Continuously decreasing: We found 170 genes in which
their expression decreased as they migrated from the BM
to the blood and into the inflamed tissue. Cell cycle func-
tions were among the pathways enriched within this cat-
egory (Figure 2b and Supplementary Table 10).
3. Down-up-down pattern: This group consisted of 617
genes being low in the BM, then upregulated in PMN-B
with subsequent downregulation in PMN-PE; cell adhe-
sion molecules, antigen processing and presentation, and
inflammation mediated by chemokine and cytokine sig-
naling pathway were upregulated in this group (Figure 2c
and Supplementary Table 11).
4. Up-down-up pattern: This group consisted of 360 genes
that are upregulated in PMN-BM, downregulated in
PMN-B and later upregulated in PMN-PE. Regulation
of actin cytoskeleton and the PI3/kinase pathway were
among those downregulated in PMN-B (Figure 2d and
Supplementary Table 12). We confirmed the expression
pattern groupings using Cluster analysis with a K-mean
clustering algorithm of the high differentially expressed
transcripts identified in the three neutrophil subsets. The
up-down-up pattern with decreased regulation in PMN-B
is represented by the heat map found in Figure 2e; addi-
tional clusters, demonstrating an up- or downregulatory
pattern, can be found in Supplementary Table 5—pat-
terns of expression.
Location of neutrophils significantly influences the gene
regulation pattern
Using IPA software to identify the main biological processes
with changing gene expression as neutrophils leave circulation
Cellular & Molecular Immunology cmi201437.3d 16/5/14 20:45:18
Table 2 The neutrophil is a transcriptionally active cell that alters its gene expression profile as it migrates from sterile
compartments into sites of inflammation. Bone marrow neutrophils (PMN-BM) were compared with blood neutrophils (PMN-
B), PMN-B were compared with peritoneal exudate neutrophils (PMN-PE) and PMN-BM were compared with PMN-PE, using a
cutoff of fivefold change (FC) and a P-value of 0.001. For a complete list of genes for each comparison, see Supplementary Table
1
BM vs. blood BM vs. PE Blood vs. PE
Fold change # of genes Fold change # of genes Fold change # of genes
BM f15 39 BM f15 52 Blood f15 19
10–15 75 10–15 46 10–15 33
5–10 249 5–10 168 5–10 145
Blood 5–10 638 PE 5–10 311 PE 5–10 346
10–15 81 10–15 70 10–15 106
f15 82 f15 126 f15 144
Total 1164 Total 773 Total 793
Abbreviations: BM, bone marrow; PE, peritoneal exudate.
Neutrophil gene expression profiles changes
FS Lakschevitz et al
5
Cellular & Molecular Immunology
and enter a site of inflammation, we grouped differentially
expressed genes into known molecular and cellular functions.
Molecular functions such as antigen presentation, cell-to-cell
signaling and interaction and cell death were differentially
regulated in both comparisons (PMN-BM vs. PMN-B and
PMN-B vs. PMN-PE), while cellular movement and cell signal-
ing were upregulated only when comparing PMN-B vs. PMN-
PE. Cellular morphology and cellular compromise were found
to be upregulated only in the PMN-BM vs. PMN-B comparison
(Supplementary Table 6—IPA Summary).
Additionally, pathway analysis was performed with DAVID,
a web-based software package that organizes genes based on
GO Terms, and interrelationship between genes of inquiry.
Among the altered pathways in both PMN-BM vs. PMN-B
and PMN-B vs. PMN-PE are inflammation mediated by che-
mokine and cytokine inflammation signaling pathway, the
MAPK signaling pathway, antigen processing and presentation
and T cell activation (Supplementary Table 7A). Pathways that
are altered in PMN-BM vs. PMN-B analysis only are: regulation
of actin cytoskeleton, PI3/kinase pathway and integrin signal-
ing pathway (Supplementary Table 7B). Finally, we found Toll-
like receptor signaling pathway, NOD-like receptor signaling
pathway, oxidative stress response, caspase cascade in apopto-
sis and regulation of BAD phosphorylation among the path-
ways that are enriched when PMN-B were compared with
PMN-PE (Supplementary Table 7C). Since multiple leukocyte
migration and apoptosis containing pathways were upregu-
lated in both comparisons we chose to further explore cell
movement and cell death categories in the neutrophils from
the three compartments.
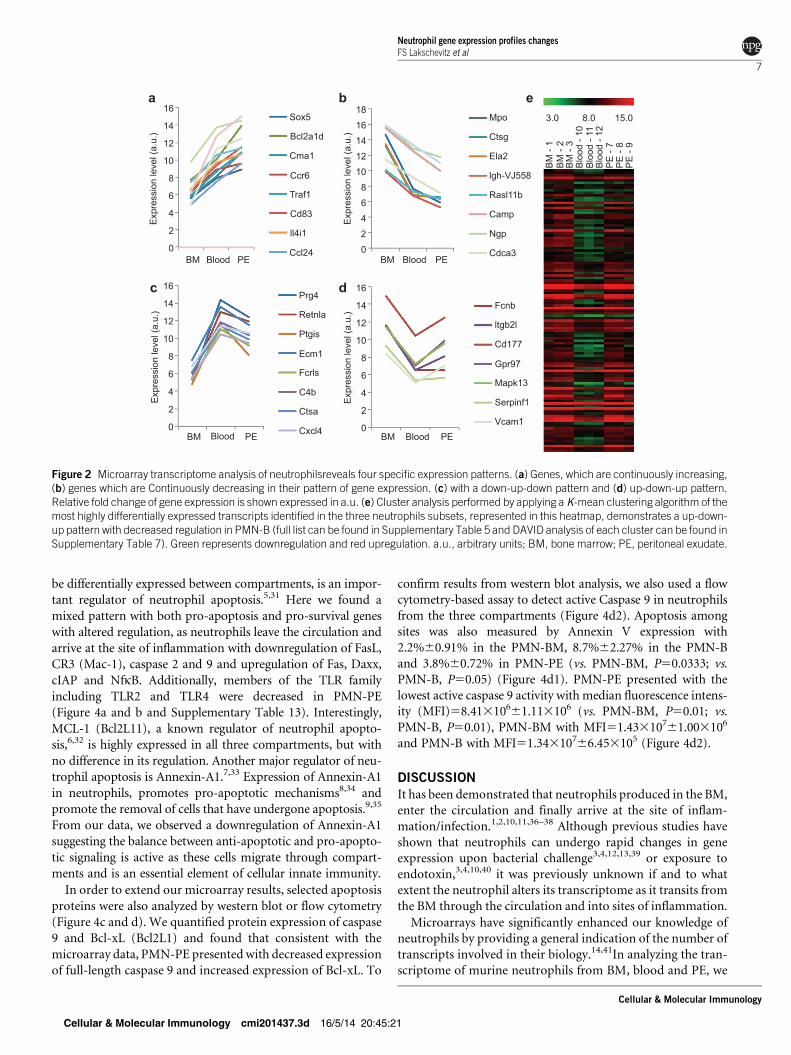
Evaluation of leukocyte migration—fMLP receptor
signaling and actin
As cell migration was one function differentially regulated
between sites we chose to further analyze components of this
pathway. As a first step toward better understanding neutrophil
chemotaxis following exposure to fMLP, we analyzed the fMLP
receptor signaling pathway and specific key components
involved in chemotaxis. It is known that activation of cell sur-
face receptors initiates intracellular signal transduction path-
ways, leading to responses including superoxide production,
actin reorganization and cell migration.27
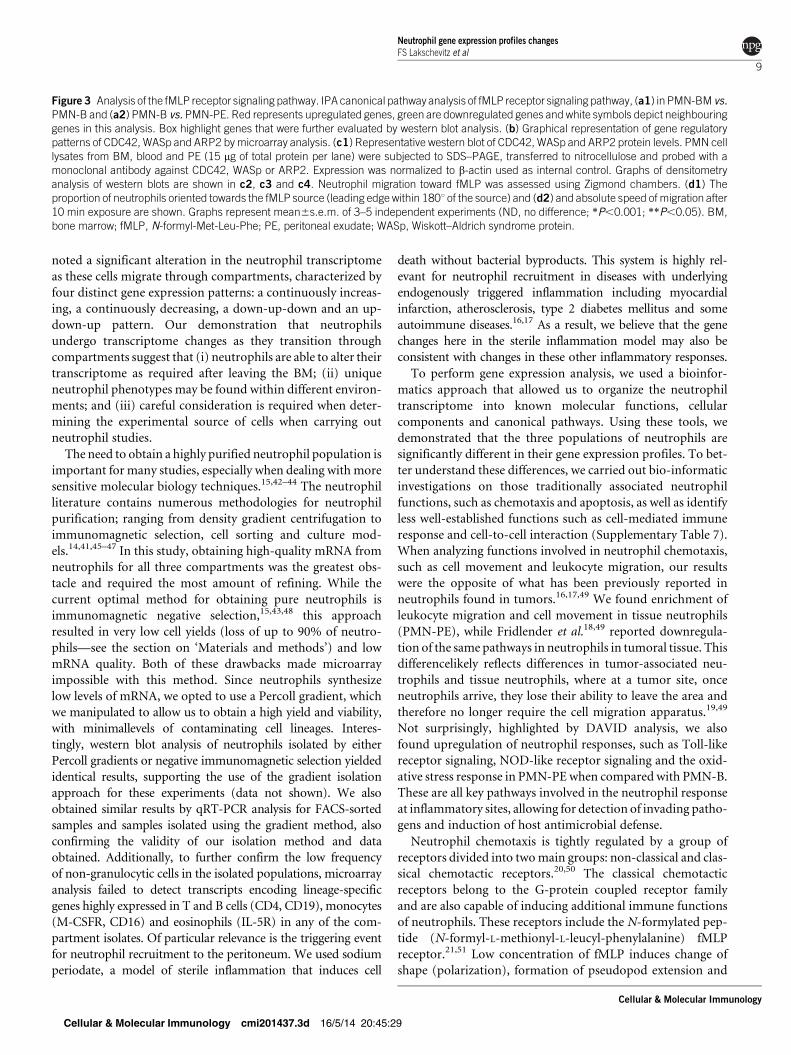
Through our microarray analysis and subsequent additional
protein expression analysis, we observed upregulation of the
Rho family small GTPase CDC42 and actin binding protein
ARP2 in PMN-PE compared with PMN-B, yet no expression
difference was found for WASp. CDC42 regulates actin poly-
merization through its direct binding to WASp, which subse-
quently activates the Arp2/3 complex leading to de novo actin
assembly28 (Figure 3a–c).
To verify if these signalling regulation differences translate to
functional differences, we also analysed neutrophil chemotaxis
in a gradient of fMLP using Zigmond chambers. Neutrophils
from BM migrated with increased speed compared with PMN-
PE (8.8660.271 mm/min vs. 6.1260.103 mm/min, Pf0.0001),
while no difference was found between PMN-BM when com-
pared with PMN-B (8.8660.271 mm/min vs. 8.5160.322 mm/
min, P50.4542) (Figure 3d1). However, when we analyzed the
direction of migration (chemotaxis compass), after 10 minutes
of fMLP stimulation, we found that 87.7%63.2% of PMN-PE
were migrating towards fMLP vs. 69%65.9% of PMN-B
(P50.0495) and 59.5%64.0% of PMN-BM (P50.0029)
(Figure 3d2 and Supplementary Figure 4).
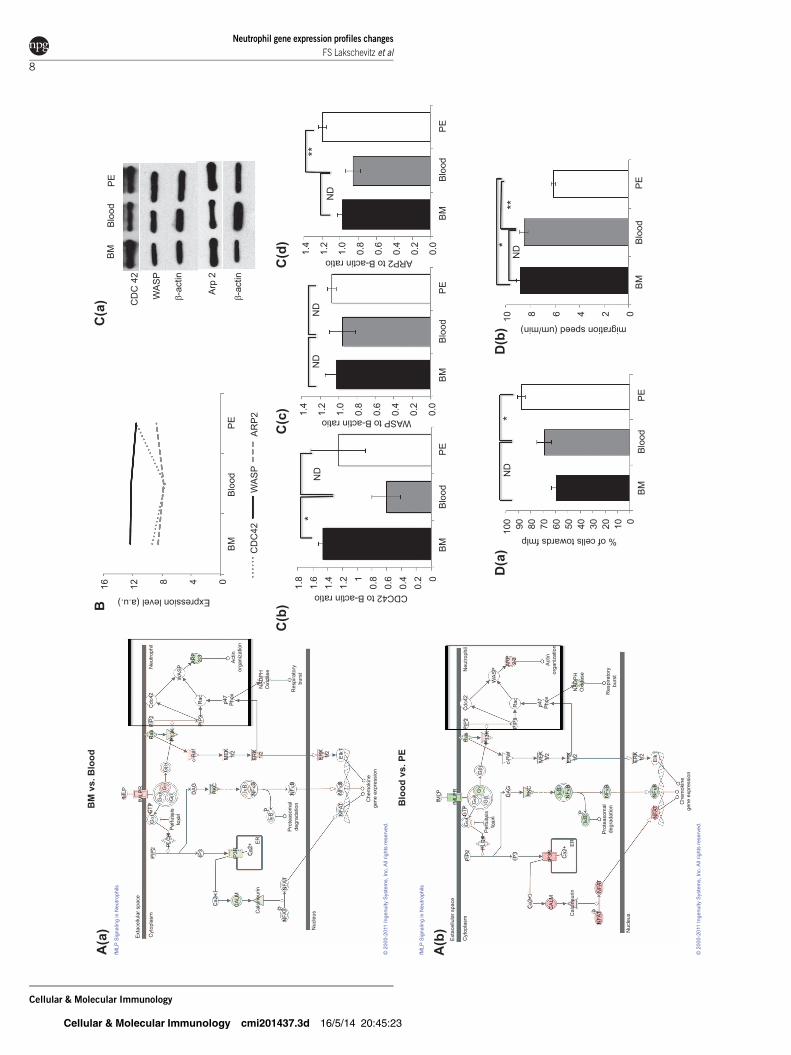
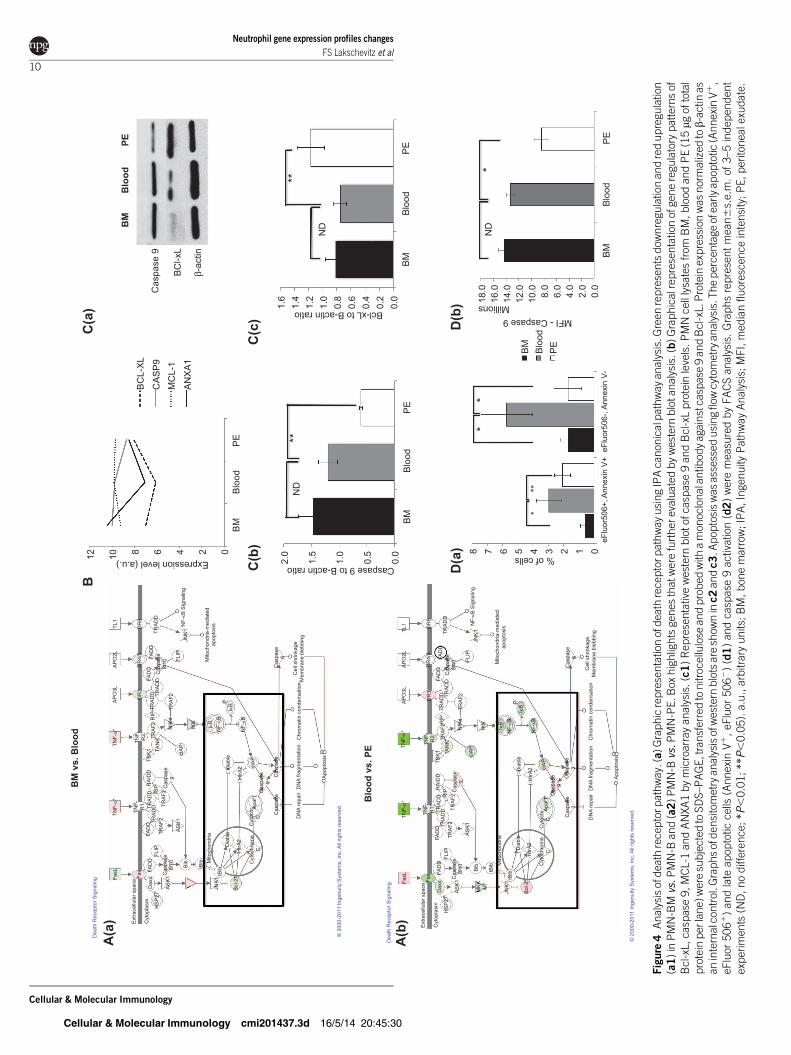
Death receptor pathway
Our microarray analysis demonstrated enrichment of apoptosis
associated pathways as neutrophils migrates through different
sites. It is widely recognized that neutrophils undergo apopto-
siseven in the absence of any extracellular stimuli.4,10,29,30 The
Bcl-2 family, which we observed in our microarray analysis to
Cellular & Molecular Immunology cmi201437.3d 16/5/14 20:45:19
16
14
12
10
8
6
Fold
Cha
nge
(rel
ativ
e to
BM
)
4
2
18a b
2
1.5
qRT-
PC
R
1
2.5R2 = 0.718
0.5
0 2.52Microarray
1.510.5 3
PE
BLOOD
0
C5AR1
CCL3
CXCL1
CXCL2
CXCL3FPR1
IL1B
MAPKAPK2NOD2
PDE4B
Figure 1 Confirmation of microarray identified genes by qRT-PCR. (a) Genes with increased expression levels in neutrophils identified by microarrayanalysis: 10 regulated genes were assessed in samples from BM, blood and PE by qRT-PCR. The graphic illustrates fold change expression of PE(%) and blood (&) relative to BM expression. *Pf0.001; **Pf0.003; ***Pf0.02; n53. (b) Relationship between mean expression of theselected genes in a obtained by microarray (X-axis) and qRT-PCR (Y-axis) by Pearson linear correlation analysis of BM vs. blood expression. Eachdot represents log fold change of one selected gene. The diagonal line represents the ideal correspondence trend (R250.718, P-,0.01). Similartrends were observed for PE vs. BM comparison. BM, bone marrow; PE, peritoneal exudates; qRT-PCR, quantitative real-time PCR.
Neutrophil gene expression profiles changes
FS Lakschevitz et al
6
Cellular & Molecular Immunology
be differentially expressed between compartments, is an impor-
tant regulator of neutrophil apoptosis.5,31 Here we found a
mixed pattern with both pro-apoptosis and pro-survival genes
with altered regulation, as neutrophils leave the circulation and
arrive at the site of inflammation with downregulation of FasL,
CR3 (Mac-1), caspase 2 and 9 and upregulation of Fas, Daxx,
cIAP and NfkB. Additionally, members of the TLR family
including TLR2 and TLR4 were decreased in PMN-PE
(Figure 4a and b and Supplementary Table 13). Interestingly,
MCL-1 (Bcl2L11), a known regulator of neutrophil apopto-
sis,6,32 is highly expressed in all three compartments, but with
no difference in its regulation. Another major regulator of neu-
trophil apoptosis is Annexin-A1.7,33 Expression of Annexin-A1
in neutrophils, promotes pro-apoptotic mechanisms8,34 and
promote the removal of cells that have undergone apoptosis.9,35
From our data, we observed a downregulation of Annexin-A1
suggesting the balance between anti-apoptotic and pro-apopto-
tic signaling is active as these cells migrate through compart-
ments and is an essential element of cellular innate immunity.
In order to extend our microarray results, selected apoptosis
proteins were also analyzed by western blot or flow cytometry
(Figure 4c and d). We quantified protein expression of caspase
9 and Bcl-xL (Bcl2L1) and found that consistent with the
microarray data, PMN-PE presented with decreased expression
of full-length caspase 9 and increased expression of Bcl-xL. To
confirm results from western blot analysis, we also used a flow
cytometry-based assay to detect active Caspase 9 in neutrophils
from the three compartments (Figure 4d2). Apoptosis among
sites was also measured by Annexin V expression with
2.2%60.91% in the PMN-BM, 8.7%62.27% in the PMN-B
and 3.8%60.72% in PMN-PE (vs. PMN-BM, P50.0333; vs.
PMN-B, P50.05) (Figure 4d1). PMN-PE presented with the
lowest active caspase 9 activity with median fluorescence intens-
ity (MFI)58.41310661.113106 (vs. PMN-BM, P50.01; vs.
PMN-B, P50.01), PMN-BM with MFI51.43310761.003106
and PMN-B with MFI51.34310766.453105 (Figure 4d2).
DISCUSSION
It has been demonstrated that neutrophils produced in the BM,
enter the circulation and finally arrive at the site of inflam-
mation/infection.1,2,10,11,36–38 Although previous studies have
shown that neutrophils can undergo rapid changes in gene
expression upon bacterial challenge3,4,12,13,39 or exposure to
endotoxin,3,4,10,40 it was previously unknown if and to what
extent the neutrophil alters its transcriptome as it transits from
the BM through the circulation and into sites of inflammation.
Microarrays have significantly enhanced our knowledge of
neutrophils by providing a general indication of the number of
transcripts involved in their biology.14,41In analyzing the tran-
scriptome of murine neutrophils from BM, blood and PE, we
Cellular & Molecular Immunology cmi201437.3d 16/5/14 20:45:21
14
12
10E
xpre
ssio
n le
vel (
a.u.
)
8
6
4
2
16a
d
b e
c
Sox5
Bcl2a1d
Cma1
Ccr6
Traf1
Cd83
Ccl24
ll4i10
BM Blood PE
14
12
10
Exp
ress
ion
leve
l (a.
u.)
Exp
ress
ion
leve
l (a.
u.)
8
6
4
2
16Prg4
Retnla
Ptgis
Ecm1
Fcrls
C4b
Cxcl4
Ctsa
Fcnb
ltgb2l
Cd177
Gpr97
Mapk13
Serpinf1
Vcam10
14
12
10
8
6
4
2
16
0BM Blood PE BM Blood PE
16
14
12
Exp
ress
ion
leve
l (a.
u.)
10
8
6
4
2
18Mpo 3.0
BM
- 1
BM
- 2
BM
- 3
Blo
od -
10B
lood
- 11
Blo
od -
12P
E -
7P
E -
8P
E -
9
8.0 15.0
Ctsg
Ela2
lgh-VJ558
Rasl11b
Camp
Cdca3
Ngp
0BM Blood PE
Figure 2 Microarray transcriptome analysis of neutrophilsreveals four specific expression patterns. (a) Genes, which are continuously increasing,(b) genes which are Continuously decreasing in their pattern of gene expression. (c) with a down-up-down pattern and (d) up-down-up pattern.Relative fold change of gene expression is shown expressed in a.u. (e) Cluster analysis performed by applying a K-mean clustering algorithm of themost highly differentially expressed transcripts identified in the three neutrophils subsets, represented in this heatmap, demonstrates a up-down-up pattern with decreased regulation in PMN-B (full list can be found in Supplementary Table 5 and DAVID analysis of each cluster can be found inSupplementary Table 7). Green represents downregulation and red upregulation. a.u., arbitrary units; BM, bone marrow; PE, peritoneal exudate.
Neutrophil gene expression profiles changes
FS Lakschevitz et al
7
Cellular & Molecular Immunology
Cellular & Molecular Immunology cmi201437.3d 16/5/14 20:45:23
fMLP
fMLP
R
GTP
Ga
i
Per
tuss
isto
xin
Ga
i DA
G
P13
K
Ras
PIP
2
PIP
3c-
Raf
PK
C
ME
K1/
2
ER
K1/
2
IkB
IkB
P
Ca2
+
Ca2
+
CA
LM
Cal
cine
urin
PN
FAT
NFA
T
ER
IP3RIP3
PIP
2 PLC
b
Pro
teas
omal
degr
adat
ion
NFk
B
NFk
B
Cdc
42
WA
SPN
eutro
phil
12 8 416B
M v
s. B
lood
Blo
od v
s. P
E
BA
(a)
A(b
)
C(a
)
C(b
)C
(c)
C(d
)
D(b
)D
(a)
0 1.6
1.4
1.2 1
0.8
0.6
0.4
0.2
1.8 0
90 80 70 60 50 40 30 20 10
% of cells towards fmlp100 0
8 6 4 2
migration speed (um/min)10 0
BM
CD
C42
WA
SP
AR
P2
Blo
odP
E
BM
Blo
odP
EB
MB
lood
PE
BM
Blo
odP
E
ND ND
*
*
ND*
**
ND
ND
ND
**
CD
C 4
2
BM
Blo
odP
E
WA
SP
b-ac
tin
b-ac
tin
Arp
2
Expression level (a.u.) CDC42 to B-actin ratio
1.2
1.0
0.8
0.6
0.4
0.2
1.4
0.0
BM
Blo
odP
EB
MB
lood
PE
WASP to B-actin ratio
1.2
1.0
0.8
0.6
0.4
0.2
1.4
0.0
ARP2 to B-actin ratio
Nuc
leus
Rac
p47
Pho
x
NA
DP
HO
xida
se
Res
pira
tory
burs
t
ER
K1/
2
EIk
1N
FkB
NFA
T
Che
mok
ine
gene
exp
ress
ion
Act
inor
gani
zatio
n
AR
P2/
3
Gg
Gb
Gbg
fMLP
fMLP
R
GTP
Ga
i
Per
tuss
isto
xin
Ga
i DA
G
P13
K
Ras
PIP
2
PIP
3c-
Raf
PK
C
ME
K1/
2
ER
K1/
2
IkB
IkB
P
Ca2
+
Ca2
+
CA
LM
Cal
cine
urin
PN
FAT
NFA
T
ER
IP3RIP3
PIP
2C
ytop
lasm
Ext
acel
lula
r spa
ce
Cyt
opla
sm
Ext
acel
lula
r spa
ce
fMLP
Sig
nalin
g in
Neu
troph
ils
fMLP
Sig
nalin
g in
Neu
troph
ils
© 2
000-
2011
Inge
nuity
Sys
tem
s, In
c. A
ll rig
hts
rese
rved
.
© 2
000-
2011
Inge
nuity
Sys
tem
s, In
c. A
ll rig
hts
rese
rved
.
PLC
b
Pro
teas
omal
degr
adat
ion
NFk
B
NFk
B
Cdc
42
WA
SPN
eutro
phil
Nuc
leus
Rac
p47
Pho
x
NA
DP
HO
xida
se
Res
pira
tory
burs
t
ER
K1/
2
EIk
1N
FkB
NFA
T
Che
mok
ine
gene
exp
ress
ion
Act
inor
gani
zatio
n
AR
P2/
3
Gg
Gb
Gbg
Neutrophil gene expression profiles changes
FS Lakschevitz et al
8
Cellular & Molecular Immunology
noted a significant alteration in the neutrophil transcriptome
as these cells migrate through compartments, characterized by
four distinct gene expression patterns: a continuously increas-
ing, a continuously decreasing, a down-up-down and an up-
down-up pattern. Our demonstration that neutrophils
undergo transcriptome changes as they transition through
compartments suggest that (i) neutrophils are able to alter their
transcriptome as required after leaving the BM; (ii) unique
neutrophil phenotypes may be found within different environ-
ments; and (iii) careful consideration is required when deter-
mining the experimental source of cells when carrying out
neutrophil studies.
The need to obtain a highly purified neutrophil population is
important for many studies, especially when dealing with more
sensitive molecular biology techniques.15,42–44 The neutrophil
literature contains numerous methodologies for neutrophil
purification; ranging from density gradient centrifugation to
immunomagnetic selection, cell sorting and culture mod-
els.14,41,45–47 In this study, obtaining high-quality mRNA from
neutrophils for all three compartments was the greatest obs-
tacle and required the most amount of refining. While the
current optimal method for obtaining pure neutrophils is
immunomagnetic negative selection,15,43,48 this approach
resulted in very low cell yields (loss of up to 90% of neutro-
phils—see the section on ‘Materials and methods’) and low
mRNA quality. Both of these drawbacks made microarray
impossible with this method. Since neutrophils synthesize
low levels of mRNA, we opted to use a Percoll gradient, which
we manipulated to allow us to obtain a high yield and viability,
with minimallevels of contaminating cell lineages. Interes-
tingly, western blot analysis of neutrophils isolated by either
Percoll gradients or negative immunomagnetic selection yielded
identical results, supporting the use of the gradient isolation
approach for these experiments (data not shown). We also
obtained similar results by qRT-PCR analysis for FACS-sorted
samples and samples isolated using the gradient method, also
confirming the validity of our isolation method and data
obtained. Additionally, to further confirm the low frequency
of non-granulocytic cells in the isolated populations, microarray
analysis failed to detect transcripts encoding lineage-specific
genes highly expressed in T and B cells (CD4, CD19), monocytes
(M-CSFR, CD16) and eosinophils (IL-5R) in any of the com-
partment isolates. Of particular relevance is the triggering event
for neutrophil recruitment to the peritoneum. We used sodium
periodate, a model of sterile inflammation that induces cell
death without bacterial byproducts. This system is highly rel-
evant for neutrophil recruitment in diseases with underlying
endogenously triggered inflammation including myocardial
infarction, atherosclerosis, type 2 diabetes mellitus and some
autoimmune diseases.16,17 As a result, we believe that the gene
changes here in the sterile inflammation model may also be
consistent with changes in these other inflammatory responses.
To perform gene expression analysis, we used a bioinfor-
matics approach that allowed us to organize the neutrophil
transcriptome into known molecular functions, cellular
components and canonical pathways. Using these tools, we
demonstrated that the three populations of neutrophils are
significantly different in their gene expression profiles. To bet-
ter understand these differences, we carried out bio-informatic
investigations on those traditionally associated neutrophil
functions, such as chemotaxis and apoptosis, as well as identify
less well-established functions such as cell-mediated immune
response and cell-to-cell interaction (Supplementary Table 7).
When analyzing functions involved in neutrophil chemotaxis,
such as cell movement and leukocyte migration, our results
were the opposite of what has been previously reported in
neutrophils found in tumors.16,17,49 We found enrichment of
leukocyte migration and cell movement in tissue neutrophils
(PMN-PE), while Fridlender et al.18,49 reported downregula-
tion of the same pathways in neutrophils in tumoral tissue. This
differencelikely reflects differences in tumor-associated neu-
trophils and tissue neutrophils, where at a tumor site, once
neutrophils arrive, they lose their ability to leave the area and
therefore no longer require the cell migration apparatus.19,49
Not surprisingly, highlighted by DAVID analysis, we also
found upregulation of neutrophil responses, such as Toll-like
receptor signaling, NOD-like receptor signaling and the oxid-
ative stress response in PMN-PE when compared with PMN-B.
These are all key pathways involved in the neutrophil response
at inflammatory sites, allowing for detection of invading patho-
gens and induction of host antimicrobial defense.
Neutrophil chemotaxis is tightly regulated by a group of
receptors divided into two main groups: non-classical and clas-
sical chemotactic receptors.20,50 The classical chemotactic
receptors belong to the G-protein coupled receptor family
and are also capable of inducing additional immune functions
of neutrophils. These receptors include the N-formylated pep-
tide (N-formyl-L-methionyl-L-leucyl-phenylalanine) fMLP
receptor.21,51 Low concentration of fMLP induces change of
shape (polarization), formation of pseudopod extension and
Cellular & Molecular Immunology cmi201437.3d 16/5/14 20:45:29
Figure 3 Analysis of the fMLP receptor signaling pathway. IPA canonical pathway analysis of fMLP receptor signaling pathway, (a1) in PMN-BM vs.PMN-B and (a2) PMN-B vs. PMN-PE. Red represents upregulated genes, green are downregulated genes and white symbols depict neighbouringgenes in this analysis. Box highlight genes that were further evaluated by western blot analysis. (b) Graphical representation of gene regulatorypatterns of CDC42, WASp and ARP2 by microarray analysis. (c1) Representative western blot of CDC42, WASp and ARP2 protein levels. PMN celllysates from BM, blood and PE (15 mg of total protein per lane) were subjected to SDS–PAGE, transferred to nitrocellulose and probed with amonoclonal antibody against CDC42, WASp or ARP2. Expression was normalized to b-actin used as internal control. Graphs of densitometryanalysis of western blots are shown in c2, c3 and c4. Neutrophil migration toward fMLP was assessed using Zigmond chambers. (d1) Theproportion of neutrophils oriented towards the fMLP source (leading edge within 180u of the source) and (d2) and absolute speed of migration after10 min exposure are shown. Graphs represent mean6s.e.m. of 3–5 independent experiments (ND, no difference; *P,0.001; **P,0.05). BM,bone marrow; fMLP, N-formyl-Met-Leu-Phe; PE, peritoneal exudate; WASp, Wiskott–Aldrich syndrome protein.
Neutrophil gene expression profiles changes
FS Lakschevitz et al
9
Cellular & Molecular Immunology
Cellular & Molecular Immunology cmi201437.3d 16/5/14 20:45:30
10 8 6 4
Expression level (a.u.)
212
AP
O3L
AP
O2L
TL1
DR
6
FAD
DFA
DDD
R4/
5D
R3
TRA
DD
TRA
DD
TRA
DD
TRA
F2N
IK IKK
TRA
F2TB
K1
TRA
F2
TRA
DD
TRA
DD
TRA
F2
AS
K1
Bib
tBib
tBib
Bcl
-2*
Dia
blo
HtrA
2
JNK
1M
itoch
ondr
ia
FLIP
FAD
DFA
DD
Dax
xH
SP
27
Cyt
opla
sm
Ext
race
llula
r spa
ce
AS
K1Fa
s
FasL
Dea
th R
ecep
tor S
igna
ling
Dea
th R
ecep
tor S
igna
ling
A(a
)B
C(a
)
C(b
)C
(c)
D(a
)D
(b)
TNF-a
*TN
F-a
*
TNF-
R1
RIP
TAN
K
clA
P
RA
IDD
Cas
pase
2
Cyt
ochr
ome
CC
ytoc
hrC
Cas
pase
8/10
Cas
pase
8/10
RIP
TNF-
R2
FLIP
JNK
1N
F-kB
Sig
nalin
g
IkB
IkBP
NF-kB
NF-kB
Dia
blo
clA
P
HtrA
2
Apa
f1
Cas
pase
7
DN
A re
pair
DN
A fra
gmen
tatio
n
Apo
ptos
is
Chr
omat
in c
onde
nsat
ion
Cel
l shr
inka
geM
embr
ane
bleb
bing
Cas
pase
3C
aspa
se6Mito
chon
dria
-med
iate
dap
opto
sis
Cas
pase
9
AP
O3L
AP
O2L
TL1 DR
6
FAD
D
DR
4/5
FAD
D
DR
3
TRA
DD
TRA
DD
TRA
DD
TRA
F2N
IK
IKK
TRA
F2TB
K1
TRA
F2
TRA
DD
TRA
DD
TRA
F2
AS
K1
Bib
MK
K4/
7tB
ib
tBib
Bcl
-2*
Dia
blo
HtrA
2
JNK
1M
itoch
ondr
ia
FLIP
FAD
DFA
DD
Dax
xH
SP
27
Cyt
opla
sm
Ext
race
llula
r spa
ce
AS
K1Fa
s
FasL
TNF-a
*Blo
od v
s. P
E
BM
vs.
Blo
od
TNF-a
*
TNF-
R1*
RIP
TAN
K*
clA
P
RA
IDD
Cas
pase
2
Cyt
ochr
ome
CC
ytoc
hrC
Cas
pase
8/10
Cas
pase
8/10
RIP
TNF-
R2
FLIP
JNK
1N
F-kB
Sig
nalin
g
IkB
IkB
PN
F-kB
NF-kB
Dia
blo
clA
P
HtrA
2
Apa
f1*
Cas
pase
7
DN
A re
pair
DN
A fra
gmen
tatio
n
Apo
ptos
is
Chr
omat
in c
onde
nsat
ion
Cel
l shr
inka
geM
embr
ane
bleb
bing
Cas
pase
3C
aspa
se6
Mito
chon
dria
-med
iate
dap
opto
sis
Cas
pase
9
1.5
1.0
0.5
0.0
Caspase 9 to B-actin ratio2.0 0
eFlu
or50
6+, A
nnex
in V
+eF
luor
506-
, Ann
exin
V-
7 6 5 4*
**
*N
D
**
% of cells 3 2 18
ND
**
0B
MP
E
BC
L-X
LC
aspa
se 9
BC
l-xL
β-ac
tin
CA
SP
9M
CL-
1
AN
XA
1
Blo
od
BM
PE
Blo
od
BM
PE
Blo
od
BM
PE
Blo
od
0.6
0.4
0.2
0.0
Bcl-xL to B-actin ratio1.4 1.2
1.0
0.8
1.6 8.
06.
04.
02.
00.
0
MFI - Caspase 9
16.0
14.0
12.0
10.0
18.0
Millions
ND
**
BM
PE
Blo
od
BM
PEB
lood
A(b
)
© 2
000-
2011
Inge
nuity
Sys
tem
s, In
c. A
ll rig
hts
rese
rved
.
© 2
000-
2011
Inge
nuity
Sys
tem
s, In
c. A
ll rig
hts
rese
rved
.
Fig
ure
4A
naly
sis
ofd
eath
recepto
rpath
way.
(a)G
raphic
repre
senta
tion
ofd
eath
recepto
rpath
way
usi
ng
IPA
canonic
alp
ath
way
analy
sis.
Gre
en
repre
sents
dow
nre
gula
tion
and
red
upre
gula
tion
(a1
)in
PM
N-B
Mvs
.P
MN
-Band
(a2
)P
MN
-Bvs
.P
MN
-PE.B
ox
hig
hlig
hts
genes
thatw
ere
furt
hereva
luate
dby
west
ern
blo
tanaly
sis.
(b)G
raphic
alr
epre
senta
tion
ofg
ene
regula
tory
patt
ern
sof
Bcl-xL
,casp
ase
9,M
CL-1
and
AN
XA
1by
mic
roarr
ay
analy
sis.
(c1
)R
epre
senta
tive
west
ern
blo
tofcasp
ase
9and
Bcl-xL
pro
tein
leve
ls.P
MN
cell
lysa
tes
from
BM
,blo
od
and
PE
(15mg
ofto
tal
pro
tein
perla
ne)w
ere
subje
cte
dto
SD
S–P
AG
E,t
ransf
err
ed
tonitr
ocellu
lose
and
pro
bed
with
am
onoclo
nala
ntib
ody
again
stcasp
ase
9and
Bcl-xL
.Pro
tein
exp
ress
ion
was
norm
aliz
ed
tob-a
ctin
as
an
inte
rnalc
ontr
ol.
Gra
phs
ofd
ensi
tom
etr
yanaly
sis
ofw
est
ern
blo
tsare
show
nin
c2
and
c3
.Apopto
sis
was
ass
ess
ed
usi
ng
flow
cyt
om
etr
yanaly
sis.
The
perc
enta
ge
ofe
arly
apopto
tic(A
nnexi
nV
1,
eFlu
or
506
1)
and
late
apopto
ticcells
(Annexi
nV
1,
eFlu
or
506
2)
(d1
)and
casp
ase
9activ
atio
n(d
2)
were
measu
red
by
FA
CS
analy
sis.
Gra
phs
repre
sent
mean
6s.
e.m
.of
3–5
independent
exp
erim
ents
(ND
,no
diff
ere
nce;*P
,0.0
1;**P
,0.0
5).
a.u
.,arb
itrary
units
;B
M,bone
marr
ow
;IP
A,In
genuity
Path
way
Analy
sis;
MFI,
media
nflu
ore
scence
inte
nsi
ty;P
E,perito
neale
xudate
.
Neutrophil gene expression profiles changes
FS Lakschevitz et al
10
Cellular & Molecular Immunology
ultimately chemotaxis of neutrophils22,52 through activation of
downstream signaling pathways including small GTPase-
associated pathways and subsequent cytoskeletal rearrange-
ments, while higher concentrations also induce degranulation
and generation of oxygen-derived free radicals.23,24,53 In this
study, we selected the fMLP pathway to further investigate its
regulation during neutrophil migration through different
compartments. Our bio-informatic approaches identified
fMLP receptor 1 to be upregulated in PMN-PE. fMLP receptor
1 mediates fMLP-induced actin polymerization and chemo-
taxis.25,54 It has recently been reported that the CDC42/
WASp axis downstream of the fMLP receptor mediates neu-
trophil polarity,26,48 where CDC42 controls WASp activation,
which in turn induces CD11b clustering, related cytoskeletal
stabilization, cell polarity and efficient migration. Here we also
found the actin regulatory protein, ARP2 to be upregulated
likely allowing for increased directionality in PMN-PE, where
neutrophil polarization is critical. Our microarray analysis sug-
gested that the regulation of cell migration may be altered as the
neutrophils transit through compartments. We therefore
looked at the protein levels for some of the key proteins in this
pathway and assayed chemotaxis. Since ARP2 is key element of
actin mediated cell migration and was upregulated as the neu-
trophil migrates from blood into the peritoneum, we assayed
expression of this protein as well as the small GTPase CDC42
and WASp. In agreement with the microarray data, the express-
ion of ARP2 was increased as the neutrophils enter the peri-
toneum. This result is consistent with data from other cells
where ARP2 is required for normal directional movement.55
In agreement with the microarray data, WASp showed signifi-
cantly altered expression in the peritoneum compared to the
blood (Figure 3).
Apoptosis plays an important role in the neutrophil cycle with
involvement in continuation or resolution of the inflammatory
response. Our microarray data highlighted a shift in the balance
between pro-apoptosis and anti-apoptosis molecules between
compartments. Although we recognize that our microarray
analysis only shows that the regulation of the death receptor
pathway is significantly altered as the neutrophils enter the
tissue compartment, our flow cytometry data further confirm
increased apoptosis in blood and tissue as demonstrated by
increased membrane alterations measured by Annexin V
expression. Previously, a microarray-based approach analyzed
differences in neutrophil gene expression during spontaneous
apoptosis after extended culture (12–24 h) with and without
GM-CSF.32 Similar to our study, they observed changes in cas-
pase 9, as well as Fas and Bcl2 members. Interestingly, we show
that the expression of these pro-apoptotic genes and pro-
survival genes is also altered as the cell arrives at the site of
inflammation. Importantly, our data highlight that regulatory
mechanisms of neutrophil apoptosis in vivo are differently regu-
lated than in vitro.32 It is well recognized that delay in neutrophil
apoptosis coincides with preservation of their functions.11,56
Another interesting finding that is worth to mention, is the
variability of Annexin-A1 expression found in our microarray
analysis. During an inflammatory insult, Annexin-A1 is known
to reduce inflammation of tissues by interacting with Annexin-
A1 receptors on neutrophils. In turn, upon the activation of these
receptors, leukocytes are directed to the site of infection and
target the source of inflammation directly.34,57 Consequently, this
inhibits neutrophils extravasation and downregulates the mag-
nitude of the inflammatory response. Without Annexin-A1 in
mediating this response, neutrophil extravasation is highly
active.33 Our data demonstrate increased early apoptotic events
in the blood, characterized by increased Annexin-V expression,
which likely represents a safety mechanism to promote a smooth
turnover of cells, since apoptotic cells suppress the production of
pro-inflammatory cytokines.56 Further, a shift occurs in periton-
eal neutrophils with reduced apoptosis rate, reflecting that pre-
servation of neutrophil functions is required at inflammatory
sites.
Consistent with our previous report, where neutrophils
altered their transcriptome and phenotype as they transited
from circulation into the oral cavity in humans,58,59 we also
observed pathways not traditionally associated with neutrophil
biology such as cell-to-cell signaling and interaction, IL-17
signaling and regulation of T-cell activation to be enriched in
murine blood when compared with BM and the peritoneum. A
large number of genes commonly expressed in T cells can also
be expressed by neutrophils. For example, ZAP70, a compon-
ent of the T-cell receptor complex, as well as CXCL9 and
CXCL10, which are known chemoattractant to T cells, is highly
regulated in neutrophils, and to finalize some activators of T
cell, pathways such as CCL2 and CCL20 can be expressed and
produced by activated neutrophils. More importantly, this
supports the idea that innate7,60 and adaptive immunity do
not function independently of each other, and neutrophils play
an important role in these interactions.7
Our data presented here is supported by de Kleijn et al.,61
where they looked at neutrophil subsets in humans, based
on expression of CD16/CD62L. After inducing endotoxemia,
they observed upregulation of genes involved in regulation of
immune responses and apoptosis. This upregulation of apop-
tosis associated pathways in both our murine model and their
human model allow us to speculate that similar mechanisms
drive changes in the neutrophil transcriptome in a mice model
of inflammation and an induced endotoxemia model in
humans.61 Interestingly, analysis of blood neutrophils from
trauma patients also identified the death receptor pathway,
antigen presentation pathway and oxidative phosphorylation
to be upregulated,41 similar to our results presented in this
study. These are significant observations, considering the dif-
fering species and study designs, method of PMN isolation and
microarray platforms.41
Our study demonstrates that neutrophils are highly plastic
cells where compartment cues determine a site-specific neutro-
phil transcriptome. The differences in the cell functions
between the three compartments allow us to suggest that the
neutrophil has a site-specific phenotype in each compartment.
This study focused on gene expression changes in response to a
Cellular & Molecular Immunology cmi201437.3d 16/5/14 20:45:34
Neutrophil gene expression profiles changes
FS Lakschevitz et al
11
Cellular & Molecular Immunology
sterile injury, which suggests that these responses may also be
extrapolated to other inflammatory models, including contact
hypersensitivity and autoimmune diseases, although further
studies will be required to confirm this.
AUTHOR CONTRIBUTIONS
FL designed, conducted experiments, analyzed data, inter-
preted experiments and wrote the paper; MV conducted
experiments and wrote the paper; CS conducted experiments;
and MG designed, interpreted experiments and wrote the
paper.
COMPETING CONFLICTS OF INTEREST
The authors declare no competing financial interests.
ACKNOWLEDGEMENTSThis work was funded by an operating grant from The Canadian
Institutes of Health Research (CIHR, Ottawa, ON, Canada) to MG. FL
is supported by CIHR Training Fellowship, TGF-53877 and the
Harron scholarship (Faculty of Dentistry, University of Toronto).
The authors give special thanks to Dionne White from The Flow
Cytometric Facility of the Immunology Department, Faculty of
Medicine of University of Toronto for assistance with flow cytometric
analysis, also to Guillermo Casallo and Pingzhao Hu of the Centre for
Applied Genomics, The Hospital for Sick Children, Toronto, Canada,
for assistance with microarray analysis and statistical analysis
respectively.
Supplementary Information accompanies the paper on Cellular &
Molecular Immunology’s website. (http://www.nature.com/cmi).
1 Nathan C. Neutrophils and immunity: challenges and opportunities.Nat Rev Immunol 2006; 6: 173–182.
2 Kobayashi SD, Deleo FR. Role of neutrophils in innate immunity: asystems biology-level approach. Wiley Interdiscip Rev Syst Biol Med2009; 1: 309–333.
3 Zhang XC et al. Gene expression in mature neutrophils: early responsesto inflammatory stimuli. Jo Leuk Biol 2004; 75: 358–372.
4 Subrahmanyam YV, Newburger PE, Weissman SM. RNA expressionpatterns change dramatically in human neutrophils exposed tobacteria. Blood 2001; 97: 2457–2468.
5 Cassatella MA. The production of cytokines by polymorphonuclearneutrophils. Immunol Today 1995; 16: 21–26.
6 Gosselin E, Wardwell K, Rigby W, Guyre P. Induction of MHC class IIon human polymorphonuclear neutrophils by granulocyte/macrophage colony-stimulating factor, IFN-gamma, and IL-3.J Immunol 1993; 151: 1482–1490.
7 Pelletier MEX et al. Evidence for a cross-talk between human neutrophilsand Th17 cells. Blood 2010; 115: 335–343.
8 Shaw JP, Chuang N, Yee H, Shamamian P. Polymorphonuclearneutrophils promote rFGF-2-induced angiogenesis in vivo. J SurgRes 2003; 109: 37–42.
9 Fridlender ZGEO et al. Polarization of tumor-associated neutrophilphenotype by TGF-beta: ‘‘N1’’ versus ‘‘N2’’ TAN. Cancer Cell 2009;16: 183–194.
10 Luo HR, LoisonF. Constitutive neutrophil apoptosis: mechanismsandregulation. Am J Hematol 2008; 83: 288–295.
11 Witko-Sarsat VR, Pederzoli-Ribeil M, Hirsh E, Sozzani S, CassatellaMA. Regulating neutrophil apoptosis: new players enter the game.Trends Immunol 2011; 32: 117–124.
12 Hudock KM EPet al. Delayed resolution of lung inflammation in IL-1RN2/2 mice reflects elevated IL-17A/G-CSF expression. Am JRespir Cell Mol Biol 2012; 47: 436–444.
13 Gamonal J EQet al. Delayed neutrophil apoptosis in chronic periodontitispatients. J Clin Periodontol 2003; 30: 616–623.
14 Sun CX. Rac1 is the small GTPase responsible for regulating theneutrophil chemotaxis compass. Blood 2004; 104: 3758–3765.
15 Hasenberg M ERet al. Rapid immunomagnetic negative enrichment ofneutrophil granulocytes from murine bone marrow for functionalstudies in vitro and in vivo. PLoS ONE 2011; 6: e17314.
16 Jiang N. The effect of inflammation on the generation of plasma DNAfrom dead and dying cells in the peritoneum. J Leuk Biol 2004; 77:296–302.
17 Shen H, Kreisel D, Goldstein DR. Processes of sterile inflammation.J Immunol 2013; 191: 2857–2863.
18 Schroeder A ESet al. The RIN: an RNA integrity number for assigningintegrity values to RNA measurements. BMC Mol Biol 2006; 7: 3.
19 Smyth GK. Linear models and empirical Bayes methods for assessingdifferential expression in microarray experiments. Stat Appl GenetMol Biol 2004; 3: 1–26.
20 Benjamini Y, Hochberg Y. Controlling the false discovery rate: apractical and powerful approach to multiple testing. J R Stat SocSer B (Methodol) 1995; 57: 289–300.
21 Huang DW, Sherman BT, Lempicki RA. Systematic and integrativeanalysis of large gene lists using DAVID bioinformatics resources. NatProtoc 2008; 4: 44–57.
22 Zheng Q, Wang XJ. GOEAST: a web-based software toolkit for GeneOntology enrichment analysis. Nucleic Acids Res 2008; 36: W358–W363.
23 Chu VT, Gottardo R, Raftery AE, Bumgarner RE, Yeung K. MeV1R:using MeV as a graphical user interface for Bioconductor applicationsin microarray analysis. Genome Biol 2008; 9: R118.
24 Yeung KY, Haynor DR, Ruzzo WL. Validating clustering for geneexpression data. Bioinformatics 2001; 17: 309–318.
25 Wang Y ETet al. Identifying the relative contributions of Rac1 and Rac2to osteoclastogenesis. J Bone Miner Res 2007; 23: 260–270.
26 Luhtala N. Parker R. LSM1 over-expression in Saccharomycescerevisiae depletes U6 snRNA levels. Nucleic Acids Res 2009; 37:5529–5536.
27 Wang F. The signaling mechanisms underlying cell polarity andchemotaxis. Cold Spring Harbor Perspect Biol 2009; 1: a002980–a002980.
28 Kumar S EUet al. Cdc42 regulates neutrophil migration via crosstalkbetween WASp, CD11b, and microtubules. Blood 2012; 120:3563–3574.
29 Moulding DA, Akgul C, Derouet M, White MR, Edwards SW. BCL-2family expression in human neutrophils during delayed andaccelerated apoptosis. J Leuk Biol 2001; 70: 783–792.
30 Kirschnek S EVet al. Molecular analysis of neutrophil spontaneousapoptosis reveals a strong role for the pro-apoptotic BH3-onlyprotein Noxa. Cell Death Differ 2011; 18: 1805–1814.
31 Atallah, M EW. et al. Constitutive neutrophil apoptosis: regulation by cellconcentration via S100 A8/9 and the MEK–ERK pathway. PLoS ONE2012; 7: e29333.
32 Kobayashi SD. Spontaneous neutrophil apoptosis and regulation ofcell survival by granulocyte macrophage-colony stimulating factor.J Leuk Biol 2005; 78: 1408–1418.
33 Perretti, M. Editorial: To resolve or not to resolve: Annexin A1 pushesresolution on track. J Leuk Biol 2012; 92: 245–247.
34 Vong L FXet al. Annexin 1 cleavage in activatedneutrophils: a pivotal rolefor proteinase 3. J Biol Chem 2007; 282: 29998–30004.
35 Arur S FOet al. Annexin I is an endogenous ligand that mediatesapoptotic cell engulfment. Dev Cell 2003; 4: 587–598.
36 Theilgaard-Monch K. The transcriptional program of terminalgranulocytic differentiation. Blood 2005; 105: 1785–1796.
37 Cheretakis C, Leung R, Sun CX, Dror Y, Glogauer M. Timing ofneutrophil tissue repopulation predicts restoration of innateimmune protection in a murine bone marrow transplantation model.Blood 2006; 108: 2821–2826.
Cellular & Molecular Immunology cmi201437.3d 16/5/14 20:45:34
Neutrophil gene expression profiles changes
FS Lakschevitz et al
12
Cellular & Molecular Immunology
38 Pillay JFP et al. In vivo labeling with 2H2O reveals a human neutrophillifespan of 5.4 days. Blood 2010; 116: 625–627.
39 Kobayashi SDFQ et al. Bacterial pathogens modulate an apoptosisdifferentiation program in human neutrophils. Proc Natl Acad SciUSA 2003; 100: 10948–10953.
40 Coldren CDFR et al. Functional and genomic changes induced byalveolar transmigration in human neutrophils. Am J Physiol LungCell Mol Physiol 2006; 291: L1267–L1276.
41 Kotz KTFS et al. Clinical microfluidics for neutrophil genomics andproteomics. Nat Med 2010; 16: 1038–1043.
42 Pelletier M, Micheletti A, Cassatella MA. Modulation of humanneutrophil survival and antigen expression by activated CD41 andCD81 T cells. J Leuk Biol 2010; 88: 1163–1170.
43 Davey MSFT et al. Failure to detect production of IL-10 by activatedhuman neutrophils. Nat Immunol 2011; 12: 1017–1018.
44 Zhang X, Ding L, Sandford AJ. Selection of reference genes for geneexpression studies in human neutrophils by real-time PCR. BMC MolBiol 2005; 6: 4.
45 Hu Y. Isolation of human and mouse neutrophils ex vivo and in vitro.Leuc Methods Protoc 2011; 844: 101–113.
46 Siemsen DW, Quinn M. Neutrophil isolation from nonhuman species.Methods Mol Biol 2007; 412: 21–34.
47 de Santo CFU et al. Invariant NKT cells modulate the suppressive activityof IL-10-secreting neutrophils differentiated with serum amyloid A.Nat Immunol 2010; 11: 1039–1046.
48 Kumar SFV et al. Cdc42 regulates neutrophil migration via crosstalkbetween WASp, CD11b, and microtubules. Blood 2012; 120:3563–3574.
49 Fridlender ZGFW et al. Transcriptomic analysis comparing tumor-associated neutrophils with granulocytic myeloid-derived suppressorcells and normal neutrophils. PLoS ONE 2012; 7: e31524.
50 Servant G, Weiner OD, Neptune ER, Sedat JW, Bourne HR. Dynamicsof a chemoattractant receptor in living neutrophils during chemotaxis.Mol Biol Cell 1999; 10: 1163–1178.
51 Zhelev DV, Alteraifi AM, Chodniewicz D. Controlled pseudopodextension of human neutrophils stimulated with differentchemoattractants. Biophys J 2004; 87: 688–695.
52 Wong CH, Heit B, Kubes P. Molecular regulators of leucocytechemotaxis during inflammation. Cardiovasc Res 2010; 86: 183–191.
53 Sun R GXet al. Identification of neutrophil granule protein cathepsin G asa novel chemotactic agonist for the G protein-coupled formyl peptidereceptor. J Immunol 2004; 173: 428–436.
54 Ye RD GOet al. International union of basic and clinical pharmacology.LXXIII. Nomenclature for the formyl peptide receptor (FPR) family.Pharmacol Rev 2009; 61: 119–161.
55 Suraneni P GPet al. The Arp2/3 complex is required for lamellipodiaextension and directional fibroblast cell migration. J Cell Biol2012; 197: 239–251.
56 Maianski NA, Maianski AN, Kuijpers TW, Roos D. Apoptosis ofneutrophils. Acta Haematol 2004; 111: 56–66.
57 Hannon R. Aberrant inflammation and resistance to glucocorticoids inAnnexin 12/2 mouse. FASEB J 2003; 17: 253–255.
58 Lakschevitz FS, Aboodi GM, Glogauer M. Oral neutrophiltranscriptome changes result in a pro-survival phenotype inperiodontal diseases. PLoS ONE 2013; 8: e68983.
59 Lakschevitz FS, Aboodi GM, Glogauer M. Oral neutrophils display asite-specific phenotype characterized by expression of T-cellreceptors. J Periodontol 2012; 84: 1493–1503.
60 Puellmann K GQet al. A variable immunoreceptor in a subpopulation ofhuman neutrophils. Proc Natl Acad Sci USA 2006; 103: 14441–14446.
61 de Kleijn S GRet al. IFN-c-stimulated neutrophils suppress lymphocyteproliferation through expression of PD-L1. PLoS ONE 2013; 8:e72249.
Cellular & Molecular Immunology cmi201437.3d 16/5/14 20:45:36
Neutrophil gene expression profiles changes
FS Lakschevitz et al
13
Cellular & Molecular Immunology

Author QueriesJournal: Cellular & Molecular ImmunologyPaper: cmi201437Title: Neutrophil transcriptional profile changes during transit from bone marrow to sites of inflammation
Query
Reference
Query
1 Please confirm the spelling of authors and affiliations.
2 Please supply location of the company.
3 Please supply location of the company.
4 Please supply location of the company.
5 Please supply location of the company.
6 Please supply location of the company.
7 Please supply location of the company.
8 Please supply location of the company.
9 Please supply the first six authors for Ref. 3.
10 Please supply the first six authors for Ref. 7.
11 Please supply the first six authors for Ref. 9.
12 Please supply the first six authors for Ref. 12.
13 Please supply the first six authors for Ref. 13.
14 Please supply the first six authors for Ref. 15.
15 Please supply the first six authors for Ref. 18.
16 Please supply the first six authors for Ref. 25.
17 Please supply the first six authors for Ref. 28.
18 Please supply the first six authors for Ref. 30.
19 Please supply the first six authors for Ref. 31.
20 Please supply the first six authors for Ref. 34.
Cellular & Molecular Immunology cmi201437.3d 16/5/14 20:45:37
Cellular & Molecular Immunology
21 Please supply the first six authors for Ref. 35.
22 Please supply the first six authors for Ref. 38.
23 Please supply the first six authors for Ref. 39.
24 Please supply the first six authors for Ref. 40.
25 Please supply the first six authors for Ref. 41.
26 Please supply the first six authors for Ref. 43.
27 Please supply the first six authors for Ref. 47.
28 Please supply the first six authors for Ref. 48.
29 Please supply the first six authors for Ref. 49.
30 Please supply the first six authors for Ref. 53.
31 Please supply the first six authors for Ref. 54.
32 Please supply the first six authors for Ref. 55.
33 Please supply the first six authors for Ref. 60.
34 Please supply the first six authors for Ref. 61.
For CMI office use only:
Layout % Figures/Tables/Boxes % References %
DOI % Error bars % Supp info (if applicable) %
Title % Colour % Acknowledgements %
Authors % Text % Author contribs (if applicable) %
Addresses % Methods (if applicable) % COI %
First para % Received/Accepted % Correspondence %
Display items % AOP (if applicable) % Author corrx %
Cellular & Molecular Immunology cmi201437.3d 16/5/14 20:45:37
Cellular & Molecular Immunology