Neuropsychological Assessment of Executive Functioning and ...
115
Loyola University Chicago Loyola University Chicago Loyola eCommons Loyola eCommons Dissertations Theses and Dissertations 2010 Neuropsychological Assessment of Executive Functioning and Its Neuropsychological Assessment of Executive Functioning and Its Association with Depressive Symptomology Association with Depressive Symptomology Erica Jean Kalkut Loyola University Chicago Follow this and additional works at: https://ecommons.luc.edu/luc_diss Part of the Clinical Psychology Commons Recommended Citation Recommended Citation Kalkut, Erica Jean, "Neuropsychological Assessment of Executive Functioning and Its Association with Depressive Symptomology" (2010). Dissertations. 230. https://ecommons.luc.edu/luc_diss/230 This Dissertation is brought to you for free and open access by the Theses and Dissertations at Loyola eCommons. It has been accepted for inclusion in Dissertations by an authorized administrator of Loyola eCommons. For more information, please contact [email protected]. This work is licensed under a Creative Commons Attribution-Noncommercial-No Derivative Works 3.0 License. Copyright © 2010 Erica Jean Kalkut
-
Upload
khangminh22 -
Category
Documents
-
view
0 -
download
0
Transcript of Neuropsychological Assessment of Executive Functioning and ...

Loyola University Chicago Loyola University Chicago
Loyola eCommons Loyola eCommons
Dissertations Theses and Dissertations
2010
Neuropsychological Assessment of Executive Functioning and Its Neuropsychological Assessment of Executive Functioning and Its
Association with Depressive Symptomology Association with Depressive Symptomology
Erica Jean Kalkut Loyola University Chicago
Follow this and additional works at: https://ecommons.luc.edu/luc_diss
Part of the Clinical Psychology Commons
Recommended Citation Recommended Citation Kalkut, Erica Jean, "Neuropsychological Assessment of Executive Functioning and Its Association with Depressive Symptomology" (2010). Dissertations. 230. https://ecommons.luc.edu/luc_diss/230
This Dissertation is brought to you for free and open access by the Theses and Dissertations at Loyola eCommons. It has been accepted for inclusion in Dissertations by an authorized administrator of Loyola eCommons. For more information, please contact [email protected].
This work is licensed under a Creative Commons Attribution-Noncommercial-No Derivative Works 3.0 License. Copyright © 2010 Erica Jean Kalkut

LOYOLA UNIVERSITY CHICAGO
NEUROPSYCHOLOGICAL ASSESSMENT OF
EXECUTIVE FUNCTIONING AND ITS ASSOCIATION
WITH DEPRESSIVE SYMPTOMOLOGY
A DISSERTATION SUBMITTED
TO THE FACULTY OF THE GRADUATE SCHOOL
IN CANDICACY FOR THE DEGREE OF
DOCTOR OF PHILOSOPHY
PROGRAM IN CLINICAL PSYCHOLOGY
BY
ERICA KALKUT
CHICAGO, ILLINOIS
MAY 2010

Copyright by Erica Kalkut, 2010 All rights reserved

ACKNOWLEDGMENTS
I would like to thank all of the people who made this dissertation possible. My
dissertation chair, Dr. Duke Han introduced me to neuropsychology and provided me
with the necessary resources to develop my research interests in the area of executive
functioning. Dr. Han’s guidance and expertise allowed me to stay on track with my goals,
and his encouragement made this process possible. I would also like to thank my
committee members, Dr. Scott Leon, Dr. Catherine Haden, and Dr. Amy Bohnert for
their valuable input throughout the process. Dr. Grayson Holmbeck’s feedback on early
drafts and Dr. Fred Bryant’s statistical advice were especially appreciated and helpful in
completing this dissertation.
I would also like to thank Loyola University Chicago for providing the funds with
which to complete my research and writing. A Dissertation Fellowship during the 2008-
2009 academic year allowed me to make discernable progress on my research.
iii

TABLE OF CONTENTS
ACKNOWLEDGMENTS iii
LIST OF TABLES vi
LIST OF FIGURES vii
ABSTRACT viii
CHAPTER ONE: INTRODUCTION 1
CHAPTER TWO: REVIEW OF RELATED LITERATURE 5 Definition of Executive Functioning 6 Components of Executive Functioning 10 Neuroanatomical Correlates of Executive Functioning 15 Gender Differences in Executive Functioning 23 Neuropsychological Assessment of Executive Functioning 24 Depressive Symptomology and Assessment 33 Summary and Current Study 38 Hypotheses 40 Relation between depressive symptoms and executive functions 40 Relation between D-KEFS and BRIEF-A 40 Factor structure of EF 40
BRIEF-A 41 D-KEFS 41
CHAPTER THREE: METHODS 50 Participants 50 Measures 51 WASI 51 D-KEFS 51 BRIEF-A 57 BDI-II 60 Procedure 60 Analyses 62 Relationship between Depressive Symptoms and Assessment (Hypothesis 1) 62 Comparison of D-KEFS and BRIEF-A (Hypothesis 2) 62 Factor Structure of Executive Functioning (Hypothesis 3) 62
CHAPTER FOUR: RESULTS 64 Descriptive Analyses 64 Relationship between Depressive Symptoms and Assessment (Hypothesis 1) 66 Comparison of D-KEFS and BRIEF-A (Hypothesis 2) 72 Factor Structure of Executive Functioning (Hypothesis 3) 74
iv

Analysis Strategy 74 BRIEF-A 75 D-KEFS 79 CHAPTER FIVE: DISCUSSION 83 General Intellectual Functioning, Depressive Symptomology, and Gender 83 Relationship between BRIEF-A and D-KEFS 87 What Constructs are Measured by the D-KEFS and BRIEF-A? 89 BRIEF-A 90 D-KEFS 91 Domain of EF: Unified or Separate? 92 Limitations of the Study and Directions for Future Research 94 Implications 95 REFERENCES 97 VITA 105
v
LIST OF TABLES
Table 1: Sample Characteristics 52
Table 2: Descriptive Statistics 65
Table 3: Standardized Coefficients for BRIEF-A Behavioral Regulation Regression Models 67
Table 4: Significant Gender Differences in Self-Reported Executive Functioning 68
Table 5: Standardized Coefficients for BRIEF-A Metacognition Regression Models 70
Table 6: Standardized Coefficients for D-KEFS Regression Models 71
Table 7: Bivariate Correlations between Executive Functioning Variables 73
Table 8: Goodness-of-Fit Statistics for BRIEF-A Factor Models 77
Table 9: Correlations between BRIEF-A Factors for Best Fitting Model: Three-Factor Model 78
Table 10: Goodness-of-Fit Statistics for D-KEFS Factor Models 80
Table 11: Correlations between D-KEFS Factors for Best Fitting Model: Five-Factor Model 81
vi

LIST OF FIGURES
Figure 1: Neural networks with frontal connectivity 17
Figure 2: BRIEF-A model 1 42
Figure 3: BRIEF-A model 2 43
Figure 4: BRIEF-A model 3 44
Figure 5: BRIEF-A model 4 45
Figure 6: D-KEFS model 1 46
Figure 7: D-KEFS model 2 48
Figure 8: D-KEFS model 3 49
vii
ABSTRACT The current study explored the construct of executive functioning and
neuropsychological measurement techniques used to assess executive functioning (EF).
Two current comprehensive measures of executive functioning include the Behavior
Rating Inventory of Executive Functioning-Adult Version (BRIEF-A) and the Delis-
Kaplan Executive Functioning System (D-KEFS). The BRIEF-A is a self-report
questionnaire that reportedly assesses behaviors associated with EF, and the D-KEFS is a
battery of tests that are objectively administered by a trained examiner to directly
measure different manifestations of EF ability. This study examined the relationship
between gender and general intellectual ability on EF and investigated each measure’s
construct validity in assessing EF in the context of symptoms of depression. The factor
structures of these measures of EF were assessed using confirmatory factor analytic
statistical techniques to determine their convergent validity in measuring EF domains in a
college sample. A three-factor model for the BRIEF-A and a five-factor model solution
for the D-KEFS emerged as the best fitting models for each measure. Overall, these
results have implications for the neuropsychological assessment of EF, and in particular
for assessing EF in clients experiencing depressive symptomology.
viii

CHAPTER ONE
INTRODUCTION
Executive functioning is a term used to describe higher-ordered cognitive
processes, such as creative thinking, problem solving and planning behavior (Zelazo &
Frye, 1998). Executive functioning has received a tremendous amount of attention in the
past decade, conceivably because of its importance to everyday human functioning and
the significant impairments that ensue for individuals with executive dysfunction. To
illustrate, a recent meta-analysis by Alvarez and Emory (2006) indicated that over 2500
scientific articles had been published in the past decade on executive functioning.
Despite the explosion in this new line of research, there are still inconsistencies in
definition and measurement. This is most likely due to the effect of ambiguities in how
to define executive functioning (Denckla, 1994) as well as substantial variability in the
measurement of executive functioning by psychologists (Alvarez & Emory, 2006). For
example, a survey of commonly used tests among 250 members of the International
Neuropsychological Society resulted in thirteen different assessments of executive
functioning (Butler, Retzlaff, & Vanderploeg, 1991), highlighting the need for consensus
on the description of these cognitive abilities to enable psychologists the capacity to
accurately assess and treat patients.
One definition of executive functioning in the academic literature is the set of
cognitive abilities involved in purposeful, goal directed behavior (Barkley, 1997, 2001;
1

2
Welsh, Pennington, & Grossier, 1991). Many researchers have discussed executive
functioning in terms of some of its individual components, namely working memory
(Barkley, 2001), attention (Rueda, Posner, & Rothbart, 2005), behavioral regulation
(Barkley 1997, 2001; Brocki & Bohlin, 2004), and set-shifting/inhibition (Baddeley,
Chincotta, & Adlam, 2001). These components have been identified mainly because of
their associations with the frontal regions of the brain. Individuals that have disorders or
conditions that negatively affect their frontal lobes often demonstrate significant deficits
in performance on tasks measuring these components (Stuss & Benton, 1984). For
example, individuals with attention deficit hyperactivity disorder (i.e., ADHD) have
greater difficulty on tasks of attention (Stins, Tolenaar, Slaats-Willemse, Buitelaar,
Swaab-Barneveld, Verhulst, Polderman, & Boomsma, 2005).
However, in addition to the cognitive aspect of executive functioning, researchers
and practitioners also recognize an observable behavioral component to executive
functioning. Problem solving, planning, and organization skills are often suggested as
outward behavioral aspects of executive functioning (Brocki & Bohlin, 2004; Gioia,
Isquith, Guy, & Kenworthy, 2000). These areas have received far less attention in the
literature due to the lack of assessment for “real world” behaviors outside of the
laboratory. However, as scientist-practitioners, clinical psychologists recognize the need
for multi-modal assessments across a number of situations. The addition of a self-report
measure, the Behavior Rating Inventory of Executive Function (BRIEF; Gioia & Isquith,
2004), has allowed greater attention toward the behavioral manifestations of executive
functioning. Despite the introduction of behavioral assessments like the BRIEF, further

3
research is necessary to determine the utility of self-report questionnaires in the
measurement of executive functioning.
While a consensus on the definition and measurement of executive functioning is
primary, consideration also needs to be given to the effects of physical and mental
conditions on assessment. Neuropsychological assessment purports to assess the
functioning of individuals in response to specific referral questions, often related to
psychiatric or neurological disorder (e.g., ADHD, epilepsy, stroke, etc). However, other
psychiatric disorders, such as depression, can interfere with the validity of these
assessments, affecting their viability in assessing what they intend to measure (e.g.,
executive functioning; Channon, 1996). Given the representation of depression in the
population, a disorder affecting one out of ten people, it is not unlikely that the patients in
need of assessment may suffer from depression (Elliot, 1998). In addition, depression is
often co-morbid with other physical and psychiatric illnesses (Schmitz, Wang, Malla, &
Lesage, 2007).
It is also known that depression affects performance on standardized assessments
of general cognitive ability and executive functioning (Elliot, 1998; Goodwin, 1997;
Hartlage, Alloy, Vazquez, & Dykman, 1993; Walter, Wolf, Spitzer, & Vasic, 2007). In
particular, depressed patients tend to show psychomotor slowing and suppressed
performance on tests requiring frontal lobe involvement (Veiel, 1997). However, it is
less clear how depression or depressive symptomology may differentially affect
traditional, examiner-administered assessment approaches versus self-report behavior
questionnaires in regard to executive functioning.

4
The current study assessed two neuropsychological assessments that claim to
measure a comprehensive construct of executive functioning. The main goal of this study
was to assess the viability of these assessment tools for the measurement of executive
functioning and their sensitivity to symptoms of depression. The following section
presents a review of the literature. Given the ambiguity in the literature on a definition of
executive functioning, research related to this topic are reviewed to provide a description
of executive functioning as it pertained to this study. The assessments used to measure
executive functioning are provided next, followed by a discussion of the association of
depression/depressive symptomology with assessment.
CHAPTER TWO
REVIEW OF RELATED LITERATURE
Executive Functioning Definition
Executive functioning has been defined as higher-ordered thinking that involves
self-directed, goal-oriented behavior (Lezak, 1982; Nauta, 1971). Divergent from general
cognitive ability or intelligence, executive functioning implies engagement in creative
thought, having open-mindedness towards new solutions as well as appropriate self-
regulatory skills (Delis, Lansing, Houston, Wetter, Han, Jacobson, Holdnack, & Kramer,
2007; Welsh, Pennington, & Grossier, 1991). Thus, executive functioning can be
considered an important aspect of human experience that may have allowed humans to
adapt to changing situations and come up with novel solutions to encountered problems
(Barkley, 2001).
Whereas general cognitive ability involves the acquisition of information,
executive functioning represents what people do with that information and how they do it
(Lezak, 1982). For example, devising a novel solution to a problem (executive function
ability) requires the use of one’s already acquired knowledge (general cognitive ability)
in order to brain-storm possible solutions, plan out the solution, and execute the plan
(Stuss, 1992). Although individuals typically use basic skill sets to engage in higher
ordered thinking, there is not necessarily a one-to-one relationship between basic and
higher ordered cognition. Recent research suggests that individuals may have
5

6
neuropsychological profiles in which their executive functioning ability is significantly
discrepant from their general intellectual ability (Delis et al, 2007). Whereas some
individuals have higher relative executive functioning, others may have lower relative
executive functioning compared to their general intellectual ability, indicating that
executive functions and general cognitive ability are not synonymous with each other.
Further evidence for the divergence between general cognitive ability and executive
functioning is illustrated in previous research with patients who have suffered frontal lobe
damage; these patients often have relatively spared general cognitive abilities but show
profound deficits in executive functioning (Lezak, Howieson, & Loring, 2004; Welsh,
Pennington, & Grossier, 1991).
Although executive functioning may overlap with general cognitive ability, it is
arguable that it should be considered a separate cognitive domain of its own (Denckla,
1994). Greater understanding of the executive functions is warranted. Executive
functioning, as a domain, has both neuroanatomical and psychodevelopmental
delineations. The development of executive functioning is progressive, beginning in
infancy and continuing into early adulthood (Welsh, Pennington & Grossier, 1991;
Barkley, 2001; Ylvisaker & Feeney, 2002). This development is thought to mirror the
development of the frontal lobes, so it naturally proceeds, from a neuroanatomical
viewpoint, that the cognitive processes involved in executive functioning have been
associated with the frontal lobes (Brocki & Bohlin, 2004; Casey, Giedd, & Thomas,
2000; Denckla, 1994; Tranel, Anderson, & Benton, 1994; Welsh, Pennington & Grossier,
1991). As the frontal lobes develop with increasing age, individuals become adept at

7
progressively more complex cognitive abilities (Denckla, 1994). Thus, the progression
of executive functioning is noteworthy in that the acquisition of cognitive skills aids in
the development of subsequent cognitive skills. For example, one theory posits that
behavioral inhibition allows for engagement in mental activity, such as working memory
(Barkley, 1997; 2001). Neuropsychological data supports the basis of such theories;
successful performance on executive functioning tasks is often dependent on successfully
developed ability on basic or simpler tasks (Anderson, Anderson, Northam, Jacobs, &
Catroppa, 2001; Kramer, et al, 2007).
Since executive functioning has only recently been recognized as a separate
domain of abilities, the developmental literature has been most helpful in identifying
individual components that comprise cognitive functioning (Denckla, 1994). For
example, there is a large literature base that includes research using tasks of planning and
attention (Brocki & Bohlin, 2004; Zelazo & Frye, 1998). However, there has been a
large amount of variability in the skills identified as executive functions. This may be
partially attributed to the tendency for the same ability to be called different names in the
literature (e.g., “switching” and “set-shifting”). In addition, this may also be because it is
difficult to identify each individual component of executive functioning. For example,
the literature suggests that the individual components of executive functioning, once
developed, work together to accomplish self-directed, purposeful actions, which makes it
difficult to tease each component apart (Barkley, 2001; Denckla, 1996).
Because of the inter-relatedness among executive functions, there has been some
debate in the literature as to whether executive functions constitute a unitary or multi-

8
faceted construct (Denckla, 1994; 1996; Gioia, Isquith, Retzlaff, & Epsy, 2002). From a
unitary domain standpoint, executive functions serve to carry out goal directed behaviors
with the components of executive functioning working together to achieve this goal
(Gioia et al, 2002). These individual components may be difficult for researchers to
identify and measure because of their close relationship to each other. For example, by
engaging in one task an individual is by definition disengaging from another. From this
viewpoint, the two skills of engaging and disengaging are inextricably tied and difficult
to separate from one another; they may be more readily identified by the end product
(e.g., task completion).
While there is an argument towards viewing executive functions as a unity
domain, many other researchers argue that the term executive functioning represents a
domain of separate processes (Denckla, 1994; 1996; Gioia et al, 2002). They maintain
that while components of executive functioning may relate to one another, they represent
separate, identifiable abilities. The neuroanatomical literature has helped to clarify this
position; much of the literature supporting this multi-faceted view of executive
functioning comes from observations of patients with frontal lobe damage. For example,
Salloway (1994) found similar presentations in patients with frontal system dysfunction
referred to an inpatient neuropsychiatry service over a year. He reported that these
patients typically presented as apathetic, disorganized, and/or disinhibited. Nauta (1971)
identified what seemed to be somewhat polar characteristics of frontal lobe patients. He
noted that patients tended to demonstrate either euphoric or apathetic mood changes,
which although quite opposite in nature, are identifiable aspects of frontal lobe damage.
9
He also reported that frontal lobe patients showed polar types of behavioral changes, such
as lack of initiation and perseveration.
Denckla (1996) refers to the behavioral components (e.g., inhibition, delayed
responding, set maintenance) as the “control processes” of executive functioning because
of their relationship to motor processes and behavioral output. Similarly, Barkley (1997)
argues that the behavioral aspects of executive functioning represent a separate
component of the domain. He elaborates that behavioral inhibition, in particular, is
central to other executive functions in that it allows for sustained mental attention to
occur.
Sustained mental activities represent additional aspects of executive functioning
in multi-dimensional models. It is hypothesized that these mental activities include such
skills as abstract reasoning, planning, sequential processing, and problem solving
(Denckla, 1996; Barkley, 2001). These “meta-cognitive” components within the domain
of executive functioning represent what occurs in the period of time between delay and
response, or during mental activity (Denckla, 1996) and are most often identified on
cognitive tasks within the developmental literature (e.g., problem solving).
Although traditional models of executive functioning tend to view the term as
encompassing a set of inter-related, but separate processes rather than a unitary process, it
is still unclear what specific processes define executive functioning. Since the processes
involved with executive functioning are often inter-related, it may be difficult to
distinguish executive functioning abilities from one another (Denckla, 1996).
Furthermore, there is often a lack of consensus on definitions of individual components

10
of executive functioning (Denckla, 1994). For example, in their respective “definitions,”
the neuroanatomical literature identifies patterns of behavior often observed in patients
with frontal lobe damage and the developmental literature identifies performance on
meta-cognitive tasks; though these bodies of research may represent convergent
constructs, they typically have developed in isolation of each other. The following
sections present an overview of the components of executive functioning from both
developmental and neuroanatomical lines of research.
Components of Executive Functioning
There has been a surge of research, particularly in the past decade, investigating
aspects of executive functioning. However, as presented in the previous section, there is
a great deal of overlap among the executive functions. As the purpose of this study is to
identify common aspects of executive functioning within neuropsychological assessment
and not to debate differences found within the literature (e.g., between developmental and
neuroanatomical literature bases), this section will serve as a discussion of frequently
identified components of executive functioning in the literature. These executive
functions include: behavioral inhibition, attention, self-regulation, set-shifting, abstract
reasoning/problem solving, and working memory.
Behavioral inhibition is frequently identified in both neuropsychological and
developmental research (Denckla, 1994). In addition to being described as an important
precursor to other executive functions, is also one of the earliest executive functions to
emerge (Barkley, 2001; Brocki & Bohlin, 2004). This ability to delay an immediately

11
gratifying behavior emerges in early infancy and during the first few months of life. It is
during these early years that infants also become better able to regulate their emotions
and control their behavior. However, although behavioral inhibition emerges early in
development, major developmental advances occur between seven and 12 years of age
(Brocki & Bohlin, 2004), which highlights the gradual progression of executive
functioning through childhood and into adolescence. Behavioral inhibition can be an
observable component of executive functioning, especially to caregivers and educators
working with children at different developmental stages (Denckla, 1996). For example, a
young child has great difficulty controlling his/her impulses and will require adult
reminders as to what behaviors are appropriate. On the other hand, an adolescent is more
capable of inhibiting his/her behavior; such as deciding not tell his/her friend an amusing
story during class when the teacher is talking. The successful development of behavioral
inhibition is evidenced by an individual’s ability to control an initial response in the face
of competing demands, and engage in a self-directed action (Barkley, 1997).
Closely related to behavioral inhibition is attention, because as one behavior is
being inhibited, another behavior is inherently being attended to (Denckla, 1994). This is
elaborated in Posner’s model of attention, which suggests that attention develops from a
reactive to a controlled response. Within this model, infants are initially reactive to
stimuli in their environment; their attention to external stimuli works to regulate their
internal distress through alerting and orienting responses (Rueda, Posner, Rothbart,
2005). As they continue to develop this reactive response, they are able to shift their
attention to external stimuli and orient towards it (Rueda, Fan, Candliss, Halparin,

12
Gruber, & Pappert, 2004). This basic attention is a precursor to a more sophisticated,
controlled attention which is characteristic of the processes in executive functioning.
As self-regulation (i.e., regulating internal distress) improves, children progress
from a reactive type of attention towards volitional or goal-oriented attention (Rueda,
Posner, Rothbart, 2005). Children begin to attend to stimuli not because it is distressing,
but because it may be new and interesting. An example of this developmental
progression in the literature is the AB task, where children must find a toy after seeing it
hidden behind one screen, and then after several trials, they must find the toy after they
see it hidden behind a new screen. Prior to the age of two, children will continue to
search for the toy behind the first screen because they are unable to disengage their
attention from the first screen (Zelazo & Frye, 1998). However, after the age of two
children are able to search for the toy behind the new screen, indicating that they are
better able to regulate their internal learned response (e.g., search behind the first screen),
to engage in the new, planned behavior.
This goal-directed attention continues to develop through adolescence (Anderson,
Anderson, Northam, Jacobs, & Catroppa, 2001; Casey, Trainor, Orendi, Schubert,
Nystrom, & Giedd, 1997). Frequently, individuals who are better able to withhold one
response in order to engage in another are considered to be more “flexible” in their
thinking (Zelazo & Frye, 1998). This hallmark aspect of executive functioning has been
cited as “set-shifting” in the neuropsychological literature. As behavioral inhibition and
self-regulation improves, children are better able to direct or “shift” their attention across

13
tasks and engage in cognitively stimulating activities (Zelazo & Frye, 1998). Similarly,
in adults, set-shifting allows for the ability to alternate between different response sets
(Baddeley, Chincotta, & Adlam, 2001; Wecker et al, 2005).
The uniqueness of executive functions is within this dual process of behavioral
control and cognition. As previously stated, executive functioning is the result of an
integration of multiple mental functions, which once developed, work with fluidity to
accomplish the goal of self-guided behavior in the individual (Barkley, 2001). While one
must have acquired the basic motor skills necessary for the behaviors previously
described in orienting, alerting, and attending, the executive component of these motor
skills involves the voluntary inhibiting of behaviors to engage in self-directed behaviors.
Once individuals are more adept at the behavioral regulation component of executive
functioning (i.e., they can sufficiently self-regulate their emotions, inhibit their behaviors
and delay their responding), it is thought that they are able to more efficiently engage in
the cognitive aspects of executive functioning (Barkley, 1997; Denckla, 1996).
Individuals are able to better mentally work through problems and figure out
solutions to tasks as they gain the ability to think about past experiences as well as a
hypothetical future (Barkley, 2001). The executive functioning ability to internally
represent information is termed working memory. Different from the ability to recall past
events, working memory involves the ability to manipulate mental activity, to integrate
the past with current perceptions while keeping an eye on the future (Barkley, 2001;
Denckla, 1996). As such, working memory is like a type of on-line mental system, where
an individual holds information just received in his/her head so that it may be used for a
14
subsequent task (e.g., hearing a list of numbers, mentally sequencing them, and repeating
them back in sequence).
Working memory aids in the ability to engage in more complex thought. An
“internal dialogue” develops that allows one to work through tasks without external
direction (Barkley, 1997). Effective working memory entails an “awareness of the
activity of the mind” (Denckla, 1996), an introspection into the working of one’s
thoughts. As working memory improves, an individual is able to work through problems
internally, considering possible solutions until the decision is made to engage. This
internal “trial and error” is much more efficient than actually trying out every solution
until the correct one is found, which can be impractical and time consuming.
Working memory has been frequently studied in the literature, and as such, has
been theoretically fractioned into component parts (Baddeley, Chincotta, & Adlam, 2001;
Smith & Jonides, 1998). Baddeley and Hitch (1974) proposed a three component model
of working memory, consisting of a “phonological loop,” the “visuospatial sketchpad,”
and the “central executive.” The central executive has been described as the ability to
divide attention between two simultaneous tasks or set-shifting, which was previously
discussed (Baddeley, Chincotta, & Adlam, 2001; Wecker et al, 2005). Evidence suggests
that the central executive or set-shifting aspect of working memory is affected in
individuals with frontal lobe lesions (Baddeley, Della Sala, Papagno, & Spinnler, 1997).
In addition, working memory has also been fractioned into verbal and non-verbal (or
spatial) components (Smith & Jonides, 1998). The verbal component is known as the
“phonological loop,” and the non-verbal component is labeled the “visuospatial

15
sketchpad.” This verbal/non-verbal component distinction has been supported by
neuroimaging studies with verbal and non-verbal working memory tasks indicating that
different brain regions are involved in the processing of each task (Smith & Jonides,
1998). The neuroanatomical distinctions of executive functioning are explored further in
the next section.
Neuroanatomical Correlates of Executive Functioning
Employment of the executive functions has been generally associated with the
prefrontal regions of the brain (Barkley, 1997; Brocki & Bohlin, 2004; Casey, Giedd, &
Thomas, 2000; Stuss, 1992; Tranel, Anderson, & Benton, 1994; Welsh, Pennington &
Grossier, 1991), thus executive functioning and frontal lobe functioning have become
interchangeable terms in the literature (Denckla, 1996; Tranel, Anderson, & Benton,
1995). While accurate, this delineation is grossly simplistic considering the complexity
of the executive functions and recent evidence implicating other brain regions involved in
executive functioning (Denckla, 1996). Yet, equating the frontal lobes and executive
functioning has made for a useful starting point, and as will be explored next, has allowed
for further investigation of the neuroanatomy of executive functioning.
The identification of the executive functions arose from clinical work with
patients experiencing difficulties within specific domains; therefore the delineation of
executive functioning became rooted in neuroanatomy (Denckla, 1996). The earliest and
most recognized example is that of Phineas Gage, who sustained an injury to his frontal
lobes and as a result suffered significant changes in his personality. Since that time, work
with patients with frontal lobe lesions or patients with disorders affecting the frontal

16
lobes has similarly found an association between the constructs of executive functioning
and impairment in the frontal lobes (Nauta, 1971; Stuss & Benton, 1984).
Brain injury studies provide further validation for the frontal lobes and associated
brain regions involved with executive functioning. While patients with cognitive deficits
typically show impairments that can be localized to specific brain areas, patients who
demonstrate impairments in executive functioning tend to show more global deficits
(Nauta, 1971; Malloy, Webster, & Russell, 1985), suggesting that executive functions are
associated with frontal circuitry in the brain rather than a localized brain area. The
frontal lobes have vast neural connections with other brain regions outside of the frontal
lobes (Stuss & Benson, 1984), which greatly expands the areas that may be involved in
the executive functions. For example, patients with damage to frontal-subcortical white
matter circuits often show deficits in executive functioning (Denckla, 1996).
Furthermore, the prefrontal cortex integrates information from other brain regions, such
as parietal and temporal regions of the central cortex and the limbic system (Nauta,
1971); breakdowns occurring at multiple points along frontal pathways could result in
executive functioning impairments.
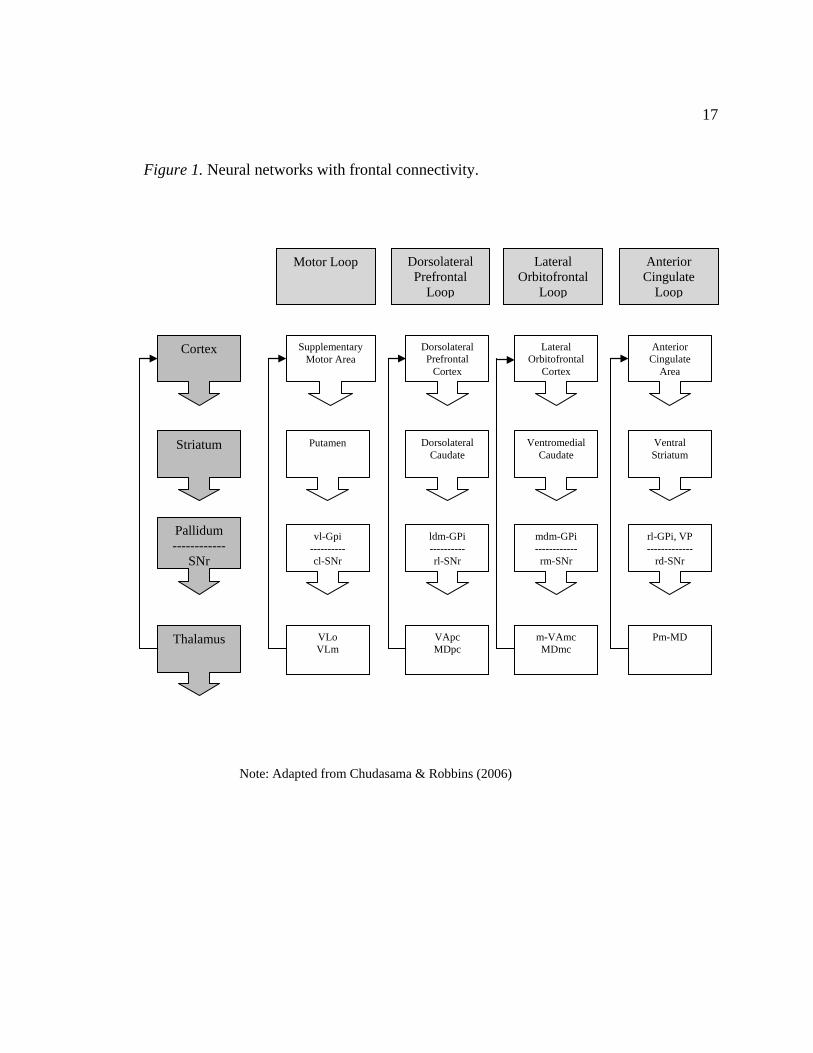
There are four neural networks with frontal lobe connectivity that are typically
identified in the literature: motor, dorsolateral prefrontal, lateral orbitofrontal and anterior
cingulate (see Figure 1; Chudasama & Robbins, 2006; Goodwin, 1997). These “frontal
loops” relay information from a specific region in the frontal cortex, through a level in
the striatum, and back to the frontal cortex via the thalamus. When a breakdown occurs
in the frontal circuitry, subsequent breakdowns occur in the frontal association areas,
17
Figure 1. Neural networks with frontal connectivity.
Note: Adapted from Chudasama & Robbins (2006)
Cortex
Striatum
Pallidum ------------
SNr
Thalamus
Supplementary Motor Area
Dorsolateral Prefrontal
Cortex
Lateral Orbitofrontal
Cortex
Anterior Cingulate
Area
Putamen Dorsolateral Caudate
Ventromedial Caudate
Ventral Striatum
vl-Gpi ---------- cl-SNr
ldm-GPi ---------- rl-SNr
mdm-GPi ------------ rm-SNr
rl-GPi, VP -------------
rd-SNr
Dorsolateral Prefrontal
Loop
Motor Loop Lateral Orbitofrontal
Loop
Anterior Cingulate
Loop
VLo VLm
VApc MDpc
m-VAmc MDmc
Pm-MD

18
resulting in impairments within several domains (Wolfe, Linn, Babikian, Knoeffel et al,
2004). As a result, patients with executive dysfunction may neuropsychologically appear
more severely impaired than they actually are. For example, individuals with frontal lobe
damage can have impairments in their ability to know how to respond (e.g., plan out a
strategy), which consequently can result in their inability to know what to correctly
respond (Lezak, Howieson, & Loring, 2004).
The dorsolateral prefrontal region is most often implicated in the operation of the
executive functions (Barkley, 1997; Brocki & Bohlin, 2004; Dennis, 1991; Casey, Giedd,
& Thomas, 2000; Stuss, 1992; Tranel, Anderson, & Benton, 1994; Welsh, Pennington &
Grossier, 1991). Neuroimaging studies have consistently found that the dorsolateral
prefrontal cortex is involved with executive functioning tasks, namely those involving
working memory (Conklin et al, 2007; Haut, Kuwabara, Leach, & Arias, 2000; Smith &
Jonides, 1998; Walter, Wolf, Spitzer, & Vasic, 2007; Wendelken, Bunge, & Carter, 2008)
and verbal fluency (Baldo, Shimamura, Delis, Kramer, & Kaplan, 2001; Lezak, 1982;
Malloy, Cohen, Jenkins, & Paul, 2006; Veiel, 1997).
Several studies have found increased activation in the dorsolateral prefrontal
cortex with performance on fluency tasks (Baldo, Shimamura, Delis, Kramer, & Kaplan,
2001; Lezak, 1982; Malloy, Cohen, Jenkins, & Paul, 2006; Veiel, 1997). Verbal fluency
tasks are typically considered tasks of executive functioning because they intend to
measure verbal generation as well as a patient’s ability to organize information into
meaningful categories (e.g., phonological or semantic clusters; Lezak, 1982). Imaging
studies indicate that the left dorsolateral prefrontal cortex is specifically involved in
19
verbal fluency tasks (Veiel, 1997). In contrast, design fluency tasks, which are the non-
verbal or visual analogues to verbal fluency tasks, were initially thought to be more
sensitive to right frontal lesions (Malloy et al, 2006). However, recent evidence suggests
that patients with right and left frontal lesions perform equally poor on a design fluency
task, suggesting that for non-verbal fluency tasks there may be bilateral frontal
involvement (Baldo et al, 2001).
Similarly, several studies have suggested lateralized processing in the dorsolateral
prefrontal cortex with working memory performance (Haut et al, 2000; Smith & Jonides,
1998). In particular, the right dorsolateral prefrontal cortex appears to process visual and
spatial aspects of working memory, whereas the left dorsolateral prefrontal cortex seems
to process verbal working memory (Smith & Jonides, 1998). However, some findings
indicate activation in the right dorsolateral prefrontal cortex for a letter-number
sequencing task, indicating that individuals may visualize verbal information in order to
effectively perform the task (Haut et al, 2000).
Despite the strong implication of the dorsolateral prefrontal cortex in working
memory tasks, several studies have found activation in additional brain regions, such as
the orbital frontal lobe, posterior parietal cortex (Haut et al, 2000; Wendelken, Bunge, &
Carter, 2008), and occipital cortex (Smith & Jonides, 1998). Similarly, a recent fMRI
study found that the medial dorsal frontal and the parietal cortex were both engaged
during a visual set-shifting task (Slagter, Giesbrecht, Kok, Weissman, Kenemans,
Woldroff, & Mangun, 2007). There are several plausible explanations for these
discrepant findings. It is possible that tasks that are considered to primarily invoke

20
dorsolateral prefrontal processing may also incorporate processing in other frontal striatal
circuits in addition to the dorsolateral prefrontal loop. For example, many assessments of
executive functioning may tap into additional skill sets, such as visual or motor abilities
(Denckla, 1996). Patients with frontal and non-frontal lesions have also been reported to
demonstrate poor performance on executive functioning tasks that involve these
additional skill sets (e.g., Wisconsin Card Sorting Test, Category Test, and Trail Making
Test; Malloy et al, 2006). Thus, it is possible that mixed neuroanatomical findings may
reflect impurities in measurement, and this inherent issue in the assessment of executive
functioning will be explored in greater detail in the following section. However, germane
to the current discussion, these results lend support to the employment of additional
regions outside of the dorsolateral prefrontal cortex in executive functioning.
There is further evidence in the literature for the involvement of additional frontal
circuits in executive functioning depending on task complexity. Some neuroimaging
studies suggest that the role of the dorsolateral prefrontal cortex in working memory may
be dependent on task load. For example, the dorsolateral prefrontal region has been
implicated in the manipulation aspect of working memory whereas the ventrolateral
prefrontal cortex has been implicated with the maintenance of information (over delayed
period) in working memory (Conklin et al, 2007; D’Esposito, Aguirre, Zarahn, Ballard,
Shin, & Lease, 1998). These findings point to a process-specific model for executive
functions. Within this model, different processes within a domain of executive
functioning have different neurobiological correlates (D’Esposito et al, 1998; Smith &
Jonides, 1998). Recent findings support the hypothesis that working memory processes

21
that involve higher task demand (e.g., manipulation of information as opposed to
maintenance of information) are executed in the dorsolateral prefrontal region (e.g., digits
backward; Conklin et al, 2007).
Multiple systems in addition to the dorsolateral prefrontal cortex are also
activated during attention and set-shifting processes (Cohen, Malloy, Jenkins, & Paul,
2006; Hampshire & Owen, 2006). A recent study by Hampshire and Owen (2006)
investigated the neuranatomical correlates of specific components of attentional control
(e.g., set-shifting). They found that although the dorsolateral prefrontal cortex was active
throughout a visual set-shifting task, additional neural correlates differed for other aspects
of attentional control. For example, the ventrolateral prefrontal cortex was active when
subjects divided their visual attention between tasks. In contrast, the orbitofrontal region
was activated when subjects were given feedback based on their performance;
specifically the lateral orbitofrontal region was activated during reversals resulting from
negative feedback and the medial orbitofrontal region activated by positive feedback.
Similarly, Chudasama and Robbins (2006) reported that reversals were affected by
lesions in the orbitofrontal region. These findings indicate that multiple brain regions
may be involved during complex tasks, with dorsal lateral prefrontal cortex
corresponding to performing visual search, ventrolateral prefrontal cortex corresponding
to shifts in attention, and lateral orbitofrontal regions corresponding to performing
reversals (alternating response sets).
In further support of these findings on the fractioned anatomical correlates of
attention, the ventrolateral prefrontal cortex and lateral orbitofrontal loop have also been

22
implicated in tasks involving initiation and inhibition (Cohen et al, 2006; Lezak,
Howieson, & Loring, 2004; Rubia, Smith, Woolley, Nosarti, Heyman, Taylor, &
Brammer, 2006). Hodgson and colleagues (2007) found that the ventrolateral frontal
cortex was involved in the inhibition of eye movements. Likewise, patients with right
prefrontal lateral cortex (Vendrell, Junque, Pujol, Jurado, Molet, & Grafman, 1995) and
orbitofrontal lesions have been shown to have impairment on go-no-go or Stroop tasks,
which require patients to withhold or inhibit responses (Malloy et al, 2006).
There are multiple other regions associated with attentional networks in addition
to the ones already mentioned. For example, subcortical structures are also implicated in
attentional networks involving motor components. Motor planning involves connections
between the basal ganglia and supplementary motor areas in the frontal cortex (Cohen et
al, 2006) and engagement in motor control involves connections between the cerebellum
and associated with frontal systems (Denckla, 1994). In addition, the anterior cingulate
and its corresponding network (see Figure 1) have been implicated in vigilance and
concentration (Jackson, Marrocco, & Posner, 1994; Lezak, Howieson, & Loring, 2004);
however, these regions appear to be important for novel, rather than automatic tasks, and
do not appear to be central to performance on executive functioning tasks (Baird, Dewar,
Critchley, Gilbert, Dolan, & Cipolotti, 2006). While these additional networks are
arguably involved in executive functioning, based on the literature to date, they appear to
be secondary to prefrontal systems.

23
Gender Differences in Executive Functioning
There is some evidence to suggest that there may be gender differences in
executive function abilities. Although some research indicates that there are no gender
differences in the executive functioning domains of verbal fluency, planning, and
organizing abilities (Welsh, Pennington, & Grossier), others have reported better female
performance on verbal fluency and working memory tasks (Anderson et al, 2001) and
set-shifting and problem solving tasks (Luboyeski, Han, Lansing, Holdnack, & Delis,
2009).
Gender differences that have been found in executive functions may be linked to
differences in frontal-lobe development. Significant differences in brain volume have
been reported for children between the ages of seven and 11 (Caviness, Kennedy,
Richelme, Rademacher, & Filipek, 1996). Specifically, female children achieve adult-
level brain volume between these ages they have less central white matter than same age
males and adult age brains. In contrast, male children between age 7 and 11 have greater
central white matter than same age females, but have not yet shown the reduction in brain
volume found in adults. At full adult development, during the early twenties, males have
approximately 10% greater overall brain volume than females. Although evidence
suggests that grey matter decreases around puberty (i.e., brain volume decreases),
females may undergo this synaptic pruning early, prior to age 7 to 11. Given these
findings, it is possible that females may also show earlier development of executive
functions development relative to males.

24
Even once adult-level brain size has been reached there may still be gender
related differences in brain structure. These gender differences may the result of hormone
levels (Bayer & Hausmann, 2009) as well as locations of androgen and estrogen receptors
in the brain (Caviness, 1996; Durston et al., 2001). Hormones, such as estrogen, have
been shown in some cases to affect both cerebral asymmetry and cognitive performance
in women. There is also evidence suggesting that males have significant age-related
increases in white matter volume in the left inferior frontal gyrus (Blakemore &
Choudhury, 2006) and the amygdala (Durston et al, 2001) as a result of the onset of
greater steroid levels in puberty, a pattern that is not evident with females. Thus, it is
possible that hormones may modulate brain structure and function, resulting in notable
differences in cognitive performance in men and women.
Neuropsychological Assessment of Executive Functioning
Initially, measurement of executive functioning was limited to assessments
developed prior to the 1950’s, before the evolution of contemporary neuropsychology
and understanding of the individual components of executive functioning (Shunk, Davis,
& Dean, 2006). Similar to the way in which the delineation of executive functioning
arose gradually from clinical work with patients, measurement of executive functioning
was compiled from assessments that were already in use. As psychologists were
beginning to identify characteristics of their patients as “executive functioning” deficits,
they were identifying aspects of the assessments they already had that tapped into these
skill deficits. For example, while conducting an evaluation of a patient using an
assessment of intellectual functioning, such as the Wechsler Adult Intelligence Scale

25
(WAIS), a psychologist might have noted that the patient also had difficulty in higher
ordered cognitive abilities, such as planning. Although the WAIS was not developed to
assess this latter skill per se, deficits that characterized executive dysfunction outside of
the area of general cognitive ability were often noted.
Although many neuropsychological assessments currently used to measure
executive functioning were not developed explicitly for this purpose, these assessments
that were developed to assess intellectual functioning, memory, and attention have been
adapted over the years to measure components of executive functioning. The lack of
specific assessments of executive functioning is not surprising considering the lack of
consensus and widely varying definitions of executive functioning (Denckla, 1994), as
presented in previous sections. However, the attention that executive functioning has
received recently in the literature is evidence of the movement towards agreement on
what the executive functions consist of and how they can be operationalized.
Currently, there is substantial variability in the measurement of executive
functioning by psychologists (Alvarez & Emory, 2006). One survey of members of the
International Neuropsychological Society indicated that thirteen different assessments of
executive functioning were currently in use by psychologists (Butler, Retzlaff, &
Vanderploeg, 1991). This is problematic since little is known about the ability of these
assessments to accurately measure aspects of executive functioning.
Furthermore, as previously discussed, there has been discussion as to whether the
executive functions should be conceived of as a unitary measurement, or in terms of its
separate components (Barkley, 1997; Denckla, 1994; Gioia, Isquith, Retzlaff, & Espy,

26
2002; Welsh, Pennington, & Grossier, 1991). If accepting the viewpoint of executive
functions as a set of separate components, using a composite measure of executive
functioning may fail to capture the multi-faceted nature of the domain. In contrast,
examining only the individual components of executive functioning may fail to represent
the inter-related processing of the components.
In addition, executive functioning often overlaps with other non-executive
domains, such as language and memory (Denckla, 1994; Miyake et al, 2000). Since
many traditional assessments were designed to assess processing within specific brain
regions, the measurement of executive functioning has been adapted from tests of these
domains (Alvarez & Emory, 2006). An example comes from memory tasks intended to
tap into the learning of information concepts, such as the Rey Auditory Verbal Learning
Test (RAVLT) or the California Verbal Learning Test (CVLT). Researchers have found
that such tests, like these that intend to assess rote memory, also frequently assess the
executive function of working memory. In addition, most assessments rarely produce a
“clean” measure of executive functioning abilities. For example, as seen in the above
example with the language based assessments RAVLT and CVLT, working memory can
involve the processing of either verbal or non-verbal information, which are each
processed in separate brain regions (Miyake et al, 2000).
Although historically assessments of executive functioning have been adapted
from other neuropsychological assessments, researchers have conducted factor analyses
on these assessments to investigate whether they measure an inclusive factor of executive
functioning. For example, Miyake and colleagues (2000) examined performance on five

27
commonly used tasks to measure executive functioning ability (Wisconsin Card Sorting
Test, Tower of Hanoi, random number generation, operation span, and dual tasking) and
found three separate factors: shifting, updating, and inhibition. Pineda and Merchan
(2003) found five separate factors based on performance on different tasks: organization
and flexibility from the Wisconsin Card Sorting Test, errors in Stroop reading and
naming, time to execute Stroop, performance on Trail Making Test A and B, and verbal
fluency. These findings were based on performance on multiple tasks of executive
functioning, which is not surprising given that many tests used to measure executive
functioning were not designed as such. Results pointing to multiple factors may be
attributable to these executive functioning tasks differing widely in content (Denckla,
1994; Miyake et al, 2000).
As example, a factor analysis conducted by Boone and colleagues (1998) with
four traditional assessments thought to measure executive functioning indicated that each
of these tests measured distinct capabilities. A mixed sample of healthy individuals and
patients presenting with various conditions in outpatient and inpatient clinics completed
neuropsychological testing on the following executive functioning assessments:
WCST, Stroop Test, Verbal Fluency Test (FAS), and Auditory Consonant Trigrams
(ACT). Results indicated that the WCST loaded onto one factor, the Stroop and Verbal
Fluency Tests loaded onto a second factor (along with the Digit Symbol subtest from the
WAIS-R), and the ACT loaded onto a third factor (along with VIQ, PIQ, Digit Span, and
Digit Symbol from the WAIS-R and the Rey-Osterrieth test). However, further analyses
indicated that there was overlap between the three factors, which yielded an ultimate one-

28
factor model that provided the best fit to the data. These results highlight that the
measures of executive functioning represent distinct, but inter-related abilities. However,
it is possible that these results reflect the overlap and distinction between measurements
of executive functioning, rather than the actual qualities of the domain.
Although the number of factors comprising executive functioning is unclear,
psychologists are converging on an accepted definition of executive functioning, which in
turn will hopefully inform appropriate measurement of executive functioning. This
process is driven forward by the emergence of comprehensive assessments of executive
functioning. Two such assessments are the Delis-Kaplan Executive Functioning System
(D-KEFS; Delis, Kaplan, & Kramer, 2001) and the Behavior Rating Inventory of
Executive Functioning (BRIEF; Roth, Isquith & Gioia, 2005). Both assessments intend
to encompass much of the domain of executive functioning; however these two
assessments appear strikingly different.
The D-KEFS was developed as a comprehensive measure of executive
functioning to be administered by a trained professional. There are no composite scores
to provide an index of overall executive functioning (Shunk, Davis, & Dean, 2006),
rather, the D-KEFS considers executive functioning in terms of its individual
components. The D-KEFS includes nine, individually administered tests that are
modifications of pre-existing measures, as well as the inclusion of novel tests created by
the authors and undeveloped tests from research studies (Shunk, Davis, & Dean, 2006).
These nine tests include: Trail Making Test, Verbal Fluency Test, Design Fluency Test,
Color-Word Interference Test, Card Sorting Test, Word Context Test, Twenty Questions
29
Test, Tower Test, and the Proverb Test. The D-KEFS measures planning, abstraction,
verbal and visual fluency, inhibition, and set-shifting aspects of executive functioning.
An advantage over previously used measures is that the D-KEFS allows for the
measurement of both basic-level and higher-ordered abilities. Thus, in addition to
performance scores, psychologists are also able to obtain process scores for their patients
(Shunk, Davis, & Dean, 2006).
Whereas the D-KEFS is an administered assessment of individual tasks requiring
executive functioning skills, the BRIEF is a questionnaire of executive functioning
problem behavior, with self-report and informant report forms. The BRIEF was designed
to assess the behavioral manifestations of executive functions (Gioia et al, 2002). As an
“ecologically valid measure,” the BRIEF assesses functioning in relation to the
environment (Gioia & Isquith, 2004). It purports to capture not only difficulties in
completing everyday executive tasks through the endorsement of problem behaviors, but
also the ability to engage in everyday executive tasks through the absence of problem
behaviors. The BRIEF-A, adult version, contains nine scales measuring the following
executive functioning areas: inhibition, shifting, emotional control, monitoring, initiating,
working memory, planning and organizing, organization of materials, and task
monitoring (Roth, Isquith & Gioia, 2005).
In addition to the nine subscales, the BRIEF-A manual provides two-factor
composite scales for behavioral regulation and metacognition, as well as a single-factor
composite for general executive functioning ability (Roth, Isquith & Gioia, 2005).
According to the BRIEF-A examiner’s manual, factor analyses were conducted on the

30
self-report form in both the normative sample (healthy 18-90 year olds) and a mixed
clinical/healthy sample of adults. The two-factor model (behavioral regulation and
metacognition) provided the best fit to the data in both samples, accounting for 73% and
76% of the variance, respectively. The two factors were reportedly highly correlated
with each other (r = .783-.798).
Although there is no other research to date that has further investigated the factor
structure of the BRIEF-A, several studies were found that conducted confirmatory factor
analyses of the parent version of the child BRIEF. Using a mixed sample of 374 children
(age 5-18), Gioia and colleagues (2002) tested four separate factor models using the 9
subscales of the parent BRIEF: a one factor model of a “Global Executive Composite,” a
two-factor model of a “Behavioral Regulation” factor including the Inhibit, Shift,
Emotional Control, and Self-Monitor subscales and a “Metacognition factor” including
the Initiate, Working Memory, Plan/Organize, Organization of Materials, and Task
Monitor subscales, a three factor model of a “Behavioral Regulation” factor including the
Inhibit and Self-Monitor subscales, a “Emotional Regulation” factor including the
Emotional Control and Shift subscales, and a “Metacognition” factor that included the
same subscales as the two-factor model, and finally a four-factor model of the
“Behavioral Regulation” and “Emotional Regulation” factors from the three-factor
model, an “Internal Metacognition” factor including the Initiate, Working Memory, and
Plan/Organize subscales, and a “External Metacognition” factor including the
Organization of Materials, and Task Monitor subscales. They found that the three factor
model provided the best fit to the data. However, in contrast, a second study with the

31
parent BRIEF found that the two factor, Behavioral Regulation and Metacognition,
model provided the best fit to a sample of 80 children with epilepsy (age 5-17; Slick,
Lautzenhiser, Sherman, & Eyrl, 2006).
Research was conducted between the BRIEF-A and other neuropsychological
assessments of executive functioning, as part of the standardization of the BRIEF-A and
as presented in the examiner’s manual (Roth, Isquith & Gioia, 2005). It was reported that
strong correlations (r = .50-.74) were found between most of the BRIEF-A subscales and
the Executive Dysfunction and Apathy subscales of the Frontal Systems Behavior Rating
Scale (FrSBe) and modest correlations (r = .47-56) were found between most of the
BRIEF-A subscales and the Disinhibition subscale of the FrSBe. However, the Shift and
Emotional Control subscales of the BRIEF-A were not significantly related to any of the
FrSBe subscales. Similar findings were reported between the BRIEF-A and the
Dysexecutive Questionnaire (DEX) (a subscale of the Behavioral Assessment of the
Dysexecutive Syndrome battery). Specifically, modest to strong correlations (r = .38-.84)
were found between all subscales of the BRIEF-A and the composite score of the DEX.
The convergent findings between the BRIEF-A and two other proposed measures of
executive functioning (i.e., FrSBe and DEX) indicate that similar constructs are measured
in all three assessments. However, these results are limited in that all assessments are
self-report measures and not objective assessments.
Though rating scales are often used clinically in conjunction with objective
measures to provide an ecological perspective, few studies have investigated the
relationship between these two types of assessments. A recent study conducted by Rabin

32
et al (2006) compared the performance of older, cognitively impaired adults on the
BRIEF-A and other objective neuropsychological assessments. In addition to the BRIEF-
A, participants were administered the CVLT-II, the Dementia Rating Scale-2 (DRS-2),
the WCST, D-KEFS Trail Making Test, D-KEFS Letter Fluency, and the Wechsler
Memory Scale-3 (WMS-III) Digit Span and Visual Reproduction subtests. A moderate
correlation (r = -.37) was found between the WMS-III Visual Reproduction subtest and
the Behavioral Regulation Index of the BRIEF-A self-report; however there were no
significant correlations between the BRIEF-A and any of the objective executive
functioning assessments mentioned above.
Similarly, Vriezen et al (2002) found that the parent report version of the child
BRIEF did not correlate with any objective executive functioning neuropsychological
assessments. Specifically, these researchers compared parent reported executive
functioning behaviors on the BRIEF with children’s performance on the Wechsler
Intelligence Scale for Children-III (WISC-III), the WCST, the Trail Making test part B,
and the Verbal Fluency test. Although the Metacognition Index of the BRIEF was
moderately correlated (r = -.30) with Verbal IQ on the WISC-III, there were no
significant relationships found between the BRIEF and the measures of executive
functioning.
Another study was found that investigated the relationship specifically between
the D-KEFS and the parent version of the child BRIEF. Parrish and colleagues (2007)
looked at the performance of epileptic and non-epileptic children (age 8-18) on executive
functioning measures. Children were assessed using the free sort description score of the

33
Card Sorting Test, the category switching accuracy score of the Verbal Fluency Test, and
the Inhibition Task timing score of the Color-Word Interference Test from the D-KEFS.
Parents of the children completed the parent version of the BRIEF and scores for the
Behavioral Regulation Index and Metacognition Index were computed. In this study
significant correlations were found between all three D-KEFS measures and the
Metacognition Index of the BRIEF.
Depressive Symptomology and Assessment
Depression is a common psychiatric mood disorder, marked by apathy, loss of
interest in pleasurable activities, and change in sleep and/or appetite (APA, 2000).
Clinical depression affects about 10% of the normal population; however it may be more
debilitating in people who also have another physical or psychological illness (Schmitz,
Wang, Malla, & Lesage, 2007). In particular, depression is often prominent in
individuals with neurological disorders, such as Parkinson’s disease, Huntington’s
disease, AIDS dementia, and stroke (Howieson, Loring, & Hannay, 2004). Given the
incidence of comorbidity in patients seeking neuropsychological evaluation, a thorough
understanding of the association of depression and assessment is warranted.
Previous research indicates that depression affects performance on standardized
assessments of executive functioning (Elliot, 1998; Goodwin, 1997; Hartlage, Alloy,
Vazquez, & Dykman, 1993; Walter, Wolf, Spitzer, & Vasic, 2007), but not consistently
on tests of general cognitive ability (Channon, 1996; Landro, Stiles, & Sletvold, 2001).
For example, depression in young, non-brain injured patients can interfere with
performance on tasks of mental processing and attention (Hartlage, Alloy, Vazquez, &

34
Dykman, 1993; Howieson, Loring, & Hannay, 2004). Furthermore, Channon (1996)
found significant differences between depressed and non-depressed individuals on the
Wisconsin Card Sorting Test, specifically in set-shifting and descriptions of sorting
categories; however differences were not found within the domain of verbal intellectual
ability.
Patients with depression are often reported to have structural brain abnormalities.
There is some evidence to suggest that depressed patients have a reduction in total frontal
lobe brain volume; however, functional abnormalities appear to be more distinct
(Goodwin, 1997). A meta-analysis of research on the cognitive performance of
depressed patients revealed that neuropsychological impairment in patients with
depression typically tends to be global and diffuse (Veiel, 1997). Similarly, Pardo and
colleagues (1996) found that depressed patients’ showed global slowing on visual
scanning tasks regardless of task difficulty. Walter, Wolf, Spitzer, & Vasic (2007)
demonstrated that depressed patients were significantly slower independent of task load.
However, in addition, these researchers found that depressed patients showed greater
activation in the left dorsolateral prefrontal cortex with highest cognitive load and greater
activation in the ventromedial prefrontal cortex during the control condition, indicating
that depressed patients may show a frontal compensatory mechanism.
This finding was congruent with other researchers who have found that although
depressed patients may show global impairment, greater deficits are often found on tasks
involving the frontal lobes (Veiel, 1997). Thus although depressed patients may show a
generally suppressed neuropsychological profile, including a slower processing speed,

35
performance on tasks involving frontal regions tend to be most affected. For example,
Veiel (1997) found in his meta-analysis that depressed patients had greater deficits on
tasks of mental flexibility and control, scanning and visuomotor tracking, visuospatial
functions, and verbal fluency than non-depressed patients.
Neuroimaging studies provide further information on the neurobiological aspects
of depression and the involvement of the frontal lobes. Mood disorders, like depression,
typically involve changes in affect, reward, motor activity, sleep, appetite, sexual interest,
concentration, and memory (Goodwin, 1997). Neuroimaging studies indicate that the
anterior structures and basal ganglia-thalamocortical pathways are often affected in
depressed patients (Goodwin, 1997). Since the basal ganglia-thalamocortical pathways
involve motor, oculomotor, dorsolateral prefrontal, lateral orbitofrontal, and anterior
cingulate circuits (Goodwin, 1997; Levin, Heller, Mohanty, Herrington, & Miller, 2007),
it is not surprising that depressed patients also show reduced metabolic activity in the left
dorsolateral prefrontal cortex, anterior-medial prefrontal cortex, the caudate nucleus, and
the paralimbic cortex, including the inferior-posterior frontal cortex, anterior temporal
cortex, and cingulated gyrus (Veiel, 1997). The dorsolateral prefrontal cortex typically is
thought to regulate executive functions in general (Veiel, 1997) and is thought to be
involved in verbal fluency tasks (Goodwin, 1997). The anterior-medial prefrontal cortex
is thought to subserve effortful processing (Veiel, 1997). The ventral frontal lobe,
including the paralimbic cortex, appears to be involved in the expression of affect; lesions
in this area also can result in disinhibition and deficits in visual discrimination (Goodwin,
1997) as well as memory functions (Veiel, 1997).

36
Landro, Stiles, and Sletvold (2001) found that depressed individuals had
suppressed performance on tasks involving selective attention as measured on the
Automated Psychological Test, working memory as measured on the Paced Auditory
Serial Addition Test, and verbal fluency as measured by the Controlled Oral Word
Association test (FAS). Differences were not found on measures of flexibility as
measured by the trail making test (TMT) A and B, short term memory as measured by
digits forward, verbal long term memory as measured by the Randt Memory Test,
visuomotor tracking as measured by the digit symbol task, motor function as measured by
the Automated Psychological Test, nonverbal long term memory as measured by the
Kimura Recurring Recognition Figure Test, and visuospatial function as measured by the
Block Design subtest of the WAIS. This study also compared intellectual functioning
between depressed and non-depressed groups using the Similarities subtest from the
WAIS found no significant differences between groups.
Similarly, Austin and colleagues (1999) found that depression affected
performance on sustained attention and set-shifting tasks. However, Pardo and
colleagues (1996) found that depressed patients showed no differences in sustained
attention as measured by reaction time on a visuospatial task. Mixed results may be the
result of construct differences between neuropsychological tasks. For example, there is
evidence that depression interferes with effortful attention as opposed to automatic
attention (Hartlage, 1993). Effortful attention is defined as engaging in thoughts
involving conscious awareness and inhibition of other pathways (Hartlage, 1993),
characteristics of executive functioning processes.

37
Some evidence suggests that selective impairments exist in depressed patients,
specifically for patients suffering from frontal lobe deficits. For example, patients with
Alzheimer’s disease and posterior cortical dementia have relative sparing of executive
functions, whereas frontal-subcortical dementia and Parkinson’s patients show greater
deficits in executive functioning (Elliot, 1998). In particular, depressed patients tend to
demonstrate a range of cognitive deficits; however the greatest impairment appears to be
on effortful, executive functioning tasks (Elliot, 1998; Levin et al, 2007).
Although the majority of research underscores the impact of depression on
executive functioning using objective assessments, there has been some literature
highlighting the relationship between depressive symptoms and self-report questionnaires
that intend to capture executive functioning. Rabin et al (2006) found significant
correlations between the Geriatric Depression Scale (GDS) and the Metacognition Index
and Behavioral Regulation Index of the BRIEF-A (r = .37 and .36, respectively) in older
adults. Similarly, the BRIEF-A examiner’s manual reported modest to moderate
correlations (r = .31-.54) between the GDS and BRIEF-A subscales in a sample of elderly
adults (Roth, Isquith, & Gioia, 2005).
The BRIEF-A examiner’s manual also reported significant correlations between
the BRIEF-A and the Clinical Assessment of Depression (CAD) and the Beck Depression
Inventory-II (BDI-II; Roth, Isquith, & Gioia, 2005). In the former analysis, the strongest
correlations (r =.37-.65) were found between the BRIEF-A and the Cognitive and
Physical Fatigue subscale of the CAD, with the Depressed Mood, Anxiety/Worry, and
Diminished Interest subscales of the CAD modestly to moderately correlated with the

38
BRIEF-A (r = .37-.62). Interestingly, however, the Task Monitor and Organization of
Materials subscales of the BRIEF-A were not significantly correlated with any of the
CAD subscales. With respect to the BDI-II, the BRIEF-A subscales were moderately
correlated with the BDI-II composite score (r = .45-.59), with the exception of the
Organization of Materials subscale, which was modestly correlated (r = .29). Overall,
these results indicate that the BRIEF-A is sensitive to depressive symptomology, as
reported on rating scales of depression.
Summary and Current Study
The findings presented above underscore the importance of studying the domain
of executive functioning and neuropsychological assessments which intend to measure
executive functions. While the literature has made significant strides in defining
executive functioning and describing specific areas comprising these higher-ordered
cognitive functions, additional research integrating neuroanatomical and
psychodevelopmental aspects of executive functioning is warranted. Discrepancies were
found in the neuropsychological assessment of executive functioning, with wide
variability in the components of executive functioning assessed and in the assessments
that are used. Further examination of assessments of executive functioning was necessary
to determine their ability to measure this cognitive domain as well as their usefulness in
clinical practice.
The recent emergence of two comprehensive assessments of executive
functioning has contributed to the demands of this field of study. However, these
assessments differ in terms of proposed constructs and measurement (objective versus

39
subjective or third-person versus first-person). It was unclear if these assessments also
measure divergent constructs. Previous research has investigated executive functioning
with patients suffering from neurological disorders involving impairment within this
domain. However, few studies have investigated the relationship between depressive
symptomology and executive functioning assessment, despite the shared neurobiological
substrates implicated in both. Research that has examined the relationship between
depression and executive functioning has often used clinical populations (e.g., inpatient
or outpatient samples). Though study of these clinical populations has provided
invaluable information for understanding executive functioning, further study was needed
within non-clinical populations.
In light of the limitations in the literature to date highlighted above, the current
study sought to extend the literature in several respects. The current study investigated
the construct of executive functioning in a healthy, mixed-gender young adult population,
during a period of time when executive functioning abilities have been proposed to be at
their peak (Welsh, Pennington & Grossier, 1991; Barkley, 2001; Ylvisaker & Feeney,
2002). This study compared the construct of executive functioning through the use of
two comprehensive assessments of executive functioning: the D-KEFS and the BRIEF-A.
Given the association in the literature between depression and the frontal lobes and the
influence of depressive symptomology on performance on neuropsychological tasks, the
current study also compared the relationship of depressive symptomology to performance
on each of these assessments. Possible gender differences in executive functioning were
also explored.

40
Hypotheses
Relationship of EF to gender and depressive symptomology
It was predicted that scores on both the BRIEF-A and D-KEFS were affected by
depressive symptomology, based on previous literature. However, it was predicted that
the subjective executive functioning measure (i.e., the BRIEF-A) was more strongly
correlated with the self-report depressive symptom rating scale (i.e., the BDI-II) than the
objective executive functioning measure (i.e., the D-KEFS). It was also predicted that
there would be gender differences in performance on both executive function measures,
with females showing greater executive functioning ability. Given the higher incidence of
depressive symptomology in females, analyses explored whether there were significant
gender by depressive symptom interactions associated with executive functioning scores.
Relation between D-KEFS and BRIEF-A
It was predicted that subscales of the Metacognition Index of the BRIEF-A would
be related to the Card-Sorting, Verbal Fluency, and Color-Word Interference tests of the
D-KEFS, based on previous work from Parrish and colleagues (2007).
In exploratory analyses, it was predicted that the subscale Shift of the BRIEF-A
would be significantly related to each of the D-KEFS switching tasks, the Inhibit subscale
of the BRIEF-A would be related to the Inhibit task of the Color-Word Interference test
of the D-KEFS, and the Initiate subscale of the BRIEF-A would be related to the Letter
and Category subtests of the D-KEFS.
41
Factor Structure of EF
BRIEF-A
Three factor models, based on previous literature, were examined using the nine
BRIEF-A subscales (Inhibit, Shift, Emotional Control, Self-Monitor, Initiate, Working
Memory, Plan/Organize, Organization of Materials, and Task Monitor). Model 1
consisted of a one-factor model (global executive functioning factor; see Figure 2).
BRIEF-A Model 1 was based on the theoretical assumption that there is significant
overlap between executive functioning abilities. The following BRIEF-A theoretical
models were based on the assumption that executive functioning abilities are distinct.
Model 2 consisted of a two-factor model, as provided in the BRIEF-A manual
(behavioral regulation and metacognition factors; see Figure 3). Model 3 was a three-
factor model of a behavioral regulation factor, an emotional regulation factor, and a
metacognition factor (see Figure 4). Model 4 was a four-factor model of an internal
metacognition factor, an external metacognition factor, an emotional regulation factor,
and a behavioral regulation factor (see Figure 5).
D-KEFS
Based on previous research three factor models were examined using seven tasks
from five D-KEFS subtests (Trail Making Test, Verbal Fluency, Design Fluency, Color-
Word Interference, and Card Sorting). Model 1 consisted of a one-factor model (unitary
construct model of executive functioning; see Figure 6). D-KEFS Model 1 was based on
the theoretical assumption that executive functioning abilities and neuropsychological
tasks overlap. Model 2 consisted of a three-factor model, based on the work of Miyake

42
Figure 2. BRIEF-A model 1.
Global Executive Composite
Inhibit
Task Monitor
Org. of Materials
Working Memory
Plan/Organize
Shift
Emotional Control
Self-Monitor
Initiate

43 Figure 3. BRIEF-A model 2.
Behavioral Regulation
Metacognition
Task Monitor
Org. of Materials
Plan/Organize
Initiate
Working Memory
Self-Monitor
Emotional Control
Inhibit
Shift

44 Figure 4. BRIEF-A model 3.
Metacognition
Emotional Regulation
Behavioral Regulation Inhibit
Self-Monitor
Emotional Control
Shift
Task Monitor
Org. of Materials
Plan/Organize
Working Memory
Initiate

45
Figure 5. BRIEF-A model 4.
Internal
Metacognition
Initiate
Working Memory
Emotional Regulation
Behavioral Regulation
Shift
Emotional Control
Self-Monitor
Inhibit
External
Metacognition
Plan/Organize
Org. of Materials
Task Monitor

46 Figure 6. D-KEFS model 1.
Global
Executive
TMT Switching
Letter Fluency
Category Switching
Design Switching
CWI Inhibition
CWI Switching
CS Sort Recognition

47 et al (2000), including a set-shifting factor, an inhibition factor, and a fluency factor (see
Figure 7). The factor analysis performed by Miyake et al (2000) found that performance
on five neuropsychological assessments tapped into three factors of executive functioning
skills, rather than a separate factor for each assessment. Thus, D-KEFS Model 2 was
based on the theoretical assumption that neuropsychological tasks overlap in their
measurement of executive functioning skills. Model 3 consisted of a five-factor model,
based on the primary measures of each subtests of the D-FEFS (see Figure 8). D-KEFS
Model 3 was based on the theoretical assumption that each neuropsychological task
measures a separate executive functioning ability.

48 Figure 7. D-KEFS model 2.
TMT Switching
Letter Fluency
Category Switching
Design Switching
CWI Inhibition
CWI Switching
CS Sort Recognition
Set-Shifting
Inhibition
Fluency

49
Figure 8. D-KEFS model 3.
Letter Fluency
Category Switching
Design Switching
CWI Inhibition
CWI Switching
CS Sort Recognition
TMT Switching
Motor EF
Verbal EF
Non-verbal EF
Inhibition/ Switching
Problem Solving

CHAPTER THREE
METHODS
Participants
One hundred college students were recruited from an introductory psychology
class from a midsized university in the Midwest. Prior to study participation, students
were provided with a brief description of the study as well as the nature of the research.
Students were invited to participate if they had not yet participated in the study, met age
criteria (over age 18) and spoke fluent English. Exclusion criteria included the following,
as they could affect performance on neuropsychological assessments: a previous history
of electroconvulsive therapy (ECT), a previous history of neurological illness, a previous
history of treatment for alcohol or drug dependence or abuse, and currently taking
medication that affects the ability to think clearly or any kind of neurological medication.
Students provided informed consent and were administered a battery of cognitive,
neuropsychological, and behavioral assessments by trained graduate or advanced
undergraduate psychology research assistants. Assessments took up to four hours to
complete, and students received course credit for their participation. All procedures were
supervised by a licensed clinical neuropsychologist and approved by the university’s
institutional review board.
Data collection took place over a period of two years during both fall and spring
semesters. Five students out of the 100 students recruited had incomplete data due to
50

51
administrator errors, thus a total of 95 students were included in the current study (82%
female). Demographic data for the sample are presented in Table 1. The majority of the
sample was 19 years of age, female, in their first year of college (12 years of education),
and Caucasian.
Measures
WASI
The Wechsler Abbreviated Intelligence Scale (WASI; Wechsler, 1999) was
designed to provide an abbreviated measure of intellectual functioning (Full Scale IQ)
and consists of four subtests (Block Design, Vocabulary, Similarities, and Matrix
Reasoning). The WASI was nationally standardized with a representative sample of 2,
245 individuals aged 6-89 years. The WASI has been demonstrated to have good
reliability and validity. According to the WASI manual, the WASI four-subtest FSIQ
score has a reliability coefficient of .96 for ages 17-19 and 20-24, which is consistent
with reliability coefficients for a FSIQ obtained from the full Wechsler Adult Intelligence
Scale-Third Edition (WAIS-III). The WASI manual reports that the WASI FSIQ and the
WAIS-III FSIQ are highly correlated (r = .92). Administration of the WASI takes
approximately 30 minutes.
D-KEFS
The Delis-Kaplan Executive Functioning System (D-KEFS; Delis, Kaplan, &
Kramer, 2001) was developed to be a comprehensive measurement of executive
functioning abilities. The D-KEFS contains normative data for age 8-89, representative of
the U.S. population according to the 2000 United States Census, with gender,

52
Table 1
Sample Characteristics
(N= 95)
Mean Standard Deviation
Age 19.09 2.21
Education 12.54 0.95
Number Percent of Sample
Gender
Male 17 17.9
Female 78 82.1
Race/Ethnicity
Caucasian 72 75.8
African American 4 4.2
Latino 8 8.4
Asian 8 8.4
Middle Eastern 1 1.1
Biracial/Other 2 2.1

53
race/ethnicity, years of education, and geographic region stratified by age group. Five
D-KEFS tests were selected for use in this study: Trail Making, Design Fluency, Verbal
Fluency, Color-Word Interference and Card Sorting Tests. Administration of these five
subtests of the D-KEFS takes approximately 45 minutes.
The Trail Making test is a motor task consisting of a visual cancellation task, and
a series of connect-the-circle tasks (Delis, Kaplan, & Kramer, 2001). The latter tasks
require the participant to make serial connections between only numbers (e.g., 1, 2, 3),
only letters (e.g., A, B, C), alternating connections between numbers and letters (e.g., A,
1, B, 2, etc.). There is also a motor speed task which requires the participant to connect
circles following a dotted line, which, together with the number sequencing and letter
sequencing tasks, are intended to serve as component tasks for the letter-number
switching task. This switching task is intended to serve as the primary executive
functioning task for Trail Making. The D-KEFS Trail Making Switching Task uses a
similar format to the Trails B test, a commonly used neuropsychological assessment
considered to measure abstraction, set maintenance, and flexibility (Malloy et al, 2006).
The D-KEFS Trail Making Test utilizes completion time as the primary performance
measure. Internal consistency for the D-KEFS Trail Making Test was reported to be in
the moderate to high range (Delis, Kaplan, & Kramer).
The Verbal Fluency Test is a verbal task consisting of three conditions: Letter
Fluency, Category Fluency, and Category Switching (Delis, Kaplan, & Kramer, 2001).
The Letter Fluency condition, similar to the Controlled Oral Word Association Test,
requires the participant to generate words that begin with a certain letter (e.g., F, A, or S).

54
The Category Fluency condition, which is intended to serve as a component task for the
switching condition, requires participants to generate words that belong within a semantic
category (e.g., animals and boy’s names). The Category Switching condition requires
participants to alternate between naming words within two semantic categories (e.g.,
name a fruit, then a piece of furniture, then a fruit, etc.). The Letter Fluency and
Category Switching conditions were intended to measure aspects of executive
functioning, and typically are more sensitive to frontal lobe lesions than Category
Fluency (Delis, Kaplan, & Kramer, 2001). The Letter Fluency task is thought to measure
initiation and dual processing attention (e.g., observing multiple rules of the task). The
Category Switching condition is intended to measure fluency, flexibility, and set-shifting.
The primary performance measure for Verbal Fluency tasks is the total number of correct
responses in 60 seconds; however the Category Switching condition also includes a
primary measure of switching accuracy, which measures the correct number of switches
between categories. Internal consistency for the Verbal Fluency Test was reported to be
α = .80 and .85 for Letter Fluency and α = .53 and .59 for Category Switching (for ages
16-19 and 20-29, respectively; Delis, Kaplan, & Kramer, 2001).
The Design Fluency Test was designed as a nonverbal analogue to the Verbal
Fluency Test and consists of three conditions: Filled Dots, Empty Dots, and Switching.
In each condition, the participant is required to draw as many designs as possible in 60
seconds. The Filled Dot condition presents the participant with boxes containing filled
dots. The participant is required to draw different designs in each box using filled dots.
In the Empty Dot condition, the participant is presented with boxes containing an equal
55
number of filled and empty dots. The participant is asked to draw different designs using
only the empty dots and inhibit from using the filled dots. In the Switching condition, the
participant is again presented with boxes containing both filled and empty dots and asked
to draw designs by alternating connections between filled and empty dots. The Filled and
Empty Dot conditions were intended to serve as component tasks for the Switching
condition. The primary performance measure for the Design Fluency Test is number of
correct designs drawn in each condition. Although the Empty Dot condition requires the
participant to inhibit from using the filled dots, significant differences were not found
between this condition and the Filled dot condition in the standardization sample of the
D-KEFS, indicating that the Empty Dot condition did not require additional burden, or
higher level ability in healthy individuals. The Switching condition, however, was
intended as a measure of set-shifting. Internal reliability was not reported for Design
Fluency due to item interdependence (Delis, Kaplan, & Kramer, 2001).
The Color-Word Interference Test was designed to be similar in structure to the
Stroop Test and consists of four conditions: Color Naming, Word Reading, Inhibition,
and Inhibition/Switching. The Color Naming and Word Reading conditions were
designed as component measures for the Inhibition and Inhibition Switching conditions.
The Color Naming condition requires participants to name the color of ink patches. The
Word Reading condition requires participants to read color words printed in black ink.
The Inhibition condition requires participants to read the color of ink that words are
printed in. Like the traditional Stroop Test, the Inhibition condition of the D-KEFS
intends to measure the executive function of inhibition since the participant must inhibit

56
reading the words in order to name the dissonant ink colors that the words are printed in.
The Inhibition/Switching condition requires the participant to alternate between reading
the printed color words and naming the dissonant ink colors. This condition is intended
to measure both verbal inhibition and flexibility or set-shifting. The primary
performance measure for the Color-Word Interference Test is time taken to complete
each condition. Internal consistency for the Color Naming and Word Reading Tests was
reported to be high (α = .75-82 for ages 16-29; Delis, Kaplan, & Kramer, 2001).
The Card Sorting Test was designed to measure concept-formation and problem
solving (Delis, Kaplan, & Kramer, 2001). It consists of two conditions: Free Sorting and
Sort Recognition. In the Free Sorting condition, the participant is required to sort and
describe the sorting rules of two sets of six cards that can be sorted into two groups, with
three cards in each group. In the Sort Recognition condition the examiner sorts the two
sets of cards into two groups, with three cards in each group, and the participant is
required to describe how the cards have been sorted in both groups. The cards can be
categorized into a maximum of eight target sorts: three based on verbal-semantic
information (e.g., clothing and parts of the body) and five based on visual-spatial features
(e.g., filled triangles and unfilled triangles). Thus, the Card Sorting Test intends to
provide measures of verbal and non-verbal problem solving. The Free Sorting condition
is also intended to measure the executive function of initiation, as the participant must
spontaneous sort the sets. The primary performance measures for both conditions of the
Card Sorting test is the description score (the participant’s ability to describe the sorting
rules), which intends to measure concept formation. The Free Sorting condition also

57
provides a primary performance measure of number of correct sorts. This measure is
indicated for assessing individuals with impairments in expressive language and is
thought to be less informative about higher level functioning. In contrast, the description
score measure is thought to provide information about the ability to transfer knowledge
into behavior and flexibility in thinking. Internal consistency for the Free Sorting
Condition was reported to be moderate to high (α = .73-.77 for ages 16-29; Delis, Kaplan,
& Kramer, 2001).
BRIEF-A
The Behavior Rating Inventory of Executive Function, Adult Version (BRIEF-A;
Roth, Isquith & Gioia, 2005) is a 75 item self-report that intends to capture executive
functioning across a range of situations and takes about 10-15 minutes to complete.
Participants report if a behavior is “never,” “sometimes,” or “often” a problem. The
BRIEF-A includes scales which provide information on clinical range deficiencies within
a Global Executive Composite (GEC), two indices: the Behavioral Regulation Index
(BRI) and the Metacognition Index (MI), and nine subscales. The BRI includes the
Inhibit, Shift, Emotional Control, and Self-Monitor scales. The MI includes Initiate,
Working Memory, Plan/Organize, Organization of Materials, and Task Monitor scales.
Higher scores on BRIEF-A scales indicate more problem behaviors within the particular
executive skill component. The BRIEF-A also includes three validity scales: Negativity,
Infrequency, and Inconsistency. The BRIEF-A has been standardized and validated for
ages 18-90. Internal consistency was reported at α = .93-.96 for the indexes (MI and
BRI) and α = .73-.90 for the clinical subscales (Roth, Isquith, & Gioia, 2005).

58
The Behavioral Regulation Index (BRI) is composed of Inhibit, Shift, Emotional
Control, and Self-Monitor subscales (Roth, Isquith, & Gioia, 2005). The BRI contains
items that intend to assess the ability to exhibit appropriate regulatory functions. The
Inhibit subscale contains eight items and intends to measure the behavioral inhibition
component of executive functioning, which includes impulse control. Individuals who
are within the clinical range on this subscale may display higher levels of physical
activity, have tendencies to interrupt others or engage in disruptive behavior. The Shift
subscale contains six items that intend to assess flexibility and the ability to attend to
various tasks as needed. Participants in the clinical range on this subscale may show
greater difficulty shifting their attention from one task to another, may be inflexible in
their responses and have an inability to transition between subject matters. The
Emotional Control subscale contains 10 items. This subscale intends to assess the
executive function of self regulation of affect, motivation and arousal. Adults with
deficiencies in this component of executive functioning may have a difficult time
regulating their emotions and may display inappropriate or overly exaggerated emotional
responses. The Monitor subscale contains five items and intends to assess the ability to
monitor behavior. The items represent the adult’s awareness of how his/her behaviors
influence others. The adult who shows deficit in this ability may have difficulty
monitoring his/her work on given tasks and displays an inability to understand one’s
effects on others.
The Metacognition Index (MI) is composed of the Initiate, Working Memory,
Plan/Organize, Task Monitor, and Organization of Materials subscales (Roth, Isquith, &
59
Gioia, 2005). The MI is supposed to assess the adult’s ability to initiate and work
through cognitive tasks. An important component of the MI is intended to be working
memory, which is an executive function that aids the adult in engaging in problem
solving behavior. The MI is also supposed to measure the ability to plan, organize, and
engage in problem solving. The Initiate subscale contains eight items which intend to
assess the ability to get started on a task. It asks questions about an individual’s ability to
generate ideas and/or problem solving strategies. Participants with difficulties in this
area may have trouble beginning a task. The Working Memory subscale contains 12
items. This subscale is supposed to assess an individual’s ability to hold and manipulate
information. The Working Memory subscale includes items asking about the ability to
complete tasks once started and being able to remember the steps have greater difficulty
completing tasks, forgetting what they are working on, and having difficulty carrying out
multiple tasks in succession. The Plan/Organize subscale contains 13 items. This
subscale is supposed to assess an individual’s proficiency in planning current and future
behaviors, as well as the ability to engage in efforts to complete these tasks. The Task
Monitor subscale contains six items which are supposed to assess an individual’s
awareness of his/her performance on tasks that they have started. This subscale also
intends to measure the extent to which an individual is able to realize mistakes or errors
that he/she is making on a task. The Organization of Materials subscale contains eight
items which are supposed to assess an individual’s ability to organize his/her
belongingness in an orderly manner.

60
BDI-II
The Beck Depression Inventory-II (BDI-II; Beck, Steer, & Brown, 1996) is a 21
item self report of depressive symptomology for individuals age 13-80. Items on the
BDI-II are intended to assess symptoms experienced in the two weeks prior to
assessment, such as intense sadness, crying, or changes in sleep, appetite or sexual
interest. Each item is a list of four statements of increasing severity. Items are on a four
point scale ranging from 0 to 3, with a maximum score of 63. The BDI-II was developed
to have clinical sensitivity for assessing depression criteria reported in the DSM-IV.
Psychometric characteristics of the BDI-II were established using four outpatient
psychiatric samples and a college student sample. The BDI-II manual reported that the
BDI-II demonstrated good internal consistency (α = .92 for the outpatient samples and α
= .93 for the college student sample), test-retest stability (α = .93 for a subset of
outpatient samples) and good convergent and discriminant validity with respect to
depression and anxiety respectively (Beck, Steer, & Brown, 1996). Cut score guidelines
suggested in the manual are as follows: 0-13 (minimal range), 14-19 (mild range), 20-28
(moderate range), and 29-63 (severe range). However, the manual indicated that cut
score thresholds may be raised or lowered to either reduce or increase the number of false
positives. For example, lowering the cut score will detect the maximum number of
individuals presenting with depressive symptoms.
Procedure
Following completion of data collection, each of the measures was scored as
indicated in the administration manuals. Scoring was completed by trained graduate

61
or advanced undergraduate students of psychology and supervised by a licensed clinical
neuropsychologist. Scaled scores for each D-KEFS subtest (trail making, verbal fluency,
design fluency, color-word interference, and card sorting) were scored separately
according to the D-KEFS manual (Delis, Kaplan, & Kramer, 2001). BRIEF-A T-scores
were calculated for each composite scale (GEC, BRI, MI, Inhibit, Shift, Emotional
Control, Self-Monitor, Initiate, Working Memory, Plan/Organize, Organization of
Materials, and Task Monitor scales). A sum of all BDI-II items provided a total
depressive symptom score. Age-corrected scores (i.e., scaled scores for the D-KEFS and
T-scores for the BRIEF-A) were reported for descriptive analyses.
Prior to all analyses, all measures were examined for normality. For the BRIEF-
A, the Infrequency, Negativity, and Inconsistency validity scales of the BRIEF-A were
examined for elevations according the examiner’s manual. Following this criteria, no
atypical participant profile was identified that necessitated exclusion from further
analyses. An a priori power analysis was conducted to determine optimal sample size for
Confirmatory Factor Analyses. This analysis was based on the largest model, which
contained nine items and four factors. Following suggestions from Faul, Erdfelder, Lang,
and Buchner (2007) five participants were suggested per parameter in structural equation
analyses. Using a nine item model, with 9 loadings and 9 unique factor correlations on
four factors, optimal sample size was estimated at 100-120.

62
Analyses
Relationship between Depressive Symptoms and Assessment (Hypothesis 1)
Multiple regression analyses were used to assess the relationship of depressive
symptomology and gender differences with executive functioning. A hierarchical step-
wise procedure was used, with full scale IQ from the WASI entered in the first step of the
regression analyses to control for general intellectual ability. In the second step of
analyses, scores on the BDI-II and gender were entered as the independent variables.
Two sets of regressions were completed with seven tasks of the D-KEFS and nine
subscales of the BRIEF-A as the dependent variables. In total 16 regressions were run.
Comparison of D-KEFS and BRIEF-A (Hypothesis 2)
To compare the D-KEFS and BRIEF-A, correlational analyses between
composites of the BRIEF-A and subtests of the D-KEFS were completed. Significant
correlations at the .05 level were used to indicate related executive functioning domains
measured by both assessments.
Factor Structure of Executive Functioning (Hypothesis 3)
D-KEFS and BRIEF-A data were examined for normality prior to analysis. The
constructs of executive functioning measured by each assessment were assessed using
maximum likelihood confirmatory factor analysis (CFA) via LISREL 8 following
suggestions by Bryant and Baxter (1997). All items were forced to have a single loading.
Χ2 values and five measures of goodness of fit (χ²/df, RMSEA, SRMR, NNFI, and NCNI)
were used to determine the goodness of fit for each of the a priori models for each
measure. The factor structure of the 9 BRIEF-A subscales were examined using CFA,

63
based on a priori hypotheses (see Hypothesis 3A). Four competing oblique models were
compared in their adequacy of fit, based on previous literature (see Figures 2-5).
Three competing oblique models based on theoretical interpretations in the
literature of executive functioning were tested using the five D-KEFS subtests (trail
making, verbal fluency, design fluency, color word, and sorting tests). These models
were based on a priori hypotheses (see Hypothesis 3A). Model 1 (see Figure 6) was a
one-factor model. Model 2 (see Figure 7) was made of three factors (fluency, inhibition,
and set-shifting) based on Miyake et al (2000). Model 3 (see Figure 8) was a five-factor
model, with each of the five subtests constituting one factor, made up of the subtests’
corresponding primary executive functioning measures.
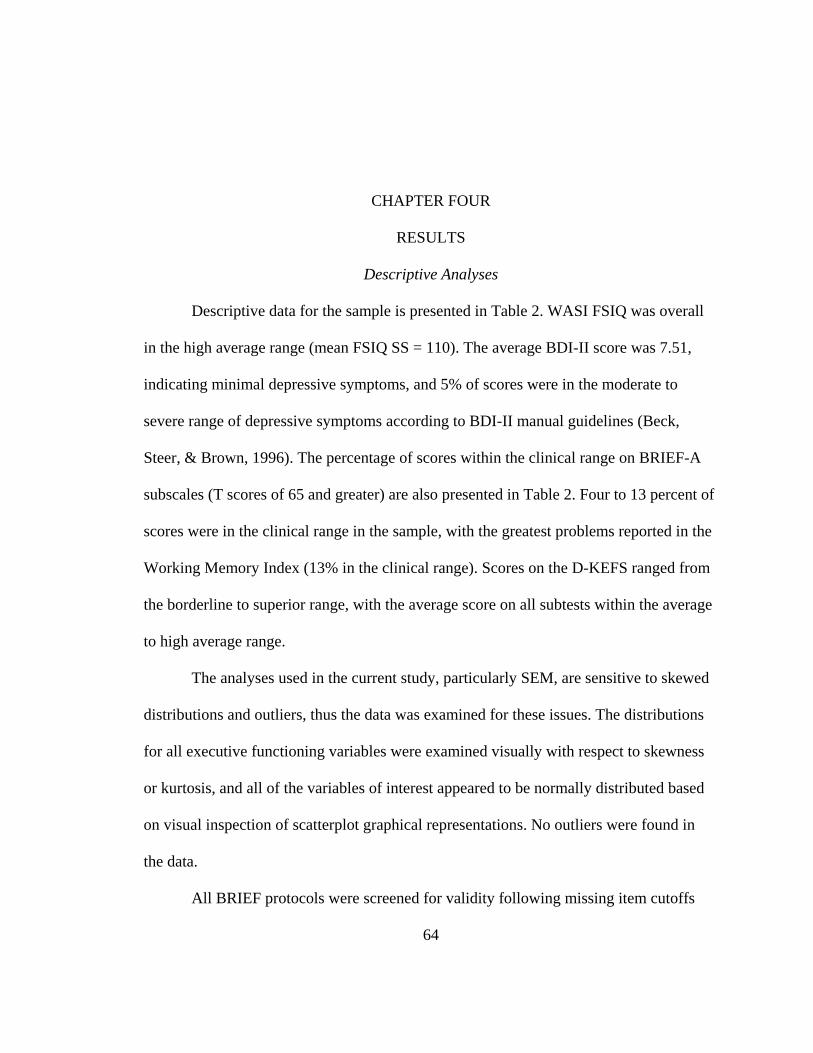
CHAPTER FOUR
RESULTS
Descriptive Analyses
Descriptive data for the sample is presented in Table 2. WASI FSIQ was overall
in the high average range (mean FSIQ SS = 110). The average BDI-II score was 7.51,
indicating minimal depressive symptoms, and 5% of scores were in the moderate to
severe range of depressive symptoms according to BDI-II manual guidelines (Beck,
Steer, & Brown, 1996). The percentage of scores within the clinical range on BRIEF-A
subscales (T scores of 65 and greater) are also presented in Table 2. Four to 13 percent of
scores were in the clinical range in the sample, with the greatest problems reported in the
Working Memory Index (13% in the clinical range). Scores on the D-KEFS ranged from
the borderline to superior range, with the average score on all subtests within the average
to high average range.
The analyses used in the current study, particularly SEM, are sensitive to skewed
distributions and outliers, thus the data was examined for these issues. The distributions
for all executive functioning variables were examined visually with respect to skewness
or kurtosis, and all of the variables of interest appeared to be normally distributed based
on visual inspection of scatterplot graphical representations. No outliers were found in
the data.
All BRIEF protocols were screened for validity following missing item cutoffs
64
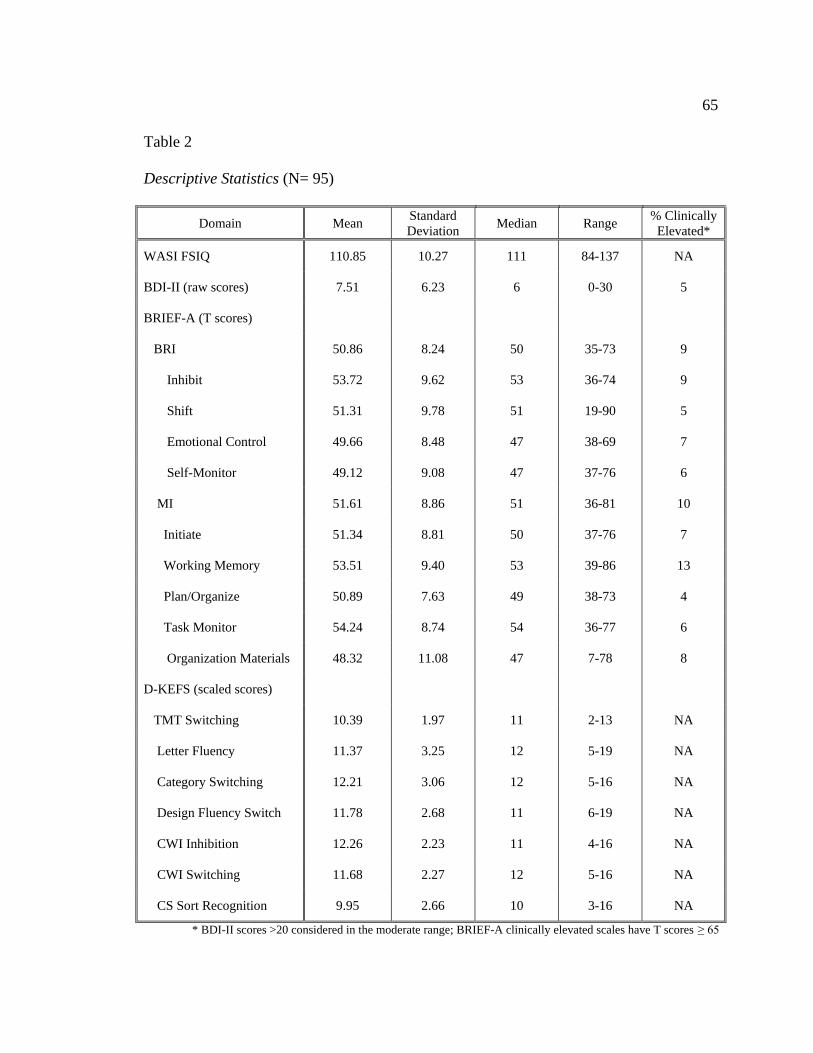
65
Table 2
Descriptive Statistics (N= 95)
Domain Mean Standard Deviation Median Range % Clinically
Elevated*
WASI FSIQ 110.85 10.27 111 84-137 NA
BDI-II (raw scores) 7.51 6.23 6 0-30 5
BRIEF-A (T scores)
BRI 50.86 8.24 50 35-73 9
Inhibit 53.72 9.62 53 36-74 9
Shift 51.31 9.78 51 19-90 5
Emotional Control 49.66 8.48 47 38-69 7
Self-Monitor 49.12 9.08 47 37-76 6
MI 51.61 8.86 51 36-81 10
Initiate 51.34 8.81 50 37-76 7
Working Memory 53.51 9.40 53 39-86 13
Plan/Organize 50.89 7.63 49 38-73 4
Task Monitor 54.24 8.74 54 36-77 6
Organization Materials 48.32 11.08 47 7-78 8
D-KEFS (scaled scores)
TMT Switching 10.39 1.97 11 2-13 NA
Letter Fluency 11.37 3.25 12 5-19 NA
Category Switching 12.21 3.06 12 5-16 NA
Design Fluency Switch 11.78 2.68 11 6-19 NA
CWI Inhibition 12.26 2.23 11 4-16 NA
CWI Switching 11.68 2.27 12 5-16 NA
CS Sort Recognition 9.95 2.66 10 3-16 NA
* BDI-II scores >20 considered in the moderate range; BRIEF-A clinically elevated scales have T scores ≥ 65

66
and evaluating the Inconsistency, Infrequency, and Negativity scales as suggested in the
manual (BRIEF-A; Roth, Isquith & Gioia, 2005). All 95 BRIEF protocols were
considered valid according to criteria suggested in the manual.
Relationship between Depressive Symptoms and Assessment (Hypothesis 1)
A series of hierarchical regression analyses were performed to assess the
association of depression to executive functioning measures. For each analysis, FSIQ was
entered in the first step; gender and depressive score were entered in the second step in a
forward entry procedure.
Table 3 presents regressions related to the behavioral regulation subscales of the
BRIEF-A. In the first step, IQ was not a significant predictor of problems on the Inhibit,
Shift, Emotional Control, and Self-Monitor subscales (p > .05). Gender, entered in the
second step, was a significant predictor for the Inhibit (p < .05) and Shift (p < .01)
subscales, with males reporting greater problems in executive functioning than females
(See Table 4). Depressive symptomology was a significant predictor in all BRIEF-A
behavioral regulation models (Inhibit p < .01; Shift p < .001; Emotional Control p < .01;
Self-Monitor p < .05). Higher levels of depressive symptomology were related to more
reported problems on the Shift, Emotional Control, and Self-Monitor subscales. Lower
levels of depressive symptomology were related to more reported problems on the Inhibit
subscale. The final models in which gender and depression emerged as significant
predictors involved the Inhibit and Shift subscales of the BRIEF-A. Gender and
depressive symptomology accounted for 12% and 17% variance in executive functioning
problems on these subscales, respectively. Final models which included only depressive

67
Table 3
Standardized Coefficients for BRIEF-A Behavioral Regulation Regression Models
BRIEF-A EF Domain
Inhibit Shift Emotional Control Self Monitor
β t β t β t β t
FSIQ Gender
-.02
-.22
-.20 -2.05*
-.11
-.30
-1.04 -2.89**
-.07
--
-.63 --
-.03
--
-.30
--
Depressive Symptomology
-.37
-3.44**
.40
3.83***
.36
3.50**
.28
2.62*
Adjusted R2 for final model .12 .17 .11 .06
* p<.05; **p<.01; ***p<.001

Table 4 Significant Gender Differences in Self-Reported Executive Functioning (male n= 17; female n=78)
68
Domain Mean Standard Deviation % Clinically Elevated*
BRIEF-A (T scores) Males Females Males Females Males Females
BRI
Inhibit 56.65 52.67 11.12 9.46 24 10
Shift 55.00 50.24 12.99 8.85 10 4
MI
Initiate 54.24 50.45 10.00 8.56 12 5
* Clinically elevated scales have T scores ≥ 65

69
symptoms as a significant predictor (i.e., Emotional Control and Self-Monitor) explained
11% and 6% of the variance, respectively.
Regressions related to the metacognition subscales of the BRIEF-A are presented
in Table 5. In the first step, IQ was not a significant predictor of problems on the Initiate,
Working Memory, Plan/Organize, Organization of Materials, and Task Monitor subscales
(p > .05). Gender, entered in the second step, was a significant predictor only for the
Initiate subscale (β = -.23; p < .05), with males reporting greater problems than females.
Depressive symptomology was a significant predictor in all BRIEF-A metacognition
models (Initiate p < .001; Working Memory p < .001; Plan/Organize p < .001;
Organization of Materials p <.01; Task Monitor p < .05). The final model for the Initiate
subscale which included both gender and depressive symptomology as predictors
accounted for 24% of the variance in executive functioning problems. The final models
for Working Memory and Plan/Organize subscales, with depressive symptomology as a
significant predictor accounted for 15% and 13% of the variance in executive functioning
problems, respectively. The final models for Organization of Materials and Task Monitor,
with depressive symptomology as a significant predictor, accounted for 8% and 6% of the
variance in executive functioning problems, respectively.
A summary of regression analyses predicting D-KEFS subtests is presented in
Table 6. In the first step, FSIQ was a significant predictor of performance on Trail
Making Test Switching (p < .01), Letter Fluency (p < .001), Category Switching (p <
.01), Color Word Interference Switching (p < .05), and Card Sorting Sort Recognition (p
< .001). Higher IQ level was associated with greater performance on these tasks. In the

Table 5
Standardized Coefficients for BRIEF-A Metacognition Regression Models
BRIEF-A EF Domain
Initiate Working Memory Plan/Organize Task Monitor Organization of Materials
β t Β t β t β t β t
FSIQ Gender
.03
-.23
.28
-2.34*
-.07
--
-.68 --
-.12
--
-1.14 --
.01
--
.06 --
-.06
--
-.53 --
Depressive Symptomology
.51
5.19***
.41
3.99***
.38
3.71***
.32
3.03**
.29
2.70*
Adjusted R2 .24 .15 .13 .08 .06
* p<.05; **p<.01; ***p<.001
70

Table 6
Standardized Coefficients for D-KEFS Regression Models
D-KEFS Subtest
TMT Switching Letter Fluency Category Switch
Design Switching
CWI Inhibition CWI Switching CS Sort Recog.
β t β t β t β t β t β t β T
FSIQ .13 3.34** .47 4.84*** .31 3.01** .10 .93 .22 2.03* .10 .90 .56 6.16***
Gender .18 1.65 -.04 -.36 .14 1.37 .03 .28 .06 .52 .07 .61 .13 1.46
Depressive Symptomology .12 1.09 .14 1.44 .03 .33 .06 .51 -.10 -.90 .01 .12 -.02 -.26
Adjusted R2 .004 .21 .09 -.002 .04 -.002 .30
* p<.05; **p<.01; ***p<.001
71

72
second step, gender and depressive symptomology were not significant in any of the D-
KEFS models (p > .05). In the final models, 30% of the variance in performance on Card
Sorting Sort Recognition and 21% of the variance in Verbal Fluency performance was
accounted for by IQ. IQ accounted for 9 % of the variance in Category Switching
performance and 6% of the variance in Color Word Interference Inhibition performance.
Less than 1% of the variance was explained in the final models of Design Fluency
Switching and Color Word Interference Switching, as none of the predictors were
significant in these models (FSIQ, gender, or depressive symptomology).
Additional analyses were run for the subscales of the BRIEF-A in which both
gender and depression symptomology were significant predictors to determine if there
was a gender by depressive symptomology interaction effect on executive functioning.
This interaction term, entered in the third step of the Inhibit, Initiate, and Shift models,
was not significant (p >.05).
Comparison of D-KEFS and BRIEF-A (Hypothesis 2)
Correlations between BRIEF-A subscales and D-KEFS tasks are presented in
Table 7. Moderate correlations (r ≥ .22) were found between variables within the same
measure (i.e., BRIEF or D-KEFS). With regard to the BRIEF-A, most correlations were
significant at the .001 level, indicating that there was a strong relationship between the
subscales of the BRIEF-A. The Trail Making Test Switching subtest was the least
correlated among the D-KEFS tasks, with significant correlations found only for the
Letter Fluency task and the CWI tasks (Inhibition and Inhibition/Switching).

Table 7
Bivariate Correlations between Executive Functioning Variables
1 2 3 4 5 6 7 8 9 10 11 12 13 14 15 16
1.BRIEF Inhibit 1.0
2.BRIEF Shift .46*** 1.0
3.BRIEF Emotional Control .41*** .47*** 1.0
4.BRIEF Self Monitor .69*** .46*** .32** 1.0
5.BRIEF Initiate .52*** .45*** .47*** .44*** 1.0
6.BRIEF Working Memory .64*** .58*** .34** .54*** .59*** 1.0
7.BRIEF Plan/Org .52*** .35** .39*** .57*** .57*** .59*** 1.0
8.BRIEF Task Monitor .55*** .50*** .41*** .62*** .58*** .61*** .56*** 1.0
9.BRIEF Org Materials Task
.47***
.33** .22* .45*** .55*** .51*** .58*** .66*** 1.0
10.D-KEFS TMT Switch .08 -.04 -.05 -.00 .01 .13 .07 .09 .08 1.0
11.D-KEFS Letter Fluency .14 -.02 -.14 .17 .11 .07 .05 .11 .13 .25* 1.0
12.D-KEFS Category Switch .04 -.09 .03 -.04 -.03 .00 -.01 -.02 -.07 .05 .39*** 1.0
13.D-KEFS Design Switch .22* .01 -.03 .15 .05 .09 .14 .17 .13 .22 .09 .25* 1.0
14.D-KEFS CWI Inhibition .17 -.11 -.18 .10 -.05 .04 .14 .01 -.07 .30** .34** .21* .21* 1.0
15.D-KEFS CWI Switch .19 -.06 -.04 .06 -.09 .06 .14 .01 -.05 .39*** .27** .11 .27** .66*** 1.0
16.D-KEFS Sort Recognition -.02 -.12 -.17 -.06 -.12 -.16 -.23* -.07 -.11 .11 .36*** .32** .15 .29** .16 1.0
* p<.05; **p<.01; ***p<.001
73
74
There were two significant correlations found between the BRIEF-A and D-KEFS. The
Sort Recognition score from the D-KEFS was significantly correlated with the BRIEF-A
Plan/Organize subscale (r = -.23, p < .05), indicating that better performance on this D-
KEFS task was associated with fewer reported problems with planning and organizing as
reported on the BRIEF-A. The Design Fluency Switching task from the D-KEFS was
significantly related to the BRIEF-A Inhibit subscale (r = .22, p < .05). However, the
positive correlation indicated that greater performance on the Design Fluency Switching
Task was associated with greater reported problems in inhibition on the BRIEF-A. All
other correlations between the BRIEF-A and D-KEFS were non-significant (p > .05).
Factor Structure of Executive Functioning (Hypothesis 3)
Analysis strategy
The factor structure of executive functioning was examined using confirmatory
factor analysis via LISREL 8. As required by CFA, the user specified which items were
expected to load on which factors, how these factors intercorrelate, and the relations
among unique-error terms for the observed indicators. In this multidimensional model,
items were forced to have a single loading, factors were standardized (i.e., variances
fixed at 1), and unique errors were considered independent.
As previous research has indicated that multiple fit indices best determine model
adequacy rather than sample size (Jackson, 2001), several fit indices were evaluated in
the current study. Following suggestions by Hu and Bentler (1998), five different
measures of goodness of fit were used to assess CFA models in the study: (1) the ratio of

75
chi-square to degrees of freedom (χ²/df), which decreases and approaches zero as the fit
of the given model improves, (2) the root mean square error of approximation (RMSEA),
(3) the standardized root mean square residual (SRMR), (4) the non-normed fit index
(NNFI), and (5) the comparative fit index (CFI). According to Hu and Bentler, the
RMSEA measure of relative fit should be no greater than .10 and ideally .05. They
suggest that an SRMR value of less than .08 is indicative of good fit. Bentler and Bonett
(1980) provide recommendations for evaluating NNFI and CFI values; specifically these
measures of relative fit increase as the model improves are indicative of an adequate fit
when greater than .90
Although conventional cutoff values indicated above are helpful in providing a
minimum level of fit, in CFA the fit of a model is also interpreted relative to competing
models (Ecklund-Johnson, Miller, & Sweet, 2004). CFA in the current study was used to
evaluate the goodness-of-fit of four competing models for the BRIEF-A and three
competing models for the D-KEFS. The results of these analyses are presented in Tables
8 and 9; the results are discussed in greater detail below.
BRIEF-A
CFA was used to compare four possible competing models using the BRIEF-A based on
plausible theoretical interpretations of self-reported executive functioning. Model 1 was
a single-factor model hypothesizing a global executive functioning factor. Model 2 was a
two-factor model hypothesizing oblique behavioral regulation and metacognition
domains. Model 3 was a three-factor model hypothesizing oblique metacognition,
emotional regulation, and behavioral regulation domains. Model 4 was a
76
four-factor model hypothesizing oblique internal metacognition, external metacognition,
emotional regulation, and behavioral regulation domains.
The one-factor conceptualization of the nine subscales provides the worst fit and
yields lower relative fit indices (See Table 8). Although SRMR was less than .08 and
NNFI and CFI values were greater than .09, indicating good model fit, the RMSEA value
for the one-factor model was greater than .10, suggesting a poor model fit. The relative fit
indices improve with the two-factor model, but of the four models tested in the analyses,
the three-factor model appears to have the best fit to the observed data. With this latter
model, the majority of fit indices suggest an adequate fit (RMSEA < .10; SRMR < .08;
NNFI and CFI >.90). Furthermore, while relative fit indices are comparable between the
three-factor and four-factor models, RMSEA, NNFI, and CFI values show a slight
increase from the three-factor to the four-factor model, indicating that the three-factor
model provides the best fit to the observed data.
As expected given the large sample size, chi-square statistics for all four models
were significant, although the chi-square value was the lowest for Models 3 and 4, as
were the ratios of chi-square to degrees of freedom. Although the chi-square to degrees
of freedom measure of relative fit was comparable between Models 3 and 4, as
previously mentioned other measures of relative fit were preferable in the three-factor
Model 3. Inspection of the inter-factor correlations from this three-factor CFA solution
revealed that metacognition, emotional regulation, and behavioral regulation are highly
intercorrelated (median Φ = 0.784, 0.852, and 0.724; See Table 9).
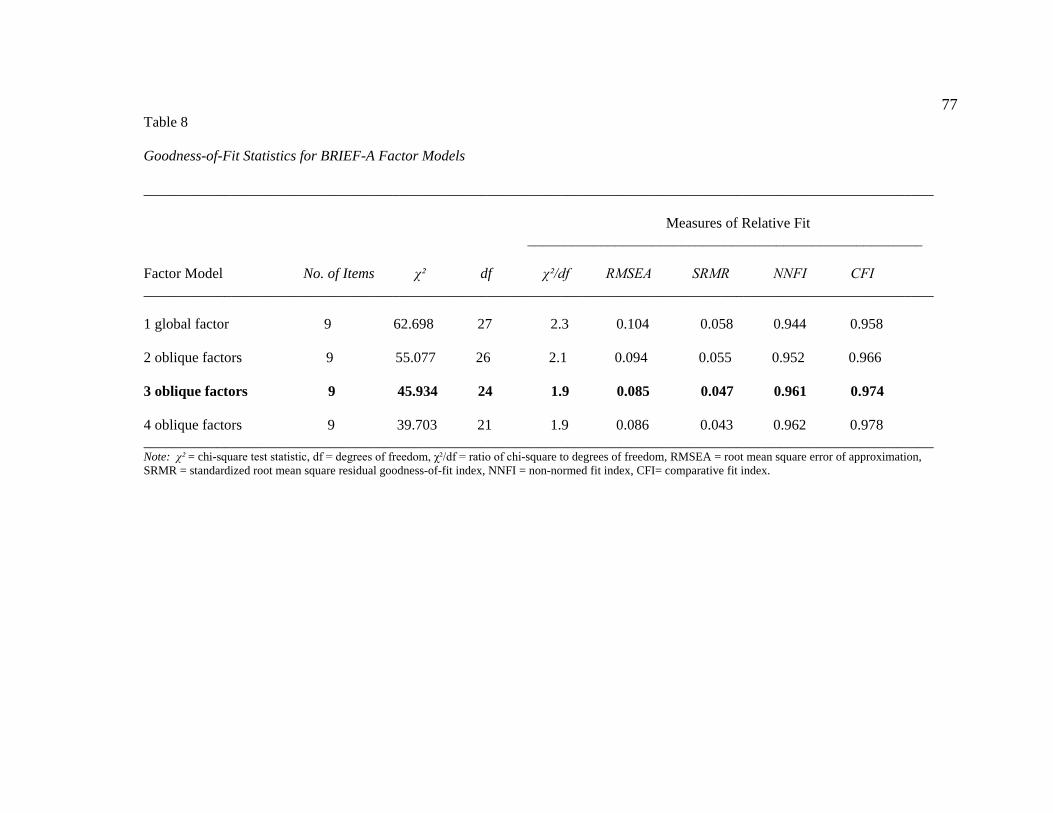
77 Table 8 Goodness-of-Fit Statistics for BRIEF-A Factor Models ____________________________________________________________________________________________________________ Measures of Relative Fit ______________________________________________________ Factor Model No. of Items χ² df χ²/df RMSEA SRMR NNFI CFI ____________________________________________________________________________________________________________ 1 global factor 9 62.698 27 2.3 0.104 0.058 0.944 0.958 2 oblique factors 9 55.077 26 2.1 0.094 0.055 0.952 0.966 3 oblique factors 9 45.934 24 1.9 0.085 0.047 0.961 0.974 4 oblique factors 9 39.703 21 1.9 0.086 0.043 0.962 0.978 ____________________________________________________________________________________________________________ Note: χ² = chi-square test statistic, df = degrees of freedom, χ²/df = ratio of chi-square to degrees of freedom, RMSEA = root mean square error of approximation, SRMR = standardized root mean square residual goodness-of-fit index, NNFI = non-normed fit index, CFI= comparative fit index.

78
Table 9
Correlations between BRIEF-A Factors for Best Fitting Model: Three-Factor Model
1 2 3
1Metacognition 1.000
2Emotional Regulation 0.784 1.000
3Behavioral Regulation 0.852 0.724 1.000

79
D-KEFS
Three competing models based on plausible theoretical interpretations involving
seven D-KEFS tasks were compared using CFA. Model 1 was a single factor model
(i.e., a global executive function factor). Model 2 was a three factor model, hypothesizing
set-shifting, inhibition, and fluency factors. Model 3 was a five factor model, including
motor executive function, verbal executive function, non-verbal executive function,
inhibition/switching, and problem solving. The motor executive function, non-verbal
executive function, and problem solving factors from Model 2 and the inhibition and
fluency factors from Model 3 had single item loadings. For these factors, variance was set
at .70, to account for 30% error.
Similar to the BRIEF-A the one-factor conceptualization of the seven D-KEFS
tasks provides the worst fit and yields lower relative fit indices (See Table 10). All fit
indices for the one-factor model were inadequate according to suggested set values
(RMSEA >.10; SRMR >.08; NNFI <.90; CFI < .90). The relative fit indices do not
improve with the two-factor model, as again none of the fit indices met suggested
standards. The five-factor model provides the best fit to the data, with all measures of
relative fit meeting criteria (RMSEA < .10; SRMR < .08; NNFI and CFI >.90). The chi-
square statistic was the lowest for the five-factor model, as was the ratio of chi-square to
degrees of freedom. Inspection of the inter-factor correlations from this five-factor CFA
solution revealed that the “motor” factor and “inhibition/switching” factor were highly
correlated (median Φ = 0.533), as were the “problem solving” factor and “verbal” factor

80
Table 10 Goodness-of-Fit Statistics for D-KEFS Factor Models ____________________________________________________________________________________________________________ Measures of Relative Fit ______________________________________________________ Factor Model No. of Items χ² df χ²/df RMSEA SRMR NNFI CFI ____________________________________________________________________________________________________________ 1 global factor 7 42.880 14 3.06 0.153 0.104 0.704 0.803 3 oblique factors 7 42.671 13 3.28 0.160 0.101 0.673 0.798 5 oblique factors 7 14.832 9 1.65 0.079 0.054 0.907 0.960 ____________________________________________________________________________________________________________ Note: χ² = chi-square test statistic, df = degrees of freedom, χ²/df = ratio of chi-square to degrees of freedom, RMSEA = root mean square error of approximation, SRMR = standardized root mean square residual goodness-of-fit index, NNFI = non-normed fit index, CFI= comparative fit index.

81
Table 11
Correlations between D-KEFS Factors for Best Fitting Model: Five-Factor Model
1 2 3 4 5
1Motor 1.000
2Verbal 0.292 1.000
3Non-verbal 0.320 0.331 1.000
4Inhibition/Switching 0.533 0.385 0.363 1.000
5Problem Solving 0.172 0.584 0.217 0.286 1.000

82
(median Φ = 0.554; See Table 11). The motor factor and the problem solving factor were
the most unrelated (median Φ = 0.172).

CHAPTER FIVE
DISCUSSION
The findings in the current study highlight the complexity of the construct and the
measurement of executive functioning. Analyses were completed to assess the overlap
between general intellectual ability and the executive functions, the relationship of
depressive symptomology with measures of executive functioning, and notable gender
differences within and across measures in an undergraduate population. Two purported
comprehensive assessments of executive functioning were directly compared to
determine the nature of their relationship. Factor analyses were conducted to further
elucidate the domain of executive functioning with respect to each measure. Results
suggest that the executive functions are a multifaceted construct and reveal clear
differences within two assessments of executive functions.
General Intellectual Functioning, Depressive Symptomology, and Gender
Historically, executive functions have been considered to be an aspect of general
intellectual functioning, a subset of skills requiring higher-ordered thinking. The results
of this study are consistent with this belief as well as previous research indicating that
executive functions are related, but distinctly different from general cognitive abilities
(Delis et al, 2007). WASI Full Scale IQ was significantly related to performance on
several D-KEFS tasks: Trail Making Test Switching, Letter Fluency, Category
Switching, Color-Word Interference Inhibition, and Card Sorting sort recognition score.
83

84
However, Full Scale IQ accounted for less than 10% of the variance in performance on
TMT Switching, Category Switching, and CWI Inhibition, 21% of the variance in Letter
Fluency performance and 30% of the variance in Card Sorting performance. Overall,
these results indicate that approximately 70-90% of the performance on executive
functioning tasks is not explained by general intellectual ability. Delis and colleagues
(2007) reported that subsets of individuals showed discrepancies between their
performance on an assessment of intellectual functioning and on executive functioning
tasks from the D-KEFS. Taken together, these findings suggest that there is not an exact
correlation between intellectual ability and executive functioning.
In addition to examining correlations between full scale IQ and performance on
the D-KEFS, the current study also examined the relationship between intellectual ability
and self-rated executive functioning as measured by the BRIEF-A. Interestingly, unlike
the D-KEFS, general intellectual ability was not significantly related to any of the
BRIEF-A subscales. There has been little research to date involving the comparison of a
rating scale of executive functioning to intellectual ability. Vriezen and Pigott (2002)
reported a significant correlation between Verbal IQ from the Wechsler Intelligence
Scale for Children-Third Edition (WISC-III) and the BRIEF parent report version in a
sample of children with traumatic brain injury. However, Rabin and colleagues (2006)
reported a non-significant correlation between the BRIEF-A and estimated verbal IQ
using the ANART in a mixed sample of older adults. The lack of a significant
relationship found between IQ and the BRIEF-A further suggests that there are
discrepancies between intellectual ability and executive functioning, particularly with

85
regard to problems in the behavioral manifestations of executive functioning assessed on
the BRIEF-A.
There were no gender differences in performance on any of the D-KEFS tasks;
however, there were gender differences with regard to self-reported executive
functioning. Specifically, men reported greater problems than women on the Inhibit,
Shift, and Initiate scales. Although gender differences have been reported in child
versions of the BRIEF (Gioia, Isquith, Guy, & Kenworthy, 2000; Guy, Isquith, & Gioia,
2004), studies involving older adults have reported non-significant gender effects (Rabin
et al, 2006). It is possible that the younger sample of adults used in the current study
displayed a pattern of responding that is more typically of adolescents, rather than older
adults. This is not surprising given the evidence suggesting that the frontal lobes continue
to develop into early adulthood (Casey, Giedd, & Thomas, 2000; Stuss, 1992), and the
likelihood that there are lingering developmental differences between male and female
brains. The finding that gender differences were specific to self-reported executive
functioning rather than administered executive functioning tasks indicates that young
adult males may be more likely to perceive problems that are not evident on laboratory
based assessments.
There were also differences in the objective and subjective assessments with
regard to their relationship to depressive symptomology. Depressive symptomology was
significantly related to all subscales of the BRIEF-A, but not to any of the D-KEFS tasks.
It is possible that this finding is an artifact of an over-reporting of symptoms across all
self-report measures (i.e., BRIEF-A and BDI-2); however, this is unlikely given that

86
depressive symptomology was negatively correlated with responses on the Inhibit scale
of the BRIEF-A. While higher levels of depressive symptomology was related to greater
problems in all executive functioning domains as measured by the BRIEF-A, with regard
to the Inhibit scale greater reported problems in inhibition was related to fewer symptoms
of depression. Given these findings, it is concluded that individuals who experience
symptoms related to depression (e.g., intense sadness, crying, changes in sleep, appetite
or sexual interest), also report having difficulty with some behavioral manifestations of
executive functioning (e.g., shifting, emotional regulation, self-monitoring, initiating,
working memory, planning and organizing, task monitoring, and organizing materials).
The correlational design precludes the determination of a causal relationship, such as
whether symptoms of depression lead to problems in executive functioning; however,
there appears to be overlap between the behavior manifestations of executive functioning
and depressive symptomology.
This finding is consistent with previous reports suggesting that there is a
relationship between report of cognitive problems and depressive symptomology (Rabin
et al, 2003; Roth, Isquith, & Gioia, 2005). In a sample of older adults with mild dementia,
research has indicated that a heightened awareness of one’s cognitive difficulties is
related to greater depressive symptoms (Spitznagel, Tremont, Brown, & Gunstad, 2006).
It is possible that a similar pattern is occurring in the sample of college students in the
current study, where there is a notable discrepancy between the ability to perform on
cognitive tasks and the experience of cognitive difficulties in daily life, with the latter
more strongly associated with depressive symptoms.

87
Relationship between BRIEF-A and D-KEFS
A primary aim of the current study was to determine the degree of overlap or
discrepancy between two comprehensive measures of executive functioning. The first set
of analyses revealed discrepancies between the two measures in terms of their
relationship to IQ, gender, and depressive symptomology. Specifically, although both
measures were discrepant from general intellectual ability, the D-KEFS was partially
correlated with IQ. In contrast, the BRIEF-A showed gender differences in the reporting
of executive functioning problem behaviors and was correlated across all subscales with
depressive symptomology.
Despite these discrepancies in the two measures of executive functioning, it was
hypothesized that when compared directly to each other, specific domains of executive
functioning between the measures would overlap. This hypothesis was based on the
premise that the executive functions are composed of separate distinct abilities that can
be identified across situations (and therefore also across different measurements). It was
expected that the Shift subscale of the BRIEF-A would correlate with the switching tasks
of the D-KEFS, the Inhibit subscale of the BRIEF-A would correlate with the CWI
Inhibition task of the D-KEFS, and the Initiate subscale of the BRIEF-A would correlate
with the Verbal Fluency tasks of the D-KEFS,
The data in the current study did not support the a priori exploratory hypotheses
regarding these similar constructs across measures. Overall, highly significant
correlations emerged among the BRIEF-A subscales and among the D-KEFS tasks,
indicating a high inter-relatedness within each executive functioning measure but little

88
overlap between measures. Only two significant correlations emerged between measures.
Similar to Parrish and colleagues (2001) the BRIEF-A Plan/Organize subscale was
related to the sort recognition score from the D-KEFS Card Sorting Test. The BRIEF-A
Inhibit subscale was also related to the D-KEFS Design Fluency switching task.
Although the two EF measures were largely uncorrelated with each other, the
significant correlations that were found between the two measures are worth further
discussion. With regard to the relationship between the Plan/Organize subscale of the
BRIEF-A and the Card Sorting Test from the D-KEFS, individuals who reported having
fewer problems with their ability to plan and organize were able to identify more sorts on
the card sorting task. This suggests that these individuals who view themselves as able to
plan and organize themselves on a day to day basis are better able to perform on tasks
that require planning and abstract thinking. In the literature, Barkley (2001) described
how the ability to work through problems in one’s head enables an individual to think
about the hypothetical future. It is possible that those individuals who are able to
problem solve are better able to mentally and physically organize.
The positive correlation that emerged between the Design Fluency switching task
and the Inhibit scale was unexpected, as this result indicates that individuals who reported
that they had greater problems inhibiting their behavior were able to generate more novel
designs involving connecting filled and empty dots (a set-shifting task). It is possible that
these individuals who view themselves as being mentally rigid are actually better able to
perform on rule bound tasks. For example, the Design Fluency task requires individuals

89
to use a set of rules: use four straight lines, make each line touch another line at a dot,
make a different design in each square, and connect lines from a filled dot to an empty
dot, etc. This task requires individuals to generate novel designs in the context of a given
set of rules, thus individuals who may not be as good at inhibiting their responses are able
to perform well on this task.
What Constructs are Measured by the D-KEFS and BRIEF-A?
A central goal to the current study was to closely examine the construct of
executive functioning through measures of executive functioning. Results from the first
set of analyses seem to indicate that the BRIEF-A and the D-KEFS are distinctly different
measures with little overlap. Performance on the D-KEFS was more related to general
intellectual ability than the BRIEF-A. In contrast, the BRIEF-A evidenced an association
with a subjective rating scale of depressive symptomology and showed gender
differences in problems in executive functioning. Correlational analyses between the two
measures revealed that each was more closely related to itself than to the other. Though
there was some overlap between measures, they each appear to measure a divergent
construct.
Supposing that each measure is tapping into aspects of executive functioning, it is
suspected that the two measures are assessing different components of executive
functioning. This hypothesis is supported by the distinction made in the literature
between “metacognitive executive functions” and emotional/motivation executive
functions” (Ardila, 2008). Ardila suggested that traditional tests of executive functioning

90
(i.e., laboratory based assessments) tap into the metacognitive executive functions or
problem solving, planning, concept-formation, strategy development/implementation,
working memory, and controlled attention. Under this premise, it is likely the
emotional/motivational executive functions,” which coordinate cognition and
emotion/motivation are measured by a behavior rating scale like the BRIEF-A. The
current study supports the idea that the D-KEFS is measuring performance-based,
cognitive aspects of executive functioning and the BRIEF-A is assessing behavioral
components of executive functioning that are based upon self-perspectives. Additional
analyses were completed to more closely examine the factor structure of each measure
separately.
BRIEF-A
A total of four factor analyses were completed involving the BRIEF-A based on
previous research and theoretical assumptions. Four models were hypothesized, involved
a one, two, three or four-factor solution to the BRIEF-A subscales. Confirmatory factor
analyses revealed that the three-factor model provided the best fit to the data, similar to
previous findings reported by Gioia and colleagues (2002) using the parent version of the
child BRIEF. This model was composed of a Behavioral Regulation factor, an Emotional
Regulation factor, and a Metacognition factor. This model is discrepant from the factor
structure reported in the BRIEF-A manual, which suggests a two factor model composed
of Behavioral Regulation and Metacognition (Roth, Isquith, & Gioia, 2005). It is possible
that the three-factor model provides a more accurate conceptualization of executive
functioning behavior with a younger adult sample used in the current study, more similar

91
to findings reported for the child version of the BRIEF. However, it is important to note
that although the three-factor solution provided the best fit to the data in the current
sample, the three factors were highly correlated with each, as was the two-factor solution
reported in the BRIEF-A manual. Factor analyses on the BRIEF-A consistently suggest
models composed of different components of executive functioning; however, these
models indicate that these factors are strongly related to one another. These findings lend
support to the theory of executive functions as a domain of separate, but interrelated
abilities.
D-KEFS
Confirmatory factor analyses were used to determine the latent factor structure of
the seven D-KEFS tasks. While previous studies with performance-based measures of
executive functioning have found three-factor models (e.g., Miyake et al, 2000), the five-
factor oblique model provided the best fit to the data. These five factors were termed
“motor executive functioning,” “verbal executive functioning,” “non-verbal executive
functioning,” “inhibition/switching,” and “problem solving.” These factors were most
similar to the five-factor model reported by Pineda and Merchan (2003). Their final
model included a factor for WCST variables, Stroop naming and reading, Stroop time,
Trail Making Test A and B, and Verbal Fluency. Like the five-factor model using the D-
KEFS tasks, this solution supported a separate factor per task model, with the exception
of the Stroop task which comprised two separate factors.

92
Additionally, examination of the correlations between the factors in the five-
factor D-KEFS solution revealed that the factors were less related than were the three-
factor BRIEF-A model. The strongest correlations were between the problem solving and
inhibition/switching factors and the problem solving and verbal executive functioning
factors. That some tasks are more correlated than others suggests that these tasks might
be invoking similar frontal pathways in the brain or involving associated areas in the
brain. For example, there is a large body of research citing the involvement of the left
dorsolateral prefrontal cortex in verbal fluency tasks (Baldo, Shimamura, Delis, Kramer,
& Kaplan, 2001; Lezak, 1982; Malloy, Cohen, Jenkins, & Paul, 2006; Veiel, 1997); it is
possible that the left dorsolateral prefrontal cortex might also be activated during the
Card Sorting Test. However, these conclusions are speculative in the absence of
neuroimaging data.
Domain of EF: Unified or Separate?
The current study sought to provide further insight into the debate on whether the
executive functions constitute a unified domain of abilities or whether they are best
understood as separate and distinct skills. This study provides overwhelming evidence in
favor of a multi-dimensional conceptualization of executive functioning. First and
foremost, two assessments designed to measure aspects of executive functioning were
found to be largely unrelated to each other. When several plausible models (including
both single and multi-factor models) involving both of these measures were examined, it
was determined that multi-factor models provided the best fit. These findings provide
93
support for the assertion that assessments of executive functioning should consider the
executive functions to be a multidimensional construct (Gioia, 2002).
The best fitting model for each executive functioning assessment highlighted
unique components of executive functioning. The BRIEF-A three-factor model
suggested a Metacognition, Emotional Regulation, and Behavioral Regulation factor
whereas the D-KEFS five-factor solution recommended a Motor Executive Function,
Verbal Executive Function, Non-verbal Executive Function, Inhibition/Switching, and
Problem Solving factor. As previously mentioned, one argument might be that one or
both of these assessments is not measuring “pure” executive functioning. However, it is
also possible that each assessment is tapping into different aspects of executive
functioning. For example, the BRIEF-A was designed as a measure of the behavioral
aspects of executive functioning that can be observed in real world settings, on a day to
day basis. In contrast, the D-KEFS attempts to assess individuals’ ability to perform on
tasks that are thought to require executive functioning.
Theoretically, one would assume that an individual’s performance on a given task
would correspond to their ability to carry out tasks of daily living involving executive
functioning. However, this study was interested in individuals’ ratings or self-perceptions
of their executive functioning. Given the low correlations between the objective and
subjective measures of executive functioning examined in this study, it is concluded that
there are discrepancies between how people view their problems in executive functioning
and their actual performance on tasks.
94
Limitations of the Study and Directions for Future Research
There were several limitations to the current study that need to be acknowledged.
First, there were restrictions posed by the sample used in the study. The sample size
limited the ability to conduct factor analyses combining the tasks of the D-KEFS and
subscales of the BRIEF-A. Though a central finding in the study was that the D-KEFS
and the BRIEF-A represented two distinct measures of executive functioning with little
overlap, future studies might confirm this finding through use of factor analyses with
both of these measures. Additionally, the sample used in the current study was restricted
to individuals aged 18-24, with an average of 12 years of education. The majority of the
sample was female (82%) and Caucasian (76%). Further studies might include a wider
age, education, gender, and ethnicity range. These limitations are particularly important
given some of the issues discussed with regard to gender and the factor structure of the
BRIEF-A in younger adult and older adult samples. In particular, the findings related to
gender and factor structures of the assessments should be replicated in additional
samples.
The current study was limited to the use of two comprehensive measures of
executive functioning (i.e., the D-KEFS and the BRIEF-A). However, as presented
earlier, there are numerous other stand-alone performance-based neuropsychological
assessments that propose to measure executive functioning (e.g., Wisconsin Card Sorting
Test). Future studies might include these other neuropsychology measures to determine
the amount of overlap or discrepancy between these measures and the measures used in
the current study.

95
The BDI-2 was used to determine the presence of depressive symptomology;
however, the ratings obtained in the study using this assessment were not intended as a
diagnostic tool for depression. Although the sample was restricted to individuals without
severe psychopathology, future research might collect information from objective sources
regarding diagnostic criteria of depression or include individuals who have met criteria
for major depression. It is possible that the rating scale of depressive symptomology used
in the current study (i.e., the BDI-2) might have limited the ability to detect higher levels
of depressive symptoms that might have affected performance on the D-KEFS. Given
this limitation, it cannot be ruled out that the correlation found between the BDI-2 and the
BRIEF-A may have been an artifact of the subjective nature of the two assessments. To
further elucidate the relationship between executive functioning assessment and
depressive symptomology, future research might include the observer rating of the
BRIEF-A to assess objective rating of executive functioning.
Implications
The current study makes several important contributions to the literature. First, it
presents additional evidence for the viewpoint of executive functioning as a multi-faceted
construct. Under this framework, executive functioning should be considered as a related
but distinct aspect of general intellectual functioning. Within the larger domain of
executive functioning are distinct and separate abilities that can be adequately assessed
using laboratory based assessments and rating scales. There remain discrepancies
between these assessments, as well as across performance-based assessments of
executive functioning. Though the D-KEFS proposes to measure comprehensive
96
executive functioning, it is important to note that each task within this larger assessment
is not measuring the same ability. As performances across tasks are largely unrelated,
patients may show a wide range of variability within this one assessment and within the
domain of executive functioning.
Furthermore, traditional performance-based laboratory measurements of
executive functioning may fail to capture all aspects of executive functioning. The
addition of a subjective rating scale adds a layer to the assessment of executive
functioning by measuring an individual’s perception of their difficulty within executive
functioning areas. The identification of both objective and subjective problems can better
inform clinicians, family members, researchers, and educators about the functioning of a
patient who undergoes neuropsychological assessment.
REFERENCES Alvarez, J.A. & Emory, E. (2006). Executive function and frontal lobes: A meta-analytic review. Neuropsychology Review, 16(1), 17-42. American Psychiatric Association (2000). Diagnostic and Statistical Manual of Mental Disorders (4th ed. Text revision). Washington, D.C.: APA. Anderson, V. A., Anderson, P., Northam, E., Jacobs, R., & Catroppa, C. (2001). Development of executive functions through late childhood and adolescence in an Australian sample. Developmental Neuropsychology, 20, 385-406. Ardila, A. (2008). On the evolutionary origins of executive functions. Brain and Cognition, 68, 92-99. Austin, M.P., Mitchell, P., Wilhelm, K., Parker, G., Hickie, I., Brodaty, H., Chan, J., Eyers, K., Milic, M., Hadzi-Pavlovic, D. (1999). Cognitive function in depression: a distinct pattern of frontal impairment in melancholia? Psychological Medicine, 29, 73–85. Baddeley, A., Chincotta, D., & Adlam, A. (2001). Working memory and the control of action: Evidence from task switching. Journal of Experimental Psychology: General, 130, 641-657. Baddeley, A.D., Della Sala, S., Papagno, C., & Spinnler, H. (1997). Dual-task performance in dysexecutive and non-dysexecutive patients with a frontal lobe lesion. Neuropsychology, 11, 187-194. Baddeley, A.D. & Hitch, G.J. (1974). Working Memory. In G.A. Bower (Ed.), The psychology of learning and motivation (Vol. 8, pp. 47-89). New York: Academic Press. Baird, A., Dewar, B.K., Critchley, H., Gilbert, S.J., Dolan, R.J., & Cipolotti, L. (2006). Cognitive functioning after medial frontal lobe damage including the anterior cingulated cortex: A preliminary investigation. Brain and Cognition, 60, 166-175. Baldo, J.V., Shimamura, A.P., Delis, D.C., Kramer, J. & Kaplan, E., (2001). Verbal and design fluency in patients with frontal lobe lesions. Journal of the International Neuropsychological Society, 7, 586-596.
97

98 Barkley, R. A. (1997). Behavioral inhibition, sustained attention, and executive functions: Constructing a unifying theory of ADHD. Psychological Bulletin, 121, 65-94. Barkley, R. A. (2001). The executive functions and self-regulation: An evolutionary neuropsychological perspective. Neuropsychology Review, 11, 1-29.
Bayer, U. & Hausmann, M. (2009). Estrogen therapy effects right hemisphere functioning in postmenopausal women. Hormones and Behavior, 55, 228-234. Beck, A.T., Steer, R.A., & Brown, G.K. (1996). Beck Depression Inventory: Second Edition: Examiner’s manual. San Antonio, TX: The Psychological Corporation.
Blakemore, S. J. & Choudhury, S. (2006). Development of the adolescent brain: Implications for executive function and social cognition. Journal of Child Psychology and Psychiatry, 47, 296-312. Boone, K.B., Ponton, M.O., Gorsuch, R.L., Gonzalez, J.J., & Miller, B.L. (1998). Factor analysis of four measures of prefrontal lobe functioning. Archives of Clinical Neuropsychology, 13, 585-595. Brocki, K. C., & Bohlin, G. (2004). Executive functions in children aged 6 to 13: A dimensional and developmental study. Developmental Neuropsychology, 26, 571. Bryant, F. B. & Baxter, J. W. (1997). The structure of positive and negative automatic cognition. Cognition and Emotion, 11, 225-258. Butler, M., Retzlaff, P., & Vanderploeg, R. (1991). Neuropsychological test usage. Professional Psychology: Research and Practice, 22, 510-512. Casey, B. J., Giedd, J. N., & Thomas, K. M. (2000). Structural and functional brain development and its relations to cognitive development. Biological Psychology, 54, 241–257. Casey, B.J., Trainor, R.J., Orendi, J.L., Schubert, A.B., Nystrom, L.E., & Giedd, J.N. (1997). A developmental functional MRI study of prefrontal activation during performance of a go-no-go task. Journal of Cognitive Neuroscience 9, 835–847. Caviness V.S. Jr., Kennedy D.N., Richelme C., Rademacher J., Filipek P.A. (1996). The human brain age 7–11 years: a volumetric analysis based on magnetic resonance images. Cerebral Cortex 6, 726–736. Chudasama, Y. & Robbins, T.W. (2006). Functions of frontal-striatal systems in cognition: Comparative neuropsychopharmocological studies in rats, monkeys, and humans. Biological Psychology, 73, 19-38.

99 Channon, S. (1996). Executive dysfunction in depression. Journal of Affective Disorders, 39, 107-114. Chaytor, N., & Schmitter-Edgecombe, M. (2003). The ecological validity of neuropsychological tests: A review of the literature on everyday cognitive skills. Neuropsychology Review, 13, 181–197. Cohen, R.A., Malloy, P.F., Jenkins, M.A., & Paul, R.H. (2006). Disorders of attention. In P.J. Snyder, P.D. Nussbaum, & D.L. Robins (Eds.), Clinical Neuropsychology, Second Edition (pp. 607-625). Washington D.C.: APA. Conklin, H. M., Luciana, M., Hooper, C.J., Yarger, R.S. (2007). Working memory performance in typically developing children and adolescents: Behavioral evidence of protracted frontal lobe development. Developmental Neuropsychology, 31, 103-128. Delis, D. C., Kaplan, E., & Kramer, J. H. (2001). Delis-Kaplan Executive Function System: Examiner’s manual, San Antonio, TX: The Psychological Corporation. Delis, D. C., Lansing, A., Houston, W. S., Wetter, S., Han, S. D., Jacobson, M., et al. (2007). Creativity lost: The importance of testing higher-level executive functions in school-age children and adolescents. Journal of Psychoeducational Assessment, 25, 29-40. Denckla, M.B. (1994). Measurement of Executive Function. In G.R. Lyon (Vol. Ed.), Frames of reference for the assessment of learning disabilities: New views on measurement issues (pp. 117-142). Baltimore: Paul H. Brookes.
Denckla, M.B. (1996). A theory and model of executive function: A Neuropsychological perspective. In G.R. Lyon & N.A. Krasnegor (Eds.), Attention, Memory, and Executive Function (pp. 263-278). Baltimore: Paul H. Brookes. Dennis, M. (1991). Frontal lobe function in childhood and adolescence: A heuristic for assessing attention regulation, executive control, and the intentional states important for social discourse. Developmental Neuropsychology, 7, 327-358. D’Esposito, M., Aguirre, G. K., Zarahn, E., Ballard, D., Shin, R. K., & Lease, J. (1998). Functional MRI studies of spatial and nonspatial working memory. Cognitive Brain Research, 7, 1–13. Dowsett, S. M., & Livesey, D. J. (2000). The development of inhibitory control in preschool children: Effects of "executive skills" training. Developmental Psychobiology, 36, 161-174.
100 Durston, S., Hilleke, E., Hulshoff, P., Casey, B. J., Giedd, J. N., Buttlelaar, J. K., & VanEngeland, H. (2001). Anatomical MRI of the developing human brain: What have we learned? Journal of the American Academy of Child and Adolescent Psychiatry, 40, 1012–1020.
Elliot, R. (1998). The neuropsychological profile in unipolar depression. Trends in Cognitive Sciences, 2, 447-454. Faul, F., Erdfelder, E., Lang, A.-G., & Buchner, A. (2007). G*Power 3: A flexible statistical power analysis program for the social, behavioral, and biomedical sciences. Behavior Research Methods, 39, 175-191. Gioia, G. A., & Isquith, P. K. (2004). Ecological assessment of executive function in traumatic brain injury. Developmental Neuropsychology, 25, 135-158. Gioia, G.A., Isquith, P.K., Guy, & Kenworthy, (2000). Behavior Rating of Executive Function: Examiner’s manual. Lutz, FL.: Psychological Assessment Resources. Gioia, G.A., Isquith, P.K., Retzlaff, P.D., & Espy, K.A. (2002). Confirmatory factor analysis of the Behavior Rating Inventory of Executive Functioning (BRIEF) in a clinical sample. Child Neuropsychology, 8, 249-257. Goodwin, G, M. (1997). Neuropsychological and neuroimaging evidence for the involvement of the frontal lobes in depression. Journal of Psychopharmacology, 11, 115-122. Guy, S. C., Isquith, P. K., & Gioia, G. A. (2004). BRIEF-SR: Behavior rating inventory of executive function-self report version: Professional manual. Florida: Psychological Assessment Resources. Hampshire, A. & Owen, A.M. (2006). Fractioning attentional control using event-related fMRI. Cerebral Cortex, 16, 1679-1689. Hartlage, S., Alloy, L.B., Vazquez, C. & Dykman, B. (1993). Automatic and effortful processing in depression. Psychological Bulletin, 113, 247-278. Haut, M.W., Kuwabara, H., Leach, S., & Arias, R.G. (2000). Neural activation during performance of number-letter sequencing. Applied Neuropsychology, 7, 237-242.
Hodgson, T., Chamberlain, M., Parris, B., James, M., Gutowski, N., Husain, M., & Kennard, C. (2007). The role of the ventrolateral frontal cortex in inhibitory oculomotor control. Brain, 130, 1525-1537.

101 Homack, S., Lee, D., & Riccio, C.A. (2005). Test review: Delis-Kaplan Executive Function System. Journal of Clinical and Experimental Neuropsychology, 27, 599-609.
Howieson, D.B., Loring, D.W., & Hannay, H.J. (2004). Neurobehavioral variables and diagnostic issues. In M.D. Lezak, D.B. Howieson, & D.W. Loring (Eds.), Neuropsychological Assessment (pp. 286-336). New York: Oxford University Press. Hu, L. & Bentler, P.M. (1998). Fit indices in covariance structure modeling: Sensitivity to unparameterized model misspecification. Psychological Methods, 3, 424-453. Jackson, S.R., Marrocco, R., & Posner, M.I. (2006). Networks of anatomical areas controlling visuospatial attention. Neural Networks, 7, 925-944. Kalkut, E.L., Han., S.D., Lansing, A.E., Holdnack, J.A., Delis, D.C. (2009). Development of set-shifting ability from late childhood through early adulthood. Manuscript submitted for publication (copy on file with author). Kramer, J. H., Quitania, L., Dean, D., Neuhaus, J., Rosen, H. J., Halabi, C., et al. (2007). Magnetic resonance imaging correlates of set shifting. Journal of the International Neurological Society, 13, 386-392. Landro, N.I., Stiles, T.C., & Sletvold, H. (2001). Neuropsychological function in nonpsychotic unipolar major depression. Neuropsychiatry, Neuropsychology, and Behavioral Neurology, 14, 233-240. Levin, R.L., Heller, W., Mohanty, A., Herrington, J.D., & Miller, G.A. (2007). Cognitive deficits in depression and functional specificity of regional brain activity. Cognitive Therapy Research, 31, 211-233. Lezak, M.D. (1982). The problem of assessing executive functions. International Journal of Psychology, 17, 281-297. Lezak, M.D., Howieson, D.B., & Loring, D.W. (2004). Executive functions and motor performance. In M.D. Lezak, D.B. Howieson, & D.W. Loring (Eds.), Neuropsychological Assessment (pp. 611-646). New York: Oxford University Press. Malloy, P.F., Cohen, R.A., Jenkins, M.A. & Paul, R.H. (2006). Frontal lobe function and dysfunction. In P.J. Snyder, P.D. Nussbaum, & D.L. Robins (Eds.), Clinical Neuropsychology, Second Edition (pp. 607-625). Washington D.C.: APA. Malloy, P.F., Webster, J.S., & Russell, W. (1985). Tests of Luria’s frontal lobe syndromes. International Journal of Clinical Neuropsychology, 7, 88-95.

102 Miyake, A., Friedman, N.P., Emerson, M.J., Witzki, A.H., Howerter, A., & Wagner, T.D. (2000). The unity and diversity of executive functions and their contributions to complex “frontal lobe” tasks: A latent variable analysis. Cognitive Psychology, 41, 49-100. Merriam, E.P., Thase, M.E., & Haas, G.L., (1999). Prefrontal cortical dysfunction in depression determined by Wisconsin Card Sorting Test. American Journal of Psychiatry, 156:780–782. Nauta, W.J. (1971). The problem of the frontal lobe: A reinterpretation. Journal of Psychiatric Research, 8, 167-187. Pardo, J.V., Pardo, P.J., Humes, S.W., & Posner, M.I. (1996). Neurocognitive dysfunction in antidepressant-free, non-elderly patients with unipolar depression: Alerting and covert orienting of visuospatial attention. Journal of Affective Disorder, 92, 71-78. Pineda, D.A. & Merchan, V. (2003). Executive function in young Colombian adults. International Journal of Neuroscience, 113, 397-410. Rabin, L.A., Roth, R.M., Isquith, P.K., Wishart, H.A., Nutter-Upham, K.E., Pare, N., Flasman, L.A., & Saykin, A.J. (2006). Self- and informant reports of executive function on the BRIEF-A in MCI and older adults with cognitive complaints. Archives of Clinical Neuropsychology, 21, 721-732. Roth, R.M., Isquith, P.K., & Gioia, G.A. (2005). Behavior Rating Inventory of Executive Function: Adult Version: Examiner’s manual. Lutz, FL.: Psychological Assessment Resources. Rubia, K., Smith, A.B., Woolley, J., Nosarti, C., Heyman, I., Taylor, E., & Brammer, M. (2006). Progressive increase of frontostriatal brain activation from childhood to adulthood during event-related tasks of cognitive control. Human Brain Mapping, 27, 973-993. Rueda, M. R., Fan, J., McCandliss, B., Halparin, J. D., Gruber, D. B., Pappert, L. (2004). Development of attentional networks in childhood. Neuropsychologia, 42, 1029– 1040. Rueda, M.R., Posner, M.I., & Rothbart, M.K. (2005). The development of executive attention: Contributions to the emergence of self-regulation. Developmental Neuropsychology, 28, 573-594. Salloway, S.P. (1994). Diagnosis and treatments of patients with “frontal lobe” syndromes. Journal of Neuropsychiatry and Clinical Neurosciences, 6, 388-398.

103 Schmitz, N., Wang, J., Malla, N., & Lesage, A. (2007). Joint effect of depression and chronic conditions on disability: Results from a population-based study. Psychosomatic Medicine, 69, 332-338. Shunk, A.W., Davis, A.S., & Dean, R.S. (2006). The Delis-Kaplan Executive Function System: Test review. Applied Neuropsychology, 13, 275-279. Slagter, H.A., Giesbrecht, B., Kok, A., Weissman, D.H., Kenemans, J.L., Woldorff, M.G., & Mangun, G.R. (2007). fMRI evidence for both generalized and specialized components of attentional control. Brain Research, 1177, 90-102. Slick, D.J., Lautzenhiser, A., Sherman, E.M.S., Eyrl, K. (2006). Frequency of scale elevations and factor structure of the Behavior Rating Inventory of Executive Function (BRIEF) in children and adolescents with intractable epilepsy. Child Neuropsychology, 12, 181-189. Smith, E.E. & Jonides, J. (1998). Neuroimaging analyses of human working memory. Proceedings of the National Academy of Sciences of the United States of America, 95, 12061-12068. Spitznagel, M. B., Tremont, G., Brown, L. B., & Gunstad, J. (2006). Cognitive reserve and the relationship between depressive symptoms and awareness of deficits in dementia. Journal of Neuropsychiatry and Clinical Neurosciences, 18, 186–190. Stins, J.F., Tolenaar, M.S., Slaats-Willemse, D.I., Buitelaar, J.K., Swaab-Barneveld, H., Verhulst, F.C., Polderman, T.C., & Boomsma, D.I. (2005). Sustained attention and executive functioning performance in Attention-Deficit/Hyperactivity Disorder. Child Neuropsychology, 11, 285-294. Stuss, D. T. (1992). Biological and psychological development of executive functions. Brain and Cognition, 20, 8-23.
Tranel, D., Anderson, S.W., & Benton, A. (1994). Development of the concept of ‘executive function’ and its relationship to the frontal lobes. In F. Boller & J. Grafman (Eds.) Handbook of Neuropsychology. : Elsevier Science B.V.
Veiel, H.O.F. (1997). A preliminary profile of neuropsychological deficits associated with major depression. Journal of Clinical and Experimental Neuropsychology, 19, 587-603. Vendrell, P., Junque, C., Pujol, J., Jurado, M.A., Molet, J., & Grafman, J. (1995). The role of prefrontal regions in the Stroop task. Neuropsychologia, 33, 341-352.

104 Vriezen, E.R. & Pigott, S.E. (2002). The relationship between parental report on the BRIEF and performance-based measures of executive function in children with moderate to severe traumatic brain injury. Child Neuropsychology, 8, 296-303. Walter, H, Wolf, R.C., Spitzer, M., & Vasic, M. (2007). Increased left prefrontal activation in patients with unipolar depression: An event-related, parametric, performance controlled fMRI study. Journal of Affective Disorders, 101, 175-185. Wechsler, D. (1999). Wechsler Abbreviated Scale of Intelligence: Examiner’s manual. San Antonio, TX: The Psychological Corporation. Wecker, N.S., Kramer, J.H., Hallam, B.J., & Delis, D.C. (2005). Mental flexibility: Age effects on switching. Neuropsychology, 19, 345-352.
Welsh, M. C., Pennington, B. F., & Grossier, D. B. (1991). A normative-developmental study of executive function: A window on prefrontal function in children. Developmental Neuropsychology, 7, 131-149. Wendelken, C., Bunge, S.A., & Carter, C.S. (2008). Maintaining structured information: An investigation into functions of parietal and lateral prefrontal cortices. Neuropsychologia, 46, 665-678. Wolfe, N., Linn, R., Babikian, V., Knoeffel, J.E. et al. (2004). Frontal systems impairment following multiple lacunar infarcts. Archives of Neurology, 47, 129- 132.
Ylvisaker, M., & Feeney, T. (2002). Executive functions, self-regulation, and learned optimism in paediatric rehabilitation: A review and implications for intervention. Pediatric Rehabilitation, 5, 51-70.
Zelazo, P. D., & Frye, D. (1998). Cognitive complexity and control: II. The development of executive function in childhood. Current Directions in Psychological Science, 7, 121-126.

VITA
Erica is in her fifth year of study in the Clinical Psychology Ph.D. program at
Loyola University Chicago and completing a pre-doctoral internship at Rush University
Medical Center in Chicago, IL in clinical neuropsychology. She received a B.A. in
Psychology, Magna cum Laude from the University of Connecticut in 2002. Her current
clinical and research interests include neuropsychological assessment, executive
functioning across the lifespan, and the impact of psychiatric disorders on
neuropsychological assessment and neurological disorders.
10