IDENTIFYING COMPONENT-PROCESSES OF EXECUTIVE FUNCTIONING THAT SERVE AS RISK FACTORS FOR...
11
Identifying Component-Processes of Executive Functioning That Serve as Risk Factors for the Alcohol-Aggression Relation Peter R. Giancola and Aaron J. Godlaski University of Kentucky Robert M. Roth Dartmouth Medical School The present investigation determined how different component-processes of executive functioning (EF) served as risk factors for intoxicated aggression. Participants were 512 (246 males and 266 females) healthy social drinkers between 21 and 35 years of age. EF was measured using the Behavior Rating Inventory of Executive Functioning–Adult Version (BRIEF-A) that assesses nine EF components. After the consumption of either an alcohol or a placebo beverage, participants were tested on a modified version of the Taylor Aggression Paradigm in which mild electric shocks were received from, and administered to, a fictitious opponent. Aggressive behavior was operationalized as the shock intensities and durations administered to the opponent. Although a general BRIEF-A EF construct consisting of all nine components predicted intoxicated aggression, the best predictor involved one termed the Behavioral Regulation Index that comprises component processes such as inhibition, emotional control, flexible thinking, and self-monitoring. O God, that men should put an enemy in their mouths to steal away their brains! that we should, with joy, pleasance, revel, and applause, transform ourselves into beasts! William Shakespeare, Othello The loss of cognitive, emotional, and behavioral control under the influence of alcohol clearly drives some individuals to commit thoughtless and damaging acts. Alcohol intoxication is involved in 55 to 60% of violent crimes (U.S. Department of Justice, 2005). Alcohol is implicated in the majority of perpetrators of sexual assaults and is involved in a higher percentage of aggravated versus simple assaults in the general population (Maston, 2010). Similar relations are also observed in alcohol-related crime among college students (Baum & Klaus, 2005). It is well accepted that alcohol increases the propensity for aggression in some, but not all persons, and that the process by which this occurs is driven largely by what trait factors place a person at heightened risk for such behavior (Collins, 1988; Fish- bein, 2003). Findings from several meta-analytic studies show that alcohol has a “medium” effect size (d 0.49 to 0.61) on aggres- sion (Bushman & Cooper, 1990; Hull & Bond, 1986; Ito, Miller, & Pollock, 1996). However, it has also been hypothesized that alcohol’s true effect on aggression may be obfuscated by a failure to in take into account key moderating trait risk factors (Giancola, Josephs, Parrott, & Duke, 2010). Executive Functioning While a number of variables have been found to moderate the alcohol-aggression relation (e.g., Berman, Bradley, Fanning, & Mc- Closkey, 2009; Giancola, 2004), the lack of consensus in defining and conceptualizing executive function (EF), has made it a risk factor of special interest. Most theorists would agree that EF is a complex cognitive construct involved in planning, initiation, and self- regulation of goal-directed behavior (Goldberg, 2001; Mesulam, 2002); in other words, the conscious control of thought and action. Abilities that fall under the rubric of EF include strategic planning, abstract reasoning, set-shifting (i.e., flexible thinking), organization and manipulation of information in working memory, decision- making, problem-solving, behavioral inhibition, emotional regulation, as well as self- and task-monitoring (Alexander & Stuss, 2006; Bechara & Van Der Linden, 2005). The empirical structure of the skills that comprise EF, and how they relate to one another, varies depending on one’s conceptual- ization of the construct, which then dictates how it will be mea- sured. Conceptually, EF can be appreciated as a relatively unified whole (Duncan et al., 2000; Zelazo, Carter, Reznick, & Frye, 1997) or as a set of distinct components (Baddeley & Logie, 1999; Shallice, 2002). Accordingly, some empirical studies have found EF to be best understood as a unitary general construct (Giancola, 2004; Giancola, Mezzich, & Tarter, 1998) while others have found that it better conforms to a set of fractionated components that still share a significant underlying commonality (Lehto, Juujarvi, Kooistra, & Pullkinen, 2003; Miyake, Friedman, Emerson, Witzki, & Howerter, 2000). While fully appreciating the aforementioned issues, Bates (2000) argued that viewing EF as a set of related component- processes could improve our understanding of the construct. Such a view would allow for the advancement of theoretically supported predictions regarding how particular EF components might differ- entially relate to, or predict, specific behavioral outcomes. Related to this line of thinking, a recent conceptualization of EF divided the construct into two categories termed “cool” and “hot” (Se ´guin, Peter R. Giancola and Aaron J. Godlaski, Department of Psychology, University of Kentucky; Robert M. Roth, Neuropsychology Program and Brain Imaging Laboratory, Department of Psychiatry, Dartmouth Medical School. This research was supported by grant R01-AA-11691 from the National Institute on Alcohol Abuse and Alcoholism and from the National Center for Research Resources awarded to Dr. Giancola. Correspondence concerning this article should be addressed to Peter R. Giancola, Department of Psychology, University of Kentucky, 115 Kastle Hall, Lexington, KY 40506-0044. E-mail: [email protected] Psychology of Addictive Behaviors © 2011 American Psychological Association 2011, Vol. ●●, No. ●, 000–000 0893-164X/11/$12.00 DOI: 10.1037/a0025207 1 tapraid5/ze6-adb/ze6-adb/ze600311/ze62417d11z xppws S1 8/3/11 12:24 Art: 2011-0828
Transcript of IDENTIFYING COMPONENT-PROCESSES OF EXECUTIVE FUNCTIONING THAT SERVE AS RISK FACTORS FOR...
Identifying Component-Processes of Executive Functioning That Serveas Risk Factors for the Alcohol-Aggression Relation
Peter R. Giancola and Aaron J. GodlaskiUniversity of Kentucky
Robert M. RothDartmouth Medical School
The present investigation determined how different component-processes of executive functioning (EF)served as risk factors for intoxicated aggression. Participants were 512 (246 males and 266 females)healthy social drinkers between 21 and 35 years of age. EF was measured using the Behavior RatingInventory of Executive Functioning–Adult Version (BRIEF-A) that assesses nine EF components. Afterthe consumption of either an alcohol or a placebo beverage, participants were tested on a modifiedversion of the Taylor Aggression Paradigm in which mild electric shocks were received from, andadministered to, a fictitious opponent. Aggressive behavior was operationalized as the shock intensitiesand durations administered to the opponent. Although a general BRIEF-A EF construct consisting of allnine components predicted intoxicated aggression, the best predictor involved one termed the BehavioralRegulation Index that comprises component processes such as inhibition, emotional control, flexiblethinking, and self-monitoring.
O God, that men should put an enemy in their mouths to steal awaytheir brains! that we should, with joy, pleasance, revel, and applause,transform ourselves into beasts!
�William Shakespeare, Othello
The loss of cognitive, emotional, and behavioral control underthe influence of alcohol clearly drives some individuals to committhoughtless and damaging acts. Alcohol intoxication is involved in55 to 60% of violent crimes (U.S. Department of Justice, 2005).Alcohol is implicated in the majority of perpetrators of sexualassaults and is involved in a higher percentage of aggravatedversus simple assaults in the general population (Maston, 2010).Similar relations are also observed in alcohol-related crime amongcollege students (Baum & Klaus, 2005).
It is well accepted that alcohol increases the propensity foraggression in some, but not all persons, and that the process bywhich this occurs is driven largely by what trait factors place aperson at heightened risk for such behavior (Collins, 1988; Fish-bein, 2003). Findings from several meta-analytic studies show thatalcohol has a “medium” effect size (d � 0.49 to 0.61) on aggres-sion (Bushman & Cooper, 1990; Hull & Bond, 1986; Ito, Miller,& Pollock, 1996). However, it has also been hypothesized thatalcohol’s true effect on aggression may be obfuscated by a failureto in take into account key moderating trait risk factors (Giancola,Josephs, Parrott, & Duke, 2010).
Executive Functioning
While a number of variables have been found to moderate thealcohol-aggression relation (e.g., Berman, Bradley, Fanning, & Mc-Closkey, 2009; Giancola, 2004), the lack of consensus in defining andconceptualizing executive function (EF), has made it a risk factor ofspecial interest. Most theorists would agree that EF is a complexcognitive construct involved in planning, initiation, and self-regulation of goal-directed behavior (Goldberg, 2001; Mesulam,2002); in other words, the conscious control of thought and action.Abilities that fall under the rubric of EF include strategic planning,abstract reasoning, set-shifting (i.e., flexible thinking), organizationand manipulation of information in working memory, decision-making, problem-solving, behavioral inhibition, emotional regulation,as well as self- and task-monitoring (Alexander & Stuss, 2006;Bechara & Van Der Linden, 2005).
The empirical structure of the skills that comprise EF, and howthey relate to one another, varies depending on one’s conceptual-ization of the construct, which then dictates how it will be mea-sured. Conceptually, EF can be appreciated as a relatively unifiedwhole (Duncan et al., 2000; Zelazo, Carter, Reznick, & Frye,1997) or as a set of distinct components (Baddeley & Logie, 1999;Shallice, 2002). Accordingly, some empirical studies have foundEF to be best understood as a unitary general construct (Giancola,2004; Giancola, Mezzich, & Tarter, 1998) while others have foundthat it better conforms to a set of fractionated components that stillshare a significant underlying commonality (Lehto, Juujarvi,Kooistra, & Pullkinen, 2003; Miyake, Friedman, Emerson, Witzki,& Howerter, 2000).
While fully appreciating the aforementioned issues, Bates(2000) argued that viewing EF as a set of related component-processes could improve our understanding of the construct. Sucha view would allow for the advancement of theoretically supportedpredictions regarding how particular EF components might differ-entially relate to, or predict, specific behavioral outcomes. Relatedto this line of thinking, a recent conceptualization of EF dividedthe construct into two categories termed “cool” and “hot” (Seguin,
Peter R. Giancola and Aaron J. Godlaski, Department of Psychology,University of Kentucky; Robert M. Roth, Neuropsychology Program andBrain Imaging Laboratory, Department of Psychiatry, Dartmouth MedicalSchool.
This research was supported by grant R01-AA-11691 from the NationalInstitute on Alcohol Abuse and Alcoholism and from the National Centerfor Research Resources awarded to Dr. Giancola.
Correspondence concerning this article should be addressed to Peter R.Giancola, Department of Psychology, University of Kentucky, 115 KastleHall, Lexington, KY 40506-0044. E-mail: [email protected]
Psychology of Addictive Behaviors © 2011 American Psychological Association2011, Vol. ●●, No. ●, 000–000 0893-164X/11/$12.00 DOI: 10.1037/a0025207
1
tapraid5/ze6-adb/ze6-adb/ze600311/ze62417d11z xppws S�1 8/3/11 12:24 Art: 2011-0828
Arseneault, & Tremblay, 2007; Zelazo & Muller, 2002). Cool EFskills are considered to be more “cerebral” or metacognitive innature, are more likely to be utilized in abstract decontextualizedreasoning, and have been argued to be governed by the dorsolateralprefrontal cortex (Metcalfe & Mischel, 1999; Zelazo & Muller,2002). More specifically, cool EFs include problem-solving abil-ities that require the capacity to represent a dilemma, maintain andorganize related information in working memory, strategicallyplan and execute a response, evaluate the efficacy of the solution,and make necessary changes based on the outcome (Seguin et al.,2007; Zelazo et al., 1997). In contrast, hot EF has been describedas being primarily governed by the ventromedial prefrontal cortex,which is closely connected to the limbic system, and is morestrongly involved with the regulation of affective and motivationalprocesses (Zelazo & Muller, 2002). Furthermore, hot EF is asso-ciated with an increased sensitivity to environmental cues ofpunishment as well as quick visceral responses pursuant to on-coming danger such as a hostile provocation (Seguin et al., 2007).Deficits in hot EF have also been reported to be more closelyrelated to impairments in social and emotional functioning thancool EF (Hongwanishkul, Happaney, Lee, & Zelazo, 2005). Im-paired hot EF may contribute to aggression by reducing one’sability to monitor the self and the situation for what are consideredto be acceptable social behaviors, regulate emotional responses,and inhibit impulsive reactions.
Increasingly complex social-information processing related tobehavioral responses requires time and progressively more elabo-rate decontextualized problem-solving abilities that are attributedto cool EF (Zelazo & Cunningham, 2007). However, before theseand other related cognitive skills can begin to be enacted, theability to control emotional reactions and inhibit basic behavioralimpulses is required first (Barkley, 1997; Sonuga-Barke, Dalen,Daley, & Remington, 2002). Accordingly, hot EF componentssuch as inhibitory control and emotional self-regulation may beconsidered to be temporally antecedent to cool components such asstrategic planning and abstract problem-solving. If hot regulationrepresents the first-line of defense in controlled responding toaggression-eliciting provocation; then, understanding the role ofbehavioral and emotional regulation in alcohol-related aggressionbecomes of particular importance in predicting who will becomeaggressive under the influence of alcohol.
EF and Aggression
The relation between poor EF and increased aggression aredocumented in a wealth of studies (reviewed in Giancola, 1995;Hawkins & Trobst, 2000; Moffitt, 1993; Morgan & Lilienfeld,2000). A number of these reports implicate emotional and behav-ioral regulation deficits in aggressive behavior in varied popula-tions from healthy children (Ellis, Weiss, & Lochman, 2009;Raaijmakers et al., 2008) to violent offenders (Hoaken, Allaby, &Earle, 2007; Raine & Yang, 2006). In this sense, hot EF functionsas a “gate-keeper,” controlling emotional and behavioral reactionsto the environment and is considered a moderator of, or risk factorfor, violence. Accordingly, when exposed to hostile provocation,an individual with intact EF is capable of fully appraising theirsituation, inhibiting the immediate emotional responses to retali-ate, and then behaving in a socially adaptive manner (unlessviolence is necessary for valid reasons of defense). However, if
this same person possesses limited EF capacities, s/he will havedifficulty controlling their emotional responses and inhibiting theirimpulses to retaliate in an aggressive manner that will then makeit significantly less likely that they will engage in the more coolabstract reasoning/problem-solving aspects of EF.
Measuring EF With the BRIEF-A
The Behavior Rating Inventory of Executive Function–Adult Ver-sion (BRIEF-A; Roth, Isquith, & Gioia, 2005) is a self-report inven-tory that assesses a variety of EFs utilized in everyday life. Themeasure provides a global score reflecting an individual’s overalllevel of EF, termed the Global Executive Composite (GEC), as wellas two factors reflecting higher-order cognitive regulation (i.e., Meta-cognition Index; MI) and behavioral-emotional regulation (i.e., Be-havioral Regulation Index; BRI). Although the latter two indices aremoderately correlated with one another, they are better understood astwo distinct, yet related, components of EF (Gioia, Isquith, Retzlaff, &Espy, 2002; Roth et al., 2005).
The MI appears to reflect largely what has been described ascool EF; assessing one’s ability to independently initiate tasks,organize, and manipulate information in working memory, moni-tor task performance for accuracy, as well as engage in strategicplanning and problem-solving (Roth et al., 2005). In contrast, theBRI comprises skills that generally fall under the rubric of hot EFsuch as the ability to properly regulate behavioral and emotionalimpulses, inhibit inappropriate thoughts and actions, actively shift/alter maladaptive problem-solving strategies (i.e., flexible think-ing), and monitor the effects of one’s behaviors on others (Hong-wanishkul et al., 2005; Seguin, Arseneault, Boulerice, Harden, &Tremblay, 2002; Zelazo & Cunningham, 2007). Without the abil-ity to emotionally regulate behavior (i.e., poor hot EF), the enact-ment of cool EF propensities such as strategic planning and ab-stract problem-solving become significantly less accessible(Zelazo & Cunningham, 2007), and may be less predictive ofaggression than hot EF. As the BRI reflects aspects of hot EF whilethe MI reflects aspects of cool EF, the BRIEF-A has the potentialto be a highly useful tool to understand the relation betweendifferent component-processes of EF in relation to aggression; anendeavor never attempted before this investigation.
EF, Alcohol, and Aggression
EF governs the same cognitive, emotional, and behavioral reg-ulatory capacities that alcohol is purported to disrupt (reviewed inGiancola, 2000). Hence, possessing limited EF coupled with alco-hol’s disinhibitory effects should engender greater aggression.Giancola (2004) supported this hypothesis by demonstrating thatEF, measured by an array of performance-based neuropsycholog-ical tests, was a risk factor for intoxicated aggression in a labora-tory setting. Specifically, alcohol intoxication was significantlymore likely to increase aggression in persons with lower, ratherthan higher, EF. However, Giancola’s battery was not designed toexamine more refined cognitive components of EF.
Thus, the purpose of the present investigation is to build uponGiancola’s (2004) research. Unlike Giancola’s previous experi-ment, we will use the BRIEF-A as our measure of EF because it iscapable of assessing a variety of EFs. As noted above, this willafford us the advantage of testing the role of separate EF compo-
2 GIANCOLA, GODLASKI, AND ROTH
tapraid5/ze6-adb/ze6-adb/ze600311/ze62417d11z xppws S�1 8/3/11 12:24 Art: 2011-0828

nents in relation to intoxicated aggression in a way never donebefore. Consistent with Giancola’s first experiment, we too hy-pothesize that a general EF score (i.e., the GEC index) willmoderate the alcohol-aggression relation. While the GEC is abroad measure of EF, it simply represents a composite of theBRIEF-As two major indices: the BRI and MI. As such, solelyusing the GEC would cloud, and limit, the potential explanatorypower of our results by reducing our ability to differentiate be-tween the theoretically important components of behavioral/emotional regulation (i.e., BRI) and metacognition (i.e., MI) in theprediction of intoxicated aggression. Consequently, we will ad-vance Giancola’s findings by making the more significant predic-tion that the alcohol-aggression relation will be moderated by hotEF, as reflected by the BRIEF-A BRI, but not by cool EF, asreflected by the MI. These predictions are based on our theoreticalconceptualizations of hot and cool EF in addition to the fact thatintoxicated persons with deficits in hot EF will have less access toEFs aggression-inhibiting components, such as behavioral andemotional regulation that are required to inhibit an immediateviolent reaction to provocation.
Method
Participants
Participants were 512 (246 males and 266 females) healthysocial drinkers between 21 and 35 years of age (M � 23.08; SD �2.93) recruited from the greater Lexington, KY, area throughnewspaper advertisements and fliers. This is an entirely differentsample than that used in Giancola (2004) and Godlaski and Gian-cola (2009) that utilized performance-based neuropsychologicaltests and not the self-report BRIEF-A instrument. Moreover, thepresent investigation did not utilize any neuropsychological mea-sures. Social drinking was defined as consuming at least 3–4drinks per occasion at least twice per month. The racial composi-tion of the sample was 87% White, 10% African American, 1%Hispanic, and 2% Other. Most participants (92%) had never mar-ried, had an average of 16 years of education, and had an averagehousehold income of $61,000.
Inclusion and Exclusion Criteria
Respondents were initially screened by telephone. However, duringthe laboratory session, individuals reporting any past or present drug-or alcohol-related problems, contraindications to alcohol consump-tion, serious head injuries, learning disabilities, or serious psychiatricsymptoms were excluded from participation. Regarding drinkingproblems, persons scoring an “8” or more on the Short MichiganAlcoholism Screening Test (Selzer, Vinokur, & van Rooijen, 1975)were also excluded. Less than 1.5% of respondents had to be excludedbecause of self-reported drug or alcohol-related problems. Anyonewith a positive breath alcohol concentration (BrAC) test or with apositive urine pregnancy/drug test result (i.e., cocaine, marijuana,morphine, amphetamines, benzodiazepines, and barbiturates) uponarrival at the laboratory were not allowed to participate (less than 1%).Women were not tested between 1 week before menstruation and thebeginning of menstruation because hormonal variations associatedwith menstruation can affect aggressive responding (Volavka, 1995).Participants abstained from alcohol for 24 hr, from caffeinated bev-
erages the day of the study, and from food for 4 hr before consumingbeverages.
Assessment of EF
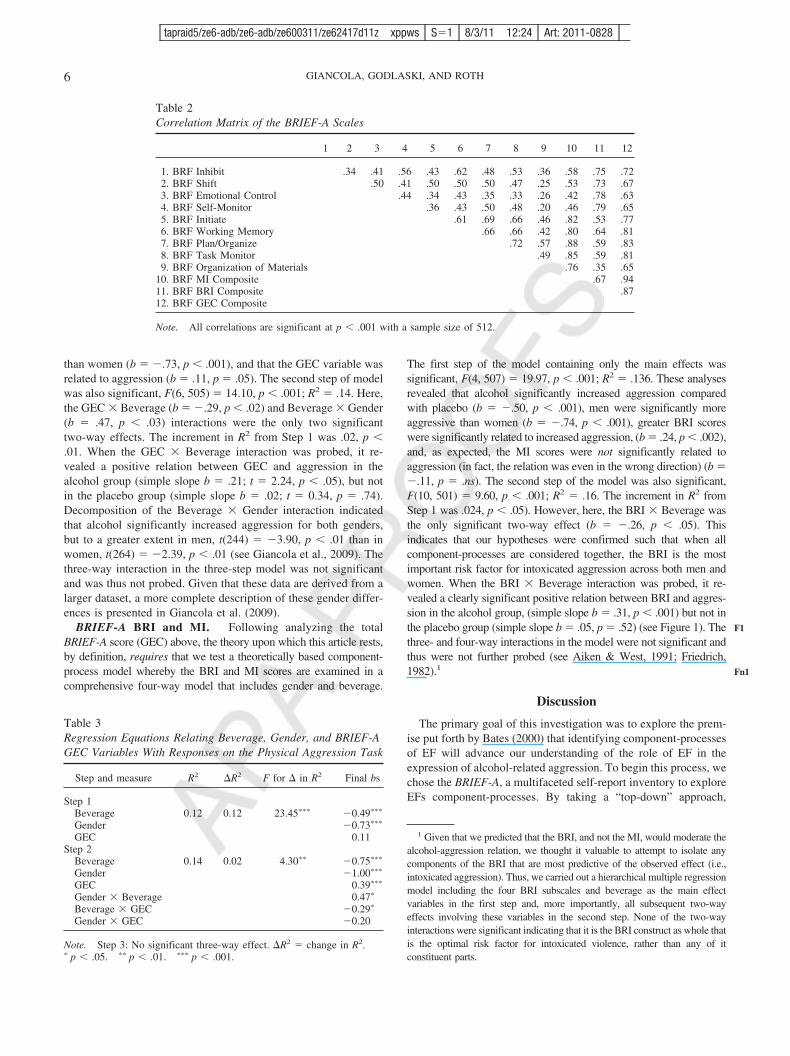
Demographic data were then collected. Participants completedthe BRIEF-A (Roth et al., 2005) in addition to a number of otherself-report inventories not pertinent to this experiment. TheBRIEF-A is a 75-item questionnaire designed to gauge the integrityof EF component processes that are utilized in everyday life (Rothet al., 2005). As indicated above, the inventory yields an overallscore (GEC), that is a composite of two index scores (the BRI andthe MI). The BRI is comprised of four scales (i.e., Inhibit, Shift,Emotional Control, and Self Monitor) and the MI is comprised offive scales (i.e., Initiate, Working Memory, Plan/Organize, TaskMonitor, and Organization of Materials) reflecting a variety ofprocesses commonly considered to be key components of EF.Higher scores reflect greater difficulty with EF. Three validityscales are also included and referred to as Negativity, Infrequencyand Inconsistency. No participants had to be excluded because ofdeviations on these scales. The BRIEF-A was standardized on1,050 adults sampled to approximate the 2002 U.S. census pro-portions with respect to sociodemographic characteristics. Themeasure has excellent internal consistency (Cronbach’s alpha co-efficients ranging from .93 to .96 for the three major indices) and1-month test–retest reliabilities (ranging from r � .93 to .94 for thethree major indices) (Roth et al., 2005). Support for the convergentand discriminant validity of the BRIEF-A has been reported (Rothet al., 2005). In the current sample, � coefficients for the nineindividual subscales ranged from .69 to .89 with a mean of .77,which are consistent with the standardization sample. In our sam-ple, the BRI, MI, and GEC had � coefficients of .89, .94, and .95,respectively. Table 2 summarizes the correlations between theBRIEF-As individual subscales and composite indices for thisspecific experimental sample.
The BRIEF-A was selected as our measure of EF based on anumber of considerations: (1) It contains a number of subscalesthat correspond well with established EF component processes thathave been argued should be examined in relation to aggressivebehavior (Bates, 2000); (2) it assesses the subjective integrity ofEF that has been argued to potentially offer greater ecologicalvalidity than, or at least complement, traditional performance-based neuropsychological measures of EF (Gioia & Isquith, 2004);and (3) it is also very time-efficient to complete (10–15 min tocomplete) compared with a full neuropsychological battery.
Procedure
Participants were told that the investigation concerned the ef-fects of alcohol and personality on reaction time in a competitivesituation and that they were about to compete against a person ofthe same gender in an adjacent room on a reaction time task.Instructions for the task were given as participants began drinkingtheir beverages. Men and women were randomly assigned intoalcohol and placebo beverage groups. Regardless of beveragegroup assignment, all participants were informed that their oppo-nent was intoxicated. This was done to ensure that the “drinkingstatus” of the opponent would not confound any potential beveragegroup differences in aggression. Because of gender differences in
3EXECUTIVE FUNCTIONING, ALCOHOL, AND AGGRESSION
T2,AQ:1
tapraid5/ze6-adb/ze6-adb/ze600311/ze62417d11z xppws S�1 8/3/11 12:24 Art: 2011-0828
body fat composition and alcohol metabolism (Watson, Watson, &Batt, 1981), men and women were given different alcohol doses.Men received 1 g/kg of 95% alcohol USP mixed at a 1:5 ratio withTropicana orange juice, whereas women received 0.90 g/kg ofalcohol. The placebo beverages contained 4 ml of alcohol in thejuice and 4 ml layered on top of the juice. In addition, the rims ofthe glasses were sprayed with alcohol just before being served. Allparticipants were told that they would consume the equivalent of3–4 mixed drinks. Participants were given 20 min to consume theirbeverages. No participant experienced any adverse effects becauseof alcohol consumption.
Next, participants’ pain tolerances to electric shock were as-sessed with electrodes attached to two fingertips with Velcrostraps. The experimenter gradually increased the level of shockuntil participants reported it became “painful.” Shocks rangedfrom “Level 1” to “Level 10.” Level 10 was described as “pain-ful,” Level 9 was 95% of the “painful” level, Level 8 was 90% ofthe “painful” level, and so on. Levels 1, 5, and 10 were labeled as“Low,” “Medium,” and “High” shock, respectively.
To measure aggression, participants competed against a fictitiousopponent of the same gender on an ostensible reaction time task todetermine who could respond more quickly on a computer keyboardprompted by messages on the computer screen; with the winnerdelivering an electric shock to the loser (Taylor, 1967). Winners wereable to control the losers’ suffering by varying the intensity andduration of the selected shocks. The task consisted of 34 trials. Aftereach trial, shock intensities set by the participant and the “opponent”were displayed on the computer screen. Participants won half of thetrials (randomly determined). The aggression score was calculated bytransforming each corresponding shock intensity and duration valueinto z-scores and then summing them across the 17 winning trials.This was done to increase the reliability of both indices as a meta-analytic investigation demonstrated that shock intensity and durationare significantly related to one another and are considered to be partof a more general construct of aggression (Carlson, Marcus-Newhall,& Miller, 1989). Basically, within the ethical limits of the laboratory,participants controlled a weapon that could be used to give theirpartner electrical shocks. As such, this task has excellent validity, ona number of different levels, and has been used for decades as alaboratory measure of aggression for men and women (for review seeGiancola & Chermack, 1998). To ensure safety and to protect theintegrity of the study, the experimenter secretly viewed and heard theparticipants through a hidden video camera and microphone.
BrAC levels were measured using the Alco-Sensor IV breathanalyzer (Intoximeters Inc., St. Louis, MO), at baseline, immedi-ately before, and immediately after the aggression task. The ag-gression task began at a BrAC as close as possible to 0.09% on theascending limb of the BrAC curve as research has shown thataggression is more likely to be observed at this time, when personsare feeling more energized and impulsive rather than whenblood alcohol levels are falling which is when feelings of sedation,fatigue, and confusion tend to predominate (Giancola & Zeichner,1997; Martin, Earleywine, Musty, Perrine, & Swift, 1993). Wechose a rising BrAC of 0.09% because both field (e.g., Graham,Osgood, Wells, & Stockwell, 2006; Phillips et al., 2007) andlaboratory studies (reviewed in Duke, Giancola, Morris, Holt, &Gunn, 2011) clearly indicate a close relation between higherBrACs and increased aggression.
To enhance the effectiveness of the placebo manipulation, partic-ipants in the placebo group began the aggression task approximately2 min after beverage consumption (e.g., Martin & Sayette, 1993).Given that our alcohol dose produces BrACs around 0.11%, a double-blind procedure would not have been feasible. When attempts aremade at disguising a beverage’s alcoholic content (using the alcoholdose proposed in this study), participants typically know that theyhave consumed alcohol (reviewed in Martin & Sayette, 1993) thusuncovering the attempt to keep them blind. Further, given alcohol’sdistinct odor, the highly visible effects of alcohol intoxication, andparticipants’ frequent comments that they are “drunk,” the experi-menter would also be aware of the participant’s drinking status. Forthese reasons, double-blind procedures are typically not used in alco-hol and aggression research (Bushman & Cooper, 1990).
Immediately before and after the aggression task, participants ratedhow drunk they were (0 � not drunk at all to 11 � more drunk thanI have ever been) and after the aggression task they also rated howimpaired they were (0 � no impairment to 10 � strong impairment).Participants were also asked whether they believed they had con-sumed alcohol (No or Yes). Finally, they were debriefed. Individualswho received alcohol remained in the laboratory until their BrACdropped to 0.04%. Although discharging participants at a BrAC of0.04% might be considered somewhat high, we followed NIAAA(2005) guidelines that state that participants can be discharged from alaboratory if the risk of danger is determined to not be physicallyhazardous. In our case, discharge was clearly nonhazardous especiallybecause participants had to be transported home in a prepaid taxi orthey had to arrange for someone to drive them home (the experi-menter visually confirmed this event) and they had to pass a fieldsobriety test and report feeling “comfortable” and “in control.” Re-garding the field sobriety test, all participants were given this test uponentering the laboratory in the sober state. They were then given thesame test when they reach a descending BrAC of 0.04%. Participantsonly “passed” the test if their score was better or the same as whenthey entered the laboratory. Finally, before exiting the laboratory,participants also had to sign a form attesting to the fact that they wouldnot drive a motor vehicle nor operate any heavy machinery until thenext morning.
Results
Manipulation Checks
Aggression task checks. To verify the success of the aggres-sion task deception, participants were administered a posttask inter-view in which they were asked a number of questions about theirsubjective perceptions about their opponent, such as whether he or shetried hard to win, whether they thought the task was a good measureof reaction time, and how well they believed they performed on thetask. The deception manipulation appeared successful. Many partic-ipants called their opponent vulgar and profane names, or gave theiropponent the middle finger, during the task. Ultimately, participantswere asked if their believed that they were competing against a realperson. Less than 1% of participants provided responses indicatingthat they should be removed from the investigation. Previous researchhas shown that this task provides a valid and reliable laboratorymeasure of aggression (e.g., Giancola & Parrott, 2008). In approxi-mately 20 years of conducting such research, including this investi-gation, the lead author has found that it was extremely rare (�1%)
4 GIANCOLA, GODLASKI, AND ROTH
AQ: 2
tapraid5/ze6-adb/ze6-adb/ze600311/ze62417d11z xppws S�1 8/3/11 12:24 Art: 2011-0828
that participants admitted to being aware of the underlying purpose ofhis experiments. This statement is supported by empirical data from arecent meta-analytic analysis demonstrating that people are generallyincapable of correctly judging deception in research studies (Bond &DePaulo, 2008). Moreover, a seminal article by Berkowitz and Don-nerstein (1982) noted that “there is not as much awareness of theresearch hypothesis in many experiments as the critics have claimed”(p. 250).
Placebo checks. All participants in the placebo group indicatedthat they believed that they drank alcohol. With regard to the questionregarding how drunk they felt, persons in the alcohol group reportedmean pre- and posttask ratings of 4.7 and 5.1 (scale range: 0 to 11) andthose in the placebo group reported mean pre- and posttask ratings of1.8 and 1.9, respectively, [pretask ratings: t(508) � �20.5, p � .05;posttask ratings: t(510) � �19.9, p � .05]. With regard to thequestion about whether the alcohol they drank caused any impair-ment, persons in the alcohol group reported an average rating of 5.6and those in the placebo group reported an average rating of 2.1,t(510) � �19.56, p � .05, (scale range: 0 to 10) indicating thatpersons in the placebo group did in fact believe that they consumedalcohol. Given the alcohol dose used in this investigation, it is im-possible to expect that subjective feelings of intoxication can beequated between the alcohol and placebo groups, especially whendealing with experienced drinkers. As such, it has been pointed out byMartin and Sayette (1993), in an authoritative review on the topic ofplacebo manipulations, that the success of a placebo manipulation isreflected by the fact that persons believed that they consumed alcoholthat is considered, in and of itself, to be enough to activate anybehavioral effects that alcohol has been consumed (Vogel-Sprott &Fillmore, 1999). Thus, according to this well accepted guideline in thealcohol administration research literature, our placebo manipulation isconsidered valid and effective.
BrAC levels. All participants tested in this study had BrACsof 0% upon entering the laboratory. Individuals in the alcoholgroup had a mean BrAC of 0.095% (SD � 0.011) just beforebeginning the aggression task and a mean BrAC of 0.105% (SD �0.015) immediately after the task. Persons given the placebo had amean BrAC of 0.015% (SD � 0.011) just before the aggressiontask and a mean BrAC of 0.007% (SD � 0.007) immediately afterthe task. There were no gender differences in mean BrACs eitherbefore (men � .094%; women � .096%) or after (men � .103%;women � .106%) the task.
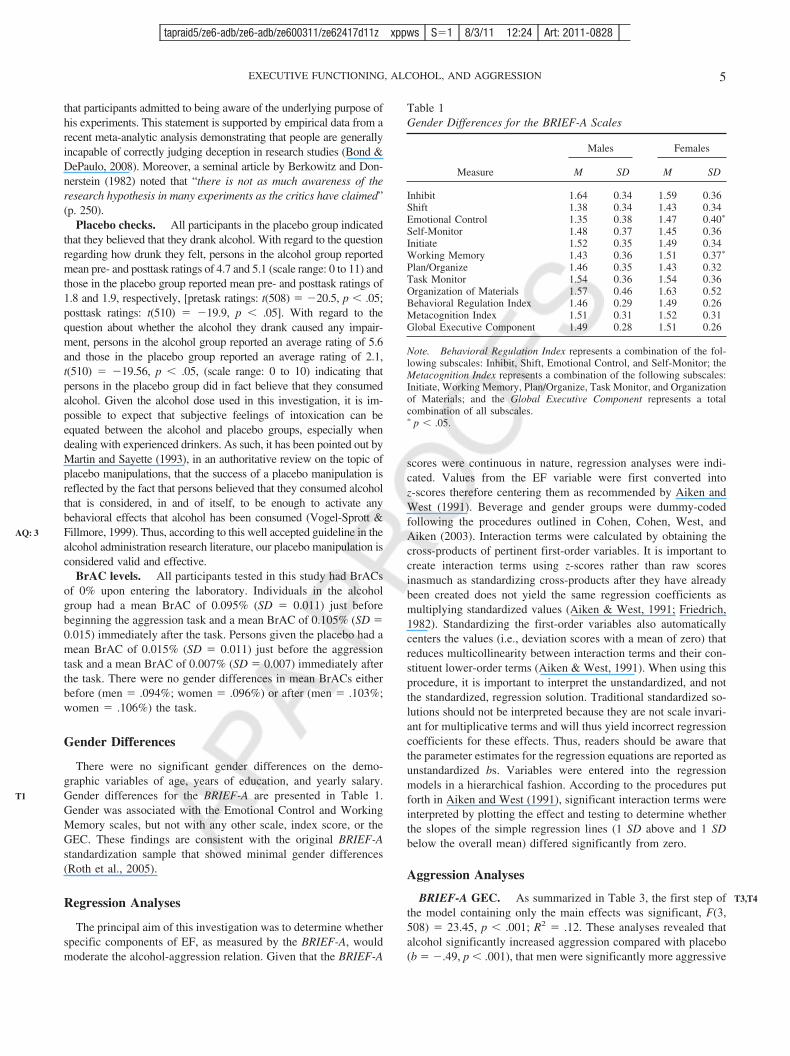
Gender Differences
There were no significant gender differences on the demo-graphic variables of age, years of education, and yearly salary.Gender differences for the BRIEF-A are presented in Table 1.Gender was associated with the Emotional Control and WorkingMemory scales, but not with any other scale, index score, or theGEC. These findings are consistent with the original BRIEF-Astandardization sample that showed minimal gender differences(Roth et al., 2005).
Regression Analyses
The principal aim of this investigation was to determine whetherspecific components of EF, as measured by the BRIEF-A, wouldmoderate the alcohol-aggression relation. Given that the BRIEF-A
scores were continuous in nature, regression analyses were indi-cated. Values from the EF variable were first converted intoz-scores therefore centering them as recommended by Aiken andWest (1991). Beverage and gender groups were dummy-codedfollowing the procedures outlined in Cohen, Cohen, West, andAiken (2003). Interaction terms were calculated by obtaining thecross-products of pertinent first-order variables. It is important tocreate interaction terms using z-scores rather than raw scoresinasmuch as standardizing cross-products after they have alreadybeen created does not yield the same regression coefficients asmultiplying standardized values (Aiken & West, 1991; Friedrich,1982). Standardizing the first-order variables also automaticallycenters the values (i.e., deviation scores with a mean of zero) thatreduces multicollinearity between interaction terms and their con-stituent lower-order terms (Aiken & West, 1991). When using thisprocedure, it is important to interpret the unstandardized, and notthe standardized, regression solution. Traditional standardized so-lutions should not be interpreted because they are not scale invari-ant for multiplicative terms and will thus yield incorrect regressioncoefficients for these effects. Thus, readers should be aware thatthe parameter estimates for the regression equations are reported asunstandardized bs. Variables were entered into the regressionmodels in a hierarchical fashion. According to the procedures putforth in Aiken and West (1991), significant interaction terms wereinterpreted by plotting the effect and testing to determine whetherthe slopes of the simple regression lines (1 SD above and 1 SDbelow the overall mean) differed significantly from zero.
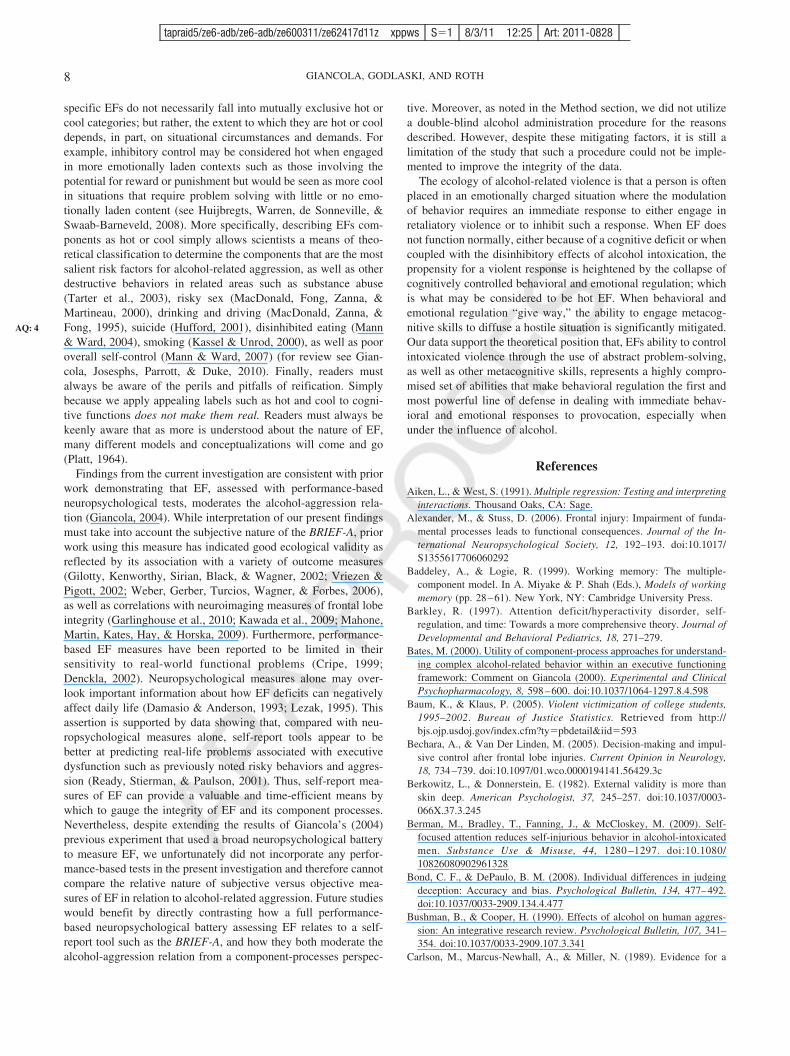
Aggression Analyses
BRIEF-A GEC. As summarized in Table 3, the first step ofthe model containing only the main effects was significant, F(3,508) � 23.45, p � .001; R2 � .12. These analyses revealed thatalcohol significantly increased aggression compared with placebo(b � �.49, p � .001), that men were significantly more aggressive
Table 1Gender Differences for the BRIEF-A Scales
Measure
Males Females
M SD M SD
Inhibit 1.64 0.34 1.59 0.36Shift 1.38 0.34 1.43 0.34Emotional Control 1.35 0.38 1.47 0.40�
Self-Monitor 1.48 0.37 1.45 0.36Initiate 1.52 0.35 1.49 0.34Working Memory 1.43 0.36 1.51 0.37�
Plan/Organize 1.46 0.35 1.43 0.32Task Monitor 1.54 0.36 1.54 0.36Organization of Materials 1.57 0.46 1.63 0.52Behavioral Regulation Index 1.46 0.29 1.49 0.26Metacognition Index 1.51 0.31 1.52 0.31Global Executive Component 1.49 0.28 1.51 0.26
Note. Behavioral Regulation Index represents a combination of the fol-lowing subscales: Inhibit, Shift, Emotional Control, and Self-Monitor; theMetacognition Index represents a combination of the following subscales:Initiate, Working Memory, Plan/Organize, Task Monitor, and Organizationof Materials; and the Global Executive Component represents a totalcombination of all subscales.� p � .05.
5EXECUTIVE FUNCTIONING, ALCOHOL, AND AGGRESSION
AQ: 3
T1
T3,T4
tapraid5/ze6-adb/ze6-adb/ze600311/ze62417d11z xppws S�1 8/3/11 12:24 Art: 2011-0828
than women (b � �.73, p � .001), and that the GEC variable wasrelated to aggression (b � .11, p � .05). The second step of modelwas also significant, F(6, 505) � 14.10, p � .001; R2 � .14. Here,the GEC � Beverage (b � �.29, p � .02) and Beverage � Gender(b � .47, p � .03) interactions were the only two significanttwo-way effects. The increment in R2 from Step 1 was .02, p �.01. When the GEC � Beverage interaction was probed, it re-vealed a positive relation between GEC and aggression in thealcohol group (simple slope b � .21; t � 2.24, p � .05), but notin the placebo group (simple slope b � .02; t � 0.34, p � .74).Decomposition of the Beverage � Gender interaction indicatedthat alcohol significantly increased aggression for both genders,but to a greater extent in men, t(244) � �3.90, p � .01 than inwomen, t(264) � �2.39, p � .01 (see Giancola et al., 2009). Thethree-way interaction in the three-step model was not significantand was thus not probed. Given that these data are derived from alarger dataset, a more complete description of these gender differ-ences is presented in Giancola et al. (2009).
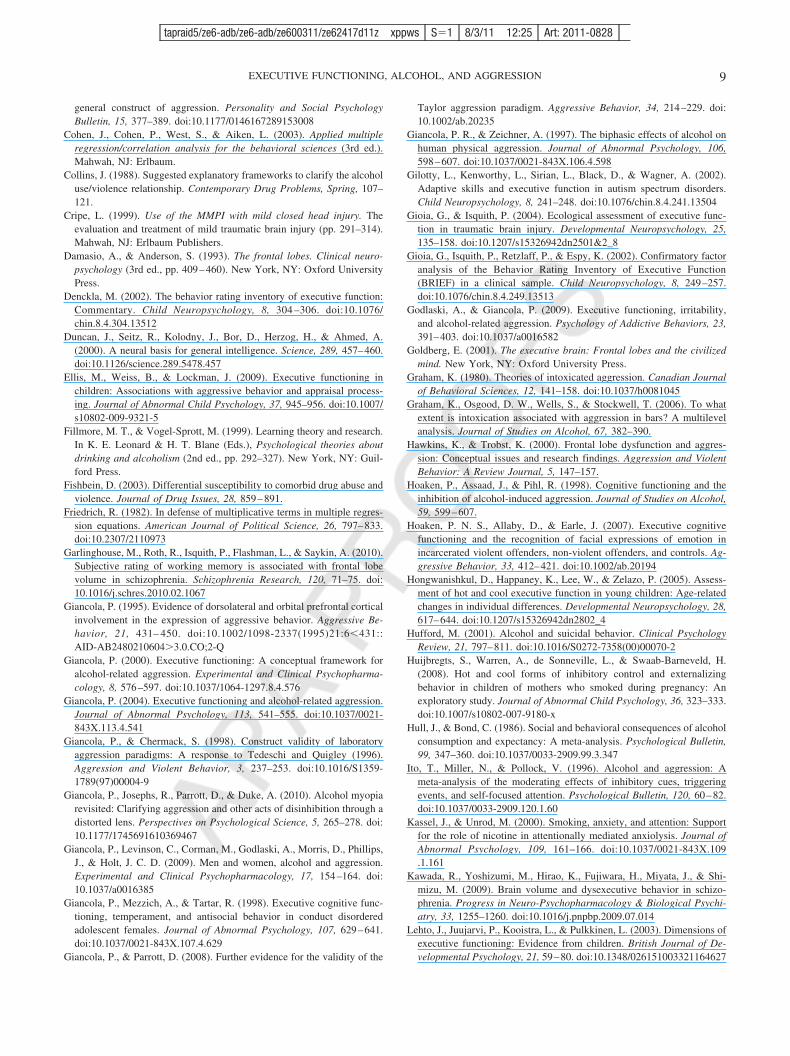
BRIEF-A BRI and MI. Following analyzing the totalBRIEF-A score (GEC) above, the theory upon which this article rests,by definition, requires that we test a theoretically based component-process model whereby the BRI and MI scores are examined in acomprehensive four-way model that includes gender and beverage.
The first step of the model containing only the main effects wassignificant, F(4, 507) � 19.97, p � .001; R2 � .136. These analysesrevealed that alcohol significantly increased aggression comparedwith placebo (b � �.50, p � .001), men were significantly moreaggressive than women (b � �.74, p � .001), greater BRI scoreswere significantly related to increased aggression, (b � .24, p � .002),and, as expected, the MI scores were not significantly related toaggression (in fact, the relation was even in the wrong direction) (b ��.11, p � .ns). The second step of the model was also significant,F(10, 501) � 9.60, p � .001; R2 � .16. The increment in R2 fromStep 1 was .024, p � .05). However, here, the BRI � Beverage wasthe only significant two-way effect (b � �.26, p � .05). Thisindicates that our hypotheses were confirmed such that when allcomponent-processes are considered together, the BRI is the mostimportant risk factor for intoxicated aggression across both men andwomen. When the BRI � Beverage interaction was probed, it re-vealed a clearly significant positive relation between BRI and aggres-sion in the alcohol group, (simple slope b � .31, p � .001) but not inthe placebo group (simple slope b � .05, p � .52) (see Figure 1). Thethree- and four-way interactions in the model were not significant andthus were not further probed (see Aiken & West, 1991; Friedrich,1982).1
Discussion
The primary goal of this investigation was to explore the prem-ise put forth by Bates (2000) that identifying component-processesof EF will advance our understanding of the role of EF in theexpression of alcohol-related aggression. To begin this process, wechose the BRIEF-A, a multifaceted self-report inventory to exploreEFs component-processes. By taking a “top-down” approach,
1 Given that we predicted that the BRI, and not the MI, would moderate thealcohol-aggression relation, we thought it valuable to attempt to isolate anycomponents of the BRI that are most predictive of the observed effect (i.e.,intoxicated aggression). Thus, we carried out a hierarchical multiple regressionmodel including the four BRI subscales and beverage as the main effectvariables in the first step and, more importantly, all subsequent two-wayeffects involving these variables in the second step. None of the two-wayinteractions were significant indicating that it is the BRI construct as whole thatis the optimal risk factor for intoxicated violence, rather than any of itconstituent parts.
Table 2Correlation Matrix of the BRIEF-A Scales
1 2 3 4 5 6 7 8 9 10 11 12
1. BRF Inhibit .34 .41 .56 .43 .62 .48 .53 .36 .58 .75 .722. BRF Shift .50 .41 .50 .50 .50 .47 .25 .53 .73 .673. BRF Emotional Control .44 .34 .43 .35 .33 .26 .42 .78 .634. BRF Self-Monitor .36 .43 .50 .48 .20 .46 .79 .655. BRF Initiate .61 .69 .66 .46 .82 .53 .776. BRF Working Memory .66 .66 .42 .80 .64 .817. BRF Plan/Organize .72 .57 .88 .59 .838. BRF Task Monitor .49 .85 .59 .819. BRF Organization of Materials .76 .35 .65
10. BRF MI Composite .67 .9411. BRF BRI Composite .8712. BRF GEC Composite
Note. All correlations are significant at p � .001 with a sample size of 512.
Table 3Regression Equations Relating Beverage, Gender, and BRIEF-AGEC Variables With Responses on the Physical Aggression Task
Step and measure R2 �R2 F for � in R2 Final bs
Step 1Beverage 0.12 0.12 23.45��� �0.49���
Gender �0.73���
GEC 0.11Step 2
Beverage 0.14 0.02 4.30�� �0.75���
Gender �1.00���
GEC 0.39���
Gender � Beverage 0.47�
Beverage � GEC �0.29�
Gender � GEC �0.20
Note. Step 3: No significant three-way effect. �R2 � change in R2.� p � .05. �� p � .01. ��� p � .001.
6 GIANCOLA, GODLASKI, AND ROTH
F1
Fn1
tapraid5/ze6-adb/ze6-adb/ze600311/ze62417d11z xppws S�1 8/3/11 12:24 Art: 2011-0828

we found a specific EF component (i.e., the BRI) to be a keymoderator of the alcohol-aggression relation. We found that anoverall measure of EF integrity, the GEC, was only mildly pre-dictive of intoxicated aggression. Although we found the GEC tobe a relatively weak predictor of intoxicated aggression, our resultssignificantly add to those of Giancola (2004) by clearly demon-strating that utilizing a component-process approach revealedmore detailed and theoretically important findings regarding therelations between specific EF elements and intoxicated aggression.
When simultaneously evaluating the MI and BRI of theBRIEF-A, the value of the component-process analysis in assessingEFs moderating qualities began to emerge. Specifically, the BRIwas a significantly better risk factor for intoxicated aggressionthan the GEC, while the MI turned out to be neither a risk factorat all for either alcohol-related, or overall, aggression. This clearlyindicates that the GECs status as a “mild” risk factor for intoxi-cated aggression was actually driven by the BRI. The BRI isrepresentative of an individual’s capacity to regulate their behav-ioral and emotional responses, while the MI involves componentsof working memory, strategic planning, and organization (Roth etal., 2005). Following our line of reasoning discussed earlier, webelieve that in a hostile situation, the role of the cognitive com-ponents assessed by the BRI is temporally antecedent to that of thecomponents assessed by the MI in the moderation of alcohol-related aggression. Specifically, the inhibition of basic emotionaland behavioral reactions occurs before more elaborate and time-consuming abstract problem-solving functions described by the MI(Barkley, 1997; Sonuga-Barke et al., 2002).
Our initial differentiation of EF component-processes wascouched within the theoretical framework of hot and cool EFsdescribed by Zelazo and Muller (2002) and Seguin et al. (2007).
The hot-cool distinction provides a heuristic for understandinghow specific EFs are related to behavioral outcomes depending, inpart, on environmental contingencies, and are proposed to have atleast a partially distinct neuroanatomical basis. However, it shouldbe noted that while we have argued that the BRI and MI scales ofthe BRIEF-A map onto the theoretical conceptions of hot and coolEF, respectively, they do so imperfectly as the BRIEF-A was notspecifically designed to assess the hot-cool distinction. On bal-ance, we chose to utilize the hot–cool distinction because itprovides a theoretically intuitive means of understanding the BRIand the MI and how they may differentially predict, and providethe next “stepping stone” in understanding and explaining, theunderlying etiology of the association between alcohol intoxica-tion and aggression. Finally, in the context of this article, the BRIfindings are also important in that they are consistent with the“disinhibition model” of alcohol-related aggression (Collins, 1988;Graham, 1980) that states that alcohol is a general dysregulator ofEF, and acts as a proxy for symptoms of organic EF deficits(Hoaken, Assaad, & Pihl, 1998; Lyvers & Maltzman, 1991).However, before concluding, as is delineated in the footnote, it isimportant to note that it was the BRI (i.e., hot EF) as a whole, andnot any of its constituent subcomponents, that best predicted thealcohol-aggression relation. These data suggest that a component-process approach to studying EF is absolutely worthwhile, how-ever, it is equally important to understand that EF is a complex andmultifaceted construct who’s whole is greater than its individualparts (Perecman, 1987; Zelazo et al., 1997); or in other words, itsconstituent parts are not wholly independent from one another, butinstead, they share an underlying commonality (Miyake, 2000).
Limitations and Issues for Further Consideration
The cultural idea that aggression is a hot behavior, because of itsrelation to being “red with anger” or “hot-headed” rather than“calm, cool, and collected,” and therefore more closely tied to hotEF processes (i.e., emotional control, inhibition), makes sensesemantically. However, the extent to which this metaphor is used,or accepted, should be tempered. As noted by Zelazo and col-leagues (Zelazo & Cunningham, 2007; Zelazo & Muller, 2002),
-0.3
0
0.3
0.6
Agg
ress
ion
(z-s
core
d)
BRI X Beverage
Alcohol
Placebo
-1 (Low BRI) +1 (High BRI)
Figure 1. ●●●.
Table 4Regression Equations Relating Beverage, Gender, and BRIEF-AMI and BRI Variables With Responses on the PhysicalAggression Task
Step and measure R2 �R2F for �
in R2 Final bs
Step 1Beverage 0.136 0.136 19.97��� �0.50���
Gender �0.74���
BRI .24��
MI �0.11Step 2
Beverage 0.161 0.024 2.43� �0.71���
Gender �0.98���
BRI 0.42��
MI 0.03Gender � Beverage 0.41Beverage � BRI �0.28�
Beverage � MI �0.02Gender � BRI �0.06Gender � MI �0.15BRI � MI �0.06
Step 3No significant three-way effects
Step 4No significant four-way effect
Note. �R2 � change in R2.� p � .05. �� p � .01. ��� p � .001.
7EXECUTIVE FUNCTIONING, ALCOHOL, AND AGGRESSION
AQ: 5
tapraid5/ze6-adb/ze6-adb/ze600311/ze62417d11z xppws S�1 8/3/11 12:25 Art: 2011-0828
specific EFs do not necessarily fall into mutually exclusive hot orcool categories; but rather, the extent to which they are hot or cooldepends, in part, on situational circumstances and demands. Forexample, inhibitory control may be considered hot when engagedin more emotionally laden contexts such as those involving thepotential for reward or punishment but would be seen as more coolin situations that require problem solving with little or no emo-tionally laden content (see Huijbregts, Warren, de Sonneville, &Swaab-Barneveld, 2008). More specifically, describing EFs com-ponents as hot or cool simply allows scientists a means of theo-retical classification to determine the components that are the mostsalient risk factors for alcohol-related aggression, as well as otherdestructive behaviors in related areas such as substance abuse(Tarter et al., 2003), risky sex (MacDonald, Fong, Zanna, &Martineau, 2000), drinking and driving (MacDonald, Zanna, &Fong, 1995), suicide (Hufford, 2001), disinhibited eating (Mann& Ward, 2004), smoking (Kassel & Unrod, 2000), as well as pooroverall self-control (Mann & Ward, 2007) (for review see Gian-cola, Josesphs, Parrott, & Duke, 2010). Finally, readers mustalways be aware of the perils and pitfalls of reification. Simplybecause we apply appealing labels such as hot and cool to cogni-tive functions does not make them real. Readers must always bekeenly aware that as more is understood about the nature of EF,many different models and conceptualizations will come and go(Platt, 1964).
Findings from the current investigation are consistent with priorwork demonstrating that EF, assessed with performance-basedneuropsychological tests, moderates the alcohol-aggression rela-tion (Giancola, 2004). While interpretation of our present findingsmust take into account the subjective nature of the BRIEF-A, priorwork using this measure has indicated good ecological validity asreflected by its association with a variety of outcome measures(Gilotty, Kenworthy, Sirian, Black, & Wagner, 2002; Vriezen &Pigott, 2002; Weber, Gerber, Turcios, Wagner, & Forbes, 2006),as well as correlations with neuroimaging measures of frontal lobeintegrity (Garlinghouse et al., 2010; Kawada et al., 2009; Mahone,Martin, Kates, Hay, & Horska, 2009). Furthermore, performance-based EF measures have been reported to be limited in theirsensitivity to real-world functional problems (Cripe, 1999;Denckla, 2002). Neuropsychological measures alone may over-look important information about how EF deficits can negativelyaffect daily life (Damasio & Anderson, 1993; Lezak, 1995). Thisassertion is supported by data showing that, compared with neu-ropsychological measures alone, self-report tools appear to bebetter at predicting real-life problems associated with executivedysfunction such as previously noted risky behaviors and aggres-sion (Ready, Stierman, & Paulson, 2001). Thus, self-report mea-sures of EF can provide a valuable and time-efficient means bywhich to gauge the integrity of EF and its component processes.Nevertheless, despite extending the results of Giancola’s (2004)previous experiment that used a broad neuropsychological batteryto measure EF, we unfortunately did not incorporate any perfor-mance-based tests in the present investigation and therefore cannotcompare the relative nature of subjective versus objective mea-sures of EF in relation to alcohol-related aggression. Future studieswould benefit by directly contrasting how a full performance-based neuropsychological battery assessing EF relates to a self-report tool such as the BRIEF-A, and how they both moderate thealcohol-aggression relation from a component-processes perspec-
tive. Moreover, as noted in the Method section, we did not utilizea double-blind alcohol administration procedure for the reasonsdescribed. However, despite these mitigating factors, it is still alimitation of the study that such a procedure could not be imple-mented to improve the integrity of the data.
The ecology of alcohol-related violence is that a person is oftenplaced in an emotionally charged situation where the modulationof behavior requires an immediate response to either engage inretaliatory violence or to inhibit such a response. When EF doesnot function normally, either because of a cognitive deficit or whencoupled with the disinhibitory effects of alcohol intoxication, thepropensity for a violent response is heightened by the collapse ofcognitively controlled behavioral and emotional regulation; whichis what may be considered to be hot EF. When behavioral andemotional regulation “give way,” the ability to engage metacog-nitive skills to diffuse a hostile situation is significantly mitigated.Our data support the theoretical position that, EFs ability to controlintoxicated violence through the use of abstract problem-solving,as well as other metacognitive skills, represents a highly compro-mised set of abilities that make behavioral regulation the first andmost powerful line of defense in dealing with immediate behav-ioral and emotional responses to provocation, especially whenunder the influence of alcohol.
References
Aiken, L., & West, S. (1991). Multiple regression: Testing and interpretinginteractions. Thousand Oaks, CA: Sage.
Alexander, M., & Stuss, D. (2006). Frontal injury: Impairment of funda-mental processes leads to functional consequences. Journal of the In-ternational Neuropsychological Society, 12, 192–193. doi:10.1017/S1355617706060292
Baddeley, A., & Logie, R. (1999). Working memory: The multiple-component model. In A. Miyake & P. Shah (Eds.), Models of workingmemory (pp. 28–61). New York, NY: Cambridge University Press.
Barkley, R. (1997). Attention deficit/hyperactivity disorder, self-regulation, and time: Towards a more comprehensive theory. Journal ofDevelopmental and Behavioral Pediatrics, 18, 271–279.
Bates, M. (2000). Utility of component-process approaches for understand-ing complex alcohol-related behavior within an executive functioningframework: Comment on Giancola (2000). Experimental and ClinicalPsychopharmacology, 8, 598–600. doi:10.1037/1064-1297.8.4.598
Baum, K., & Klaus, P. (2005). Violent victimization of college students,1995–2002. Bureau of Justice Statistics. Retrieved from http://bjs.ojp.usdoj.gov/index.cfm?ty�pbdetail&iid�593
Bechara, A., & Van Der Linden, M. (2005). Decision-making and impul-sive control after frontal lobe injuries. Current Opinion in Neurology,18, 734–739. doi:10.1097/01.wco.0000194141.56429.3c
Berkowitz, L., & Donnerstein, E. (1982). External validity is more thanskin deep. American Psychologist, 37, 245–257. doi:10.1037/0003-066X.37.3.245
Berman, M., Bradley, T., Fanning, J., & McCloskey, M. (2009). Self-focused attention reduces self-injurious behavior in alcohol-intoxicatedmen. Substance Use & Misuse, 44, 1280 –1297. doi:10.1080/10826080902961328
Bond, C. F., & DePaulo, B. M. (2008). Individual differences in judgingdeception: Accuracy and bias. Psychological Bulletin, 134, 477–492.doi:10.1037/0033-2909.134.4.477
Bushman, B., & Cooper, H. (1990). Effects of alcohol on human aggres-sion: An integrative research review. Psychological Bulletin, 107, 341–354. doi:10.1037/0033-2909.107.3.341
Carlson, M., Marcus-Newhall, A., & Miller, N. (1989). Evidence for a
8 GIANCOLA, GODLASKI, AND ROTH
AQ: 4
tapraid5/ze6-adb/ze6-adb/ze600311/ze62417d11z xppws S�1 8/3/11 12:25 Art: 2011-0828
general construct of aggression. Personality and Social PsychologyBulletin, 15, 377–389. doi:10.1177/0146167289153008
Cohen, J., Cohen, P., West, S., & Aiken, L. (2003). Applied multipleregression/correlation analysis for the behavioral sciences (3rd ed.).Mahwah, NJ: Erlbaum.
Collins, J. (1988). Suggested explanatory frameworks to clarify the alcoholuse/violence relationship. Contemporary Drug Problems, Spring, 107–121.
Cripe, L. (1999). Use of the MMPI with mild closed head injury. Theevaluation and treatment of mild traumatic brain injury (pp. 291–314).Mahwah, NJ: Erlbaum Publishers.
Damasio, A., & Anderson, S. (1993). The frontal lobes. Clinical neuro-psychology (3rd ed., pp. 409–460). New York, NY: Oxford UniversityPress.
Denckla, M. (2002). The behavior rating inventory of executive function:Commentary. Child Neuropsychology, 8, 304 –306. doi:10.1076/chin.8.4.304.13512
Duncan, J., Seitz, R., Kolodny, J., Bor, D., Herzog, H., & Ahmed, A.(2000). A neural basis for general intelligence. Science, 289, 457–460.doi:10.1126/science.289.5478.457
Ellis, M., Weiss, B., & Lockman, J. (2009). Executive functioning inchildren: Associations with aggressive behavior and appraisal process-ing. Journal of Abnormal Child Psychology, 37, 945–956. doi:10.1007/s10802-009-9321-5
Fillmore, M. T., & Vogel-Sprott, M. (1999). Learning theory and research.In K. E. Leonard & H. T. Blane (Eds.), Psychological theories aboutdrinking and alcoholism (2nd ed., pp. 292–327). New York, NY: Guil-ford Press.
Fishbein, D. (2003). Differential susceptibility to comorbid drug abuse andviolence. Journal of Drug Issues, 28, 859–891.
Friedrich, R. (1982). In defense of multiplicative terms in multiple regres-sion equations. American Journal of Political Science, 26, 797–833.doi:10.2307/2110973
Garlinghouse, M., Roth, R., Isquith, P., Flashman, L., & Saykin, A. (2010).Subjective rating of working memory is associated with frontal lobevolume in schizophrenia. Schizophrenia Research, 120, 71–75. doi:10.1016/j.schres.2010.02.1067
Giancola, P. (1995). Evidence of dorsolateral and orbital prefrontal corticalinvolvement in the expression of aggressive behavior. Aggressive Be-havior, 21, 431– 450. doi:10.1002/1098-2337(1995)21:6�431::AID-AB2480210604�3.0.CO;2-Q
Giancola, P. (2000). Executive functioning: A conceptual framework foralcohol-related aggression. Experimental and Clinical Psychopharma-cology, 8, 576–597. doi:10.1037/1064-1297.8.4.576
Giancola, P. (2004). Executive functioning and alcohol-related aggression.Journal of Abnormal Psychology, 113, 541–555. doi:10.1037/0021-843X.113.4.541
Giancola, P., & Chermack, S. (1998). Construct validity of laboratoryaggression paradigms: A response to Tedeschi and Quigley (1996).Aggression and Violent Behavior, 3, 237–253. doi:10.1016/S1359-1789(97)00004-9
Giancola, P., Josephs, R., Parrott, D., & Duke, A. (2010). Alcohol myopiarevisited: Clarifying aggression and other acts of disinhibition through adistorted lens. Perspectives on Psychological Science, 5, 265–278. doi:10.1177/1745691610369467
Giancola, P., Levinson, C., Corman, M., Godlaski, A., Morris, D., Phillips,J., & Holt, J. C. D. (2009). Men and women, alcohol and aggression.Experimental and Clinical Psychopharmacology, 17, 154–164. doi:10.1037/a0016385
Giancola, P., Mezzich, A., & Tartar, R. (1998). Executive cognitive func-tioning, temperament, and antisocial behavior in conduct disorderedadolescent females. Journal of Abnormal Psychology, 107, 629–641.doi:10.1037/0021-843X.107.4.629
Giancola, P., & Parrott, D. (2008). Further evidence for the validity of the
Taylor aggression paradigm. Aggressive Behavior, 34, 214–229. doi:10.1002/ab.20235
Giancola, P. R., & Zeichner, A. (1997). The biphasic effects of alcohol onhuman physical aggression. Journal of Abnormal Psychology, 106,598–607. doi:10.1037/0021-843X.106.4.598
Gilotty, L., Kenworthy, L., Sirian, L., Black, D., & Wagner, A. (2002).Adaptive skills and executive function in autism spectrum disorders.Child Neuropsychology, 8, 241–248. doi:10.1076/chin.8.4.241.13504
Gioia, G., & Isquith, P. (2004). Ecological assessment of executive func-tion in traumatic brain injury. Developmental Neuropsychology, 25,135–158. doi:10.1207/s15326942dn2501&2_8
Gioia, G., Isquith, P., Retzlaff, P., & Espy, K. (2002). Confirmatory factoranalysis of the Behavior Rating Inventory of Executive Function(BRIEF) in a clinical sample. Child Neuropsychology, 8, 249–257.doi:10.1076/chin.8.4.249.13513
Godlaski, A., & Giancola, P. (2009). Executive functioning, irritability,and alcohol-related aggression. Psychology of Addictive Behaviors, 23,391–403. doi:10.1037/a0016582
Goldberg, E. (2001). The executive brain: Frontal lobes and the civilizedmind. New York, NY: Oxford University Press.
Graham, K. (1980). Theories of intoxicated aggression. Canadian Journalof Behavioral Sciences, 12, 141–158. doi:10.1037/h0081045
Graham, K., Osgood, D. W., Wells, S., & Stockwell, T. (2006). To whatextent is intoxication associated with aggression in bars? A multilevelanalysis. Journal of Studies on Alcohol, 67, 382–390.
Hawkins, K., & Trobst, K. (2000). Frontal lobe dysfunction and aggres-sion: Conceptual issues and research findings. Aggression and ViolentBehavior: A Review Journal, 5, 147–157.
Hoaken, P., Assaad, J., & Pihl, R. (1998). Cognitive functioning and theinhibition of alcohol-induced aggression. Journal of Studies on Alcohol,59, 599–607.
Hoaken, P. N. S., Allaby, D., & Earle, J. (2007). Executive cognitivefunctioning and the recognition of facial expressions of emotion inincarcerated violent offenders, non-violent offenders, and controls. Ag-gressive Behavior, 33, 412–421. doi:10.1002/ab.20194
Hongwanishkul, D., Happaney, K., Lee, W., & Zelazo, P. (2005). Assess-ment of hot and cool executive function in young children: Age-relatedchanges in individual differences. Developmental Neuropsychology, 28,617–644. doi:10.1207/s15326942dn2802_4
Hufford, M. (2001). Alcohol and suicidal behavior. Clinical PsychologyReview, 21, 797–811. doi:10.1016/S0272-7358(00)00070-2
Huijbregts, S., Warren, A., de Sonneville, L., & Swaab-Barneveld, H.(2008). Hot and cool forms of inhibitory control and externalizingbehavior in children of mothers who smoked during pregnancy: Anexploratory study. Journal of Abnormal Child Psychology, 36, 323–333.doi:10.1007/s10802-007-9180-x
Hull, J., & Bond, C. (1986). Social and behavioral consequences of alcoholconsumption and expectancy: A meta-analysis. Psychological Bulletin,99, 347–360. doi:10.1037/0033-2909.99.3.347
Ito, T., Miller, N., & Pollock, V. (1996). Alcohol and aggression: Ameta-analysis of the moderating effects of inhibitory cues, triggeringevents, and self-focused attention. Psychological Bulletin, 120, 60–82.doi:10.1037/0033-2909.120.1.60
Kassel, J., & Unrod, M. (2000). Smoking, anxiety, and attention: Supportfor the role of nicotine in attentionally mediated anxiolysis. Journal ofAbnormal Psychology, 109, 161–166. doi:10.1037/0021-843X.109.1.161
Kawada, R., Yoshizumi, M., Hirao, K., Fujiwara, H., Miyata, J., & Shi-mizu, M. (2009). Brain volume and dysexecutive behavior in schizo-phrenia. Progress in Neuro-Psychopharmacology & Biological Psychi-atry, 33, 1255–1260. doi:10.1016/j.pnpbp.2009.07.014
Lehto, J., Juujarvi, P., Kooistra, L., & Pulkkinen, L. (2003). Dimensions ofexecutive functioning: Evidence from children. British Journal of De-velopmental Psychology, 21, 59–80. doi:10.1348/026151003321164627
9EXECUTIVE FUNCTIONING, ALCOHOL, AND AGGRESSION
tapraid5/ze6-adb/ze6-adb/ze600311/ze62417d11z xppws S�1 8/3/11 12:25 Art: 2011-0828
Lezak, M. (1995). Neuropsychological assessment (3rd ed.). New York,NY: Oxford University Press.
Lyvers, M., & Maltzman, I. (1991). Selective effects of alcohol on Wis-consin Card Sorting Test performance. British Journal of Addiction, 86,399–407. doi:10.1111/j.1360-0443.1991.tb03417.x
MacDonald, T., Fong, G., Zanna, M., & Martineau, A. (2000). Alcoholmyopia and condom use: Can alcohol intoxication be associated withmore prudent behavior? Journal of Personality and Social Psychology,78, 605–619. doi:10.1037/0022-3514.78.4.605
Mahone, E., Martin, R., Kates, W., Hay, T., & Horska, A. (2009). Neuro-imaging correlates of parent ratings of working memory in typicallydeveloping children. Journal of the International NeuropsychologicalSociety, 15, 31–41. doi:10.1017/S1355617708090164
Mann, T., & Ward, A. (2004). To eat or not to eat: Implications of theattentional myopia model for restrained eaters. Journal of AbnormalPsychology, 113, 90–98. doi:10.1037/0021-843X.113.1.90
Mann, T., & Ward, A. (2007). Attention, self-control, and health behaviors.Current Directions in Psychological Science, 16, 280–283. doi:10.1111/j.1467-8721.2007.00520.x
Martin, C., Earleywine, M., Musty, R., Perrine, M., & Swift, R. (1993).Development and validation of the biphasic alcohol effects scale. Alco-holism: Clinical and Experimental Research, 17, 140–146. doi:10.1111/j.1530-0277.1993.tb00739.x
Martin, C., & Sayette, M. (1993). Experimental design in alcohol admin-istration research: Limitations and alternatives in the manipulation ofdosage-set. Journal of Studies on Alcohol and Drugs, 54, 750–761.
Maston, C. (2010). Crime victimization in the United States: Statisticaltables. Bureau of Justice Statistics. Retrieved from http://bjs.ojp.usdoj.gov/index.cfm?ty�pbdetail&iid�2173
Mesulam, M. (2002). The human frontal lobes: Transcending the defaultmode through continent encoding. In D. Stuss & R. Knight (Eds.),Principles of frontal lobe function (pp. 8–30). New York, NY: OxfordUniversity Press. doi:10.1093/acprof:oso/9780195134971.003.0002
Metcalfe, J., & Mischel, W. (1999). A hot/cool-system analysis of delay ofgratification: Dynamics of will power. Psychological Review, 106, 3–19.doi:10.1037/0033-295X.106.1.3
Miyake, A., Friedman, N., Emerson, M., Witzki, A., & Howerter, A.(2000). The unity and diversity of executive functions and their contri-butions to complex “frontal lobe” tasks: A latent variable analysis.Cognitive Psychology, 41, 49–100. doi:10.1006/cogp.1999.0734
Moffitt, T. (1993). The neuropsychology of conduct disorder. Developmentand Psychopathology, 5, 133–151. doi:10.1017/S0954579400004302
Morgan, A., & Lilienfeld, S. (2000). A meta-analytic review of the relationbetween antisocial behavior and neuropsychological measures of exec-utive function. Clinical Psychology Review, 20, 113–136. doi:10.1016/S0272-7358(98)00096-8
NIAAA. (2005). National advisory council on alcohol abuse and alcohol-ism: Recommended council guidelines on ethyl alcohol administration inhuman experimentation (http://www.niaaa.nih.gov/Resources/ResearchResources/job22.htm).
Perecman, E. (1987). Consciousness and the meta-functions of the frontallobes: Setting the Stage. In E. Perecman (Ed.), The frontal lobes revis-ited (pp. 1–10). Mahwah, NJ: Erlbaum.
Phillips, S., Matusko, J., & Tomasovic, E. (2007). Reconsidering therelationship between alcohol and lethal violence. Journal of Interper-sonal Violence, 22, 66–84. doi:10.1177/0886260506294997
Platt, J. (1964). Strong inference. Science, 146, 347–353. doi:10.1126/science.146.3642.347
Raaijmakers, M., Smidts, D., Sergeant, J., Maassen, G., Posthumus, J., vanEngeland, H., & Matthys, W. (2008). Executive functions in preschoolchildren with aggressive behavior: Impairments in inhibitory control.Journal of Abnormal Child Psychology, 36, 1097–1107. doi:10.1007/s10802-008-9235-7
Raine, A., & Yang, Y. (2006). Neural foundations to moral reasoning and
antisocial behavior. Social Cognitive and Affective Neuroscience, 1,203–213. doi:10.1093/scan/nsl033
Ready, R., Stierman, L., & Paulsen, J. (2001). Ecological validity ofneuropsychological and personality measures of executive functions.The Clinical Neuropsychologist, 15, 314 –323. doi:10.1076/clin.15.3.314.10269
Roth, R. M., Isquith, P. K., & Gioia, G. A. (2005). Behavior RatingInventory of Executive Function-Adult Version (BRIEF-A). Lutz, FL:Psychological Assessment Resources.
Seguin, J., Arseneault, L., Boulerice, B., Harden, P., & Tremblay, R.(2002). Response perseveration in adolescent boys with stable andunstable histories of physical aggression. Journal of Child Psychologyand Psychiatry, 43, 482–494. doi:10.1111/1469-7610.00039
Seguin, J., Arseneault, L., & Tremblay, R. (2007). The contribution of“hot” and “cool” components of decision-making in adolescence: Im-plications for developmental psychopathology. Cognitive Development,22, 530–543. doi:10.1016/j.cogdev.2007.08.006
Selzer, M., Vinokur, A., & van Rooijen, L. (1975). A self-administeredShort Michigan Alcoholism Screening Test (SMAST). Journal of Stud-ies on Alcohol, 36, 117–126.
Shallice, T. (2002). Fractionation of the supervisory system. In D. Stuss &R. Knight (Eds.), Principles of frontal lobe function (pp. 261–277). NewYork, NY: Oxford University Press. doi:10.1093/acprof:oso/9780195134971.003.0017
Sonuga-Barke, E., Dalen, L., Daley, D., & Remington, B. (2002). Areplanning, working memory, and inhibition associated with individualdifferences in preschool ADHD symptoms? Developmental Neuropsy-chology, 21, 255–272. doi:10.1207/S15326942DN2103_3
Tarter, R., Kirisci, L., Mezzich, A., Cornelius, J., Pajer, K., Vanyukov, M.,. . . Clark, D. (2003). American Journal of Psychiatry, 160, 1078–1085.doi:10.1176/appi.ajp.160.6.1078
Taylor, S. (1967). Aggressive behavior and physiological arousal as afunction of provocation and the tendency to inhibit aggression. Journalof Personality, 35, 297–310. doi:10.1111/j.1467-6494.1967.tb01430.x
United States Department of Justice. (2005). Bureau of Justice Statistics:Crime characteristics. Retrieved from http://www.ojp.usdoj.gov/bjs/cvict_c.htm#alcohol
Volavka, J. (1995). Neurobiology of violence. Washington, DC: AmericanPsychiatry Press.
Vriezen, E., & Pigott, S. (2002). The relationship between parental reporton the BRIEF and performance-based measures of executive function inchildren with moderate to severe traumatic brain injury. Child Neuro-psychology, 8, 296–303. doi:10.1076/chin.8.4.296.13505
Watson, P., Watson, I., & Batt, R. (1981). Prediction of blood alcoholconcentration in human subjects: Updating the Widmark equation. Jour-nal of Studies on Alcohol, 42, 547–556.
Weber, D., Gerber, E., Turcios, V., Wagner, E., & Forbes, P. (2006).Executive functioning and performance on high-stakes testing in chil-dren from urban schools. Developmental Neuropsychology, 29, 459–477. doi:10.1207/s15326942dn2903_5
Zelazo, P., Carter, A., Reznick, S., & Frye, D. (1997). Early developmentof executive function: A problem-solving framework. Review of GeneralPsychology, 1, 198–226. doi:10.1037/1089-2680.1.2.198
Zelazo, P., & Cunningham, W. (2007). Executive function: Mechanismsunderlying emotion regulation. In J. Gross (Ed.), Handbook of emotionregulation (pp. 135–158). New York, NY: Guilford Press.
Zelazo, P., & Muller, U. (2002). Executive function in typical and atypicaldevelopment. In U. Goswami (Ed.), Handbook of childhood cognitivedevelopment (pp. 445–469). Oxford, UK: Blackwell.
Received January 14, 2011Revision received June 30, 2011
Accepted July 13, 2011 �
10 GIANCOLA, GODLASKI, AND ROTH
tapraid5/ze6-adb/ze6-adb/ze600311/ze62417d11z xppws S�1 8/3/11 12:25 Art: 2011-0828

JOBNAME: AUTHOR QUERIES PAGE: 1 SESS: 1 OUTPUT: Wed Aug 3 12:25:10 2011/tapraid5/ze6-adb/ze6-adb/ze600311/ze62417d11z
AQ1: Author: Journal style is to cite Tables in numerical order. Table 2 has been cited before Table1. Please renumber your tables. In addition, please cite Table 4 in the text.
AQ2: Author: Please add Duke et al. (2011) to the reference list. Thank you.
AQ3: Author: Please verify if this is meant to be Fillmore & Vogel-Sprott (1999) and if not, addVogel-Sprott & Fillmore (1999) to the reference list.
AQ4: Author: Please add MacDonald, Zanna, & Fong (1995) to the reference list.
AQ5: Author: Please provide a legend for Figure 1.
AUTHOR QUERIES
AUTHOR PLEASE ANSWER ALL QUERIES 1