Electrical source analysis of auditory ERPs in medial temporal lobe amnestic syndrome

Neural networks involving the medial temporal structures intemporal lobe epilepsy
Fabrice Bartolomeia,*, Fabrice Wendlingb, Jean-Jacques Bellangerb,Jean ReÂgisa, Patrick Chauvela
aUnite d'eÂpileptologie et Laboratoire de Neurophysiologie et Neuropsychologie, INSERM EMI 9926, Universite de la MeÂditerraneÂe, 13385
Marseille Cedex 5, FrancebLaboratoire Traitement du Signal et de L'Image, INSERM EPI 9934, Universite de Rennes 1, Campus de Beaulieu, 35042 Rennes Cedex, France
Accepted 27 April 2001
Abstract
Objectives: In a previous study using the averaged coherence technique to study interactions between medial/limbic and lateral/neocor-
tical regions, we observed that epileptogenic networks in temporal lobe epilepsy seizures (TLES) could be divided into 4 subtypes, i.e. medial
(M), medial±lateral (ML), lateral±medial (LM), and lateral (L). In the ML and LM subtypes, medial structures and the anterior temporal
neocortex are co-activated at the onset of seizures. However, using this approach, we were unable to determine the direction of coupling and
may have overlooked non-linear variations in interdependency. The purpose of the present study using non-linear regression for analysis of
stereoelectroencephalographic (SEEG) signal pairs was to measure the degree and direction of coupling between medial and neocortical
areas during TLES in patients with the M, ML, and LM subtypes.
Methods: Eighteen patients with drug-resistant TLEs who underwent SEEG recording were studied. We used a non-linear correlation
method as a measure of the degree and the direction of coupling on SEEG signal pairs. Patients with pure lateral TLEs were not studied. We
analyzed the functional coupling between 3 regions of the temporal lobe: the anterior temporal neocortex, the amygdala, and the anterior
hippocampus. A physiological model of EEG generation was used to validate the non-linear quanti®cation method and assess its applicability
to real SEEG signals.
Results: Results are ®rst based on a physiological model of EEG data in which both degree and direction of coupling are explicitly
represented, thus allowing construction of the neural systems inside which causality relationships are controlled and generation of multi-
channel EEG signals from these systems. These signals provide an objective way of studying the performance of non-linear regression
analysis on real signals.
In medial networks (10 patients), the ictal discharge is limited to the medial limbic structures and may propagate secondarily to the cortex.
Quanti®ed results demonstrated no signi®cant coupling between medial and lateral structures at the beginning of the seizures. Conversely,
almost constant unidirectional or bidirectional coupling was observed between hippocampus and amygdala.
In medial±lateral (5 patients) and lateral±medial (3 patients) networks, the initial ictal discharge includes both limbic and neocortical
regions. A rapid `tonic' discharge is observed over the temporal neocortex at the onset of seizure. Quantitative analysis showed an initial
increase in the non-linear correlation coef®cient between neocortex and medial structures. Quanti®cation of the coupling direction demon-
strated in¯uence of medial over lateral structures (medial±lateral) or of the lateral neocortex over medial structures (lateral±medial).
Conclusions: These results con®rm the existence of several generic and organized networks involving the medial structures during TLE
seizures. q 2001 Elsevier Science Ireland Ltd. All rights reserved.
Keywords: Temporal lobe epilepsy; Non-linear regression; Neural networks; Stereoelectroencephalography; Classi®cation
1. Introduction
Temporal lobe epilepsy (TLE) is a form of partial
epilepsy involving seizure originating in one or several
anatomic divisions of the temporal lobe and propagating
through interconnected neuronal networks within or beyond
its boundaries. TLE is classi®ed into two main subtypes
(Commission on Classi®cation and Terminology of the
International League Against Epilepsy, 1989; Williamson
et al., 1998). The ®rst and most common subtype is called
medial TLE (MTLE) because of primary involvement of
medial (limbic) temporal structures. The second subtype is
Clinical Neurophysiology 112 (2001) 1746±1760
1388-2457/01/$ - see front matter q 2001 Elsevier Science Ireland Ltd. All rights reserved.
PII: S1388-2457(01)00591-0
www.elsevier.com/locate/clinph
CLINPH 2000792
* Corresponding author. Service de Neurophysiologie Clinique et UniteÂ
d'Epileptologie, CHU Timone-264 Rue St Pierre, 13005 Marseille, France.
E-mail address: [email protected] (F. Bartolomei).

called lateral (or neocortical) TLE (LTLE) because of
primary involvement of the temporal neocortex (Ebner,
1994; Burgerman et al., 1995;Walczak, 1995). MTLE has
been extensively studied over the last decade resulting in
description of the so-called `MTLE syndrome' (French et
al., 1993; Wieser et al., 1993; Williamson et al., 1993). The
cardinal histopathological and neuroimaging marker of the
MTLE syndrome is hippocampal sclerosis that can be read-
ily detected by MRI.
Drug treatment is often inef®cient in TLE patients, but
surgical excision of the epileptogenic region and/or seizure
propagation pathways can stop or signi®cantly reduce the
frequency of seizures. However, the rate of surgical failure
in this population is far from negligible (Engel et al., 1993;
French et al., 1993; Williamson et al., 1993), suggesting that
current criteria of patient selection are not entirely satisfac-
tory. In this regard, several studies have demonstrated
hippocampal atrophy in patients with LTLE (Cascino et
al., 1993) and patients with temporal or extratemporal
lesions (Levesque et al., 1991). This observation suggests
that this MRI ®nding may not be a speci®c diagnostic tool
for MTLE.
Analysis of the epileptogenic zone in TLE remains the
important step for understanding seizure-triggering
mechanisms, identifying implicated brain structures, and
improving surgical planning. Several authors have high-
lighted the richness and variability of epileptogenic region
organization in TLE patients (Bancaud et al., 1965;
Bancaud, 1981; Wieser, 1983; Munari et al., 1994; Walc-
zak, 1995). Particular emphasis has been placed on the
complexity of interactions within limbic or paralimbic
structures such as the temporal pole (Munari et al., 1994;
Chabardes et al., 1999) or the insular cortex (Isnard et al.,
2000) and between limbic and neocortical structures (Barto-
lomei et al., 1999). Synchronization of neuronal networks
has been shown to be essential for generation of epileptic
events at a cellular level (Lopes da Silva and Pijn, 1995).
Synchronization of several spatially separate neural struc-
tures in the brain could actually form the substratum of the
epileptogenic zone at a macroscopic level (Badier and
Chauvel, 1995; Wendling et al., 1997, 2001).
This speculation has led to the hypothesis that the epilep-
togenic zone results from a network formed by neuronal
populations in different cerebral structures. However,
there is little direct evidence for the existence of these
neuronal networks in the literature. Proof would require
demonstration of abnormal functional links between several
neural structures at the onset of seizure. Occurrence of these
links could be con®rmed by analyzing interdependency of
electrical activities in these neural assemblies. A number of
techniques have been described for this purpose based on
either linear (e.g. the coherence function) or non-linear
calculation. Traditionally, non-linear calculation has
involved either mutual information (Mars and Lopes da
Silva, 1983) or non-linear regression (Pijn et al., 1991,
1992; Pijn and Lopes da Silva, 1993). A developing new
approach to non-linear calculation has been based on the
study of non-linear dynamical systems and chaos (Le Van
Quyen et al., 1998).
In a previous study using the linear averaged coherence
technique to study interactions between medial/limbic and
lateral regions, we demonstrated that epileptogenic
networks in TLE patients should be divided into 4 subtypes,
i.e. medial (M), medial±lateral (ML), lateral±medial (LM),
and lateral (L) (Bartolomei et al., 1999). In the ML and LM
subtypes, medial structures and the anterior temporal
neocortex are co-activated at the onset of seizures.
However, using this approach, we were unable to determine
the direction of coupling and may have overlooked non-
linear variations in interdependency. Recent studies have
suggested the existence of such non-linear events during
TLE seizures (Casdagli et al., 1997; Van der Heyden et
al., 1999).
The purpose of the present study using non-linear regres-
sion for analysis of stereoelectroencephalography (SEEG)
signal pairs was to measure the degree and direction of
coupling between medial and neocortical areas during
temporal lobe epilepsy seizures (TLES) involving the
medial limbic structures in patients with the M, ML, and
LM subtypes. A physiological model of EEG generation
was used to validate the non-linear quanti®cation method
and assess its applicability to real SEEG signals.
2. Methods
2.1. Patients and SEEG study
Eighteen patients were selected from a group undergoing
evaluation for surgical treatment of intractable TLE
between 1994 and 1999. All of them had a comprehensive
evaluation, including a detailed history and neurological
examination, neuropsychological testing, routine MRI
study, interictal/ictal SPECT, and video-EEG recording of
seizures. At the end of this ®rst non-invasive phase, patients
were separated into two groups: (1) when all the localization
criteria converged to a pure MTLE, patients were operated
on (anterior temporal lobectomy or amygdalo-hippocam-
pectomy); and (2) when discrepancies between the exis-
tence of hippocampal atrophy or other lesion and
electroclinical or/and SPECT data occurred, SEEG was
indicated for de®ning the contribution of remote temporal
or extratemporal areas to the epileptogenic zone. In the
latter group, it could happen that SEEG validated the exis-
tence of pure MTLE. SEEG recordings were performed as
described elsewhere (Chauvel et al., 1996). Multiple leads
(10±15) depth electrodes were placed intracranially accord-
ing to Talairach's stereotactic method (Talairach et al.,
1974) based on available information (determined from
non-invasive data) on the epileptogenic zone (de®ned as
the cerebral regions simultaneously discharging at seizure
onset). The strategy of electrode placement was individua-
F. Bartolomei et al. / Clinical Neurophysiology 112 (2001) 1746±1760 1747

lized depending on clinical, neurophysiological, and anato-
mical characteristics of each patient. However, all the
patients had electrodes that spatially sampled some
medial/limbic regions (amygdala and hippocampus) and
lateral/neocortical regions of the middle temporal gyrus
(T2). In some cases (see Table 1), electrodes were also
placed in other structures such as the temporal pole, the
ento/perirhinal cortex, the parahippocampal gyrus, the
superior temporal gyrus (T1), and the insula, as well as
various frontal and parieto-occipital regions to determine
the role of these different areas in the epileptogenic zone
and in the propagation of the discharges. Electrodes explor-
ing the temporal pole and the entorhinal region were more
recently introduced in our explorations. This explains why
in this series only 3 patients had these electrodes (patients 7,
8 and 15). Patients with bilateral TLE or multifocal epilepsy
(e.g. with independent temporal and frontal epileptogenic
zones) were excluded. In addition, patients with LTLE as
de®ned in our previous study (Bartolomei et al., 1999) were
not selected for this study.
2.2. Non-linear regression analysis
Non-linear regression analysis is aimed at quantifying,
using a parameter that takes its values within [0,1], how a
signal X from a given channel can be predicted from a signal
Y from another channel. The estimation of this parameter,
referred to as the non-linear correlation coef®cient h2*xy , is
performed on a temporal window of ®xed duration and slid-
ing on both signals in order to follow the temporal evolution
of the statistical relationship (linear or non-linear) between
both signals. Besides the estimation of h2*xy , a second quan-
tity is evaluated to obtain information on the causal property
of the relationship. This quantity, referred to as the direction
index Dxy, takes into account both an estimated time delay
between signals X and Y and the asymmetrical nature of the
non-linear correlation coef®cient. In order to study the
statistical properties of estimated quantities h2*xy and Dxy
and in order to interpret their behavior on real SEEG signals,
a physiological model of EEG generation is introduced
(Section 2.2.1). A summarized description of the non-linear
correlation coef®cient h2*xy and the direction index Dxy is then
given in Section 2.2.2.
2.2.1. Simulation of EEG signals from multiple coupled
neural populations
In the present work, an EEG model is used to physiolo-
gically interpret measures performed on SEEG signals. A
summarized description of this model is given in the follow-
ing. Readers may refer to our previous studies (Wendling et
al., 2000) for a detailed description.
As depicted in Fig. 1, the model follows a lumped-para-
meter approach in which neural populations are modeled as
non-linear dynamical systems based on neurophysiological
concepts (excitation, inhibition, synaptic ef®cacy, connec-
tivity constants). This approach has already led to realistic
macroscopic models of EEG generation, such as those
reported by Lopes da Silva et al. (1974, 1976) for alpha
rhythm representation.
In the context of SEEG exploration, the number of
recorded brain structures is always greater than one. Thus,
starting from the aforementioned works, we recently
extended the capabilities of this class of model such that it
can now generate vectorial EEG signals from multiple
F. Bartolomei et al. / Clinical Neurophysiology 112 (2001) 1746±17601748
Table 1
Patients' characteristics and chronology of brain structure involvement during seizuresa
No. Side of TLE MRI or histopathology A Hros Hcau TP EC T2 T1 F TPO P
1 R HS 1 (S,LVD) 1 (S,LVD) 2 (S) 3 (SW) 4 (SW) ± ± ±
2 L N 2 (S) 1 (LVD) 3 (S) 3 (SW) 4 (SW) ± ±
3 L HS 1 (S) 1 (LVD) 2 (S) 3 (SW) 4 (SW) ± ± 4 (SW)
4 L HS 2 (S) 1 (S) 2 (S) 3 (SW) 4 (SW)
5 R HS 1 (S) ± 3 (S) 3 (SW) ± 3 (S)
6 L Hippocampal lesion 1 (S) 1 (S) 2 (LVD) 2 (LVD) 2 (LVD) ± ± ±
7 L HS 1 (S) 1 (S) 1 (S) 1 (S) 1 (LVD) 2 (SW) ± ± ± ±
8 R N 1 (S) 1 (S) 2 (S) 1 (LVD) 2 (SW) 3 (SW) 3 (SW) 4 (SW)
9 R HS 1 (S) 1 (S) 2 (S) 2 (SW) 3 (SW) 4 (SW)
10 R HS 1 (S) 1 (S,LVD) 2 (S) 3 (SW) 4 (SW) 4 (SW) 4 (SW)
11 R HS 2 (LVD) 1 (LVD) 2 (LVD) 2 (LVD) 1 (LVD) 3 (SW) ± 3 (SW)
12 L HS 1 (S) 1 (S) 3 (S) 2 (LVD) 4 (S) ± ± 4 (SW)
13 L HS 2 (LVD) 2 (LVD) 1 (LVD) 2 (LVD) 3 (S) 3 (S) ± ±
14 L HS 1 (LVD) 4 (SW) 2 (LVD) 1 (LVD) 5 (SW) 4 (SW) ± ±
15 L Ganglioglioma PHG 1 (LVD) ± 1 (LVD) 1 (LVD) 1 (LVD) 1 (LVD) 2 (S) ± 3 (SW) ±
16 L N 1 (LVD) 1 (LVD) 1 (LVD) 2 (SW) 4 (SW) ± ± ±
17 L Cortical dysplasia MTG 1 (LVD) 1 (LVD) 1 (LVD) 2 (SW) 3 (SW) ±
18 L Cortical dysplasia MTG 1 (S) 1 (S) 2 (S) 1 (S) 4 (SW) ± 3 (S) 3 (S)
a F, female; M, male; (), aspect of the discharge; S, spikes; LVD, low-voltage fast discharge; slow W, slow waves; SW, spike-waves; le, lesion identi®ed by
MRI; A, amygdala; Ha, anterior part of the hippocampus; Hp, posterior part of the hippocampus; T2, middle temporal gyrus; T1, superior temporal gyrus; F,
prefrontal region; PHG, parahippocampal gyrus; EC, entorhinal cortex; HS, hippocampal sclerosis; N, normal.

distant coupled neural populations. Taking into account
current hypotheses about epileptic mechanisms, we also
altered model parameters to make the model produce
signals that qualitatively resemble real SEEG signals
recorded on more than one channel during interictal or
ictal periods. Consequently, the model offers a framework
in which it is possible (i) to build networks with a priori
known couplings between populations and (ii) to generate
realistic epileptiform signals from these networks with
appropriate alteration of model parameters (local balance
of excitation and inhibition, degree and direction of
couplings between populations). In this study, the model
is used to relate coupling parameters (degree/direction)
between neural populations to relations between EEG
signals they produce, these relations being evaluated using
non-linear regression.
2.2.2. Non-linear regression analysis and characterization
of couplings (degree/direction)
Given two SEEG signals X�t� and Y�t� recorded from two
neural groups Gx and Gy, respectively, two questions are to
be addressed.
1. How are we to quantify the synchronization (in a general
F. Bartolomei et al. / Clinical Neurophysiology 112 (2001) 1746±1760 1749
Fig. 1. In the model, a set of interconnected neural populations is considered. (a) Each population contains two subsets of neurons that mutually interact via
excitatory or inhibitory feedback: the main cells (i.e. pyramidal cells) and the local interneurons (i.e. other non-pyramidal cells, stellate or basket cells). The
in¯uence from neighboring neurons is modeled by an excitatory input that globally represents the average density of afferent action potentials. Each subset is
characterized by: (i) two dynamic linear transfer functions, he and hi that change the average pre-synaptic pulse density of action potentials into post-synaptic
membrane potential (either excitatory, EPSP, or inhibitory, IPSP); and (ii) a static non-linear function (sigmoid) that relates the average post-synaptic potential
of a given subset to an average pulse density of potentials ®red by the neurons. Moreover, interactions between main cells and interneurons are summarized in
the model by 4 connectivity constants C1±C4, which account for the average number of synaptic contacts. (b) Finally, since pyramidal cells are excitatory
neurons that project their axons to other areas of the brain, the model accounts for this organization by using the average pulse density of action potentials from
the main cells of one population as an excitatory input to another population of neurons. A connection from a given population i to a population j is
characterized by parameters Kij and hd, which represent the degree of coupling and the average time delay associated with this connection, respectively.
Kij is dimensionless. When Kij � 0, populations i and j are uncoupled and produced activities are independent. When Kij . 0, an excitatory connection from
population i to population j is simulated. Activity produced by population j is partially driven by that produced by population i. Details about the model and its
extension to multiple coupled neural populations may be found in Wendling et al. (2000).

sense) between the activity from Gx and that from Gy?
2. How are we to evaluate, from computation, which of the
following situations is the most plausible:
± Gx leads Gy,
± Gy leads Gx,
± Gx and Gy in¯uence each other,
± activities in Gx and Gy are independent?
To answer questions 1 and 2, the simplest and most classical
method consists in evaluating a quantity based on the linear
correlation coef®cient between random samples X�t� and
Y�t� present in the analysis window sliding on both signals.
This quantity is generally normalized such that it is equal to
0 when there exists no linear dependence between X�t� and
Y�t� and it is equal to 1 when Y�t� is an af®ne function of
X�t�.When close to 1.0, this quantity provides an answer to
question 1 because one can consider, in that case, that activ-
ities in Gx and Gy are strongly coupled or dependent. The
interpretation of a low value is more intricate. Indeed, it
only indicates a weak statistical linear relationship between
X�t� and Y�t�. However, it does not allow the non-linear
relationship hypothesis to be rejected and thus for us to
conclude that activities in Gx and Gy are independent.
Non-linear regression is a way to address the above dif®-
culty. In this method, a non-linear function is used in the
regression of Y�t� over X�t�. It allows two quantities, namely
the non-linear correlation coef®cient and the time delay,
denoted in the following by h2*xy and txy, respectively, to
be calculated from signals X�t� and Y�t�. These quantities
were ®rst introduced in the ®eld of EEG for the study of
associations between signals by Pijn and Lopes da Silva
(1993). A summarized description of these two quantities
is given in the following. Readers may refer to Pijn and
Lopes da Silva (1993) for a detailed description.
The non-linear correlation coef®cient h2*xy is obtained by
considering the amplitude y of signal Y�t 1 t� as a perturbed
function of the amplitude x of signal X�t� (i.e. the condi-
tional mean of Y�t 1 t� given X�t� � x). The variance of the
perturbation formally corresponds to the conditional
variance of Y�t 1 t� given X�t� (i.e. the reduction of
variance of Y�t 1 t� obtained by predicting y values from
x values). This conditional variance can be estimated from
the construction of a piecewise linear regression curve
Y�t 1 t� � h�X�t��. Here, it is also normalized by the
variance of Y�t 1 t� and the normalized value is subtracted
from 1 to obtain the following quantity:
h2xy�t� � 1 2
VAR�Y�t 1 t�=X�t��VAR�Y�t 1 t��
where
VAR�Y�t 1 t�=X�t�� � arg minh
�E�Y�t 1 t�2 h�X�t���2�
The above procedure can be reiterated for different values of
t between X and Y to obtain the time shift txy for which
h2xy�t� is maximum:
h2*xy � max�h2
xy�t�� � h2xy�txy�
tmin , t , tmax
h2*xy is called the `non-linear correlation coef®cient'. Its
values are contained between 0 (Y is independent of X)
and 1 (X and Y are linearly or non-linearly dependent) and
provide an answer to question 1. Question 2 can also be
answered using non-linear regression. Unlike a linear corre-
lation coef®cient, h2*xy is not symmetric and generally h2*
xy is
different from h2*YX . As described by Arnhold et al. (1999)
and although the relationship is less evident, this asymmetry
can provide insight into causality relations: for given X and
Y signals of the same order of complexity and for a given
prediction error obtained from a non-linear asymmetric
interdependence estimator, if Y is partially driven by X,
then the difference Dh2 � h2*xy 2 h2*
YX is positive. In this
same case, the difference between time delays when
measured from X to Y�txy� and from Y to X�txy�,Dt � txy 2 tYX , is also positive.
Since both quantities (asymmetry and time delay) contain
causality information, we proposed to conjointly use them
in a new quantity (referred to as the `direction index' Dxy)
aimed at characterizing the direction of coupling between
neural populations that produce signals:
Dxy � 12�sgn�Dh2�1 sgn�Dt��
where sgn denotes the sign function.
In theory, if there exists a relation between signals X and
Y and if Dxy � 11 (21), then Y (X) is in¯uenced by X (Y). In
practice, signals X�t� and Y�t� are non-stationary and a slid-
ing window is used to locally analyze the relationship
between signal X�t� and signal Y�t�. Over this window,
Dh2and Dt are computed at each sliding step and Dxy is
estimated from the averaged sum of their respective signs
Dxy, over a small number of steps. Consequently, Dxy values
are contained between 21 and 11.
As described in Section 3.1 on signals simulated with the
model, a Dxy value close to 11 (21) conjointly with a
signi®cantly high value of h2*xy indicates a unidirectional
coupling from population Gx to population Gy (from popu-
lation Gy to population Gx), whereas a value close to 0
indicates a bidirectional coupling between the two popula-
tions. Finally, it must also be mentioned that we showed that
Dxy provides a better estimate of the direction of coupling
than the time delay or the asymmetry property taken sepa-
rately (Wendling et al., 2001).
As far as the recording technique is concerned, our
system allows SEEG signals to be recorded on 128 channels
at a sampling frequency of 200 Hz with respect to a
common reference signal. In our signal processing analysis,
we do not use monopolar but bipolar signals that are built by
subtracting signals recorded on two adjacent sites located in
F. Bartolomei et al. / Clinical Neurophysiology 112 (2001) 1746±17601750

a given cerebral structure. This operation allows the refer-
ence signal common to all recorded signals to be removed.
3. Results
3.1. Results obtained on simulated signals
3.1.1. Unidirectionally coupled populations
The model con®guration used to simulate signals from
two populations unidirectionally coupled is presented in
Fig. 2a. The E=I ratio (that was shown to control the degree
of excitability in the model) in population 1 is increased
such that the activity from this population becomes epilepti-
form (rhythmic discharge of spikes). Population 2 is main-
tained at standard values; the corresponding EEG re¯ects a
normal background activity. Starting from zero, the
coupling value from population 1 to population 2, denoted
by K12, is progressively increased in steps of 25 units. For
small values of K12, sporadic spikes start to appear in the
signal generated by population 2. As K12 increases, these
spikes become more and more frequent and tend to synchro-
nize with those originating from population 1. Finally, for
the highest values of K12, both populations generate rhyth-
mic synchronized spikes. For each value of K12, the non-
linear correlation coef®cients h2xy and h2
yx and the direction
index Dxy are computed on long-duration simulated signals
(300 s) using a 5 s duration window (i.e. 1000 samples at a
sampling rate of 200 Hz) sliding over signals by steps of
0.5 s (i.e. 100 samples).
Experimental averaged values and standard deviations
(SDs) of these quantities are represented in Fig. 2b,c. Both
averaged h2xy and h2
yx increase with K12 from a null value to a
value of 0.85. One can notice that h2xy (solid line) is slightly
greater than h2yx (dashed line). Fig. 2c gives the evolution of
the average direction index Dxy. Some important points
about this quantity can be emphasized. First, it signi®cantly
deviates from 0 (2SD at least) even for relatively small
values of coupling between population 1 and population 2.
Second, from K12 � 175, h2xy is greater than 0.5 and Dxy is
greater than 0.8, clearly indicating a unidirectional coupling
of relatively high degree from population 1 to population 2.
F. Bartolomei et al. / Clinical Neurophysiology 112 (2001) 1746±1760 1751
Fig. 2. Simulation of EEG signals from two neural populations (a) unidirectionally coupled and (b) bidirectionally coupled. Computation of non-linear
regression coef®cient h2xy (solid line) and h2
yx (dashed line) and direction index Dxy for increasing degree of coupling in both con®gurations. See text for detailed
interpretation (Section 3.1).

F. Bartolomei et al. / Clinical Neurophysiology 112 (2001) 1746±17601752
Fig. 3. Non-linear regression analysis in a patient (patient 1) with a medial
seizure (MTLEs). (a) Representation of the onset of seizures and the corre-
sponding epoch on SEEG traces. (b) Three epochs of 10 s are analyzed at
the onset of seizures. A, amygdala; H, anterior hippocampus; NC, neocor-
tex of the middle temporal gyrus. h2 refers to the non-linear correlation
coef®cients h2*xy and h2*
YX , represented by two traces. Dxy, direction index. See
text for detailed interpretation.
Fig. 4. Non-linear regression analysis in a patient (patient 11) with a
medial±lateral seizure (MLTLEs). (a) Representation of the onset of
seizures and the corresponding epoch on SEEG traces. (b) Three epochs
of 10 s are analyzed at the onset of seizures. A, amygdala; H, anterior
hippocampus; NC, neocortex of the middle temporal gyrus. h2 refers to
the non-linear correlation coef®cients h2*xy and h2*
YX , represented by two
traces. Dxy, direction index. See text for detailed interpretation.

In other words, these two values characterize the fact that
the activity generated by population 2 is causally deter-
mined (or `driven') by that generated by population 1.
3.1.2. Bidirectionally coupled populations
The model con®guration used to simulate signals from
bidirectionally coupled populations is represented in Fig.
2d. Now, E=I ratios are slightly increased (relative to the
standard value) to make both populations more excitable;
epileptiform events (spikes) sporadically appear in the
activity produced by both populations. Moreover, for the
two populations to in¯uence each other identically, coupling
parameters are set to equal values �K12 � K21 � K�.Starting from null couplings �K � 0� between the two
populations for which spikes are not correlated, we progres-
sively increased the value of K, as in the previous case.
Visual inspection of simulated signals shows that both activ-
ities synchronize faster when couplings are bidirectional.
For the highest values of K, both populations generate
sustained discharges of spikes whose average frequency is
also higher than in the unidirectional case. Fig. 2e gives
averaged values of h2xy (solid line) and h2
yx (dashed line) as
K increases. Now, values range from 0.0 to 0.96, which is
higher than for unidirectional coupling. Fig. 2f gives the
curve representing the evolution of the averaged direction
index Dxy as a function of K. The combined features of
asymmetry and time delays are re¯ected in this curve: it
does not diverge from 0 and the SD is higher than for
unidirectional coupling. The behavior of quantities
described above can be explained by the model con®gura-
tion used to generate signals: since both populations
mutually and symmetrically in¯uence each other, neither
of the two activities is determined by the other. The method
clearly re¯ects this situation through the behavior of h2xy and
Dxy measured on signals and characterizing the degree and
direction of coupling, respectively.
3.2. Interactions between the middle temporal gyrus, the
amygdala, and the anterior hippocampus in patients with
TLE
Main patient characteristics and results of SEEG record-
ings are summarized in Table 1. Visual analysis of ictal
patterns demonstrated that interindividual variability was
high but intraindividual reproducibility was good. The inter-
actions between medial (hippocampus and amygdala) and
lateral neocortical (middle temporal gyrus) structures during
ictal periods at the onset of seizure were quanti®ed by non-
linear regression analysis as described earlier using bipolar
SEEG signals (determination of non-linear correlation coef-
®cients h2xy and h2
yx followed by analysis of direction index
Dxy for values with signi®cantly high correlation coef®-
cients).
Tables 2±4 summarize correlation coef®cients and direc-
tion indexes obtained during onset of seizure. Maximal
values statistically different from the interictal period (.2
F. Bartolomei et al. / Clinical Neurophysiology 112 (2001) 1746±1760 1753
Fig. 5. Non-linear regression analysis in a patient (patient 17) with a lateral±
medial seizure (LMTLEs). (a) Representation of the onset of seizures and
the corresponding epoch on SEEG traces. (b) Three epochs of 10 s are
analyzed at the onset of seizures. A, amygdala; H, anterior hippocampus;
NC, neocortex of the middle temporal gyrus. h2 refers to the non-linear
correlation coef®cients h2*xy and h2*
YX , represented by two traces. Dxy, direc-
tion index. See text for detailed interpretation.
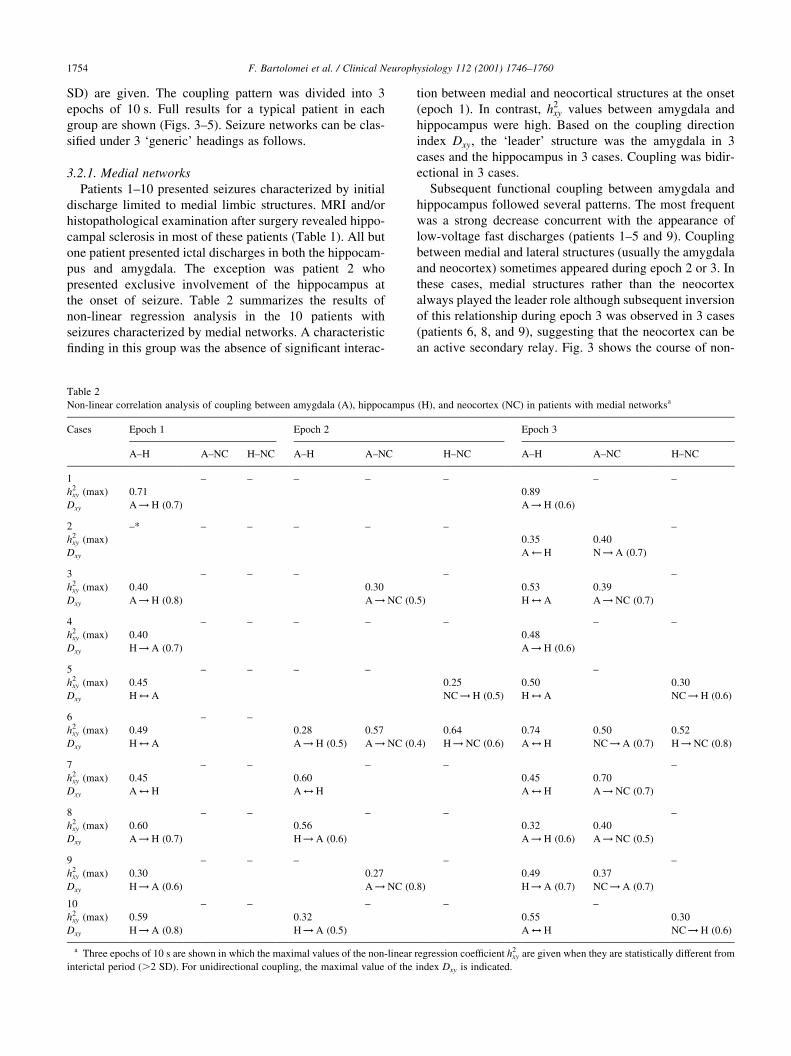
SD) are given. The coupling pattern was divided into 3
epochs of 10 s. Full results for a typical patient in each
group are shown (Figs. 3±5). Seizure networks can be clas-
si®ed under 3 `generic' headings as follows.
3.2.1. Medial networks
Patients 1±10 presented seizures characterized by initial
discharge limited to medial limbic structures. MRI and/or
histopathological examination after surgery revealed hippo-
campal sclerosis in most of these patients (Table 1). All but
one patient presented ictal discharges in both the hippocam-
pus and amygdala. The exception was patient 2 who
presented exclusive involvement of the hippocampus at
the onset of seizure. Table 2 summarizes the results of
non-linear regression analysis in the 10 patients with
seizures characterized by medial networks. A characteristic
®nding in this group was the absence of signi®cant interac-
tion between medial and neocortical structures at the onset
(epoch 1). In contrast, h2xy values between amygdala and
hippocampus were high. Based on the coupling direction
index Dxy, the `leader' structure was the amygdala in 3
cases and the hippocampus in 3 cases. Coupling was bidir-
ectional in 3 cases.
Subsequent functional coupling between amygdala and
hippocampus followed several patterns. The most frequent
was a strong decrease concurrent with the appearance of
low-voltage fast discharges (patients 1±5 and 9). Coupling
between medial and lateral structures (usually the amygdala
and neocortex) sometimes appeared during epoch 2 or 3. In
these cases, medial structures rather than the neocortex
always played the leader role although subsequent inversion
of this relationship during epoch 3 was observed in 3 cases
(patients 6, 8, and 9), suggesting that the neocortex can be
an active secondary relay. Fig. 3 shows the course of non-
F. Bartolomei et al. / Clinical Neurophysiology 112 (2001) 1746±17601754
Table 2
Non-linear correlation analysis of coupling between amygdala (A), hippocampus (H), and neocortex (NC) in patients with medial networksa
Cases Epoch 1 Epoch 2 Epoch 3
A±H A±NC H±NC A±H A±NC H±NC A±H A±NC H±NC
1 ± ± ± ± ± ± ±
h2xy (max) 0.71 0.89
Dxy A! H (0.7) A! H (0.6)
2 ±* ± ± ± ± ± ±
h2xy (max) 0.35 0.40
Dxy A Ã H N! A (0.7)
3 ± ± ± ± ±
h2xy (max) 0.40 0.30 0.53 0.39
Dxy A! H (0.8) A! NC (0.5) H$ A A! NC (0.7)
4 ± ± ± ± ± ± ±
h2xy (max) 0.40 0.48
Dxy H! A (0.7) A! H (0.6)
5 ± ± ± ± ±
h2xy (max) 0.45 0.25 0.50 0.30
Dxy H$ A NC! H (0.5) H$ A NC! H (0.6)
6 ± ±
h2xy (max) 0.49 0.28 0.57 0.64 0.74 0.50 0.52
Dxy H$ A A! H (0.5) A! NC (0.4) H! NC (0.6) A$ H NC! A (0.7) H!NC (0.8)
7 ± ± ± ± ±
h2xy (max) 0.45 0.60 0.45 0.70
Dxy A$ H A$ H A$ H A! NC (0.7)
8 ± ± ± ± ±
h2xy (max) 0.60 0.56 0.32 0.40
Dxy A! H (0.7) H! A (0.6) A! H (0.6) A! NC (0.5)
9 ± ± ± ± ±
h2xy (max) 0.30 0.27 0.49 0.37
Dxy H! A (0.6) A! NC (0.8) H! A (0.7) NC! A (0.7)
10 ± ± ± ± ±
h2xy (max) 0.59 0.32 0.55 0.30
Dxy H! A (0.8) H! A (0.5) A$ H NC! H (0.6)
a Three epochs of 10 s are shown in which the maximal values of the non-linear regression coef®cient h2xy are given when they are statistically different from
interictal period (.2 SD). For unidirectional coupling, the maximal value of the index Dxy is indicated.

linear regression analysis during a medial seizure in patient
1. A clear-cut increase in interdependency between the
amygdala and hippocampus was observed at the same
time as appearance of spiking activities in these two struc-
tures. The direction index Dxy increased to a value of 10.8,
suggesting that the discharge was driven by the amygdala.
When the fast low-voltage discharges emerged, the h2xy
value decreased (epoch 2). Late occurrence of a second
phase of synchronization (epoch 3) with high h2xy (maximum
0.7) and Dxy values indicated that the amygdala played the
leader role. The end of the seizure was marked by a rebound
in the h2xy value. No signi®cant interdependency was
observed between medial and neocortical structures.
3.2.2. Medial±lateral networks
Medial±lateral networks were observed in patients 11±15.
MRI and/or histopathological examination of surgical speci-
mens revealed hippocampal sclerosis in 4 cases (patients
11±14) and a dysplastic lesion (ganglioglioma) involving
the parahippocampal gyrus in one (patient 15) (Table 1).
Seizure started either by a short period of spiking activity
over the amygdala and hippocampus (cases 11±14) or by a
slow wave complex in the parahippocampal region (case 15)
followed by fast low-voltage discharges affecting both the
medial structures and the neocortex. Table 3 shows the
result of h2xy analysis in these patients. During epoch 1,
high h2xy values were observed between medial and lateral
F. Bartolomei et al. / Clinical Neurophysiology 112 (2001) 1746±1760 1755
Table 3
Non-linear correlation analysis of coupling between amygdala (A), hippocampus (H), and neocortex (NC) in patients with medial±lateral networksa
Cases Epoch 1 Epoch 2 Epoch 3
A±H A±NC H±NC H±A A±NC H±NC H±A A±NC H±NC
11 ± ± ± ± ±
h2xy (max) 0.35 0.55 0.45 0.33
Dxy A! H (0.8) A! NC (0.7) A! NC (0.7) A! H (0.8)
12 ± ±
h2xy (max) 0.80 0.60 0.70 0.41 0.75 0.40 0.40
Dxy A! H (0.9) A! NC (0.8) H! NC (0.7) N$ A H! A (0.8) N! A (0.6) N!H (0.5)
13 ± ± ±
h2xy (max) 0.36 0.33 0.61 0.61 0.45 0.35
Dxy A$ H A! NC (0.7) H! NC (0.8) H!NC (0.9) A! H (0.8) A! NC (0.7)
14 ± ± ± ±
h2xy (max) 0.61 0.40 0.60 0.39 0.90
Dxy A! NC (0.6) H! A (0.7) A$ H (0.8) NC! A (0.7) H$NC
15 ± ± ±
h2xy (max) 0.43 0.53 0.41 0.30 0.50 0.50
Dxy H! A (0.6) A! NC (0.7) H! NC (0.8) H! A (0.7) NC! A (0.8) H!NC (0.8)
a Three epochs of 10 s are shown in which the maximal values of the non-linear regression coef®cient h2xy are given when they are statistically different from
the interictal period (.2 SD). For unidirectional coupling, the maximal value of the index Dxy is indicated.
Table 4
Non-linear correlation analysis of coupling between amygdala (A), hippocampus (H), and neocortex (NC) in patients with lateral±medial networksa
Cases Epoch 1 Epoch 2 Epoch 3
A±H A±NC H±NC A±H A±NC H±NC A±H A±NC H±NC
16 ± ± ±
h2xy (max) 0.53 0.40 0.42 0.40 0.53 0.50
Dxy H! A (0.8) NC! A (0.6) NC! H (0.7) A! NC (0.6) H! A (0.6) H$NC
17
h2xy (max) 0.45 0.69 0.55 0.40 0.5 0.60 0.60 0.67 0.30
Dxy H! A (0.6) NC! A (0.6) NC! H (0.4) H! A (0.5) NC! A (0.7) NC! H (0.6) H! A (0.4) A! N (0.6) H!NC (0.4)
18 ± ± ± ±
h2xy (max) 0.54 0.40 0.4 0.41 0.65
Dxy A! H (0.6) NC! A (0.4) A! H (0.5) NC! A (0.4) NC$ A (0.4)
a Three epochs of 10 s are shown in which the maximal values of the non-linear regression coef®cient h2xy are given when they are statistically different from
interictal period (.2 SD). For unidirectional coupling the maximal value of the index Dxy is indicated.

structures as well as between medial structures. It is note-
worthy that coupling with the neocortex was already present
even when rhythmic modi®cations appeared over medial
regions. The fundamental difference between this group
and the preceding one was medial±lateral coupling.
Coupling was found to be either bidirectional or unidirec-
tional to the amygdala. The neocortex always appeared to be
driven by medial structures (amygdala or amygdala and
hippocampus) at the onset of seizure.
Fig. 4 depicts the typical pattern of non-linear regression
analysis in a patient with MLTLE. The ®rst epoch was
characterized by an increase in h2xy values between medial
structures (amygdala and hippocampus). The direction
index Dxy indicated that the amygdala was the leader struc-
ture in the initial phase of coupling. This second epoch was
marked by a decrease in coupling between the amygdala and
hippocampus coinciding with the appearance of fast low-
voltage discharge.
Signi®cant coupling was also demonstrated in the ®rst
epoch between the medial structures and neocortex (h2xy
value reaching 0.6 (amygdala±neocortex) and 0.8. (hippo-
campus±neocortex)). The direction index demonstrated that
the medial structure played the leader role in this coupling.
Initial coupling was followed by a decrease (again concur-
rent with low-voltage discharges) followed by coupling
between these regions.
3.2.3. Lateral±medial networks
The lateral±medial network subtype was observed in
patients 16±18. Results of non-linear analysis are shown
in Table 4. These networks were associated with lesions
involving the anterior temporal neocortex in two cases
(Table 1). The seizure pattern appeared to consist of a
rapid low-voltage discharge involving both medial and
lateral structures. The main characteristic of this group
was the existence of initial coupling between the neocortex
and medial structures (amygdala and/or hippocampus). The
main difference from the MLTLE group was the direction of
F. Bartolomei et al. / Clinical Neurophysiology 112 (2001) 1746±17601756
Fig. 6. Seizure and medial network according to the interactions between several temporal lobe structures in patient 7. The maximal h2xy values during the ®rst
10 s of seizure (epoch 1) are given for signi®cant interactions. The direction of the coupling indicated by the arrows is given by the direction index Dxy. A,
amygdala; Ha, anterior hippocampus; ant T2, anterior part of the middle temporal gyrus; midT2, mid-part of the middle temporal gyrus; TP, temporopolar
region; T1, ®rst temporal gyrus; Ins, insula; TP l, lateral part of the temporal pole; TPm, medial part of the temporal pole.

coupling since the neocortex was the initial leader and
medial structures appeared to be driven. Major non-linear
interdependency was also observed between amygdala and
hippocampus in these patients.
Fig. 5 shows the course of couplings associated with
LMTLE seizure in patient 17. During epoch 1, h2xy coef®-
cients between the neocortex and amygdala reached values
up to 0.5 while Dxy rose to 10.9. This ®nding indicates that
the leader role was played by the neocortex. During epoch 2,
h2xy rose signi®cantly in comparison to interictal values
(maximum 0.8). At the same time, Dxy values remained
around 11.0. Interpretation of simulation results suggests
that neural populations in lateral structures tended to couple
with ± and drive ± neural populations from medial struc-
tures. During epoch 2, major coupling was observed
between the amygdala and hippocampus and between the
hippocampus and neocortex.
3.2.4. An approach to the complexity of involved neural
networks
The results presented in Section 3.1 are based on non-
linear regression evaluation of the interactions between the
amygdala, anterior hippocampus, and neocortex of the
middle temporal gyrus. Patients 7, 8 and 15 had additional
electrodes exploring other medial limbic regions, i.e. the
temporal pole and the entorhinal/perirhinal cortex. Patients
7 and 8 presented medial seizures and non-linear regression
analysis of the coupling revealed that the networks involved
all explored limbic neural structures including the medial
part of the temporal pole. The leader structure in these
networks was the amygdala±hippocampus complex (Figs.
6 and 7). In patient 8, strong bidirectional coupling occurred
between the amygdala, hippocampus, and entorhinal cortex,
which drove the temporal pole. These two cases show that
medial networks can extend beyond the classical amygdala±
hippocampus complex.
Fig. 8 shows the network involved in patient 15. The
onset of seizure was characterized by a slow wave complex
in various structures, including the medial structures, para-
hippocampal gyrus (lesional site), and temporal neocortex,
followed by a fast low-voltage discharge. Analysis of h2xy
values at the onset of the seizure showed that these struc-
tures are functionally linked in a complex medial±lateral
network. In this network, the lesional site played the leader
role.
4. Discussion
This study was focused speci®cally on interactions
between the temporal neocortex and limbic structures and
the relative contribution of these structures to the generation
of TLE seizures. On the basis of Pijn and Lopes da Silva
(1993), our ®ndings showed that non-linear regression
allows not only reliable quanti®cation of relationships
between signals in epileptic partial seizures. The results
described here are based on a physiological model of EEG
data. This model differs from the more `external' models
(autoregressive, for example) classically used to evaluate
EEG signal processing (Lopes da Silva et al., 1975; Kocarev
and Parlitz, 1996). Our model allows us to explicitly repre-
sent both degree and direction of coupling, thus allowing
construction of the neural systems inside controlling caus-
ality relationships and generation of multichannel EEG
signals from these systems. These signals provide an objec-
tive way of studying the performance of non-linear regres-
sion analysis and allow comparison of h2xy and Dxy
coef®cients computed on real signals.
In a previous study we de®ned 4 subtypes of TLE, namely
medial, medial±lateral, lateral±medial and lateral (Bartolo-
mei et al., 1999). The results of this study con®rm and
extend our knowledge about these spatio-temporal patterns
in several respects. One of the most important results is that
the epileptogenic zone giving rise to initial ictal discharge
can be more accurately de®ned as a network of neural struc-
tures rather than as a focus of abnormal activity. This de®-
nition implies the existence of `abnormally facilitated
connections' between neuronal groups that display stereo-
typed behavior during seizures.
In medial networks, the ictal discharge is limited to the
F. Bartolomei et al. / Clinical Neurophysiology 112 (2001) 1746±1760 1757
Fig. 7. Medial network in patient 8 including the entorhinal cortex and the
medial part of the temporal pole. The maximal h2xy values during the ®rst
10 s of seizure (epoch 1) are given for signi®cant interactions. The direction
of the coupling indicated by the arrows is given by the direction index Dxy.
A, amygdala; Ha, hippocampus anterior part; T2, anterior part of the second
temporal gyrus; T1, ®rst temporal gyrus; Ins, insula; TP l, lateral part of the
temporal pole; TPm, medial part of the temporal pole; EC, entorhinal
cortex.

medial limbic structures and may propagate secondarily to
the cortex. The initial discharge may be phasic (clonic) or
tonic (rapid) but propagation is always clonic (Bartolomei et
al., 1999). Quanti®ed results in the present study demon-
strated no signi®cant coupling between medial and lateral
structures at the beginning of the seizures. Conversely,
almost constant coupling was observed between hippocam-
pus and amygdala, thus demonstrating that these two struc-
tures were involved in generation of seizures. Our data also
indicated that this coupling could be unidirectional or bidir-
ectional. Previous studies using linear methods (Lieb et al.,
1987; Duckrow and Spencer, 1992; Gotman and Levtova,
1996) described major interactions between medial struc-
tures during TLE seizures. Findings of a recent study (Le
Van Quyen et al., 1998) involving a new method of non-
linear evaluation of SEEG signal interdependence (mutual
non-linear prediction) showed that non-linear relationships
take place during seizures between several regions of the
medial structures during TLE seizures. However, this study
was limited to the interactions within the limbic medial
structures of the temporal lobe.
In MTLE, initial coupling between medial structures
seems to be a prerequisite condition to initiate ictal activity.
This initial phase is generally followed by a second phase in
which a strong decrease in coupling is observed in parallel
with development of fast low-voltage discharges. These
®ndings have already been reported in linear (Lieb et al.,
1987; Duckrow and Spencer, 1992) as well as other non-
F. Bartolomei et al. / Clinical Neurophysiology 112 (2001) 1746±17601758
Fig. 8. Seizure and complex medial±lateral network (patient 15) including the medial limbic structures (A, amygdala; Ha, anterior hippocampus; PHG,
parahippocampal gyrus posterior part; EC, entorhinal cortex) and the neocortical part of the left temporal lobe (T3, inferior temporal gyrus; T2, middle
temporal gyrus). The maximal h2xy values during the ®rst 10 s of seizure (epoch 1) are given for signi®cant interactions. The direction of the coupling indicated
by the arrows is given by the direction index Dxy.
linear studies (Le Van Quyen et al., 1998). A possible
mechanism could be a loss of synchronization in the activity
of the two structures. This phenomenon could result from
functional disconnections between structures. In this regard,
experimental evidence has shown that generation of fast
rapid discharges in neuron clusters depletes extracellular
calcium concentrations to levels no longer consistent with
synaptic transmission (Jefferys, 1990; Wheal, 1990).
Compensatory mechanisms as well as slowing of the
discharge rate could re-establish the connections.
In medial±lateral and lateral±medial networks, the ictal
discharge includes both limbic and neocortical regions. A
rapid `tonic' discharge is observed over the temporal
neocortex at the onset of seizure (Bartolomei et al., 1999).
Quantitative analysis showed an initial increase in the non-
linear correlation coef®cient and direction index. This ®nd-
ing would indicate an in¯uence of medial over lateral struc-
tures (medial±lateral) or of the lateral neocortex over medial
structures (lateral±medial). The amygdala probably plays a
central role in these networks since cortical±medial inter-
dependence always involves this structure. This result is in
agreement with previous data (Gotman and Levtova, 1996)
showing that the amygdala was the most common
discharge-initiating structure in patients presenting neocor-
tical involvement during TLE seizures. This result can be
interpreted in terms of connectivity between these struc-
tures. Connections between the amygdala and temporal
cortex can be described as strong, direct, and bidirectional
while connections with the hippocampus are indirect,
passing through the entorhinal cortex (Amaral and Insausti,
1990). The existence of these dense direct connections
could explain why the amygdala is more often involved
than the hippocampus in these cortico-limbic networks.
Our methodological approach seemed to be well suited to
de®ning the involved networks and identifying leader struc-
tures in these networks. In the present study, investigation of
limbic structures was limited mainly to interactions between
the amygdala and hippocampus. However, involvement of
other functionally interconnected structures in these
networks is likely. In this regard, our preliminary results
from the patients with electrodes in the temporal pole and/
or peri/entorhinal region indicated that these regions might
be involved in the epileptogenic network in addition to the
amygdalo-hippocampal complex. Further study in a larger
population of patients will be needed to assess involvement
of other limbic or paralimbic regions in medial networks or
in medial±lateral networks.
Our ®ndings are in agreement with previous reports
including those of Bancaud et al. who were the ®rst to
propose the existence of several TLE subtypes (Bancaud
et al., 1965; Bancaud, 1981) and with other reports describ-
ing simultaneous involvement of the temporal neocortex
and medial structures during TLE seizures (Wieser, 1983;
Spencer et al., 1990; Munari et al., 1994). It is noteworthy
that neuroimaging and/or pathological features in patients
presenting medial and medial±lateral networks are consis-
tent with primary disease in temporal limbic structures,
while those in patients presenting lateral±medial networks
are consistent with primary pathology of the neocortex. This
suggests that hippocampal sclerosis would not be the discri-
minating factor since it is usually found in the ®rst two
subtypes. Thus, there is convincing evidence that the clas-
sical distinction between medial and lateral TLE is insuf®-
cient and oversimpli®ed.
A more appropriate classi®cation and better understand-
ing of the network organization of the epileptogenic zone
would assist the surgeon in achieving `optimal' delineation
of the volume of tissue to be excised. It is generally
acknowledged that MTLE has a better surgical prognosis
even though there is little supportive evidence in the litera-
ture. Standardized surgical procedures limited to medial
temporal structures (amygdalo-hippocampectomy) or
extended to the anterior temporal lobe (anterior temporal
lobectomy) are performed in most cases. In about 35% of
cases, however, patients are not seizure-free after such
procedures (Engel et al., 1993). Failure may be due to the
complexity of interactions between neocortical and limbic
temporal lobe structures within the epileptogenic zone,
particularly when a standardized surgical procedure is
performed.
References
Amaral D, Insausti R. Hippocampal formation. In: Paxinos G, editor. The
human nervous system, San Diego, CA: Academic Press, 1990. pp.
711±757.
Arnhold J, Grassberger P, Lenhertz K, Elger CE. A robust method for
detecting interdependences: application to intracranially recorded
EEG. Physica D 1999;134:419±430.
Badier J, Chauvel P. Spatio-temporal characteristics of paroxysmal inter-
ictal events in human temporal lobe epilepsy. J Physiol (Paris)
1995;89:255±264.
Bancaud J. Epileptic attacks of temporal lobe origin in man. Jap J EEG
EMG 1981;Suppl:61±71.
Bancaud J, Talairach J, Bonis A, Schaub C, Szikla G, Morel P, Bordas-
Ferrer M. La steÂreÂoeÂlectroenceÂphalographie dans l'eÂpilepsie: informa-
tions neurophysiopathologiques apporteÂes par l'investigation fonction-
nelle stereotaxique Paris: Masson, 1965.
Bartolomei F, Wendling F, Vignal J, Kochen S, Bellanger J, Badier J, Le
Bouquin-Jeannes R, Chauvel P. Seizures of temporal lobe epilepsy:
identi®cation of subtypes by coherence analysis using stereo-electro-
encephalography. Clin Neurophysiol 1999;110:1741±1754.
Burgerman R, Sperling M, French J, Saykin A, O'Connor M. Comparison
of medial versus neocortical onset temporal lobe seizures: neurodiag-
nostic ®ndings and surgical outcome. Epilepsia 1995;36:662±670.
Cascino G, Jack C, Sharbrough F, Kelly P, Marsh W. MRI assessments of
hippocampal pathology in extra-temporal lesional epilepsy. Neurology
1993;43(Suppl 2):A383.
Casdagli M, Iasemidis L, Savit R, Gilmore R, Roper S, Sackellares J. Non-
linearity in invasive EEG recordings from patients with temporal lobe
epilepsy. Electroenceph clin Neurophysiol 1997;102:98±105.
Chabardes S, Kahane P, Hoffman D, Munari C, Benabid AL. Role of the
temporo-polar region in the genesis of temporal lobe seizures. Epilepsia
1999;40(Suppl 7):78.
Chauvel P, Vignal J, Biraben A, Badier J, Scarabin J. Stereoelectroence-
phalography. In: Pawlik G, Stefan H, editors. Multimethodological
assessment of the epileptic forms, New York, NY: Springer, 1996.
F. Bartolomei et al. / Clinical Neurophysiology 112 (2001) 1746±1760 1759

Commission on Classi®cation and Terminology of the International League
Against Epilepsy. Commission on Classi®cation and Terminology of
the International League Against Epilepsy: proposal for revised classi-
®cation of epilepsies and epileptic syndromes. Epilepsia 1989;30:389±
399.
Duckrow R, Spencer S. Regional coherence and the transfer of ictal activity
during seizure onset in the medial temporal lobe. Electroenceph clin
Neurophysiol 1992;82:415±422.
Ebner A. Lateral (neocortical) temporal lobe epilepsy. In: Wolf P, editor.
Epileptic seizures and syndromes, London: John Libbey and Co, 1994.
pp. 375±382.
Engel J, VanNess P, Rasmussen T, Ojemann L. Outcome with respect to
epileptic seizures. In: Engel J, editor. Surgical treatment of the epilep-
sies, 2nd ed. New York, NY: Raven Press, 1993. pp. 609±622.
French J, Williamson P, Thadani V, Darcey T, Mattson R, Spencer S,
Spencer D. Characteristics of medial temporal lobe epilepsy: I. Results
of history and physical examination. Ann Neurol 1993;34:774±780.
Gotman J, Levtova V. Amygdala±hippocampus relationships in temporal
lobe seizures: a phase coherence study. Epilepsy Res 1996;25:51±57.
Isnard J, Guenot M, Ostrowsky K, Sindou M, MauguieÁre F. The role of the
insular cortex in temporal lobe epilepsy. Ann Neurol 2000;48:614±623.
Jefferys J. Basic mechanisms of focal epilepsies. Exp Physiol 1990;75:127±
162.
Kocarev L, Parlitz U. Generalized synchronization, predictability and
equivalence of unidirectionally coupled dynamical systems. Phys Rev
Lett 1996;76:1816±1819.
Le Van Quyen M, Adam C, Baulac M, Martinerie J, Varela F. Nonlinear
interdependencies of EEG signals in human intracranially recorded
temporal lobe seizures. Brain Res 1998;792:24±40.
Levesque M, Nakasato N, Vinters H, Babb T. Surgical treatment of limbic
epilepsy associated with extratemporal lesions: the problem of dual
pathology. J Neurosurg 1991;75:364±370.
Lieb J, Hoque K, Skomer C, Song X. Interhemispheric propagation of
human medial temporal lobe seizures: a coherence/phase analysis. Elec-
troenceph clin Neurophysiol 1987;67:101±119.
Lopes da Silva F, Pijn J. Epilepsy: network models of generation. In: Arbib
M, editor. The handbook of brain theory and neural networks,
Cambridge, MA/London: Bradford/The MIT Press, 1995. pp. 367±369.
Lopes da Silva F, Hoek AHS, Zetterberg L. Model of brain rhythmic
activity. Kybernetic 1974;15:27±37.
Lopes da Silva F, Dijk A, Smits H. Detection of non-stationarities in EEGs
using the autoregressive model ± an application to EEGs of epileptics.
In: Dolce H, Kunkel, editors. CEAN ± computerized EEG analysis,
Stuttgart: Fischer, 1975. pp. 180±199.
Lopes da Silva F, van Rotterdam A, Barts P, van Heusden E, Burr W.
Models of neuronal populations: the basic mechanisms of rhythmicity.
Prog Brain Res 1976;45:281±308.
Mars N, Lopes da Silva F. Propagation of seizure activity in kindled dogs.
Electroenceph clin Neurophysiol 1983;56:194±209.
Munari C, Tassi L, Kahane P, Francione S, DiLeo M, Quarato P. Analysis
of clinical symptomatology during stereo-EEG recorded mesiotemporal
lobe seizures. In: Wolf P, editor. Epileptic seizures and syndromes,
London: John Libbey and Co, 1994.
Pijn J, Lopes da Silva F. Propagation of electrical activity: nonlinear asso-
ciations and time delays between EEG signals. In: Zschocke, Speck-
mann, editors. Basic Mechanisms of the EEG, Boston, MA: Birkauser,
1993.
Pijn J, Van Neerven J, Noest A, Lopes da Silva F. Chaos or noise in EEG
signals; dependance on state and brain site. Electroenceph clin Neuro-
physiol 1991;79:371±381.
Pijn J, Velis DN, Lopes da Silva F. Measurement of interhemispheric time
differences in generalised spike-and-wave. Electroenceph clin Neuro-
physiol 1992;83:169±171.
Spencer S, Spencer D, Williamson P, Mattson R. Combined depth and
subdural electrode investigation in uncontrolled epilepsy. Neurology
1990;40:74±79.
Talairach J, Bancaud J, Szickla G, Bonis A, Geier S. Approche nouvelle de
la chirurgie de l'eÂpilepsie: methodologie steÂreÂotaxique et reÂsultats theÂr-
apeutiques. Neurochirurgie 1974;20(Suppl 1):1±240.
Van der Heyden M, Velis D, Hoekstra B, Pijn J, Van Emde Boas W, Van
Veelen C, Van Rijen P, Lopes da Silva F, DeGoede J. Non-linear
analysis of intracranial human EEG in temporal lobe epilepsy. Clin
Neurophysiol 1999;110:1726±1740.
Walczak T. Neocortical temporal lobe epilepsy. Epilepsia 1995;36:633±
635.
Wendling F, Badier J, Chauvel P, Coatrieux J. A method to quantify invar-
iant information in depth-recorded epileptic seizures. Electroenceph
clin Neurophysiol 1997;102:472±485.
Wendling F, Bellanger J, Bartolomei F, Chauvel P. Relevance of nonlinear
lumped-parameter models in the analysis of depth-EEG epileptic
signals. Biol Cybern 2000;83:367±378.
Wendling F, Bartolomei F, Bellanger J, Chauvel P. Interpretation of inter-
dependencies in epileptic signals using a macroscopic physiological
model of EEG. Clin Neurophysiol 2001;112:1201±1218.
Wheal H. Membrane electrophysiology of epileptiform activity in the
hippocampus. Acta Neurochirurgica 1990;50(Suppl):6±13.
Wieser H. Electroclinical features of the psychomotor seizures. London:
Butterworths, 1983.
Wieser H, Engel JJ, Williamson P, Babb T, Gloor P. Surgically remediable
temporal lobes syndromes. In: Engel Jr J, editor. Surgical treatment of
the epilepsies, 2nd ed. New York, NY: Raven Press, 1993. pp. 49±63.
Williamson P, French J, Thadani V, Kim J, Novelly R, Spencer S, Spencer
D, Mattson R. Characteristics of medial temporal lobe epilepsy: II.
Interictal and ictal scalp electroencephalography, neuropsychological
testing, neuroimaging, surgical results and pathology. Ann Neurol
1993;34:781±787.
Williamson P, Engel P, Munari C. Anatomic classi®cation of localization-
related epilepsies. In: Engel J, Pedley T, editors. Epilepsy: a compre-
hensive textbook, New York, NY: Lippincott-Raven, 1998.
F. Bartolomei et al. / Clinical Neurophysiology 112 (2001) 1746±17601760
Copyright © 2022 FDOKUMEN