Category-specific visual responses of single neurons in the human medial temporal lobe
8
946 nature neuroscience • volume 3 no 9 • september 2000 articles Visual recognition of objects is a key function of the primate brain. There is a progression in the complexity of the represen- tation of the visual scene by single neurons. Neurons in early visual areas in monkeys are tuned to simple features of the stim- uli, such as the orientation of bars in area V1 or direction of motion in area V5. In the monkey inferotemporal cortex (IT), neurons respond to complex stimuli, including faces and hands, but also abstract patterns or common, everyday objects 1–3 . There are strong projections from IT to higher association areas in the temporal lobe, including the parahippocampal gyrus, perirhinal cortex, entorhinal cortex, hippocampus and amygdala 4,5 . Single neurons in these polymodal areas in monkeys also show visual selectivity for complex stimuli 6–8 . Temporal lobe lesions lead to profound category-specific deficits in visual recognition in both macaques and humans 9–12 . There is evidence from electrical stimulation studies in epileptic patients that current injection in the temporal lobe can interfere with visual recognition 13 and elicit visual memories and halluci- nations 13,14 . Functional brain imaging and event-related poten- tials (ERP) also show a correlation between brain activity and visual recognition of specific categories of stimuli such as human faces and spatial layouts or places 15–20 . We reported that neurons in the human medial temporal lobe discriminate objects from faces 21 . Here we further investigated visual response properties and showed that single neurons respond selectively to different stimulus categories. RESULTS We recorded the activity of 427 single neurons in 11 patients with pharmacologically resistant epilepsy who had intracranial depth electrodes implanted to determine the location of the seizure focus for possible surgical resection. Based on clinical criteria, electrode probes, containing several microwires each, were placed in medial temporal lobe targets bilaterally (Table 1). Based on MRI confirmation (Fig. 1), 149 of the neurons recorded were in the amygdala, 153 neurons in the entorhinal cortex and 125 neu- rons in the hippocampus. (Eighty-five percent of the sites were in the anterior segment of the hippocampus.) Most of the elec- trodes we recorded from were in the right temporal lobe (79%). During single-neuron recording, subjects were presented with visual stimuli (Fig. 2) and performed a simple discrimination task indicating whether the picture was a human face or not. Of the 427 neurons, 85 (20%) showed changes in firing rate during presentation of the visual stimuli, and 61 (14%) showed visual- ly selective responses that were category specific. Visual responses Most neurons showed maintained firing rates below 10 spikes per second (Table 1). No significant response differences were observed between the right and left hemispheres, and there- fore the data were pooled. The average overall firing rate was 3.6 ± 5.6 spikes per second, similar to observations in rats and monkeys 6–8,22 . We studied the responses of each neuron to the 1000-ms pre- sentation of the visual stimuli by averaging the activity for all images within each category. For each neuron and each category, a post-stimulus time histogram was computed, showing the neu- ronal response starting 1000 ms before stimulus onset and end- ing 1000 ms after the stimulus disappeared. A neuron was considered visually selective for a specific cat- egory if the activity during stimulus presentation for that cate- gory was significantly different from the baseline activity and from the responses to other categories of stimuli (Methods). For example, a visually selective neuron in the entorhinal cor- Category-specific visual responses of single neurons in the human medial temporal lobe Gabriel Kreiman 1 , Christof Koch 1 and Itzhak Fried 2 1 Computation and Neural Systems Program, California Institute of Technology, 139-74, Pasadena, California 91125, USA 2 Division of Neurosurgery and Department of Psychiatry and Biobehavioral Sciences, Box 957039, UCLA School of Medicine, 740 Westwood Plaza, Los Angeles, California 90095-7039, USA Correspondence should be addressed to I.F. ([email protected]) The hippocampus, amygdala and entorhinal cortex receive convergent input from temporal neocorti- cal regions specialized for processing complex visual stimuli and are important in the representation and recognition of visual images. Recording from 427 single neurons in the human hippocampus, entorhinal cortex and amygdala, we found a remarkable degree of category-specific firing of individ- ual neurons on a trial-by-trial basis. Of the recorded neurons, 14% responded selectively to visual stimuli from different categories, including faces, natural scenes and houses, famous people and animals. Based on the firing rate of individual neurons, stimulus category could be predicted with a mean probability of error of 0.24. In the hippocampus, the proportion of neurons responding to spa- tial layouts was greater than to other categories. Our data provide direct support for the role of human medial temporal regions in the representation of different categories of visual stimuli. © 2000 Nature America Inc. • http://neurosci.nature.com © 2000 Nature America Inc. • http://neurosci.nature.com
-
Upload
hms-harvard -
Category
Documents
-
view
5 -
download
0
Transcript of Category-specific visual responses of single neurons in the human medial temporal lobe

946 nature neuroscience • volume 3 no 9 • september 2000
articles
Visual recognition of objects is a key function of the primatebrain. There is a progression in the complexity of the represen-tation of the visual scene by single neurons. Neurons in earlyvisual areas in monkeys are tuned to simple features of the stim-uli, such as the orientation of bars in area V1 or direction ofmotion in area V5. In the monkey inferotemporal cortex (IT),neurons respond to complex stimuli, including faces and hands,but also abstract patterns or common, everyday objects1–3. Thereare strong projections from IT to higher association areas in thetemporal lobe, including the parahippocampal gyrus, perirhinalcortex, entorhinal cortex, hippocampus and amygdala4,5. Singleneurons in these polymodal areas in monkeys also show visualselectivity for complex stimuli6–8.
Temporal lobe lesions lead to profound category-specificdeficits in visual recognition in both macaques and humans9–12.There is evidence from electrical stimulation studies in epilepticpatients that current injection in the temporal lobe can interferewith visual recognition13 and elicit visual memories and halluci-nations13,14. Functional brain imaging and event-related poten-tials (ERP) also show a correlation between brain activity andvisual recognition of specific categories of stimuli such as humanfaces and spatial layouts or places15–20.
We reported that neurons in the human medial temporal lobediscriminate objects from faces21. Here we further investigatedvisual response properties and showed that single neuronsrespond selectively to different stimulus categories.
RESULTSWe recorded the activity of 427 single neurons in 11 patients withpharmacologically resistant epilepsy who had intracranial depthelectrodes implanted to determine the location of the seizurefocus for possible surgical resection. Based on clinical criteria,
electrode probes, containing several microwires each, were placedin medial temporal lobe targets bilaterally (Table 1). Based onMRI confirmation (Fig. 1), 149 of the neurons recorded were inthe amygdala, 153 neurons in the entorhinal cortex and 125 neu-rons in the hippocampus. (Eighty-five percent of the sites werein the anterior segment of the hippocampus.) Most of the elec-trodes we recorded from were in the right temporal lobe (79%).During single-neuron recording, subjects were presented withvisual stimuli (Fig. 2) and performed a simple discriminationtask indicating whether the picture was a human face or not. Ofthe 427 neurons, 85 (20%) showed changes in firing rate duringpresentation of the visual stimuli, and 61 (14%) showed visual-ly selective responses that were category specific.
Visual responsesMost neurons showed maintained firing rates below 10 spikesper second (Table 1). No significant response differences wereobserved between the right and left hemispheres, and there-fore the data were pooled. The average overall firing rate was3.6 ± 5.6 spikes per second, similar to observations in rats andmonkeys6–8,22.
We studied the responses of each neuron to the 1000-ms pre-sentation of the visual stimuli by averaging the activity for allimages within each category. For each neuron and each category,a post-stimulus time histogram was computed, showing the neu-ronal response starting 1000 ms before stimulus onset and end-ing 1000 ms after the stimulus disappeared.
A neuron was considered visually selective for a specific cat-egory if the activity during stimulus presentation for that cate-gory was significantly different from the baseline activity andfrom the responses to other categories of stimuli (Methods).For example, a visually selective neuron in the entorhinal cor-
Category-specific visual responsesof single neurons in the humanmedial temporal lobe
Gabriel Kreiman1, Christof Koch1 and Itzhak Fried2
1 Computation and Neural Systems Program, California Institute of Technology, 139-74, Pasadena, California 91125, USA2 Division of Neurosurgery and Department of Psychiatry and Biobehavioral Sciences, Box 957039, UCLA School of Medicine, 740 Westwood Plaza, Los Angeles,
California 90095-7039, USA
Correspondence should be addressed to I.F. ([email protected])
The hippocampus, amygdala and entorhinal cortex receive convergent input from temporal neocorti-cal regions specialized for processing complex visual stimuli and are important in the representationand recognition of visual images. Recording from 427 single neurons in the human hippocampus,entorhinal cortex and amygdala, we found a remarkable degree of category-specific firing of individ-ual neurons on a trial-by-trial basis. Of the recorded neurons, 14% responded selectively to visualstimuli from different categories, including faces, natural scenes and houses, famous people andanimals. Based on the firing rate of individual neurons, stimulus category could be predicted with amean probability of error of 0.24. In the hippocampus, the proportion of neurons responding to spa-tial layouts was greater than to other categories. Our data provide direct support for the role ofhuman medial temporal regions in the representation of different categories of visual stimuli.
© 2000 Nature America Inc. • http://neurosci.nature.com©
200
0 N
atu
re A
mer
ica
Inc.
• h
ttp
://n
euro
sci.n
atu
re.c
om
nature neuroscience • volume 3 no 9 • september 2000 947
tex had increased firing rate in response to pictures of animals(Fig. 3a). The activity of this neuron during the 100–1000 msinterval after stimulus onset was different from baseline for ani-mal stimuli (p < 10–4, Wilcoxon rank-sum test), but not for theother stimulus categories (p > 0.1). A one-way ANOVA com-paring firing rates between categories yielded p < 0.001, andcomparing the activity for animals to all other categories usinga pair-wise non-parametric Wilcoxon test yielded statisticallysignificant differences (p < 0.001). The latency of response forthis neuron was 219 ms, and the duration of increased responseover baseline was 752 ms.
How specific was the response of the neuron within theselective category? If the averageincreased response to animals weredue to enhanced firing for only a fewpictures of animals, one mightexpect to observe a bimodal (or mul-timodal) distribution of firing rates.However, the distribution of firingrates for this neuron during presen-tation of different pictures of ani-mals did not show any clear signs ofmultimodality (Fig. 3b). Althoughthere was variability in the responseof the neuron to individual instancesof animals, the neuron respondedabove baseline for all pictures of ani-mals (Fig. 3c; p < 0.005). We alsocompared the variability for differ-ent presentations of the same animalto the variability across different pic-
articles
tures of animals using an analysis of variance (ANOVA). Bothparametric and non-parametric tests failed to show differencesamong individual stimuli (p > 0.4).
One visually selective neuron in the anterior hippocampus(Fig. 4) showed an increased firing rate over baseline in responseto drawings of famous people as well as, to a lesser degree, tophotos of famous people (p < 0.001). A one-way ANOVA yield-ed p < 0.001, and subsequent across-categories, pair-wise com-parisons also showed that the activity during stimuluspresentation was significantly higher for these two categories.Although the peak response was larger for drawings than forphotographs (13.9 spikes/s versus 9.6 spikes/s), the average
Table 1. Number of neurons and response properties.
Amygdala Entorhinal cortex Hippocampus Total
Left Right Left Right Left Right Left RightNumber of channels 21 57 13 58 12 54 215Number of neurons 50 99 24 129 44 81 427f (spikes/s) 2.1 ± 3.5 4.7 ± 5.4 4.0 ± 7.2Responsive neurons 6 (12) 12 (12) 6 (25) 29 (22) 16 (36) 16 (20) 28 (24) 57 (18)Selective neurons 5 (10) 9 (9) 5 (21) 20 (16) 13 (30) 9 (11) 23 (19) 38 (12)Latency (ms) 240 ± 145 209 ± 119 239 ± 132Durations (ms) 459 ± 322 507 ± 356 568 ± 325
Number of recorded channels and isolated neurons in each location in each hemisphere from the 11 patients.On average, we recorded approximately two neurons per microwire. For each neuron, we computed themean firing rate (f) over the entire experimental session. The firing rates in spikes/s ranged from 0.03 to 27 inthe amygdala, 0.02 to 38 in the entorhinal cortex and 0.03 to 29 in the hippocampus. The criteria used to clas-sify a neuron as visually responsive or selective are described in the text. The numbers in parenthesis indicatethe percentages with respect to the total number of neurons in each location. Neurons with late responseswere not included in the mean latency computation (Methods).
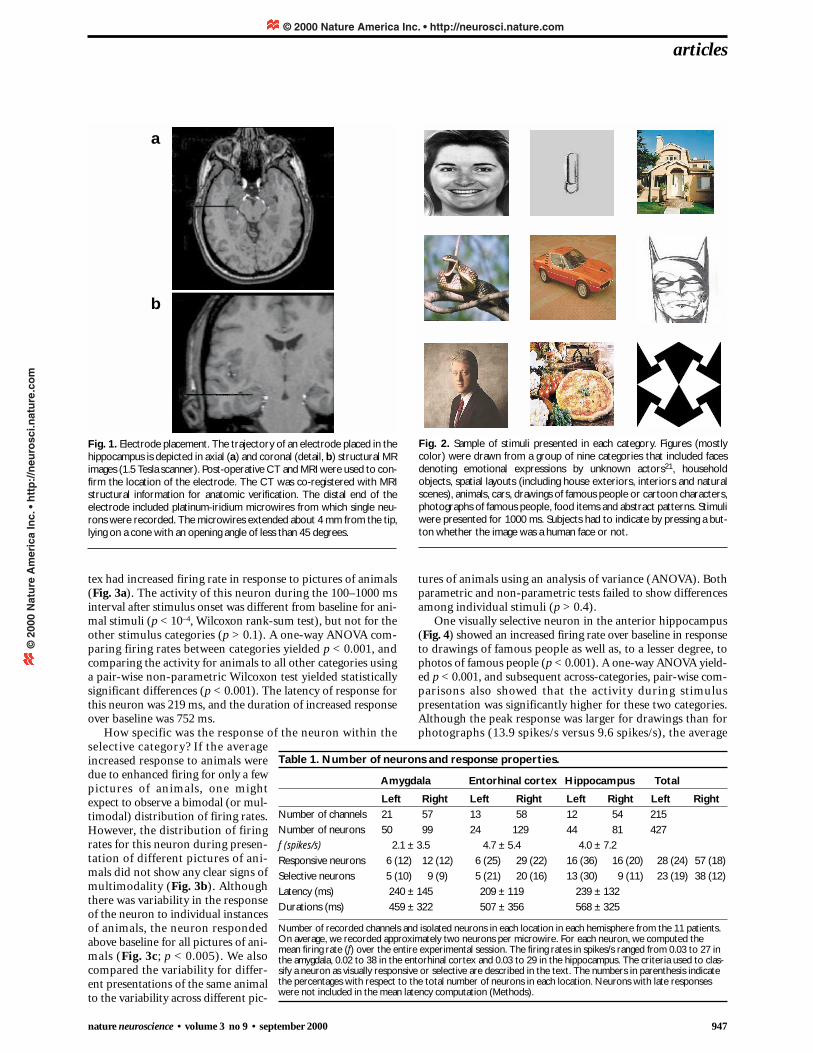
Fig. 1. Electrode placement. The trajectory of an electrode placed in thehippocampus is depicted in axial (a) and coronal (detail, b) structural MRimages (1.5 Tesla scanner). Post-operative CT and MRI were used to con-firm the location of the electrode. The CT was co-registered with MRIstructural information for anatomic verification. The distal end of theelectrode included platinum-iridium microwires from which single neu-rons were recorded. The microwires extended about 4 mm from the tip,lying on a cone with an opening angle of less than 45 degrees.
Fig. 2. Sample of stimuli presented in each category. Figures (mostlycolor) were drawn from a group of nine categories that included facesdenoting emotional expressions by unknown actors21, householdobjects, spatial layouts (including house exteriors, interiors and naturalscenes), animals, cars, drawings of famous people or cartoon characters,photographs of famous people, food items and abstract patterns. Stimuliwere presented for 1000 ms. Subjects had to indicate by pressing a but-ton whether the image was a human face or not.
a
b
© 2000 Nature America Inc. • http://neurosci.nature.com©
200
0 N
atu
re A
mer
ica
Inc.
• h
ttp
://n
euro
sci.n
atu
re.c
om

948 nature neuroscience • volume 3 no 9 • september 2000
activity was not significantly different (Wilcoxon rank-sum test,p > 0.05). This neuron did not respond to faces per se, as indi-cated by the lack of change in the activity for emotional facesof unknown actors. The distribution of firing rates in responseto photos of famous people for this neuron did not show clearsigns of displaying more than one mode (Fig. 4b). Variabilityin the responses to distinct individual photos (Fig. 4c) was nothigher than variability across different presentations of the samephotograph (ANOVA, p > 0.2). Similar results held for draw-ings of famous people. The response to all individual stimuliwithin the selective categories was significantly different frombaseline (p < 0.01).
Although we used a significance criterion of 0.05 in the sta-tistical analysis, most of the actual p values were below 0.01. Forthe visually selective neurons, 69% of the p values were less than0.01 (average p value, 0.01 ± 0.02). A χ2 test rejected the hypoth-esis that these responses could be due to chance (p < 0.001).
Some of the neurons showed changes in firing rate in responseto more than one of the categories (for example, Fig. 4). The pro-portion of neurons, relative to the number of selective neurons,that responded to more than one category was 21% in the amyg-
articles
dala, 10% in the entorhinal cortex and 25% in the hippocam-pus. Most of these neurons responded to two categories.
We also observed neurons that showed significant but non-selective changes in firing rate during stimulus presentation (Meth-ods). The proportion of nonselective neurons, relative to the totalnumber of responsive neurons, was 28% in the hippocampus, 29%in the entorhinal cortex and 17% in the amygdala.
Although most of the visually selective neurons showedincreases in the firing rate on presentation of visual stimuli, somecells had reduced firing rate from baseline (three neurons in theamygdala, two in the entorhinal cortex and two in the hip-pocampus). Decreases were also observed in the visually respon-sive but nonselective neurons (one neuron in the amygdala, fivein entorhinal cortex and three in hippocampus).
Most of the neurons responded during the stimulus-pre-sentation period, but there were some that responded when thestimulus was removed. To address this, we computed for allneurons, within the 2000 ms after stimulus onset, the numberof spikes in a 600-ms interval centered on the peak of theresponse and statistically analyzed the responses as describedabove. There were eight selective neurons (four in hippocam-
Fig. 3. Visually selective neuron inthe entorhinal cortex. (a) Post-stim-ulus time histogram (PSTH) of theresponses of a neuron in the rightentorhinal cortex. The rasters andhistograms are aligned to the onsetof the stimulus. The stimulus was pre-sented between t = 0 and t = 1000 ms(indicated by dashed vertical lines ineach histogram). Responses wereaveraged for all stimuli within a givencategory using a bin size of 200 ms.The dashed horizontal line indicatesthe mean firing rate over the wholeexperiment (10.3 spikes/s). The cate-gory and the number of stimuli pre-sented in each category are indicatedat the top of each histogram. The fir-ing rate in the 100–1000 ms intervalupon presentation of a picture of ananimal was significantly different fromthat in the –1000 to 0 ms baselinepreceding the stimulus onset (p < 10–4).The probability of error (pe) from theROC analysis (Fig. 6) was 0.21.There were only five presentations offood items in this experiment, andthey were not included in the graph.The neuron did not respond to fooditems based on these five repetitions.(b) Distribution of firing rates duringpresentation of pictures of animals.Histogram distribution of mean firingrate of response in each trial, bin sizeof 1.5 spikes/s. There is no clear signof bimodality in the distribution. (c) PSTHs showing the responses ofthis neuron to each individual stimu-lus within the category of animals.Although the responses vary fromone stimulus to another, the neuronresponds to all stimuli within this category (comparison with baseline, p < 0.01). An analysis of variance comparing the responses to different indi-vidual animals did not yield significance (p > 0.4). The scale is the same as in (a).
Emotional face (100)
Spi
kes/
s
Object (51) Spatial (105)
-1 0 1 2 -1 0 1 2 -1 0 1 2 -1 0 1 2
Animal (46)
0
10
20
30
0
10
20
30Car (17)
0
10
20
30
0
10
20
30Face drawing (134)
0
10
20
30
0
10
20
30Famous face (100)
-1 0 1 2 -1 0 1 2 -1 0 1 2 -1 0 1 2
0
10
20
30
0
10
20
30Pattern (54)
Time (s)
0 10
10
20
30
spik
es/s
0 10
10
20
30
0 10
10
20
30
0 10
10
20
30
0 10
10
20
30
0 10
10
20
30
0 10
10
20
30
0
5
10
15
Pro
port
ion
(%)
0 10 3020FR (spikes/s)
Spi
kes/
s
a
b c
© 2000 Nature America Inc. • http://neurosci.nature.com©
200
0 N
atu
re A
mer
ica
Inc.
• h
ttp
://n
euro
sci.n
atu
re.c
om

nature neuroscience • volume 3 no 9 • september 2000 949
pus, three in entorhinal cortex and one in the amygdala) thatshowed a statistically significant late response and were notdetected with the previous analysis.
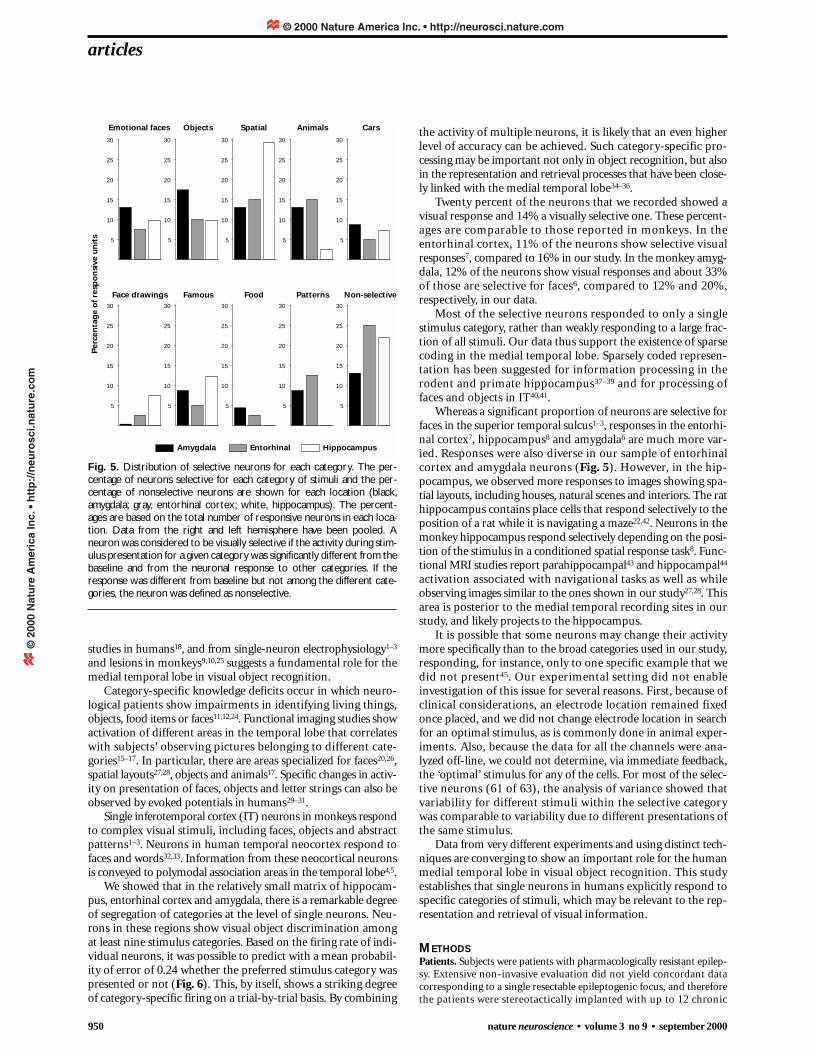
Under the assumption that there is no preference in theprevalence of selectivity for any of the nine different stimuluscategories, the number of selective neurons within any one areashould be uniformly distributed among these categories. Wetested this hypothesis using a χ2 test23. We obtained χ2 valuesof 6.0, 9.6 and 29.5 for the amygdala, entorhinal cortex andhippocampus respectively (Fig. 5). The p values were over 0.25for the amygdala and entorhinal cortex but less than 10–3 forthe hippocampus. In the hippocampus, we observed a smallrelative proportion of responses to animals, food items andpatterns and, interestingly, a relatively high number of neu-rons responding to spatial layouts (Fig. 5). No significant dif-ference was observed in a direct comparison of the responseof any of these neurons to house facades versus natural scenes(Wilcoxon, p > 0.05).
Among the selective neurons, there were 2 that yielded p < 0.05(and 3 more with a p value between 0.05 and 0.1) in the ANOVAanalysis of specificity to individual stimuli within the selective cat-egory. These neurons responded more strongly to one to three ofthe individual stimuli within the selective category. These wereexcluded from the number of selective neurons in Table 1.
articles
We computed the latency and the duration of the evokedactivities for all neurons showing a visual response (Methods).The latencies ranged from 52 to 695 ms and the durations from53 to 1190 ms (Table 1). There was no significant differenceamong the amygdala, entorhinal cortex and hippocampus ineither of these two variables (ANOVA, p > 0.1).
Classification by an ideal observerWe assessed how well an ideal observer could discriminate, basedon the response of an individual neuron, whether a stimulusbelonged to the category for which the neuron was selective ornot. We computed pe, the probability of misclassifying a stimulusbased on the firing rate, using a classical optimal decision pro-cedure (ROC analysis; Methods and Fig. 6a–c). The value of pe
can range from 0 to 0.5, with pe = 0.5 indicating chance perfor-mance and pe = 0 indicating perfect classification. Our pe valuesranged from 0.13 to 0.32 (0.22 ± 0.06, mean ± s.d.) in the amyg-dala, 0.04 to 0.44 (0.23 ± 0.10) in the entorhinal cortex and 0.08to 0.47 (0.23 ± 0.10) in the hippocampus (Fig. 6d–f).
DISCUSSIONIncreasingly complex stimulus attributes are represented fromthe retina to the higher visual areas. Evidence from neurolo-gy11,12,24, functional brain imaging15–17,20 and evoked-potential
Fig. 4. Visually selective neuron in thehippocampus. (a) PSTH of theresponses of a neuron in the rightanterior hippocampus. The notationand symbols are the same as in theprevious figure. The firing rate in the100–1000 ms interval on presentationof a drawing or a photo of a famousface was significantly different fromthat in the –1000 to 0 ms baselinepreceding stimulus onset (p < 0.001).Note that this neuron does notrespond to just any face, as it fails tochange its activity to the unknownactors depicting emotional expres-sions (top, left histogram). The meanfiring rate over the whole experimentwas 3.1 spikes/s, and the pe was 0.19.There were only five presentations offood items in this experiment, andthey were not included in the graph.The neuron did not respond to fooditems based on these five repetitions.(b) Distribution of firing rates duringpresentation of famous faces.Histogram distribution of mean firingrate of responses in each trial, bin sizeof 1.5 spikes/s. There is no clear signof bimodality in the distribution. (c) PSTHs showing the responses ofthis neuron to each individual stimuluswithin the category of photos offamous faces. Although the responsesvary from one stimulus to another,the neuron responds to all stimuliwithin this category (comparison withbaseline, p < 0.05). An ANOVA com-paring the responses to different indi-vidual famous faces did not yieldsignificance (p > 0.2). The scale is thesame as in (a).
Emotional face (100)
Spi
kes/
s
Object (51) Spatial (105)
-1 0 1 2 -1 0 1 2 -1 0 1 2 -1 0 1 2
Animal (46)
0
5
10
15
0
5
10
15Car (17)
0
5
10
15
0
5
10
15Face drawing (134)
0
5
10
15
0
5
10
15Famous face (100)
-1 0 1 2 -1 0 1 2 -1 0 1 2 -1 0 1 2
0
5
10
15
0
5
10
15Pattern (54)
Time (s)
Spi
kes/
s
0 1 0 1 0 1 0 1
0 1 0 1 0 1 0 1
0
5
10
15
0
5
10
15
0 1
0
5
10
15
0
5
10
15
0
5
10
15
0 1
0
5
10
15
0
5
10
15
0
5
10
15
0 1
0
5
10
15
0
5
10
15
0
5
10
15
0 5 10 15 200
5
10
15
20
FR (spikes/s)
Pro
port
ion
spik
es/s
a
b c
© 2000 Nature America Inc. • http://neurosci.nature.com©
200
0 N
atu
re A
mer
ica
Inc.
• h
ttp
://n
euro
sci.n
atu
re.c
om
950 nature neuroscience • volume 3 no 9 • september 2000
articles
studies in humans18, and from single-neuron electrophysiology1–3
and lesions in monkeys9,10,25 suggests a fundamental role for themedial temporal lobe in visual object recognition.
Category-specific knowledge deficits occur in which neuro-logical patients show impairments in identifying living things,objects, food items or faces11,12,24. Functional imaging studies showactivation of different areas in the temporal lobe that correlateswith subjects’ observing pictures belonging to different cate-gories15–17. In particular, there are areas specialized for faces20,26,spatial layouts27,28, objects and animals17. Specific changes in activ-ity on presentation of faces, objects and letter strings can also beobserved by evoked potentials in humans29–31.
Single inferotemporal cortex (IT) neurons in monkeys respondto complex visual stimuli, including faces, objects and abstractpatterns1–3. Neurons in human temporal neocortex respond tofaces and words32,33. Information from these neocortical neuronsis conveyed to polymodal association areas in the temporal lobe4,5.
We showed that in the relatively small matrix of hippocam-pus, entorhinal cortex and amygdala, there is a remarkable degreeof segregation of categories at the level of single neurons. Neu-rons in these regions show visual object discrimination amongat least nine stimulus categories. Based on the firing rate of indi-vidual neurons, it was possible to predict with a mean probabil-ity of error of 0.24 whether the preferred stimulus category waspresented or not (Fig. 6). This, by itself, shows a striking degreeof category-specific firing on a trial-by-trial basis. By combining
the activity of multiple neurons, it is likely that an even higherlevel of accuracy can be achieved. Such category-specific pro-cessing may be important not only in object recognition, but alsoin the representation and retrieval processes that have been close-ly linked with the medial temporal lobe34–36.
Twenty percent of the neurons that we recorded showed avisual response and 14% a visually selective one. These percent-ages are comparable to those reported in monkeys. In theentorhinal cortex, 11% of the neurons show selective visualresponses7, compared to 16% in our study. In the monkey amyg-dala, 12% of the neurons show visual responses and about 33%of those are selective for faces6, compared to 12% and 20%,respectively, in our data.
Most of the selective neurons responded to only a singlestimulus category, rather than weakly responding to a large frac-tion of all stimuli. Our data thus support the existence of sparsecoding in the medial temporal lobe. Sparsely coded represen-tation has been suggested for information processing in therodent and primate hippocampus37–39 and for processing offaces and objects in IT40,41.
Whereas a significant proportion of neurons are selective forfaces in the superior temporal sulcus1–3, responses in the entorhi-nal cortex7, hippocampus8 and amygdala6 are much more var-ied. Responses were also diverse in our sample of entorhinalcortex and amygdala neurons (Fig. 5). However, in the hip-pocampus, we observed more responses to images showing spa-tial layouts, including houses, natural scenes and interiors. The rathippocampus contains place cells that respond selectively to theposition of a rat while it is navigating a maze22,42. Neurons in themonkey hippocampus respond selectively depending on the posi-tion of the stimulus in a conditioned spatial response task8. Func-tional MRI studies report parahippocampal43 and hippocampal44
activation associated with navigational tasks as well as whileobserving images similar to the ones shown in our study27,28. Thisarea is posterior to the medial temporal recording sites in ourstudy, and likely projects to the hippocampus.
It is possible that some neurons may change their activitymore specifically than to the broad categories used in our study,responding, for instance, only to one specific example that wedid not present45. Our experimental setting did not enableinvestigation of this issue for several reasons. First, because ofclinical considerations, an electrode location remained fixedonce placed, and we did not change electrode location in searchfor an optimal stimulus, as is commonly done in animal exper-iments. Also, because the data for all the channels were ana-lyzed off-line, we could not determine, via immediate feedback,the ‘optimal’ stimulus for any of the cells. For most of the selec-tive neurons (61 of 63), the analysis of variance showed thatvariability for different stimuli within the selective categorywas comparable to variability due to different presentations ofthe same stimulus.
Data from very different experiments and using distinct tech-niques are converging to show an important role for the humanmedial temporal lobe in visual object recognition. This studyestablishes that single neurons in humans explicitly respond tospecific categories of stimuli, which may be relevant to the rep-resentation and retrieval of visual information.
METHODSPatients. Subjects were patients with pharmacologically resistant epilep-sy. Extensive non-invasive evaluation did not yield concordant datacorresponding to a single resectable epileptogenic focus, and thereforethe patients were stereotactically implanted with up to 12 chronic
Fig. 5. Distribution of selective neurons for each category. The per-centage of neurons selective for each category of stimuli and the per-centage of nonselective neurons are shown for each location (black,amygdala; gray, entorhinal cortex; white, hippocampus). The percent-ages are based on the total number of responsive neurons in each loca-tion. Data from the right and left hemisphere have been pooled. Aneuron was considered to be visually selective if the activity during stim-ulus presentation for a given category was significantly different from thebaseline and from the neuronal response to other categories. If theresponse was different from baseline but not among the different cate-gories, the neuron was defined as nonselective.
Emotional faces
Per
cent
age
of r
espo
nsiv
e un
its
Objects Spatial Animals Cars
5
10
15
20
25
30
5
10
15
20
25
30
Face drawings
5
10
15
20
25
30
5
10
15
20
25
30
Famous
5
10
15
20
25
30
5
10
15
20
25
30
Food
5
10
15
20
25
30
5
10
15
20
25
30
Patterns
5
10
15
20
25
30
5
10
15
20
25
30
Non-selective
Amygdala Entorhinal Hippocampus
Emotional faces Objects Spatial Animals Cars
Face drawings Famous Food Patterns Non-selective
Amygdala Entorhinal Hippocampus
Per
cen
tag
e o
f re
spo
nsi
ve u
nit
s
© 2000 Nature America Inc. • http://neurosci.nature.com©
200
0 N
atu
re A
mer
ica
Inc.
• h
ttp
://n
euro
sci.n
atu
re.c
om

nature neuroscience • volume 3 no 9 • september 2000 951
articles
intracranial depth electrodes for one to twoweeks to determine the focus of their seizuresfor possible surgical resection21,46. Throughthe lumen of the electrodes, up to 8microwires (40 µm diameter) were inserted.The surgeries were performed by I.F. All stud-ies described here conformed with the guide-lines of the Medical Institutional ReviewBoard at UCLA. The present study describesdata from 11 subjects (6 males and 5 females;8 right-handed and 3 left-handed; 24 to 48years old).
The sites of implantation of the electrodeswere based exclusively on clinical criteria. Thelocation of the electrodes was verified bystructural MR images obtained before remov-ing the electrodes (Fig. 1). Individualmicrowires extended approximately 4 mmfrom the tip, lying in a cone with an openingangle of less than 45 degrees.
We report here the activity of neurons forall the probes located in the medial temporallobe. Neurons from anterior (85%), middle(10%) and posterior (5%) parts of the hip-pocampus were pooled together as hip-pocampus neurons. Most neurons in theamygdala were in the basolateral nuclear com-plex. Our MR resolution did not allow us toaccurately determine in which CA fields thehippocampal probes were placed or what layerof the entorhinal cortex we recorded from.
The information recorded during seizuresfrom the depth electrodes was used to localizethe seizure focus46. Eighty-five percent ofrecorded neurons were outside the clinicallydetermined zone of seizure onset (that is, eitherin the other hemisphere or in a different brainarea on the same side). Ninety-four percent ofresponsive neurons were outside the seizurefocus. Because we did not observe any differ-ences in their waveforms, firing rates, interspikeinterval distributions or response properties,all neurons were included in Table 1. The per-centage of responsive neurons would increasefrom 20% to 22% if we excluded neurons with-in the seizure focus.
Experimental protocol. A series of images wasshown on a monitor at an approximate size of 5 degrees of visual angle(Fig. 2). Each picture was repeated 4–10 times (depending on time con-straints), and there was a total of up to 600 presentations; the order ofpresentation of the stimuli was random. The number of different indi-vidual stimuli per category ranged from 3 to 25 (7.2 ± 4.6, mean ± s.d.).Each picture was presented for 1000 ms. In the first two patients, stim-uli from only three different categories were presented (emotional faces,objects and spatial layouts). Immediately after the picture disappeared,there was a tone that indicated that the subject had to respond whetherthe picture was a human face or not by pressing a button. This was doneto engage the subject’s attention and to verify that he was seeing thepictures. Trials in which subjects made an error (mean percentage cor-rect 97 ± 1%) or in which the subjects moved were discarded from sub-sequent analysis. The behavioral response occurred on average 472 ±201 ms after stimulus offset.
Recordings. Data from each of the recorded microwires were amplifiedand high-pass filtered (with a corner frequency of 300 Hz), A/D con-verted and stored for off-line spike sorting using Experiment Workbenchdata acquisition software (Datawave, Denver, Colorado). Note thatbecause the microelectrodes were chronically implanted, we could notfurther select neurons by moving the electrodes, as is common in mon-
key experiments. We analyzed all spikes from all neurons we detected.Spikes from single neurons were discriminated from the extracellular
recordings based on the height, width, peak voltage and other parametersof the waveforms using a manual cluster-cutting method implementedin Datawave. For each isolated neuron, we determined the fraction of allspikes that were within 2 ms of each other. If this fraction exceeded 2%,the data were discarded because of possible contamination by firing frommore than one neuron.
In some cases, we recorded from the same microwires on separate days(presenting different sets of pictures from the same categories). Becauseof various constraints, we often could not be sure that a neuron record-ed on one day was identical to a neuron recorded on another day. Of our427 neurons, 128 (30%) were recorded on consecutive days. If we assumethat all 128 neurons are identical across days, the total number of neu-rons reduces to 299, and the percentage of responsive neurons increas-es from 20% (85 of 427) to 23% (70 of 299).
Data analysis. For each neuron, we computed histograms locked to thestimulus presentation times (post-stimulus time histograms, PSTHs) byaveraging the neuronal responses for all stimuli within each category. Wealso compared all color versus non-color pictures; we found only twoneurons with a statistically significant enhanced response to color stim-uli. To assess the significance of the response to different categories of
Fig. 6. ROC analysis and pe distribution. (a) Distribution of firing rates for the neuron shown in Fig. 3 for the preferred category (top, animals) and non-preferred category (bottom, all other cate-gories). Bin size, 1.5 spikes/s. These represent the conditional probability distributions P(f | stim ∈ pre-ferred category) and P(f | stim ∉ preferred category), where f denotes the firing response computed inthe 100–1000 ms interval and stim indicates the stimulus. (b) ROC analysis. Each stimulus is classifiedinto the preferred category if the firing rate during the 100–1000 ms interval is above a given thresh-old T. The probability of correctly classifying a stimulus (PCD) is plotted as a function of the probabilityof making a false alarm (PFA). This was calculated for successive values of the threshold T by integratingthe tails of the two distributions: P(f > T | stim ∈ preferred cat.) and P(f > T | stim ∉ preferred cat.). Thedashed line indicates chance performance (PCD = PFA). The dots indicate the actual data using numer-ical integration, whereas the continuous line indicates the values after assuming a Gaussian distribu-tion of firing rates. (c) The overall probability of error, perror(T) = 1/2 PFA (T) + 1/2 (1–PCD(T)) is plottedas a function of the probability of false alarm. The classification performance of the neuron based onthe firing rate was characterized by the minimum in this curve, pe (indicated by an arrow). (d–f) Distribution of pe for neurons in each of the three locations. Bin size, 0.03.
0
5
10
15 Pref.
0 10 20 300
5
10
15
Firing rate (spikes/s)
Pro
port
ion
(%)
Non-Pref.
0 0.5 10
0.2
0.4
0.6
0.8
1
PFA
PC
D
0 0.5 10
0.1
0.2
0.3
0.4
0.5
PFA
Per
ror
↑
pe
0 0.2 0.40
5
10
15
20
25
30P
ropo
rtio
n (%
)
Amygdala
0 0.2 0.40
5
10
15
20
25
Entorhinal
0 0.2 0.40
5
10
15
20
Hippocampus
pe
a
fed
cb
© 2000 Nature America Inc. • http://neurosci.nature.com©
200
0 N
atu
re A
mer
ica
Inc.
• h
ttp
://n
euro
sci.n
atu
re.c
om

952 nature neuroscience • volume 3 no 9 • september 2000
visual stimuli, we ran a series of statistical comparisons. For a neuron tobe considered visually selective for a specific category, it had to meet threerequirements. First, the neuronal response pooled over all stimuli belong-ing to the same category had to show a different firing rate, that is, loweror higher, during the time of presentation of the image than during thepreceding baseline. The firing rate during image presentation was com-puted in the interval 100 ms ≤ t < 1000 ms. (The lower boundary of 100 ms was chosen because most neurons showed latencies above 100 ms.) The baseline before stimulus presentation was computed in theinterval –1000 ms ≤ t < 0 ms. Significance was assessed both by a two-tailed t-test and a non-parametric Wilcoxon rank-sum test23. Becausethe results from both tests were very similar, the p values reportedthroughout the text for pairwise comparisons correspond to those fromthe non-parametric test. Second, a one-way analysis of variance (ANOVA)during the 100–1000 ms interval after stimulus onset, assessing whetherthere were differences in firing rate among the different categories, had toshow a significant p-value (< 0.05). In this analysis, stimuli were pooledaccording to the category they belonged to. Third, subsequent pairwisecomparisons between the activity during this interval for the putativeselective category and the rest of the categories had to show a statistical-ly significant change (Wilcoxon rank sum test, < 0.05).
Although we used a significance criterion of 0.05, most responsiveneurons showed p values that were less than 0.01 (Results). Our analy-sis encompassed both increases and decreases in firing rate.
If the ANOVA test failed to indicate a significant difference betweencategories, but the activity for 75% of the stimulus categories was sig-nificantly different from the baseline activity (that is, the first criterionwas met but not the second), we labeled the neuron as visually responsivebut nonselective.
For the neurons that showed visual selectivity, we further studied thedegree of specificity of the responses. We computed the distribution offiring rates for the selective category to assess whether it was a polymodaldistribution. We also computed an analysis of variance (both a para-metric analysis23 as well as a non-parametric analysis using a bootstrapprocedure47) to compare the variance to different individual stimuli with-in the same category to the variance to repeated presentations of the samestimulus.
It is reported that neurons can respond to visual stimuli with a longdelay even after the stimulus disappears21,48,49. To study these cases, weanalyzed the responses in an interval of 600 ms centered on the responsepeak. To estimate the time of occurrence of the peak, we computed anestimation of the spike density function (sdf) for each category of stim-uli by convolving the spike trains with a Gaussian of fixed width of 100 msand then averaging over repetitions.
We computed the latency and duration of the responses from the sdffor each category. The latency was defined as the first time value on whichfive consecutive bins of the sdf yielded a value that was beyond two s.d. ofthe mean response before stimulus presentation. In analogous fashion,the end of the response was defined as the first time point at which fiveconsecutive bins of the sdf yielded a value not different from baselineafter the latency value.
To discriminate whether the neurons showed significant activity relat-ed to the behavioral response, we did two additional analyses. First, wecomputed histograms of all the neuronal responses locked to the timeat which the subjects pressed the button by averaging over all stimuli.We then computed whether there was a significant difference in theresponse in the interval 300 ms before and 300 ms after the button waspressed. This interval was chosen so that it would not overlap on averagewith the periods of visual presentation. We found four neurons (three inthe amygdala, one in the hippocampus) for which the response beforethe button press was significantly different from that after the buttonpress and also from that during the baseline –1000 to 0 ms interval (1-way ANOVA, p < 0.05; pairwise comparisons, p < 0.05). None ofthese neurons was visually responsive. We also found 2 neurons thatshowed an increased activity in a 600-ms window around the responsecompared to the baseline (Wilcoxon test, p < 0.05). Neither of theseneurons was visually responsive.
When computing the average neuron activity in response to all humanfaces (emotional faces, drawings and photos of famous faces), weobserved 10 neurons (5 in the hippocampus, 3 in the entorhinal cortex,
articles
2 in the amygdala) for which the activity in the 100–1000 ms interval forall face stimuli was significantly larger than the baseline activity and thanthe response for non-face stimuli (1-way ANOVA, p < 0.05; pairwisecomparisons, p < 0.05). However, for some of these neurons (for exam-ple, Fig. 4a), the response was selective for some faces and not others.
For those neurons that showed visual selectivity for stimuli withinspecific categories, we also addressed the question of how well an idealobserver could estimate which category the stimulus belonged to byobserving the firing rate. To quantify the classification performance ofthe neurons, we used an ROC analysis as used in signal-detection theo-ry and psychophysics experiments50. For each visually selective neuron,we computed the distribution of firing rates for the preferred stimuli andthe non-preferred stimuli (the remaining categories; Fig. 6a). From thedistribution of firing rates we evaluated, by sliding a threshold T overthe whole range of firing rates, the probability of correct detection (PCD)and the probability of false alarm (PFA). Assuming chance performance,PCD = PFA (Fig. 6b, dashed line). The departure from the diagonal showsthe possibility of discriminating between the preferred and non-pre-ferred categories. The probability of misclassification plotted against theprobability of false alarm can be obtained as
perror (T) = 1/2 PFA (T) + 1/2 (1 – PCD(T))
The overall probability of error, pe, is then defined as the minimumvalue of this function (arrow in Fig. 6c). A value of pe = 1/2 correspondsto chance performance, whereas a value of pe = 0 indicates that it is pos-sible to predict with perfect accuracy based on the number of spikeswhether the specified category was presented or not.
Throughout the manuscript, values are given as mean ± standard devi-ation (s.d.).
ACKNOWLEDGEMENTSThis work was supported by grants from NIH (to I.F.), the Keck Foundation (to
C.K.) and the Center for Consciousness Studies, University of Arizona (to I.F.
and C.K.). We would like to thank D. Rozenfarb and M. Zirlinger for
suggestions and reading the manuscript and Peter Steinmetz for general discus-
sion. We wish to acknowledge Tony Fields, Jack Morrow, Eve Isham, Charles
Wilson, Rick Staba, Eric Behnke and Anatol Bragin for help with the recordings.
RECEIVED 16 JUNE; ACCEPTED 18 JULY 2000
1. Logothetis, N. K. & Sheinberg, D. L. Visual object recognition. Annu. Rev.Neurosci. 19, 577–621 (1996).
2. Tanaka, K. Inferotemporal cortex and object vision. Annu. Rev. Neurosci. 19,109–139 (1996).
3. Gross, C. G. How inferior temporal cortex became a visual area. Cereb. Cortex5, 455-469 (1994).
4. Suzuki, W. A. Neuroanatomy of the monkey entorhinal, perirhinal andparahippocampal cortices: Organization of cortical inputs andinterconnections with amygdala and striatum. Sem. Neurosci. 8, 3–12 (1996).
5. Saleem, K. S. & Tanaka, K. Divergent projections from the anteriorinferotemporal area TE to the perirhinal and entorhinal cortices in themacaque monkey. J. Neurosci. 16, 4757–4775 (1996).
6. Leonard, C. M., Rolls, E. T., Wilson, F. A. W. & Baylis, G. C. Neurons in theamygdala of the monkey with responses selective for faces. Behav. Brain. Res15, 159–176 (1985).
7. Suzuki, W., Miller, E. & Desimone, R. Object and place memory in themacaque entorhinal cortex. J. Neurophysiol. 78, 1062–1081 (1997).
8. Miyashita, Y., Rolls, E. T., Cahusac, P. M. B., Niki, H. & Feigenbaum, J. D.Activity of hippocampal formation neurons in the monkey related to aconditional spatial response task. J. Neurophysiol. 61, 669–678 (1989).
9. Mishkin, M. Memory in monkeys severely impaired by combined but notseparate removal of amygdala and hippocampus. Nature 273, 297–298(1978).
10. Meunier, M., Bachevaoer, J., Mishkin, M. & Murray, E. A. Effects on visualrecognition of combined and separate ablations of the entorhinal andperirhinal cortex in rhesus monkeys. J. Neurosci. 13, 5418–5432 (1993).
11. Tranel, D., Damasio, H. & Damasio, A. Face agnosia and the neural substratesof memory. Annu. Rev. Neurosci. 13, 89–109 (1990).
12. Warrington, E. & McCarthy, R. Categories of knowledge — Furtherfractionations and an attempted integration. Brain 110, 1273–1296 (1987).
13. Fried, I., Mateer, C., Ojemann, G., Wohns, R. & Fedio, P. Organization ofvisuospatial functions in human cortex. Brain 105, 349–371 (1982).
© 2000 Nature America Inc. • http://neurosci.nature.com©
200
0 N
atu
re A
mer
ica
Inc.
• h
ttp
://n
euro
sci.n
atu
re.c
om
nature neuroscience • volume 3 no 9 • september 2000 953
32. Ojemann, J. G., Ojemann, G. A. & Lettich, E. Neuronal activity related tofaces and matching in human right nondominant temporal cortex. Brain115, 1–13 (1992).
33. Ojemann, G. A., Ojemann, S. G. & Fried, I. Lessons from the human brain:neuronal activity related to cognition. The Neuroscientist 4, 285–300 (1998).
34. Scoville, W. B. & Milner, B. Loss of recent memory after bilateralhippocampal lesions. J. Neurol. Neurosurg. Psychiatry. 20, 11–21 (1957).
35. Penfield, W. & Milner, B. Memory deficit produced bilateral lesions in thehippocampal zone. Arch. Neurol. Psychol. 79, 475–479 (1958).
36. Zola-Morgan, S. & Squire, L. R. Neuroanatomy of memory. Annu. Rev.Neurosci. 16, 547–563 (1993).
37. McNaughton, B. L. & Nadel, L. in Neuroscience and Connectionist Theory (ed.Seifert, W.) 1–64 (Academic, New York, 1990).
38. Alvarez, P. & Squire, L. R. Memory consolidation and the medial temporallobe: a simple network model. Proc. Natl. Acad. Sci. USA 91, 7041–7045 (1994).
39. Treves, A. & Rolls, E. T. Computational analysis of the role of thehippocampus in memory. Hippocampus 4, 374–391 (1994).
40. Young, M. P. & Yamane, S. Sparse population coding of faces in the inferiortemporal cortex. Science 256, 1327–1331 (1992).
41. Logothetis, N. K. & Pauls, J. Psychophysical and physiological evidence forviewer-centered object representations in the primate. Cereb. Cortex 3,270–288 (1995).
42. Muller, R. A quarter of a century of place cells. Cell 17, 813–822 (1996).43. Aguirre, G. K., Detre, J. A., Alsop, D. C. & D’Esposito, M. The
parahippocampus subserves topographical learning in man. Cereb. Cortex 6,823–829 (1996).
44. Maguire, E. A. et al. Knowing where and getting there: a human navigationnetwork. Science 280, 921–924 (1998).
45. Heit, G., Smith, M. E. & Halgren, E. Neural encoding of individual wordsand faces by the human hippocampus and amygdala. Nature 333, 773–775(1988).
46. Fried, I. et al. Cerebral microdialysis combined with single-neuron andelectroencephalographic recording in neurosurgical patients. J. Neurosurg.91, 697–705 (1999).
47. Efron, B. & Tibshirani, R. J. An Introduction to the Bootstrap (Chapman &Hall/CRC, London, 1993).
48. Yakovlev, V., Fusi, S., Berman, E. & Zohary, E. Inter-trial neuronal activity ininferior temporal cortex: a putative vehicle to generate long-term visualassociations. Nat. Neurosci. 1, 310–317 (1998).
49. Miyashita, Y. Neuronal correlate of visual associative long-term memory inthe primate temporal cortex. Nature 335, 817–820 (1988).
50. Green, D. & Swets, J. Signal Detection Theory and Psychophysics (Wiley, NewYork, 1966).
articles
14. Penfield, W. & Jasper, H. Epilepsy and the Functional Anatomy of the HumanBrain (Little, Brown, Boston, 1954).
15. Treisman, A. M. & Kanwisher, N. G. Perceiving visually presented objects:recognition, awareness, and modularity. Curr. Opin. Neurobiol. 8, 218–226(1998).
16. Ishai, A., Ungerleider, L. G., Martin, A., Schouten, J. L. & Haxby, J. V.Distributed representation of objects in the human ventral visual pathway.Proc. Natl. Acad. Sci. USA 96, 9379–9384 (1999).
17. Martin, A., Wiggs, C. L., Ungerleider, L. G. & Haxby, J. V. Neural correlates ofcategory-specific knowledge. Nature 379, 649–652 (1996).
18. Allison, T. et al. Face recognition in human extrastriate cortex. J.Neurophysiol. 71, 821–825 (1994).
19. Nobre, A., Allison, T. & McCarthy, G. Word recognition in the humaninferior temporal lobe. Nature 372, 260–263 (1994).
20. Tong, F., Nakayama, K., Moscovitch, M., Weinrib, O. & Kanwisher, N.Response properties of the human fusiform face area. Cognit. Neuropsychol.17, 257–279 (2000).
21. Fried, I., MacDonald, K. A. & Wilson, C. Single neuron activity in humanhippocampus and amygdala during recognition of faces and objects. Neuron18, 753–765 (1997).
22. Wilson, M. A. & McNaughton, B. L. Dynamics of the hippocampal ensemblecode for space. Science 261, 1055–1058 (1993).
23. Keeping, E. S. Introduction to Statistical Inference (Dover, New York, 1995).24. Adolphs, R., Tranel, D., Damasio, H. & Damasio, A. Impaired recognition of
emotion in facial expressions following bilateral damage to the amygdala.Nature 372, 669–672 (1994).
25. Buckley, M. J. & Gaffan, D. Perirhinal cortex ablation impairs objectidentification. J. Neurosci. 18, 2268–2275 (1998).
26. Kanwisher, N., McDermott, J. & Chun, M. M. The fusiform face area: amodule in human extrastriate cortex specialized for face perception. J. Neurosci. 17, 4302–4311 (1997).
27. Epstein, R. & Kanwisher, N. A cortical representation of the local visualenvironment. Nature 392, 598–601 (1998).
28. Epstein, R., Harris, A., Stanley, D. & Kanwisher, N. The parahippocampalplace area: recognition, navigation, or encoding? Neuron 23, 115–125 (1999).
29. Allison, T., Puce, A., Spencer, D. & McCarthy, G. Electrophysiological studiesof human face perception. I: Potentials generated in occipitotemporal cortexby face and non-face stimuli. Cereb. Cortex 9, 415–430 (1999).
30. Klopp, J., Halgren, E., Marinkovic, K. & Nenov, V. Face-selective spectralchanges in the human fusiform gyrus. Clin. Neurophysiol. 110, 676–682 (1999).
31. Halgren, E., Raij, T., Marinkovic, K., Jousmaki, V. & Hari, R. Cognitiveresponse profile of the human fusiform face area as determined by MEG.Cereb. Cortex 10, 69–81 (2000).
© 2000 Nature America Inc. • http://neurosci.nature.com©
200
0 N
atu
re A
mer
ica
Inc.
• h
ttp
://n
euro
sci.n
atu
re.c
om