network analyses of psychopathology in cross-section
73
NETWORK ANALYSES OF PSYCHOPATHOLOGY IN CROSS-SECTION 1 Running head: NETWORK ANALYSES OF PSYCHOPATHOLOGY IN CROSS-SECTION Problems with centrality measures in psychopathology symptom networks: Why network psychometrics cannot escape psychometric theory Michael N. Hallquist Department of Psychology Penn State University Aidan G. C. Wright Department of Psychology University of Pittsburgh Peter C. M. Molenaar Department of Human and Family Studies Penn State University Accepted for publication in Multivariate Behavioral Research. Correspondence: Michael Hallquist, Department of Psychology, 140 Moore Building, University Park, PA 16801. [email protected]. This research was supported by grants from the National Institute of Mental Health to MNH (K01 MH097091) and AGCW (L30 MH101760). Keywords: network psychometrics, latent confounding, factor models, symptom co-occurrence
-
Upload
khangminh22 -
Category
Documents
-
view
3 -
download
0
Transcript of network analyses of psychopathology in cross-section

NETWORK ANALYSES OF PSYCHOPATHOLOGY IN CROSS-SECTION 1
Running head: NETWORK ANALYSES OF PSYCHOPATHOLOGY IN CROSS-SECTION
Problems with centrality measures in psychopathology symptom networks:
Why network psychometrics cannot escape psychometric theory
Michael N. Hallquist
Department of Psychology
Penn State University
Aidan G. C. Wright
Department of Psychology
University of Pittsburgh
Peter C. M. Molenaar
Department of Human and Family Studies
Penn State University
Accepted for publication in Multivariate Behavioral Research.
Correspondence: Michael Hallquist, Department of Psychology, 140 Moore Building, University Park, PA 16801. [email protected].
This research was supported by grants from the National Institute of Mental Health to MNH (K01 MH097091) and AGCW (L30 MH101760). Keywords: network psychometrics, latent confounding, factor models, symptom co-occurrence

NETWORK ANALYSES OF PSYCHOPATHOLOGY IN CROSS-SECTION 2
Abstract
Understanding patterns of symptom co-occurrence is one of the most difficult challenges in
psychopathology research. Do symptoms co-occur because of a latent factor, or might they
directly and causally influence one another? Motivated by such questions, there has been a surge
of interest in network analyses that emphasize the putatively direct relationships among
symptoms. In this critical paper, we highlight conceptual and statistical problems with using
centrality measures in cross-sectional networks. In particular, common network analyses assume
that there are no unmodeled latent variables that confound symptom co-occurrence. In
simulations that include latent variables, we demonstrate that closeness and betweenness are
vulnerable to spurious covariance among symptoms that connect subgraphs (e.g., diagnoses).
Furthermore, strength is redundant with factor loading in several cases. Finally, if a symptom
reflects multiple latent causes, centrality metrics reflect a weighted combination, undermining
their interpretability in empirical data. Our results suggest that it is essential for network
psychometric approaches to examine the evidence for latent variables prior to analyzing or
interpreting symptom centrality. Failing to do so risks identifying spurious relationships or
failing to detect causally important effects. Altogether, centrality measures do not provide solid
ground for understanding the structure of psychopathology when latent confounding exists.

NETWORK ANALYSES OF PSYCHOPATHOLOGY IN CROSS-SECTION 3
Introduction
One of the most difficult challenges faced by clinicians and researchers alike is how best
to conceptualize the co-occurrence of symptoms of psychopathology. Do certain symptoms co-
occur because they reflect an underlying clinical entity (i.e., a disease category) or a shared latent
trait (Krueger & Markon, 2006)? Or, do symptoms exacerbate and amplify each other, eventually
generating clinical states recognized as mental disorders (Cramer, Waldorp, van der Maas, &
Borsboom, 2010)? By extension, should the presumed underlying causes or the observed
symptoms be the primary focus of interventions? Motivated by such questions, there has been a
surge of interest in network analyses of psychopathology that could potentially reveal potentially
causal relationships among symptoms (Borsboom et al., 2016; Hofmann, Curtiss, & McNally,
2016).
The network perspective rests on a mutualism model in which symptoms directly and
reciprocally cause each other (Cramer et al., 2010; Van Der Maas et al., 2006). A central
assumption of this approach is that symptoms, as measured by single psychometric items or scale
scores, are the atomic units of psychopathology (Nesselroade & Molenaar, 2016). In much of the
network psychometrics literature, this conceptualization has been contrasted and placed in direct
contention with latent variable models — especially factor models — of psychopathology (e.g.,
McNally, 2012). This raises the question, do network analyses provide interpretable and novel
information relative to established latent variable models? In this critical review, we address this
important question, focusing particularly on the performance of symptom centrality measures in
data where latent variables underlie covariance patterns.
Although improving the taxonomy of mental illness is an important goal, we assert that
network analyses of cross-sectional symptom data rest on shaky ontological assumptions,

NETWORK ANALYSES OF PSYCHOPATHOLOGY IN CROSS-SECTION 4
emphasize data-driven algorithms over extant theory, and are limited in the novel information
they can provide. Specifically, through a series of simulations, we demonstrate that relative to
structural equation models (SEM), symptom (i.e., ‘node’) centrality metrics provide potentially
misleading and at times redundant information about the relationships among symptoms when a
common cause (e.g., an underlying disorder or trait) is present. Furthermore, we show that if
symptoms reflect multiple independent causes (e.g., a pathophysiological process and gender
bias in clinician judgment), nodal metrics reflect an unknown combination of these causes,
undermining their utility in empirical analyses. As we articulate below, such latent confounding
is likely to be present in most, if not virtually all, cross-sectional symptom data.
A Shift in Perspective
The pattern of covariance among symptoms both within and across disorders has
traditionally been described using factor models, often within an SEM framework (Forbush &
Watson, 2013; Kotov, 2011; Krueger, Chentsova-Dutton, Markon, Goldberg, & Ormel, 2003;
Sharp et al., 2015; Watson, 2005). One of the most widely replicated findings from this literature
is that the co-occurrence of mental disorders partly reflects two superordinate dimensions,
internalizing and externalizing, that serve as shared liability factors with potentially distinct
separable genetic and neurobiological substrates (Krueger & Markon, 2006; Salvatore et al.,
2014). Indeed, some studies have found that these broad dimensions, rather than specific
disorders, are better predictors of future psychopathology and negative health outcomes (e.g.,
Eaton et al., 2013).
By contrast, the network approach to psychopathology is built on a particle physics
metaphor (Marsman et al., 2018), such that within an individual, it is the direct, potentially
causal interactions among symptoms over time that putatively lead to the emergence and

NETWORK ANALYSES OF PSYCHOPATHOLOGY IN CROSS-SECTION 5
resolution of psychological problems. For example, an individual who experiences insomnia one
night is more likely to suffer from fatigue and malaise the next day. The key argument is that
mental illness is a dynamic phenomenon that involves activation of some symptoms, spread of
activation to other symptoms, and disorder states that ultimately achieve stability through mutual
reinforcement, even after triggering conditions have resolved (i.e., hysteresis; for additional
details on this account, see Borsboom, 2017). Hofmann and colleagues (2016, p. 598) provide a
useful synopsis: “Hence, a disorder is not the underlying cause of symptoms; it constitutes a
network of symptoms that interact in ways that tend to maintain themselves. Accordingly, a
stressful event does not activate an underlying entity called depression, which then causes the
emergence of symptoms. Rather, stressful events activate certain symptoms that, in turn, activate
other symptoms, and when the requisite number of symptoms occurs, an episode of disorder may
be diagnosable.” Although the motivation of network psychometrics is to understand dynamic
relationships among features of psychopathology over time, the data employed to test these
questions have largely been cross-sectional (Fried et al., 2018; Heeren, Jones, & McNally, 2018;
Kendler, Aggen, Flint, Borsboom, & Fried, 2018; McNally et al., 2015).
In a series of papers, scientists advocating a network psychometric approach to symptom
co-occurrence have highlighted potential problems with the ontology of diagnostic entities and
assumptions of conventional factor models (Borsboom & Cramer, 2013; Borsboom et al., 2016;
Fried & Cramer, 2017; Hofmann et al., 2016; McNally, 2012). For example, if fatigue occurs in
depression and anxiety disorders, it is possible that fatigue directly causes related problems such
as appetite loss or distractibility in both disorders. This causal effect of one symptom on another
could hold true without the need to invoke a latent variable such as a diagnosis or putative
dimension of psychopathology.

NETWORK ANALYSES OF PSYCHOPATHOLOGY IN CROSS-SECTION 6
In a recent methodological study, Marsman and colleagues (2018) demonstrated that the
Ising model, which is commonly used in network analyses of observed binary variables, is
statistically equivalent to some latent variable models from item response theory, particularly the
Rasch model and a multidimensional two-parameter logistic model. This builds on earlier
demonstrations that latent variable models can be transformed into directed network models
without latent variables that are equivalent in their statistical fit (Molenaar, 2003, 2010;
Molenaar, van Rijn, & Hamaker, 2007). Importantly, however, latent variable and network
models differ considerably in their conceptual accounts. As Marsman and colleagues note, the
statistical equivalence of some network and latent variable models suggests that, “the
associations can be interpreted to arise from a direct influence between variables or due to an
underlying and unobserved (set of) common cause(s)” (p. 31). In the case of equivalent models,
experimentally manipulating key variables in the model or adding instrumental variables can
help disambiguate alternative accounts (Pearl, 2009). Furthermore, additional research is needed
to clarify what forms of network and latent variable models are equivalent in order to develop a
deeper understanding of what conceptual models are tenable and distinct in psychopathology
data.
Summarizing Key Features of a Symptom Network Using Nodal Statistics
A detailed treatment of how to resolve the challenges of alternative conceptual models
that provide equivalent statistical fit is beyond the scope of this paper (for additional information,
see Pearl, 2009). We note, however, that the equivalencies between latent variable and network
models that have been identified to date exist at the level of the symptom covariance matrix (for
details, see Graphical and Latent Variable Models of Cross-Sectional Symptoms below). On the
other hand, empirical studies of symptom networks have primarily focused on nodal metrics

NETWORK ANALYSES OF PSYCHOPATHOLOGY IN CROSS-SECTION 7
from graph theory to explore whether particular symptoms are central in a network (e.g.,
McNally et al., 2015). Nodal metrics aggregate information from the overall covariance structure
to summarize the properties of one symptom relative to another. In this way, even if there are
cases in which network and latent variable models provide equivalent global fit, nodal centrality
estimates, by definition, provide local information about symptoms within a co-occurrence
network. Furthermore, nodal statistics are estimated from a given network structure and, thus, are
not isomorphic with formal parameters in latent variable models such as factor loadings.
Centrality within a symptom co-occurrence network, it has been argued, may help to
identify important clinical targets that play a crucial role in precipitating other problems or that
may be particularly salient indicators of a given disorder (Hofmann et al., 2016). For example,
the strength of a node is defined as the sum of its edge weights (i.e., partial correlations)1 to other
nodes:
𝑠" =$𝑊"&&
Other centrality metrics such as closeness and betweenness derive from the concept of
distance, which builds on the physical nature of many traditional graph theory applications,
including railways and computer networks (Newman, 2010). In association networks such as
those based on symptoms, the idea of network distance does not have a physical referent (e.g.,
number of miles of fiber optic cable), but instead reflects a quantitative summary of correlation
strength.
Nodal centrality metrics describe an important aspect of graph topology but are not
integrally linked to the estimation of the network itself. That is, metrics such as strength do not
1 We note that many network psychometric studies (e.g., Epskamp & Fried, 2018) have used the absolute value of the edges prior to computing nodal metrics including strength.

NETWORK ANALYSES OF PSYCHOPATHOLOGY IN CROSS-SECTION 8
reflect the likelihood of the data given the parameters and model. Rather, for continuous data, the
model-implied covariance matrix is usually derived from the Gaussian Graphical Model (GGM)
whose free parameters are partial correlations (i.e., edges) among symptoms. Given this
structure, we wish to underscore that graph metrics such as strength or closeness are secondary
statistics in that they build upon characteristics of the formal model parameters. Consequently, it
is not usually straightforward to estimate the uncertainty of a nodal statistic using asymptotic
theory, though this can partly be circumvented using nonparametric bootstrapping (Epskamp,
Borsboom, & Fried, 2018). By contrast, because the free parameters are typically of substantive
interest in SEM and estimation uncertainty is an integral part of maximum likelihood estimation,
it is straightforward to compare parameters or groups statistically.
The Ubiquity of Latent Variables in Taxonomy and Symptom Assessment
It is possible that at the level of ontology, symptoms directly and reciprocally cause one
another. If this is the case, then focusing on symptom centrality metrics as the primary target of
inference may help to clarify co-occurrence patterns. On the other hand, as noted above, there is
substantial evidence that symptoms of psychopathology can be viewed within a hierarchical
framework (Kotov et al., 2017; Markon, Krueger, & Watson, 2005) that conceptualizes broader
dimensions as the latent causes of symptoms. Furthermore, it is important to note that symptoms
themselves are often hypothetical constructs (e.g., anhedonia) that may have many plausible
realizations.
Setting aside these thorny ontological questions, the intellectual traditions and research
practices of both psychiatry and psychology provide reasons to be skeptical that trustworthy
symptom networks can be identified from extant measures without the need to invoke latent
variables. There is a rich history in psychometric theory (Nunnally & Bernstein, 1994) and test

NETWORK ANALYSES OF PSYCHOPATHOLOGY IN CROSS-SECTION 9
development (Clark & Watson, 1995) that builds on the idea of differentiating a hypothetical
construct from its measurable manifestations. In their classic text on construct validity, Cronbach
and Meehl (1955) argued that evidence for a hypothetical construct depends on defining key
concepts and their relationships to each other, articulating observable manifestations of these
concepts, and empirically testing whether the relationships among observables align with the
theory. Thus, in test construction, researchers typically build item pools that measure content
domains that emerge from theory, then use factor analysis to cull items that do not appear to
measure a domain well (e.g., weak primary loading or strong cross-loading; Loevinger, 1957).
Moreover, there is increasing public awareness about mental illness, particularly from a
biological perspective that emphasizes categorical diagnoses (Schomerus et al., 2012). This trend
is likely to influence response patterns on self-report symptom inventories insofar as respondents
may have a tendency to conceptualize their symptoms vis-à-vis a diagnostic construct. In short,
the result is that most, if not all, psychological tests have a strong degree of latent structure that
results from core principles of psychometric theory and/or public conceptions of mental illness.
Likewise, in defining the diagnostic criteria of mental disorders, the descriptive
psychiatry tradition of the mid-20th century (Feighner et al., 1972) shaped the psychometric
properties of the diagnostic manuals from DSM-III onward. Relative to earlier editions, the
DSM-III emphasized the psychometric reliability and validity of diagnoses and sought to
untether diagnosis from theories of etiology (Gunderson & Singer, 1975; Robins & Guze, 1970).
Although there are many problems with boundary overlap among disorders (e.g., Widiger &
Trull, 2007) and evidence in favor of dimensional over categorical taxonomy (Kotov et al.,
2017), the process of defining diagnoses in the DSM continues to depend in part on interrater
agreement and test-retest reliability of multi-item symptom inventories (Narrow et al., 2013;

NETWORK ANALYSES OF PSYCHOPATHOLOGY IN CROSS-SECTION 10
Regier et al., 2013). Thus, there is a high probability that clinician ratings of psychopathology
also have substantial latent structure that reflects both training practices in diagnosis and the
psychometric legacy of the diagnostic system.
In sum, whether it is items from psychometric scales or symptoms from diagnostic
interviews, these are the variables most often used in network analyses. As such, a latent
variable architecture of some sort may be inherent to the data, and network methods need to be
sensitive to such structure (cf. Spirtes & Zhang, 2016). If network psychometric analyses provide
erroneous or limited information about symptom networks in which latent confounding exists,
this could undermine the value of this approach.
The Current Study
Given the above concerns about potential latent confounding in cross-sectional symptom
data, our study sought to characterize the performance of nodal centrality metrics in cross-
sectional symptom data. More specifically, in simulations we examined how nodal metrics
derived from GGMs represent a variety of datasets whose structure reflects one or more latent
causes (i.e., factors). In line with the network psychometrics literature (e.g., Epskamp et al.,
2018), we examined three nodal centrality measures: strength, closeness, and betweenness.
Closeness is the sum of the shortest path lengths between a specific node and all other nodes.
Betweenness quantifies how often the shortest paths among all nodes traverse a given node (i.e.,
how much traffic flows through the node). Previous research has focused on symptoms that have
high betweenness as potentially serving a “bridging” role such that comorbidity between two
disorders may reflect a symptom that is in common between them (Cramer et al., 2010).
NETWORK ANALYSES OF PSYCHOPATHOLOGY IN CROSS-SECTION 11
Although there have been previous treatments of the alignment between latent variable
and network models (Epskamp, Kruis, & Marsman, 2017; Marsman et al., 2018; Marsman,
Maris, Bechger, & Glas, 2015), these have addressed a restricted set of models (e.g., the Rasch
model). In parallel, there has been recent interest and debate about whether networks are
reproducible within and across samples (Forbes, Wright, Markon, & Krueger, 2017; Fried et al.,
2018) and whether different symptom thresholds yield different conclusions about network
structure (Hoffman, Steinley, Trull, & Sher, 2018). Relative to these contributions, our study
provides a detailed characterization of nodal centrality measures, which have been the primary
focus in empirical studies. A secondary goal of our study was to compare formal SEM
parameters, particularly factor loadings, with centrality measures under a variety of conditions.
If nodal centrality metrics are directly relevant to inferring the clinical and theoretical
significance of specific symptoms, it is important to understand their sensitivity to different
sources of covariance. More specifically, the network perspective assumes that differences in
relative symptom centrality reflect particularly meaningful, distinct covariance patterns for
specific symptoms in the context of the broader covariance structure. For example, in a network
analysis of posttraumatic stress disorder (PTSD) symptoms, McNally and colleagues (2015)
found that hypervigilance had greater strength and closeness centrality than other symptoms.
From this, the authors inferred that hypervigilance may be a defining characteristic of PTSD that
has particularly strong, direct associations with other symptoms.
The validity of such inferences depends on, minimally, whether 1) centrality measures
are sensitive to the dominant sources of covariation in the data, 2) changes in symptom centrality
measures are proportional to changes in the underlying covariance structure, and 3) centrality
measures provide meaningful information about the relative importance of symptoms across a

NETWORK ANALYSES OF PSYCHOPATHOLOGY IN CROSS-SECTION 12
range of causal structures, including those that include latent variables. For instance, regarding
proportionality, if a centrality metric such as betweenness changes dramatically due to very small
differences in the covariance matrix (e.g., one cell decreases by 5%), this could undermine the
interpretability of centrality differences in empirical studies. By contrast, if there is a
proportional, monotonic relationship between changes in centrality measures and changes in
symptom-relevant covariance, this would bolster the argument that nodal centrality may have
conceptual centrality in understanding co-occurrence patterns. For example, if the correlation of
a candidate symptom with all other symptoms is increased by 10%, by definition, strength
centrality for the candidate will increase by 10%.
We conducted three latent structure simulations in an SEM framework in order to assess
the extent to which symptom centrality measures provide meaningful information about
symptom covariance patterns when the data contain at least one latent variable that confounds
bivariate relationships among symptoms. Importantly, our simulations were intended to provide
a set of test cases to examine how centrality measures varied as a function of unique versus
shared sources of covariance. Thus, we were explicitly interested in using simulations to
understand what inferences one might make in empirical data if one applied network
psychometric approaches (using current best practice recommendations; Epskamp et al., 2018;
Epskamp & Fried, 2018) to plausible symptom covariance patterns. This approach is unlike
many simulation studies that are motivated to understand the performance of an estimator or
model across a variety of conditions in which one examines differences between population
parameters and estimated statistics (e.g., Rhemtulla, Brosseau-Liard, & Savalei, 2012). We note
that the statistics of interest in our study — symptom centrality measures — are not part of the
NETWORK ANALYSES OF PSYCHOPATHOLOGY IN CROSS-SECTION 13
underlying population model (either factor models or graphical models) and, thus, do not have
groundtruth parameter values.
The first simulation sought to map the correspondence between nodal centrality metrics
and factor loadings. This builds on previous work arguing that centrality and factor loadings are
incommensurable statistics in symptom networks (Cramer et al., 2010), yet to our knowledge,
their relationship has not been examined in data generated by variants of the common factors
model. We hypothesized that strength, which reflects the sum of edge weights incident to a given
node, would be highly correlated with factor loadings in single- and multi-factor models. We
further anticipated that closeness and betweenness, which depend on measuring shortest path
lengths among nodes, would not show a strong correspondence with factor loadings in multi-
factor models due to the presence of relatively disconnected subgraphs. Finally, we examined the
extent to which centrality measures were affected by sampling variability that introduced small
correlations among items from different latent causes.
The second simulation focused on the effects of common variance due to latent factors
versus a specific bivariate relationship between two target psychometric items. This extends
from the network psychometrics notion of a “bridge” symptom that connects partially
nonoverlapping symptom clusters — here, conceptualized as distinct factors. We simulated
datasets along a specific-to-general gradient in order to test how centrality measures varied as a
function of the source of covariation. We hypothesized that strength would scale linearly along
this gradient such that it was maximized when the targeted node was explained solely as a
function of the latent factor. By contrast, we expected that allowing specific covariation between
items that loaded on different factors would increase their betweenness, consistent with the idea
of a bridge symptom. Extending the idea of proportional changes above, this simulation was also

NETWORK ANALYSES OF PSYCHOPATHOLOGY IN CROSS-SECTION 14
motivated to understand the form and magnitude of changes in centrality measures as a function
of linear changes in the specific-to-general covariance gradient between the two target
psychometric items.
The third simulation examined how network metrics from GGMs handle multiple latent
causes for a given psychometric item. This was motivated in part by many applications in latent
variable modeling, including how best to handle cross-loadings (Asparouhov, Muthén, & Morin,
2015), bifactor models (Reise, 2012), multi-trait multi-method analyses (Kenny & Kashy, 1992),
and mitigating response biases (McLarnon, Goffin, Schneider, & Johnston, 2016). Such
applications share an interest in modeling multiple sources of covariation such that substantively
interesting structural covariance relationships can be identified even in the presence of other
reasons for responses on psychometric tests. By contrast, the conditional independence
assumption in GGMs only permit unitary direct associations among observed items. We
hypothesized that network metrics would reflect a combination of latent causes, suggesting that
in empirical (as opposed to simulated) data, centrality cannot be interpreted in unambiguously
substantive terms.
Overview of Models and Simulation Methods
Graphical and Latent Variable Models of Cross-Sectional Symptoms. Both SEM and
network analyses of cross-sectional symptom data seek to represent the sample covariance
matrix, 𝐒, accurately while also minimizing the number of free parameters (i.e., maintaining
positive degrees of freedom). In SEM, the fit of a model is based on the discrepancy between 𝐒
and a model-implied covariance matrix, 𝚺(𝛉+), which reflects a set of structural equations across
conceptually distinct parameter matrices (for an overview, see Lei & Wu, 2007). The Gaussian
Graphical model (GGM) is the most common formal basis for networks composed of

NETWORK ANALYSES OF PSYCHOPATHOLOGY IN CROSS-SECTION 15
multivariate normal psychometric data (Epskamp, Rhemtulla, & Borsboom, 2017). More
specifically, GGMs capture the covariation among symptoms according to a set of edges (i.e.,
connections) that represent pairwise conditional association. That is, if two symptoms are
independent of each other (i.e., uncorrelated) after conditioning on all other symptoms, no edge
would be included in the graph. Mathematically, a GGM can be estimated by inverting and
standardizing the sample covariance matrix. This yields a partial correlation matrix, 𝐊+ , in which
each cell represents the conditional association of 𝑋" and 𝑋& net all other symptoms, 𝐗0"&. That
is, if a given cell is zero, then 𝑋" and 𝑋& are conditionally independent given the other nodes:
𝑋" ⊥ 𝑋&|𝐗0"&.
The prevailing approach to network analyses of cross-sectional symptom data builds on
network discovery algorithms (Friedman, Hastie, & Tibshirani, 2008; Lauritzen, 1999) that seek
to identify unique relationships among symptom pairs after accounting for all other symptoms
(Epskamp et al., 2018). As we will return to below, most algorithms assume that there is no
latent confounding that could explain relationships among nodes in the network (cf. Ogarrio,
Spirtes, & Ramsey, 2016). Furthermore, many algorithms such as the graphical least absolute
shrinkage and selection operator (GLASSO), assume that the underlying causal network is
sparse, such that the observed covariance matrix, 𝐒, can be explained by a fraction of partial
correlations among variables (Epskamp, Kruis, et al., 2017). Finally, most network models
reflect a data-driven approach to symptom covariance that does not incorporate the researcher’s
a priori knowledge about mental illness or the structure of the data (e.g., a distinction between
variables representing patient report versus clinician judgment).
Although there is a deep link between SEM and network models (Molenaar, 2010; Pearl,
2012), traditional SEM with latent variables has a fundamentally different view of the data

NETWORK ANALYSES OF PSYCHOPATHOLOGY IN CROSS-SECTION 16
generating processes. In particular, conditional independence relationships among symptoms and
the overall sparsity (i.e., the explicit omission of free parameters that could explain covariance)
largely reflect the researcher's a priori model specification. Furthermore, researchers using SEM
are exhorted to test and compare multiple models that instantiate distinct hypotheses about latent
and observed relationships in order to bolster their interpretation of the preferred model
(Tomarken & Waller, 2005).
Network models share the goal of obtaining a parsimonious, overidentified
approximation of symptom covariance, but achieve this by controlling the number of estimated
edges (i.e., partial correlations). In GGMs, the decision to estimate or omit a given edge between
nodes is typically based on algorithms that optimize a statistical fit criterion during a network
search. To reduce the influence of small, spurious relationships and handle the problem of more
parameters than observations (i.e., the p ≫ n problem; Johnstone & Titterington, 2009), it is
common to regularize the network estimation (Epskamp & Fried, 2018) by applying a penalty on
the number of non-zero edges. Here, we focus specifically on the GLASSO algorithm, which has
been promoted in this literature (Epskamp et al., 2018).
General Methods Used Across Simulations. All data were simulated from confirmatory
factor models using continuous, Gaussian indicators in an SEM framework. Across population
models, we standardized latent factors (i.e., variance = 1.0) and equated residual item variances.
Covariance matrices were simulated using the simsem (Jorgensen, Pornprasertmanit, Miller, &
Schoemann, 2017) package in R 3.4.0 (R Core Team, 2017) and fit within a confirmatory factor
analysis (CFA) framework using lavaan (Rosseel, 2012). In CFA analyses, we provided the
correct population model (i.e., no misspecification of the structural or measurement models), but
factor loadings, residual variances, and covariances (if relevant) were free parameters. The

NETWORK ANALYSES OF PSYCHOPATHOLOGY IN CROSS-SECTION 17
conditional associations among variables in each dataset were fit as a GGM using the EBIC +
GLASSO algorithm (EBICglasso function in the qgraph package; Epskamp, Cramer, Waldorp,
Schmittmann, & Borsboom, 2012).
The GLASSO algorithm depends on a tuning parameter, 𝜆, that controls the proportion of
edges that are shrunk to exactly zero according to an L1 penalty, thereby eliminating a free
parameter (Friedman et al., 2008). Here, we chose 𝜆 according to the extended Bayesian
Information Criterion (EBIC). Importantly, the EBIC + GLASSO algorithm (hereafter called
EBICGLASSO for simplicity) depends on a hyperparameter, 𝛾, that is chosen by the researcher
and controls the preference for simple versus complex models (Foygel & Drton, 2010).
Consistent with the defaults of the bootnet and qgraph packages, we used a 𝛾 of 0.5, which
assumes a sparser graph compared to lower values of 𝛾, resulting in higher specificity (i.e., more
likely to omit spurious associations; Epskamp et al., 2018).
Based on the absolute value of the estimated coefficients of the GGM — that is, the
conditional associations among items — we computed nodal statistics from the weighted
undirected graph using the igraph package (Csardi & Nepusz, 2006). Because closeness and
betweenness depend on the length of paths connecting nodes, it is necessary to provide an
operational definition of distance when the edge weights reflect association. Consistent with
previous work on correlation/communication networks (e.g., Latora & Marchiori, 2003), when
computing closeness and betweenness, we used the reciprocal of the partial correlation as the
edgewise distance metric.
Simulation 1: Correspondence of Centrality Metrics and Factor Loadings
The first simulation focused on the correspondence between nodal centrality metrics and
factor loadings across single- and multi-factor latent trait models.

NETWORK ANALYSES OF PSYCHOPATHOLOGY IN CROSS-SECTION 18
Methods
In Simulation 1, we generated data from factor models having 10 indicators per factor
and a sample size of 400. Factor loadings were drawn from a random uniform distribution
between .4 and .95. To ensure that our findings were not specific to a given set of random
loadings, we repeated this process 50 times, yielding 50 population models. For each population
model, we simulated 100 replication datasets and fit these using CFA (with no misspecifiation)
and GGM using the EBICGLASSO method. We then computed the relationships between nodal
centrality metrics — strength, closeness, and betweenness — and fitted factor loadings.
To illustrate how the number of factors and the correlation between them affects the
relationship between factor loadings and nodal centrality, we simulated data for one-, two-, and
three-factor models. In the two- and three-factor models, we assumed simple structure (i.e., no
cross-loadings); we further tested conditions in which factors were orthogonal (r = 0) or
moderately correlated (r = 0.4). In order to compare across models, we combined graph metrics
and factor loadings across all population models and replications. In multilevel regressions
conducted using the lme4 package (Bates, Mächler, Bolker, & Walker, 2015), we regressed a
given graph metric (e.g., strength) on the corresponding fitted factor loading, as well as the
number of factors (one, two, or three) and the correlation condition (orthogonal versus
correlated). We modeled crossed random effects of node, replication, and population model,
allowing random intercepts of each. To quantify the relative level of variance explained in nodal
statistics across predictors, we computed squared semipartial correlations following the approach
of Nakagawa & Schielzeth (2013).
Results

NETWORK ANALYSES OF PSYCHOPATHOLOGY IN CROSS-SECTION 19
Representative marginal and regularized partial correlations among items for the two-
factor orthogonal and correlated models are depicted in Figure 1. Weighted analyses of nodal
centrality in the one-factor CFA revealed a strong correspondence between factor loadings and
centrality statistics (Table 1). A similar, but weaker pattern, was observed for closeness and
betweenness, which are based on path length among nodes.
-------------------------------- Insert Figure 1 about here --------------------------------
In the model with two orthogonal factors, the association between strength and factor
loadings remained, changing negligibly compared to the one-factor model. The association of
closeness with factor loadings, however, dropped precipitously for the two-factor compared to
one-factor model, Δr = -.52, d = -10.20. We also observed a large drop in the correspondence of
betweenness and factor loadings, Δr = -.37, d = -5.41. Declines in graph metric-factor loading
correspondence for the correlated two-factor model were qualitatively similar to the orthogonal
model (Table 1). In the three-factor models, the correspondence between strength and factor
loadings remained very high (r = .97). The correspondence of factor loadings with closeness and
betweenness was much lower in the three-factor than the one-factor model, mirroring association
decreases for the two-factor model.
-------------------------------- Insert Table 1 about here
--------------------------------
In network terms, a model with orthogonal factors and simple structure (i.e., no
substantial cross-loadings) results in a structure with essentially disconnected subgraphs (each
representing a factor; for an example, see Figure 2, left panel). By contrast, the correlated factors
model yields a pattern of strong item correlations within factors and weaker associations between

NETWORK ANALYSES OF PSYCHOPATHOLOGY IN CROSS-SECTION 20
factors (see Figure 2, right panel). As described above, both closeness and betweenness are
dependent on the connectedness of the entire graph, whereas strength is only concerned with
edges incident to a given node. As a result, in multi-factor models, any edges among the
subgraphs (i.e., edges that connect the factors), even if small, could potentially lead to substantial
increases in closeness and betweenness centrality. Such edges have been of particular theoretical
interest in the network psychometrics literature because they could putatively “bridge” between
disorders and therefore explain patterns of comorbidity (Cramer et al., 2010). Furthermore, the
presence of such “bridging” edges could explain the precipitous drop in the correspondence of
closeness and betweenness with factor loadings.
-------------------------------- Insert Figure 2 about here --------------------------------
To interrogate this possibility, we computed the sum of the off-factor elements of the
adjacency matrix that represented the associations of items that loaded on different factors2. In
the orthogonal factors case, this sum reflects spurious association among items due to sampling
variability; in the population model, these items are conditionally independent. In the correlated
factors case, the off-factor sum reflects both sampling variability and the weak association of
items across factors due to the factor correlation (r = 0.4). For comparison, we computed the sum
of the associations among items within a given factor. In the orthogonal factors design the sum
of within-factor associations for each indicator was approximately 100 times larger than the
summed associations with indicators of other factors, EBICGLASSO within/between M = 97.98,
SD = 5.48. In the correlated factors case, this ratio was smaller, within/between M = 22.55, SD =
.69.
2 Because the pattern of correspondence between graph metrics and loadings was similar in the two- and three-factor models, we only ran these additional tests in the two-factor case.

NETWORK ANALYSES OF PSYCHOPATHOLOGY IN CROSS-SECTION 21
Although associations among indicators of orthogonal factors reflect sampling variability,
not latent structure, these nevertheless played a key role in estimates of strength, closeness, and
betweenness. Consistent with the correspondence statistics reported above (Table 1), strength
had a relatively weak dependence on off-factor associations (sr2 = .04) relative to the primary
factor loading, (sr2 = .82); see Figure 3, left panel3. By contrast, closeness centrality showed a
dependency on the off-factor associations, with the off-factor influence (sr2 = .08) accounting for
about four times as much variance as the factor loading (sr2 = .02; Figure 3, middle panel).
Betweenness depended even more strongly on off-factor associations (sr2 = .33); this effect was
approximately three times the magnitude of the factor loading-betweenness relationship (sr2 =
.11; Figure 3, right panel). The pattern was qualitatively similar for the correlated two-factor
model, but with more equal contributions of factor loadings and off-factor sums to closeness and
betweenness estimates (Figure 3, righthand bars). We note that in the correlated factors case, the
off-factor sums reflect both sampling variability and model-implied correlation due to the factor
correlation.
-------------------------------- Insert Figure 3 about here --------------------------------
Simulation 2: Effects of Common Versus Specific Sources of Covariation on Network
Metrics
In Simulation 1, we were surprised to learn that small conditional associations between
indicators of different factors, even if spurious, influenced closeness and betweenness. This
3 Note that because the GLASSO algorithm shrinks some correlations to zero, the off-factor association sums were non-zero in only 55% of cases. The statistics here reflect only the cases with non-zero off-factor associations, but the statistics are qualitatively similar when all data are included, 𝛽789:;< =.77, 𝛽;770789:;<0ABC = .07.

NETWORK ANALYSES OF PSYCHOPATHOLOGY IN CROSS-SECTION 22
finding suggests that even in the presence of robust associations due to a shared latent trait,
smaller specific relationships between items could have nonlinear effects on nodal metrics. In
Simulation 2, we focused specifically on this concern by manipulating the degree to which
variance in two items, y2 and y12, reflected a common factor versus a specific bivariate
relationship (i.e., a direct link) with an indicator of another factor (Figure 4). Simulation 2 sought
to examine the functional form of network metrics along a gradient from common to specific
variance. We anticipated that strength would scale linearly with factor-related variance. Because
our simulation parametrically manipulated the specific covariance of items from different factors,
we anticipated that the corresponding edge between them would have nonlinear effects on
closeness and betweenness, which are based on paths between nodes.
-------------------------------- Insert Figure 4 about here --------------------------------
Methods
Simulation 2 generated data from an orthogonal factor model with ten indicators per
factor in which there was a specific association between two indicators, y2 and y12. These items
loaded on different latent factors, f1 and f2, respectively, and the specific association between
them varied between r = 0 to r = 0.64 (see Figure 4). We implemented the specific association
between y2 and y12 using a two-indicator latent variable, s, with equated loadings, but a model
that captured a residual association between these items in the 𝚯 matrix would be equivalent.
Standardized factor loadings for all other indicators were fixed to 0.8; residual variances were
fixed at 0.36 for all items.
For indicators that were conditionally independent after accounting for the latent factor
(e.g., y3 or y14), the variance explained reflected the squared factor loading alone. In the case of
the correlated indicators, y2 and y12, the simulations varied along a gradient that traded off

NETWORK ANALYSES OF PSYCHOPATHOLOGY IN CROSS-SECTION 23
variance due to specific association versus latent factor. More specifically, we parametrically
varied the factor loadings such that variance explained by the shared factor varied from 0% to
64% in 1% increments: 𝑟789:;<G + 𝑟AIJ9K7K9G = .64. Thus, there were 65 population models, and we
simulated 100 replications from each using a sample size of 400. At one extreme of the variance
gradient, the model reflected a simple two-factor orthogonal model: 𝑟AIJ9K7K9G = 0; at the other
extreme, y2 and y12 were not indicators of the latent factors, but reflected unique bivariate
association alone.
For simplicity, we aggregated across replications within a given population model and
used polynomial regression to capture the relationship between each metric and the difference in
variance explained by the common factor versus specific association. Results were substantively
similar using multilevel models that retained replication variability within each population
model. Finally, we compared the effects of the variance manipulation on both a target node, y2,
and comparator node, y3. Variance in y2 was explained by both factor and specific association
with y12, whereas variance in y3 was attributable to the latent factor, f1, alone.
Results
We first tested whether the magnitude of the edge (i.e., partial correlation) between y2
and y12 followed the underlying parametric gradient between common factor variance and
specific association. As depicted in Figure 5, there was a strong correspondence between the
specific association of y2 and y12 and the corresponding edge weight between them, r(63) =
0.997; there was a slight nonlinearity in the relationship below 0.1 (Figure 5, lower left corner).
-------------------------------- Insert Figure 5 about here --------------------------------

NETWORK ANALYSES OF PSYCHOPATHOLOGY IN CROSS-SECTION 24
These tests confirmed that the EBICGLASSO method was highly influenced by unique
covariation between items in the presence of other sources of covariation – here, the covariation
due to a common latent factor. Building on this basic test, we next examined the effect of
specific versus common sources of covariation on strength, closeness, and betweenness. Overall,
there was a nonlinear effect of the source of covariation (shared versus unique) on nodal metrics
(Figure 6).
-------------------------------- Insert Figure 6 about here --------------------------------
Strength
We found a moderate main effect of the specific-to-shared variance balance on strength
estimates, 𝜂OG = .20 (Table 2). There was also a strong main effect of node type, 𝜂OG = .51, such
that strength was higher for comparator nodes compared to targets on average (Figure 6a). These
effects were qualified by a variance balance x node type interaction, 𝜂OG = .17. On average,
strength for target nodes increased substantially as a greater proportion of variation was
attributable to the shared factor. To interrogate the functional form of this interaction more
specifically, however, we used orthogonal polynomial contrasts.
-------------------------------- Insert Table 2 about here
--------------------------------
For the target nodes (y2 and y12), strength varied substantially as a function of variance
balance, 𝜂OG = .40. The relationship between strength and variance balance followed a cubic
pattern, R2linear = .48, R2quadratic = .64, R2cubic = .98. More specifically, strength tended to increase
as variance in the target was explained by the factor relative to the unique bivariate association.
However, strength increased rapidly with small increases in factor-related variance, plateaued
when there was a relative balance between factor and unique variance, then increased again as

NETWORK ANALYSES OF PSYCHOPATHOLOGY IN CROSS-SECTION 25
factor variance predominated. By comparison, if networks were defined using marginal, not
partial, correlation, strength of the target increased asymptotically as factor variance
predominated (Supplementary Figure S1).
For comparator nodes (i.e., items whose variance was explained only by the shared
factor), strength was only weakly dependent on the variance balance of the target node, 𝜂OG = .03.
As depicted in Figure 6a, the difference in range for strength was much smaller across conditions
for comparator nodes compared to target nodes.
Closeness
We found a strong main effect of target node variance balance on closeness, 𝜂OG = .68.
There was also a relationship between node type and closeness, 𝜂OG = .34. These were qualified
by a moderate interaction between variance balance and node type, 𝜂OG = .15. As depicted in
Figure 6b, there was an inverse quadratic relationship between source of variance and closeness
for both target (R2quadratic = .95) and comparator nodes (R2quadratic = .96), though the peak of the
quadratic component was higher for the target than comparator node, node type x squared
variance source F(1, 124) = 168.25, p < .0001. For both target and comparator nodes, closeness
was highest when there was slightly more factor variance than unique variance.
Betweenness
There were strong main effects of variance balance and node type on betweenness, 𝜂OG =
.24 and .68, respectively. These were qualified by a variance balance x node type interaction 𝜂OG
= .29. Whereas betweenness varied strongly for target nodes as a function of variance balance
(𝜂OG = .52), betweenness in comparator nodes was only weakly associated with the variance
balance of targets (𝜂OG = .03). As depicted in Figure 6c, betweenness increased substantially for
target nodes when they had even a small degree of both factor and unique variance. This

NETWORK ANALYSES OF PSYCHOPATHOLOGY IN CROSS-SECTION 26
relationship could be approximated by a quartic polynomial model (R2quartic = .92), cubic versus
quartic 𝛥𝑅G = .04, F(1, 60) = 27.19. For comparator nodes, there was a weak tendency for
betweenness to be greater when most of the variance in the target was explained by either unique
or shared variance (R2quadratic = .64).
Simulation 3: Effects of multiple latent causes on nodal graph metrics
Simulation 2 revealed that the specific bivariate relationship between items loading on
different common factors (i.e., relaxing the conditional independence assumption of the factor
model) resulted in substantial and often nonlinear changes in graph metrics. Although the
primary goal of Simulation 2 was to examine common versus specific sources of covariation, the
target items can also be viewed in terms of multiple latent causes. That is, variance in y2 and y12
was jointly explained by both common (f1 and f2) and specific (s) factors. Simulation 3 built on
this notion, as well as our interest in understanding how symptom networks would represent
multiple latent causes such as method factors versus substantive traits. In Simulation 3, we
examined how nodal metrics vary when a node is a function of two latent causes. We
hypothesized that network metrics would reflect a weighted combination of these latent causes.
Methods
We independently manipulated the loadings of a target item, y17, on two latent factors, f1
and f2 (see Figure 7). Factor loadings of the target item on f1 and f2 varied between 0.2 and 0.8
in 0.05 increments. Altogether, this yielded 169 possible combinations (132) of loadings for the
target item. All other loadings were fixed on their respective factors at 0.8 and residual item
variance was held at 0.3 for all items across conditions. As with the other simulations, for each
condition, we simulated 100 replication datasets with N = 400. As in Simulation 2, we averaged
across replications within a given population model and used polynomial regression to capture

NETWORK ANALYSES OF PSYCHOPATHOLOGY IN CROSS-SECTION 27
the relationship between graph metrics and factor loadings. To examine the effect of target factor
loadings on other nodes, we analyzed a comparator node, y10, which loaded on f2.
-------------------------------- Insert Figure 7 about here --------------------------------
Our primary focus was on the association between graph metrics for the target node, y17,
and the population factor loadings across conditions. We also compared the effect of simulation
condition on a comparator node, y10, whose loadings were fixed to 0.8 in all population models.
Crucially, unlike network metrics, there was not a significant association between the fitted
factor loading for the comparator node and both the population and fitted loadings of the target
node, R2 < .001. That is, manipulating the target factor loading did not bias the estimated loading
of the comparator node. For simplicity, we averaged graph metrics across replications to
understand their association with factor loadings, but multilevel models that captured replications
nested within condition provided substantively identical results.
Results
For the target node, strength was an equally weighted combination of the factor 1 and
factor 2 loadings, 𝐵UV = 0.94 (SE = .007), 𝐵UG = 0.94 (SE = .007), R2 = 1.0 (Figure 8a). Across
replications, strength of the target node varied largely as a function of both factor 1 (𝜂OG = 0.88)
and factor 2 (𝜂OG = 0.88) loadings, and very weakly as a function of their interaction (𝜂OG = 0.02).
Variation in strength for the comparator was much smaller across conditions (Figure 8b, top right
panel), but it was weakly associated with target factor 1 loading (𝜂OG = 0.05), factor 2 loading (𝜂OG
= 0.05), and their interaction (𝜂OG = 0.02). Averaging across replication datasets, factor loadings
of the target, including the factor 1 x factor 2 interaction, explained 82% of the variance in the
comparator after accounting for the comparator factor loading. Finally, to quantify the similarity

NETWORK ANALYSES OF PSYCHOPATHOLOGY IN CROSS-SECTION 28
of condition effects on target and comparator nodes, we computed the correlation between
average strength of target and comparator nodes across conditions. This revealed a high
similarity for strength, r(167) = .84 (cf. patterns in Figure 8a,b).
For closeness, we found that the effect of condition on the target was strongly related to
factor 1 loading (𝜂OG = 0.63), factor 2 loading (𝜂OG = 0.63), and their interaction (𝜂OG = 0.20). The
relationship between loadings and closeness was best captured by a model that included both
linear and quadratic terms for the factor loadings, as well as the interaction of the linear terms, R2
= .99 (Supplementary Table 1). As depicted in Figure 8c, closeness was particularly high when
both factor 1 and 2 loadings were high. Although the comparator node had lower closeness on
average, it nevertheless varied substantially as a function of the factor loadings for the target,
factor 1 𝜂OG = 0.33, factor 2 𝜂OG = 0.33, factor 1 x factor 2 𝜂OG = .06.More specifically, variation
in comparator closeness across conditions was largely predicted by a model that included linear
and quadratic terms of the target’s loadings, R2 = 0.98 (Supplementary Table 1). Furthermore,
there was a very strong association in the effect of condition on closeness between target and
comparator nodes, r(167) = 0.99 (cf. Figure 8c,d).
For betweenness, the effect of condition on the target was very weak, factor 1 𝜂OG = .003,
factor 2 𝜂OG = .003, factor 2 x factor 2 𝜂OG = .009. Averaging across replications, betweenness was
somewhat associated with both factor loadings, as well as their interaction, R2 = .43
(Supplementary Table 2). As depicted in Figure 8e, betweenness for the target was greatest when
loadings for both factors were relatively weak, diminishing as either factor loading increased.
Variation in betweenness for the comparator node was very weakly related to the simulation
condition for the target, factor 1 𝜂OG = .01, factor 1 𝜂OG = .01, factor 1 x factor 2 𝜂OG = .009.
Betweenness in the comparator node, y10, was predicted by the factor loading of the target on

NETWORK ANALYSES OF PSYCHOPATHOLOGY IN CROSS-SECTION 29
same factor. More specifically, when y17 (target) had a smaller loading on the same factor as y10
(comparator), the betweenness of the comparator was higher (note the bottom-to-top color
gradient depicted in Figure 8f), R2 = 0.70 (Supplementary Table 2). The effect of condition on
betweenness was only modestly related between target and comparator nodes, r(167) = 0.35.
-------------------------------- Insert Figure 8 about here --------------------------------
Discussion
The goal of this paper was to examine the performance of network psychometric
approaches to cross-sectional symptom data in which the covariance patterns reflect at least one
latent variable. We focused on the relationship between estimates of formal parameters from a
latent variable model and estimated nodal centrality measures in graph analyses, which are the
primary focus of empirical studies (e.g., Fried et al., 2015). By contrast, previous research has
examined the performance of network search algorithms in the accurate detection of edges (i.e.,
conditional bivariate relationships), or the convergence of selected network and latent variable
models (Forbes et al., 2017; Marsman et al., 2018). Across three simulation studies, we observed
a number of patterns in nodal centrality measures that undermine their interpretability in
empirical studies of symptom co-occurrence.
In the first simulation, we examined the correspondence between nodal centrality metrics
and factor loadings when data were generated from a factor model. Given the large literature on
latent variable approaches to psychiatric comorbidity (Krueger & Markon, 2006), it is important
to understand potential points of correspondence and disjunction between network psychometric
analyses and traditional factor models. In defining symptom centrality as a construct, Cramer and
colleagues (2010) state, “a latent variable model renders all symptoms equally central and thus
exchangeable. … Within a latent variable framework, factor loadings cannot be measures of

NETWORK ANALYSES OF PSYCHOPATHOLOGY IN CROSS-SECTION 30
symptom centrality as we view the concept since those loadings are simply reliability estimates”
(p. 144). Although exchangeability is an optional feature of latent variable models (e.g., by
equating factor loadings in a 𝜏-equivalent model), our first simulation demonstrated that when a
latent factor underlies symptom correlations, nodal strength is perfectly correlated with loadings
using the EBICGLASSO algorithm. Furthermore, this redundancy held true in correlated multi-
factor models. This finding suggests that in empirical analyses, a node with higher strength may
not necessarily denote a distinctly important symptom, but instead a symptom that is strongly
associated with an underlying latent construct such as a diagnosis.
The notion that latent variable models render all symptoms equally central is both
philosophically and quantitatively at odds with the results of our strength centrality findings.
Classical test theory emphasizes the importance of exchangeability in part because item
properties are not taken into account when test scores reflect equally weighted item sums
(Nunnally & Bernstein, 1994). A modern approach to psychometric theory, however, explicitly
incorporates item properties into the measurement of latent traits (McDonald, 1999). In so doing,
the strength of the relationships between a putative latent variable and its manifestations can be
indexed by the factor loadings (Bartholomew, Knott, & Moustaki, 2011). Consequently,
although network psychometric studies have interpreted relative differences in strength in terms
of the unique importance of specific symptoms, our findings are consistent with the
interpretation that symptoms with higher strength centrality may simply be better indicators of a
latent variable. Even if one adopts the narrow view that factor loadings are ‘simply reliability
estimates,’ the equivalence of loadings and strength estimates in our simulations suggests that
one could interpret symptoms with higher strength as being more reliable indicators of a latent
variable, which has not been the view articulated in empirical network psychometric studies.

NETWORK ANALYSES OF PSYCHOPATHOLOGY IN CROSS-SECTION 31
Our findings for closeness and betweenness revealed a more complex relationship
between latent structure and nodal metrics. In our orthogonal multi-factor models, symptoms
loading on different factors were, by definition, conditionally independent of each other (i.e.,
causally unrelated). However, in a given sample, there will be small associations between
symptoms of different factors due to sampling variability. We found that closeness and
betweenness were better explained by such spurious sampling variability than by the primary
factor loading despite item correlations within a factor being nearly 100 times greater than
spurious associations among items of uncorrelated factors. The magnitude of this sensitivity to
sampling variability was larger for betweenness than for closeness. Such extreme sensitivity to
small associations may partly explain the instability of these network metrics across samples
(Forbes et al., 2017) or subsamples of the same dataset (Epskamp et al., 2018).
This result has particularly important implications for so-called “bridge” symptoms
(Cramer et al., 2010) or “causal bridges” (Fried & Cramer, 2017) such as fatigue, which co-occur
in different mental disorders. From a network psychometrics perspective, bridge symptoms are
thought to explain disorder comorbidity. One would expect bridge symptoms to have greater
betweenness, reflecting that symptoms of different disorders are connected via a path that
includes the bridge. Likewise, a bridge symptom would typically have elevated closeness,
reflecting relatively short distances (here, larger average partial correlations) to all other
symptoms in the network, even if indirect. Our findings indicate that both nodal closeness and
betweenness may be substantially elevated in empirical studies due to small, and even spurious,
associations between symptoms that help to connect relatively disconnected subgraphs (here,
resulting from orthogonal latent factors). One would almost certainly avoid interpreting such
dubious results by a visual inspection of the marginal correlation matrix (e.g., Figure 1a). As is

NETWORK ANALYSES OF PSYCHOPATHOLOGY IN CROSS-SECTION 32
typical in the SEM literature (McDonald & Ho, 2002), we believe that it is important for network
psychometric studies to report both marginal and partial correlation matrices used in their
analyses. Failing to do so prevents a detailed examination of associations and requires the reader
to interpret relationships using graphical depictions alone. Network diagrams often use color or
line width to encode key information; these channels have limited bandwidth and are subject to
constraints on graphical perception (Munzner, 2014).
Our second simulation examined more specifically how nodal metrics were affected
when the variance of a target psychometric item was attributable to a broad latent factor (here,
having 10 indicators) versus a specific bivariate relationship with a symptom of a different
factor. By trading off variance along a general-to-specific gradient, this simulation tested both
the accuracy of the specific edge between target items (Figure 4), as well as broader effects on
network topology. Consistent with previous research on the sensitivity of the EBICGLASSO
method to edgewise variation (e.g., van Borkulo et al., 2015), we found that the specific edge
strength between target items was recovered well across simulation conditions. However, when
examining the performance of nodal metrics, there were strong nonlinear effects along the
general-to-specific gradient (Figure 6). As articulated above, the interpretability of centrality
statistics rests, in part, on the extent to which they capture the dominant sources of covariation in
the symptom matrix and whether they scale in proportion to changes in the underlying data-
generating model.
We found that strength for target items increased as the node was more factor-related,
consistent with the broader pattern of correlations that would be expected for an indicator of a
latent factor relative to a specific bivariate correlation. Notably, strength increased rapidly as the
target node had even weak factor-related variance but plateaued when specific and unique

NETWORK ANALYSES OF PSYCHOPATHOLOGY IN CROSS-SECTION 33
variance were relatively balanced. Closeness was maximized for the target item when there was
a balance between factor-related and specific variance, following an inverse quadratic pattern of
change. This is conceptually sensible insofar as a node should be closer to all other nodes in the
graph when it links across otherwise disconnected subgraphs (here, factors). Importantly,
however, we observed a similar, but smaller, inverse quadratic pattern for closeness of
comparator nodes even though marginal associations among comparator items did not vary as a
function of the target. This indicates that if any node connects subgraphs, then all nodes become
closer, which is a correct description of the graph in terms of average correlational distances.
Nevertheless, this suggests that researchers should exercise caution when interpreting closeness
because it may change in parallel for two nodes that are conditionally independent of each other.
Likewise, we urge caution when interpreting the causal importance of betweenness in
symptom networks. Even small correlations that connect subgraphs were associated with
substantial changes in betweenness, but this metric was largely insensitive to variation in the
relative balance of factor-related versus specific variance over most conditions tested (Figure
6c). This aligns with the findings from the first simulation, where small spurious correlations that
connected subgraphs were associated with changes in betweenness.
Altogether, our findings from the second simulation indicate that researchers should be
aware of the potentially nonlinear and heterogeneous changes in nodal metrics when variance in
an item is attributable to a direct bivariate association relative to a broader latent factor. If nodal
metrics are to be the primary emphasis of empirical studies, our findings suggest that remarkably
different estimates could be obtained from relatively similar underlying structures. We
recommend that researchers interested in network psychometrics use simulation studies to test
how nodal metrics vary across plausible causal structures for their data. Likewise, researchers
NETWORK ANALYSES OF PSYCHOPATHOLOGY IN CROSS-SECTION 34
should be cognizant of the possibility that there could be relatively distinct modules (e.g.,
cognitive versus affective symptoms of depression; for an overview of modularity, see Newman
& Girvan, 2004) such that edges connecting symptoms within a given module are stronger than
edges between modules. Most nodal metrics capture aspects of the overall graph structure, but
are not based on knowledge of modules, subgraphs, or latent factors. Without examining how
metrics vary across alternative causal models, our findings suggest that the interpretation of
strength, closeness, and betweenness may be ambiguous in empirical studies.
Extending such concerns, our third simulation examined how nodal metrics varied when
symptom covariance reflected multiple latent causes. For example, some researchers have argued
that psychopathology reflects a combination of broad liability factors such as internalizing or the
‘p-factor’ (i.e., omnibus risk for mental illness), as well as specific risk factors for particular
forms of mental illness (Caspi et al., 2013; Kotov et al., 2017; Sharp et al., 2015). This view can
be instantiated by bifactor models in which items reflect both general and specific factors (for a
network-based objection, see van Bork, Epskamp, Rhemtulla, Borsboom, & van der Maas,
2017). Other researchers have sought to separate nuisance factors, such as method variance or
response biases, from substantive factors that reflect hypothetical constructs (Eid, 2000;
McLarnon et al., 2016). For example, Cole and colleagues (2007) demonstrated that omitting
correlations among residuals that are attributable to the study design (e.g., items that were
completed by a given informant) undermines the interpretability of substantive latent factors.
We found that nodal metrics reflect a weighted and at times nonlinear combination of the
simulated latent causes. More specifically, if variation in a target node was due to two
independent latent factors, nodal statistics depended on both factors (Figure 8). Although this is
unsurprising in some ways, it has troubling implications for empirical studies. For example,

NETWORK ANALYSES OF PSYCHOPATHOLOGY IN CROSS-SECTION 35
strength was an equally weighted combination of the factor loadings of the two independent
causes. Thus, in empirical studies, strength will be just as sensitive to nuisance factors (e.g.,
method variance) as substantive factors (e.g., personality traits). Furthermore, to our knowledge,
network psychometric studies have exclusively used observed items from symptom inventories
or clinical interviews without accounting for their psychometric properties, including
measurement error, method variance, or response bias factors. Without explicitly modeling
nuisance factors, it is impossible in an empirical analysis to unmix what portion of nodal metrics
reflects substantively interesting covariation versus undesirable features of the psychological
test. By contrast, there are many applications of SEM that are explicitly motivated by the goal of
examining method variance such as in cross-informant agreement about symptoms (e.g.,
Grigorenko, Geiser, Slobodskaya, & Francis, 2010), as well as methodological techniques for
mitigating common method variance (Williams, Hartman, & Cavazotte, 2010).
Moreover, if a given psychometric item is truly multidimensional — that is, influenced
by multiple traits — nodal metrics cannot inform an understanding of which trait is conceptually
more influential. For example, from an interpersonal circumplex perspective, stronger
endorsement of extraversion items could be viewed in terms of elevations on the dimensions of
dominance and affiliation (Wiggins & Pincus, 2002). This dilemma can be seen in the top-left-
to-bottom-right diagonal of Figure 8a, where equal estimates of nodal strength were obtained
despite substantial differences in the magnitudes of the latent causes.
Consistent with the dependencies observed in simulation 2, we found that there were
echoes of the target item’s factor loadings on nodal metrics for other items (see patterns between
Target and Comparator panels in Figure 8). This was true despite there being no relationship
between factor loadings for the target and those for comparators. Neither did the fitted factor

NETWORK ANALYSES OF PSYCHOPATHOLOGY IN CROSS-SECTION 36
loadings show any dependency in the simulation. In particular, the closeness of comparator
nodes was strongly associated with the closeness of the target, being maximized when factor
loadings for the target were both high. Altogether, the factor model maintained a kind of firewall
between conditionally independent items across conditions — that is, estimated factor loadings
for target and comparator nodes were uncorrelated. This necessarily follows from the structure of
the latent variable model, where indicators were independent after conditioning on the latent
factor. Nevertheless, nodal metrics, which depend on the overall structure of the graph, were
contaminated by a node that reflected multiple causes.
Why Network Psychometrics Cannot Escape Psychometric Theory
One of the major implications of our third simulation is that researchers must exercise
extreme caution in selecting symptoms to enter into network analysis. In particular, any source of
nuisance variation such as similar item phrasing or variation in assessment method (e.g., self-
report versus clinical interview) should be minimized to avoid undermining the interpretability of
nodal metrics. Furthermore, if two symptoms are likely to reflect the same underlying construct,
these should probably be excluded from the analysis. For example, if the items “I worry a lot”
and “I can’t get certain troubles off of my mind” were included in a symptom network, it is
possible that their centrality estimates could reflect strongly overlapping content, rather than a
substantive role in the broader pattern of generalized anxiety symptoms. Ideally, symptoms in
network analyses should reflect conceptually distinct constructs such that the edges among them
are akin to the structural model of an SEM.
The notion that nodes should reflect conceptually distinct constructs has been articulated
in some of the network psychometrics literature. For example, in distinguishing a network
approach from a typical latent trait approach to personality, Cramer and colleagues (2012) state,

NETWORK ANALYSES OF PSYCHOPATHOLOGY IN CROSS-SECTION 37
“we propose that every feeling, thought or act is a potential component of personality if it is
associated with a unique ‘causal system’ … The component must thus be unique in the sense that
its causal system differs from that of other (potential) components. This means that a personality
component is, to a certain degree, causally autonomous and, as such, not ‘exchangeable’ with
other components” (p. 415). Importantly, however, most network studies of psychopathology
symptoms have selected nodes that are drawn from a given diagnosis or syndrome (e.g., Fried et
al., 2015; McNally et al., 2015). As we have described above, extant symptom measures are
typically constructed following a latent variable approach in which items that load strongly onto
a factor are retained, while items with poor loadings are culled. Likewise, the development of
psychiatric classification systems has been strongly informed by considerations of interrater
agreement and internal consistency of a symptom set.
In short, implementing the recommendation to include symptoms that are conceptually
and causally distinct may be possible in some circumstances, but we have doubts about the
promise of this direction given the current structure of symptom measures and datasets. This is
not to say that symptom co-occurrence necessarily reflects latent variables at the ontological
level. Rather, if proponents of network approaches believe that psychopathology is composed of
causally distinct components, it is essential that new measures be developed using methods that
capture these components while discouraging the presence of latent confounding in the resulting
item covariance matrices.
The Challenges of Latent Confounding in Graph Analyses
A primary goal of this paper was to examine the interpretability of nodal metrics when
symptom correlations partly reflect latent confounding. In the causal network discovery
literature, there is increasing awareness of the need to accurately identify conditional

NETWORK ANALYSES OF PSYCHOPATHOLOGY IN CROSS-SECTION 38
independence relationships in the presence of latent confounding (Chandrasekaran, Parrilo, &
Willsky, 2012; Ogarrio et al., 2016; Spirtes & Zhang, 2016). Crucially, graphical models
representing causal relationships among nodes assume that there are no key omitted variables
(Pearl, 2000). In a commentary on this dilemma, Yuan (2012) noted, “the difficulty comes from
the fact that the validity of conditional independence relationships implied by a graphical model
relies critically on the assumption that all conditional variables are observed, which of course can
be unrealistic” (p. 1968).
Ignoring the possibility of latent confounding can fundamentally misrepresent symptom
relationships. If, in truth, the co-occurrence of anhedonia, dysphoria, and hopelessness reflect
depression as a latent cause, omitting depression (a so-called “hidden” variable in the network
literature) from the graphical model yields a structure in which edges among symptoms may be
spurious, or important direct relationships are omitted. The consequences of this problem are
visually evident in Figure 9 (reprinted from Yuan, 2012), which shows the poor performance of
the GLASSO algorithm in the presence of latent confounding. This is a known limitation of
GLASSO that has been described in the causal networks literature, with extensions that
specifically seek to handle unknown latent variables (e.g., Agakov, Orchard, & Storkey, 2012).
Indeed, when confronted with a set of highly correlated variables, as may occur among items
measuring a given construct, a LASSO approach typically retains only a subset of plausible
edges, and the subset is often sample dependent (Hastie, Tibshirani, & Friedman, 2009).
-------------------------------- Insert Figure 9 about here --------------------------------
Exploratory factor analysis (EFA) is a classical approach to identifying hidden variables
in covariance matrices that can help to understand structural, and potentially causal, relationships

NETWORK ANALYSES OF PSYCHOPATHOLOGY IN CROSS-SECTION 39
(Loehlin, 2003). EFA is particularly useful when a researcher has relatively weak a priori
knowledge about latent structure. Although network discovery algorithms have developed
substantially in the past 15 years (Spirtes & Zhang, 2016), many approaches, including
GLASSO, are based on searching for causal relationships among observed variables.
Importantly, however, there is some evidence that network search algorithms that are sensitive to
latent confounding can outperform EFA when the data generating model is complex (Silva,
Scheines, Glymour, & Spirtes, 2006). Thus, although we have criticized network psychometric
approaches in their current form, we believe that network science may provide useful methods
for understanding the causes of symptom co-occurrence, both hidden and observed.
Furthermore, if researchers have a priori knowledge of latent structure — for example,
based on validation studies of a psychological test — we recommend that this be formally
incorporated into covariance structure analyses. Indeed, the fit of CFA models can be compared
to GGMs, and conventional model selection strategies (e.g., based on global fit statistics) can
inform an understanding of what model best describes the structure of symptom covariance
(Epskamp, Rhemtulla, et al., 2017). We also believe that it is crucial for network models and
more conventional SEMs to be compared in terms of fit versus parsimony (Krueger, Deyoung, &
Markon, 2010), interpretability vis-à-vis theory, and reproducibility (Forbes et al., 2017) in order
to promote a multi-model selection approach based on relative evidence (Burnham & Anderson,
2002). For example, Epskamp and colleagues (2017) recently developed an approach that
integrates latent trait models with network search algorithms.
The Important Debate About the Ontology of Psychopathology
Advocates of network psychometrics have asserted that the assumption of local
independence in common factor models — that is, that two indicators of a latent factor are

NETWORK ANALYSES OF PSYCHOPATHOLOGY IN CROSS-SECTION 40
independent after accounting for the factor — may not hold true in some datasets (Cramer et al.,
2010). Although our study used factor models to examine the performance of network
psychometrics in the presence of latent confounding, we do not make a strong assertion that
common symptoms of psychopathology are caused by a diagnostic entity such as depression or a
broad liability factor such as internalizing. Likewise, we acknowledge that factor models may
not adequately describe some patterns of symptom co-occurrence. Such limitations have
motivated, for example, extensions such as exploratory SEM, that allows the researcher to
specify a measurement and structural model based on theory while also allowing for data-driven
deviations from theory, particularly item cross-loadings (Marsh, Morin, Parker, & Kaur, 2014;
also see Muthén & Asparouhov, 2012). Furthermore, we acknowledge that our study generated
data from factor models and fit them using network models, but we did not examine the
converse.
Understanding the formal relationships between network and factor models is a topic of
active inquiry (Marsman et al., 2018). We have previously shown that factor models can be
transformed into directed path models lacking latent variables (the so-called Houdini
transformation; Bentler & Molenaar, 2012; Molenaar, 2003). This highlights the challenge of
distinguishing between models that are conceptually distinct, but statistically equivalent. Future
work should examine the conditions under which typical latent variable models accurately
capture data generated from a network model such as the GGM. Ultimately, model fitting alone
is typically insufficient to disambiguate equivalent models, and other approaches such as
experimental manipulation or alternative metrics of model quality are needed (Williams, 2012).
These limitations notwithstanding, for the reasons stated above, we believe that it is
highly plausible and often likely that latent variables are present in cross-sectional symptom

NETWORK ANALYSES OF PSYCHOPATHOLOGY IN CROSS-SECTION 41
covariance data. Our results, along with deeper treatments of latent confounding
(Chandrasekaran et al., 2012), suggest that it is essential that network psychometric approaches
examine the evidence for hidden variables prior to analyzing or interpreting patterns at the
symptom level. Failing to do so risks identifying spurious relationships or failing to detect
causally important effects. In this vein, one recent study contextualized nodal metrics vis-à-vis
symptom modules that may represent latent variables, rather than emphasizing metrics such as
closeness that are blind to subgraph structure (Blanken et al., 2018).
Returning to the conceptual model underlying cross-sectional network psychometric
approaches (Borsboom, 2017), we wish to highlight three key ontological assumptions:
1. Two symptoms (manifest variables) can be uniquely associated with each other
without implying a latent clinical entity (e.g., depression) or dimensional trait (e.g., negative
affect). That is, symptoms are the atomic units of psychopathology.
2. The relationship between two symptoms can best be understood when common
variation with other symptoms is partialed out. That is, the symptoms should have some direct
relationship with each other, rather than simply being associated through many indirect effects.
3. Observed variables provide direct evidence of a symptom of interest, rather than being
an indicator of a hypothetical construct. A corollary of this assumption is that measurement error
is not important in characterizing the association among symptoms.
A fundamental difficulty with these assumptions is that many, if not most, symptoms
could themselves be considered hypothetical constructs. For example, there is a literature on
different facets of fatigue, as well as many psychometric items to measure each facet (Beurskens
et al., 2000). Moreover, there are substantial advantages of accounting for measurement error in
latent variable analyses, such as mitigating the attenuation of validity coefficients or improving

NETWORK ANALYSES OF PSYCHOPATHOLOGY IN CROSS-SECTION 42
power to detect structural relationships (Furr, 2017). We also question whether causal
relationships between two symptoms will be identified under the assumption that the specific
association is conditioned on all other symptoms. What is the meaning of a conditional
association between fatigue and insomnia after accounting for all other symptoms of mood and
anxiety disorders? By extension, the breadth of symptoms included in a network analysis is an
implicit statement about the confounders that could obscure a unique bivariate causal
relationship. Thus, the researcher’s decision about whether to include symptoms of a disorder
(e.g., depression), family (e.g., mood disorders), or superordinate spectrum (e.g., internalizing
pathology) fundamentally alters the causal assumptions of a given graphical model.
In short, network psychometrics cannot escape psychometric theory and should not
attempt to do so. Rather, to advance a quantitative approach to the classification of mental
illness, we believe that models should incorporate and test researchers’ a priori theory and build
on extant knowledge of the latent structure of psychopathology. Such structures are likely to
include latent variables such as diagnoses or liability factors (Krueger & Markon, 2006), and
formally incorporating measurement models is likely to advance the validity of network
analyses. At present, network psychometrics have applied exploratory data-driven algorithms
that require minimal input from the scientist and optimize a fit criterion, rather than seeking to
test a specific hypothesis about covariance structure. These approaches have operated almost
exclusively at the level of observed variables, precluding the possibility of latent factors.
Our simulations provide a proof of concept that network psychometric approaches may
provide ambiguous or misleading guidance in empirical studies. Nodal metrics are secondary
statistics that may reflect an array of causes and do not directly link with the underlying
conditional independence relationships of a given graphical model. Although arguments for a

NETWORK ANALYSES OF PSYCHOPATHOLOGY IN CROSS-SECTION 43
network approach have largely been cast in ontological terms (e.g., McNally, 2012), our results
suggest that network psychometrics in their current form do not overcome key epistemic hurdles.
In particular, network analyses based on observed variables alone fail to provide scientists with
knowledge of whether or not latent confounders are likely to exist in the data. We believe that
the classification of mental illness will be best advanced by examining parameters from formal
models that are sensitive to latent structure and that instantiate specific hypotheses about the
basis of symptom co-occurrence.

NETWORK ANALYSES OF PSYCHOPATHOLOGY IN CROSS-SECTION 44
Acknowledgements. The authors thank Nathan T. Hall for helpful comments on a previous
version of this manuscript. This research was performed, in part, using resources and the
computing assistance of the Pennsylvania State University Institute for CyberScience Advanced
CyberInfrastructure (ICS-ACI).

NETWORK ANALYSES OF PSYCHOPATHOLOGY IN CROSS-SECTION 45
References
Agakov, F., Orchard, P., & Storkey, A. (2012). Discriminative Mixtures of Sparse Latent Fields
for Risk Management. In N. D. Lawrence & M. Girolami (Eds.), Proceedings of the
Fifteenth International Conference on Artificial Intelligence and Statistics (pp. 10–18).
Retrieved from http://proceedings.mlr.press/v22/agakov12.html
Asparouhov, T., Muthén, B., & Morin, A. J. S. (2015). Bayesian Structural Equation Modeling
With Cross-Loadings and Residual Covariances: Comments on Stromeyer et al. Journal
of Management, 41(6), 1561–1577. https://doi.org/10.1177/0149206315591075
Bartholomew, D. J., Knott, M., & Moustaki, I. (2011). Latent Variable Models and Factor
Analysis: A Unified Approach (3rd ed.). Retrieved from
http://ebookcentral.proquest.com/lib/pensu/detail.action?docID=819225
Bates, D., Mächler, M., Bolker, B., & Walker, S. (2015). Fitting Linear Mixed-Effects Models
Using lme4. Journal of Statistical Software, 67(1), 1–48.
https://doi.org/10.18637/jss.v067.i01
Bentler, P. M., & Molenaar, P. C. M. (2012). The Houdini Transformation: True, but Illusory.
Multivariate Behavioral Research, 47(3), 442–447.
https://doi.org/10.1080/00273171.2012.673941
Beurskens, A. J. H. M., Bültmann, U., Kant, Ij., Vercoulen, J. H. M. M., Bleijenberg, G., &
Swaen, G. M. H. (2000). Fatigue among working people: validity of a questionnaire
measure. Occupational and Environmental Medicine, 57(5), 353–357.
https://doi.org/10.1136/oem.57.5.353
Blanken, T. F., Deserno, M. K., Dalege, J., Borsboom, D., Blanken, P., Kerkhof, G. A., &
Cramer, A. O. J. (2018). The role of stabilizing and communicating symptoms given

NETWORK ANALYSES OF PSYCHOPATHOLOGY IN CROSS-SECTION 46
overlapping communities in psychopathology networks. Scientific Reports, 8(1), 5854.
https://doi.org/10.1038/s41598-018-24224-2
Borsboom, D. (2017). A network theory of mental disorders. World Psychiatry, 16(1), 5–13.
https://doi.org/10.1002/wps.20375
Borsboom, D., & Cramer, A. O. J. (2013). Network Analysis: An Integrative Approach to the
Structure of Psychopathology. Annual Review of Clinical Psychology, 9(1), 91–121.
https://doi.org/10.1146/annurev-clinpsy-050212-185608
Borsboom, D., Rhemtulla, M., Cramer, A. O. J., van der Maas, H. L. J., Scheffer, M., & Dolan,
C. V. (2016). Kinds versus continua: a review of psychometric approaches to uncover the
structure of psychiatric constructs. Psychological Medicine, 46(8), 1567–1579.
Burnham, K. P., & Anderson, D. R. (2002). Model selection and multi-model inference: A
practical information-theoretic approach (2nd ed.). New York: Springer.
Caspi, A., Houts, R. M., Belsky, D. W., Goldman-Mellor, S. J., Harrington, H., Israel, S., …
Moffitt, T. E. (2013). The p Factor: One general psychopathology factor in the structure
of psychiatric disorders? Clinical Psychological Science, 2167702613497473.
https://doi.org/10.1177/2167702613497473
Chandrasekaran, V., Parrilo, P. A., & Willsky, A. S. (2012). Latent variable graphical model
selection via convex optimization. The Annals of Statistics, 40(4), 1935–1967.
https://doi.org/10.1214/11-AOS949
Clark, L. A., & Watson, D. (1995). Constructing validity: Basic issues in objective scale
development. Psychological Assessment. Special Issue: Methodological Issues in
Psychological Assessment Research, 7(3), 309–319.

NETWORK ANALYSES OF PSYCHOPATHOLOGY IN CROSS-SECTION 47
Cole, D. A., Ciesla, J. A., & Steiger, J. H. (2007). The insidious effects of failing to include
design-driven correlated residuals in latent-variable covariance structure analysis.
Psychological Methods, 12(4), 381–398. https://doi.org/doi:10.1037/1082-989X.12.4.381
Cramer, A. O. J., van der Sluis, S., Noordhof, A., Wichers, M., Geschwind, N., Aggen, S. H., …
Borsboom, D. (2012). Dimensions of Normal Personality as Networks in Search of
Equilibrium: You Can’t Like Parties if You Don’t Like People: Dimensions of normal
personality as networks. European Journal of Personality, 26(4), 414–431.
https://doi.org/10.1002/per.1866
Cramer, A. O. J., Waldorp, L. J., van der Maas, H. L. J., & Borsboom, D. (2010). Comorbidity:
A network perspective. Behavioral and Brain Sciences, 33(2–3), 137–150.
https://doi.org/10.1017/S0140525X09991567
Cronbach, L. J., & Meehl, P. E. (1955). Construct validity in psychological tests. Psychological
Bulletin, 52(4), 281–302.
Csardi, G., & Nepusz, T. (2006). The igraph software package for complex network research.
InterJournal, Complex Systems, 1695.
Eaton, N. R., Krueger, R. F., Markon, K. E., Keyes, K. M., Skodol, A. E., Wall, M., … Grant, B.
F. (2013). The Structure and Predictive Validity of the Internalizing Disorders. Journal of
Abnormal Psychology, 122(1), 86–92. https://doi.org/10.1037/a0029598
Eid, M. (2000). A multitrait-multimethod model with minimal assumptions. Psychometrika,
65(2), 241–261. https://doi.org/10.1007/BF02294377
Epskamp, S., Borsboom, D., & Fried, E. I. (2018). Estimating psychological networks and their
accuracy: A tutorial paper. Behavior Research Methods, 50(1), 195–212.
https://doi.org/10.3758/s13428-017-0862-1

NETWORK ANALYSES OF PSYCHOPATHOLOGY IN CROSS-SECTION 48
Epskamp, S., Cramer, A. O. J., Waldorp, L. J., Schmittmann, V. D., & Borsboom, D. (2012).
qgraph: Network Visualizations of Relationships in Psychometric Data. Journal of
Statistical Software, 48(4), 1–18.
Epskamp, S., & Fried, E. I. (2018). A Tutorial on Regularized Partial Correlation Networks.
Psychological Methods. https://doi.org/10.1037/met0000167
Epskamp, S., Kruis, J., & Marsman, M. (2017). Estimating psychopathological networks: Be
careful what you wish for. PLOS ONE, 12(6), e0179891.
https://doi.org/10.1371/journal.pone.0179891
Epskamp, S., Rhemtulla, M., & Borsboom, D. (2017). Generalized Network Psychometrics:
Combining Network and Latent Variable Models. Psychometrika, 82(4), 904–927.
https://doi.org/10.1007/s11336-017-9557-x
Feighner, J. P., Robins, E., Guze, S. B., Woodruff, R. A., Winokur, G., & Munoz, R. (1972).
Diagnostic criteria for use in psychiatric research. Archives of General Psychiatry, 26(1),
57–63.
Forbes, M. K., Wright, A. G. C., Markon, K. E., & Krueger, R. F. (2017). Evidence that
psychopathology symptom networks have limited replicability. Journal of Abnormal
Psychology, 126(7), 969–988.
http://dx.doi.org.ezaccess.libraries.psu.edu/10.1037/abn0000276
Forbush, K. T., & Watson, D. (2013). The structure of common and uncommon mental
disorders. Psychological Medicine, 43(01), 97–108.
https://doi.org/10.1017/S0033291712001092
Foygel, R., & Drton, M. (2010). Extended Bayesian Information Criteria for Gaussian Graphical
Models. Advances in Neural Information Processing Systems, 23, 2020–2028.

NETWORK ANALYSES OF PSYCHOPATHOLOGY IN CROSS-SECTION 49
Fried, E. I., Bockting, C., Arjadi, R., Borsboom, D., Amshoff, M., Cramer, A. O. J., … Stroebe,
M. (2015). From loss to loneliness: The relationship between bereavement and depressive
symptoms. Journal of Abnormal Psychology, 124(2), 256–265.
https://doi.org/10.1037/abn0000028
Fried, E. I., & Cramer, A. O. J. (2017). Moving Forward: Challenges and Directions for
Psychopathological Network Theory and Methodology. Perspectives on Psychological
Science, 12(6), 999–1020. https://doi.org/10.1177/1745691617705892
Fried, E. I., Eidhof, M. B., Palic, S., Costantini, G., Dijk, H. M. H., Bockting, C. L. H., …
Karstoft, K.-I. (2018). Replicability and Generalizability of Posttraumatic Stress Disorder
(PTSD) Networks: A Cross-Cultural Multisite Study of PTSD Symptoms in Four Trauma
Patient Samples. Clinical Psychological Science, 2167702617745092.
https://doi.org/10.1177/2167702617745092
Friedman, J., Hastie, T., & Tibshirani, R. (2008). Sparse inverse covariance estimation with the
graphical lasso. Biostatistics, 9(3), 432–441. https://doi.org/10.1093/biostatistics/kxm045
Furr, R. M. (2017). Psychometrics: An Introduction (Third edition). Thousand Oaks, California:
SAGE Publications, Inc.
Grigorenko, E. L., Geiser, C., Slobodskaya, H. R., & Francis, D. J. (2010). Cross-Informant
Symptoms from CBCL, TRF, and YSR: Trait and Method Variance in a Normative
Sample of Russian Youths. Psychological Assessment, 22(4), 893–911.
https://doi.org/10.1037/a0020703
Gunderson, J. G., & Singer, M. T. (1975). Defining borderline patients: An overview. American
Journal of Psychiatry, 132(1), 1–10.
Hastie, T., Tibshirani, R., & Friedman, J. (2009). The Elements of Statistical Learning.

NETWORK ANALYSES OF PSYCHOPATHOLOGY IN CROSS-SECTION 50
Heeren, A., Jones, P. J., & McNally, R. J. (2018). Mapping network connectivity among
symptoms of social anxiety and comorbid depression in people with social anxiety
disorder. Journal of Affective Disorders, 228, 75–82.
https://doi.org/10.1016/j.jad.2017.12.003
Hoffman, M., Steinley, D., Trull, T. J., & Sher, K. J. (2018). Criteria Definitions and Network
Relations: The Importance of Criterion Thresholds. Clinical Psychological Science, 6(4),
506–516. https://doi.org/10.1177/2167702617747657
Hofmann, S. G., Curtiss, J., & McNally, R. J. (2016). A complex network perspective on clinical
science. Perspectives on Psychological Science, 11(5), 597–605.
Johnstone, I. M., & Titterington, D. M. (2009). Statistical challenges of high-dimensional data.
Philosophical Transactions of the Royal Society of London A: Mathematical, Physical
and Engineering Sciences, 367(1906), 4237–4253. https://doi.org/10.1098/rsta.2009.0159
Jorgensen, T. D., Pornprasertmanit, S., Miller, P., & Schoemann, A. (2017). simsem: SIMulated
Structural Equation Modeling. Retrieved from http://www.simsem.org
Kendler, K. S., Aggen, S. H., Flint, J., Borsboom, D., & Fried, E. I. (2018). The centrality of
DSM and non-DSM depressive symptoms in Han Chinese women with major depression.
Journal of Affective Disorders, 227, 739–744. https://doi.org/10.1016/j.jad.2017.11.032
Kenny, D. A., & Kashy, D. A. (1992). Analysis of the Multitrait-Multimethod Matrix by
Confirmatory Factor Analysis. Psychological Bulletin, 112(1), 165–172.
Kotov, R. (2011). New Dimensions in the Quantitative Classification of Mental Illness. Archives
of General Psychiatry, 68(10), 1003. https://doi.org/10.1001/archgenpsychiatry.2011.107
Kotov, R., Krueger, R. F., Watson, D., Achenbach, T. M., Althoff, R. R., Bagby, R. M., …
Zimmerman, M. (2017). The Hierarchical Taxonomy of Psychopathology (HiTOP): A
NETWORK ANALYSES OF PSYCHOPATHOLOGY IN CROSS-SECTION 51
dimensional alternative to traditional nosologies. Journal of Abnormal Psychology,
126(4), 454–477. http://dx.doi.org/10.1037/abn0000258
Krueger, R. F., Chentsova-Dutton, Y. E., Markon, K. E., Goldberg, D., & Ormel, J. (2003). A
cross-cultural study of the structure of comorbidity among common psychopathological
syndromes in the general health care setting. Journal of Abnormal Psychology, 112(3),
437–447. https://doi.org/10.1037/0021-843X.112.3.437
Krueger, R. F., Deyoung, C. G., & Markon, K. E. (2010). Toward scientifically useful
quantitative models of psychopathology: the importance of a comparative approach. The
Behavioral and Brain Sciences, 33(2–3), 163–164.
https://doi.org/10.1017/S0140525X10000646
Krueger, R. F., & Markon, K. E. (2006). Reinterpreting Comorbidity: A Model-Based Approach
to Understanding and Classifying Psychopathology. Annual Review of Clinical
Psychology, 2(1), 111–133. https://doi.org/10.1146/annurev.clinpsy.2.022305.095213
Latora, V., & Marchiori, M. (2003). Economic small-world behavior in weighted networks. The
European Physical Journal B - Condensed Matter and Complex Systems, 32(2), 249–263.
https://doi.org/10.1140/epjb/e2003-00095-5
Lauritzen, S. L. (1999). Causal Inference from Graphical Models. In Complex Stochastic
Systems, 63–107. Chapman and Hall/CRC Press.
Lei, P.-W., & Wu, Q. (2007). Introduction to Structural Equation Modeling: Issues and Practical
Considerations. Educational Measurement: Issues and Practice, 26(3), 33–43.
https://doi.org/10.1111/j.1745-3992.2007.00099.x
Loehlin, J. C. (2003). Latent Variable Models: An Introduction to Factor, Path, and Structural
Equation Analysis (4 edition). Mahwah, N.J: Psychology Press.

NETWORK ANALYSES OF PSYCHOPATHOLOGY IN CROSS-SECTION 52
Loevinger, J. (1957). Objective tests as instruments of psychological theory. Psychological
Reports, 3(3), 635–694.
Markon, K. E., Krueger, R. F., & Watson, D. (2005). Delineating the structure of normal and
abnormal personality: an integrative hierarchical approach. Journal of Personality and
Social Psychology, 88(1), 139–157.
Marsh, H. W., Morin, A. J. S., Parker, P. D., & Kaur, G. (2014). Exploratory Structural Equation
Modeling: An Integration of the Best Features of Exploratory and Confirmatory Factor
Analysis. Annual Review of Clinical Psychology, 10(1), 85–110.
https://doi.org/10.1146/annurev-clinpsy-032813-153700
Marsman, M., Borsboom, D., Kruis, J., Epskamp, S., Bork, R. van, Waldorp, L. J., … Maris, G.
(2018). An Introduction to Network Psychometrics: Relating Ising Network Models to
Item Response Theory Models. Multivariate Behavioral Research, 53(1), 15–35.
https://doi.org/10.1080/00273171.2017.1379379
Marsman, M., Maris, G., Bechger, T., & Glas, C. (2015). Bayesian inference for low-rank Ising
networks. Scientific Reports, 5, 9050. https://doi.org/10.1038/srep09050
McDonald, R. P. (1999). Test Theory : A Unified Treatment. Mahwah, N.J.: Psychology Press.
McDonald, R. P., & Ho, M.-H. R. (2002). Principles and practice in reporting structural equation
analyses. Psychological Methods, 7(1), 64–82.
McLarnon, M. J. W., Goffin, R. D., Schneider, T. J., & Johnston, N. G. (2016). To Be or Not to
Be: Exploring the Nature of Positively and Negatively Keyed Personality Items in High-
Stakes Testing. Journal of Personality Assessment, 98(5), 480–490.
https://doi.org/10.1080/00223891.2016.1170691
NETWORK ANALYSES OF PSYCHOPATHOLOGY IN CROSS-SECTION 53
McNally, R. J. (2012). The ontology of posttraumatic stress disorder: Natural kind, social
construction, or causal system? Clinical Psychology: Science and Practice, 19(3), 220–
228.
McNally, R. J., Robinaugh, D. J., Wu, G. W., Wang, L., Deserno, M. K., & Borsboom, D.
(2015). Mental disorders as causal systems: A network approach to posttraumatic stress
disorder. Clinical Psychological Science, 3(6), 836–849.
Molenaar, P. C. M. (2003). State space techniques in structural equation modeling:
Transformation of latent variables in and out of latent variable models. Retrieved from
http://www.hhdev.psu.edu/hdfs/faculty/docs/StateSpaceTechniques.pdf
Molenaar, P. C. M. (2010). Latent variable models are network models. Behavioral and Brain
Sciences, 33(2–3), 166–166. https://doi.org/10.1017/S0140525X10000798
Molenaar, P. C. M., van Rijn, P., & Hamaker, E. (2007). A new class of SEM model
equivalences and its implications. In S. M. Boker & M. J. Wenger (Eds.), Data analytic
techniques for dynamical systems (pp. 189–211). Erlbaum.
Munzner, T. (2014). Visualization Analysis and Design. Retrieved from
https://www.crcpress.com/Visualization-Analysis-and-
Design/Munzner/p/book/9781466508910
Muthén, B., & Asparouhov, T. (2012). Bayesian structural equation modeling: A more flexible
representation of substantive theory. Psychological Methods, 17(3), 313–335.
https://doi.org/10.1037/a0026802
Nakagawa, S., & Schielzeth, H. (2013). A general and simple method for obtaining R2 from
generalized linear mixed-effects models. Methods in Ecology and Evolution, 4(2), 133–
142. https://doi.org/10.1111/j.2041-210x.2012.00261.x
NETWORK ANALYSES OF PSYCHOPATHOLOGY IN CROSS-SECTION 54
Narrow, W. E., Clarke, D. E., Kuramoto, S. J., Kraemer, H. C., Kupfer, D. J., Greiner, L., &
Regier, D. A. (2013). DSM-5 Field Trials in the United States and Canada, Part III:
Development and Reliability Testing of a Cross-Cutting Symptom Assessment for DSM-
5. American Journal of Psychiatry, 170(1), 71–82.
https://doi.org/10.1176/appi.ajp.2012.12071000
Nesselroade, J. R., & Molenaar, P. C. M. (2016). Some Behaviorial Science Measurement
Concerns and Proposals. Multivariate Behavioral Research, 51(2–3), 396–412.
https://doi.org/10.1080/00273171.2015.1050481
Newman, M. E. J. (2010). Networks: An Introduction (1st ed.). Oxford University Press, USA.
Newman, M. E. J., & Girvan, M. (2004). Finding and evaluating community structure in
networks. Physical Review E, 69(2), 026113.
Nunnally, J. C., & Bernstein, I. H. (1994). Psychometric Theory (3rd ed.). New York: McGraw-
Hill.
Ogarrio, J. M., Spirtes, P., & Ramsey, J. (2016). A Hybrid Causal Search Algorithm for Latent
Variable Models. JMLR Workshop and Conference Proceedings, 52, 368–379.
Pearl, J. (2000). Causality: models, reasoning, and inference. Cambridge University Press.
Pearl, J. (2009). Causality: Models, Reasoning and Inference (2nd edition). New York, NY:
Cambridge University Press.
Pearl, J. (2012). The causal foundations of structural equation modeling. In R. H. Hoyle (Ed.),
Handbook of structural equation modeling (pp. 68–91). New York: Guilford Press.
R Core Team. (2017). R: A language and environment for statistical computing (Version 3.4.0).
Vienna, Austria: R Foundation for Statistical Computing.

NETWORK ANALYSES OF PSYCHOPATHOLOGY IN CROSS-SECTION 55
Regier, D. A., Narrow, W. E., Clarke, D. E., Kraemer, H. C., Kuramoto, S. J., Kuhl, E. A., &
Kupfer, D. J. (2013). DSM-5 Field Trials in the United States and Canada, Part II: Test-
Retest Reliability of Selected Categorical Diagnoses. American Journal of Psychiatry,
170(1), 59–70. https://doi.org/10.1176/appi.ajp.2012.12070999
Reise, S. P. (2012). The Rediscovery of Bifactor Measurement Models. Multivariate Behavioral
Research, 47(5), 667–696. https://doi.org/10.1080/00273171.2012.715555
Rhemtulla, M., Brosseau-Liard, P. É., & Savalei, V. (2012). When can categorical variables be
treated as continuous? A comparison of robust continuous and categorical SEM
estimation methods under suboptimal conditions. Psychological Methods, 17(3), 354–
373. https://doi.org/10.1037/a0029315
Robins, E., & Guze, S. B. (1970). Establishment of diagnostic validity in psychiatric illness: its
application to schizophrenia. American Journal of Psychiatry, 126(7), 983–987.
Rosseel, Y. (2012). lavaan: An R package for structural equation modeling. Journal of Statistical
Software, 48(2), 1–36.
Salvatore, J. E., Aliev, F., Bucholz, K., Agrawal, A., Hesselbrock, V., Hesselbrock, M., … Dick,
D. M. (2014). Polygenic Risk for Externalizing Disorders Gene-by-Development and
Gene-by-Environment Effects in Adolescents and Young Adults. Clinical Psychological
Science, 2167702614534211. https://doi.org/10.1177/2167702614534211
Schomerus, G., Schwahn, C., Holzinger, A., Corrigan, P. W., Grabe, H. J., Carta, M. G., &
Angermeyer, M. C. (2012). Evolution of public attitudes about mental illness: a
systematic review and meta-analysis: Evolution of public attitudes. Acta Psychiatrica
Scandinavica, 125(6), 440–452. https://doi.org/10.1111/j.1600-0447.2012.01826.x

NETWORK ANALYSES OF PSYCHOPATHOLOGY IN CROSS-SECTION 56
Sharp, C., Wright, A. G. C., Fowler, J. C., Frueh, B. C., Allen, J. G., Oldham, J., & Clark, L. A.
(2015). The structure of personality pathology: Both general (‘g’) and specific (‘s’)
factors? Journal of Abnormal Psychology, 124(2), 387–398.
http://dx.doi.org.ezaccess.libraries.psu.edu/10.1037/abn0000033
Silva, R., Scheines, R., Glymour, C., & Spirtes, P. (2006). Learning the Structure of Linear
Latent Variable Models. Journal of Machine Learning Research, 7, 191–246.
Spirtes, P., & Zhang, K. (2016). Causal discovery and inference: concepts and recent
methodological advances. Applied Informatics, 3. https://doi.org/10.1186/s40535-016-
0018-x
Tomarken, A. J., & Waller, N. G. (2005). Structural equation modeling: Strengths, limitations,
and misconceptions. Annual Review of Clinical Psychology, 1(1), 31–65.
van Bork, R., Epskamp, S., Rhemtulla, M., Borsboom, D., & van der Maas, H. L. J. (2017).
What is the p-factor of psychopathology? Some risks of general factor modeling. Theory
& Psychology, 27(6), 759–773. https://doi.org/10.1177/0959354317737185
van Borkulo, C. D., Borsboom, D., Epskamp, S., Blanken, T. F., Boschloo, L., Schoevers, R. A.,
& Waldorp, L. J. (2015). A new method for constructing networks from binary data.
Scientific Reports, 4(1). https://doi.org/10.1038/srep05918
Van Der Maas, H. L. J., Dolan, C. V., Grasman, R. P. P. P., Wicherts, J. M., Huizenga, H. M., &
Raijmakers, M. E. J. (2006). A dynamical model of general intelligence: The positive
manifold of intelligence by mutualism. Psychological Review, 113(4), 842–861.
https://doi.org/10.1037/0033-295X.113.4.842

NETWORK ANALYSES OF PSYCHOPATHOLOGY IN CROSS-SECTION 57
Watson, D. (2005). Rethinking the mood and anxiety disorders: A quantitative hierarchical
model for DSM-V. Journal of Abnormal Psychology, 114(4), 522–536.
https://doi.org/10.1037/0021-843X.114.4.522
Widiger, T. A., & Trull, T. J. (2007). Plate tectonics in the classification of personality disorder:
Shifting to a dimensional model. American Psychologist, 62(2), 71–83.
Wiggins, J. S., & Pincus, A. L. (2002). Personality structure and the structure of personality
disorders. In P. T. Costa Jr & T. A. Widiger (Eds.), Personality disorders and the five-
factor model of personality (2nd ed., pp. 103–124). Washington, DC, US: American
Psychological Association.
Williams, L. J. (2012). Equivalent models: Concepts, problems, alternatives. In Rick H. Hoyle
(Ed.), Handbook of structural equation modeling (pp. 247–260). New York, NY, US:
The Guilford Press.
Williams, L. J., Hartman, N., & Cavazotte, F. (2010). Method Variance and Marker Variables: A
Review and Comprehensive CFA Marker Technique. Organizational Research Methods,
13(3), 477–514. https://doi.org/10.1177/1094428110366036
Yuan, M. (2012). Discussion: Latent variable graphical model selection via convex optimization.
The Annals of Statistics, 40(4), 1968–1972. https://doi.org/10.1214/12-AOS979

NETWORK ANALYSES OF PSYCHOPATHOLOGY IN CROSS-SECTION 58
Figures
Figure 1. Example correlation matrices based on marginal association (a, c) and
regularized partial correlation (b, d). The top row depicts the two-factor orthogonal Pearson (a)
and EBICGLASSO partial (b) correlations for a representative covariance matrix. The bottom
row depicts the correlated factors model (r = 0.4) for Pearson (c) and EBICGLASSO partial (d)
correlations. Indicators y1-10 load onto one factor, whereas indicators y11-y20 load onto
another.
y1y2y3y4y5y6y7y8y9y10y11y12y13y14y15y16y17y18y19y20
y1 y2 y3 y4 y5 y6 y7 y8 y9 y10
y11
y12
y13
y14
y15
y16
y17
y18
y19
y20
0.00.20.40.60.8
Correlation(Pearson r)
a)
y1y2y3y4y5y6y7y8y9y10y11y12y13y14y15y16y17y18y19y20
y1 y2 y3 y4 y5 y6 y7 y8 y9 y10
y11
y12
y13
y14
y15
y16
y17
y18
y19
y20
0.0
0.1
0.2
Correlation(Partial r)
b)
y1y2y3y4y5y6y7y8y9y10y11y12y13y14y15y16y17y18y19y20
y1 y2 y3 y4 y5 y6 y7 y8 y9 y10
y11
y12
y13
y14
y15
y16
y17
y18
y19
y20
0.00.20.40.60.8
Correlation(Pearson r)
c)
y1y2y3y4y5y6y7y8y9y10y11y12y13y14y15y16y17y18y19y20
y1 y2 y3 y4 y5 y6 y7 y8 y9 y10
y11
y12
y13
y14
y15
y16
y17
y18
y19
y20
0.0
0.1
0.2
Correlation(Partial r)
d)

NETWORK ANALYSES OF PSYCHOPATHOLOGY IN CROSS-SECTION 59
Figure 2. Adjacency matrices for two-factor orthogonal (left; cf. Figure 1b) and
correlated (right; cf. Figure 1d) example graphs using the EBICGLASSO method. Note that
indicators y1-10 load onto one factor, whereas indicators y11-y20 load onto another.
y1 y2y3
y4
y5
y6
y7
y8y9
y10y11y12y13
y14
y15
y16
y17
y18y19
y20
Two−Factor Orthogonal
y1 y2y3
y4
y5
y6
y7
y8y9
y10y11y12y13
y14
y15
y16
y17
y18y19
y20
0.0
0.1
0.2
Partialcorrelation
Two−Factor Correlated

NETWORK ANALYSES OF PSYCHOPATHOLOGY IN CROSS-SECTION 60
Figure 3. The effects of factor loading and summed off-factor associations on graph
metrics in orthogonal (panel a) and correlated (panel b) two-factor CFAs. Bars denote the
standardized coefficients from a multilevel model in which a given nodal graph metric (e.g.,
strength) is regressed on corresponding fitted factor loadings and the sum of the node’s
conditional associations with items from the other latent factor. Black bars denote the 99%
confidence limits on the standardized coefficients.
Strength Closeness Betweenness
loading off−factorsum
loading off−factorsum
loading off−factorsum
0.0
0.2
0.4
0.6
0.8
Predictor
Stan
dard
ized
coef
ficie
nt
Two−Factor ModelOrthogonalCorrelated

NETWORK ANALYSES OF PSYCHOPATHOLOGY IN CROSS-SECTION 61
Figure 4. The orthogonal factor model for Simulation 2. The association between y2 and
y12 varied parametrically between r = 0 and r = 0.64 according to the loading, α, on the specific
factor, s. Standardized loadings for all other indicators were fixed at 0.8, whereas loadings for y2
and y12 varied to hold constant the explained item variance across conditions.
y3y2 y6y1 y4 y5
f1
y7 y8 y9 y10
1
y13y12 y16y11 y14 y15
f2
y17 y18 y19 y20
1
.8.8 .8 .8 .8 .8 .8 .8 .8β
β.8
.8 .8 .8 .8 .8 .8 .8 .8
var(y2) = β2 + α2 + .36 = 1.0 var(y12) = β2 + α2 + .36 = 1.0
.36
.36
Target is y2
Comparator is y3
s1
α
α

NETWORK ANALYSES OF PSYCHOPATHOLOGY IN CROSS-SECTION 62
Figure 5. Edge strength between correlated items as a function of variance explained by a
specific bivariate association. In all conditions, 64% of the variance in y2 and y12 was accounted
for by the model. When zero variance was explained by the factor (i.e., the factor loadings were
zero for y2 and y11), all variance was explained by the unique (marginal) association.
Conversely, when all variance was explained by the factor, y2 and y11 had no specific
association. Lines denote the mean edge strength across the 100 replications of each condition.
Gray ribbons around the lines denote the bootstrapped 99% confidence interval.
0.0
0.2
0.4
0.6
0.0 0.1 0.2 0.3 0.4 0.5 0.6
Variance explained by specific association
Aver
age
edge
stre
ngth
bet
ween
y2
and
y11

NETWORK ANALYSES OF PSYCHOPATHOLOGY IN CROSS-SECTION 63
Figure 6. Nodal graph metrics as a function of variance explained in the target nodes, y2
and y12, by common factor or unique sources (see Figure 4). Note that the scale of the y axis
varies substantially across panels. The x axis represents difference in the variance explained by
these sources, with the far left-hand side denoting variation completely due to a bivariate
relationship between y2 and y12 (no factor effect). The far right-hand side denotes a condition in
which all variation is due to common latent factors (no specific bivariate association). Lines
denote the mean across replications within a condition; ribbons denote the 99% bootstrapped
confidence limits of the mean. The target node depicts the effects of the simulation conditions on
y2, whereas the comparator node depicts effects on y3, whose variance was not manipulated by
the simulation.

NETWORK ANALYSES OF PSYCHOPATHOLOGY IN CROSS-SECTION 64
Figure 7. The orthogonal two-factor model with cross-loadings used in Simulation 3. As
depicted in the inset panel, the loadings of y17 (target) on f1 and f2 varied independently
between 0.2 and 0.8 in 0.05 increments. Standardized loadings for all other indicators were fixed
at 0.8, and residual item variances were fixed at 0.3.
y17
y2 y5y1 y3 y4
f1
y6 y7 y8
1
.8 .8 .8 .8 .8 .8 .8 .8
Simulation conditions
0.2
0.4
0.6
0.8
0.2 0.4 0.6 0.8Factor 1 loading
Fact
or 2
load
ing
0.40.81.21.6
Summedloadings
y10 y13y9 y11 y12
f2
y14 y15 y16
1
.8 .8 .8 .8 .8 .8 .8 .8
λ17,1
λ 17,2
λ17,1
λ17,2
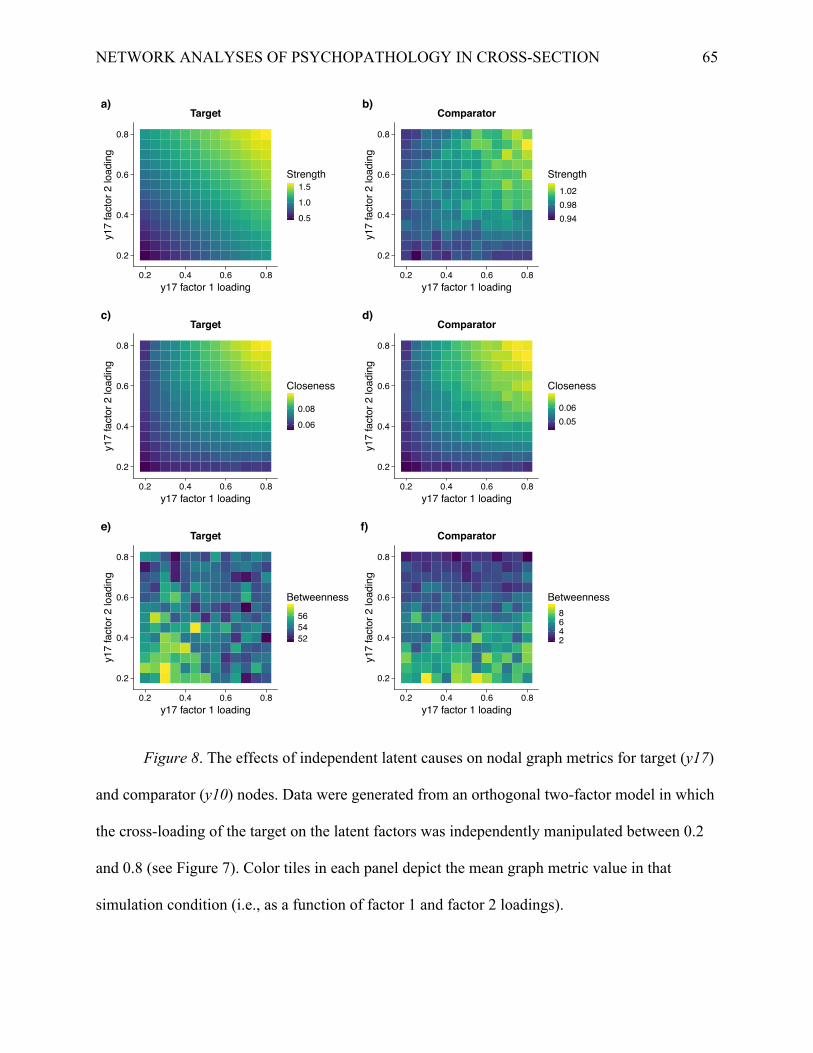
NETWORK ANALYSES OF PSYCHOPATHOLOGY IN CROSS-SECTION 65
Figure 8. The effects of independent latent causes on nodal graph metrics for target (y17)
and comparator (y10) nodes. Data were generated from an orthogonal two-factor model in which
the cross-loading of the target on the latent factors was independently manipulated between 0.2
and 0.8 (see Figure 7). Color tiles in each panel depict the mean graph metric value in that
simulation condition (i.e., as a function of factor 1 and factor 2 loadings).
0.2
0.4
0.6
0.8
0.2 0.4 0.6 0.8y17 factor 1 loading
y17
fact
or 2
load
ing
0.51.01.5
Strength
Targeta)
0.2
0.4
0.6
0.8
0.2 0.4 0.6 0.8y17 factor 1 loading
y17
fact
or 2
load
ing
0.940.981.02
Strength
Comparatorb)
0.2
0.4
0.6
0.8
0.2 0.4 0.6 0.8y17 factor 1 loading
y17
fact
or 2
load
ing
0.06
0.08
Closeness
Targetc)
0.2
0.4
0.6
0.8
0.2 0.4 0.6 0.8y17 factor 1 loading
y17
fact
or 2
load
ing
0.050.06
Closeness
Comparatord)
0.2
0.4
0.6
0.8
0.2 0.4 0.6 0.8y17 factor 1 loading
y17
fact
or 2
load
ing
525456
Betweenness
Targete)
0.2
0.4
0.6
0.8
0.2 0.4 0.6 0.8y17 factor 1 loading
y17
fact
or 2
load
ing
2468
Betweenness
Comparatorf)

NETWORK ANALYSES OF PSYCHOPATHOLOGY IN CROSS-SECTION 66
Figure 9. The performance of three algorithms (glasso, LVglasso, CPW) in recovering a
graph structure (upper left panel) that depends on latent variables. The glasso algorithm has been
used extensively in the network psychometrics literature, but performs rather poorly in the
presence of latent confounding (upper right panel). By contrast, the LVglasso and CPW
algorithms, which seek to identify latent variables as part of estimating the graph, recover the
structure reasonably well. LVglasso = latent variable graphical lasso; CPW = latent variable
graphical model selection method of Chandrasekaran, Parrillo, and Willsky (2012). Figure
reprinted from Yuan (2012); permission pending.
COMMENT 1971
FIG. 1. True graphical model and its estimates.
to the data. We used the MATLAB code provided by CPW to compute their esti-mates. As observed by CPW, their estimate typically is insensitive to a wide rangeof values of γ , and we report here the results with the default choice of γ = 5without loss of generality. Similarly, for LVglasso, little variation was observedfor r = 2, . . . ,10, and we shall focus on r = 2 for brevity. The choice of λ playsa critical role for both methods. We compute both estimators for a fine grid of λ.With the main focus on recovering the conditional graphical model, that is, thesparsity pattern of S, we report in Figure 2 the ROC curve for both methods. Forcontrast, we also reported the result for glasso which neglects the missingness.In Figure 1, we also presented the estimated graphical model for each method thatis closest to the truth. These results clearly demonstrate the necessity of account-ing for the latent variables. It is also interesting to note that the rank constrainedestimator performs slightly better in this example over the trace norm penalizationmethod of CPW.
The preliminary results presented here suggest that direct rank constraint mayprovide a competitive alternative to the trace norm penalization for recovering

NETWORK ANALYSES OF PSYCHOPATHOLOGY IN CROSS-SECTION 67
Table 1. Correspondence between nodal centrality statistics and fitted factor loadings
Model M r with strength (SDbw, SDwi)
M r with closeness (SDbw, SDwi)
M r with betweenness (SDbw, SDwi)
One-factor CFA
0.98 (.005, .01)
0.94 (.01, .03)
0.74 (.05, .13)
Two-factor CFA, Orthogonal
.98 (.007,
.01) .42 (.06, .31)
0.37 (.08, .27)
Two-factor CFA, Correlated
0.97 (.007, .01)
.51 (.07,
.27) .44 (.07, .25)
Three-factor CFA, Orthogonal
0.98 (.007, .01)
.42 (.06,
.31) .31 (.07, .28)
Three-factor CFA, Correlated
0.97 (.009, .01)
.55 (.06,
.26) .41 (.06, .26)
Note. SDbw reflects the standard deviation of the association between factor loadings and centrality metrics across independent examples/population models (n = 50). SDwi reflects the standard deviation of the association between factor loadings and centrality metrics within replication samples from a given population model (n = 100).

NETWORK ANALYSES OF PSYCHOPATHOLOGY IN CROSS-SECTION 68
Table 2. Effects of variance balance and node type on nodal metrics in Simulation 2
Metric Effect F (df1, df2) Generalized 𝜂G
Strength Variance balance (unique to shared)
45.42 (64, 6435) .20
Node type (target versus comparator)
15320.34 (1, 6435) .51
Variance balance x node type 47.62 (64, 6435) .17
Closeness Variance balance (unique to shared)
249.71 (64, 6435) .68
Node type (target versus comparator)
26350.16 (1, 6435) .34
Variance balance x node type 145.54 (64, 6435) .15
Betweenness Variance balance (unique to shared)
64.44 (64, 6435) .24
Node type (target versus comparator)
26772.13 (1, 6435) .68
Variance balance x node type 78.63 (64, 6435) .29

NETWORK ANALYSES OF PSYCHOPATHOLOGY IN CROSS-SECTION 69
Supplementary materials for Hallquist, Wright, and Molenaar
Network analyses of psychopathology in cross-section:
Why network psychometrics cannot escape psychometric theory

NETWORK ANALYSES OF PSYCHOPATHOLOGY IN CROSS-SECTION 70
Figure S1. Nodal graph metrics as a function of variance explained in the target nodes, y2 and y12, by common factor or unique sources (cf. Figure 7). Here, we include the effect of the simulation on graph metrics when the graph was

NETWORK ANALYSES OF PSYCHOPATHOLOGY IN CROSS-SECTION 71
constructed from marginal correlations. More specifically, the Cor.Shrink panel depicts graph metrics when edge weights reflected a shrinkage estimate of the zero-order correlation among items (cor.shrink function from the corpcor package; Schäfer & Strimmer, 2005).
The x axis represents difference in the variance explained by these sources, with the far left-hand side denoting variation completely due to a bivariate relationship between y2 and y12 (no factor effect). The far right-hand side denotes a condition in which all variation is due to common latent factors (no unique residual association). Lines denote the mean across replications within a condition; ribbons denote the 99% bootstrapped confidence limits of the mean. The target node depicts the effects of the simulation conditions on y2, whereas the comparator node depicts effects on y3, whose variance was not manipulated by the simulation.
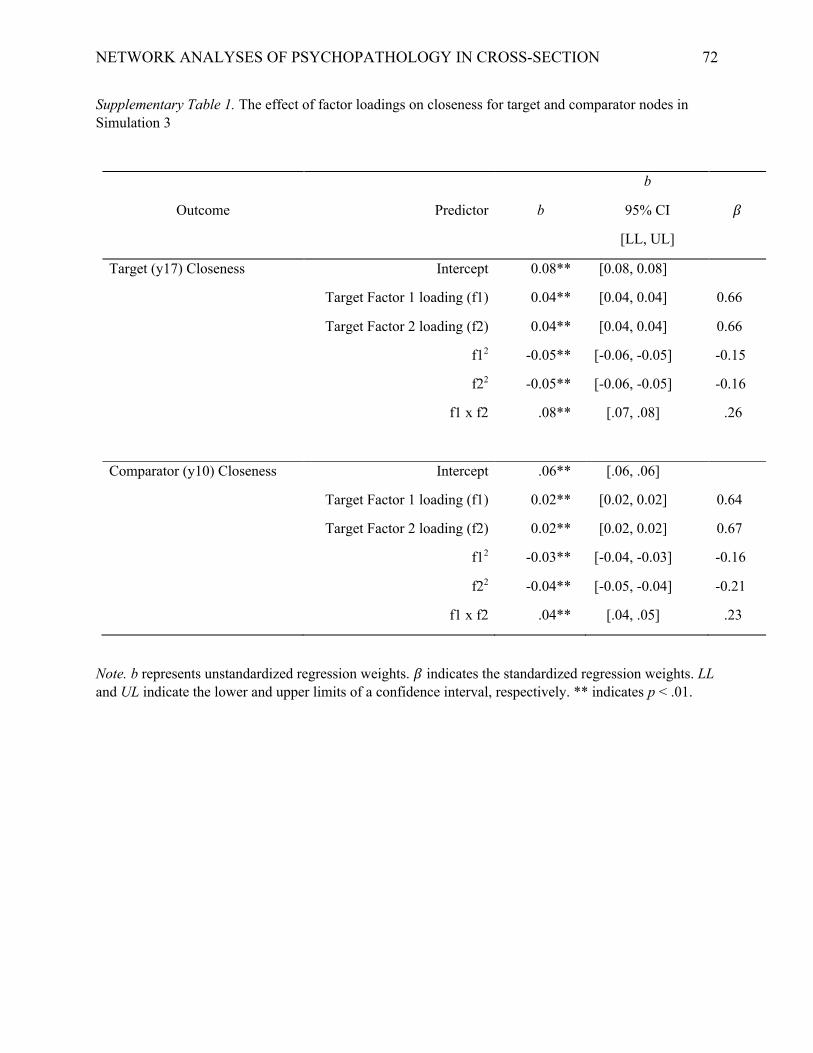
NETWORK ANALYSES OF PSYCHOPATHOLOGY IN CROSS-SECTION 72
Supplementary Table 1. The effect of factor loadings on closeness for target and comparator nodes in Simulation 3
Outcome Predictor b
b
95% CI
[LL, UL]
𝛽
Target (y17) Closeness Intercept 0.08** [0.08, 0.08]
Target Factor 1 loading (f1) 0.04** [0.04, 0.04] 0.66
Target Factor 2 loading (f2) 0.04** [0.04, 0.04] 0.66
f12 -0.05** [-0.06, -0.05] -0.15
f22 -0.05** [-0.06, -0.05] -0.16
f1 x f2 .08** [.07, .08] .26
Comparator (y10) Closeness Intercept .06** [.06, .06]
Target Factor 1 loading (f1) 0.02** [0.02, 0.02] 0.64
Target Factor 2 loading (f2) 0.02** [0.02, 0.02] 0.67
f12 -0.03** [-0.04, -0.03] -0.16
f22 -0.04** [-0.05, -0.04] -0.21
f1 x f2 .04** [.04, .05] .23
Note. b represents unstandardized regression weights. 𝛽 indicates the standardized regression weights. LL and UL indicate the lower and upper limits of a confidence interval, respectively. ** indicates p < .01.

NETWORK ANALYSES OF PSYCHOPATHOLOGY IN CROSS-SECTION 73
Supplementary Table 2. The effect of factor loadings on betweenness for target and comparator nodes in Simulation 3
Outcome Predictor b
b
95% CI
[LL, UL]
𝛽
Target (y17) Betweenness Intercept 54.26** [54.11, 54.42]
Target Factor 1 loading (f1) -2.74** [-3.56, -1.92] -0.39
Target Factor 2 loading (f2) -2.86** [-3.68, -2.04] -0.40
f1 x f2 12.60** [8.21, 17.00] 0.33
Comparator (y10) Betweenness Intercept 5.08** [4.94, 5.22]
Target Factor 1 loading (f1) 0.56 [-0.19, 1.30] 0.06
Target Factor 2 loading (f2) -7.46** [-8.21, -6.71] -0.84
f1 x f2 -0.56 [-4.57, 3.45] -0.01
Note. b represents unstandardized regression weights. 𝛽 indicates the standardized regression weights. LL and UL indicate the lower and upper limits of a confidence interval, respectively. ** indicates p < .01.