Neonatal, postneonatal, childhood, and under-5 mortality for 187 countries, 1970–2010: a...
21
1988 www.thelancet.com Vol 375 June 5, 2010 Articles Lancet 2010; 375: 1988–2008 Published Online May 24, 2010 DOI:10.1016/S0140- 6736(10)60703-9 See Comment page 1941 Institute for Health Metrics and Evaluation, University of Washington, Seattle, WA, USA (J K Rajaratnam PhD, J R Marcus BA, A D Flaxman PhD, H Wang PhD, A Levin-Rector BSPH, L Dwyer BA, M Costa BA, Prof C J L Murray MD); and School of Population Health, University of Queensland, Brisbane, QLD, Australia (Prof A D Lopez PhD) Correspondence to: Prof Christopher J L Murray, Institute for Health Metrics and Evaluation, University of Washington, 2301 5th Avenue, Suite 600, Seattle, WA 98121, USA [email protected] Neonatal, postneonatal, childhood, and under-5 mortality for 187 countries, 1970–2010: a systematic analysis of progress towards Millennium Development Goal 4 Julie Knoll Rajaratnam, Jake R Marcus, Abraham D Flaxman, Haidong Wang, Alison Levin-Rector, Laura Dwyer, Megan Costa, Alan D Lopez, Christopher J L Murray Summary Background Previous assessments have highlighted that less than a quarter of countries are on track to achieve Millennium Development Goal 4 (MDG 4), which calls for a two-thirds reduction in mortality in children younger than 5 years between 1990 and 2015. In view of policy initiatives and investments made since 2000, it is important to see if there is acceleration towards the MDG 4 target. We assessed levels and trends in child mortality for 187 countries from 1970 to 2010. Methods We compiled a database of 16 174 measurements of mortality in children younger than 5 years for 187 countries from 1970 to 2009, by use of data from all available sources, including vital registration systems, summary birth histories in censuses and surveys, and complete birth histories. We used Gaussian process regression to generate estimates of the probability of death between birth and age 5 years. This is the first study that uses Gaussian process regression to estimate child mortality, and this technique has better out-of-sample predictive validity than do previous methods and captures uncertainty caused by sampling and non-sampling error across data types. Neonatal, postneonatal, and childhood mortality was estimated from mortality in children younger than 5 years by use of the 1760 measurements from vital registration systems and complete birth histories that contained specific information about neonatal and postneonatal mortality. Findings Worldwide mortality in children younger than 5 years has dropped from 11·9 million deaths in 1990 to 7·7 million deaths in 2010, consisting of 3·1 million neonatal deaths, 2·3 million postneonatal deaths, and 2·3 million childhood deaths (deaths in children aged 1–4 years). 33·0% of deaths in children younger than 5 years occur in south Asia and 49·6% occur in sub-Saharan Africa, with less than 1% of deaths occurring in high-income countries. Across 21 regions of the world, rates of neonatal, postneonatal, and childhood mortality are declining. The global decline from 1990 to 2010 is 2·1% per year for neonatal mortality, 2·3% for postneonatal mortality, and 2·2% for childhood mortality. In 13 regions of the world, including all regions in sub-Saharan Africa, there is evidence of accelerating declines from 2000 to 2010 compared with 1990 to 2000. Within sub-Saharan Africa, rates of decline have increased by more than 1% in Angola, Botswana, Cameroon, Congo, Democratic Republic of the Congo, Kenya, Lesotho, Liberia, Rwanda, Senegal, Sierra Leone, Swaziland, and The Gambia. Interpretation Robust measurement of mortality in children younger than 5 years shows that accelerating declines are occurring in several low-income countries. These positive developments deserve attention and might need enhanced policy attention and resources. Funding Bill & Melinda Gates Foundation. Introduction There are only 5 years left to achieve Millennium Development Goal 4 (MDG 4), which calls for a two-thirds reduction in mortality in children younger than 5 years between 1990 and 2015. Regular assessment of levels and trends in child mortality is essential for countries to ascertain their progress towards this goal and to take action to meet it. Previous appraisals of mortality in children younger than 5 years suggest that few countries are on track to meet MDG 4. 1–3 In each of these studies, 1–3 no more than 26% of low-income and middle-income countries examined were deemed to be on track to reach this target. Groups such as the Countdown to 2015 Initiative 3 have therefore tried to rally support to accelerate progress in child mortality. 4–7 The MDG 4 target has shifted the focus from tracking levels of child mortality to assessing whether countries are reducing child mortality at the 4·4% rate per year needed to achieve the two-thirds reduction in 25 years. Accurate assessments of rates of change need more robust measurement with narrower uncertainty intervals than do assessments of levels. Although there have been substantial investments in the collection of data such as summary and complete birth histories to measure child mortality, assessments of trends have varied substantially from year to year and from source to source. For example, the list of the ten countries with the fastest rates of decline in child mortality between 1990 and 2007, as reported by UNICEF in 2008, 8 UNICEF in 2009, 9 and the UN
-
Upload
independent -
Category
Documents
-
view
1 -
download
0
Transcript of Neonatal, postneonatal, childhood, and under-5 mortality for 187 countries, 1970–2010: a...
1988 www.thelancet.com Vol 375 June 5, 2010
Articles
Lancet 2010; 375: 1988–2008
Published OnlineMay 24, 2010
DOI:10.1016/S0140-6736(10)60703-9
See Comment page 1941
Institute for Health Metrics and Evaluation, University of
Washington, Seattle, WA, USA (J K Rajaratnam PhD,
J R Marcus BA, A D Flaxman PhD, H Wang PhD,
A Levin-Rector BSPH, L Dwyer BA, M Costa BA,
Prof C J L Murray MD); and School of Population Health,
University of Queensland, Brisbane, QLD, Australia
(Prof A D Lopez PhD)
Correspondence to: Prof Christopher J L Murray,
Institute for Health Metrics and Evaluation, University of
Washington, 2301 5th Avenue, Suite 600, Seattle,
WA 98121, [email protected]
Neonatal, postneonatal, childhood, and under-5 mortality for 187 countries, 1970–2010: a systematic analysis of progress towards Millennium Development Goal 4Julie Knoll Rajaratnam, Jake R Marcus, Abraham D Flaxman, Haidong Wang, Alison Levin-Rector, Laura Dwyer, Megan Costa, Alan D Lopez, Christopher J L Murray
SummaryBackground Previous assessments have highlighted that less than a quarter of countries are on track to achieve Millennium Development Goal 4 (MDG 4), which calls for a two-thirds reduction in mortality in children younger than 5 years between 1990 and 2015. In view of policy initiatives and investments made since 2000, it is important to see if there is acceleration towards the MDG 4 target. We assessed levels and trends in child mortality for 187 countries from 1970 to 2010.
Methods We compiled a database of 16 174 measurements of mortality in children younger than 5 years for 187 countries from 1970 to 2009, by use of data from all available sources, including vital registration systems, summary birth histories in censuses and surveys, and complete birth histories. We used Gaussian process regression to generate estimates of the probability of death between birth and age 5 years. This is the fi rst study that uses Gaussian process regression to estimate child mortality, and this technique has better out-of-sample predictive validity than do previous methods and captures uncertainty caused by sampling and non-sampling error across data types. Neonatal, postneonatal, and childhood mortality was estimated from mortality in children younger than 5 years by use of the 1760 measurements from vital registration systems and complete birth histories that contained specifi c information about neonatal and postneonatal mortality.
Findings Worldwide mortality in children younger than 5 years has dropped from 11·9 million deaths in 1990 to 7·7 million deaths in 2010, consisting of 3·1 million neonatal deaths, 2·3 million postneonatal deaths, and 2·3 million childhood deaths (deaths in children aged 1–4 years). 33·0% of deaths in children younger than 5 years occur in south Asia and 49·6% occur in sub-Saharan Africa, with less than 1% of deaths occurring in high-income countries. Across 21 regions of the world, rates of neonatal, postneonatal, and childhood mortality are declining. The global decline from 1990 to 2010 is 2·1% per year for neonatal mortality, 2·3% for postneonatal mortality, and 2·2% for childhood mortality. In 13 regions of the world, including all regions in sub-Saharan Africa, there is evidence of accelerating declines from 2000 to 2010 compared with 1990 to 2000. Within sub-Saharan Africa, rates of decline have increased by more than 1% in Angola, Botswana, Cameroon, Congo, Democratic Republic of the Congo, Kenya, Lesotho, Liberia, Rwanda, Senegal, Sierra Leone, Swaziland, and The Gambia.
Interpretation Robust measurement of mortality in children younger than 5 years shows that accelerating declines are occurring in several low-income countries. These positive developments deserve attention and might need enhanced policy attention and resources.
Funding Bill & Melinda Gates Foundation.
IntroductionThere are only 5 years left to achieve Millennium Development Goal 4 (MDG 4), which calls for a two-thirds reduction in mortality in children younger than 5 years between 1990 and 2015. Regular assessment of levels and trends in child mortality is essential for countries to ascertain their progress towards this goal and to take action to meet it. Previous appraisals of mortality in children younger than 5 years suggest that few countries are on track to meet MDG 4.1–3 In each of these studies,1–3 no more than 26% of low-income and middle-income countries examined were deemed to be on track to reach this target. Groups such as the Countdown to 2015 Initiative3 have therefore tried to rally support to accelerate progress in child mortality.4–7
The MDG 4 target has shifted the focus from tracking levels of child mortality to assessing whether countries are reducing child mortality at the 4·4% rate per year needed to achieve the two-thirds reduction in 25 years. Accurate assessments of rates of change need more robust measurement with narrower uncertainty intervals than do assessments of levels. Although there have been substantial investments in the collection of data such as summary and complete birth histories to measure child mortality, assessments of trends have varied substantially from year to year and from source to source. For example, the list of the ten countries with the fastest rates of decline in child mortality between 1990 and 2007, as reported by UNICEF in 2008,8 UNICEF in 2009,9 and the UN
Articles
www.thelancet.com Vol 375 June 5, 2010 1989
Population Division (UNPD) in 2009,10 have only three countries in common: Portugal, Vietnam, and the Maldives. In 2008, UNICEF reported that Thailand had the fastest rate of decline in the world, leading researchers to undertake a case study of this success.11 But in 2009, UNICEF reported that Thailand had only the 47th fastest rate of decline;9 in a UNPD report, the country had the fourth fastest rate of decline.10 Such confusion about the true extent of progress can foster policy inaction in countries, precisely at a time when targeted, eff ective programmes are needed most. Variation in the assessments of rates of decline indicates the availability and use of diff erent datasets, diff erent analytical methods, and diff erent decisions about data quality by the analysts.
Evidence from several low-income countries suggests that in some countries, declines in mortality in children younger than 5 years might have accelerated since 2000,12–14 whereas in others, the rate of decline might be slowing. During the 25 years of the MDG 4 target, countries are likely to experience accelerations and decelerations in rates of decline. Acceleration matters because it could be an early indication of policy or programme success. The need to use the best datasets and the most valid methods for assessing child mortality over time is only intensifi ed when trying to detect such accelerations and decelerations. In view of the scale-up in
development assistance for health,15 the expansion of insecticide-treated net coverage,16 activity of the GAVI Alliance,17 and rollout of antiretroviral drugs,18 there are many reasons to hope that accelerations might be occurring in some countries.
In this study, we examined levels, rates of decline, and accelerations and decelerations in rates of decline in neonatal, post neonatal, childhood, and under-5 mortality from 1970 to 2010 in 187 countries. This study was aided by four important developments since the previous studies were done. First, we made use of data that have been newly released or acquired during an intensive 3-year eff ort to obtain access to microdata (individual-level data) and tabulated data sources. Second, we used new methods to analyse data from summary birth histories with reduced bias and measurement error.19 Third, we applied new data synthesis methods with enhanced predictive validity to combine data from several sources and capture both sampling and non-sampling error patterns. This new method requires many fewer subjective inputs to estimation, ensuring that the output is strongly grounded in empirical data and is as reproducible as possible. Finally, we took advantage of more data and better models with improved predictive validity to analyse country patterns of neonatal, postneonatal, and childhood mortality.
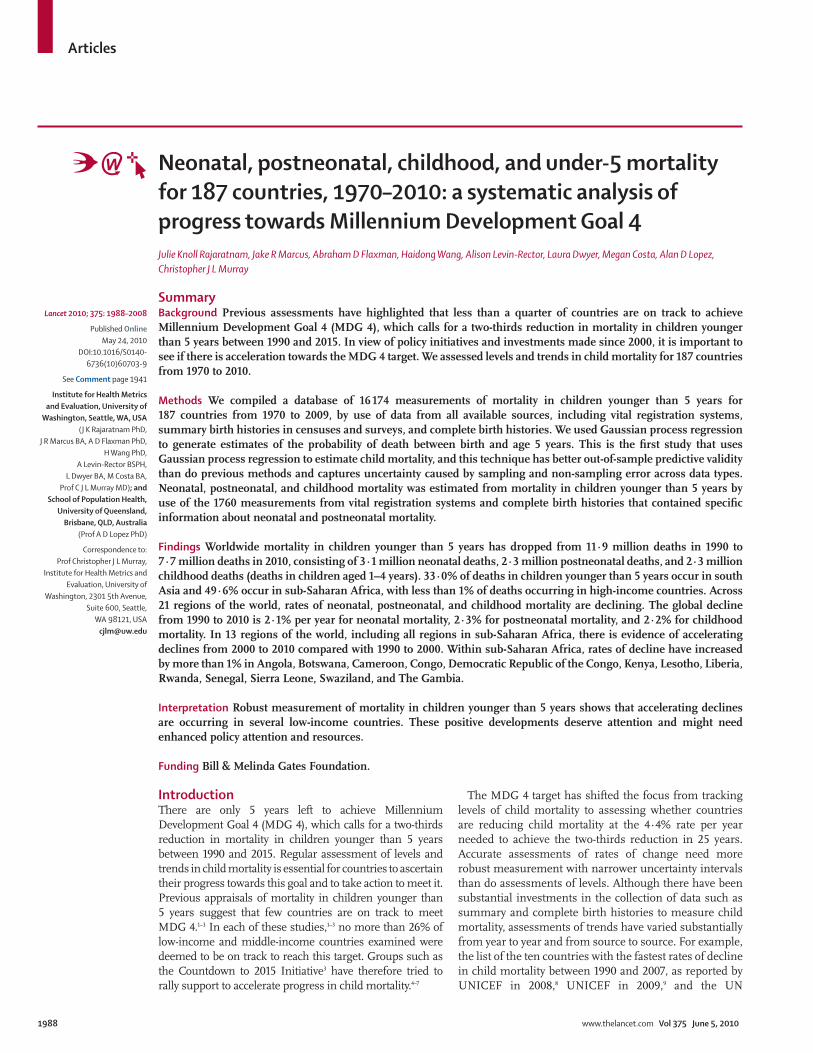
Figure 1: Empirical data sources and estimated under-5 mortality from 1970 to 2010 for selected countriesDashed lines indicate uncertainty intervals. Hollow circles represent outliers. Under-5 mortality is defi ned as the probability of death between birth and age 5 years. Upward-pointing triangles are direct estimates from complete birth histories. Downward-pointing triangles are indirect estimates from summary birth histories.
Unde
r-5 m
orta
lity
(per
100
0)Un
der-5
mor
talit
y (p
er 1
000)
Year
Vital registration
CensusOther
Norway
16
0
1970 1980 1990 2000 2010
4
6
8
12
14
10
300
0
50
100
150
250
200
A
Year
Demographic and Health SurveysCenters for Disease Control and Prevention Reproductive Health SurveysCensusVital registrationOther
El Salvador
0
1970 1980 1990 2000 2010
50
150
100
200B
LaosC LiberiaD
●●●●
●●
●●
●●
●● ●●
●●●●
●● ●●●●
●●●●
●● ●● ●●
●●
●●
●● ●●●● ●●
●●
●●
●●●●●● ●●●● ●● ●●
●●
●●
●●
●●
●●
●
●
●
●
Demographic and Health SurveysCensusHousehold deathsOtherMalaria indicator survey
350
0
50
100
150
250
200
300
Articles
1990 www.thelancet.com Vol 375 June 5, 2010
MethodsData sourcesBy use of improved methods, we substantially updated the database of measurements for under-5 mortality (defi ned as the probability of death between birth and age 5 years) used by Murray and colleagues1 in 2007 to include newly released or obtained data, as well as reanalysed microdata from many of the sources included in the 2007 database. We retained measurements from the original database if we were not able to reanalyse the source data. The database now contains 7933 more measurements than did the 2007 analysis. Data for mortality in children younger than 5 years were derived from a range of sources, including vital registration systems, sample registration systems, surveys, and censuses. A full list of data types and sources is provided in webappendix pp 211–15.
Survey measurements of under-5 mortality in the database consist of data from complete and summary birth histories. Under-5 mortality from complete birth histories in continuing survey programmes such as the Demographic and Health Surveys (DHS) were computed from pooled data across all such surveys in a given country (World Fertility Surveys, as the precursor to DHS, were included with DHS). The pooling approach mitigates some of the concerns of bias in the complete birth histories, such as selection bias for surveys in countries with high prevalence of HIV.20 If microdata
were available from summary birth histories, we estimated under-5 mortality by use of the combined method developed by Rajaratnam and colleagues.19 If microdata were not available, but we were able to obtain tabulated data for children who died and children ever-born by mother’s age, we applied the maternal age cohort-derived method.19 We analysed 545 surveys with summary birth history microdata or tabulated data and 256 surveys with complete birth history microdata. If microdata or tabulated data were not available, we included estimated values of under-5 mortality from reports, such as preliminary DHS reports.
We also analysed survey and census data for deaths in the household. We adjusted estimates on the basis of household deaths from single surveys by use of the growth balance method.21 When completeness of death reporting was estimated to be more than 100%, we adjusted the death rates downwards, with the logic that respondents might be telescoping deaths—ie, including deaths that occurred outside the recall period in the period of recall.22,23 Child death registration is usually lower than is adult death registration, so estimates corrected upward (24 in total) must be viewed as lower bound estimates of child mortality. Sensitivity of our results to inclusion of these sources is presented in webappendix pp 10–11.
Our fi nal database contained 17 208 measurements, consisting of 10 555 reanalysed measurements from summary birth histories, 1455 from complete birth histories, 79 from household deaths, 3626 from vital registration systems, and 1493 from various other sources. 1034 of the total measurements were classifi ed as outliers on the basis of examination of country plots and in some cases because of known biases in the data. We used two criteria for identifying outliers: rates of child mortality that were far beyond the plausible range in view of a country’s level of development, and rates of child mortality that were substantially inconsistent with other sources of information for the same country that cannot be explained by a known mortality shock. Generally, we favoured the inclusion of data points rather than their exclusion. We also excluded countries with populations of less than 50 000 from the analysis. Overall, we produced yearly estimates of under-5 mortality from 16 174 empirical measurements for 187 countries.
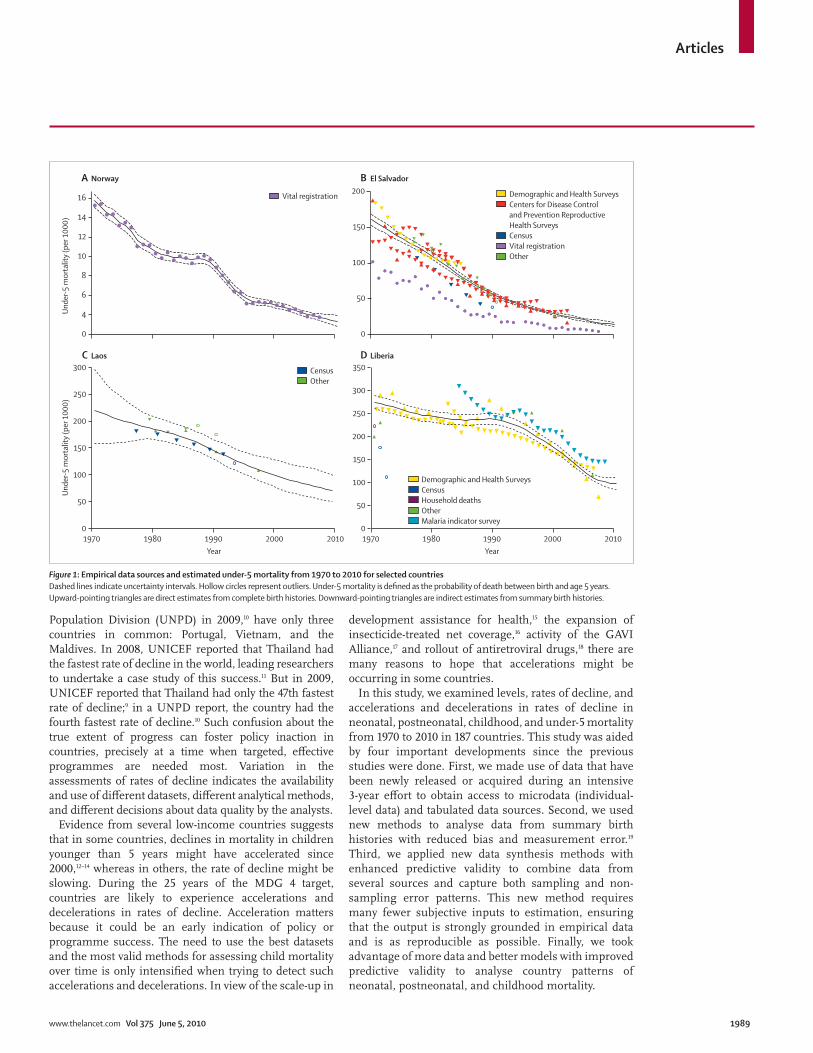
Estimation of under-5 mortality For each country, we generated a time series of estimates of under-5 mortality by synthesising the empirical data estimates with an analytical technique called Gaussian process regression (GPR).24–27 Details of the implementation of this technique are shown in webappendix pp 1–8. Briefl y, we applied Loess regression of the log of under-5 mortality in a country as a function of time and an indicator variable for measurements from vital registration data to allow for under-registration of child deaths. This predicted series was then updated by the data Figure 2: Worldwide number of deaths in children younger than 5 years from 1970 to 2010
UN Population Division (2009)10
UNICEF (2009)9
Murray et al (2007)1
Current study
01970 1980 1990
Year
Estim
ated
num
ber o
f dea
ths (
mill
ions
)
2000 2010
8
6
10
12
14
16
18
See Online for webappendix
Articles
www.thelancet.com Vol 375 June 5, 2010 1991
within each country by use of GPR. Our GPR model improves on previous approaches to synthesising measurements for under-5 mortality by providing the fl exibility to track observed trends in the data and a coherent, empirical framework for distinguishing these real trends from fl uctuations caused by sampling and non-sampling errors. Uncertainty in the measurements because of non-sampling error was captured in the model by a set of variance parameters, one for each type of data source. These parameters were estimated on the basis of the degree to which a source tends to disagree with the other sources. The more that a particular source confl icted with other sources, the higher the variance parameter will be and thus the more uncertain the measurements. The model takes this uncertainty into account as well as the sampling uncertainty and accordingly smooths data that are noisy (ie, with large variation because of sampling or small numbers) and uncertain. For countries with reliable data, the GPR estimates closely track the observed data.
As described in webappendix pp 8–10, we assessed the validity of this strategy to synthesise data sources by undertaking two types of out-of-sample predictive validity tests. When 20% of surveys and 20% of vital registration country-years were excluded from the analysis, the GPR predictions for these withheld data had a median relative error of 7·3%. When the last 10 years of data for every country with at least 20 years of data were excluded, GPR predictions had a median relative error of 10·9%. Webappendix p 212 shows the predictive validity of GPR compared with four other methods on performance in the two types of out-of-sample predictive validity tests. The four methods consist of a Loess-based approach and spline-based approaches with varying numbers of knots. GPR outperforms all four of these approaches.
One benefi t of GPR is that it improves on previous attempts to estimate uncertainty in under-5 mortality that have ignored the many sources of uncertainty beyond model specifi cation for an ad-hoc choice of model.1 The uncertainty in this application depends on the sample sizes of the measurement instruments, non-sampling error for a given data source, and aspects of the Gaussian process. Details are provided in webappendix pp 1–17.
Wars, earthquakes, and other mortality shocksPeriods that were aff ected by mortality shocks were identifi ed by data from the Uppsala Confl ict Data Program and the Centre for Research on the Epidemiology of Disasters.28–31 Deaths caused by confl ict or natural disaster from each database, in addition to population estimates from the UN,10 were used to generate a variable of war/disaster deaths per head. Any year with a value higher than a threshold of one death per 10 000 population was coded as a mortality shock year. We also examined the data from each country to identify aberrations in observed mortality that were consistent with a historical record of confl ict or disaster. Empirical data points from years classifi ed as mortality
shocks were not included in the GPR estimation. We added the shocks back in by replacing the GPR estimate with the mean of the empirical measurements in the year of the shock. For countries in which shocks were expected but not present in the data (surveys are often unable to include regions heavily aff ected by confl ict), such as the Democratic Republic of the Congo, Ethiopia, and Sudan, we used province-level data from the Complex Emergency Database (CE-DAT) to generate national estimates that were more indicative of mortality shocks.32 Unfortunately, because of the wide variation in the CE-DAT data, this eff ort did not substantially alter the GPR estimates for these countries; therefore, we did not include these data points. Because of the diffi culties inherent in obtaining reliable data that cover periods of mortality shocks, the systematic process we applied in these scenarios is imperfect and remains a limitation to our analysis. The eff ect of the Haiti 2010 earthquake was estimated by applying the same percentage increase in mortality, compared with the previous year, recorded in the Armenia 1988 earthquake.
Analysis of trendsWe computed yearly rates of change in under-5 mortality and examined rates over time for each country. The average rate of decline needed to meet MDG 4 is 4·4% per year, and across diff erent periods between 1990 and 2010, we looked at how many countries were experiencing declines at that rate or greater.
Concerns have also been raised that mortality from HIV might be diff erentially aff ecting mothers whose
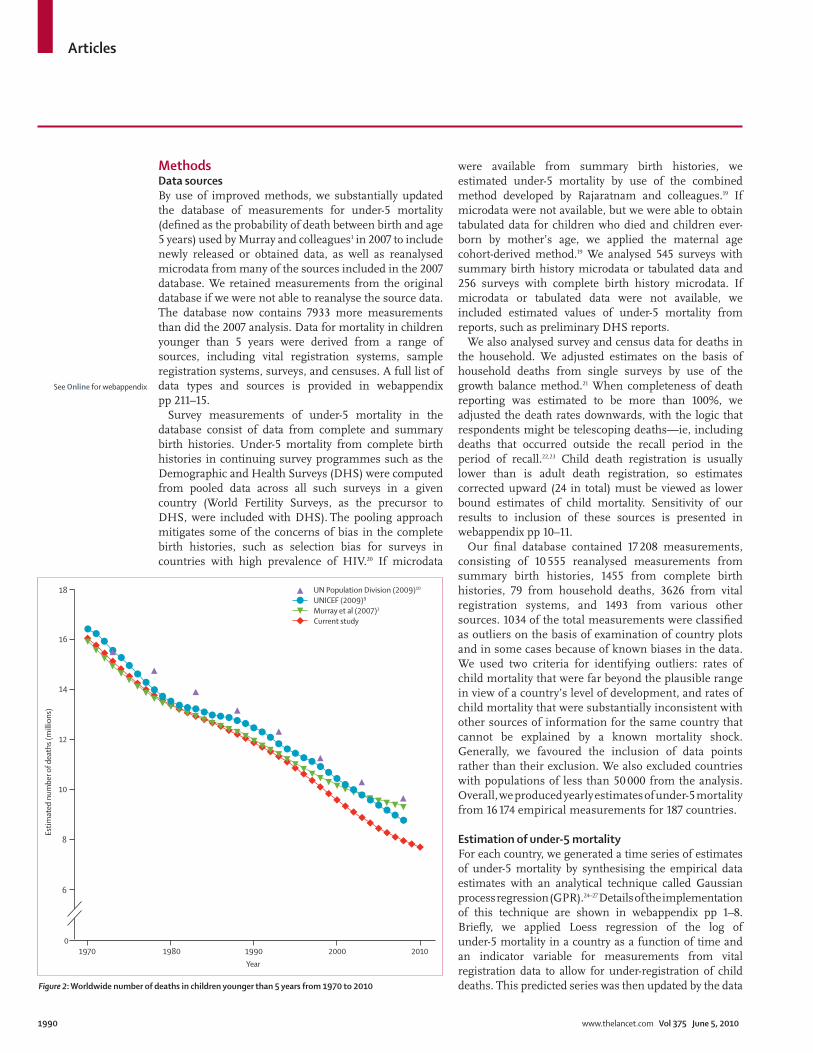
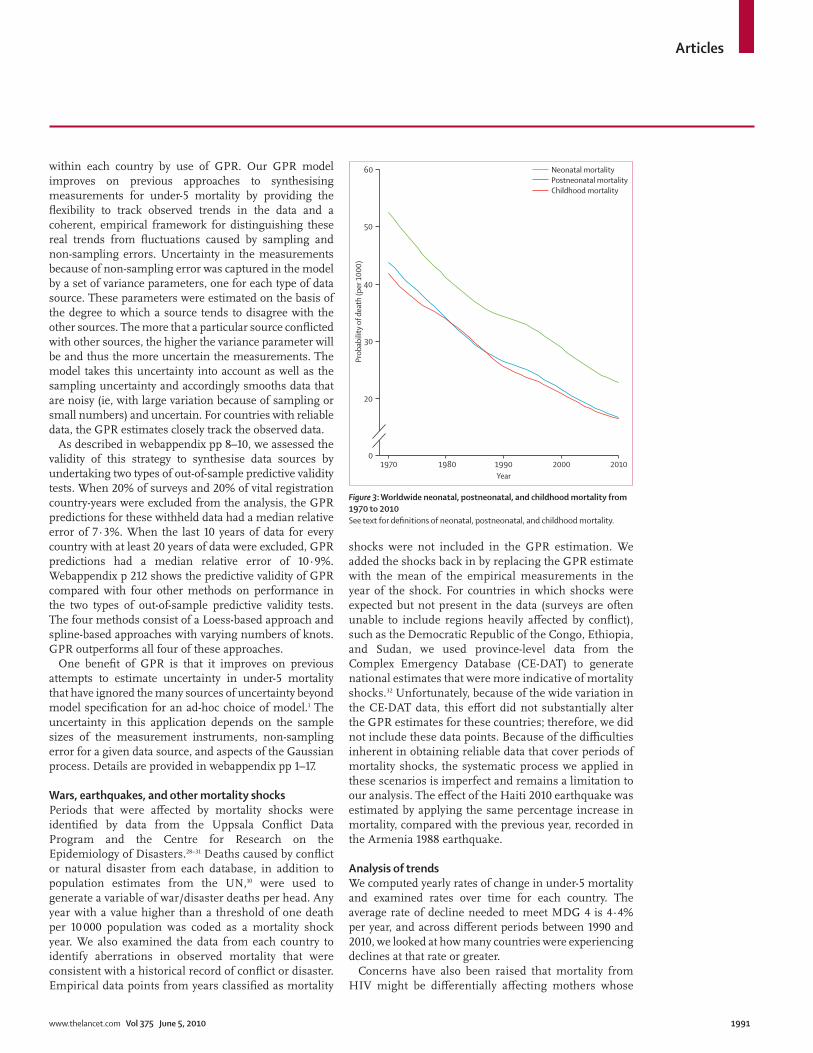
Figure 3: Worldwide neonatal, postneonatal, and childhood mortality from 1970 to 2010See text for defi nitions of neonatal, postneonatal, and childhood mortality.
1970
Prob
abili
ty o
f dea
th (p
er 1
000)
0
20
30
40
50
60 Neonatal mortalityPostneonatal mortalityChildhood mortality
1980 1990Year
2000 2010

Articles
1992 www.thelancet.com Vol 375 June 5, 2010
children have high mortality, resulting in selection bias.14 This bias is expected to have a larger eff ect farther back in time before the survey,33–35 which would tend to reduce the estimated trend in child mortality. Our use, in nearly all countries, of overlapping surveys to estimate the levels and trends in child mortality should substantially attenuate this eff ect. As described in more detail in the webappendix, we have further examined the under-5 mortality rate in HIV-positive women and
HIV-negative women in the 10 years before the survey in 21 DHS with HIV testing that can be linked to the complete birth histories. The diff erence in the under-5 mortality rate ranges from 135 (uncertainty interval 72–200) per 1000 higher in HIV-positive women than in HIV-negative women to 73 (4–141) per 1000 lower in HIV-positive women than in HIV-negative women. This variation is related to the correlated socioeconomic status and location of HIV-positive women relative to
1970 1980 1990 2000 2010
Asia Pacifi c, high income
Brunei 53·4 (48·2–60·0) 21·4 (18·5–24·7) 11·4 (10·0–13·1) 9·2 (8·0–10·9) 7·5 (5·6–10·3)
Japan 17·8 (17·7–18·0) 11·6 (11·4–11·7) 6·6 (6·5–6·8) 4·4 (4·3–4·5) 3·3 (2·8–3·9)
Singapore 29·2 (27·9–30·5) 15·3 (14·4–16·3) 7·7 (7·2–8·3) 4·1 (3·7–4·4) 2·5 (1·9–3·3)
South Korea 56·5 (52·1–61·0) 18·7 (14·2–24·2) 11·3 (8·4–14·7) 9·3 (6·8–12·2) 5·1 (3·4–7·6)
Asia, central
Armenia 103·1 (88·6–122·8) 68·9 (65·7–72·1) 50·9 (48·7–53·2) 32·2 (30·7–33·8) 19·3 (15·7–23·8)
Azerbaijan 149·8 (109·1–206·8) 109·8 (99·7–121·9) 78·6 (73·3–83·2) 56·2 (52·5–59·6) 33·8 (26·6–42·7)
Georgia 94·0 (77·9–113·0) 58·9 (55·7–62·3) 44·8 (42·6–47·0) 35·2 (33·2–37·2) 23·9 (19·0–29·3)
Kazakhstan 69·8 (60·9–78·5) 65·3 (61·8–68·9) 53·3 (50·3–56·0) 44·1 (40·8–47·5) 31·3 (25·4–40·0)
Kyrgyzstan 139·3 (126·5–152·6) 98·2 (94·1–102·8) 69·5 (66·8–72·6) 50·9 (46·7–54·5) 42·5 (36·0–52·4)
Mongolia 157·4 (147·0–169·4) 126·3 (121·2–131·5) 94·5 (90·9–98·5) 58·5 (55·7–61·4) 33·8 (29·4–38·7)
Tajikistan 177·5 (142·2–210·6) 143·5 (135·2–152·6) 108·4 (102·2–114·3) 81·4 (76·8–86·1) 49·7 (39·7–60·4)
Turkmenistan 184·7 (137·2–239·7) 124·8 (111·7–139·9) 98·4 (89·4–108·5) 74·7 (64·4–86·3) 26·0 (18·9–34·8)
Uzbekistan 81·6 (70·5–92·2) 77·4 (74·1–81·4) 65·9 (62·6–68·5) 57·3 (54·8–60·4) 43·5 (36·7–51·6)
Asia, east
China 85·7 (73·3–99·8) 48·5 (43·0–54·3) 39·6 (35·8–43·3) 32·0 (28·5–36·5) 15·4 (11·8–20·1)
North Korea 114·4 (62·1–210·7) 70·5 (38·3–129·7) 50·9 (27·7–93·8) 45·9 (24·9–84·5) 33·4 (18·1–61·5)
Taiwan 27·4 (26·9–27·9) 15·3 (15·0–15·6) 8·9 (8·7–9·2) 8·6 (8·3–8·9) 6·2 (5·2–7·4)
Asia, south
Afghanistan 286·9 (260·0–314·9) 212·0 (196·9–230·1) 163·5 (154·2–173·5) 141·0 (131·6–150·4) 121·3 (109·0–134·7)
Bangladesh 234·4 (227·4–242·7) 191·0 (186·5–195·2) 139·5 (136·7–142·5) 87·9 (85·5–90·1) 55·9 (51·6–60·1)
Bhutan 278·1 (246·8–310·7) 207·7 (190·3–229·4) 144·8 (134·9–156·7) 88·1 (81·4–95·7) 54·1 (47·4–61·8)
India 197·8 (191·9–203·4) 150·9 (147·8–154·0) 114·3 (112·0–116·7) 84·6 (82·5–86·8) 62·6 (58·2–67·3)
Nepal 261·7 (252·3–271·7) 210·2 (204·7–215·8) 137·3 (133·6–141·0) 77·9 (75·3–80·9) 47·3 (42·6–52·3)
Pakistan 169·2 (162·6–176·5) 134·9 (129·0–141·0) 113·3 (109·0–117·7) 94·6 (89·9–98·8) 80·3 (70·5–92·3)
Asia, southeast
Cambodia 169·2 (140·7–203·6) 173·4 (164·8–183·6) 121·2 (115·5–127·3) 105·4 (99·8–111·7) 59·7 (42·4–84·8)
Burma 162·6 (139·0–190·4) 125·6 (106·5–144·1) 120·2 (103·5–142·9) 79·6 (68·3–92·4) 55·0 (39·7–76·0)
Indonesia 156·8 (152·5–161·0) 104·1 (101·7–106·8) 71·5 (69·8–73·3) 48·8 (47·4–50·4) 36·6 (32·4–41·1)
Laos 218·8 (158·4–296·1) 184·7 (165·4–207·9) 144·5 (126·9–164·7) 98·3 (76·3–127·0) 68·3 (47·1–97·9)
Malaysia 49·6 (47·0–52·3) 28·0 (25·6–30·6) 16·4 (15·1–17·9) 9·6 (8·7–10·6) 5·1 (4·1–6·3)
Maldives 247·1 (226·3–272·5) 172·7 (160·7–187·0) 88·5 (80·8–96·7) 34·0 (29·7–39·0) 14·0 (11·1–17·9)
Mauritius 84·0 (81·7–86·4) 43·8 (42·2–45·3) 24·4 (23·3–25·5) 19·0 (18·1–20·1) 13·0 (10·7–15·7)
Philippines 87·5 (83·8–90·9) 78·8 (76·3–81·3) 54·1 (52·4–55·9) 38·3 (36·5–40·7) 28·6 (23·6–33·9)
Seychelles 79·9 (70·1–91·7) 29·8 (26·1–34·6) 18·9 (16·3–21·7) 17·3 (14·3–21·2) 12·5 (8·7–18·6)
Sri Lanka 66·8 (63·0–70·7) 43·7 (41·2–46·5) 35·4 (32·1–39·2) 17·6 (15·8–19·4) 10·1 (7·2–14·0)
Thailand 87·9 (84·5–91·3) 49·2 (47·3–51·5) 23·3 (22·1–24·7) 13·8 (13·1–14·7) 8·9 (7·6–10·5)
Timor-Leste 202·1 (177·4–229·7) 153·2 (142·0–167·5) 101·4 (92·7–110·3) 82·6 (74·0–92·5) 63·2 (46·7–83·7)
Vietnam 87·3 (77·0–99·2) 67·9 (64·4–71·6) 46·3 (43·8–48·8) 21·8 (19·9–24·0) 12·9 (9·1–18·6)
Australasia
Australia 23·1 (22·6–23·6) 14·6 (14·1–15·0) 9·9 (9·6–10·3) 6·4 (6·2–6·7) 4·7 (3·9–5·6)
New Zealand 21·5 (20·7–22·3) 16·5 (15·8–17·3) 11·1 (10·6–11·7) 7·9 (7·5–8·3) 5·8 (5·0–6·9)
(Continues on next page)

Articles
www.thelancet.com Vol 375 June 5, 2010 1993
HIV-negative women. We have simulated the eff ect of this range on our estimates in view of the types of analytical methods we apply, and fi nd that biases even in the presence of HIV seroprevalence of 20% range from underestimation of ten per 1000 to overestimation of six per 1000. Trends in the past 10–15 years are largely unaff ected. Because of the enormous variation in the potential bias and, the further confounding of this association by scale-up of prevention of mother-to-child transmission and antiretroviral drugs, we have opted to not apply any standard correction to the estimated rates of child mortality.
Neonatal, postneonatal, and childhood death ratesWe divided the estimates of under-5 mortality generated by GPR into estimates of neonatal (the probability of death before age 1 month), postneonatal (the probability of death before age 1 year conditional on surviving to age 1 month), and childhood (the probability of death from age 1 year to age 5 years) risks of death by use of a two-step modelling process in which we fi rst predicted sex-specifi c under-5 mortality and then predicted the sex-specifi c neonatal, postneonatal, and childhood risks of death. We modelled the age breakdown by use of separate models for boys and girls because diff erent levels of
1970 1980 1990 2000 2010
(Continued from previous page)
Caribbean
Antigua and Barbuda 44·1 (38·9–50·0) 30·2 (25·5–35·9) 18·1 (15·4–21·1) 23·2 (20·2–27·0) 13·8 (10·8–17·9)
Barbados 71·5 (65·9–77·7) 40·4 (36·9–44·7) 26·4 (23·6–29·4) 21·7 (18·9–25·1) 10·6 (8·1–13·7)
Belize 127·6 (109·6–145·0) 78·0 (71·0–85·9) 43·6 (40·0–46·9) 31·0 (28·7–34·1) 22·7 (19·2–27·8)
Cuba 38·9 (35·8–43·0) 23·3 (21·6–25·3) 13·9 (12·8–15·1) 8·6 (7·9–9·4) 5·2 (4·5–6·1)
Dominica 63·1 (58·6–68·0) 22·9 (20·3–25·7) 24·1 (21·3–26·6) 21·0 (17·9–24·3) 16·5 (12·5–21·5)
Dominican Republic 118·7 (115·5–121·9) 84·4 (82·4–86·5) 57·0 (55·7–58·5) 38·3 (37·1–39·4) 27·5 (24·6–30·7)
Grenada 80·0 (71·5–89·6) 45·0 (39·1–52·0) 26·7 (23·8–30·0) 21·6 (18·3–24·9) 11·6 (9·1–14·7)
Guyana 72·0 (67·4–76·6) 69·2 (63·8–75·2) 61·0 (57·2–64·6) 46·8 (43·9–49·9) 38·0 (32·9–44·7)
Haiti 229·6 (220·0–240·9) 198·6 (192·8–204·8) 149·2 (145·1–154·0) 99·8 (95·9–103·3) 102·6 (90·0–119·6)
Jamaica 57·0 (53·2–60·9) 45·0 (42·4–48·1) 33·9 (32·0–35·9) 25·4 (23·5–27·2) 18·4 (15·4–22·0)
Saint Lucia 77·0 (71·3–84·0) 39·1 (36·4–41·7) 23·2 (21·2–25·1) 16·4 (14·9–18·4) 11·4 (8·8–14·6)
Saint Vincent and the Grenadines
80·1 (74·6–85·9) 60·1 (55·8–65·1) 24·8 (22·2–27·9) 24·0 (21·6–26·8) 23·2 (18·9–28·8)
Suriname 71·8 (62·3–83·1) 60·5 (56·5–65·0) 46·4 (43·1–49·6) 43·7 (39·6–48·4) 35·5 (28·5–43·7)
The Bahamas 68·8 (61·5–76·3) 49·9 (45·7–54·4) 36·0 (32·8–39·6) 18·3 (16·3–21·0) 15·8 (12·8–19·5)
Trinidad and Tobago 51·6 (48·8–54·4) 37·2 (35·2–39·3) 30·2 (28·1–32·4) 31·9 (29·5–34·6) 25·4 (20·4–31·4)
Europe, central
Albania 65·3 (50·1–84·7) 42·5 (38·3–47·3) 40·1 (37·6–42·7) 22·3 (20·5–24·1) 15·1 (12·1–19·0)
Bosnia and Herzegovina 58·6 (40·2–84·7) 34·3 (26·2–44·3) 17·7 (16·9–18·7) 10·4 (9·7–11·1) 7·9 (6·2–9·8)
Bulgaria 32·2 (29·4–35·5) 23·9 (21·9–26·0) 18·3 (16·6–20·0) 17·4 (15·9–19·0) 10·7 (8·7–13·3)
Croatia 40·8 (29·7–56·2) 24·5 (20·6–30·1) 13·4 (12·8–14·0) 8·5 (8·1–9·0) 5·4 (4·7–6·2)
Czech Republic 29·3 (26·3–32·5) 21·1 (19·5–22·9) 14·2 (13·0–15·5) 7·4 (6·7–8·3) 4·1 (3·5–5·0)
Hungary 38·0 (34·3–41·5) 25·1 (22·1–27·7) 16·7 (15·0–18·1) 10·2 (9·3–11·3) 5·5 (4·4–6·7)
Macedonia 59·6 (41·3–86·4) 40·7 (31·5–52·1) 26·2 (23·6–28·9) 18·5 (16·8–20·4) 11·8 (9·3–15·0)
Montenegro 82·6 (56·2–119·0) 45·6 (31·8–64·8) 25·1 (18·5–34·1) 13·9 (12·5–15·6) 9·4 (7·7–11·8)
Poland 36·5 (36·0–36·9) 24·9 (24·5–25·3) 19·0 (18·6–19·3) 9·6 (9·3–9·9) 6·4 (5·1–8·2)
Romania 50·4 (45·7–55·6) 36·3 (32·5–40·8) 30·4 (27·2–33·9) 22·2 (20·0–24·8) 15·2 (12·4–18·8)
Serbia 37·7 (26·0–54·6) 21·7 (15·7–30·8) 12·7 (9·6–16·6) 7·8 (7·5–8·1) 4·0 (3·5–4·6)
Slovakia 31·9 (30·8–33·0) 23·4 (22·6–24·3) 14·2 (13·5–14·9) 10·2 (9·5–10·9) 6·6 (5·1–8·6)
Slovenia 42·6 (31·5–57·9) 21·3 (18·0–25·4) 10·6 (9·9–11·3) 5·4 (4·9–5·9) 3·2 (2·6–3·8)
Europe, eastern
Belarus 32·0 (29·4–34·9) 27·5 (25·5–29·7) 21·5 (19·9–23·1) 16·9 (15·7–18·1) 10·4 (8·8–12·4)
Estonia 23·6 (21·8–25·8) 21·8 (20·0–23·8) 18·0 (16·4–19·8) 11·0 (9·9–12·1) 6·3 (5·3–7·4)
Latvia 23·2 (21·3–25·3) 21·7 (19·8–23·7) 17·3 (15·7–19·0) 14·8 (13·5–16·3) 9·5 (7·7–11·3)
Lithuania 24·9 (23·8–26·0) 20·3 (19·4–21·2) 14·4 (13·7–15·2) 10·9 (10·2–11·6) 6·8 (5·7–7·9)
Moldova 65·0 (54·7–77·1) 56·2 (51·6–61·5) 35·1 (33·0–37·6) 23·0 (21·6–24·6) 13·7 (11·7–16·1)
Russia 35·4 (32·0–39·1) 32·8 (29·7–36·4) 26·7 (23·7–29·7) 21·6 (19·3–24·2) 14·5 (12·0–17·3)
Ukraine 30·5 (28·0–33·3) 29·2 (27·2–31·3) 21·6 (20·3–23·0) 19·7 (18·6–20·9) 15·5 (13·0–18·5)
(Continues on next page)

Articles
1994 www.thelancet.com Vol 375 June 5, 2010
mortality at each age are seen between the sexes, especially in the neonatal period in which male mortality generally exceeds female mortality.36,37 The level of mortality at each age for both sexes combined is a function of the level for each sex and the relative size of the population of each sex; modelling mortality for the
fi ner age groups cannot be based on combined under-5 mortality alone.
We estimated sex-specifi c under-5 mortality by modelling the relation between the ratio of male under-5 mortality to female under-5 mortality and level of mortality for both sexes combined by use of vital registration data
1970 1980 1990 2000 2010
(Continued from previous page)
Europe, western
Andorra 16·3 (11·5–23·1) 11·7 (8·3–16·6) 9·4 (6·6–13·3) 7·1 (5·0–10·1) 4·9 (3·4–6·9)
Austria 29·4 (28·5–30·2) 17·2 (16·5–17·8) 10·8 (10·3–11·3) 6·1 (5·7–6·5) 3·9 (3·3–4·6)
Belgium 25·5 (24·8–26·2) 15·3 (14·7–15·8) 10·2 (9·8–10·7) 6·2 (5·9–6·5) 4·3 (3·6–5·3)
Cyprus 26·6 (22·5–31·1) 20·0 (17·9–22·1) 12·8 (11·7–14·0) 6·6 (5·9–7·3) 2·8 (2·3–3·4)
Denmark 16·4 (15·8–17·1) 10·1 (9·6–10·7) 8·7 (8·2–9·2) 5·8 (5·5–6·2) 4·1 (3·4–4·9)
Finland 15·9 (15·1–16·8) 8·0 (7·5–8·5) 7·1 (6·6–7·5) 4·5 (4·1–4·8) 3·0 (2·5–3·7)
France 19·2 (19·0–19·5) 14·7 (14·4–14·9) 9·5 (9·3–9·7) 5·4 (5·3–5·6) 3·9 (3·2–4·8)
Germany 25·8 (25·5–26·1) 14·0 (13·8–14·3) 8·9 (8·7–9·1) 5·2 (5·0–5·3) 4·1 (3·5–4·8)
Greece 28·7 (27·8–29·4) 19·0 (18·3–19·7) 11·2 (10·6–11·6) 6·9 (6·6–7·3) 3·7 (3·0–4·5)
Iceland 16·4 (14·9–18·0) 9·7 (8·6–10·9) 6·7 (5·9–7·7) 4·1 (3·5–4·8) 2·6 (2·1–3·3)
Ireland 23·4 (22·5–24·3) 14·9 (14·3–15·6) 9·9 (9·2–10·5) 7·4 (7·0–7·8) 4·2 (3·5–5·1)
Israel 27·2 (26·3–28·2) 19·0 (18·3–19·7) 12·1 (11·6–12·6) 6·9 (6·6–7·3) 4·7 (3·9–5·7)
Italy 34·3 (34·0–34·7) 17·0 (16·7–17·3) 10·0 (9·8–10·2) 6·4 (6·2–6·6) 3·3 (2·8–4·0)
Luxembourg 23·3 (21·5–25·7) 13·9 (12·5–15·4) 9·1 (8·2–10·2) 5·1 (4·6–5·8) 2·9 (2·3–3·7)
Malta 31·5 (28·8–34·5) 16·9 (15·2–18·7) 11·3 (10·0–12·8) 7·2 (6·1–8·4) 5·2 (4·0–6·9)
Netherlands 16·4 (16·0–16·9) 11·4 (11·0–11·9) 8·9 (8·6–9·2) 6·5 (6·3–6·8) 4·3 (3·7–4·9)
Norway 15·8 (15·1–16·4) 10·5 (9·9–11·0) 8·8 (8·4–9·3) 5·0 (4·7–5·3) 3·4 (2·8–4·0)
Portugal 74·4 (73·2–75·6) 29·4 (28·6–30·2) 15·0 (14·4–15·6) 8·0 (7·6–8·5) 3·3 (2·6–4·3)
Spain 32·8 (32·4–33·2) 14·3 (14·1–14·6) 9·2 (9·0–9·5) 5·7 (5·5–5·9) 3·8 (3·1–4·6)
Sweden 12·7 (12·2–13·3) 8·9 (8·5–9·3) 7·2 (6·9–7·6) 4·9 (4·6–5·2) 2·7 (2·2–3·3)
Switzerland 18·7 (18·1–19·4) 10·6 (10·1–11·1) 8·8 (8·4–9·2) 6·0 (5·7–6·3) 4·2 (3·5–5·0)
UK 21·8 (21·5–22·1) 15·2 (15·0–15·5) 9·7 (9·5–9·9) 6·8 (6·6–6·9) 5·3 (4·5–6·2)
Latin America, Andean
Bolivia 220·7 (212·7–229·9) 153·0 (148·1–158·0) 103·9 (100·3–107·5) 62·2 (58·6–65·6) 46·7 (39·9–57·0)
Ecuador 129·1 (125·8–132·7) 82·5 (80·4–84·6) 50·1 (48·7–51·8) 34·0 (32·1–35·7) 21·0 (18·0–24·3)
Peru 159·0 (154·8–163·2) 114·1 (111·6–117·0) 72·7 (70·9–74·6) 40·7 (39·2–42·3) 24·6 (21·6–28·9)
Latin America, central
Colombia 86·8 (84·0–89·8) 52·8 (51·2–54·4) 33·3 (32·0–34·5) 24·7 (23·6–25·8) 15·3 (13·1–17·7)
Costa Rica 73·6 (70·5–77·2) 33·1 (31·5–34·8) 21·4 (20·2–22·6) 14·8 (13·7–16·0) 8·7 (7·3–10·2)
El Salvador 160·4 (152·6–168·1) 110·7 (106·5–116·3) 59·4 (56·6–62·1) 34·2 (32·3–36·3) 19·2 (16·7–22·3)
Guatemala 175·1 (169·8–181·1) 120·7 (117·8–124·1) 75·8 (73·6–77·7) 49·9 (47·7–52·5) 31·9 (27·6–36·9)
Honduras 149·5 (142·3–158·5) 92·9 (90·3–95·8) 56·3 (54·2–58·1) 36·6 (35·3–38·2) 22·6 (19·7–25·4)
Mexico 107·5 (104·3–110·6) 70·0 (67·9–72·2) 41·9 (40·2–43·8) 25·8 (24·4–27·4) 16·6 (14·7–18·4)
Nicaragua 166·2 (160·2–172·7) 102·3 (99·2–105·2) 63·9 (62·0–66·0) 39·3 (37·8–40·8) 26·6 (23·1–31·0)
Panama 54·7 (52·5–57·2) 36·8 (35·2–38·7) 27·8 (26·3–29·3) 23·3 (21·7–25·1) 18·0 (15·3–20·9)
Venezuela 58·8 (55·6–62·2) 38·6 (36·4–40·9) 29·4 (27·5–31·1) 23·2 (21·5–25·0) 16·1 (13·2–19·4)
Latin America, southern
Argentina 72·6 (72·0–73·3) 37·7 (37·3–38·2) 28·0 (27·6–28·3) 19·7 (19·4–20·0) 12·9 (10·5–15·8)
Chile 92·1 (85·4–98·8) 37·3 (34·4–40·3) 18·2 (16·7–19·8) 11·1 (10·3–12·1) 6·5 (5·4–7·9)
Uruguay 56·0 (54·5–57·7) 40·7 (39·2–42·1) 22·2 (21·2–23·3) 16·5 (15·7–17·3) 11·5 (9·3–14·4)
Latin America, tropical
Brazil 120·8 (117·2–124·7) 83·6 (80·7–86·1) 52·0 (50·3–54·1) 30·8 (28·5–32·9) 19·9 (17·3–23·0)
Paraguay 73·9 (71·4–76·9) 56·6 (54·9–58·7) 37·7 (36·1–39·1) 27·7 (26·2–29·5) 20·9 (17·9–24·8)
(Continues on next page)

Articles
www.thelancet.com Vol 375 June 5, 2010 1995
(3253 points) and DHS complete birth history data (525 points) from 147 countries. This model produced predictions of the ratio of male to female under-5 mortality that were then combined with the sex ratio at birth (from UNPD10 if available, and assuming 1·05 if not available) to form a system of two equations that could be solved to generate estimates of under-5 mortality for boys and under-5 mortality for girls. This model included year as a
covariate, and regional and national random eff ects on intercept and slope.
We then modelled the probability of an under-5 death occurring during the neonatal, postneonatal, and childhood periods to the sex-specifi c under-5 mortality rate, again by use of data from vital registration systems (1234 points) and DHS complete birth histories (526 points) from 122 countries. These models also included regional
1970 1980 1990 2000 2010
(Continued from previous page)
North Africa and Middle East
Algeria 172·4 (162·2–183·5) 100·9 (96·0–106·6) 52·4 (49·8–55·1) 34·1 (31·3–37·2) 19·3 (14·3–25·1)
Bahrain 70·2 (63·3–78·7) 29·6 (26·8–32·5) 19·0 (17·2–21·0) 12·2 (10·9–13·5) 7·4 (6·1–8·8)
Egypt 236·7 (231·2–242·8) 157·9 (154·8–160·9) 85·4 (83·7–87·0) 45·6 (44·4–46·7) 24·7 (22·4–27·4)
Iran 183·1 (162·3–211·5) 107·2 (100·7–114·2) 65·5 (62·1–69·7) 46·7 (43·2–50·8) 31·1 (24·2–38·9)
Iraq 111·2 (98·4–126·9) 78·2 (73·3–83·8) 58·4 (55·7–61·7) 42·7 (40·2–45·0) 31·6 (26·9–36·6)
Jordan 86·6 (82·5–91·2) 54·4 (52·3–56·6) 33·4 (32·1–34·8) 23·7 (22·6–24·9) 14·1 (11·6–16·7)
Kuwait 52·8 (47·8–58·3) 35·0 (31·2–39·5) 12·8 (11·3–14·8) 12·4 (11·0–14·1) 7·8 (6·0–10·3)
Lebanon 68·0 (60·3–77·1) 43·4 (40·4–47·0) 31·4 (28·5–34·5) 13·8 (12·5–15·3) 10·2 (7·3–14·4)
Libya 118·4 (111·8–125·2) 61·8 (58·6–65·1) 37·6 (35·6–39·8) 22·1 (19·4–25·0) 12·9 (9·9–16·6)
Morocco 178·2 (173·3–183·1) 124·0 (121·0–126·9) 76·9 (74·8–78·7) 50·5 (48·6–52·3) 32·4 (27·9–37·7)
Occupied Palestinian territories
116·1 (90·1–147·2) 70·6 (62·5–79·6) 41·9 (38·9–45·0) 29·3 (26·1–32·8) 22·1 (17·8–27·5)
Oman 190·0 (165·8–216·3) 97·6 (85·3–115·2) 37·1 (30·5–45·5) 15·9 (11·7–21·9) 9·3 (6·6–13·4)
Qatar 52·3 (43·6–64·4) 27·5 (24·6–30·9) 15·9 (14·5–17·2) 12·8 (11·6–14·1) 10·5 (8·8–12·6)
Saudi Arabia 204·9 (167·3–260·1) 71·9 (63·3–81·9) 29·5 (24·8–35·2) 21·8 (18·0–26·8) 15·0 (11·5–19·8)
Syria 85·3 (81·3–89·4) 48·2 (45·8–50·4) 31·8 (30·6–33·2) 18·8 (17·7–19·8) 11·4 (9·6–13·7)
Tunisia 147·4 (142·2–153·4) 80·7 (78·3–83·6) 47·4 (45·4–49·8) 27·2 (24·5–29·8) 15·2 (11·8–19·4)
Turkey 194·1 (185·5–203·8) 123·9 (119·3–128·7) 71·3 (68·4–74·2) 40·0 (37·7–42·5) 29·2 (22·6–39·1)
United Arab Emirates 81·1 (71·9–91·1) 38·1 (32·3–45·4) 16·1 (12·9–20·2) 7·0 (5·2–9·9) 3·0 (2·1–4·3)
Yemen 285·1 (275·0–296·3) 188·1 (181·9–195·5) 128·3 (123·1–133·3) 93·2 (88·7–98·1) 60·0 (50·8–69·6)
North America, high income
Canada 26·1 (25·7–26·6) 12·9 (12·6–13·2) 8·8 (8·6–9·1) 6·6 (6·4–6·8) 4·9 (4·0–6·0)
USA 25·7 (25·5–25·9) 16·0 (15·8–16·1) 11·6 (11·5–11·7) 8·3 (8·2–8·4) 6·7 (5·8–7·6)
Oceania
Fiji 55·0 (52·0–58·3) 42·1 (38·0–46·4) 35·2 (30·5–40·7) 30·8 (26·3–36·4) 26·6 (21·6–32·8)
Federated States of Micronesia
115·6 (87·4–147·0) 86·5 (73·3–102·3) 56·3 (48·5–66·9) 37·7 (29·4–48·0) 25·7 (19·4–34·1)
Kiribati 134·3 (117·1–152·8) 102·9 (84·8–125·1) 75·8 (68·6–83·6) 59·2 (53·4–65·3) 46·4 (36·1–60·3)
Marshall Islands 49·5 (38·3–64·3) 49·8 (41·1–60·1) 50·8 (44·0–58·6) 47·4 (42·3–53·7) 37·5 (31·2–44·9)
Papua New Guinea 133·1 (121·1–147·3) 106·0 (99·5–113·8) 100·2 (93·1–108·0) 91·7 (77·6–108·3) 82·7 (65·7–106·9)
Samoa 57·0 (51·9–62·9) 36·5 (31·2–42·0) 29·6 (24·9–35·3) 24·5 (21·3–28·2) 18·6 (15·3–22·8)
Solomon Islands 89·2 (78·6–101·4) 56·3 (47·0–67·6) 38·4 (33·8–43·5) 34·6 (31·3–38·6) 29·4 (23·9–35·6)
Tonga 36·5 (32·4–41·6) 29·5 (25·5–33·9) 25·8 (20·7–32·6) 22·2 (17·6–28·5) 19·2 (15·0–24·6)
Vanuatu 116·2 (100·0–135·1) 81·0 (71·5–91·4) 52·8 (45·6–60·2) 34·9 (29·2–41·5) 23·0 (18·3–29·6)
Sub-Saharan Africa, central
Angola 305·9 (267·8–356·3) 266·3 (250·8–283·4) 236·3 (222·6–248·2) 193·6 (181·1–206·7) 134·8 (113·8–155·1)
Central African Republic 205·6 (193·8–216·1) 178·7 (172·3–185·3) 163·8 (158·1–170·1) 153·5 (141·2–165·8) 138·1 (117·2–160·9)
Congo 144·9 (127·6–163·9) 122·4 (114·5–131·7) 109·4 (103·5–115·3) 114·5 (107·6–122·2) 107·5 (92·4–124·1)
Democratic Republic of the Congo
241·6 (216·1–270·2) 207·8 (198·0–217·9) 182·9 (176·1–190·0) 165·1 (154·3–176·0) 131·1 (117·2–145·6)
Equatorial Guinea 209·6 (183·8–238·8) 191·1 (180·5–201·7) 178·7 (169·4–187·7) 180·3 (166·7–195·7) 180·1 (155·5–210·8)
Gabon 167·8 (152·0–185·5) 118·1 (112·5–123·6) 93·8 (89·3–97·6) 83·1 (77·3–89·3) 68·3 (58·5–79·8)
(Continues on next page)

Articles
1996 www.thelancet.com Vol 375 June 5, 2010
and national random eff ects on both intercept and slope and the resulting probabilities were scaled to sum to 1·0 and converted to age-specifi c probabilities of death conditional on survival to the beginning of the period. For both steps, a range of diff erent model specifi cations were
explored and out-of-sample validity tests undertaken. The best performing models from these analyses were implemented. In out-of-sample predictive validity tests, with the models fi tted repeatedly with data from random sets of 80% of countries, the median relative error in the
1970 1980 1990 2000 2010
(Continued from previous page)
Sub-Saharan Africa, east
Burundi 229·8 (219·7–241·0) 192·1 (184·1–199·0) 175·8 (166·5–187·2) 150·1 (141·5–158·6) 130·3 (115·1–148·0)
Comoros 197·8 (182·1–214·4) 159·5 (153·3–166·1) 115·6 (110·9–120·6) 83·4 (75·1–92·8) 61·5 (52·9–72·1)
Djibouti 116·2 (100·2–133·8) 111·3 (103·5–119·2) 110·0 (104·6–116·1) 89·6 (84·8–94·4) 66·7 (58·9–74·6)
Eritrea 232·0 (217·7–248·5) 185·8 (178·3–191·8) 142·7 (138·2–148·4) 100·6 (93·0–108·7) 78·2 (66·9–94·5)
Ethiopia 255·4 (240·1–270·5) 237·1 (229·1–245·6) 201·9 (194·9–209·3) 136·9 (130·7–142·3) 101·0 (89·3–117·6)
Kenya 142·0 (137·2–146·7) 112·2 (109·3–115·0) 103·8 (101·2–106·8) 100·4 (95·9–104·4) 82·2 (72·0–91·9)
Madagascar 188·4 (179·0–197·4) 180·8 (174·5–186·7) 158·0 (153·0–163·2) 104·5 (99·3–109·6) 70·5 (62·9–79·7)
Malawi 343·9 (330·3–358·1) 260·6 (252·3–270·1) 211·3 (204·8–217·6) 148·4 (143·4–153·4) 96·8 (84·3–111·6)
Mozambique 271·3 (255·9–287·9) 231·5 (223·2–241·1) 226·6 (218·7–236·1) 163·5 (156·1–170·8) 133·7 (114·3–157·9)
Rwanda 232·3 (222·9–241·5) 203·7 (194·5–213·9) 169·4 (161·7–177·6) 166·0 (158·0–174·6) 102·9 (88·2–118·6)
Somalia 206·3 (178·7–240·6) 189·0 (171·0–205·4) 174·2 (164·8–184·1) 145·1 (137·3–153·3) 111·4 (98·4–123·4)
Sudan 152·1 (146·8–157·3) 141·2 (136·4–146·2) 118·1 (111·4–124·3) 103·7 (89·7–118·8) 92·1 (77·5–110·3)
Tanzania 207·7 (199·5–215·9) 173·2 (167·9–178·0) 153·1 (147·9–158·0) 127·1 (121·7–133·0) 98·4 (85·6–116·2)
Uganda 190·4 (183·8–196·3) 185·9 (181·5–190·7) 167·8 (163·5–172·1) 141·1 (136·8–145·6) 116·7 (105·0–127·5)
Zambia 181·8 (175·0–189·4) 168·3 (163·2–173·4) 172·8 (167·9–178·1) 143·4 (138·4–149·1) 118·8 (106·3–134·0)
Sub-Saharan Africa, southern
Botswana 98·4 (92·4–103·8) 62·1 (59·1–65·6) 54·2 (48·5–61·1) 59·0 (50·3–69·8) 49·1 (37·7–62·2)
Lesotho 172·0 (160·9–182·3) 113·9 (109·1–118·8) 94·5 (90·8–98·2) 104·9 (100·2–109·7) 96·8 (78·8–115·6)
Namibia 111·5 (105·1–118·2) 95·4 (91·7–99·6) 72·0 (69·3–75·2) 62·1 (59·2–65·7) 54·9 (45·6–64·4)
South Africa 132·8 (119·2–146·8) 86·8 (81·2–92·2) 57·6 (54·2–61·1) 37·3 (37·0–37·6) 50·9 (43·2–60·3)
Swaziland 188·0 (167·2–210·3) 122·3 (115·0–130·5) 73·7 (69·3–78·4) 99·3 (93·7–106·4) 101·2 (79·5–126·0)
Zimbabwe 111·3 (106·5–116·4) 93·2 (89·9–96·9) 73·3 (70·4–76·1) 73·7 (70·1–77·4) 70·4 (57·3–86·1)
Sub-Saharan Africa, west
Benin 280·6 (269·5–293·1) 222·1 (215·0–228·1) 176·5 (172·0–180·9) 137·0 (132·7–141·8) 100·7 (89·3–111·3)
Burkina Faso 319·5 (305·5–334·2) 250·2 (242·5–258·0) 204·7 (198·2–211·0) 172·4 (165·4–179·7) 133·7 (114·3–155·8)
Cameroon 214·3 (205·8–223·6) 174·4 (169·1–181·0) 143·5 (138·4–148·3) 140·3 (134·1–146·5) 114·4 (94·3–140·1)
Cape Verde 116·2 (107·0–130·5) 79·3 (74·5–83·3) 58·2 (54·8–61·3) 45·4 (40·8–51·5) 32·3 (26·9–39·1)
Chad 260·0 (243·3–276·9) 245·4 (238·6–253·2) 210·8 (204·9–216·5) 189·0 (182·2–196·6) 168·7 (149·1–190·0)
Côte d’Ivoire 225·3 (217·1–234·8) 170·4 (165·0–175·5) 149·2 (145·3–153·6) 128·7 (123·7–133·4) 107·3 (95·3–121·5)
Ghana 174·7 (170·0–179·6) 149·4 (146·3–152·9) 122·2 (119·5–125·0) 98·6 (96·1–101·1) 77·5 (72·2–83·4)
Guinea 318·9 (300·7–336·9) 274·0 (266·3–281·2) 226·8 (220·9–232·5) 174·2 (168·4–180·2) 132·7 (119·3–146·1)
Guinea-Bissau 295·0 (263·4–330·2) 262·4 (250·5–275·9) 233·2 (224·9–242·0) 191·1 (182·4–199·6) 158·6 (143·3–177·9)
Liberia 271·6 (257·9–285·6) 240·6 (227·8–252·7) 235·4 (223·6–247·7) 172·2 (163·4–181·5) 98·9 (86·6–113·0)
Mali 370·3 (359·4–382·3) 301·7 (294·3–309·7) 254·0 (247·2–260·0) 212·4 (205·7–219·3) 161·2 (142·6–179·5)
Mauritania 189·9 (182·6–196·7) 143·1 (138·9–147·2) 112·8 (109·4–116·2) 100·3 (96·4–104·7) 85·5 (77·8–95·0)
Niger 354·7 (341·4–368·2) 326·5 (317·1–336·2) 297·0 (289·2–305·3) 223·7 (216·0–231·5) 161·1 (142·0–185·3)
Nigeria 224·4 (214·1–236·5) 200·5 (192·2–208·7) 194·1 (187·1–201·8) 177·0 (169·2–185·8) 157·0 (140·9–174·0)
Sao Tome and Principe 132·1 (119·1–146·3) 114·8 (106·6–124·7) 109·4 (101·5–118·3) 74·9 (67·4–82·8) 62·2 (50·2–76·2)
Senegal 278·5 (270·6–287·1) 203·1 (197·4–208·2) 146·5 (142·0–150·4) 123·5 (119·1–128·2) 86·5 (77·7–97·0)
Sierra Leone 351·4 (325·7–378·8) 292·4 (279·7–306·1) 241·6 (232·7–250·7) 196·9 (188·8–207·2) 139·1 (124·7–152·8)
The Gambia 291·0 (263·8–324·0) 209·8 (195·4–224·6) 146·0 (138·0–154·1) 120·8 (113·9–128·1) 80·7 (69·5–93·7)
Togo 225·8 (218·4–233·8) 175·0 (170·5–180·2) 142·4 (137·9–147·5) 114·0 (108·3–119·6) 91·4 (82·1–101·8)
Countries are grouped into 21 regions on the basis of epidemiological profi les and geography. Under-5 mortality is defi ned as the probability of death between birth and age 5 years.
Table 1: Under-5 mortality (uncertainty interval) per 1000, by decade

Articles
www.thelancet.com Vol 375 June 5, 2010 1997
fi rst model for estimates from the knocked out countries was 2·4% for boys and 3·1% for girls; in the same predictive validity tests for the second model, the median relative error was 7·1% for the neonatal model, 9·1% for the postneonatal model, and 8·8% for the childhood model (the results of other predictive validity tests are provided in webappendix pp 9–10). The uncertainty from the GPR process was propagated through these two models to estimate the uncertainty in our fi nal neonatal, postneonatal, and childhood mortality estimates (further details are provided in webappendix p 8).
Aggregate numbers of deathsTo compute aggregate numbers of deaths for each country, we combined estimates of neonatal and postneonatal mortality to obtain an estimate of the infant mortality rate. We obtained deaths in infants younger than 1 year by applying the infant mortality rate (the probability of death from birth to age 1 year) to the number of births in the current and previous years with the following formula (which gives more weight to the births in the current year because most deaths in infants younger than 1 year occur in the fi rst few months of life):
where 1D0 represents deaths under age 1 year, t is the current year, B is births, 1a0 is the mean time lived by a
child who dies under age 1 year, and IMR is the infant mortality rate. We used a similar method to estimate deaths in children aged between 1 year and 5 years.
Deaths in children younger than 5 years were the sum of deaths in infants younger than 1 year and deaths in children aged between 1 year and 5 years. This method of computing deaths in children younger than 5 years is more accurate than is use of under-5 mortality and births in the current year, because it better accounts for changing cohort sizes and mortality rates from year to year. We validated this method by comparing it with other approaches (ie, use of under-5 mortality and births, and by converting infant and childhood probabilities of death to mortality rates and multiplying by population estimates) in countries with complete vital registration data.
In addition to computing under-5 mortality and number of deaths by country, we generated results for 21 regions of the world. These regions were grouped on the basis of epidemiological profi les and geography (see webappendix p 205 for regions).38 Analyses were undertaken in Stata (version 11.0), R citation (version 2.9.0), and Python (version 2.5). We used the PyMC package (version 2.0) in Python to implement the Markov chain Monte Carlo sampling.
Role of the funding sourceThe sponsors of the study had no role in study design, data collection, data analysis, data interpretation, or
Figure 4: Under-5 mortality from 1970 to 2010, by regionUnder-5 mortality is defi ned as the probability of death between birth and age 5 years.
Unde
r-5 m
orta
lity
(per
100
0)
0
10
20
30
0
50
100
150
20040
CaribbeanOceaniaSub–Saharan Africa, southern
Asia, southSub–Saharan Africa, centralSub–Saharan Africa, eastSub–Saharan Africa, west
A BEurope, centralEurope, easternEurope, westernNorth America, high income
Asia Pacific, high incomeAustralasia
Latin America, AndeanLatin Americ, centralLatin America, southernLatin America, tropicalNorth Africa/Middle East
Unde
r-5 m
orta
lity
(per
100
0)
Year
019801970 20001990 2010
20
40
80
0
50
100
150
250140
120
60
100
C
Year
200
19801970 20001990 2010
DAsia, centralAsia, eastAsia, southeast
1D0(t)=B(t) * 1–1a0(t) *IMR(t)+B(t–1) *1a0(t–1) *IMR(t–1)( )
Articles
1998 www.thelancet.com Vol 375 June 5, 2010
writing of the report. The corresponding author had full access to all data in the study and had fi nal responsibility for the decision to submit for publication.
ResultsTable 1 shows our estimates and uncertainty intervals for under-5 mortality in all 187 countries every 10 years from 1970 to 2010. A full time series of results is available for each country in the webappendix (pp 18–204); four examples of these data plots are shown in fi gure 1. Norway is an example of a country with complete vital registration data. Our GPR model produced estimates that were very close to the observed data with narrow uncertainty intervals, representing sampling uncertainty only (fi gure 1). El Salvador has data from survey and vital registration systems. The vital registration data are biased downwards, suggesting incomplete registration of child deaths. Nevertheless, the survey estimates are quite consistent with each other, and fairly consistent with the trend in the vital registration data. The GPR estimates track at the level of the survey estimates and have narrow uncertainty intervals. El Salvador is on course to meet MDG 4. Few data were available for Laos. The uncertainty intervals are wide, and broaden as the estimates move further away from the data. Liberia is not on track to meet MDG 4, but has recently shown a steep decline in under-5 mortality, falling from 235 (uncertainty interval 224–248) per 1000 in 1990 to 99 (870–113) per 1000 by 2010. Liberia had data from various sources, including DHS and a malaria indicator survey (MIS). The GPR model tracks the DHS data more closely than the MIS data because there is less non-sampling error in DHS data (see webappendix pp 6–7).
In 2010, we estimate that there will be 7·7 million child deaths worldwide, a decrease from 16 million in 1970 and 11·9 million in 1990 (fi gure 2). These 7·7 million deaths comprise 3·1 million neonatal deaths, 2·3 million
postneonatal deaths, and 2·3 million deaths in children aged 1–4 years. Between 1970 and 2010, the number of deaths in children younger than 5 years has fallen by more than 52%, even though the total number of births has increased by 16% in the same period.10 Our estimates are substantially lower than those produced by UNICEF9 and UNPD10 and those reported in the 2007 study by Murray and colleagues.1 The most recent estimates provided by UNICEF are from 2008; we estimated that there were 7·95 million deaths in 2008 compared with UNICEF’s estimation of 8·77 million. Worldwide, this represents a 30% decline since 1990. Compared with the 2008 UNICEF estimates, our estimates were higher for 73 countries and lower for 110 countries. Where our estimates were lower than UNICEF’s, the most substantial diff erences occurred for the Democratic Republic of the Congo, Afghanistan, Nigeria, Kenya, Angola, China, Burma, Somalia, Pakistan, and Burkina Faso. In most cases, the diff erences were a result of the more recent data used in our analysis. In the case of Afghanistan, UNICEF estimated child mortality without taking into account the more recently available data sources.
Figure 3 shows worldwide neonatal, postneonatal, and childhood mortality rates from 1970 to 2010. Rates in all three age components of under-5 mortality are declining. Neonatal mortality has fallen by 57%, from 53 (uncertainty interval 42–65) per 1000 in 1970 to 23 (18–28) per 1000 in 2010; postneonatal mortality has declined by 62% and childhood mortality by 60% during this period. These reductions equate to rates of decline of 2·1%, 2·3%, and 2·2% per year in the neonatal, postneonatal, and childhood periods, respectively. Although the absolute decreases in the rates of all three components of under-5 mortality are similar, the higher rates of neonatal mortality in each year mean that the relative share of deaths that are caused by neonatal causes has increased from 38·9% in 1970 to 40·7% in 2010. Table 2 provides
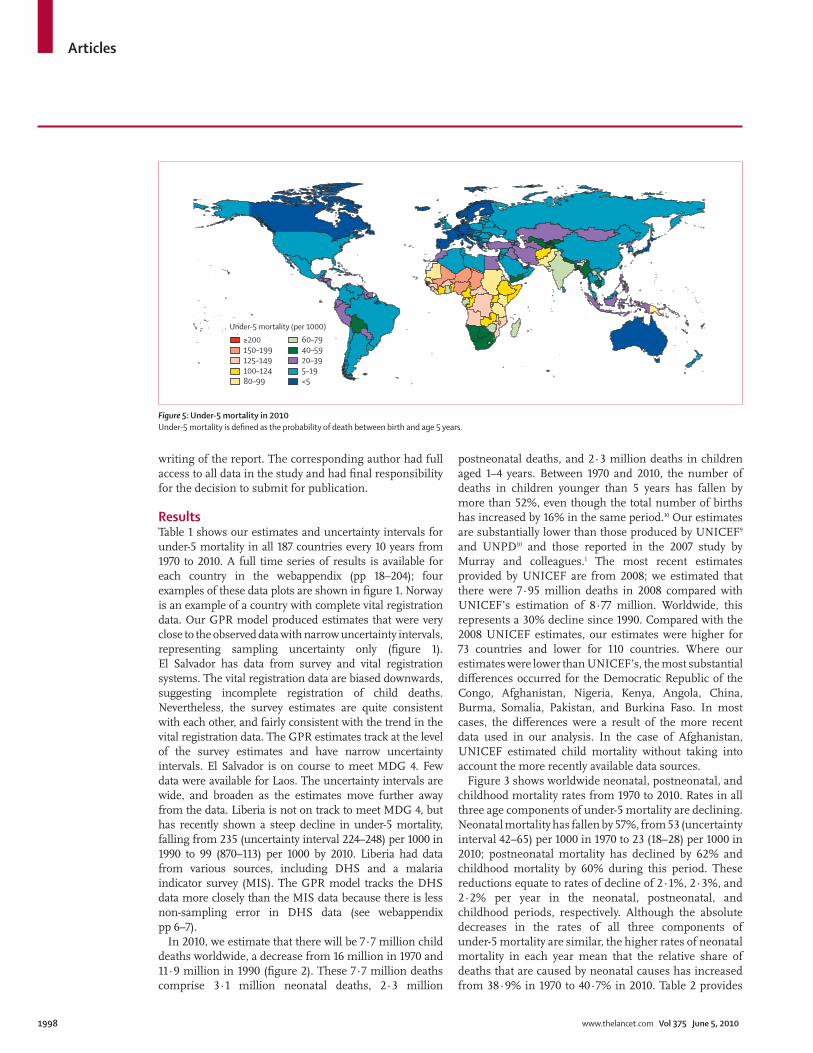
Figure 5: Under-5 mortality in 2010Under-5 mortality is defi ned as the probability of death between birth and age 5 years.
Under-5 mortality (per 1000)≥200150–199125–149100–12480–99
60–7940–5920–395–19<5
Articles
www.thelancet.com Vol 375 June 5, 2010 1999
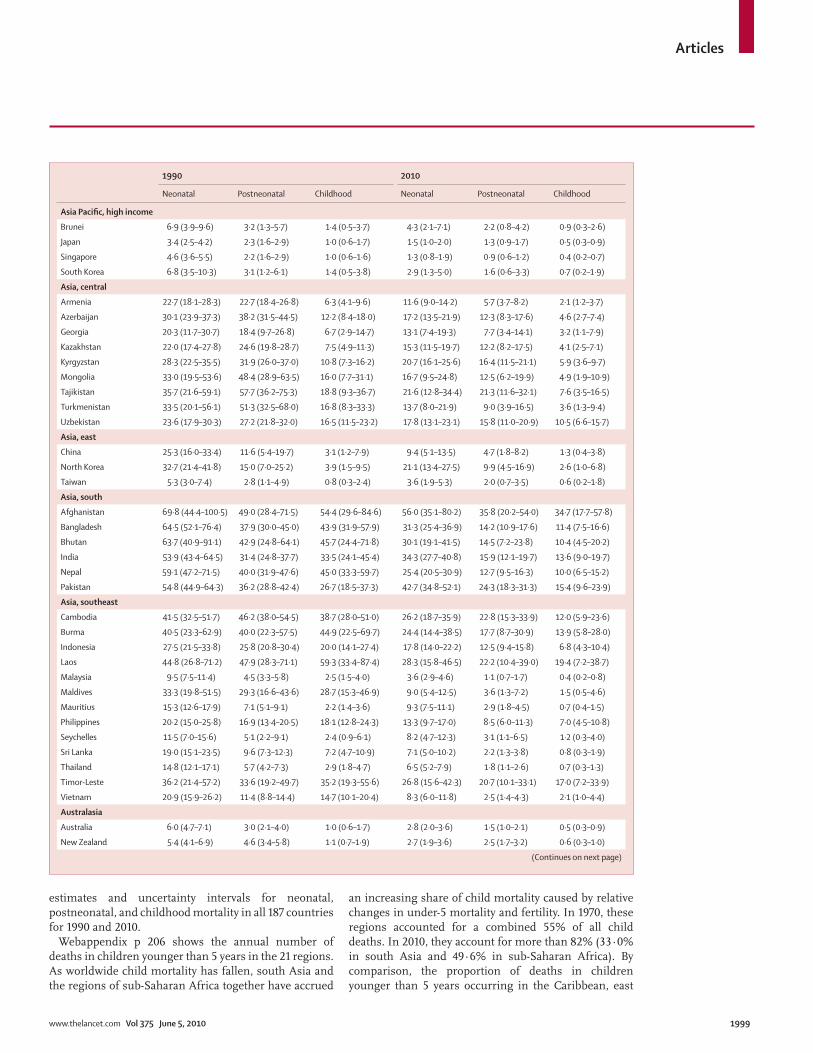
estimates and uncertainty intervals for neonatal, postneonatal, and childhood mortality in all 187 countries for 1990 and 2010.
Webappendix p 206 shows the annual number of deaths in children younger than 5 years in the 21 regions. As worldwide child mortality has fallen, south Asia and the regions of sub-Saharan Africa together have accrued
an increasing share of child mortality caused by relative changes in under-5 mortality and fertility. In 1970, these regions accounted for a combined 55% of all child deaths. In 2010, they account for more than 82% (33·0% in south Asia and 49·6% in sub-Saharan Africa). By comparison, the proportion of deaths in children younger than 5 years occurring in the Caribbean, east
1990 2010
Neonatal Postneonatal Childhood Neonatal Postneonatal Childhood
Asia Pacifi c, high income
Brunei 6·9 (3·9–9·6) 3·2 (1·3–5·7) 1·4 (0·5–3·7) 4·3 (2·1–7·1) 2·2 (0·8–4·2) 0·9 (0·3–2·6)
Japan 3·4 (2·5–4·2) 2·3 (1·6–2·9) 1·0 (0·6–1·7) 1·5 (1·0–2·0) 1·3 (0·9–1·7) 0·5 (0·3–0·9)
Singapore 4·6 (3·6–5·5) 2·2 (1·6–2·9) 1·0 (0·6–1·6) 1·3 (0·8–1·9) 0·9 (0·6–1·2) 0·4 (0·2–0·7)
South Korea 6·8 (3·5–10·3) 3·1 (1·2–6·1) 1·4 (0·5–3·8) 2·9 (1·3–5·0) 1·6 (0·6–3·3) 0·7 (0·2–1·9)
Asia, central
Armenia 22·7 (18·1–28·3) 22·7 (18·4–26·8) 6·3 (4·1–9·6) 11·6 (9·0–14·2) 5·7 (3·7–8·2) 2·1 (1·2–3·7)
Azerbaijan 30·1 (23·9–37·3) 38·2 (31·5–44·5) 12·2 (8·4–18·0) 17·2 (13·5–21·9) 12·3 (8·3–17·6) 4·6 (2·7–7·4)
Georgia 20·3 (11·7–30·7) 18·4 (9·7–26·8) 6·7 (2·9–14·7) 13·1 (7·4–19·3) 7·7 (3·4–14·1) 3·2 (1·1–7·9)
Kazakhstan 22·0 (17·4–27·8) 24·6 (19·8–28·7) 7·5 (4·9–11·3) 15·3 (11·5–19·7) 12·2 (8·2–17·5) 4·1 (2·5–7·1)
Kyrgyzstan 28·3 (22·5–35·5) 31·9 (26·0–37·0) 10·8 (7·3–16·2) 20·7 (16·1–25·6) 16·4 (11·5–21·1) 5·9 (3·6–9·7)
Mongolia 33·0 (19·5–53·6) 48·4 (28·9–63·5) 16·0 (7·7–31·1) 16·7 (9·5–24·8) 12·5 (6·2–19·9) 4·9 (1·9–10·9)
Tajikistan 35·7 (21·6–59·1) 57·7 (36·2–75·3) 18·8 (9·3–36·7) 21·6 (12·8–34·4) 21·3 (11·6–32·1) 7·6 (3·5–16·5)
Turkmenistan 33·5 (20·1–56·1) 51·3 (32·5–68·0) 16·8 (8·3–33·3) 13·7 (8·0–21·9) 9·0 (3·9–16·5) 3·6 (1·3–9·4)
Uzbekistan 23·6 (17·9–30·3) 27·2 (21·8–32·0) 16·5 (11·5–23·2) 17·8 (13·1–23·1) 15·8 (11·0–20·9) 10·5 (6·6–15·7)
Asia, east
China 25·3 (16·0–33·4) 11·6 (5·4–19·7) 3·1 (1·2–7·9) 9·4 (5·1–13·5) 4·7 (1·8–8·2) 1·3 (0·4–3·8)
North Korea 32·7 (21·4–41·8) 15·0 (7·0–25·2) 3·9 (1·5–9·5) 21·1 (13·4–27·5) 9·9 (4·5–16·9) 2·6 (1·0–6·8)
Taiwan 5·3 (3·0–7·4) 2·8 (1·1–4·9) 0·8 (0·3–2·4) 3·6 (1·9–5·3) 2·0 (0·7–3·5) 0·6 (0·2–1·8)
Asia, south
Afghanistan 69·8 (44·4–100·5) 49·0 (28·4–71·5) 54·4 (29·6–84·6) 56·0 (35·1–80·2) 35·8 (20·2–54·0) 34·7 (17·7–57·8)
Bangladesh 64·5 (52·1–76·4) 37·9 (30·0–45·0) 43·9 (31·9–57·9) 31·3 (25·4–36·9) 14·2 (10·9–17·6) 11·4 (7·5–16·6)
Bhutan 63·7 (40·9–91·1) 42·9 (24·8–64·1) 45·7 (24·4–71·8) 30·1 (19·1–41·5) 14·5 (7·2–23·8) 10·4 (4·5–20·2)
India 53·9 (43·4–64·5) 31·4 (24·8–37·7) 33·5 (24·1–45·4) 34·3 (27·7–40·8) 15·9 (12·1–19·7) 13·6 (9·0–19·7)
Nepal 59·1 (47·2–71·5) 40·0 (31·9–47·6) 45·0 (33·3–59·7) 25·4 (20·5–30·9) 12·7 (9·5–16·3) 10·0 (6·5–15·2)
Pakistan 54·8 (44·9–64·3) 36·2 (28·8–42·4) 26·7 (18·5–37·3) 42·7 (34·8–52·1) 24·3 (18·3–31·3) 15·4 (9·6–23·9)
Asia, southeast
Cambodia 41·5 (32·5–51·7) 46·2 (38·0–54·5) 38·7 (28·0–51·0) 26·2 (18·7–35·9) 22·8 (15·3–33·9) 12·0 (5·9–23·6)
Burma 40·5 (23·3–62·9) 40·0 (22·3–57·5) 44·9 (22·5–69·7) 24·4 (14·4–38·5) 17·7 (8·7–30·9) 13·9 (5·8–28·0)
Indonesia 27·5 (21·5–33·8) 25·8 (20·8–30·4) 20·0 (14·1–27·4) 17·8 (14·0–22·2) 12·5 (9·4–15·8) 6·8 (4·3–10·4)
Laos 44·8 (26·8–71·2) 47·9 (28·3–71·1) 59·3 (33·4–87·4) 28·3 (15·8–46·5) 22·2 (10·4–39·0) 19·4 (7·2–38·7)
Malaysia 9·5 (7·5–11·4) 4·5 (3·3–5·8) 2·5 (1·5–4·0) 3·6 (2·9–4·6) 1·1 (0·7–1·7) 0·4 (0·2–0·8)
Maldives 33·3 (19·8–51·5) 29·3 (16·6–43·6) 28·7 (15·3–46·9) 9·0 (5·4–12·5) 3·6 (1·3–7·2) 1·5 (0·5–4·6)
Mauritius 15·3 (12·6–17·9) 7·1 (5·1–9·1) 2·2 (1·4–3·6) 9·3 (7·5–11·1) 2·9 (1·8–4·5) 0·7 (0·4–1·5)
Philippines 20·2 (15·0–25·8) 16·9 (13·4–20·5) 18·1 (12·8–24·3) 13·3 (9·7–17·0) 8·5 (6·0–11·3) 7·0 (4·5–10·8)
Seychelles 11·5 (7·0–15·6) 5·1 (2·2–9·1) 2·4 (0·9–6·1) 8·2 (4·7–12·3) 3·1 (1·1–6·5) 1·2 (0·3–4·0)
Sri Lanka 19·0 (15·1–23·5) 9·6 (7·3–12·3) 7·2 (4·7–10·9) 7·1 (5·0–10·2) 2·2 (1·3–3·8) 0·8 (0·3–1·9)
Thailand 14·8 (12·1–17·1) 5·7 (4·2–7·3) 2·9 (1·8–4·7) 6·5 (5·2–7·9) 1·8 (1·1–2·6) 0·7 (0·3–1·3)
Timor-Leste 36·2 (21·4–57·2) 33·6 (19·2–49·7) 35·2 (19·3–55·6) 26·8 (15·6–42·3) 20·7 (10·1–33·1) 17·0 (7·2–33·9)
Vietnam 20·9 (15·9–26·2) 11·4 (8·8–14·4) 14·7 (10·1–20·4) 8·3 (6·0–11·8) 2·5 (1·4–4·3) 2·1 (1·0–4·4)
Australasia
Australia 6·0 (4·7–7·1) 3·0 (2·1–4·0) 1·0 (0·6–1·7) 2·8 (2·0–3·6) 1·5 (1·0–2·1) 0·5 (0·3–0·9)
New Zealand 5·4 (4·1–6·9) 4·6 (3·4–5·8) 1·1 (0·7–1·9) 2·7 (1·9–3·6) 2·5 (1·7–3·2) 0·6 (0·3–1·0)
(Continues on next page)

Articles
2000 www.thelancet.com Vol 375 June 5, 2010
and southeast Asia, north Africa and the Middle East, and regions of Latin America has decreased by 63% between 1970 and 2010. Less than 1% of child deaths occur in high-income countries.
Figure 4 shows the trends in under-5 mortality for each of the 21 regions between 1970 and 2010. Among regions with the lowest rates of under-5 mortality (fi gure 4A), western Europe, Australasia, Asia-Pacifi c high income, and North America high income have tracked each other closely. However, high income countries in North America have seen less progress in the past 15 years,
largely driven by rates in the USA. Central and eastern Europe have notably higher rates of mortality throughout the entire period. Across all regions of Latin America and north Africa and the Middle East, there has been sustained decline in under-5 mortality (fi gure 4B). The fl uctuations in post-1990 under-5 mortality in southern sub-Saharan Africa show the eff ect of HIV in the region (fi gure 4C). Consistently high rates of mortality in Oceania indicate poor progress. The four regions with the highest rates of under-5 mortality are east, west, and central sub-Saharan Africa, and south Asia (fi gure 4D).
1990 2010
Neonatal Postneonatal Childhood Neonatal Postneonatal Childhood
(Continued from previous page)
Caribbean
Antigua and Barbuda 10·6 (6·3–14·6) 5·3 (2·4–9·4) 2·2 (0·8–5·4) 8·2 (4·6–12·2) 4·0 (1·7–7·3) 1·6 (0·6–4·2)
Barbados 14·8 (8·9–20·6) 8·3 (3·8–13·6) 3·5 (1·4–7·9) 6·4 (3·5–9·6) 3·1 (1·1–5·6) 1·2 (0·4–3·3)
Belize 23·5 (14·5–32·8) 14·4 (7·1–22·6) 6·3 (2·7–13·4) 12·9 (7·8–18·7) 7·0 (3·2–11·9) 2·9 (1·1–7·1)
Cuba 7·9 (6·3–9·5) 4·6 (3·4–5·9) 1·4 (0·9–2·4) 2·8 (2·1–3·7) 1·7 (1·2–2·3) 0·7 (0·4–1·2)
Dominica 13·9 (8·3–18·9) 7·3 (3·5–12·2) 3·1 (1·2–7·2) 9·7 (5·5–14·3) 4·9 (2·0–9·0) 2·0 (0·7–5·0)
Dominican Republic 25·4 (19·9–31·2) 19·3 (15·5–22·9) 13·4 (9·3–19·2) 14·9 (11·4–18·5) 8·1 (5·5–11·3) 4·7 (2·7–7·8)
Grenada 15·1 (9·2–21·2) 8·4 (3·9–13·9) 3·5 (1·4–8·3) 6·9 (4·1–10·2) 3·4 (1·4–6·3) 1·3 (0·4–3·7)
Guyana 32·0 (20·1–44·9) 20·8 (10·8–31·5) 9·4 (4·2–19·5) 20·7 (12·9–30·0) 12·3 (5·9–21·1) 5·4 (2·1–12·5)
Haiti 44·0 (34·4–55·5) 56·8 (46·3–66·8) 56·4 (42·1–71·5) 30·4 (23·0–39·7) 39·2 (30·4–47·2) 36·8 (25·7–49·9)
Jamaica 18·7 (11·5–26·1) 10·9 (5·3–17·8) 4·7 (2·0–10·5) 10·6 (6·1–15·2) 5·6 (2·4–9·5) 2·3 (0·8–5·7)
Saint Lucia 13·2 (7·8–18·3) 7·2 (3·2–12·0) 3·0 (1·2–7·0) 6·8 (3·8–10·1) 3·3 (1·3–6·0) 1·3 (0·5–3·6)
Saint Vincent and the Grenadines
14·1 (8·5–19·6) 7·7 (3·5–13·0) 3·2 (1·3–7·6) 13·1 (7·8–19·6) 7·2 (3·1–12·4) 3·0 (1·1–7·5)
Suriname 24·9 (15·2–35·1) 15·3 (7·6–23·6) 6·8 (2·8–14·4) 19·4 (11·0–27·9) 11·4 (5·1–19·0) 5·0 (1·8–11·4)
The Bahamas 19·7 (12·2–27·8) 11·7 (5·7–18·9) 5·0 (2·0–11·1) 9·2 (5·3–13·3) 4·7 (2·0–8·4) 1·9 (0·6–4·8)
Trinidad and Tobago 20·3 (17·1–23·2) 7·0 (5·0–9·3) 3·0 (1·8–5·0) 17·4 (13·6–22·4) 5·8 (3·9–8·4) 2·5 (1·4–4·3)
Europe, central
Albania 9·2 (6·9–12·6) 24·3 (20·5–27·4) 7·0 (4·7–10·2) 3·7 (2·5–5·3) 8·3 (6·2–11·0) 3·2 (2·0–5·0)
Bosnia and Herzegovina 9·8 (5·7–13·8) 6·5 (2·9–10·5) 1·5 (0·6–4·2) 4·5 (2·4–6·9) 2·6 (1·0–4·4) 0·8 (0·2–2·2)
Bulgaria 8·9 (6·9–11·3) 7·6 (5·8–9·3) 1·9 (1·2–3·0) 5·4 (3·8–7·1) 4·1 (2·9–5·7) 1·3 (0·7–2·1)
Croatia 9·0 (7·4–10·4) 3·6 (2·5–4·8) 0·9 (0·5–1·6) 3·8 (3·0–4·5) 1·3 (0·8–1·8) 0·4 (0·2–0·8)
Czech Republic 7·9 (4·6–11·4) 5·1 (2·3–8·2) 1·2 (0·4–3·5) 2·5 (1·3–3·6) 1·2 (0·4–2·3) 0·4 (0·1–1·4)
Hungary 11·6 (9·7–13·4) 4·1 (2·9–5·7) 1·1 (0·6–1·9) 3·4 (2·7–4·4) 1·6 (1·1–2·2) 0·5 (0·3–0·9)
Macedonia 15·2 (12·1–18·6) 9·7 (7·1–12·3) 1·6 (1·0–2·6) 7·4 (5·5–9·7) 3·7 (2·4–5·5) 0·8 (0·4–1·4)
Montenegro 13·6 (7·5–21·0) 9·7 (4·2–16·2) 2·0 (0·7–5·7) 5·4 (3·0–8·0) 3·2 (1·3–5·7) 0·9 (0·3–2·6)
Poland 12·1 (10·1–13·9) 5·7 (4·1–7·5) 1·3 (0·8–2·2) 4·4 (3·3–5·8) 1·6 (1·0–2·3) 0·5 (0·3–0·9)
Romania 10·6 (8·2–13·8) 16·9 (13·5–20·0) 3·2 (2·0–5·0) 6·2 (4·5–8·2) 7·4 (5·2–10·0) 1·6 (1·0–2·6)
Serbia 8·1 (5·9–10·9) 3·7 (2·3–5·6) 0·9 (0·5–1·7) 2·7 (2·1–3·3) 1·0 (0·6–1·4) 0·3 (0·2–0·6)
Slovakia 7·7 (6·2–9·3) 5·2 (3·9–6·4) 1·3 (0·8–2·1) 3·8 (2·7–5·0) 2·2 (1·4–3·3) 0·7 (0·4–1·2)
Slovenia 6·6 (5·3–7·8) 3·1 (2·2–4·2) 0·9 (0·5–1·6) 2·1 (1·5–2·6) 0·8 (0·5–1·2) 0·4 (0·2–0·7)
Europe, eastern
Belarus 12·8 (7·7–17·7) 6·6 (3·0–11·5) 2·2 (0·8–6·1) 5·7 (3·1–8·6) 3·6 (1·5–5·9) 1·2 (0·4–3·4)
Estonia 10·9 (8·7–13·2) 5·3 (3·9–6·9) 2·0 (1·2–3·3) 3·3 (2·4–4·2) 2·2 (1·6–2·9) 0·8 (0·5–1·3)
Latvia 10·0 (7·9–12·2) 5·5 (4·0–7·0) 1·8 (1·1–3·0) 5·2 (3·8–6·8) 3·2 (2·3–4·3) 1·1 (0·6–1·9)
Lithuania 8·1 (6·3–9·8) 4·9 (3·6–6·2) 1·5 (0·9–2·5) 3·4 (2·5–4·5) 2·6 (1·9–3·4) 0·8 (0·5–1·4)
Moldova 17·2 (13·5–21·5) 14·8 (11·6–17·8) 3·5 (2·3–5·6) 5·6 (4·2–7·7) 6·6 (4·9–8·1) 1·5 (0·9–2·5)
Russia 16·1 (9·7–21·9) 8·1 (3·6–13·7) 2·7 (1·0–7·1) 8·2 (4·5–12·1) 4·8 (2·0–7·8) 1·6 (0·6–4·3)
Ukraine 14·2 (11·6–16·5) 4·9 (3·5–6·5) 2·6 (1·6–4·3) 9·9 (7·7–12·4) 3·7 (2·6–5·1) 2·0 (1·2–3·3)
(Continues on next page)

Articles
www.thelancet.com Vol 375 June 5, 2010 2001
Figure 5 shows worldwide under-5 mortality in 2010 (worldwide under-5 mortality in 1970 and 1990 is shown in webappendix pp 207–08). Improvement in under-5 mortality is visible in all regions—by 2010, mortality is less than 200 per 1000 in all countries,
whereas in 1970, 40 countries had rates higher than this level. The USA, UK, New Zealand, and South Korea lag behind other high-income countries, having failed to reach rates of under-5 mortality of less than fi ve per 1000 by 2010. Latin America and the Caribbean have
1990 2010
Neonatal Postneonatal Childhood Neonatal Postneonatal Childhood
(Continued from previous page)
Europe, western
Andorra 5·8 (3·3–7·8) 2·8 (1·1–5·0) 0·8 (0·3–2·5) 3·0 (1·6–4·1) 1·4 (0·5–2·7) 0·5 (0·1–1·4)
Austria 6·6 (5·3–7·8) 3·3 (2·4–4·5) 0·9 (0·6–1·6) 2·2 (1·6–2·9) 1·3 (0·8–1·7) 0·4 (0·2–0·7)
Belgium 5·8 (4·4–7·0) 3·6 (2·5–4·6) 0·9 (0·5–1·6) 2·2 (1·6–3·0) 1·7 (1·1–2·2) 0·4 (0·2–0·8)
Cyprus 7·9 (4·6–10·6) 3·8 (1·5–6·8) 1·2 (0·4–3·3) 1·7 (0·9–2·6) 0·8 (0·3–1·6) 0·3 (0·1–0·9)
Denmark 5·4 (4·3–6·4) 2·4 (1·7–3·3) 0·9 (0·5–1·5) 2·5 (1·8–3·3) 1·2 (0·7–1·7) 0·4 (0·2–0·8)
Finland 4·6 (3·7–5·5) 1·8 (1·2–2·4) 0·7 (0·4–1·2) 1·9 (1·4–2·5) 0·8 (0·5–1·2) 0·3 (0·2–0·6)
France 5·1 (4·0–6·2) 3·5 (2·5–4·4) 0·9 (0·6–1·6) 2·1 (1·5–2·8) 1·4 (0·9–1·9) 0·4 (0·2–0·7)
Germany 5·5 (3·1–7·4) 2·6 (1·0–4·8) 0·8 (0·3–2·4) 2·5 (1·3–3·6) 1·2 (0·4–2·3) 0·4 (0·1–1·3)
Greece 7·5 (6·2–8·5) 3·0 (2·1–3·9) 0·7 (0·4–1·3) 2·4 (1·8–3·1) 1·0 (0·7–1·4) 0·3 (0·1–0·5)
Iceland 4·1 (2·3–5·8) 2·0 (0·7–3·7) 0·6 (0·2–1·9) 1·6 (0·8–2·4) 0·8 (0·3–1·5) 0·3 (0·1–0·9)
Ireland 5·9 (4·6–7·0) 3·1 (2·2–4·1) 0·9 (0·5–1·6) 2·5 (1·8–3·2) 1·2 (0·8–1·7) 0·4 (0·2–0·7)
Israel 7·1 (5·6–8·4) 3·8 (2·8–4·9) 1·2 (0·8–2·1) 2·7 (1·9–3·5) 1·5 (1·0–2·0) 0·5 (0·3–0·9)
Italy 7·0 (5·8–7·9) 2·3 (1·6–3·2) 0·7 (0·4–1·3) 2·3 (1·8–2·9) 0·7 (0·5–1·1) 0·3 (0·1–0·5)
Luxembourg 5·6 (3·2–7·7) 2·7 (1·0–4·9) 0·8 (0·3–2·5) 1·8 (1·0–2·7) 0·9 (0·3–1·6) 0·3 (0·1–1·0)
Malta 7·0 (3·9–9·6) 3·3 (1·3–6·0) 1·0 (0·3–3·1) 3·2 (1·7–5·0) 1·6 (0·5–3·0) 0·5 (0·2–1·6)
Netherlands 5·7 (4·5–6·7) 2·3 (1·6–3·2) 0·9 (0·6–1·6) 2·7 (2·1–3·5) 1·1 (0·7–1·5) 0·4 (0·2–0·8)
Norway 5·2 (4·0–6·2) 2·7 (1·9–3·6) 1·0 (0·6–1·7) 1·9 (1·4–2·5) 1·0 (0·7–1·4) 0·4 (0·2–0·7)
Portugal 8·3 (6·6–10·1) 5·0 (3·7–6·3) 1·8 (1·1–2·9) 1·9 (1·3–2·6) 0·9 (0·6–1·3) 0·5 (0·3–0·9)
Spain 5·7 (3·3–7·7) 2·7 (1·1–4·9) 0·8 (0·3–2·5) 2·3 (1·2–3·3) 1·1 (0·4–2·1) 0·4 (0·1–1·2)
Sweden 4·6 (3·6–5·4) 2·0 (1·4–2·7) 0·6 (0·4–1·1) 1·5 (1·1–2·1) 0·9 (0·6–1·2) 0·3 (0·1–0·5)
Switzerland 5·4 (4·2–6·4) 2·5 (1·7–3·4) 0·9 (0·5–1·6) 2·6 (1·9–3·4) 1·2 (0·8–1·7) 0·4 (0·2–0·8)
UK 5·6 (4·5–6·8) 3·3 (2·4–4·3) 0·8 (0·5–1·4) 3·1 (2·4–4·0) 1·7 (1·1–2·4) 0·5 (0·3–0·8)
Latin America, Andean
Bolivia 35·7 (27·8–44·8) 37·9 (30·8–44·6) 34·1 (24·8–45·3) 19·3 (13·9–24·1) 17·1 (12·5–20·9) 11·0 (6·9–15·4)
Ecuador 14·4 (11·3–18·2) 23·7 (19·8–27·1) 12·9 (9·1–18·0) 6·0 (4·5–8·1) 10·9 (8·6–13·0) 4·1 (2·6–6·3)
Peru 25·9 (20·0–32·7) 25·4 (20·4–30·1) 23·2 (16·7–31·0) 11·3 (8·6–14·5) 8·2 (6·0–10·5) 5·3 (3·3–8·3)
Latin America, central
Colombia 14·8 (11·7–18·4) 12·8 (10·1–15·3) 6·0 (4·0–9·2) 8·6 (7·0–10·8) 5·0 (3·6–6·9) 1·8 (1·1–3·2)
Costa Rica 11·2 (9·0–13·6) 8·5 (6·4–10·4) 1·8 (1·1–3·1) 5·3 (4·1–6·6) 3·0 (1·9–4·0) 0·5 (0·2–0·9)
El Salvador 22·4 (12·9–34·7) 25·4 (14·2–34·9) 12·8 (5·9–23·3) 9·3 (5·1–14·2) 7·7 (3·6–11·8) 2·4 (0·9–6·1)
Guatemala 22·8 (17·5–28·9) 34·6 (28·4–39·6) 20·4 (14·4–27·5) 10·2 (7·5–13·7) 16·2 (12·8–19·6) 5·9 (3·7–9·2)
Honduras 22·4 (17·0–28·3) 19·1 (15·2–22·8) 15·9 (11·1–21·9) 11·4 (8·8–14·4) 7·0 (5·1–9·0) 4·3 (2·5–6·8)
Mexico 14·0 (10·9–18·1) 21·2 (17·7–24·2) 7·1 (4·8–10·6) 6·6 (4·9–8·5) 8·2 (6·2–9·7) 1·9 (1·1–3·1)
Nicaragua 22·4 (17·4–28·3) 28·8 (23·7–33·2) 14·1 (9·8–20·1) 11·3 (8·5–14·8) 11·4 (8·7–14·6) 4·2 (2·6–6·7)
Panama 12·8 (9·9–15·7) 10·5 (8·3–12·6) 4·8 (3·0–7·2) 8·9 (6·7–11·1) 6·6 (4·8–8·5) 2·6 (1·4–4·1)
Venezuela 14·8 (11·7–18·1) 11·3 (8·7–13·8) 3·5 (2·3–5·6) 9·3 (7·1–11·6) 5·4 (3·7–7·6) 1·4 (0·8–2·5)
Latin America, southern
Argentina 15·5 (12·6–18·6) 10·5 (7·9–13·0) 2·2 (1·4–3·6) 8·2 (6·4–10·1) 3·8 (2·4–5·5) 0·9 (0·5–1·7)
Chile 9·2 (7·2–11·2) 7·6 (5·6–9·4) 1·5 (0·9–2·5) 3·8 (2·9–4·9) 2·1 (1·3–3·0) 0·6 (0·3–1·0)
Uruguay 11·6 (9·3–14·0) 9·2 (7·0–11·2) 1·5 (1·0–2·5) 6·2 (4·6–8·2) 4·5 (3·0–6·0) 0·9 (0·5–1·6)
Latin America, tropical
Brazil 21·6 (17·1–27·0) 23·8 (19·2–27·3) 7·5 (5·0–11·1) 10·1 (7·7–12·4) 8·2 (5·8–10·3) 1·7 (1·0–2·9)
Paraguay 16·7 (12·9–20·5) 13·6 (10·8–16·0) 7·9 (5·2–11·3) 10·3 (7·9–13·7) 7·3 (5·3–9·9) 3·5 (2·1–5·8)
(Continues on next page)

Articles
2002 www.thelancet.com Vol 375 June 5, 2010
made good progress overall, but Bolivia and Haiti have rates higher than 40 per 1000. Of all 38 countries in the world with under-5 mortality higher than 80 per 1000 in 2010, 34 are in sub-Saharan Africa. Countries in southern Africa have notably lower under-5 mortality rates than do countries in other sub-Saharan regions; the west sub-
Saharan African countries of Nigeria, Guinea-Bissau, Niger, Mali, Chad, and Equatorial Guinea have the highest rates of under-5 mortality in the world. In north Africa and the Middle East, only Yemen has a rate of under-5 mortality of more than 40 per 1000 and 12 countries have rates of less than 20 per 1000. Pakistan
1990 2010
Neonatal Postneonatal Childhood Neonatal Postneonatal Childhood
(Continued from previous page)
North Africa and Middle East
Algeria 25·0 (15·5–36·2) 18·6 (9·9–27·7) 9·8 (4·4–19·2) 11·8 (6·9–16·4) 5·6 (2·0–10·1) 2·0 (0·6–5·7)
Bahrain 11·2 (9·3–14·2) 5·4 (4·1–7·3) 2·5 (1·6–4·2) 4·7 (3·5–6·0) 2·1 (1·3–3·0) 0·7 (0·4–1·3)
Egypt 32·4 (25·8–39·7) 32·0 (26·4–37·1) 23·5 (16·8–32·0) 14·4 (11·7–16·9) 7·5 (5·5–9·6) 3·0 (1·8–4·9)
Iran 29·1 (17·9–43·2) 24·0 (13·5–35·0) 13·8 (6·7–25·7) 17·1 (10·4–24·7) 10·0 (4·8–16·5) 4·4 (1·7–10·1)
Iraq 27·0 (16·3–39·3) 20·9 (11·5–30·7) 11·6 (5·4–21·9) 17·3 (10·4–25·2) 10·1 (4·9–17·2) 4·5 (1·7–10·5)
Jordan 18·0 (14·7–21·3) 11·1 (8·6–13·6) 4·7 (3·0–7·1) 9·4 (7·8–11·4) 3·6 (2·4–5·1) 1·1 (0·6–2·1)
Kuwait 8·0 (6·4–9·8) 3·8 (2·5–5·1) 1·1 (0·6–1·9) 5·3 (4·0–6·9) 2·0 (1·2–3·2) 0·5 (0·3–1·0)
Lebanon 17·1 (10·6–23·8) 10·2 (5·0–16·0) 4·4 (1·8–9·7) 7·0 (4·1–10·4) 2·5 (1·0–5·2) 0·7 (0·2–2·4)
Libya 19·6 (12·2–27·8) 12·6 (6·4–19·6) 5·8 (2·5–12·2) 8·5 (5·0–12·2) 3·4 (1·3–6·3) 1·1 (0·3–3·2)
Morocco 34·5 (27·9–41·2) 26·1 (20·9–30·8) 18·3 (12·9–25·6) 19·1 (15·4–22·7) 9·2 (6·3–12·3) 4·4 (2·5–7·1)
Occupied Palestinian territories
21·3 (13·4–30·2) 14·3 (7·4–21·9) 6·9 (2·9–13·9) 13·1 (7·7–18·5) 6·6 (2·8–11·4) 2·5 (0·9–6·1)
Oman 19·3 (12·2–28·2) 12·4 (6·1–19·9) 5·8 (2·5–13·0) 6·6 (3·6–8·5) 2·2 (0·7–4·3) 0·6 (0·1–1·8)
Qatar 10·1 (6·3–13·5) 4·4 (1·9–7·8) 1·4 (0·5–3·9) 7·2 (4·3–9·6) 2·6 (1·0–5·1) 0·7 (0·2–2·4)
Saudi Arabia 16·4 (9·6–22·8) 9·5 (4·3–15·4) 3·9 (1·4–9·5) 9·6 (5·6–13·6) 4·1 (1·6–7·8) 1·3 (0·4–4·0)
Syria 17·4 (10·7–24·0) 10·3 (5·0–16·5) 4·5 (1·9–9·8) 7·7 (4·9–10·3) 2·9 (1·1–5·6) 0·9 (0·3–2·6)
Tunisia 21·3 (16·9–26·3) 16·4 (13·1–19·9) 10·4 (7·1–15·0) 9·4 (6·7–12·3) 4·2 (2·6–6·5) 1·6 (0·8–3·2)
Turkey 30·3 (24·5–37·4) 29·8 (24·6–34·7) 12·9 (8·8–18·8) 16·4 (11·5–17·6) 9·7 (6·0–11·3) 3·4 (1·8–5·0)
United Arab Emirates 10·2 (6·2–14·2) 4·4 (1·8–8·1) 1·5 (0·5–4·2) 2·4 (1·4–3·4) 0·5 (0·1–1·4) 0·1 (0·0–0·4)
Yemen 46·0 (35·6–57·3) 49·0 (39·7–57·2) 39·2 (28·4–52·7) 27·8 (21·9–34·6) 21·3 (15·8–27·1) 12·1 (7·4–19·1)
North America, high income
Canada 5·4 (4·3–6·5) 2·6 (1·8–3·5) 0·8 (0·5–1·4) 2·9 (2·1–3·8) 1·5 (1·0–2·1) 0·5 (0·3–0·8)
USA 7·2 (5·8–8·5) 3·4 (2·4–4·6) 1·0 (0·6–1·7) 3·9 (3·0–4·9) 2·2 (1·5–2·9) 0·6 (0·3–1·1)
Oceania
Fiji 18·6 (10·6–27·2) 11·9 (5·4–18·8) 5·1 (2·0–11·2) 14·5 (8·2–22·2) 8·8 (3·9–14·8) 3·6 (1·4–8·5)
Federated States of Micronesia
28·3 (16·6–42·0) 19·8 (10·1–31·1) 9·2 (3·9–18·9) 14·1 (7·5–21·3) 8·3 (3·5–14·4) 3·5 (1·3–8·3)
Kiribati 36·6 (21·8–51·9) 27·6 (14·7–40·5) 13·4 (6·0–26·0) 23·8 (13·5–35·0) 16·1 (7·8–25·3) 7·2 (3·0–15·5)
Marshall Islands 25·9 (15·5–37·0) 17·6 (9·1–28·1) 8·0 (3·3–16·9) 20·0 (11·7–28·8) 12·5 (5·9–20·8) 5·4 (2·1–12·7)
Papua New Guinea 46·6 (28·6–68·0) 37·7 (20·8–55·4) 19·2 (9·0–36·0) 39·3 (23·4–61·1) 30·4 (15·6–47·4) 15·2 (6·6–30·7)
Samoa 15·9 (9·2–23·6) 9·8 (4·5–16·5) 4·1 (1·6–9·7) 10·5 (5·7–15·3) 5·9 (2·5–10·2) 2·3 (0·9–6·1)
Solomon Islands 20·0 (11·8–28·8) 13·1 (6·1–21·1) 5·7 (2·3–12·6) 15·8 (8·9–23·0) 9·7 (4·3–16·2) 4·1 (1·5–9·4)
Tonga 14·0 (7·9–20·5) 8·4 (3·7–14·2) 3·5 (1·3–8·3) 10·8 (5·7–15·9) 6·1 (2·5–10·1) 2·4 (0·8–6·3)
Vanuatu 26·7 (15·5–39·1) 18·5 (9·4–29·0) 8·5 (3·6–18·2) 12·7 (7·3–19·1) 7·4 (3·2–13·0) 3·0 (1·1–7·5)
Sub-Saharan Africa, central
Angola 52·3 (29·3–90·5) 84·1 (49·9–121·2) 120·1 (76·2–160·2) 37·3 (20·4–64·2) 47·0 (26·6–70·0) 56·9 (31·1–84·5)
Central African Republic 46·6 (35·6–60·3) 60·0 (48·8–71·7) 66·9 (50·9–85·1) 41·2 (31·4–54·5) 50·2 (39·1–63·0) 53·5 (38·1–71·2)
Congo 30·1 (22·7–40·0) 38·3 (30·9–46·8) 45·2 (34·8–58·2) 29·7 (22·5–39·6) 37·7 (30·0–46·9) 44·2 (32·6–59·5)
Democratic Republic of the Congo
39·8 (29·4–53·1) 65·9 (52·1–80·1) 89·0 (69·3–107·9) 32·6 (24·0–43·9) 47·1 (36·6–57·7) 57·5 (42·8–73·6)
Equatorial Guinea 44·0 (24·7–75·8) 63·0 (37·3–90·9) 83·1 (50·7–115·7) 44·4 (24·4–75·3) 63·6 (37·0–93·7) 83·8 (50·0–119·2)
Gabon 31·1 (22·8–40·2) 29·7 (23·2–35·6) 36·1 (26·7–46·4) 25·6 (18·7–33·6) 20·9 (15·4–26·5) 23·4 (15·8–32·9)
(Continues on next page)

Articles
www.thelancet.com Vol 375 June 5, 2010 2003
and Afghanistan have the highest rates of under-5 mortality in south Asia. In southeast Asia, under-5 mortality is less than ten per 1000 in Thailand and Malaysia. Rates of under-5 mortality in the Philippines and Indonesia are twice as high as those in other countries in southeast
Asia; Laos, Cambodia, Timor-Leste, and Burma have rates that are three to four times higher.
The GPR method and enhanced database used in this study allow for a detailed assessment of rates of decline in under-5 mortality. Webappendix p 209 shows the
1990 2010
Neonatal Postneonatal Childhood Neonatal Postneonatal Childhood
(Continued from previous page)
Sub-Saharan Africa, east
Burundi 37·6 (28·2–51·7) 46·5 (36·4–60·1) 101·8 (84·3–122·3) 31·2 (22·3–42·2) 35·7 (27·0–46·2) 69·0 (51·6–89·9)
Comoros 46·9 (37·4–57·5) 39·3 (31·7–46·4) 34·1 (24·8–46·0) 29·2 (22·7–37·1) 20·5 (15·4–26·1) 13·1 (8·2–20·0)
Djibouti 32·3 (18·1–54·8) 37·2 (21·0–55·2) 44·8 (25·0–66·4) 22·4 (12·2–36·8) 23·3 (12·7–34·4) 22·5 (11·5–36·8)
Eritrea 33·7 (24·2–45·3) 36·8 (28·2–46·2) 78·8 (62·7–93·8) 22·1 (15·6–30·4) 21·8 (16·5–28·0) 36·3 (25·9–47·5)
Ethiopia 58·5 (44·7–75·1) 65·0 (51·6–78·3) 93·4 (72·7–114·8) 35·0 (26·6–45·7) 33·5 (26·3–43·2) 36·2 (25·3–50·1)
Kenya 30·1 (22·2–39·5) 38·6 (31·1–45·5) 38·8 (28·7–50·2) 25·9 (18·2–33·4) 31·0 (23·1–37·5) 27·6 (18·1–36·1)
Madagascar 37·4 (28·0–49·0) 55·1 (44·0–67·2) 74·3 (57·9–91·7) 22·0 (16·2–28·5) 25·7 (20·3–31·4) 24·6 (17·1–33·8)
Malawi 48·6 (36·3–64·1) 70·1 (55·2–85·3) 108·6 (86·0–130·6) 26·9 (19·9–36·0) 35·4 (27·5–44·0) 37·7 (26·2–52·1)
Mozambique 59·4 (46·1–75·6) 94·0 (76·0–109·3) 92·5 (70·1–115·9) 39·0 (28·1–50·3) 57·5 (44·0–69·1) 43·5 (29·2–58·6)
Rwanda 45·4 (33·3–59·5) 48·6 (37·9–59·9) 85·5 (67·3–103·6) 32·0 (23·9–42·3) 30·9 (23·2–39·7) 43·7 (30·3–58·1)
Somalia 44·4 (25·4–74·9) 56·6 (33·1–83·5) 83·9 (50·4–115·7) 32·6 (18·2–55·1) 37·4 (21·4–56·1) 45·7 (25·1–68·3)
Sudan 35·7 (26·7–47·0) 30·9 (24·1–38·3) 56·3 (44·1–70·9) 30·3 (21·9–39·0) 24·3 (18·1–30·7) 40·3 (28·4–54·7)
Tanzania 38·5 (29·1–50·4) 56·6 (45·4–67·8) 66·4 (51·6–82·9) 28·3 (20·7–37·1) 37·5 (28·9–46·0) 36·0 (24·6–49·1)
Uganda 42·2 (31·2–55·3) 56·1 (43·8–68·0) 79·5 (61·7–96·3) 31·9 (23·2–42·0) 40·5 (31·5–49·9) 49·0 (34·1–63·0)
Zambia 36·7 (27·5–48·2) 57·5 (45·0–70·5) 88·9 (71·0–106·7) 28·5 (21·4–38·2) 41·1 (31·9–51·0) 54·0 (40·1–69·3)
Sub-Saharan Africa, southern
Botswana 21·1 (15·6–26·7) 18·5 (13·9–22·9) 15·6 (10·6–21·6) 19·8 (14·4–27·0) 16·3 (11·0–23·4) 13·9 (8·2–21·7)
Lesotho 38·6 (29·8–47·9) 35·1 (28·1–41·6) 23·8 (16·4–33·1) 39·2 (28·9–50·4) 36·0 (25·5–47·3) 24·8 (14·7–36·8)
Namibia 26·1 (19·3–33·6) 22·9 (18·0–27·8) 24·8 (18·0–33·2) 22·5 (16·5–28·7) 16·4 (11·9–21·5) 17·1 (11·0–24·7)
South Africa 17·7 (13·2–23·0) 26·0 (21·1–30·2) 15·1 (10·3–20·8) 16·3 (12·0–21·6) 22·9 (17·6–28·6) 12·6 (8·1–19·0)
Swaziland 19·1 (13·9–25·5) 30·7 (24·5–36·6) 25·8 (18·8–34·1) 22·9 (16·6–31·6) 43·5 (31·4–58·1) 38·3 (25·2–54·5)
Zimbabwe 23·0 (17·2–29·8) 25·6 (20·6–30·7) 26·5 (19·4–34·8) 22·6 (16·8–29·7) 24·4 (17·8–32·5) 25·1 (16·6–35·2)
Sub-Saharan Africa, west
Benin 45·4 (33·3–59·8) 53·2 (41·9–64·9) 88·8 (69·9–107·5) 29·4 (20·9–39·8) 30·6 (23·8–38·2) 44·2 (32·7–57·2)
Burkina Faso 46·0 (34·2–60·6) 58·6 (45·4–73·7) 114·5 (93·0–135·5) 31·6 (22·8–43·3) 38·7 (28·7–49·7) 69·4 (51·6–87·0)
Cameroon 41·4 (30·6–54·6) 41·7 (33·1–51·2) 67·6 (53·0–83·8) 33·8 (24·5–46·5) 33·7 (25·6–43·3) 51·5 (37·2–69·9)
Cape Verde 20·2 (9·8–33·9) 17·3 (9·1–27·3) 21·9 (10·8–34·0) 13·0 (5·9–21·7) 9·4 (4·4–15·4) 10·3 (4·5–18·6)
Chad 50·6 (37·7–65·8) 65·7 (51·0–80·9) 110·3 (87·8–130·9) 41·5 (29·9–56·5) 53·5 (41·0–68·4) 83·6 (62·4–108)
Côte d’Ivoire 48·3 (36·8–61·8) 48·9 (39·2–58·5) 60·1 (45·6–76·3) 36·6 (27·0–48·0) 35·6 (27·7–44·3) 39·2 (28·1–53·7)
Ghana 39·5 (29·0–51·5) 30·4 (23·6–37·5) 57·5 (44·1–71·0) 28·1 (20·3–37·1) 19·2 (14·8–24·4) 32·2 (23·8–41·7)
Guinea 60·3 (45·5–78·6) 69·2 (54·7–84·7) 116 (92·3–139·8) 38·9 (28·7–51·7) 41·2 (31·5–51·2) 58·8 (43·1–76·7)
Guinea-Bissau 59·5 (34·7–100·7) 68·5 (40·0–103·5) 124·9 (80·0–164·7) 43·3 (24·1–74·4) 47·0 (26·9–71·4) 77·2 (45·6–107·1)
Liberia 65·6 (50·3–85·2) 95·7 (77·0–113·8) 95·1 (72·4–119·5) 31·7 (23·0–41·6) 39·1 (30·1–49·5) 31·5 (21·3–43·2)
Mali 68·5 (51·2–89·6) 64·8 (50·3–81·2) 143·7 (116·5–169·1) 47·0 (35·2–63·0) 41·6 (32·6–53·0) 81·6 (63·9–102·3)
Mauritania 40·6 (30·0–51·4) 30·4 (23·6–36·8) 46·3 (34·2–58·0) 33·2 (23·9–42·7) 22·7 (16·8–27·9) 32·1 (22·1–42·8)
Niger 53·8 (39·8–72·3) 76·8 (58·2–98·6) 195·2 (164·4–219·5) 31·3 (22·1–43·5) 43·4 (32·2–55·6) 94·7 (72·7–116·5)
Nigeria 49·0 (36·0–64·6) 50·1 (38·3–62·4) 107·9 (86·3–127·3) 41·3 (30·3–55·4) 40·5 (31·2–50·5) 83·5 (64·0–103·1)
Sao Tome and Principe 32·6 (17·0–56·3) 32·5 (18·3–50·3) 48·5 (27·0–70·2) 21·2 (10·1–37·2) 18·4 (9·7–30·3) 23·9 (10·9–39·7)
Senegal 39·3 (28·3–53·0) 33·8 (25·8–43·0) 80·4 (64·7–96·8) 29·2 (21·1–39·5) 19·8 (15·1–25·8) 40·1 (29·8–52·6)
Sierra Leone 61·8 (46·9–79·7) 95·2 (77·4–111·6) 106·6 (81·6–132·3) 38·6 (28·7–51·2) 55·0 (42·9–66·1) 52·3 (37·7–67·8)
The Gambia 40·8 (22·1–69·9) 43·0 (24·4–67·1) 69·6 (40·7–96·6) 25·8 (13·1–44·6) 23·9 (13·1–38·6) 33·3 (17·1–53·2)
Togo 41·5 (30·4–55·3) 37·4 (29·4–46·9) 70·5 (54·8–86·5) 30·1 (21·5–40·3) 24·0 (18·4–31·5) 40·2 (28·4–54·3)
Countries are grouped into 21 regions on the basis of epidemiological profi les and geography. See text for defi nitions of neonatal, postneonatal, and childhood mortality.
Table 2: Neonatal, postneonatal, and childhood mortality (uncertainty interval) per 1000 in 1990 and 2010

Articles
2004 www.thelancet.com Vol 375 June 5, 2010
frequency distribution of yearly rates of change, calculated at each single year increment, across all countries from 1970 to 2010. The median yearly rate of decline was 3·3% and the 10th percentile and 90th percentile rates of change were 0·8% and 6·4%, respectively. The empirical distribution of rates of change also shows that the MDG 4 target rate of change corresponds to the 67th percentile. In 1970–90, the median rate of change across all country-years was 3·2%, whereas in 1990–2010, the median rate of change was 3·3%. Yearly rates of change by country from 1990 to 2010 (calculated over the entire period) are shown in fi gure 6. Across all developing countries, the yearly rate of decline in under-5 mortality is 2·1%, a 35% decline overall. The fastest rates of decline occurred in many Latin American and north African countries. Some countries in sub-Saharan Africa have had yearly rates of decline of more than 3%—Comoros, Eritrea, Ethiopia, Liberia, Madagascar, Malawi, and Niger.
Figure 7 shows, for each of the 21 regions, the yearly rate of decline in under-5, neonatal, postneonatal, and childhood mortality from 1990 to 2010. In regions that consist of developing countries, the yearly rate of decline has been faster for childhood mortality than for postneonatal mortality, and slowest for neonatal mortality. The fastest rates of decline have been more than 6% per year for childhood mortality in Latin America Andean, Latin America tropical, Latin America central, and north Africa and the Middle East. The lowest rates of decline during the MDG 4 target window have been in Oceania and southern sub-Saharan Africa. In regions with developed countries, rates of decline are more uniform across neonatal, postneonatal, and childhood mortality and have stayed between 3% and 5% per year. Rates of decline in high-income countries in North America have, however, been notably lower.
During the MDG period (1990 to 2010), there is clear evidence of acceleration and deceleration in rates of decline in child mortality. Between 1990 and 2000, 31% of country-years had rates of decline that were above the MDG 4 target
rate of 4·4% per year. This proportion increased to 34% of country-years in 2000–10. Figure 8 shows the yearly percentage decline (median across countries) in under-5 mortality in 1990–2000 compared with 2000–10 for the 21 regions. Regions below the 45° equivalence line are showing deceleration and regions above the 45° line are showing acceleration. In 13 regions of the world, including all regions in sub-Saharan Africa, there is evidence of accelerating declines from 2000 to 2010 compared with 1990 to 2000. Three high-income regions are showing a slowdown in decline, but 11 developing country regions are showing accelerations. This fi nding is particularly important since policy attention for the MDGs since the Millennium Declaration in 2000 might be leading to accelerations. The marked accelerations in decline in east Asia and central Asia deserve note since several studies39–41 have reported the slow rate of improvement, especially in China, in the 1990s. From the perspective of the countries with the highest rates of mortality, the accelerations in rates of decline seen in all regions in sub-Saharan Africa are the most encouraging. Clearly these regions are far from the MDG 4 rate of decline, but there are signs of improving progress. Webappendix p 210 provides the rate of decline for each country in sub-Saharan Africa. Rates of decline have increased in 34 countries in sub-Saharan Africa for 2000–10 compared with 1990–2000 and have increased by 1% or more in Angola, Botswana, Cameroon, Congo, Democratic Republic of the Congo, Kenya, Lesotho, Liberia, Rwanda, Senegal, Sierra Leone, Swaziland, and The Gambia. In 25 countries in sub-Saharan Africa, rates of decline now exceed 2% per year; 11 countries have rates of decline in 1990–2000 and 2000–10 that are faster than the global median.
DiscussionOur analysis of 16 174 measurements of child mortality in 187 countries shows that the number of deaths in children younger than 5 years dropped from 16 million in 1970 to 7·7 million in 2010. In developing countries, mortality in
Figure 6: Yearly percentage decline in mortality in children younger than 5 years between 1990 and 2010
Under-5 mortality (per 1000)≥200150–199125–149100–12480–99
60–7940–5920–395–19<5

Articles
www.thelancet.com Vol 375 June 5, 2010 2005
children younger than 5 years declined by 35% from 1990 to 2010, a yearly rate of 2·1%. This rate of decline is lower than the MDG 4 target of 4·4% per year but represents substantial progress across countries; no countries have a rate of under-5 mortality of more than 200 per 1000 in 2010 whereas 12 did in 1990. Although progress has been slowest in sub-Saharan Africa and Oceania, there is clear evidence of accelerating rates of decline in under-5 mortality in all regions of sub-Saharan Africa. Rates of under-5 mortality in 25 countries in sub-Saharan Africa are now declining at more than 2% per year; in 34 countries in this region, the rate of decline has increased in the period 2000–10 compared with 1990–2000.
This assessment yields substantially lower estimates of child mortality than did previous studies. For example, UNICEF reported 8·77 million deaths in 2008, and we
estimated 7·95 million for the same year. Our lower estimate is largely driven by newer surveys that show that declines in child mortality have been faster than projected and by the improved predictive validity of GPR compared with other methods. Loess forecasts used in the 2007 analysis by Murray and colleagues1 tend towards the average long-term rate of decline in countries; when mortality decline is accelerating, these forecasts proved to be too conservative. The change in the overall numbers and the even more striking change in the estimated rates of decline from 1990 to 2008 due to new data and improved methods highlight why it is important to continually update and refi ne the measurement of child mortality. Our assessment of rates of change is also notably diff erent than that done by UNICEF; the correlation coeffi cient of yearly rates of change from 1990 to 2008 in the two
0
Neonatal
Postneonatal
Asia, Pacific,high income
Childhood
Under-5
Neonatal
Postneonatal
Childhood
Under-5
Neonatal
Postneonatal
Childhood
Under-5
Neonatal
Postneonatal
Childhood
Under-5
Neonatal
Postneonatal
Childhood
Under-5
Neonatal
Postneonatal
Childhood
Under-5
Neonatal
Postneonatal
Childhood
Under-5
2
4
6
8
Asia, central Asia, east Asia, south Asia, southeast Australasia Caribbean
0
Europe, central
2
4
6
8
Europe, eastern Europe, western Latin America, Andean Latin America, central Latin America,southern
Latin America,tropical
0
North Africa/Middle East
2
4
Year
ly d
eclin
e (%
)Ye
arly
dec
line
(%)
Year
ly d
eclin
e (%
)
6
8
North America,high income
Oceania Sub-Saharan Africa,central
Sub-Saharan Africa,east
Sub-saharan Africa,southern
Sub-Saharan Africa,west
Figure 7: Yearly percentage decline in under-5, neonatal, postneonatal, and childhood mortality between 1990 and 2010, by regionError bars represent uncertainty intervals. Under-5 mortality is defi ned as the probability of death between birth and age 5 years. See text for defi nitions of neonatal, postneonatal, and childhood mortality.

Articles
2006 www.thelancet.com Vol 375 June 5, 2010
analyses is 0·46. Our assessment of rates of change was based on more extensive data and methods that more carefully track changes in countries than was the UNICEF study. We can draw important lessons from countries with rapid rates of decline in child mortality, but equally, we might draw the wrong inferences if we study countries that are not really showing outstanding improvements. The study of positive deviants needs particularly robust measurement.
There is compelling evidence that several low-income countries in sub-Saharan Africa are experiencing an accelerated decline in child mortality. Our descriptive analysis does not explain this occurrence. Increasing coverage of health interventions such as immunisation, insecticide-treated nets, prevention of mother-to-child transmission of HIV, or antiretroviral drugs could be contributing to the accelerated decline in mortality, although this study provides no direct evidence of this relation. In an era in which the eff ectiveness of development assistance for health has become increasingly important, following up this study with careful country case studies will be crucial. Can we link the accelerated declines in mortality to the delivery of known, eff ective interventions? Are there policy lessons on how governments and other organisations have tackled particular child health problems? A further next
step will be to relate levels and trends in child mortality to changes in the key drivers of child mortality, including income per head, levels of maternal education, the HIV epidemic, and possibly the secular trend in malaria intensity16 to help understand where country performance has been better than expected.
Examination of the distribution of yearly rates of change in under-5 mortality shows that the MDG 4 target of a reduction rate of 4·4% per year corresponds to performance at the 67th percentile level. With hindsight, we can ask whether setting the target at this level was appropriate or not. How much of a stretch should targets be? Looking past 2015, when a new round of health targets might be formulated, it will be important to base the choice of targets on an informed discussion of the distribution of progress across countries. This distribution of progress for child mortality also highlights that in 10% of country-years, rates of decline can exceed 6·4% per year. Bursts of rapid decline are possible. For example, 66 countries have decreased child mortality by more than 30% in just 5 years during the period of this study. Such remarkable declines provide hope that accelerated progress is possible. At the same time, there is evidence of a slowing decline in mortality in some countries—the USA, UK, New Zealand, and South Korea show rates of decline that are slower than expected. These cases deserve further scrutiny to identify factors responsible for slowdowns in progress which might be amenable to intervention.
This study has several limitations. For the analysis of complete birth histories, concerns have been raised that in recent DHS surveys, interviewers might have been transferring births from year 5 to year 6 in the interview to avoid extra questions.42,43 We have analysed complete birth histories for 2-year intervals, which attenuates this eff ect. Additionally, we have included in the overall analysis the summary birth history data that are not aff ected by this occurrence. Results of a sensitivity analysis, which are covered in more detail in webappendix pp 10–16, suggest that birth transference has little eff ect on our estimates with the exception of Liberia. A study has shown that summary birth histories are very robust and might actually have less bias than do complete birth histories for the most recent periods.19 The same study also showed that in the presence of rapid mortality change, summary birth histories can smooth out true changes. In other words, in the presence of mortality shocks or accelerated declines, we might be underestimating the increase or decrease in mortality.
As noted in the methods section, the HIV epidemic might be leading to underestimation or in some cases overestimation of under-5 mortality rates in countries with large HIV epidemics. Our sensitivity analysis suggests that the range of biases is likely to be between an underestimation of ten per 1000 for the under-5 death rate to an overestimation of six per 1000. The scale-up of interventions for HIV are probably decreasing
Figure 8: Yearly percentage decline (median country) in under-5 mortality in 2000–10 compared with 1990–2000, by regionUnder-5 mortality is defi ned as the probability of death between birth and age 5 years.
Year
ly d
eclin
e, 2
000–
10 (%
)
Yearly decline, 1990–2000 (%)
5
4
–10–1 21 3 4 5
0
1
2
3
Asia Pacific, high incomeAustralasiaEurope, westernLatin America, southernNorth America, high incomeAsia, centralEurope, centralEurope, easternAsia, eastAsia, southeastOceania
Asia, southCaribbeanLatin America, AndeanLatin America, centralLatin America, tropicalNorth Africa/Middle EastSub–Saharan Africa, centralSub–Saharan Africa, eastSub–Saharan Africa, southernSub–Saharan Africa, west

Articles
www.thelancet.com Vol 375 June 5, 2010 2007
Confl icts of interestWe declare that we have no confl icts of interest.
AcknowledgmentsThis research was supported by funding from the Bill & Melinda Gates
Foundation. We thank the many individuals around the world who have
helped us to gather empirical data from a wide range of sources. We also
thank David Phillips, Dane Boog, Summer Ohno, and Kate Jackson for
their support in the production of this report.
References1 Murray CJL, Laakso T, Shibuya K, Hill K, Lopez AD. Can we achieve
Millennium Development Goal 4? New analysis of country trends and forecasts of under-5 mortality to 2015. Lancet 2007; 370: 1040–54.
2 Bryce J, Terreri N, Victora CG, et al. Countdown to 2015: tracking intervention coverage for child survival. Lancet 2006; 368: 1067–76.
3 Countdown Coverage Writing Group on behalf of the Countdown to 2015 Core Group. Countdown to 2015 for maternal, newborn, and child survival: the 2008 report on tracking coverage of interventions. Lancet 2008; 371: 1247–58.
4 Child Mortality Coordination Group. Tracking progress towards the Millennium Development Goals: reaching consensus on child mortality levels and trends. Bull World Health Organ 2006; 84: 225–32.
5 Department for International Development. The International Health Partnership launched today. 2007. http://www.dfi d.gov.uk/Media-Room/News-Stories/2007/The-International-Health-Partnership-Launched-Today/ (accessed March 18, 2010).
6 Global Health Council News. Women and children fi rst: a sneak peak at the global business plan for maternal, newborn and child health. 2007. http://www.globalhealth.org/news/article/9098 (accessed Sept 13, 2007).
7 UNFPA News. Second Regular Session UNDP/UNFPA Executive Board: statement by Thoraya Ahmed Obaid, Executive Director, UNFPA. 2007. http://www.unfpa.org/news/news.cfm?ID=1030 (accessed March 18, 2010).
8 UNICEF. Child mortality database: estimates for 2007. Nov 20, 2009. http://www.childmortality.org (accessed March 18, 2010).
9 UNICEF. Child mortality database: estimates for 2008. Nov 20, 2009. http://www.childmortality.org (accessed March 18, 2010).
10 United Nations Population Division. World population prospects: the 2008 revision population database. 2009. http://esa.un.org/unpp (accessed March 18, 2010).
11 Rohde J, Cousens S, Chopra M, et al. 30 years after Alma-Ata: has primary health care worked in countries? Lancet 2008; 372: 950–61.
12 Kleinschmidt I, Schwabe C, Benavente L, et al. Marked increase in child survival after four years of intensive malaria control. Am J Trop Med Hyg 2009; 80: 882–88.
13 Ndirangu J, Newell ML, Tanser F, Herbst AJ, Bland R. Decline in early life mortality in a high HIV prevalence rural area of South Africa: evidence of HIV prevention or treatment impact? AIDS 2010; 24: 593–602.
14 You D, Wardlaw T, Salama P, Jones G. Levels and trends in under-5 mortality, 1990–2008. Lancet 2010; 375: 100–03.
15 Ravishankar N, Gubbins P, Cooley RJ, et al. Financing of global health: tracking development assistance for health from 1990 to 2007. Lancet 2009; 373: 2113–24.
16 WHO. World malaria report 2008. http://www.who.int/malaria/publications/atoz/9789241563697/en/index.html (accessed March 18, 2010).
17 GAVI Alliance. Investing in immunisation through the GAVI Alliance: the evidence base. 2010. http://www.gavialliance.org/resources/GAVI_Alliance_Evidence_Base_March_2010.pdf (accessed March 18, 2010).
18 Boerma JT, Stanecki KA, Newell ML, et al. Monitoring the scale-up of antiretroviral therapy programmes: methods to estimate coverage. Bull World Health Organ 2006; 84: 145–50.
19 Rajaratnam JK, Tran LN, Lopez AD, Murray CJL. Measuring under-fi ve mortality: validation of new low-cost methods. PLoS Med 2010; 7: e1000253.
20 Garenne M, Gakusi E. Health transitions in sub-Saharan Africa: overview of mortality trends in children under 5 years old (1950–2000). Bull World Health Organ 2006; 84: 470–78.
these biases in the recent periods. The uncertainty in the measurement of the level and trend in under-5 mortality rates introduced by the HIV epidemic deserve increased attention by the mortality measurement research community.
The GPR procedure captures sampling error related to the size and design of each survey or study and some features of non-sampling error are also captured. One of the major advantages of the GPR method is that it provides a coherent approach to the assessment of uncertainty, both cross-sectionally and over time, that incorporates sampling error, non-sampling error, and parameter uncertainty. Nevertheless, there might be features of non-sampling error that are idiosyncratic to a particular survey in a particular country that are not captured in the analysis. For surveys with complete birth histories, we analysed both the summary birth history and the complete birth history from the same source; the estimated rates of mortality in children younger than 5 years in any given year from both analyses are not strictly independent so that stochastic sampling variance might be underestimated. Finally, there is always the concern that future surveys will show that some of the surveys in the current analysis record anomalous trends. To aid the work of others, we plan to release computer code to make it practical to implement GPR for child mortality synthesis and forecasting.
UNICEF has called for a focus on selected countries with the greatest number of child deaths.14 Although this strategy is logical, if there are substantial fi xed costs associated with maintaining eff ective programmes at the national level, it might be negated by the acceleration in progress in some countries. The resources and policy eff ort triggered by the MDGs and by advocation for greater attention to child health might fi nally be proving eff ective through accelerations in the rate of decline in some countries with the highest rates of child mortality. Most countries with accelerated progress will not achieve MDG 4. Nevertheless, the international community, through resources and technical support, might be able to play an important part in nurturing these trends. Rapidly reducing child deaths must remain a global health priority. This reduction will be aided by regular, careful, and rigorous assessments with new and comparable methods that inspire confi dence in the level, and more importantly, the rate of decline of child mortality worldwide.
ContributorsJKR managed the research process, including data management, data
analysis, and interpretation of results, and co-wrote the fi rst draft of
the report. JRM participated in data management, methods
development, data analysis and interpretation, and contributed to the
writing of the report. ADF contributed to methods development, and
reviewed the report. HW, AL-R, MC, and LD contributed to data
management and analysis, and reviewed the report. ADL conceived the
research idea, contributed to data analysis and interpretation, and
contributed to the writing of the report. CJLM conceived the research
idea, contributed to data analysis and interpretation, and co-wrote the
fi rst draft of the report.

Articles
2008 www.thelancet.com Vol 375 June 5, 2010
21 Brass W. Methods for estimating fertility and mortality from limited and defective data. Chapel Hill, NC: Laboratories for Population Statistics at the University of North Carolina at Chapel Hill, 1975.
22 Gaskell GD, Wright DB, O’Muircheartaigh CA. Telescoping of landmark events: implications for survey research. Public Opin Q 2000; 64: 77–89.
23 Lessler JT, Sirken MG. Laboratory-based research on the cognitive aspects of survey methodology: the goals and methods of the National Center for Health Statistics Study. Milbank Q 1985; 63: 565–81.
24 Wiener N. Extrapolation, interpolation, and smoothing of stationary time series. Cambridge, MA: MIT Press, 1949.
25 Thompson P. Optimum smoothing of two-dimensional fi elds. Tellus 1956; 8: 84–93.
26 Paciorek P. Nonstationary Gaussian process for regression and spatial modeling. Pittsburgh, PA: Carnegie Mellon University, 2003.
27 Rasmussen CE, Williams CKI. Gaussian processes for machine learning. Cambridge, MA: MIT Press, 2006.
28 Uppsala Confl ict Data Program. UCDP/PRIO armed confl ict dataset v.4-2009, 1946–2008. 2009. http://www.ucdp.uu.se/database (accessed March 2, 2010).
29 Uppsala Confl ict Data Program. UCDP non-state confl ict dataset v. 2.1 2002–2007. 2009. http://www.ucdp.uu.se/database (accessed March 2, 2010).
30 Uppsala Confl ict Data Program. UCDP non-state actor dataset v. 1-2009. 2009. http://www.pcr.uu.se/research/UCDP/data_and_publications/datasets.htm (accessed March 2, 2010).
31 Centre for Research on the Epidemiology of Disasters. Deaths due to natural disasters, 1900–2007. 2009. http://www.emdat.be/advanced-search (accessed Oct 12, 2009).
32 Centre for Research on the Epidemiology of Disasters. CE-DAT: The Complex Emergency Database. 2009. http://www.cedat.org (accessed March 11, 2010).
33 Ward P, Zaba B. The eff ect of HIV on the estimation of child mortality using the children surviving/children ever born technique. South Afr J Demogr 2008; 11: 39–73.
34 Mahy M. Measuring child mortality in AIDS-aff ected countries. Sept 4, 2003. http://www.un.org/esa/population/publications/adultmort/UNICEF_Paper15.pdf (accessed Dec 18, 2009).
35 Nakiyingi JS, Bracher M, Whitworth JAG, et al. Child survival in relation to mother’s HIV infection and survival: evidence from a Ugandan cohort study. AIDS 2003; 17: 1827–34.
36 Drevenstedt GL, Crimmins EM, Vasunilashorn S, Finch CE. The rise and fall of excess male infant mortality. Proc Natl Acad Sci USA 2008; 105: 5016–21.
37 Hammoud EI. Studies in fetal and infant mortality. II. Diff erentials in mortality by sex and race. Am J Public Health Nations Health 1965; 55: 1152–63.
38 Harvard University, Institute for Health Metrics and Evaluation at the University of Washington, Johns Hopkins University, University of Queensland, WHO. Global Burden of Disease Study operations manual. 2009. http://www.globalburden.org/GBD_Study_Operations_Manual_Jan_20_2009.pdf (accessed March 9, 2010).
39 Preker AS, Wang J, Bos E, Peabody J, Jamison DT. Measuring country performance on health: selected indicators for 115 countries. World Bank, 1999.
40 World Bank. World development report 1993: investing in health. New York, NY: Oxford University Press, 1993.
41 Guillot M, Lim S. Infant mortality in Kyrgyzstan before and after the break-up of the Soviet Union. In: Harris K, Moffi t R, eds. Population Association of America Annual Meeting; Detroit, MI, USA; April 30, 2009.
42 Arnold F. Assessment of the quality of birth history data in the demographic and health surveys. Report No. 1: an assessment of DHS-I data quality. 1990. http://www.measuredhs.com/pubs/pdf/MR1/MR1.pdf (accessed March 18, 2010).
43 Curtis SL. Assessment of the quality of data used for direct estimation of infant and child mortality in DHS-II surveys. Occasional Papers No. 3. 1995. http://www.measuredhs.com/pubs/pdf/OP3/OP3.pdf (accessed March 18, 2010).
44 Gregson S, Hallett TB, Kurwa F, et al. Monitoring progress towards Millennium Development Goal 4 in generalised HIV epidemics: measurement and correction for bias in child mortality statistics. IUSSP International Population Conference; Marrakech, Morocco; Sept 27, 2009.
45 Artzrouni M, Zaba B. HIV-induced bias in the estimation of child mortality using birth history reports. Technical Meeting on HIV and Child Mortality London; London, UK; March, 2003.