Neighbourhood mobility in context: household moves and changing neighbourhoods in the Netherlands
18
1 This is the author's Post-print version (final draft post-refereeing as accepted for publication by the journal). The definitive, peer-reviewed and edited version of this article is published as: van Ham M. and Clark W.A.V (2009) Neighbourhood mobility in context: household moves and changing neighbourhoods in the Netherlands. Environment and Planning A 41, 1442-1459. http://dx.doi.org/10.1068/a4182 Neighbourhood mobility in context: household moves and changing neighbourhoods in the Netherlands 1 Maarten van Ham * , William A.V. Clark ** * University of St Andrews, School of Geography & Geosciences, Irvine Building, North Street, St Andrews, Fife, KY16 9AL, UK. Phone +44 (0)1334 463912, Fax +44 (0)1334 463949. E-mail: [email protected] ** Department of Geography, University of California, Los Angeles, Los Angeles, CA 90095-1524, USA. Email: [email protected] Abstract Although high levels of population mobility are often viewed as a problem at the neighbourhood level we know relatively little about what makes some neighbourhoods more mobile than others. The main question in this paper is to what extent differences in out-mobility between neighbourhoods can be explained by differences in the share of mobile residents, or whether other neighbourhood characteristics also play a role. To answer this question we focus on the effects of the socio-economic status and ethnic composition of neighbourhoods and on neighbourhood change. Using data from the Netherlands population registration system and the Housing Demand Survey we model population mobility at both individual and neighbourhood levels. The aggregate results show that the composition of the housing stock and the neighbourhood population explain most of the variation in levels of neighbourhood out-mobility. At the same time although ethnic minority groups in the Netherlands are shown to be relatively immobile, neighbourhoods with concentrations of ethnic minorities have the highest population turnover. The individual level models show that people living in neighbourhoods, with an increase in the percentage of ethnic minorities are more likely to move, except when they belong to an ethnic minority group themselves. The evidence suggests that “white flight” and “socio-economic flight” are important factors in neighbourhood change. Key words: neighbourhoods; population turnover; socio-economic status; ethnic minorities; neighbourhood change, racial proxy hypothesis INTRODUCTION Rapid population turnover in a neighbourhood is often associated with a range of negative outcomes at the individual level. Research has established correlations between high population turnover and residents’ involvement in violence and crime (Shaw and McKay, 1969; Sampson et al., 1997) and there is some evidence that residential 1 This paper was originally formulated with Frans Dieleman before his untimely death three years ago. We wish to acknowledge his ideas and concepts which have been incorporated into the paper as we developed it and to dedicate the paper to the memory of his work on urban patterns and processes.
Transcript of Neighbourhood mobility in context: household moves and changing neighbourhoods in the Netherlands
1
This is the author's Post-print version (final draft post-refereeing as accepted for
publication by the journal). The definitive, peer-reviewed and edited version of this
article is published as: van Ham M. and Clark W.A.V (2009) Neighbourhood
mobility in context: household moves and changing neighbourhoods in the
Netherlands. Environment and Planning A 41, 1442-1459.
http://dx.doi.org/10.1068/a4182
Neighbourhood mobility in context: household
moves and changing neighbourhoods in the
Netherlands1
Maarten van Ham*, William A.V. Clark
**
*University of St Andrews, School of Geography & Geosciences, Irvine Building, North
Street, St Andrews, Fife, KY16 9AL, UK. Phone +44 (0)1334 463912, Fax +44 (0)1334
463949. E-mail: [email protected] **
Department of Geography, University of California, Los Angeles, Los Angeles, CA
90095-1524, USA. Email: [email protected]
Abstract
Although high levels of population mobility are often viewed as a problem at the
neighbourhood level we know relatively little about what makes some neighbourhoods
more mobile than others. The main question in this paper is to what extent differences
in out-mobility between neighbourhoods can be explained by differences in the share of
mobile residents, or whether other neighbourhood characteristics also play a role. To
answer this question we focus on the effects of the socio-economic status and ethnic
composition of neighbourhoods and on neighbourhood change. Using data from the
Netherlands population registration system and the Housing Demand Survey we model
population mobility at both individual and neighbourhood levels. The aggregate results
show that the composition of the housing stock and the neighbourhood population
explain most of the variation in levels of neighbourhood out-mobility. At the same time
although ethnic minority groups in the Netherlands are shown to be relatively immobile,
neighbourhoods with concentrations of ethnic minorities have the highest population
turnover. The individual level models show that people living in neighbourhoods, with
an increase in the percentage of ethnic minorities are more likely to move, except when
they belong to an ethnic minority group themselves. The evidence suggests that “white
flight” and “socio-economic flight” are important factors in neighbourhood change.
Key words: neighbourhoods; population turnover; socio-economic status; ethnic
minorities; neighbourhood change, racial proxy hypothesis
INTRODUCTION
Rapid population turnover in a neighbourhood is often associated with a range of
negative outcomes at the individual level. Research has established correlations between
high population turnover and residents’ involvement in violence and crime (Shaw and
McKay, 1969; Sampson et al., 1997) and there is some evidence that residential
1 This paper was originally formulated with Frans Dieleman before his untimely death three years ago.
We wish to acknowledge his ideas and concepts which have been incorporated into the paper as we
developed it and to dedicate the paper to the memory of his work on urban patterns and processes.
2
instability is related to the health of residents (Aneshensel and Sucoff, 1996; Drukker et
al., 2005). A high level of population turnover is seen as both a symptom and a cause of
problems at the neighbourhood level (Page, 1993; Power and Tunstall, 1995; Pawson
and Bramley, 2000; Anderson and Bråmå, 2004). High population turnover is thought to
be associated with neighbourhood deprivation, levels of crime, weak social structures
within neighbourhoods, a lack of identification with the neighbourhood and anonymity
(Pawson and Bramley, 2000; Parkes and Kearns, 2003). High population turnover can
also cause a spiral of decline, further weakening social structures, resulting in an even
higher population turnover, and reinforcing the negative cycle (Social Exclusion Unit,
2001, Anderson and Bråmå, 2004). Often, it is not the level of mobility, but the
selective character of the mobility that causes problems, especially when there is an
exodus of the better off and an inflow of low socio-economic groups, driving the
neighbourhood towards decline (Friedrichs, 1991; Power, 1997; Skifter Andersen,
2002; Anderson and Bråmå, 2004).
There are many assumptions about the relationship between neighbourhood
socio-economic status and the level of population turnover in neighbourhoods (see
Bailey and Livingston, 2007 for a discussion). But we actually do not know a great deal
about the interaction between neighbourhood characteristics and neighbourhood
population mobility. The scarce literature explicitly focussing on understanding
neighbourhood level mobility suggests that it is not the socio-economic status of
neighbourhoods, but the demographic mix of the neighbourhood population and
characteristics of the housing stock that are the main explanations of neighbourhood
population mobility (for the USA see Moore and Clark, 1990; for the UK see Bailey
and Livingston, 2007). The aim of this paper is to increase our understanding of the
variation in out-mobility between neighbourhoods. We are interested in out-mobility
because those who leave a neighbourhood have a potentially large effect on
neighbourhood change when replaced by others with different characteristics.
On the individual level, there is increasing empirical evidence that
characteristics of the residential context play a role in explaining moving behaviour
(Galster, 1987; Clark et al., 2006; Van Ham and Feijten 2008). Both the socio-economic
status of neighbourhoods (Harris, 1999) and the ethnic mix of the neighbourhood
population (Clark, 1992; Crowder, 2000) have been linked to residential mobility. Some
would argue that static characteristics of the neighbourhood can not influence
neighbourhood mobility as people choose a neighbourhood knowing its characteristics.
Instead, research should focus on the effect of (unanticipated) changes in the
neighbourhood as determinants of mobility behaviour (see Galster, 1987; Lee et al.,
1994; Feijten and Van Ham, 2008). We do, however, think there are also good reasons
to believe that static neighbourhood characteristics can influence mobility. First, due to
imperfect information upon arrival in a neighbourhood, negative aspects of a
neighbourhood might only reveal themselves after some length of time. Second,
people’s needs and desires change over time, which might have an effect on how people
see their neighbourhood. Third, not all people end up in the neighbourhood of their
choice. For most people a suitable dwelling will be the first priority, which will be
accepted even when the dwelling is located in a less desirable neighbourhood. Forth, the
choice to live in a highly mobile or deprived neighbourhood can be a positive choice
connected with a certain phase in the life-course and people might expect to soon move
out of the neighbourhood soon again.
The main question in this paper is to what extent differences in out-mobility
between neighbourhoods can be explained by differences in the share of mobile
residents, or whether other neighbourhood characteristics also play a role. We will focus
explicitly on the effects of the socio-economic status of neighbourhoods, the ethnic
composition of the population and on neighbourhood change. Using secondary data
from the Netherlands population registration system (GBA) and the Housing Demand
3
Survey (WBO) we model population mobility at both neighbourhood and individual
levels.
LITERATURE REVIEW
Most residential mobility is driven by a mismatch between a household’s residential
needs and preferences on the one hand and the characteristics of its current housing
situation on the other hand (Brown and Moore, 1970; Speare et al., 1975; Quigley and
Weinberg, 1977; Clark and Dieleman, 1996). This mismatch is often the result of
demographic changes in the household that lead to the need for more (or less) space
(Clark and Dieleman, 1996). Age and household composition are among the most
important predictors of general residential mobility (Mulder, 1993). Singles and couples
without children are known to be more mobile than couples with children, mainly
because they are more likely to have few commitments, to have not yet settled and to be
working on their labour market trajectory. Income (and indirectly level of education) is
also thought to be an important factor in understanding housing careers (Clark et al.,
2006). Those who live in crowded accommodation are most likely to move (Landsdale
and Guest, 1985; Clark and Dieleman, 1996). Further, homeowners and those living in
single-family dwellings are known to be the least likely to move (Clark and Dieleman,
1996; Helderman et al., 2004).
Given the above, and in line with theory (e.g. Quigley and Weinberg, 1977) and
what was found by Bailey and Livingston for the UK (2007), we expect that the
composition of the neighbourhood housing stock and the associated population sorted
into the stock will be the most important predictors of variation in mobility between
neighbourhoods. Neighbourhoods with a large percentage of rented dwellings and many
young singles can be expected to show the highest population mobility. Levels of
mobility can also be expected to be influenced by the supply side of the housing market.
Mobility is likely to be highest in housing markets with many opportunities for
households to find a dwelling that suits their housing needs.
There is increasing evidence that neighbourhood characteristics – beyond simple
compositional effects – are also part of the explanation of residential mobility (Lee et
al., 1994; Parkes and Kearns, 2003; Clark et al., 2006; Van Ham and Feijten, 2008;
Feijten and Van Ham, 2008). For example, Kearns and Parkes (2003), using UK data
from the English House Condition Survey, found that perceived neighbourhood decline
increases the probability that people wish to move, but decreased the probability that
they would actually move. They also found people who are unhappy with disorder in
the immediate surroundings of their dwelling to be more likely to move, although they
did not find an effect on moving behaviour of characteristics of the wider
neighbourhood. The literature distinguishes two sets of neighbourhood characteristics
potentially influencing population mobility: the physical structure of the neighbourhood
and socio-economic and ethnic characteristics of the neighbourhood population
(Amérigo, 2002). An important characteristic of the physical dimension is building
density, which is a good proxy for such factors as (noise) pollution, (lack of) green
public space, infrastructure, and the appearance of the built environment. Evidence from
the USA and Europe consistently shows that people prefer to live in low-density
environments. Only a small part of the population has a strong preference for living in
the highly-urbanized core areas of large cities (Brower, 1996; Brun and Fagnani, 1994;
Talen, 2001). In the remainder of this literature review we will focus on the socio-
economic and ethnic characteristics of the neighbourhood population as an explanation
of population mobility.
Neighbourhood socio-economic status
4
There is strong academic and policy interest in peoples ability to escape poor
neighbourhoods (e.g. for the Netherlands see Bolt and Van Kempen, 2003, for the US
see Quillian, 1999; 2003). In general, when given the opportunity, people exhibit a
tendency to move away from neighbourhoods with low socio-economic status. Using
data from the American Panel Study of Income Dynamics Quillian (1999, 2003)
showed that the non-poor move away from poor neighbourhoods and that African
Americans are less successful than whites in leaving poor neighbourhoods even after
controlling for their poverty status. Research has shown a range of (negative) contextual
effects of poor neighbourhoods on residents’ social position and social opportunities
such as on school dropout rates (Overman, 2002); childhood achievement (Duncan et
al., 1994); transition rates from welfare to work (Van der Klaauw and Ours, 2003);
deviant behaviour (Friedrichs and Blasius, 2003); social exclusion (Buck, 2001); and
social mobility (Musterd et al., 2003). According to a literature review by Harris (1999),
households (especially those with children) attempt to avoid neighbourhoods with low
socio-economic status, and neighbours who deviate from mainstream norms and values.
Low income, unemployment and low levels of education are seen as indicators of such
deviance (Auletta, 1982; Wilson, 1987; Katz, 1989). From the above it follows that we
can expect that neighbourhoods with low socio-economic status will show high levels
of population mobility.
As stated in the introduction, some argue that it is not neighbourhood socio-
economic status per se that influence residential mobility behaviour, but (unanticipated)
change in neighbourhood status. People select themselves into neighbourhoods based on
the choice for a certain dwelling in a certain neighbourhood, and they tend to stay other
things being equal. Once people have selected a neighbourhood, they become attached
to them (Aitken, 1990). When the socio-economic status of a neighbourhood changes,
especially to a less desirable status, higher status residents can be expected to have high
probabilities of moving out. Their replacements are likely to be less affluent families,
which in turn may bring poverty, unemployment and associated problems to the
neighbourhood, creating a spiral of selective downward mobility associated with high
levels of population turnover.
Neighbourhood ethnic composition
The debate on the role of the neighbourhood socio-economic status in understanding
selective residential mobility is closely related to the debate on the role of ethnic
composition of the neighbourhood population (Clark, 2007). Two main explanatory
mechanisms through which the ethnic composition of neighbourhoods influences
mobility have been suggested. The ‘racial proxy hypothesis’ argues that a whole range
of social problems are concentrated in neighbourhoods with a high percentage of ethnic
minorities (Taub et al., 1984; Clark, 1992; Harris, 1999). This is partly because some
ethnic minority groups are more likely to be unemployed and poor, and partly because
ethnic minorities often end up in poor, deprived and unstable neighbourhoods as a result
of limited choice on the housing market (Bolt and Van Kempen, 2003). According to
the racial proxy hypothesis, people want to escape ethnic concentration neighbourhoods
because these neighbourhoods are deprived and not because they have an aversion to
living near minority group members per se (Crowder, 2000). In a similar fashion, an
increase in ethnic minorities in a neighbourhood can function as a proxy for an increase
of a range of problems in the neighbourhood. According to Gould Ellen (2000),
households in the USA tend to associate a growing ethnic minority presence in a
neighbourhood with structural decline which therefore can be a reason to leave the
neighbourhood. Harris (1999) states that if models properly control for ethnic
composition and (change in) socio-economic composition, neighbourhood desirability
should not be affected by ethnic composition, or change in ethnic composition. It is
therefore very important that neighbourhood ethnic composition and non-ethnic socio-
economic neighbourhood characteristics are analyzed together (Harris, 1999).
5
An alternative mechanism which is invoked to explain neighbourhood
population mobility is the differing choices of white and other ethnic groups for the
preferred composition of the neighbourhood. Initially postulated by Schelling (1969,
1971) different ethnic groups live in different neighbourhoods because of their varying
preferences for own and other race combinations. With consequent moving behaviour
individuals of one race or ethnicity cumulatively settle in highly segregated
neighbourhoods. Clark’s empirical examination of the Schelling hypothesis for the USA
(1991) confirmed that the thesis is broadly correct, but that the differences in
neighbourhood preferences between blacks and whites are significantly greater than
those postulated by Schelling (see also other studies such as Clark, 1992; Ihlanfeldt and
Scafidi, 2002; Ioannides and Zabel, 2003; Zorlu and Mulder, 2008). Based on Schelling
(1969, 1971) we can expect that an increase in the percentage of ethnic minorities in the
neighbourhood especially affects the probability of out-mobility of the native Dutch
population.
Some studies while conceding that preferences play a role in neighbourhood
choice, argue that prejudice and discriminatory reaction also play a role in the levels of
neighbourhood change in ethnicity (Bobo and Zubrinsky, 1996). The white flight
literature (Crowder, 2000) often suggests that whites leave their neighbourhood because
of the increase in the share of ethnic minorities in the neighbourhood. Other support for
the idea that recent changes in the ethnic composition of neighbourhoods have an effect
on whites’ mobility decisions comes from several studies of neighbourhood transitions
(Wolf, 1963; Rapkin and Grigsby, 1960; Taub et al., 1984). In the Netherlands,
neighbourhoods with high concentrations of ethnic minorities are generally perceived as
less desirable compared to ‘white’ neighbourhoods (Bolt et al., 2008). Although levels
of ethnic segregation and concentration are kept to a relatively low level by a broad set
of welfare state arrangements, there are still relatively large differences between
neighbourhoods.
Hypotheses
The following hypotheses have been derived from the literature and will be tested in the
empirical section of this paper:
1. Neighbourhoods with a high percentage of ethnic minorities have high population
mobility and people living in neighbourhoods with a high percentage of ethnic
minorities have a higher probability of moving than people who live in a
neighbourhood with a low percentage of ethnic minorities.
2. Neighbourhoods which experience an increase in the percentage of ethnic minorities
have high population mobility and people living in a neighbourhood which
experienced an increase in the percentage of ethnic minorities are more likely to
move than those in stable neighbourhoods.
3. Neighbourhoods with a high socio-economic status have low population mobility
and people living in neighbourhoods with a high socio-economic status have a lower
probability of moving than people who live in a neighbourhood with a low socio-
economic status.
4. Neighbourhoods which experience a drop in socio-economic status have high
population mobility and people living in a neighbourhood which experienced a drop
in socio-economic status are more likely to move than those in stable
neighbourhoods.
5. An increase in the percentage of ethnic minorities in a neighbourhood is expected to
mainly affect the probability of out-mobility of those belonging to the native Dutch
population. Following the same reasoning that people want to live among people
similar to themselves we expect that a drop in socio-economic status of the
neighbourhood mainly influences the probability of out-mobility of those with a high
income.
6
6. Based on the ‘racial proxy hypothesis’ we expect that controlling for (change in) the
socio-economic status of neighbourhoods will result in insignificant effects for the
neighbourhood ethnicity variables.
DATA AND METHOD
We obtained data on population mobility on the 4-digit postcode level for the year 2002
from Statistics Netherlands (CBS). The registration data originates from the Netherlands
Municipal Personal Records Database (GBA). There is no one-to-one relationship
between 4-digit postcode areas and neighbourhoods as perceived by residents (see
Galster, 2001). However, in urban areas, 4-digit postcodes come close to what people
may perceive as their neighbourhood as urban neighbourhoods are relatively small in
size (one square kilometre or less). To stay as close as possible to the concept of a
neighbourhood, we excluded all rural postcodes and postcodes with less than 100
inhabitants (mainly industrial areas), leaving 2,604 useable postcodes.
We used 9 postcode level variables from the ABF Combimonitor: percentage of
owner occupied dwellings (ABF Research–SysWov); percentage of population aged 15-
34 and aged 65-84 (CBS–Population statistics); percentage households with children
(CBS–Population statistics); percentage one-person households (CBS–Population
statistics); percentage dwellings built after 1991 (ABF Research–SysWov); percentage
of non-western migrants (CBS–Population statistics); degree of urbanization (CBS–
Postcode Register). All variables were measured on the first of January 2002, apart from
the percentage of non-western migrants which was also measured for 1998. We used
neighbourhood level socio-economic status scores for 1998 and 2002 from the
Netherlands Social and Cultural Planning Office (SCP). The scores are based on
educational levels, level of unemployment and incomes in neighbourhoods (see SCP,
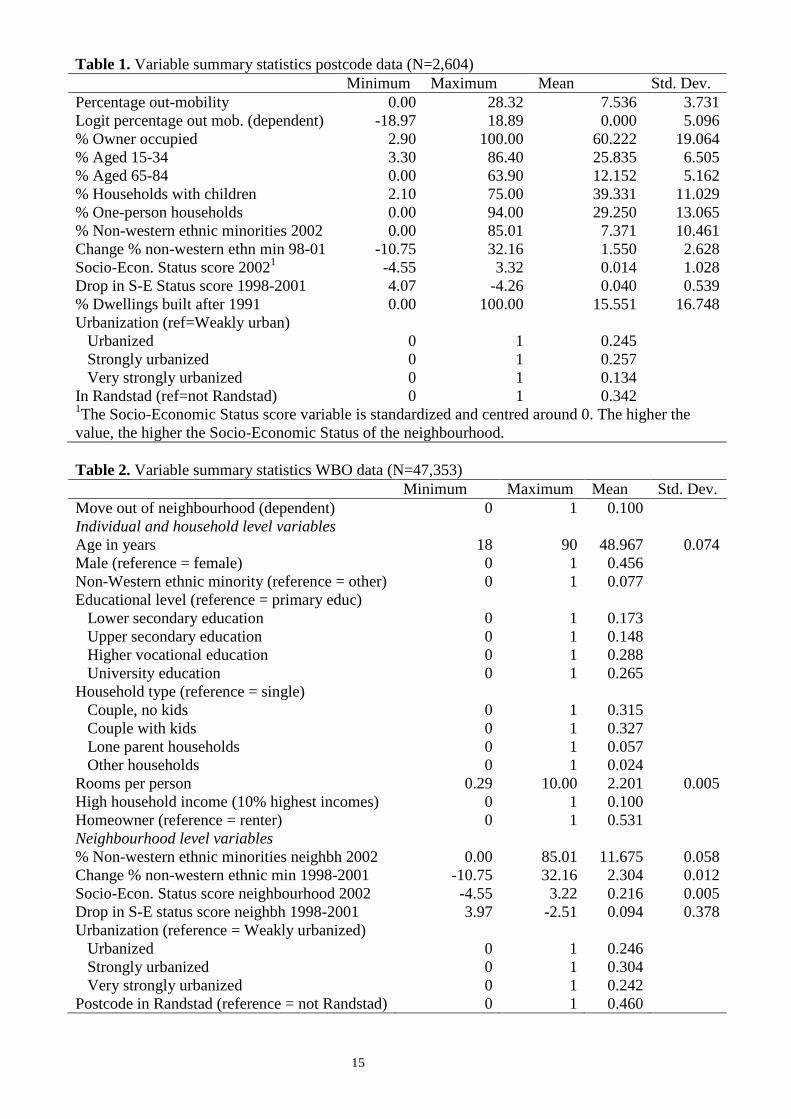
1998). Detailed variable summary statistics can be found in Table 1.
---Table_1---
The individual-level data (75,043 respondents) were assembled from the 2002 Housing
Demand Survey (WBO) of the Ministry of Housing, Spatial Planning and the
Environment (VROM), which is available through the Netherlands Scientific Statistical
Agency. The research sample was representative of the Netherlands’ population aged 18
and over and not living in an institution. The dataset includes the 4-digit postcode of
present residence and past residence for those who moved in the two years before the
interview. For the analysis, respondents between the ages of 18 and 90 were selected,
excluding people still living with their parents, people living in shared housing, people
living in non-house accommodations, and people who moved for educational reasons.
Further, we excluded people living in the most sparsely populated areas (fewer than 500
addresses per square kilometre). In our analyses we concentrate on out-mobility: people
leaving their neighbourhood. We therefore excluded all who moved within the same
postal code area in the two years before the interview. Following this selection, the
research sample consisted of 47,353 respondents. Detailed variable summary statistics
of the individual level data can be found in Table 2.
----Table_2----
For the neighbourhood level analyses we used linear regression to model a centred logit
of the percentage of out-mobility on the postcode level as the dependent variable with
mean 0 and having an almost perfect normal distribution. For the individual level
analyses we used logistic regression to model whether (1) or not (0) respondents moved
to another postcode area in the two years before the interview. Since the models
7
included both individual level characteristics and neighbourhood level characteristics
and the data included multiple individuals per postcode, the standard errors have been
adjusted for clustering of individuals on the postcode level.
ANALYSIS
Neighbourhood level out-mobility
In 2002 The Netherlands had a population of approximately 16 million, of which 9.9
percent moved in that year. A small percent (2.3) moved within the same
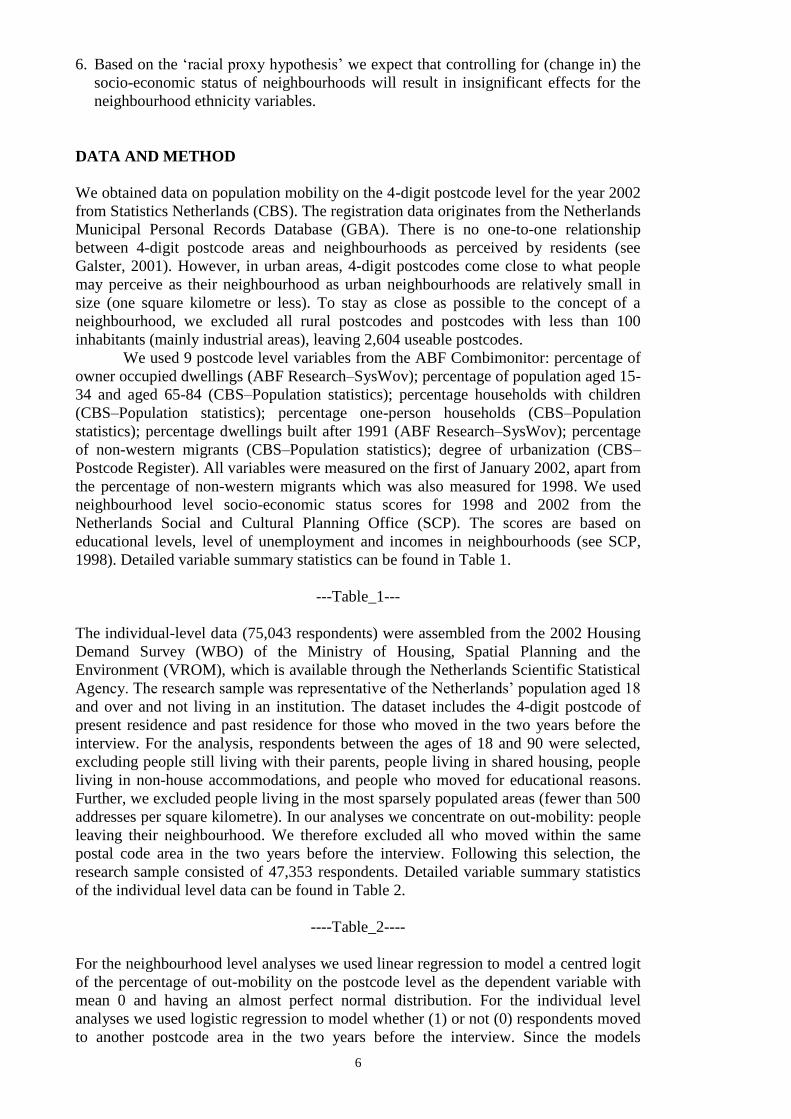
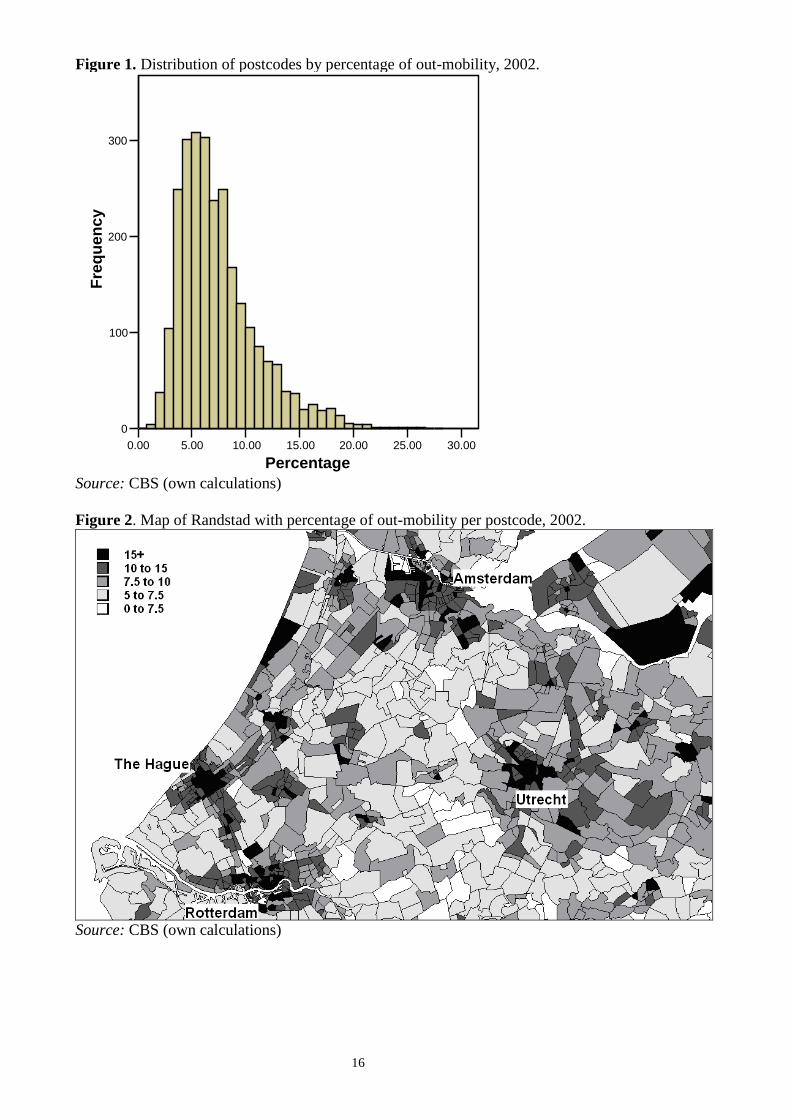
neighbourhood and 7.6 percent moved to another neighbourhood. Figure 1 shows the
large variation in out-mobility between neighbourhoods, ranging from zero percent to
almost 30 percent. Because in most parts of the Netherlands the housing market is very
tight, a high level of out-mobility is an indication of a high level of population turnover,
as most vacant dwellings are filled almost immediately. There are hardly any problems
in the Netherlands with large-scale abandonment of housing estates, unlike for example,
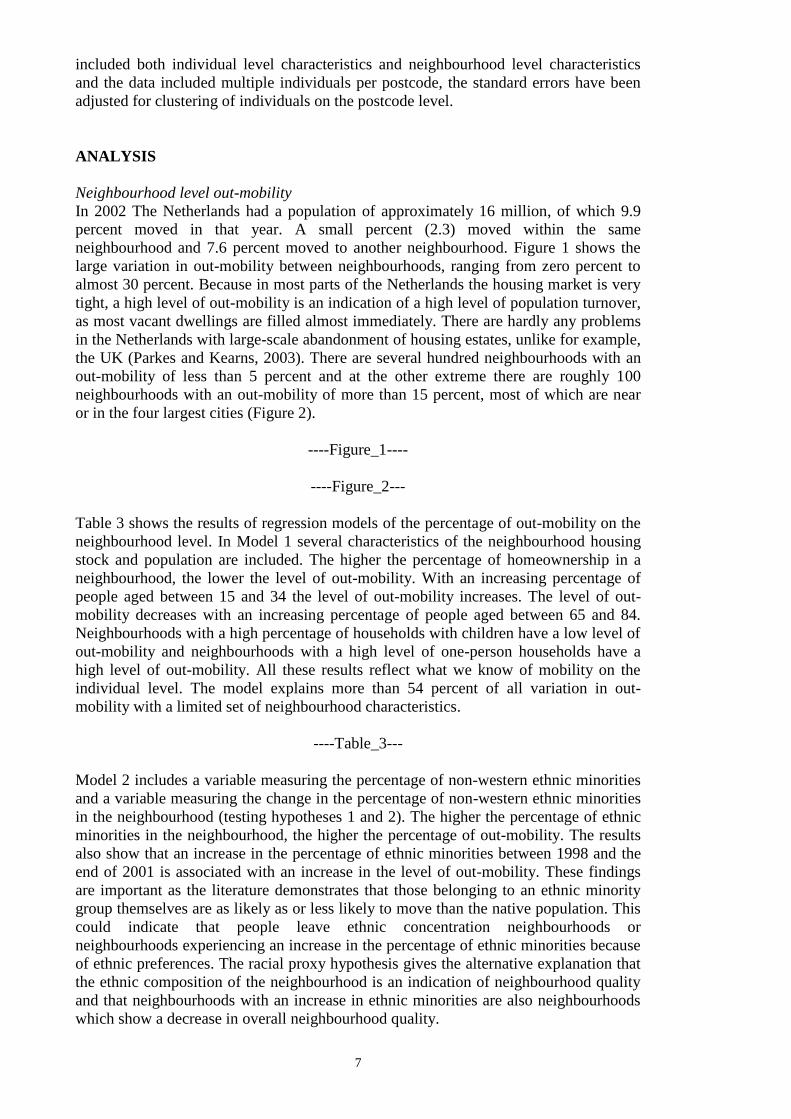
the UK (Parkes and Kearns, 2003). There are several hundred neighbourhoods with an
out-mobility of less than 5 percent and at the other extreme there are roughly 100
neighbourhoods with an out-mobility of more than 15 percent, most of which are near
or in the four largest cities (Figure 2).
----Figure_1----
----Figure_2---
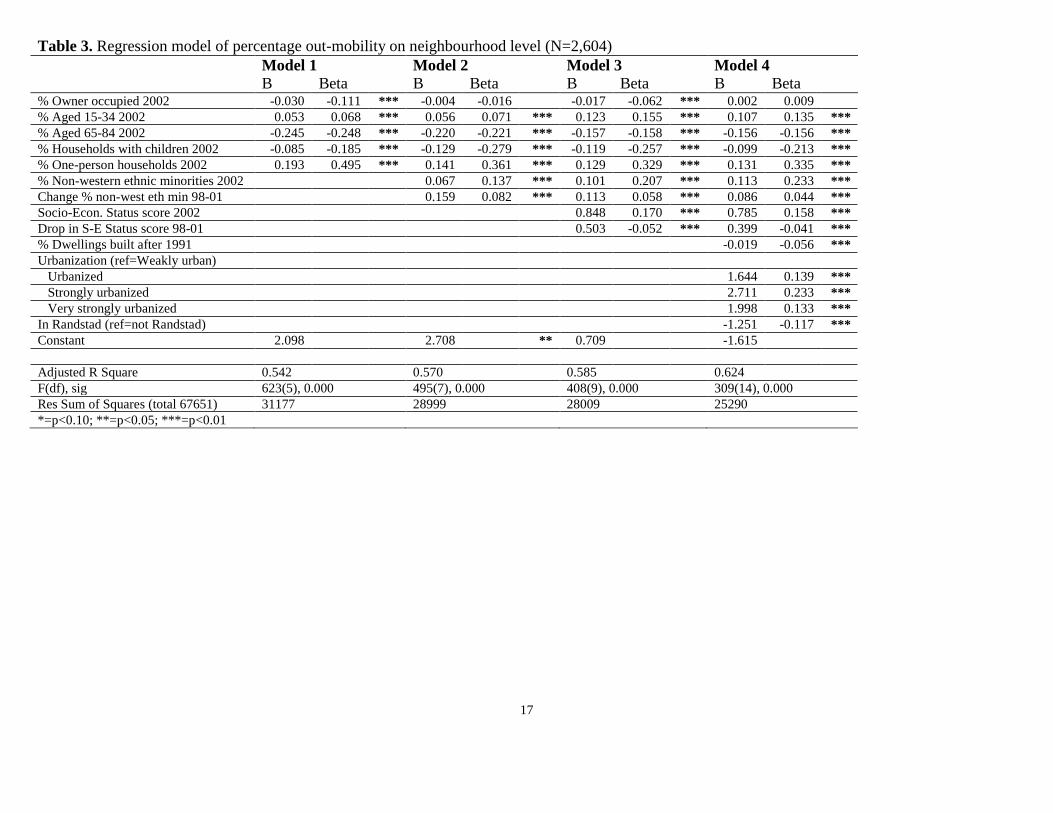
Table 3 shows the results of regression models of the percentage of out-mobility on the
neighbourhood level. In Model 1 several characteristics of the neighbourhood housing
stock and population are included. The higher the percentage of homeownership in a
neighbourhood, the lower the level of out-mobility. With an increasing percentage of
people aged between 15 and 34 the level of out-mobility increases. The level of out-
mobility decreases with an increasing percentage of people aged between 65 and 84.
Neighbourhoods with a high percentage of households with children have a low level of
out-mobility and neighbourhoods with a high level of one-person households have a
high level of out-mobility. All these results reflect what we know of mobility on the
individual level. The model explains more than 54 percent of all variation in out-
mobility with a limited set of neighbourhood characteristics.
----Table_3---
Model 2 includes a variable measuring the percentage of non-western ethnic minorities
and a variable measuring the change in the percentage of non-western ethnic minorities
in the neighbourhood (testing hypotheses 1 and 2). The higher the percentage of ethnic
minorities in the neighbourhood, the higher the percentage of out-mobility. The results
also show that an increase in the percentage of ethnic minorities between 1998 and the
end of 2001 is associated with an increase in the level of out-mobility. These findings
are important as the literature demonstrates that those belonging to an ethnic minority
group themselves are as likely as or less likely to move than the native population. This
could indicate that people leave ethnic concentration neighbourhoods or
neighbourhoods experiencing an increase in the percentage of ethnic minorities because
of ethnic preferences. The racial proxy hypothesis gives the alternative explanation that
the ethnic composition of the neighbourhood is an indication of neighbourhood quality
and that neighbourhoods with an increase in ethnic minorities are also neighbourhoods
which show a decrease in overall neighbourhood quality.
8
Model 3 includes a variable indicating the neighbourhood socio-economic status
score and a variable indicating whether a neighbourhood experienced a drop in socio-
economic status between 1998 and the end of 2001 (testing hypotheses 3 and 4).
Controlling for the other neighbourhood characteristics, neighbourhoods with a high
socio-economic status show a higher level of out-mobility than neighbourhoods with a
low socio-economic status. This is the opposite of what we expected, but can be
explained by the fact that people with a high income are in general more able and more
likely to move. A model with socio-economic status as the only variable shows that
postcodes with a low socio-economic status show the highest level of out-mobility
(results not shown). Model 3 also shows that neighbourhoods which experience a drop
in socio-economic status show a higher level of out-mobility than other
neighbourhoods. Since the effect(s) of (changes in) the ethnic composition of the
neighbourhood remain roughly the same after controlling for (changes in) the socio-
economic status of the neighbourhood, the results seem not to support the racial proxy
hypothesis (hypothesis 6). As mentioned before, Harris (1999) stated that if models
properly control for socio-economic composition, neighbourhood desirability should not
be affected by ethnic composition.
Finally, in model 4 several spatial characteristics of the neighbourhoods are
included. In line with the literature, the results show that with increasing level of
urbanization the level of out-mobility increases, except for the most densely populated
neighbourhoods. Model 5 also shows that after controlling for all other neighbourhood
characteristics, neighbourhoods in the Randstad show the lowest level of out-mobility.
The analysis of out-mobility on the neighbourhood level has yielded some
important results. Model 4 explains over 62% of the total variation in out-mobility with
a limited set of explanatory variables. Most of the variation in out-mobility is explained
by the composition of the housing stock and the composition of the neighbourhood
population. Although the effect of the percentage of owner occupied dwellings in the
neighbourhood was not significant in model 4, a model including only this variable
explains 24 percent of all variation in mobility between neighbourhoods (not shown).
The fact that this effect disappears once neighbourhood population composition is
controlled for implies that neighbourhoods with a high percentage of owner occupied
dwellings are neighbourhoods with the least mobile groups.
Our results show that neighbourhoods with a high level of population turnover
are mainly neighbourhoods with a very mobile population, and not necessarily bad
neighbourhoods. This is in line with findings by Bailey and Livingston (2007) for the
UK. An interesting (although not unexpected) finding is that the level of out-mobility
increases with the percentage of non-western ethnic minorities in the neighbourhood
and is even higher in neighbourhoods which experience an increase in the share of
ethnic minorities. The next section on individual level out-mobility will shed more light
on this outcome: are the ethnic minorities themselves mobile, do people move because
of concentrations of ethnic minorities or is the high level of ethnic minorities in a
neighbourhood a proxy for unfavourable neighbourhood characteristics?
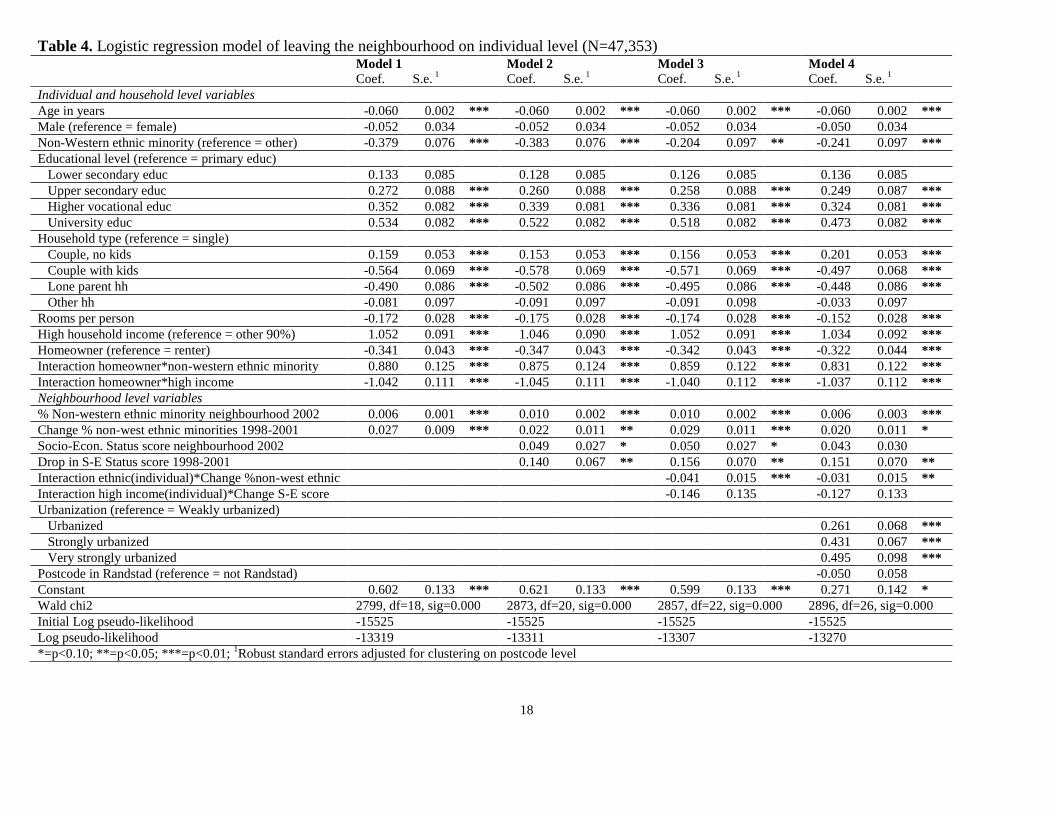
Individual level out-mobility
A series of logistic regression models are used to estimate the probability of leaving the
neighbourhood at the individual level (Table 4). Model 1 includes a range of control
variables plus two neighbourhood level variables. The control variables all show the
expected effect on the probability of moving. With increasing age, the probability of
moving decreases; there is no significant gender effect; those belonging to a non-
western ethnic minority group are less likely to move than others (but this is only the
case for renters, see interaction effect); the probability of moving increases with level of
education; compared to singles and couples without children, couples with children and
lone parents are less likely to move; the probability of moving decreases with the
number of rooms available per person in the household; the probability of moving
9
increases with household income (but this is only the case for renters, see interaction
effect); and homeowners are less likely to move than renters.
----Table_4---
Initially we estimated separate models for homeowners and renters (not shown). The
main differences between these two models were the effects of belonging to a non-
western ethnic minority and the effect of household income. We have therefore included
interaction effects between these two variables and the homeowner dummy. The results
show that homeowners from non-western ethnic minority groups are more likely to
leave their neighbourhood (-0.379-0.341+0.880 = 0.160) than other homeowners (-
0.341), renters from non-western ethnic minority groups (-0.379) and other renters (0).
A possible explanation is that ethnic minorities face more restrictions on the housing
market than others and can therefore not be too critical about the neighbourhood they
choose to live in. But when they move again, they are more likely to leave their
neighbourhood as they try to improve their situation. The interaction effect between
homeowner and income is negative and significant and indicates that homeowners with
a high income (-0.341+1.052-1.042 = -0.331) and other homeowners (-0.341) are the
least likely to move. Renters in general are most likely to move, especially renters with
a high income (1.052).
As hypothesised (hypothesis 1), the percentage of non-western ethnic minorities
in the neighbourhood has a positive effect on the probability of moving. Those living in
concentration neighbourhoods are most likely to leave the neighbourhood. The effect
(0.006) seems small, but for neighbourhoods with the highest percentage of ethnic
minorities (85%) the effect is relatively high (0.006*85=0.51). Also, as expected
(hypothesis 2) the change in the percentage in ethnic minorities in the neighbourhood
has a positive effect on the probability of moving (0.027).
Two variables are added in Model 2. The results show that people who live in a
neighbourhood with a high socio-economic status have a higher probability of moving
and leave the neighbourhood than people who live in a neighbourhood with a low socio-
economic status, but the effect is only just significant. In a model without variables
measuring the (change in) ethnic composition of the neighbourhood the effect of the
socio-economic status variable is negative as expected (not shown). People who live in
a neighbourhood where the socio-economic status dropped in recent years are more
likely to move (0.140) than people living in neighbourhoods where the socio-economic
status increased (hypothesis 4). It is worth noting that for both socio-economic status of
the neighbourhood and the ethnic composition of the neighbourhood, the effect of
recent change is relatively large compared to the effect of static neighbourhood
characteristics. We used several non-linear specifications (including splines) to test for
tipping points in the change variables, but did not find clear evidence for tipping points.
In the analyses of neighbourhood level mobility (Table 3) we saw that
neighbourhoods with a high percentage of ethnic minorities showed a high level of
population turnover. The results in Table 4 show that it is not the ethnic minorities
themselves that have a high level of mobility. The only exception is ethnic minority
homeowners, but these are a relatively small group. Only 22 percent of non-western
ethnic minorities in the dataset are homeowners while 55.6 percent of the others are
homeowners.
We also saw a positive effect of the change in the percentage of ethnic
minorities in the neighbourhood on mobility. From the literature review we derived the
hypothesis (number 5) that an increase in the percentage of non-western ethnic
minorities would mainly affect the probability of moving of those not belonging to an
ethnic minority. This is tested in Model 3 where an interaction effect between the
respondents own ethnicity and the change in ethnic composition of the neighbourhood
is included. The results show that the effect of a change of the ethnic composition of the
10
neighbourhood is -0.012 (0.029-0.041) for ethnic minorities and +0.029 for others. This
means that an increase of ethnic minorities in the neighbourhood has a small negative
effect on the probability that ethnic minorities move out and a relatively large positive
effect for the native Dutch population. The interaction effect between individual income
and change in socio-economic status of the neighbourhood is not significant, indicating
that the Schelling derived hypothesis is not confirmed for socio-economic status. Since
the model also controls for the socio-economic status of the neighbourhood and the
change of socio-economic status, the results do not seem to support the racial proxy
hypothesis (hypothesis 6).
Finally, in Model 4, dummies for the level of urbanisation and a Randstad
dummy are added to the model. Adding these variable changes little compared to Model
3. As expected, the probability of moving increases with the level of urbanisation. After
controlling for all other variables, living in the Randstad has no effect on mobility at the
individual level.
CONCLUSIONS
The analyses of out-mobility at the neighbourhood level have shown that the
composition of the housing stock and the composition of the neighbourhood population
are capable of explaining most variation in mobility between neighbourhoods:
neighbourhoods with a high population turnover are simply neighbourhoods with a
mobile population. If from a policy point of view high population mobility is regarded
as undesirable, there are few options to influence neighbourhood mobility levels. The
most effective measure would probably be to increase the level of home ownership in
neighbourhoods showing a high level of mobility. By stimulating homeownership it is
likely that the neighbourhood population composition shifts towards less mobile groups:
older people and households with children.
The neighbourhood level analyses have shown that the level of out-mobility
increases with the percentage of non-western ethnic minorities in the neighbourhood
and that out-mobility is even higher in neighbourhoods which recently experienced an
increase in the level of ethnic minorities. The individual level analyses have shown that
it is not the ethnic minority groups themselves who are mobile, ruling out that the
neighbourhood level results are simple population composition effects. The individual
level analyses show that those living in neighbourhoods with concentrations of ethnic
minorities are more likely to move and leave the neighbourhood. Moreover, the
analyses also showed that those living in neighbourhoods where there is an increase in
the percentage of non-western ethnic minorities are more likely to leave the
neighbourhood, but that this is only the case for the native Dutch population.
Our results can be seen as either supporting the preference for own race
hypothesis – a Schelling type effect, or some more complex argument involving white
flight as a response to a change in racial composition. Unless we argue that the native
population ‘escapes’ neighbourhoods where there is an increase in the concentration of
ethnic minorities because of other neighbourhood characteristics, and ethnic minority
groups themselves have a ‘lower evaluative standards’ due to a legacy of discrimination
in the housing market (St. John and Clark, 1984), we must conclude that these are
responses directly to the change in ethnicity of the neighbourhood population.
Of course, anyone attempting to model the effect of neighbourhood
characteristics on mobility behaviour should be aware of the fact that the effects found
might be the result of omitted variable bias: unmeasured variables at the individual level
or the level of the neighbourhood which correlate with the (change in the) percentage of
non-western ethnic minorities in the neighbourhood. For example, neighbourhoods
where there is an increase in ethnic minorities might also experience a change in local
public services or other amenities associated with the neighbourhood. It might very well
11
be that these variables are the ‘real’ underlying cause of mobility and not the change in
ethnic composition. However, since we control for the (change in) socio-economic state
of neighbourhoods – the most important control variable mentioned in the literature (see
Harris, 1999) – in both our neighbourhood level models and individual level models, it
is unlikely that the effect of ethnic composition is simply a proxy for the effect of socio-
economic status of neighbourhoods.
Although the results of the present analyses do not give us an in-depth
understanding of the underlying mechanism of the effect of the ethnic composition of
neighbourhoods, the results enhance our understanding of processes of segregation and
seem to be in line with Schelling’s (1969, 1971) segregation hypothesis (see also Clark,
1991; Van Ham and Feijten, 2008). The results also cast doubt on the future success of
mixed housing strategies as stated explicitly by governments in the Netherlands, the
United Kingdom, Germany, France, Finland, and Sweden (Atkinson and Kintrea, 2001;
Kearns 2002; Musterd et al., 1999). The idea is that mixing tenures will create mixed
ethnic and mixed socio-economic neighbourhoods which will create better social
opportunities for individuals (Musterd and Anderson, 2005). However, mixed
neighbourhoods will only work when different groups want to live together. With about
10 percent of the Netherlands population moving each year and more than two thirds of
these movers leaving their neighbourhood, our results suggest that levels of ethnic
segregation are likely to remain high.
Acknowledgements
Maarten van Ham also contributed to this paper while being a member of the Urban and
Regional research centre Utrecht (URU), Faculty of Geosciences, Utrecht University
and the OTB Research Institute for Housing, Urban and Mobility Studies, Delft
University of Technology. The authors wish to thank the editors of Environment and
Planning A and four anonymous referees for their valuable comments.
REFERENCES
Aitken S C, 1990, “Local evaluations of neighborhood change” Annals Of The
Association of American Geographers 80 247 – 267
Amérigo M, 2002, “A psychological approach to the study of residential satisfaction”,
in Residential Environments: Choice, Satisfaction, and Behavior Eds J A Aragonés,
G Francescato, T Gärling (Bergin and Garvey, Westport, CT), pp 81 – 99
Andersson R, Bråmå A, 2004, “Selective migration in Swedish distressed
neighbourhoods: can area-based urban policies counteract segregation processes?”
Housing Studies 19 517 – 539
Aneshensel C S, Sucoff C A, 1996, “The neighborhood context of adolescent mental
health” Journal of Health and Social Behavior 37 293 – 310
Atkinson R, Kintrea K, 2001, “Disentangling area effects: evidence from deprived and
non-deprived neighbourhoods” Urban Studies 38 2277 – 2298
Auletta K, 1982, The Underclass (Random House, New York)
Bailey N, Livingston M, 2007, Population turnover and area deprivation (The Policy
Press, Bristol)
Bobo L, Zubrinsky C L, 1996, “Attitudes on residential integration: perceived status
differences, mere in-group preference, or racial prejudice?” Social Forces 74 883 –
909
Bolt G, Van Kempen R, 2003, “Escaping poverty neighborhoods in the Netherlands”
Housing, theory and society 20 209 – 222
12
Bolt G, Van Kempen R, and Van Ham M 2008, “Minority ethnic groups in the Dutch
housing market: spatial segregation, relocation dynamics and housing policy”
Urban Studies 45 1359 – 1384
Brower S, 1996 Good Neighbourhoods: A Study of In-town and Suburban Residential
Environments (Praeger, Westport, CT)
Brown L A, Moore E G, 1970, ”The intra-urban migration process: a perspective”
Geografiska Annaler Series B 52 1 – 13
Brun J, Fagnani J, 1994, “Lifestyles and locational choices - trade-offs and
compromises: a case-study of middle-class couples living in the Ile-de-France
region” Urban Studies 31 921 – 934
Buck N, 2001, “Identifying neighbourhood effects on social exclusion” Urban Studies
38 2251 – 2275
Clark W A V, 1991, “Residential preferences and neighborhood racial segregation - a
test of the Schelling segregation model” Demography 28 1 – 19
Clark W A V, 1992, “Residential preferences and residential choices in a multiethnic
context” Demography 29 451 – 466
Clark W A V, 2007, “Race, Class, and Place, Evaluating Mobility Outcomes, for
African Americans” Urban Affairs Review 42 295 – 314
Clark W A V, Dieleman F M, 1996 Households and Housing. Choice and Outcomes in
the Housing Market (Center for Urban Policy Research, New Brunswick, NJ)
Clark W A V, Deurloo M C, Dieleman F M, 2006 “Residential mobility and
neighbourhood outcomes” Housing Studies 21 323 – 342
Crowder K, 2000, “The racial context of white mobility: An individual-level assessment
of the white flight hypothesis” Social Science Research 29 223 – 257
Drukker M, Kaplan C, Van Os J, 2005, “Residential instability in socioeconomically
deprived neighbourhoods, good or bad?” Health & Place 11 121 – 129
Duncan G, Brooks-Gunn J, Klebanov P, 1994, “Economic deprivation and early
childhood development” Child Development 65 296 – 318
Feijten P M, Van Ham M, 2008, “Neighbourhood change… reason to leave?”
Submitted to journal; copy available from M Van Ham, School of Geography &
Geosciences, University of St Andrews, UK
Friedrichs J, 1991, “Middle-class leakage in large new housing estates: empirical
findings and policy implications” Journal of Architectural and Planning Research 8
287 – 295
Friedrichs J, Blasius J, 2003, “Social norms in distressed neighbourhoods: Testing the
Wilson hypothesis” Housing Studies 18 807 – 826
Galster G C, 1987, Homeowners and neighborhood reinvestment (Duke University
Press)
Galster G, 2001, “On the nature of neighbourhood” Urban Studies 38 2111 – 2124
Gould Ellen I, 2000, “Race-based neighbourhood projection: a proposed framework for
understanding new data on racial integration” Urban Studies 37 1513 – 1533
Harris D R, 1999 “"Property values drop when blacks move in, because...": racial and
socioeconomic determinants of neighborhood desirability” American Sociological
Review 64 461 – 479
Helderman A, Mulder C H, Van Ham M, 2004, The changing effect of home ownership
on residential mobility in the Netherlands, 1980-98” Housing Studies 19 601 – 616
Ihlanfeldt K R, Scafidi B, 2002, “Black self-segregation as a cause of housing
segregation: Evidence from the multi-city study of urban inequality” Journal of
Urban Economics 51 366-390
Ioannides Y M, Zabel J E, 2003, Neighbourhood effects and housing demand, Journal
of Applied Econometrics 18 563-584
Katz M B, 1989 The undeserving poor: from the war on poverty to the war on welfare
(Pantheon Books, New York)

13
Kearns A, 2002, “Response: from residential disadvantage to opportunity? Reflections
on British and European policy and research” Housing Studies 17 145 – 150
Kearns A, Parkes A, 2003, “Living in and Leaving Poor Neighbourhood Conditions in
England” Housing Studies 18 827 – 851
Lansdale N S, Guest A M, 1985, “Constraints, satisfaction and residential mobility:
Speare's model reconsidered” Demography 22 199 – 222
Lee B A, Oropesa R S, Kanan J W, 1994, “Neighborhood context and residential-
mobility” Demography 31 249 – 270
Moore E G, Clark W A V, 1990, “Housing and households in American cities: structure
and change in population mobility, 1974-1982”, in Housing demography. Linking
demographic structure and housing markets Ed D Myers (Madison, WI: University
of Wisconsin Press) pp 203 – 231
Mulder C H, 1993 Migration dynamics: a life course approach (Thesis Publishers,
Amsterdam)
Musterd S, Anderson R, 2005, “Housing mix, social mix, and social opportunities”
Urban Affairs Review 40 761 – 790
Musterd S, Ostendorf W, De Vos S, 2003, “Neighbourhood effects and social mobility:
a longitudinal analysis” Housing Studies 18 877 – 892
Musterd S, Priemus H, Van Kempen R, 1999, “Towards undivided cities: the potential
of economic revitalisation and housing redifferentiation” Housing Studies 14 573
– 584
Overman H G, 2002, “Neighbourhood effects in large and small neighbourhoods”
Urban Studies 39 117 – 130
Page D, 1993 Building for Communities (Joseph Rowntree Foundation, York)
Parkes A, Kearns A, 2003, “Residential perceptions and housing mobility in Scotland:
An analysis of the longitudinal Scottish House Condition Survey 1991-96” Housing
Studies 18 673 – 701
Pawson H, Bramley G, 2000, “Understanding recent trends in residential mobility in
council housing in England” Urban Studies 37 1231 – 1259
Power A, Tunstall R, 1995 Swimming Against the Tide (Joseph Rowntree Foundation,
York)
Power A, 1997 Estates on the Edge. The Social Consequences of Mass Housing in
Northern Europe (MacMillan, London).
Quigley J M, Weinberg D H, 1977, “Intra-urban residential mobility: A review and
synthesis” International Regional Science Review 2 41– 66
Quillian L, 1999, "Migration Patterns and the Growth of High-Poverty Neighborhoods,
1970–1990" American Journal of Sociology 105 1 – 37
Quillian L, 2003, “How long are exposures to poor neighborhoods? The long-term
dynamics of entry and exit from poor neighborhoods” Population Research and
Policy Review 22(3) 221– 249
Rapkin C, Grigsby W, 1960 The Demand for Housing in Racially Mixed Areas
(University of California Press, Berkeley, CA)
Sampson R J, Raudenbush S W, Earls F, 1997, “Neighborhoods and violent crime: a
multilevel study of collective efficacy” Science 277 918 – 924
Schelling T C, 1969, “Models of segregation” The American Economic Review 59 488 –
493
Schelling T C, 1971, “Dynamic models of segregation” Journal of mathematical
sociology 1 143-186.
SCP, 1998 Van hoog naar laag; van laag naar hoog.[down and up; up and down]
Cahier nr. 152 (Sociaal en Cultureel Planbureau, Rijswijk)
Shaw C R, McKay H, 1969, Juvenile Delinquency and Urban Areas: A Study of Rates
of Delinquency in Relation to Differential Characteristics of Local Communities in
American Cities, revised edition (University of Chicago Press, Chicago)
14
Skifter Andersen H, 2002 Urban Sores: On the Interaction between Segregation, Urban
Decay and Deprived Neighbourhoods (Ashgate, Aldershot)
Social Exclusion Unit (2001) A New Commitment to Neighbourhood Renewal—
National Strategy Action Plan (Cabinet Office, London)
Speare A, Goldstein S, Frey W H, 1975 Residential mobility, migration, and
metropolitan change (Ballinger, Cambridge Mass)
St. John C, Clark F, 1984, “Racial differences in dimensions of neighborhood
satisfaction” Social Indicators Research 15 43 – 60
Talen E, 2001, “Traditional urbanism meets residential affluence: an analysis of the
variability of suburban preference” Journal of the American Planning Association
67 199 – 216
Taub R P, Taylor G D, Dunham J D, 1984 Paths of Neighborhood Change (University
of Chicago Press, Chicago, IL)
Van der Klaauw B, Van Ours J C, 2003, “From welfare to work: does the neighborhood
matter?” Journal Of Public Economics 87 957 – 985
Van Ham M, Feijten P M, 2008, “Who wants to leave the neighbourhood? The effect on
moving wishes of being different from the neighbourhood population” Environment
and Planning A 40 1151 – 1170
Wilson W, 1987 The truly disadvantaged. The inner city, the underclass and public
policy (University of Chicago Press, Chicago)
Wolf E P, 1963, “The tipping-point and racially changing neighborhoods” Journal of
the American Institute of Planners 29 217 – 222
Zorlu A, Mulder C H, 2008, "Initial and subsequent location choices of immigrants to
the Netherlands" Regional Studies 42 245 – 264
15
Table 1. Variable summary statistics postcode data (N=2,604)
Minimum Maximum Mean Std. Dev.
Percentage out-mobility 0.00 28.32 7.536 3.731
Logit percentage out mob. (dependent) -18.97 18.89 0.000 5.096
% Owner occupied 2.90 100.00 60.222 19.064
% Aged 15-34 3.30 86.40 25.835 6.505
% Aged 65-84 0.00 63.90 12.152 5.162
% Households with children 2.10 75.00 39.331 11.029
% One-person households 0.00 94.00 29.250 13.065
% Non-western ethnic minorities 2002 0.00 85.01 7.371 10.461
Change % non-western ethn min 98-01 -10.75 32.16 1.550 2.628
Socio-Econ. Status score 20021 -4.55 3.32 0.014 1.028
Drop in S-E Status score 1998-2001 4.07 -4.26 0.040 0.539
% Dwellings built after 1991 0.00 100.00 15.551 16.748
Urbanization (ref=Weakly urban)
Urbanized 0 1 0.245
Strongly urbanized 0 1 0.257
Very strongly urbanized 0 1 0.134
In Randstad (ref=not Randstad) 0 1 0.342 1The Socio-Economic Status score variable is standardized and centred around 0. The higher the
value, the higher the Socio-Economic Status of the neighbourhood.
Table 2. Variable summary statistics WBO data (N=47,353)
Minimum Maximum Mean Std. Dev.
Move out of neighbourhood (dependent) 0 1 0.100
Individual and household level variables
Age in years 18 90 48.967 0.074
Male (reference = female) 0 1 0.456
Non-Western ethnic minority (reference = other) 0 1 0.077
Educational level (reference = primary educ)
Lower secondary education 0 1 0.173
Upper secondary education 0 1 0.148
Higher vocational education 0 1 0.288
University education 0 1 0.265
Household type (reference = single)
Couple, no kids 0 1 0.315
Couple with kids 0 1 0.327
Lone parent households 0 1 0.057
Other households 0 1 0.024
Rooms per person 0.29 10.00 2.201 0.005
High household income (10% highest incomes) 0 1 0.100
Homeowner (reference = renter) 0 1 0.531
Neighbourhood level variables
% Non-western ethnic minorities neighbh 2002 0.00 85.01 11.675 0.058
Change % non-western ethnic min 1998-2001 -10.75 32.16 2.304 0.012
Socio-Econ. Status score neighbourhood 2002 -4.55 3.22 0.216 0.005
Drop in S-E status score neighbh 1998-2001 3.97 -2.51 0.094 0.378
Urbanization (reference = Weakly urbanized)
Urbanized 0 1 0.246
Strongly urbanized 0 1 0.304
Very strongly urbanized 0 1 0.242
Postcode in Randstad (reference = not Randstad) 0 1 0.460
16
Figure 1. Distribution of postcodes by percentage of out-mobility, 2002.
0.00 5.00 10.00 15.00 20.00 25.00 30.00
Percentage
0
100
200
300
Fre
qu
en
cy
Source: CBS (own calculations)
Figure 2. Map of Randstad with percentage of out-mobility per postcode, 2002.
Source: CBS (own calculations)
17
Table 3. Regression model of percentage out-mobility on neighbourhood level (N=2,604)
Model 1 Model 2 Model 3 Model 4 B Beta B Beta B Beta B Beta % Owner occupied 2002 -0.030 -0.111 *** -0.004 -0.016 -0.017 -0.062 *** 0.002 0.009
% Aged 15-34 2002 0.053 0.068 *** 0.056 0.071 *** 0.123 0.155 *** 0.107 0.135 ***
% Aged 65-84 2002 -0.245 -0.248 *** -0.220 -0.221 *** -0.157 -0.158 *** -0.156 -0.156 ***
% Households with children 2002 -0.085 -0.185 *** -0.129 -0.279 *** -0.119 -0.257 *** -0.099 -0.213 ***
% One-person households 2002 0.193 0.495 *** 0.141 0.361 *** 0.129 0.329 *** 0.131 0.335 ***
% Non-western ethnic minorities 2002 0.067 0.137 *** 0.101 0.207 *** 0.113 0.233 ***
Change % non-west eth min 98-01 0.159 0.082 *** 0.113 0.058 *** 0.086 0.044 ***
Socio-Econ. Status score 2002 0.848 0.170 *** 0.785 0.158 ***
Drop in S-E Status score 98-01 0.503 -0.052 *** 0.399 -0.041 ***
% Dwellings built after 1991 -0.019 -0.056 ***
Urbanization (ref=Weakly urban)
Urbanized 1.644 0.139 ***
Strongly urbanized 2.711 0.233 ***
Very strongly urbanized 1.998 0.133 ***
In Randstad (ref=not Randstad) -1.251 -0.117 ***
Constant 2.098 2.708 ** 0.709 -1.615
Adjusted R Square 0.542 0.570 0.585 0.624
F(df), sig 623(5), 0.000 495(7), 0.000 408(9), 0.000 309(14), 0.000
Res Sum of Squares (total 67651) 31177 28999 28009 25290
*=p<0.10; **=p<0.05; ***=p<0.01
18
Table 4. Logistic regression model of leaving the neighbourhood on individual level (N=47,353) Model 1 Model 2 Model 3 Model 4
Coef. S.e. 1 Coef. S.e.
1 Coef. S.e.
1 Coef. S.e.
1
Individual and household level variables
Age in years -0.060 0.002 *** -0.060 0.002 *** -0.060 0.002 *** -0.060 0.002 ***
Male (reference = female) -0.052 0.034 -0.052 0.034 -0.052 0.034 -0.050 0.034
Non-Western ethnic minority (reference = other) -0.379 0.076 *** -0.383 0.076 *** -0.204 0.097 ** -0.241 0.097 ***
Educational level (reference = primary educ)
Lower secondary educ 0.133 0.085 0.128 0.085 0.126 0.085 0.136 0.085
Upper secondary educ 0.272 0.088 *** 0.260 0.088 *** 0.258 0.088 *** 0.249 0.087 ***
Higher vocational educ 0.352 0.082 *** 0.339 0.081 *** 0.336 0.081 *** 0.324 0.081 ***
University educ 0.534 0.082 *** 0.522 0.082 *** 0.518 0.082 *** 0.473 0.082 ***
Household type (reference = single)
Couple, no kids 0.159 0.053 *** 0.153 0.053 *** 0.156 0.053 *** 0.201 0.053 ***
Couple with kids -0.564 0.069 *** -0.578 0.069 *** -0.571 0.069 *** -0.497 0.068 ***
Lone parent hh -0.490 0.086 *** -0.502 0.086 *** -0.495 0.086 *** -0.448 0.086 ***
Other hh -0.081 0.097 -0.091 0.097 -0.091 0.098 -0.033 0.097
Rooms per person -0.172 0.028 *** -0.175 0.028 *** -0.174 0.028 *** -0.152 0.028 ***
High household income (reference = other 90%) 1.052 0.091 *** 1.046 0.090 *** 1.052 0.091 *** 1.034 0.092 ***
Homeowner (reference = renter) -0.341 0.043 *** -0.347 0.043 *** -0.342 0.043 *** -0.322 0.044 ***
Interaction homeowner*non-western ethnic minority 0.880 0.125 *** 0.875 0.124 *** 0.859 0.122 *** 0.831 0.122 ***
Interaction homeowner*high income -1.042 0.111 *** -1.045 0.111 *** -1.040 0.112 *** -1.037 0.112 ***
Neighbourhood level variables
% Non-western ethnic minority neighbourhood 2002 0.006 0.001 *** 0.010 0.002 *** 0.010 0.002 *** 0.006 0.003 ***
Change % non-west ethnic minorities 1998-2001 0.027 0.009 *** 0.022 0.011 ** 0.029 0.011 *** 0.020 0.011 *
Socio-Econ. Status score neighbourhood 2002 0.049 0.027 * 0.050 0.027 * 0.043 0.030
Drop in S-E Status score 1998-2001 0.140 0.067 ** 0.156 0.070 ** 0.151 0.070 **
Interaction ethnic(individual)*Change %non-west ethnic -0.041 0.015 *** -0.031 0.015 **
Interaction high income(individual)*Change S-E score -0.146 0.135 -0.127 0.133
Urbanization (reference = Weakly urbanized)
Urbanized 0.261 0.068 ***
Strongly urbanized 0.431 0.067 ***
Very strongly urbanized 0.495 0.098 ***
Postcode in Randstad (reference = not Randstad) -0.050 0.058
Constant 0.602 0.133 *** 0.621 0.133 *** 0.599 0.133 *** 0.271 0.142 *
Wald chi2 2799, df=18, sig=0.000 2873, df=20, sig=0.000 2857, df=22, sig=0.000 2896, df=26, sig=0.000
Initial Log pseudo-likelihood -15525 -15525 -15525 -15525
Log pseudo-likelihood -13319 -13311 -13307 -13270
*=p<0.10; **=p<0.05; ***=p<0.01; 1Robust standard errors adjusted for clustering on postcode level