Neighborhood Poverty Impacts Children's Physical Health and Well-Being Over Time: Evidence From the...
24
PLEASE SCROLL DOWN FOR ARTICLE This article was downloaded by: On: 21 April 2011 Access details: Access Details: Free Access Publisher Routledge Informa Ltd Registered in England and Wales Registered Number: 1072954 Registered office: Mortimer House, 37- 41 Mortimer Street, London W1T 3JH, UK Early Education & Development Publication details, including instructions for authors and subscription information: http://www.informaworld.com/smpp/title~content=t775653644 Neighborhood Poverty Impacts Children's Physical Health and Well-Being Over Time: Evidence From the Early Development Instrument Jennifer A. Cushon a ; Lan T. H. Vu b ; Bonnie L. Janzen a ; Nazeem Muhajarine ac a Department of Community Health and Epidemiology, University of Saskatchewan, b Department of Epidemiology, Hanoi School of Public Health, c Saskatchewan Population Health and Evaluation Research Unit, Online publication date: 31 March 2011 To cite this Article Cushon, Jennifer A. , Vu, Lan T. H. , Janzen, Bonnie L. and Muhajarine, Nazeem(2011) 'Neighborhood Poverty Impacts Children's Physical Health and Well-Being Over Time: Evidence From the Early Development Instrument', Early Education & Development, 22: 2, 183 — 205 To link to this Article: DOI: 10.1080/10409280902915861 URL: http://dx.doi.org/10.1080/10409280902915861 Full terms and conditions of use: http://www.informaworld.com/terms-and-conditions-of-access.pdf This article may be used for research, teaching and private study purposes. Any substantial or systematic reproduction, re-distribution, re-selling, loan or sub-licensing, systematic supply or distribution in any form to anyone is expressly forbidden. The publisher does not give any warranty express or implied or make any representation that the contents will be complete or accurate or up to date. The accuracy of any instructions, formulae and drug doses should be independently verified with primary sources. The publisher shall not be liable for any loss, actions, claims, proceedings, demand or costs or damages whatsoever or howsoever caused arising directly or indirectly in connection with or arising out of the use of this material.
-
Upload
independent -
Category
Documents
-
view
2 -
download
0
Transcript of Neighborhood Poverty Impacts Children's Physical Health and Well-Being Over Time: Evidence From the...
PLEASE SCROLL DOWN FOR ARTICLE
This article was downloaded by:On: 21 April 2011Access details: Access Details: Free AccessPublisher RoutledgeInforma Ltd Registered in England and Wales Registered Number: 1072954 Registered office: Mortimer House, 37-41 Mortimer Street, London W1T 3JH, UK
Early Education & DevelopmentPublication details, including instructions for authors and subscription information:http://www.informaworld.com/smpp/title~content=t775653644
Neighborhood Poverty Impacts Children's Physical Health and Well-BeingOver Time: Evidence From the Early Development InstrumentJennifer A. Cushona; Lan T. H. Vub; Bonnie L. Janzena; Nazeem Muhajarineac
a Department of Community Health and Epidemiology, University of Saskatchewan, b Department ofEpidemiology, Hanoi School of Public Health, c Saskatchewan Population Health and EvaluationResearch Unit,
Online publication date: 31 March 2011
To cite this Article Cushon, Jennifer A. , Vu, Lan T. H. , Janzen, Bonnie L. and Muhajarine, Nazeem(2011) 'NeighborhoodPoverty Impacts Children's Physical Health and Well-Being Over Time: Evidence From the Early DevelopmentInstrument', Early Education & Development, 22: 2, 183 — 205To link to this Article: DOI: 10.1080/10409280902915861URL: http://dx.doi.org/10.1080/10409280902915861
Full terms and conditions of use: http://www.informaworld.com/terms-and-conditions-of-access.pdf
This article may be used for research, teaching and private study purposes. Any substantial orsystematic reproduction, re-distribution, re-selling, loan or sub-licensing, systematic supply ordistribution in any form to anyone is expressly forbidden.
The publisher does not give any warranty express or implied or make any representation that the contentswill be complete or accurate or up to date. The accuracy of any instructions, formulae and drug dosesshould be independently verified with primary sources. The publisher shall not be liable for any loss,actions, claims, proceedings, demand or costs or damages whatsoever or howsoever caused arising directlyor indirectly in connection with or arising out of the use of this material.

Neighborhood Poverty ImpactsChildren’s Physical Health and
Well-Being Over Time: Evidence Fromthe Early Development Instrument
Jennifer A. CushonDepartment of Community Health and Epidemiology,
University of Saskatchewan
Lan T. H. VuDepartment of Epidemiology, Hanoi School of Public Health
Bonnie L. JanzenDepartment of Community Health and Epidemiology,
University of Saskatchewan
Nazeem MuhajarineDepartment of Community Health and Epidemiology,
University of Saskatchewan; and Saskatchewan Population Health andEvaluation Research Unit
Research Findings: The purpose of this study was to investigate howneighborhoods and neighborhood socioeconomic disadvantage impact schoolreadiness over time. School readiness was measured using the Early Develop-ment Instrument (EDI) for 3 populations of kindergartners in 2001, 2003, and2005 in Saskatoon, Saskatchewan, Canada. EDI results revealed that meanscores for the EDI domains of (a) physical health and well-being and (b) com-munication and general knowledge have been decreasing over time, although
Correspondence regarding this article should be addressed to Jennifer A. Cushon,
Department of Community Health and Epidemiology, Health Science Building, 107 Wiggins
Road, University of Saskatchewan, Saskatoon, Saskatchewan, Canada S7N 5E5. E-mail:
EARLY EDUCATION AND DEVELOPMENT, 22(2), 183–205
Copyright # 2011 Taylor & Francis Group, LLC
ISSN: 1040-9289 print=1556-6935 online
DOI: 10.1080/10409280902915861
183
Downloaded At: 19:23 21 April 2011

this varied according to neighborhood. A derived summary measure ofsocioeconomic disadvantage at the neighborhood level was significantly asso-ciated with declining scores in the EDI domain of physical health andwell-being. Practice or Policy: These findings suggest a need for policy andprograms that address the underlying determinants of poor school readinessscores, such as socioeconomic disadvantage at the neighborhood level.
Most simply, school readiness refers to the various competencies that chil-dren require at the time of school entry for success in the later years.Although there is general agreement about the nature of school readiness,contention exists regarding the components of child development thatcontribute most to school readiness. For instance, a number of authors havecriticized school readiness studies for focusing on specific components ofdevelopment such as literacy to the exclusion of other developmental areassuch as social and behavioral competencies (Snow, 2006). To reflect theemerging consensus that school readiness should be a multidimensional con-struct that reflects more than just cognitive skills (Janus & Offord, 2007),this study defined school readiness as a holistic concept that encompassesthe cognitive, social, physical, communication, and behavioral competencieschildren require for success in their first years of school (Emig, 2000; Graue,2006; Pianta, 2002). Some have also argued that children are in fact bornwith an inherent readiness to learn (Graue, 2006). In this article, the focusis on school readiness rather than the broader term readiness to learn.
School readiness is fundamental to a child’s development because thosechildren who demonstrate low school readiness begin school already fallingbehind their peers, they often do not catch up to their ‘‘school ready’’ con-temporaries, and they have declining academic performance in later years(Darlington, Royce, Snipper, Murray, & Lazar, 1980; Graham & Power,2007; Guo, Brooks-Gunn, & Harris, 1996; Hertzman, 1999; Janus & Duku,2007; Snow, 2006). The precise pathways by which school readiness in theearly years affects later academic performance are not clearly understoodat present; however, authors have contended that children with low schoolreadiness may experience lower expectations from teachers, lose confidencein themselves, and experience academic failure, which further jeopardizestheir chances of achieving success in the first year of school and beyond(Mustard, McCain, & Bertrand, 2000).
Evaluating the concept of school readiness has become increasinglypopular among child development and education researchers, as evidencedby two special issues of Early Education and Development (EE&D). The ear-lier special issue (Volume 17, Number 1) explored the measurement of
184 CUSHON, VU, JANZEN, AND MUHAJARINE
Downloaded At: 19:23 21 April 2011

school readiness, and the more recent special issue (Volume 18, Number 3)was dedicated to measuring school readiness with the Early DevelopmentInstrument (EDI). The EDI was developed at the Offord Centre of ChildStudies at McMaster University (Hamilton, Ontario, Canada) with theintent of providing communities an affordable, valid, and reliable instru-ment to measure school readiness in populations of children (Janus &Offord, 2007). The EDI was designed to be used at an aggregate level ratherthan for individual diagnostic or remedial education purposes. Measuringschool readiness is often difficult because of the lack of a clearly definedconstruct (Graue, 2006), but the EDI addresses this challenge by clearlydefining the constructs or components of school readiness: physical well-being and age-appropriate motor development, emotional health and apositive approach to new experiences, age-appropriate knowledge and com-petence, age-appropriate language skills, and age-appropriate generalknowledge and language skills (Janus & Offord, 2007).
Articles in the more recent special issue of EE&D (Volume 18, Number 3)explored various aspects of the EDI, including administration, the validityof the instrument, psychometric properties of the instrument, findings fromspecific population-level studies, as well as issues related to evaluation andpolicy. Population-level studies in this special issue found that schoolreadiness outcomes as measured with the EDI were influenced not onlyby individual- or family-level variables (Janus & Duku, 2007) but also bycontextual variables related to where children and families lived, such asemployment levels, neighborhood socioeconomic status, the predominanceof lone-parent families, and the proportion of low-income families withinan area (Kershaw, Forer, Irwin, Hertzman, & Lapointe, 2007; Lapointe,Ford, & Zumbo, 2007). Building on the population-level studies includedin that special issue of EE&D, this article presents a population-level studyin Saskatoon, Saskatchewan, Canada, that analyzed EDI data over time.
The purpose of this study was to investigate how neighborhoods andneighborhood socioeconomic disadvantage impact school readiness overtime. Using Canadian census data and EDI data from three populations ofkindergartners from a mid-sized Canadian city (Saskatoon, Saskatchewan)in 2001, 2003, and 2005, this article addresses three research questions:
1. Do EDI domain scores vary significantly over time? (i.e., the issue oftime variations).
2. Do EDI domain scores over time vary significantly across neighbor-hoods? (i.e., time–spatial variations).
3. Does socioeconomic disadvantage, as expressed by a neighborhoodpoverty index, explain significant changes in EDI domain scores
IMPACT OF NEIGHBORHOOD POVERTY ON CHILDREN 185
Downloaded At: 19:23 21 April 2011

independently, and above and beyond individual factors, over time andacross neighborhoods in Saskatoon?
Addressing these research questions contributes to the early educationand development field in several ways, specifically (a) by increasing under-standing of whether school readiness shows time–spatial variability within arelatively short time period and over a well-circumscribed geographicalspace (i.e., a city with well-defined neighborhoods), (b) by identifyingwhether contextual factors at the neighborhood level are independentlyassociated with school readiness, (c) by disentangling random and fixedeffects of school readiness at the population level, and (d) by using a concep-tual framework to derive a summary measure for socioeconomicdisadvantage.
THEORETICAL FRAMEWORK
Inherent in both the population-level studies utilizing the EDI in the specialissue of EE&D and this study was an interest in further exploring therelationship between child development and contextual variables. Therehas been a growing consensus among researchers that individual-level vari-ables as well as contextual variables impact school readiness (Guhn, Janus,& Hertzman, 2007). According to this perspective, a child’s development isinfluenced not only by conditions within his or her immediate family butalso by conditions that exist within a series of overlapping environmentsor contexts (Jenson & Stroick, 1999). The work of Bronfenbrenner (1979),most notably, popularized ecological theory and the supposition thatchildren’s outcomes are influenced by contextual variables beyond theimmediate family, such as neighborhoods and schools.
Although a few Canadian studies have explored the impact of contextualvariables on school readiness outcomes, guiding conceptual frameworkshave been absent from these previous population-level studies. A conceptualframework is important for operationalizing key concepts and for providinga map of linkages between contextual variables and individual child devel-opment. In response to this omission in previous studies, the present studywas informed by a conceptual framework developed by Muhajarine, Vu,and Labonte (2006; refer to Figure 1). This particular framework seeks tounderstand and graphically illustrate the complex and dynamic factorsand settings that shape early childhood development, such as the intrauter-ine environment, the family, neighborhoods, and cities. An emphasis onearly childhood experiences in this conceptual framework reflects the popu-lation health perspective, whereby early childhood, beginning in utero, acts
186 CUSHON, VU, JANZEN, AND MUHAJARINE
Downloaded At: 19:23 21 April 2011

as an important determinant of health and well-being throughout the lifecourse (Ben-Shlomo & Kuh, 2002; Keating & Hertzman, 1999). In termsof situating the present study within the conceptual framework, the focuswas on the community level of the framework, or more specifically theneighborhood level, and its impact on the early childhood outcome ofschool readiness.
This study was interested in assessing the variability of school readinessin defined populations of children across time and place and was premisedon the thesis that school readiness is non-randomly distributed across timeand place. Changes that occur over time and that are related to place, suchas contextual factors or the composition of a study sample, have a powerful
FIGURE 1 Multilevel conceptual framework of determinants and consequences of childhood
development. From ‘‘Social Contexts and Children’s Health Outcomes: Researching Across the
Boundaries,’’ by N. Muhajarine, L. Vu, and R. Labonte, 2006, Critical Public Health, 16(3),
p. 208. Copyright 2006 by Routledge. Reprinted with permission.
IMPACT OF NEIGHBORHOOD POVERTY ON CHILDREN 187
Downloaded At: 19:23 21 April 2011

impact on patterning events such as school readiness. Although place wasnot as common a research concern in the mid-twentieth century, geographi-cal information system (GIS) technology has catalyzed renewed interest inthe geographical dimensions of human health and development (Krieger,2003). Moreover, it is important to measure variability in human healthand development indicators over time and across place since this informswhether underlying population vulnerability is changing for the better, chan-ging for the worse, or staying the same. Variability across time and place islargely produced by the distribution of underlying vulnerability, such aslow income levels or low education levels (Galea, Ahern, & Karpati, 2005).
To address the third research question of determining the impact ofsocioeconomic disadvantage on EDI scores over time, the conceptual frame-work of Muhajarine et al. (2006) guided the development of summarymeasures. Summary measures were developed because many neighborhoodvariables were highly correlated, making it quite difficult, if not impossible,to differentiate between the exact effects of one variable on an outcome(Ellen & Turner, 1997). Six summary measures were derived to representneighborhood contextual factors: socioeconomic disadvantage, physicalcondition, social integration, population density, lifestyle norm, and theavailability and accessibility of programs and services for young children.
This article focuses on the impact of the derived summary measure forsocioeconomic disadvantage, termed a neighborhood poverty index, onschool readiness over time and across neighborhoods. Socioeconomicdisadvantage was selected as the research focus since recent research hashighlighted the deleterious impact of such disadvantage on child develop-ment (Shonkoff, 2006; Weitzman, 2003). Based on findings from previousstudies (Pickett & Pearl, 2001), the following seven variables were includedin the neighborhood poverty index: percentage of families falling below thelow-income cut-off (LICO),1 percentage of the population that is unem-ployed, percentage of the adult population with education less than Grade9, percentage of single parents, percentage of movers during the past year,percentage of the population that does not own its house, and percentageof Aboriginal population. The rationale for the inclusion of these variablesin the neighborhood poverty index is discussed next.
The majority of studies that have investigated the impact of neighbor-hood on social and health outcomes have focused on socioeconomic
1The LICO is a standard used by Statistics Canada to compare wages and living expenses,
whereby the value is the percentage of income that an average family spends on necessities,
which includes shelter, food, and clothing. A family falls below the LICO if the level of income
is such that a typical family would spend more than 20% of its average income on necessities.
This value is readjusted for community size and inflation.
188 CUSHON, VU, JANZEN, AND MUHAJARINE
Downloaded At: 19:23 21 April 2011

disadvantage as measured by household income (Sampson, Morenoff, &Gannon-Rowley, 2002). Income level at the neighborhood level has separateand significant effects on individual child development (Kershaw et al.,2007; Lapointe et al., 2007; Muhajarine & Vu, in press). Considering thestrong correlation between income and employment, neighborhoods withlow employment levels will likely contain a higher proportion of low-incomehouseholds (Ross & Wu, 1995). Another component of this study’s sum-mary measure for socioeconomic disadvantage was the proportion of adultsin a neighborhood with less than a Grade 9 education. Areas where levels ofeducation are lower will generally have higher rates of poverty, which isassociated with lower income, decreased access to health services, and higherrates of illiteracy (World Health Organization, 2000).
Most summary measures of socioeconomic disadvantage include income,employment, and education as proxies for disadvantage. Nonetheless, anumber of studies at the community level have also conceptualized dis-advantage in terms of the concentration of lone-parent families. Lone-parent status at the individual level significantly impacts child healthoutcomes, usually negatively; but studies also show that a preponderanceof lone-parent families within a neighborhood has detrimental effects onchild health outcomes since households with only one income earner areat an elevated risk for poverty (Beauvais & Jenson, 2003; Brooks-Gunn,Duncan, Klebanov, & Sealand, 1993). Another neighborhood variable thathas been extensively studied in relation to school readiness is rates ofmobility and=or levels of home ownership and tenure (Sampson et al.,2002). High rates of residential stability have been found to lead to greatersocial cohesion and trust within an area (Drukker, Kaplan, Feron, & vanOs, 2003). In contrast, transience is strongly linked to poverty, which hasseparate and significant implications for childhood development (Neigh-bours, 2003). Finally, neighborhoods with a high proportion of Aboriginalresidents often have higher rates of unemployment and greater proportionsof lone-parent families. Because of a history of colonialism and oppression,Aboriginal people in Canada are more likely to live in situations of impov-erishment and social deprivation, which will diminish the ability of certainpopulations and areas to mobilize around issues of importance to youngchildren (Lapointe et al., 2007).
METHODS
Setting
This study was based on EDI data collected on three populations ofkindergartners in Saskatoon, Saskatchewan, Canada in 2001, 2003, and
IMPACT OF NEIGHBORHOOD POVERTY ON CHILDREN 189
Downloaded At: 19:23 21 April 2011
2005. During the study period, Saskatoon had a total of 83 neighborhoods;56 were considered residential, with the remainder being industrial orcommercial (e.g., university grounds, airport). Only residential neighbor-hoods were included in the analysis. Children in elementary school grades(kindergarten to Grade 8) in Saskatoon have the choice of attending aschool located in their neighborhood from either one of two systems: theSaskatoonPublic SchoolDivision or the SaskatoonCatholic SchoolDivision.
Measures
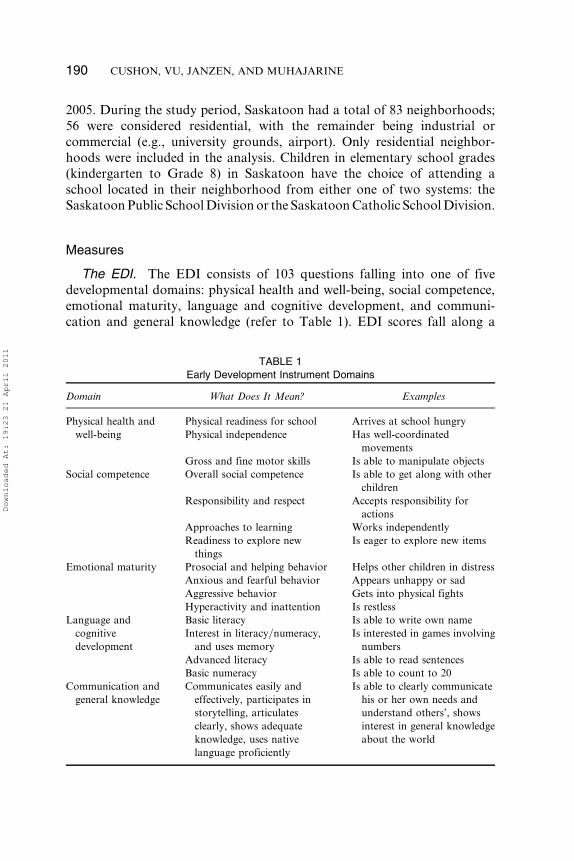
The EDI. The EDI consists of 103 questions falling into one of fivedevelopmental domains: physical health and well-being, social competence,emotional maturity, language and cognitive development, and communi-cation and general knowledge (refer to Table 1). EDI scores fall along a
TABLE 1
Early Development Instrument Domains
Domain What Does It Mean? Examples
Physical health and
well-being
Physical readiness for school Arrives at school hungry
Physical independence Has well-coordinated
movements
Gross and fine motor skills Is able to manipulate objects
Social competence Overall social competence Is able to get along with other
children
Responsibility and respect Accepts responsibility for
actions
Approaches to learning Works independently
Readiness to explore new
things
Is eager to explore new items
Emotional maturity Prosocial and helping behavior Helps other children in distress
Anxious and fearful behavior Appears unhappy or sad
Aggressive behavior Gets into physical fights
Hyperactivity and inattention Is restless
Language and
cognitive
development
Basic literacy Is able to write own name
Interest in literacy=numeracy,
and uses memory
Is interested in games involving
numbers
Advanced literacy Is able to read sentences
Basic numeracy Is able to count to 20
Communication and
general knowledge
Communicates easily and
effectively, participates in
storytelling, articulates
clearly, shows adequate
knowledge, uses native
language proficiently
Is able to clearly communicate
his or her own needs and
understand others’, shows
interest in general knowledge
about the world
190 CUSHON, VU, JANZEN, AND MUHAJARINE
Downloaded At: 19:23 21 April 2011

10-point standardized scale. Children scoring in the lowest 10% of the dis-tribution of scores are considered not school ready. The EDI is completedby kindergarten teachers for each of their pupils (Janus & Offord, 2007).
The EDI also captures basic demographic information such as gender,date of birth, Aboriginal status,2 mother tongue, and also some school-based designations such as the presence of special skills3 and specialproblems.4 The EDI has been shown to have adequate internal consistency,with Cronbach’s alphas from .84 to .96 for the five domains. Studies exam-ining the psychometric properties of the EDI have demonstrated consistentagreement between parent–teacher ratings, concurrent validity, and conver-gent validity. Interrater reliability on the EDI ranges from 0.53 to 0.80(Janus & Offord, 2007).
Canadian census data. Because EDI data are analyzed and reported atthe population level, this allows for the EDI data to be linked to otherpopulation-level databases such as the census (Guhn et al., 2007; Kershawet al., 2007). Statistics Canada conducts a national census every 5 years.The Canadian census collects reliable, detailed data on every resident ofCanada. This allows for analyses to be conducted for areas as small as aneighborhood and as large as the country. For this particular study, the2001 census was used to describe the characteristics of Saskatoon’sneighborhoods.
A common methodological challenge in the neighborhood effectsliterature is defining and demarcating neighborhoods. Neighborhood effectsstudies use a variety of definitions for neighborhood, with many usingconvenient and contrived boundaries such as census tracts or census dis-semination areas (McIntyre, Ellaway, & Cummins, 2002; O’Campo, 2003).However, administratively defined neighborhoods are often not meaningfulfor residents and do not reflect the true neighborhood characteristics at alevel that matters to health outcomes (Burton & Jarrett, 2000; Ellen &Turner, 1997; Matthews, 2008; Muhajarine et al., 2006). This methodologi-cal challenge was easily addressed in Saskatoon because of its long history ofplanned neighborhoods. Neighborhood units in Saskatoon have well-defined geographical boundaries, are meaningful to residents, and have been
2Aboriginal status of the child is proxy-reported by the kindergarten teacher. In the
Canadian context, generally, a declaration of Aboriginal status would involve a child having
a parent of Aboriginal ancestry (i.e., Registered Indian, Treaty Indian, or Metis).3Developers of the EDI include these skills as special skills: numeracy, literacy, arts, music,
athletics=dance, problem solving, and other. Each of these skills is scored as yes or no.4Developers of the EDI consider special problems to include physical disability, visual
impairment, hearing impairment, speech impairment, learning disability, emotional problem,
behavior problem, and problems at home. These are scored the same as special skills.
IMPACT OF NEIGHBORHOOD POVERTY ON CHILDREN 191
Downloaded At: 19:23 21 April 2011

comprehensively planned to be units that are efficient to service andmaintain over the long term. Neighborhoods in Saskatoon are as close to‘‘natural neighborhoods’’ as one may find (City of Saskatoon, 2006).
Procedure
In 2001, the EDI was implemented in only the Saskatoon Public SchoolDivision. In 2003 and 2005, kindergarten teachers in both Saskatoon’sPublic and Catholic School Divisions evaluated their students using theEDI. There were no substantial differences in children’s profiles (e.g., age,sex, socioeconomic status) between Saskatoon’s Public and Catholic SchoolDivisions, as both of these options are available to all families with kinder-garten children irrespective of their income level or religious preferences.Most neighborhoods have an elementary school within each of the Publicand Catholic School Divisions. The population for each data collection per-iod was distributed as follows: 2001 (N¼ 1,458), 2003 (N¼ 2,159), and 2005(N¼ 2,218). Prior to implementing the EDI in their classrooms, kindergar-ten teachers participated in training sessions on the correct implementationof the tool. Most teachers were familiar with the EDI and demonstrated asound grasp of the proper implementation of the instrument. The EDIwas completed approximately midway into the kindergarten year (inFebruary) and was typically completed over a 2-week period. EDI resultsfor each population of kindergartners are presented in Table 2.
Analysis
Neighborhood poverty index. Data on neighborhood socioeconomicconditions came from the 2001 Canadian Census. The following variableswere included in the socioeconomic disadvantage summary measure: per-centage of Aboriginal population, percentage of single parents, percentageof families falling below the LICO, percentage of movers during the past
TABLE 2
Early Development Instrument Descriptive Statistics for Kindergartners
Domain 2001 2003 2005
Physical health and well-being 8.55 (0.53) 8.65 (0.54) 8.35 (0.82)
Social competence 8.13 (0.67) 8.27 (0.66) 8.11 (0.85)
Emotional maturity 7.74 (0.63) 7.96 (0.62) 7.84 (1.03)
Language and cognitive development 7.54 (0.98) 7.57 (0.90) 7.74 (1.03)
Communication and general knowledge 7.57 (0.84) 7.71 (0.82) 7.27 (1.05)
Note. Data are M (SD).
192 CUSHON, VU, JANZEN, AND MUHAJARINE
Downloaded At: 19:23 21 April 2011

year, percentage of the adult population with education less than Grade 9,percentage of the population that does not own its house, and percentage ofthe population that is unemployed. These variables were selected based onprevious neighborhood studies (Pickett & Pearl, 2001). Cronbach’s alphafor these seven neighborhood variables, when combined, was .86. Thesevariables were highly correlated (refer to Table 3), indicating the need touse a statistical procedure to combine them. Principal component analysiswas applied to create a neighborhood socioeconomic disadvantage sum-mary measure. Principal component analysis involves a mathematicalprocedure that transforms a number of (possibly) correlated variables intoa (smaller) number of uncorrelated variables called principal components.The basic premise in principal component analysis is to find the componentss1, s2, . . . , sn so that they explain the maximum amount of variance possibleby n linearly transformed components. The first principal componentaccounts for as much of the variability in the data as possible, and each suc-ceeding component accounts for as much of the remaining variability aspossible. The items were combined using regression to create a new derivedvariable. The derived variable was named ‘‘poverty index,’’ and it explained62% of the total variation involving the seven original variables. Descriptiveinformation for the poverty index is contained in Table 4.
Multilevel modeling. The outcome of interest in this study was thechange in average EDI score for each neighborhood over three time points(i.e., individual EDI data aggregated by neighborhood and study time).Independent variables examined in this study were in two levels. Level 1(or repeated data) included variables examining the change in the character-istics of the study sample over time: the average age of the study sample, theproportion of Aboriginal children in the study sample, the proportion of
TABLE 3
Intercorrelations Between Variables in the Neighborhood Poverty Index
Variable 1 2 3 4 5 6 7
1. Percentage of Aboriginal population — .894�� .754�� .631�� .473�� .420�� .331�
2. Percentage of single parents — .779�� .628�� .413�� .505�� .261�
3. Percentage of LICO families — .726�� .366�� .750�� .401��
4. Percentage who moved last year — .304� .686�� .353��
5. Percentage with education less than
Grade 9
— .385�� .858��
6. Percentage not owning home — .563��
7. Percentage unemployed —
Note. LICO¼ low-income cut-off.�p< .05, two-tailed. ��p< .01, two-tailed.
IMPACT OF NEIGHBORHOOD POVERTY ON CHILDREN 193
Downloaded At: 19:23 21 April 2011

children with special skills, the proportion of children with special needs, theproportion of children with a learning problem, the proportion of childrenwith English as a second language, and the proportion of male children.These variables were selected to represent the compositional characteristicsof the sample. All analyses in this study accounted for changes in the avail-able characteristics of the study sample over time (refer to Table 5). TheLevel 2 data consisted of time constant variables at the neighborhood level(i.e., data on neighborhood characteristics obtained from the 2001 CanadianCensus). Given the nested nature of the data, hierarchical linear regressionwas performed using HLM statistical package version 6.02.
The final model for average EDI scores took the following form:
Level 1 Equation
Yij ¼ b0j þ b1j Timeþ b2j �% of children with special needsþ b3j �% of
children with special skillsþ b4j �% of children with problemsþ b5j �% of
female childrenþ b6j �% ofAboriginal studentsþ b7j � average age of
childrenþ eIj
Level 2 Equation
b0j ¼ c00
b1j ¼ c10 þ c11 �NB povertyþ u1;
TABLE 5
Characteristics of the Study Sample in 2001, 2003, and 2005
Characteristic 2001 2003 2005
Average age (years) 5.6 5.6 5.7
Percentage of male children 50.3 49.4 50.6
Percentage of Aboriginal children 16.4 16.9 18.2
Percentage of children with special needs 8.0 4.9 3.9
Percentage of children with special skills 20.3 19.3 24.5
Percentage of children with learning problems 17.6 19.4 11.9
Percentage of children with English as a second language 2.2 1.8 2.8
TABLE 4
Descriptive Statistics for the Neighborhood Poverty Index
N Min Max M SD
54 �1.73664 3.31978 .000000 1.000000
194 CUSHON, VU, JANZEN, AND MUHAJARINE
Downloaded At: 19:23 21 April 2011
where
cqsðq ¼ 0; 1; . . . . . . . . . . . .SqÞ : Level 2 coefficients
uqj : Level 2 random effect
Again, all the Level 2 random effects (uqj) were assumed to follow a normaldistribution with mean of 0 and a variance of sqq. Furthermore, for any pairof random effects q and q0 Cov(uqj, uq0j)¼ sqq0.
b1j is trend in EDI score over time.
RESULTS
Time Variations
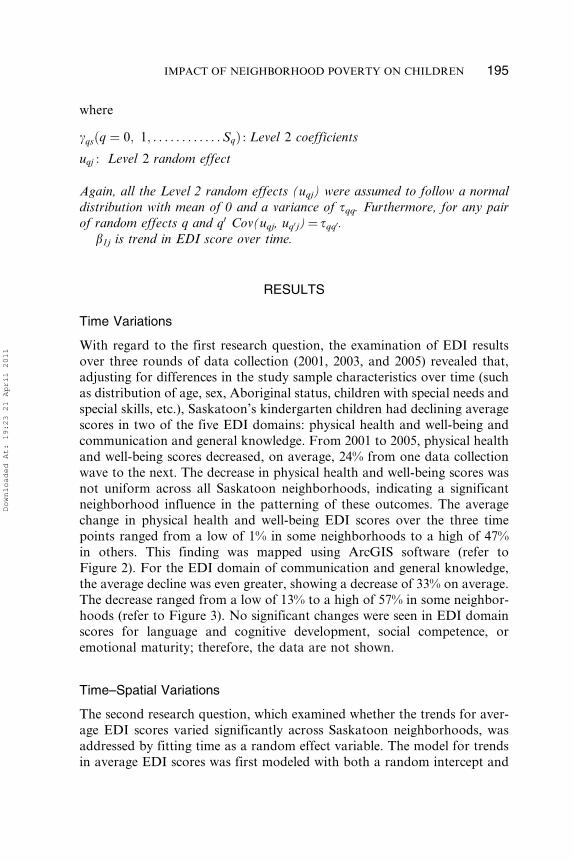
With regard to the first research question, the examination of EDI resultsover three rounds of data collection (2001, 2003, and 2005) revealed that,adjusting for differences in the study sample characteristics over time (suchas distribution of age, sex, Aboriginal status, children with special needs andspecial skills, etc.), Saskatoon’s kindergarten children had declining averagescores in two of the five EDI domains: physical health and well-being andcommunication and general knowledge. From 2001 to 2005, physical healthand well-being scores decreased, on average, 24% from one data collectionwave to the next. The decrease in physical health and well-being scores wasnot uniform across all Saskatoon neighborhoods, indicating a significantneighborhood influence in the patterning of these outcomes. The averagechange in physical health and well-being EDI scores over the three timepoints ranged from a low of 1% in some neighborhoods to a high of 47%in others. This finding was mapped using ArcGIS software (refer toFigure 2). For the EDI domain of communication and general knowledge,the average decline was even greater, showing a decrease of 33% on average.The decrease ranged from a low of 13% to a high of 57% in some neighbor-hoods (refer to Figure 3). No significant changes were seen in EDI domainscores for language and cognitive development, social competence, oremotional maturity; therefore, the data are not shown.
Time–Spatial Variations
The second research question, which examined whether the trends for aver-age EDI scores varied significantly across Saskatoon neighborhoods, wasaddressed by fitting time as a random effect variable. The model for trendsin average EDI scores was first modeled with both a random intercept and
IMPACT OF NEIGHBORHOOD POVERTY ON CHILDREN 195
Downloaded At: 19:23 21 April 2011

a random slope for time. However, the random intercept did not reach stat-istical significance (variance¼ 0.004, v2¼ 52, df¼ 42, p¼ 0.16, N¼ 162) andwas therefore removed from the model. The random slope for time wasretained for further analysis. The variable time was centered on the year2003 (i.e., year 2001 took the value �2 and year 2005 took the value þ2).EDI scores revealed significant changes over time for kindergarten childrenin the EDI domains of physical health and well-being and communicationand general knowledge. These changes varied across neighborhoods.
The study sample changed over time (in terms of average age, genderdistribution, percentage of children with special needs, etc.), so this had tobe accounted for in terms of the changes over time on average EDI scores.This was accomplished by treating all of the characteristics of the studysample at each time point as variables in Level 1. Results showed that thefollowing study sample characteristics had an impact on changes in physicalhealth and well-being domain scores: (a) proportion of Aboriginal students,(b) proportion of students with special needs, (c) proportion of students withspecial problems, and (d) average age of students.
FIGURE 2 Average changes in physical health and well-being Early Development Instrument
(EDI) domain scores over time and across neighborhoods (n¼ 56).
196 CUSHON, VU, JANZEN, AND MUHAJARINE
Downloaded At: 19:23 21 April 2011

Impact of Neighborhood Poverty Index
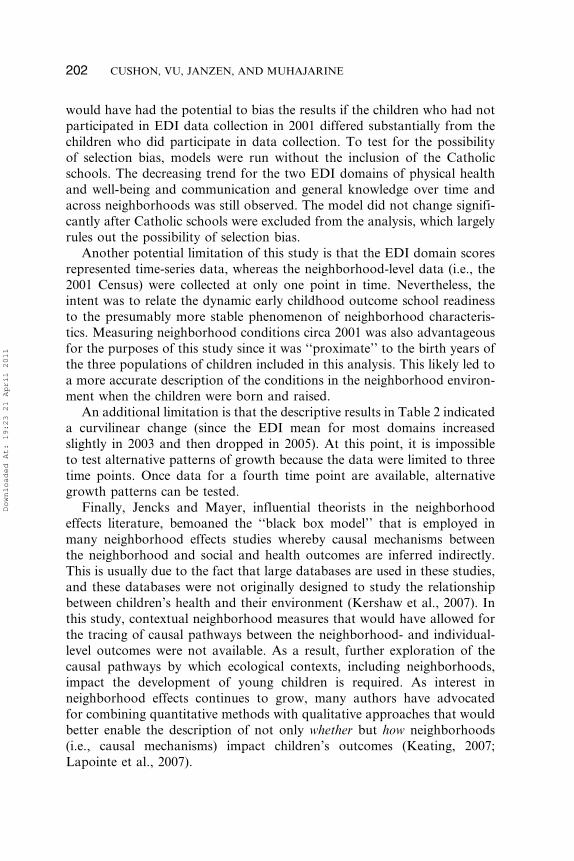
Since EDI scores showed significant changes over time for kindergartenchildren in Saskatoon, and these changes varied across neighborhoods,the third research question focused on the factors at the neighborhood levelthat influenced these variations. Following this line of reasoning, threeincremental multilevel models were fitted. The first model, the null model,had only the variable time (with a random slope). The second modelincluded changes in characteristics of the study sample over time, and thethird model included and tested for neighborhood variables such as thepoverty index. Multilevel analysis revealed that the neighborhood povertyindex was significantly related to declining scores in the domain of physicalhealth and well-being (refer to Table 6 and Figure 4) but was not signifi-cantly related to declining scores in the domain of communication and gen-eral knowledge (refer to Table 7). The variance of trends in physical healthand well-being domain scores among the different models (with the randomslope of the variable time) is presented in Table 8. From this table, the per-centage of variance in the change for physical health and well-being EDIscores explained by adding the poverty index was calculated as 36.8%
FIGURE 3 Average changes in communication and general knowledge Early Development
Instrument (EDI) domain scores over time and across neighborhoods (n¼ 56).
IMPACT OF NEIGHBORHOOD POVERTY ON CHILDREN 197
Downloaded At: 19:23 21 April 2011
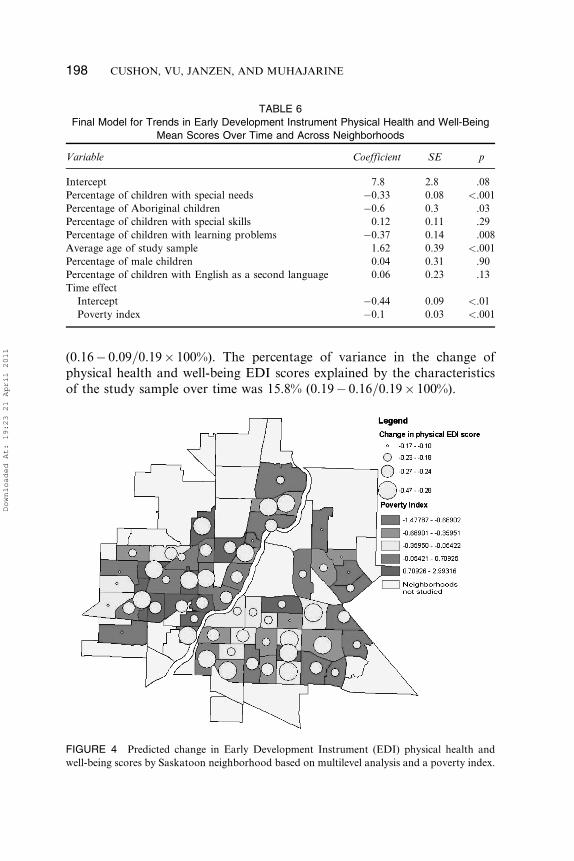
(0.16� 0.09=0.19� 100%). The percentage of variance in the change ofphysical health and well-being EDI scores explained by the characteristicsof the study sample over time was 15.8% (0.19� 0.16=0.19� 100%).
FIGURE 4 Predicted change in Early Development Instrument (EDI) physical health and
well-being scores by Saskatoon neighborhood based on multilevel analysis and a poverty index.
TABLE 6
Final Model for Trends in Early Development Instrument Physical Health and Well-Being
Mean Scores Over Time and Across Neighborhoods
Variable Coefficient SE p
Intercept 7.8 2.8 .08
Percentage of children with special needs �0.33 0.08 <.001
Percentage of Aboriginal children �0.6 0.3 .03
Percentage of children with special skills 0.12 0.11 .29
Percentage of children with learning problems �0.37 0.14 .008
Average age of study sample 1.62 0.39 <.001
Percentage of male children 0.04 0.31 .90
Percentage of children with English as a second language 0.06 0.23 .13
Time effect
Intercept �0.44 0.09 <.01
Poverty index �0.1 0.03 <.001
198 CUSHON, VU, JANZEN, AND MUHAJARINE
Downloaded At: 19:23 21 April 2011

DISCUSSION
Findings from Saskatoon support the general conclusion from a recent spe-cial issue of EE&D that neighborhoods matter for school readiness (Janus &Duku, 2007; Kershaw et al., 2007; Lapointe et al., 2007). Since previousneighborhood effects studies had already found a relationship betweenneighborhood-level variables and school readiness for a single point intime (Janus & Duku, 2007; Kershaw, Irwin, Trafford, & Hertzman, 2005;Kershaw et al., 2007; Lapointe et al., 2007), the present study sought to deter-mine whether EDI domain scores varied significantly over time for threepopulations of kindergartners in Saskatoon in 2001, 2003, and 2005. Thisstudy found that EDI scores for the domains of physical health andwell-being and communication and general knowledge declined significantlyover the study period and varied according to neighborhood. These findings
TABLE 7
Final Model for Trends in Early Development Instrument Communication and General
Knowledge Mean Scores Over Time and Across Neighborhoods
Variable Coefficient SE p
Intercept 7.4 0.8 <.001
Percentage of children with special needs �0.46 0.11 <.001
Percentage of Aboriginal children �2.0 0.2 <.001
Percentage of children with special skills 0.18 0.19 .34
Percentage of children with learning problems �0.89 0.14 <.001
Average age of study sample 1.47 0.68 .033
Percentage of male children 0.79 0.69 .19
Percentage of children with English as a second language 0.07 0.20 .17
Time effect
Intercept �0.31 0.07 <.001
Poverty index �0.02 0.03 .58
TABLE 8
Variance of Trends in Early Development Instrument Physical Health
and Well-Being Scores Among Different Models
Variable
Null
Model
Model With
Level 1 Variables
Model With
Level 2 Variables
Variance component 0.19 0.16 0.09
v2 (df¼ 42) 213 202 55
p <.001 <.001 .05
IMPACT OF NEIGHBORHOOD POVERTY ON CHILDREN 199
Downloaded At: 19:23 21 April 2011

provide support for the hypothesis that school readiness shows variabilityover time and space, which has important policy and programmaticimplications, such as the need for policies and programs that are flexibleand adaptive to the constantly evolving needs of a community.
In terms of the third research question, this study found a significantrelationship between a derived neighborhood poverty index and decliningEDI scores for physical health and well-being. Kershaw et al. (2007) alsoreported that ‘‘physical vulnerability,’’ as captured by the EDI domain ofphysical health and well-being, was largely predicted by the proportion ofAboriginal residents in a neighborhood and the proportion of familiesbelow the LICO. Both the proportion of Aboriginal residents in a neighbor-hood and the proportion of families below the LICO were components ofthe derived neighborhood poverty index in this study. Similarly, Lapointeet al. (2007) found that neighborhood contextual factors were most impor-tant for outcomes in the physical health and well-being domain of the EDIand were less important for the emotional maturity and social competencedomains.
Although average scores over time for the EDI domain of communi-cation and general knowledge also significantly decreased, the derivedneighborhood poverty index was not a predictor of this decline. Previousstudies demonstrated that this EDI domain was usually significantly pre-dicted by neighborhood factors (Lapointe et al., 2007); however, previousresearch only assessed the impact of neighborhood variables on EDI scoresat one point in time, whereas this study assessed changes in EDI scores overtime. In addition, this study only focused on time trends for EDI scores asrelated to a derived summary measure that represented socioeconomicdisadvantage, and not a single variable, as in previous studies.
Although the other neighborhood summary measures that weredeveloped (physical condition, social integration, population density, life-style, availability and accessibility of programs and services) were not thefocus of this article, further analysis found that these summary measureswere also not significantly related to declining EDI scores in communicationand general knowledge. For this study, the relationship between time andthe neighborhood poverty index was examined only for the two EDI out-comes for which there were declines over time in order to focus the scopeof this study and to specifically address the questions of whether there isa trend over time for neighborhood average EDI scores and which factorsaffect these trends.
Why did we observe an impact of neighborhood socioeconomic dis-advantage on the physical health and well-being outcome and not on otherEDI domains? The physical health and well-being domain was clearly moresensitive to a measure of neighborhood-level socioeconomic disadvantage
200 CUSHON, VU, JANZEN, AND MUHAJARINE
Downloaded At: 19:23 21 April 2011

than other EDI domains in this study. It is possible that physical health andwell-being in children as young as 5 years is a fundamental, or a prerequisite,requirement for development in other areas such as communication andgeneral knowledge, social competence, emotional maturity, and languageand cognitive development. Moreover, certain health or social indicatorsare more sensitive to social conditions than others (Galea et al., 2005). Itis also possible that the relationship observed between neighborhood socio-economic disadvantage and physical health and well-being was due in partto the relatively uncomplicated nature of this measure (i.e., it is a ‘‘pure’’dimension) compared to the complex and multidimensional measures cap-tured in the social competence, emotional maturity, and even languageand cognitive development domains of the EDI.
This study’s use of a derived summary measure to reflect socioeconomicdisadvantage at the neighborhood level is a distinct contribution to the earlychildhood education and development literature. This approach has recentlygained currency in examining neighborhood impact on health more gener-ally. For instance, the concept of deprivation, as it relates to health, was firstintroduced in the late 1980s by British researchers Townsend (1987) andCarstairs and Morris (1989). In recent years, several deprivation indiceshave been created to describe basic and fundamental social and economicdisadvantage at the community level that, in turn, affects health (Matheson,Moineddin, & Glazier, 2008; Pampalon & Raymond, 2000). Using a sum-mary measure of socioeconomic disadvantage, or deprivation, at the arealevel has been shown to be an effective means of describing the magnitudeof geographic differences in socioeconomic inequalities linked to healthstatus inequalities (Frohlich & Mustard, 1996).
Summary measures more fully reflect the complexity of neighborhoodcharacteristics. A community or neighborhood is composed of numeroussocial networks, sources of support, and other resources, many of whichare difficult to adequately capture and measure in a systematic manner.Because of the complex array of factors and variables that exist in a neigh-borhood, a single variable, such as the proportion of families in a neighbor-hood living below the LICO, would not entirely or adequately explain allof the potential mechanisms and pathways by which neighborhoodsocioeconomic disadvantage impacts individual outcomes (Muhajarineet al., 2006).
Limitations
Several limitations of this study must be noted. A potential source of bias inthis study originated from the fact that EDI data were not collected forkindergartners in the Saskatoon Catholic School Division in 2001. This
IMPACT OF NEIGHBORHOOD POVERTY ON CHILDREN 201
Downloaded At: 19:23 21 April 2011
would have had the potential to bias the results if the children who had notparticipated in EDI data collection in 2001 differed substantially from thechildren who did participate in data collection. To test for the possibilityof selection bias, models were run without the inclusion of the Catholicschools. The decreasing trend for the two EDI domains of physical healthand well-being and communication and general knowledge over time andacross neighborhoods was still observed. The model did not change signifi-cantly after Catholic schools were excluded from the analysis, which largelyrules out the possibility of selection bias.
Another potential limitation of this study is that the EDI domain scoresrepresented time-series data, whereas the neighborhood-level data (i.e., the2001 Census) were collected at only one point in time. Nevertheless, theintent was to relate the dynamic early childhood outcome school readinessto the presumably more stable phenomenon of neighborhood characteris-tics. Measuring neighborhood conditions circa 2001 was also advantageousfor the purposes of this study since it was ‘‘proximate’’ to the birth years ofthe three populations of children included in this analysis. This likely led toa more accurate description of the conditions in the neighborhood environ-ment when the children were born and raised.
An additional limitation is that the descriptive results in Table 2 indicateda curvilinear change (since the EDI mean for most domains increasedslightly in 2003 and then dropped in 2005). At this point, it is impossibleto test alternative patterns of growth because the data were limited to threetime points. Once data for a fourth time point are available, alternativegrowth patterns can be tested.
Finally, Jencks and Mayer, influential theorists in the neighborhoodeffects literature, bemoaned the ‘‘black box model’’ that is employed inmany neighborhood effects studies whereby causal mechanisms betweenthe neighborhood and social and health outcomes are inferred indirectly.This is usually due to the fact that large databases are used in these studies,and these databases were not originally designed to study the relationshipbetween children’s health and their environment (Kershaw et al., 2007). Inthis study, contextual neighborhood measures that would have allowed forthe tracing of causal pathways between the neighborhood- and individual-level outcomes were not available. As a result, further exploration of thecausal pathways by which ecological contexts, including neighborhoods,impact the development of young children is required. As interest inneighborhood effects continues to grow, many authors have advocatedfor combining quantitative methods with qualitative approaches that wouldbetter enable the description of not only whether but how neighborhoods(i.e., causal mechanisms) impact children’s outcomes (Keating, 2007;Lapointe et al., 2007).
202 CUSHON, VU, JANZEN, AND MUHAJARINE
Downloaded At: 19:23 21 April 2011

CONCLUSION
Results pertaining to school readiness, as measured by the EDI inSaskatoon, were mixed when measured over time and place. Some schoolreadiness domains showed a significant and substantial decline, whereasother domains did not change significantly over time. For instance, notabledeclines in physical health and well-being and communication and generalknowledge scores for Saskatoon’s kindergartners were noted. These changeswere not consistent across neighborhoods. A derived neighborhood povertyindex was significantly related to declines in the domain of physical healthand well-being, suggesting neighborhood effects in patterning school readi-ness outcomes in children over time. Although these results are interesting inand of themselves, they also suggest areas ripe for investment and policy,particularly in more disadvantaged areas of the city (e.g., the Saskatoonneighborhoods west-central of the river). As indicated by the constructionof a neighborhood poverty index, there is clearly a need for policy and pro-grams that address the underlying determinants of poor school readinessscores (e.g., socioeconomic conditions, support for single-parent families,mobility) at both the individual and the neighborhood levels.
ACKNOWLEDGMENTS
We would like to acknowledge Sue Delanoy, Fleur Macqueen Smith, andthe Understanding the Early Years (UEY) study staff; Craig Silliphantfor editorial assistance; the Saskatoon Public School Division and theGreater Saskatoon Catholic School Division for their cooperation; andHuman Resources and Social Development Canada (HRSDC) for fundingthe UEY study. All views expressed in this report are our own and do notnecessarily reflect the opinions of HRSDC or the Government of Canada.
REFERENCES
Beauvais, C., & Jenson, J. (2003). The well-being of children: Are there neighborhood effects?
(Report No. F|31). Ottawa, Ontario, Canada: Canadian Policy Research Networks.
Ben-Shlomo, Y., & Kuh, D. (2002). A life course approach to chronic disease epidemiology:
Conceptual models, empirical challenges, and interdisciplinary perspectives. International
Journal of Epidemiology, 31, 285–293.
Bronfenbrenner, U. (1979). The ecology of human development: Experiments by nature and
design. Cambridge, MA: Harvard University Press.
Brooks-Gunn, J., Duncan, G. J., Klebanov, P. K., & Sealand, N. (1993). Do neighborhoods
influence child and adolescent development? American Journal of Sociology, 99, 353–395.
IMPACT OF NEIGHBORHOOD POVERTY ON CHILDREN 203
Downloaded At: 19:23 21 April 2011

Burton, L. M., & Jarrett, R. L. (2000). In the mix, yet on the margins: The place of families in
urban neighborhood and child development research. Journal of Marriage and Family, 62,
1114–1135.
Carstairs, V., & Morris, R. (1989). Deprivation: Explaining differences in mortality between
Scotland and England and Wales. British Medical Journal, 299, 886–889.
City of Saskatoon. (2006). City of Saskatoon development plan: Bylaw no. 7799. Saskatoon,
Saskatchewan, Canada: Office of the City Clerk.
Darlington, R. B., Royce, J. M., Snipper, A. S., Murray, H. W., & Lazar, I. (1980, April 11).
Preschool programs and later school competence of children from low-income families.
Science, 208, 202–204.
Drukker, M., Kaplan, C., Feron, F., & van Os, J. (2003). Children’s health-related quality of
life, neighborhood socioeconomic deprivation and social capital: A contextual analysis.
Social Science & Medicine, 57, 825–841.
Ellen, I. G., & Turner, M. A. (1997). Does neighborhood matter? Assessing recent evidence.
Housing Policy Debate, 8, 833–866.
Emig, C. (Ed.). (2000). School readiness: Helping communities get children ready for school and
schools ready for children (Child Trends Research Brief). Washington, DC: Child Trends.
Frohlich, N., & Mustard, C. (1996). A regional comparison of socioeconomic and health indices
in a Canadian province. Social Science & Medicine, 42, 1273–1281.
Galea, S., Ahern, J., & Karpati, A. (2005). A model of underlying socioeconomic vulnerability
in human populations: Evidence from variability in population health and implications for
public health. Social Science & Medicine, 60, 2417–2430.
Graham, H., & Power, C. (2004). Childhood disadvantage and adult health: A lifecourse frame-
work. London, England: National Health Service, Health Development Agency. Retrieved
from www.nice.org.uk/nicemedia/pdf/childhood_disadvantage_health.pdf
Graue, E. (2006). The answer is readiness—Now what is the question? Early Education and
Development, 17, 43–56.
Guhn, M., Janus, M., & Hertzman, C. (2007). The Early Development Instrument: Translating
school readiness assessment into community actions and policy planning. Early Education
and Development, 18, 369–374.
Guo, G., Brooks-Gunn, J., & Harris, K. M. (1996). Parental labor-force attachment and grade
retention among urban black children. Sociology of Education, 69, 217–236.
Hertzman, C. (1999). The biological embedding of early experience and its effects on health in
adulthood. Annals New York Academy of Sciences, 896(1), 85–95.
Janus,M., &Duku, E. (2007). The school entry gap: Socioeconomic, family, and health factors asso-
ciated with children’s school readiness to learn.Early Education and Development, 18, 375–403.
Janus, M., & Offord, D. (2007). Development and psychometric properties of the Early Devel-
opment Instrument (EDI): A measure of children’s school readiness. Canadian Journal of
Behavioural Science, 39(1), 1–122.
Jenson, J., & Stroick, S. M. (1999). What is the best policy mix for Canada’s young children?
(Report No. F-09). Ottawa, Ontario, Canada: Canadian Policy Research Networks.
Keating, D. P. (2007). Formative evaluation of the Early Development Instrument: Progress
and prospects. Early Education and Development, 18, 561–570.
Keating, D. P., & Hertzman, C. (Eds.). (1999). Developmental health and the wealth of nations.
New York, NY: Guilford Press.
Kershaw, P., Forer, B., Irwin, L. G., Hertzman, C., & Lapointe, V. (2007). Toward a social care
program of research: A population-level study of neighborhood effects on child develop-
ment. Early Education and Development, 18, 535–560.
Kershaw, P., Irwin, L., Trafford, K., & Hertzman, C. (2005). The British Columbia atlas of child
development (1st ed.). Vancouver, British Columbia, Canada.
204 CUSHON, VU, JANZEN, AND MUHAJARINE
Downloaded At: 19:23 21 April 2011
Krieger, N. (2003). Place, space, and health: GIS and epidemiology. Epidemiology, 14, 384–385.
Lapointe, V. R., Ford, L., & Zumbo, B. D. (2007). Examining the relationship between neigh-
borhood environment and school readiness for kindergarten children. Early Education and
Development, 18, 473–495.
Matheson, F. I., Moineddin, R., & Glazier, R. H. (2008). The weight of place: A multilevel
analysis of gender, neighborhood material deprivation, and body mass index among
Canadian adults. Social Science and Medicine, 66, 675–690.
Matthews, S. A. (2008). The salience of neighborhood: Some lessons from sociology. American
Journal of Preventive Medicine, 34(3), 257–259.
McIntyre, S., Ellaway, A., & Cummins, S. (2002). Place effects on health: How can we concep-
tualise, operationalise, and measure them? Social Science and Medicine, 55, 125–139.
Muhajarine, N., & Vu, L. (2009). Neighbourhood contexts and low birth weight: Social
disconnection heightens singles parents risks in Saskatoon. Canadian Journal of Public
Health, 100(2), 130–134.
Muhajarine, N., Vu, L., & Labonte, R. (2006). Social contexts and children’s health outcomes:
Researching across the boundaries. Critical Public Health, 16(3), 205–218.
Mustard, J. F., McCain, M. N., & Bertrand, J. (2000). Changing beliefs to change policy:
The early years study. ISUMA, 1(2). Retrieved from http://www.founders.net/fn/
papers.nsf/0176625ce34a8895852566360044448b/9978799568a4e4f385256aee004bcd14!
OpenDocument&ExpandSection=2
Neighbours, M. (2003). Transience: A worldwide problem to be faced by educators and those who
hold the purse. Retrieved from http://www.nzpf.ac.nz/resources/magazine/2002/june/
transience1.htm
O’Campo, P. (2003). Invited commentary: Advancing theory and methods for multilevel models
of residential neighborhoods and health. American Journal of Epidemiology, 157, 9–13.
Pampalon, R., & Raymond, G. (2000). A deprivation index for health and welfare planning in
Quebec. Chronic Diseases in Canada, 21(3), 104–113.
Pianta, R. C. (2002). School readiness: A focus on children, families, communities and schools
(The Informed Educator Series). Washington, DC: Educational Research Service, Office
of Educational Research and Improvement.
Pickett, K. E., & Pearl, M. (2001). Multilevel analyses of neighborhood socioeconomic context
and health outcomes: A critical review. Journal of Epidemiology and Community Health,
55(2), 111–122.
Ross, C. E., & Wu, C. (1995). The links between education and health. American Sociological
Review, 60, 719–745.
Sampson, R. J., Morenoff, J. D., & Gannon-Rowley, T. (2002). Assessing ‘‘neighborhood
effects’’: Social processes and new directions in research. Annual Review of Sociology,
28, 443–478.
Shonkoff, J. P. (2006). A promising opportunity for developmental and behavioral pediatrics at
the interface of neuroscience, psychology, and social policy: Remarks on receiving the
2005 C. Anderson Aldrich award. Pediatrics, 118, 2187–2191.
Snow, K. L. (2006). Measuring school readiness: Conceptual and practical considerations.
Early Education and Development, 17, 7–41.
Townsend, P. (1987). Deprivation. Journal of Social Policy, 16, 125–146.
Weitzman, M. (2003). Low income and its impact on psychosocial child development. Retrieved
from the Encyclopedia on Early Childhood Development website: http://www.
child-encyclopedia.com/documents/WeitzmanANGxp.pdf
World Health Organization. (2000). Obesity: Preventing and managing the global epidemic
(Report of WHO Consultation on Obesity No. 894). Geneva, Switzerland: Author.
IMPACT OF NEIGHBORHOOD POVERTY ON CHILDREN 205
Downloaded At: 19:23 21 April 2011