Near-bed current velocity profiles in the eastern Irish Sea: implications for radioactive waste...
14
Geol. Bull. Univ. Peshawar, 1991, Vol. 24,pp. 177-190 SYED SHAFIQUR REHMAN Department of Geology, University of Pcshawar, Pcshawar, Pakistan. ABSTRACT Near-bed current velocity dnta have been recorded at six different stations in the eastern Irish Sea using a vertical array of five electromagnetic current meters in the boundary layer. The dnta suggests that circulation in the Irish Sea is dominated by tidal streams modulating at semi-diurnal frequency and circulat- ing in counter-clockurise direction. Values of friction velocity and roughness height determined fPom the current velocity suggest that (I) for slow currents the flow is "smooth turbulent" in most part, (2) at higher velocities the flow becomes "rough turbulent" and the senbed becomes rippled. It appears that form drag increases resistance to flow instead of skin friction (grain size). Waveparameters recorded at one of the stations indicate that during calm weather wave height varied between 11.4 crn to I .I 1 m, wave period between 8-20 S, and wavelength from 103 to 346 m in 35 rn deep water. It has also been observed that even in thepresence of small waves, wave orbital currents are produced in the boundary layer which add to the shear stress caused by tidal currents and increase the potential for resuspension of bed sediments. Since the Irish Sea generally becomes storm dominated during winters, resuspension of bed sediments and attached radionuclides may increases during this season. INTRODUCTION The Irish Sea is a shallow, funnel-shaped.body of the Atlantic Ocean (Fig. 1). The southern and western parts of the sea are relatively deeper than the north-eastern part wtrmmean&p~-tse~~e~ tlieEngTisk Coast T~Z 13GfManisaboS %;(Bowden, 1980). Circulation of water in the sea is predomiriantly controlled by semi-diurnal tides having a typical surface magnitude of 1 m/s (Robinson, 1979). Tidal streams enter simultaneously from south and north, and meet at about 54' N. The tidal range is 9 m
Transcript of Near-bed current velocity profiles in the eastern Irish Sea: implications for radioactive waste...

Geol. Bull. Univ. Peshawar, 1991, Vol. 24,pp. 177-190
SYED SHAFIQUR REHMAN
Department of Geology, University of Pcshawar, Pcshawar, Pakistan.
ABSTRACT
Near-bed current velocity dnta have been recorded at six different stations in the eastern Irish Sea using a vertical array of five electromagnetic current meters in the boundary layer. The dnta suggests that circulation in the Irish Sea is dominated by tidal streams modulating at semi-diurnal frequency and circulat- ing in counter-clockurise direction. Values of friction velocity and roughness height determined fPom the current velocity suggest that ( I ) for slow currents the flow is "smooth turbulent" in most part, (2) at higher velocities the flow becomes "rough turbulent" and the senbed becomes rippled. It appears that form drag increases resistance to flow instead of skin friction (grain size).
Wave parameters recorded at one of the stations indicate that during calm weather wave height varied between 11.4 crn to I .I 1 m, wave period between 8-20 S, and wavelength from 103 to 346 m in 35 rn deep water. It has also been observed that even in thepresence of small waves, wave orbital currents are produced in the boundary layer which add to the shear stress caused by tidal currents and increase the potential for resuspension of bed sediments. Since the Irish Sea generally becomes storm dominated during winters, resuspension of bed sediments and attached radionuclides may increases during this season.
INTRODUCTION
The Irish Sea is a shallow, funnel-shaped.body of the Atlantic Ocean (Fig. 1). The southern and western parts of the sea are relatively deeper than the north-eastern part w t r m m e a n & p ~ - t s e ~ ~ e ~ tlieEngTisk Coast T ~ Z 13GfManisaboS %;(Bowden, 1980). Circulation of water in the sea is predomiriantly controlled by semi-diurnal tides having a typical surface magnitude of 1 m/s (Robinson, 1979). Tidal streams enter simultaneously from south and north, and meet at about 54' N. The tidal range is 9 m
v EASTERN 9H SEA
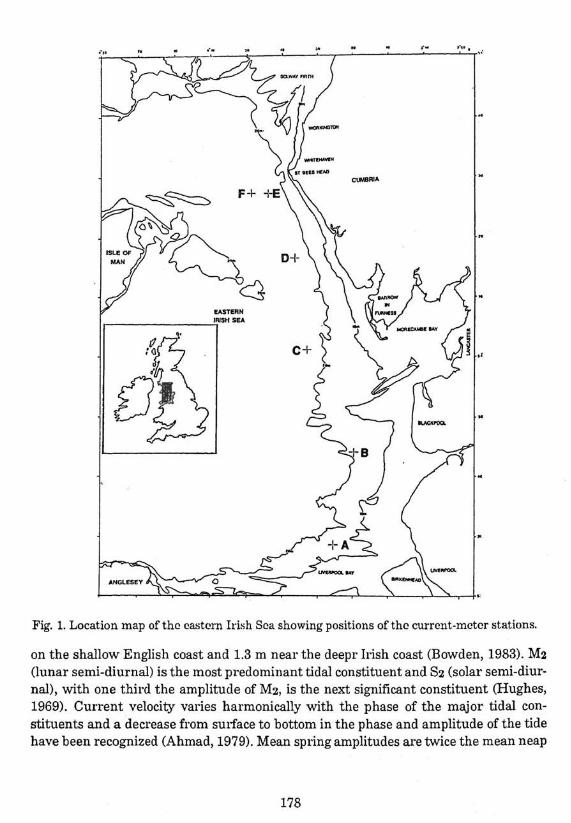
Fig. 1. Location map of thc eastern Irish Sca showing positions of the currcnt-mctcr stations.
on the shallow English coast and 1.3 m near the deepr Irish coast (Bowden, 1983). M2 (lunar semi-diurnal) is the most predominant tidal constituent and Sz (solar semi-diur- nal), with one third the amplitude of Mz, is the next significant constituent (Hughes, 1969). Current velocity varies harmonically with the phase of the major tidal con- stituents and a decrease from surface to bottom in the phase and amplitude of the tide have been recognized (Ahmad, 1979). Mean spring amplitudes are twice the mean neap

amplitudes in the eastern Irish Sea, Tidal currents are slowest near the Isle of Man but have a greater amplitude (0.9 m/s) to north and south of the island (Howarth, 1984).
Low level effluent nuclear waste has been discharged into the Irish Sea from the Sellafield reprocessing plant at Cumbria, since 1952. These effluents contain both soluble ('OS~, la7cs) and insoluble ( l o 6 ~ u , ld4ce, 2 4 0 ~ u , " '~m) radionuclides of which the latter are -95% (Hetherington, 1976; Hain, 1986; Kershaw et dl., 1986). The soluble component stays in solution and either moves with currents or becomes trapped in the interstitial waters, but the insoluble component descends to the sea-floor as colloids of particles (Howarth, 1984). These insoluble pollutants have been abundantly found in the vicinity of the outfall and intertidal sediments of the Esk estuary and Cumbrian coast (Aston et al., 1985; Hamilton, 1985). A positive correlation between Pu activity and fine fraction of the mud have also been identified in the area (Aston et al., 1985; Kershaw et al., 1986).
This paper presents the current-meter data recorded at 6 different stations in the northeastern Irish Sea, The data were collected during 1988 and 1989. A special bottom-mounted autonomous system, equipped with a vertical array of five electromag- netic current meters and a pressure sensor was used for this purpose (Rehman & Vincent, 1988; Vincent et al., 1990). Current and wave data were recorded on a battery operated Seadata logger, mounted on a platform 2 m above the base of'the tetrapod.
THEORY
Flowing water experiences friction at the fluid solid interface due to current shear. Correspondingly water exerts an equal and opposite tangential drag on the boundary, &led shear stress (z) which is proportional to the square of the flow speed. As a result the flow speed gradually decreases from surface to bottom in a logarithmic layer whereby layers with different velocities shear past each other. If current velocities (Uz) are recorded at different levels above the bed and plotted against logarithm of distance from the bed, then shear or frcition velocity (U*) can be determined from the gradient of the line by following relationship (Open University, 1989):
where U1 and U2 are the current veocities at two reference levels, log1 and log22 are the log of the distance between the seabed and the respective measurement level, k is von Karman's constant having a value of 0.4.
The shear velocity is effectively related to the drag on the sea bed, zo, as well as the density of water p and is, therefore, responsible for the sediment transport by:

The effect of bed on the flow is expressed as CD, the drag coefficient which accounts for the roughness of the bed or the particle size making the bed. Mathemati- cally, it can be expressed as :
............ CD = ( u * / u ~ ) ~ (n11
where Uz is current velocity usually measured l m above the bed.
At slow currents flowing over a bed composed of fine grained sediments, a viscous sublayer (d) can form beneath the logarithmic layer. The thickness of this sublayer is normally of the order of a few mm which is inversely proportional to Uz (and thus U*). In this region the flow is quasi-laminar because viscosity dominates i t and the current flow only sees a smooth bed. At this stage the sediment diameter (d) is not significant and roughness height of the bed (20) is a function of flow speed.
A flow is regarded as "smooth turbulent" if the grain diameter of the bottom is less than one third of the thickness of viscous sublayer (d < 6/3). A flow will be "rough turbulent" if the grain diameter is seven times the thickness of 6, and "transitional" betweeen these two maxima. The thickness of 6 is determined as:
where v is the kinematic viscosity (molecular viscosity divided by density= 0.014 cm/s for seawater).
Apart from current velocity, other factors responsible for initiation of sediment transport include size and shape of the particles making the bed, relative sediment density, nature of bed forms, cohesion between sediments (yield strength), and viscosity of water. When the shear velocity exceeds the threshold limit and overcomes the inter-particle cohesion, sediments along the bed start to move. Depending on the ratio between grain size of the substrate and the thickness of 6, particles can be transported as bed load (rolling, sliding or saltation) or as suspended load.
Boundary layer flow in most rni;ine environments is turbulent and charac- terized by random movements of small eddies within the water column. The initiation of suspended load, however, requires greater turbulence with high eddy viscosity to cause a vigmms mosiorr of +he -s~&strate an& l i f t particles into suspensio6. Noni cohesive sediments can be resuspended if the upward lifting force exceeds the grain weight. These particles are passively carried by horizontal currents till their velocity is checked and the deposition starts (for details see Ch. 7, Allen, 1985).
INSTRUMENTATION
Currents
Current measurements for the present study were recorded by a vertical array of five Marsh-McBirney type electromagnetic current meters with a 2.5 cm diameter sensor head. The current meters were attached to a tetrapod and positioned a t 15, 30, 60, 100, and 135 c i heights from its base to measure the Eulerian current velocity a t above heights from the sea bed. One of the current meters (2 = 30 cm) was aligned at 90•‹ to the others. Each current meter measured flow velocity along the two horizontally orthogonal axes - a north component and an east component. The sampling was done in bursts consisting of 500 measurements per burst for each current meter. The burst interval was 30 minutes and sampling frequency of 1.2 s, taking 10 minutes to complete a burst. Data from 500 measurements were averaged and recorded as a. mean and standard deviation.
Waves
A common method available for obtaining information on wave parameters is to use a fixed pressure sensor mounted on a stand and deployed near the bed. The sensor measures hydrostatic pressure which varies periodically as the depth of water between surface and the sensor varies with waves of different heights passing over it. This method is useful for shallow waters because the pressure variation is rapid depending upon the wavelength of the waves (Pond & Pickard, 1983). For this study pressure values were recorded by a sensor mounted on the tetrapod 2 m above the seabed. It was also sampling in burst mode consisting of 500 measurements taken a t a frequency of 1.2 s. The pressure sensor and current meters were synchronized to start the bursts simultaneously.
METHOD
Before calculating U* (friction velcoity) and zo (roughness height) for these stations, it was important to check how logarithmic the flow was at the time of measurements. This was necessary because at slow velocity the determination of above parameters becomes inaccurate. The coefficient of regression (r2) was determined for each burst by using linear regression between Uz and logz. Bursts with a critical value of r2 < 0.95 were ignored for further analysis. Since current meter at level 2 (z = 30 cm) was not aligned with the rest and some of its data were contaminated and hence not included in the calculation of r2, U* and zo.
RESULTS
Stations A, B, C and
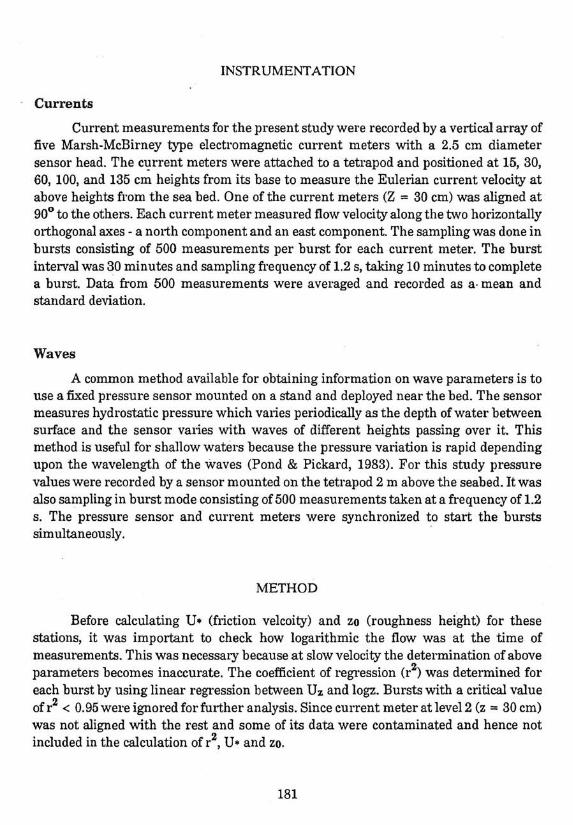
The first set of near-bed current velocity data were recorded from stations A, B, C and D (see Fig. 1) having mean depths of 23,23,26 and 31m respectively. The system was deployed for four relatively short periods (16-25 h) in January 1988, when the tidal range was very close to mean neap (- 5 m). Profiles of current velocity a t 15,60 and 135 crn from the bed for these stations indicate that mean flow is tidally dominated with a semi-diurnal frequency and tidal streams flow counter-clockwise (Fig. 2). Peak mean velocity at U135 is - 40 cm/s and the profiles are logarithmic only when flow speed is > 20 cm/s.
$ 57 SITE A . (23 rn depth) V
SITE B- - U 60 (23 rn depth1
4 4
SITE b. (31 m depth)
~ime (h) Time (h)
Fig. 2. Current velocity proflles at 15,60 and 135 cm above the seabed at stations A, B, C and D in the eastern Irish Sea on January 11, 13, 14 and 15, 1988, respectively.
Burst values having rZ > 0.95 were used to determine the U* and zo for all four stations (Fig, 3). The relationship between U* and zo values suggest that for U* < 1.5 cm/s, the zo remains low (0.1 em), but when the friction velcoity exceeds this threshold,

the roughness height also increases accordingly. Thus, it can be inferred that during slow currents at station A (< 30 cm/s), - 1 mm thick viscous sublayer (8) was formed above the bed which rendered the sediment size insignificant and hence zo was a function of the flow speed (Fig. 3a). However, as soon as the velocity increased the above value, the thickness of d decreased and the sediment size and the form drag became important. The value of zo obtained for this period (1.5 cm) indicate that the bed could be rippled and that the flow was rough turbulent (d > 76). Measurements at station B are not logarithmic for the most part and therefore, will not be discussed in detail.
- Roughness Length -.-.-. Fric. Velocity
Coe f. Regression.
T i m e (h) Time (h)
Fig. 3. Plots showing cocMicicnts of rcgrcssion (r2), friction velocity (U*), and roughness height (zo) for stations A-D.
U* values for station C show typical values of about 1.5-2.0 cm/s for current velocities > 20 cm/s (Fig. 312). rZ is higher than the critical value of 0.95 for most of the bursts. High zo values indicate that seabed in this region is rippled and it is the form drag which increases the resistance to flow rather than the skin friction. At station D also (Fig. 3d), high U* values (> 2 cm/s) are encountered during very fast flows suggesting a significant friction by the bed forms (high 20).
Station E
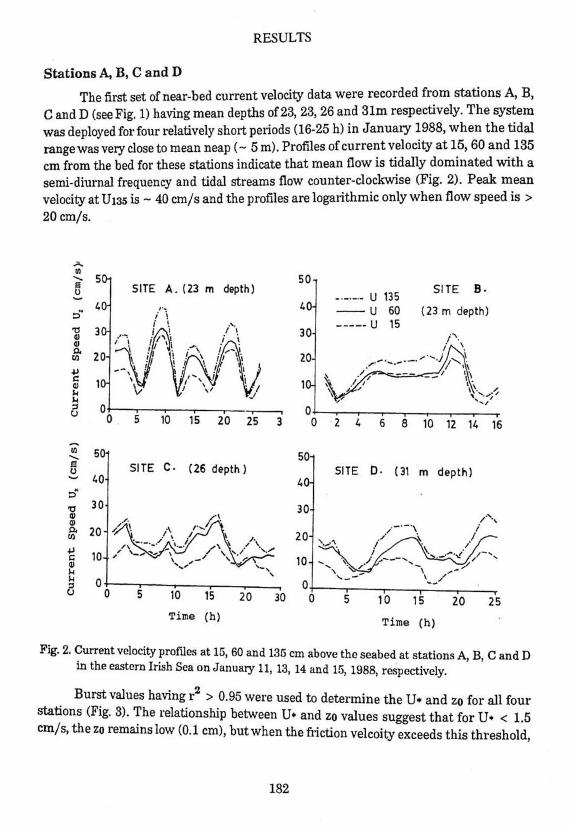
The next set of data were recorded at station E in 24 rn deep water. Here the tetrapod was deployed for 23 days during Jan. Feb. 1988. The sampling was controlled by pressure fluctuations which would continue for the next 12 hours if the fluctuation was greater than a certain threshold. Otherwise, the samples were recorded once evmy 12 h. Thus, during the period of 23 days, there are about half a dozen such occasions when measurements went on for 12 hours or more. Figure 4 represents four such events when the velocity was recorded for 20 hours or more at n stretch, chosen for further analysis.
Time (h) Time ( h )
Fig. 4. Current velocity profiles at 15,60 and 135 cm abovc thcsc~bcd at tati ion E in the owtwn Irish Sea. (a) 20 h on 19-1-1988, (b) 60 h on 31-1-1988, (c) 130 h on 7-2-1988, and (dl 85 h on 9-2-1988.
The first event lasted up to 20 hours at a time when the tidal range was > 8 m at Liverpool (Fig. 4a). The second set of data represents current mcosuremerlts for 60 hours with tidal range of 6 m (Fig. 4b). The third sot represents 30 hours of measure- ments in nearly 7 m tidal range (Fig. 4c) and, and the fourth event lasted 35 hsum in IS m of tidal range (Fig. 4d).

A generalized examination of the mean velocity profiles for station E shows that fastest currents speed at 135cm from the bed reached 61 cm/s which corresponds to 47 cm/s near the bed (U15). Records show that these profiles are generally logarithmic and above the critical value of r2 > 0.95. Currents show a clear modulation a t semi-diurnal frequency and an anticlockwise rotation.
Time (h) Time (h)
Fig. 5. Plots showing mcfficients of rcpcssion (r2), friction velocity (U*), and roughness height (ZO) from stations E for corresponding periods of figure 4 (a,b,c,d).
The highest U* value, determined for this station during a period of 23 days, i s about 4.8 cm/s (Fig. 5). Such high U* values coupled with high zo suggest that the bed at this locality is rippled rather than being made of coarser particles. Water flowing at a speed of 60 cm/s, - 1 m above the bed, is capable of initiating transport of non-cohesive sediments of up to 800 pm in diameter. Similarly, a flow with a friction velocity of 4.5 cm/s can transport particles, having 500 pm diameter, in suspension. It is estimated that for U* values of < 2.5 cm/s, the thickness of 6 would be 0.4 mm and the flow would be smooth turbulent if d < 0.1 mm, however, the flow becomes rough turbulent when d > 3 mm. It is because at this stage the bed flow may generate ripples which a r e responsible for high zo values, occasionally encountered during the profiles.

Station F
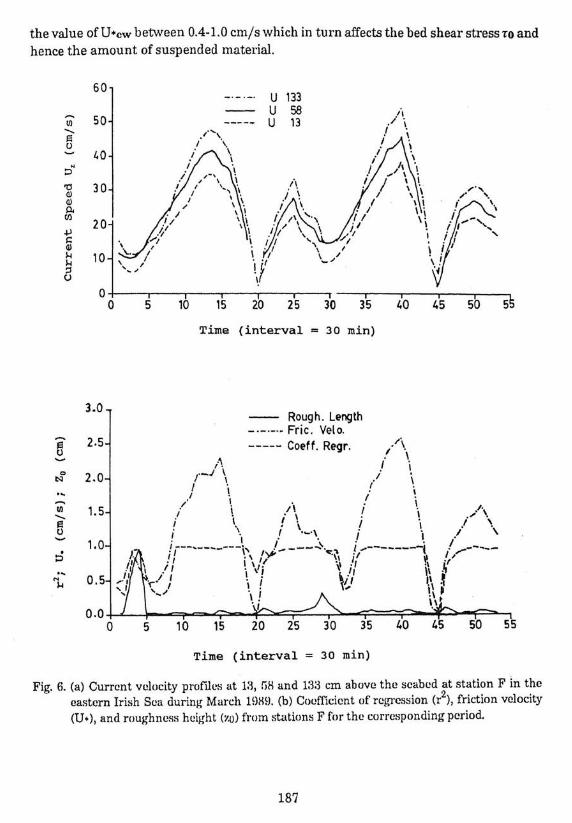
Near-bed current velocity data from station F were recorded at a depth of 35 m through a short deployment of 26 hours during March 1989. Calm waether had prevailed before and during the deployment and the tide was at spring (> 9 m). The fastest currents measured simultaneously at 135 and 15 cm above the bed were 55 and 39 cm/s, respectively (Fig. 6a). The tidal frequency is semi-diurnal with a counter- clockwise flow and the major axis of the ellipse oriented towards NW-SE. The U* values range from 1-2.7 cm/s, and zo < 0.1 cm (Fig. 6b). It has been suggested that a velocity of 55 cm/s (- 1 m above the bed) can initiate bed load transport of particles of < 600 ,am diameter, and suspended load transport of up to 300 ,urn, if the substrate is made of non-cohesive sediments (Open University, 1989).
Analysis of waves at station F
Pressure profiles were also measured a t station F, for the first 22 hours of the deployment. The data were analysed in detail and wavelength (L), wave period (T), wave height (Hrnax, Hsig, Hmin) and the near-bed wave orbital current velocity (Urnax,
Usig, Urnin) were calculated for that period. Figure 7 shows the profiles of significant wave height (Hsig) and the significant near-bed wave orbital current velocity (Usig). The values of Hsig range from 0.2 to 0.75 m, and those of Usig varies from 10-22 cm/s.
The wave parameters recorded at station F show a wide range of scale. During the 22 hours of measurement, the smallest mean waves were 11.4 cm high but the maximum height was 1.11 m. Wave periods range from a minimum of 8 s (correspond- ing to the highest wave) to a maximum of 20 s. The wavelength of various waves vary between 103 to 346 m. It should be noted here that wave periods measured a t this station (depth 35 m) are much longer than expected for a sea such as the Irish Sea (normal T = 6-8 s). However, because wave attenuation increases as T decreases, the influence of longer waves in the spectrum of surface waves is accentuated a t the seabed.
It looks certain from figure 7 that even in the presence of smallerwaves, there are wave orbital currents in the boundary layer. These currents add to the total shear stress caused by tidal currents and thus increase the potential for resuspension of the bed sediments. A quantitative estimation of the magnitude of additional stress was obtained through the use of Glenn and Grant's model (1987). This model computes the nearbed kinem~and&narnic~aram&ersfori~1:0~bi11~d&est of waves cmbtidal ctilrrentson - - -
a bed with movable bed roughness.
In order to compute the new values of U*m (currents and waves) through the above model, it was assumed that the bed was composed of only one size particles (125 mm) having a density of 2.65 g/cm. The angle between the directions of waves and currents was set to 45O. The results showed that wave current interaction does increase
the value of U*W between 0.4-1.0 cm/s which in turn affects the bed shear stress zo and hence the amount of suspended material.
T i m e (interval = 30 m i n )
- Rough. Length - .-.-.- Fric. Velo.
Time (interval = 30 min)
Fig. 6. (a) Current velocity prafdcs at 1:3, T,X and 139 cm above the seabed at station F in the 2
castern Irish Sea during Murch 10XI). (b) Cocfficicnt of regression (r ), friction velocity (U*), and roughness height (Y. ) ) from stations F for the corresponding period.

_ ._._. Sig Current Speed
E __ _ - I Sig Wave Height
T i m e (interval = 30 min)
Fig. 7. Plot of significant wave height (Hsig) at station F and the resulting increase in current velocity due to wave orbital currents.
DISCUSSION AND CONCLUSION
A generalized analysis of the current velocity data from various points in the shallow eastern Irish Sea suggests that water circulation is controlled by tidal streams at a semi-diurnal frequency. The two incoming tidal streams meet a t almost the centre of the Irish Sea basin from where they circulate in a counter-clockwise direction. The longest axis of the tidal ellipse is oriented in NW-SE direction. Typical surface currents in this area flow at - 1 m/s which corresponds well with the measured data as the fastest currents measured anywhere in the eastern part of the Irish Sea basin a t a height of 135 ern from the bed never exceed 65 cm/s. Becasue of the significant difference in the depth of the basin from west to east, the tidal range is maximum near Liverpool and minimum near the Iiish coast.
Seabed in this part of the basin is composed of sand and sandy mud (Dickson, 1987) with a significant degree of cohesion in the extreme northeastern part. These sediments are eroded and resuspended only when the shear velocity of the currents cross a certain threshold. It follows that at slow currents ( c 30 cm/s) the flow is smooth turbulent in boundary layer. When current velocity is higher during spring tides, the flow becomes rough turbulent and coarser particles along the bed form ripples which increases the resistance (form drag). Higher values of roughness height on ceitain
occasions indicate the above and show that the substrate may be rippled in this part of the sea.
Wave parameters measured during calm weather also indicate that wave orbital currents are cel-tainly vely important in terms of adding to the friction velocity of tidal currents, increases their potential for erosion of the substrate and resuspension of particles (Fig. 7). Winter storms (with gale force winds) are common in the north Atlantic and western European coastal regions. These storms (though fetch limited in the Irish Sea region) are likely to generate large waves which interact with the tidal and wind-driven currents. Hence, friction velocity may exponentially increase if such storm coincide with spring tides and erosion/resuspension of the bed particles may ensue. The present study does not support the argument of Sills & Edge (1987) that seabed in this area may be receiving recent sedi~nents as opposed to erosion (cf. Fig. 6; Rehman & Vincent, 1988).
The most i~npoi-tant implication of this analysis is that bed sediments in a large part of the northeastern Irish Sea are conta~ninated/polluted due to the insoluble cornponetlt of the nuclear waste, a majority of them can be eroded and resuspended during winter storms and the pothential health hazard in the area may also increase.
Acknolulcdgements: The author is sincerely thankful to Dr. C.E. Vincent of the Univer- sity of East Anglia, Nolwich (U.K) for providing invaluable guidance during this study sponsored by the Ministly of Science and Technology, Government of Pakistan. My thanks should also extend to M/S. Nick Pearson, and Mike Thomas of the MAFF laboratories at Fisheries Directorate, Lowestoft (U.K) for their technical help. Dr. Saifullah Tancrli rlarseiws to be thanked for his positive suggestions while reviewing this article.
REFERENCES
Ahmad, F., 1979. Pitting of the tidal constitucnts to thc current mctcr rccnrds rcprcscnting velocity, prcssurc and the c;ilculation of semi-major and scmi-minor axes of the tidal ~xr rcn t cllipscs of'M2 constitucnts. Pak. J. Sci. Ind. Rcs. 22, 222-227.
Allcn, J.R.L., 1985. Princip lcs of Physical Scdimcntulogy. Gcorgc Allcn & Unwin, London.
Aston, S.R., Assindcr, D.J. & Kclly, M., 1985. Plutonium in intertidal coastal and estuarine scdimcnts in thc northcm Irish Sca. Estur. Coast. Shclf Sci. 20, 7131-771.
Bowdcn, K.F., 1980. Physicit1 and dynamical oceanography of the Irish Sea In: Thc north-west European shelf scas: the s~i lbcd and the sea in motion (F.T. Banner, M.B. Collins, & KS. Massic, cds.). Elscvicr, Arnstcrtlzrm, 2, 391-414.
Bowdcn, KF., 1 9 H X Physical Oceanography of thc Coastal Waters. John Wiley & Sons, Chichustcr.

Dickson, R.R (ed.), 1987. Irish Sea status report of theMarine Pollution Monitoring Management Group. Aquatic Environment Monitoring Rep. 17. MAFF Fisheries Directorate Lowestoft.
Glenn, S.M. & Grant, W.D., 1987. A suspended sediment stratification correction for combined wave and current flows. J. Gcophys. Rcs. 92, 8244-8264.
Hain, J.H.W., 1986. Low-level radioactivity in the Irish Sea. Oceanus 29, 16-27.
Hamilton, E.I., 1985. The disposal of radioactive wastes into the marine environment: the presence of hot particles containingpu and Am in the source term. Min. Mag. 49, 177-194.
Hetherington, J.A., 1976. Radioactivity in surface and coastal waters of the British Isles. Min. , Agric. Fish Food, Radiobiol. Lab., Lowestoft, FRL 11, 1-34.
Howarth, M.J., 1984. Currents in the eastern Irish Sea. Oceanogr. Mar. Biol. Ann. Rev. 22, 11-53.
Hughes, P., 1969. Submarine cable measurement of tidal currents in the Irish Sea. Limnology & Oceanography 14,269-278.
Kershaw, P.J., Breale, J.H. Woodhead, D.S. & Lovctt, M.B., 1986. Alpha-emitting, hot particles in the Irish Sca sediments. The Sci. Tot. Env. 53, 77-87.
Open University, 1989. Waves, Tides and Shallow-Water Processes. Pcrgammon Press, Oxford.
Pond, S. & Pickard, G.L., 1983. Introductory Dynamical Oceanography. Pergammon Press, Oxford.
Rchman, S.S. & Vincent, C.E., 1988. Acoustic measurement of suspcnded sediments in the eastern Irish Sea. Gcol. Bull. Univ. Peshawar 21, 105-116.
Robinson, I.S., 1979. The tidal dynamics of the Irish and Celtic seas. Geophys. J. Astr. Soe 56, 159-197.
Sills, G.C. &Edge, M.J., 1987. Sediment bchwiour in the Irish Sca. Unpub. Rep. OUEL 1698/87, Dept. Eng.'Sci. Univ. Oxford.
Vincent, C.E., Rehman, S.S. & Dickson, R.R., 1990. Fine sediment dispersal in the Irish Sea. Proceedings of the ISCZC. China Ocean Press, Bcijing, 565-575.