NCSD Southland WWTF MP - Nipomo Community Services ...
259
January 2009 Nipomo Community Services District Southland Wastewater Treatment Facility MASTER PLAN Wastewater Treatment Plant Upgrade and Expansion Project for 1194 Pacific Street, Suite 204 San Luis Obispo, CA 93401 P 805.542.9840 F 805.542.9990 www.aecom.com Nipomo Community Services District District General Manager Bruce Buel District Engineer Peter Sevcik, PE Utility Superintendent Tina Grietens AECOM Project Manager Mike Nunley, PE Project Engineer Eileen Shields, EIT
-
Upload
khangminh22 -
Category
Documents
-
view
2 -
download
0
Transcript of NCSD Southland WWTF MP - Nipomo Community Services ...
January 2009
Nipomo Community Services District Southland Wastewater Treatment Facility MASTER PLAN
Wastewater Treatment PlantUpgrade and Expansion Project
for 1194 Pacific Street, Suite 204San Luis Obispo, CA 93401
P 805.542.9840F 805.542.9990
www.aecom.com
Nipomo Community Services District
District General Manager Bruce Buel
District Engineer Peter Sevcik, PE
Utility Superintendent Tina Grietens
AECOM
Project Manager Mike Nunley, PE
Project Engineer Eileen Shields, EIT
January 2009
1194 Pacific Street, Suite 204San Luis Obispo, CA 93401
P 805.542.9840F 805.542.9990www.aecom.com
Nipomo Community Services District Southland Wastewater Treatment Facility MASTER PLAN
Nipomo Community Services District
District General Manager Bruce Buel
District Engineer Peter Sevcik, PE
Utility Superintendent Tina Grietens
AECOM
Project Manager Mike Nunley, PE
Project Engineer Eileen Shields, EIT
i
Table of Contents ___________________________________________________________________________________
1.0 INTRODUCTION ....................................................................................................1
1.1 Background ...............................................................................................1
1.2 Objectives and Scope of Work ..................................................................1
2.0 EXISTING LOADS..................................................................................................4
2.1 Flow Analysis.............................................................................................4
2.2 Loading Rates and Solids Production .......................................................6
2.3 Inflow and Infiltration..................................................................................8
3.0 PROJECTED LOADS...........................................................................................10
3.1 Projected Future Flow Demands.............................................................10
3.2 Projected Future Plant Loading...............................................................10
4.0 EXISTING WASTEWATER TREATMENT FACILITY..........................................14
4.1 Waste Discharge Requirements..............................................................14
4.2 System Components ...............................................................................14
4.3 Effluent Quality ........................................................................................18
5.0 PLANT PERFORMANCE AND CAPACITY .........................................................20
5.1 Ability of Existing System to Meet Current Demand ...............................20
5.2 Ability of Existing System to Meet Future Demand .................................25
6.0 WATER QUALITY GOALS...................................................................................30
6.1 Recycled Water Usage............................................................................30
6.2 Option 1 - Unrestricted Urban Reuse ......................................................30
6.3 Option 2 - Groundwater Recharge Reuse...............................................37
6.4 Option 3 - Maintain Current Discharge Practices....................................44
6.5 Recommendations...................................................................................44
7.0 SYSTEM IMPROVEMENTS.................................................................................46
7.1 Frontage Road Trunk Main .....................................................................46
7.2 Influent Pump Station ..............................................................................46
7.3 Screening and Grit Removal ...................................................................49
7.4 Sludge Removal ......................................................................................52
7.5 Operability and Automation .....................................................................55
7.6 Recommendations for Facility Improvements .........................................57
8.0 FUTURE PROCESS ALTERNATIVES ................................................................59
8.1 Expansion of Aerated Ponds...................................................................59
8.2 Biolac® Conversion.................................................................................63

ii
8.3 Activated Sludge......................................................................................68
8.4 Oxidation Ditch ........................................................................................69
8.5 Tertiary Treatment ...................................................................................72
8.6 Solids Handling........................................................................................73
8.7 Wastewater Disposal...............................................................................76
8.8 Removal of Sludge from Drying Beds during Construction.....................76
8.9 Alternative Energy Supply .......................................................................77
8.10 Recommendations...................................................................................78
9.0 CONCLUSIONS & RECOMMENDATIONS .........................................................79
9.1 Conclusions .............................................................................................79
9.2 Recommendations...................................................................................80
10.0 RECOMMENDED CAPITAL IMPROVEMENTS PLAN & OPINION OF PROBABLE COST…………………………….…………………………………………………………….….81
11.0 BASIS FOR ASSESSMENT OF RATES & FEES................................................84
iii
List of Tables Table 2-1 Historic Flow and Precipitation Data
Table 2-2 Summary of Peaking Factors
Table 2-3 Influent BOD5 Concentrations and Loading
Table 3-1 Project Flow Rates
Table 3-2 Project BOD5 Loading Rates
Table 4-1 Effluent Water Quality Requirements
Table 4-2 Historical Plant Effluent
Table 5-1 Estimated Contributing Flows to Frontage Road Trunk Main
Table 5-2 Modeled Effluent Quality under Existing Flow Conditions
Table 5-3 Treatment Capacity of Existing System under Future Flow Conditions
Table 6-1 Guidelines for Interpretation of Water Quality for Irrigation
Table 6-2 Summary of Effluent Quality from NCSD Southland WWTF
Table 6-3 Crop Specific Tolerance Limits for Irrigation Water Quality
Table 6-4 Three Options to Demonstrate Control of Nitrogen Compounds
Table 6-5 Maximum Contaminant Level (MCL) for Inorganic Compounds
Table 6-6 Maximum Contaminant Levels for Radioactivity
Table 6-7 Reporting Limits and Action Levels for Lead and Copper
Table 6-8 Maximum Contaminant Levels for Organic Compounds
Table 6-9 Maximum Contaminant Levels for Disinfection Byproducts
Table 6-10 Maximum Contaminant Levels for Secondary Constituents
Table 7-1 Cost Opinion for Influent Pump Station Upgrade
Table 7-2 Cost Opinions for Screening and Grit Removal Systems
Table 7-3 ST-3 FLUMP® Cost Opinion
Table 8-1 Cost Opinion and Relative Size for Future Treatment Options
Table 8-2 Cost Opinion for Sludge Drying Beds
Table 8-3 Cost Opinion for Infiltration Basins
Table 11-1 Conceptual Cost Opinions for Facility Improvements
Table 11-2 Conceptual Cost Opinions for Process Improvements
iv
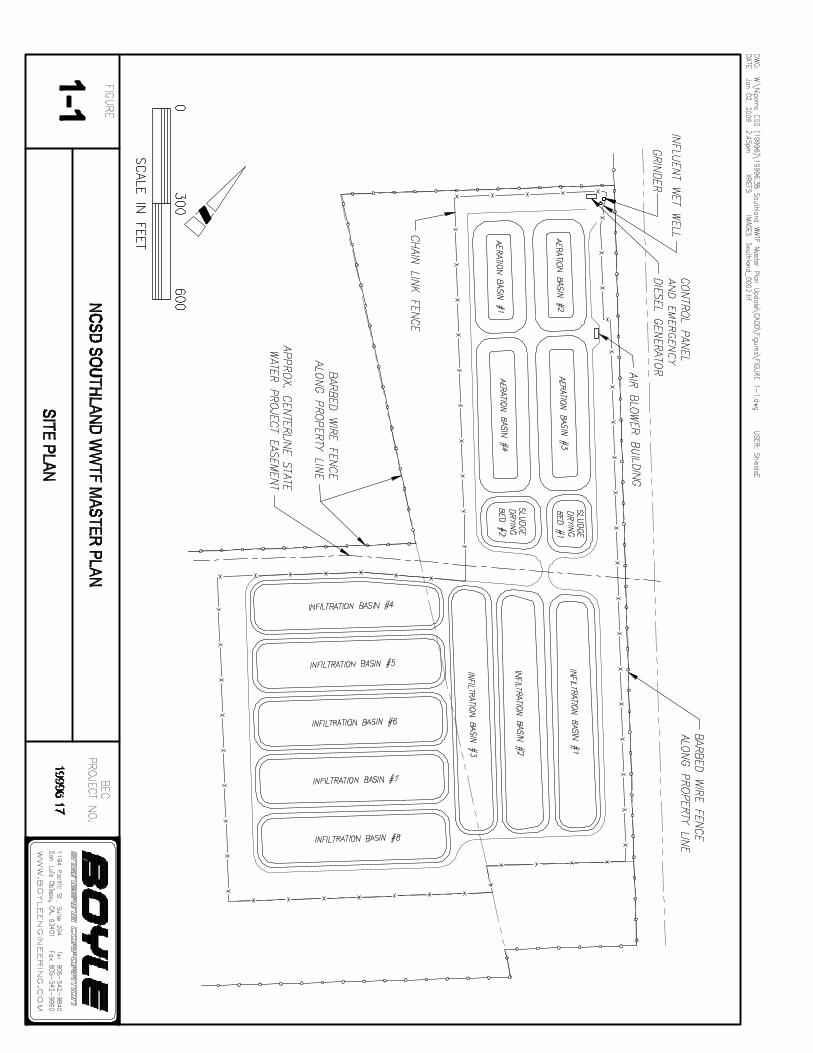
List of Figures Figure 1-1 Site Plan
Figure 2-1 Southland Monthly Average Daily Flows and Total Precipitation (Sep 2006 - Aug 2008)
Figure 3-1 Influent BOD5 Frequency Diagram
Figure 3-2 Influent TSS Frequency Diagram
Figure 4-1 Existing Process Flow Diagram
Figure 5-1 Frontage Road Trunk Main Study Area
Figure 5-2 Frontage Road Trunk Main Hydraulic Profile for Existing Demands
Figure 5-3 Composite Service Pump Curve and System Curve
Figure 5-4 Frontage Road Trunk Main Hydraulic Profile for 2030 Projected Demands
Figure 5-5 Treatment Plant Hydraulic Profile for 2030 Peak Day Flow
Figure 7-1 Top view Hycor® Helisieve®
Figure 7-2 Profile view AquaGuard®
Figure 7-3 Jones & Attwood JetAir® and Screw Classifier
Figure 7-4 Conceptual Schematic of Pond with Sump
Figure 7-5 Severe Duty Flump® Operating on Traverse System to Dredge a Pig Lagoon
Figure 7-6 ShoreMaster’s Polydock®
Figure 8-1 Expansion of Aerated Ponds Process Flow Diagram
Figure 8-2 Alternate 1: Site Plan for Aerated Ponds
Figure 8-3 Biolac® Conversion Process Flow Diagram
Figure 8-4 Alternate 2: Site Plan for Biolac®
Figure 8-5 Comparative Life-Cycle Costs of an Aerated Ponds System and a Biolac® System
Figure 8-6 Completely Mixed Activated Sludge Process Flow Diagram
Figure 8-7 Alternates 3 & 4: Site Plan for Activated Sludge and Oxidation Ditch
Figure 8-8 Oxidation Ditch Process Flow Diagram
EXECUTIVE SUMMARY
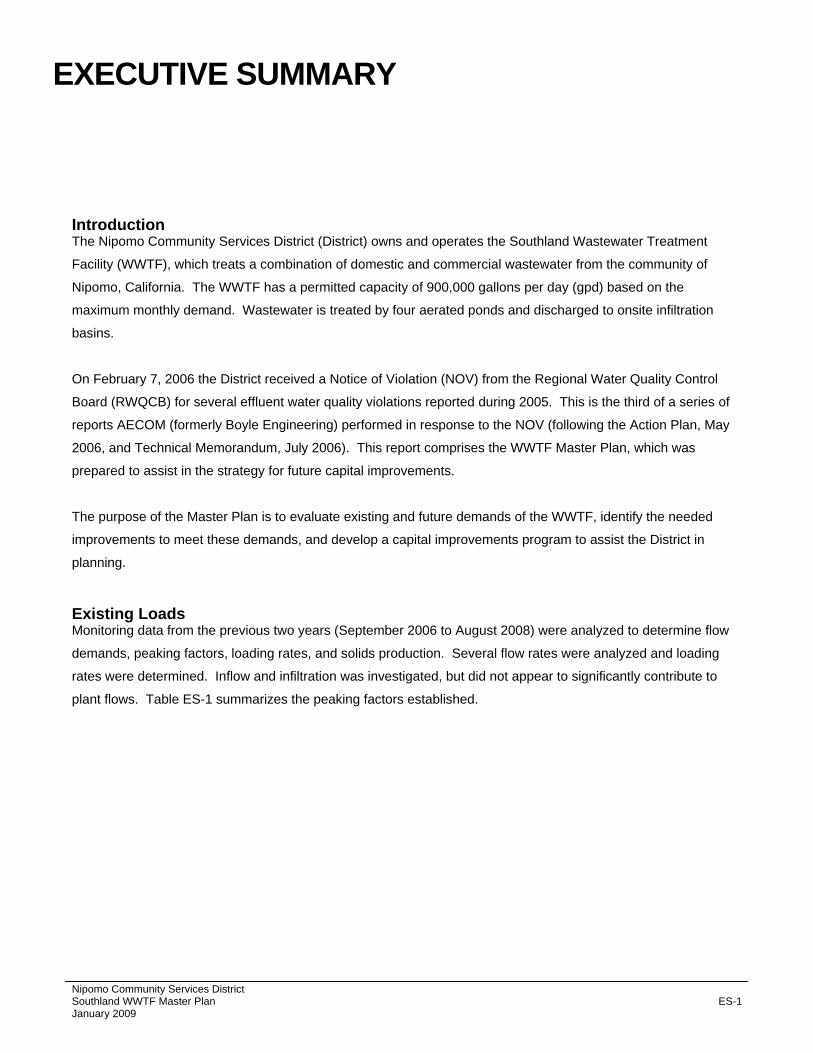
Introduction The Nipomo Community Services District (District) owns and operates the Southland Wastewater Treatment
Facility (WWTF), which treats a combination of domestic and commercial wastewater from the community of
Nipomo, California. The WWTF has a permitted capacity of 900,000 gallons per day (gpd) based on the
maximum monthly demand. Wastewater is treated by four aerated ponds and discharged to onsite infiltration
basins.
On February 7, 2006 the District received a Notice of Violation (NOV) from the Regional Water Quality Control
Board (RWQCB) for several effluent water quality violations reported during 2005. This is the third of a series of
reports AECOM (formerly Boyle Engineering) performed in response to the NOV (following the Action Plan, May
2006, and Technical Memorandum, July 2006). This report comprises the WWTF Master Plan, which was
prepared to assist in the strategy for future capital improvements.
The purpose of the Master Plan is to evaluate existing and future demands of the WWTF, identify the needed
improvements to meet these demands, and develop a capital improvements program to assist the District in
planning.
Existing Loads Monitoring data from the previous two years (September 2006 to August 2008) were analyzed to determine flow
demands, peaking factors, loading rates, and solids production. Several flow rates were analyzed and loading
rates were determined. Inflow and infiltration was investigated, but did not appear to significantly contribute to
plant flows. Table ES-1 summarizes the peaking factors established.
Nipomo Community Services District Southland WWTF Master Plan ES-1 January 2009

Table ES-1 Summary of Peaking Factors
Flow Condition Existing Flow (mgd) Peaking Factor
Average Annual Flow (AAF) 0.59 --
Maximum Monthly Flow (MMF)1 0.64 1.09
Peak Daily Flow (PDF) 1.19 2.00
Peak Hourly Flow (PHF) 1.77 3.00 1 The February 2007 Draft Southland WWTF Master Plan reported a MMF peaking factor of 1.34, based on flow records from Sept. 2004 – Aug. 2006. This report has been updated to reflect flow data from Sept. 2006 – Aug. 2008.
The loading of organic materials and solids in domestic wastewater are important to establish the process
capacity of the WWTF. The data from September 2006 through August 2008 were used to establish the
following:
• Average Annual BOD5 loading = 1,370 lb/day
• Maximum Monthly BOD5 loading = 1,892 lb/day
• Average Annual TSS loading = 1,280 lb/day
• Maximum Monthly TSS loading = 1,950 lb/day
Projected Loads Plant records from September 2006 to August 2008 indicate an AAF of 0.59 mgd. Under direction of NCSD staff,
this study used the projected 2030 AAF from Scenario 1 (which uses existing land use designations) of the Water
and Sewer Master Plan (Cannon Associates, December 2007) and derived intermediate future AAFs assuming
linearized growth between existing and 2030 flow rates. Peaking factors were used to project other relevant
flows. Table ES-2 summarizes current and projected future flow rates. According to this conservative growth
projection, the permitted capacity (MMF = 0.9 mgd) could be reached by December 2010. The District should
begin planning and designing a plant expansion to ensure sufficient capacity for the future.
Nipomo Community Services District Southland WWTF Master Plan ES-2 January 2009
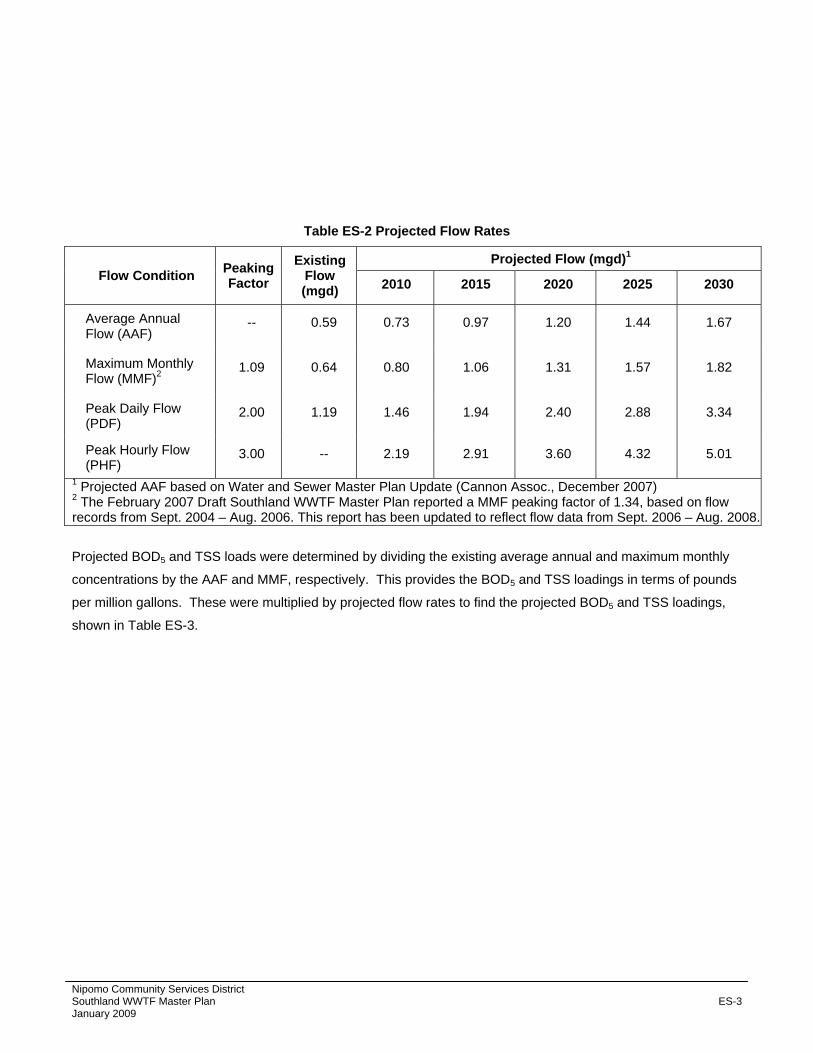
Table ES-2 Projected Flow Rates
Projected Flow (mgd)1 Flow Condition Peaking
Factor Existing
Flow (mgd) 2010 2015 2020 2025 2030
Average Annual Flow (AAF)
-- 0.59 0.73 0.97 1.20 1.44 1.67
Maximum Monthly Flow (MMF)2 1.09 0.64 0.80 1.06 1.31 1.57 1.82
Peak Daily Flow (PDF)
2.00 1.19 1.46 1.94 2.40 2.88 3.34
Peak Hourly Flow (PHF)
3.00 -- 2.19 2.91 3.60 4.32 5.01
1 Projected AAF based on Water and Sewer Master Plan Update (Cannon Assoc., December 2007) 2 The February 2007 Draft Southland WWTF Master Plan reported a MMF peaking factor of 1.34, based on flow records from Sept. 2004 – Aug. 2006. This report has been updated to reflect flow data from Sept. 2006 – Aug. 2008.
Projected BOD5 and TSS loads were determined by dividing the existing average annual and maximum monthly
concentrations by the AAF and MMF, respectively. This provides the BOD5 and TSS loadings in terms of pounds
per million gallons. These were multiplied by projected flow rates to find the projected BOD5 and TSS loadings,
shown in Table ES-3.
Nipomo Community Services District Southland WWTF Master Plan ES-3 January 2009
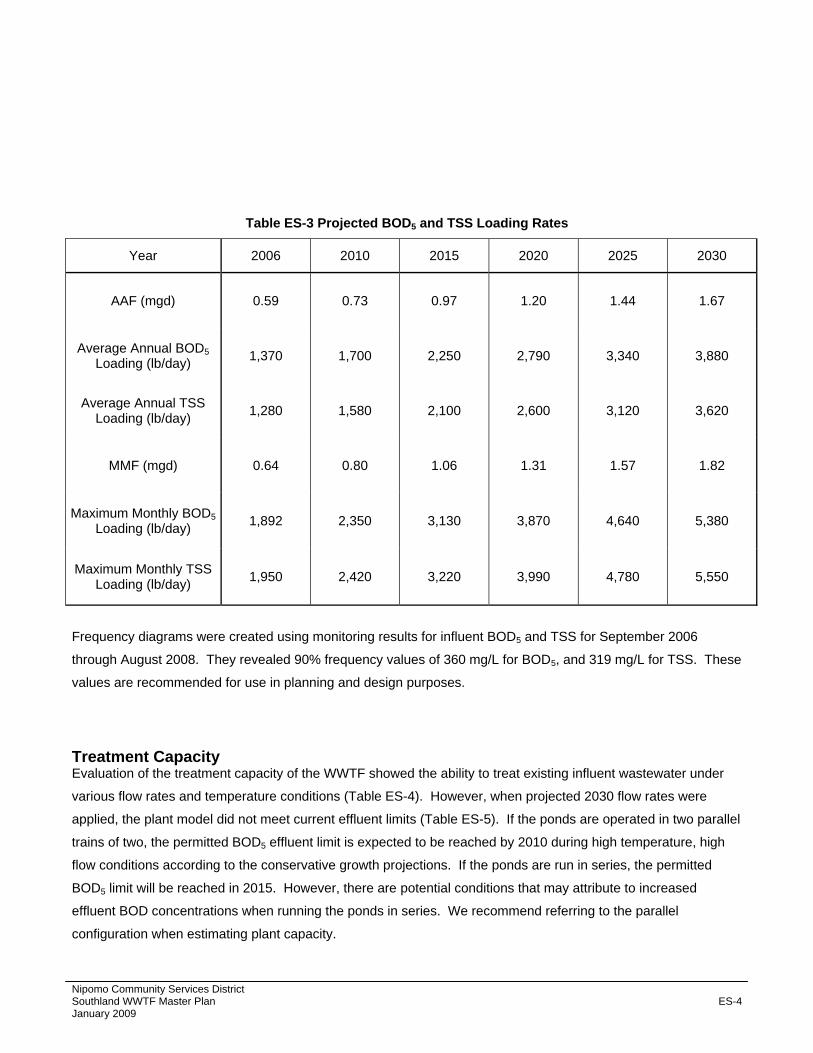
Table ES-3 Projected BOD5 and TSS Loading Rates
Year 2006 2010 2015 2020 2025 2030
AAF (mgd) 0.59 0.73 0.97 1.20 1.44 1.67
Average Annual BOD5 Loading (lb/day) 1,370 1,700 2,250 2,790 3,340 3,880
Average Annual TSS Loading (lb/day) 1,280 1,580 2,100 2,600 3,120 3,620
MMF (mgd) 0.64 0.80 1.06 1.31 1.57 1.82
Maximum Monthly BOD5 Loading (lb/day) 1,892 2,350 3,130 3,870 4,640 5,380
Maximum Monthly TSS Loading (lb/day) 1,950 2,420 3,220 3,990 4,780 5,550
Frequency diagrams were created using monitoring results for influent BOD5 and TSS for September 2006
through August 2008. They revealed 90% frequency values of 360 mg/L for BOD5, and 319 mg/L for TSS. These
values are recommended for use in planning and design purposes.
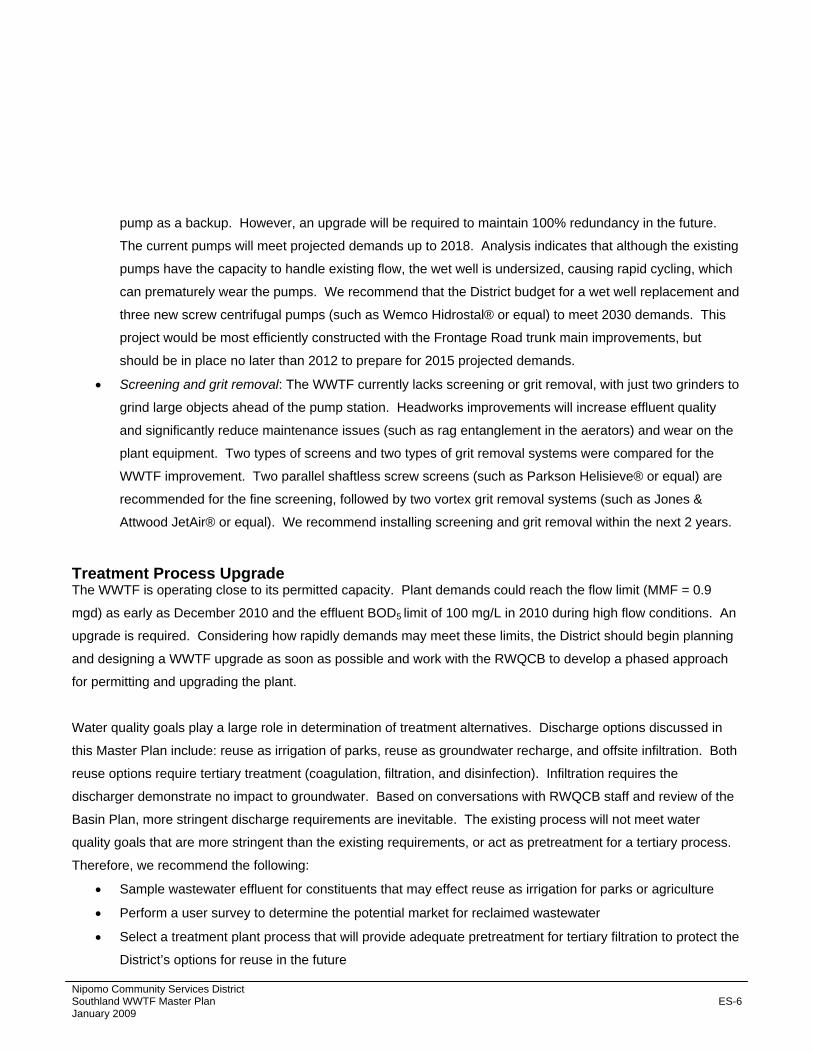
Treatment Capacity Evaluation of the treatment capacity of the WWTF showed the ability to treat existing influent wastewater under
various flow rates and temperature conditions (Table ES-4). However, when projected 2030 flow rates were
applied, the plant model did not meet current effluent limits (Table ES-5). If the ponds are operated in two parallel
trains of two, the permitted BOD5 effluent limit is expected to be reached by 2010 during high temperature, high
flow conditions according to the conservative growth projections. If the ponds are run in series, the permitted
BOD5 limit will be reached in 2015. However, there are potential conditions that may attribute to increased
effluent BOD concentrations when running the ponds in series. We recommend referring to the parallel
configuration when estimating plant capacity.
Nipomo Community Services District Southland WWTF Master Plan ES-4 January 2009
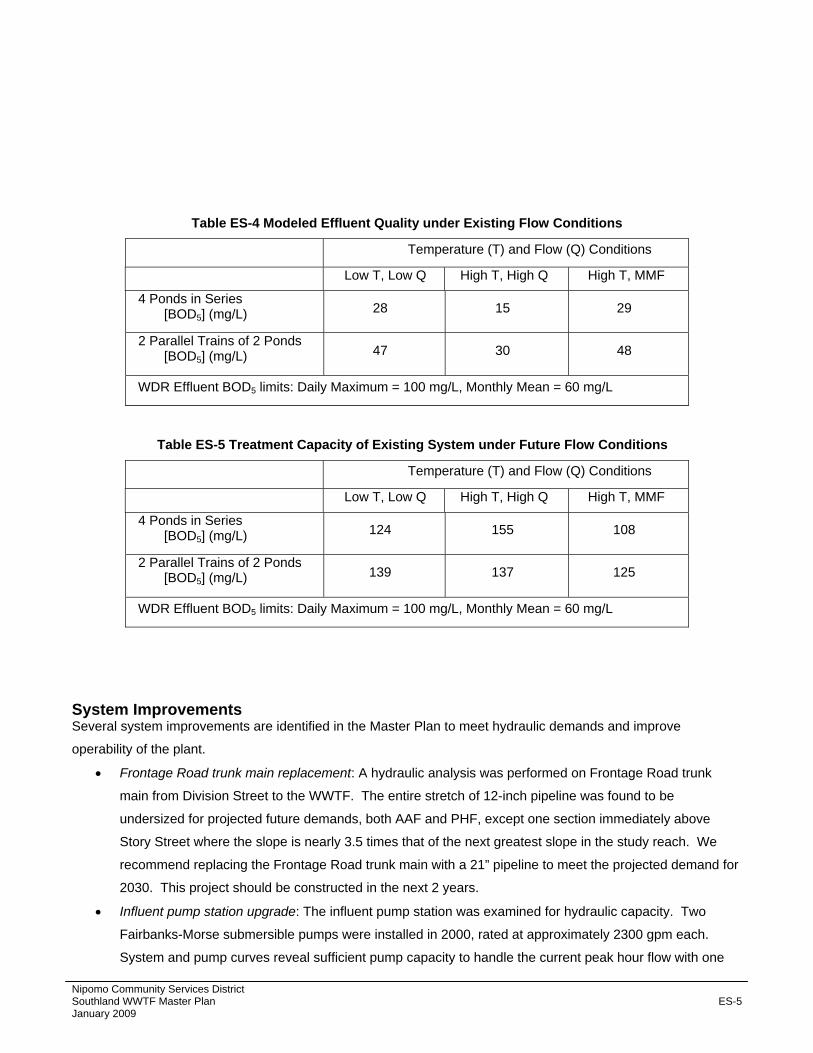
Table ES-4 Modeled Effluent Quality under Existing Flow Conditions
Temperature (T) and Flow (Q) Conditions
Low T, Low Q High T, High Q High T, MMF
4 Ponds in Series [BOD5] (mg/L) 28 15 29
2 Parallel Trains of 2 Ponds [BOD5] (mg/L) 47 30 48
WDR Effluent BOD5 limits: Daily Maximum = 100 mg/L, Monthly Mean = 60 mg/L
Table ES-5 Treatment Capacity of Existing System under Future Flow Conditions
Temperature (T) and Flow (Q) Conditions
Low T, Low Q High T, High Q High T, MMF
4 Ponds in Series [BOD5] (mg/L) 124 155 108
2 Parallel Trains of 2 Ponds [BOD5] (mg/L) 139 137 125
WDR Effluent BOD5 limits: Daily Maximum = 100 mg/L, Monthly Mean = 60 mg/L
System Improvements Several system improvements are identified in the Master Plan to meet hydraulic demands and improve
operability of the plant.
• Frontage Road trunk main replacement: A hydraulic analysis was performed on Frontage Road trunk
main from Division Street to the WWTF. The entire stretch of 12-inch pipeline was found to be
undersized for projected future demands, both AAF and PHF, except one section immediately above
Story Street where the slope is nearly 3.5 times that of the next greatest slope in the study reach. We
recommend replacing the Frontage Road trunk main with a 21” pipeline to meet the projected demand for
2030. This project should be constructed in the next 2 years.
• Influent pump station upgrade: The influent pump station was examined for hydraulic capacity. Two
Fairbanks-Morse submersible pumps were installed in 2000, rated at approximately 2300 gpm each.
System and pump curves reveal sufficient pump capacity to handle the current peak hour flow with one
Nipomo Community Services District Southland WWTF Master Plan ES-5 January 2009
pump as a backup. However, an upgrade will be required to maintain 100% redundancy in the future.
The current pumps will meet projected demands up to 2018. Analysis indicates that although the existing
pumps have the capacity to handle existing flow, the wet well is undersized, causing rapid cycling, which
can prematurely wear the pumps. We recommend that the District budget for a wet well replacement and
three new screw centrifugal pumps (such as Wemco Hidrostal® or equal) to meet 2030 demands. This
project would be most efficiently constructed with the Frontage Road trunk main improvements, but
should be in place no later than 2012 to prepare for 2015 projected demands.
• Screening and grit removal: The WWTF currently lacks screening or grit removal, with just two grinders to
grind large objects ahead of the pump station. Headworks improvements will increase effluent quality
and significantly reduce maintenance issues (such as rag entanglement in the aerators) and wear on the
plant equipment. Two types of screens and two types of grit removal systems were compared for the
WWTF improvement. Two parallel shaftless screw screens (such as Parkson Helisieve® or equal) are
recommended for the fine screening, followed by two vortex grit removal systems (such as Jones &
Attwood JetAir® or equal). We recommend installing screening and grit removal within the next 2 years.
Treatment Process Upgrade The WWTF is operating close to its permitted capacity. Plant demands could reach the flow limit (MMF = 0.9
mgd) as early as December 2010 and the effluent BOD5 limit of 100 mg/L in 2010 during high flow conditions. An
upgrade is required. Considering how rapidly demands may meet these limits, the District should begin planning
and designing a WWTF upgrade as soon as possible and work with the RWQCB to develop a phased approach
for permitting and upgrading the plant.
Water quality goals play a large role in determination of treatment alternatives. Discharge options discussed in
this Master Plan include: reuse as irrigation of parks, reuse as groundwater recharge, and offsite infiltration. Both
reuse options require tertiary treatment (coagulation, filtration, and disinfection). Infiltration requires the
discharger demonstrate no impact to groundwater. Based on conversations with RWQCB staff and review of the
Basin Plan, more stringent discharge requirements are inevitable. The existing process will not meet water
quality goals that are more stringent than the existing requirements, or act as pretreatment for a tertiary process.
Therefore, we recommend the following:
• Sample wastewater effluent for constituents that may effect reuse as irrigation for parks or agriculture
• Perform a user survey to determine the potential market for reclaimed wastewater
• Select a treatment plant process that will provide adequate pretreatment for tertiary filtration to protect the
District’s options for reuse in the future
Nipomo Community Services District Southland WWTF Master Plan ES-6 January 2009
Four treatment alternatives were evaluated for the WWTF upgrade: additional aerated ponds, Biolac® wave
oxidation system, oxidation ditch, and conventional activated sludge. We recommend the Biolac system because
it provides a high quality effluent (sufficient for a tertiary process pretreatment) at a lower cost than any of the
other three alternatives examined. Comprehensive life cycle costs are approximately half that of a pond system.
It requires a Grade II Operator to manage, with a higher degree of operator involvement than a pond system, but
routine operations and maintenance are less complex than the other, more expensive treatment technologies
reviewed (oxidation ditch and activated sludge). We recommend retrofitting a portion of Ponds 3 and 4 with
Biolac® wave oxidation systems and constructing two clarifiers. Primary ponds 1 and 2 would be converted to
aerated sludge holding lagoons. The upgrade could be phased by installing 75% of the aeration equipment
required to meet the projected 2030 demands. This is estimated to be sufficient until 2020. Phase II would
include installation of additional diffusers and an additional blower.
Solids Handling We recommend lining the two existing drying beds and installing a decant pumping station concurrently with the
Phase I Biolac project. Two additional beds would be constructed with the Phase II Biolac expansion.
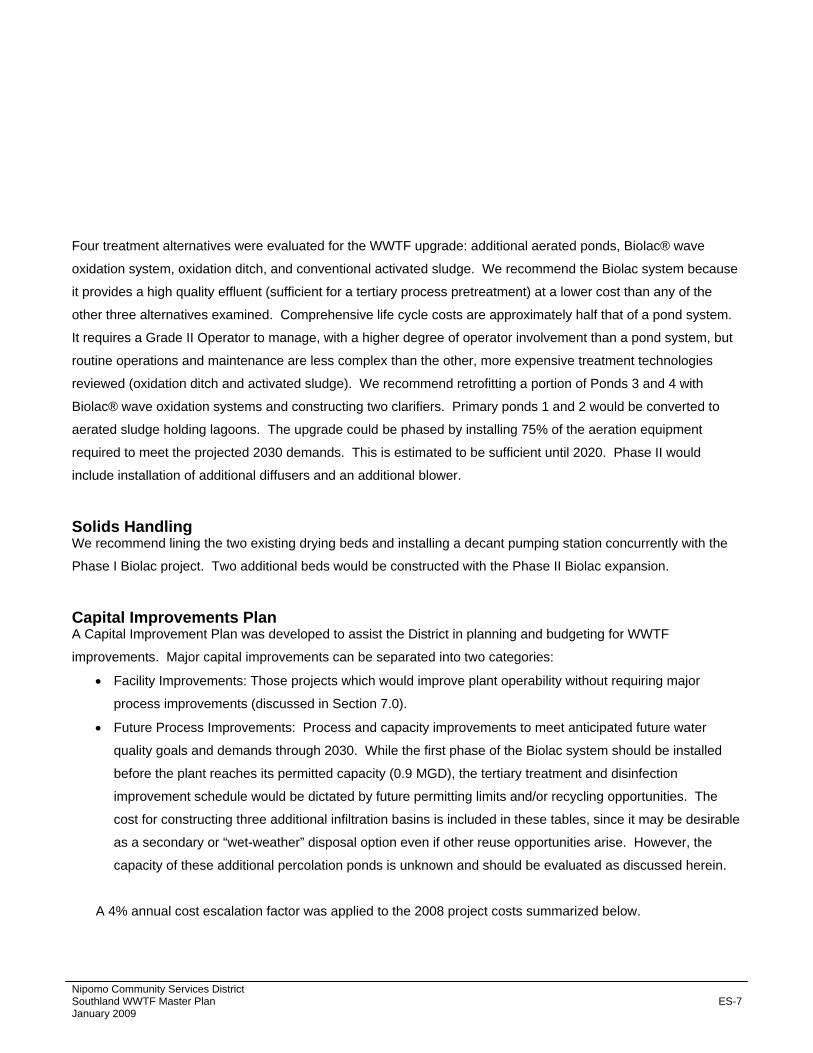
Capital Improvements Plan A Capital Improvement Plan was developed to assist the District in planning and budgeting for WWTF
improvements. Major capital improvements can be separated into two categories:
• Facility Improvements: Those projects which would improve plant operability without requiring major
process improvements (discussed in Section 7.0).
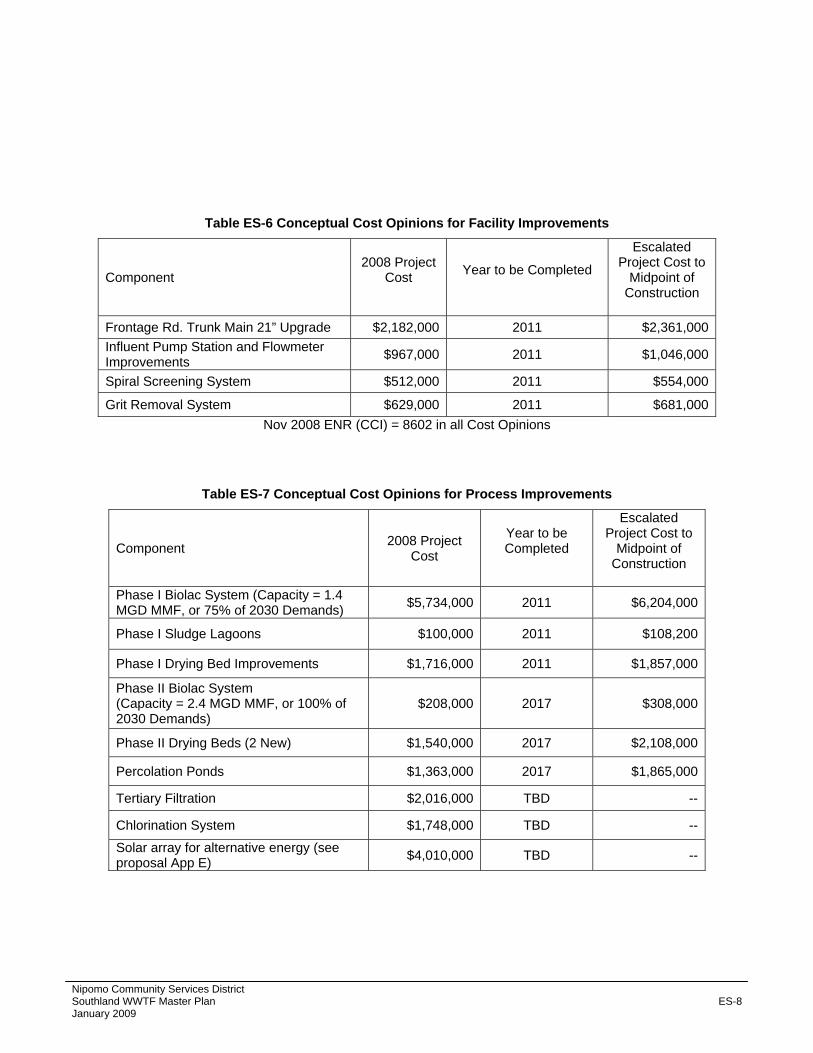
• Future Process Improvements: Process and capacity improvements to meet anticipated future water
quality goals and demands through 2030. While the first phase of the Biolac system should be installed
before the plant reaches its permitted capacity (0.9 MGD), the tertiary treatment and disinfection
improvement schedule would be dictated by future permitting limits and/or recycling opportunities. The
cost for constructing three additional infiltration basins is included in these tables, since it may be desirable
as a secondary or “wet-weather” disposal option even if other reuse opportunities arise. However, the
capacity of these additional percolation ponds is unknown and should be evaluated as discussed herein.
A 4% annual cost escalation factor was applied to the 2008 project costs summarized below.
Nipomo Community Services District Southland WWTF Master Plan ES-7 January 2009
Nipomo Community Services District Southland WWTF Master Plan ES-8 January 2009
Table ES-6 Conceptual Cost Opinions for Facility Improvements
Component 2008 Project
Cost
Year to be Completed
Escalated Project Cost to
Midpoint of Construction
Frontage Rd. Trunk Main 21” Upgrade $2,182,000 2011 $2,361,000Influent Pump Station and Flowmeter Improvements $967,000 2011 $1,046,000
Spiral Screening System $512,000 2011 $554,000
Grit Removal System $629,000 2011 $681,000Nov 2008 ENR (CCI) = 8602 in all Cost Opinions
Table ES-7 Conceptual Cost Opinions for Process Improvements
Component 2008 Project Cost
Year to be Completed
Escalated Project Cost to
Midpoint of Construction
Phase I Biolac System (Capacity = 1.4 MGD MMF, or 75% of 2030 Demands) $5,734,000 2011 $6,204,000
Phase I Sludge Lagoons $100,000 2011 $108,200
Phase I Drying Bed Improvements $1,716,000 2011 $1,857,000
Phase II Biolac System (Capacity = 2.4 MGD MMF, or 100% of 2030 Demands)
$208,000 2017 $308,000
Phase II Drying Beds (2 New) $1,540,000 2017 $2,108,000
Percolation Ponds $1,363,000 2017 $1,865,000
Tertiary Filtration $2,016,000 TBD --
Chlorination System $1,748,000 TBD --
Solar array for alternative energy (see proposal App E) $4,010,000 TBD --
Nipomo Community Services District Southland WWTF Master Plan 1 of 86 January 2009
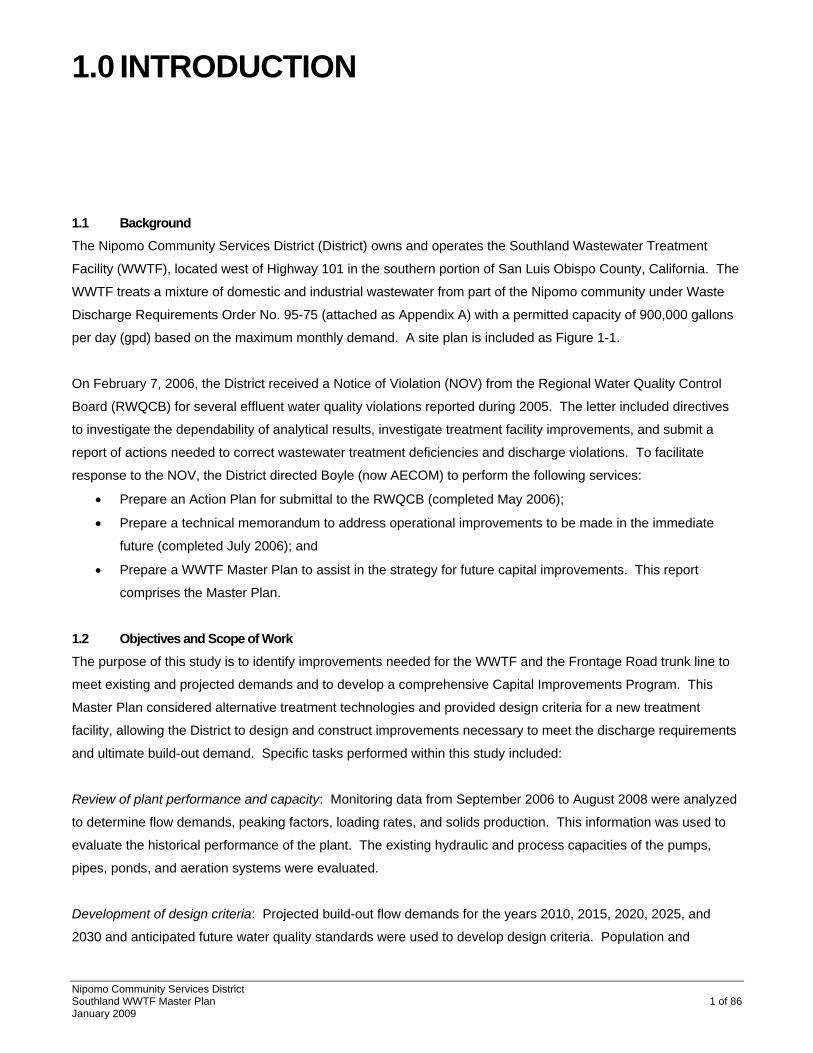
1.1 Background The Nipomo Community Services District (District) owns and operates the Southland Wastewater Treatment
Facility (WWTF), located west of Highway 101 in the southern portion of San Luis Obispo County, California. The
WWTF treats a mixture of domestic and industrial wastewater from part of the Nipomo community under Waste
Discharge Requirements Order No. 95-75 (attached as Appendix A) with a permitted capacity of 900,000 gallons
per day (gpd) based on the maximum monthly demand. A site plan is included as Figure 1-1.
On February 7, 2006, the District received a Notice of Violation (NOV) from the Regional Water Quality Control
Board (RWQCB) for several effluent water quality violations reported during 2005. The letter included directives
to investigate the dependability of analytical results, investigate treatment facility improvements, and submit a
report of actions needed to correct wastewater treatment deficiencies and discharge violations. To facilitate
response to the NOV, the District directed Boyle (now AECOM) to perform the following services:
• Prepare an Action Plan for submittal to the RWQCB (completed May 2006);
• Prepare a technical memorandum to address operational improvements to be made in the immediate
future (completed July 2006); and
• Prepare a WWTF Master Plan to assist in the strategy for future capital improvements. This report
comprises the Master Plan.
1.2 Objectives and Scope of Work The purpose of this study is to identify improvements needed for the WWTF and the Frontage Road trunk line to
meet existing and projected demands and to develop a comprehensive Capital Improvements Program. This
Master Plan considered alternative treatment technologies and provided design criteria for a new treatment
facility, allowing the District to design and construct improvements necessary to meet the discharge requirements
and ultimate build-out demand. Specific tasks performed within this study included:
Review of plant performance and capacity: Monitoring data from September 2006 to August 2008 were analyzed
to determine flow demands, peaking factors, loading rates, and solids production. This information was used to
evaluate the historical performance of the plant. The existing hydraulic and process capacities of the pumps,
pipes, ponds, and aeration systems were evaluated.
Development of design criteria: Projected build-out flow demands for the years 2010, 2015, 2020, 2025, and
2030 and anticipated future water quality standards were used to develop design criteria. Population and
1.0 INTRODUCTION

Nipomo Community Services District Southland WWTF Master Plan 2 of 86 January 2009
wastewater flow projections from the District’s Water and Sewer Master Plan were used to develop flow demands.
Peaking factors were developed for use in this analysis, as well.
Determination of needed facility improvements: The Plan included evaluation of current facility capacity (process,
hydraulic, and solids handling) and identification of improvements needed to meet current demands and treatment
requirements. These improvements include screening and grit removal facilities, replacement of the Frontage
Road Trunk Main, electrical improvements, and sludge handling facilities and strategies. Cost opinions were
provided for solar power and for sludge removal from the drying beds, as well.
Evaluation of alternatives for future plant improvements: Four treatment processes were evaluated based on the
ability to meet future demands. Process flow diagrams, site plans, schematics, and planning-level conceptual
cost opinions are provided for each alternative.
Development of a Capital Improvements Plan: The schematic diagram, site plan, schedule, and cost are outlined
for the recommended improvements.

Nipomo Community Services District Southland WWTF Master Plan 4 of 86 January 2009
2.1 Flow Analysis Several flow rates were analyzed in this study. The Average Annual Flow (AAF) is the flow rate averaged over
the course of the year and is the base flow for the WWTF. Collection and analysis of 2 years of historical flow
data (September 2006 through August 2008) yielded an AAF of 0.59 million gallons per day (mgd).
Average Wet Weather Flow (AWWF) was defined as the average daily flow during “wet” months, or months that
experience a total rainfall greater than 0.5 inches. San Luis Obispo County provided rainfall data, collected from
a gauge at the WWTF. Flow and rainfall records indicate the service area has an AWWF of 0.59 mgd.
Maximum Month Flow (MMF) is an important design flow for the Waste Discharge Requirements (WDR’s) since it
is the basis of the plants permitted capacity. MMF is the average daily flow during the maximum month. Flow
records indicate a MMF of 0.64 mgd over the past two years (January 2007).
Peak Day Flow (PDF) is the maximum daily flow rate experienced at the WWTF. Flow records show the PDF to
be 1.19 mgd (June 23, 2007).
Peak Hour Flow (PHF) is the maximum one-hour flow experienced by the system, and can usually be derived
from WWTF records, flow monitoring, or empirical equations used to estimate PHF based on service area
population. It is important for design of pumps, pipes, screens, flow meters, grit removal devices and clarifiers.
Peak Dry Weather Flow (PDWF) is the maximum daily flow rate recorded at the WWTF during months when less
than 0.5 inches of rain occurs. PDWF for the WWTF is 1.19 mgd (June 23, 2007).
Peak Wet Weather Flow (PWWF) is the maximum daily flow rate recorded at the WWTF during months when 0.5
inches or more rain is recorded. The larger of the PWWF and the PDWF is used as the PDF. PWWF for the
District is 0.993 mgd (December 22, 2006).
Table 2-1 summarizes the average and peak daily flows for each month. Also included are the monthly
precipitation and peak and average flows. Table 2-2 summarizes existing flows and peaking factors.
2.0 EXISTING LOADS
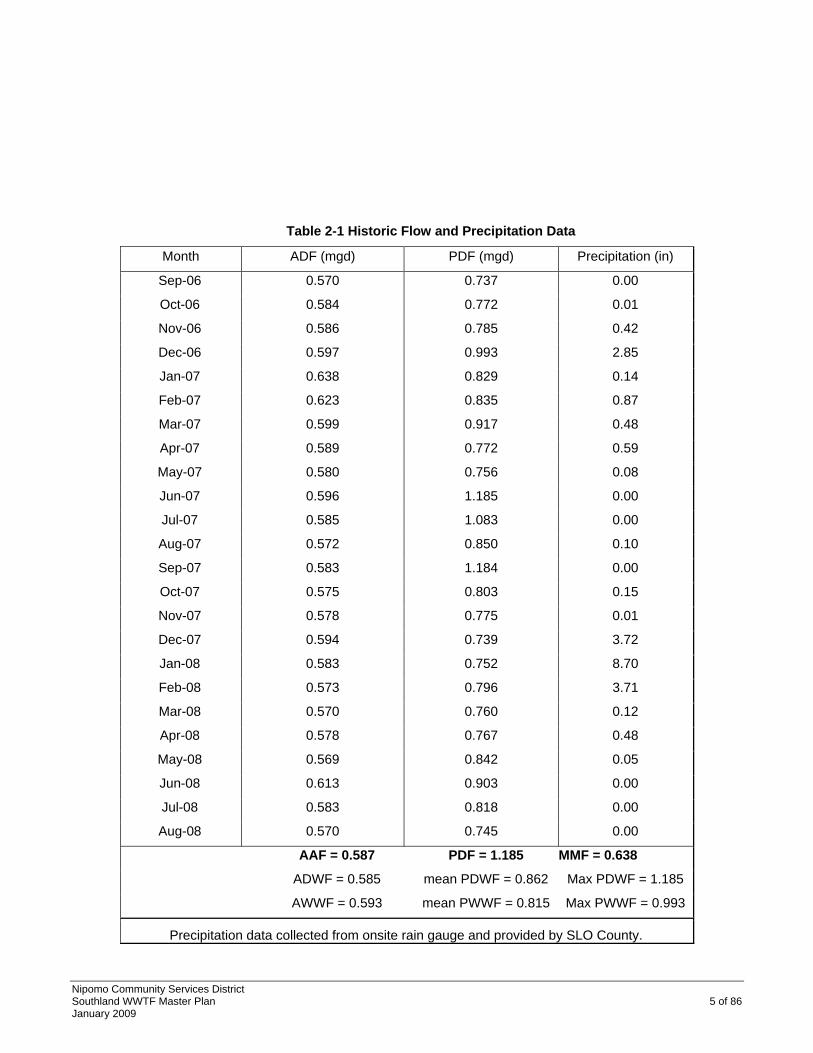
Nipomo Community Services District Southland WWTF Master Plan 5 of 86 January 2009
Table 2-1 Historic Flow and Precipitation Data
Month ADF (mgd) PDF (mgd) Precipitation (in)
Sep-06 0.570 0.737 0.00
Oct-06 0.584 0.772 0.01
Nov-06 0.586 0.785 0.42
Dec-06 0.597 0.993 2.85
Jan-07 0.638 0.829 0.14
Feb-07 0.623 0.835 0.87
Mar-07 0.599 0.917 0.48
Apr-07 0.589 0.772 0.59
May-07 0.580 0.756 0.08
Jun-07 0.596 1.185 0.00
Jul-07 0.585 1.083 0.00
Aug-07 0.572 0.850 0.10
Sep-07 0.583 1.184 0.00
Oct-07 0.575 0.803 0.15
Nov-07 0.578 0.775 0.01
Dec-07 0.594 0.739 3.72
Jan-08 0.583 0.752 8.70
Feb-08 0.573 0.796 3.71
Mar-08 0.570 0.760 0.12
Apr-08 0.578 0.767 0.48
May-08 0.569 0.842 0.05
Jun-08 0.613 0.903 0.00
Jul-08 0.583 0.818 0.00
Aug-08 0.570 0.745 0.00
AAF = 0.587 PDF = 1.185 MMF = 0.638
ADWF = 0.585 mean PDWF = 0.862 Max PDWF = 1.185
AWWF = 0.593 mean PWWF = 0.815 Max PWWF = 0.993
Precipitation data collected from onsite rain gauge and provided by SLO County.
Nipomo Community Services District Southland WWTF Master Plan 6 of 86 January 2009
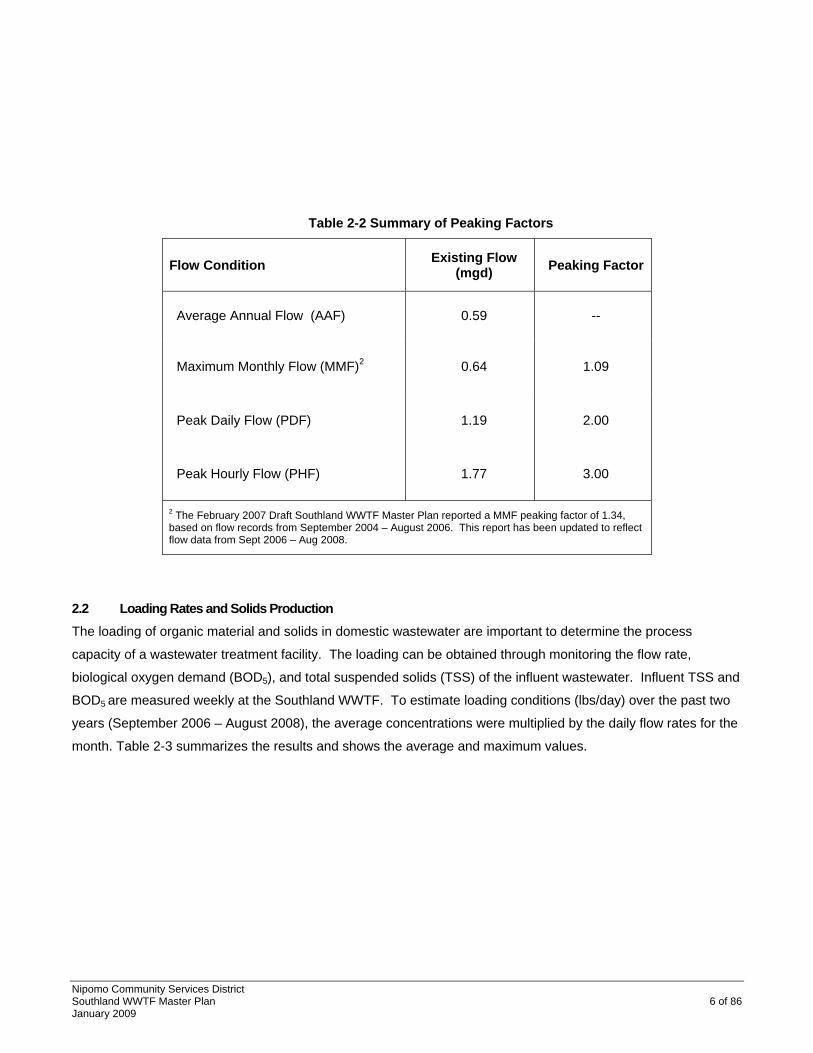
Table 2-2 Summary of Peaking Factors
Flow Condition Existing Flow (mgd) Peaking Factor
Average Annual Flow (AAF) 0.59 --
Maximum Monthly Flow (MMF)2 0.64 1.09
Peak Daily Flow (PDF) 1.19 2.00
Peak Hourly Flow (PHF) 1.77 3.00
2 The February 2007 Draft Southland WWTF Master Plan reported a MMF peaking factor of 1.34, based on flow records from September 2004 – August 2006. This report has been updated to reflect flow data from Sept 2006 – Aug 2008.
2.2 Loading Rates and Solids Production The loading of organic material and solids in domestic wastewater are important to determine the process
capacity of a wastewater treatment facility. The loading can be obtained through monitoring the flow rate,
biological oxygen demand (BOD5), and total suspended solids (TSS) of the influent wastewater. Influent TSS and
BOD5 are measured weekly at the Southland WWTF. To estimate loading conditions (lbs/day) over the past two
years (September 2006 – August 2008), the average concentrations were multiplied by the daily flow rates for the
month. Table 2-3 summarizes the results and shows the average and maximum values.

Nipomo Community Services District Southland WWTF Master Plan 7 of 86 January 2009
Table 2-3 Influent BOD5 Concentrations and Loading
Month-Year Average Daily
Flow (mgd) Monthly Average
BOD5 (mg/L) Monthly Average
TSS (mg/L)
Average Daily BOD5 loading
(lb/day)
Average Daily TSS loading
(lb/day) Sep-06 0.570 320 218 1,521 1,036Oct-06 0.584 270 210 1,315 1,023Nov-06 0.586 295 250 1,443 1,222Dec-06 0.597 273 228 1,357 1,135Jan-07 0.638 278 254 1,479 1,352Feb-07 0.623 308 302 1,598 1,569Mar-07 0.599 250 300 1,246 1,499Apr-07 0.589 291 238 1,428 1,169
May-07 0.580 310 248 1,500 1,200Jun-07 0.596 287 310 1,424 1,541Jul-07 0.595 311 238 1,545 1,181
Aug-07 0.572 285 252 1,361 1,202Sep-07 0.583 297 208 1,444 1,011Oct-07 0.575 272 244 1,304 1,170Nov-07 0.578 393 290 1,892 1,398Dec-07 0.594 243 188 1,205 931Jan-08 0.583 238 252 1,156 1,225Feb-08 0.573 262 408 1,251 1,950Mar-08 0.570 290 333 1,379 1,583Apr-08 0.578 247 262 1,192 1,263
May-08 0.569 252 274 1,195 1,300Jun-08 0.613 242 194 1,236 1,350Jul-08 0.583 237 240 1,150 1,167
Aug-08 0.570 264 205 1,255 1,250AVERAGE 0.587 280 256 1,370 1,280MAXIMUM 1,892 1,950
As the solids layer, including grit, sludge, and screenings, builds up on the bottom of the ponds, the retention time
decreases and the effluent water quality is reduced. Over the past three years, sludge has been removed from
each aeration pond and transferred to the sludge drying beds. The WWTF has been operating with all four ponds
since July 25, 2008. An estimation of volume and weight of the sludge and cost for removal from the beds and
disposal is included in Section 8.8.
Nipomo Community Services District Southland WWTF Master Plan 8 of 86 January 2009
2.3 Inflow and Infiltration The potential impact from inflow and infiltration was investigated. Infiltration is the water entering a sewer system
and service connections from groundwater, through such means as defective pipes, pipe joints, connections, or
manhole walls. Infiltration does not include inflow and is relatively constant over a period of days, weeks, or even
months if high groundwater conditions persist near the sewer system. Inflow is the water discharged into a sewer
system and service connections from such sources as roof and foundation drains, manhole covers, cross
connections from storm sewers, and catch basins. Inflow does not include infiltration. Inflow varies rapidly with
rainfall conditions, with flows rising and falling within minutes or hours of a severe storm event with significant
runoff.
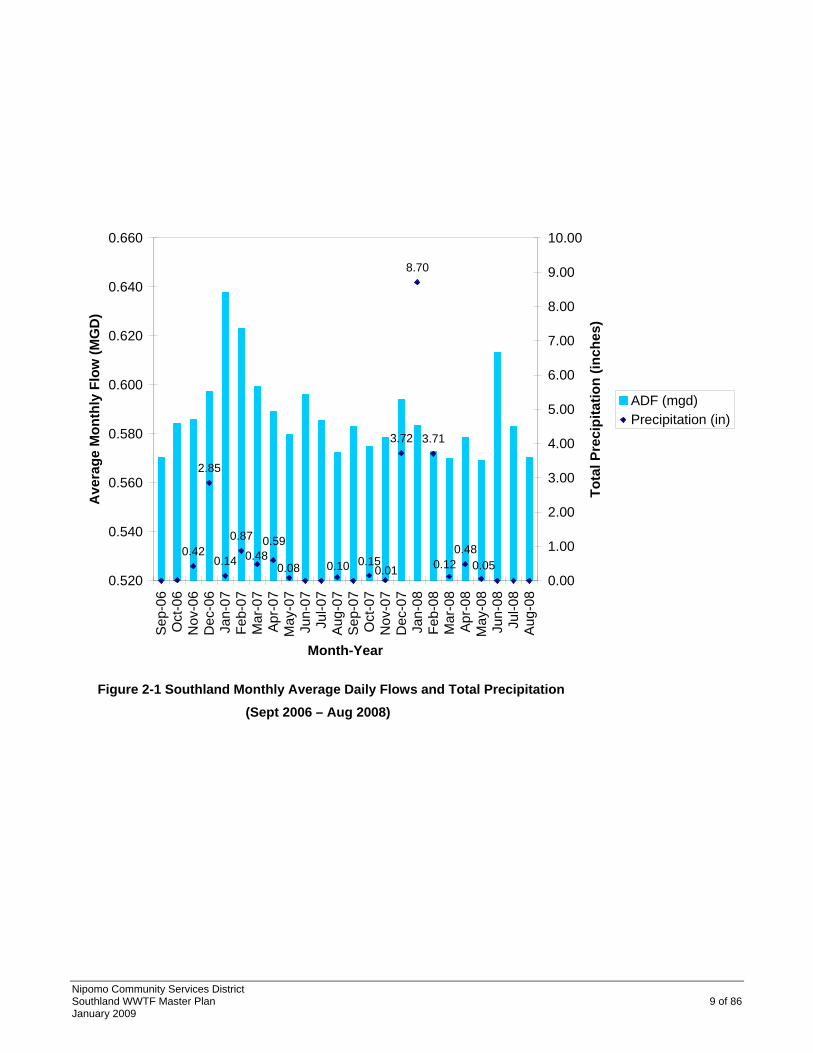
Figure 2-1 compares the total precipitation, as measured by San Luis Obispo County at the WWTF, with the
average daily flow for each month between September 2006 and August 2008. Typically, potential influence of
infiltration on treatment plant flow rates can be estimated by observing patterns in the total rainfall plotted with the
average daily flows for each month. Based on comparison of rainfall and monthly flows (Figure 2-1) it appears
infiltration is not significant.
The impact of inflow can be estimated by the difference between wet weather and dry weather peak daily flows.
Plant records indicate peak day flows during wet weather months are generally less than dry weather peak day
flows, suggesting that inflow is not a significant contribution to wastewater flow.
For these reasons, inflow/infiltration (I/I) is not considered significant in this capacity analysis. The annual
average flow (AAF), peak daily flow (PDF), and peak hourly flow (PHF) were used to analyze existing and future
capacity and it was assumed these peaks would occur during dry weather periods.
Nipomo Community Services District Southland WWTF Master Plan 9 of 86 January 2009
0.42
2.85
0.14
0.87
3.72
8.70
3.71
0.480.08 0.10 0.15
0.01 0.050.12
0.590.48
0.520
0.540
0.560
0.580
0.600
0.620
0.640
0.660
Sep
-06
Oct
-06
Nov
-06
Dec
-06
Jan-
07Fe
b-07
Mar
-07
Apr-
07M
ay-0
7Ju
n-07
Jul-0
7A
ug-0
7S
ep-0
7O
ct-0
7N
ov-0
7D
ec-0
7Ja
n-08
Feb-
08M
ar-0
8Ap
r-08
May
-08
Jun-
08Ju
l-08
Aug
-08
Month-Year
Ave
rage
Mon
thly
Flo
w (M
GD
)
0.00
1.00
2.00
3.00
4.00
5.00
6.00
7.00
8.00
9.00
10.00
Tota
l Pre
cipi
tatio
n (in
ches
)
ADF (mgd)Precipitation (in)
Figure 2-1 Southland Monthly Average Daily Flows and Total Precipitation (Sept 2006 – Aug 2008)
Nipomo Community Services District Southland WWTF Master Plan 10 of 86 January 2009
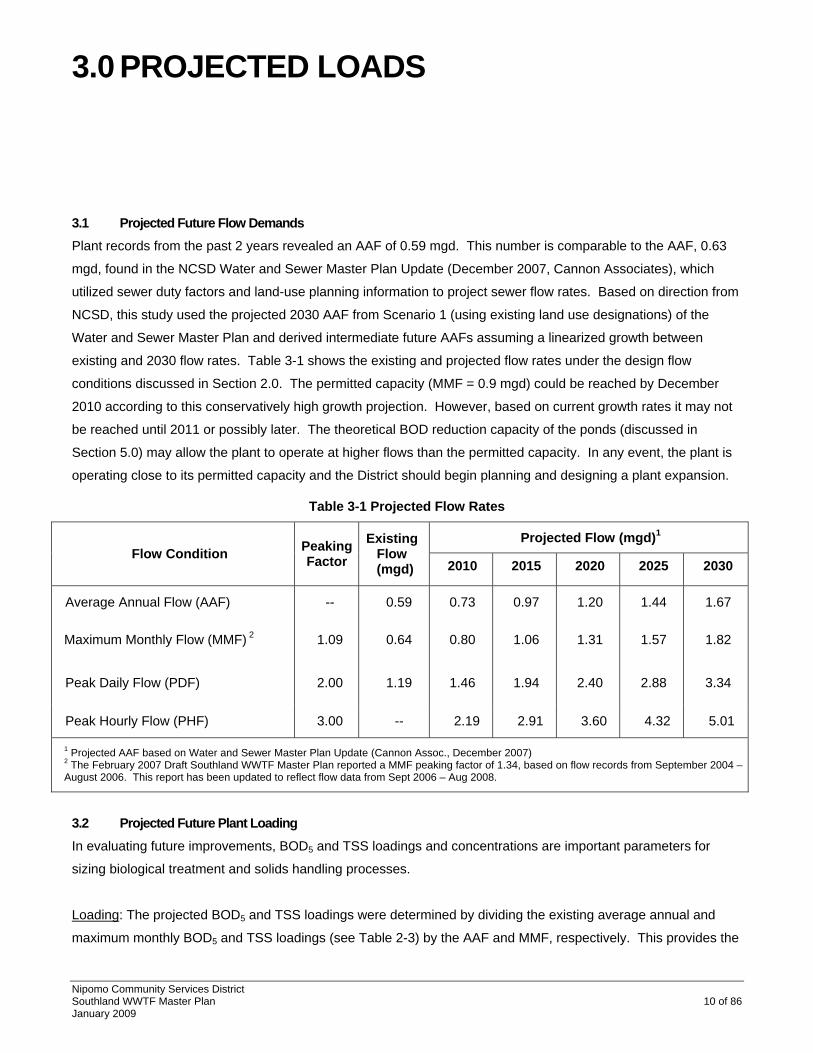
3.1 Projected Future Flow Demands Plant records from the past 2 years revealed an AAF of 0.59 mgd. This number is comparable to the AAF, 0.63
mgd, found in the NCSD Water and Sewer Master Plan Update (December 2007, Cannon Associates), which
utilized sewer duty factors and land-use planning information to project sewer flow rates. Based on direction from
NCSD, this study used the projected 2030 AAF from Scenario 1 (using existing land use designations) of the
Water and Sewer Master Plan and derived intermediate future AAFs assuming a linearized growth between
existing and 2030 flow rates. Table 3-1 shows the existing and projected flow rates under the design flow
conditions discussed in Section 2.0. The permitted capacity (MMF = 0.9 mgd) could be reached by December
2010 according to this conservatively high growth projection. However, based on current growth rates it may not
be reached until 2011 or possibly later. The theoretical BOD reduction capacity of the ponds (discussed in
Section 5.0) may allow the plant to operate at higher flows than the permitted capacity. In any event, the plant is
operating close to its permitted capacity and the District should begin planning and designing a plant expansion.
Table 3-1 Projected Flow Rates
Projected Flow (mgd)1 Flow Condition Peaking
Factor Existing
Flow (mgd) 2010 2015 2020 2025 2030
Average Annual Flow (AAF) -- 0.59 0.73 0.97 1.20 1.44 1.67
Maximum Monthly Flow (MMF) 2 1.09 0.64 0.80 1.06 1.31 1.57 1.82
Peak Daily Flow (PDF) 2.00 1.19 1.46 1.94 2.40 2.88 3.34
Peak Hourly Flow (PHF) 3.00 -- 2.19 2.91 3.60 4.32 5.01
1 Projected AAF based on Water and Sewer Master Plan Update (Cannon Assoc., December 2007) 2 The February 2007 Draft Southland WWTF Master Plan reported a MMF peaking factor of 1.34, based on flow records from September 2004 – August 2006. This report has been updated to reflect flow data from Sept 2006 – Aug 2008.
3.2 Projected Future Plant Loading In evaluating future improvements, BOD5 and TSS loadings and concentrations are important parameters for
sizing biological treatment and solids handling processes.
Loading: The projected BOD5 and TSS loadings were determined by dividing the existing average annual and
maximum monthly BOD5 and TSS loadings (see Table 2-3) by the AAF and MMF, respectively. This provides the
3.0 PROJECTED LOADS
Nipomo Community Services District Southland WWTF Master Plan 11 of 86 January 2009
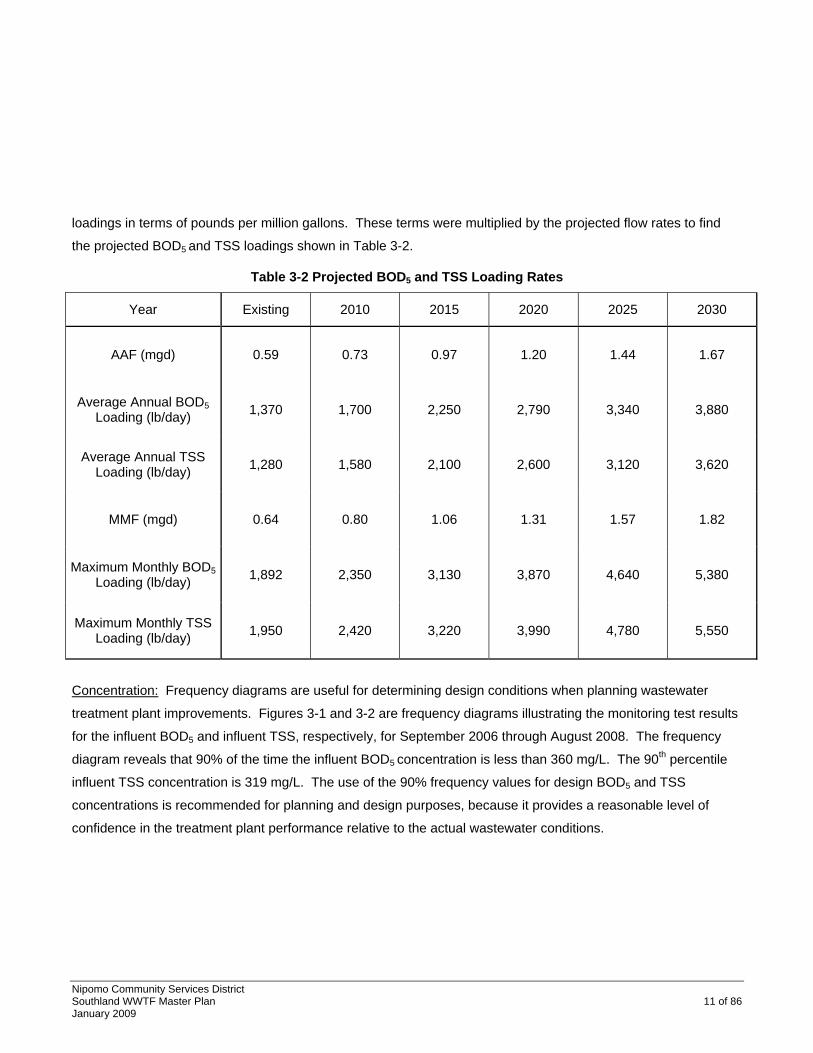
loadings in terms of pounds per million gallons. These terms were multiplied by the projected flow rates to find
the projected BOD5 and TSS loadings shown in Table 3-2.
Table 3-2 Projected BOD5 and TSS Loading Rates
Year Existing 2010 2015 2020 2025 2030
AAF (mgd) 0.59 0.73 0.97 1.20 1.44 1.67
Average Annual BOD5 Loading (lb/day) 1,370 1,700 2,250 2,790 3,340 3,880
Average Annual TSS Loading (lb/day) 1,280 1,580 2,100 2,600 3,120 3,620
MMF (mgd) 0.64 0.80 1.06 1.31 1.57 1.82
Maximum Monthly BOD5 Loading (lb/day) 1,892 2,350 3,130 3,870 4,640 5,380
Maximum Monthly TSS Loading (lb/day) 1,950 2,420 3,220 3,990 4,780 5,550
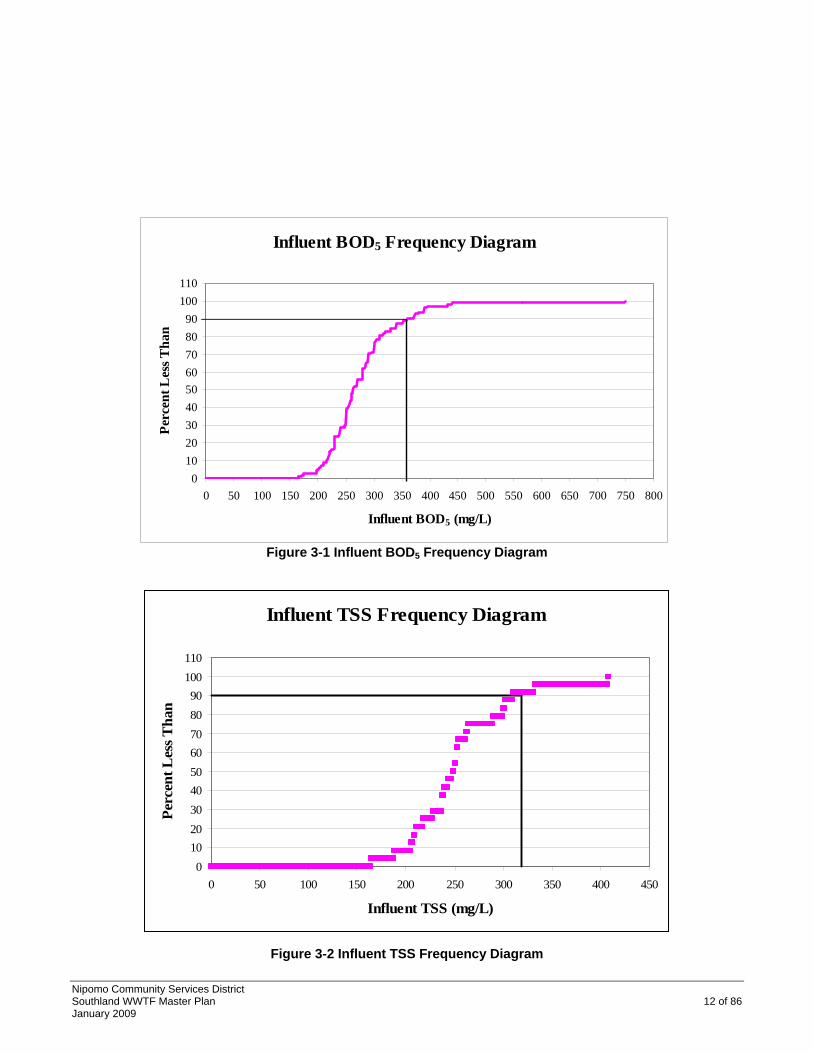
Concentration: Frequency diagrams are useful for determining design conditions when planning wastewater
treatment plant improvements. Figures 3-1 and 3-2 are frequency diagrams illustrating the monitoring test results
for the influent BOD5 and influent TSS, respectively, for September 2006 through August 2008. The frequency
diagram reveals that 90% of the time the influent BOD5 concentration is less than 360 mg/L. The 90th percentile
influent TSS concentration is 319 mg/L. The use of the 90% frequency values for design BOD5 and TSS
concentrations is recommended for planning and design purposes, because it provides a reasonable level of
confidence in the treatment plant performance relative to the actual wastewater conditions.
Nipomo Community Services District Southland WWTF Master Plan 12 of 86 January 2009
Figure 3-1 Influent BOD5 Frequency Diagram
Influent TSS Frequency Diagram
0102030405060708090
100110
0 50 100 150 200 250 300 350 400 450
Influent TSS (mg/L)
Perc
ent L
ess T
han
Figure 3-2 Influent TSS Frequency Diagram
Influent BOD5 Frequency Diagram
0102030405060708090
100110
0 50 100 150 200 250 300 350 400 450 500 550 600 650 700 750 800
Influent BOD5 (mg/L)
Perc
ent L
ess T
han

Nipomo Community Services District Southland WWTF Master Plan 13 of 86 January 2009
Future sludge production was estimated for a 5-year period at the projected 2030 AAF based on the 90th
percentile influent TSS concentration shown in the frequency diagram. Assuming a density of 15%,
approximately 2.6 million gallons of sludge is expected to accumulate over 5 years. This is equivalent to 20% of
the existing pond system volume. Calculations are included in Appendix B.
Nipomo Community Services District Southland WWTF Master Plan 14 of 86 January 2009
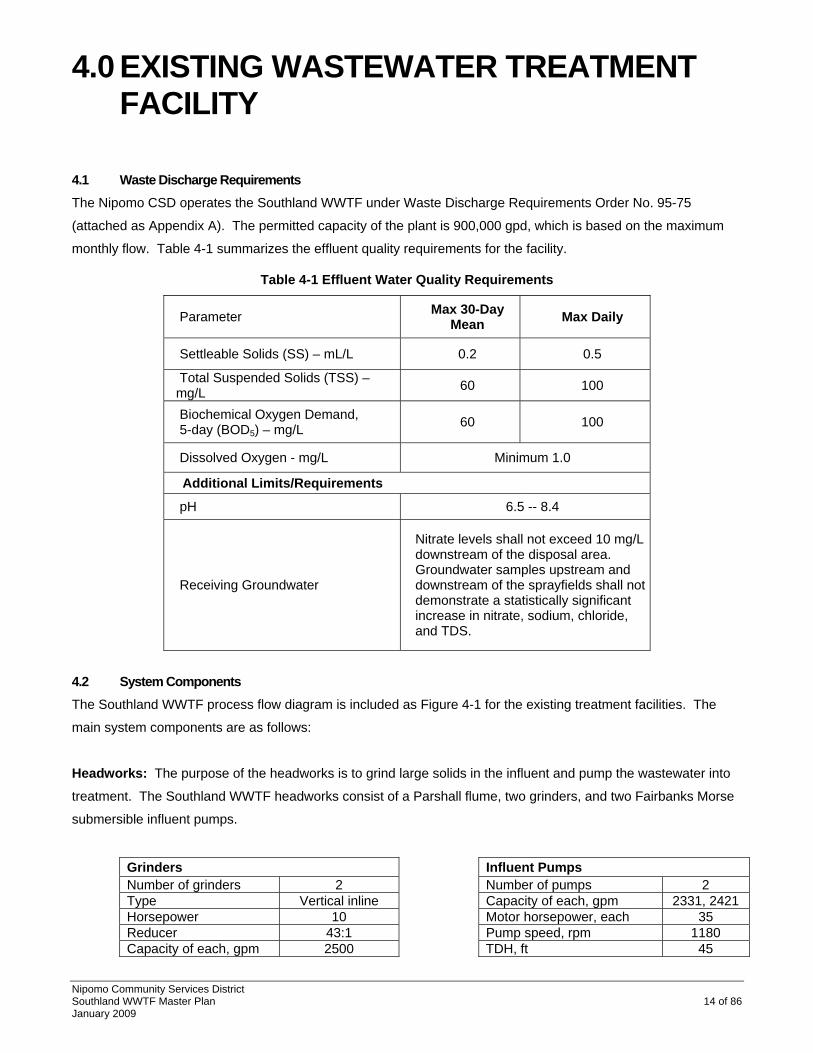
4.1 Waste Discharge Requirements The Nipomo CSD operates the Southland WWTF under Waste Discharge Requirements Order No. 95-75
(attached as Appendix A). The permitted capacity of the plant is 900,000 gpd, which is based on the maximum
monthly flow. Table 4-1 summarizes the effluent quality requirements for the facility.
Table 4-1 Effluent Water Quality Requirements
Parameter Max 30-Day Mean Max Daily
Settleable Solids (SS) – mL/L 0.2 0.5
Total Suspended Solids (TSS) – mg/L 60 100
Biochemical Oxygen Demand, 5-day (BOD5) – mg/L 60 100
Dissolved Oxygen - mg/L Minimum 1.0
Additional Limits/Requirements
pH 6.5 -- 8.4
Receiving Groundwater
Nitrate levels shall not exceed 10 mg/L downstream of the disposal area. Groundwater samples upstream and downstream of the sprayfields shall not demonstrate a statistically significant increase in nitrate, sodium, chloride, and TDS.
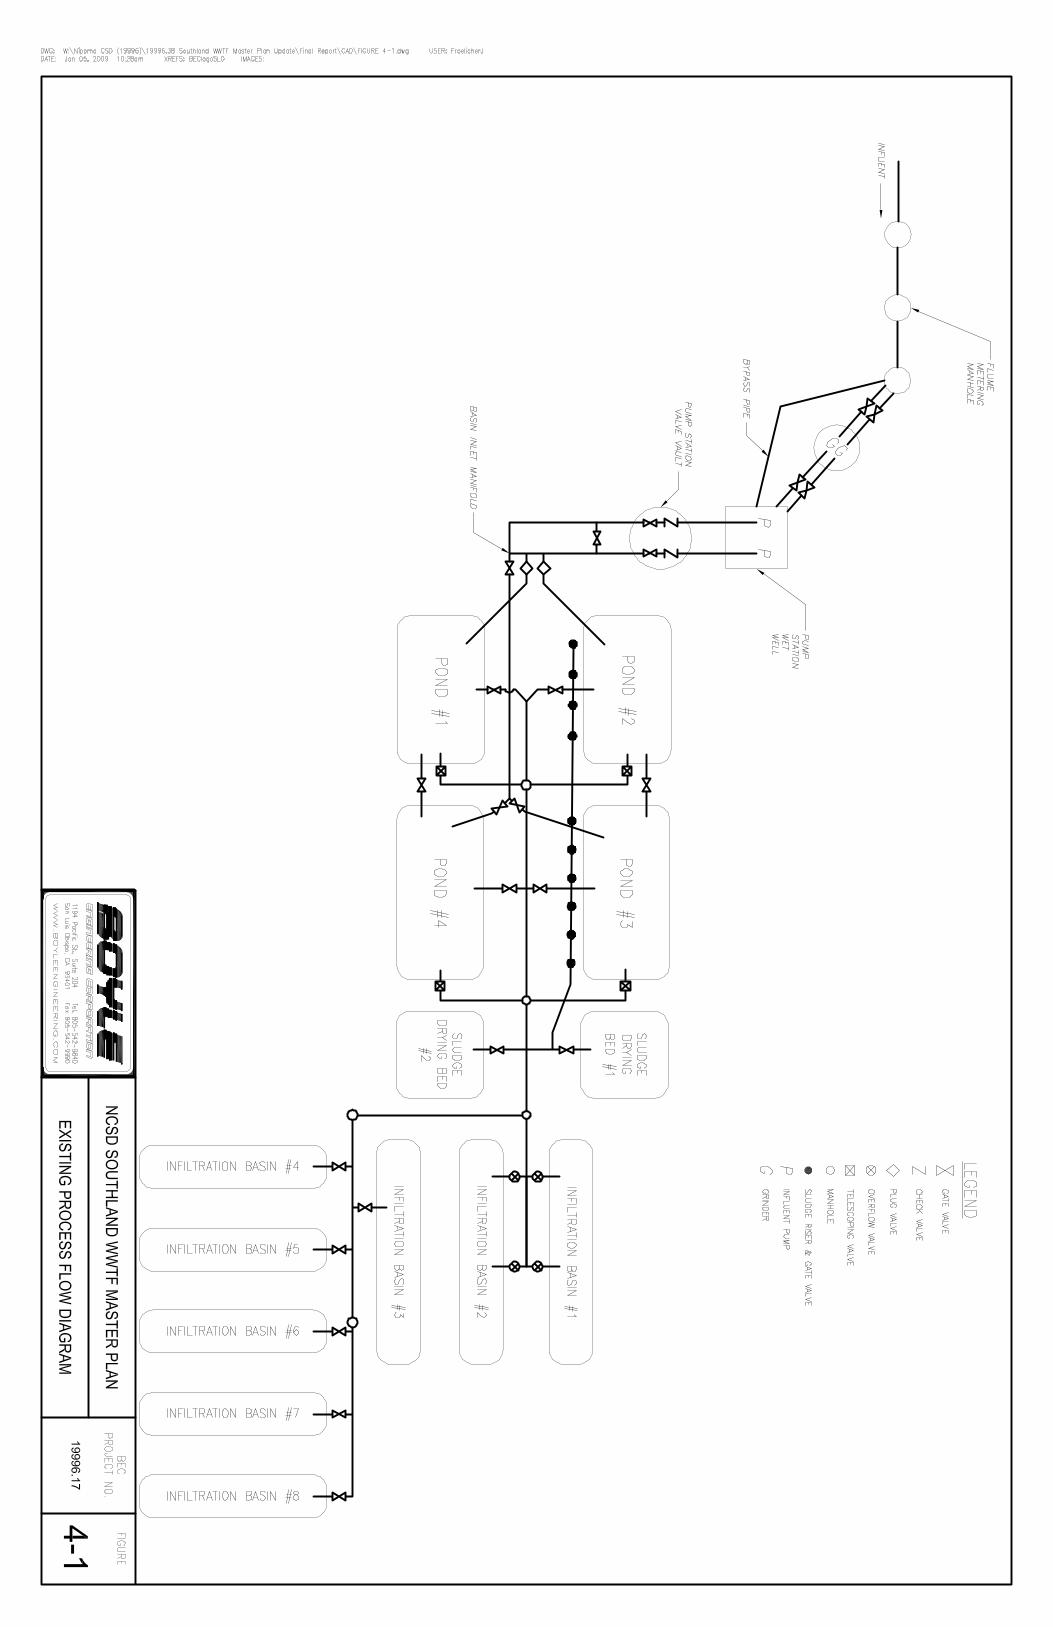
4.2 System Components The Southland WWTF process flow diagram is included as Figure 4-1 for the existing treatment facilities. The
main system components are as follows:
Headworks: The purpose of the headworks is to grind large solids in the influent and pump the wastewater into
treatment. The Southland WWTF headworks consist of a Parshall flume, two grinders, and two Fairbanks Morse
submersible influent pumps.
Grinders Influent Pumps Number of grinders 2 Number of pumps 2 Type Vertical inline Capacity of each, gpm 2331, 2421 Horsepower 10 Motor horsepower, each 35 Reducer 43:1 Pump speed, rpm 1180 Capacity of each, gpm 2500 TDH, ft 45
4.0 EXISTING WASTEWATER TREATMENT FACILITY
Nipomo Community Services District Southland WWTF Master Plan 15 of 86 January 2009
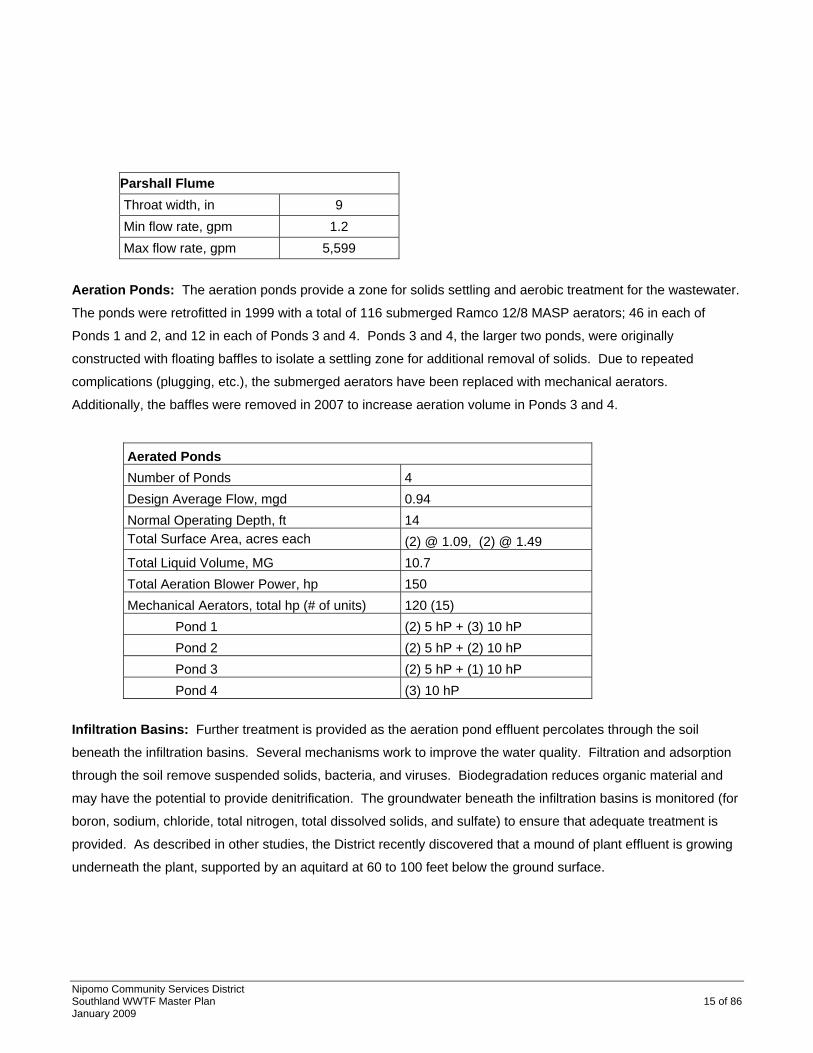
Parshall Flume Throat width, in 9 Min flow rate, gpm 1.2 Max flow rate, gpm 5,599
Aeration Ponds: The aeration ponds provide a zone for solids settling and aerobic treatment for the wastewater.
The ponds were retrofitted in 1999 with a total of 116 submerged Ramco 12/8 MASP aerators; 46 in each of
Ponds 1 and 2, and 12 in each of Ponds 3 and 4. Ponds 3 and 4, the larger two ponds, were originally
constructed with floating baffles to isolate a settling zone for additional removal of solids. Due to repeated
complications (plugging, etc.), the submerged aerators have been replaced with mechanical aerators.
Additionally, the baffles were removed in 2007 to increase aeration volume in Ponds 3 and 4.
Aerated Ponds Number of Ponds 4 Design Average Flow, mgd 0.94 Normal Operating Depth, ft 14 Total Surface Area, acres each (2) @ 1.09, (2) @ 1.49 Total Liquid Volume, MG 10.7 Total Aeration Blower Power, hp 150 Mechanical Aerators, total hp (# of units) 120 (15) Pond 1 (2) 5 hP + (3) 10 hP Pond 2 (2) 5 hP + (2) 10 hP Pond 3 (2) 5 hP + (1) 10 hP Pond 4 (3) 10 hP
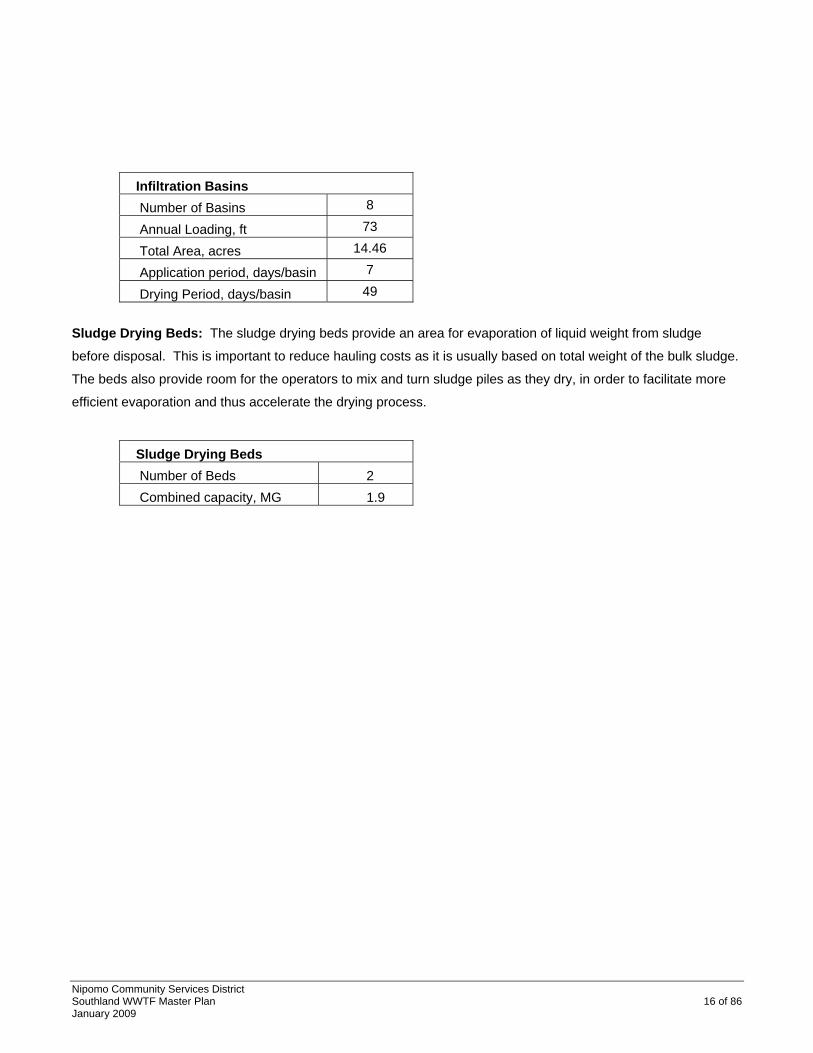
Infiltration Basins: Further treatment is provided as the aeration pond effluent percolates through the soil
beneath the infiltration basins. Several mechanisms work to improve the water quality. Filtration and adsorption
through the soil remove suspended solids, bacteria, and viruses. Biodegradation reduces organic material and
may have the potential to provide denitrification. The groundwater beneath the infiltration basins is monitored (for
boron, sodium, chloride, total nitrogen, total dissolved solids, and sulfate) to ensure that adequate treatment is
provided. As described in other studies, the District recently discovered that a mound of plant effluent is growing
underneath the plant, supported by an aquitard at 60 to 100 feet below the ground surface.
Nipomo Community Services District Southland WWTF Master Plan 16 of 86 January 2009
Infiltration Basins Number of Basins 8
Annual Loading, ft 73
Total Area, acres 14.46
Application period, days/basin 7
Drying Period, days/basin 49
Sludge Drying Beds: The sludge drying beds provide an area for evaporation of liquid weight from sludge
before disposal. This is important to reduce hauling costs as it is usually based on total weight of the bulk sludge.
The beds also provide room for the operators to mix and turn sludge piles as they dry, in order to facilitate more
efficient evaporation and thus accelerate the drying process.
Sludge Drying Beds Number of Beds 2 Combined capacity, MG 1.9


Nipomo Community Services District Southland WWTF Master Plan 18 of 86 January 2009
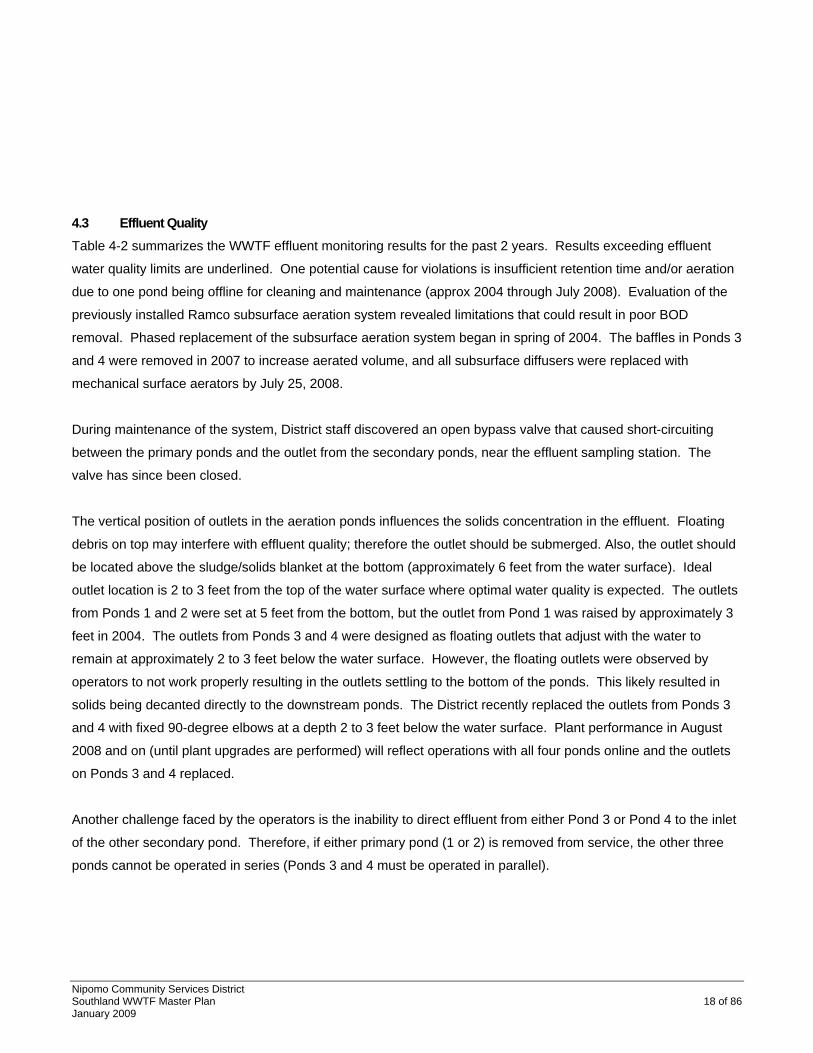
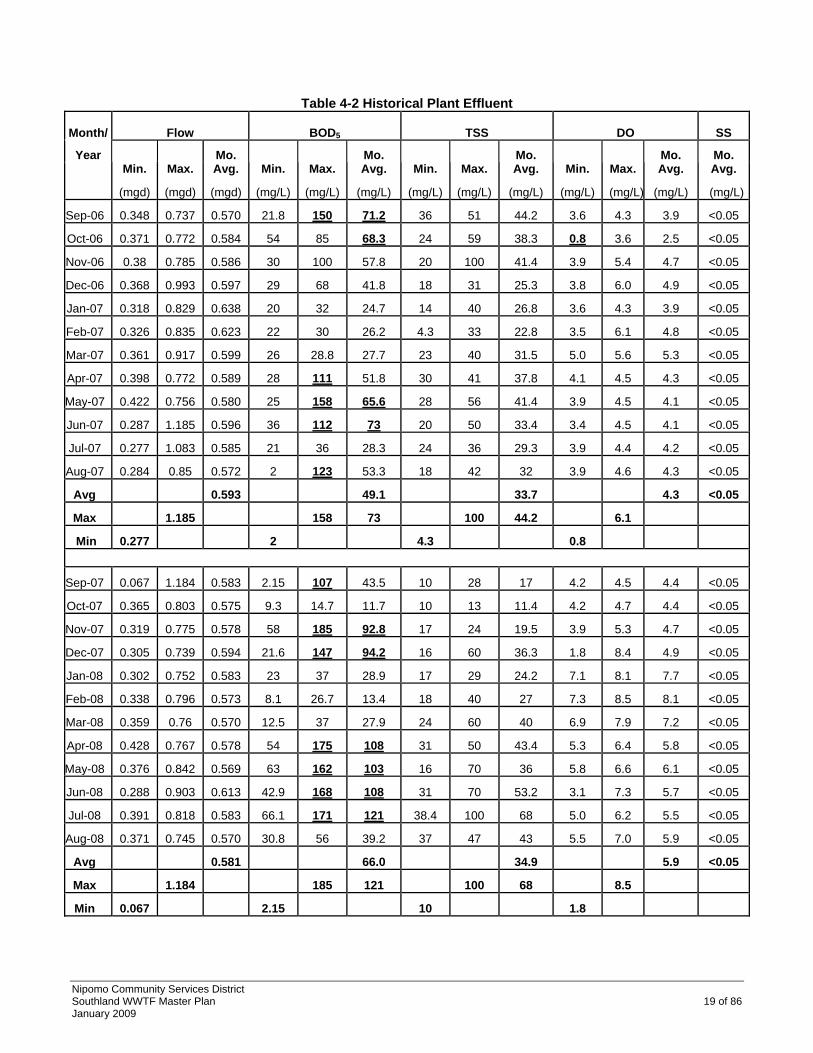
4.3 Effluent Quality Table 4-2 summarizes the WWTF effluent monitoring results for the past 2 years. Results exceeding effluent
water quality limits are underlined. One potential cause for violations is insufficient retention time and/or aeration
due to one pond being offline for cleaning and maintenance (approx 2004 through July 2008). Evaluation of the
previously installed Ramco subsurface aeration system revealed limitations that could result in poor BOD
removal. Phased replacement of the subsurface aeration system began in spring of 2004. The baffles in Ponds 3
and 4 were removed in 2007 to increase aerated volume, and all subsurface diffusers were replaced with
mechanical surface aerators by July 25, 2008.
During maintenance of the system, District staff discovered an open bypass valve that caused short-circuiting
between the primary ponds and the outlet from the secondary ponds, near the effluent sampling station. The
valve has since been closed.
The vertical position of outlets in the aeration ponds influences the solids concentration in the effluent. Floating
debris on top may interfere with effluent quality; therefore the outlet should be submerged. Also, the outlet should
be located above the sludge/solids blanket at the bottom (approximately 6 feet from the water surface). Ideal
outlet location is 2 to 3 feet from the top of the water surface where optimal water quality is expected. The outlets
from Ponds 1 and 2 were set at 5 feet from the bottom, but the outlet from Pond 1 was raised by approximately 3
feet in 2004. The outlets from Ponds 3 and 4 were designed as floating outlets that adjust with the water to
remain at approximately 2 to 3 feet below the water surface. However, the floating outlets were observed by
operators to not work properly resulting in the outlets settling to the bottom of the ponds. This likely resulted in
solids being decanted directly to the downstream ponds. The District recently replaced the outlets from Ponds 3
and 4 with fixed 90-degree elbows at a depth 2 to 3 feet below the water surface. Plant performance in August
2008 and on (until plant upgrades are performed) will reflect operations with all four ponds online and the outlets
on Ponds 3 and 4 replaced.
Another challenge faced by the operators is the inability to direct effluent from either Pond 3 or Pond 4 to the inlet
of the other secondary pond. Therefore, if either primary pond (1 or 2) is removed from service, the other three
ponds cannot be operated in series (Ponds 3 and 4 must be operated in parallel).
Nipomo Community Services District Southland WWTF Master Plan 19 of 86 January 2009
Table 4-2 Historical Plant Effluent
Month/ Flow BOD5 TSS DO SS
Year Min. Max.
Mo. Avg. Min. Max.
Mo. Avg. Min. Max.
Mo. Avg. Min. Max.
Mo. Avg.
Mo. Avg.
(mgd) (mgd) (mgd) (mg/L) (mg/L) (mg/L) (mg/L) (mg/L) (mg/L) (mg/L) (mg/L) (mg/L) (mg/L)
Sep-06 0.348 0.737 0.570 21.8 150 71.2 36 51 44.2 3.6 4.3 3.9 <0.05
Oct-06 0.371 0.772 0.584 54 85 68.3 24 59 38.3 0.8 3.6 2.5 <0.05
Nov-06 0.38 0.785 0.586 30 100 57.8 20 100 41.4 3.9 5.4 4.7 <0.05
Dec-06 0.368 0.993 0.597 29 68 41.8 18 31 25.3 3.8 6.0 4.9 <0.05
Jan-07 0.318 0.829 0.638 20 32 24.7 14 40 26.8 3.6 4.3 3.9 <0.05
Feb-07 0.326 0.835 0.623 22 30 26.2 4.3 33 22.8 3.5 6.1 4.8 <0.05
Mar-07 0.361 0.917 0.599 26 28.8 27.7 23 40 31.5 5.0 5.6 5.3 <0.05
Apr-07 0.398 0.772 0.589 28 111 51.8 30 41 37.8 4.1 4.5 4.3 <0.05
May-07 0.422 0.756 0.580 25 158 65.6 28 56 41.4 3.9 4.5 4.1 <0.05
Jun-07 0.287 1.185 0.596 36 112 73 20 50 33.4 3.4 4.5 4.1 <0.05
Jul-07 0.277 1.083 0.585 21 36 28.3 24 36 29.3 3.9 4.4 4.2 <0.05
Aug-07 0.284 0.85 0.572 2 123 53.3 18 42 32 3.9 4.6 4.3 <0.05
Avg 0.593 49.1 33.7 4.3 <0.05
Max 1.185 158 73 100 44.2 6.1
Min 0.277 2 4.3 0.8
Sep-07 0.067 1.184 0.583 2.15 107 43.5 10 28 17 4.2 4.5 4.4 <0.05
Oct-07 0.365 0.803 0.575 9.3 14.7 11.7 10 13 11.4 4.2 4.7 4.4 <0.05
Nov-07 0.319 0.775 0.578 58 185 92.8 17 24 19.5 3.9 5.3 4.7 <0.05
Dec-07 0.305 0.739 0.594 21.6 147 94.2 16 60 36.3 1.8 8.4 4.9 <0.05
Jan-08 0.302 0.752 0.583 23 37 28.9 17 29 24.2 7.1 8.1 7.7 <0.05
Feb-08 0.338 0.796 0.573 8.1 26.7 13.4 18 40 27 7.3 8.5 8.1 <0.05
Mar-08 0.359 0.76 0.570 12.5 37 27.9 24 60 40 6.9 7.9 7.2 <0.05
Apr-08 0.428 0.767 0.578 54 175 108 31 50 43.4 5.3 6.4 5.8 <0.05
May-08 0.376 0.842 0.569 63 162 103 16 70 36 5.8 6.6 6.1 <0.05
Jun-08 0.288 0.903 0.613 42.9 168 108 31 70 53.2 3.1 7.3 5.7 <0.05
Jul-08 0.391 0.818 0.583 66.1 171 121 38.4 100 68 5.0 6.2 5.5 <0.05
Aug-08 0.371 0.745 0.570 30.8 56 39.2 37 47 43 5.5 7.0 5.9 <0.05
Avg 0.581 66.0 34.9 5.9 <0.05
Max 1.184 185 121 100 68 8.5
Min 0.067 2.15 10 1.8
Nipomo Community Services District Southland WWTF Master Plan 20 of 86 January 2009
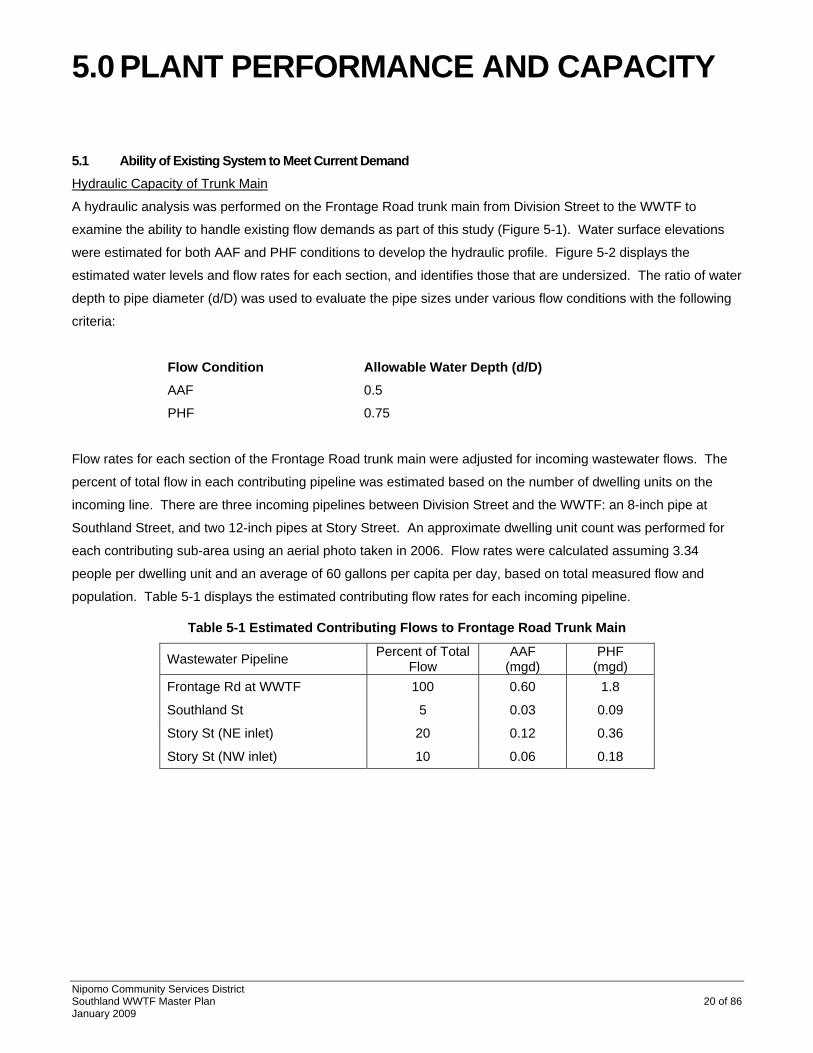
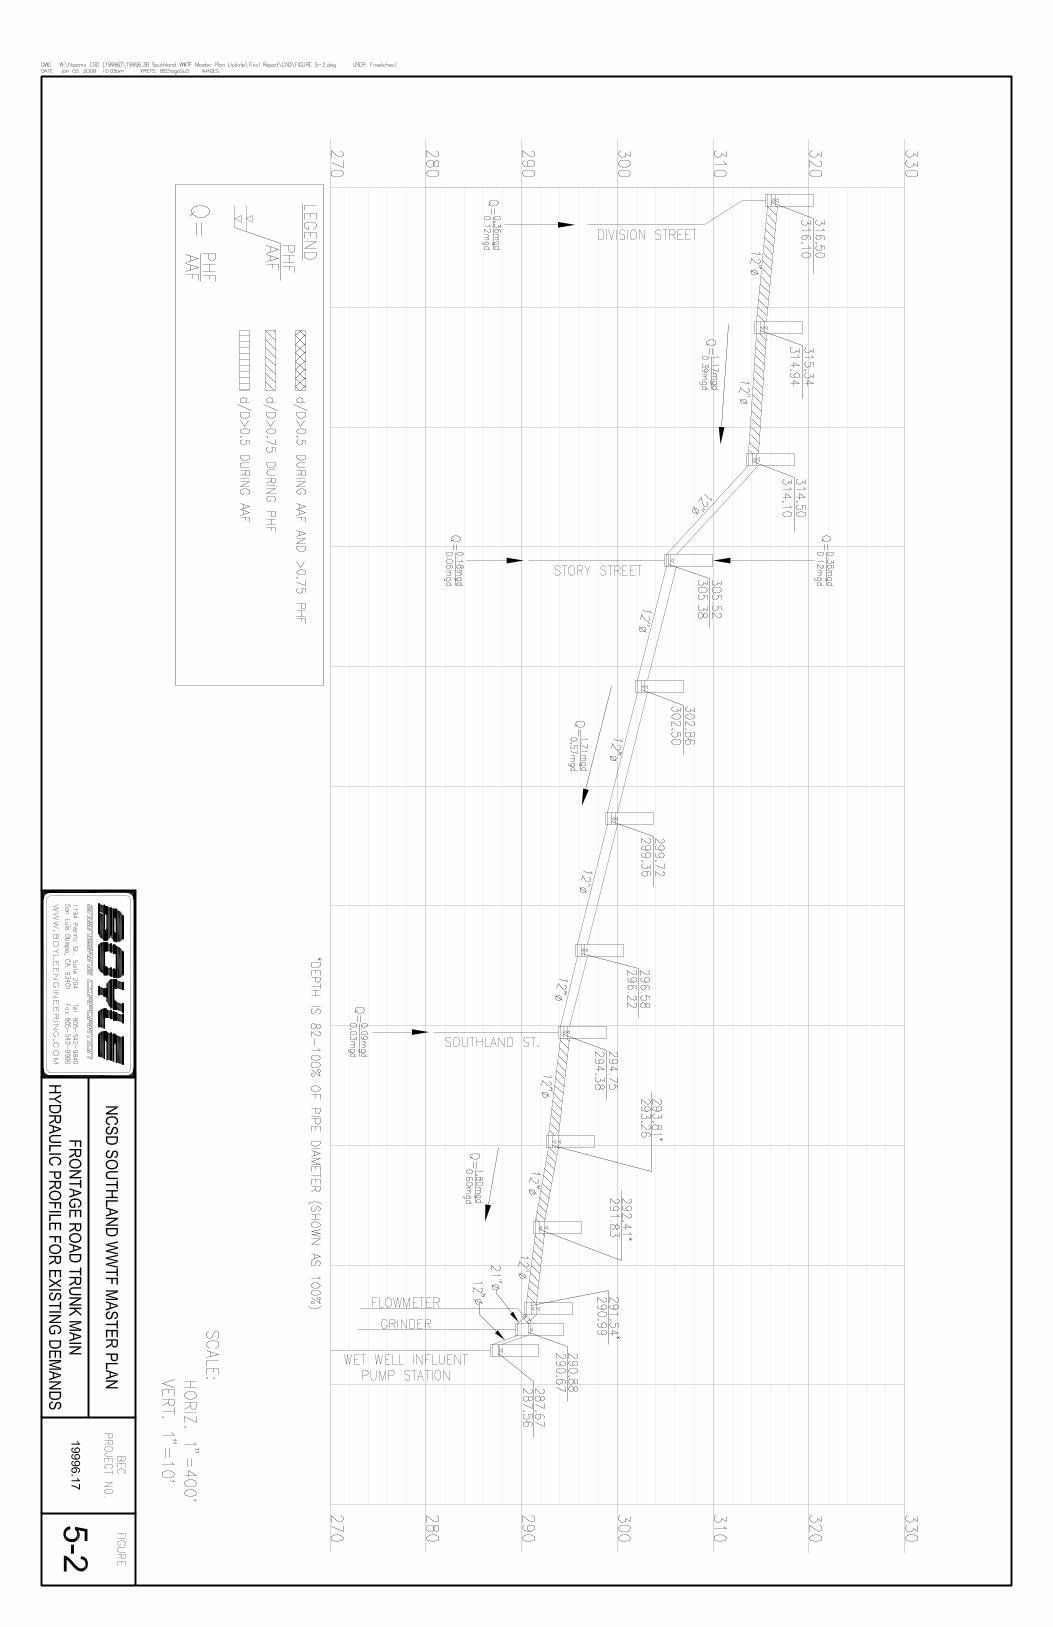
5.1 Ability of Existing System to Meet Current Demand Hydraulic Capacity of Trunk Main
A hydraulic analysis was performed on the Frontage Road trunk main from Division Street to the WWTF to
examine the ability to handle existing flow demands as part of this study (Figure 5-1). Water surface elevations
were estimated for both AAF and PHF conditions to develop the hydraulic profile. Figure 5-2 displays the
estimated water levels and flow rates for each section, and identifies those that are undersized. The ratio of water
depth to pipe diameter (d/D) was used to evaluate the pipe sizes under various flow conditions with the following
criteria:
Flow Condition Allowable Water Depth (d/D) AAF 0.5
PHF 0.75
Flow rates for each section of the Frontage Road trunk main were adjusted for incoming wastewater flows. The
percent of total flow in each contributing pipeline was estimated based on the number of dwelling units on the
incoming line. There are three incoming pipelines between Division Street and the WWTF: an 8-inch pipe at
Southland Street, and two 12-inch pipes at Story Street. An approximate dwelling unit count was performed for
each contributing sub-area using an aerial photo taken in 2006. Flow rates were calculated assuming 3.34
people per dwelling unit and an average of 60 gallons per capita per day, based on total measured flow and
population. Table 5-1 displays the estimated contributing flow rates for each incoming pipeline.
Table 5-1 Estimated Contributing Flows to Frontage Road Trunk Main
Wastewater Pipeline Percent of Total Flow
AAF (mgd)
PHF (mgd)
Frontage Rd at WWTF 100 0.60 1.8
Southland St 5 0.03 0.09
Story St (NE inlet) 20 0.12 0.36
Story St (NW inlet) 10 0.06 0.18
5.0 PLANT PERFORMANCE AND CAPACITY


Nipomo Community Services District Southland WWTF Master Plan 23 of 86 January 2009
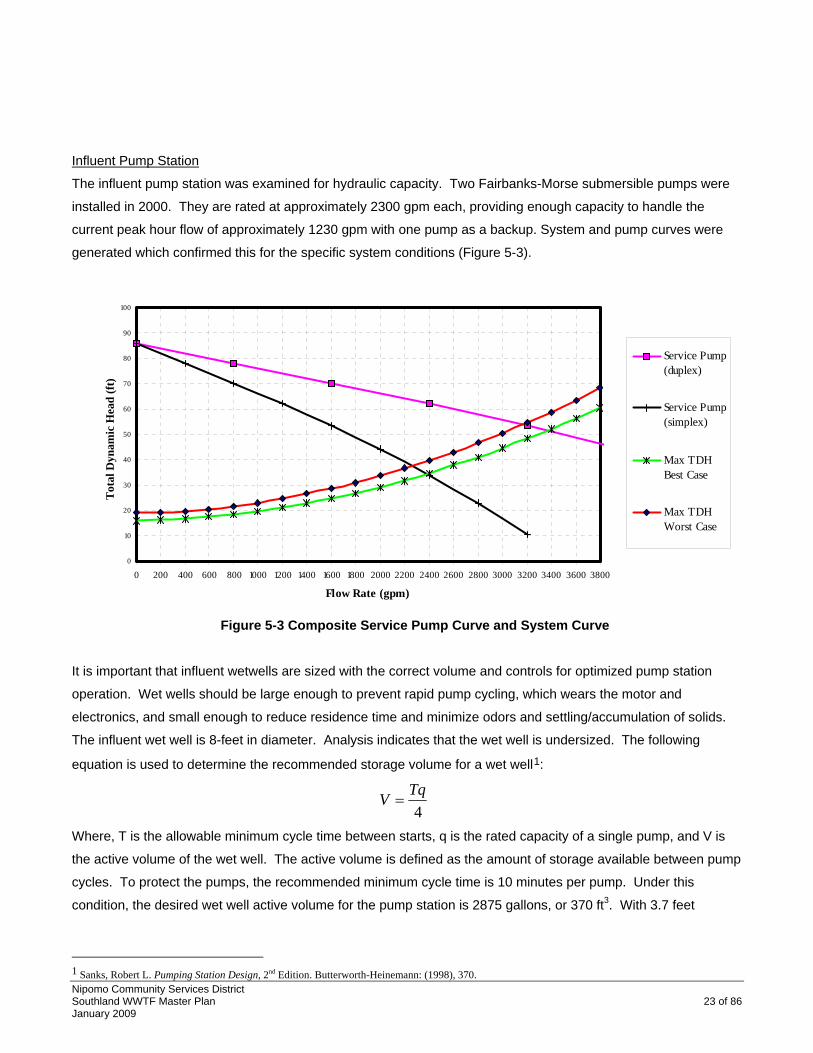
Influent Pump Station
The influent pump station was examined for hydraulic capacity. Two Fairbanks-Morse submersible pumps were
installed in 2000. They are rated at approximately 2300 gpm each, providing enough capacity to handle the
current peak hour flow of approximately 1230 gpm with one pump as a backup. System and pump curves were
generated which confirmed this for the specific system conditions (Figure 5-3).
0
10
20
30
40
50
60
70
80
90
100
0 200 400 600 800 1000 1200 1400 1600 1800 2000 2200 2400 2600 2800 3000 3200 3400 3600 3800
Flow Rate (gpm)
Tot
al D
ynam
ic H
ead
(ft)
Service Pump(duplex)
Service Pump(simplex)
Max TDHBest Case
Max TDHWorst Case
Figure 5-3 Composite Service Pump Curve and System Curve
It is important that influent wetwells are sized with the correct volume and controls for optimized pump station
operation. Wet wells should be large enough to prevent rapid pump cycling, which wears the motor and
electronics, and small enough to reduce residence time and minimize odors and settling/accumulation of solids.
The influent wet well is 8-feet in diameter. Analysis indicates that the wet well is undersized. The following
equation is used to determine the recommended storage volume for a wet well1:
4TqV =
Where, T is the allowable minimum cycle time between starts, q is the rated capacity of a single pump, and V is
the active volume of the wet well. The active volume is defined as the amount of storage available between pump
cycles. To protect the pumps, the recommended minimum cycle time is 10 minutes per pump. Under this
condition, the desired wet well active volume for the pump station is 2875 gallons, or 370 ft3. With 3.7 feet
1 Sanks, Robert L. Pumping Station Design, 2nd Edition. Butterworth-Heinemann: (1998), 370.
Nipomo Community Services District Southland WWTF Master Plan 24 of 86 January 2009
between the levels when the lead pump turns on and off, the current active volume is 186 ft3, half the volume
recommended for existing conditions.
Treatment Capacity
The ability to treat the current influent wastewater was evaluated using various historic flow and temperature
conditions. First-order rate kinetics were used to estimate BOD5 degradation in the aeration ponds. The analysis
showed that the current treatment system is able to handle existing conditions and treat incoming wastewater to
acceptable levels provided adequate aeration is accomplished and transfer of clarified effluent between the
primary ponds to the secondary ponds is withdrawn from proper level above sludge blanket and below pond
surface. The 90th percentile BOD5 (360 mg/L) was applied and the analyses were run under two assumed
configurations: four ponds in series and two ponds in series (two parallel flow trains). Both configurations were
examined under different combinations of temperature and flow conditions (summer and winter temperatures, and
high, low, and maximum month daily flow rates).
Analyses show the configuration using four ponds in series theoretically performs better than the series of two
ponds, providing a 92 – 96% reduction in BOD5 concentration (from 360 mg/L to 15 – 29 mg/L). The two ponds in
series configuration also shows the ability for adequate levels of treatment, providing effluent BOD5
concentrations between 30 and 48 mg/L, or an 87 – 92% reduction of BOD5. However, several other factors can
hinder the ponds’ capability to reduce BOD. Extended detention times can result in poorly settled sludge in the
final aeration steps. This sludge may be suspended in the ponds and may cause an increase in effluent BOD.
For this reason, we recommend using the parallel model to determine if the ponds provide sufficient retention time
as opposed to the ponds in series. The modeling cannot provide an accurate prediction of effluent BOD5
concentrations, but is useful in evaluating retention time and determining appropriate pond volumes. Table 5-2
summarizes the results of the analysis and indicates that sufficient retention time and pond volume are available
under existing conditions. Calculations are included in Appendix B.
Table 5-2 Modeled Effluent Quality under Existing Flow Conditions
Temperature (T) and Flow (Q) Conditions
Low T, Low Q High T, High Q High T, MMF
4 Ponds in Series [BOD5] (mg/L) 28 15 29
2 Parallel Trains of 2 Ponds [BOD5] (mg/L) 47 30 48
WDR Effluent BOD5 Limits: Daily = 100 mg/L; Monthly = 60 mg/L
Nipomo Community Services District Southland WWTF Master Plan 25 of 86 January 2009
5.2 Ability of Existing System to Meet Future Demand Frontage Road Trunk Main
The Frontage Road Trunk Main from Division Street to the WWTF was examined to determine the ability to
handle future flow demands. The water surface elevations were estimated using the projected AAF and PHF to
form the hydraulic profile, included as Figure 5-4. Flow rates were adjusted for incoming wastewater pipelines,
using the same method as previously discussed.
The same d/D criteria as for the existing hydraulic capacity analysis were used to identify undersized pipe. The
entire stretch of 12-inch pipeline examined was found to be undersized for both AAF and PHF, except one section
immediately above the Story Street intersection where the slope is 2.1%, nearly 3.5 times that of the next greatest
slope in the study reach. If the other pipes are replaced, it is recommended that this pipe be replaced as well.


Nipomo Community Services District Southland WWTF Master Plan 27 of 86 January 2009
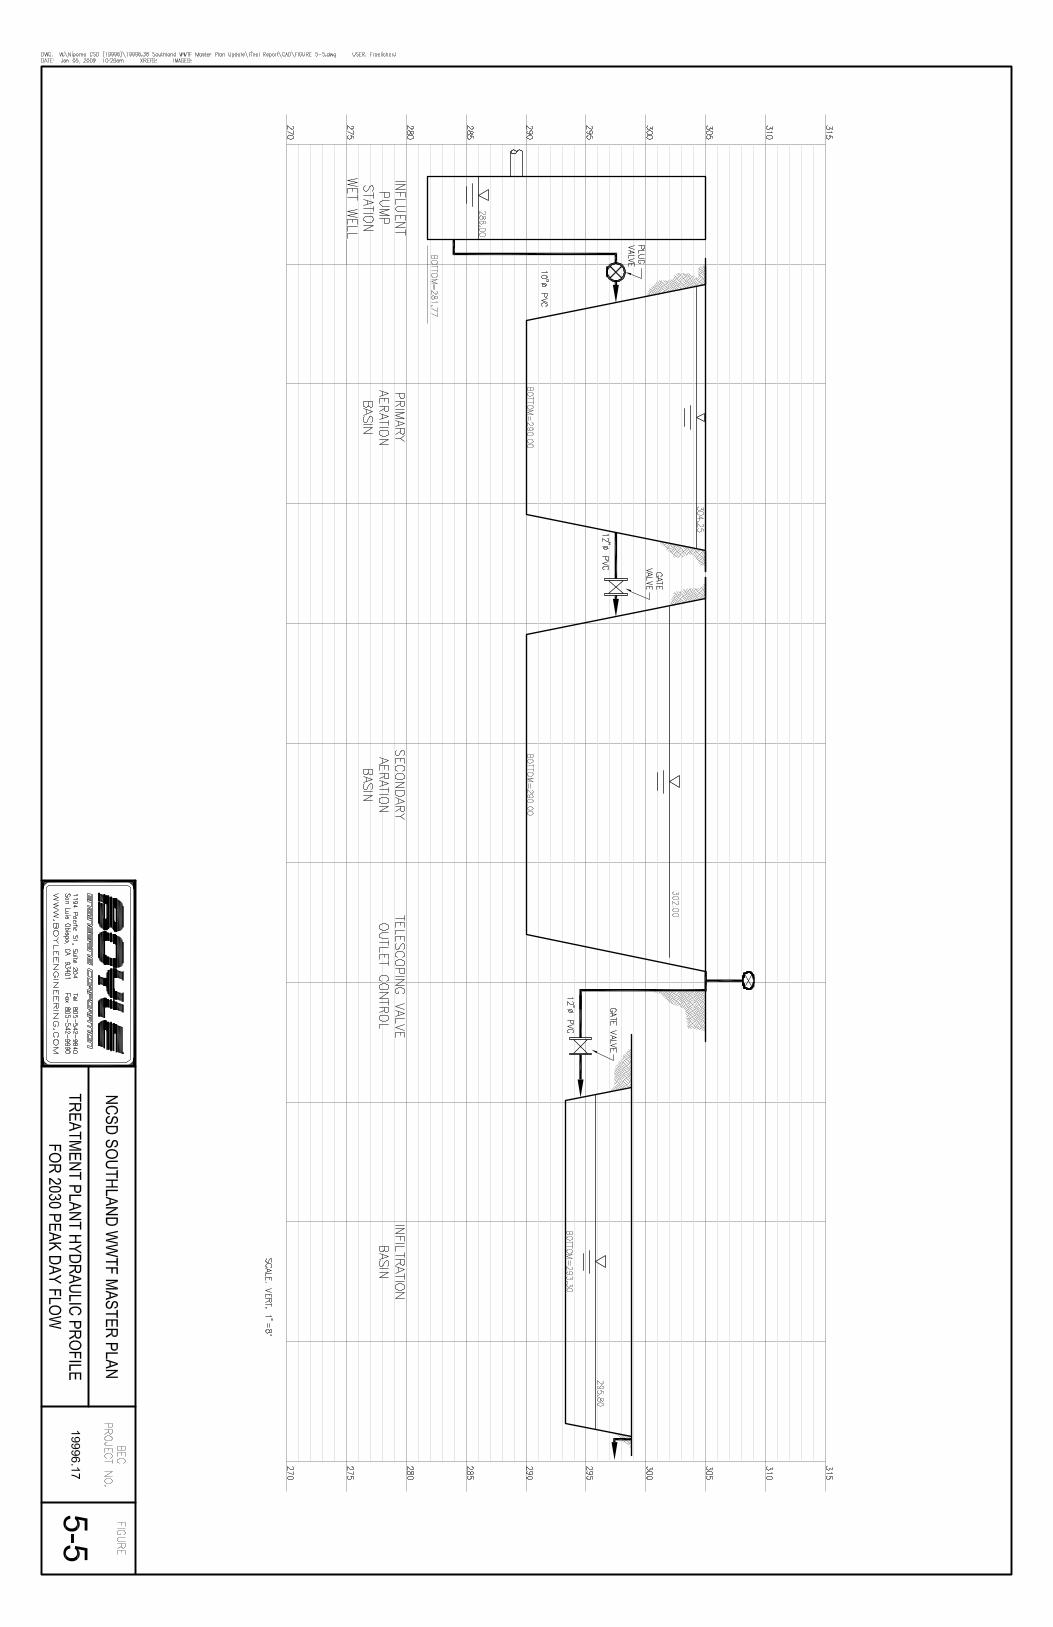
WWTF Hydraulic Capacity
Available record drawings were used to develop a hydraulic grade line through the wastewater treatment facility
for future peak day flow. Overflow weirs and outlet control devices dictate the water levels in the secondary
ponds. A hydraulic analysis was performed through the pipes and valves connecting the primary to the
secondary ponds to determine the water levels in the primary ponds. Hydraulically, the current pond system has
sufficient capacity to meet future flow demands. Treatment capacity is addressed in the subsequent section.
Figure 5-5 displays the hydraulic grade line through the treatment facility.
Influent Pump Station
The influent pump station was analyzed for future capacity. Based on the pump and system curves, included as
Figure 5-3 above, the pumps are undersized to handle the year 2030 PHF of 3500 gpm. The duplex pump curve
indicates that the two existing pumps pumping together will be capable of delivering the flow. However, an
upgrade is required to maintain 100% redundancy in the future.
Since the desired wet well volume is dependent on pump capacity, the wet well volume should be increased when
the pumps are replaced with larger pumps. Assuming two 3500-gpm pumps are installed to meet PHF, the future
required active wet well volume should be 585 ft3 to maintain a 10-minute cycle time per pump during PHF. It
should be noted that the analysis is based on the existing system. If changes are made to the headworks the
analysis will need to be revisited to properly size influent pumps and wet well. The addition of screening and grit
removal systems will add to system head loss, potentially requiring additional pump capacity.
Treatment Capacity
The ability of the existing system to treat future wastewater flow was evaluated using projected hydraulic
demands for applicable 2030 flow rates (PDF, AAF, and MMF), the 90th percentile BOD5 concentration (360
mg/L), and two boundary temperature conditions (summer and winter). Two configurations were examined: four
ponds in series, and two parallel trains with two ponds in each train. First-order rate kinetics were applied to
predict BOD5 degradation. Table 5-3 summarizes the results of the analysis. Neither configuration appears to
provide sufficient treatment under any boundary flow condition. Full calculations are included in Appendix B.
Nipomo Community Services District Southland WWTF Master Plan 28 of 86 January 2009
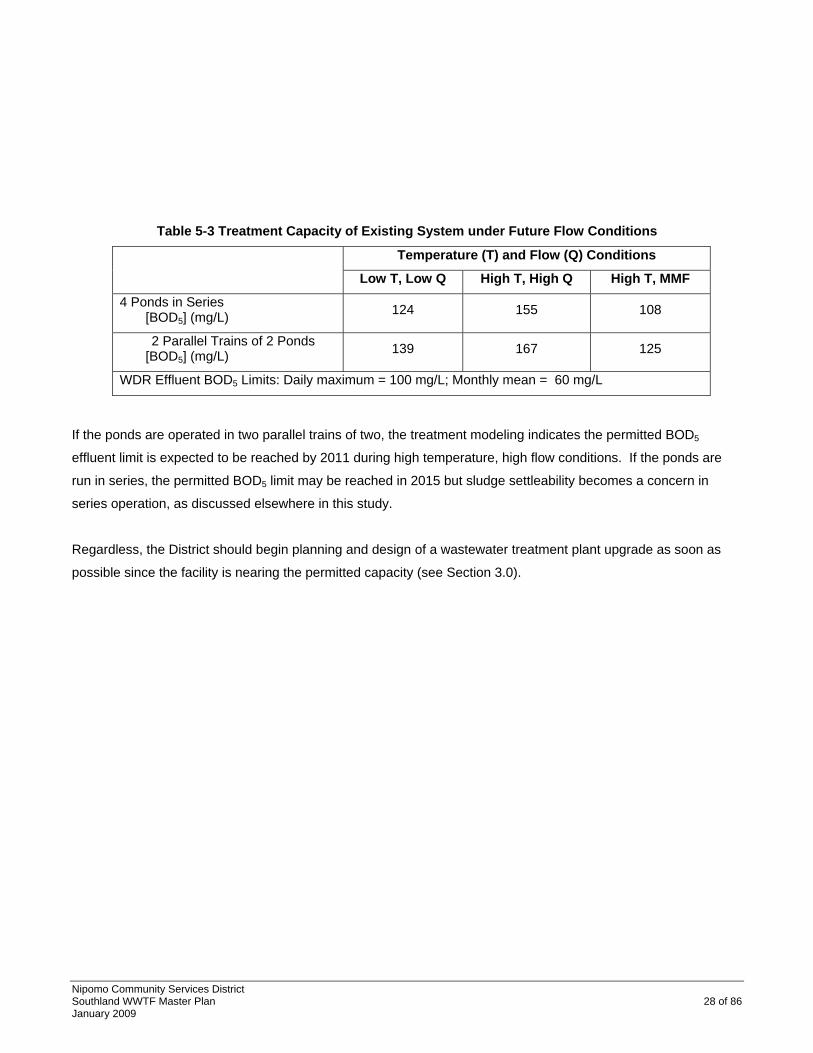
Table 5-3 Treatment Capacity of Existing System under Future Flow Conditions
Temperature (T) and Flow (Q) Conditions
Low T, Low Q High T, High Q High T, MMF
4 Ponds in Series [BOD5] (mg/L) 124 155 108
2 Parallel Trains of 2 Ponds [BOD5] (mg/L) 139 167 125
WDR Effluent BOD5 Limits: Daily maximum = 100 mg/L; Monthly mean = 60 mg/L
If the ponds are operated in two parallel trains of two, the treatment modeling indicates the permitted BOD5
effluent limit is expected to be reached by 2011 during high temperature, high flow conditions. If the ponds are
run in series, the permitted BOD5 limit may be reached in 2015 but sludge settleability becomes a concern in
series operation, as discussed elsewhere in this study.
Regardless, the District should begin planning and design of a wastewater treatment plant upgrade as soon as
possible since the facility is nearing the permitted capacity (see Section 3.0).

Nipomo Community Services District Southland WWTF Master Plan 30 of 86 January 2009
6.1 Recycled Water Usage Currently, the Southland Wastewater Treatment Facility (WWTF) discharges to eight infiltration basins and
eventually to groundwater. The selection of treatment processes, associated plant improvements, pumping
stations, pipelines, and storage facilities depend on the end user or final destination of the wastewater.
Depending on the usage option chosen, different regulatory requirements will be enforced; also, the WDRs will
need to be revised for recycled water use. The usage options considered in this section are as follows: 1)
Unrestricted Urban Usage, 2) Groundwater Recharge, and 3) Maintain Current Discharge Practices. Depending
on the usage option chosen, the WWTF may need to meet recycled wastewater regulations (i.e. California Code
of Regulations (CCR) Title 22).
Since this Master Plan was drafted the District has investigated future disposal and reuse options for treated
wastewater from Southland WWTF. AECOM recently completed the Preliminary Screening Evaluation of
Southland Wastewater Treatment Facility Disposal Alternatives (January 2009). In this report, several potential
disposal and reuse alternatives were evaluated. Groundwater recharge reuse was determined “fatally flawed”
based on regulatory restrictions and the cost to fulfill the requirements for diluent water. However, because of the
potential benefits and in case the District desires to pursue the option in the future, an evaluation of groundwater
recharge reuse is presented in Section 6.3 below.
6.2 Option 1 - Unrestricted Urban Reuse (Disinfected Tertiary Recycled Water) Regulatory Requirements
The California Code of Regulations (CCR) Title 22, Division 4, Chapter 3, Sections 60301 through 60355 are
used to regulate recycled wastewater and are administered jointly by California Department of Health Services
(CDPH) and RWQCB.
Disinfected tertiary recycled wastewater requires a level of treatment that meets the most stringent requirements
for all uses allowed under the Title 22 criteria. Potential users include farmlands, parks and playgrounds,
schoolyards, unrestricted access golf courses, roadway landscaping, and residential and commercial
landscaping. This study focuses on landscaping application for parks. Owners of these facilities, CDPH,
RWQCB, County, and possibly local authorities will be involved in wastewater reuse contracts and permitting.
The Waste Discharge Requirements for the WWTF would need to be revised to allow reuse of plant effluent for
unrestricted urban use. Disinfected tertiary treatment requires oxidation, coagulation2, filtration and disinfection.
These treatment stages will need to be added to the WWTP as part of the upgrades if this reuse option is
6.0 WATER QUALITY GOALS
Nipomo Community Services District Southland WWTF Master Plan 31 of 86 January 2009
pursued. According to Title 22 requirements, the median total coliform limit in reclaimed water is 2.2 MPN/100mL,
and the maximum total coliform standard is 23 MPN/100mL. The median total coliform number is determined
from samples of bacteria collected from the last 7-days of analysis. The maximum total coliform should not be
exceeded in one sample over 30 consecutive days.
Contracts with end users are typically required for guaranteeing a demand for treated wastewater. In addition,
facilities and appurtenances needed for recycling include transmission pipelines, pump stations, storage
reservoirs, and property or easements for locating these facilities.
Water Quality Objectives
Water quality objectives for unrestricted urban use are primarily driven by public safety and suitability for
application. Safety assurances are written into Title 22 requirements through standards for effluent coliform
concentrations and usage restrictions, such as pipeline distance from potable water pipelines, proximity to
groundwater, and restrictions near eating facilities and drinking fountains.
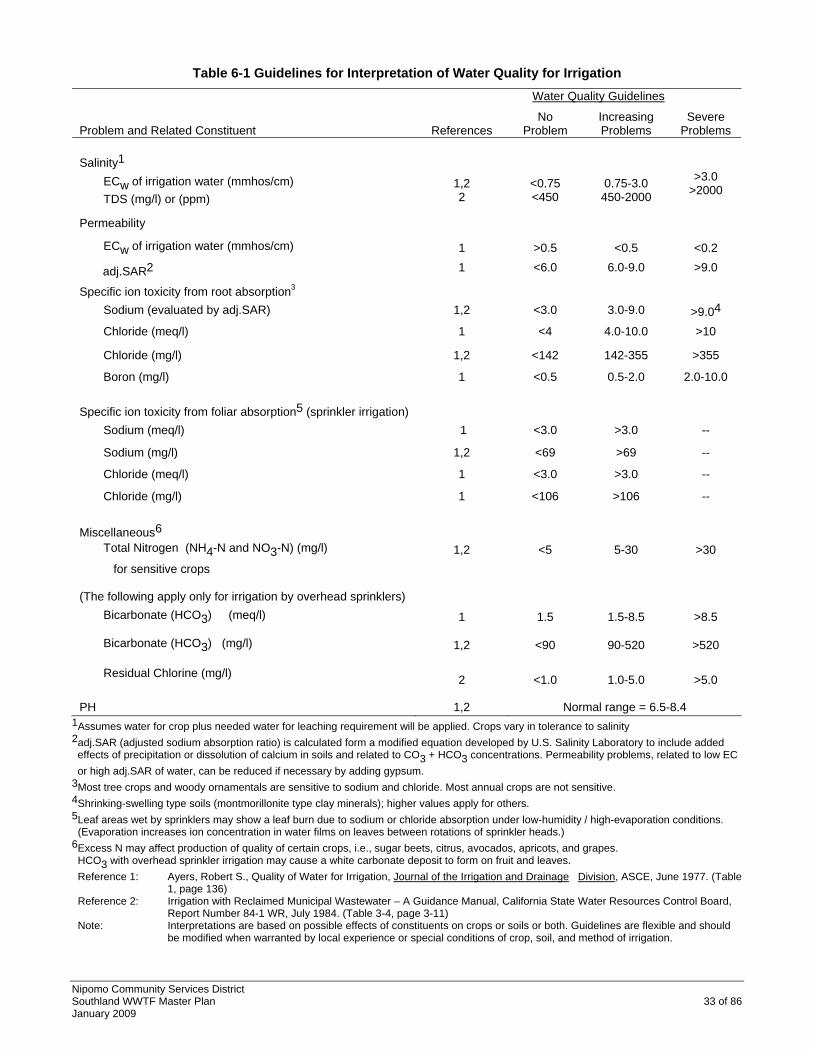
There have been multiple studies to determine constituents of concern in reclaimed water used for irrigation.
Suitability of water for irrigation is directly related to the concentration and kind of chemical constituents present.
The water constituents that may affect recycled water suitability for irrigation of grasses and ornamental plants
include electrical conductivity of the irrigation water (ECw), sodium adsorption ratio (SAR), bicarbonates,
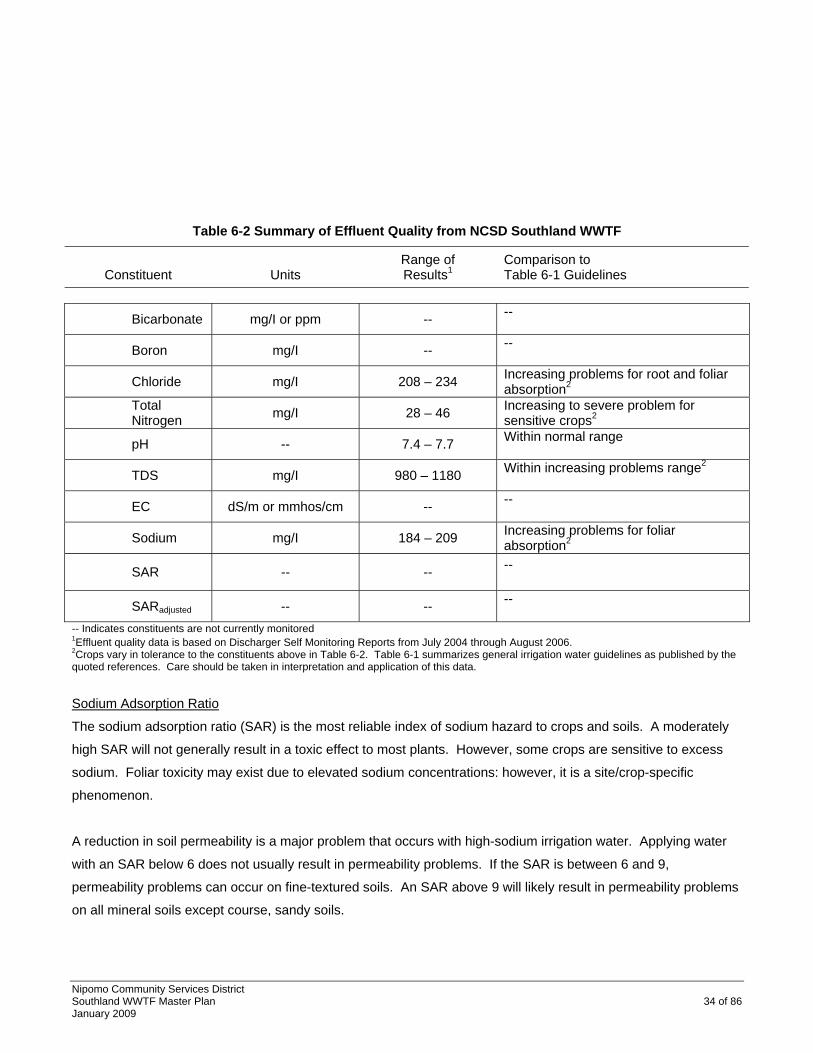
chlorides, and boron. General irrigation water quality guidelines are shown on Table 6-1. A summary of the
effluent3 (treated wastewater) quality from the Nipomo Southland Wastewater Treatment Facility (WWTF) is
presented in Table 6-2. Crop specific tolerance limits are presented in Table 6-3.
Electric Conductivity/TDS
Salinity can be indirectly measured by electrical conductivity. The units of conductance are typically decisiemens
per meter (dS/m), which is equivalent to millimhos per centimeter (mmhos/cm). Multiple devices and protocols
exist for the monitoring/measuring of electrical conductivity, including in-office and in-field measurements.
ECw is the electrical conductivity of the irrigation water. It is a measure of the total salt content of the irrigation
water and is used to quantify its salinity. Since the EC of the treatment plant effluent is not currently monitored,
no conclusions can be drawn as to the suitability of the effluent’s salinity for irrigation. If the effluent salinity
2 Coagulation is not typically required if membrane filtration is used and/or turbidity requirements are met.

Nipomo Community Services District Southland WWTF Master Plan 32 of 86 January 2009
(measured as EC) is within the water quality guidelines summarized in Table 6-1 for irrigation water salinity
(measured as ECw), there should be no EC associated effluent reuse restrictions. However, if the effluent salinity
tends toward the “Increasing Problems” or “Severe Problems” range, intensive irrigation management may be
required in order to control soil salinity levels. Adequate rainfall will assist the salt leaching process and help to
mitigate the accumulation of soluble salts in the soil profile.
3 Effluent is currently secondary
Nipomo Community Services District Southland WWTF Master Plan 33 of 86 January 2009
Table 6-1 Guidelines for Interpretation of Water Quality for Irrigation Water Quality Guidelines
Problem and Related Constituent
References
No Problem
Increasing Problems
Severe Problems
Salinity1
ECw of irrigation water (mmhos/cm) TDS (mg/l) or (ppm)
1,2 2
<0.75 <450
0.75-3.0 450-2000
>3.0 >2000
Permeability
ECw of irrigation water (mmhos/cm) 1 >0.5 <0.5 <0.2
adj.SAR2 1 <6.0 6.0-9.0 >9.0
Specific ion toxicity from root absorption3
Sodium (evaluated by adj.SAR) 1,2 <3.0 3.0-9.0 >9.04 Chloride (meq/l) 1 <4 4.0-10.0 >10
Chloride (mg/l) 1,2 <142 142-355 >355
Boron (mg/l) 1 <0.5 0.5-2.0 2.0-10.0
Specific ion toxicity from foliar absorption5 (sprinkler irrigation)
Sodium (meq/l) 1 <3.0 >3.0 --
Sodium (mg/l) 1,2 <69 >69 --
Chloride (meq/l) 1 <3.0 >3.0 --
Chloride (mg/l) 1 <106 >106 --
Miscellaneous6 Total Nitrogen (NH4-N and NO3-N) (mg/l) 1,2 <5 5-30 >30 for sensitive crops
(The following apply only for irrigation by overhead sprinklers)
Bicarbonate (HCO3) (meq/l) 1 1.5 1.5-8.5 >8.5
Bicarbonate (HCO3) (mg/l) 1,2 <90 90-520 >520
Residual Chlorine (mg/l) 2 <1.0 1.0-5.0 >5.0
PH 1,2 Normal range = 6.5-8.4 1Assumes water for crop plus needed water for leaching requirement will be applied. Crops vary in tolerance to salinity 2adj.SAR (adjusted sodium absorption ratio) is calculated form a modified equation developed by U.S. Salinity Laboratory to include added effects of precipitation or dissolution of calcium in soils and related to CO3 + HCO3 concentrations. Permeability problems, related to low EC or high adj.SAR of water, can be reduced if necessary by adding gypsum.
3Most tree crops and woody ornamentals are sensitive to sodium and chloride. Most annual crops are not sensitive. 4Shrinking-swelling type soils (montmorillonite type clay minerals); higher values apply for others. 5Leaf areas wet by sprinklers may show a leaf burn due to sodium or chloride absorption under low-humidity / high-evaporation conditions.
(Evaporation increases ion concentration in water films on leaves between rotations of sprinkler heads.) 6Excess N may affect production of quality of certain crops, i.e., sugar beets, citrus, avocados, apricots, and grapes. HCO3 with overhead sprinkler irrigation may cause a white carbonate deposit to form on fruit and leaves. Reference 1: Ayers, Robert S., Quality of Water for Irrigation, Journal of the Irrigation and Drainage Division, ASCE, June 1977. (Table
1, page 136) Reference 2: Irrigation with Reclaimed Municipal Wastewater – A Guidance Manual, California State Water Resources Control Board,
Report Number 84-1 WR, July 1984. (Table 3-4, page 3-11) Note: Interpretations are based on possible effects of constituents on crops or soils or both. Guidelines are flexible and should
be modified when warranted by local experience or special conditions of crop, soil, and method of irrigation.
Nipomo Community Services District Southland WWTF Master Plan 34 of 86 January 2009
Table 6-2 Summary of Effluent Quality from NCSD Southland WWTF
Constituent
Units
Range of Results1
Comparison to Table 6-1 Guidelines
Bicarbonate mg/I or ppm -- --
Boron mg/I -- --
Chloride mg/I 208 – 234 Increasing problems for root and foliar absorption2
Total Nitrogen mg/I 28 – 46 Increasing to severe problem for
sensitive crops2
pH -- 7.4 – 7.7 Within normal range
TDS mg/I 980 – 1180 Within increasing problems range2
EC dS/m or mmhos/cm -- --
Sodium mg/I 184 – 209 Increasing problems for foliar absorption2
SAR -- -- --
SARadjusted -- -- --
-- Indicates constituents are not currently monitored 1Effluent quality data is based on Discharger Self Monitoring Reports from July 2004 through August 2006. 2Crops vary in tolerance to the constituents above in Table 6-2. Table 6-1 summarizes general irrigation water guidelines as published by the quoted references. Care should be taken in interpretation and application of this data.
Sodium Adsorption Ratio
The sodium adsorption ratio (SAR) is the most reliable index of sodium hazard to crops and soils. A moderately
high SAR will not generally result in a toxic effect to most plants. However, some crops are sensitive to excess
sodium. Foliar toxicity may exist due to elevated sodium concentrations: however, it is a site/crop-specific
phenomenon.
A reduction in soil permeability is a major problem that occurs with high-sodium irrigation water. Applying water
with an SAR below 6 does not usually result in permeability problems. If the SAR is between 6 and 9,
permeability problems can occur on fine-textured soils. An SAR above 9 will likely result in permeability problems
on all mineral soils except course, sandy soils.
Nipomo Community Services District Southland WWTF Master Plan 35 of 86 January 2009
Bicarbonates and Adjusted Sodium Adsorption Ratio (SARadj)
Bicarbonates in irrigation water applied to the soil will precipitate calcium from the cation exchange complex as
relatively insoluble calcium carbonate. As exchangeable calcium is lost from the soil, the relative proportion of
sodium is increased with a corresponding increase in the sodium hazard (SAR). Bicarbonates in the irrigation
water contribute to the overall salinity, but, more importantly, they may result in a previously calcium-dominant soil
becoming sodium dominant by precipitating the exchangeable calcium, which, in turn, will reduce soil
permeability.
A measure of the bicarbonate hazard in irrigation water can be expressed as the adjusted SAR. See Table 6-1.
The adjusted SAR takes into account the concentration of bicarbonates in irrigation water in relation to their effect
on potential increases in soil SAR. When the adjusted SAR is less than 6, soil permeability problems generally do
not occur. If the adjusted SAR is between 6 to 9, permeability problems can occur on fine-textured soil. An
adjusted SAR above 9 will likely result in permeability problems in mineral soils except course, sandy soils, where
adverse impacts to soil permeability are not a major concern. Periodic soil treatment (i.e. deep ripping or disking)
or water treatment may be required to maintain favorable water infiltration characteristics in project soils.
Bicarbonates in irrigation water may also cause potential problems in micro-irrigation systems as a result of lime
precipitation, which can cause emitter plugging. These potential problems are accentuated in alkaline irrigation
water.
Chlorides
Chlorides are necessary for plant growth in relatively small amounts. However, high concentrations of chlorides
can inhibit growth and result in toxicity to foliage if applied by sprinkler irrigation. Chlorides in irrigation water are
toxic to some plant species. The tolerances of select herbaceous crops and ornamentals to chloride are shown
on Table 6-3. The chloride concentration of the treatment plant effluent (see Table 6-2) is within the range of
increasing problems for root and foliar absorption when compared to the guidelines in Table 6-1. If a sprinkler
wets the leaf areas, foliage toxicity (leaf burn) problems may also be apparent as a result of the effluent having a
slightly higher-than-desired chloride concentration level (Table 6-2).
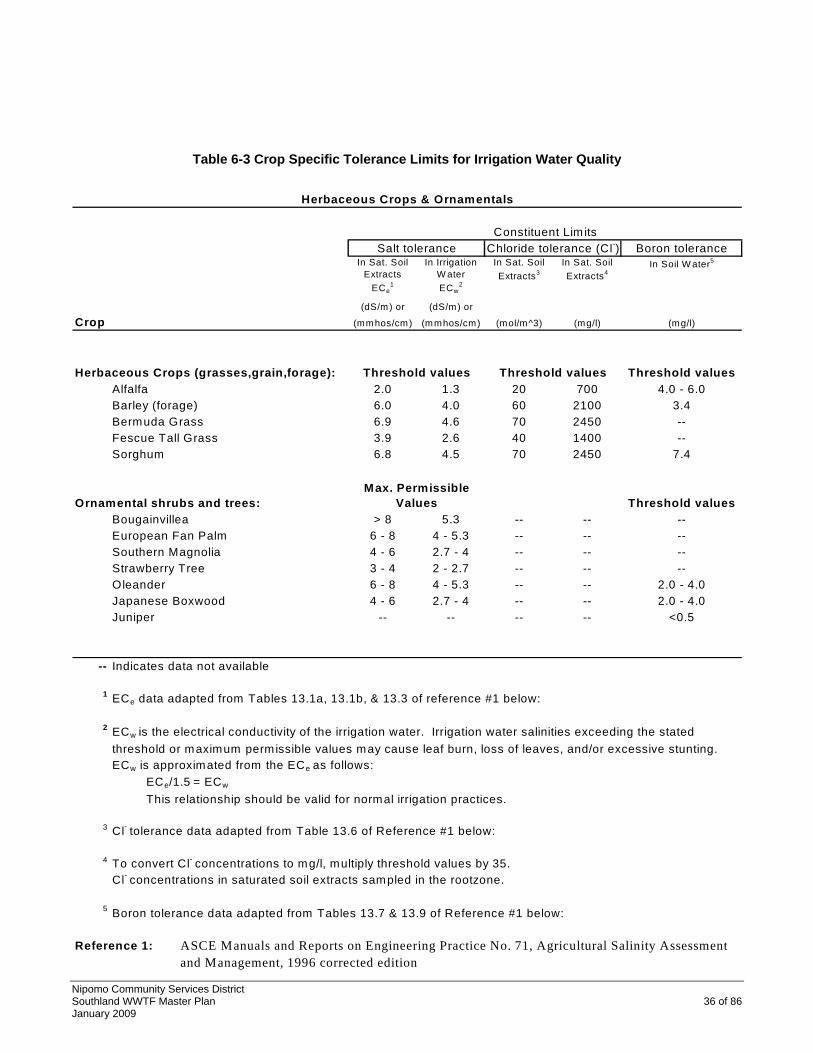
Nipomo Community Services District Southland WWTF Master Plan 36 of 86 January 2009
Table 6-3 Crop Specific Tolerance Limits for Irrigation Water Quality
Crop
Herbaceous Crops (grasses,grain,forage):AlfalfaBarley (forage)Bermuda GrassFescue Tall GrassSorghum
Ornamental shrubs and trees:BougainvilleaEuropean Fan PalmSouthern MagnoliaStrawberry TreeOleanderJapanese BoxwoodJuniper
-- Indicates data not available
1
2
ECe/1.5 = ECw
This relationship should be valid for normal irrigation practices.
3 Cl- tolerance data adapted from Table 13.6 of Reference #1 below:
4 To convert Cl- concentrations to mg/l, multiply threshold values by 35.Cl- concentrations in saturated soil extracts sampled in the rootzone.
5 Boron tolerance data adapted from Tables 13.7 & 13.9 of Reference #1 below:
Reference 1:
ECe data adapted from Tables 13.1a, 13.1b, & 13.3 of reference #1 below:
ECw is the electrical conductivity of the irrigation water. Irrigation water salinities exceeding the statedthreshold or maximum permissible values may cause leaf burn, loss of leaves, and/or excessive stunting.ECw is approximated from the ECe as follows:
4 - 6
Chloride tolerance (Cl-) Boron tolerance
(dS/m) or (dS/m) or
Herbaceous Crops & Ornamentals
7021004.0
6.9 4.66.0 3.4
70 2450 7.440 1400 --
2450 --60
> 8 5.3
2.66.8 4.53.9
Max. Permissible Values
6 - 8 4 - 5.34 - 6 2.7 - 43 - 4 2 - 2.76 - 8 4 - 5.3
2.0 1.3Threshold values
Salt toleranceConstituent Lim its
(mmhos/cm) (mmhos/cm)
In Sat. Soil Extracts
ECe1
In Irrigation W ater ECw
2
In Sat. Soil Extracts3
In Sat. Soil Extracts4
(mol/m^3)
-- -- <0.5
-- -- 2.0 - 4.0
ASCE Manuals and Reports on Engineering Practice No. 71, Agricultural Salinity Assessment
2.7 - 4-- --
-- -- 2.0 - 4.0
and Management, 1996 corrected edition
In Soil W ater5
(mg/l)
20 700 4.0 - 6.0Threshold values
(mg/l)
Threshold values
Threshold values-- -- ---- -- ---- -- ---- -- --
Nipomo Community Services District Southland WWTF Master Plan 37 of 86 January 2009
Boron
Boron in irrigation water does not have an effect on soil physical conditions, but in high concentrations it can have
a toxic effect on some plants. The tolerance of some crops to boron is shown in Table 6-3. As indicated in Table
6-2, boron is currently not monitored, as it is not a regulated contaminant in the treatment plant’s WDR.
Recommendations For Monitoring
In order to fully evaluate the suitability of the wastewater treatment plant effluent for unrestricted use in urban
applications, the following constituents/parameters should be monitored, recorded, and evaluated on a quarterly
or semiannual basis.
• Effluent Electrical conductivity (ECw) as previously discussed in this report
• SAR and SARadj to evaluate the water sodium hazard
• Boron to evaluate potential toxicity to plants
• Fecal coliform
This data is invaluable in fully understanding, evaluating, and identifying potential soil management and crop
production problems that can arise as a result of irrigating with the effluent in question.
6.3 Option 2 - Groundwater Recharge Reuse In August 2008, CDPH released a draft document to regulate groundwater recharge reuse projects (GRRP) called
the Groundwater Recharge Reuse Draft Regulations. This document proposed guidelines for maximum
percentage of recycled water, retention time, horizontal distance to extraction, and maximum contaminant levels
(MCLs). A GRRP is defined as “A project that uses recycled municipal wastewater … planned and operated for
the purpose of recharging a groundwater basin designated in the Water Quality Control Plan [defined in the Water
Code section 13050(j)] for use as a source of domestic water supply, and has been identified as a GRRP by the
RWQCB”. Though the regulations are still in draft form and the ultimately adopted criteria are unknown, the
document provides useful guidelines for potential groundwater recharge reuse projects. CDPH, RWQCB, local
agencies, and landowners will be involved if this usage option is pursued.
The general requirements of the draft regulations indicate that for each GRRP the wastewater management
agency shall administer an industrial pretreatment and pollutant source control program. Contaminants for the
program will be specified by CDPH based on a review of an engineering report (discussed below) and other
available data. The source control program shall include:
Nipomo Community Services District Southland WWTF Master Plan 38 of 86 January 2009
1) An assessment of the fate of specified contaminants,
2) A source investigation and monitoring program focused on specified contaminants,
3) An outreach program to the public within service area to manage and minimize discharge of compounds
of concern, and
4) A program for maintaining an inventory of compounds discharged into the wastewater collection system.
Upon proposal of a GRRP an engineering report is required for CDPH and RWQCB that includes a
comprehensive investigation and evaluation of the GRRP, characterization of the recycled and diluent water
quality, evaluation of the impacts on the existing potential uses of the impacted groundwater basin, the proposed
means for achieving compliance, and an operations plan. Prior to the operation of a new GRRP, an approved
plan shall be in place for providing an alternative source of domestic water supply or an approved treatment if
drinking water sources are determined to be unsafe as a result of the GRRP. CDPH will conduct public hearings
for the proposed GRRP prior to making recommendations to the RWQCB regarding permitting.
Recycled water used for groundwater recharge reuse projects must meet the definition of filtered, disinfected
tertiary wastewater as defined by CDPH. The median and maximum total coliform limits are the same as for the
disinfected tertiary wastewater for unrestricted urban use. Filtration will be required to meet turbidity
requirements. The recycled municipal wastewater must be retained underground for a minimum of six months
prior to extraction for use as a drinking water supply. Methods for demonstrating retention time are outlined in the
regulations.
All GRRP must dilute the recycled water to be used as recharge with an approved source of water. The water
source must be a potable source of water and cannot contain treated municipal wastewater. The ratio of recycled
water to diluent water is regulated through a value termed the “recycled water contribution” (RWC). The RWC is
calculated each month using a running monthly average (RMA), which is based on the total volume of recycled
municipal wastewater and diluent water for the preceding 60 calendar months. The average RWC shall not
exceed the maximum RWC specified by CDPH. The initial maximum RWC will be based on the CDPH review of
the engineering report (Section 60320.080), but cannot exceed 0.50 for subsurface application, or 0.20 for surface
applications, unless the GRRP provides reverse osmosis and advanced oxidation treatment meeting CDPH
requirements. It is possible to increase the maximum RWC with approval from CDPH and RWQCB.
Requirements for such approval are outlined in the Draft Regulations.
Total organic carbon (TOC) is monitored in the filtered wastewater or in the recycled municipal wastewater. For
filtered wastewater, 24-hour composite samples are to be collected twice per week, unless subsequently treated

Nipomo Community Services District Southland WWTF Master Plan 39 of 86 January 2009
by reverse osmosis. TOC is not to exceed 16 mg/L based on two consecutive samples and the average of the
last four results. For recycled municipal wastewater, 24-hour composite samples are to be collected once per
week and the TOC is not to exceed 0.5 mg/L divided by the CDPH-specified RWC based on two consecutive
samples and the average of the last four results. Limits may be increased after 10 years with approval of CDPH.
The basis for approval is outlined in the Draft Regulations.
Three methods are available to demonstrate the control of organic and inorganic nitrogen compounds. Table 6-4
details each method. Tables 6-5 through 6-10 summarize the maximum contaminant levels (MCLs) for
constituents of concern in GRRPs. To determine compliance, samples are to be collected and analyzed quarterly
for inorganics, organics, lead and copper, radionuclide chemicals, and disinfection byproducts. Once per year,
samples are to be collected and analyzed for secondary constituents.
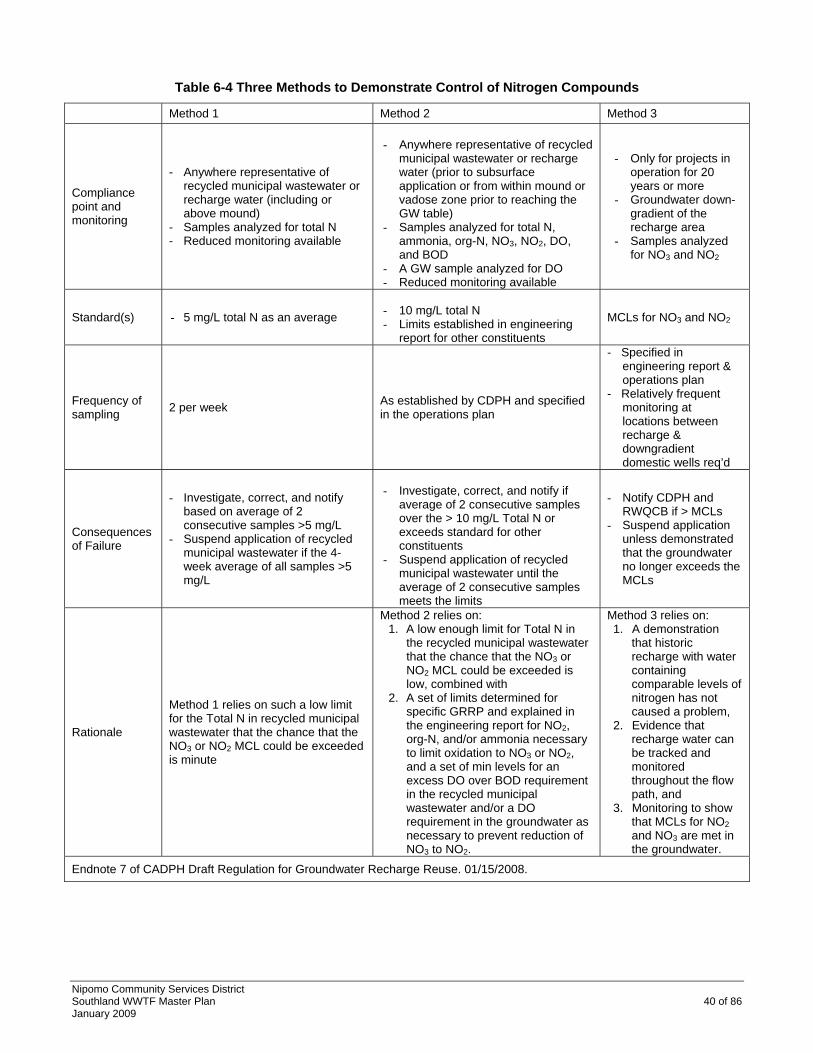
Nipomo Community Services District Southland WWTF Master Plan 40 of 86 January 2009
Table 6-4 Three Methods to Demonstrate Control of Nitrogen Compounds Method 1 Method 2 Method 3
Compliance point and monitoring
- Anywhere representative of recycled municipal wastewater or recharge water (including or above mound)
- Samples analyzed for total N - Reduced monitoring available
- Anywhere representative of recycled
municipal wastewater or recharge water (prior to subsurface application or from within mound or vadose zone prior to reaching the GW table)
- Samples analyzed for total N, ammonia, org-N, NO3, NO2, DO, and BOD
- A GW sample analyzed for DO - Reduced monitoring available
- Only for projects in operation for 20 years or more
- Groundwater down-gradient of the recharge area
- Samples analyzed for NO3 and NO2
Standard(s) - 5 mg/L total N as an average
- 10 mg/L total N - Limits established in engineering
report for other constituents
MCLs for NO3 and NO2
Frequency of sampling 2 per week As established by CDPH and specified
in the operations plan
- Specified in engineering report & operations plan
- Relatively frequent monitoring at locations between recharge & downgradient domestic wells req’d
Consequences of Failure
- Investigate, correct, and notify based on average of 2 consecutive samples >5 mg/L
- Suspend application of recycled municipal wastewater if the 4-week average of all samples >5 mg/L
- Investigate, correct, and notify if
average of 2 consecutive samples over the > 10 mg/L Total N or exceeds standard for other constituents
- Suspend application of recycled municipal wastewater until the average of 2 consecutive samples meets the limits
- Notify CDPH and RWQCB if > MCLs
- Suspend application unless demonstrated that the groundwater no longer exceeds the MCLs
Rationale
Method 1 relies on such a low limit for the Total N in recycled municipal wastewater that the chance that the NO3 or NO2 MCL could be exceeded is minute
Method 2 relies on: 1. A low enough limit for Total N in
the recycled municipal wastewater that the chance that the NO3 or NO2 MCL could be exceeded is low, combined with
2. A set of limits determined for specific GRRP and explained in the engineering report for NO2, org-N, and/or ammonia necessary to limit oxidation to NO3 or NO2, and a set of min levels for an excess DO over BOD requirement in the recycled municipal wastewater and/or a DO requirement in the groundwater as necessary to prevent reduction of NO3 to NO2.
Method 3 relies on: 1. A demonstration
that historic recharge with water containing comparable levels of nitrogen has not caused a problem,
2. Evidence that recharge water can be tracked and monitored throughout the flow path, and
3. Monitoring to show that MCLs for NO2 and NO3 are met in the groundwater.
Endnote 7 of CADPH Draft Regulation for Groundwater Recharge Reuse. 01/15/2008.
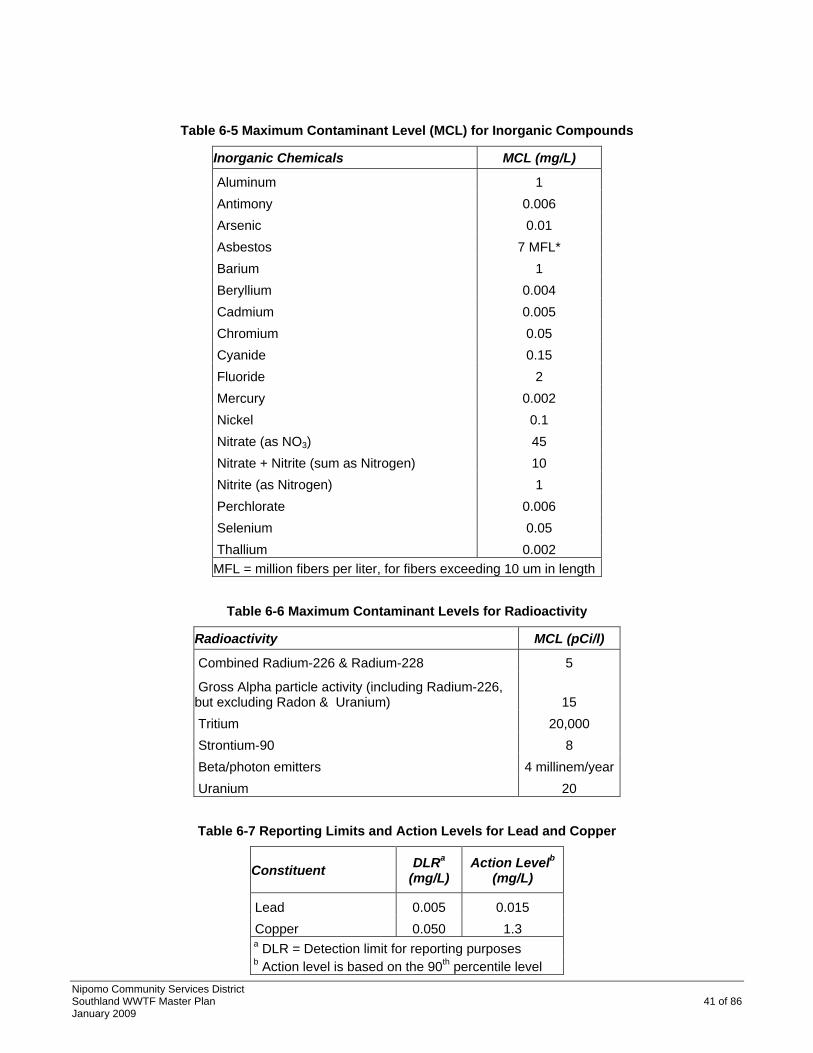
Nipomo Community Services District Southland WWTF Master Plan 41 of 86 January 2009
Table 6-5 Maximum Contaminant Level (MCL) for Inorganic Compounds
Inorganic Chemicals MCL (mg/L)
Aluminum 1 Antimony 0.006 Arsenic 0.01 Asbestos 7 MFL* Barium 1 Beryllium 0.004 Cadmium 0.005 Chromium 0.05 Cyanide 0.15 Fluoride 2 Mercury 0.002 Nickel 0.1 Nitrate (as NO3) 45 Nitrate + Nitrite (sum as Nitrogen) 10 Nitrite (as Nitrogen) 1 Perchlorate 0.006 Selenium 0.05 Thallium 0.002 MFL = million fibers per liter, for fibers exceeding 10 um in length
Table 6-6 Maximum Contaminant Levels for Radioactivity
Radioactivity MCL (pCi/l)
Combined Radium-226 & Radium-228 5
Gross Alpha particle activity (including Radium-226, but excluding Radon & Uranium) 15 Tritium 20,000 Strontium-90 8 Beta/photon emitters 4 millinem/year Uranium 20
Table 6-7 Reporting Limits and Action Levels for Lead and Copper
Constituent DLRa (mg/L)
Action Levelb (mg/L)
Lead 0.005 0.015 Copper 0.050 1.3 a DLR = Detection limit for reporting purposes b Action level is based on the 90th percentile level
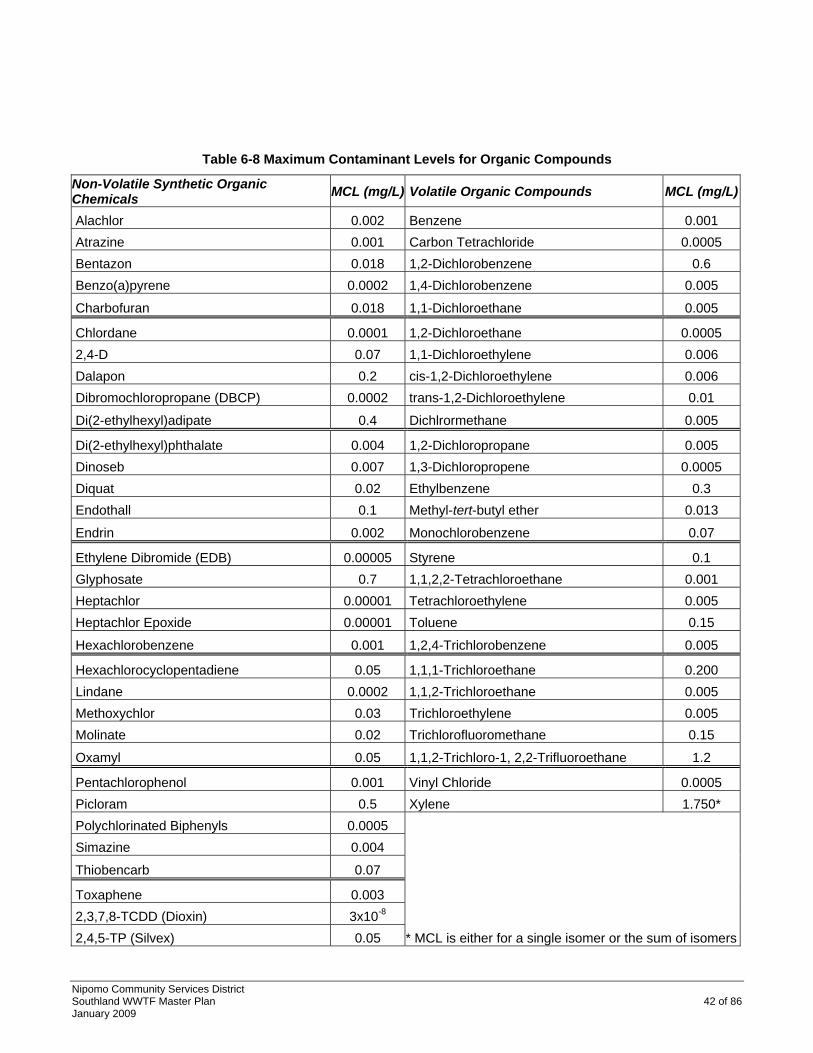
Nipomo Community Services District Southland WWTF Master Plan 42 of 86 January 2009
Table 6-8 Maximum Contaminant Levels for Organic Compounds
Non-Volatile Synthetic Organic Chemicals MCL (mg/L) Volatile Organic Compounds MCL (mg/L)
Alachlor 0.002 Benzene 0.001 Atrazine 0.001 Carbon Tetrachloride 0.0005 Bentazon 0.018 1,2-Dichlorobenzene 0.6 Benzo(a)pyrene 0.0002 1,4-Dichlorobenzene 0.005
Charbofuran 0.018 1,1-Dichloroethane 0.005
Chlordane 0.0001 1,2-Dichloroethane 0.0005 2,4-D 0.07 1,1-Dichloroethylene 0.006 Dalapon 0.2 cis-1,2-Dichloroethylene 0.006 Dibromochloropropane (DBCP) 0.0002 trans-1,2-Dichloroethylene 0.01
Di(2-ethylhexyl)adipate 0.4 Dichlrormethane 0.005
Di(2-ethylhexyl)phthalate 0.004 1,2-Dichloropropane 0.005 Dinoseb 0.007 1,3-Dichloropropene 0.0005 Diquat 0.02 Ethylbenzene 0.3 Endothall 0.1 Methyl-tert-butyl ether 0.013
Endrin 0.002 Monochlorobenzene 0.07
Ethylene Dibromide (EDB) 0.00005 Styrene 0.1 Glyphosate 0.7 1,1,2,2-Tetrachloroethane 0.001 Heptachlor 0.00001 Tetrachloroethylene 0.005 Heptachlor Epoxide 0.00001 Toluene 0.15
Hexachlorobenzene 0.001 1,2,4-Trichlorobenzene 0.005
Hexachlorocyclopentadiene 0.05 1,1,1-Trichloroethane 0.200 Lindane 0.0002 1,1,2-Trichloroethane 0.005 Methoxychlor 0.03 Trichloroethylene 0.005 Molinate 0.02 Trichlorofluoromethane 0.15
Oxamyl 0.05 1,1,2-Trichloro-1, 2,2-Trifluoroethane 1.2
Pentachlorophenol 0.001 Vinyl Chloride 0.0005 Picloram 0.5 Xylene 1.750* Polychlorinated Biphenyls 0.0005 Simazine 0.004
Thiobencarb 0.07
Toxaphene 0.003 2,3,7,8-TCDD (Dioxin) 3x10⁻⁸ 2,4,5-TP (Silvex) 0.05 * MCL is either for a single isomer or the sum of isomers
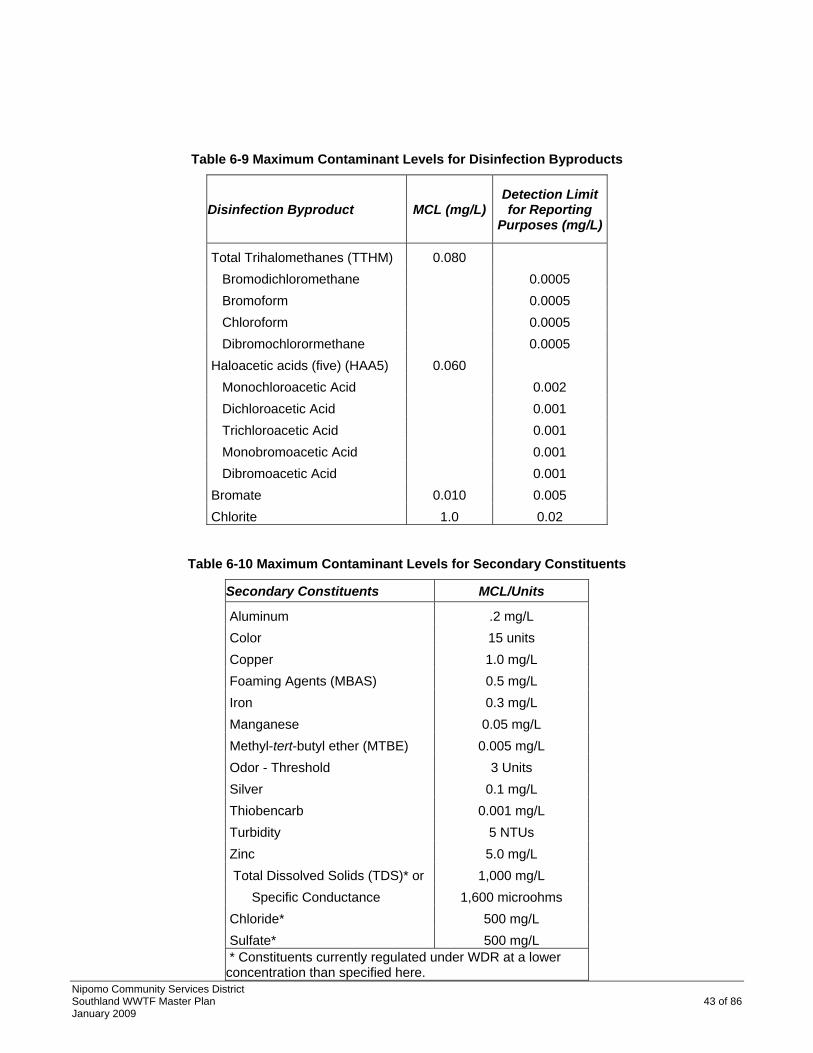
Nipomo Community Services District Southland WWTF Master Plan 43 of 86 January 2009
Table 6-9 Maximum Contaminant Levels for Disinfection Byproducts
Disinfection Byproduct MCL (mg/L)Detection Limit for Reporting
Purposes (mg/L)
Total Trihalomethanes (TTHM) 0.080 Bromodichloromethane 0.0005 Bromoform 0.0005 Chloroform 0.0005 Dibromochlorormethane 0.0005 Haloacetic acids (five) (HAA5) 0.060 Monochloroacetic Acid 0.002 Dichloroacetic Acid 0.001 Trichloroacetic Acid 0.001 Monobromoacetic Acid 0.001 Dibromoacetic Acid 0.001 Bromate 0.010 0.005 Chlorite 1.0 0.02
Table 6-10 Maximum Contaminant Levels for Secondary Constituents
Secondary Constituents MCL/Units
Aluminum .2 mg/L Color 15 units Copper 1.0 mg/L Foaming Agents (MBAS) 0.5 mg/L Iron 0.3 mg/L Manganese 0.05 mg/L Methyl-tert-butyl ether (MTBE) 0.005 mg/L Odor - Threshold 3 Units Silver 0.1 mg/L Thiobencarb 0.001 mg/L Turbidity 5 NTUs Zinc 5.0 mg/L Total Dissolved Solids (TDS)* or 1,000 mg/L Specific Conductance 1,600 microohms Chloride* 500 mg/L Sulfate* 500 mg/L * Constituents currently regulated under WDR at a lower concentration than specified here.
Nipomo Community Services District Southland WWTF Master Plan 44 of 86 January 2009
The two delivery options typically considered for groundwater recharge are direct injection with groundwater wells
or surface spreading and percolation. The latter option may be preferred because it will allow natural filtration of
the percolated wastewater throughout the geological subsurface or vadose zone, allowing further biological and
filtration treatment. Direct injection is often energy intensive, requires high capital costs due to the requirement for
RO treatment, may present public perception concerns, and may require an additional level of treatment to assure
the public that contamination is not a significant risk. Another option is subsurface application, which allows
percolation through the soil column but is applied beneath the ground surface with perforated pipes, or other
technique similar to a leach system, to reduce potential visual impacts and odors.
The District has investigated some potential sites for groundwater recharge. To be effective, the land must have
proper soil characteristics for percolation and be located where recharge would increase availability of water in
the aquifer. A GRRP will require treatment process improvements, transmission pipelines, pump stations, and
property for percolation ponds. Additionally, the District must identify a source of diluent water to blend with the
recycled water prior to spreading or injection.
6.4 Option 3 - Maintain Current Discharge Practices Operating improvements made over the past two years have generally improved the wastewater effluent quality.
However, groundwater monitoring and hydrogeological studies have indicated a clay layer between 60 and 140
feet beneath the site. This layer appears to be restricting percolation to groundwater and a mound of treated
effluent is growing horizontally and upwards beneath the site.
The Preliminary Screening Evaluation of Southland WWTF Disposal Alternatives was completed in January 2009
(AECOM). The disposal/reuse alternatives considered included the current disposal practice (which was
determined to be fatally flawed based on capacity and regulatory considerations), infiltration offsite using surface
basins or subsurface systems, and irrigation of landscape or agricultural lands with recycled water. It may be
possible to utilize onsite infiltration followed by pumping, for infiltration and storage before transporting the treated
effluent offsite. The report provides a ranking to assist the District with determining which alternatives to continue
investigating.
6.5 Recommendations Water quality goals will dictate the appropriate level of treatment for the future wastewater treatment plant.
Recommendations to assist in that determination are as follows:
Nipomo Community Services District Southland WWTF Master Plan 45 of 86 January 2009
• Implement next phase of effluent disposal and reuse alternatives presenting in the January 2009
Screening Evaluation (ibid).
• Sample effluent for constituents that may effect reuse as irrigation: ECw, SAR & SARadj, boron, and fecal
coliform.
• Sample effluent for constituents that may effect reuse as recharge: TOC, turbidity, organic and inorganic
nitrogen.
• Select a future treatment plant process which will provide adequate pretreatment for filtration. If uses
such as park/school irrigation, groundwater recharge, or infiltration (under more stringent permit limits
than the plant’s current permit) are pursued for the expanded treatment facility, aerated ponds will not
provide adequate treatment or pretreatment.
Nipomo Community Services District Southland WWTF Master Plan 46 of 86 January 2009
7.1 Frontage Road Trunk Main A hydraulic analysis based on Manning’s equation was performed on the Frontage Road trunk main from Division
Street to the WWTF. The analysis allowed identification of trunk main sections that are insufficiently sized to
handle existing and/or future flows based on the allowable water depth, or d/D as discussed in Section 5.1 (See
Figures 5-2 and 5-4). Several sections currently fail to meet the criteria for PHF and the majority of the line is
expected to fail for both average and peak future flow rates. The minimum pipeline diameters needed to meet
both existing and projected demand were calculated. A 15-inch pipeline will handle existing flow rates, but a 21-
inch replacement is recommended to meet future peak demand. The 15-inch upgrade is estimated to cost
approximately $1,800,000. The 21-inch upgrade is estimated to cost about 20% more, at $2,200,000. The cost
opinions are based on open trench construction. Pipe bursting or pipe reaming may be an option, but a
geotechnical study and identification of nearby utilities would be required to determine feasibility. Additional
assumptions are listed with the detailed cost opinions, included in Appendix C.
7.2 Influent Pump Station Electrical Supply Reliability
The WWTF uses two influent pumps to pump incoming wastewater to treatment ponds. The Fairbanks Morse
submersible pumps are 35 HP each and rated at an approximate 2300 gallons per minute (gpm) capacity.
Occasionally, the WWTF experiences an imbalance in the utility power supply, which causes temporary pump
failure. This causes submergence of the trunk sewer and the Parshall flume throat, resulting in false meter
readings. The electrical problem is likely a result of the plant’s position as the end user on the distribution line,
where many “up-stream” residential developments, which are single-phase loads, create an imbalance in the
line’s three-phase voltage. This theory was substantiated by a data logger that revealed voltage differences of up
to 12-15 volts between phases. While this is a problem for the District, it is within the delivery tolerances allowed
by Pacific Gas & Electric (PG&E) for their customers. The District has installed motor savers on the pumps, to
protect the motors during voltage imbalances, but this results in deactivating the motors and causing surcharges.
A small voltage imbalance can create a large current imbalance, and may thereby increase heat in the motors
and lead to premature motor failure.
Several methods were considered to reduce or eliminate the electrical problem at the pumps, as follows:
1. Variable-Frequency Drives (VFDs) convert the three-phase power to a direct current and then convert it
back to an adjustable frequency three-phase voltage. By slightly oversizing the VFD, the VFD can
accommodate a severe input voltage imbalance and produce a completely balanced output voltage to the
motor. Disadvantage is high cost and complexity.
7.0 SYSTEM IMPROVEMENTS
Nipomo Community Services District Southland WWTF Master Plan 47 of 86 January 2009
2. The solid-state starter (Allen Bradley Dialog Plus) has a unique feature called a phase re-balance feature.
In lieu of bypassing the solid state starter once it gets the motor up to speed, as is conventionally done, the
solid state starter remains in the circuit and reduces the voltage of the high phase(s) to balance it with the
other phases(s). We recommend a bypass contactor also be installed as a backup to the solid state starter
with a hand switch with “soft-start only, bypass only and normal” positions. This option appears to be the
most favorable with regard to cost and operability.
3. A larger motor on the same pump could handle the voltage imbalances without overloading any of the three
motor phases since the rating of the motor phases would be higher. Disadvantage is that pump and wiring
must also be replaced resulting in a high cost. However, if District is planning on a pump replacement for
other reasons, this is the simplest and least technical option at about the same cost as the solid state
starter.
Wetwell and Pumping Capacity
Analyses show the existing influent pumps have capacity to handle existing flow, but will need to be upgraded to
maintain redundancy while meeting future demands. The wetwell volume calculations also showed that the wet
well is undersized for existing conditions. The cycle time was calculated to be 3 minutes for existing peak hour
conditions. However, staff has estimated that the pumps are cycling every 15 minutes during peak hour flow.
Additional investigation is recommended to fully evaluate the existing pump station and determine appropriate
alternatives to meet future demand. An excessive number of pump starts per hour (greater than 4 or 5) results in
shorter useful life for starters and motors.
On a short-term basis, assuming no pump station upgrades are performed for several years, retrofiting the
existing pumps with VFDs was investigated as an option to reduce required capacity of the wet well. VFDs will
allow the pumps to run at a reduced speed. They also assist with the voltage imbalances as discussed above.
The disadvantages are cost, some decreased efficiency, and complexity of operation. In order to retrofit the
pumps with VFDs, the minimum flow must be determined. It is not recommended to operate pumps at flows less
than 30% below their best efficiency point to maintain sufficient shaft speed for discharge against the static head.
Review of the pump curve indicates the highest efficiency point for the existing influent pumps is at 2000 gpm.
Therefore the recommended minimum flow rate is 1400 gpm, at an operating speed of 850 rpm. At this flow the
required active volume to provide a 10-minute cycle time per pump at peak flow is 1750 gallons or 220 ft3.
Though this is nearly half the volume needed without VFDs, the existing wet well is still smaller than desired for
pump cycling (existing active volume of 186 ft3).
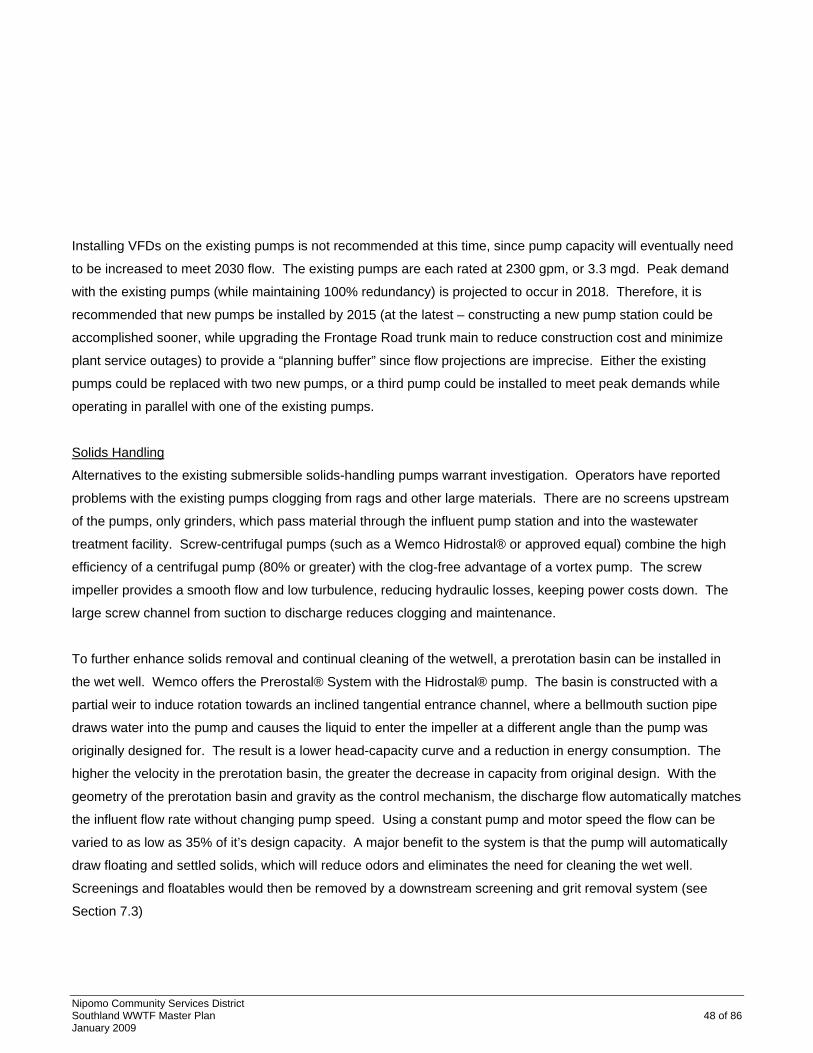
Nipomo Community Services District Southland WWTF Master Plan 48 of 86 January 2009
Installing VFDs on the existing pumps is not recommended at this time, since pump capacity will eventually need
to be increased to meet 2030 flow. The existing pumps are each rated at 2300 gpm, or 3.3 mgd. Peak demand
with the existing pumps (while maintaining 100% redundancy) is projected to occur in 2018. Therefore, it is
recommended that new pumps be installed by 2015 (at the latest – constructing a new pump station could be
accomplished sooner, while upgrading the Frontage Road trunk main to reduce construction cost and minimize
plant service outages) to provide a “planning buffer” since flow projections are imprecise. Either the existing
pumps could be replaced with two new pumps, or a third pump could be installed to meet peak demands while
operating in parallel with one of the existing pumps.
Solids Handling
Alternatives to the existing submersible solids-handling pumps warrant investigation. Operators have reported
problems with the existing pumps clogging from rags and other large materials. There are no screens upstream
of the pumps, only grinders, which pass material through the influent pump station and into the wastewater
treatment facility. Screw-centrifugal pumps (such as a Wemco Hidrostal® or approved equal) combine the high
efficiency of a centrifugal pump (80% or greater) with the clog-free advantage of a vortex pump. The screw
impeller provides a smooth flow and low turbulence, reducing hydraulic losses, keeping power costs down. The
large screw channel from suction to discharge reduces clogging and maintenance.
To further enhance solids removal and continual cleaning of the wetwell, a prerotation basin can be installed in
the wet well. Wemco offers the Prerostal® System with the Hidrostal® pump. The basin is constructed with a
partial weir to induce rotation towards an inclined tangential entrance channel, where a bellmouth suction pipe
draws water into the pump and causes the liquid to enter the impeller at a different angle than the pump was
originally designed for. The result is a lower head-capacity curve and a reduction in energy consumption. The
higher the velocity in the prerotation basin, the greater the decrease in capacity from original design. With the
geometry of the prerotation basin and gravity as the control mechanism, the discharge flow automatically matches
the influent flow rate without changing pump speed. Using a constant pump and motor speed the flow can be
varied to as low as 35% of it’s design capacity. A major benefit to the system is that the pump will automatically
draw floating and settled solids, which will reduce odors and eliminates the need for cleaning the wet well.
Screenings and floatables would then be removed by a downstream screening and grit removal system (see
Section 7.3)
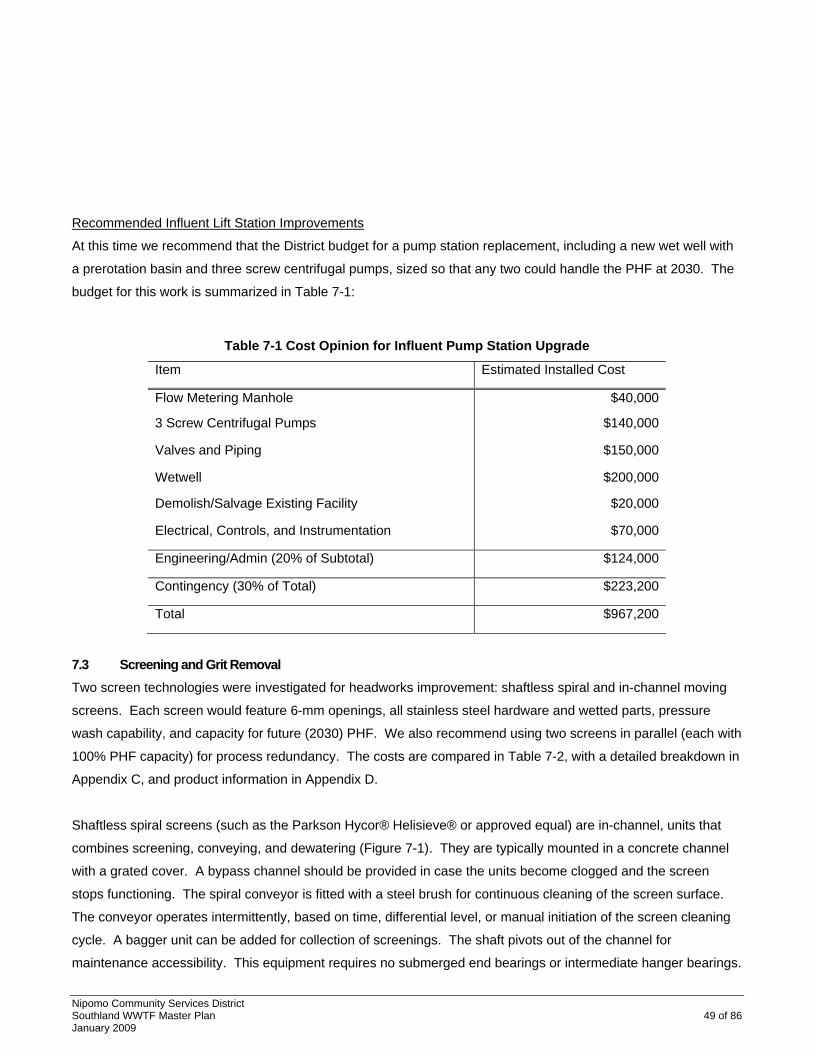
Nipomo Community Services District Southland WWTF Master Plan 49 of 86 January 2009
Recommended Influent Lift Station Improvements
At this time we recommend that the District budget for a pump station replacement, including a new wet well with
a prerotation basin and three screw centrifugal pumps, sized so that any two could handle the PHF at 2030. The
budget for this work is summarized in Table 7-1:
Table 7-1 Cost Opinion for Influent Pump Station Upgrade
Item Estimated Installed Cost
Flow Metering Manhole $40,000
3 Screw Centrifugal Pumps $140,000
Valves and Piping $150,000
Wetwell $200,000
Demolish/Salvage Existing Facility $20,000
Electrical, Controls, and Instrumentation $70,000
Engineering/Admin (20% of Subtotal) $124,000
Contingency (30% of Total) $223,200
Total $967,200
7.3 Screening and Grit Removal Two screen technologies were investigated for headworks improvement: shaftless spiral and in-channel moving
screens. Each screen would feature 6-mm openings, all stainless steel hardware and wetted parts, pressure
wash capability, and capacity for future (2030) PHF. We also recommend using two screens in parallel (each with
100% PHF capacity) for process redundancy. The costs are compared in Table 7-2, with a detailed breakdown in
Appendix C, and product information in Appendix D.
Shaftless spiral screens (such as the Parkson Hycor® Helisieve® or approved equal) are in-channel, units that
combines screening, conveying, and dewatering (Figure 7-1). They are typically mounted in a concrete channel
with a grated cover. A bypass channel should be provided in case the units become clogged and the screen
stops functioning. The spiral conveyor is fitted with a steel brush for continuous cleaning of the screen surface.
The conveyor operates intermittently, based on time, differential level, or manual initiation of the screen cleaning
cycle. A bagger unit can be added for collection of screenings. The shaft pivots out of the channel for
maintenance accessibility. This equipment requires no submerged end bearings or intermediate hanger bearings.
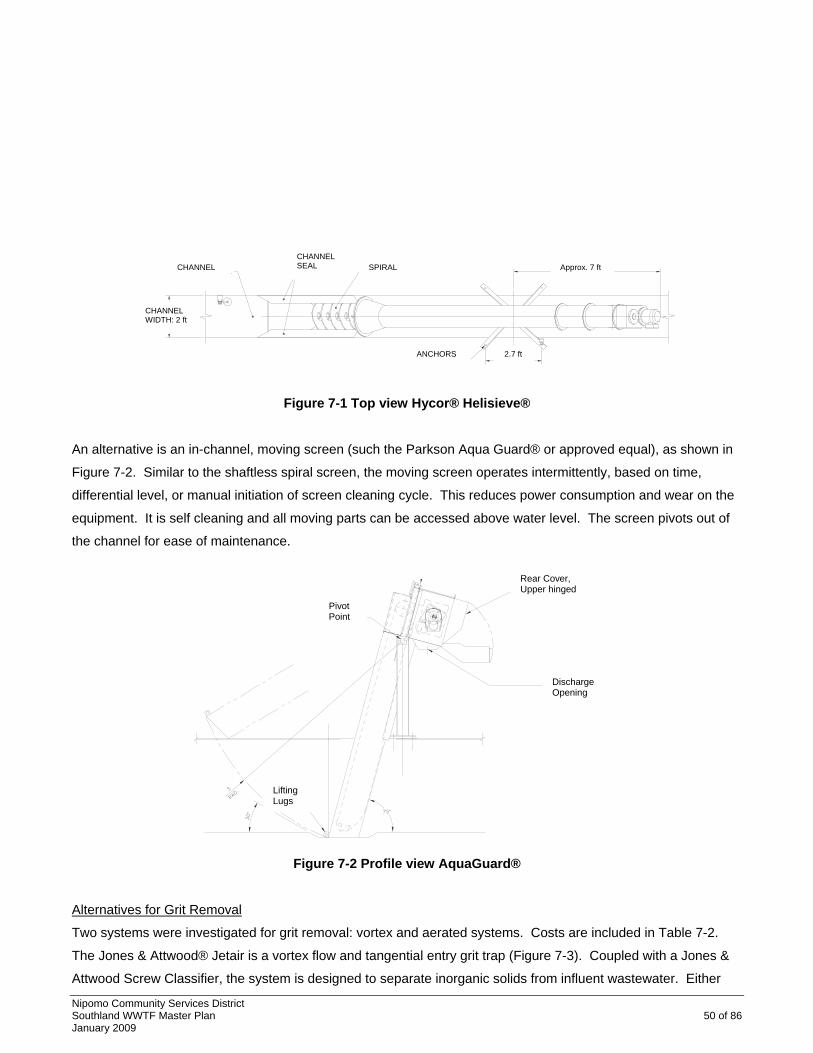
Nipomo Community Services District Southland WWTF Master Plan 50 of 86 January 2009
Figure 7-1 Top view Hycor® Helisieve®
An alternative is an in-channel, moving screen (such the Parkson Aqua Guard® or approved equal), as shown in
Figure 7-2. Similar to the shaftless spiral screen, the moving screen operates intermittently, based on time,
differential level, or manual initiation of screen cleaning cycle. This reduces power consumption and wear on the
equipment. It is self cleaning and all moving parts can be accessed above water level. The screen pivots out of
the channel for ease of maintenance.
S
RAD.
LIFTINGLUGS
REAR COVER,UPPER (HINGED)
PIVOTPOINT
75°
DISCHARGE OPENING11 X (W - 1/8)
30°
Figure 7-2 Profile view AquaGuard®
Alternatives for Grit Removal
Two systems were investigated for grit removal: vortex and aerated systems. Costs are included in Table 7-2.
The Jones & Attwood® Jetair is a vortex flow and tangential entry grit trap (Figure 7-3). Coupled with a Jones &
Attwood Screw Classifier, the system is designed to separate inorganic solids from influent wastewater. Either
SPIRAL CHANNEL SEAL CHANNEL
ANCHORS
CHANNEL WIDTH: 2 ft
Approx. 7 ft
2.7 ft
Rear Cover, Upper hinged
Pivot Point
Discharge Opening
Lifting Lugs
Nipomo Community Services District Southland WWTF Master Plan 51 of 86 January 2009
two units could be installed, each able to handle 50% of the projected 2030 PHF and allow temporary operation
with one unit while maintenance is performed on the other, or one unit with a bypass could be provided to handle
100% of PHF.
Figure 7-3 Jones & Attwood JetAir® and Screw Classifier
(Detailed photographs and drawings included in Appendix D)
An aerated grit chamber is an economical alternative to vortex grit removal. Air is introduced from one side of a
rectangular chamber, perpendicular to the wastewater flow to create a spiral flow pattern through the tank.
Heavier grit particles settle to the bottom of the chamber, while lighter particles – primarily organics – remain
suspended and pass through. When compared to the vortex grit removal system, aerated grit chambers require
more air piping, diffusers, and mixing, which demand more power and maintenance, but are typically less
expensive to construct. Aerated grit chambers require blowers to blow air through the water and overcome static
head from the depth of diffusers. Since the District already has blowers onsite, and an air line is near the existing
headworks, they already have aeration capability for the chambers. Aerated grit chambers sometimes contribute
to odors and headworks corrosion through the creation and release of hydrogen sulfide.
Drum Screens
A potential alternative to screening and grit removal systems is a drum screen. A drum screen will remove more
material than a mechanical screen alone, but less than a combined system as presented above. The advantage
to this option is having only one headworks system to maintain, assumedly simplifying operations. However,
drum screens often require more maintenance than other screens, since they typically have a smaller opening
Nipomo Community Services District Southland WWTF Master Plan 52 of 86 January 2009
than mechanical screens (3 mm verses 6 mm) and can clog more frequently. Though more expensive than other
types of screens, when comparing to a dual screen and grit removal system, the capital costs are similar. Drum
screens require continuous wash water at higher flow rates than required for coarser screens (described above)
and conveying, dewatering, and bagging must be performed separately.
Table 7-2 Cost Opinions for Screening and Grit Removal Systems
Improvement Option Estimated Installed Cost
Screens
(2) Parkson HLS500 Hycor® Helisieve® $512,000
(2) Parkson Aqua Guard® AG-MN-A $855,000
Grit Removal (2) Jones & Attwood JetAir 100 Grit Trap + Model 100 Screw Classifier $629,000
(2) Aerated Grit Chambers4 $588,000
Recommendations for Screening and Grit Removal Systems
Two (2) shaftless screw screens are recommended for screening, since they require lower capital cost and
provide better dewatering and compaction of solids than a mechanical screen.
A vortex grit removal system (such as the Jones & Attwood JetAir® grit trap) is recommended as part of the
headworks improvements at the WWTF. The capital costs are higher than an aerated grit chamber, but the
system requires less maintenance than an aerated grit chamber which requires regular repair and replacement of
air valves, fittings, diffusers and piping in the basins
7.4 Sludge Removal Currently, ponds are drained by temporary pumps and piping systems to remove sludge and convey it to the
drying beds. Buried sludge removal pipes are installed, but no longer used. Testing would be required to
determine if the pipes are functional. Draining a pond is a time-consuming task and the WWTF must take the
pond out of service, requiring operation using the remaining ponds until the sludge removal is complete.
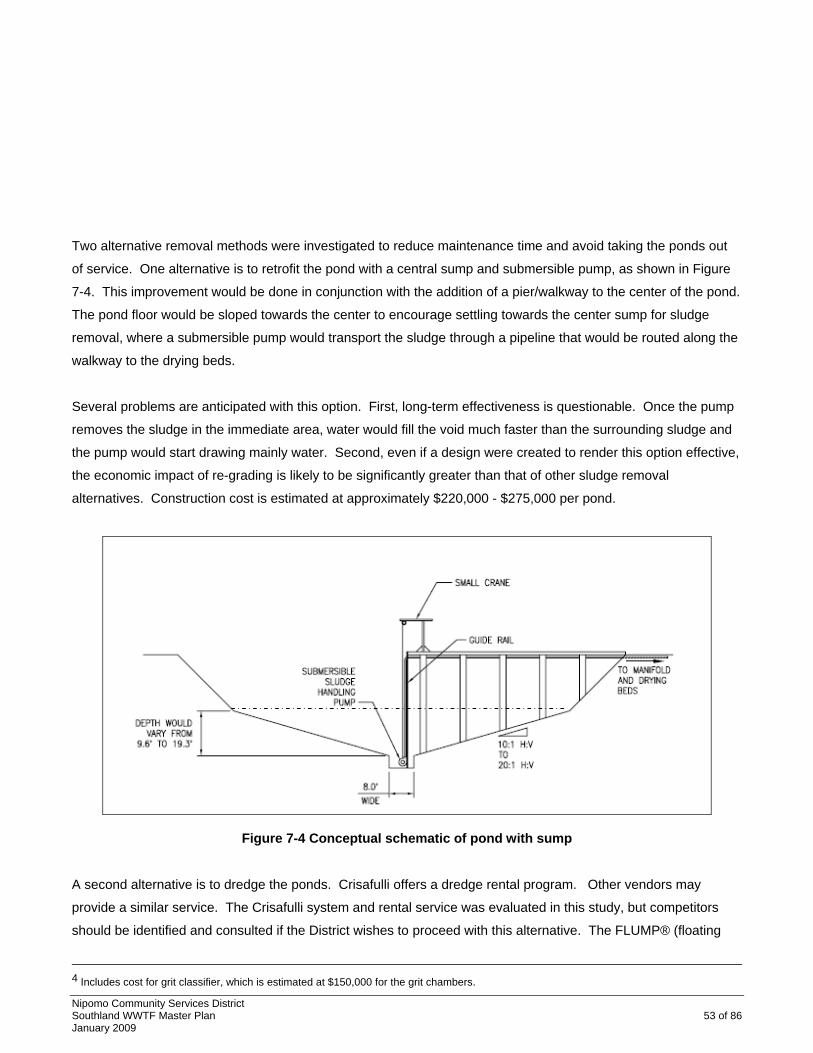
Nipomo Community Services District Southland WWTF Master Plan 53 of 86 January 2009
Two alternative removal methods were investigated to reduce maintenance time and avoid taking the ponds out
of service. One alternative is to retrofit the pond with a central sump and submersible pump, as shown in Figure
7-4. This improvement would be done in conjunction with the addition of a pier/walkway to the center of the pond.
The pond floor would be sloped towards the center to encourage settling towards the center sump for sludge
removal, where a submersible pump would transport the sludge through a pipeline that would be routed along the
walkway to the drying beds.
Several problems are anticipated with this option. First, long-term effectiveness is questionable. Once the pump
removes the sludge in the immediate area, water would fill the void much faster than the surrounding sludge and
the pump would start drawing mainly water. Second, even if a design were created to render this option effective,
the economic impact of re-grading is likely to be significantly greater than that of other sludge removal
alternatives. Construction cost is estimated at approximately $220,000 - $275,000 per pond.
Figure 7-4 Conceptual schematic of pond with sump
A second alternative is to dredge the ponds. Crisafulli offers a dredge rental program. Other vendors may
provide a similar service. The Crisafulli system and rental service was evaluated in this study, but competitors
should be identified and consulted if the District wishes to proceed with this alternative. The FLUMP® (floating
4 Includes cost for grit classifier, which is estimated at $150,000 for the grit chambers.
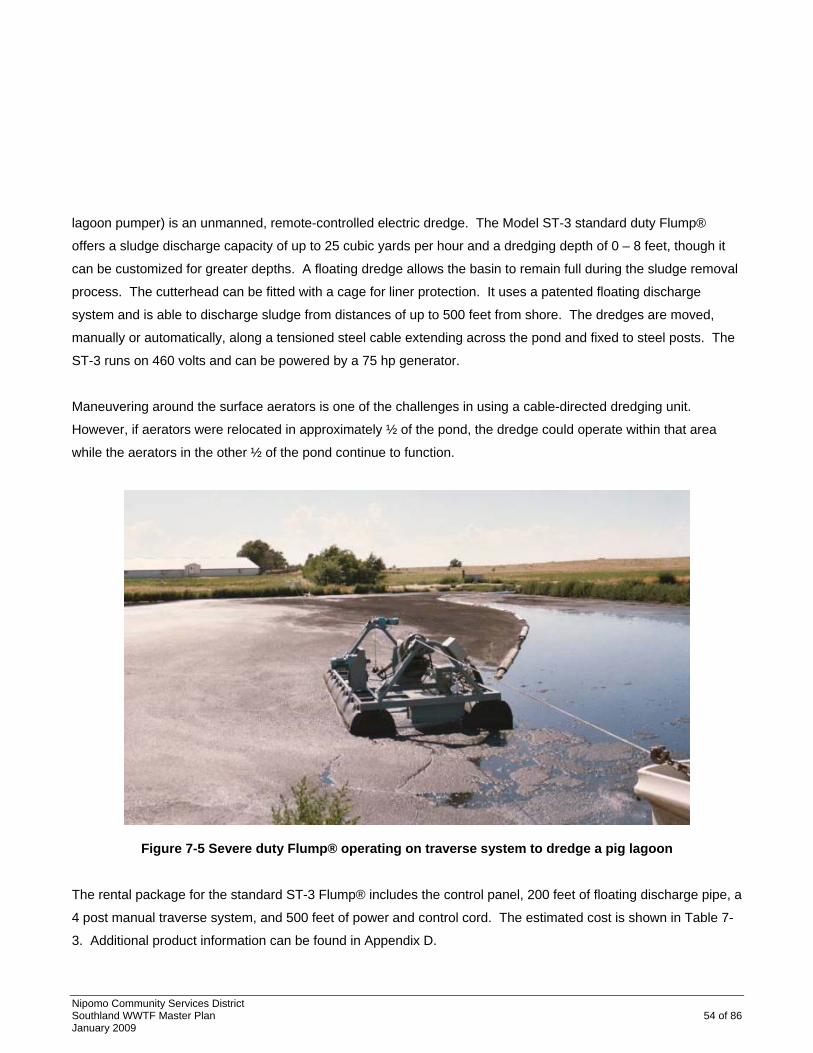
Nipomo Community Services District Southland WWTF Master Plan 54 of 86 January 2009
lagoon pumper) is an unmanned, remote-controlled electric dredge. The Model ST-3 standard duty Flump®
offers a sludge discharge capacity of up to 25 cubic yards per hour and a dredging depth of 0 – 8 feet, though it
can be customized for greater depths. A floating dredge allows the basin to remain full during the sludge removal
process. The cutterhead can be fitted with a cage for liner protection. It uses a patented floating discharge
system and is able to discharge sludge from distances of up to 500 feet from shore. The dredges are moved,
manually or automatically, along a tensioned steel cable extending across the pond and fixed to steel posts. The
ST-3 runs on 460 volts and can be powered by a 75 hp generator.
Maneuvering around the surface aerators is one of the challenges in using a cable-directed dredging unit.
However, if aerators were relocated in approximately ½ of the pond, the dredge could operate within that area
while the aerators in the other ½ of the pond continue to function.
Figure 7-5 Severe duty Flump® operating on traverse system to dredge a pig lagoon
The rental package for the standard ST-3 Flump® includes the control panel, 200 feet of floating discharge pipe, a
4 post manual traverse system, and 500 feet of power and control cord. The estimated cost is shown in Table 7-
3. Additional product information can be found in Appendix D.
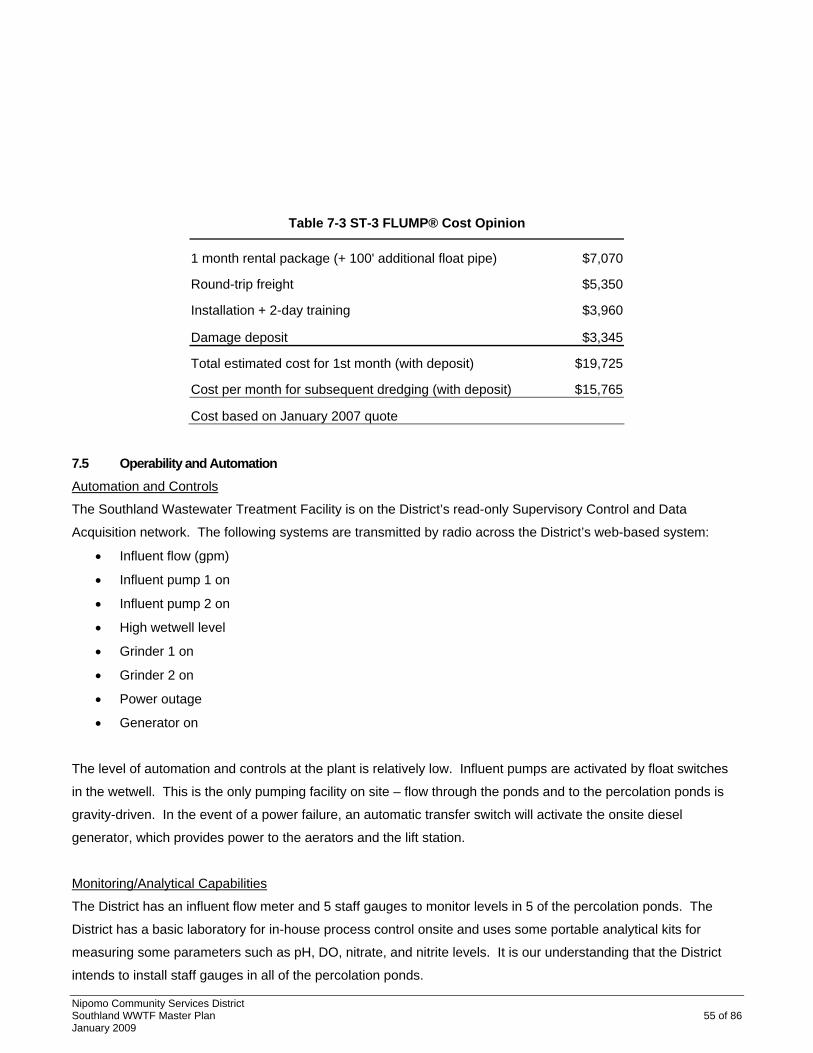
Nipomo Community Services District Southland WWTF Master Plan 55 of 86 January 2009
Table 7-3 ST-3 FLUMP® Cost Opinion
1 month rental package (+ 100' additional float pipe) $7,070
Round-trip freight $5,350
Installation + 2-day training $3,960
Damage deposit $3,345
Total estimated cost for 1st month (with deposit) $19,725
Cost per month for subsequent dredging (with deposit) $15,765
Cost based on January 2007 quote
7.5 Operability and Automation Automation and Controls
The Southland Wastewater Treatment Facility is on the District’s read-only Supervisory Control and Data
Acquisition network. The following systems are transmitted by radio across the District’s web-based system:
• Influent flow (gpm)
• Influent pump 1 on
• Influent pump 2 on
• High wetwell level
• Grinder 1 on
• Grinder 2 on
• Power outage
• Generator on
The level of automation and controls at the plant is relatively low. Influent pumps are activated by float switches
in the wetwell. This is the only pumping facility on site – flow through the ponds and to the percolation ponds is
gravity-driven. In the event of a power failure, an automatic transfer switch will activate the onsite diesel
generator, which provides power to the aerators and the lift station.
Monitoring/Analytical Capabilities
The District has an influent flow meter and 5 staff gauges to monitor levels in 5 of the percolation ponds. The
District has a basic laboratory for in-house process control onsite and uses some portable analytical kits for
measuring some parameters such as pH, DO, nitrate, and nitrite levels. It is our understanding that the District
intends to install staff gauges in all of the percolation ponds.
Nipomo Community Services District Southland WWTF Master Plan 56 of 86 January 2009
In addition to these changes, we would recommend adding current meters to read and transmit amperage for
each aerator, pumps, and grinders (if they remain in operation). This would allow operators to remotely detect
problems that would increase or decrease load (and cause changes in current) on the motors, such as clogged
pumps, “ragging” of aerators, and blockage in the grinders. A greater level of automation could be achieved with
reconfiguration of the aerator controls and dissolved oxygen probes to control aerators by DO levels. A system
could be developed to allow staff to step-up or step-down the number of aerators in operation to maintain
consistent DO levels. At a minimum, if the aerators remain in operation, it is recommended that the aerators
closest to the outlets be provided with DO controls since these aerators would face lower regular BOD loading
than the inlet-side aerators.
Laboratory equipment should be purchased to allow District staff to measure BOD as a “quality control” method to
check laboratory results, since they have been questionable (in the past). The lab could also be outfitted to
perform sludge volume index (SVI) and total suspended solids (TSS). The laboratory should also have a vented
hood, to allow the District to run Chemical Oxygen Demand (COD) tests and other tests which require ventilation
for safety.
Improved Pond Access
Representative sampling is a goal for any wastewater treatment plant. Building piers for access into the pond
interior area is a relatively simple improvement to gain better access for representative sampling. It is difficult to
obtain representative samples at the shore due to floating and submerged debris build up caused by wind and
pond circulation patterns. Construction of a pier would require draining the ponds and modification to the liners
for installed footings or piles with columns for support. Placement should be near the pond outlet where the
majority of the treatment has been accomplished, extending out to the deepest part of the pond to avoid collection
of material from the sides when sampling. The side-slope ends approximately 42-feet from the edge of the pond.
The walkway should be aluminum-framed with stainless steel handrails. Gatordock makes an aluminum fixed
pier. A 40-foot long by 6 feet wide DuraDock® with handrails is expected to cost approximately $16,000. This
includes the cost of four plastic coated wood pilings and shipping. It does not include costs associated with
modification of the liner or installation of an anchoring system. The main disadvantages to a fixed pier include the
disruption of service for construction, the potential for interference with pond retrofits or sludge removal, and the
cost and potential problems with modifying the pond liner.
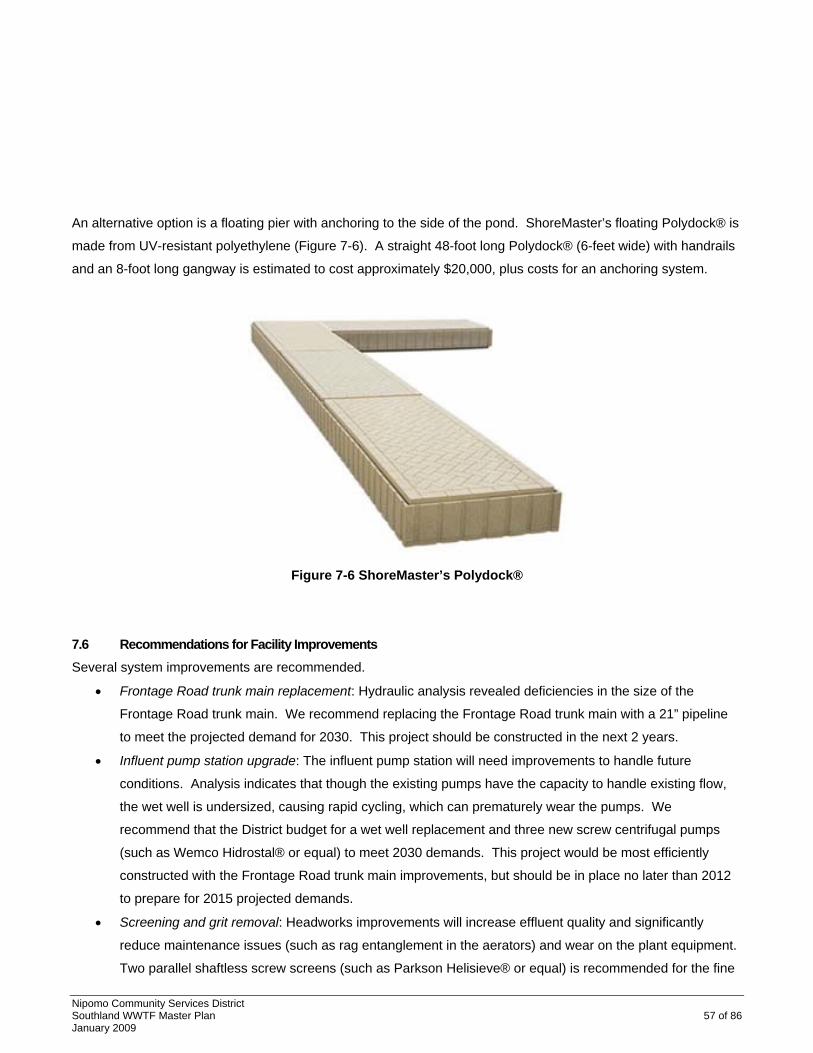
Nipomo Community Services District Southland WWTF Master Plan 57 of 86 January 2009
An alternative option is a floating pier with anchoring to the side of the pond. ShoreMaster’s floating Polydock® is
made from UV-resistant polyethylene (Figure 7-6). A straight 48-foot long Polydock® (6-feet wide) with handrails
and an 8-foot long gangway is estimated to cost approximately $20,000, plus costs for an anchoring system.
Figure 7-6 ShoreMaster’s Polydock®
7.6 Recommendations for Facility Improvements Several system improvements are recommended.
• Frontage Road trunk main replacement: Hydraulic analysis revealed deficiencies in the size of the
Frontage Road trunk main. We recommend replacing the Frontage Road trunk main with a 21” pipeline
to meet the projected demand for 2030. This project should be constructed in the next 2 years.
• Influent pump station upgrade: The influent pump station will need improvements to handle future
conditions. Analysis indicates that though the existing pumps have the capacity to handle existing flow,
the wet well is undersized, causing rapid cycling, which can prematurely wear the pumps. We
recommend that the District budget for a wet well replacement and three new screw centrifugal pumps
(such as Wemco Hidrostal® or equal) to meet 2030 demands. This project would be most efficiently
constructed with the Frontage Road trunk main improvements, but should be in place no later than 2012
to prepare for 2015 projected demands.
• Screening and grit removal: Headworks improvements will increase effluent quality and significantly
reduce maintenance issues (such as rag entanglement in the aerators) and wear on the plant equipment.
Two parallel shaftless screw screens (such as Parkson Helisieve® or equal) is recommended for the fine

Nipomo Community Services District Southland WWTF Master Plan 58 of 86 January 2009
screening, followed by two vortex grit removal systems (such as Jones & Attwood JetAir® or equal). We
recommend installing screening and grit removal within the next 2 years.
• Solids handling: If needed, rent a portable dredging unit (such as the Crisafulli Flump®) for future sludge
removal from the aerated ponds.
• Control and automation: If the District maintains the pond system for the future treatment process, we
recommend adding current meters to aerators, pumps, and grinders to read and transmit amperage, and
reconfiguration of the aerator controls and dissolved oxygen probes to control the aerators by DO levels.
• Increase pond access: Fixed and floating piers were investigated. Floating piers can provide pond
access at a reasonable cost without constructing a permanent structure or damaging the pond liner. If
pond access is desired for sampling or monitoring, or for access to pond outlet, we recommend installing
a floating dock.

Nipomo Community Services District Southland WWTF Master Plan 59 of 86 January 2009
The anticipated effluent requirements for permitting and future flow increases necessitate investigation of
treatment process alternatives. Four alternatives were reviewed and are discussed below: expansion of the
current treatment process with additional aerated ponds, a conversion to Biolac® Wave Oxidation System (an
extended aeration technology), a conventional activated sludge system, and an oxidation ditch. Most of these
options could be implemented in phases, spreading the capital cost out over several years. A summary of
comparative cost opinions is shown in Table 8-2. Cost details are included in Appendix C. Sizing and cost
opinions are based on meeting an AAF of 1.67 mgd, for 2030 demand.
8.1 Expansion of Aerated Ponds
The WWTF currently uses four aerated ponds for treatment. Under normal operation, the wastewater flow from
the influent pump station is split into the primary ponds, Ponds 1 and 2, then flows into the secondary ponds,
Ponds 4 and 3, respectively. The inlet and outlet ends of the secondary ponds were previously split with a baffle
curtain to minimize short-circuiting and provide a quiescent zone. The front 40% of each pond was aerated with
two 5-hp mechanical surface aerators, and the back 60% was a stabilization basin, providing settling time. In
2007, the baffle curtain was removed to maximize aerated volume. The WWTF currently runs 3 aerators each in
Ponds 3 and 4. Pond 3 has two 5 hP aerators and one 10 hP. Pond 4 contains three 10 hP aerators. The
District plans to replace all existing 5-hp aerators with 10-hp aerators. Figure 4-1 shows the existing process flow
diagram.
Based on the projected flows discussed in Section 3.0 and a monthly mean BOD5 effluent goal of 40 mg/L, four
additional ponds would be needed, each with an equivalent liquid volume of the existing secondary ponds
(approximately 3.1 million gallons). Calculations were performed with the assumption that the baffling in the
existing secondary ponds would be removed to provide additional aerated capacity for treating increased flows.
Appendix B contains the complete calculations. Additional aerators, providing 195 hp more, will be needed for
adequate aeration in the new ponds (total of 315 hp). The process flow diagram for this option is provided as
Figure 8-1. A recommended layout for the four additional ponds is shown as a site plan in Figure 8-2. Though
there is open area behind the existing ponds, only two ponds of this size will fit. We would recommend
constructing the four new aeration basins in place of the existing infiltration basins #1, 2, and 3. Additional sludge
drying beds could be constructed in the area behind the existing aeration ponds and there is room to the
southwest, behind infiltration basins #4 through #8, to construct additional infiltration basins. The improvements
could be implemented in phases, as the demand requires.
8.0 FUTURE PROCESS ALTERNATIVES
Nipomo Community Services District Southland WWTF Master Plan 60 of 86 January 2009
One of the main disadvantages to constructing additional aerated ponds is the inability to meet a higher level of
treatment than is currently required in the WDRs, as well as poor nitrogen removal. In addition, aerated or
facultative ponds will not produce effluent that can be efficiently filtered for recycled water applications such
irrigation at parks or schools. This option will sufficiently treat the wastewater with projected future hydraulic and
loading demands with respect to current water quality goals. However, more stringent water quality regulations
are anticipated for the future and if the District chooses to pursue groundwater recharge or another reuse
alternative, additional treatment to reduce nitrogen concentrations and other constituents in the effluent will be
required. The capital cost is for this option is one of the highest, due to the large amount of excavation and fill
required. The cost opinion does not include excavation and grading for additional infiltration basins or sludge
drying beds, which are discussed in Sections 8.6 and 8.7.
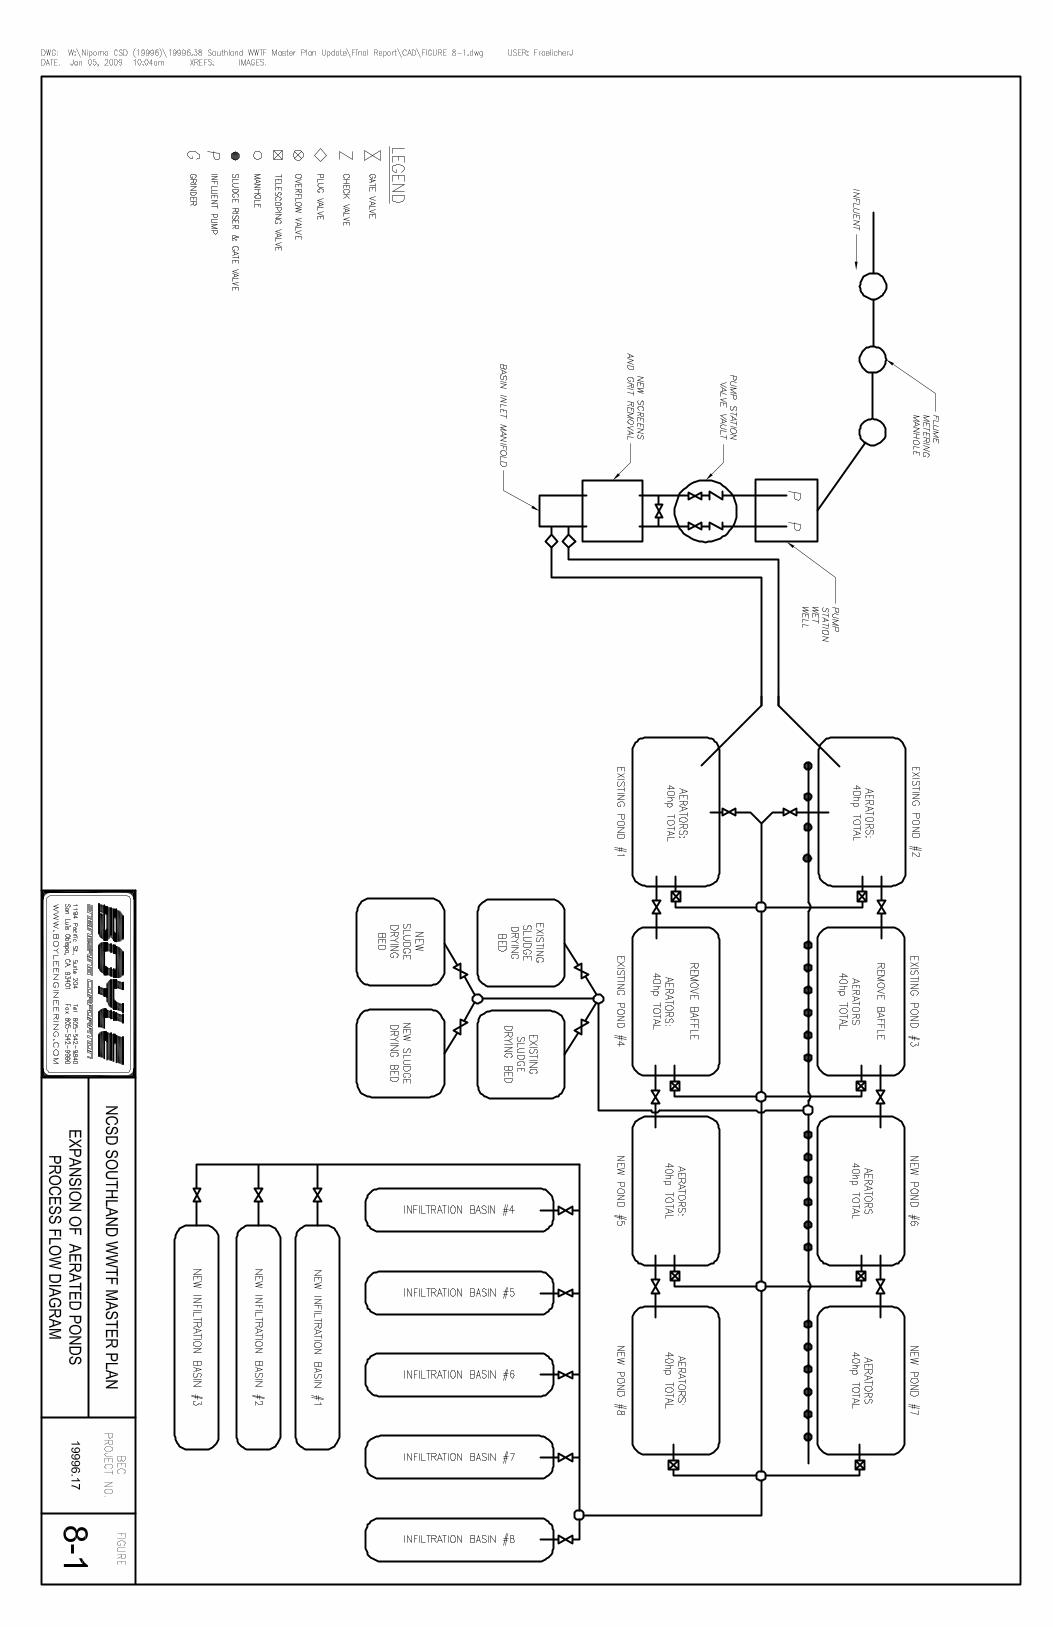

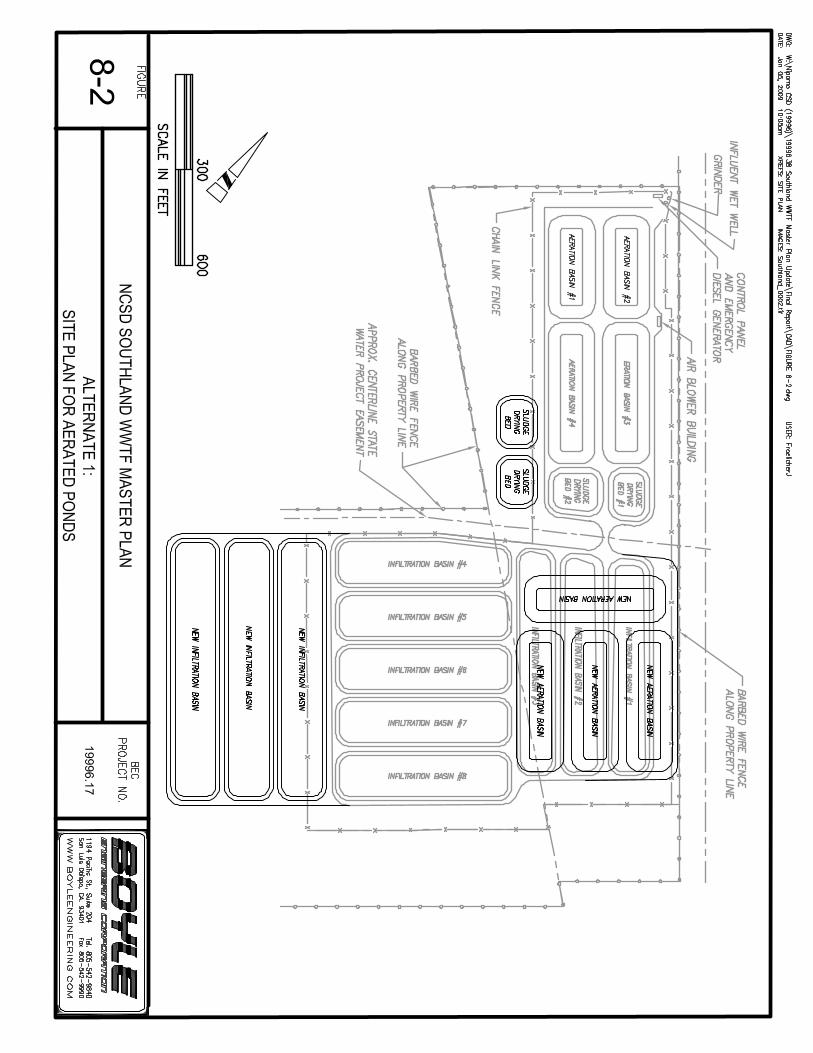


Nipomo Community Services District Southland WWTF Master Plan 63 of 86 January 2009
8.2 Biolac® Conversion
The Parkson Biolac® Wave Oxidation System is an extended aeration process that utilizes a longer solids
retention time (SRT) and moving aeration chains to reduce BOD and TSS concentrations to below 15 mg/L and
total nitrogen to less than 10 mg/L. The extended SRT increases the stability of the system, allowing for
fluctuating loads under similar operating conditions. Airflow to the moving aeration chains can be controlled to
create a wave of aerobic and anoxic zones, resulting in nitrification and denitrification. Multiple fine-bubble
diffusers are mounted on the flexible air tubing suspended across the pond. The flexible Biolac aeration system
maintains the required mixing and suspension of solids at 4 cubic feet per minute per 1000 cubic feet of aeration
basin volume, half that required for a typical stationary aeration system. Appendix D contains additional product
information.
The process flow diagram for a Biolac retrofit and site plan are shown as Figures 8-3 and 8-4. One main
advantage to this option is the high level of treatment provided within a small footprint and relatively lower cost
than comparable technologies. It can be retrofitted into the existing ponds with some piping modifications and
can utilize the existing blowers. To handle the future projected flow rates, two secondary ponds will eventually
need to be converted to Biolac systems. This would include installation of the Wave Oxidation system, which will
each fit within the footprint of a pond, and new secondary clarifiers. A Biolac system in one pond will provide
adequate treatment until the MMF reaches approximately 1.4 mgd, currently projected for 2020, allowing a
phased upgrade. This would leave three aeration ponds for the facility to stay online during the retrofit.
Otherwise, for redundancy, two ponds could be retrofitted with sufficient diffusers to meet the 2020 demands and
additional diffusers could be added later. After the conversion, the unused primary ponds could be used for
sludge holding and digestion. Sand or multi-media filtration can easily be added to the treatment train to provide
a higher quality effluent if required, whereas conventional aerated or facultative pond systems do not produce
effluent quality that is compatible with filtration equipment.
The main disadvantage to a Biolac upgrade is increased maintenance and control requirements, inherent in the
higher level of technology. Blower controls are needed for aeration cycling. The diffuser sheets will need to be
replaced approximately every 5 to 7 years and the air tubing will need replacing about every 7 to 10 years. The
diffuser assemblies are designed for neutral buoyancy, and are lightweight and compact for easy retrieval. For
the level of treatment, Biolac appears the most maintainable when compared with activated sludge and oxidation
ditch systems – simple, accessible parts, relatively inexpensive to replace.
Nipomo Community Services District Southland WWTF Master Plan 64 of 86 January 2009
The life-cycle power and replacement costs for a Biolac system were compared to that of an aerated pond
system. Power consumption and material needs to the year 2030 were determined assuming the systems were
constructed to meet the projected 2030 demands. The cumulative present-worth costs for Biolac would be
approximately $8,015,000, while a pond system would cost approximately $12,700,000. Figure 8-5 summarizes
the comparative, cumulative life cycle costs, assuming the system is built this year. Costs for disposal systems
and sludge drying beds were not included, since it is assumed these facilities would be the same cost for each
alternative. Assumptions are included in the detailed cost opinion in Appendix C.
It should be noted that a Biolac system will require a Grade II Wastewater Treatment Operator for the Chief Plant
Operator (as an extended aeration process), whereas pond systems require only Grade I certification. Therefore,
the District must ensure that a Grade II Operator directs plant operations if Biolac is selected. Shift supervisors
are required to have at least a Grade I certification, and operators are to have an operator-in-training certification
or higher.
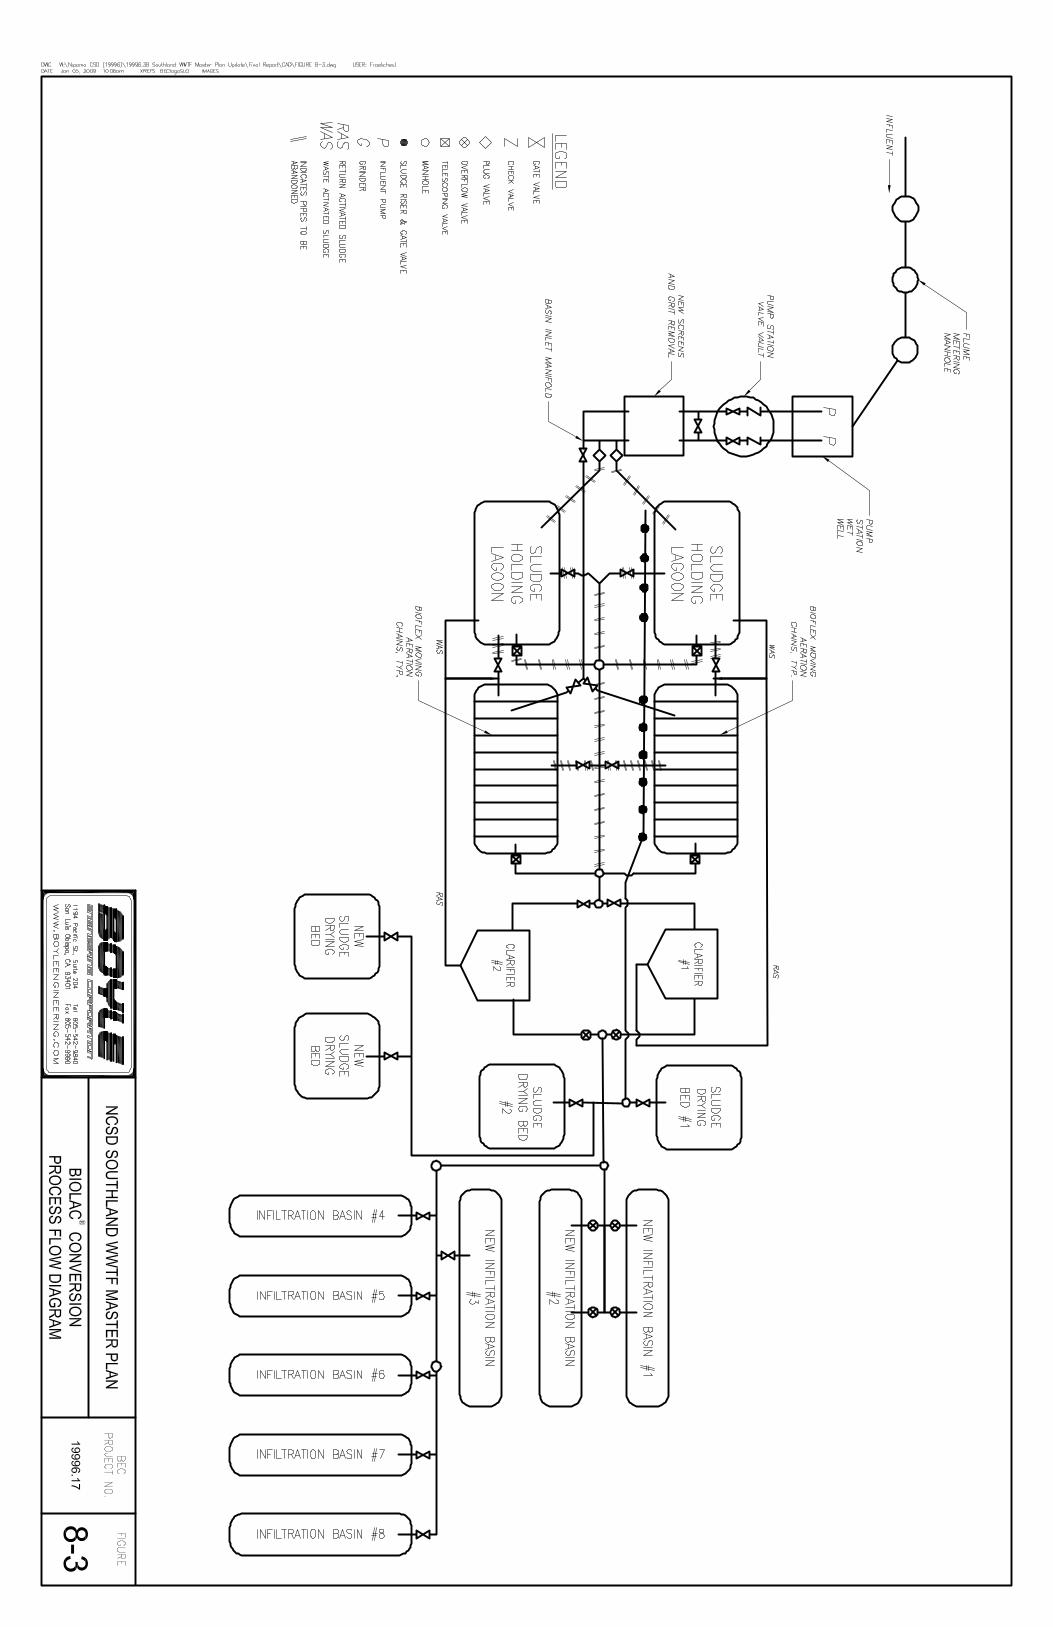

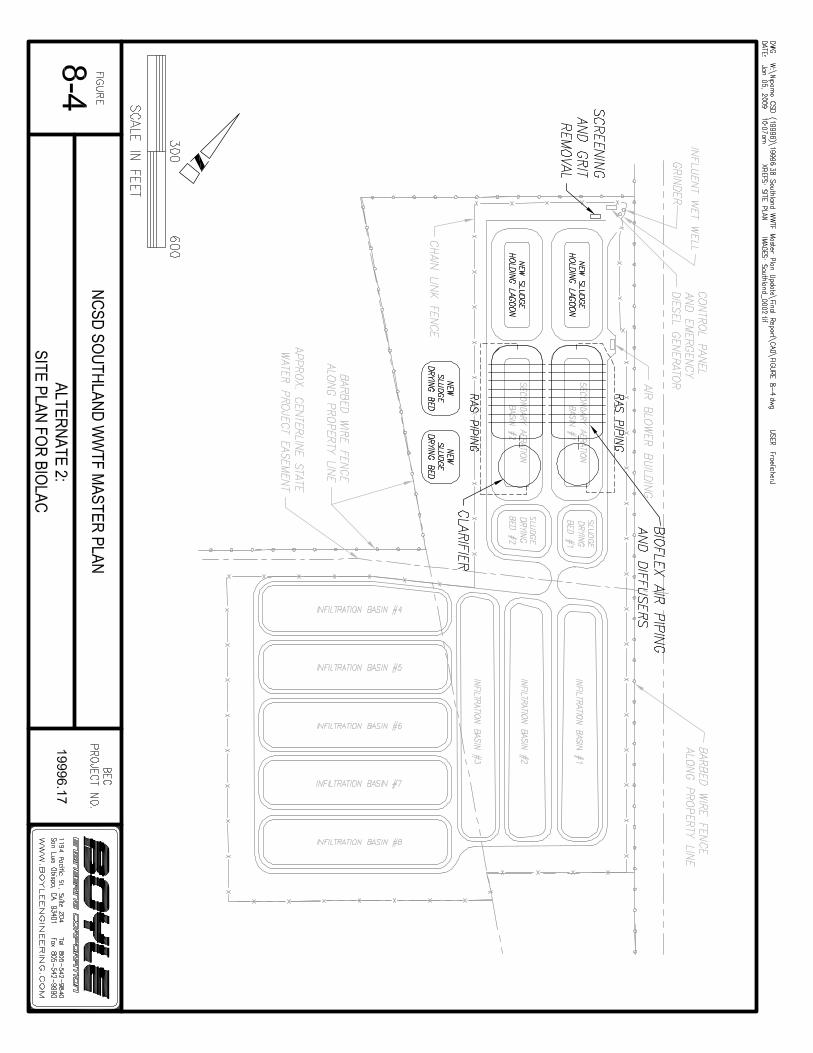


Nipomo Community Services District Southland WWTF Master Plan 67 of 86 January 2009
Comparative Life-Cycle Costs of an Aerated Pond and Biolac System
$4,000,000
$5,000,000
$6,000,000
$7,000,000
$8,000,000
$9,000,000
$10,000,000
$11,000,000
$12,000,000
$13,000,000
$14,000,000
2008 2010 2012 2014 2016 2018 2020 2022 2024 2026 2028 2030
Year
2007
US
Dol
lars
Pond System
Biolac System
Figure 8-5 Comparative Life-Cycle Costs of an Aerated Pond System and a Biolac® System
Costs include capital, power, and parts replacement
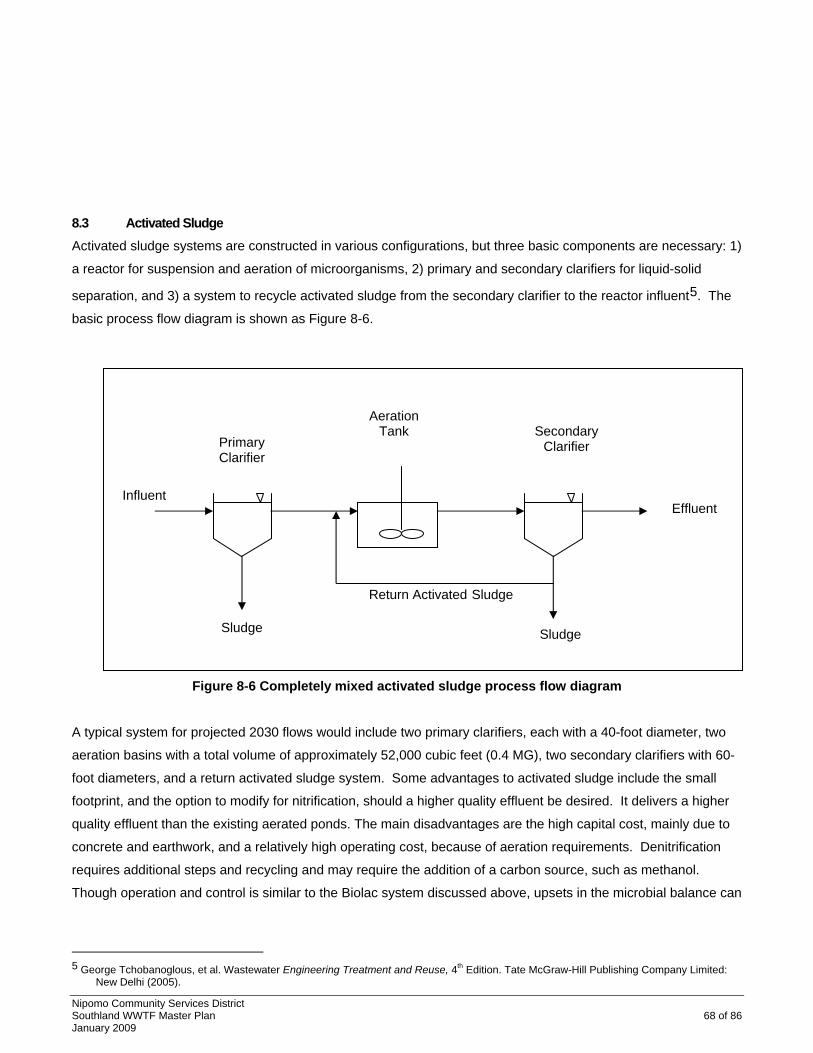
Nipomo Community Services District Southland WWTF Master Plan 68 of 86 January 2009
8.3 Activated Sludge Activated sludge systems are constructed in various configurations, but three basic components are necessary: 1)
a reactor for suspension and aeration of microorganisms, 2) primary and secondary clarifiers for liquid-solid
separation, and 3) a system to recycle activated sludge from the secondary clarifier to the reactor influent5. The
basic process flow diagram is shown as Figure 8-6.
Figure 8-6 Completely mixed activated sludge process flow diagram
A typical system for projected 2030 flows would include two primary clarifiers, each with a 40-foot diameter, two
aeration basins with a total volume of approximately 52,000 cubic feet (0.4 MG), two secondary clarifiers with 60-
foot diameters, and a return activated sludge system. Some advantages to activated sludge include the small
footprint, and the option to modify for nitrification, should a higher quality effluent be desired. It delivers a higher
quality effluent than the existing aerated ponds. The main disadvantages are the high capital cost, mainly due to
concrete and earthwork, and a relatively high operating cost, because of aeration requirements. Denitrification
requires additional steps and recycling and may require the addition of a carbon source, such as methanol.
Though operation and control is similar to the Biolac system discussed above, upsets in the microbial balance can
5 George Tchobanoglous, et al. Wastewater Engineering Treatment and Reuse, 4th Edition. Tate McGraw-Hill Publishing Company Limited:
New Delhi (2005).
Primary Clarifier
Secondary Clarifier
Aeration Tank
Return Activated Sludge
Influent Effluent
Sludge Sludge

Nipomo Community Services District Southland WWTF Master Plan 69 of 86 January 2009
cause operational problems like sludge bulking or foaming more frequently than expected with Biolac. The
relative footprint for an activated sludge system is shown in Figure 8-7.
8.4 Oxidation Ditch An oxidation ditch is a ring-shaped channel equipped with aeration and mixing devices. Influent wastewater is
mixed with return activated sludge in an anoxic chamber to accomplish biological nutrient removal (nitrogen). The
design mimics the kinetics of a completely mixed reactor in the aerated sections, with plug flow along the
channels. The aeration zone, located at a turn in the channel, provides oxidation of BOD and ammonia and
establishes constant flow, driving the mixed liquor along the channels. As wastewater leaves the aeration zone,
oxygen concentrations decrease and denitrification occurs. The process flow diagram for this option is included
as Figure 8-8 and the relative footprint is shown in Figure 8-7.
The Eimco Carrousel® System is an example of a closed loop oxidation ditch reactor. The configuration is
custom designed based on influent characteristics, and aeration and effluent requirements. Aerators are placed
in such a way as to ensure solids suspension in the entire channel. The Eimco Excell™Aerator incorporates a
surface aerator on a common shaft with a lower turbine. The system is designed to be able to draw only 15-30 %
of the nameplate power and maintain sufficient mixing throughout the channel. This allows for the build-out
design to save energy during low influent loadings. Oxidation ditches provide a higher quality effluent than
aerated ponds and can handle fluctuating loads. Disadvantages include the high capital cost due to the great
amount of concrete required and relatively expensive equipment.
Table 8-1 Cost Opinion and Relative Size for Future Treatment Options
Treatment Process Total Capital Cost (2008
US $)
Total Estimated Footprint (acre)
Additional Aeration Ponds (4) $8,680,000 7.8 +
Biolac® Wave Oxidation System $6,014,000 Within 2 existing
secondary ponds Eimo Carrousel 3000 + 2 secondary clarifiers $7,197,000 0.45
Activated Sludge + primary & secondary clarifiers
$7,638,000 0.23

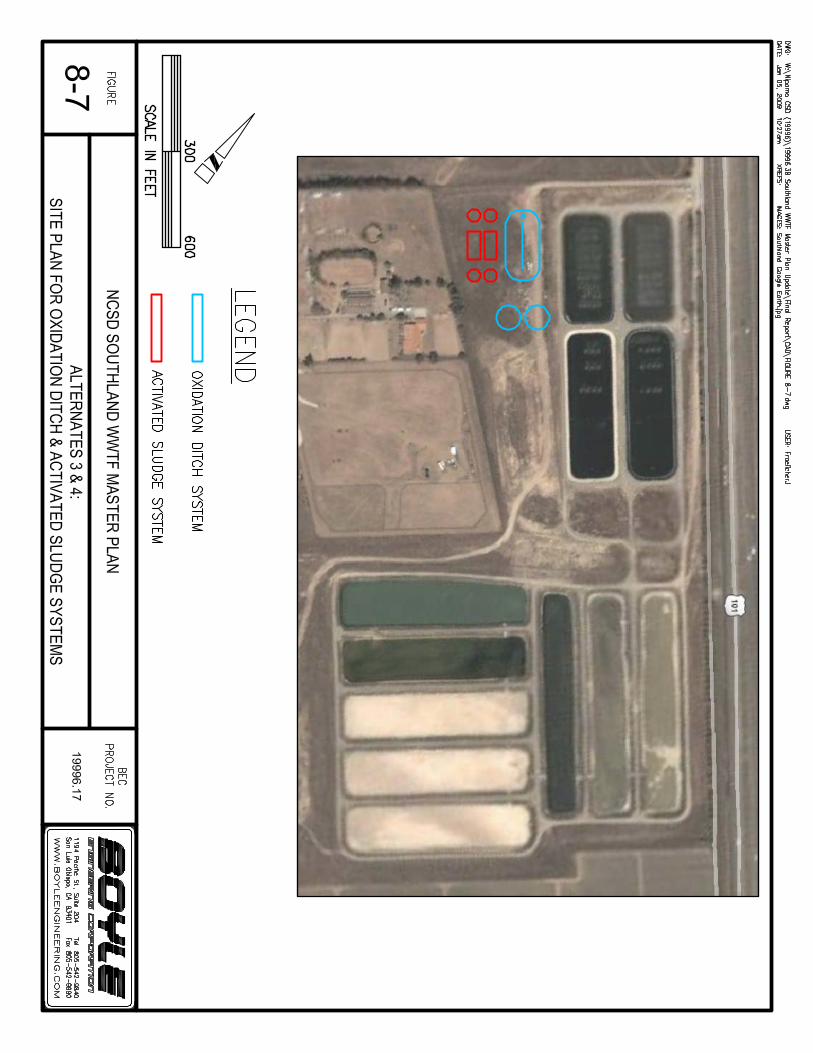

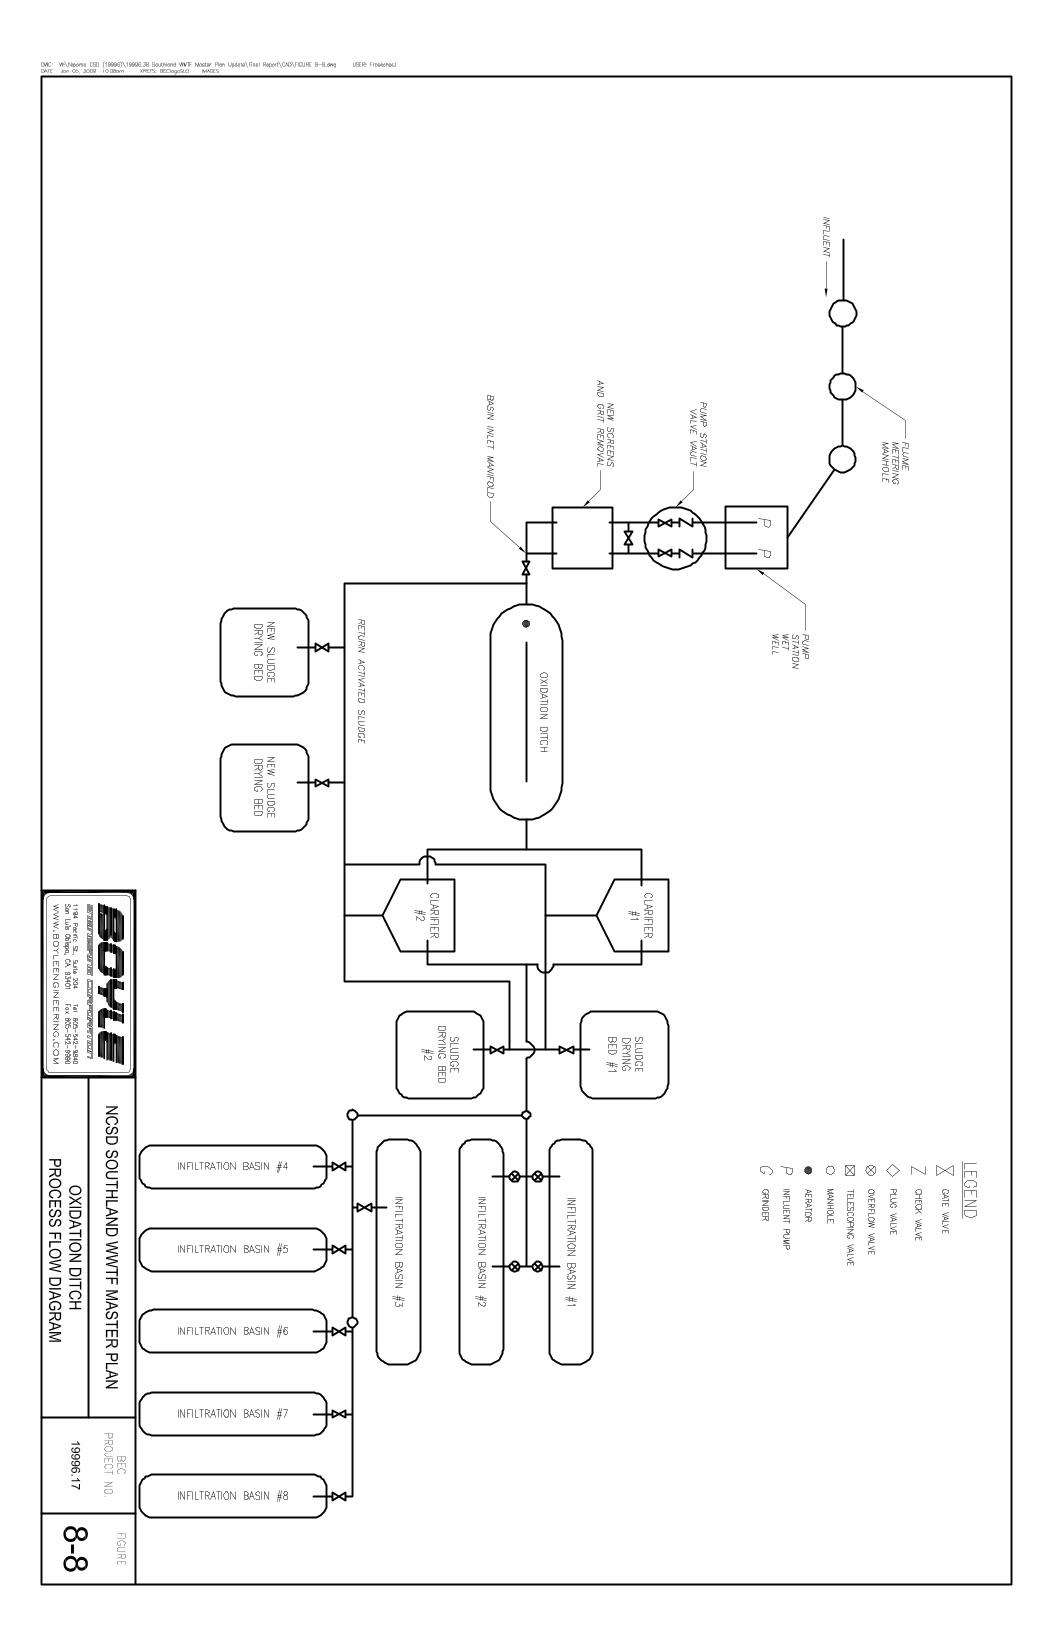

Nipomo Community Services District Southland WWTF Master Plan 72 of 86 January 2009
8.5 Tertiary Treatment The level of treatment will be dictated by water quality goals and regulations and the decided end use, as
discussed in Section 6.0. Section 6.0 evaluates three end uses: unrestricted urban reuse (irrigation of parks),
groundwater recharge reuse, and percolation (the current disposal method). Reuse options will require tertiary
treatment (coagulation, filtration, and disinfection) to meet Title 22 and additional regulatory requirements. Under
the existing WDR, the current disposal method does not require tertiary treatment. However, the current trend in
water quality regulations suggest a higher quality effluent and/or groundwater monitoring may be required to
demonstrate that groundwater is not being negatively impacted at some point in the foreseeable future.
Alternatives for filtration and disinfection were investigated and are discussed below. A detailed cost opinion is
included in Appendix C, and Appendix D contains additional product information for the filtration and UV systems.
In order to provide relatively constant flows to the tertiary treatment systems discussed below, it is assumed the
upstream treatment process will provide flow equalization in order to limit short-term peak flows (such as the PHF)
to the peak day flow (PDF). Pumping facilities to transfer pond effluent to the filters would likely be required for
either alternative, and are included in the cost opinions.
Filtration
Either filtration option would require coagulant feed and mixing equipment upstream of the filters for compliance
with Title 22 requirements. It is assumed that coagulant feed and mixing facilities would cost approximately
$100,000 for 2030 design flows.
Option 1: Advanced Sand Filtration (Parkson Dynasand)
The Dynasand filtration system consists of upflow, modular sand filters with integral backwash. The internal wash
system does not require backwash pumps or wash water storage tanks, reducing energy costs, the need for clean
water storage, and the system footprint. Each filter is continuously backwashed, eliminating the need for
downtime to clean the filters. Dynasand filters have been approved for Title 22 compliance.
To meet 2030 PDF, a minimum of 10 modules are needed. Therefore, we recommend 6 filtration cells with 2
modules per cell. This way one cell could be taken offline at a time without exceeding the maximum allowable
loading rate (5 gpm/ft2) for Title 22 compliance. Arranging the cells in 2 columns with 3 rows, the total
approximate footprint would be 45 feet long by 15 feet wide. The estimated capital cost is approximately
$2,780,000. Construction could be phased with flow demand.
Nipomo Community Services District Southland WWTF Master Plan 73 of 86 January 2009
Option 2: Rotating Disk Filtration (Aqua-Aerobic Aquadisk)
The Aquadisk rotating disk filter system uses nylon pile cloth media. Backwashing occurs at a predetermined
water level or time without interrupting treatment. Filters arrive completely assembled in a stainless steel tank.
Each unit includes a vacuum backwash, a hopper-bottom tank, a solids removal manifold system, and a fully
automatic PLC-based control system. Two 10-disk filters are recommended to provide 100% redundancy. The
system was sized to meet 2030 PDF. Each unit is approximately 10 feet wide, 20 feet long and 10 feet high. The
estimated capital cost for the system is approximately $2,020,000.
Disinfection
Option 1: Chlorine Contact Basin
For chlorine disinfection, 90-minutes of contact time (at PDF) is required to meet Title 22 standards. To provide
this level of treatment, the basin will need a volume of 27,900 ft3. We recommend two parallel channels for
redundancy and ease of maintenance. Chlorine dosing and monitoring equipment will be needed. The dosing
can be paced off the influent flow meter. The estimated capital cost for a chlorine disinfection system is
approximately $1,750,000.
Option 2: UV Disinfection
The Trojan UV3000 Plus™ is a reliable and proven disinfection system that uses low pressure, high output
variable power amalgam lamps. The system was designed with an emphasis on dependable performance and
simplified maintenance. It is equipped with an automatic chemical/mechanical cleaning system, called
ActiClean™, consisting of submersible wiper assemblies with on each UV module. ActiClean™ maintains 95%
sleeve transmittance and works while the system is in operation, eliminating the need to go offline for cleaning.
To meet design flow for 2030, a system with five banks (four duty, one redundant) is recommended, with nine 8-
lamp modules per bank, for a total of 360 lamps. The total estimated capital cost for this option is approximately
$4,550,000.
8.6 Solids Handling The additional biological activity of any of the extended aeration processes discussed (Biolac®, oxidation ditch, or
activated sludge) provides a higher level of treatment and produces a greater volume of sludge than the existing
aerated pond system. This will require additional storage space for solids handling. If the District pursues
activated sludge or oxidation ditch treatment, all of the existing aerated ponds will be available and could be used
for sludge treatment and storage.

Nipomo Community Services District Southland WWTF Master Plan 74 of 86 January 2009
A Biolac system retrofit (least capital cost option) will leave the two primary ponds for use. Odor control can be
provided by maintaining an aerated, 2- to 4-foot depth of water over the sludge. This would require the
installation of two (2) 10-hp brush aerators in each pond. We recommend the District budget for approximately
$100,000 ($50,000 per pond) in addition to the capital cost shown in Table 8.1 for aerators and other
miscellaneous equipment needed to convert the primary ponds to sludge lagoons.
The sludge produced from a Biolac system at Year 2030 conditions was calculated as an example. Biolac
typically yields 0.6 pounds of solids per pound of BOD removed. Assuming the influent BOD5 concentration is
equal to the average BOD5 concentration (265 mg/L), TSS is 319 mg/L (70% as fixed solids), and Biolac reduces
BOD5 to 5 mg/L, approximately 3500 pounds of sludge would be produced per day during average flow
conditions. Assuming 2% solids, the volume of sludge produced would be approximately 2800 ft3 per day. Over
time, it is expected that the sludge concentration in the ponds would compress, resulting an average of 6% solids
(assuming negligible anaerobic degradation of sludge).
With three feet for freeboard, each primary pond has a total volume of 424,000 ft3. At 2% solids, the ponds can
provide a minimum of 150 days of storage each (approximately 10 months total). If solids reach 6% within the
first year of storage, the ponds may store approximately 2 years of sludge at 2030 flows. It is assumed the sludge
would be removed by a portable pump and conveyed through temporary sludge piping to the District’s sludge
drying beds.
Although the District has used the existing drying beds successfully for many years, we recommend upgrading
them. The beds are not lined, and any infiltration through the bottom of the beds could contribute to groundwater
degradation. In addition, the beds will be used more regularly in the future and should be lined with concrete to
allow vehicles and equipment to work in the ponds without getting stuck. Therefore, initially (during construction
of the Phase I Biolac improvements – in the next 2 years) we recommend lining the beds with concrete and
installing a decanting pump station for dewatering the beds and conveying supernatant back to the plant’s
headworks for treatment. This will provide the District with maximum use of their drying beds, by regularly
removing any liquid volume from the ponds and leaving more volume for receiving sludge from the holding ponds.
Actively “working” the sludge in drying beds can remove 50-75% of the water from the sludge. At 2030 demands,
one year of “dried” sludge (50% solids) would occupy approximately 50% of the proposed drying bed volume, and
would require approximately 140 standard 10-cy truck trips for removal. If solids content is increased to 75%
through continual compression, raking, and further evaporation, this would be reduced to 70 truck trips.
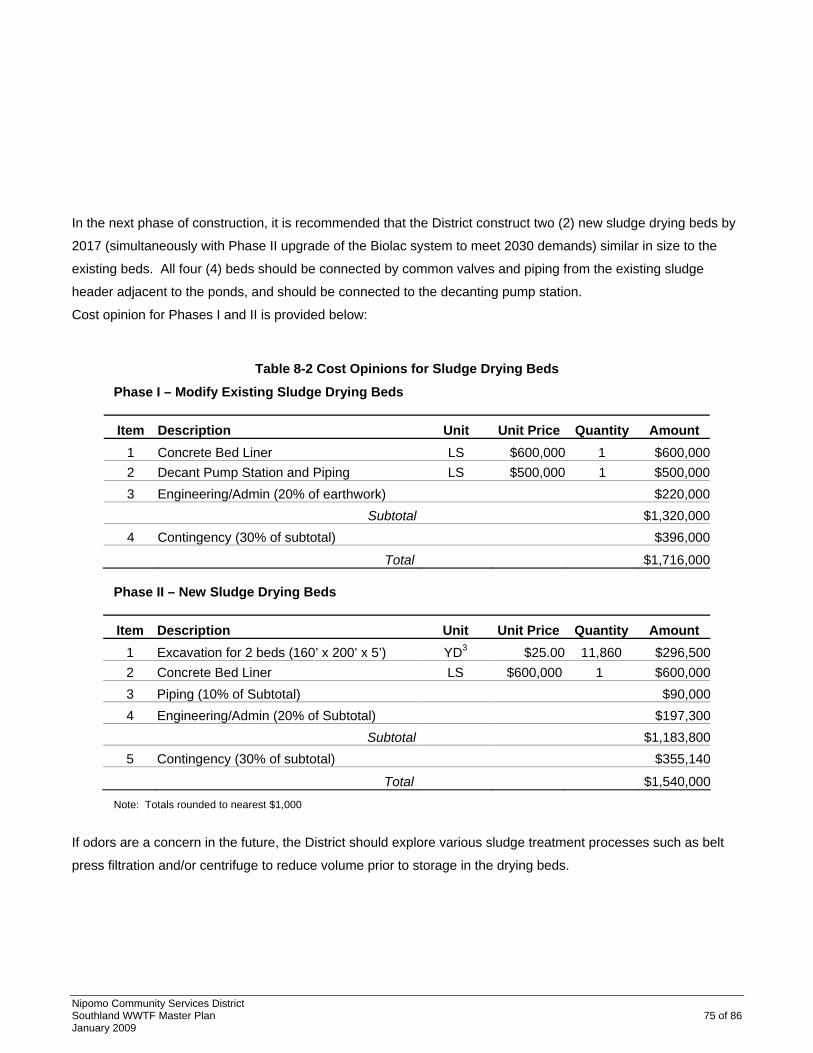
Nipomo Community Services District Southland WWTF Master Plan 75 of 86 January 2009
In the next phase of construction, it is recommended that the District construct two (2) new sludge drying beds by
2017 (simultaneously with Phase II upgrade of the Biolac system to meet 2030 demands) similar in size to the
existing beds. All four (4) beds should be connected by common valves and piping from the existing sludge
header adjacent to the ponds, and should be connected to the decanting pump station.
Cost opinion for Phases I and II is provided below:
Table 8-2 Cost Opinions for Sludge Drying Beds
Phase I – Modify Existing Sludge Drying Beds
Phase II – New Sludge Drying Beds
Note: Totals rounded to nearest $1,000
If odors are a concern in the future, the District should explore various sludge treatment processes such as belt
press filtration and/or centrifuge to reduce volume prior to storage in the drying beds.
Item Description Unit Unit Price Quantity Amount 1 Concrete Bed Liner LS $600,000 1 $600,0002 Decant Pump Station and Piping LS $500,000 1 $500,0003 Engineering/Admin (20% of earthwork) $220,000 Subtotal $1,320,0004 Contingency (30% of subtotal) $396,000
Total $1,716,000
Item Description Unit Unit Price Quantity Amount 1 Excavation for 2 beds (160’ x 200’ x 5’) YD3 $25.00 11,860 $296,5002 Concrete Bed Liner LS $600,000 1 $600,0003 Piping (10% of Subtotal) $90,0004 Engineering/Admin (20% of Subtotal) $197,300 Subtotal $1,183,8005 Contingency (30% of subtotal) $355,140
Total $1,540,000
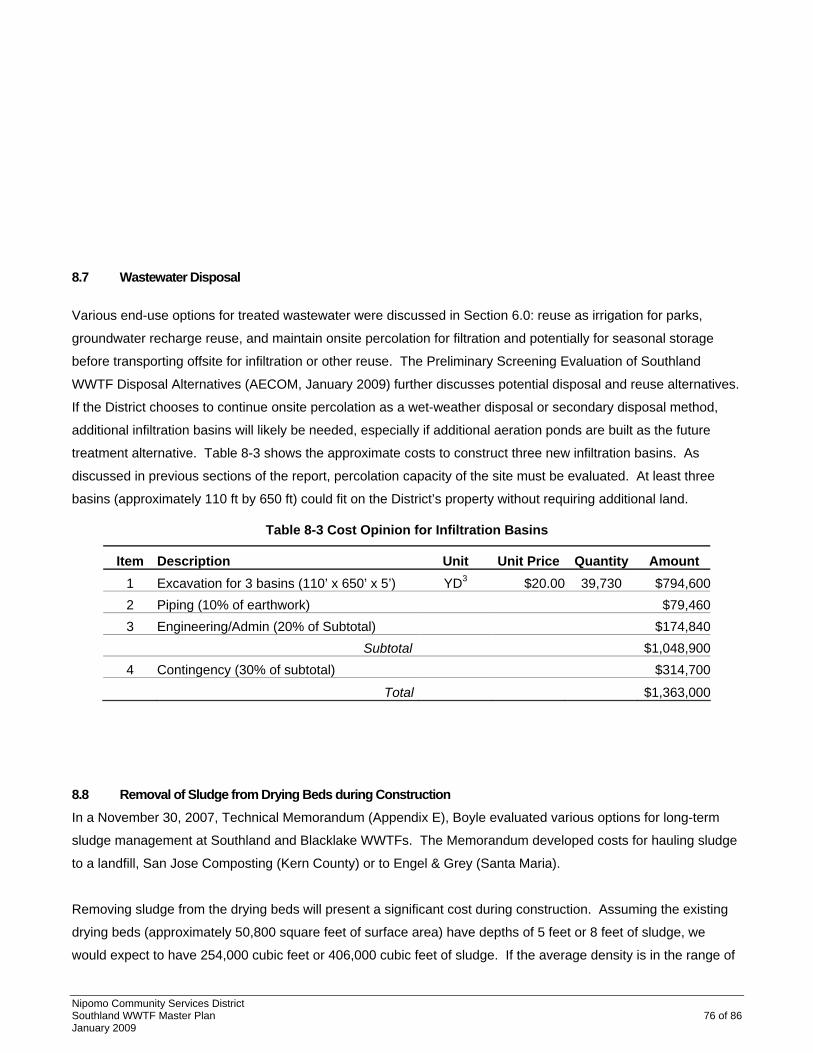
Nipomo Community Services District Southland WWTF Master Plan 76 of 86 January 2009
8.7 Wastewater Disposal Various end-use options for treated wastewater were discussed in Section 6.0: reuse as irrigation for parks,
groundwater recharge reuse, and maintain onsite percolation for filtration and potentially for seasonal storage
before transporting offsite for infiltration or other reuse. The Preliminary Screening Evaluation of Southland
WWTF Disposal Alternatives (AECOM, January 2009) further discusses potential disposal and reuse alternatives.
If the District chooses to continue onsite percolation as a wet-weather disposal or secondary disposal method,
additional infiltration basins will likely be needed, especially if additional aeration ponds are built as the future
treatment alternative. Table 8-3 shows the approximate costs to construct three new infiltration basins. As
discussed in previous sections of the report, percolation capacity of the site must be evaluated. At least three
basins (approximately 110 ft by 650 ft) could fit on the District’s property without requiring additional land.
Table 8-3 Cost Opinion for Infiltration Basins
Item Description Unit Unit Price Quantity Amount 1 Excavation for 3 basins (110’ x 650’ x 5’) YD3 $20.00 39,730 $794,6002 Piping (10% of earthwork) $79,4603 Engineering/Admin (20% of Subtotal) $174,840 Subtotal $1,048,9004 Contingency (30% of subtotal) $314,700
Total $1,363,000
8.8 Removal of Sludge from Drying Beds during Construction In a November 30, 2007, Technical Memorandum (Appendix E), Boyle evaluated various options for long-term
sludge management at Southland and Blacklake WWTFs. The Memorandum developed costs for hauling sludge
to a landfill, San Jose Composting (Kern County) or to Engel & Grey (Santa Maria).
Removing sludge from the drying beds will present a significant cost during construction. Assuming the existing
drying beds (approximately 50,800 square feet of surface area) have depths of 5 feet or 8 feet of sludge, we
would expect to have 254,000 cubic feet or 406,000 cubic feet of sludge. If the average density is in the range of
Nipomo Community Services District Southland WWTF Master Plan 77 of 86 January 2009
10-30% solids at a specific gravity of 1.06, we would anticipate the volumes are equivalent to 1,100 and 1,800
tons, respectively.
It is unlikely a composting facility will take these solids since there is no grit removal or screening at the plant, but
the landfill might take them. Since landfill and composting facilities’ policies may change in the next year, it is
recommended that this analysis be reviewed and revised prior to beginning plant construction.
The budget numbers summarized below are considered to be an adequate, current planning-level cost for hauling
solids to a landfill. Reducing volume by drying these solids will decrease hauling and tipping costs:
• Excavation of Sludge (5-ft Depth) = $100,000 ($10 per cubic yard)
• Excavation of Sludge (8-ft Depth) = $150,000 ($15 per cubic yard)
• Total Tipping and Hauling Cost per Truck Load = $1,500 ($1330 from 2007 Technical Memorandum
with 10% Escalation)
• Total Sludge Disposal Cost (5-ft Depth = 45 Loads) = $170,000
• Total Sludge Disposal Cost (8-ft Depth = 72 Loads) = $260,000
8.9 Alternative Energy Supply The District is interested in pursuing alternative energy to provide power for the expanded Southland WWTF. A
proposal received from SPG Solar (See Appendix F) described a 500-kW solar array that could be placed on a
3.5 acre area adjacent to the existing plant. If implemented, the SPG project would cost approximately
$4,010,000 in capital cost or a Power Purchase Agreement could be executed between the District and SPG
Solar to provide approximately 1,000,000 kWh/yr at around $0.11/kWh with 3% annual escalation or $0.105/kWh
with 4% annual escalation. The SPG proposal does not include site preparation, fencing, lighting, drainage, or
other improvements beyond installation of the solar arrays and electrical conduits to the plant’s control center.
Although this proposal is included for budgetary purposes, an evaluation of solar power alternatives should be
performed prior to implementing a project. No analysis has been performed on the SPG Solar proposal and it is
unknown if it would be appropriate for providing power to the proposed treatment project.

Nipomo Community Services District Southland WWTF Master Plan 78 of 86 January 2009
8.10 Recommendations The WWTF will require an upgrade to handle future demands. Several processes were evaluated. When
compared to the aerated pond system, a Biolac® system can provide a higher level of treatment at a lower capital
and operating cost. It requires a higher degree of operator involvement than the current system, but routine
operations and maintenance are less complex than the other, more expensive treatment technologies reviewed
herein (oxidation ditch and activated sludge).
We recommend installing sufficient aeration capacity to meet 75% of 2030 demands in Phase I of plant upgrades,
as well as lining the existing sludge drying beds and installing a decanting pump station 6. Ponds 3 and 4 should
be relined and retrofit with Biolac wave oxidation systems and clarifiers should be constructed. The existing
primary ponds should be used for onsite sludge storage and anaerobic reduction prior to drying.
Phase II would involve upgrading the Biolac system capacity to meet 2030 demands and installing two additional
lined sludge drying beds.
Three (3) infiltration basins, similar in size to the existing ponds, could fit on the existing WWTF site. The ultimate
capacity of the existing and new ponds should be determined so the District can decide whether to use the onsite
infiltration basins as filtration and potentially “wet-weather” storage prior to offsite infiltration or some reuse
alternative.
6 Phase I improvements meet Scenario 1 demands from the Water and Sewer Master Plan Update (Cannon Associates, December 2007).

Nipomo Community Services District Southland WWTF Master Plan 79 of 86 January 2009
9.1 Conclusions The Southland WWTF is approaching the permitted capacity (MMF = 900,000 gpd). Flowrates could reach this
limit as early as 2010 and the WWTF is expected to exceed effluent quality limits (average monthly BOD5 = 60
mg/L) in 2011 during high flow conditions. An upgrade is required to handle future demands and water quality
goals. The District should work with RWQCB to develop a phased approach to upgrading the Wastewater
Treatment Facility. A schedule for this work is outlined in Section 10.0.
Water quality goals will dictate future plant process improvements. Feasible usage options include direct reuse
(irrigation) and offsite infiltration (disposal). Based on conversations with RWQCB staff, and review of Basin Plan
criteria, more stringent discharge requirements to eliminate impacts on groundwater are inevitable. These
requirements may include nitrogen limits and salts limits in the future. The existing treatment process is not
adequate to meet water quality goals that are more stringent than the current discharge requirements, including
requirements for tertiary treatment (for park/school irrigation) or pretreatment requirements for future salts
removal if required.
An examination of existing and future hydraulic demands on the system revealed deficiencies as discussed
below:
• The capacity of the Frontage Road trunk main is inadequate for existing conditions;
• The influent pumps can meet projected flow demands through 2015, however the wetwell is undersized
for existing demands and may cause excessive motor wear. The influent pump station will not meet 2030
demands.
• The plant is nearing its rated capacity, and could exceed permitted flow limits by 2010, according to the
flow projections presented in this report.
Four alternatives were evaluated for the WWTF treatment upgrade: additional aerated ponds, Biolac® wave
oxidation system, oxidation ditch, and conventional activated sludge. The first option is an extension of the
current treatment process at the plant. The following three are variations of activated sludge technology, which
provides a higher quality effluent and a basis for tertiary treatment. The Biolac system provides extended
aeration at a lower cost than any of the other three alternatives examined. Life cycle costs are approximately half
that of a pond system. Additional treatment can be easily added to the process train, providing flexibility for the
potential of tertiary treatment.
9.0 CONCLUSIONS & RECOMMENDATIONS
Nipomo Community Services District Southland WWTF Master Plan 80 of 86 January 2009
9.2 Recommendations As discussed in previous sections, we recommend the following as a result of our analysis in this Master Plan:
• Begin planning and permitting efforts for a wastewater treatment plant expansion as soon as possible;
• The District should consult with RWQCB to acquire either interim adjustment to effluent limits, or to
permitted flows, during planning and design of a treatment facility expansion. They should also seek
RWQCB support on the recommendations and schedule presented in this Master Plan. Details are
discussed in Section 8.0.
• If reuse is an option, a user survey should be conducted to see if a viable market for irrigation is available.
(See Preliminary Screening Evaluation of Southland WWTF Disposal Alternatives, ibid, for additional
discussion).
• Since expansion of percolation area may be required on an interim basis, regardless of future reuse
opportunities, we recommend assessing available onsite percolation capacity and evaluating groundwater
conditions beneath the plant.
• Screening and grit removal systems will improve treatment and reduce wear on system components. We
recommend installing two (2) shaftless screw screens and two (2) vortex-type grit removal vaults.
• Sludge in the drying beds will need to be removed before construction. As discussed in Section 8.8,
volume is estimated between 254,000 and 406,000 ft3 and the weight between 1,100 and 1,800 tons,
respectively.
• Biolac® is the recommended wastewater treatment process based on capability to meet more stringent
discharge limits; nitrogen removal capabilities; low level of complexity compared with activated sludge
systems; and low capital/lifecycle costs compared with the other alternatives evaluated herein. Ponds 3
and 4 should be relined and retrofitted with the Biolac wave oxidation system. External clarifiers will also
be required. The system should be constructed in two phases – Phase I would provide 75% of the 2030
capacity 7, and Phase II would meet 2030 demands.
• The District should have a Class II Operator managing the Biolac system.
• The primary treatment ponds should be converted to aerated sludge holding lagoons.
• The two existing drying beds should be lined and a decanting pump station should be provided. Two
additional drying beds should be constructed to meet 2030 solids handling demands. If odors become a
concern in the future, due to increase in development around the plant site, more rigorous solids
processing may be required.
7 Phase I improvements meet Scenario 1 demands from the Water and Sewer Master Plan Update (Canon Associates, December 2007).
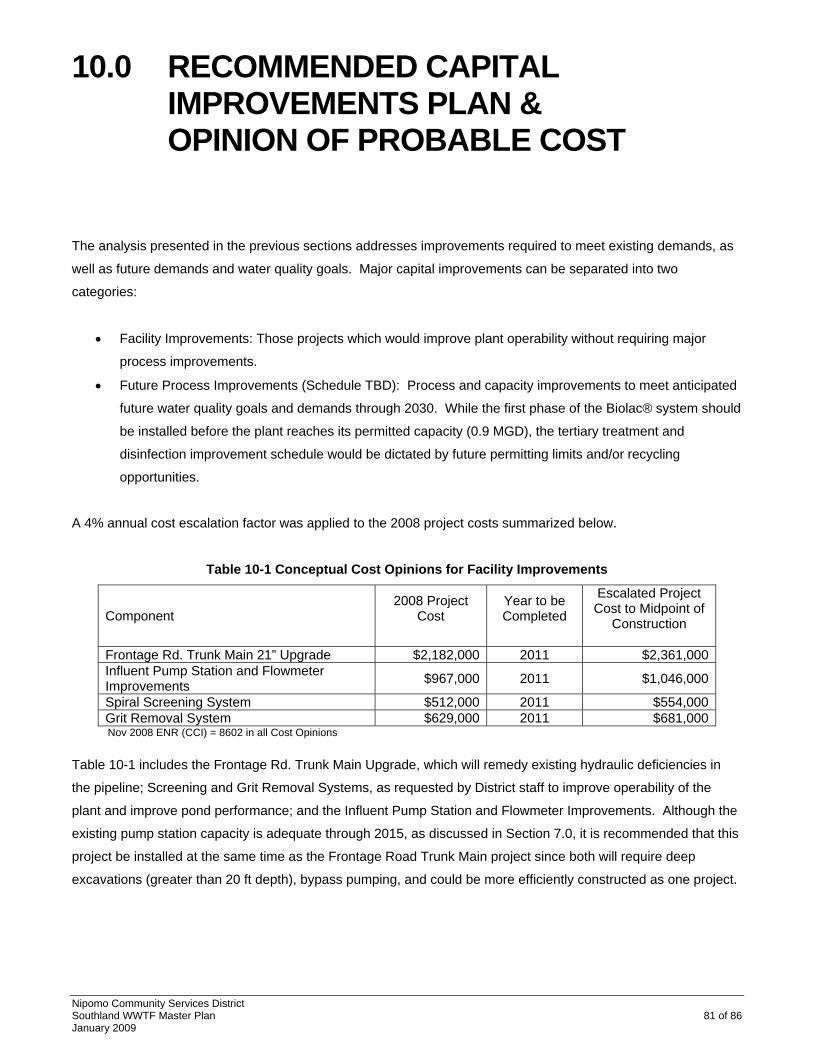
Nipomo Community Services District Southland WWTF Master Plan 81 of 86 January 2009
The analysis presented in the previous sections addresses improvements required to meet existing demands, as
well as future demands and water quality goals. Major capital improvements can be separated into two
categories:
• Facility Improvements: Those projects which would improve plant operability without requiring major
process improvements.
• Future Process Improvements (Schedule TBD): Process and capacity improvements to meet anticipated
future water quality goals and demands through 2030. While the first phase of the Biolac® system should
be installed before the plant reaches its permitted capacity (0.9 MGD), the tertiary treatment and
disinfection improvement schedule would be dictated by future permitting limits and/or recycling
opportunities.
A 4% annual cost escalation factor was applied to the 2008 project costs summarized below.
Table 10-1 Conceptual Cost Opinions for Facility Improvements
Component 2008 Project
Cost
Year to be Completed
Escalated Project Cost to Midpoint of
Construction
Frontage Rd. Trunk Main 21” Upgrade $2,182,000 2011 $2,361,000Influent Pump Station and Flowmeter Improvements $967,000 2011 $1,046,000
Spiral Screening System $512,000 2011 $554,000Grit Removal System $629,000 2011 $681,000Nov 2008 ENR (CCI) = 8602 in all Cost Opinions
Table 10-1 includes the Frontage Rd. Trunk Main Upgrade, which will remedy existing hydraulic deficiencies in
the pipeline; Screening and Grit Removal Systems, as requested by District staff to improve operability of the
plant and improve pond performance; and the Influent Pump Station and Flowmeter Improvements. Although the
existing pump station capacity is adequate through 2015, as discussed in Section 7.0, it is recommended that this
project be installed at the same time as the Frontage Road Trunk Main project since both will require deep
excavations (greater than 20 ft depth), bypass pumping, and could be more efficiently constructed as one project.
10.0 RECOMMENDED CAPITAL IMPROVEMENTS PLAN & OPINION OF PROBABLE COST
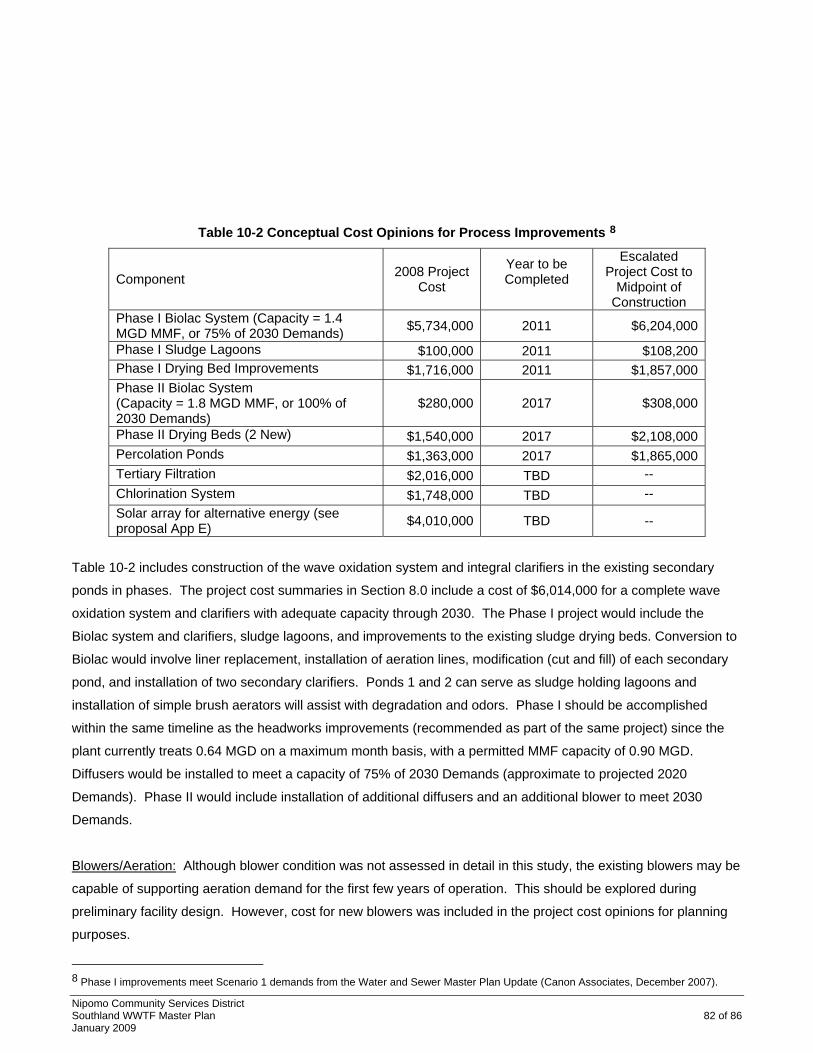
Nipomo Community Services District Southland WWTF Master Plan 82 of 86 January 2009
Table 10-2 Conceptual Cost Opinions for Process Improvements 8
Component 2008 Project Cost
Year to be Completed
Escalated Project Cost to
Midpoint of Construction
Phase I Biolac System (Capacity = 1.4 MGD MMF, or 75% of 2030 Demands) $5,734,000 2011 $6,204,000
Phase I Sludge Lagoons $100,000 2011 $108,200Phase I Drying Bed Improvements $1,716,000 2011 $1,857,000Phase II Biolac System (Capacity = 1.8 MGD MMF, or 100% of 2030 Demands)
$280,000 2017 $308,000
Phase II Drying Beds (2 New) $1,540,000 2017 $2,108,000Percolation Ponds $1,363,000 2017 $1,865,000Tertiary Filtration $2,016,000 TBD -- Chlorination System $1,748,000 TBD -- Solar array for alternative energy (see proposal App E) $4,010,000 TBD --
Table 10-2 includes construction of the wave oxidation system and integral clarifiers in the existing secondary
ponds in phases. The project cost summaries in Section 8.0 include a cost of $6,014,000 for a complete wave
oxidation system and clarifiers with adequate capacity through 2030. The Phase I project would include the
Biolac system and clarifiers, sludge lagoons, and improvements to the existing sludge drying beds. Conversion to
Biolac would involve liner replacement, installation of aeration lines, modification (cut and fill) of each secondary
pond, and installation of two secondary clarifiers. Ponds 1 and 2 can serve as sludge holding lagoons and
installation of simple brush aerators will assist with degradation and odors. Phase I should be accomplished
within the same timeline as the headworks improvements (recommended as part of the same project) since the
plant currently treats 0.64 MGD on a maximum month basis, with a permitted MMF capacity of 0.90 MGD.
Diffusers would be installed to meet a capacity of 75% of 2030 Demands (approximate to projected 2020
Demands). Phase II would include installation of additional diffusers and an additional blower to meet 2030
Demands.
Blowers/Aeration: Although blower condition was not assessed in detail in this study, the existing blowers may be
capable of supporting aeration demand for the first few years of operation. This should be explored during
preliminary facility design. However, cost for new blowers was included in the project cost opinions for planning
purposes.
8 Phase I improvements meet Scenario 1 demands from the Water and Sewer Master Plan Update (Canon Associates, December 2007).

Nipomo Community Services District Southland WWTF Master Plan 83 of 86 January 2009
Solids Handling Facilities: At the same time the Phase I Biolac project is constructed, we recommend converting
the existing primary treatment ponds to aerated sludge holding lagoons, lining the District’s existing drying beds,
and constructing a decanting pump station. Two additional drying beds would be installed if needed prior to 2015,
or in conjunction with the Phase II Biolac expansion in 2015.
If odors become a concern near the plant site, additional solids handling facilities (such as a centrifuge or belt
press) may be required to process sludge before storing or drying it onsite.
Disposal or Reuse Option: Evaluating potential discharge, percolation, or reuse opportunities will require further
investigation by the District. Currently, the District is investigating potential disposal and reuse opportunities
through the Preliminary Screening Evaluation of Southland WWTF Disposal Alternatives (ibid).


Nipomo Community Services District Southland WWTF Master Plan 84 of 86 January 2009
The objectives of this section are 1) to establish guidelines for determining the value of the existing facilities at
Southland WWTF that would remain in service for future demands, and 2) to recommend a cost allocation
strategy for existing ratepayers and new development to assist in funding Phase I WWTF improvements. 9
Use of Existing Facilities
The process schematic of the existing WWTF is included as Figure 4-1. If the Biolac® System is installed, all the
basins, drying beds, and percolation ponds will remain in service with the recommended upgrades. However, the
influent trunk main, flow meter, and pump station will be replaced. The grinder will be replaced with screening
and grit removal systems in order to reduce the amount of solids in the influent and resulting wear on equipment.
The recommended process improvement, a Biolac® system, utilizes two of the four existing aerated ponds as
basins (the two larger, secondary aeration ponds). The flow diagram and site plan (with the existing facilities in
gray) for the Biolac® retrofit are included as Figures 8-3 and 8-4. With this alternative, the mechanical aerators
will be replaced with a Wave Oxidation™ system and clarifiers. Existing aeration piping will be abandoned or
removed. The District will be able to use the blower building and three existing blowers, but may need to add or
replace some in the future as demand increases. The Biolac® upgrade is recommended in phases as discussed
in Section 10.
With increased biological treatment of any extended aeration processes, a greater amount of sludge will be
produced than is currently generated. The two existing primary aerated ponds would be operated as sludge
holding lagoons to provide treatment and storage. The aeration system will need to be removed and brush
aerators will be added to maintain an aerated layer of water over the sludge.
The two existing sludge drying beds will continue in service. In order to meet increased demands, we
recommend adding concrete liners and a decanting pump station for dewatering the beds and conveying the
supernatant back to the plant’s headworks for treatment. This retrofit is recommended to coincide with the Phase
I Biolac improvements (see Table 11-2). During the second phase of construction, two new drying beds should
be installed to ensure storage and dewatering capacity for buildout demands.
The WWTF currently uses onsite infiltration basins for final treatment and disposal of the effluent. Continued
onsite percolation is assumed in this report, but pending studies and future policy direction regarding wastewater
9 Though Phase II improvements are discussed in this report, the cost-sharing strategy was developed only for Phase I at this time based on
direction from the Board during the April 11, 2007 NCSD Board Meeting.
11.0 BASIS FOR ASSESSMENT OF RATES & FEES
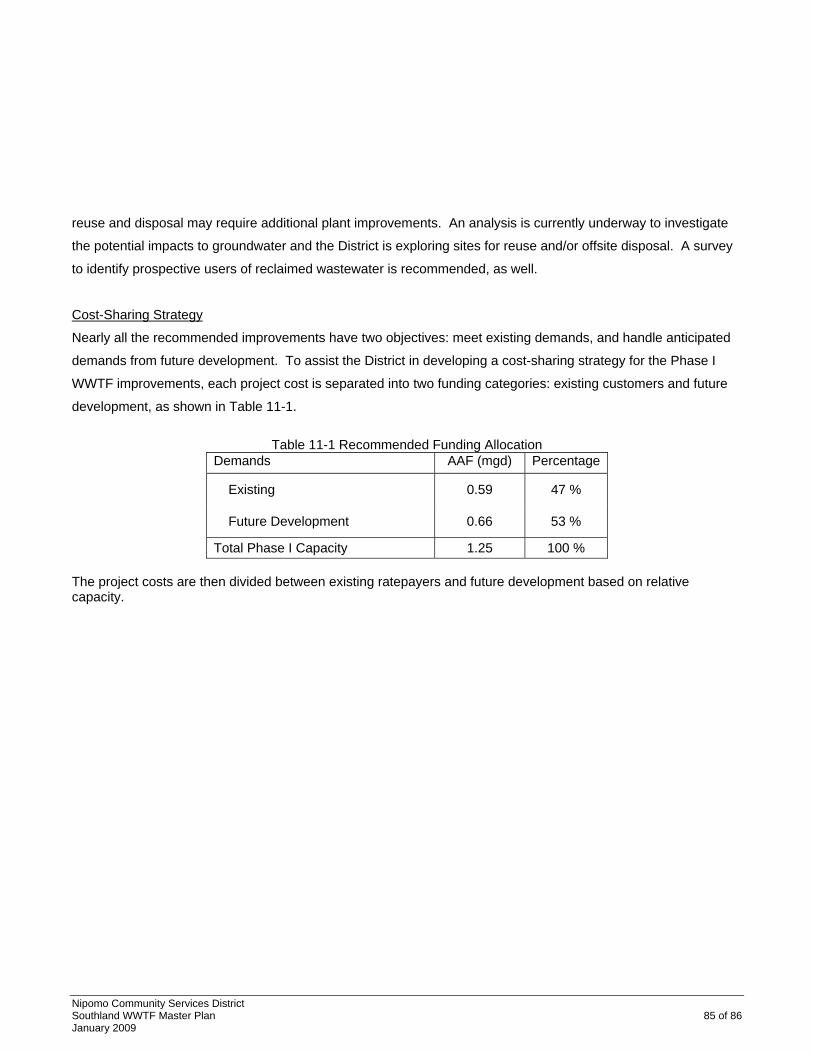
Nipomo Community Services District Southland WWTF Master Plan 85 of 86 January 2009
reuse and disposal may require additional plant improvements. An analysis is currently underway to investigate
the potential impacts to groundwater and the District is exploring sites for reuse and/or offsite disposal. A survey
to identify prospective users of reclaimed wastewater is recommended, as well.
Cost-Sharing Strategy
Nearly all the recommended improvements have two objectives: meet existing demands, and handle anticipated
demands from future development. To assist the District in developing a cost-sharing strategy for the Phase I
WWTF improvements, each project cost is separated into two funding categories: existing customers and future
development, as shown in Table 11-1.
Table 11-1 Recommended Funding Allocation
Demands AAF (mgd) Percentage
Existing 0.59 47 %
Future Development 0.66 53 %
Total Phase I Capacity 1.25 100 % The project costs are then divided between existing ratepayers and future development based on relative capacity.
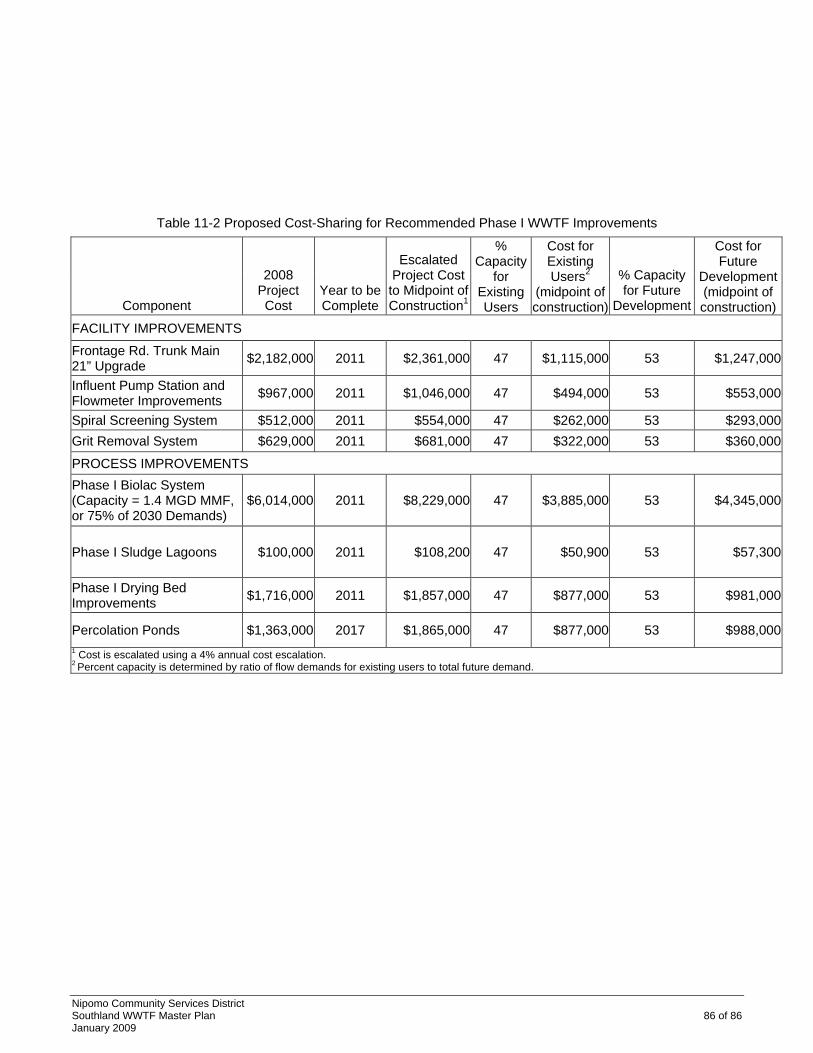
Nipomo Community Services District Southland WWTF Master Plan 86 of 86 January 2009
Table 11-2 Proposed Cost-Sharing for Recommended Phase I WWTF Improvements
Component
2008 Project Cost
Year to be Complete
Escalated Project Cost to Midpoint of Construction1
% Capacity
for Existing Users
Cost for Existing Users2
(midpoint of construction)
% Capacity for Future
Development
Cost for Future
Development (midpoint of construction)
FACILITY IMPROVEMENTS
Frontage Rd. Trunk Main 21” Upgrade $2,182,000 2011 $2,361,000 47 $1,115,000 53 $1,247,000
Influent Pump Station and Flowmeter Improvements $967,000 2011 $1,046,000 47 $494,000 53 $553,000
Spiral Screening System $512,000 2011 $554,000 47 $262,000 53 $293,000 Grit Removal System $629,000 2011 $681,000 47 $322,000 53 $360,000
PROCESS IMPROVEMENTS Phase I Biolac System (Capacity = 1.4 MGD MMF, or 75% of 2030 Demands)
$6,014,000 2011 $8,229,000 47 $3,885,000 53 $4,345,000
Phase I Sludge Lagoons $100,000 2011 $108,200 47 $50,900 53 $57,300
Phase I Drying Bed Improvements $1,716,000 2011 $1,857,000 47 $877,000 53 $981,000
Percolation Ponds $1,363,000 2017 $1,865,000 47 $877,000 53 $988,0001 Cost is escalated using a 4% annual cost escalation. 2 Percent capacity is determined by ratio of flow demands for existing users to total future demand.
APPENDIX A
WASTE DISCHARGE ORDER MONITORING & REPORTING PROGRAM

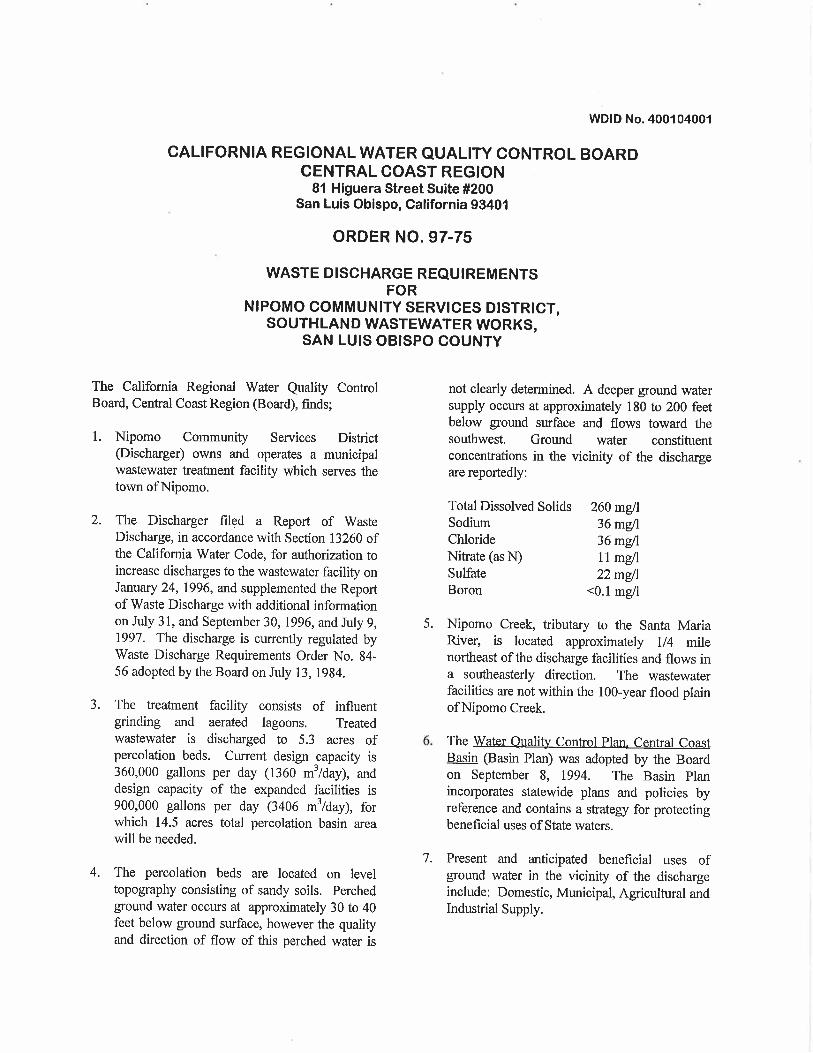
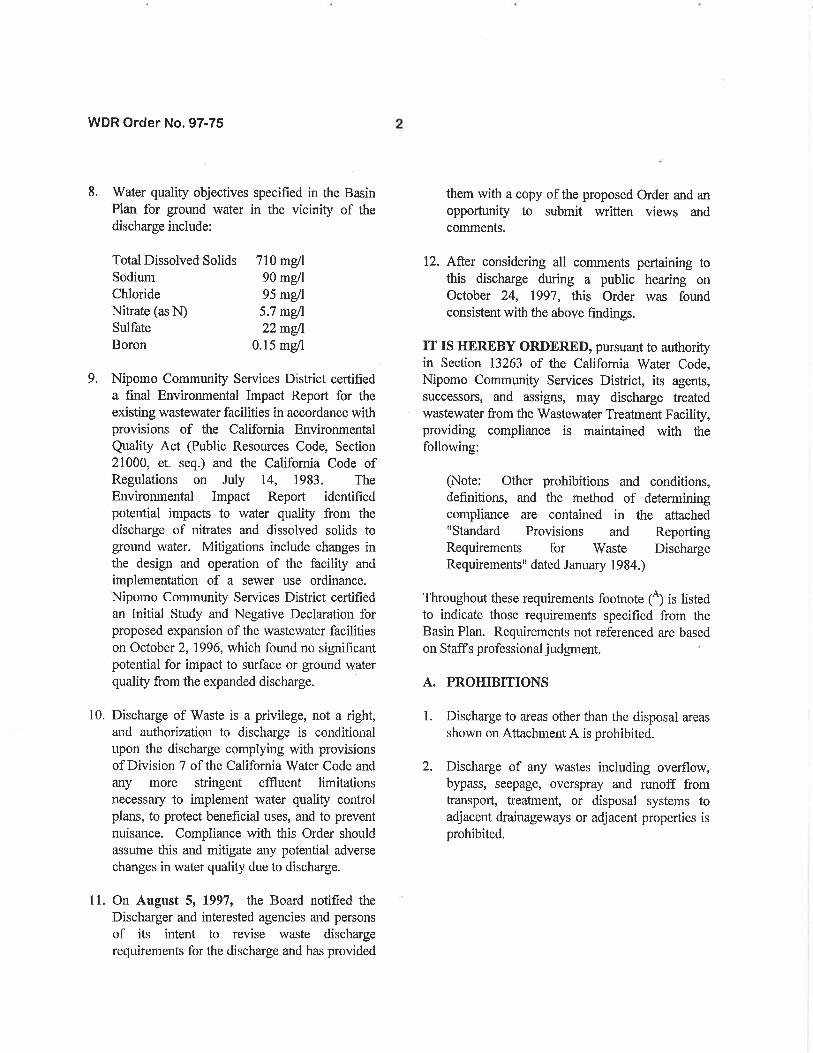
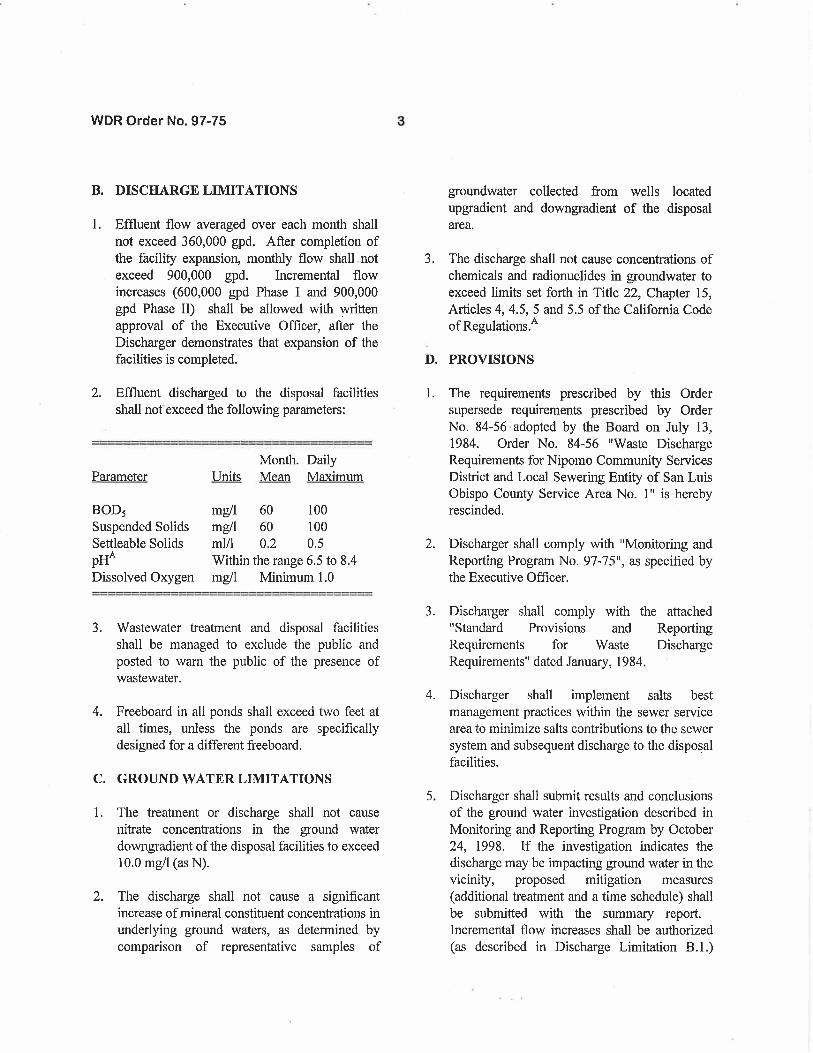
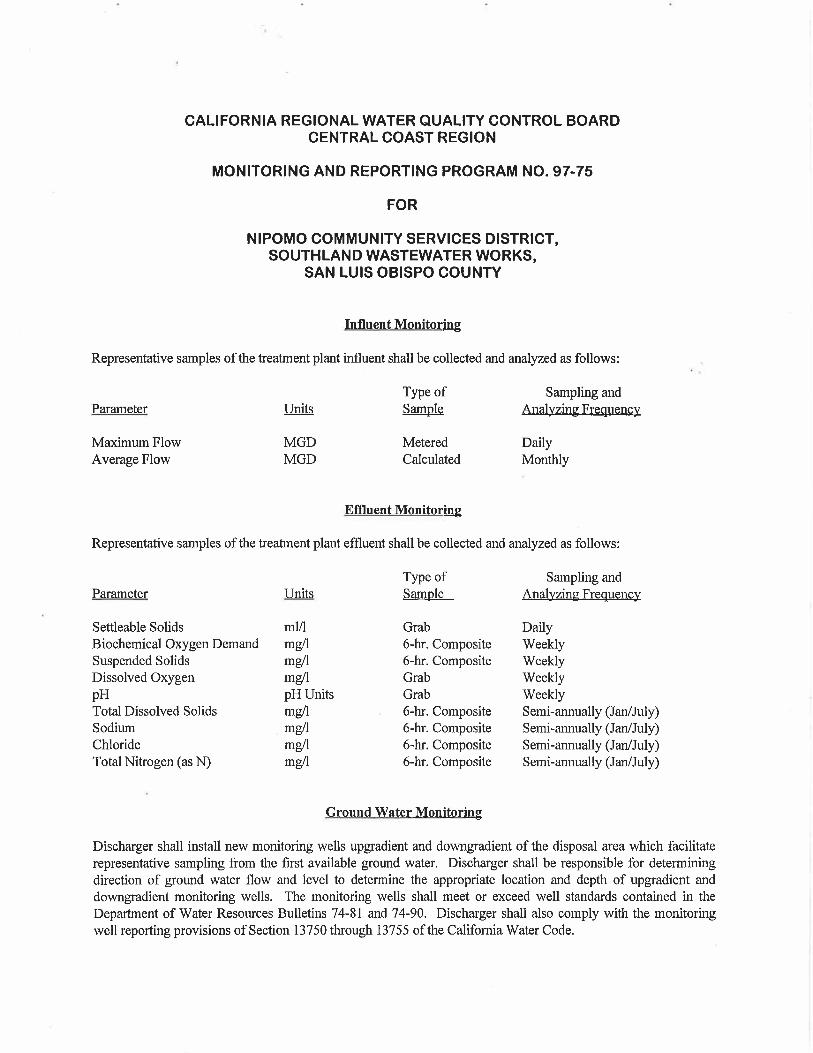
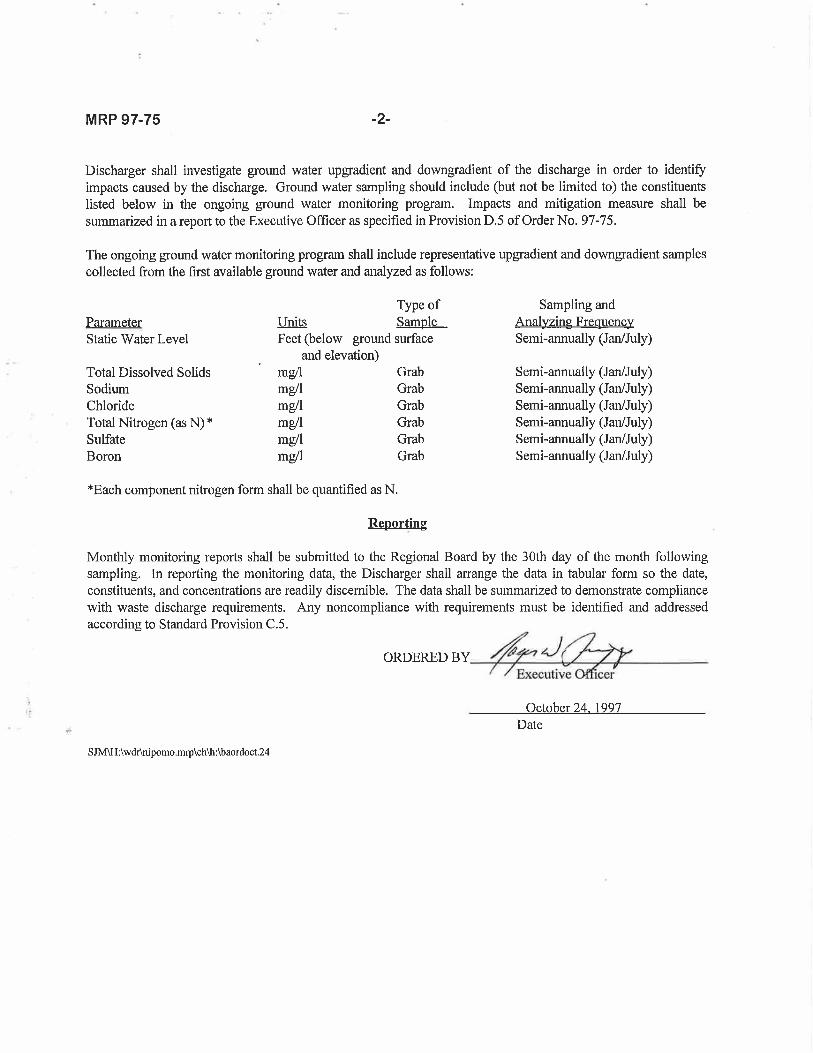
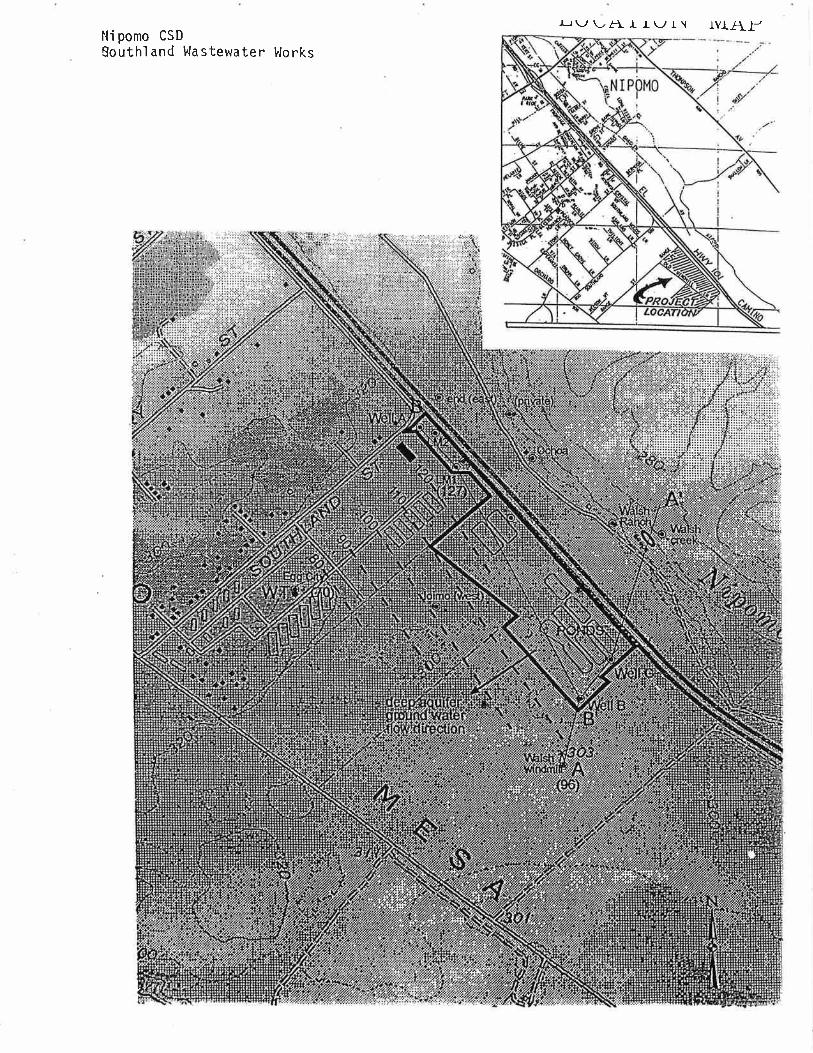
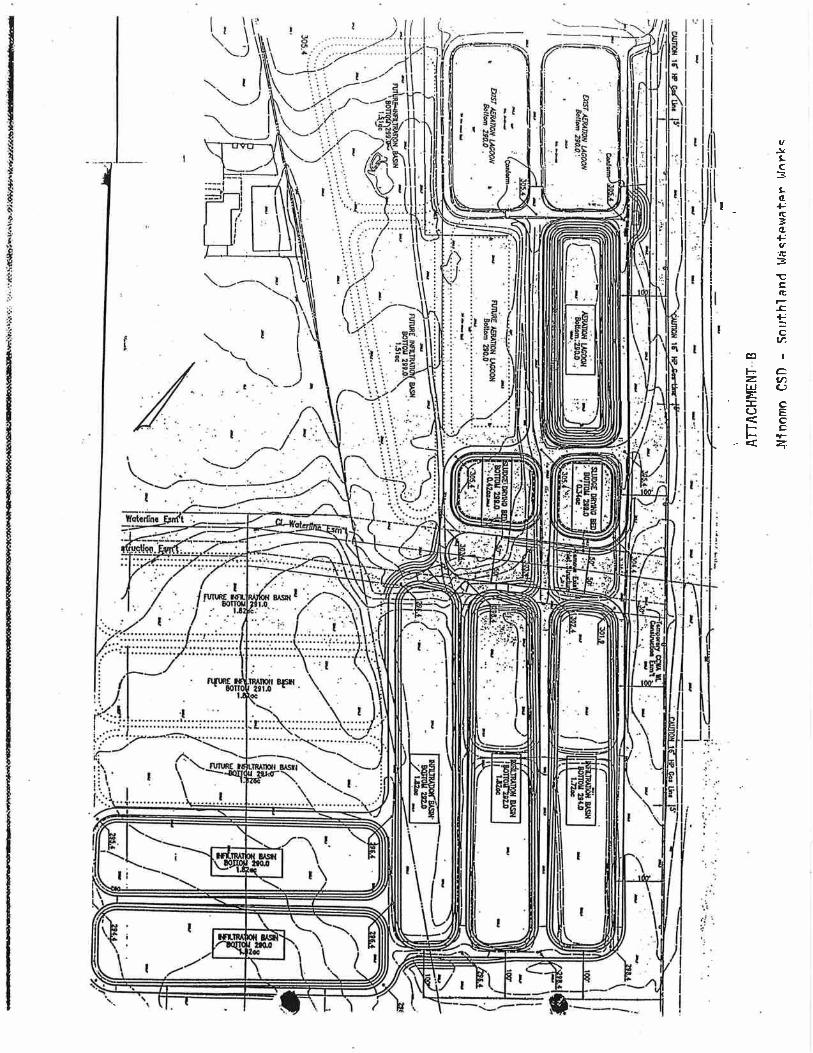

APPENDIX B
CALCULATIONS

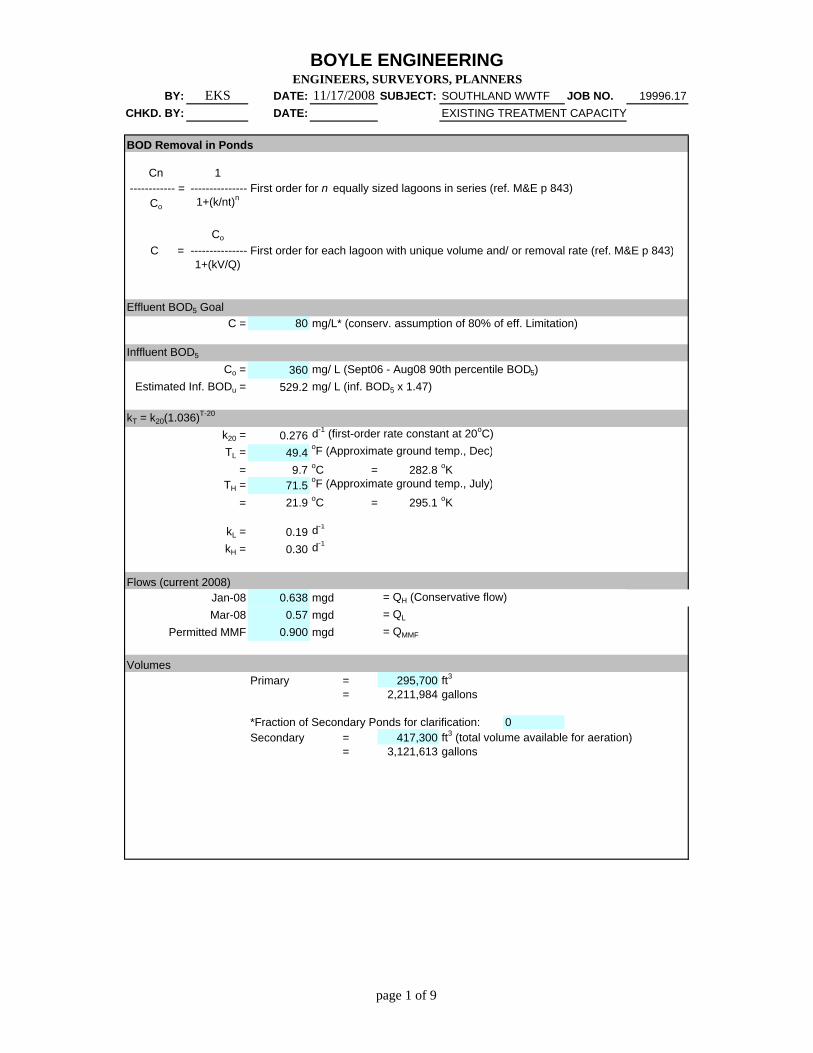
BOYLE ENGINEERINGENGINEERS, SURVEYORS, PLANNERS
BY: EKS DATE: 11/17/2008 SUBJECT: SOUTHLAND WWTF JOB NO. 19996.17CHKD. BY: DATE: EXISTING TREATMENT CAPACITY
BOD Removal in Ponds
Cn 1 ------------ = --------------- First order for n equally sized lagoons in series (ref. M&E p 843)
Co 1+(k/nt)n
Co
C = --------------- First order for each lagoon with unique volume and/ or removal rate (ref. M&E p 843)1+(kV/Q)
Effluent BOD5 GoalC = 80 mg/L* (conserv. assumption of 80% of eff. Limitation)
Inffluent BOD5
Co = 360 mg/ L (Sept06 - Aug08 90th percentile BOD5)Estimated Inf. BODu = 529.2 mg/ L (inf. BOD5 x 1.47)
kT = k20(1.036)T-20
k20 = 0.276 d-1 (first-order rate constant at 20oC)TL = 49.4 oF (Approximate ground temp., Dec)
= 9.7 oC = 282.8 oKTH = 71.5 oF (Approximate ground temp., July)
= 21.9 oC = 295.1 oK
kL = 0.19 d-1
kH = 0.30 d-1
Flows (current 2008)Jan-08 0.638 mgd = QH (Conservative flow)Mar-08 0.57 mgd = QL
Permitted MMF 0.900 mgd = QMMF
VolumesPrimary = 295,700 ft3
= 2,211,984 gallons
*Fraction of Secondary Ponds for clarification: 0Secondary = 417,300 ft3 (total volume available for aeration)
= 3,121,613 gallons
page 1 of 9

BOYLE ENGINEERINGENGINEERS, SURVEYORS, PLANNERS
BY: EKS DATE: 11/17/2008 SUBJECT: SOUTHLAND WWTF JOB NO. 19996.17CHKD. BY: DATE: EXISTING TREATMENT CAPACITY
Aeration requirement (oxygen demand)
O2 demand (lb/ day) = Co x 1.5 x QAve x 8.34e-6 Note: 1mg/L = 8.34e-6 lb/gal;
Calculated oxygen demands
Cu = 540 mg/ L (1.5 x Co)
QL = 570,000 gpdQH = 638,000 gpd
QMMF = 900,000 gpd
Oxygen demand for low flow rate: 2,567.1 lb O2/ dayOxygen demand for high flow rate: 2,873.3 lb O2/ day
Oxygen demand for permit MMFflow rate: 4,053.2 lb O2/ day
page 2 of 9
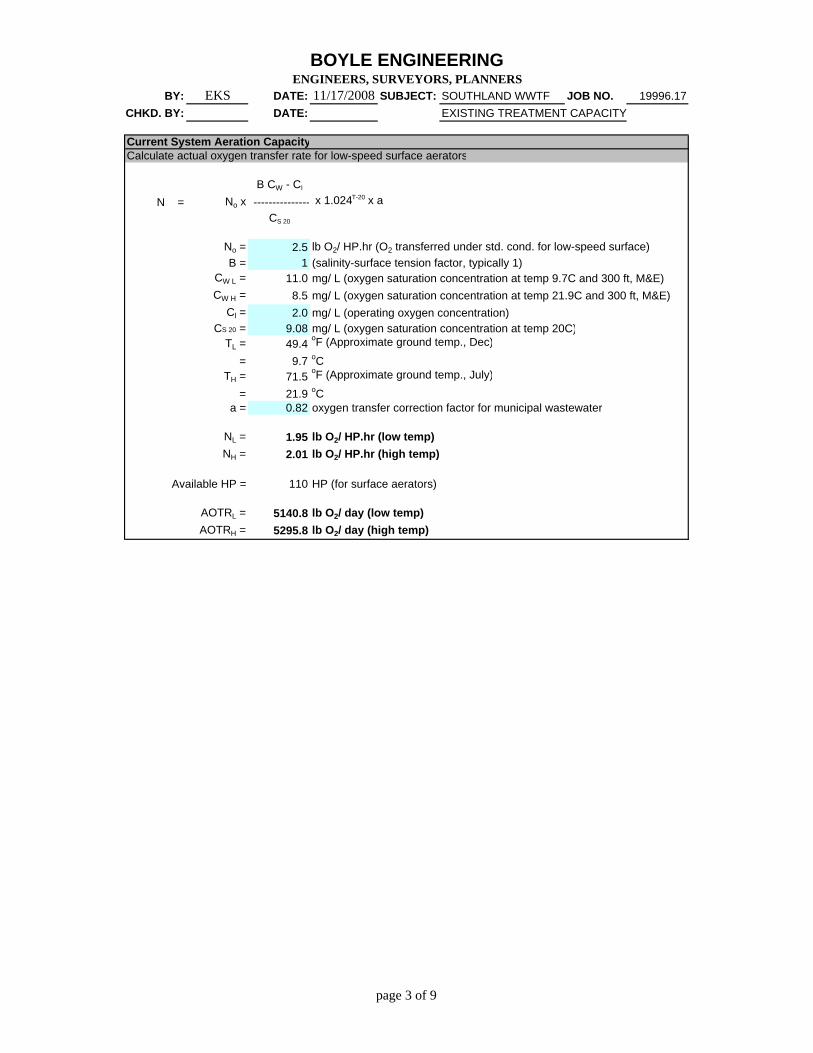
BOYLE ENGINEERINGENGINEERS, SURVEYORS, PLANNERS
BY: EKS DATE: 11/17/2008 SUBJECT: SOUTHLAND WWTF JOB NO. 19996.17CHKD. BY: DATE: EXISTING TREATMENT CAPACITY
Current System Aeration CapacityCalculate actual oxygen transfer rate for low-speed surface aerators
B CW - Cl
N = No x --------------- x 1.024T-20 x aCS 20
No = 2.5 lb O2/ HP.hr (O2 transferred under std. cond. for low-speed surface)B = 1 (salinity-surface tension factor, typically 1)
CW L = 11.0 mg/ L (oxygen saturation concentration at temp 9.7C and 300 ft, M&E)CW H = 8.5 mg/ L (oxygen saturation concentration at temp 21.9C and 300 ft, M&E)
Cl = 2.0 mg/ L (operating oxygen concentration)CS 20 = 9.08 mg/ L (oxygen saturation concentration at temp 20C)
TL = 49.4 oF (Approximate ground temp., Dec)
= 9.7 oCTH = 71.5 oF (Approximate ground temp., July)
= 21.9 oCa = 0.82 oxygen transfer correction factor for municipal wastewater
NL = 1.95 lb O2/ HP.hr (low temp)NH = 2.01 lb O2/ HP.hr (high temp)
Available HP = 110 HP (for surface aerators)
AOTRL = 5140.8 lb O2/ day (low temp)AOTRH = 5295.8 lb O2/ day (high temp)
page 3 of 9
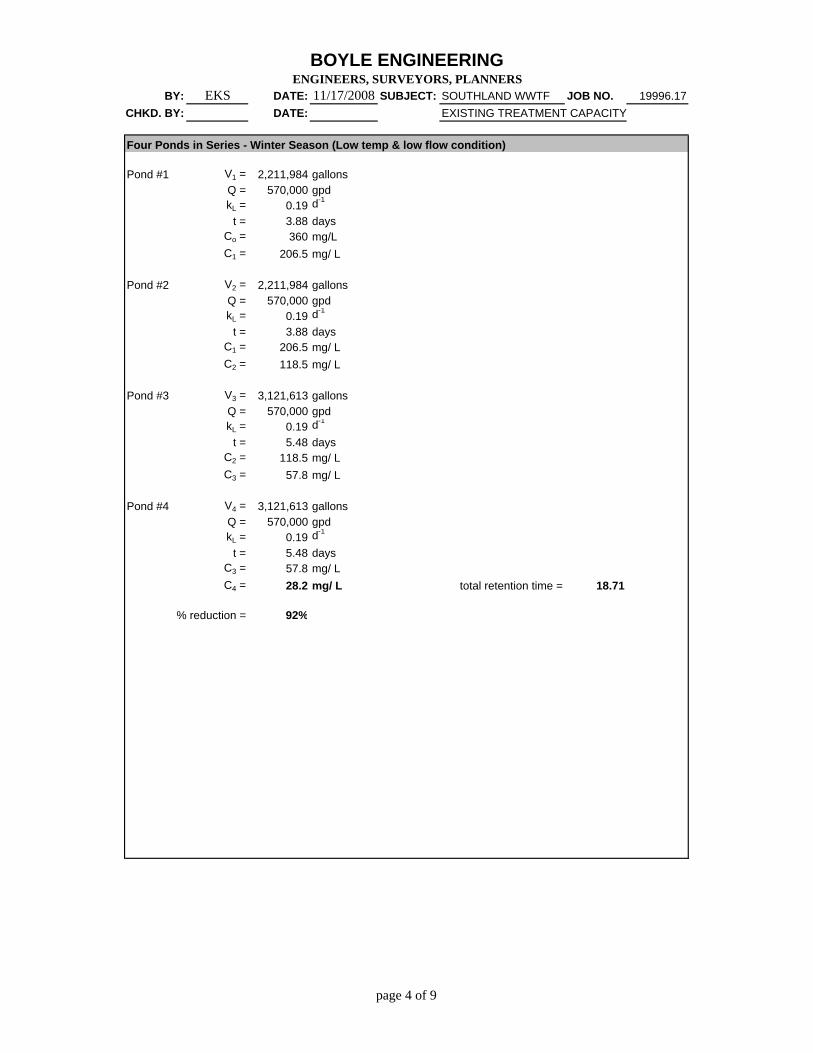
BOYLE ENGINEERINGENGINEERS, SURVEYORS, PLANNERS
BY: EKS DATE: 11/17/2008 SUBJECT: SOUTHLAND WWTF JOB NO. 19996.17CHKD. BY: DATE: EXISTING TREATMENT CAPACITY
Four Ponds in Series - Winter Season (Low temp & low flow condition)
Pond #1 V1 = 2,211,984 gallonsQ = 570,000 gpdkL = 0.19 d-1
t = 3.88 daysCo = 360 mg/LC1 = 206.5 mg/ L
Pond #2 V2 = 2,211,984 gallonsQ = 570,000 gpdkL = 0.19 d-1
t = 3.88 daysC1 = 206.5 mg/ LC2 = 118.5 mg/ L
Pond #3 V3 = 3,121,613 gallonsQ = 570,000 gpdkL = 0.19 d-1
t = 5.48 daysC2 = 118.5 mg/ LC3 = 57.8 mg/ L
Pond #4 V4 = 3,121,613 gallonsQ = 570,000 gpdkL = 0.19 d-1
t = 5.48 daysC3 = 57.8 mg/ LC4 = 28.2 mg/ L total retention time = 18.71
% reduction = 92%
page 4 of 9
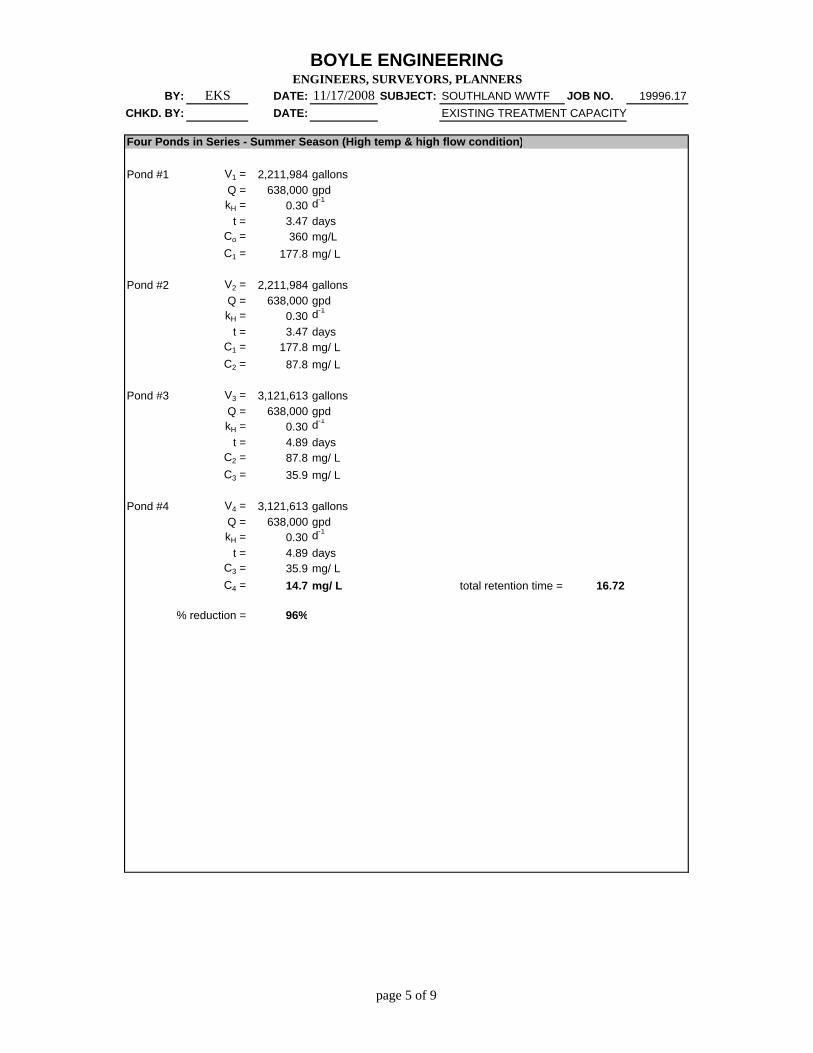
BOYLE ENGINEERINGENGINEERS, SURVEYORS, PLANNERS
BY: EKS DATE: 11/17/2008 SUBJECT: SOUTHLAND WWTF JOB NO. 19996.17CHKD. BY: DATE: EXISTING TREATMENT CAPACITY
Four Ponds in Series - Summer Season (High temp & high flow condition)
Pond #1 V1 = 2,211,984 gallonsQ = 638,000 gpdkH = 0.30 d-1
t = 3.47 daysCo = 360 mg/LC1 = 177.8 mg/ L
Pond #2 V2 = 2,211,984 gallonsQ = 638,000 gpdkH = 0.30 d-1
t = 3.47 daysC1 = 177.8 mg/ LC2 = 87.8 mg/ L
Pond #3 V3 = 3,121,613 gallonsQ = 638,000 gpdkH = 0.30 d-1
t = 4.89 daysC2 = 87.8 mg/ LC3 = 35.9 mg/ L
Pond #4 V4 = 3,121,613 gallonsQ = 638,000 gpdkH = 0.30 d-1
t = 4.89 daysC3 = 35.9 mg/ LC4 = 14.7 mg/ L total retention time = 16.72
% reduction = 96%
page 5 of 9

BOYLE ENGINEERINGENGINEERS, SURVEYORS, PLANNERS
BY: EKS DATE: 11/17/2008 SUBJECT: SOUTHLAND WWTF JOB NO. 19996.17CHKD. BY: DATE: EXISTING TREATMENT CAPACITY
Four Ponds in Series - MMF Summer Season (High temp & MMF flow condition)
Pond #1 V1 = 2,211,984 gallonsQ = 900,000 gpdkH = 0.30 d-1
t = 2.46 daysCo = 360 mg/LC1 = 208.5 mg/ L
Pond #2 V2 = 2,211,984 gallonsQ = 900,000 gpdkH = 0.30 d-1
t = 2.46 daysC1 = 208.5 mg/ LC2 = 120.8 mg/ L
Pond #3 V3 = 3,121,613 gallonsQ = 900,000 gpdkH = 0.30 d-1
t = 3.47 daysC2 = 120.8 mg/ LC3 = 59.6 mg/ L
Pond #4 V4 = 3,121,613 gallonsQ = 900,000 gpdkH = 0.30 d-1
t = 3.47 daysC3 = 59.6 mg/ LC4 = 29.4 mg/ L total retention time = 11.85
% reduction = 92%
page 6 of 9

BOYLE ENGINEERINGENGINEERS, SURVEYORS, PLANNERS
BY: EKS DATE: 11/17/2008 SUBJECT: SOUTHLAND WWTF JOB NO. 19996.17CHKD. BY: DATE: EXISTING TREATMENT CAPACITY
Two Ponds in Series, Two parallel flow trains - Winter Season (Low temp & low flow condition)
Pond #1 V1 = 2,211,984 gallonsQ = 285,000 gpdkL = 0.19 d-1
t = 7.76 daysCo = 360 mg/LC1 = 144.8 mg/ L
Pond #4 V3 = 3,121,613 gallonsQ = 285,000 gpdkL = 0.19 d-1
t = 10.95 daysC1 = 144.8 mg/ LC3 = 46.7 mg/ L
Pond #2 V2 = 2,211,984 gallonsQ = 285,000 gpdkL = 0.19 d-1
t = 7.76 daysCo = 360 mg/LC2 = 144.8 mg/ L
Pond #3 V4 = 3,121,613 gallonsQ = 285,000 gpdkL = 0.19 d-1
t = 10.95 daysC2 = 144.8 mg/ LC4 = 46.7 mg/ L total retention time = 18.71
% reduction = 87%
page 7 of 9
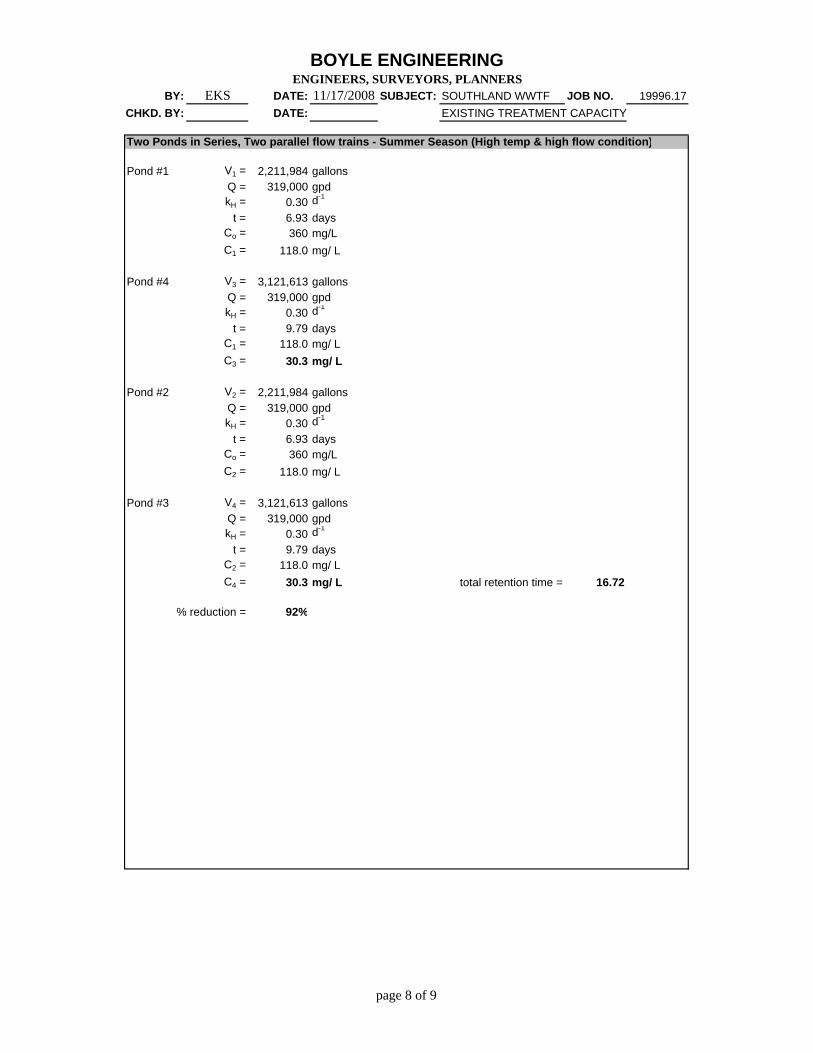
BOYLE ENGINEERINGENGINEERS, SURVEYORS, PLANNERS
BY: EKS DATE: 11/17/2008 SUBJECT: SOUTHLAND WWTF JOB NO. 19996.17CHKD. BY: DATE: EXISTING TREATMENT CAPACITY
Two Ponds in Series, Two parallel flow trains - Summer Season (High temp & high flow condition)
Pond #1 V1 = 2,211,984 gallonsQ = 319,000 gpdkH = 0.30 d-1
t = 6.93 daysCo = 360 mg/LC1 = 118.0 mg/ L
Pond #4 V3 = 3,121,613 gallonsQ = 319,000 gpdkH = 0.30 d-1
t = 9.79 daysC1 = 118.0 mg/ LC3 = 30.3 mg/ L
Pond #2 V2 = 2,211,984 gallonsQ = 319,000 gpdkH = 0.30 d-1
t = 6.93 daysCo = 360 mg/LC2 = 118.0 mg/ L
Pond #3 V4 = 3,121,613 gallonsQ = 319,000 gpdkH = 0.30 d-1
t = 9.79 daysC2 = 118.0 mg/ LC4 = 30.3 mg/ L total retention time = 16.72
% reduction = 92%
page 8 of 9
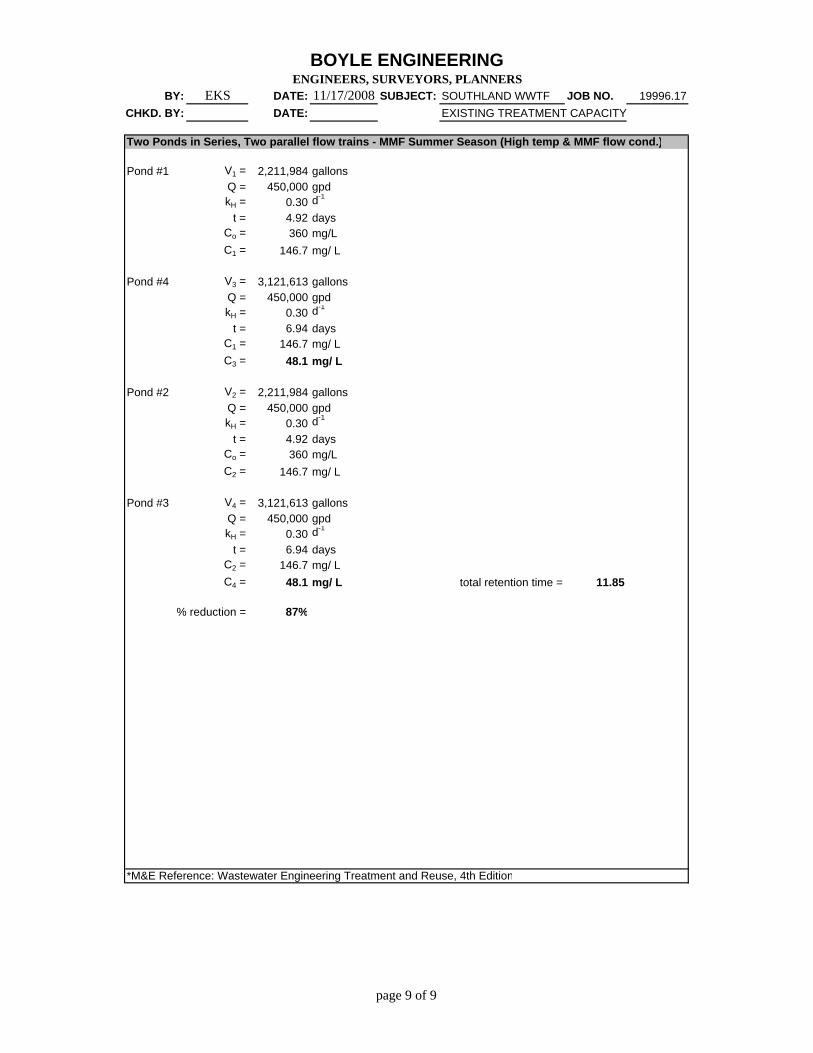
BOYLE ENGINEERINGENGINEERS, SURVEYORS, PLANNERS
BY: EKS DATE: 11/17/2008 SUBJECT: SOUTHLAND WWTF JOB NO. 19996.17CHKD. BY: DATE: EXISTING TREATMENT CAPACITY
Two Ponds in Series, Two parallel flow trains - MMF Summer Season (High temp & MMF flow cond.)
Pond #1 V1 = 2,211,984 gallonsQ = 450,000 gpdkH = 0.30 d-1
t = 4.92 daysCo = 360 mg/LC1 = 146.7 mg/ L
Pond #4 V3 = 3,121,613 gallonsQ = 450,000 gpdkH = 0.30 d-1
t = 6.94 daysC1 = 146.7 mg/ LC3 = 48.1 mg/ L
Pond #2 V2 = 2,211,984 gallonsQ = 450,000 gpdkH = 0.30 d-1
t = 4.92 daysCo = 360 mg/LC2 = 146.7 mg/ L
Pond #3 V4 = 3,121,613 gallonsQ = 450,000 gpdkH = 0.30 d-1
t = 6.94 daysC2 = 146.7 mg/ LC4 = 48.1 mg/ L total retention time = 11.85
% reduction = 87%
*M&E Reference: Wastewater Engineering Treatment and Reuse, 4th Edition
page 9 of 9
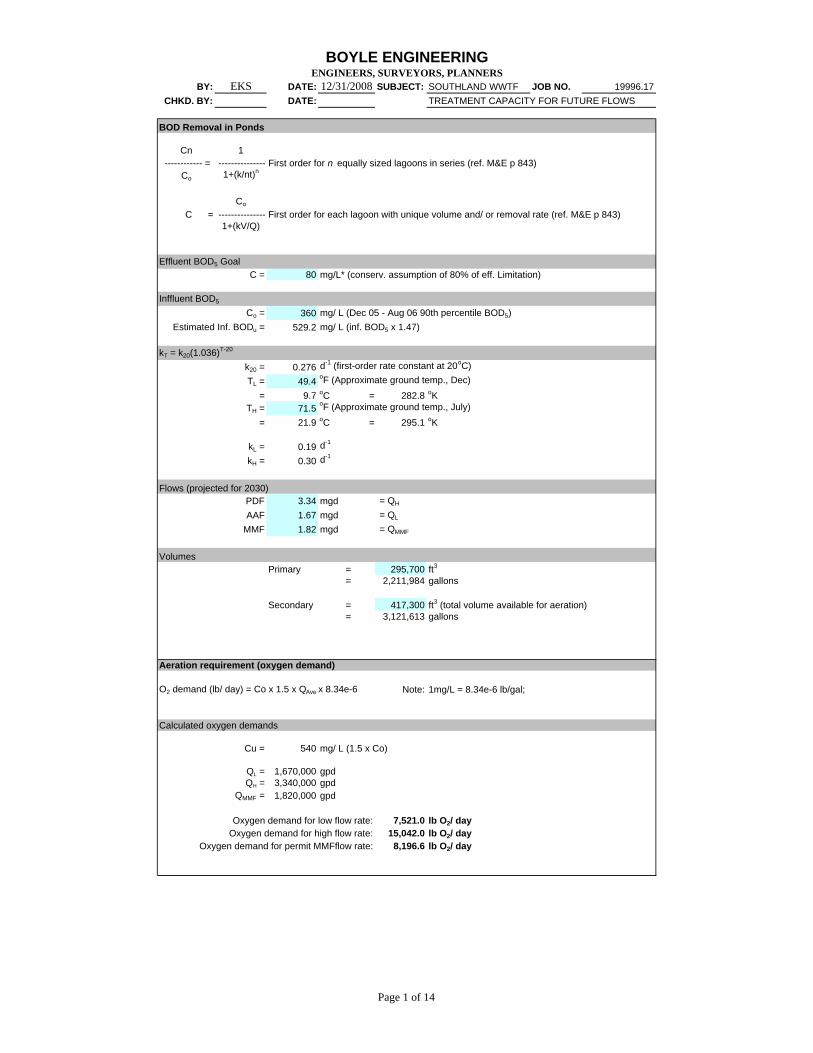
BOYLE ENGINEERINGENGINEERS, SURVEYORS, PLANNERS
BY: EKS DATE: 12/31/2008 SUBJECT: SOUTHLAND WWTF JOB NO. 19996.17CHKD. BY: DATE: TREATMENT CAPACITY FOR FUTURE FLOWS
BOD Removal in Ponds
Cn 1 ------------ = --------------- First order for n equally sized lagoons in series (ref. M&E p 843)
Co 1+(k/nt)n
Co
C = --------------- First order for each lagoon with unique volume and/ or removal rate (ref. M&E p 843)1+(kV/Q)
Effluent BOD5 GoalC = 80 mg/L* (conserv. assumption of 80% of eff. Limitation)
Inffluent BOD5
Co = 360 mg/ L (Dec 05 - Aug 06 90th percentile BOD5)Estimated Inf. BODu = 529.2 mg/ L (inf. BOD5 x 1.47)
kT = k20(1.036)T-20
k20 = 0.276 d-1 (first-order rate constant at 20oC)TL = 49.4 oF (Approximate ground temp., Dec)
= 9.7 oC = 282.8 oKTH = 71.5 oF (Approximate ground temp., July)
= 21.9 oC = 295.1 oK
kL = 0.19 d-1
kH = 0.30 d-1
Flows (projected for 2030)PDF 3.34 mgd = QH
AAF 1.67 mgd = QL
MMF 1.82 mgd = QMMF
VolumesPrimary = 295,700 ft3
= 2,211,984 gallons
Secondary = 417,300 ft3 (total volume available for aeration) = 3,121,613 gallons
Aeration requirement (oxygen demand)
O2 demand (lb/ day) = Co x 1.5 x QAve x 8.34e-6 Note: 1mg/L = 8.34e-6 lb/gal;
Calculated oxygen demands
Cu = 540 mg/ L (1.5 x Co)
QL = 1,670,000 gpdQH = 3,340,000 gpd
QMMF = 1,820,000 gpd
Oxygen demand for low flow rate: 7,521.0 lb O2/ dayOxygen demand for high flow rate: 15,042.0 lb O2/ day
Oxygen demand for permit MMFflow rate: 8,196.6 lb O2/ day
Page 1 of 14
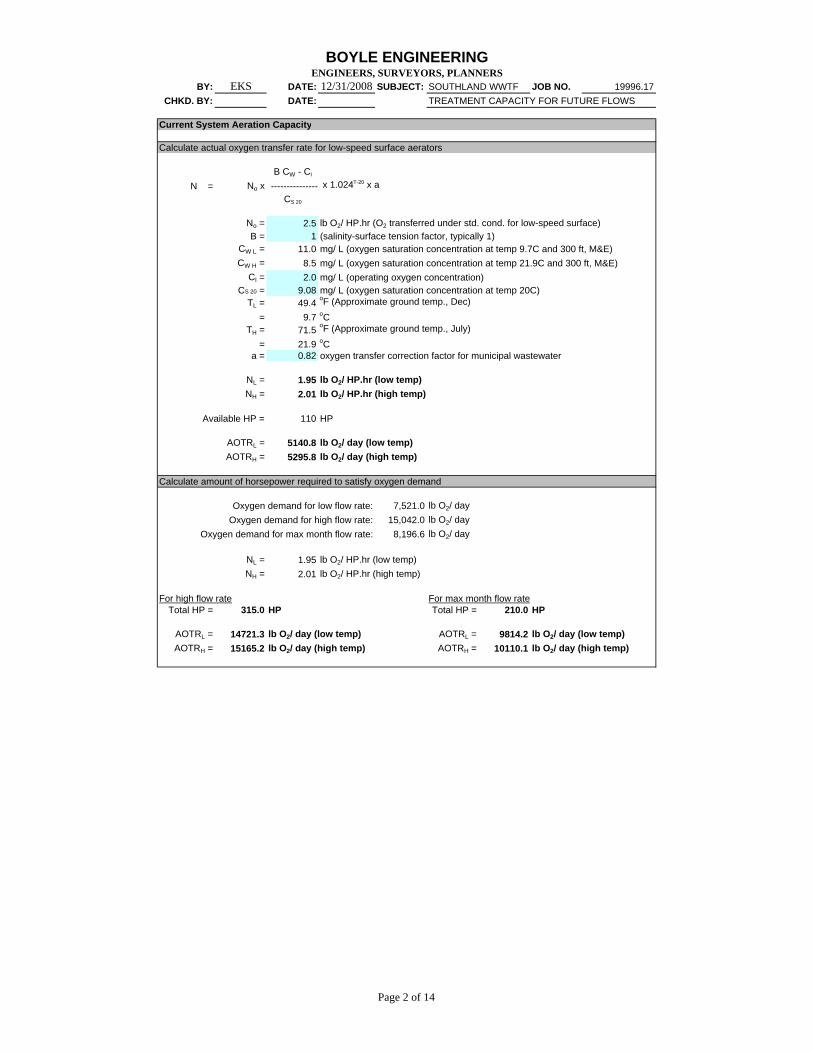
BOYLE ENGINEERINGENGINEERS, SURVEYORS, PLANNERS
BY: EKS DATE: 12/31/2008 SUBJECT: SOUTHLAND WWTF JOB NO. 19996.17CHKD. BY: DATE: TREATMENT CAPACITY FOR FUTURE FLOWS
Current System Aeration Capacity
Calculate actual oxygen transfer rate for low-speed surface aerators
B CW - Cl
N = No x --------------- x 1.024T-20 x aCS 20
No = 2.5 lb O2/ HP.hr (O2 transferred under std. cond. for low-speed surface)B = 1 (salinity-surface tension factor, typically 1)
CW L = 11.0 mg/ L (oxygen saturation concentration at temp 9.7C and 300 ft, M&E)CW H = 8.5 mg/ L (oxygen saturation concentration at temp 21.9C and 300 ft, M&E)
Cl = 2.0 mg/ L (operating oxygen concentration)CS 20 = 9.08 mg/ L (oxygen saturation concentration at temp 20C)
TL = 49.4 oF (Approximate ground temp., Dec) = 9.7 oC
TH = 71.5 oF (Approximate ground temp., July) = 21.9 oC
a = 0.82 oxygen transfer correction factor for municipal wastewater
NL = 1.95 lb O2/ HP.hr (low temp)NH = 2.01 lb O2/ HP.hr (high temp)
Available HP = 110 HP
AOTRL = 5140.8 lb O2/ day (low temp)AOTRH = 5295.8 lb O2/ day (high temp)
Calculate amount of horsepower required to satisfy oxygen demand
Oxygen demand for low flow rate: 7,521.0 lb O2/ dayOxygen demand for high flow rate: 15,042.0 lb O2/ day
Oxygen demand for max month flow rate: 8,196.6 lb O2/ day
NL = 1.95 lb O2/ HP.hr (low temp)NH = 2.01 lb O2/ HP.hr (high temp)
For high flow rate For max month flow rateTotal HP = 315.0 HP Total HP = 210.0 HP
AOTRL = 14721.3 lb O2/ day (low temp) AOTRL = 9814.2 lb O2/ day (low temp)AOTRH = 15165.2 lb O2/ day (high temp) AOTRH = 10110.1 lb O2/ day (high temp)
Page 2 of 14

BOYLE ENGINEERINGENGINEERS, SURVEYORS, PLANNERS
BY: EKS DATE: 12/31/2008 SUBJECT: SOUTHLAND WWTF JOB NO. 19996.17CHKD. BY: DATE: TREATMENT CAPACITY FOR FUTURE FLOWS
Ponds in Series - Winter Season (Low temp & low flow condition)Current System Under 2030 Flow ConditionsPond #1 V1 = 2,211,984 gallons
Q = 1,670,000 gpdkL = 0.19 d-1
t = 1.32 daysCo = 360 mg/LC1 = 287.2 mg/ L
Pond #2 V2 = 2,211,984 gallonsQ = 1,670,000 gpdkL = 0.19 d-1
t = 1.32 daysC1 = 287.2 mg/ LC2 = 229.1 mg/ L
Pond #3 V3 = 3,121,613 gallonsQ = 1,670,000 gpdkL = 0.19 d-1
t = 1.87 daysC2 = 229.1 mg/ LC3 = 168.7 mg/ L
Pond #4 V4 = 3,121,613 gallonsQ = 1,670,000 gpdkL = 0.19 d-1
t = 1.87 daysC3 = 168.7 mg/ LC4 = 124.2 mg/ L
current % reduction = 65% total retention time = 6.39 days
Page 3 of 14
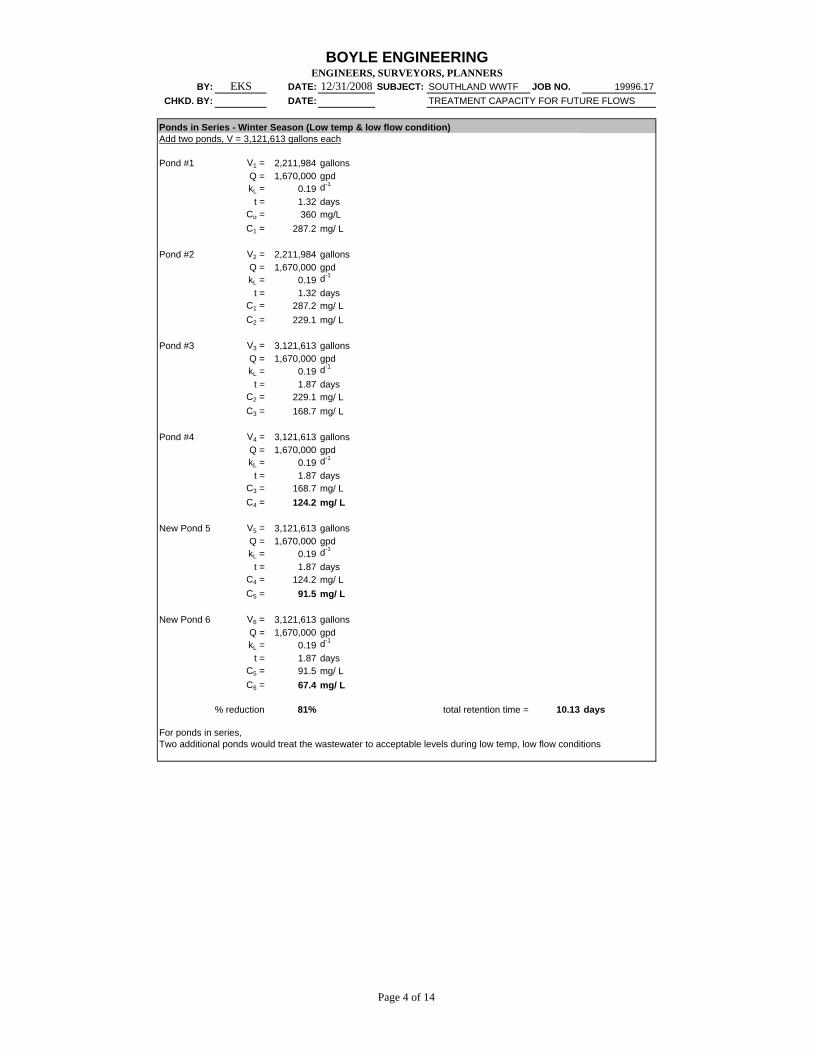
BOYLE ENGINEERINGENGINEERS, SURVEYORS, PLANNERS
BY: EKS DATE: 12/31/2008 SUBJECT: SOUTHLAND WWTF JOB NO. 19996.17CHKD. BY: DATE: TREATMENT CAPACITY FOR FUTURE FLOWS
Ponds in Series - Winter Season (Low temp & low flow condition)Add two ponds, V = 3,121,613 gallons each
Pond #1 V1 = 2,211,984 gallonsQ = 1,670,000 gpdkL = 0.19 d-1
t = 1.32 daysCo = 360 mg/LC1 = 287.2 mg/ L
Pond #2 V2 = 2,211,984 gallonsQ = 1,670,000 gpdkL = 0.19 d-1
t = 1.32 daysC1 = 287.2 mg/ LC2 = 229.1 mg/ L
Pond #3 V3 = 3,121,613 gallonsQ = 1,670,000 gpdkL = 0.19 d-1
t = 1.87 daysC2 = 229.1 mg/ LC3 = 168.7 mg/ L
Pond #4 V4 = 3,121,613 gallonsQ = 1,670,000 gpdkL = 0.19 d-1
t = 1.87 daysC3 = 168.7 mg/ LC4 = 124.2 mg/ L
New Pond 5 V5 = 3,121,613 gallonsQ = 1,670,000 gpdkL = 0.19 d-1
t = 1.87 daysC4 = 124.2 mg/ LC5 = 91.5 mg/ L
New Pond 6 V6 = 3,121,613 gallonsQ = 1,670,000 gpdkL = 0.19 d-1
t = 1.87 daysC5 = 91.5 mg/ LC6 = 67.4 mg/ L
% reduction 81% total retention time = 10.13 days
For ponds in series, Two additional ponds would treat the wastewater to acceptable levels during low temp, low flow conditions
Page 4 of 14

BOYLE ENGINEERINGENGINEERS, SURVEYORS, PLANNERS
BY: EKS DATE: 12/31/2008 SUBJECT: SOUTHLAND WWTF JOB NO. 19996.17CHKD. BY: DATE: TREATMENT CAPACITY FOR FUTURE FLOWS
Ponds in Series - Summer Season (High temp & high flow condition)Current System Under 2030 Flow ConditionsPond #1 V1 = 2,211,984 gallons
Q = 3,340,000 gpdkH = 0.30 d-1
t = 0.66 daysCo = 360 mg/LC1 = 301.1 mg/ L
Pond #2 V2 = 2,211,984 gallonsQ = 3,340,000 gpdkH = 0.30 d-1
t = 0.66 daysC1 = 301.1 mg/ LC2 = 251.8 mg/ L
Pond #3 V3 = 3,121,613 gallonsQ = 3,340,000 gpdkH = 0.30 d-1
t = 0.93 daysC2 = 251.8 mg/ LC3 = 197.3 mg/ L
Pond #4 V4 = 3,121,613 gallonsQ = 3,340,000 gpdkH = 0.30 d-1
t = 0.93 daysC3 = 197.3 mg/ LC4 = 154.5 mg/ L total retention time = 3.19 days
% reduction = 57%
Page 5 of 14
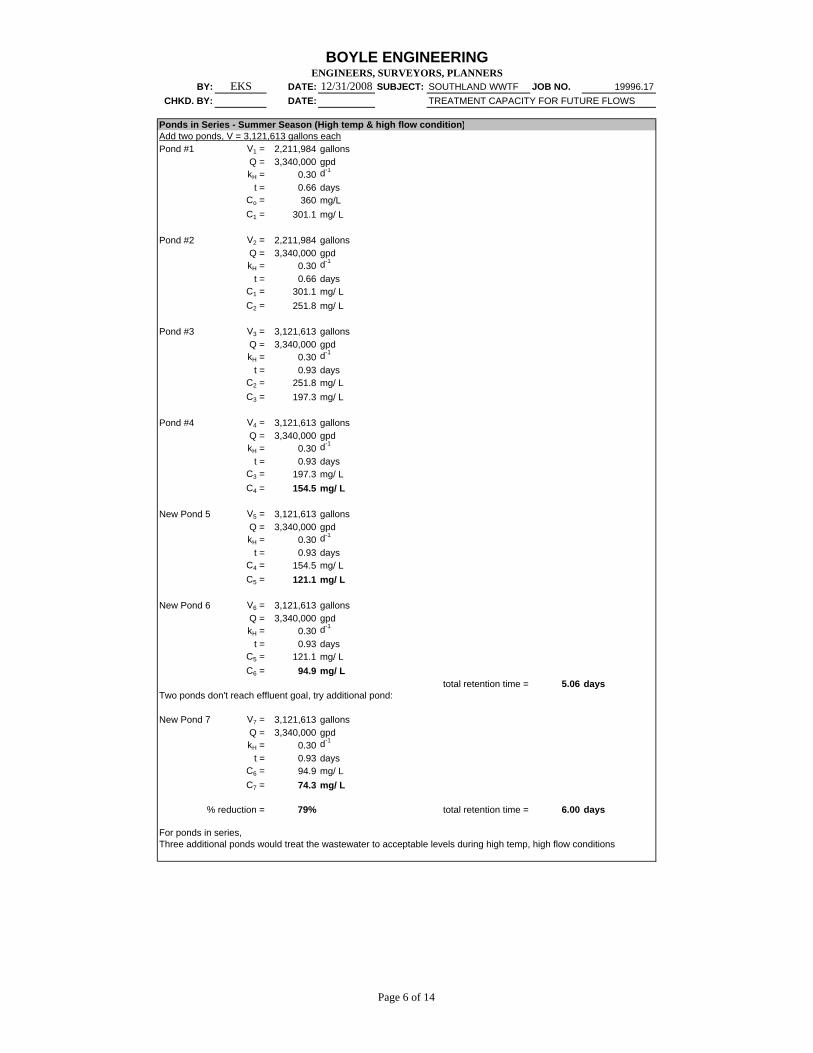
BOYLE ENGINEERINGENGINEERS, SURVEYORS, PLANNERS
BY: EKS DATE: 12/31/2008 SUBJECT: SOUTHLAND WWTF JOB NO. 19996.17CHKD. BY: DATE: TREATMENT CAPACITY FOR FUTURE FLOWS
Ponds in Series - Summer Season (High temp & high flow condition)Add two ponds, V = 3,121,613 gallons eachPond #1 V1 = 2,211,984 gallons
Q = 3,340,000 gpdkH = 0.30 d-1
t = 0.66 daysCo = 360 mg/LC1 = 301.1 mg/ L
Pond #2 V2 = 2,211,984 gallonsQ = 3,340,000 gpdkH = 0.30 d-1
t = 0.66 daysC1 = 301.1 mg/ LC2 = 251.8 mg/ L
Pond #3 V3 = 3,121,613 gallonsQ = 3,340,000 gpdkH = 0.30 d-1
t = 0.93 daysC2 = 251.8 mg/ LC3 = 197.3 mg/ L
Pond #4 V4 = 3,121,613 gallonsQ = 3,340,000 gpdkH = 0.30 d-1
t = 0.93 daysC3 = 197.3 mg/ LC4 = 154.5 mg/ L
New Pond 5 V5 = 3,121,613 gallonsQ = 3,340,000 gpdkH = 0.30 d-1
t = 0.93 daysC4 = 154.5 mg/ LC5 = 121.1 mg/ L
New Pond 6 V6 = 3,121,613 gallonsQ = 3,340,000 gpdkH = 0.30 d-1
t = 0.93 daysC5 = 121.1 mg/ LC6 = 94.9 mg/ L
total retention time = 5.06 daysTwo ponds don't reach effluent goal, try additional pond:
New Pond 7 V7 = 3,121,613 gallonsQ = 3,340,000 gpdkH = 0.30 d-1
t = 0.93 daysC6 = 94.9 mg/ LC7 = 74.3 mg/ L
% reduction = 79% total retention time = 6.00 days
For ponds in series,Three additional ponds would treat the wastewater to acceptable levels during high temp, high flow conditions
Page 6 of 14
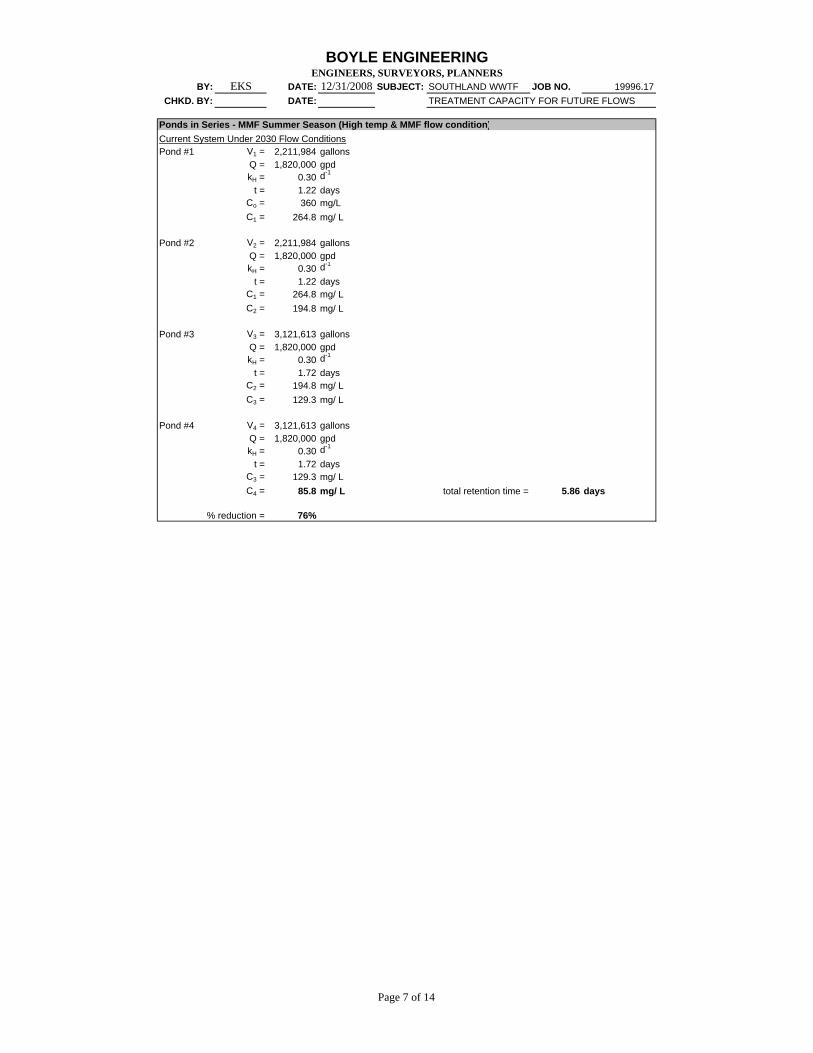
BOYLE ENGINEERINGENGINEERS, SURVEYORS, PLANNERS
BY: EKS DATE: 12/31/2008 SUBJECT: SOUTHLAND WWTF JOB NO. 19996.17CHKD. BY: DATE: TREATMENT CAPACITY FOR FUTURE FLOWS
Ponds in Series - MMF Summer Season (High temp & MMF flow condition)Current System Under 2030 Flow ConditionsPond #1 V1 = 2,211,984 gallons
Q = 1,820,000 gpdkH = 0.30 d-1
t = 1.22 daysCo = 360 mg/LC1 = 264.8 mg/ L
Pond #2 V2 = 2,211,984 gallonsQ = 1,820,000 gpdkH = 0.30 d-1
t = 1.22 daysC1 = 264.8 mg/ LC2 = 194.8 mg/ L
Pond #3 V3 = 3,121,613 gallonsQ = 1,820,000 gpdkH = 0.30 d-1
t = 1.72 daysC2 = 194.8 mg/ LC3 = 129.3 mg/ L
Pond #4 V4 = 3,121,613 gallonsQ = 1,820,000 gpdkH = 0.30 d-1
t = 1.72 daysC3 = 129.3 mg/ LC4 = 85.8 mg/ L total retention time = 5.86 days
% reduction = 76%
Page 7 of 14
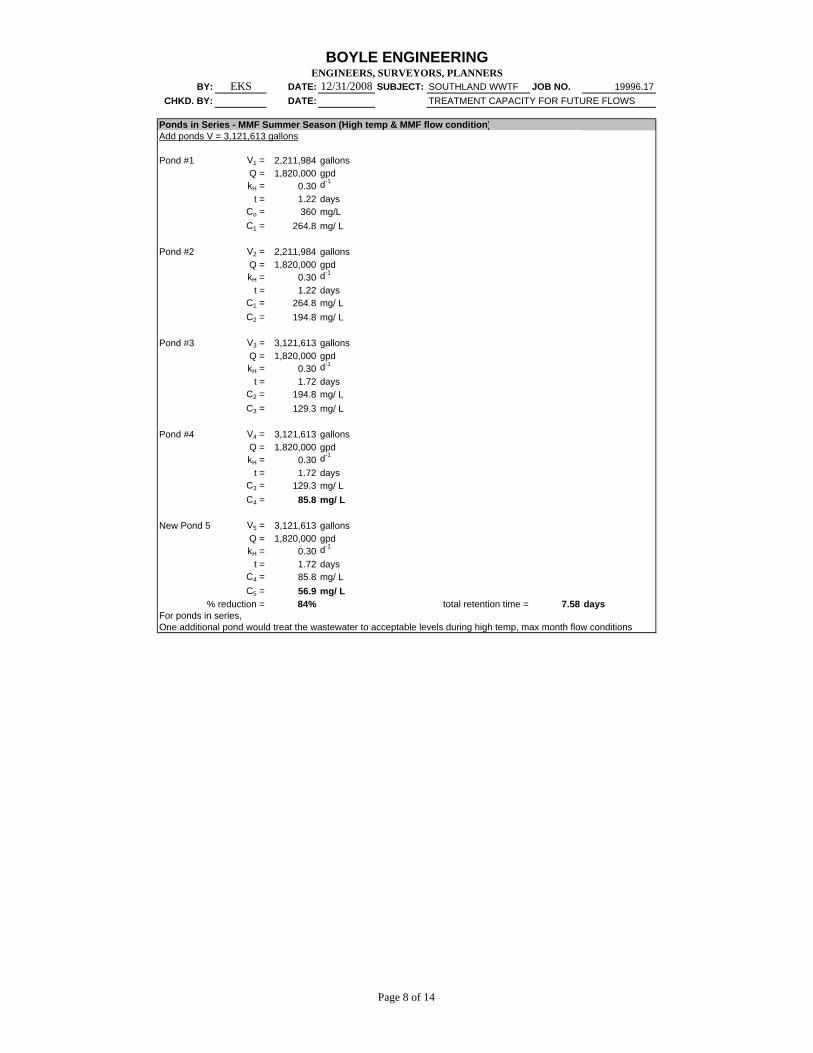
BOYLE ENGINEERINGENGINEERS, SURVEYORS, PLANNERS
BY: EKS DATE: 12/31/2008 SUBJECT: SOUTHLAND WWTF JOB NO. 19996.17CHKD. BY: DATE: TREATMENT CAPACITY FOR FUTURE FLOWS
Ponds in Series - MMF Summer Season (High temp & MMF flow condition)Add ponds V = 3,121,613 gallons
Pond #1 V1 = 2,211,984 gallonsQ = 1,820,000 gpdkH = 0.30 d-1
t = 1.22 daysCo = 360 mg/LC1 = 264.8 mg/ L
Pond #2 V2 = 2,211,984 gallonsQ = 1,820,000 gpdkH = 0.30 d-1
t = 1.22 daysC1 = 264.8 mg/ LC2 = 194.8 mg/ L
Pond #3 V3 = 3,121,613 gallonsQ = 1,820,000 gpdkH = 0.30 d-1
t = 1.72 daysC2 = 194.8 mg/ LC3 = 129.3 mg/ L
Pond #4 V4 = 3,121,613 gallonsQ = 1,820,000 gpdkH = 0.30 d-1
t = 1.72 daysC3 = 129.3 mg/ LC4 = 85.8 mg/ L
New Pond 5 V5 = 3,121,613 gallonsQ = 1,820,000 gpdkH = 0.30 d-1
t = 1.72 daysC4 = 85.8 mg/ LC5 = 56.9 mg/ L
% reduction = 84% total retention time = 7.58 daysFor ponds in series,One additional pond would treat the wastewater to acceptable levels during high temp, max month flow conditions
Page 8 of 14

BOYLE ENGINEERINGENGINEERS, SURVEYORS, PLANNERS
BY: EKS DATE: 12/31/2008 SUBJECT: SOUTHLAND WWTF JOB NO. 19996.17CHKD. BY: DATE: TREATMENT CAPACITY FOR FUTURE FLOWS
Two parallel flow trains - Winter Season (Low temp & low flow condition)Current System Under 2030 Flow ConditionsPond #1 V1 = 2,211,984 gallons
Q = 835,000 gpdkL = 0.19 d-1
t = 2.65 daysCo = 360 mg/LC1 = 238.8 mg/ L
Pond #4 V4 = 3,121,613 gallonsQ = 835,000 gpdkL = 0.19 d-1
t = 3.74 daysC1 = 238.8 mg/ LC4 = 139.2 mg/ L
Pond #2 V2 = 2,211,984 gallonsQ = 835,000 gpdkL = 0.19 d-1
t = 2.65 daysCo = 360 mg/LC2 = 238.8 mg/ L
Pond #3 V3 = 3,121,613 gallonsQ = 835,000 gpdkL = 0.19 d-1
t = 3.74 daysC2 = 238.8 mg/ LC3 = 139.2 mg/ L total retention time = 6.39 days
% reduction = 61%
Page 9 of 14
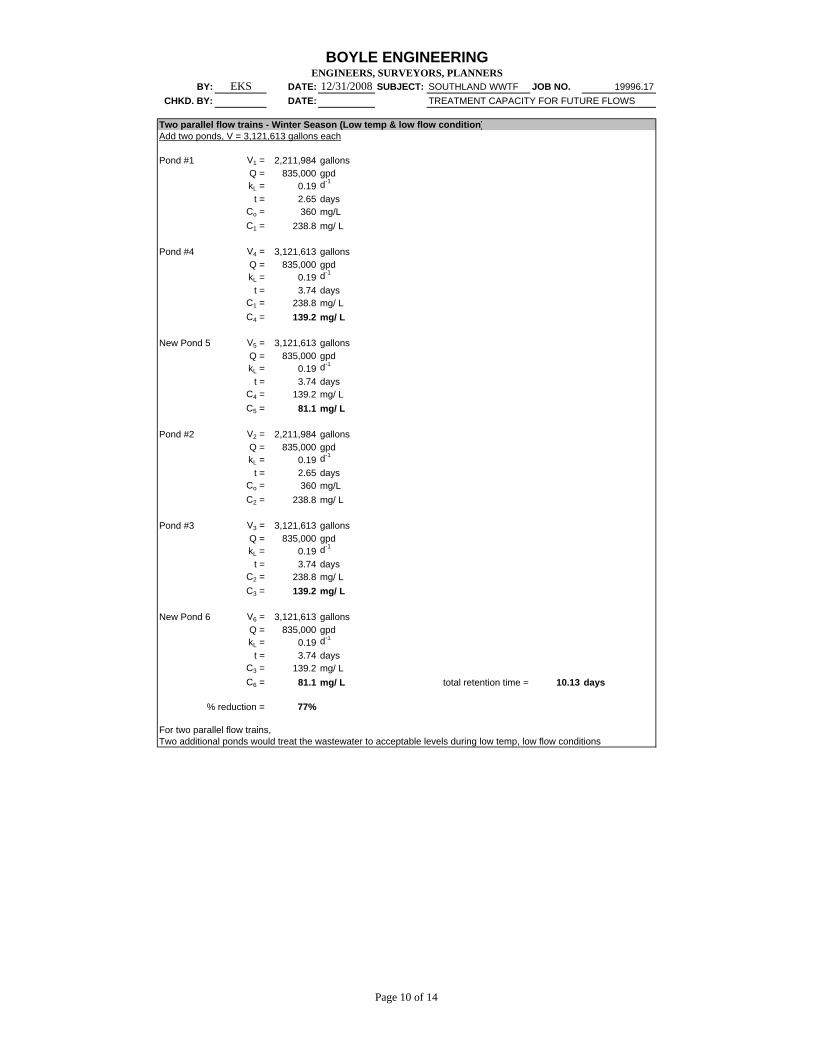
BOYLE ENGINEERINGENGINEERS, SURVEYORS, PLANNERS
BY: EKS DATE: 12/31/2008 SUBJECT: SOUTHLAND WWTF JOB NO. 19996.17CHKD. BY: DATE: TREATMENT CAPACITY FOR FUTURE FLOWS
Two parallel flow trains - Winter Season (Low temp & low flow condition)Add two ponds, V = 3,121,613 gallons each
Pond #1 V1 = 2,211,984 gallonsQ = 835,000 gpdkL = 0.19 d-1
t = 2.65 daysCo = 360 mg/LC1 = 238.8 mg/ L
Pond #4 V4 = 3,121,613 gallonsQ = 835,000 gpdkL = 0.19 d-1
t = 3.74 daysC1 = 238.8 mg/ LC4 = 139.2 mg/ L
New Pond 5 V5 = 3,121,613 gallonsQ = 835,000 gpdkL = 0.19 d-1
t = 3.74 daysC4 = 139.2 mg/ LC5 = 81.1 mg/ L
Pond #2 V2 = 2,211,984 gallonsQ = 835,000 gpdkL = 0.19 d-1
t = 2.65 daysCo = 360 mg/LC2 = 238.8 mg/ L
Pond #3 V3 = 3,121,613 gallonsQ = 835,000 gpdkL = 0.19 d-1
t = 3.74 daysC2 = 238.8 mg/ LC3 = 139.2 mg/ L
New Pond 6 V6 = 3,121,613 gallonsQ = 835,000 gpdkL = 0.19 d-1
t = 3.74 daysC3 = 139.2 mg/ LC6 = 81.1 mg/ L total retention time = 10.13 days
% reduction = 77%
For two parallel flow trains, Two additional ponds would treat the wastewater to acceptable levels during low temp, low flow conditions
Page 10 of 14

BOYLE ENGINEERINGENGINEERS, SURVEYORS, PLANNERS
BY: EKS DATE: 12/31/2008 SUBJECT: SOUTHLAND WWTF JOB NO. 19996.17CHKD. BY: DATE: TREATMENT CAPACITY FOR FUTURE FLOWS
Two parallel flow trains - Summer Season (High temp & high flow condition)Current System Under 2030 Flow ConditionsPond #1 V1 = 2,211,984 gallons
Q = 1,670,000 gpdkH = 0.30 d-1
t = 1.32 daysCo = 360 mg/LC1 = 258.7 mg/ L
Pond #4 V3 = 3,121,613 gallonsQ = 1,670,000 gpdkH = 0.30 d-1
t = 1.87 daysC1 = 258.7 mg/ LC3 = 166.6 mg/ L
Pond #2 V2 = 2,211,984 gallonsQ = 1,670,000 gpdkH = 0.30 d-1
t = 1.32 daysCo = 360 mg/LC2 = 258.7 mg/ L
Pond #3 V4 = 3,121,613 gallonsQ = 1,670,000 gpdkH = 0.30 d-1
t = 1.87 daysC2 = 258.7 mg/ LC4 = 166.6 mg/ L total retention time = 3.19 days
% reduction = 54%
Page 11 of 14
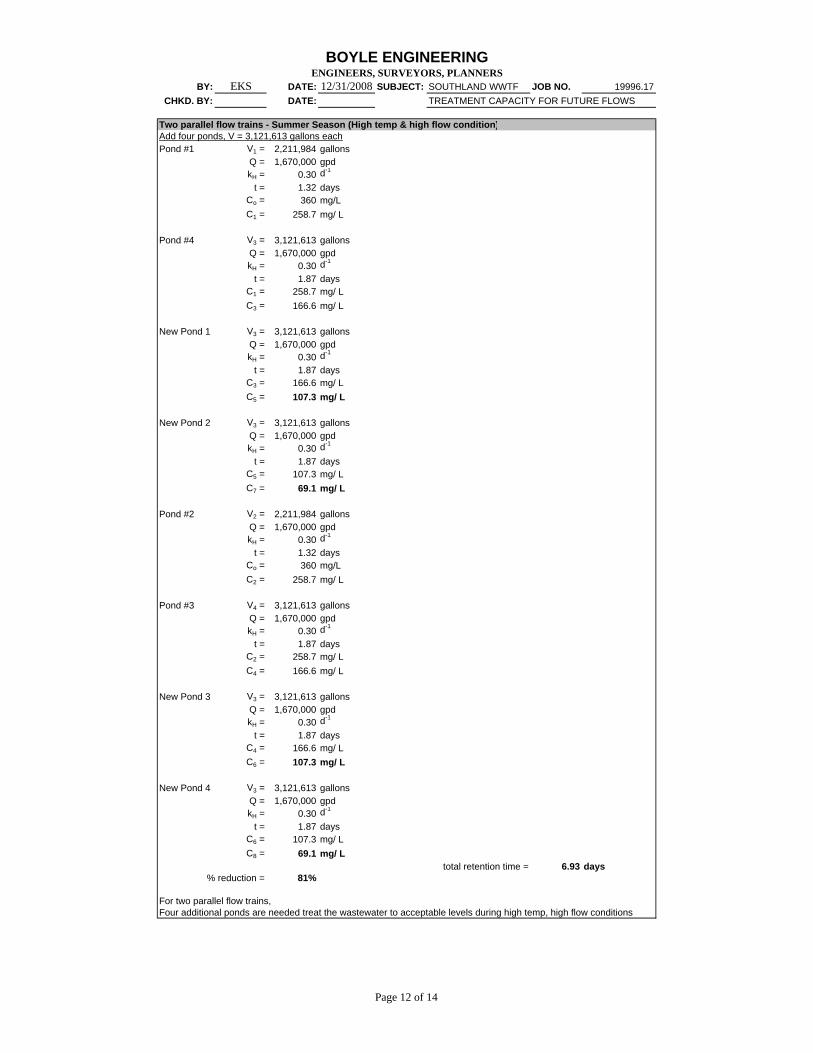
BOYLE ENGINEERINGENGINEERS, SURVEYORS, PLANNERS
BY: EKS DATE: 12/31/2008 SUBJECT: SOUTHLAND WWTF JOB NO. 19996.17CHKD. BY: DATE: TREATMENT CAPACITY FOR FUTURE FLOWS
Two parallel flow trains - Summer Season (High temp & high flow condition)Add four ponds, V = 3,121,613 gallons eachPond #1 V1 = 2,211,984 gallons
Q = 1,670,000 gpdkH = 0.30 d-1
t = 1.32 daysCo = 360 mg/LC1 = 258.7 mg/ L
Pond #4 V3 = 3,121,613 gallonsQ = 1,670,000 gpdkH = 0.30 d-1
t = 1.87 daysC1 = 258.7 mg/ LC3 = 166.6 mg/ L
New Pond 1 V3 = 3,121,613 gallonsQ = 1,670,000 gpdkH = 0.30 d-1
t = 1.87 daysC3 = 166.6 mg/ LC5 = 107.3 mg/ L
New Pond 2 V3 = 3,121,613 gallonsQ = 1,670,000 gpdkH = 0.30 d-1
t = 1.87 daysC5 = 107.3 mg/ LC7 = 69.1 mg/ L
Pond #2 V2 = 2,211,984 gallonsQ = 1,670,000 gpdkH = 0.30 d-1
t = 1.32 daysCo = 360 mg/LC2 = 258.7 mg/ L
Pond #3 V4 = 3,121,613 gallonsQ = 1,670,000 gpdkH = 0.30 d-1
t = 1.87 daysC2 = 258.7 mg/ LC4 = 166.6 mg/ L
New Pond 3 V3 = 3,121,613 gallonsQ = 1,670,000 gpdkH = 0.30 d-1
t = 1.87 daysC4 = 166.6 mg/ LC6 = 107.3 mg/ L
New Pond 4 V3 = 3,121,613 gallonsQ = 1,670,000 gpdkH = 0.30 d-1
t = 1.87 daysC6 = 107.3 mg/ LC8 = 69.1 mg/ L
total retention time = 6.93 days% reduction = 81%
For two parallel flow trains, Four additional ponds are needed treat the wastewater to acceptable levels during high temp, high flow conditions
Page 12 of 14

BOYLE ENGINEERINGENGINEERS, SURVEYORS, PLANNERS
BY: EKS DATE: 12/31/2008 SUBJECT: SOUTHLAND WWTF JOB NO. 19996.17CHKD. BY: DATE: TREATMENT CAPACITY FOR FUTURE FLOWS
Two parallel flow trains - MMF Summer Season (High temp & MMF flow cond.)Current System Under 2030 Flow ConditionsPond #1 V1 = 2,211,984 gallons
Q = 910,000 gpdkH = 0.30 d-1
t = 2.43 daysCo = 360 mg/LC1 = 209.5 mg/ L
Pond #4 V3 = 3,121,613 gallonsQ = 910,000 gpdkH = 0.30 d-1
t = 3.43 daysC1 = 209.5 mg/ LC3 = 104.0 mg/ L
Pond #2 V2 = 2,211,984 gallonsQ = 910,000 gpdkH = 0.30 d-1
t = 2.43 daysCo = 360 mg/LC2 = 209.5 mg/ L
Pond #3 V4 = 3,121,613 gallonsQ = 910,000 gpdkH = 0.30 d-1
t = 3.43 daysC2 = 209.5 mg/ LC4 = 104.0 mg/ L total retention time = 5.86 days
% reduction = 71%
Page 13 of 14
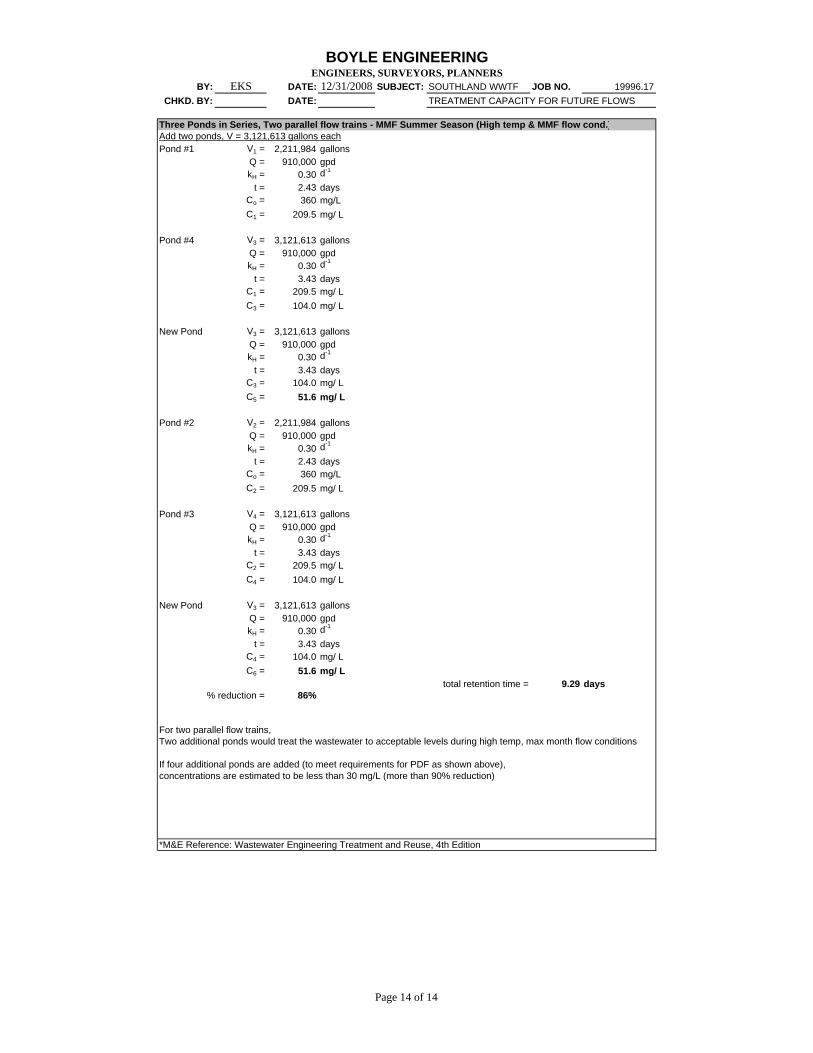
BOYLE ENGINEERINGENGINEERS, SURVEYORS, PLANNERS
BY: EKS DATE: 12/31/2008 SUBJECT: SOUTHLAND WWTF JOB NO. 19996.17CHKD. BY: DATE: TREATMENT CAPACITY FOR FUTURE FLOWS
Three Ponds in Series, Two parallel flow trains - MMF Summer Season (High temp & MMF flow cond.)Add two ponds, V = 3,121,613 gallons eachPond #1 V1 = 2,211,984 gallons
Q = 910,000 gpdkH = 0.30 d-1
t = 2.43 daysCo = 360 mg/LC1 = 209.5 mg/ L
Pond #4 V3 = 3,121,613 gallonsQ = 910,000 gpdkH = 0.30 d-1
t = 3.43 daysC1 = 209.5 mg/ LC3 = 104.0 mg/ L
New Pond V3 = 3,121,613 gallonsQ = 910,000 gpdkH = 0.30 d-1
t = 3.43 daysC3 = 104.0 mg/ LC5 = 51.6 mg/ L
Pond #2 V2 = 2,211,984 gallonsQ = 910,000 gpdkH = 0.30 d-1
t = 2.43 daysCo = 360 mg/LC2 = 209.5 mg/ L
Pond #3 V4 = 3,121,613 gallonsQ = 910,000 gpdkH = 0.30 d-1
t = 3.43 daysC2 = 209.5 mg/ LC4 = 104.0 mg/ L
New Pond V3 = 3,121,613 gallonsQ = 910,000 gpdkH = 0.30 d-1
t = 3.43 daysC4 = 104.0 mg/ LC6 = 51.6 mg/ L
total retention time = 9.29 days% reduction = 86%
For two parallel flow trains, Two additional ponds would treat the wastewater to acceptable levels during high temp, max month flow conditions
If four additional ponds are added (to meet requirements for PDF as shown above), concentrations are estimated to be less than 30 mg/L (more than 90% reduction)
*M&E Reference: Wastewater Engineering Treatment and Reuse, 4th Edition
Page 14 of 14
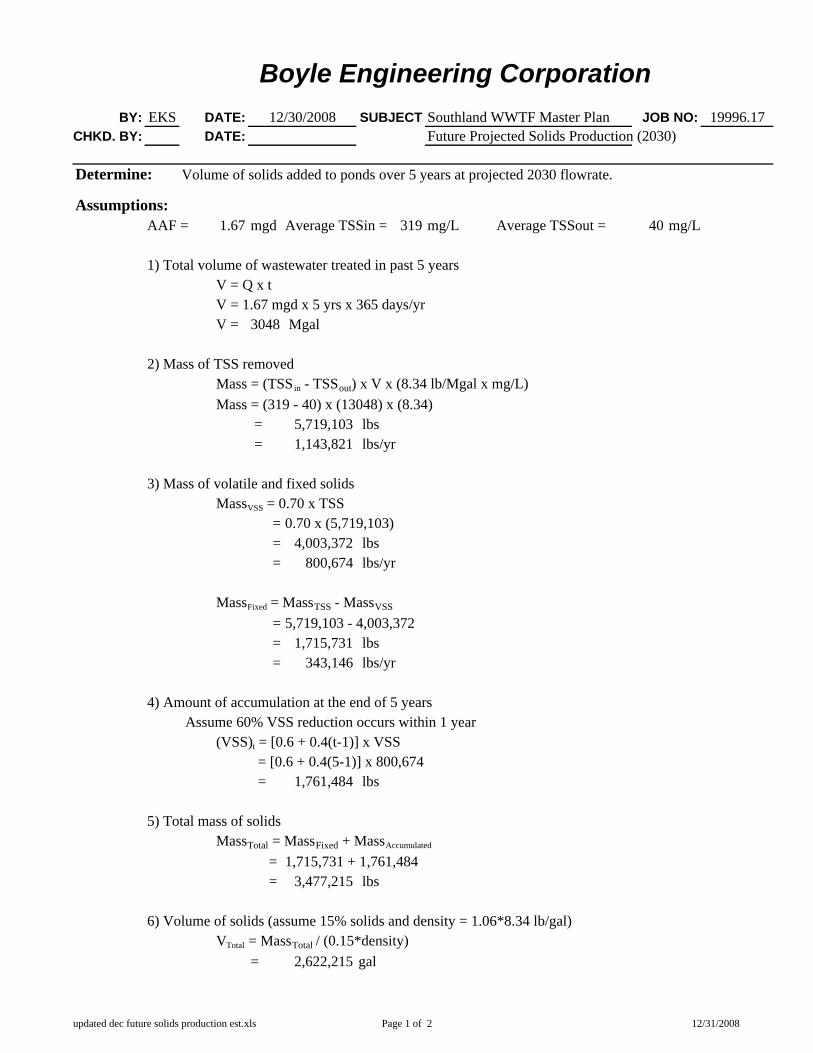
Boyle Engineering CorporationBY: EKS DATE: 12/30/2008 SUBJECT Southland WWTF Master Plan JOB NO: 19996.17
CHKD. BY: DATE: Future Projected Solids Production (2030)
Determine: Volume of solids added to ponds over 5 years at projected 2030 flowrate.
Assumptions:AAF = 1.67 mgd Average TSSin = 319 mg/L Average TSSout = 40 mg/L
1) Total volume of wastewater treated in past 5 yearsV = Q x tV = 1.67 mgd x 5 yrs x 365 days/yrV = 3048 Mgal
2) Mass of TSS removedMass = (TSSin - TSSout) x V x (8.34 lb/Mgal x mg/L)Mass = (319 - 40) x (13048) x (8.34)
= 5,719,103 lbs = 1,143,821 lbs/yr
3) Mass of volatile and fixed solidsMassVSS = 0.70 x TSS
= 0.70 x (5,719,103) = 4,003,372 lbs = 800,674 lbs/yr
MassFixed = MassTSS - MassVSS
= 5,719,103 - 4,003,372 = 1,715,731 lbs = 343,146 lbs/yr
4) Amount of accumulation at the end of 5 years Assume 60% VSS reduction occurs within 1 year
(VSS)t = [0.6 + 0.4(t-1)] x VSS = [0.6 + 0.4(5-1)] x 800,674 = 1,761,484 lbs
5) Total mass of solidsMassTotal = MassFixed + MassAccumulated
= 1,715,731 + 1,761,484 = 3,477,215 lbs
6) Volume of solids (assume 15% solids and density = 1.06*8.34 lb/gal)VTotal = MassTotal / (0.15*density)
= 2,622,215 gal
updated dec future solids production est.xls Page 1 of 2 12/31/2008

Boyle Engineering CorporationBY: EKS DATE: 12/30/2008 SUBJECT Southland WWTF Master Plan JOB NO: 19996.17
CHKD. BY: DATE: Future Projected Solids Production (2030)
Potential percentage of solid volume in ponds over 5 years at projected flowrate
Total pond volume (taken from NCSD Southland O&M Manual, July 2000)Liquid volume = 2 @ 295,700 cf & 2 @ 417,300 cfSludge volume = 2 @ 0.5 Mgal & 2 @ 0.7 Mgal
VTotal = [2 x 295,700 + 2 x 417,300] x 7.481 gal/cf + 2 x 500,000 + 2 x 700, 000VTotal = 13,067,906 gal
% of solids in pond = 2,622,21513,067,906
= 0.20 = 20% of existing pond volume for 5 years at projected future flowrate
updated dec future solids production est.xls Page 2 of 2 12/31/2008

APPENDIX C
COST OPINIONS

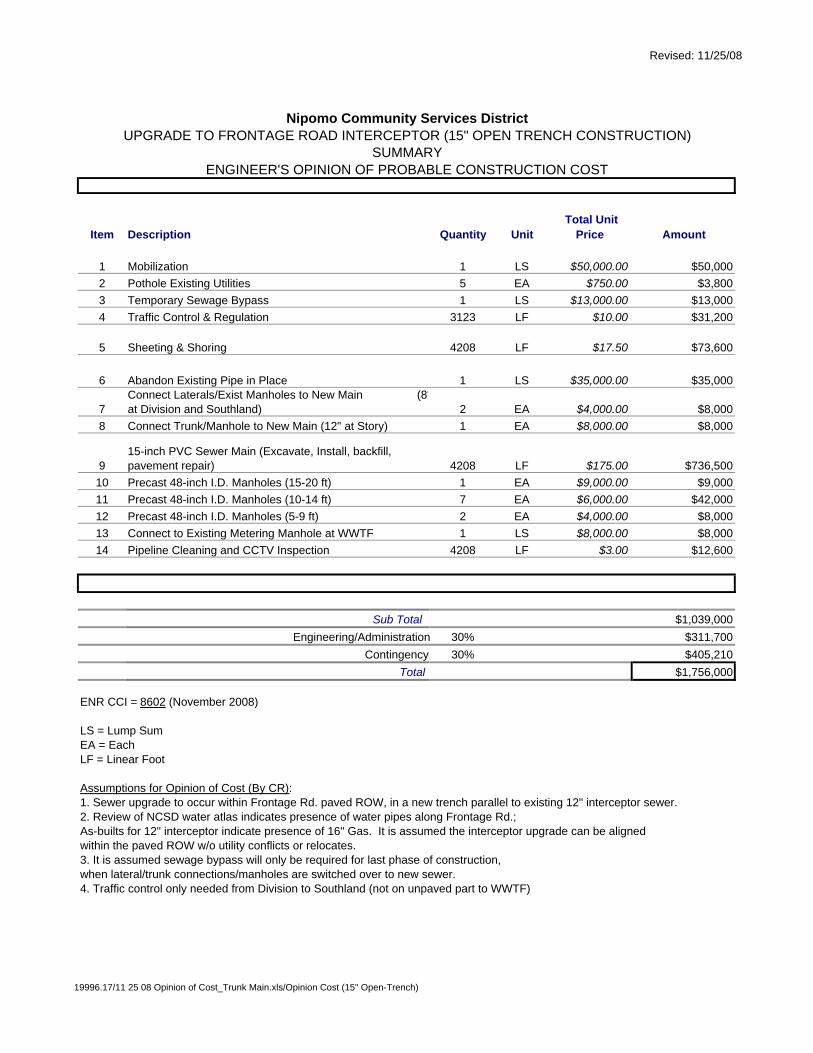
Revised: 11/25/08
Item Description Quantity Unit Total Unit
Price Amount
1 Mobilization 1 LS $50,000.00 $50,0002 Pothole Existing Utilities 5 EA $750.00 $3,8003 Temporary Sewage Bypass 1 LS $13,000.00 $13,0004 Traffic Control & Regulation 3123 LF $10.00 $31,200
5 Sheeting & Shoring 4208 LF $17.50 $73,600
6 Abandon Existing Pipe in Place 1 LS $35,000.00 $35,000
7Connect Laterals/Exist Manholes to New Main (8"at Division and Southland) 2 EA $4,000.00 $8,000
8 Connect Trunk/Manhole to New Main (12" at Story) 1 EA $8,000.00 $8,000
915-inch PVC Sewer Main (Excavate, Install, backfill, pavement repair) 4208 LF $175.00 $736,500
10 Precast 48-inch I.D. Manholes (15-20 ft) 1 EA $9,000.00 $9,00011 Precast 48-inch I.D. Manholes (10-14 ft) 7 EA $6,000.00 $42,00012 Precast 48-inch I.D. Manholes (5-9 ft) 2 EA $4,000.00 $8,00013 Connect to Existing Metering Manhole at WWTF 1 LS $8,000.00 $8,00014 Pipeline Cleaning and CCTV Inspection 4208 LF $3.00 $12,600
Sub Total $1,039,000Engineering/Administration 30% $311,700
Contingency 30% $405,210Total $1,756,000
ENR CCI = 8602 (November 2008)
LS = Lump SumEA = EachLF = Linear Foot
Assumptions for Opinion of Cost (By CR):1. Sewer upgrade to occur within Frontage Rd. paved ROW, in a new trench parallel to existing 12" interceptor sewer.2. Review of NCSD water atlas indicates presence of water pipes along Frontage Rd.; As-builts for 12" interceptor indicate presence of 16" Gas. It is assumed the interceptor upgrade can be aligned within the paved ROW w/o utility conflicts or relocates.3. It is assumed sewage bypass will only be required for last phase of construction, when lateral/trunk connections/manholes are switched over to new sewer.4. Traffic control only needed from Division to Southland (not on unpaved part to WWTF)
Nipomo Community Services DistrictUPGRADE TO FRONTAGE ROAD INTERCEPTOR (15" OPEN TRENCH CONSTRUCTION)
SUMMARYENGINEER'S OPINION OF PROBABLE CONSTRUCTION COST
19996.17/11 25 08 Opinion of Cost_Trunk Main.xls/Opinion Cost (15" Open-Trench)
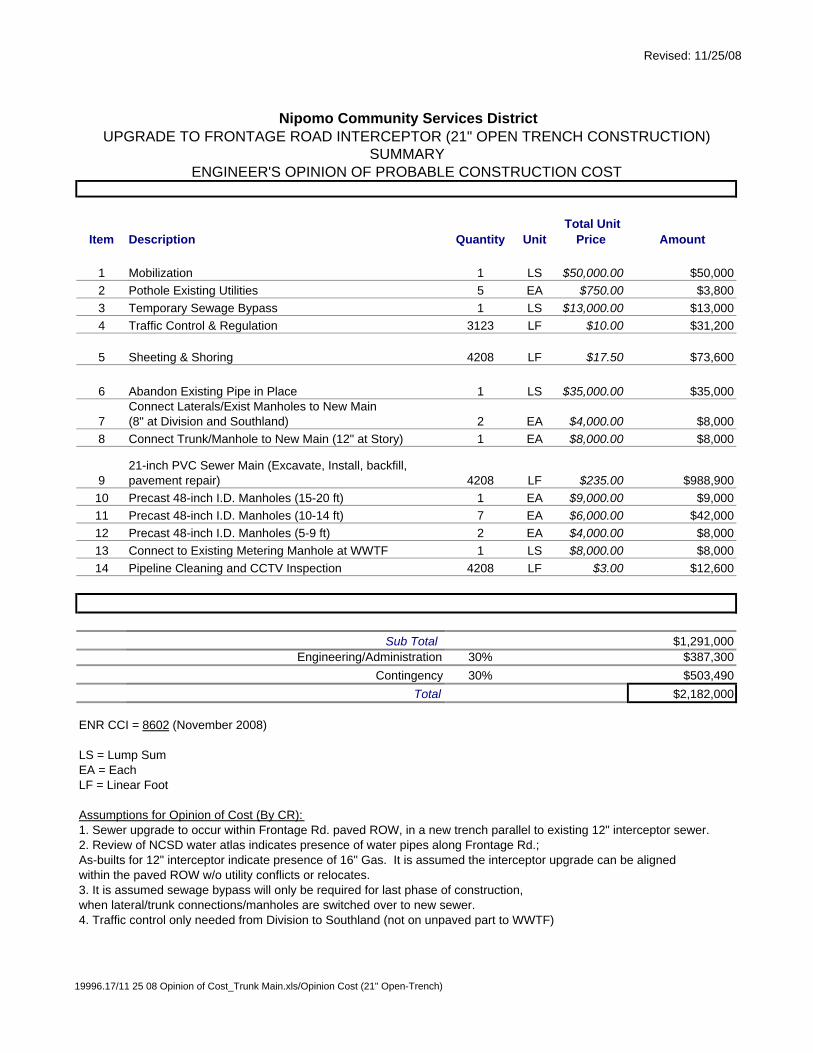
Revised: 11/25/08
Item Description Quantity Unit Total Unit
Price Amount
1 Mobilization 1 LS $50,000.00 $50,0002 Pothole Existing Utilities 5 EA $750.00 $3,8003 Temporary Sewage Bypass 1 LS $13,000.00 $13,0004 Traffic Control & Regulation 3123 LF $10.00 $31,200
5 Sheeting & Shoring 4208 LF $17.50 $73,600
6 Abandon Existing Pipe in Place 1 LS $35,000.00 $35,000
7Connect Laterals/Exist Manholes to New Main (8" at Division and Southland) 2 EA $4,000.00 $8,000
8 Connect Trunk/Manhole to New Main (12" at Story) 1 EA $8,000.00 $8,000
921-inch PVC Sewer Main (Excavate, Install, backfill, pavement repair) 4208 LF $235.00 $988,900
10 Precast 48-inch I.D. Manholes (15-20 ft) 1 EA $9,000.00 $9,00011 Precast 48-inch I.D. Manholes (10-14 ft) 7 EA $6,000.00 $42,00012 Precast 48-inch I.D. Manholes (5-9 ft) 2 EA $4,000.00 $8,00013 Connect to Existing Metering Manhole at WWTF 1 LS $8,000.00 $8,00014 Pipeline Cleaning and CCTV Inspection 4208 LF $3.00 $12,600
Sub Total $1,291,000Engineering/Administration 30% $387,300
Contingency 30% $503,490Total $2,182,000
ENR CCI = 8602 (November 2008)
LS = Lump SumEA = EachLF = Linear Foot
Assumptions for Opinion of Cost (By CR):1. Sewer upgrade to occur within Frontage Rd. paved ROW, in a new trench parallel to existing 12" interceptor sewer.2. Review of NCSD water atlas indicates presence of water pipes along Frontage Rd.; As-builts for 12" interceptor indicate presence of 16" Gas. It is assumed the interceptor upgrade can be aligned within the paved ROW w/o utility conflicts or relocates.3. It is assumed sewage bypass will only be required for last phase of construction, when lateral/trunk connections/manholes are switched over to new sewer.4. Traffic control only needed from Division to Southland (not on unpaved part to WWTF)
Nipomo Community Services DistrictUPGRADE TO FRONTAGE ROAD INTERCEPTOR (21" OPEN TRENCH CONSTRUCTION)
SUMMARYENGINEER'S OPINION OF PROBABLE CONSTRUCTION COST
19996.17/11 25 08 Opinion of Cost_Trunk Main.xls/Opinion Cost (21" Open-Trench)
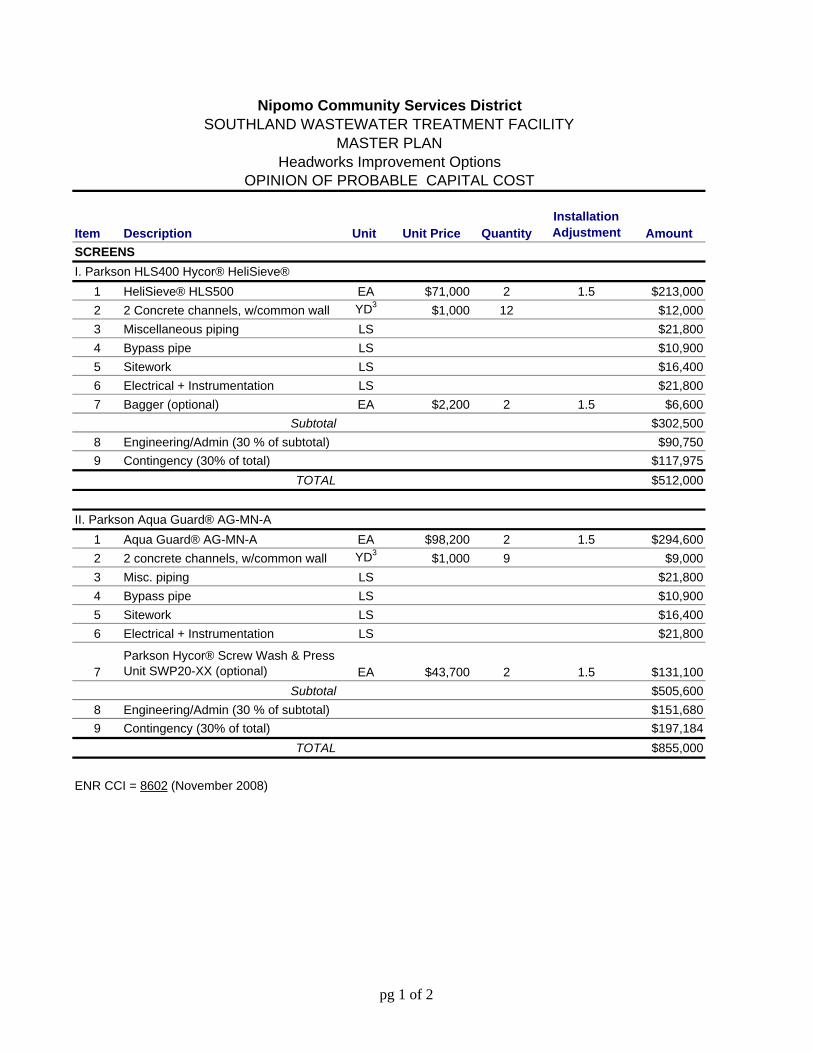
Item Description Unit Unit Price QuantityInstallation Adjustment Amount
1 HeliSieve® HLS500 EA $71,000 2 1.5 $213,0002 2 Concrete channels, w/common wall YD3 $1,000 12 $12,0003 Miscellaneous piping LS $21,8004 Bypass pipe LS $10,9005 Sitework LS $16,4006 Electrical + Instrumentation LS $21,8007 Bagger (optional) EA $2,200 2 1.5 $6,600
Subtotal $302,5008 Engineering/Admin (30 % of subtotal) $90,7509 Contingency (30% of total) $117,975
TOTAL $512,000
1 Aqua Guard® AG-MN-A EA $98,200 2 1.5 $294,6002 2 concrete channels, w/common wall YD3 $1,000 9 $9,0003 Misc. piping LS $21,8004 Bypass pipe LS $10,9005 Sitework LS $16,4006 Electrical + Instrumentation LS $21,800
7Parkson Hycor® Screw Wash & Press Unit SWP20-XX (optional) EA $43,700 2 1.5 $131,100
Subtotal $505,6008 Engineering/Admin (30 % of subtotal) $151,6809 Contingency (30% of total) $197,184
TOTAL $855,000
ENR CCI = 8602 (November 2008)
I. Parkson HLS400 Hycor® HeliSieve®
II. Parkson Aqua Guard® AG-MN-A
Nipomo Community Services DistrictSOUTHLAND WASTEWATER TREATMENT FACILITY
MASTER PLANHeadworks Improvement Options
OPINION OF PROBABLE CAPITAL COST
SCREENS
pg 1 of 2
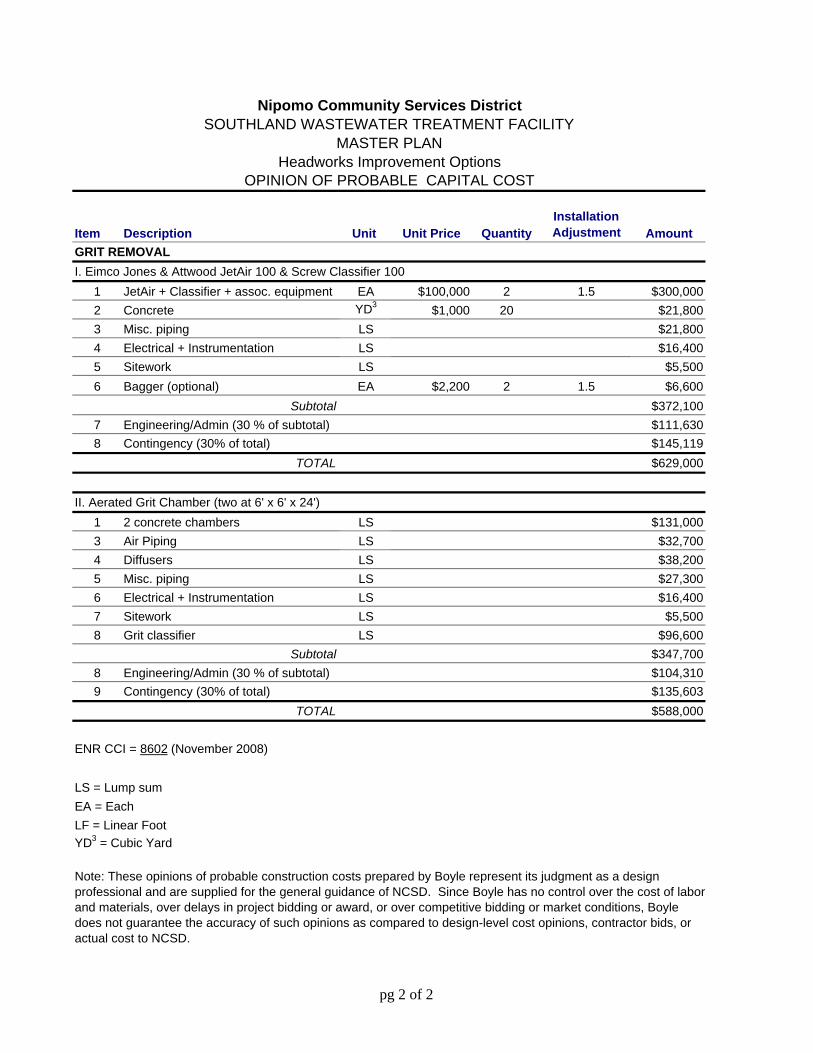
Item Description Unit Unit Price QuantityInstallation Adjustment Amount
Nipomo Community Services DistrictSOUTHLAND WASTEWATER TREATMENT FACILITY
MASTER PLANHeadworks Improvement Options
OPINION OF PROBABLE CAPITAL COST
1 JetAir + Classifier + assoc. equipment EA $100,000 2 1.5 $300,0002 Concrete YD3 $1,000 20 $21,8003 Misc. piping LS $21,8004 Electrical + Instrumentation LS $16,4005 Sitework LS $5,5006 Bagger (optional) EA $2,200 2 1.5 $6,600
Subtotal $372,1007 Engineering/Admin (30 % of subtotal) $111,6308 Contingency (30% of total) $145,119
TOTAL $629,000
1 2 concrete chambers LS $131,0003 Air Piping LS $32,7004 Diffusers LS $38,2005 Misc. piping LS $27,3006 Electrical + Instrumentation LS $16,4007 Sitework LS $5,5008 Grit classifier LS $96,600
Subtotal $347,7008 Engineering/Admin (30 % of subtotal) $104,3109 Contingency (30% of total) $135,603
TOTAL $588,000
ENR CCI = 8602 (November 2008)
LS = Lump sumEA = EachLF = Linear FootYD3 = Cubic Yard
II. Aerated Grit Chamber (two at 6' x 6' x 24')
Note: These opinions of probable construction costs prepared by Boyle represent its judgment as a design professional and are supplied for the general guidance of NCSD. Since Boyle has no control over the cost of labor and materials, over delays in project bidding or award, or over competitive bidding or market conditions, Boyle does not guarantee the accuracy of such opinions as compared to design-level cost opinions, contractor bids, or actual cost to NCSD.
GRIT REMOVALI. Eimco Jones & Attwood JetAir 100 & Screw Classifier 100
pg 2 of 2
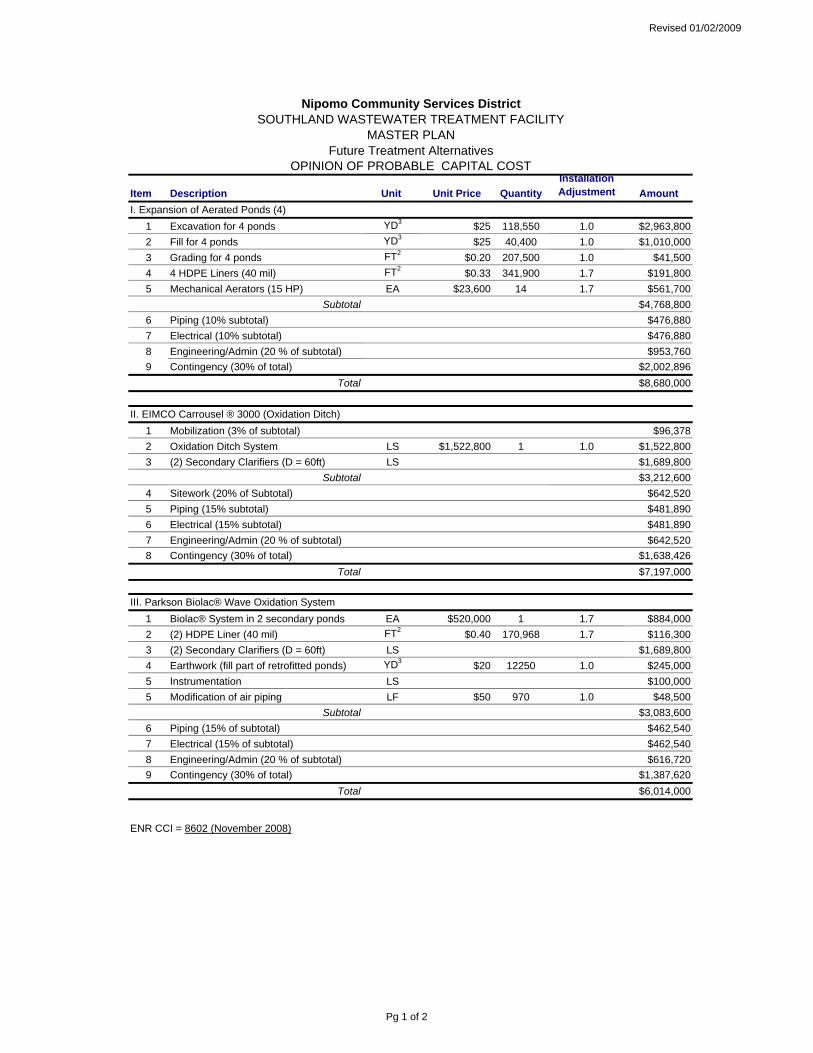
Revised 01/02/2009
Item Description Unit Unit Price QuantityInstallation Adjustment Amount
1 Excavation for 4 ponds YD3 $25 118,550 1.0 $2,963,8002 Fill for 4 ponds YD3 $25 40,400 1.0 $1,010,0003 Grading for 4 ponds FT2 $0.20 207,500 1.0 $41,5004 4 HDPE Liners (40 mil) FT2 $0.33 341,900 1.7 $191,8005 Mechanical Aerators (15 HP) EA $23,600 14 1.7 $561,700
Subtotal $4,768,8006 Piping (10% subtotal) $476,8807 Electrical (10% subtotal) $476,8808 Engineering/Admin (20 % of subtotal) $953,7609 Contingency (30% of total) $2,002,896
Total $8,680,000
1 Mobilization (3% of subtotal) $96,3782 Oxidation Ditch System LS $1,522,800 1 1.0 $1,522,8003 (2) Secondary Clarifiers (D = 60ft) LS $1,689,800
Subtotal $3,212,6004 Sitework (20% of Subtotal) $642,5205 Piping (15% subtotal) $481,8906 Electrical (15% subtotal) $481,8907 Engineering/Admin (20 % of subtotal) $642,5208 Contingency (30% of total) $1,638,426
Total $7,197,000
1 Biolac® System in 2 secondary ponds EA $520,000 1 1.7 $884,0002 (2) HDPE Liner (40 mil) FT2 $0.40 170,968 1.7 $116,3003 (2) Secondary Clarifiers (D = 60ft) LS $1,689,8004 Earthwork (fill part of retrofitted ponds) YD3 $20 12250 1.0 $245,0005 Instrumentation LS $100,0005 Modification of air piping LF $50 970 1.0 $48,500
Subtotal $3,083,6006 Piping (15% of subtotal) $462,5407 Electrical (15% of subtotal) $462,5408 Engineering/Admin (20 % of subtotal) $616,7209 Contingency (30% of total) $1,387,620
Total $6,014,000
ENR CCI = 8602 (November 2008)
III. Parkson Biolac® Wave Oxidation System
OPINION OF PROBABLE CAPITAL COST
I. Expansion of Aerated Ponds (4)
II. EIMCO Carrousel ® 3000 (Oxidation Ditch)
Nipomo Community Services DistrictSOUTHLAND WASTEWATER TREATMENT FACILITY
MASTER PLANFuture Treatment Alternatives
Pg 1 of 2
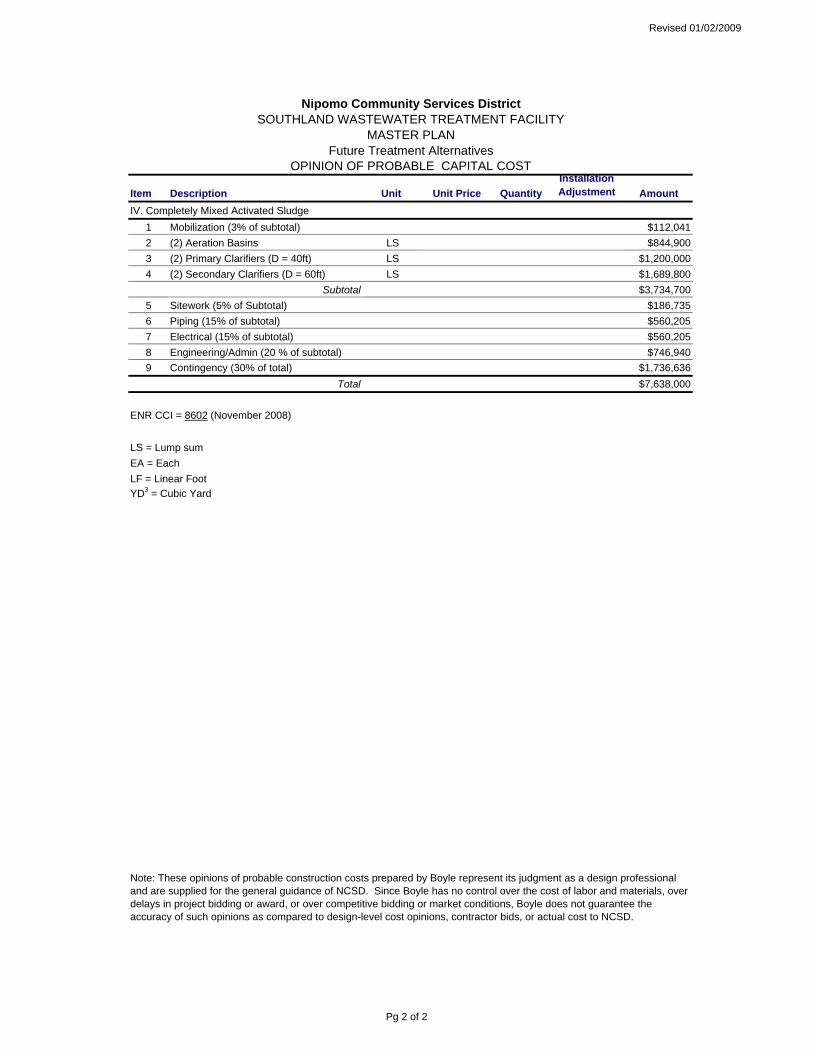
Revised 01/02/2009
Item Description Unit Unit Price QuantityInstallation Adjustment Amount
OPINION OF PROBABLE CAPITAL COST
Nipomo Community Services DistrictSOUTHLAND WASTEWATER TREATMENT FACILITY
MASTER PLANFuture Treatment Alternatives
1 Mobilization (3% of subtotal) $112,0412 (2) Aeration Basins LS $844,9003 (2) Primary Clarifiers (D = 40ft) LS $1,200,0004 (2) Secondary Clarifiers (D = 60ft) LS $1,689,800
Subtotal $3,734,7005 Sitework (5% of Subtotal) $186,7356 Piping (15% of subtotal) $560,2057 Electrical (15% of subtotal) $560,2058 Engineering/Admin (20 % of subtotal) $746,9409 Contingency (30% of total) $1,736,636
Total $7,638,000
ENR CCI = 8602 (November 2008)
LS = Lump sumEA = EachLF = Linear FootYD3 = Cubic Yard
Note: These opinions of probable construction costs prepared by Boyle represent its judgment as a design professional and are supplied for the general guidance of NCSD. Since Boyle has no control over the cost of labor and materials, over delays in project bidding or award, or over competitive bidding or market conditions, Boyle does not guarantee the accuracy of such opinions as compared to design-level cost opinions, contractor bids, or actual cost to NCSD.
IV. Completely Mixed Activated Sludge
Pg 2 of 2
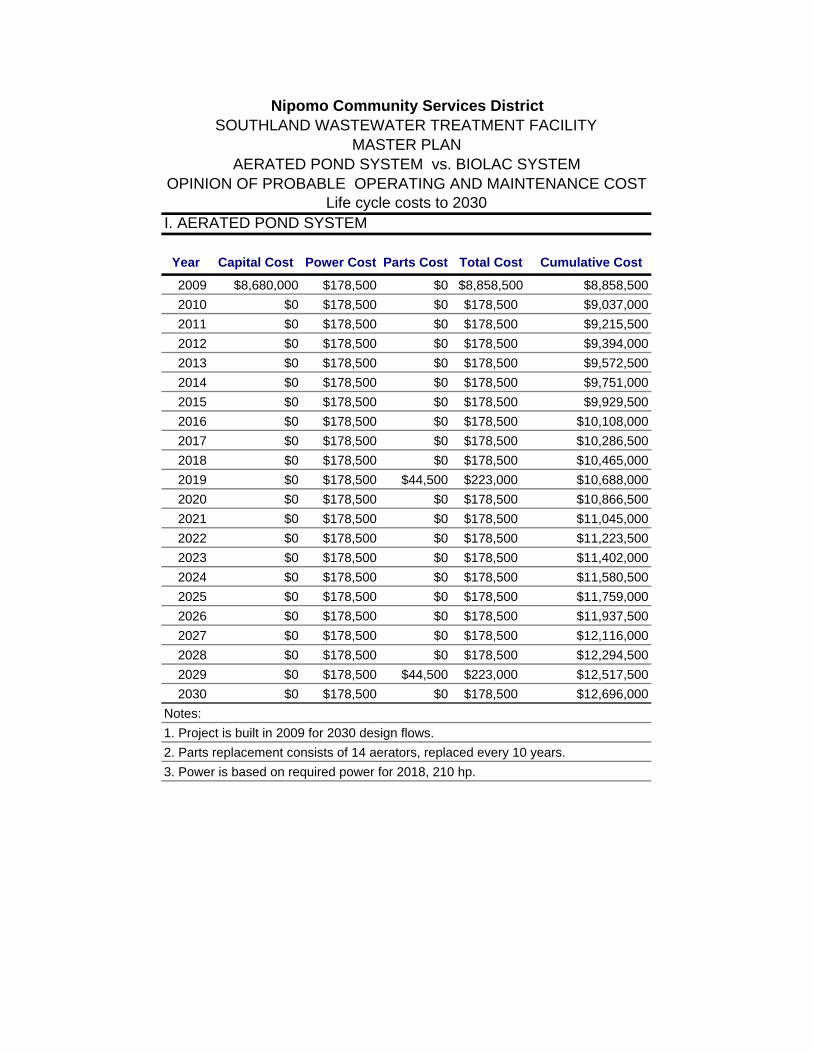
I. AERATED POND SYSTEM
Year Capital Cost Power Cost Parts Cost Total Cost Cumulative Cost
2009 $8,680,000 $178,500 $0 $8,858,500 $8,858,5002010 $0 $178,500 $0 $178,500 $9,037,0002011 $0 $178,500 $0 $178,500 $9,215,5002012 $0 $178,500 $0 $178,500 $9,394,0002013 $0 $178,500 $0 $178,500 $9,572,5002014 $0 $178,500 $0 $178,500 $9,751,0002015 $0 $178,500 $0 $178,500 $9,929,5002016 $0 $178,500 $0 $178,500 $10,108,0002017 $0 $178,500 $0 $178,500 $10,286,5002018 $0 $178,500 $0 $178,500 $10,465,0002019 $0 $178,500 $44,500 $223,000 $10,688,0002020 $0 $178,500 $0 $178,500 $10,866,5002021 $0 $178,500 $0 $178,500 $11,045,0002022 $0 $178,500 $0 $178,500 $11,223,5002023 $0 $178,500 $0 $178,500 $11,402,0002024 $0 $178,500 $0 $178,500 $11,580,5002025 $0 $178,500 $0 $178,500 $11,759,0002026 $0 $178,500 $0 $178,500 $11,937,5002027 $0 $178,500 $0 $178,500 $12,116,0002028 $0 $178,500 $0 $178,500 $12,294,5002029 $0 $178,500 $44,500 $223,000 $12,517,5002030 $0 $178,500 $0 $178,500 $12,696,000
Notes:1. Project is built in 2009 for 2030 design flows. 2. Parts replacement consists of 14 aerators, replaced every 10 years.3. Power is based on required power for 2018, 210 hp.
Nipomo Community Services DistrictSOUTHLAND WASTEWATER TREATMENT FACILITY
MASTER PLANAERATED POND SYSTEM vs. BIOLAC SYSTEM
OPINION OF PROBABLE OPERATING AND MAINTENANCE COST Life cycle costs to 2030
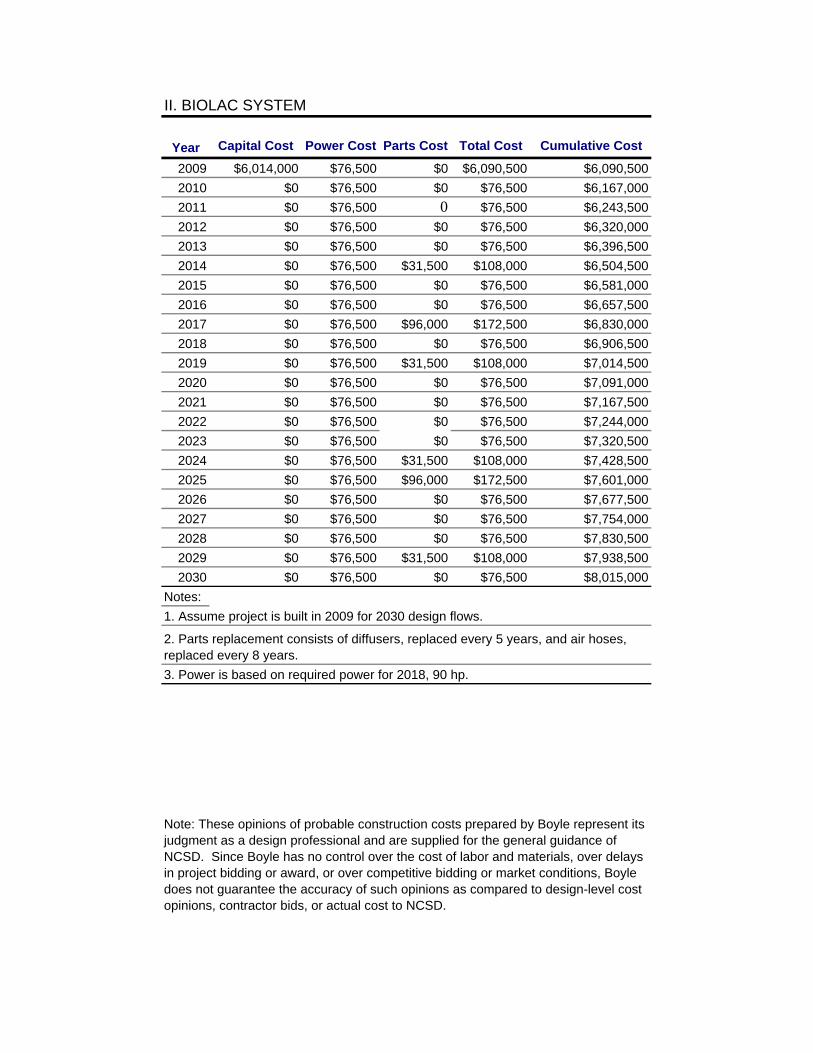
II. BIOLAC SYSTEM
Year Capital Cost Power Cost Parts Cost Total Cost Cumulative Cost
2009 $6,014,000 $76,500 $0 $6,090,500 $6,090,5002010 $0 $76,500 $0 $76,500 $6,167,0002011 $0 $76,500 0 $76,500 $6,243,5002012 $0 $76,500 $0 $76,500 $6,320,0002013 $0 $76,500 $0 $76,500 $6,396,5002014 $0 $76,500 $31,500 $108,000 $6,504,5002015 $0 $76,500 $0 $76,500 $6,581,0002016 $0 $76,500 $0 $76,500 $6,657,5002017 $0 $76,500 $96,000 $172,500 $6,830,0002018 $0 $76,500 $0 $76,500 $6,906,5002019 $0 $76,500 $31,500 $108,000 $7,014,5002020 $0 $76,500 $0 $76,500 $7,091,0002021 $0 $76,500 $0 $76,500 $7,167,5002022 $0 $76,500 $0 $76,500 $7,244,0002023 $0 $76,500 $0 $76,500 $7,320,5002024 $0 $76,500 $31,500 $108,000 $7,428,5002025 $0 $76,500 $96,000 $172,500 $7,601,0002026 $0 $76,500 $0 $76,500 $7,677,5002027 $0 $76,500 $0 $76,500 $7,754,0002028 $0 $76,500 $0 $76,500 $7,830,5002029 $0 $76,500 $31,500 $108,000 $7,938,5002030 $0 $76,500 $0 $76,500 $8,015,000
Notes:1. Assume project is built in 2009 for 2030 design flows.
3. Power is based on required power for 2018, 90 hp.
2. Parts replacement consists of diffusers, replaced every 5 years, and air hoses, replaced every 8 years.
Note: These opinions of probable construction costs prepared by Boyle represent its judgment as a design professional and are supplied for the general guidance of NCSD. Since Boyle has no control over the cost of labor and materials, over delays in project bidding or award, or over competitive bidding or market conditions, Boyle does not guarantee the accuracy of such opinions as compared to design-level cost opinions, contractor bids, or actual cost to NCSD.
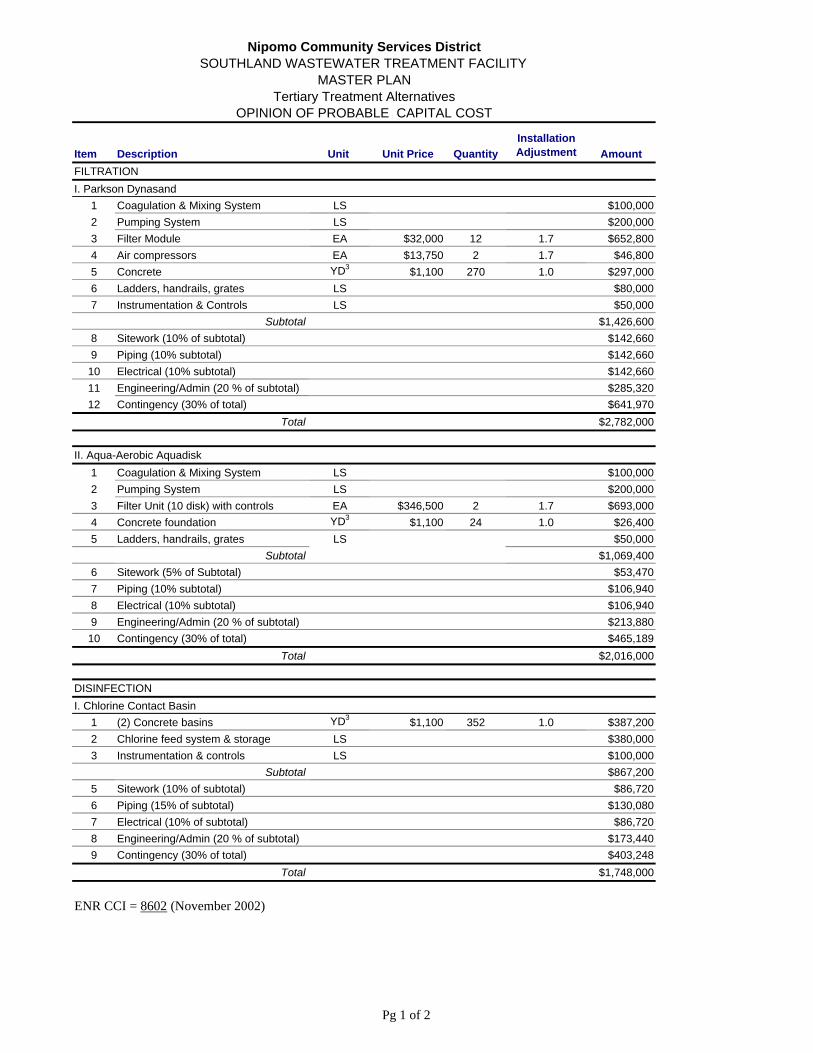
Item Description Unit Unit Price QuantityInstallation Adjustment Amount
I. Parkson Dynasand1 Coagulation & Mixing System LS $100,0002 Pumping System LS $200,0003 Filter Module EA $32,000 12 1.7 $652,8004 Air compressors EA $13,750 2 1.7 $46,8005 Concrete YD3 $1,100 270 1.0 $297,0006 Ladders, handrails, grates LS $80,0007 Instrumentation & Controls LS $50,000
Subtotal $1,426,6008 Sitework (10% of subtotal) $142,6609 Piping (10% subtotal) $142,66010 Electrical (10% subtotal) $142,66011 Engineering/Admin (20 % of subtotal) $285,32012 Contingency (30% of total) $641,970
Total $2,782,000
1 Coagulation & Mixing System LS $100,0002 Pumping System LS $200,0003 Filter Unit (10 disk) with controls EA $346,500 2 1.7 $693,0004 Concrete foundation YD3 $1,100 24 1.0 $26,4005 Ladders, handrails, grates LS $50,000
Subtotal $1,069,4006 Sitework (5% of Subtotal) $53,4707 Piping (10% subtotal) $106,9408 Electrical (10% subtotal) $106,9409 Engineering/Admin (20 % of subtotal) $213,88010 Contingency (30% of total) $465,189
Total $2,016,000
I. Chlorine Contact Basin1 (2) Concrete basins YD3 $1,100 352 1.0 $387,2002 Chlorine feed system & storage LS $380,0003 Instrumentation & controls LS $100,000
Subtotal $867,2005 Sitework (10% of subtotal) $86,7206 Piping (15% of subtotal) $130,0807 Electrical (10% of subtotal) $86,7208 Engineering/Admin (20 % of subtotal) $173,4409 Contingency (30% of total) $403,248
Total $1,748,000
ENR CCI = 8602 (November 2002)
DISINFECTION
OPINION OF PROBABLE CAPITAL COST
FILTRATION
II. Aqua-Aerobic Aquadisk
Nipomo Community Services DistrictSOUTHLAND WASTEWATER TREATMENT FACILITY
MASTER PLANTertiary Treatment Alternatives
Pg 1 of 2
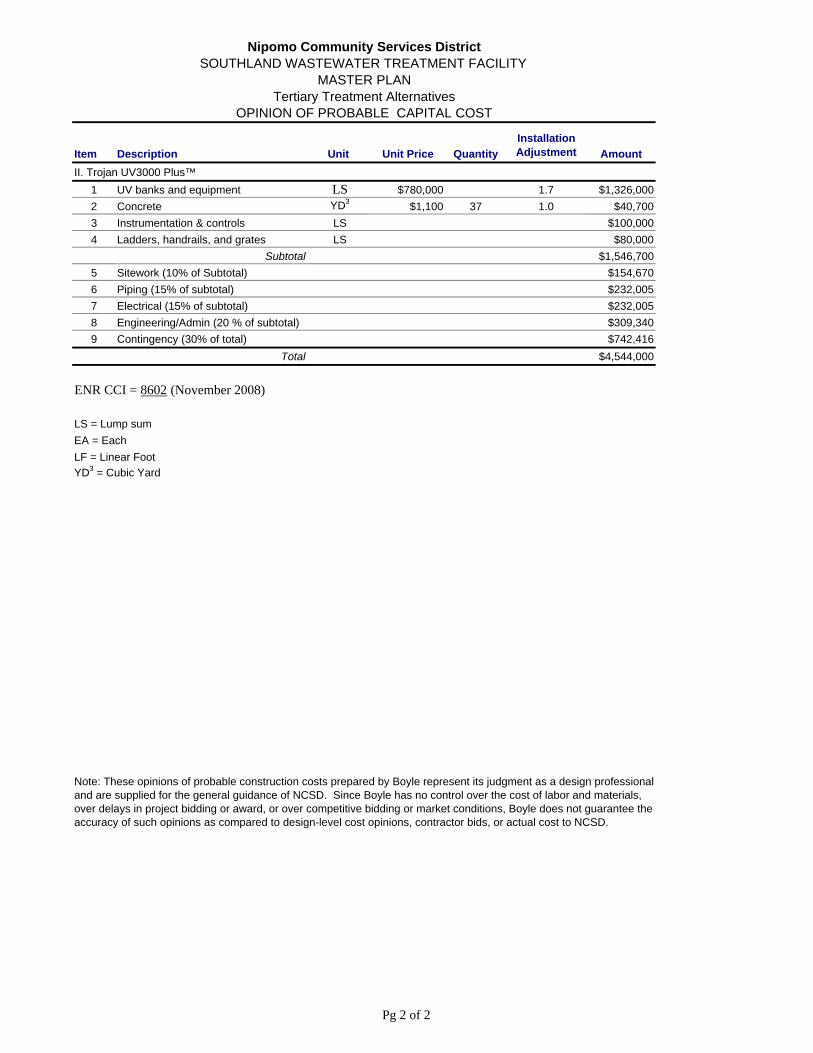
Item Description Unit Unit Price QuantityInstallation Adjustment Amount
OPINION OF PROBABLE CAPITAL COST
Nipomo Community Services DistrictSOUTHLAND WASTEWATER TREATMENT FACILITY
MASTER PLANTertiary Treatment Alternatives
1 UV banks and equipment LS $780,000 1.7 $1,326,0002 Concrete YD3 $1,100 37 1.0 $40,7003 Instrumentation & controls LS $100,0004 Ladders, handrails, and grates LS $80,000
Subtotal $1,546,7005 Sitework (10% of Subtotal) $154,6706 Piping (15% of subtotal) $232,0057 Electrical (15% of subtotal) $232,0058 Engineering/Admin (20 % of subtotal) $309,3409 Contingency (30% of total) $742,416
Total $4,544,000
ENR CCI = 8602 (November 2008)
LS = Lump sumEA = EachLF = Linear FootYD3 = Cubic Yard
Note: These opinions of probable construction costs prepared by Boyle represent its judgment as a design professional and are supplied for the general guidance of NCSD. Since Boyle has no control over the cost of labor and materials, over delays in project bidding or award, or over competitive bidding or market conditions, Boyle does not guarantee the accuracy of such opinions as compared to design-level cost opinions, contractor bids, or actual cost to NCSD.
II. Trojan UV3000 Plus™
Pg 2 of 2
>I PARKSON CORPORATION
DYNASAND8
CONTINUOUS, UPFLOW, GRANULAR MEDIA FILTER
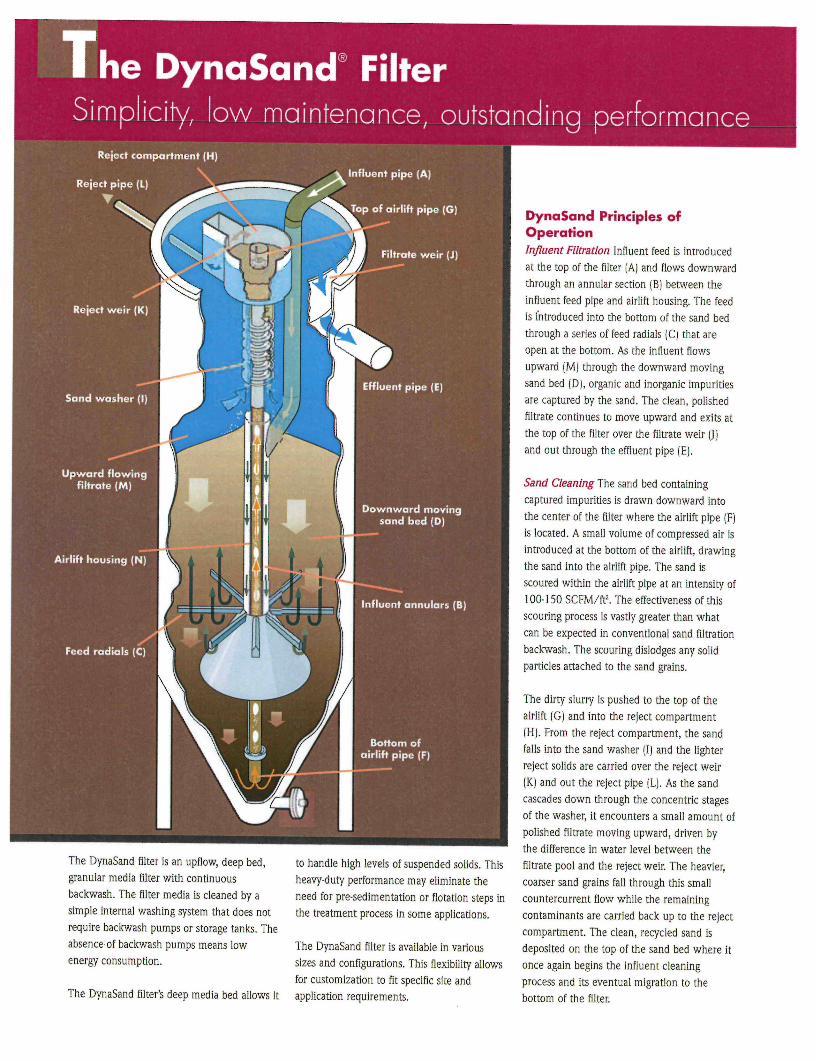
he DynaSand FilterSimplicity, low maintenance, outstanding performance
art men t (H)
Influent pipReject pipe (t)
Top of airlift pipe (G) DynaSand Principles ofOperationInfluent Filtration Influent feed is introduced
at the top of the filter (A) and flows downward
through an annular section (B) between the
influent feed pipe and airlift housing. The feed
is introduced into the bottom of the sand bed
through a series of feed radials (C) that are
open at the bottom. As the influent flows
upward (M) through the downward moving
sand bed (D), organic and inorganic impurities
are captured by the sand. The clean, polished
filtrate continues to move upward and exits at
the top of the filter over the filtrate weir (J)
and out through the effluent pipe (E).
Sand Cleaning The sand bed containing
captured impurities is drawn downward into
the center of the filter where the airlift pipe (F)
is located. A small volume of compressed air is
introduced at the bottom of the airlift, drawing
the sand into the airlift pipe. The sand is
scoured within the airlift pipe at an intensity of
100-150 SCFM/ft\ The effectiveness of this
scouring process is vastly greater than what
can be expected in conventional sand filtration
backwash. The scouring dislodges any solid
particles attached to the sand grains.
The dirty slurry is pushed to the top of the
airlift (G) and into the reject compartment
(H). From the reject compartment, the sand
falls into the sand washer (I) and the lighter
reject solids are carried over the reject weir
(K) and out the reject pipe (L). As the sand
cascades down through the concentric stages
of the washer, it encounters a small amount of
polished filtrate moving upward, driven by
the difference in water level between the
filtrate pool and the reject weir. The heavier,
coarser sand grains fall, through this small
countercurrent flow while the remaining
contaminants are carried back up to the reject
compartment. The clean, recycled sand is
deposited on the top of the sand bed where it
once again begins the influent cleaning
process and its eventual migration to the
bottom of the filter.
Filtrate weir (J)
Reject weir (K)
Effluent pipe (E)Sand washer (I)
Upward flowingfiltrate (M)
Downward movingsand bed (D)
Airlift housing (N)
Feed radials (C)
Bottom oairlift pipe (F)
The DynaSand filter is an upflow, deep bed,
granular media filter with continuous
backwash. The filter media is cleaned by a
simple internal washing system that does not
require backwash pumps or storage tanks. The
absence-of backwash pumps means low
energy consumption.
The DynaSand filter's deep media bed allows it
to handle high levels of suspended solids. This
heavy-duty performance may eliminate the
need for pre-sedimentation or flotation steps in
the treatment process in some applications.
The DynaSand filter is available in various
sizes and configurations. This flexibility allows
for customization to fit specific site and
application requirements.
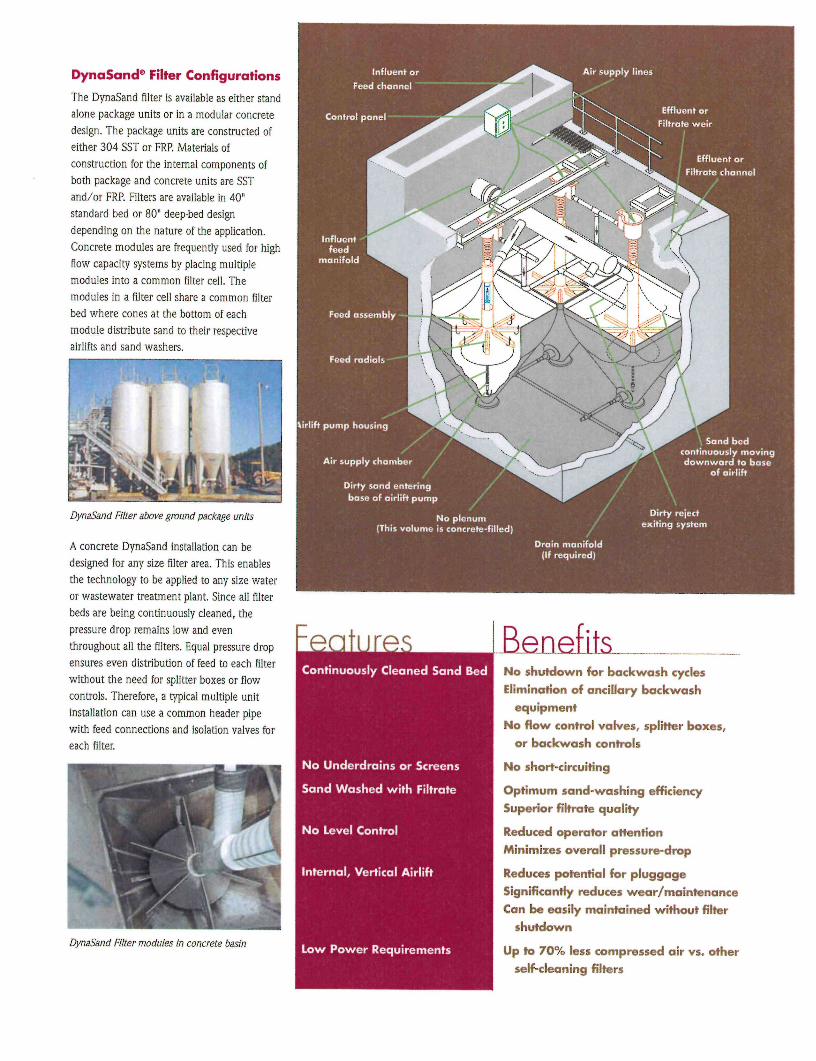
Influent or
Feed channel "
Air supply linesDynaSand® Filter Configurations
The DynaSand filter is available as either stand
alone package units or in a modular concrete
design. The package units are constructed of
either 304 SST or FRP. Materials of
construction for the internal components of
both package and concrete units are SST
and/or FRP. Filters are available in 40"
standard bed or 80" deep-bed design
depending on the nature of the application.
Concrete modules are frequently used for high
flow capacity systems by placing multiple
modules into a common filter cell. The
modules in a filter cell share a common filter
bed where cones at the bottom of each
module distribute sand to their respective
airlifts and sand washers.
Effluent orFiltrate weir
Control panel -
Effluent orFiltrate channel
Influentfeed
manifold
Feed assembly —
Feed radials-
Wlift pump housing
Sand bedcontinuously movingdownward to base
of airliftAir supply chamber /
Dirty sand enteringbase of airlift pump
Dirty rejectexiting system
DynaSand Filter above ground package units
A concrete DynaSand installation can be
designed for any size filter area. This enables
the technology to be applied to any size water
or wastewater treatment plant. Since all filter
beds are being continuously cleaned, the
pressure drop remains low and even
throughout all the filters. Equal pressure drop
ensures even distribution of feed to each filter
without the need for splitter boxes or flow
controls. Therefore, a typical multiple unit
installation can use a common header pipe
with feed connections and isolation valves for
each filter.
No plenum(This volume is concrete-filled)
Drain manifold(If required)
Benefits.Feati jresContinuously Cleaned Sand Bed No shutdown for backwash cycles
Elimination of ancillary backwash
equipment
No flow control valves, splitter boxes,
or backwash controls
No short-circuiting
Optimum sand-washing efficiency
Superior filtrate quality
Reduced operator attention
Minimizes overall pressure-drop
Reduces potential for pluggage
Significantly reduces wear/maintenance
Can be easily maintained without filter
shutdown
Up to 70% less compressed air vs. other
self-cleaning filters
No Underdrains or Screens
Sand Washed with Filtrate
No Level Control
Internal, Vertical Airlift
DynaSand Filter modules in concrete basinLow Power Requirements
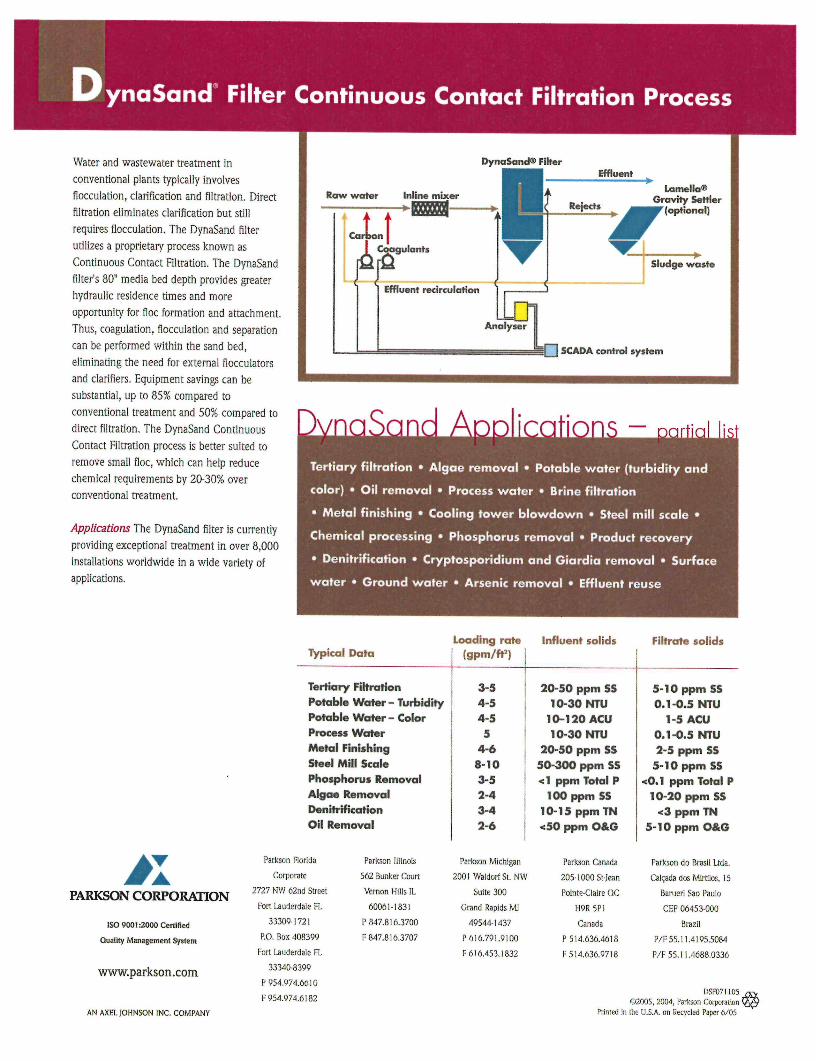
ynaSand Filter Continuous Contact Filtration Process
DynaSand® FilterWater and wastewater treatment in
conventional plants typically involves
flocculation, clarification and filtration. Direct
filtration eliminates clarification but still
requires flocculation. The DynaSand filter
utilizes a proprietary process known as
Continuous Contact Filtration. The DynaSand
filter's 80" media bed depth provides greater
hydraulic residence times and more
opportunity for floe formation and attachment.
Thus, coagulation, flocculation and separation
can be performed within the sand bed,
eliminating the need for external flocculators
and clarifiers. Equipment savings can be
substantial, up to 85% compared to
conventional treatment and 50% compared to
direct filtration. The DynaSand Continuous
Contact Filtration process is better suited to
remove small floe, which can help reduce
chemical requirements by 20-30% over
conventional treatment.
Applications The DynaSand filter is currently
providing exceptional treatment in over 8,000
installations worldwide in a wide variety of
applications.
Effluent
Lamella®Gravity Settler
(optional)
Raw water Inline mixer
Sludge waste
l[~~l SCADA control system
K/nnSand Appl icat ions - nnrtiai iist
Tertiary filtration • Algae removal • Potable water (turbidity and
color) • Oil removal • Process water • Brine filtration
• Metal finishing • Cooling tower blowdown • Steel mill scale •
Chemical processing • Phosphorus removal • Product recovery
• Denitrification • Cryptosporidium and Giardia removal • Surface
water • Ground water • Arsenic removal • Effluent reuse
Typical Data
Tertiary FiltrationPotable Water - TurbidityPotable Water - ColorProcess WaterMetal Finishing
Steel Mill ScalePhosphorus RemovalAlgae RemovalDenitrificationOil Removal
Loading rate(gpm/fr')
3-54-54-55
4-68-103-52-43-42-6
Influent solids
20-50 ppm SS10-30 NTU
10-120 ACU10-30 NTU
20-50 ppm SS50-300 ppm SS< 1 ppm Total P
100 ppm SS10-15 ppmTN<50 ppm O&G
Filtrate solids
5-10 ppm SS0.1-0.5 NTU
1-5 ACU0.1-0.5 NTU2-5 ppm SS
5-10 ppm SS«O.l ppm Total P
10-20 ppm SS<3 ppm TN
5-10 ppm O&G
Partcson Florida
Corporate
2727 NW 62nd Street
Fort Lauderdale FL
33309-1721
P.O. Box 408399
Fort Lauderdale FL
33340-8399
P 9.54.974.6610
F 954.974.6182
Parkson Illinois
562 Bunker Court
Vcrnon Hills 11.
60061-1831
P 847.816.3700
F 847.816.3707
Parkson Michigan
2001 Waldorf St. NW
Suite 300
Grand Rapids Ml
49544-1437
P 616.791.9100
F 616.453.1832
Parkson Canada
205-1000 St-Jean
Pointe-Claire QC
H9R5P1
Canada
P 514.636.4618
F 514.636.9718
Primed
Parkson do Brasil Llcla.
Calcada dos Mirtilos, 15
Baruerl Sao Paulo
CEP 06453-000
Brazil
P/F 55.11.4195.5084
P/F 55.11.4688.0336
IJM-U/ 1 10.1
©2005, 2004, Parfeson Corporationin the U.S.A. on Recycled Paper 6/05
PARKSON CORPORATION
ISO 9001:2000 Certified
Quality Management System
www.parkson.com
AN AXF.L JOHNSON INC. COMPANY

Aqua-Aerobic Systems, Inc.Bulletin #600G 07/05
AquaCloth Media Filtration
T h e L e a d e r i n C l o t h M e d i a F i l t r a t i o n
AquaCloth Media Filtration
5679-ClothMedia.qxd 7/26/05 10:39 AM Page 2
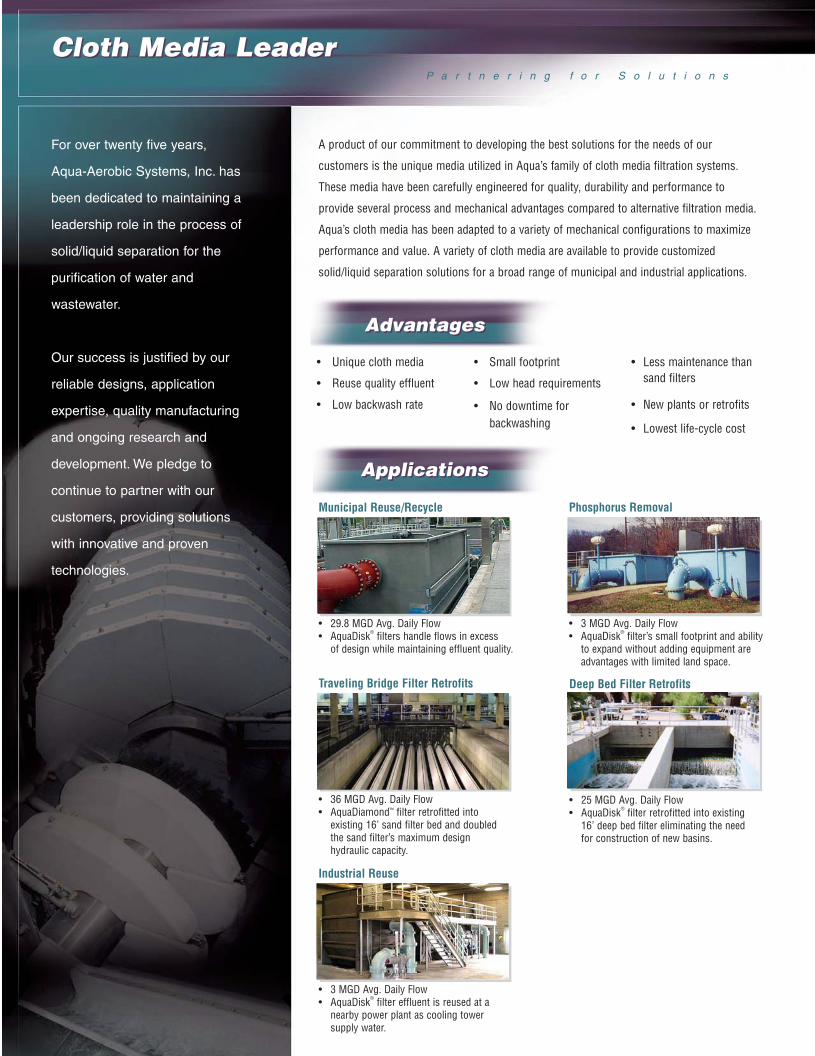
For over twenty five years,
Aqua-Aerobic Systems, Inc. has
been dedicated to maintaining a
leadership role in the process of
solid/liquid separation for the
purification of water and
wastewater.
Our success is justified by our
reliable designs, application
expertise, quality manufacturing
and ongoing research and
development. We pledge to
continue to partner with our
customers, providing solutions
with innovative and proven
technologies.
P a r t n e r i n g f o r S o l u t i o n s
A product of our commitment to developing the best solutions for the needs of our
customers is the unique media utilized in Aqua’s family of cloth media filtration systems.
These media have been carefully engineered for quality, durability and performance to
provide several process and mechanical advantages compared to alternative filtration media.
Aqua’s cloth media has been adapted to a variety of mechanical configurations to maximize
performance and value. A variety of cloth media are available to provide customized
solid/liquid separation solutions for a broad range of municipal and industrial applications.
Advantages
Cloth Media Leader
Municipal Reuse/Recycle
• 29.8 MGD Avg. Daily Flow• AquaDisk® filters handle flows in excess
of design while maintaining effluent quality.
Deep Bed Filter Retrofits
• 25 MGD Avg. Daily Flow• AquaDisk® filter retrofitted into existing
16’ deep bed filter eliminating the need for construction of new basins.
Phosphorus Removal
• 3 MGD Avg. Daily Flow• AquaDisk® filter’s small footprint and ability
to expand without adding equipment are advantages with limited land space.
Traveling Bridge Filter Retrofits
• 36 MGD Avg. Daily Flow• AquaDiamond™ filter retrofitted into
existing 16’ sand filter bed and doubled the sand filter’s maximum design hydraulic capacity.
Industrial Reuse
• 3 MGD Avg. Daily Flow• AquaDisk® filter effluent is reused at a
nearby power plant as cooling tower supply water.
Applications
Cloth Media Leader
• Unique cloth media
• Reuse quality effluent
• Low backwash rate
• Small footprint
• Low head requirements
• No downtime for backwashing
• Less maintenance than sand filters
• New plants or retrofits
• Lowest life-cycle cost
Applications
Advantages
5679-ClothMedia.qxd 7/26/05 10:51 AM Page 3

Aqua’s proactive experience with research and development results in cloth media filtration
products that virtually meet any tertiary requirements. We are dedicated to obtaining
extensive knowledge on media, textile construction, durability, and impact on performance
by working directly with textile manufacturers and independent testing laboratories. Our
research efforts include continued development through partnerships with universities who
test our products for durability and performance. Our commitment to research and
development and piloting programs provides our customers with more media and
configuration options to suite individual application needs.
Evolution of Aqua’s Cloth Media Technology
1991 1992 1998 2001 2002 2003 2004 2005
C o n t i n u o u s T e s t i n g
Introduction to NeedlefeltCloth Media
First AquaDisk®
Filter Installation
Launched AquaMiniDisk™ Filter
Introduction toPile Cloth Media
First Pile ClothMedia Installation
& LaunchedAquaDrum™ Filter
Launched Aqua Diamond®
Filter
First AquaDiamond®
Filter Installation
PrototypingNew Cloth
Media
Pile Cloth Operation
Normal Operation
Active Filter Depth
When wetted and mounted in a verticalconfiguration, densley packed fibersoverlay one another, creating depth forthe efficient removal and storage ofsolids.
Filtrate Feed Water
Solids retained on and within the clothform an additional filter layer whichprovides enhanced filtration.
Backwash
Filtrate
During backwash, filtrate is drawn backthrough the cloth. The suction causesthe pile fibers to revert back to anatural state.
Microscopic view ofneedlefelt media.
Natural State
OngoingCommitment
Unique ClothMedia
Microscopic view of pile media.
Aqua’s cloth media filtration systems utilize
state-of-the-art cloth media. Only Aqua offers a
variety of “true” cloth media, each with
distinctive characteristics which can be custom-
applied to your specific application. The depth of
the media is inherent to the cloth’s ability to
consistently store and remove solid particles,
resulting in optimal effluent quality.
Unique ClothMedia
OngoingCommitment
Cloth Media The Key ComponentCloth Media The Key Component
BackwashWater
3-5 mm
Normal Operation
5679-ClothMedia.qxd 7/26/05 10:51 AM Page 4
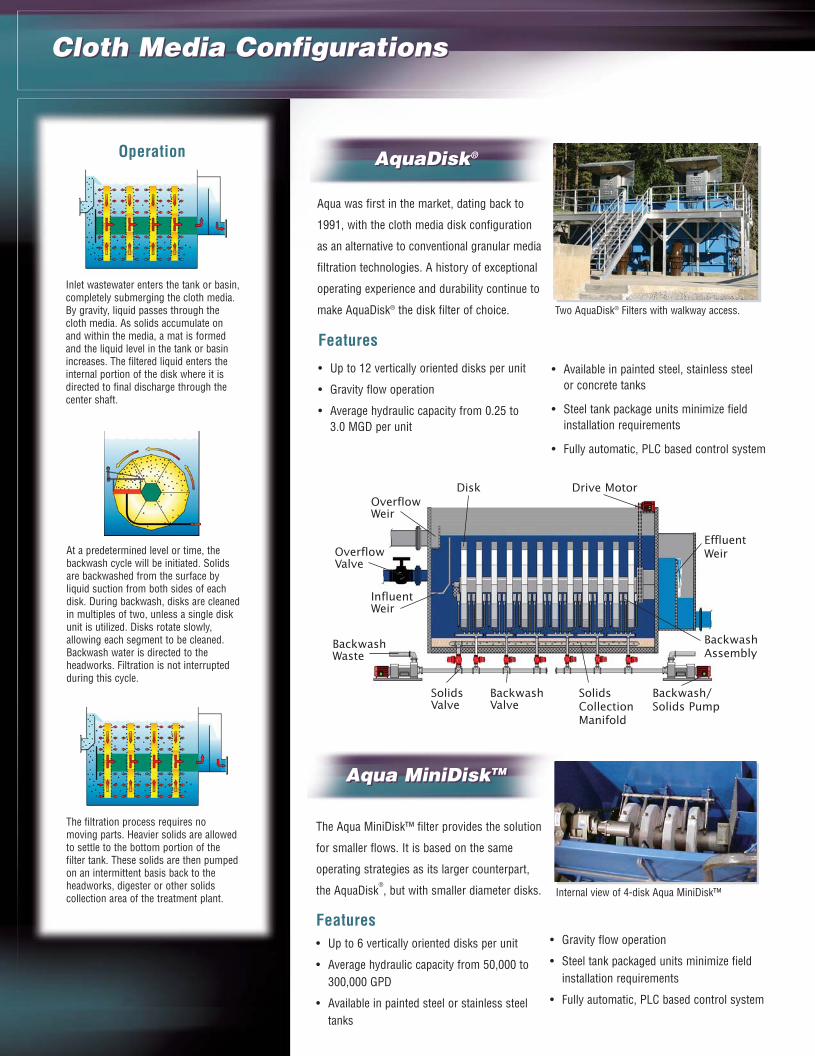
Inlet wastewater enters the tank or basin,completely submerging the cloth media.By gravity, liquid passes through thecloth media. As solids accumulate onand within the media, a mat is formedand the liquid level in the tank or basinincreases. The filtered liquid enters theinternal portion of the disk where it isdirected to final discharge through thecenter shaft.
At a predetermined level or time, thebackwash cycle will be initiated. Solidsare backwashed from the surface byliquid suction from both sides of eachdisk. During backwash, disks are cleanedin multiples of two, unless a single diskunit is utilized. Disks rotate slowly,allowing each segment to be cleaned.Backwash water is directed to theheadworks. Filtration is not interruptedduring this cycle.
Operation
The filtration process requires nomoving parts. Heavier solids are allowedto settle to the bottom portion of thefilter tank. These solids are then pumpedon an intermittent basis back to theheadworks, digester or other solidscollection area of the treatment plant.
Two AquaDisk® Filters with walkway access.
The Aqua MiniDisk™ filter provides the solution
for smaller flows. It is based on the same
operating strategies as its larger counterpart,
the AquaDisk®, but with smaller diameter disks. Internal view of 4-disk Aqua MiniDisk™
Cloth Media Configurations
AquaDisk®
Features• Up to 6 vertically oriented disks per unit
• Average hydraulic capacity from 50,000 to 300,000 GPD
• Available in painted steel or stainless steel tanks
• Gravity flow operation
• Steel tank packaged units minimize field installation requirements
• Fully automatic, PLC based control system
Cloth Media Configurations
AquaDisk®
Aqua MiniDiskTMAqua MiniDiskTM
Aqua was first in the market, dating back to
1991, with the cloth media disk configuration
as an alternative to conventional granular media
filtration technologies. A history of exceptional
operating experience and durability continue to
make AquaDisk® the disk filter of choice.
Features
• Up to 12 vertically oriented disks per unit
• Gravity flow operation
• Average hydraulic capacity from 0.25 to 3.0 MGD per unit
• Available in painted steel, stainless steel or concrete tanks
• Steel tank package units minimize fieldinstallation requirements
• Fully automatic, PLC based control system
DiskOverflowWeir
BackwashWaste
SolidsValve
BackwashValve
BackwashAssembly
EffluentWeir
Drive Motor
SolidsCollectionManifold
Backwash/Solids Pump
InfluentWeir
OverflowValve
5679-ClothMedia.qxd 7/26/05 10:41 AM Page 5
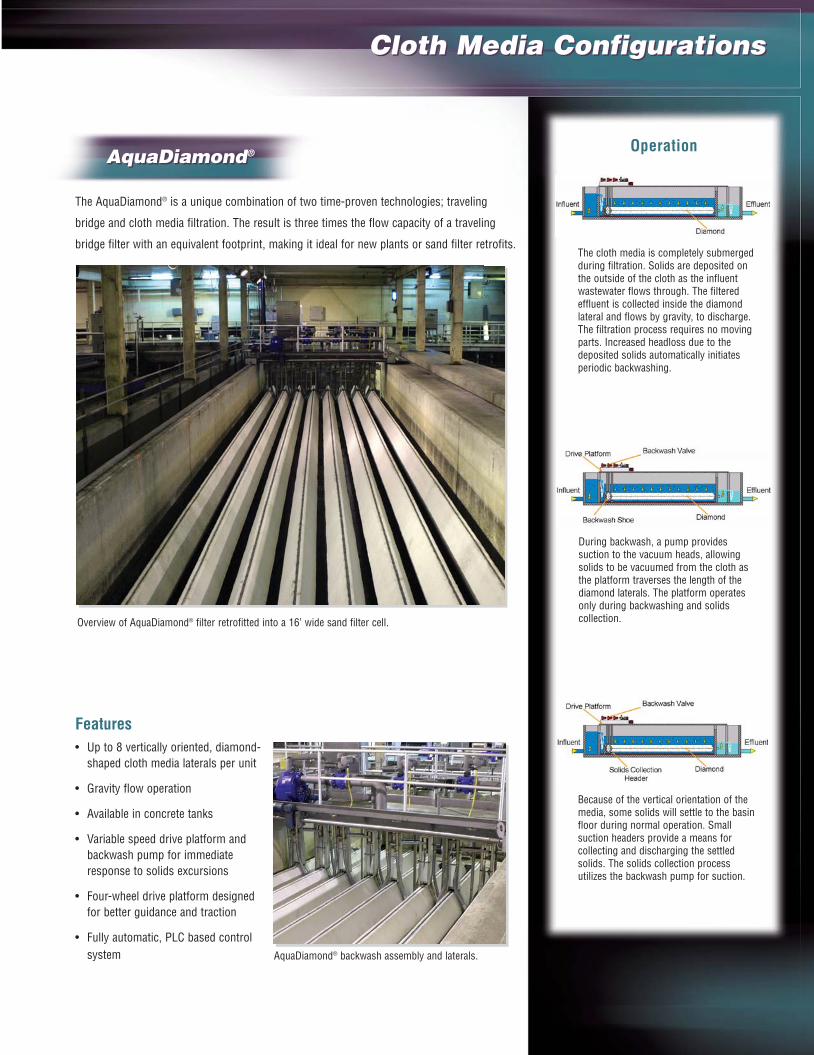
Cloth Media Configurations
During backwash, a pump providessuction to the vacuum heads, allowingsolids to be vacuumed from the cloth asthe platform traverses the length of thediamond laterals. The platform operatesonly during backwashing and solidscollection.
Because of the vertical orientation of themedia, some solids will settle to the basinfloor during normal operation. Smallsuction headers provide a means forcollecting and discharging the settledsolids. The solids collection processutilizes the backwash pump for suction.
The cloth media is completely submergedduring filtration. Solids are deposited onthe outside of the cloth as the influentwastewater flows through. The filteredeffluent is collected inside the diamondlateral and flows by gravity, to discharge.The filtration process requires no movingparts. Increased headloss due to thedeposited solids automatically initiatesperiodic backwashing.
The AquaDiamond® is a unique combination of two time-proven technologies; traveling
bridge and cloth media filtration. The result is three times the flow capacity of a traveling
bridge filter with an equivalent footprint, making it ideal for new plants or sand filter retrofits.
Overview of AquaDiamond® filter retrofitted into a 16’ wide sand filter cell.
AquaDiamond®
AquaDiamond® backwash assembly and laterals.
Cloth Media Configurations
AquaDiamond® Operation
Features• Up to 8 vertically oriented, diamond-
shaped cloth media laterals per unit
• Gravity flow operation
• Available in concrete tanks
• Variable speed drive platform and backwash pump for immediate response to solids excursions
• Four-wheel drive platform designed for better guidance and traction
• Fully automatic, PLC based control system
5679-ClothMedia.qxd 7/26/05 10:41 AM Page 6
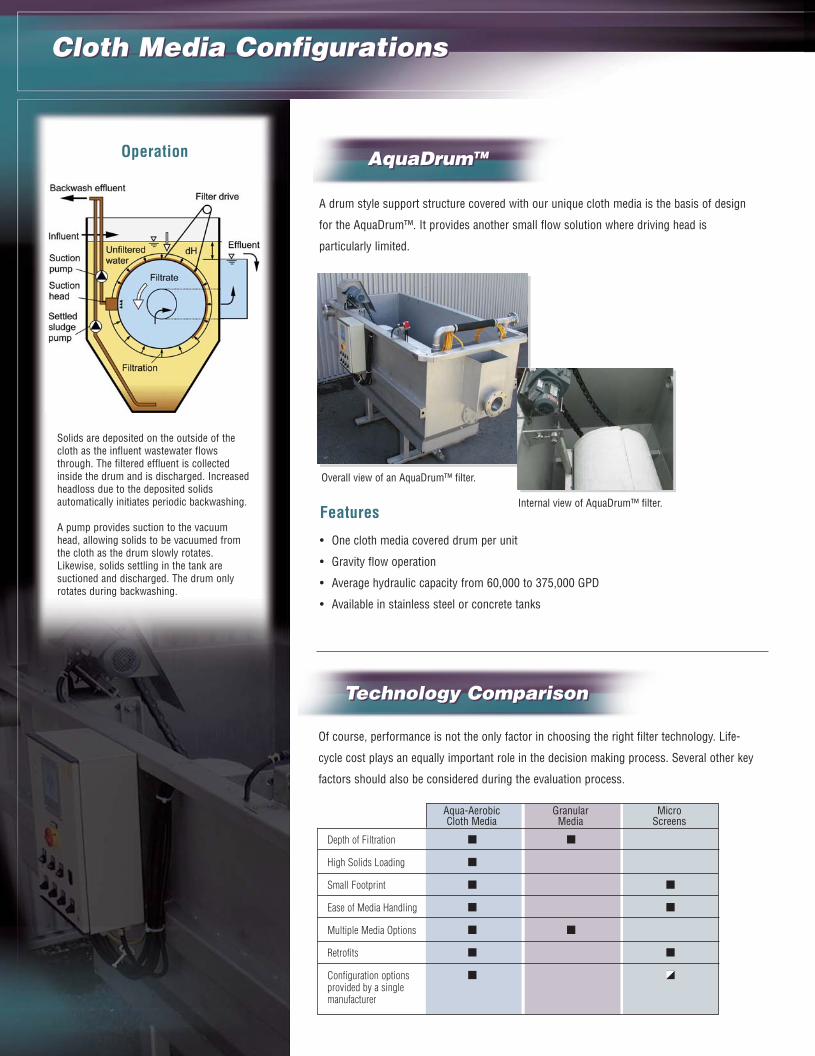
Cloth Media Configurations
Solids are deposited on the outside of thecloth as the influent wastewater flowsthrough. The filtered effluent is collectedinside the drum and is discharged. Increasedheadloss due to the deposited solidsautomatically initiates periodic backwashing.
A pump provides suction to the vacuumhead, allowing solids to be vacuumed fromthe cloth as the drum slowly rotates.Likewise, solids settling in the tank aresuctioned and discharged. The drum onlyrotates during backwashing.
Operation
A drum style support structure covered with our unique cloth media is the basis of design
for the AquaDrum™. It provides another small flow solution where driving head is
particularly limited.
AquaDrumTM
Internal view of AquaDrum™ filter.
Overall view of an AquaDrum™ filter.
Features
• One cloth media covered drum per unit
• Gravity flow operation
• Average hydraulic capacity from 60,000 to 375,000 GPD
• Available in stainless steel or concrete tanks
Of course, performance is not the only factor in choosing the right filter technology. Life-
cycle cost plays an equally important role in the decision making process. Several other key
factors should also be considered during the evaluation process.
Cloth Media Configurations
AquaDrumTM
Technology ComparisonTechnology Comparison
Depth of Filtration ■ ■
High Solids Loading ■
Small Footprint ■ ■
Ease of Media Handling ■ ■
Multiple Media Options ■ ■
Retrofits ■ ■
Configuration options ■ ■provided by a single manufacturer
Aqua-Aerobic Granular Micro Cloth Media Media Screens
5679-ClothMedia.qxd 7/26/05 10:42 AM Page 7
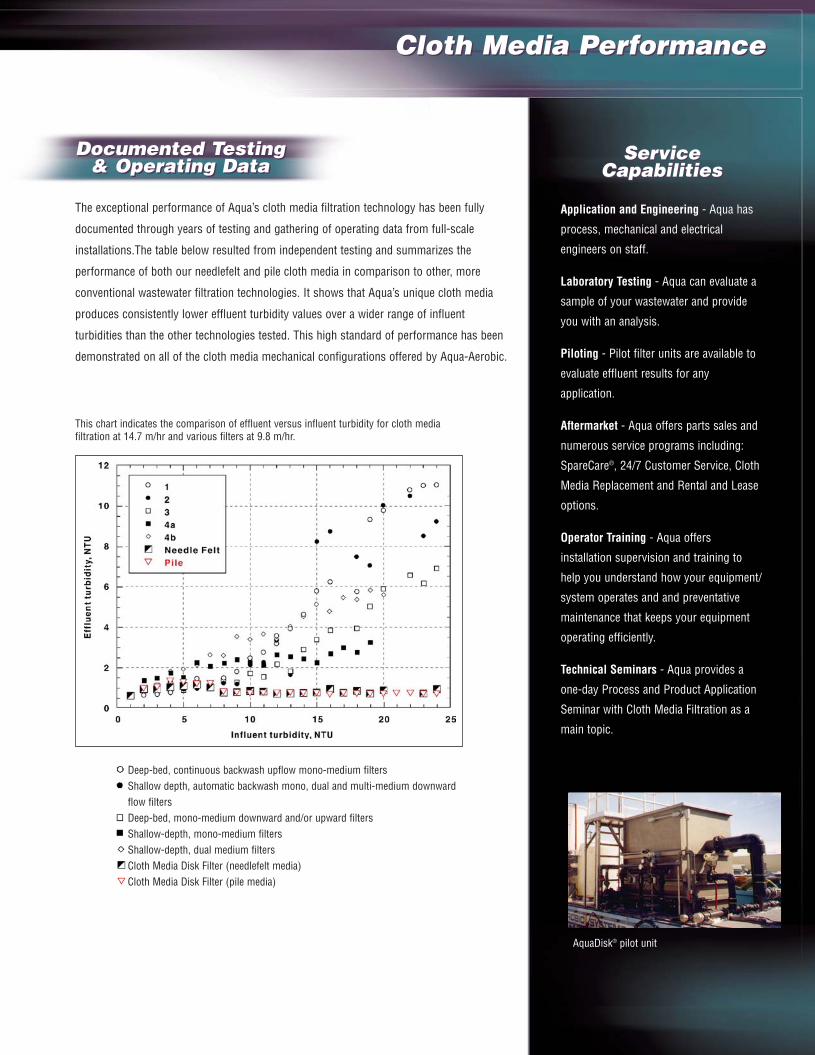
Cloth Media Performance
The exceptional performance of Aqua’s cloth media filtration technology has been fully
documented through years of testing and gathering of operating data from full-scale
installations.The table below resulted from independent testing and summarizes the
performance of both our needlefelt and pile cloth media in comparison to other, more
conventional wastewater filtration technologies. It shows that Aqua’s unique cloth media
produces consistently lower effluent turbidity values over a wider range of influent
turbidities than the other technologies tested. This high standard of performance has been
demonstrated on all of the cloth media mechanical configurations offered by Aqua-Aerobic.
Deep-bed, continuous backwash upflow mono-medium filtersShallow depth, automatic backwash mono, dual and multi-medium downwardflow filtersDeep-bed, mono-medium downward and/or upward filtersShallow-depth, mono-medium filtersShallow-depth, dual medium filtersCloth Media Disk Filter (needlefelt media)Cloth Media Disk Filter (pile media)
This chart indicates the comparison of effluent versus influent turbidity for cloth mediafiltration at 14.7 m/hr and various filters at 9.8 m/hr.
AquaDisk® pilot unit
Cloth Media Performance
ServiceCapabilities
Documented Testing & Operating Data
ServiceCapabilities
Application and Engineering - Aqua has
process, mechanical and electrical
engineers on staff.
Laboratory Testing - Aqua can evaluate a
sample of your wastewater and provide
you with an analysis.
Piloting - Pilot filter units are available to
evaluate effluent results for any
application.
Aftermarket - Aqua offers parts sales and
numerous service programs including:
SpareCare®, 24/7 Customer Service, Cloth
Media Replacement and Rental and Lease
options.
Operator Training - Aqua offers
installation supervision and training to
help you understand how your equipment/
system operates and and preventative
maintenance that keeps your equipment
operating efficiently.
Technical Seminars - Aqua provides a
one-day Process and Product Application
Seminar with Cloth Media Filtration as a
main topic.
Documented Testing & Operating Data
5679-ClothMedia.qxd 7/26/05 10:42 AM Page 8
Aqua-Aerobic Systems, Inc.6306 N. Alpine Rd. • P.O. Box 2026 • Rockford, IL 61130
Phone: 815/654-2501 • Fax: 815/654-2508 • Toll Free: 877/214-9625Email: [email protected] • www.aqua-aerobic.com
The information contained herein relative to data, dimensions and recommendations as to size, power and assembly are for purpose of estimation only. These values should not be assumed to be universally applicable
to specific design problems. Particular designs, installations and plants may call for specific requirements. Consult Aqua-Aerobic Systems, Inc. for exact recommendations or specific needs.
Patents Apply. Patents Pending.
Bulletin #600G 07/05©Copyright 2005
Contact Your Local Representative:
Aqua-Jet®
Surface Aerators
Aqua-Jet II®
Contained Flow Aerators
AquaDDM®
Direct Drive Mixer-Blenders
Aqua MixAir®
Aeration Systems
Aqua EnduraDisc®
Fine Bubble Diffusers
Aqua EnduraTube®
Fine Bubble Diffusers
Aqua CB-24®
Coarse Bubble Diffusers
AquaSBR®
Sequencing Batch Reactors
AquaExcel™Batch Reactors with AquaEnsure™
AquaEnsure™
Maintenance-Free Decanter
Aqua MSBR®
Modified Sequencing Batch Reactor
AquaPASS™
Phased Activated Sludge Systems
AquaMB Process™
Multiple Barrier Membrane System
AquaDisk®
Cloth Media Filters
Aqua MiniDisk™
Cloth Media Filters
AquaDiamond®
Cloth Media Filters
AquaDrum™
Cloth Media Filters
AquaABF®
Automatic Backwash Filters
ThermoFlo®
Surface Spray Coolers
IntelliPRO™
Process Management System
5679-ClothMedia.qxd 7/26/05 10:39 AM Page 1
WASTEWATER DISINFECTION

1
Trojan Technologies is an ISO 9001: 2000 registered company that has set the standard for proven UV technology and ongoing innovation for more than 25 years. With unmatched scientific and technical expertise, and a global network of water treatment specialists, representatives and technicians, Trojan is trusted more than any other firm as the best choice for municipal UV solutions. Trojan has the largest UV installation base – over 4,000 municipal installations worldwide – and almost one in five North American wastewater
treatment plants rely on our proven, chemical-free disinfection solutions.
The TrojanUV3000Plus™ is one of the reasons why. This highly flexible system has demonstrated its effective, reliable performance around the world in over 400 installations. It is well suited to wastewater disinfection applications with a wide range of flow rates, including challenging effluent such as combined sewer overflows, primary and tertiary wastewater reclamation and reuse.
Following a review with Plant Operators and Engineers, the proven infrastructure of the TrojanUV3000Plus™ has been refined to make it even more operator-friendly. The result is more dependable performance, simplified maintenance, and maximized UV lamp output at end-of-lamp life. It also incorporates innovative features to reduce O&M costs, including variable output electronic ballasts and Trojan’s revolutionary ActiClean™ system – the industry’s only chemical/mechanical sleeve cleaning system.
The Reference Standard in UV Proven, chemical-free disinfection from the industry leader
Short trim this panel
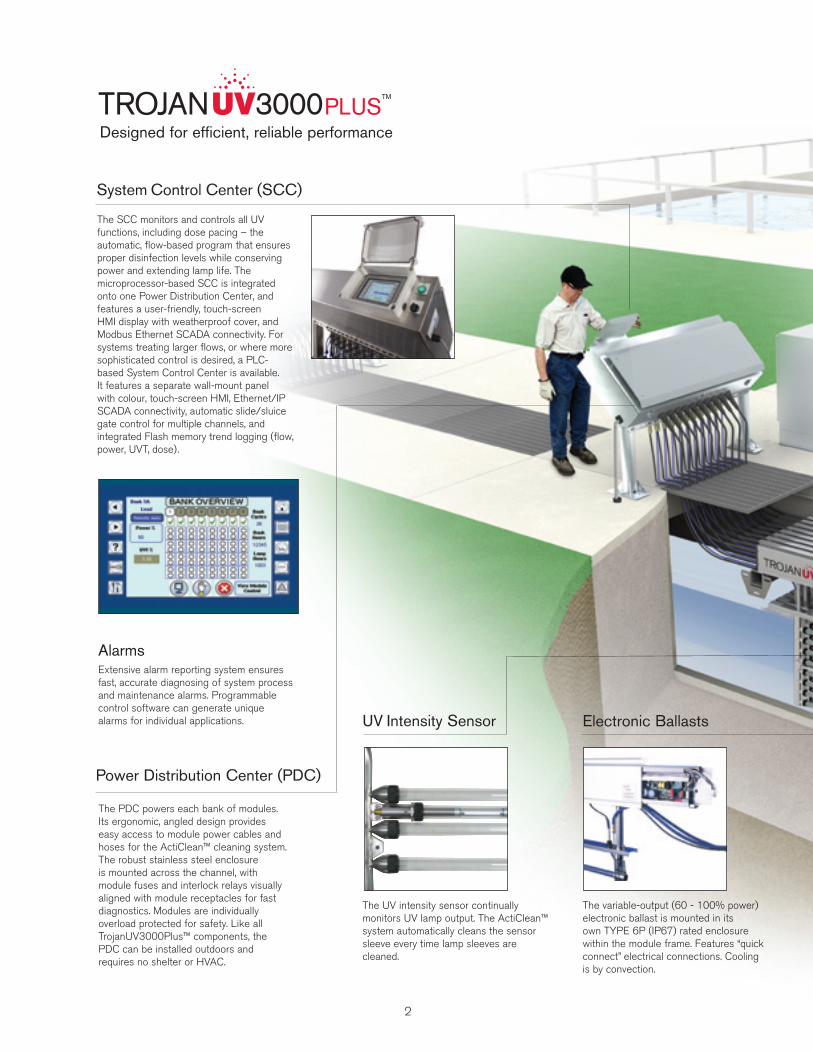
The PDC powers each bank of modules. Its ergonomic, angled design provides easy access to module power cables and hoses for the ActiClean™ cleaning system. The robust stainless steel enclosure is mounted across the channel, with module fuses and interlock relays visually aligned with module receptacles for fast diagnostics. Modules are individually overload protected for safety. Like all TrojanUV3000Plus™ components, the PDC can be installed outdoors and requires no shelter or HVAC.
Designed for efficient, reliable performance
2
Power Distribution Center (PDC)
UV Intensity Sensor
The UV intensity sensor continually monitors UV lamp output. The ActiClean™ system automatically cleans the sensor sleeve every time lamp sleeves are cleaned.
The SCC monitors and controls all UV functions, including dose pacing – the automatic, flow-based program that ensures proper disinfection levels while conserving power and extending lamp life. The microprocessor-based SCC is integrated onto one Power Distribution Center, and features a user-friendly, touch-screen HMI display with weatherproof cover, and Modbus Ethernet SCADA connectivity. For systems treating larger flows, or where more sophisticated control is desired, a PLC-based System Control Center is available. It features a separate wall-mount panel with colour, touch-screen HMI, Ethernet/IP SCADA connectivity, automatic slide/sluice gate control for multiple channels, and integrated Flash memory trend logging (flow, power, UVT, dose).
Electronic Ballasts
The variable-output (60 - 100% power) electronic ballast is mounted in its own TYPE 6P (IP67) rated enclosure within the module frame. Features “quick connect” electrical connections. Cooling is by convection.
AlarmsExtensive alarm reporting system ensures fast, accurate diagnosing of system process and maintenance alarms. Programmable control software can generate unique alarms for individual applications.
System Control Center (SCC)
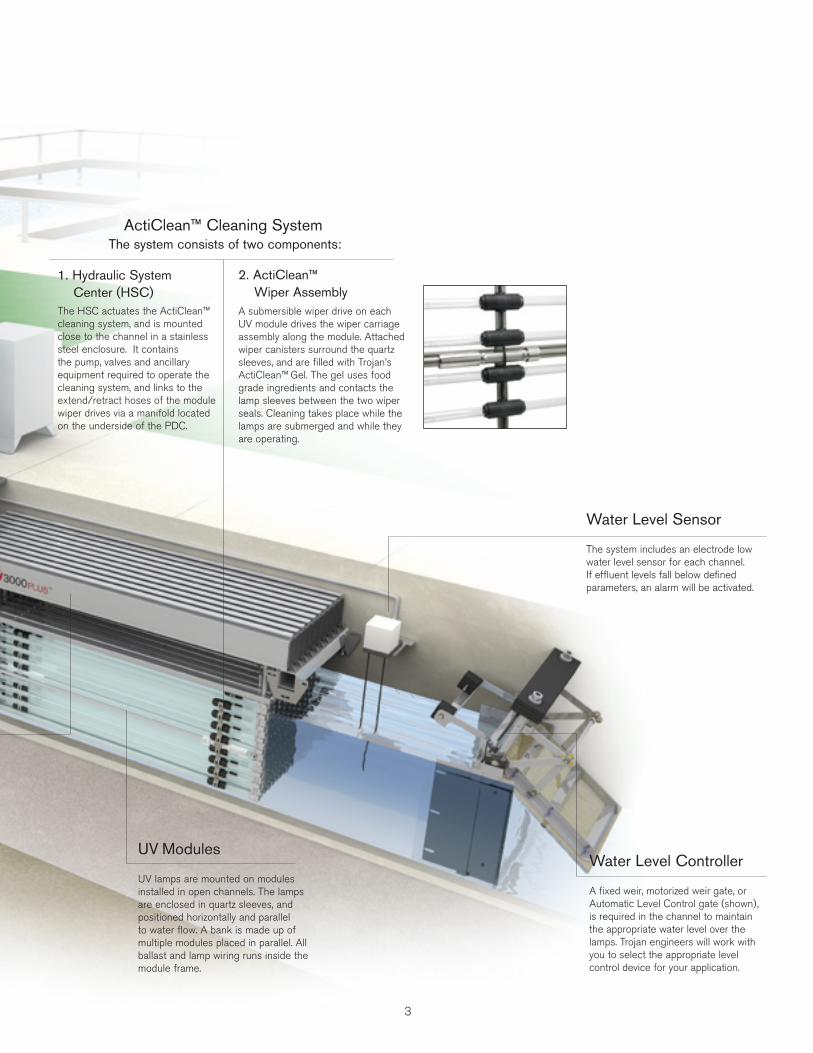
Water Level Controller
A fixed weir, motorized weir gate, or Automatic Level Control gate (shown), is required in the channel to maintain the appropriate water level over the lamps. Trojan engineers will work with you to select the appropriate level control device for your application.
Water Level Sensor
The system includes an electrode low water level sensor for each channel. If effluent levels fall below defined parameters, an alarm will be activated.
UV Modules
UV lamps are mounted on modules installed in open channels. The lamps are enclosed in quartz sleeves, and positioned horizontally and parallel to water flow. A bank is made up of multiple modules placed in parallel. All ballast and lamp wiring runs inside the module frame.
3
2. ActiClean™ Wiper Assembly A submersible wiper drive on each UV module drives the wiper carriage assembly along the module. Attached wiper canisters surround the quartz sleeves, and are filled with Trojan’s ActiClean™ Gel. The gel uses food grade ingredients and contacts the lamp sleeves between the two wiper seals. Cleaning takes place while the lamps are submerged and while they are operating.
1. Hydraulic System Center (HSC)The HSC actuates the ActiClean™ cleaning system, and is mounted close to the channel in a stainless steel enclosure. It contains the pump, valves and ancillary equipment required to operate the cleaning system, and links to the extend/retract hoses of the module wiper drives via a manifold located on the underside of the PDC.
ActiClean™ Cleaning SystemThe system consists of two components:
Key Benefits TrojanUV3000Plus™
Increased operator, community and environmental safety. The TrojanUV3000Plus™ uses environmentally-friendly ultraviolet light – the safest
alternative for wastewater disinfection. No disinfection by-products are created, and no
chemicals must be transported, stored or handled.
Well suited to changing regulations. Trojan UV systems do not have any negative
impact on receiving waters and do not produce disinfection by-products, making them a
strategic, long-term choice as regulations become increasingly stringent.
Most efficient UV system available versus competitive low-pressure, high-output
(LPHO) or amalgam lamp-based systems.
Reduces operating costs by as much as 30% per year. Long-lasting
amalgam lamps and variable-output ballasts optimize UV output to meet wastewater
conditions and maximize system efficiency versus competitive UV systems.
Proven disinfection based on actual dose delivery testing (bioassay validation), and
over 400 TrojanUV3000Plus™ installations worldwide. Real-world, field performance data
eliminates sizing assumptions resulting from theoretical dose calculations.
Dual-action sleeve cleaning system improves performance and reduces labor costs. Automatic ActiClean™ chemical/mechanical cleaning system
maintains sleeve transmittance of at least 95%, and works online – eliminating the need to
remove modules from the channel.
Reduced installation costs. The compact TrojanUV3000Plus™ can be retrofitted
into existing chlorine contact tanks, and comes pre-tested, pre-assembled and pre-wired to
minimize installation costs.
Outdoor installation flexibility. The entire TrojanUV3000Plus™ system can be
installed outdoors, eliminating the need and costs of a building, shelter, and HVAC for ballast
cooling.
Guaranteed performance and comprehensive warranty. Trojan systems
include a Lifetime Performance Guarantee, the best lamp warranty in the industry, and use
lamps from multiple approved suppliers. Ask for details.
4
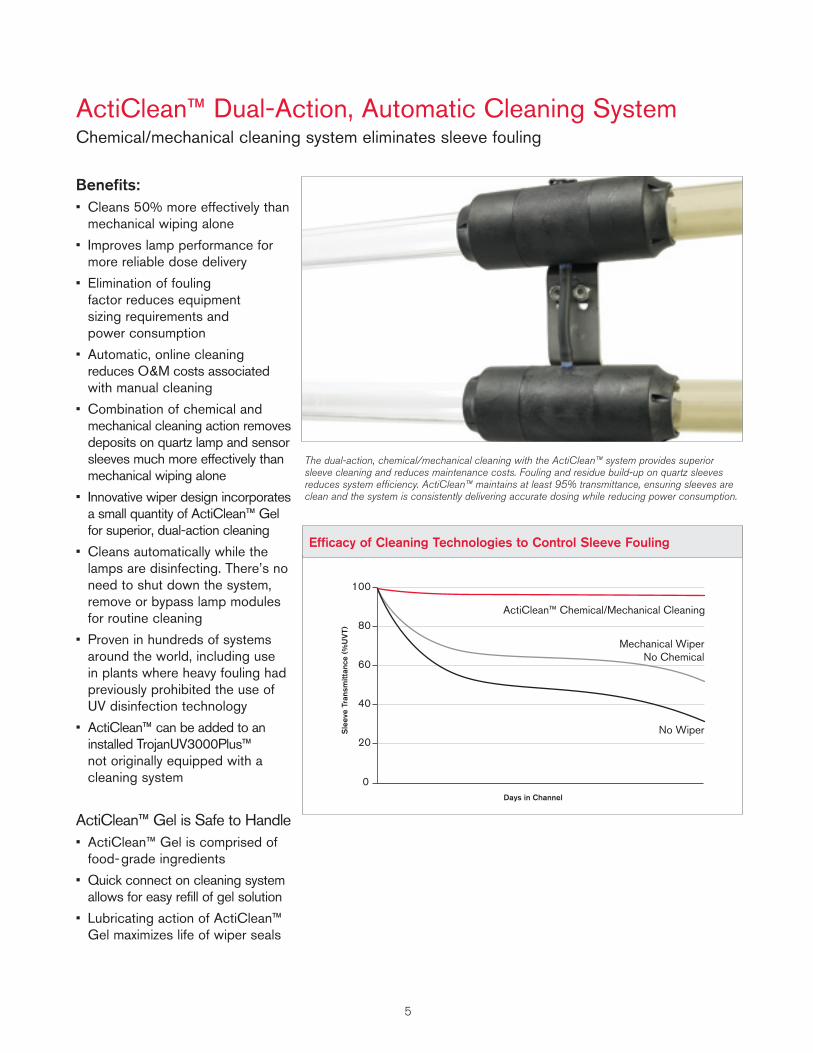
Benefits:• Cleans 50% more effectively than
mechanical wiping alone
• Improves lamp performance for more reliable dose delivery
• Elimination of fouling factor reduces equipment sizing requirements and power consumption
• Automatic, online cleaning reduces O&M costs associated with manual cleaning
• Combination of chemical and mechanical cleaning action removes deposits on quartz lamp and sensor sleeves much more effectively than mechanical wiping alone
• Innovative wiper design incorporates a small quantity of ActiClean™ Gel for superior, dual-action cleaning
• Cleans automatically while the lamps are disinfecting. There’s no need to shut down the system, remove or bypass lamp modules for routine cleaning
• Proven in hundreds of systems around the world, including use in plants where heavy fouling had previously prohibited the use of UV disinfection technology
• ActiClean™ can be added to an installed TrojanUV3000Plus™ not originally equipped with a cleaning system
ActiClean™ Gel is Safe to Handle• ActiClean™ Gel is comprised of food-grade ingredients
• Quick connect on cleaning system allows for easy refill of gel solution
• Lubricating action of ActiClean™ Gel maximizes life of wiper seals
ActiClean™ Dual-Action, Automatic Cleaning SystemChemical/mechanical cleaning system eliminates sleeve fouling
The dual-action, chemical/mechanical cleaning with the ActiClean™ system provides superior sleeve cleaning and reduces maintenance costs. Fouling and residue build-up on quartz sleeves reduces system efficiency. ActiClean™ maintains at least 95% transmittance, ensuring sleeves are clean and the system is consistently delivering accurate dosing while reducing power consumption.
5
Efficacy of Cleaning Technologies to Control Sleeve Fouling
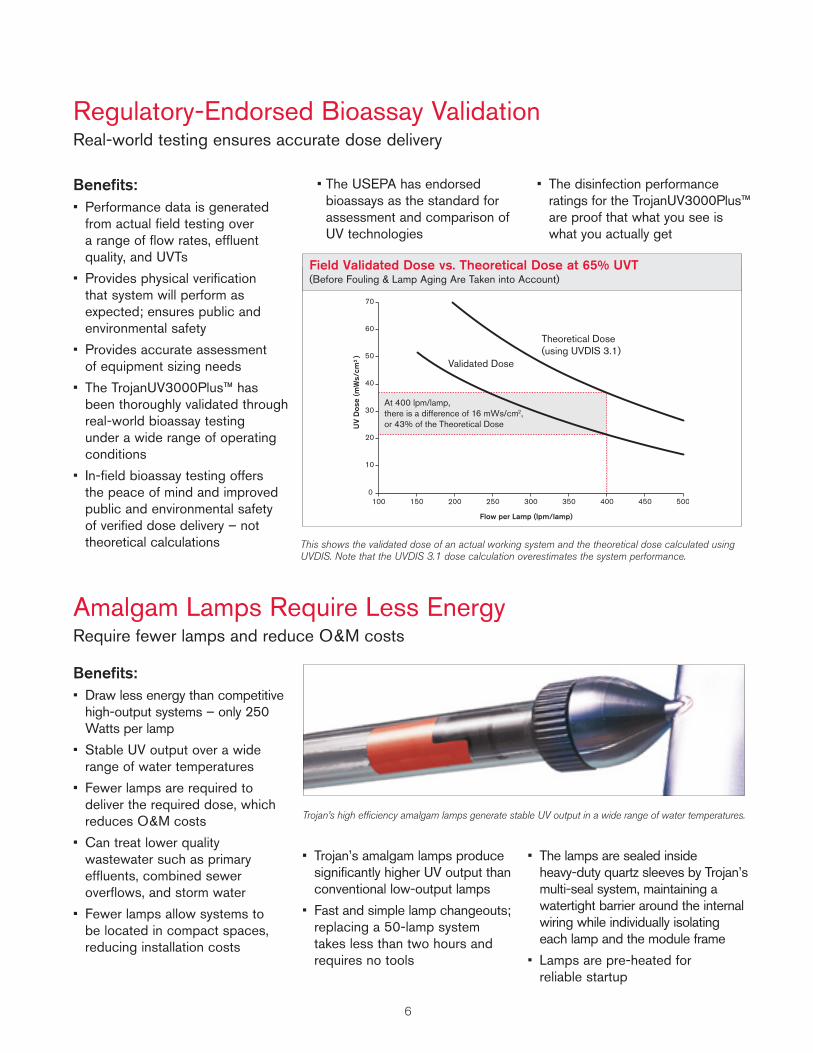
Benefits:• Performance data is generated
from actual field testing over a range of flow rates, effluent quality, and UVTs
• Provides physical verification that system will perform as expected; ensures public and environmental safety
• Provides accurate assessment of equipment sizing needs
• The TrojanUV3000Plus™ has been thoroughly validated through real-world bioassay testing under a wide range of operating conditions
• In-field bioassay testing offers the peace of mind and improved public and environmental safety of verified dose delivery – not theoretical calculations
• The USEPA has endorsed bioassays as the standard for assessment and comparison of UV technologies
• The disinfection performance ratings for the TrojanUV3000Plus™ are proof that what you see is what you actually get
Regulatory-Endorsed Bioassay ValidationReal-world testing ensures accurate dose delivery
Amalgam Lamps Require Less EnergyRequire fewer lamps and reduce O&M costs
Benefits:• Draw less energy than competitive
high-output systems – only 250 Watts per lamp
• Stable UV output over a wide range of water temperatures
• Fewer lamps are required to deliver the required dose, which reduces O&M costs
• Can treat lower quality wastewater such as primary effluents, combined sewer overflows, and storm water
• Fewer lamps allow systems to be located in compact spaces, reducing installation costs
Trojan’s high efficiency amalgam lamps generate stable UV output in a wide range of water temperatures.
6
Field Validated Dose vs. Theoretical Dose at 65% UVT(Before Fouling & Lamp Aging Are Taken into Account)
• Trojan’s amalgam lamps produce significantly higher UV output than conventional low-output lamps
• Fast and simple lamp changeouts; replacing a 50-lamp system takes less than two hours and requires no tools
• The lamps are sealed inside heavy-duty quartz sleeves by Trojan’s multi-seal system, maintaining a watertight barrier around the internal wiring while individually isolating each lamp and the module frame
• Lamps are pre-heated for reliable startup
This shows the validated dose of an actual working system and the theoretical dose calculated using UVDIS. Note that the UVDIS 3.1 dose calculation overestimates the system performance.
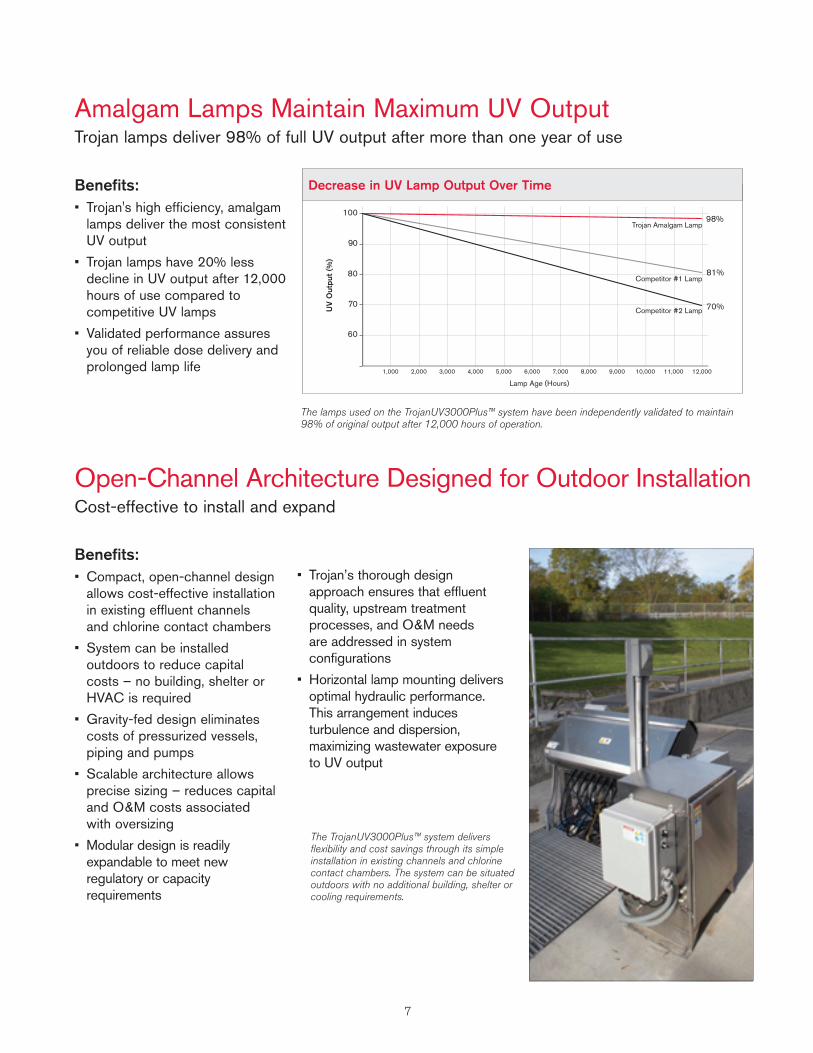
Benefits:• Trojan's high efficiency, amalgam
lamps deliver the most consistent UV output
• Trojan lamps have 20% less decline in UV output after 12,000 hours of use compared to competitive UV lamps
• Validated performance assures you of reliable dose delivery and prolonged lamp life
Amalgam Lamps Maintain Maximum UV OutputTrojan lamps deliver 98% of full UV output after more than one year of use
The lamps used on the TrojanUV3000Plus™ system have been independently validated to maintain 98% of original output after 12,000 hours of operation.
Open-Channel Architecture Designed for Outdoor Installation Cost-effective to install and expand
7
1,000 2,000 3,000 4,000 5,000 6,000 7,000 8,000 9,000 10,000 11,000 12,000
Decrease in UV Lamp Output Over Time
UV
Out
put
(%)
The TrojanUV3000Plus™ system delivers flexibility and cost savings through its simple installation in existing channels and chlorine contact chambers. The system can be situated outdoors with no additional building, shelter or cooling requirements.
Benefits:• Compact, open-channel design
allows cost-effective installation in existing effluent channels and chlorine contact chambers
• System can be installed outdoors to reduce capital costs – no building, shelter or HVAC is required
• Gravity-fed design eliminates costs of pressurized vessels, piping and pumps
• Scalable architecture allows precise sizing – reduces capital and O&M costs associated with oversizing
• Modular design is readily expandable to meet new regulatory or capacity requirements
• Trojan’s thorough design approach ensures that effluent quality, upstream treatment processes, and O&M needs are addressed in system configurations
• Horizontal lamp mounting delivers optimal hydraulic performance. This arrangement induces turbulence and dispersion, maximizing wastewater exposure to UV output
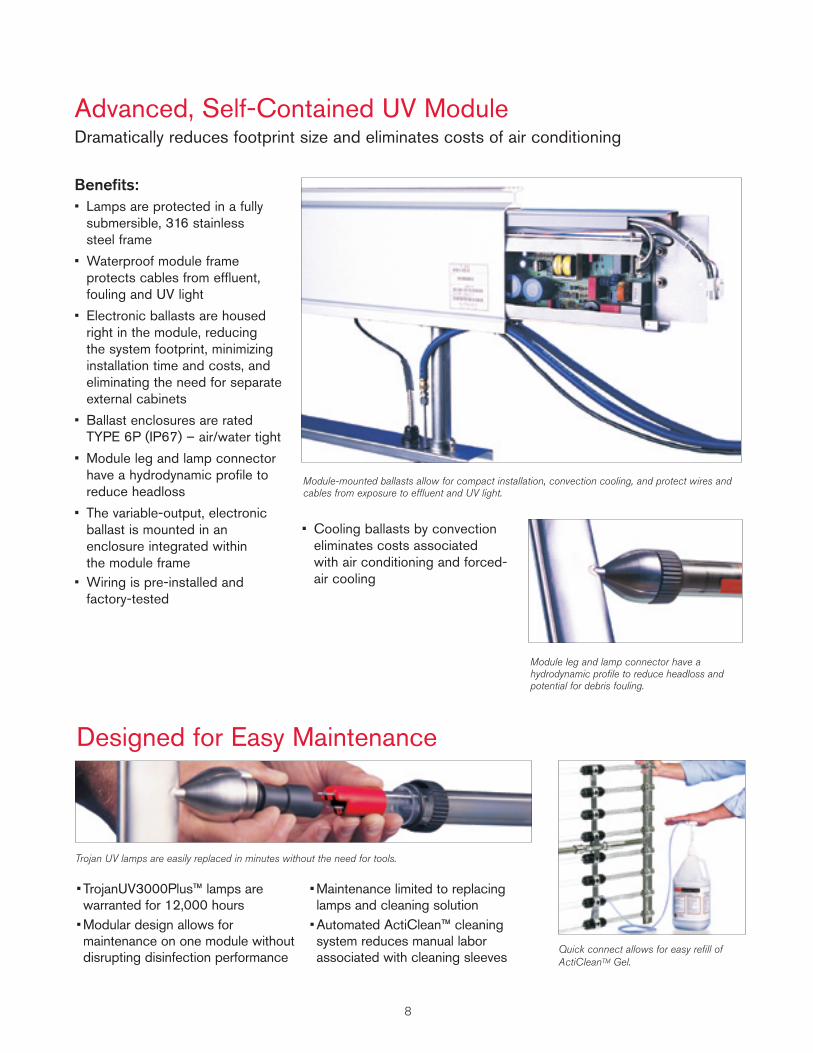
Benefits:• Lamps are protected in a fully
submersible, 316 stainless steel frame
• Waterproof module frame protects cables from effluent, fouling and UV light
• Electronic ballasts are housed right in the module, reducing the system footprint, minimizing installation time and costs, and eliminating the need for separate external cabinets
• Ballast enclosures are rated TYPE 6P (IP67) – air/water tight
• Module leg and lamp connector have a hydrodynamic profile to reduce headloss
• The variable-output, electronic ballast is mounted in an enclosure integrated within the module frame
• Wiring is pre-installed and factory-tested
• Cooling ballasts by convection eliminates costs associated with air conditioning and forced-air cooling
Advanced, Self-Contained UV ModuleDramatically reduces footprint size and eliminates costs of air conditioning
Module leg and lamp connector have a hydrodynamic profile to reduce headloss and potential for debris fouling.
8
Module-mounted ballasts allow for compact installation, convection cooling, and protect wires and cables from exposure to effluent and UV light.
• TrojanUV3000Plus™ lamps are warranted for 12,000 hours
• Modular design allows for maintenance on one module without disrupting disinfection performance
• Maintenance limited to replacing lamps and cleaning solution
• Automated ActiClean™ cleaning system reduces manual labor associated with cleaning sleeves
Trojan UV lamps are easily replaced in minutes without the need for tools.
Quick connect allows for easy refill of ActiCleanTM Gel.
Designed for Easy Maintenance
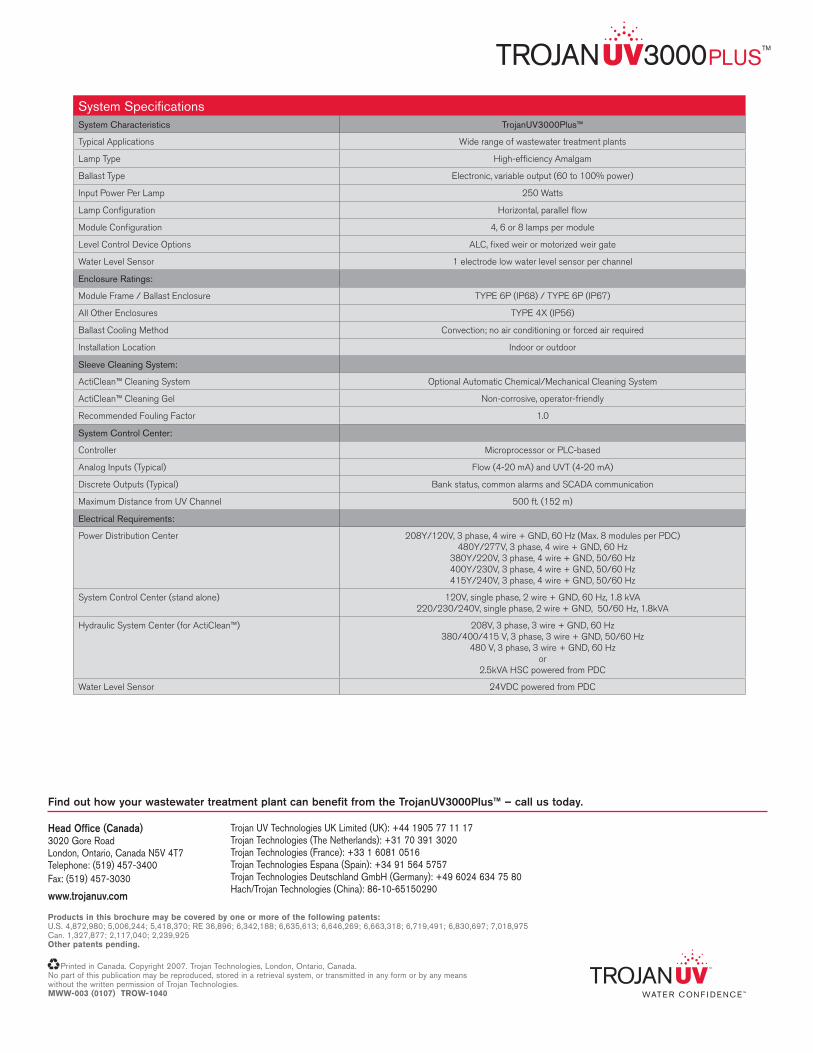
System SpecificationsSystem Characteristics TrojanUV3000Plus™
Typical Applications Wide range of wastewater treatment plants
Lamp Type High-efficiency Amalgam
Ballast Type Electronic, variable output (60 to 100% power)
Input Power Per Lamp 250 Watts
Lamp Configuration Horizontal, parallel flow
Module Configuration 4, 6 or 8 lamps per module
Level Control Device Options ALC, fixed weir or motorized weir gate
Water Level Sensor 1 electrode low water level sensor per channel
Enclosure Ratings:
Module Frame / Ballast Enclosure TYPE 6P (IP68) / TYPE 6P (IP67)
All Other Enclosures TYPE 4X (IP56)
Ballast Cooling Method Convection; no air conditioning or forced air required
Installation Location Indoor or outdoor
Sleeve Cleaning System:
ActiClean™ Cleaning System Optional Automatic Chemical/Mechanical Cleaning System
ActiClean™ Cleaning Gel Non-corrosive, operator-friendly
Recommended Fouling Factor 1.0
System Control Center:
Controller Microprocessor or PLC-based
Analog Inputs (Typical) Flow (4-20 mA) and UVT (4-20 mA)
Discrete Outputs (Typical) Bank status, common alarms and SCADA communication
Maximum Distance from UV Channel 500 ft. (152 m)
Electrical Requirements:
Power Distribution Center 208Y/120V, 3 phase, 4 wire + GND, 60 Hz (Max. 8 modules per PDC)480Y/277V, 3 phase, 4 wire + GND, 60 Hz
380Y/220V, 3 phase, 4 wire + GND, 50/60 Hz 400Y/230V, 3 phase, 4 wire + GND, 50/60 Hz 415Y/240V, 3 phase, 4 wire + GND, 50/60 Hz
System Control Center (stand alone) 120V, single phase, 2 wire + GND, 60 Hz, 1.8 kVA220/230/240V, single phase, 2 wire + GND, 50/60 Hz, 1.8kVA
Hydraulic System Center (for ActiClean™) 208V, 3 phase, 3 wire + GND, 60 Hz 380/400/415 V, 3 phase, 3 wire + GND, 50/60 Hz
480 V, 3 phase, 3 wire + GND, 60 Hz or
2.5kVA HSC powered from PDC
Water Level Sensor 24VDC powered from PDC
Find out how your wastewater treatment plant can benefit from the TrojanUV3000Plus™ – call us today.
Trojan UV Technologies UK Limited (UK): +44 1905 77 11 17Trojan Technologies (The Netherlands): +31 70 391 3020Trojan Technologies (France): +33 1 6081 0516Trojan Technologies Espana (Spain): +34 91 564 5757Trojan Technologies Deutschland GmbH (Germany): +49 6024 634 75 80Hach/Trojan Technologies (China): 86-10-65150290
Head Office (Canada)3020 Gore RoadLondon, Ontario, Canada N5V 4T7Telephone: (519) 457-3400 Fax: (519) 457-3030
www.trojanuv.com
Printed in Canada. Copyright 2007. Trojan Technologies, London, Ontario, Canada.No part of this publication may be reproduced, stored in a retrieval system, or transmitted in any form or by any meanswithout the written permission of Trojan Technologies. MWW-003 (0107) TROW-1040
Products in this brochure may be covered by one or more of the following patents:U.S. 4,872,980; 5,006,244; 5,418,370; RE 36,896; 6,342,188; 6,635,613; 6,646,269; 6,663,318; 6,719,491; 6,830,697; 7,018,975Can. 1,327,877; 2,117,040; 2,239,925 Other patents pending.
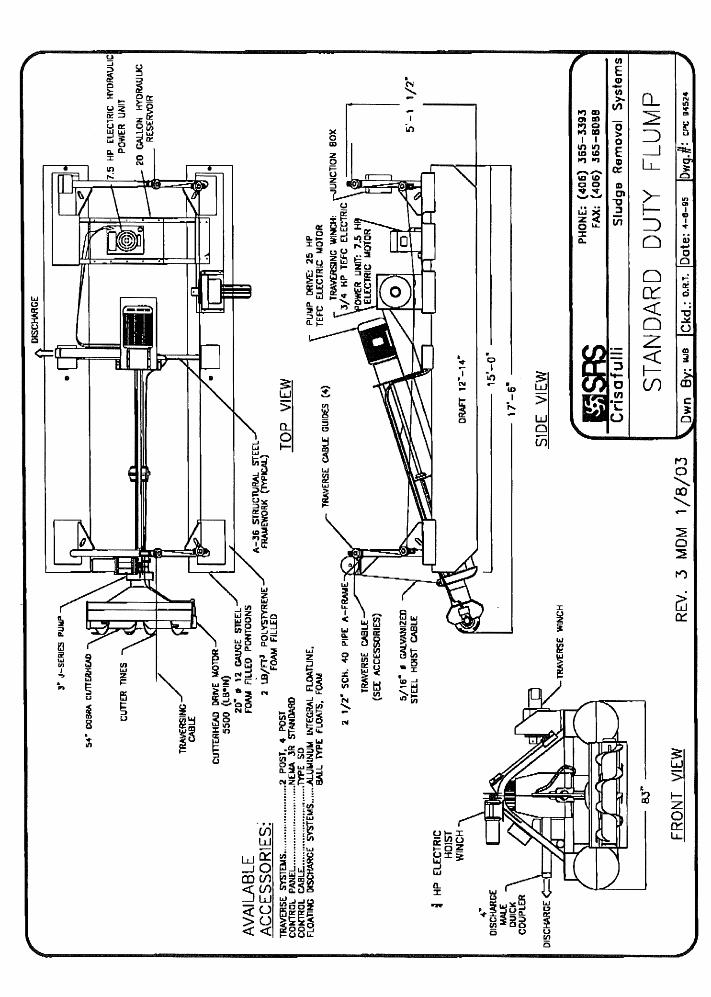
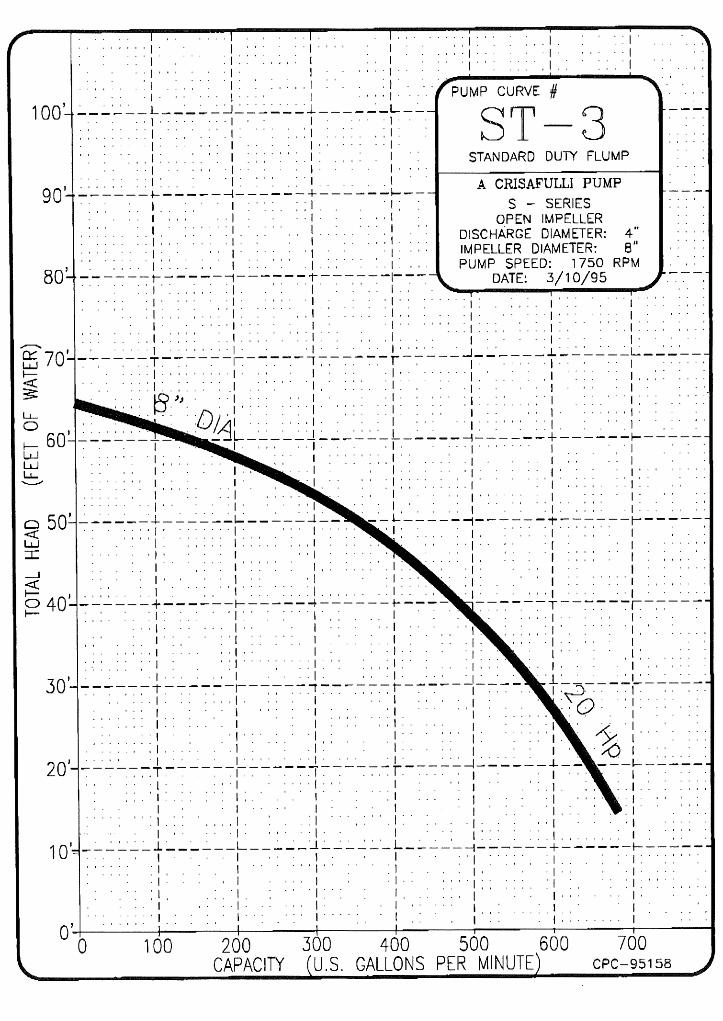
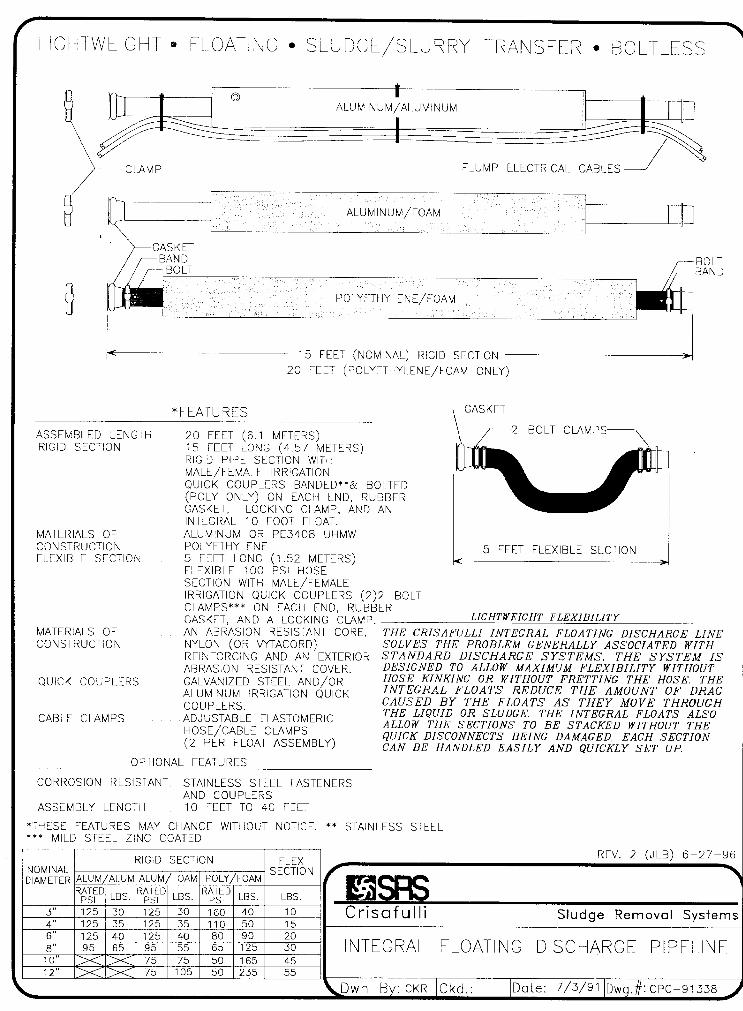
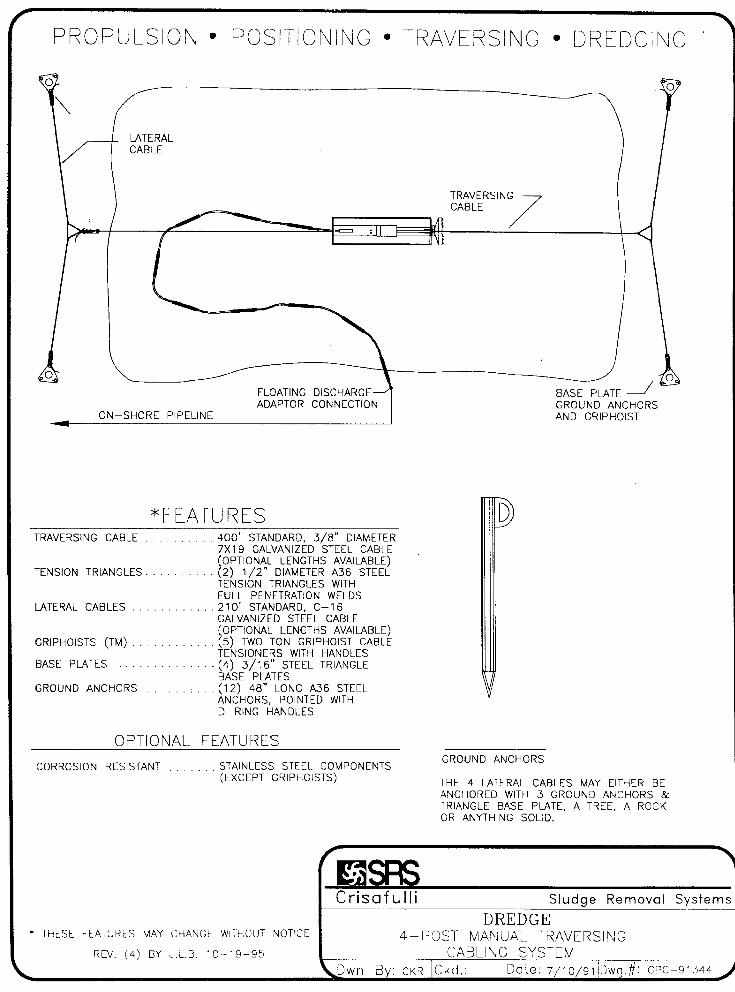
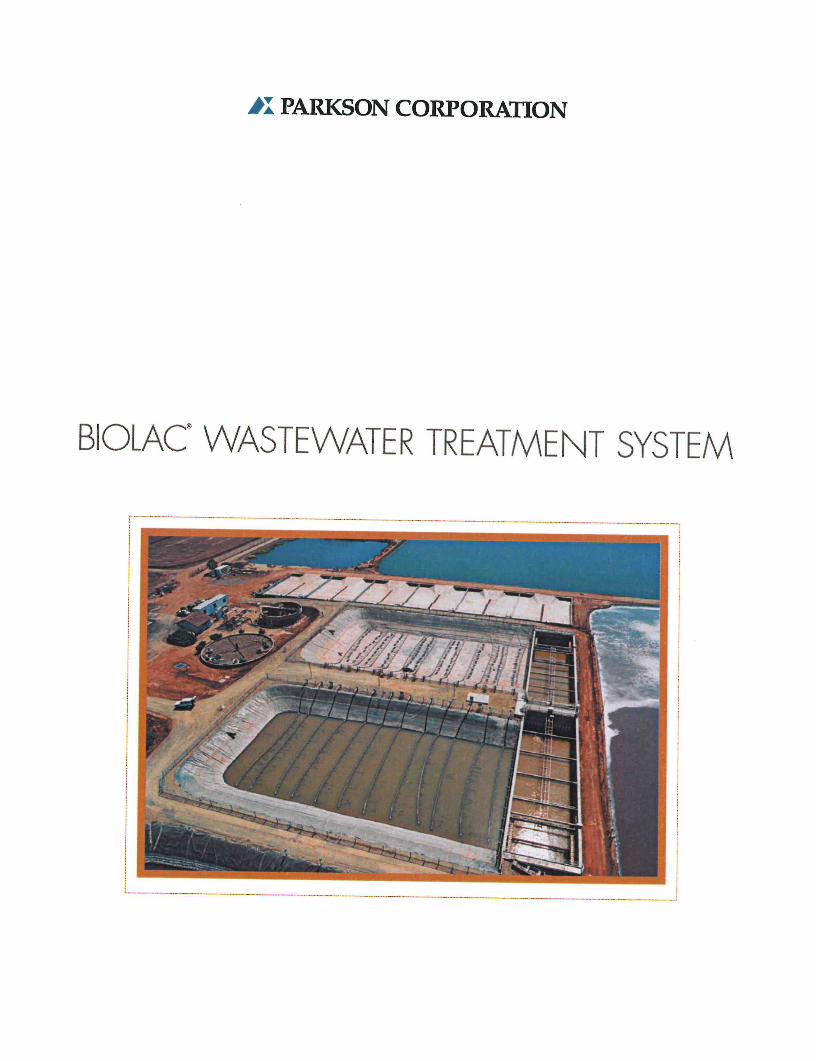
>I PARKSON CORPORATION
BIOLAC WASTEWATER TREATMENT SYSTEM
- ; « F J'-H1 "KHr^TTV
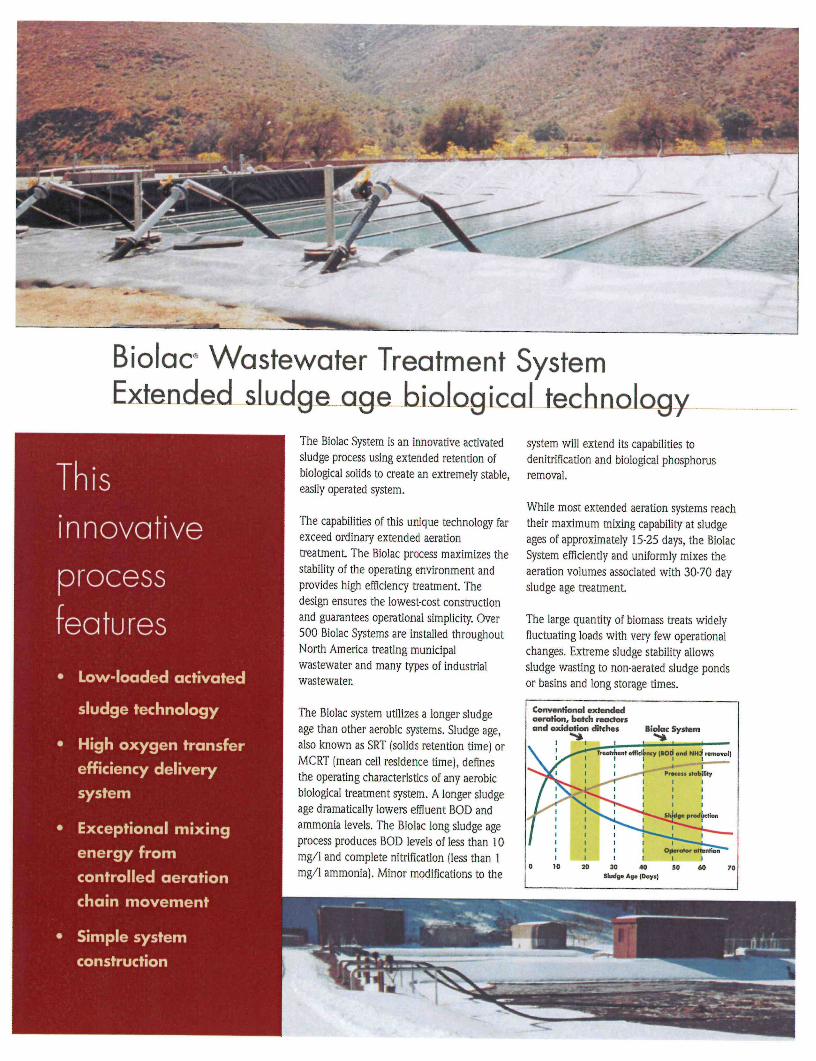
/
Biolae Wastewater Treatment SystemExtended sludge age .biological technology.
The Biolae System is an innovative activatedsludge process using extended retention ofbiological solids to create an extremely stable,easily operated system.
The capabilities of this unique technology farexceed ordinary extended aerationtreatment. The Biolae process maximizes thestability of the operating environment andprovides high efficiency treatment. Thedesign ensures the lowest-cost constructionand guarantees operational simplicity. Over500 Biolae Systems are installed throughoutNorth America treating municipalwastewater and many types of industrialwastewater.
The Biolae system utilizes a longer sludgeage than other aerobic systems. Sludge age,also known as SRT (solids retention time) orMCRT (mean cell residence time), definesthe operating characteristics of any aerobicbiological treatment system. A longer sludgeage dramatically lowers effluent BOD andammonia levels. The Biolae long sludge ageprocess produces BOD levels of less than 10mg/1 and. complete nitrification (less than 1mg/1 ammonia). Minor modifications to the
system will extend its capabilities todenitrification and biological phosphorusremoval.
While most extended aeration systems reachtheir maximum mixing capability at sludgeages of approximately 15-25 days, the BiolaeSystem efficiently and uniformly mixes theaeration volumes associated with 30-70 daysludge age treatment.
The large quantity of biomass treats widelyfluctuating loads with very few operationalchanges. Extreme sludge stability allowssludge wasting to non-aerated sludge pondsor basins and long storage times.
innovative
process
lures
• Low-loaded activated
sludge technology
• High oxygen transfer
efficiency delivery
system
• Exceptional mixing
energy from
controlled aeration
chain movement
> Simple system
construction
Conventional extendedaeration, batch reactorsand oxidation ditches
, * » , ,
/ >/
/
1 ̂
1II
r
f ^
Biolae System
' Tkvatrftanl efficiency {tOd and NH* rtmoval)
^***C ^ 1^ ^ » w 1
^ ^ ^ I ^ ^ " «
!1tI
0 10 70 30
i —̂»——- i•r0***™ rtoWlityI 1 11 1 11 1 11 1 1^^Shjda.prodJKHon
J I * * * * - |1^***-*^ i i1 I I1 Operator attention*"1 1 I10 30 60 70
Sludge Age (Day.)
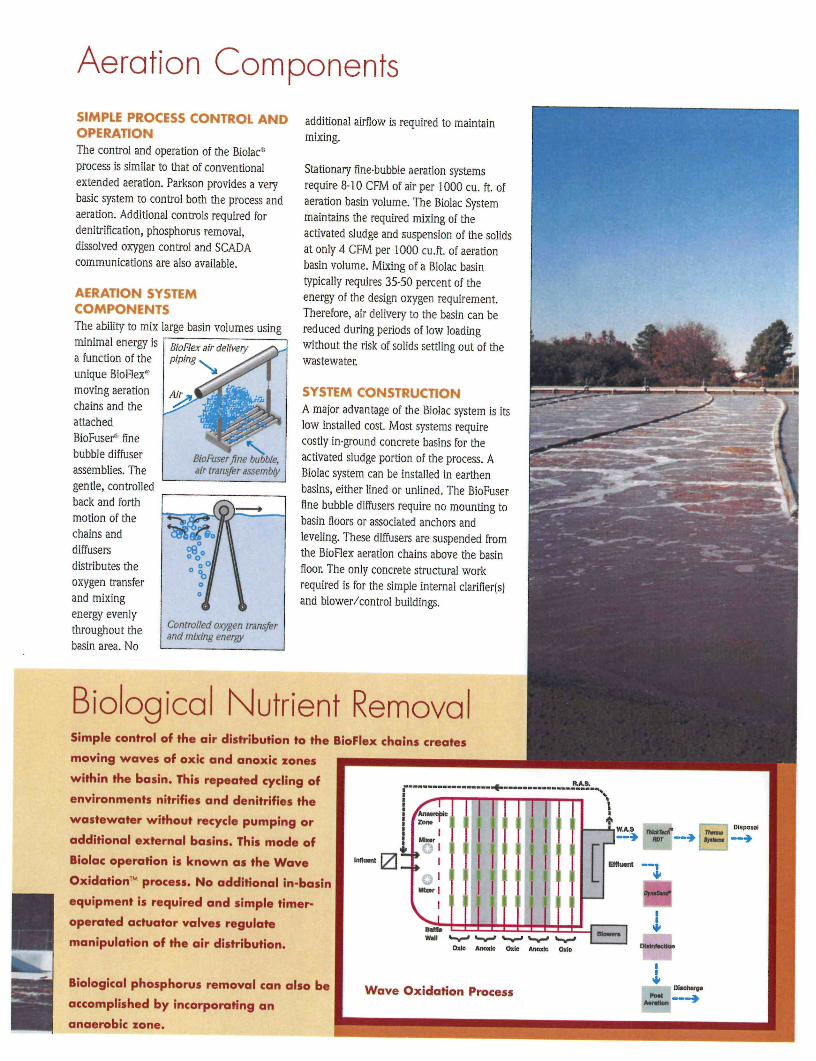
Aeration ComponentsSIMPLE PROCESS CONTROL ANDOPERATIONThe control and operation of the Biolac"process is similar to that of conventionalextended aeration. Parkson provides a verybasic system to control both the process andaeration. Additional controls required fordenitrification, phosphorus removal,dissolved oxygen control and SCADAcommunications are also available.
AERATION SYSTEMCOMPONENTSThe ability to mix large basin volumes usingminimal energy isa function of theunique BioFlex45
moving aerationchains and theattachedBioFuser' finebubble diffuserassemblies. Thegentle, controlledback and forthmotion of thechains anddiffusersdistributes theoxygen transferand mixingenergy evenlythroughout thebasin area. No
additional airflow is required to maintainmixing.
Stationary fine-bubble aeration systemsrequire 8-10 CFM of air per 1000 cu. ft. ofaeration basin volume. The Biolac Systemmaintains the required mixing of theactivated sludge and suspension of the solidsat only 4 CFM per 1000 cu.fi. of aerationbasin volume. Mixing of a Biolac basintypically requires 35-50 percent of theenergy of the design oxygen requirement.Therefore, air delivery to the basin can bereduced during periods of low loadingwithout the risk of solids settling out of thewastewater.
SYSTEM CONSTRUCTIONA major advantage of the Biolac system is itslow installed cost. Most systems requirecostly in-ground concrete basins for theactivated sludge portion of the process. ABiolac system can be installed in earthenbasins, either lined or unlined. The BioFuserfine bubble diffusers require no mounting tobasin floors or associated anchors andleveling. These diffusers are suspended fromthe BioFlex aeration chains above the basinfloor. The only concrete structural workrequired is for the simple internal clarifier(s)and blower/control buildings.
BioFlex air deliverypiping..
Air
BioFuser fine bubble,air transfer assembly
Controlled oxygen transferand mixing energy
Biological Nutrient RemovalSimple control of the air distribution to the BioFlex chains creates
moving waves of oxic and anoxic zones
within the basin. This repeated cycling of
environments nitrifies and denitrifies the
wastewater without recycle pumping or
additional external basins. This mode of
Biolac operation is known as the Wave
Oxidation" process. No additional in-basin
equipment is required and simple timer-
operated actuator valves regulate
manipulation of the air distribution.
f - "1——L.W.A.TilZon. ' |
It-!' I!1i i
i
DisposalW.A.9 nwiwT— •
[ Effluant - - •1
I I
iWtit
Oxic Anoxic Oxic Anoxic Oxte
iBiological phosphorus removal can also be
accomplished by incorporating an
anaerobic zone.
Wave Oxidation Process DlKtivg*
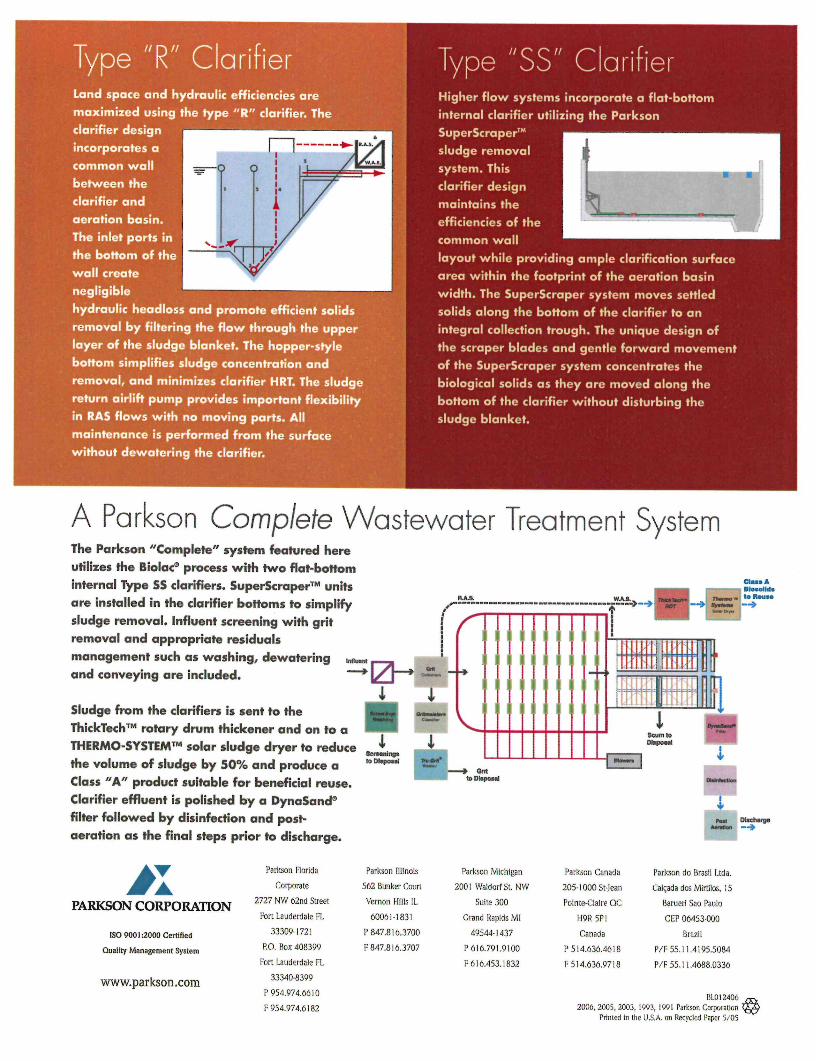
Type "SS" ClarifierLand space and hydraulic efficiencies are
maximized using the type "R" clarifier. The
clarifier design
incorporates a
common wall
between the
clarifier and
aeration basin.
The inlet ports in
the bottom of the
wall create
negligible
hydraulic headloss^rH^JrWTIbte efficient solids
removal by filtering the flow through the upper
layer of the sludge blanket. The hopper-style
bottom simplifies sludge concentration and
removal, and minimizes clarifier HRT. The sludge1
return airlift pump provides important flexibility
in RAS flows with no moving parts. All I
maintenance is performed from the surface ]
without dewatering the clarifier. I
Higher flow systems incorporate a flat-bottominternal clarifier utilizing the ParksonSuperScraper™ _ — _ .... — -.,....-..
sludge removal
system. This
clarifier design
maintains the
efficiencies of the
common wall
layout while providing ample clarification surface
area within the footprint of the aeration basin
width. The SuperScraper system moves settled
solids along the bottom of the clarifier to an
integral collection trough. The unique design of
the scraper blades and gentle forward movement
of the SuperScraper system concentrates the
biological solids as they are moved along the
bottom of the clarifier without disturbing the
sludge blanket.
A Parkson Complete Waste water Treatment SystemThe Parkson "Complete" system featured here
utilizes the Biolac* process with two flat-bottom
internal Type SS clarifiers. SuperScraper™ units
are installed in the clarifier bottoms to simplify
sludge removal. Influent screening with grit
removal and appropriate residuals
management such as washing, dewatering
and conveying are included.
Sludge from the clarifiers is sent to the
ThickTech™ rotary drum thickener and on to a
THERMO-SYSTEM™ solar sludge dryer to reduce
the volume of sludge by 50% and produce a
Class "A" product suitable for beneficial reuse.
Clarifier effluent is polished by a DynaSand®
filter followed by disinfection and post-
aeration as the final steps prior to discharge.
0-i
Scrttnins*toDtopostl
amto Disposal
Dt.ch.ra.
Parkson Florida
Corporate
2727 NW 62nd Street
Fort Lauderdale R
33309-1721
P.O. Box 408399
Fort Laudcrdale Fl.
33340-8399
P 954.974.6610
F 954.974.6182
Parkson Illinois
562 Bunker Court
Yernon Hills IL.
60061-1831
P 847.816.3700
F 847.816.3707
Parkson Michigan
2001 Waldorf St. NW
Suite 300
Grand Rapids MI
49S44-1437
P 616.791.9100
F 616.453.1832
Parkson Canada
205-1000 St-Jcan
Pointe-Claire QC
H91? 5P1
Canada
P 514.636.4618
F 514.636.9718
Parkson do Brasil l.lda.
Canada dos Mirtilos, 15
Barueri Sao Paulo
CEP 06453-000
Brazil
P/I-55. II.4195.5084
P/F 55.11.4688.0336
PARKSON CORPORATION
ISO 9001:2000 Certified
Quality Management System
www.parkson.comB1.012406
2006, 2005, 2003, IM3, 1 Wl Parkson Corporation \Printed in the U.S.A. on Recycled Paper 5/05
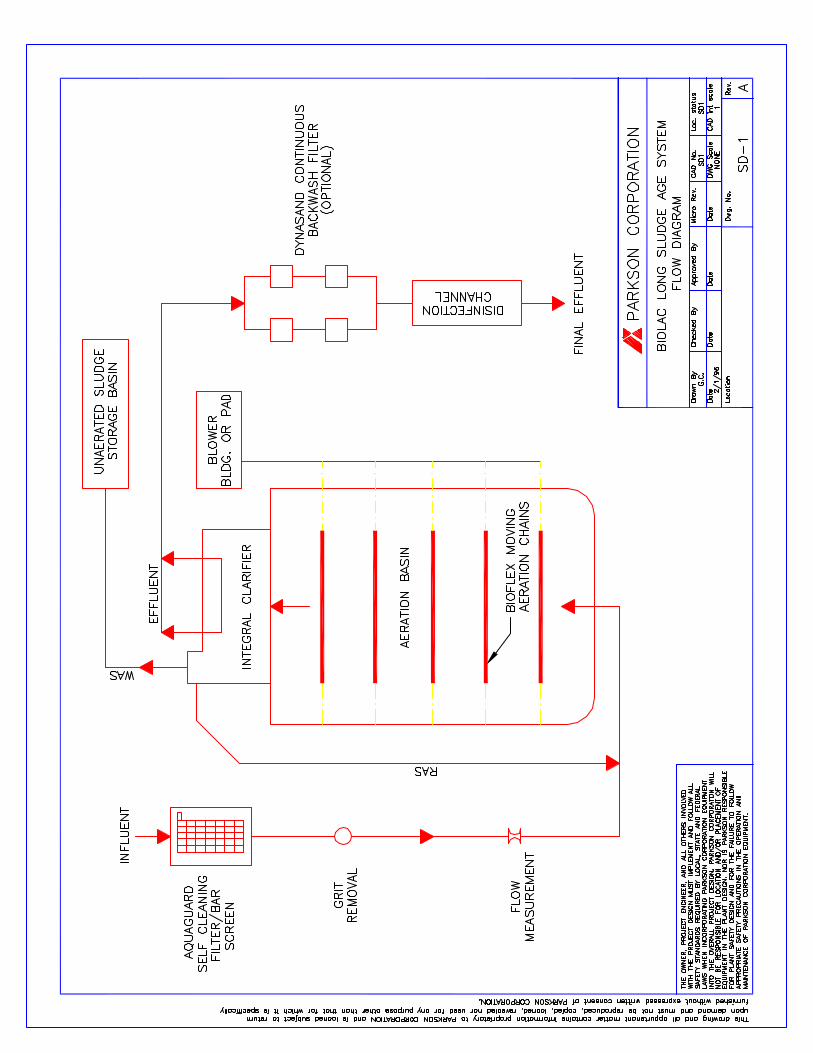
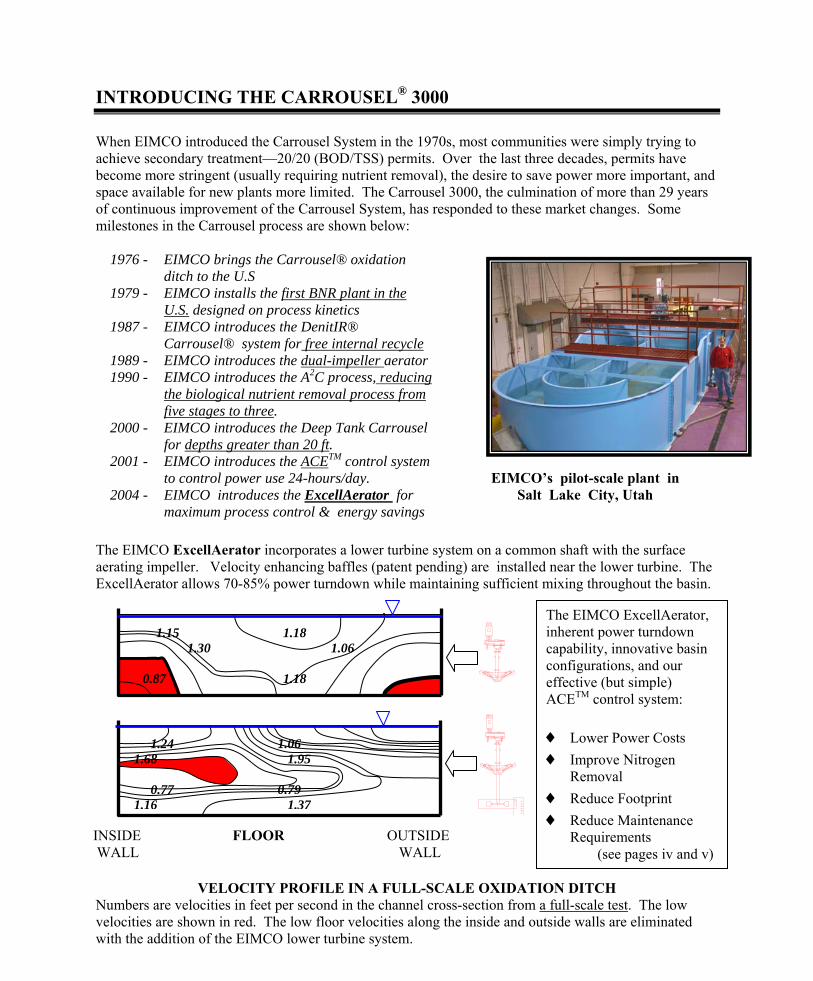
Nipomo, California WWTP November 27, 2006 Carrousel® System Proposal CONFIDENTIAL Page A-2
INTRODUCING THE CARROUSEL® 3000
When EIMCO introduced the Carrousel System in the 1970s, most communities were simply trying to achieve secondary treatment—20/20 (BOD/TSS) permits. Over the last three decades, permits have become more stringent (usually requiring nutrient removal), the desire to save power more important, and space available for new plants more limited. The Carrousel 3000, the culmination of more than 29 years of continuous improvement of the Carrousel System, has responded to these market changes. Some milestones in the Carrousel process are shown below:
EIMCO’s pilot-scale plant in Salt Lake City, Utah
The EIMCO ExcellAerator incorporates a lower turbine system on a common shaft with the surface aerating impeller. Velocity enhancing baffles (patent pending) are installed near the lower turbine. The ExcellAerator allows 70-85% power turndown while maintaining sufficient mixing throughout the basin.
VELOCITY PROFILE IN A FULL-SCALE OXIDATION DITCH Numbers are velocities in feet per second in the channel cross-section from a full-scale test. The low velocities are shown in red. The low floor velocities along the inside and outside walls are eliminated with the addition of the EIMCO lower turbine system.
1976 - EIMCO brings the Carrousel® oxidation ditch to the U.S
1979 - EIMCO installs the first BNR plant in the U.S. designed on process kinetics
1987 - EIMCO introduces the DenitIR® Carrousel® system for free internal recycle
1989 - EIMCO introduces the dual-impeller aerator 1990 - EIMCO introduces the A2C process, reducing
the biological nutrient removal process from five stages to three.
2000 - EIMCO introduces the Deep Tank Carrousel for depths greater than 20 ft.
2001 - EIMCO introduces the ACETM control system to control power use 24-hours/day.
2004 - EIMCO introduces the ExcellAerator for maximum process control & energy savings
1.24 1.06 1.68 1.95 0.77 0.79 1.16 1.37
Inside Outsid
1.15 1.18 1.30 1.06 0.87 1.18
OutsidInsid
INSIDE FLOOR OUTSIDE WALL WALL
The EIMCO ExcellAerator, inherent power turndown capability, innovative basin configurations, and our effective (but simple) ACETM control system: ♦ Lower Power Costs ♦ Improve Nitrogen
Removal ♦ Reduce Footprint ♦ Reduce Maintenance
Requirements (see pages iv and v)
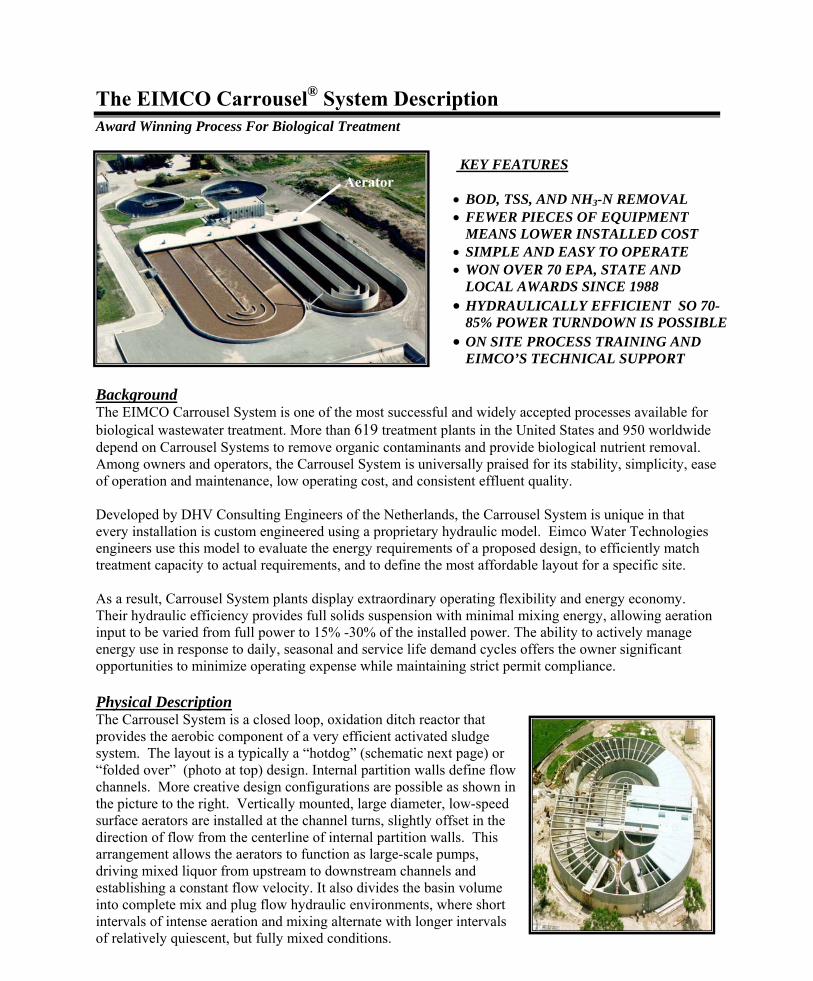
Nipomo, California WWTP November 27, 2006 Carrousel® System Proposal CONFIDENTIAL Page A-3
The EIMCO Carrousel® System Description Award Winning Process For Biological Treatment
KEY FEATURES • BOD, TSS, AND NH3-N REMOVAL • FEWER PIECES OF EQUIPMENT
MEANS LOWER INSTALLED COST • SIMPLE AND EASY TO OPERATE • WON OVER 70 EPA, STATE AND
LOCAL AWARDS SINCE 1988 • HYDRAULICALLY EFFICIENT SO 70-
85% POWER TURNDOWN IS POSSIBLE • ON SITE PROCESS TRAINING AND
EIMCO’S TECHNICAL SUPPORT Background The EIMCO Carrousel System is one of the most successful and widely accepted processes available for biological wastewater treatment. More than 619 treatment plants in the United States and 950 worldwide depend on Carrousel Systems to remove organic contaminants and provide biological nutrient removal. Among owners and operators, the Carrousel System is universally praised for its stability, simplicity, ease of operation and maintenance, low operating cost, and consistent effluent quality. Developed by DHV Consulting Engineers of the Netherlands, the Carrousel System is unique in that every installation is custom engineered using a proprietary hydraulic model. Eimco Water Technologies engineers use this model to evaluate the energy requirements of a proposed design, to efficiently match treatment capacity to actual requirements, and to define the most affordable layout for a specific site. As a result, Carrousel System plants display extraordinary operating flexibility and energy economy. Their hydraulic efficiency provides full solids suspension with minimal mixing energy, allowing aeration input to be varied from full power to 15% -30% of the installed power. The ability to actively manage energy use in response to daily, seasonal and service life demand cycles offers the owner significant opportunities to minimize operating expense while maintaining strict permit compliance. Physical Description The Carrousel System is a closed loop, oxidation ditch reactor that provides the aerobic component of a very efficient activated sludge system. The layout is a typically a “hotdog” (schematic next page) or “folded over” (photo at top) design. Internal partition walls define flow channels. More creative design configurations are possible as shown in the picture to the right. Vertically mounted, large diameter, low-speed surface aerators are installed at the channel turns, slightly offset in the direction of flow from the centerline of internal partition walls. This arrangement allows the aerators to function as large-scale pumps, driving mixed liquor from upstream to downstream channels and establishing a constant flow velocity. It also divides the basin volume into complete mix and plug flow hydraulic environments, where short intervals of intense aeration and mixing alternate with longer intervals of relatively quiescent, but fully mixed conditions.
Aerator

Nipomo, California WWTP November 27, 2006 Carrousel® System Proposal CONFIDENTIAL Page A-4
The EIMCO Carrousel® System Description (cont’d) Award Winning Process For Biological Treatment Operating Description In the aeration zone, influent wastewater and returned activated sludge (RAS) are introduced under intense, concentrated mixing action, providing immediate dilution in a mixed liquor volume of 50 to 100 times the influent flow and eliminating the possibility of short circuiting. The concentration of aeration power in a confined volume enhances oxygen transfer efficiency and establishes a uniform dissolved oxygen profile throughout the channel depth. As mixed liquor enters the downstream channel, the complete mix conditions give way to a plug flow environment in which the channel velocity maintains an energy level high enough to keep solids suspended, but low enough to allow progressive bioflocculation of the mixed liquor solids. In the channels, natural respiration of the biomass produces a gradual drop in DO concentration, which can be managed for various process objectives, including denitrification. The low DO entering the aeration zone also increases oxygen transfer. An overflow weir is located upstream of the aeration zone to take maximum advantage of oxygen management practices and bioflocculation in the downstream channels. By concentrating the input of mixing and aeration energy in a small portion of the basin volume, and by using the channel velocity to maintain solids suspension in the larger volume, the Carrousel System provides more flexible, efficient aeration with fewer aerators than other oxidation ditch systems and with significantly lower overall power requirements than complete mix systems. The reduced number of aerators and their convenient location simplify and greatly reduce mechanical maintenance requirements. Maximum Mixing, Minimum Power The operating economies described above depend on a reactor basin where channel velocity is maintained with the smallest possible input of aeration energy. All dimensions and specifications that influence this capability are evaluated using the DHV Carrousel System hydraulic model, including impeller type, impeller diameter, aerator rotational speed, aeration zone depth, channel depth and width. The resulting hydraulic efficiency ensures that solids remain in suspension using only a fraction of the installed power. A Proposal of Excellence The EIMCO Carrousel System proposed in this document will ensure your client of wastewater treatment performance that will reliably meet the plant’s specified effluent discharge limits. In addition, it will provide the owner with a treatment system that is simpler, more stable, easier to operate and maintain and less expensive to operate than any other oxidation ditch configuration. It will provide a flexible platform for future upgrades should they be required by service area growth or more restrictive discharge regulations. Eimco engineers provide process training and start-up technical support so that Carrousel systems perform to their specifications from Day 1. For these reasons, the Carrousel system is a responsible technology investment for you and your client.
BOD + 02 CO2 + H20 NH3 + 02 NO3
DO < 0.50
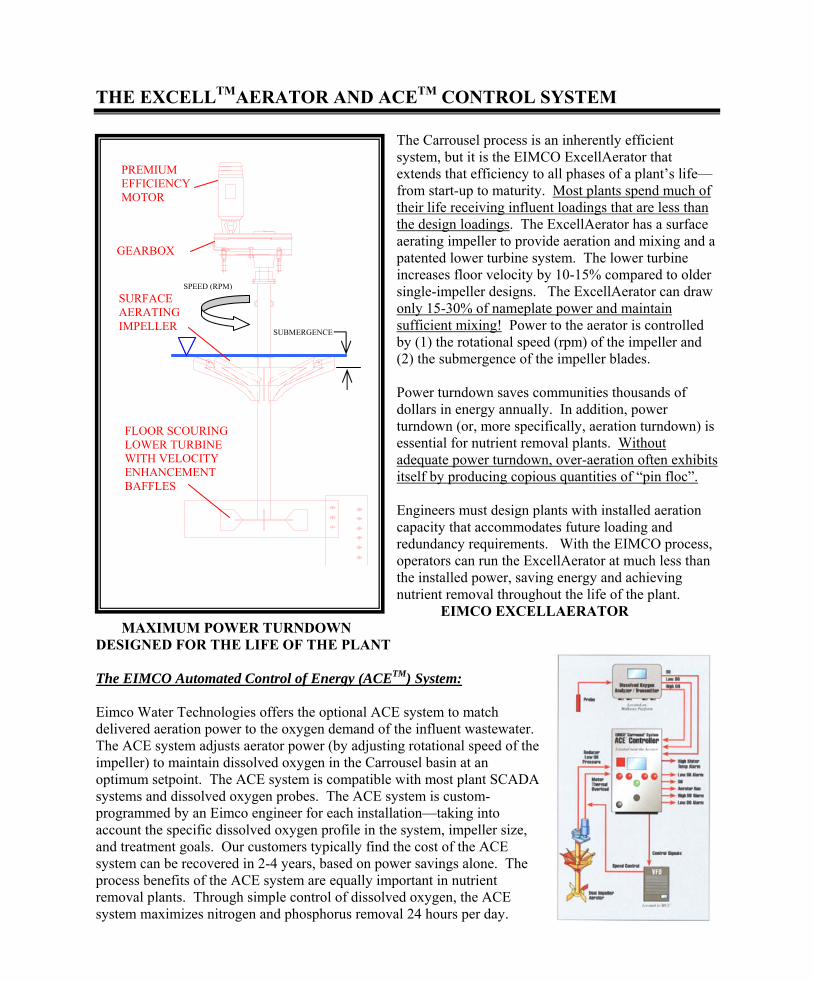
Nipomo, California WWTP November 27, 2006 Carrousel® System Proposal CONFIDENTIAL Page A-5
THE EXCELLTMAERATOR AND ACETM CONTROL SYSTEM
The Carrousel process is an inherently efficient system, but it is the EIMCO ExcellAerator that extends that efficiency to all phases of a plant’s life—from start-up to maturity. Most plants spend much of their life receiving influent loadings that are less than the design loadings. The ExcellAerator has a surface aerating impeller to provide aeration and mixing and a patented lower turbine system. The lower turbine increases floor velocity by 10-15% compared to older single-impeller designs. The ExcellAerator can draw only 15-30% of nameplate power and maintain sufficient mixing! Power to the aerator is controlled by (1) the rotational speed (rpm) of the impeller and (2) the submergence of the impeller blades. Power turndown saves communities thousands of dollars in energy annually. In addition, power turndown (or, more specifically, aeration turndown) is essential for nutrient removal plants. Without adequate power turndown, over-aeration often exhibits itself by producing copious quantities of “pin floc”. Engineers must design plants with installed aeration capacity that accommodates future loading and redundancy requirements. With the EIMCO process, operators can run the ExcellAerator at much less than the installed power, saving energy and achieving nutrient removal throughout the life of the plant. EIMCO EXCELLAERATOR
MAXIMUM POWER TURNDOWN DESIGNED FOR THE LIFE OF THE PLANT The EIMCO Automated Control of Energy (ACETM) System: Eimco Water Technologies offers the optional ACE system to match delivered aeration power to the oxygen demand of the influent wastewater. The ACE system adjusts aerator power (by adjusting rotational speed of the impeller) to maintain dissolved oxygen in the Carrousel basin at an optimum setpoint. The ACE system is compatible with most plant SCADA systems and dissolved oxygen probes. The ACE system is custom-programmed by an Eimco engineer for each installation—taking into account the specific dissolved oxygen profile in the system, impeller size, and treatment goals. Our customers typically find the cost of the ACE system can be recovered in 2-4 years, based on power savings alone. The process benefits of the ACE system are equally important in nutrient removal plants. Through simple control of dissolved oxygen, the ACE system maximizes nitrogen and phosphorus removal 24 hours per day.
PREMIUM EFFICIENCY MOTOR
GEARBOX
SURFACE AERATING IMPELLER
FLOOR SCOURING LOWER TURBINE WITH VELOCITY ENHANCEMENT BAFFLES
SUBMERGENCE
SPEED (RPM)
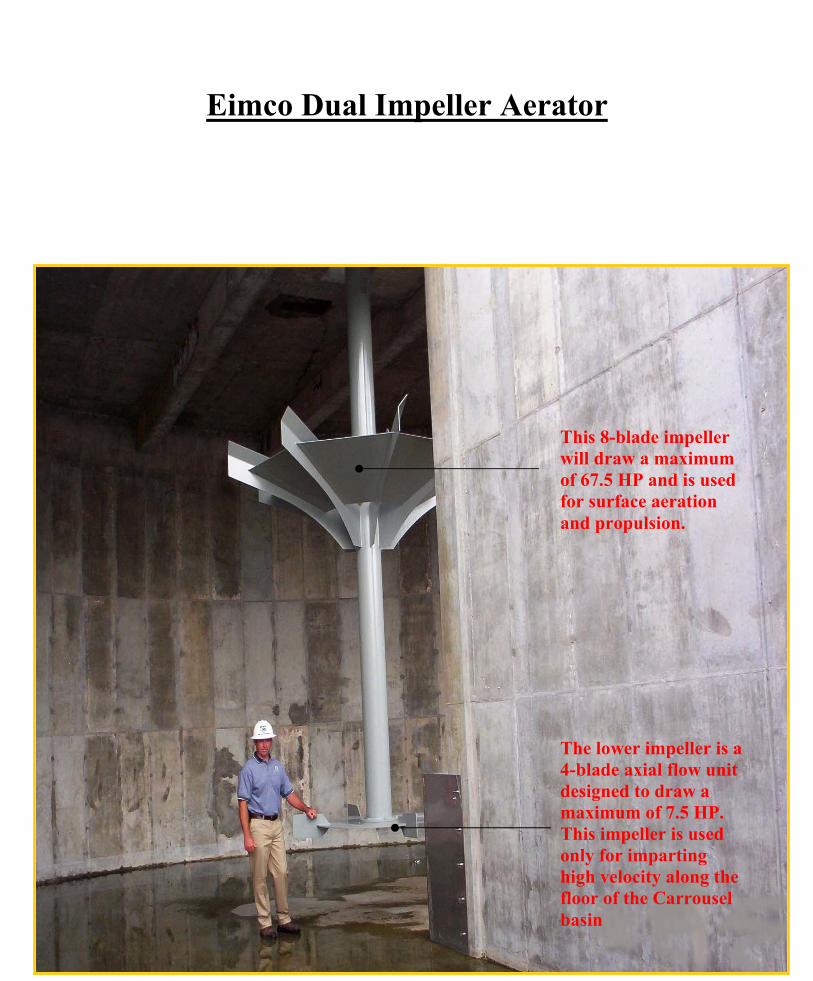
Nipomo, California WWTP November 27, 2006 Carrousel® System Proposal CONFIDENTIAL Page A-6
Eimco Dual Impeller Aerator
This 8-blade impeller will draw a maximum of 67.5 HP and is used for surface aeration and propulsion.
The lower impeller is a 4-blade axial flow unit designed to draw a maximum of 7.5 HP. This impeller is used only for imparting high velocity along the floor of the Carrousel basin
APPENDIX D
PRODUCT INFORMATION


The Helisieve system uses shaftless spiral
technology to perform screening, solids
conveying and dewatering in one cost efficient
operation. The heart of the system is a heavy-
duty carbon steel spiral that conveys
screenings to the dewatering zone and
dewaters them to acceptable landfill
requirements. The spiral is fabricated in a
continuous flight to assure a strong, stable
structure. It is surrounded by a stainless steel
tube that encloses screenings, minimizes odors
and provides clean, hygienic operation.
The Helisieve’s shaftless core handles a greater
volume of solids than shafted screw designs.
Fibrous and bulky solids have a clear, barrier-
free path to the dewatering zone. The shaftless
design also eliminates the need for
maintenance-intensive bottom support bearings
and intermediate hanger bearings.
The Helisieve system performsthree operations in one:Screening. Influent moves into the fine
screening area where the perforated screen
removes solids. A spiral-mounted brush keeps
the screen surface clean.
Conveying. The spiral moves the screenings
upward through the transport area. There is no
shaft to restrict flow or become entangled with
long, stringy solids.
Dewatering. Solids are dewatered by
compression against a plug of material formed
in the flightless zone. Liquid is discharged
through a perforated screen. A removable drain
box simplifies access to the screen and solids
plug. Solids at 40% dry weight are common.
Hycor® Helisieve® In-Channel Fine Screen Model HLS
All-in-one screening, conveying and dewatering system
Combines screening, conveying and
dewatering into one reliable, automatic,
cost-efficient system.
Durable spiral brush keeps the screen clean.
Close-up view of the new drain box with
optional explosion-proof wiring.
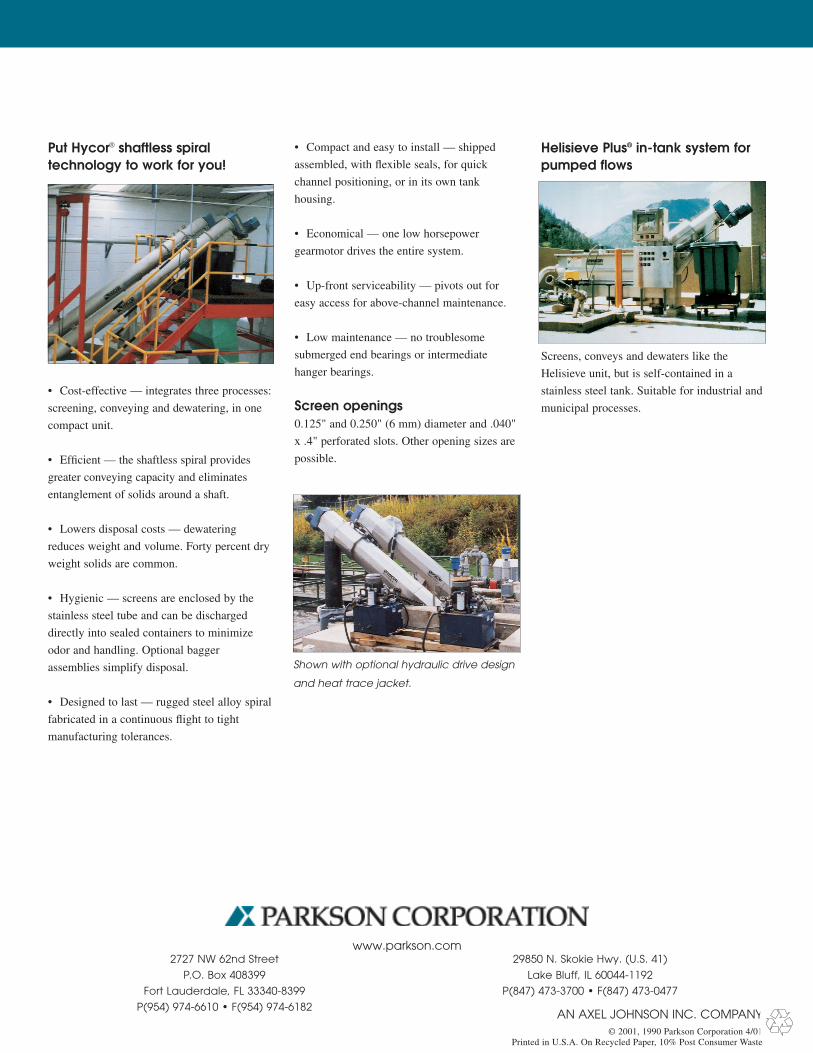
Put Hycor® shaftless spiraltechnology to work for you!
• Cost-effective — integrates three processes:
screening, conveying and dewatering, in one
compact unit.
• Efficient — the shaftless spiral provides
greater conveying capacity and eliminates
entanglement of solids around a shaft.
• Lowers disposal costs — dewatering
reduces weight and volume. Forty percent dry
weight solids are common.
• Hygienic — screens are enclosed by the
stainless steel tube and can be discharged
directly into sealed containers to minimize
odor and handling. Optional bagger
assemblies simplify disposal.
• Designed to last — rugged steel alloy spiral
fabricated in a continuous flight to tight
manufacturing tolerances.
• Compact and easy to install — shipped
assembled, with flexible seals, for quick
channel positioning, or in its own tank
housing.
• Economical — one low horsepower
gearmotor drives the entire system.
• Up-front serviceability — pivots out for
easy access for above-channel maintenance.
• Low maintenance — no troublesome
submerged end bearings or intermediate
hanger bearings.
Screen openings0.125" and 0.250" (6 mm) diameter and .040"
x .4" perforated slots. Other opening sizes are
possible.
Helisieve Plus® in-tank system forpumped flows
Screens, conveys and dewaters like the
Helisieve unit, but is self-contained in a
stainless steel tank. Suitable for industrial and
municipal processes.
Shown with optional hydraulic drive design
and heat trace jacket.
2727 NW 62nd Street
P.O. Box 408399
Fort Lauderdale, FL 33340-8399
P(954) 974-6610 • F(954) 974-6182
29850 N. Skokie Hwy. (U.S. 41)
Lake Bluff, IL 60044-1192
P(847) 473-3700 • F(847) 473-0477
AN AXEL JOHNSON INC. COMPANY© 2001, 1990 Parkson Corporation 4/01
Printed in U.S.A. On Recycled Paper, 10% Post Consumer Waste
www.parkson.com
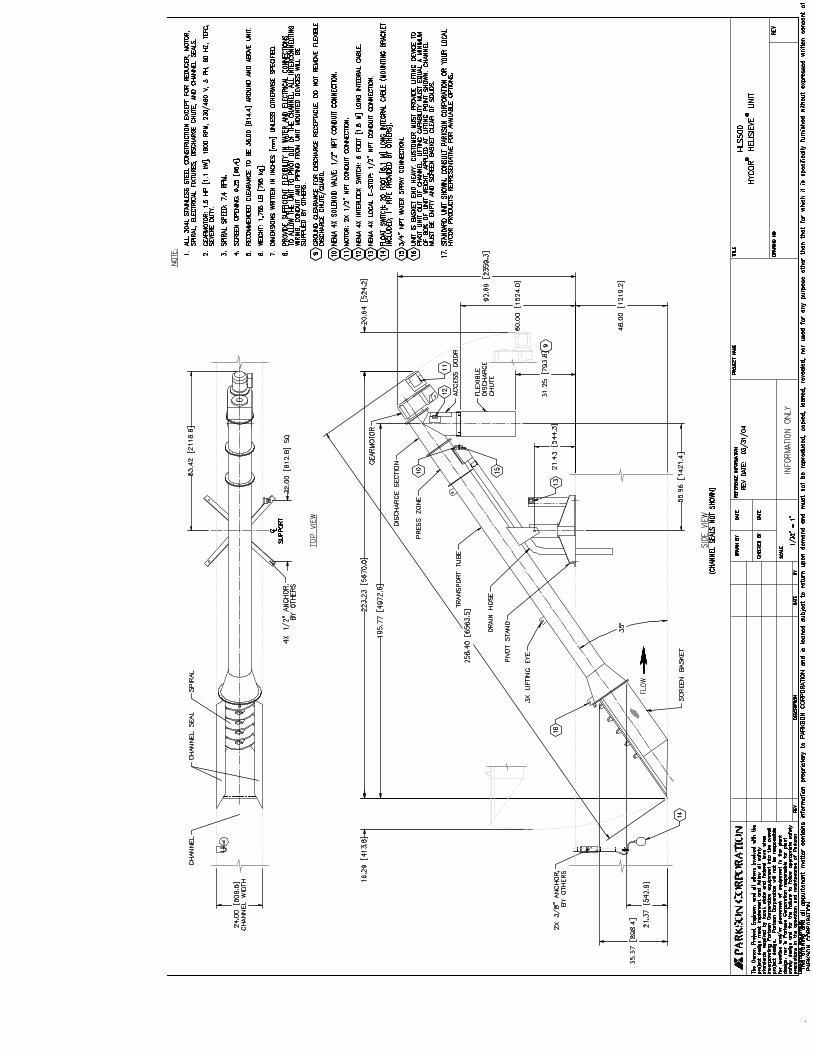

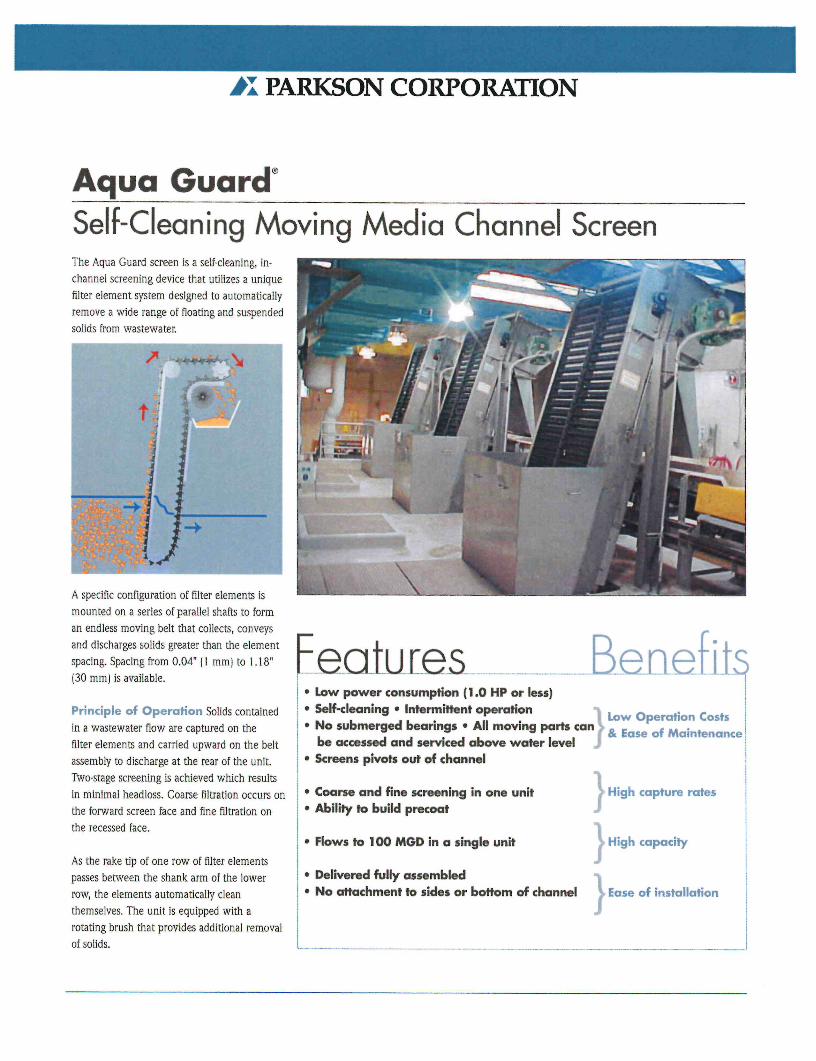
>I PARKSON CORPORATION
Aqua Guard'Self-Cleaning Moving Media Channel ScreenThe Aqua Guard screen is a self-cleaning, in-
channel screening device that utilizes a unique
filter element system designed to automatically
remove a wide range of floating and suspended
solids from wastewater.
A specific configuration of filter elements is
mounted on a series of parallel shafts to form.
an endless moving belt that collects, conveys
and discharges solids greater than the element
spacing. Spacing from 0.04" (1 mm) to 1.18"
(30 mm) is available.
Principle of Operation Solids contained
in a wastewater flow are captured on the
filter elements and carried upward on the belt
assembly to discharge at the rear of the unit.
Two-stage screening is achieved which results
in minimal headloss. Coarse Filtration occurs on
the forward screen face and fine filtration on
the recessed face.
As the rake tip of one row of filter elements
passes between the shank arm of the lower
row, the elements automatically clean
themselves. The unit is equipped with a
rotating brush that provides additional removal,
of solids.
Benefit.̂
}}}
• Low power consumption (t.O HP or less)
• Self-cleaning • Intermittent operation > . - _ ,. . , , . . . . . I Low Operation Costs ,
• No submerged bearings • All mov.ng parts can J & | a s e o f M a i n t e n a n c e
be accessed and serviced above water level
• Screens pivots out of channel
Coarse and fine screening in one unit
Ability to build precoat
Flows to 100 MGD in a single unit
Delivered fully assembled
No attachment to sides or bottom of channel
High capture rates
High capacity
Ease of installation
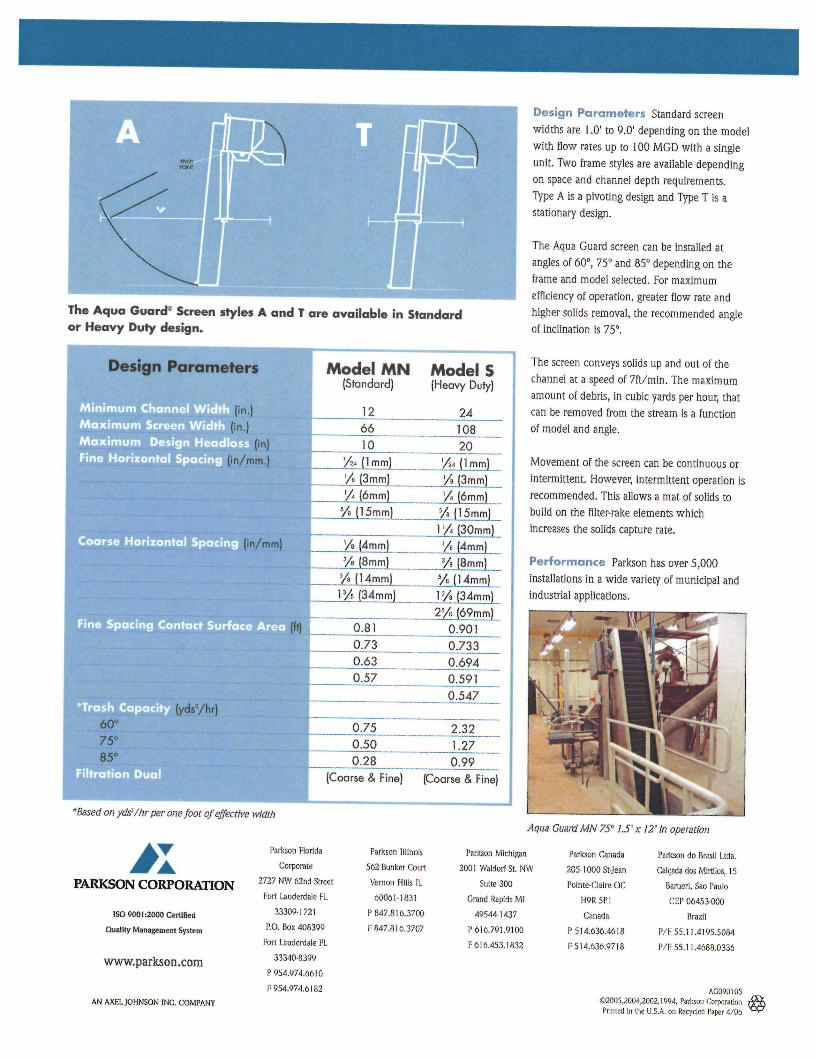
Design Parameters Standard screenwidths are 1.0' to 9.0' depending on the model
with flow rates up to 100 MGD with a single
unit. Two frame styles are available depending
on space and channel depth requirements.
Type A is a pivoting design and Type T is a
stationary design.
The Aqua Guard screen can be installed at
angles of 60°, 75° and 85° depending on the
frame and model selected. For maximum
efficiency of operation, greater flow rate and
higher solids removal, the recommended angle
of inclination is 75°.
The screen conveys solids up and out of the
channel at a speed of 7ft/min. The maximum
amount of debris, in cubic yards per hour, that
can be removed from the stream, is a function
of model and angle.
Movement of the screen can be continuous or
intermittent. However, intermittent operation is
recommended. This allows a mat of solids to
build on the filter-rake elements which
increases the solids capture rate.
P e r f o r m a n c e Parkson has over 5,000
installations in a wide variety of municipal and
industrial applications.
IF
The Aqua Guard" Screen styles A and T are available in Standardor Heavy Duty design.
(in.) fl(in)
n/mm.)
vice Area
^
^ ^
Model MN(Standard)
I J21 66: 10
'/-jlmm]1 '/e (3 mm)
£J6mrnL
V> (15mm)
'/s (4mm)
Z__i/L.[8mmLlI"y»(14mm}_
i.yLl34mml.Zr
0.81
0.73 "
0.63
0.57
0.75
0.50
0.28
(Coarse & Fine)
Model S
(Heavy Duty)
24108
20]/u (1 mm)
'/s [3mm)
V?J]lmm)_ 'I
_ VA (30mm) *
/«]4mmJL_
__iL|8n»nl_ 1s/^(14mm[ ;
.._l3/»_.i34m~mf \2ye[69mmf '
0.901
0.733'
0.694
0.591 j
0.547
2.32
1.27
0.99
(Coarse & Fine)
Design Parameters
Maximum Screen '..,
Maximum Design Head
Fine Horizontal Spa
Coarse Horizontal Spaci
'Trash Capa (ydsVhr;
60°
75°
85°
Filtration Dual
'Bused on ydst/hr per one foot of effective width
Aqua Guard MN 75° IS x 12' in operation
Parkson Florida
Corporate
2727 NW 62nd Street
Fort Lsuderdak' PI.
33300-1721
P.O. Box 408399
Fort Lauderdale FL
33340-8399
P 954.974.6610
F 954.974.6182
Parkson Illinois
502 Bunker Court
Vemon Hills II.
00061-1831
I'847.816.3700
F 847.816.3707
Parkson Michigan
2001 Waldorf St. NW
Suite 300
Grand Rapids Ml
-195-14-1437
P 616.791.9100
F 016.453.1832
Parkson Canada
205-1000 St-Jean
Pointc-Clairc QC
H9R 5P1
Cnnada
P 514.636.4618
F 514.636.9718
Parkson do Brasil Ltda.
Cakjada dos Mirlilos, 15
Barueri, Sao Paulo
CEP 06453-000
Brazil
P/F 55.11.4195.5084
P/T 55.11.4688.0336
PARKSON CORPORATION
ISO 9001:2000 Certified
Quality Management System
www.parkson.com
AN AXEL JOHNSON INC. COMPANYAG000105
©2005,2004,2002.1094, Pavkson CorporationPrimed in Hie U.S.A. on Recycled Paper 4/06
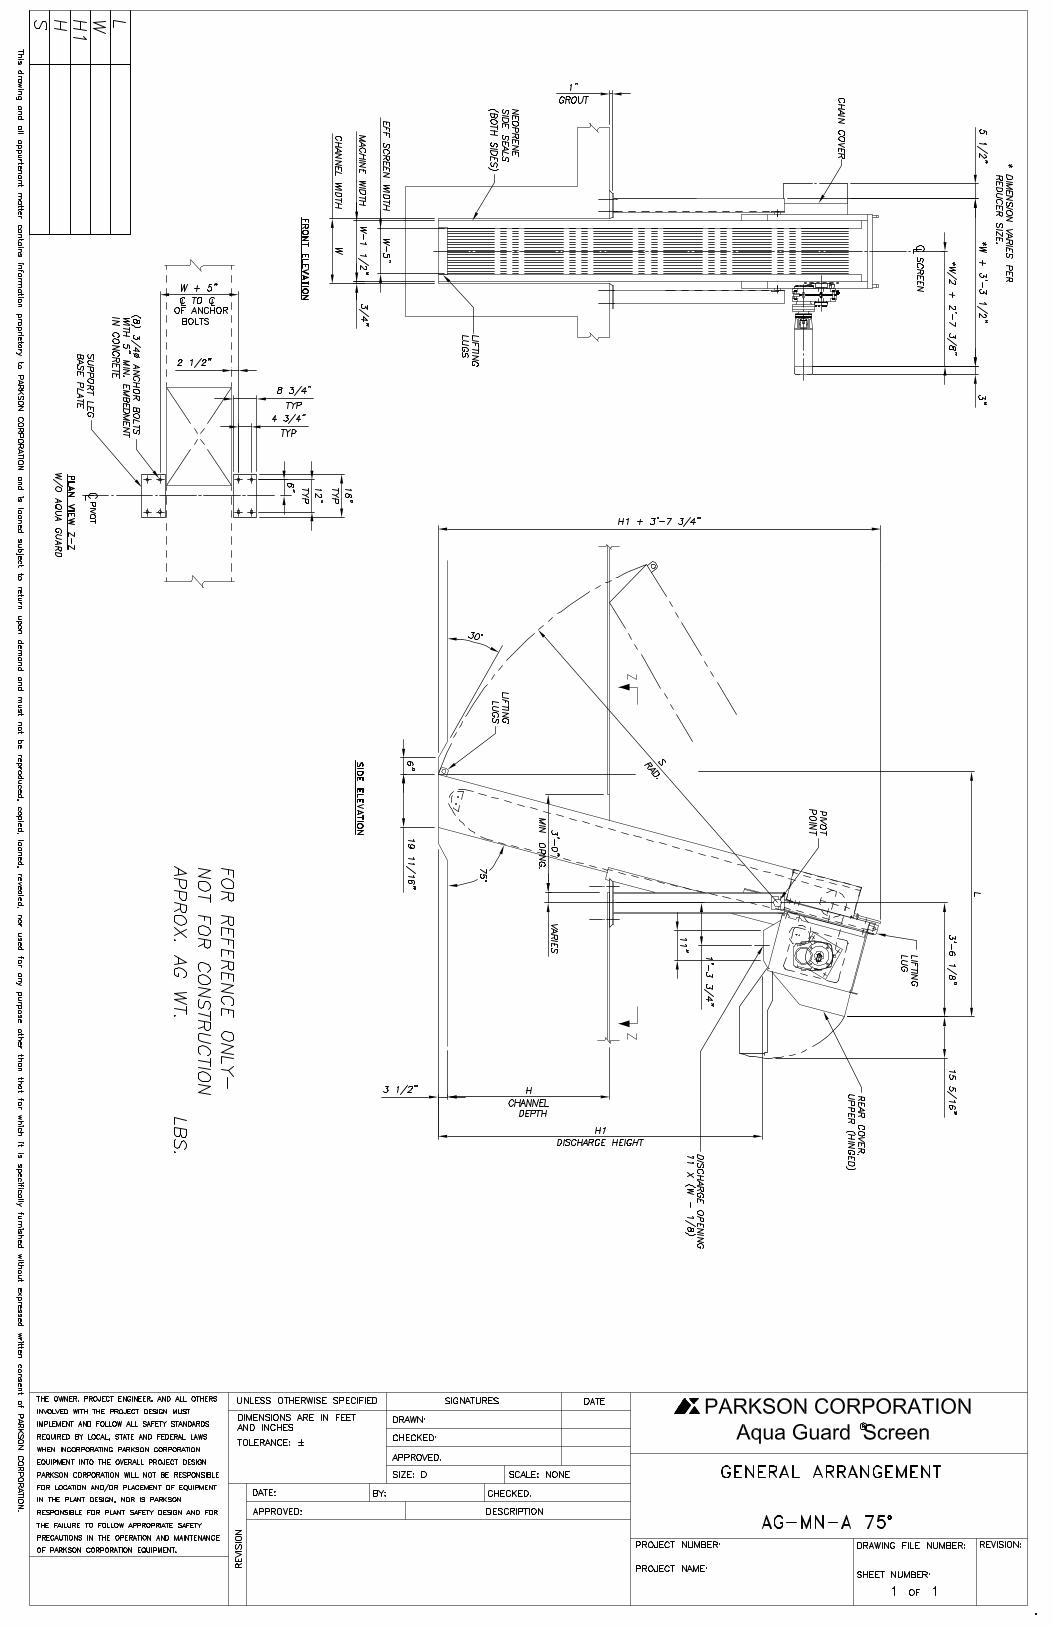

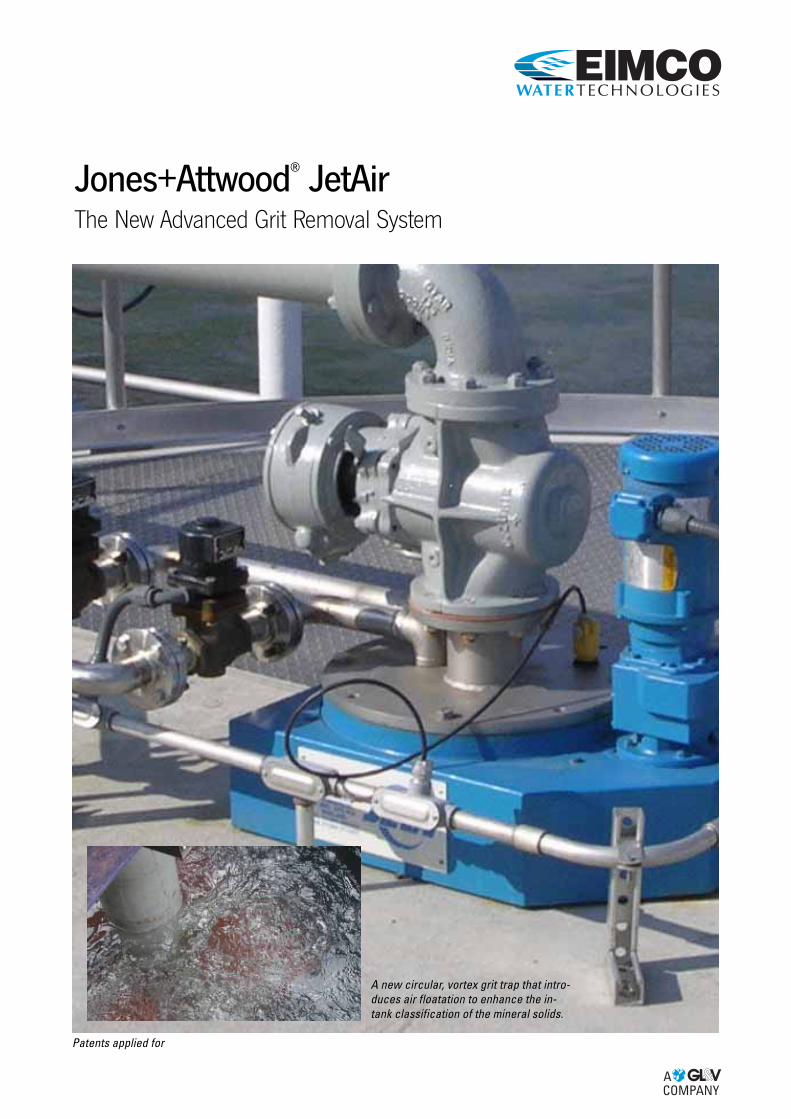
Jones+Attwood®
JetAir
COMPANYA
The New Advanced Grit Removal System
A new circular, vortex grit trap that intro-duces air floatation to enhance the in-tank classification of the mineral solids.
Patents applied for
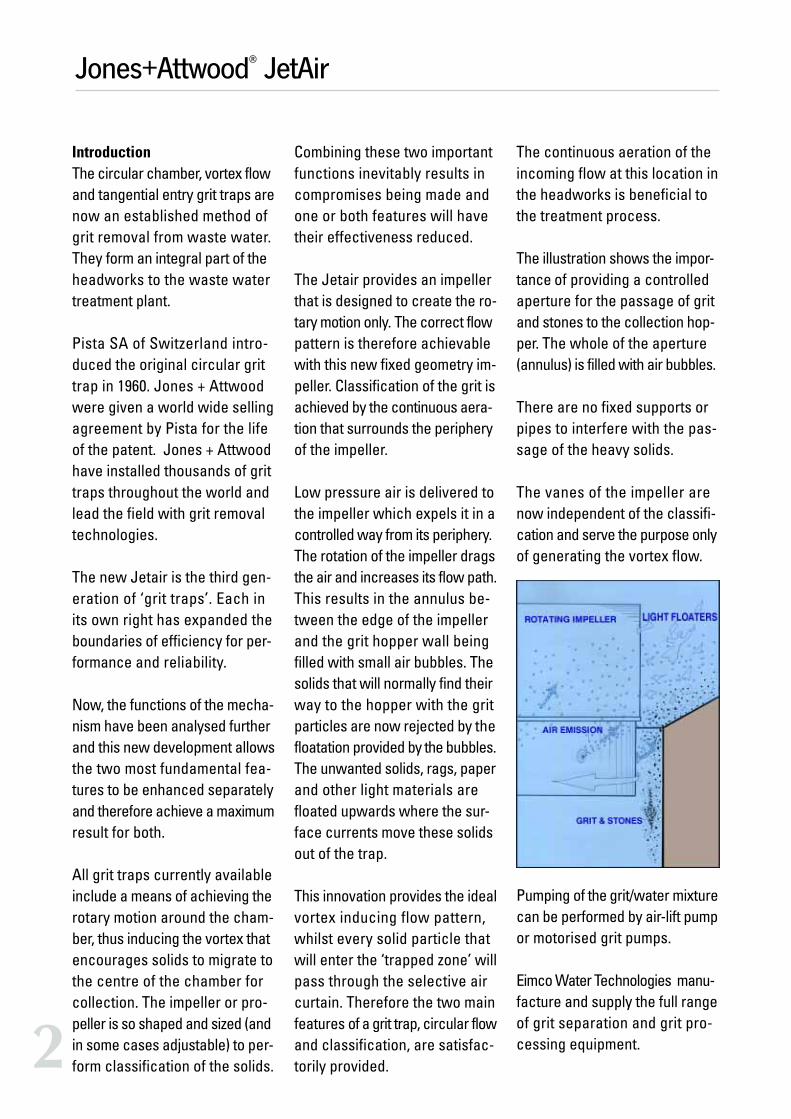
Jones+Attwood®
JetAir
2
IntroductionThe circular chamber, vortex flowand tangential entry grit traps arenow an established method ofgrit removal from waste water.They form an integral part of theheadworks to the waste watertreatment plant.
Pista SA of Switzerland intro-duced the original circular grittrap in 1960. Jones + Attwoodwere given a world wide sellingagreement by Pista for the lifeof the patent. Jones + Attwoodhave installed thousands of grittraps throughout the world andlead the field with grit removaltechnologies.
The new Jetair is the third gen-eration of ‘grit traps’. Each inits own right has expanded theboundaries of efficiency for per-formance and reliability.
Now, the functions of the mecha-nism have been analysed furtherand this new development allowsthe two most fundamental fea-tures to be enhanced separatelyand therefore achieve a maximumresult for both.
All grit traps currently availableinclude a means of achieving therotary motion around the cham-ber, thus inducing the vortex thatencourages solids to migrate tothe centre of the chamber forcollection. The impeller or pro-peller is so shaped and sized (andin some cases adjustable) to per-form classification of the solids.
Combining these two importantfunctions inevitably results incompromises being made andone or both features will havetheir effectiveness reduced.
The Jetair provides an impellerthat is designed to create the ro-tary motion only. The correct flowpattern is therefore achievablewith this new fixed geometry im-peller. Classification of the grit isachieved by the continuous aera-tion that surrounds the peripheryof the impeller.
Low pressure air is delivered tothe impeller which expels it in acontrolled way from its periphery.The rotation of the impeller dragsthe air and increases its flow path.This results in the annulus be-tween the edge of the impellerand the grit hopper wall beingfilled with small air bubbles. Thesolids that will normally find theirway to the hopper with the gritparticles are now rejected by thefloatation provided by the bubbles.The unwanted solids, rags, paperand other light materials arefloated upwards where the sur-face currents move these solidsout of the trap.
This innovation provides the idealvortex inducing flow pattern,whilst every solid particle thatwill enter the ‘trapped zone’ willpass through the selective aircurtain. Therefore the two mainfeatures of a grit trap, circular flowand classification, are satisfac-torily provided.
The continuous aeration of theincoming flow at this location inthe headworks is beneficial tothe treatment process.
The illustration shows the impor-tance of providing a controlledaperture for the passage of gritand stones to the collection hop-per. The whole of the aperture(annulus) is filled with air bubbles.
There are no fixed supports orpipes to interfere with the pas-sage of the heavy solids.
The vanes of the impeller arenow independent of the classifi-cation and serve the purpose onlyof generating the vortex flow.
Pumping of the grit/water mixturecan be performed by air-lift pumpor motorised grit pumps.
Eimco Water Technologies manu-facture and supply the full rangeof grit separation and grit pro-cessing equipment.
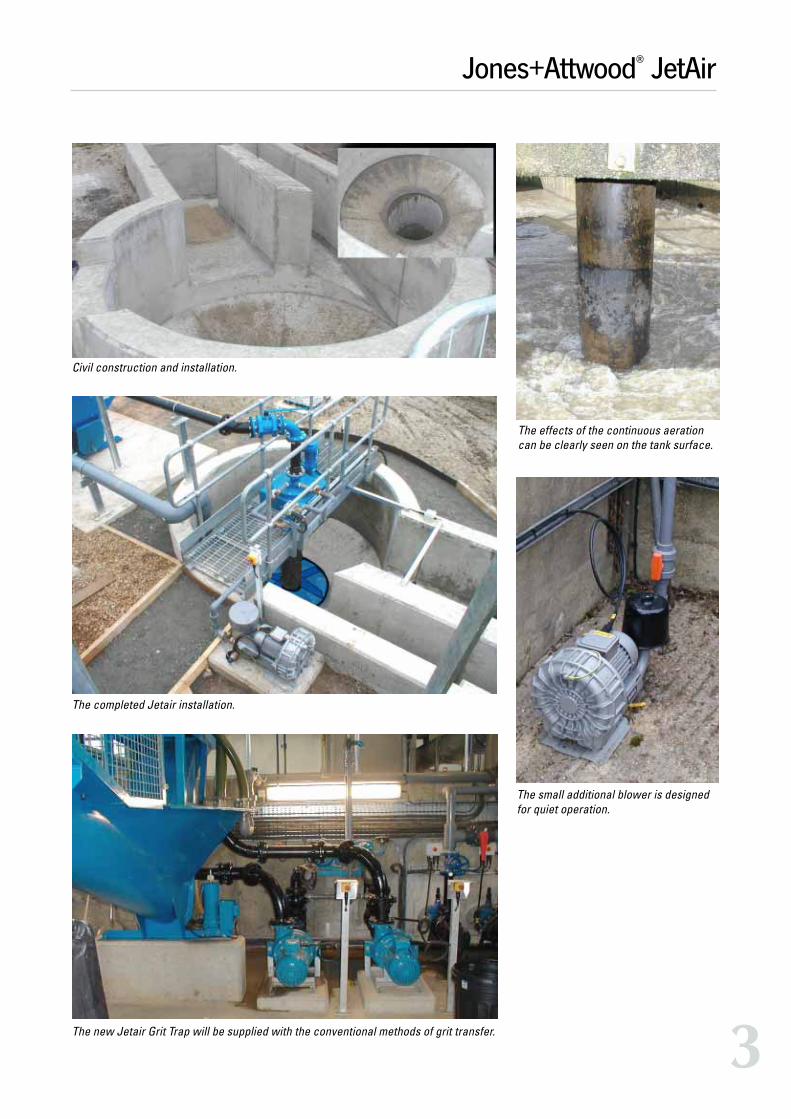
Jones+Attwood®
JetAir
3
Civil construction and installation.
The completed Jetair installation.
The effects of the continuous aerationcan be clearly seen on the tank surface.
The small additional blower is designedfor quiet operation.
The new Jetair Grit Trap will be supplied with the conventional methods of grit transfer.
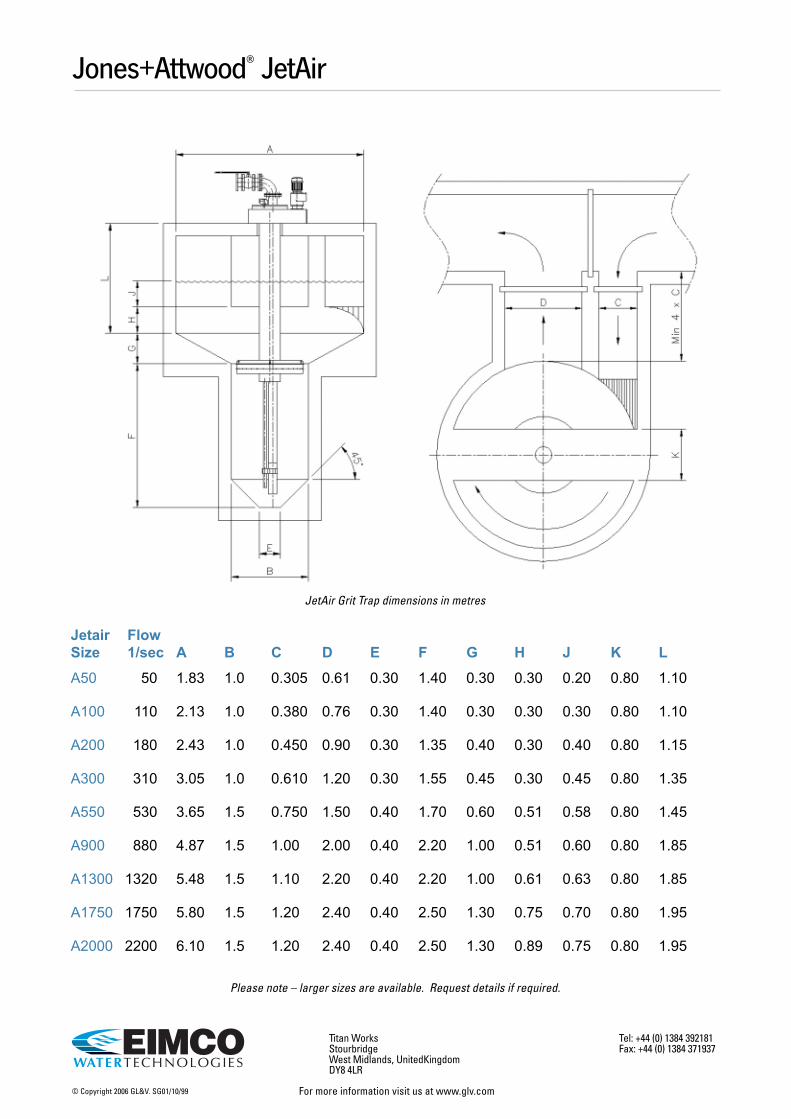
© Copyright 2006 GL&V. SG01/10/99
Jones+Attwood®
JetAir
For more information visit us at www.glv.com
Titan WorksStourbridgeWest Midlands, UnitedKingdomDY8 4LR
Tel: +44 (0) 1384 392181Fax: +44 (0) 1384 371937
Jetair Flow
Size 1/sec A B C D E F G H J K L
A50 50 1.83 1.0 0.305 0.61 0.30 1.40 0.30 0.30 0.20 0.80 1.10
A100 110 2.13 1.0 0.380 0.76 0.30 1.40 0.30 0.30 0.30 0.80 1.10
A200 180 2.43 1.0 0.450 0.90 0.30 1.35 0.40 0.30 0.40 0.80 1.15
A300 310 3.05 1.0 0.610 1.20 0.30 1.55 0.45 0.30 0.45 0.80 1.35
A550 530 3.65 1.5 0.750 1.50 0.40 1.70 0.60 0.51 0.58 0.80 1.45
A900 880 4.87 1.5 1.00 2.00 0.40 2.20 1.00 0.51 0.60 0.80 1.85
A1300 1320 5.48 1.5 1.10 2.20 0.40 2.20 1.00 0.61 0.63 0.80 1.85
A1750 1750 5.80 1.5 1.20 2.40 0.40 2.50 1.30 0.75 0.70 0.80 1.95
A2000 2200 6.10 1.5 1.20 2.40 0.40 2.50 1.30 0.89 0.75 0.80 1.95
Please note – larger sizes are available. Request details if required.
JetAir Grit Trap dimensions in metres
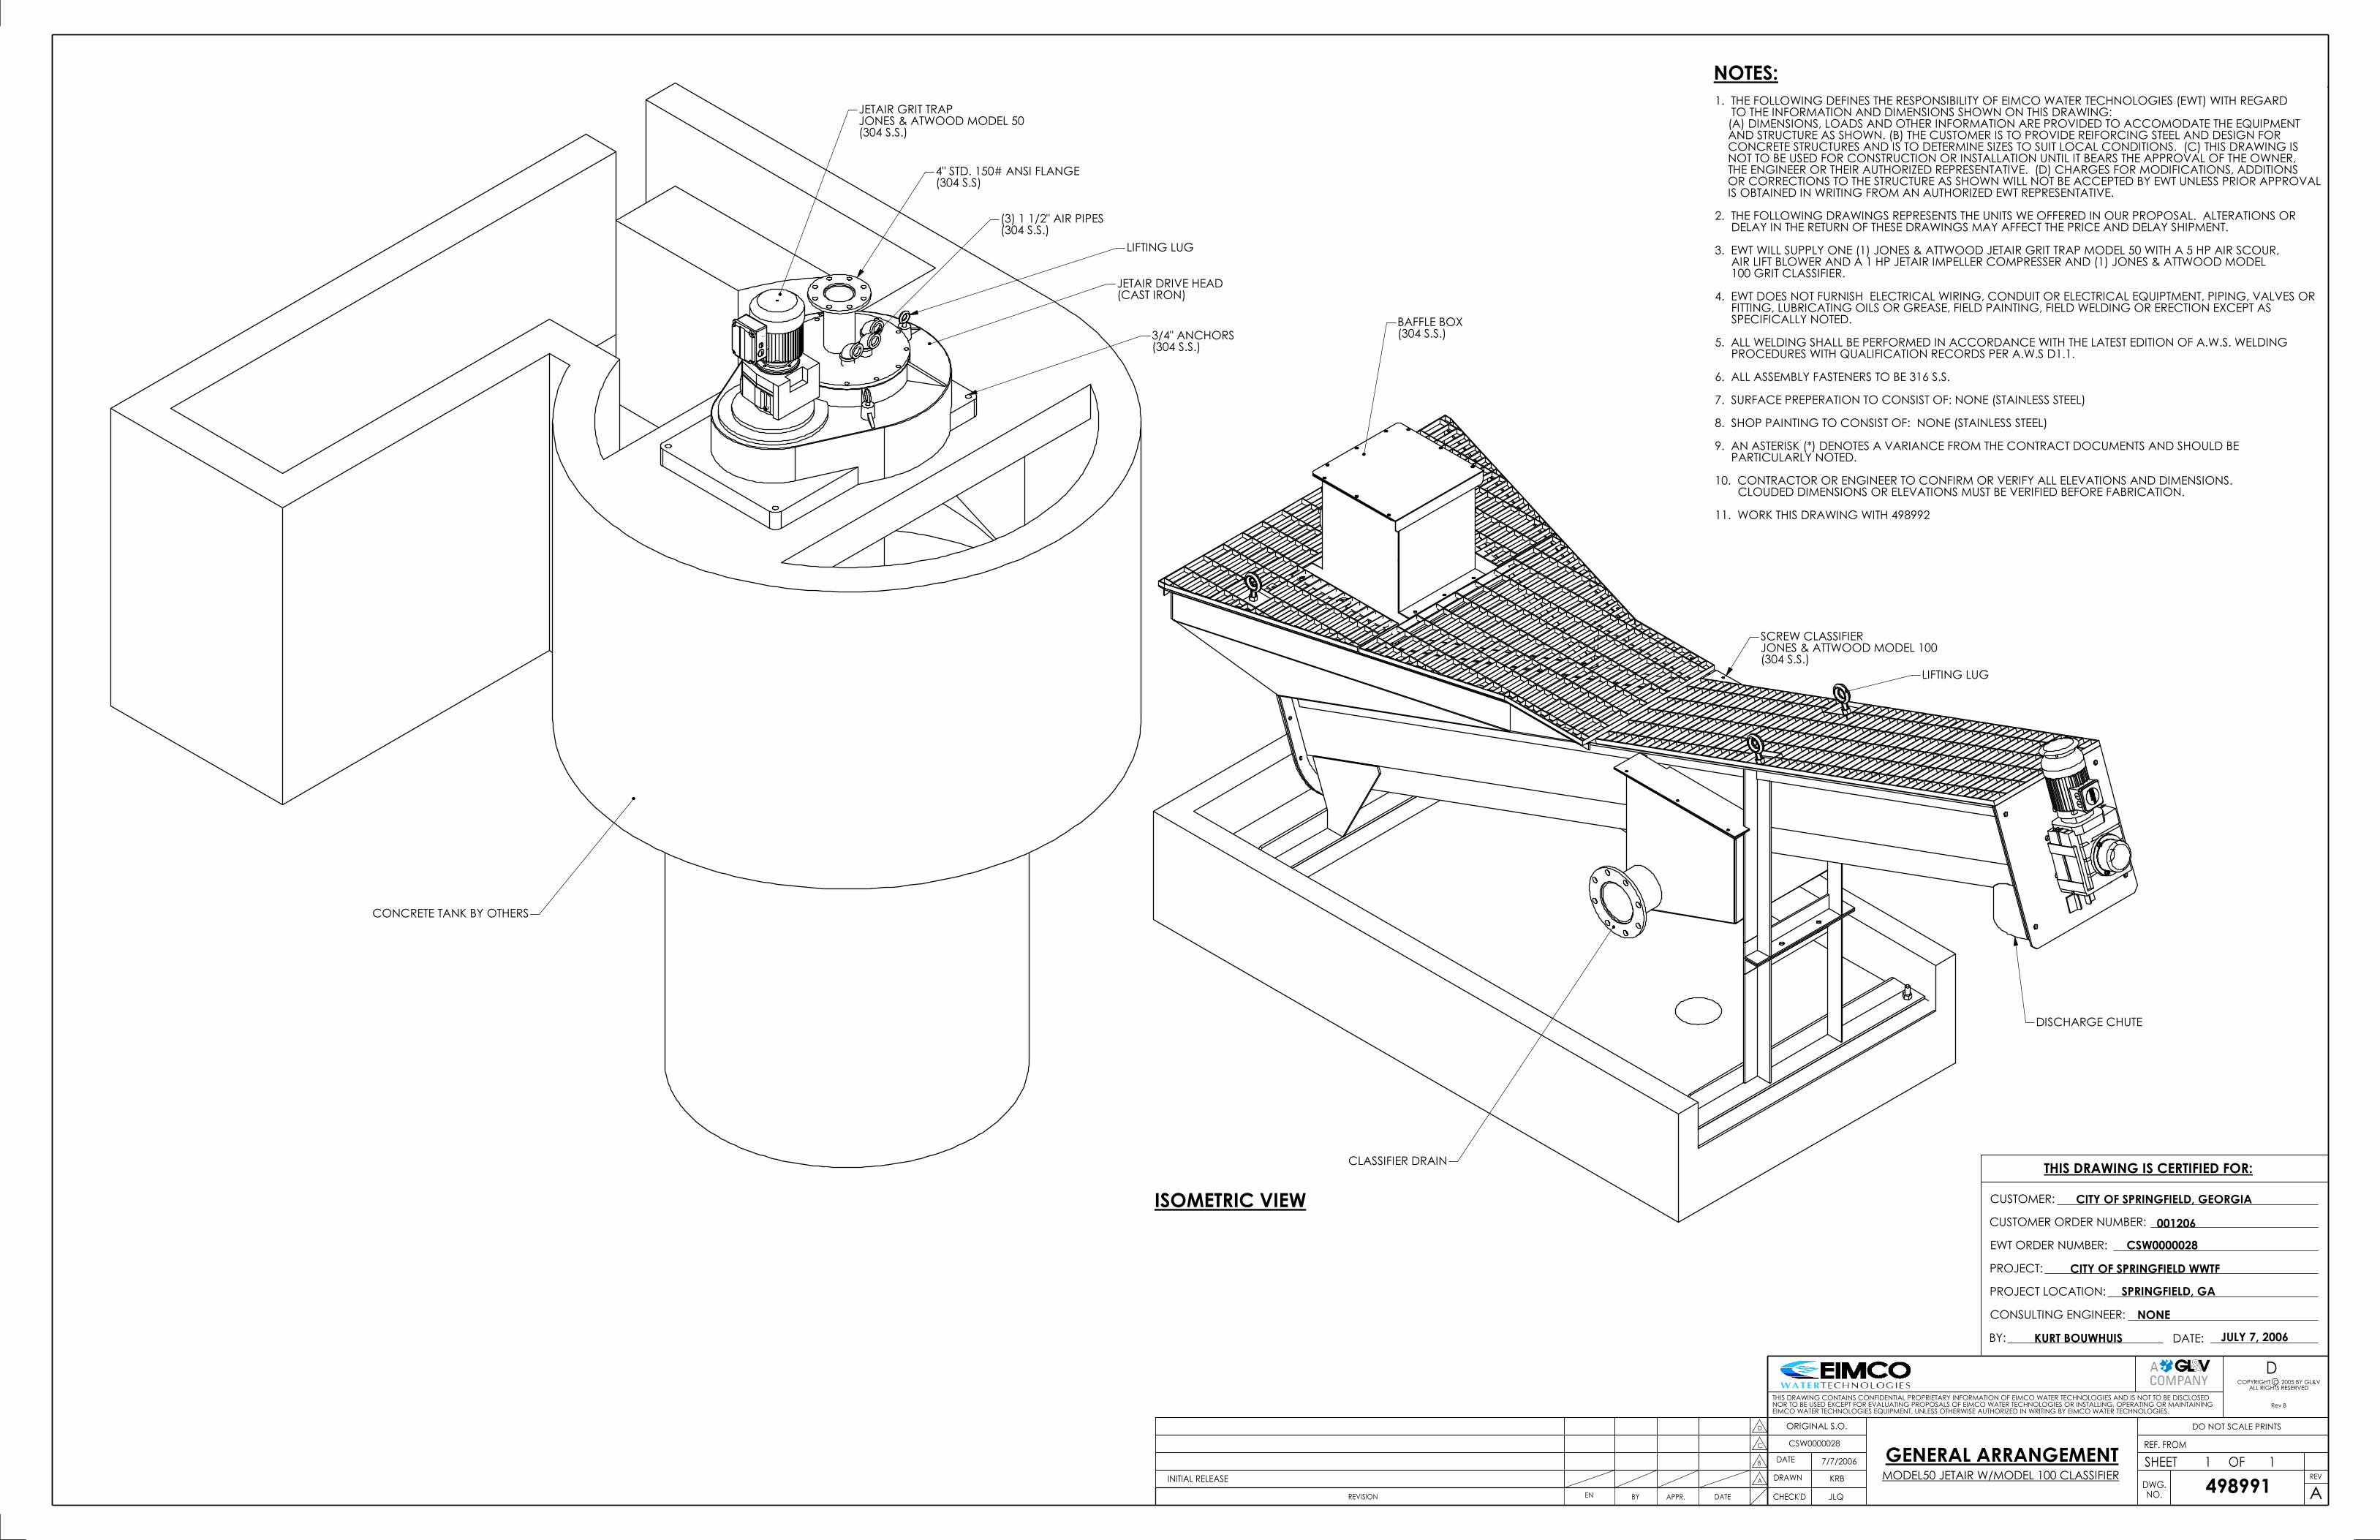
ISOMETRIC VIEW
CONCRETE TANK BY OTHERS
JETAIR DRIVE HEAD(CAST IRON)
4" STD. 150# ANSI FLANGE(304 S.S)
(3) 1 1/2" AIR PIPES(304 S.S.)
3/4" ANCHORS(304 S.S.)
BAFFLE BOX(304 S.S.)
SCREW CLASSIFIERJONES & ATTWOOD MODEL 100(304 S.S.)
JETAIR GRIT TRAPJONES & ATWOOD MODEL 50(304 S.S.)
LIFTING LUG
DISCHARGE CHUTE
CLASSIFIER DRAIN
LIFTING LUG
NOTES:
1. THE FOLLOWING DEFINES THE RESPONSIBILITY OF EIMCO WATER TECHNOLOGIES (EWT) WITH REGARD TO THE INFORMATION AND DIMENSIONS SHOWN ON THIS DRAWING: (A) DIMENSIONS, LOADS AND OTHER INFORMATION ARE PROVIDED TO ACCOMODATE THE EQUIPMENT AND STRUCTURE AS SHOWN. (B) THE CUSTOMER IS TO PROVIDE REIFORCING STEEL AND DESIGN FOR CONCRETE STRUCTURES AND IS TO DETERMINE SIZES TO SUIT LOCAL CONDITIONS. (C) THIS DRAWING IS NOT TO BE USED FOR CONSTRUCTION OR INSTALLATION UNTIL IT BEARS THE APPROVAL OF THE OWNER, THE ENGINEER OR THEIR AUTHORIZED REPRESENTATIVE. (D) CHARGES FOR MODIFICATIONS, ADDITIONS OR CORRECTIONS TO THE STRUCTURE AS SHOWN WILL NOT BE ACCEPTED BY EWT UNLESS PRIOR APPROVAL IS OBTAINED IN WRITING FROM AN AUTHORIZED EWT REPRESENTATIVE.
2. THE FOLLOWING DRAWINGS REPRESENTS THE UNITS WE OFFERED IN OUR PROPOSAL. ALTERATIONS OR DELAY IN THE RETURN OF THESE DRAWINGS MAY AFFECT THE PRICE AND DELAY SHIPMENT.
3. EWT WILL SUPPLY ONE (1) JONES & ATTWOOD JETAIR GRIT TRAP MODEL 50 WITH A 5 HP AIR SCOUR, AIR LIFT BLOWER AND A 1 HP JETAIR IMPELLER COMPRESSER AND (1) JONES & ATTWOOD MODEL 100 GRIT CLASSIFIER.
4. EWT DOES NOT FURNISH ELECTRICAL WIRING, CONDUIT OR ELECTRICAL EQUIPTMENT, PIPING, VALVES OR FITTING, LUBRICATING OILS OR GREASE, FIELD PAINTING, FIELD WELDING OR ERECTION EXCEPT AS SPECIFICALLY NOTED.
5. ALL WELDING SHALL BE PERFORMED IN ACCORDANCE WITH THE LATEST EDITION OF A.W.S. WELDING PROCEDURES WITH QUALIFICATION RECORDS PER A.W.S D1.1.
6. ALL ASSEMBLY FASTENERS TO BE 316 S.S.
7. SURFACE PREPERATION TO CONSIST OF: NONE (STAINLESS STEEL)
8. SHOP PAINTING TO CONSIST OF: NONE (STAINLESS STEEL)
9. AN ASTERISK (*) DENOTES A VARIANCE FROM THE CONTRACT DOCUMENTS AND SHOULD BE PARTICULARLY NOTED.
10. CONTRACTOR OR ENGINEER TO CONFIRM OR VERIFY ALL ELEVATIONS AND DIMENSIONS. CLOUDED DIMENSIONS OR ELEVATIONS MUST BE VERIFIED BEFORE FABRICATION.
11. WORK THIS DRAWING WITH 498992
COPYRIGHT C 2005 BY GL&VALL RIGHTS RESERVED
Rev B
D
A
D
C REF. FROM
DO NOT SCALE PRINTS
B
DATEAPPR.BY
DRAWNDWG.NO.
REV
CHECK'D
DATE SHEET 1 OF 1
ENREVISION
INITIAL RELEASE
7/7/2006
KRB
GENERAL ARRANGEMENT
498991JLQ
THIS DRAWING CONTAINS CONFIDENTIAL PROPRIETARY INFORMATION OF EIMCO WATER TECHNOLOGIES AND IS NOT TO BE DISCLOSEDNOR TO BE USED EXCEPT FOR EVALUATING PROPOSALS OF EIMCO WATER TECHNOLOGIES OR INSTALLING, OPERATING OR MAINTAININGEIMCO WATER TECHNOLOGIES EQUIPMENT, UNLESS OTHERWISE AUTHORIZED IN WRITING BY EIMCO WATER TECHNOLOGIES.
A
THIS DRAWING IS CERTIFIED FOR:
CUSTOMER:
CUSTOMER ORDER NUMBER:
EWT ORDER NUMBER:
PROJECT:
PROJECT LOCATION:
CONSULTING ENGINEER:
BY: DATE:
CITY OF SPRINGFIELD, GEORGIA
001206
CSW0000028
CITY OF SPRINGFIELD WWTF
SPRINGFIELD, GA
NONE
KURT BOUWHUIS JULY 7, 2006
ORIGINAL S.O.
CSW0000028
MODEL50 JETAIR W/MODEL 100 CLASSIFIER

APPENDIX E
REVIEW OF SLUDGE MANAGEMENT OPTIONS

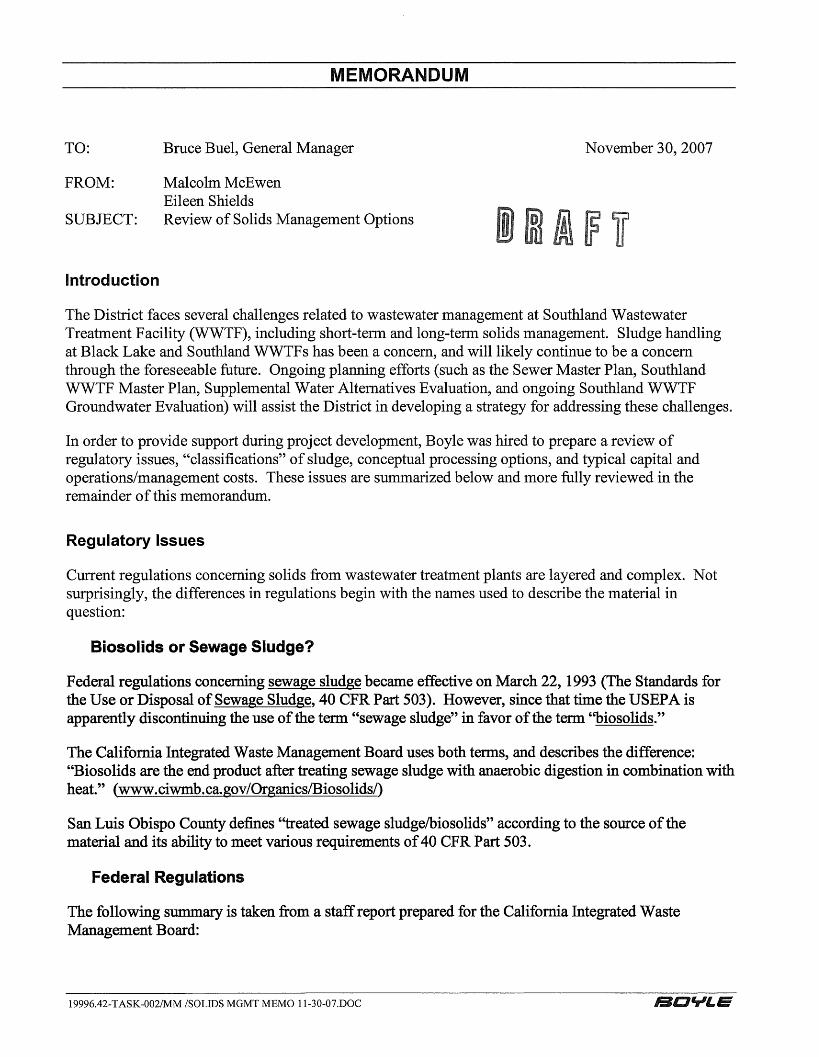
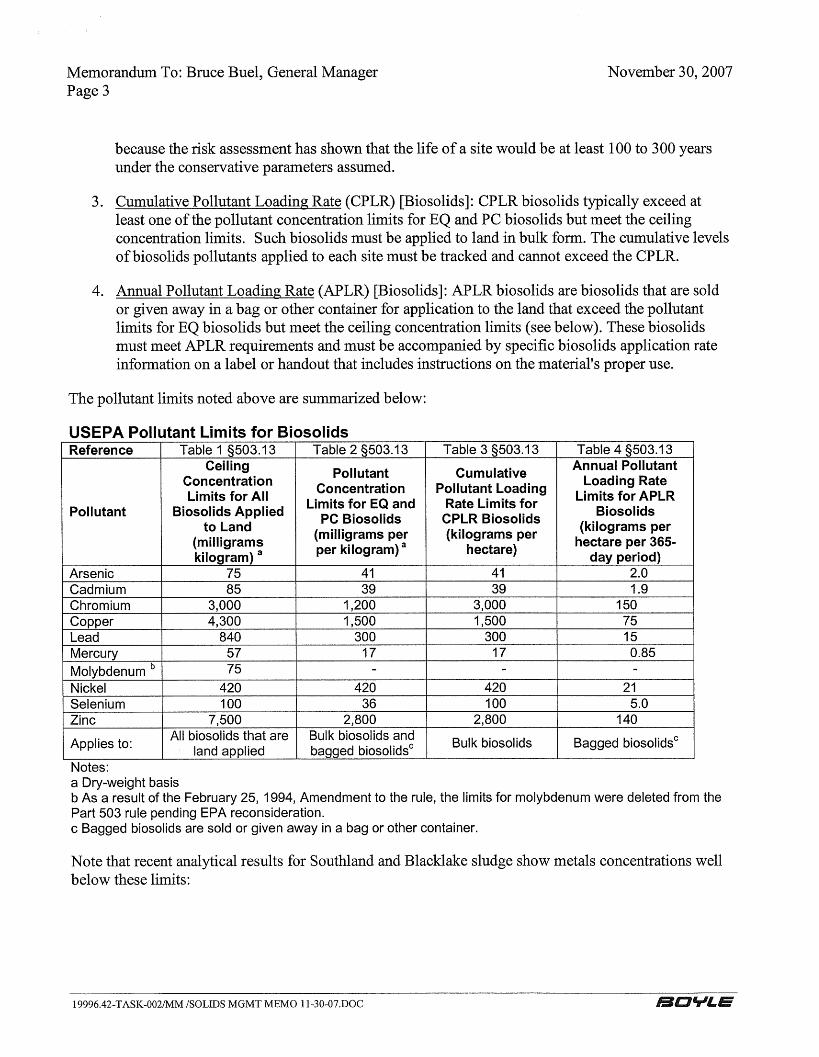
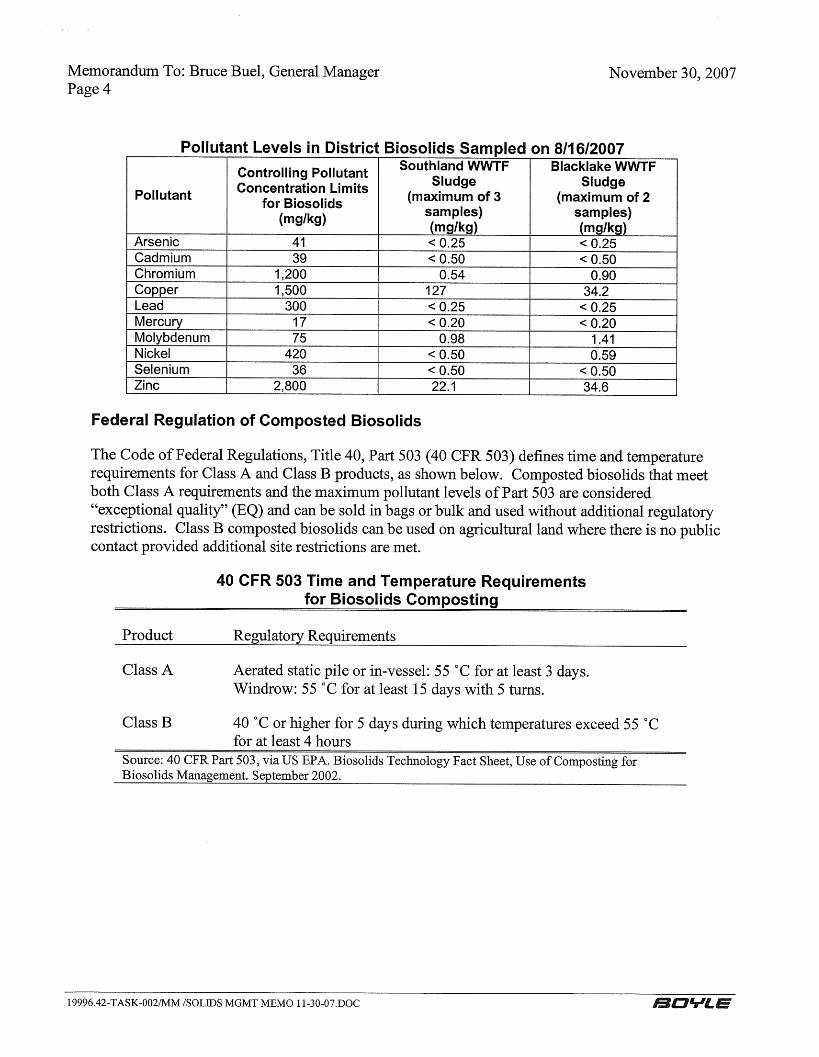
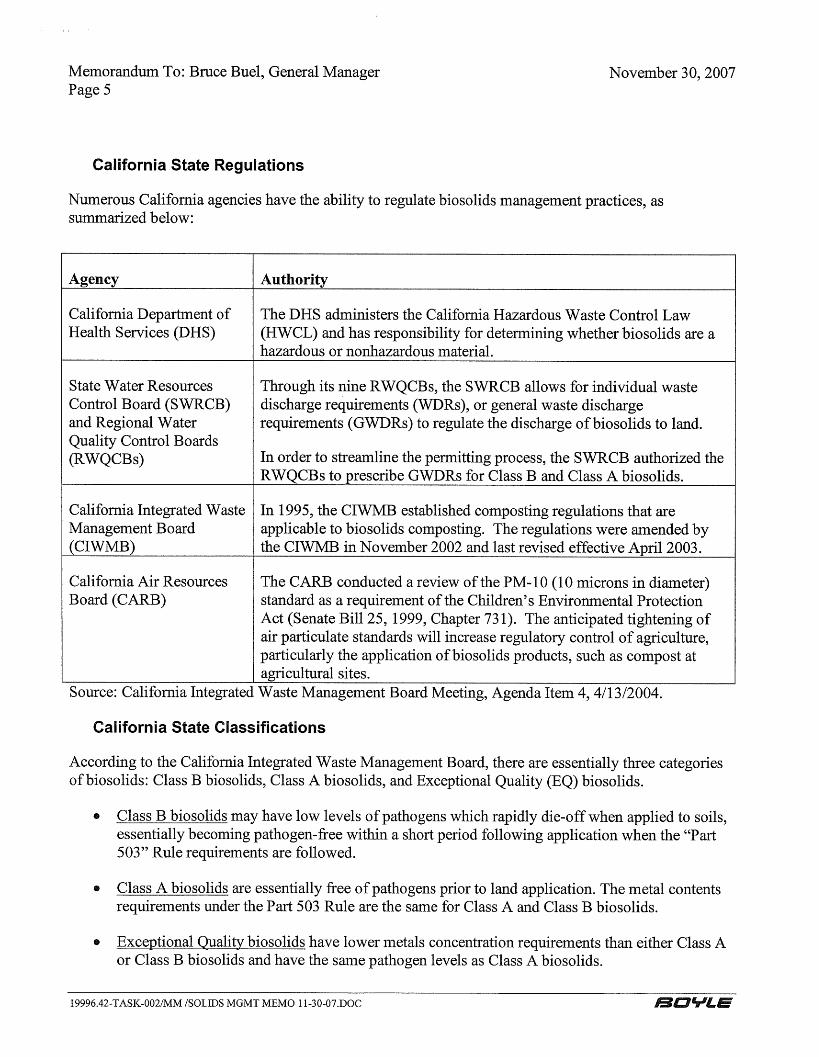
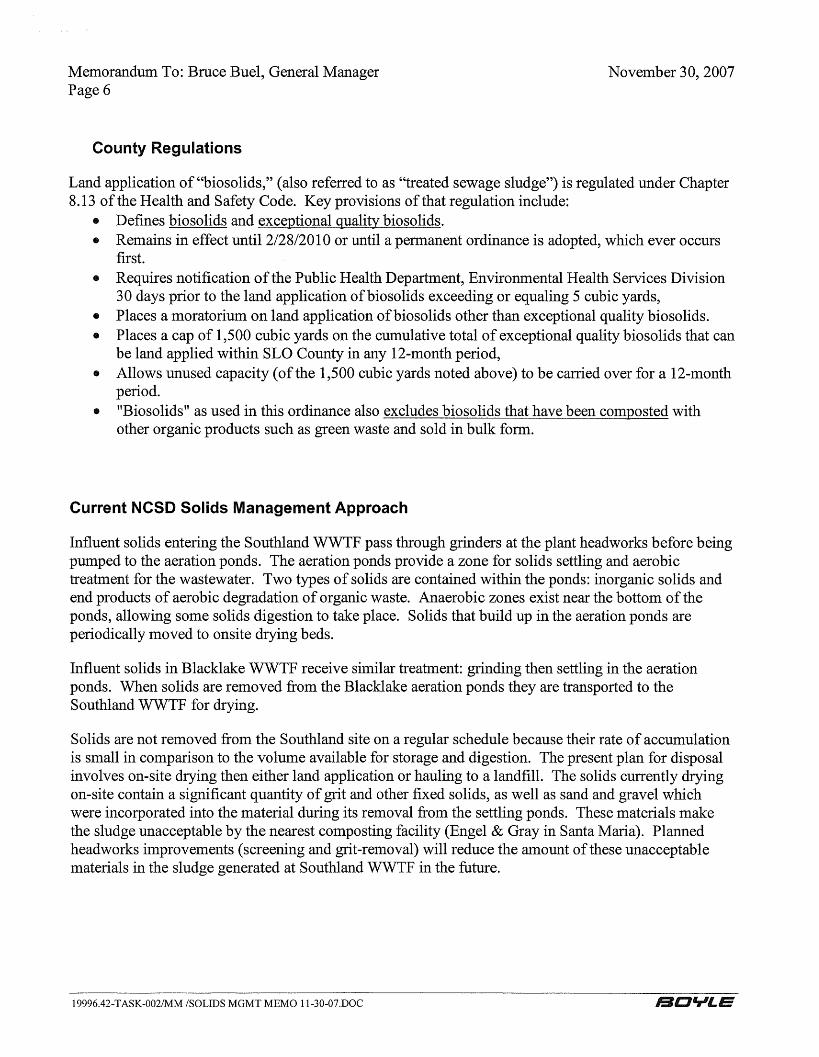
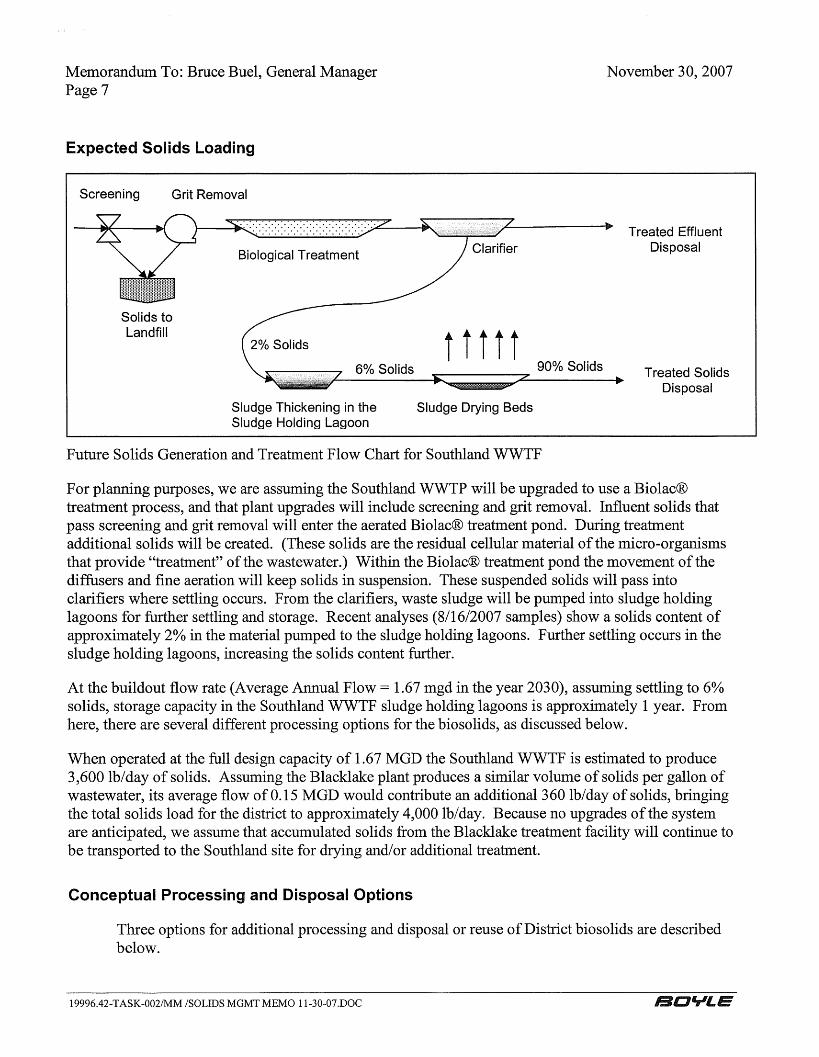
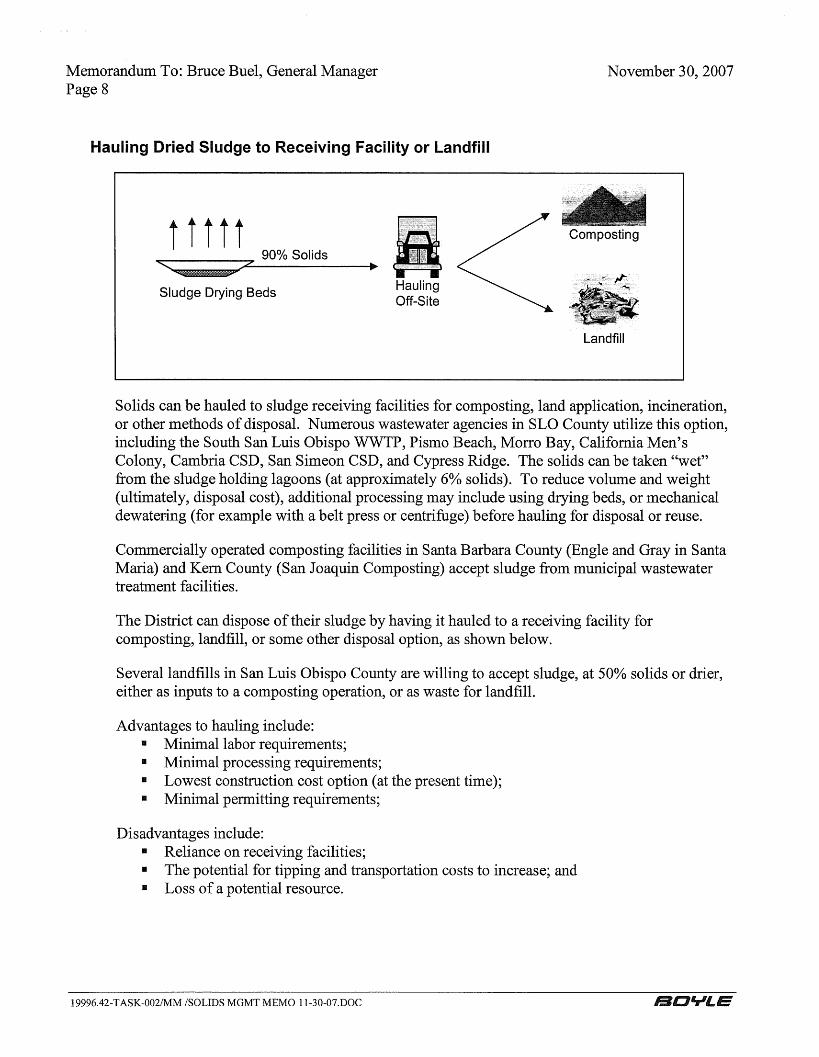
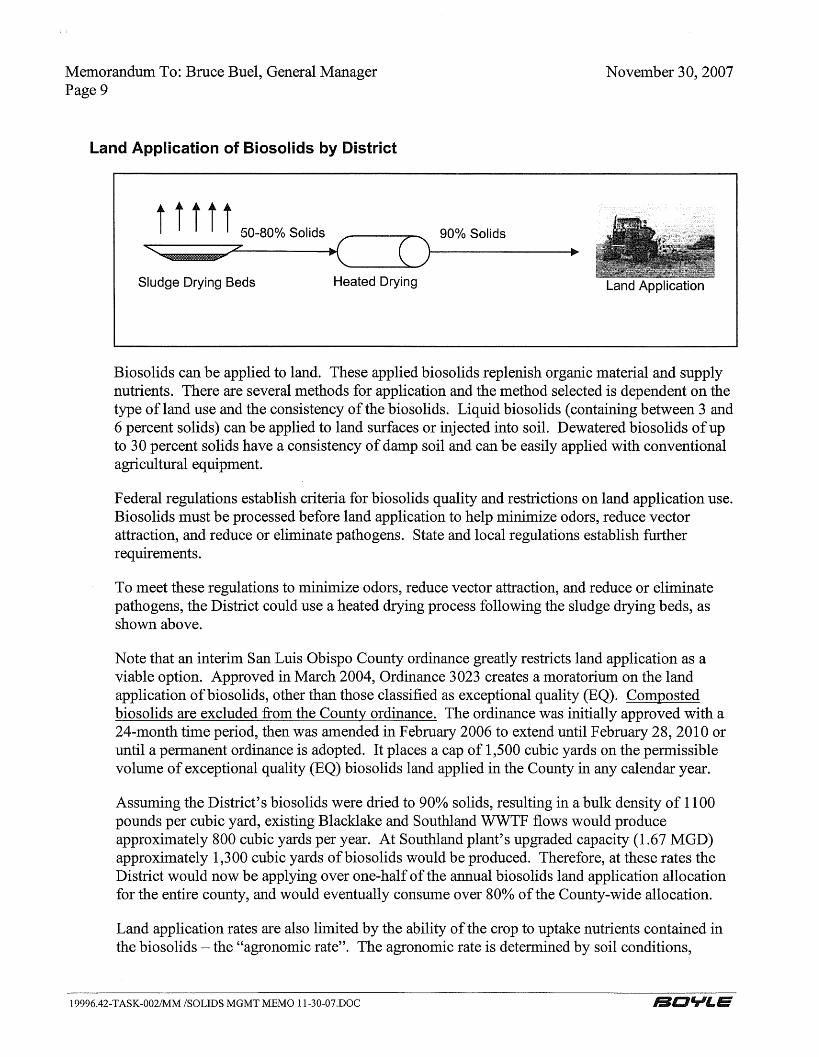
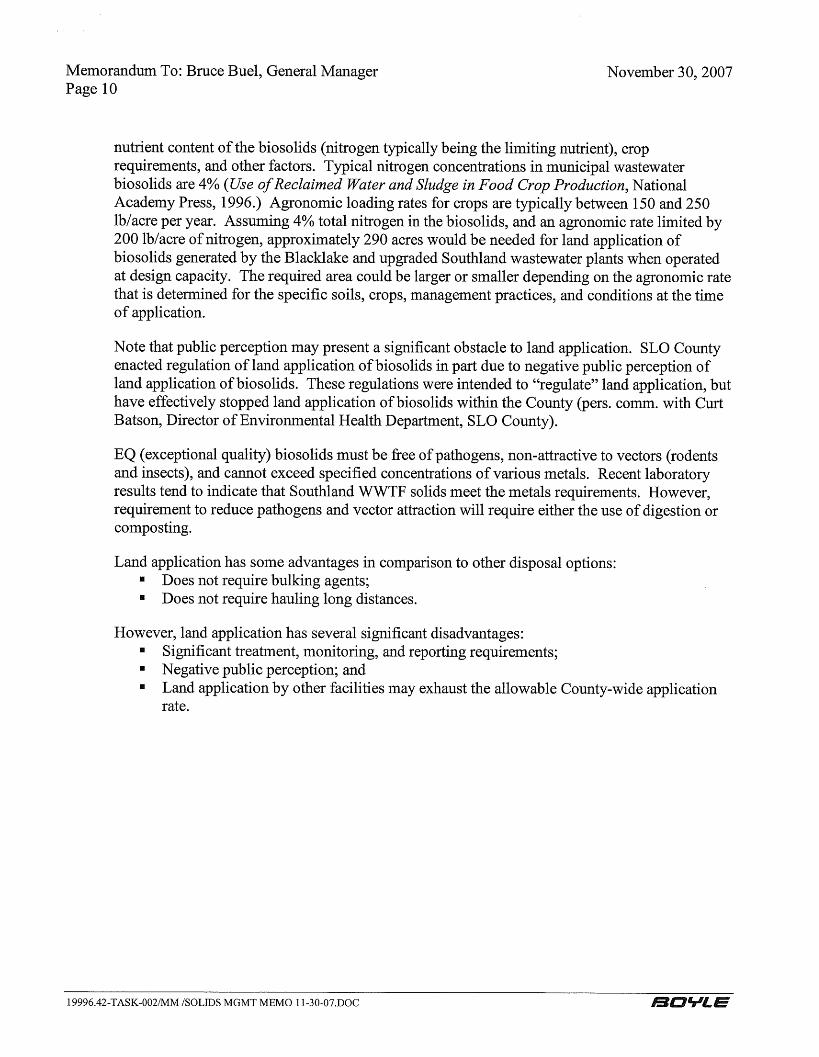
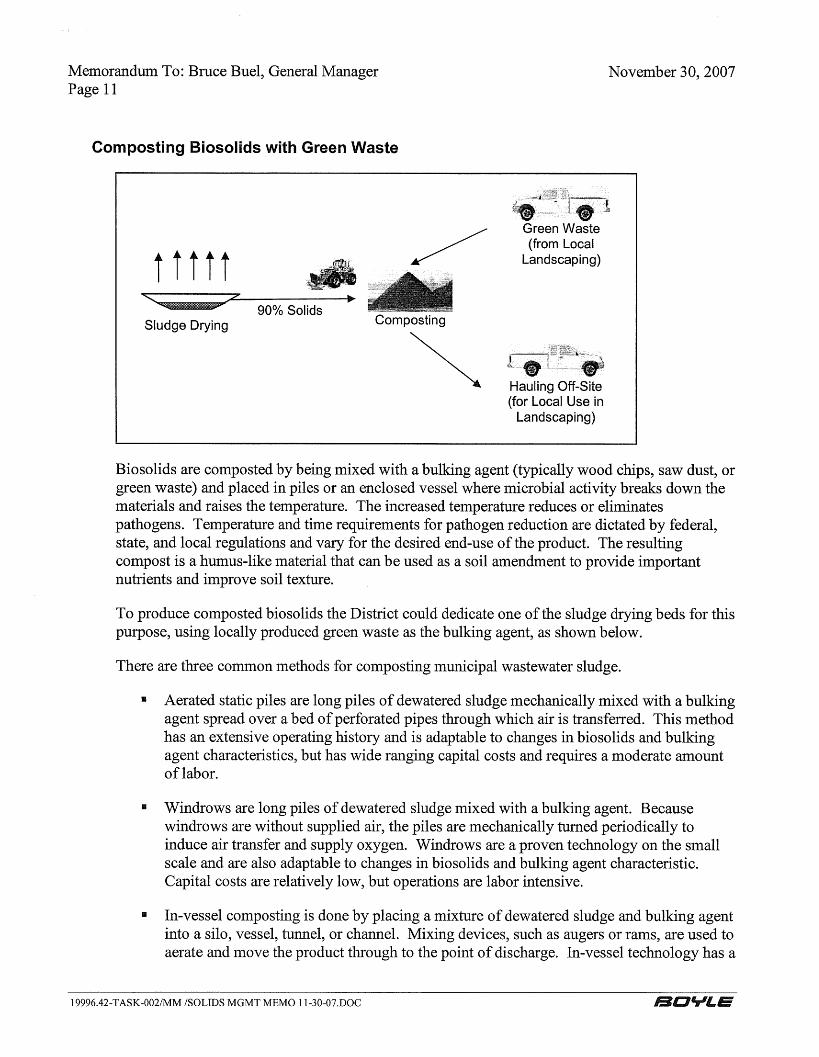

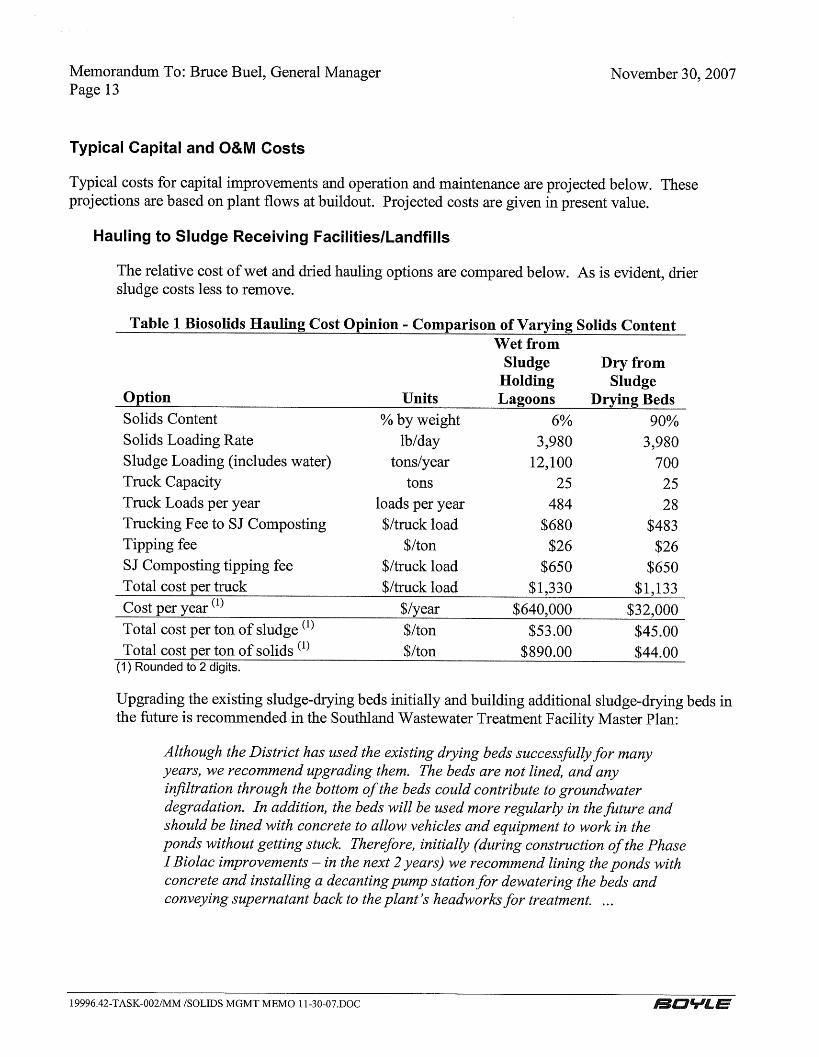
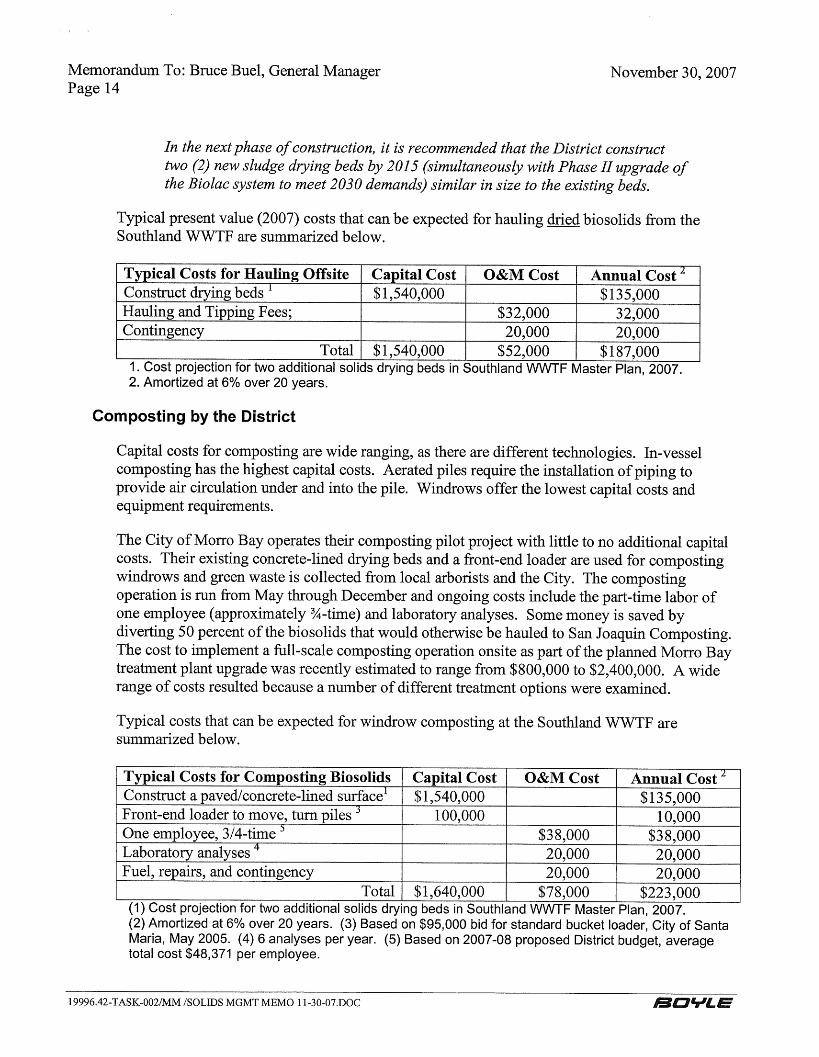
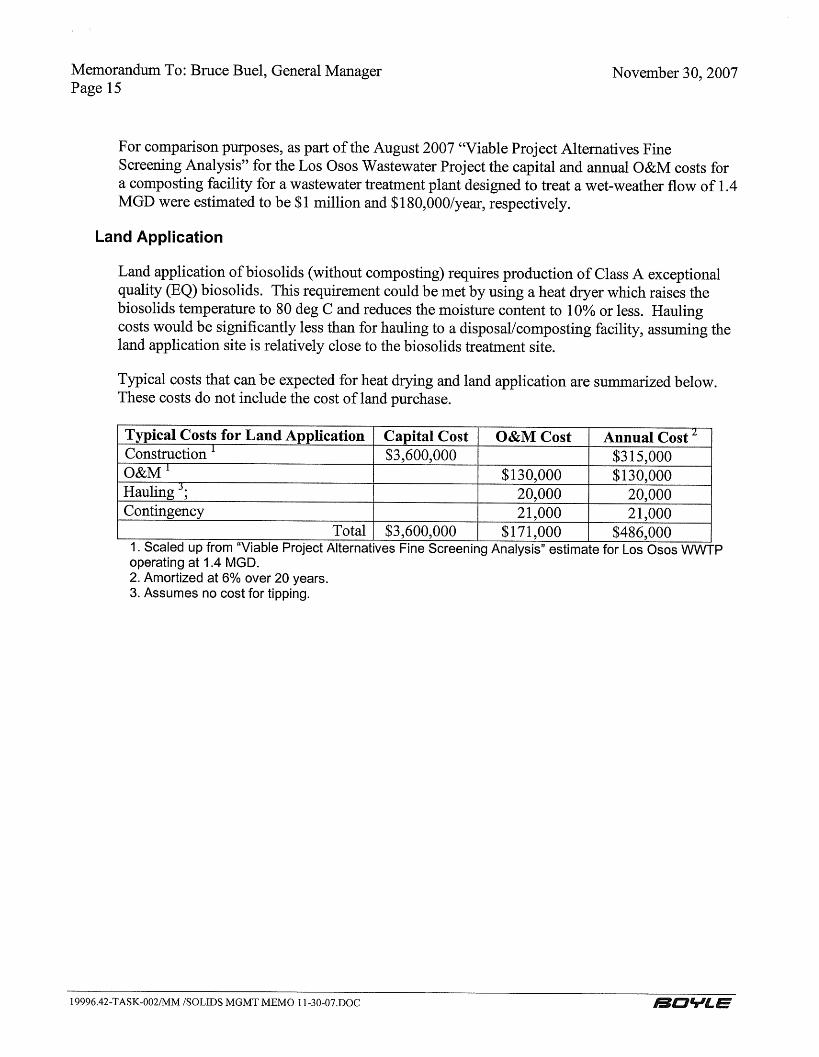
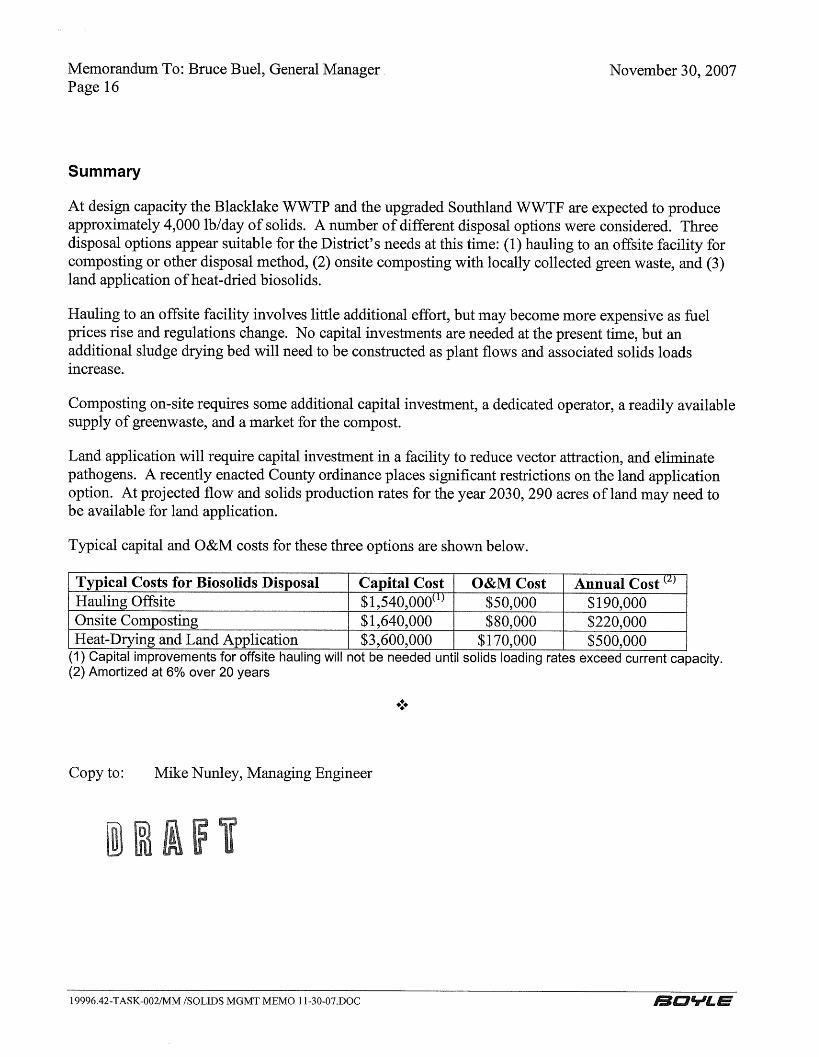

APPENDIX F
SPG SOLAR BUDGETARY PROPOSAL FOR SOUTHLAND WWTF

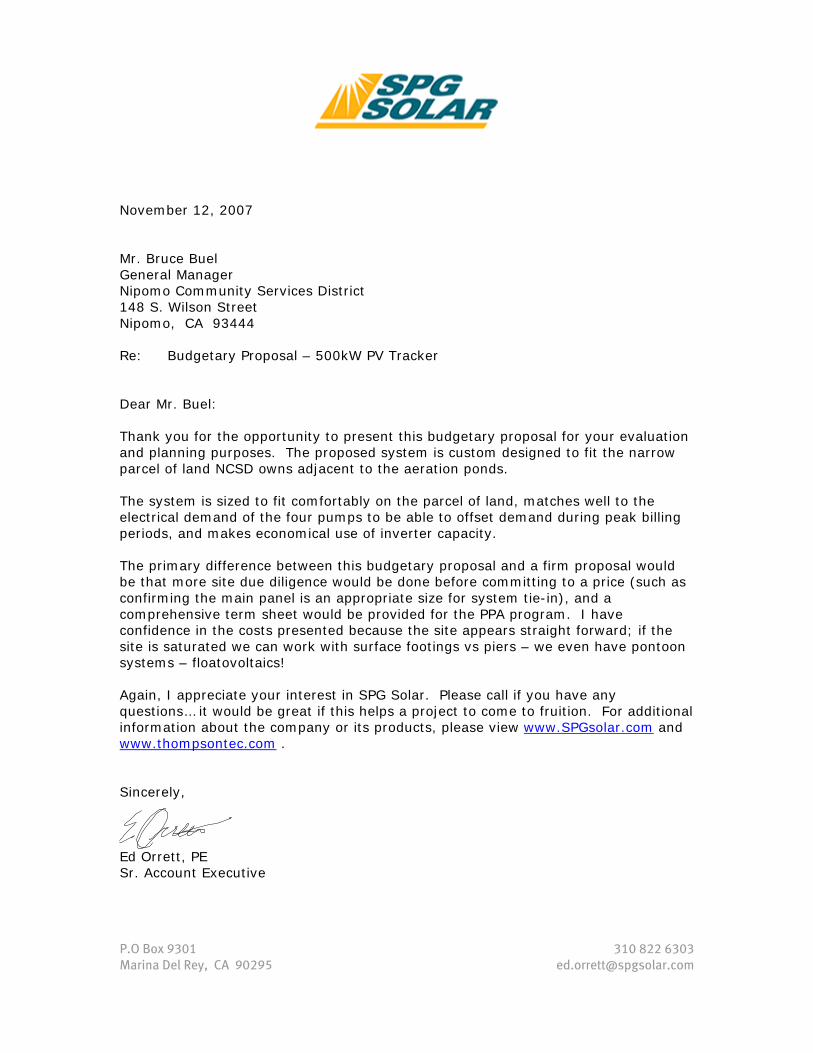
P.O Box 9301 310 822 6303 Marina Del Rey, CA 90295 [email protected]
November 12, 2007 Mr. Bruce Buel General Manager Nipomo Community Services District 148 S. Wilson Street Nipomo, CA 93444 Re: Budgetary Proposal – 500kW PV Tracker Dear Mr. Buel: Thank you for the opportunity to present this budgetary proposal for your evaluation and planning purposes. The proposed system is custom designed to fit the narrow parcel of land NCSD owns adjacent to the aeration ponds. The system is sized to fit comfortably on the parcel of land, matches well to the electrical demand of the four pumps to be able to offset demand during peak billing periods, and makes economical use of inverter capacity. The primary difference between this budgetary proposal and a firm proposal would be that more site due diligence would be done before committing to a price (such as confirming the main panel is an appropriate size for system tie-in), and a comprehensive term sheet would be provided for the PPA program. I have confidence in the costs presented because the site appears straight forward; if the site is saturated we can work with surface footings vs piers – we even have pontoon systems – floatovoltaics! Again, I appreciate your interest in SPG Solar. Please call if you have any questions… it would be great if this helps a project to come to fruition. For additional information about the company or its products, please view www.SPGsolar.com and www.thompsontec.com . Sincerely, Ed Orrett, PE Sr. Account Executive

NCSD Budgetary 500kW – Tracker November 12, 2007
Budgetary Proposal Nipomo Community Services District
500kW PV Tracker Ground-mounted, Single-Axis Tracker PV modules produce the most energy when they are perpendicular to the source of light (the sun). PV systems that follow or “track” the sun across the sky from east to west produce 15-25% more power than a fixed, stationary system. A standard 1MW ground mounted single-axis tracking PV array (the maximum size PV system able to fully utilize State incentives) requires a rectangular, flat ground area of about 5 acres. Typically this would be in 4 individual building blocks with their own electric drive lines. Rows of PV modules run north-south and are connected by a steel drive line that slowly rotates the rows from east to west during the day. An electronic GPS based controller and a small 1.5 hp electric motor turning a stainless steel screw-jack drive each unit. For the Nipomo site we have provided a layout for a 500kW AC CEC tracking array using 3,168 Mitsubishi 185 watt modules and two Xantrex 225 kW inverters to fit within the property owned by NCSD adjacent to the aeration ponds (array layout follows). The 500kW peak output would match closely to the demand of the four 120 HP pumps on the site, therefore being able to offset nearly all PG&E utility power needs to the site during peak summer periods. Although the orientation of the tracking array is 45° off of due East-West, the angle diminishes output only about 4% from ideal. It is possible the design can be finessed to more closely align in an E/W orientation. SPG Solar uses its proprietary single-axis tracking system manufactured by its affiliated company, Thompson Technology Industries (TTI). All mounting posts and drive mechanisms are galvanized steel for a long and reliable life.
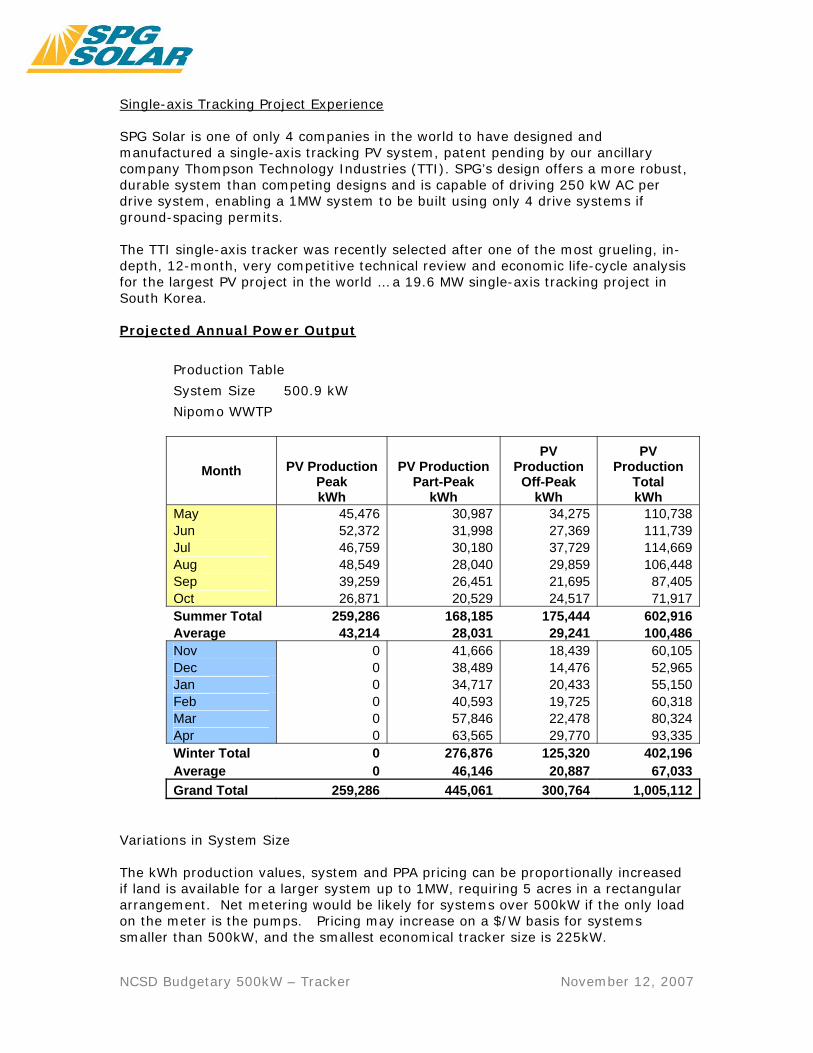
NCSD Budgetary 500kW – Tracker November 12, 2007
Single-axis Tracking Project Experience SPG Solar is one of only 4 companies in the world to have designed and manufactured a single-axis tracking PV system, patent pending by our ancillary company Thompson Technology Industries (TTI). SPG’s design offers a more robust, durable system than competing designs and is capable of driving 250 kW AC per drive system, enabling a 1MW system to be built using only 4 drive systems if ground-spacing permits. The TTI single-axis tracker was recently selected after one of the most grueling, in-depth, 12-month, very competitive technical review and economic life-cycle analysis for the largest PV project in the world … a 19.6 MW single-axis tracking project in South Korea. Projected Annual Power Output Production Table System Size 500.9 kW Nipomo WWTP
Month PV ProductionPeak kWh
PV ProductionPart-Peak
kWh
PV Production
Off-Peak kWh
PV Production
Total kWh
May 45,476 30,987 34,275 110,738 Jun 52,372 31,998 27,369 111,739 Jul 46,759 30,180 37,729 114,669 Aug 48,549 28,040 29,859 106,448 Sep 39,259 26,451 21,695 87,405 Oct 26,871 20,529 24,517 71,917 Summer Total 259,286 168,185 175,444 602,916 Average 43,214 28,031 29,241 100,486 Nov 0 41,666 18,439 60,105 Dec 0 38,489 14,476 52,965 Jan 0 34,717 20,433 55,150 Feb 0 40,593 19,725 60,318 Mar 0 57,846 22,478 80,324 Apr 0 63,565 29,770 93,335 Winter Total 0 276,876 125,320 402,196 Average 0 46,146 20,887 67,033 Grand Total 259,286 445,061 300,764 1,005,112
Variations in System Size The kWh production values, system and PPA pricing can be proportionally increased if land is available for a larger system up to 1MW, requiring 5 acres in a rectangular arrangement. Net metering would be likely for systems over 500kW if the only load on the meter is the pumps. Pricing may increase on a $/W basis for systems smaller than 500kW, and the smallest economical tracker size is 225kW.
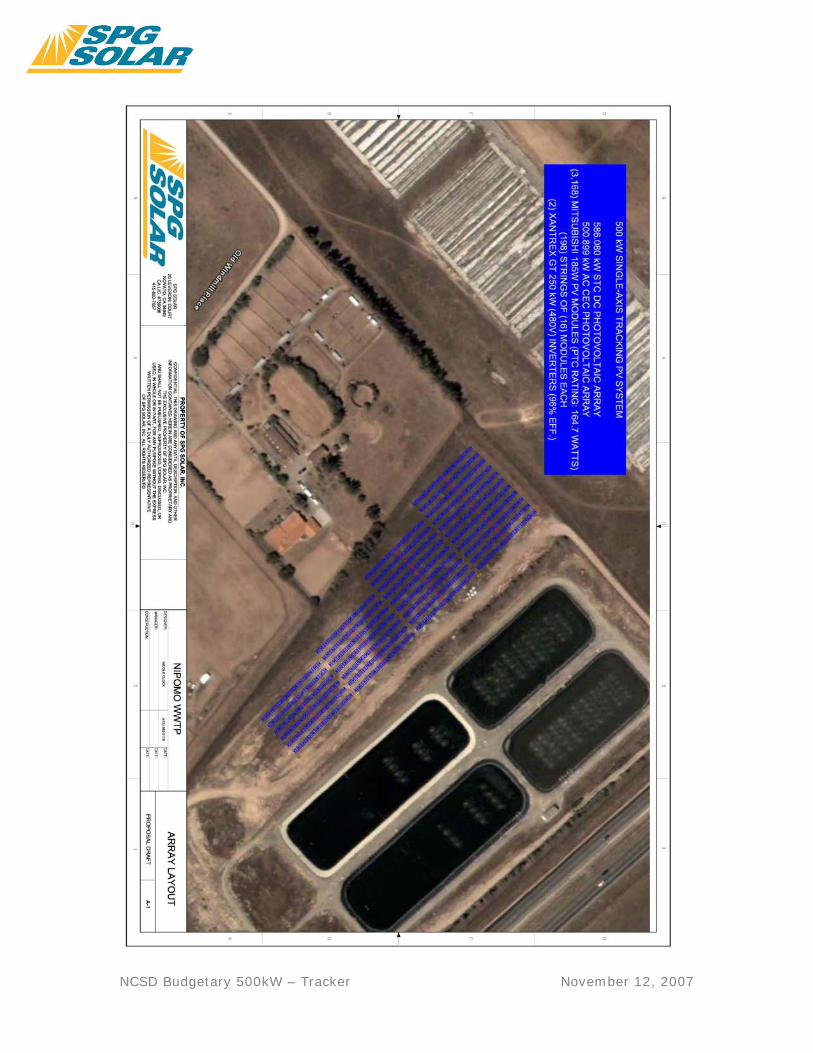
NCSD Budgetary 500kW – Tracker November 12, 2007

NCSD Budgetary 500kW – Tracker November 12, 2007
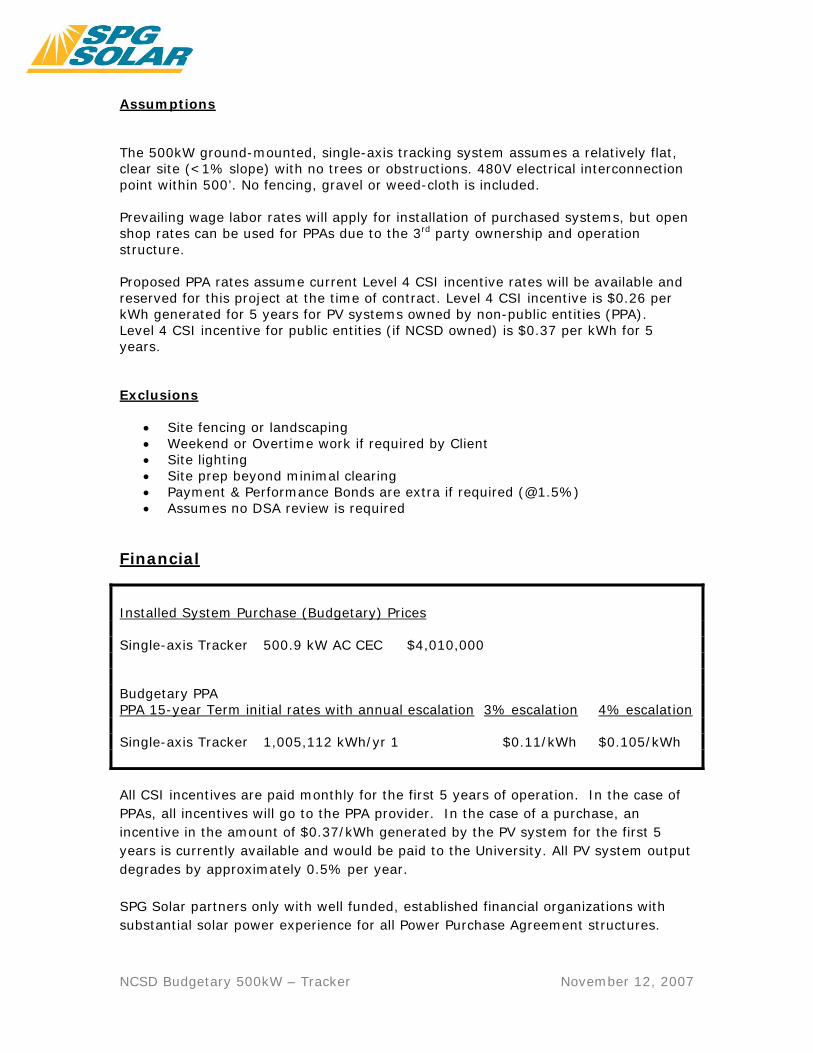
NCSD Budgetary 500kW – Tracker November 12, 2007
Assumptions The 500kW ground-mounted, single-axis tracking system assumes a relatively flat, clear site (<1% slope) with no trees or obstructions. 480V electrical interconnection point within 500’. No fencing, gravel or weed-cloth is included. Prevailing wage labor rates will apply for installation of purchased systems, but open shop rates can be used for PPAs due to the 3rd party ownership and operation structure. Proposed PPA rates assume current Level 4 CSI incentive rates will be available and reserved for this project at the time of contract. Level 4 CSI incentive is $0.26 per kWh generated for 5 years for PV systems owned by non-public entities (PPA). Level 4 CSI incentive for public entities (if NCSD owned) is $0.37 per kWh for 5 years. Exclusions
• Site fencing or landscaping • Weekend or Overtime work if required by Client • Site lighting • Site prep beyond minimal clearing • Payment & Performance Bonds are extra if required (@1.5%) • Assumes no DSA review is required
Financial
Installed System Purchase (Budgetary) Prices Single-axis Tracker 500.9 kW AC CEC $4,010,000 Budgetary PPA PPA 15-year Term initial rates with annual escalation 3% escalation 4% escalation Single-axis Tracker 1,005,112 kWh/yr 1 $0.11/kWh $0.105/kWh
All CSI incentives are paid monthly for the first 5 years of operation. In the case of PPAs, all incentives will go to the PPA provider. In the case of a purchase, an incentive in the amount of $0.37/kWh generated by the PV system for the first 5 years is currently available and would be paid to the University. All PV system output degrades by approximately 0.5% per year. SPG Solar partners only with well funded, established financial organizations with substantial solar power experience for all Power Purchase Agreement structures.
NCSD Budgetary 500kW – Tracker November 12, 2007
PPA Overview A Power Purchase Agreement, or PPA, is a long-term agreement to buy power from a company that produces electricity. A solar PPA provider builds a solar energy facility on the customer's site and maintains and operates the facility for 15 years or longer. Favorable PPA rates are achieved because the PPA provider is able to utilize the substantial tax benefits that are available with solar investments. The solar facility generates reliable, long-term clean energy for use by the customer. Under the terms of a PPA, the provider assumes the risks and responsibilities of ownership when it purchases, operates, and maintains the turn-key facility. After installation, maintenance and operations are typically contracted to SPG Solar, who cleans the solar panels regularly, provides preventative maintenance services, repairs any faults, and monitors the energy production and the system's health and well-being. Their customers just run their businesses as usual, without any of the headaches of owning a power plant. At the end of the PPA term, the facility can be purchased by the customer at fair market value or the PPA can be renewed on favorable terms. The PPA enables the customer to benefit from the use of "green" energy, while still receiving some of the benefits of ownership (lower and/or "hedged" electricity costs, positive public image, etc.) and allows them to spend their capital budget on their core businesses. Project Timeline SPG Solar will commit to starting system engineering within 30 days from the date of contract and submit plans for NCSD review by 60 days from the date of contract. Construction mobilization will occur from 15 – 60 days following approval and permitting of plans depending on which system option is contracted. Once construction starts, the tracker can be operational within 4 months. Warrantees Module power output: 25 years Inverter: 10 years System: 10 years Perf. Monitoring: 10 years PPA Warrantees: For the term of the PPA Training of on-site personnel included for all options. Warranty of CSI Incentives Eligibility SPG Solar warrants that all three systems proposed under Options A, B & C are fully eligible for full CSI incentives as specified in the CSI Handbook.
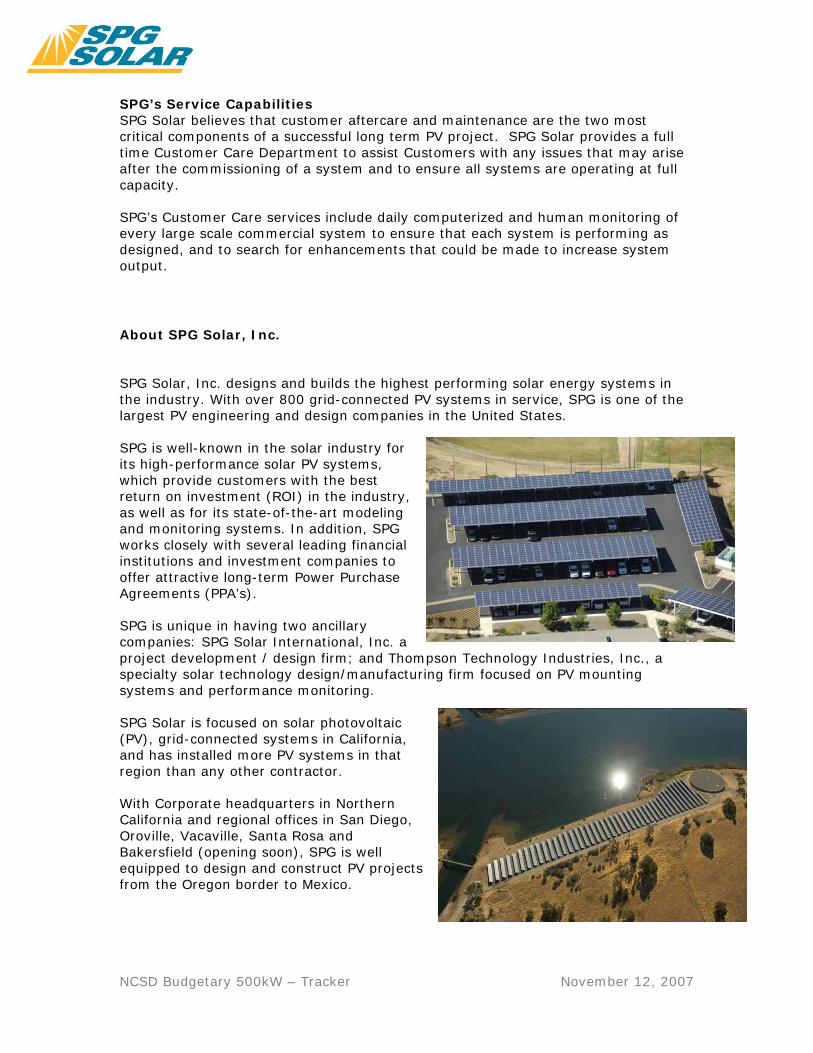
NCSD Budgetary 500kW – Tracker November 12, 2007
SPG’s Service Capabilities SPG Solar believes that customer aftercare and maintenance are the two most critical components of a successful long term PV project. SPG Solar provides a full time Customer Care Department to assist Customers with any issues that may arise after the commissioning of a system and to ensure all systems are operating at full capacity. SPG’s Customer Care services include daily computerized and human monitoring of every large scale commercial system to ensure that each system is performing as designed, and to search for enhancements that could be made to increase system output. About SPG Solar, Inc. SPG Solar, Inc. designs and builds the highest performing solar energy systems in the industry. With over 800 grid-connected PV systems in service, SPG is one of the largest PV engineering and design companies in the United States. SPG is well-known in the solar industry for its high-performance solar PV systems, which provide customers with the best return on investment (ROI) in the industry, as well as for its state-of-the-art modeling and monitoring systems. In addition, SPG works closely with several leading financial institutions and investment companies to offer attractive long-term Power Purchase Agreements (PPA’s). SPG is unique in having two ancillary companies: SPG Solar International, Inc. a project development / design firm; and Thompson Technology Industries, Inc., a specialty solar technology design/manufacturing firm focused on PV mounting systems and performance monitoring. SPG Solar is focused on solar photovoltaic (PV), grid-connected systems in California, and has installed more PV systems in that region than any other contractor. With Corporate headquarters in Northern California and regional offices in San Diego, Oroville, Vacaville, Santa Rosa and Bakersfield (opening soon), SPG is well equipped to design and construct PV projects from the Oregon border to Mexico.
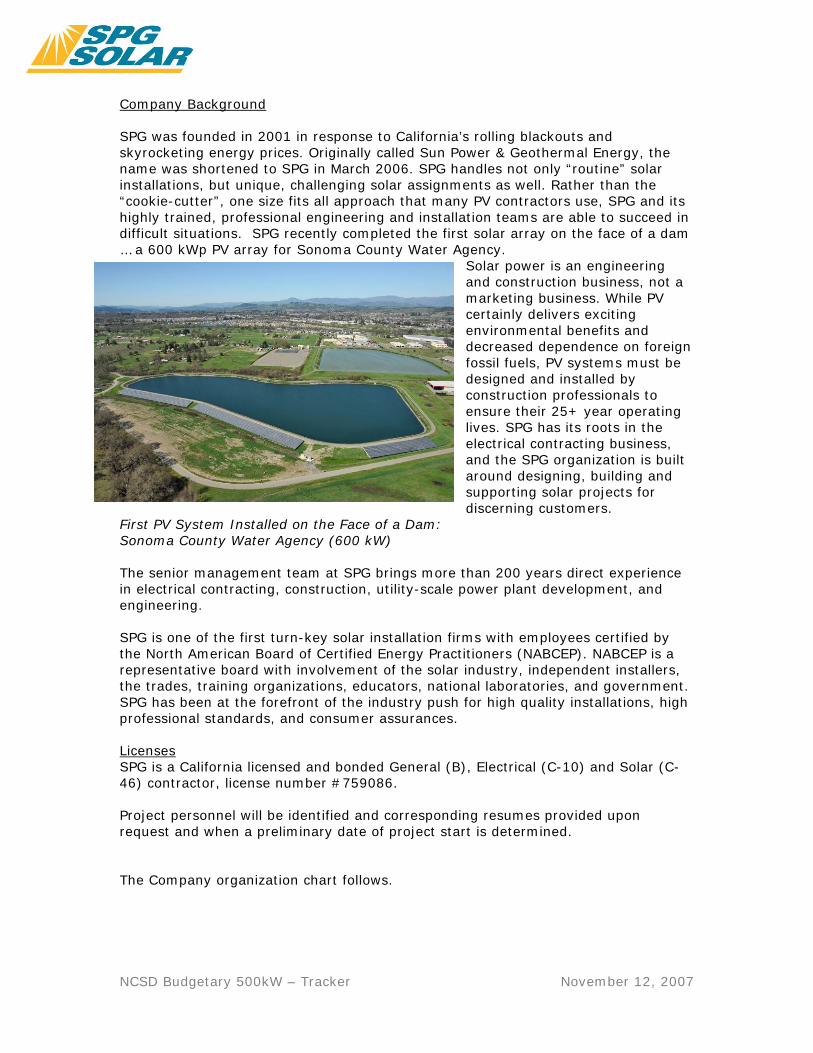
NCSD Budgetary 500kW – Tracker November 12, 2007
Company Background SPG was founded in 2001 in response to California’s rolling blackouts and skyrocketing energy prices. Originally called Sun Power & Geothermal Energy, the name was shortened to SPG in March 2006. SPG handles not only “routine” solar installations, but unique, challenging solar assignments as well. Rather than the “cookie-cutter”, one size fits all approach that many PV contractors use, SPG and its highly trained, professional engineering and installation teams are able to succeed in difficult situations. SPG recently completed the first solar array on the face of a dam … a 600 kWp PV array for Sonoma County Water Agency.
Solar power is an engineering and construction business, not a marketing business. While PV certainly delivers exciting environmental benefits and decreased dependence on foreign fossil fuels, PV systems must be designed and installed by construction professionals to ensure their 25+ year operating lives. SPG has its roots in the electrical contracting business, and the SPG organization is built around designing, building and supporting solar projects for discerning customers.
First PV System Installed on the Face of a Dam: Sonoma County Water Agency (600 kW) The senior management team at SPG brings more than 200 years direct experience in electrical contracting, construction, utility-scale power plant development, and engineering. SPG is one of the first turn-key solar installation firms with employees certified by the North American Board of Certified Energy Practitioners (NABCEP). NABCEP is a representative board with involvement of the solar industry, independent installers, the trades, training organizations, educators, national laboratories, and government. SPG has been at the forefront of the industry push for high quality installations, high professional standards, and consumer assurances. Licenses SPG is a California licensed and bonded General (B), Electrical (C-10) and Solar (C-46) contractor, license number #759086. Project personnel will be identified and corresponding resumes provided upon request and when a preliminary date of project start is determined. The Company organization chart follows.
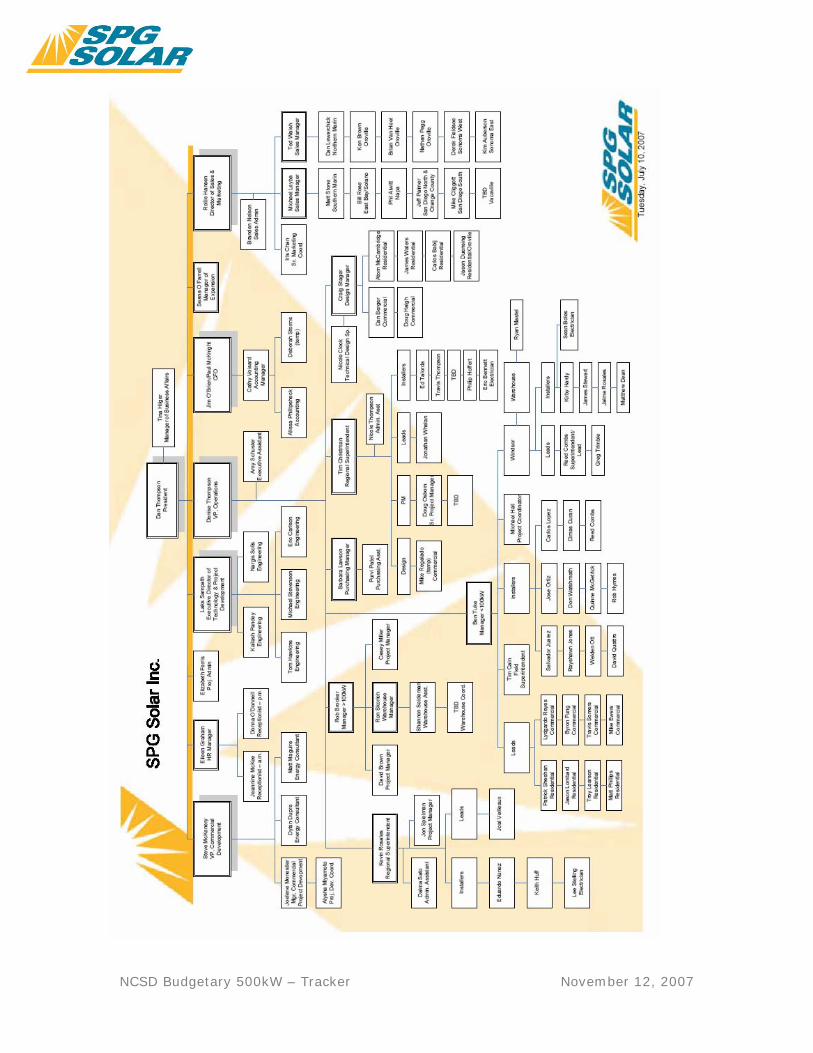
NCSD Budgetary 500kW – Tracker November 12, 2007

NCSD Budgetary 500kW – Tracker November 12, 2007
References
Vallecitos Water District Dale Mason, General Manager 201 Vallecitos De Oro San Marcos, CA 92069 (760) 744-0460 375 kW SolarPort PV System Butte College Mike Miller, Director Facilities Planning 3536 Butte Campus Drive Oroville, CA 95965 (530) 895-2298 1.06 Megawatt PV System Sewerage Commission Oroville Region Ray Sousa, Superintendent 2880 South Fifth Avenue Oroville, CA 95965 (530) 534-0353 625 kW PV System South Feather Water & Power Michael Glaze, General Manager 2310 Oroville Quincy Hwy. Oroville, CA 95965 (530) 533-4578 566 kW PV System Monterey Ridge Elementary School Gould Electric: Bob Taeckens 17117 4 S Ranch Parkway San Diego, CA 92127 (858) 748-2474 200 kW PV System
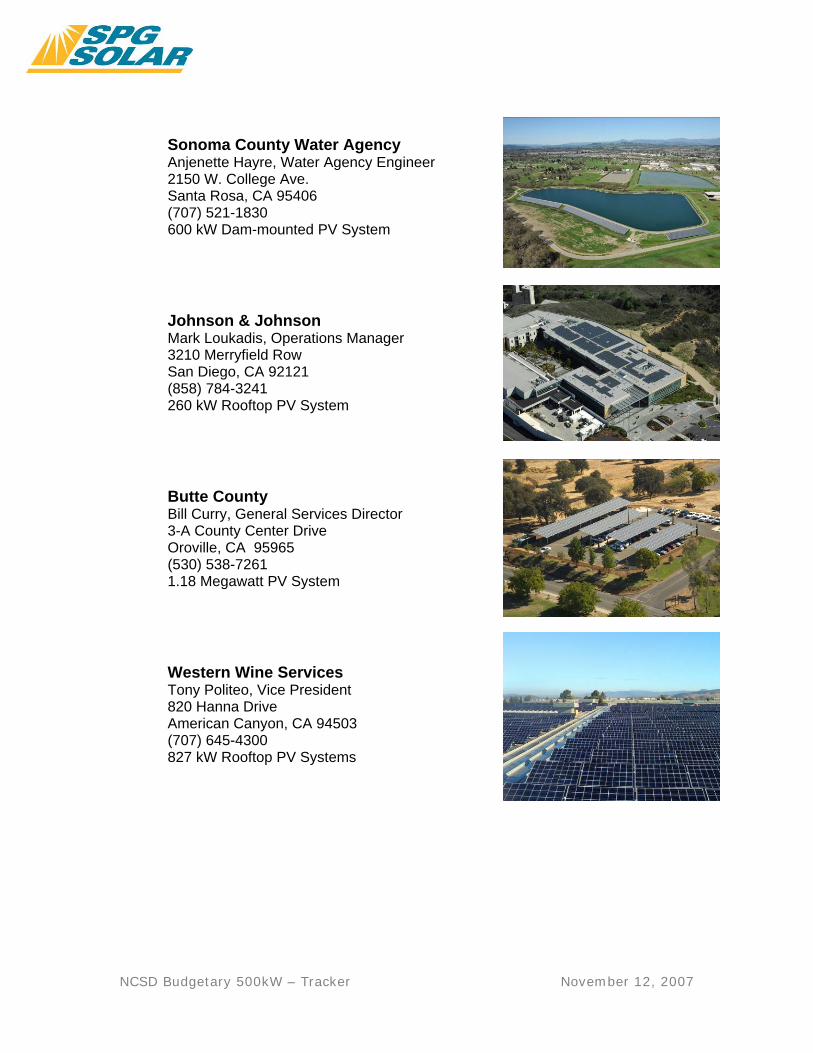
NCSD Budgetary 500kW – Tracker November 12, 2007
Sonoma County Water Agency Anjenette Hayre, Water Agency Engineer 2150 W. College Ave. Santa Rosa, CA 95406 (707) 521-1830 600 kW Dam-mounted PV System Johnson & Johnson Mark Loukadis, Operations Manager 3210 Merryfield Row San Diego, CA 92121 (858) 784-3241 260 kW Rooftop PV System Butte County Bill Curry, General Services Director 3-A County Center Drive Oroville, CA 95965 (530) 538-7261 1.18 Megawatt PV System Western Wine Services Tony Politeo, Vice President 820 Hanna Drive American Canyon, CA 94503 (707) 645-4300 827 kW Rooftop PV Systems

NCSD Budgetary 500kW – Tracker November 12, 2007
SunSpot Performance Monitoring Reporting System
SPG Solar’s bid includes the cost of our proprietary state-of-the-art SunSpot® monitoring and reporting system with a full ten year license, at no extra cost. It is CSI certified and found on the CEC website at http://www.consumerenergycenter.org/erprebate/monitors+rsp.html:
This monitoring system is a product of SPG’s ancillary company, Thompson Technologies Inc. (TTI).
Since PV systems require very little maintenance, they can easily be forgotten both by staff and by the public. Because of this, SPG has developed the SunSpot® monitoring software and public display kiosks. All information generated by SunSpot® can be viewed by authorized client staff online through a password protected internet site provided and maintained by SPG. Visitors to the Customer location can also view limited system information through the included public display kiosk.
SunSpot® monitoring system will allow the Customer and SPG system analysts to monitor:
• Real time system output • Cumulative system output • System performance by daily, monthly, cumulative or defined range
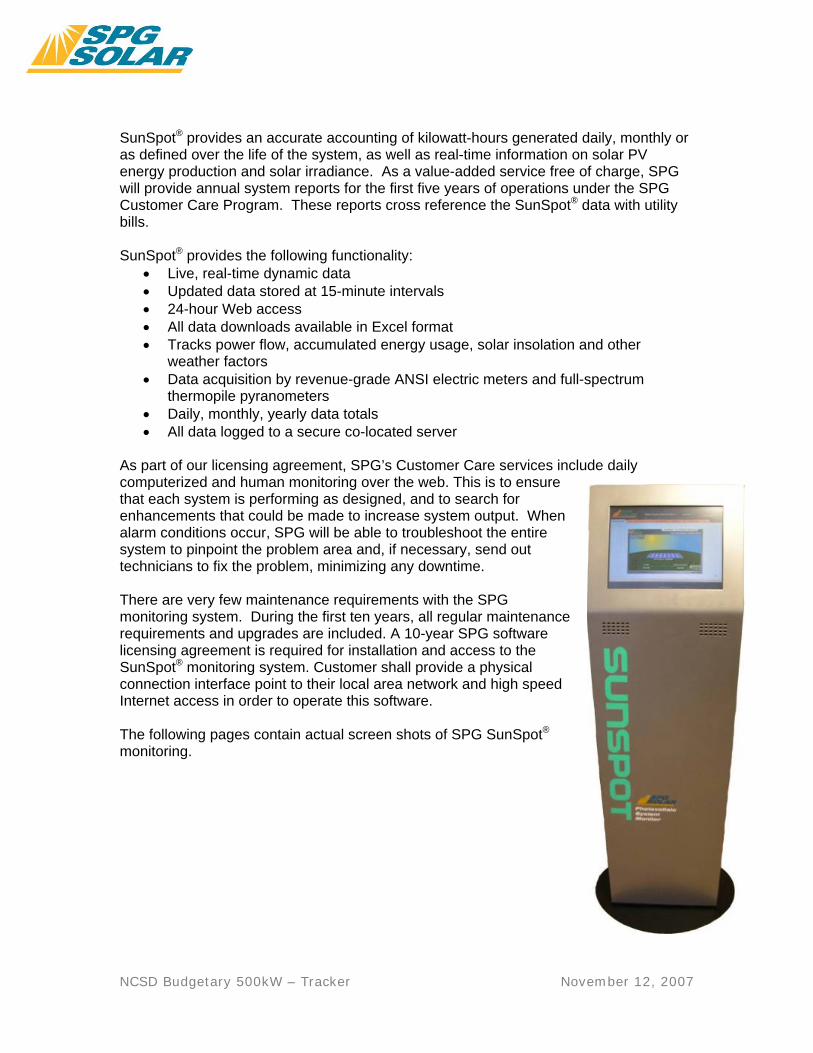
NCSD Budgetary 500kW – Tracker November 12, 2007
SunSpot® provides an accurate accounting of kilowatt-hours generated daily, monthly or as defined over the life of the system, as well as real-time information on solar PV energy production and solar irradiance. As a value-added service free of charge, SPG will provide annual system reports for the first five years of operations under the SPG Customer Care Program. These reports cross reference the SunSpot® data with utility bills. SunSpot® provides the following functionality:
• Live, real-time dynamic data • Updated data stored at 15-minute intervals • 24-hour Web access • All data downloads available in Excel format • Tracks power flow, accumulated energy usage, solar insolation and other
weather factors • Data acquisition by revenue-grade ANSI electric meters and full-spectrum
thermopile pyranometers • Daily, monthly, yearly data totals • All data logged to a secure co-located server
As part of our licensing agreement, SPG’s Customer Care services include daily computerized and human monitoring over the web. This is to ensure that each system is performing as designed, and to search for enhancements that could be made to increase system output. When alarm conditions occur, SPG will be able to troubleshoot the entire system to pinpoint the problem area and, if necessary, send out technicians to fix the problem, minimizing any downtime. There are very few maintenance requirements with the SPG monitoring system. During the first ten years, all regular maintenance requirements and upgrades are included. A 10-year SPG software licensing agreement is required for installation and access to the SunSpot® monitoring system. Customer shall provide a physical connection interface point to their local area network and high speed Internet access in order to operate this software. The following pages contain actual screen shots of SPG SunSpot® monitoring.
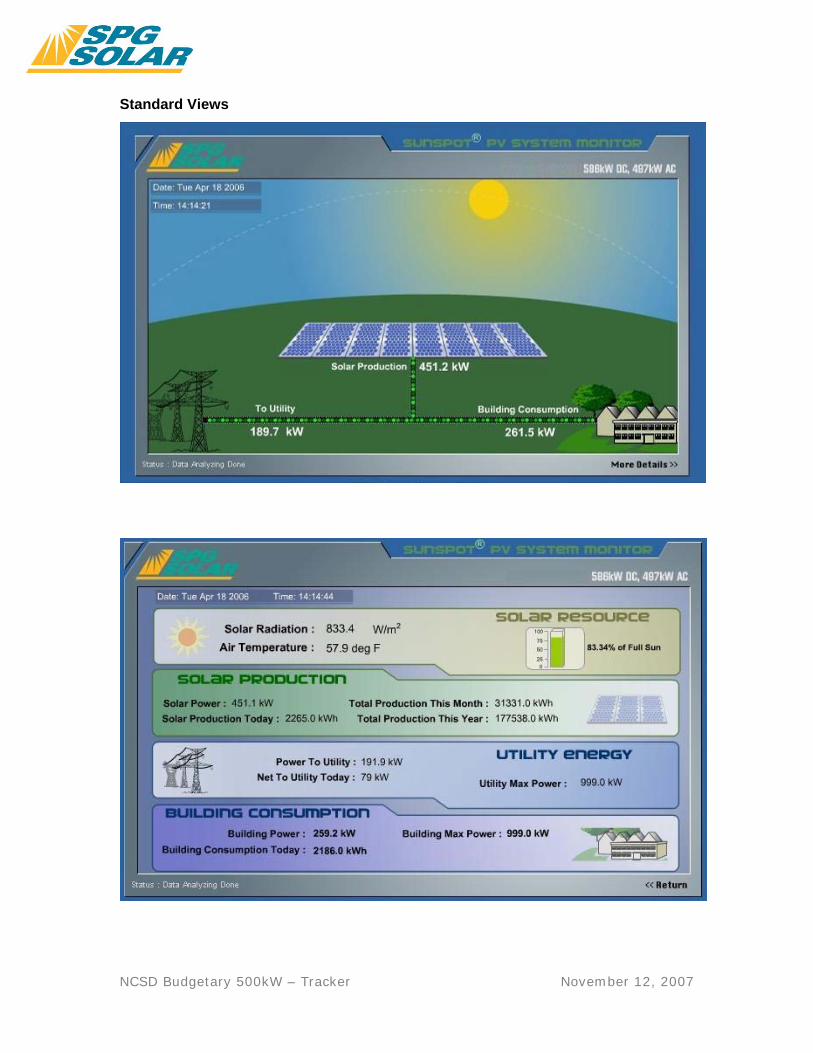
NCSD Budgetary 500kW – Tracker November 12, 2007
Standard Views
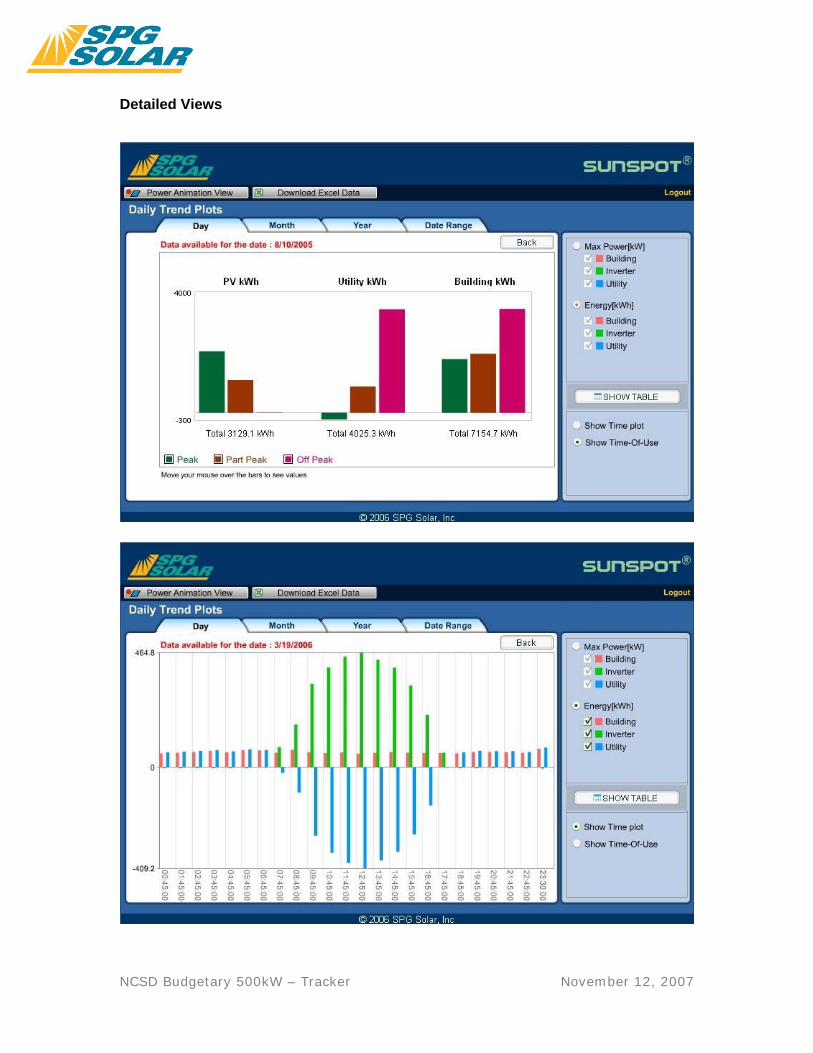
NCSD Budgetary 500kW – Tracker November 12, 2007
Detailed Views

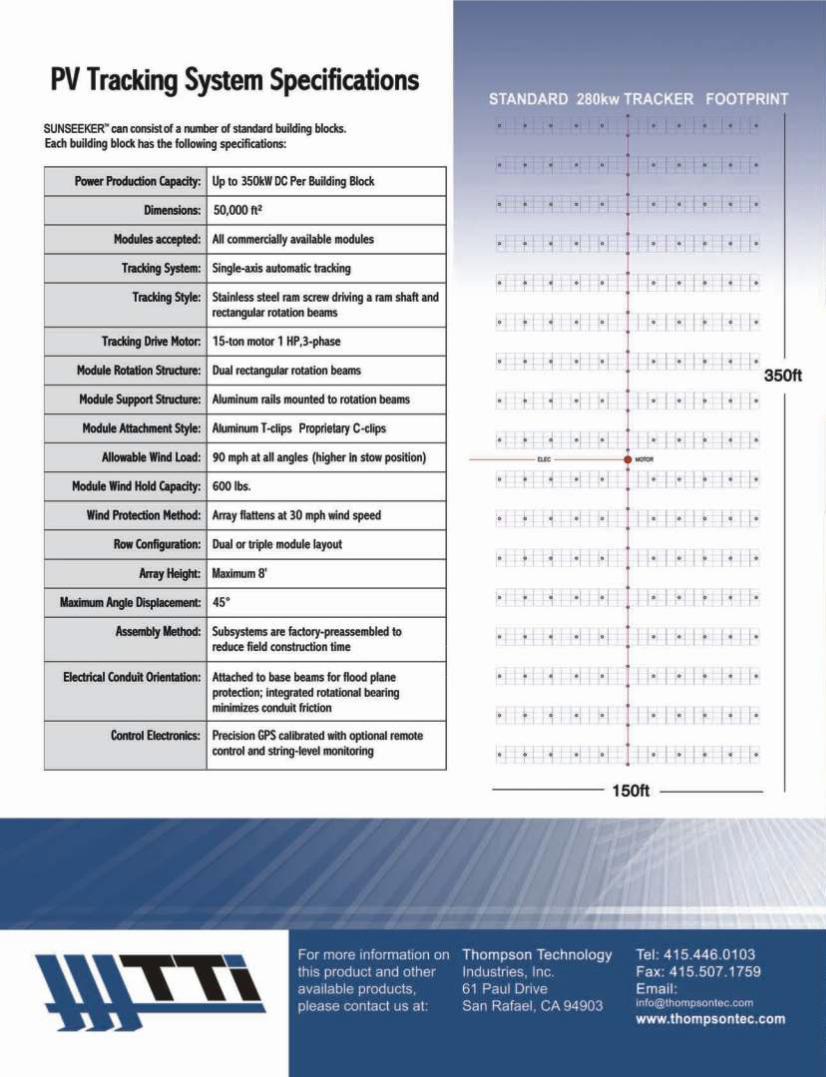


![III. THEORETICAL STRUCTURES Mp[QMS]](https://static.fdokumen.com/doc/165x107/631eca3256cbbb475005bb31/iii-theoretical-structures-mpqms.jpg)