Navigating New Mobility: Policy Approaches for Cities - ROSA P
134
Navigating New Mobility: urbanism next center October 2019 @urbanismnext urbanismnext.com city of gresham, or | city of Eugene, or policy approaches for cities
-
Upload
khangminh22 -
Category
Documents
-
view
0 -
download
0
Transcript of Navigating New Mobility: Policy Approaches for Cities - ROSA P

Navigating New Mobility:
urbanism next center
October 2019
@urbanismnexturbanismnext.com
city of gresham, or | city of Eugene, or
policy approaches for cities

Urbanism Next | University of Oregon

Navigating New Mobility | October 2019 | 3
Funding for this project was generously provided by the National Institute for Transportation and Communities (NITC; grant number 1249), the National Science Foundation (NSF; award number 1737645), the City of Gresham, and the City of Eugene. Special thanks to City of Eugene staff Terri Harding, Chris Henry, Rob Inerfeld, Jeff Petry, Shane Rhodes, Lacey Risdal, Matt Rodrigues, and Larisa Varela. From the City of Gresham, we’d like to thank Katherine Kelly, Amanda Lunsford, John Heili, and Carly Rice.
The primary author of this report is Becky Steckler, AICP, Urbanism Next Program Director.
This report could not have been completed without the efforts of the following people:Jennifer DavidsonAmanda HowellNico Larco, AIARebecca Lewis, PhDMichelle MontielMarsie SurguineHuijun Tan
ACKNOWLEDGMENTS

Urbanism Next | University of Oregon
Navigating New Mobility | October 2019 | 1
Introduction
The Potential Impacts of Technology on Mobility
New Mobility Policies and Strategies
Implications for Gresham and Eugene
Appendix A: Bibliography
Appendix B: The Multilevel Impacts of Emerging Technologies on City Form and Development, Chapter 2
TABLE OF CONTENTs01|
02|
03|
04|
Aa|
AB|
3
7
15
35
61
66
Urbanism Next | University of Oregon
Navigating New Mobility | October 2019 | 3
01 | Introduction
...These new forms of mobility
create new issues...
Urbanism Next | University of Oregon 4 | Navigating New Mobility | October 2019 | Section 1 - Introduction
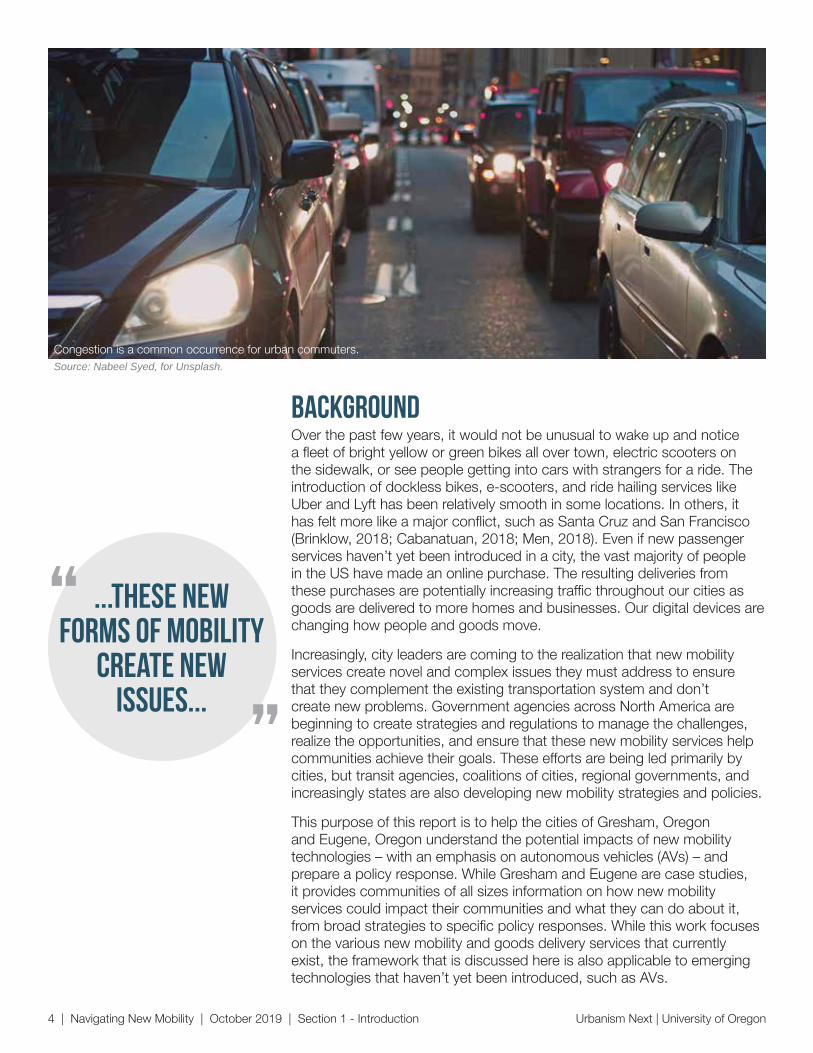
BackgroundOver the past few years, it would not be unusual to wake up and notice a fleet of bright yellow or green bikes all over town, electric scooters on the sidewalk, or see people getting into cars with strangers for a ride. The introduction of dockless bikes, e-scooters, and ride hailing services like Uber and Lyft has been relatively smooth in some locations. In others, it has felt more like a major conflict, such as Santa Cruz and San Francisco (Brinklow, 2018; Cabanatuan, 2018; Men, 2018). Even if new passenger services haven’t yet been introduced in a city, the vast majority of people in the US have made an online purchase. The resulting deliveries from these purchases are potentially increasing traffic throughout our cities as goods are delivered to more homes and businesses. Our digital devices are changing how people and goods move.
Increasingly, city leaders are coming to the realization that new mobility services create novel and complex issues they must address to ensure that they complement the existing transportation system and don’t create new problems. Government agencies across North America are beginning to create strategies and regulations to manage the challenges, realize the opportunities, and ensure that these new mobility services help communities achieve their goals. These efforts are being led primarily by cities, but transit agencies, coalitions of cities, regional governments, and increasingly states are also developing new mobility strategies and policies.
This purpose of this report is to help the cities of Gresham, Oregon and Eugene, Oregon understand the potential impacts of new mobility technologies – with an emphasis on autonomous vehicles (AVs) – and prepare a policy response. While Gresham and Eugene are case studies, it provides communities of all sizes information on how new mobility services could impact their communities and what they can do about it, from broad strategies to specific policy responses. While this work focuses on the various new mobility and goods delivery services that currently exist, the framework that is discussed here is also applicable to emerging technologies that haven’t yet been introduced, such as AVs.
Source: Nabeel Syed, for Unsplash.
“
”
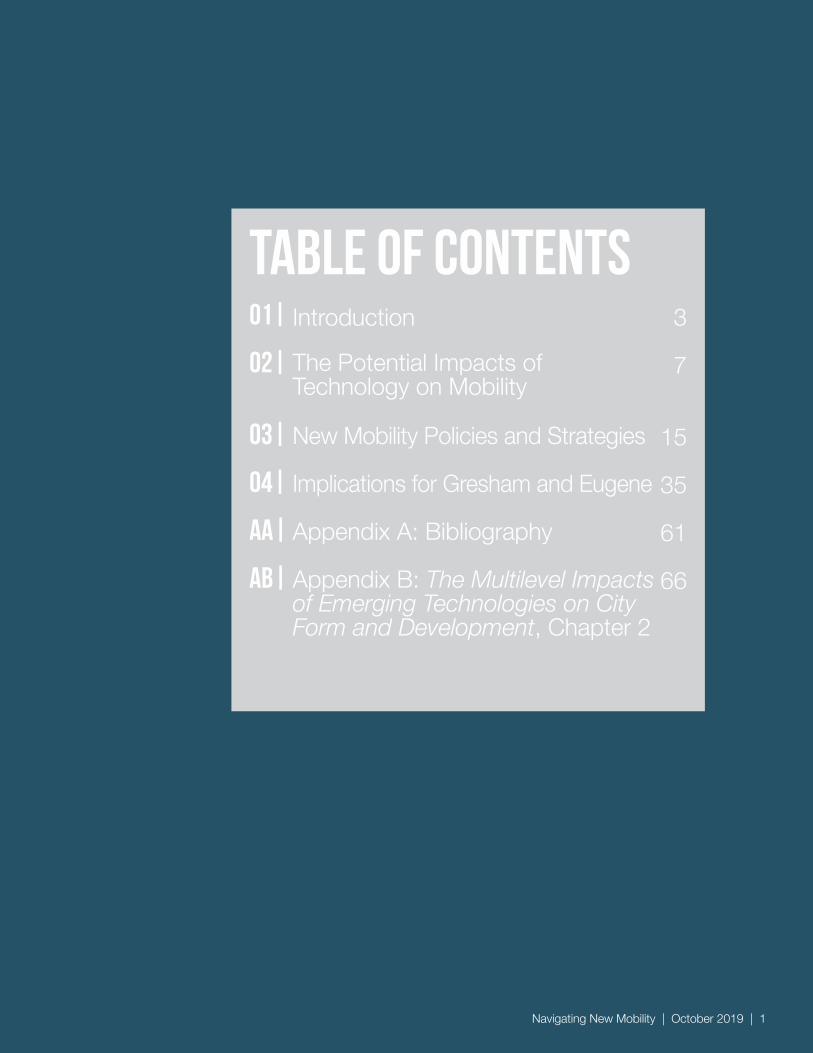
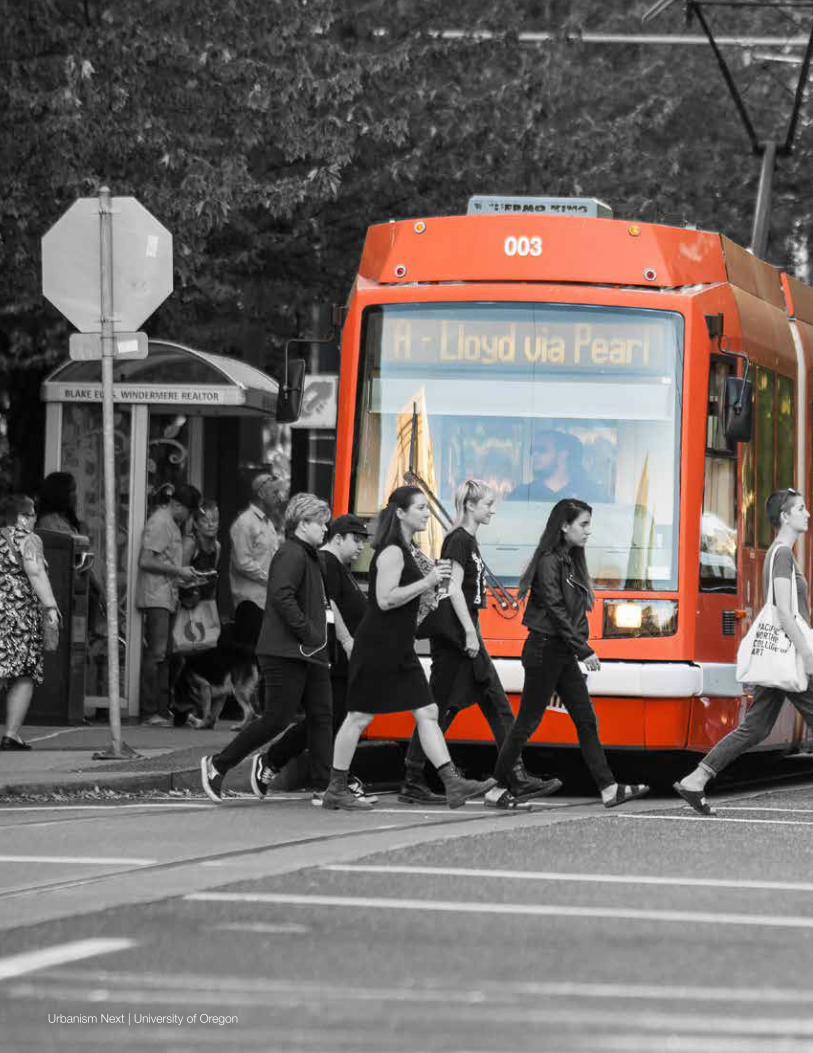
Congestion is a common occurrence for urban commuters.
Urbanism Next | University of Oregon Section 1 - Introduction | Navigating New Mobility | October 2019 | 5
methodsThe University of Oregon has been at the forefront of thinking about the secondary impacts of emerging technologies on city form and development. This document relies in part on extensive literature and policy reviews conducted in 2018 and 2019 for the Carbon Neutral Cities Alliance at the Urban Sustainability Directors Network (CNCA/USDN) and funded by the Bullitt Foundation, and the National Science Foundation. This report builds upon the policy review conducted as part of the CNCA/USDN work that compiled information from existing playbooks, policies, and strategies for new mobility and emerging transportation technologies. Some cities, such as Seattle, WA; Los Angeles, CA; and Austin, TX have created or adopted new mobility policies or strategies. Other cities, such as Atlanta, GA and St. Louis, MO are incorporating elements of new mobility topics into current planning documents or regulations. They all have something to teach other cities that are contemplating how to respond to the challenges of new mobility technology. This report focuses on new mobility and how it might affect city policies, programs, and budgets.
What was once purely science fiction is starting to materialize on streets across the country. Being prepared for these changes is what makes the difference between a community achieving its goals or being plagued with negative impacts. Cities that think ahead, stay ahead.
report organization
Potential impacts of technology on mobility. This section describes how technology is changing how people
and goods move. It briefly describes “new mobility” modes, including anticipated changes from the deployment of autonomous vehicles (AVs). It then discusses some of the possible first order impacts of new mobility, such as reduced demand for parking and increase in vehicle miles traveled (VMT) and congestion. This section then explores some of the potential secondary impacts of new mobility.
section 2
New mobility policies and strategies. Government agencies at the federal, state, and local level are just
beginning to address the challenges and opportunities presented by emerging technologies. This section will describe the roles of regulations at the federal, state, and local level, focusing on North American jurisdictions. It then describes in greater detail the ten most common topics included in new mobility policies and strategies from plans across the country.
section 3
What does this mean for Gresham and Eugene? This section includes a scan of Gresham and Eugene’s
transportation and other plans and highlights exisiting strengths, opportunities, and gaps.
section 4
BibliographyAppendix aThe Multilevel Impacts of Emerging Technologies on City Form and Development Report, Chapter 2.Appendix B
The rest of this document is organized in the following sections:

Urbanism Next | University of Oregon

Navigating New Mobility | October 2019 | 7
02 | the potential impacts of technology ON MOBILITY
Urbanism Next | University of Oregon 8 | Navigating New Mobility | October 2019 | Section 2 - Potential Impacts of Technology
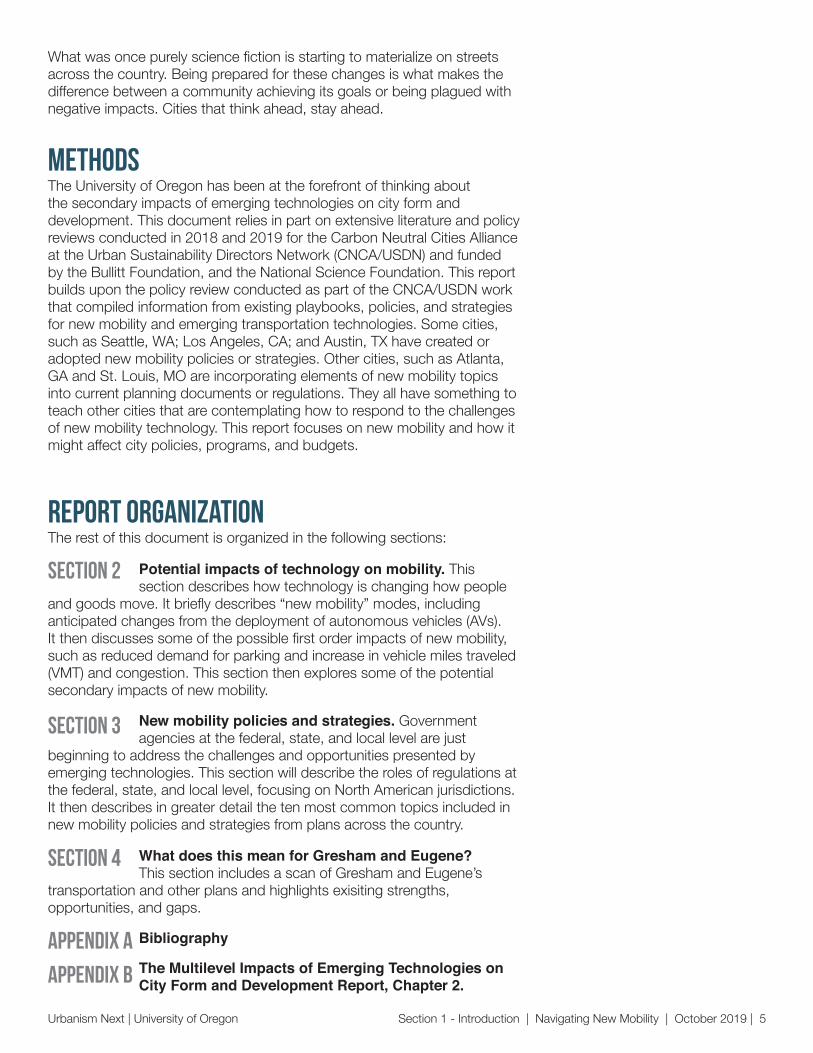
NEW MOBILITY: HOW TECHNOLOGY IS CHANGING HOW PEOPLE AND GOODS MOVEIt may be hard to understand how a digital device changes how people and goods move. One critical difference is that access to a wide range of mobility services has the potential to make transportation much more accessible. For example, a city that has a variety of services – from transit, to e-scooters, to TNCs – multiplies the possible modes and routes that a person can take throughout a day to get where they need to go. No longer is a person required to drive if they need to go somewhere inconvenient to transit. The new suite of options vastly expands the menu of options that people have to get around.
Another critical difference is that by accessing transportation via a smartphone means that people can leave their cars at home. If people are leaving cars at home, then the demand for parking goes down. At the same time, the demand for space for drop-off and pick-up goes up. In addition, people make different choices about how many trips they take and what mode they use. For example, women going out at night might take public transit early in the evening when service is more frequent and more people are out, but feel less safe later at night waiting for the bus or train and decide to take an Uber or Lyft home instead. A recent report by the Rudin Center for Transportation estimated that women surveyed in New York pay $26-$50 more than men per month for safe transportation (Kaufman, Polack, & Campbell, 2018). Another study found that the majority of trips made by people taking TNCs would either not have been taken at all, or the trips would have been made by walking, biking, or transit (R. R. Clewlow & Mishra, 2017) had TNCs not been available. In other words, most TNC trips are not replacing driving trips.
Source: Fred Joe Photo

Urbanism Next | University of Oregon Section 2 - Potential Impacts of Technology | Navigating New Mobility | October 2019 | 9
The median extra transportation
cost per month for men, due to
safety reasons, is $0.
On the other hand, the median
extra cost per month for women
is $26-$50.
Conclusion: Women are more likely than men to change their behavior in order to avoid harassment.
$0 $26-
50/M
O
Source: The Pink Tax on Transportation | Rudin Center for Transportation | November 2018Graphic: Urbanism Next
Change is not limited to passenger movement. The growth of e-commerce as well as food, grocery, and other types of local delivery (also referred to as courier services in this report) is rapidly changing the retail economy and impacting transportation systems. While there is some data on passenger movement and heavy freight moving to and through cities, very few (if any) cities require companies to provide data on deliveries to homes and businesses. Given the rapid growth in e-commerce – the US Census Bureau reported that e-commerce increased from 4.5% in 2010 of total retail sales to 8.9% in 2017 – cities should expect to see increased delivery on city streets and increased demand for commercial loading and unloading zones. While demands from deliveries are felt first in larger metropolitan areas, it is expected to increase in suburban and rural areas over time. In addition to deliveries made by commercial trucks (like UPS, FedEx, and USPS), cities need to consider deliveries made in personal vehicles. There is very limited data about the communities served, number of deliveries, total miles traveled for companies like UberEats, GrubHub, Postmates, or Amazon Flex. As these services increase, communities need to understand the impact on the transportation system and the demand for curb space.
The Urbanism Next Center completed research on how emerging technologies are disrupting land use, urban design, transportation, and real estate markets. This section briefly summarizes some of the work from the Multilevel Impacts of Emerging Technologies on City Form and Development. Appendix B includes Chapter 2 from that report that describes shifting paradigms and how they are leading to forces for change and the implications of those forces of change on equity, health, the economy, the environment, and governance. The next four pages describe new mobility, new mobility services, and new mobility as a service. It then defines new mobility services for moving people and moving goods. Finally, it lists the forces of change and 1st level impacts of new mobility technologies, the growth of e-commerce, and the anticipated deployment of AVs.

Urbanism Next | University of Oregon 10 | Navigating New Mobility | October 2019 | Section 2 - Potential Impacts of Technology
New MobilityThe term used to describe transportation that is newly enabled by digital technology, primarily the use of smartphone apps.
Examples include: ridehailing transportation network companies (TNC) (e.g. Uber and Lyft), autonomous vehicles, micro-transit (e.g. Via), bikeshare, and e-scooters.
New Mobility Services (NMS)The term used to describe the types of transportation services of New Mobility.
Examples include: ridehailing, microtransit, and car and bike shares, which operate using smartphones and other emerging technologies. (See additional NMS types on the next page.)
Mobility as a Service (MaaS)Describes both a change in how mobility is viewed as well as how New Mobility Services are consumed.
The mobility paradigm shift is a shift from thinking of mobility as something one individually owns (e.g. owning a car or bike) to approaching mobility as a suite of pay-as-you-use transportation services.
Mobility as a Service (MaaS) is the consumption of New Mobility Services (NMS) via the integration of various forms of transportation services into a single mobility service accessible on demand, such as a smartphone app.
Through digital technology and a single end-to-end charge, consumers can choose their “own adventure” when deciding travel routes by selecting from a suite of New Mobility Services, choosing their mode(s) of transportation based on availability and preferences in price and total trip duration. (Below is the ideal MaaS situation: using a smartphone app, choosing desired modes of mobility, and paying through the app.)
defining terminology
MaaS
MaaS
2min
total: $2.75
10min $0.25
25min $2.50
arrive: 10:31a (37 min)
$0
2min
total: $2.75
10min $0.25
25min $2.50
arrive: 10:31a (37 min)
$0

MICROTRANSITPrivately operated
passenger vans and shuttle buses offer
transit-like service on a smaller scale. Routes may be fixed or dynamic, but
typically use predetermined pick-up and
drop off points for passengers.
RIDEHAILINGUse of smartphone apps to connect passengers
with drivers who provide rides in their personal
vehicles. Also known as transportation network
companies (TNCs). Can be single or shared
occupancy.
AUTONOMOUS VEHICLEVehicles use sensors and advanced control systems to operate independently from a human driver and may be used to transport
passengers as well as freight.
PUBLIC TRANSITUse of public transit as it currently exists, but using newer technologies like smartphone apps to look up routes and/or pay for
ride.
AUTONOMOUS DELIVERYThe delivery of goods by driverless autonomous vehicles, from larger
freight vehicles to smaller passenger vehicles.
SELF-DRIVING ROBOTIC DELIVERY
Fleets of small autonomous delivery vehicles that may
be used on sidewalks or on roads depending on size
and speed.
AERIAL DRONE DELIVERYNot a focus of report/or in
the scope of Urbanism Next... but a technology on
the near horizon.
COURIER SERVICESThe use of an app to
connect people using their personal vehicles to make
restaurant, grocery, or other package deliveries.
eSCOOTER SHAREServices providing fleets of
electric scooters for short-term rental within a
defined service area. Pick-up/leave anywhere within a defined area.
BIKESHAREServices providing fleets of
bicycles for short-term rental. Pay at kiosk/
smartphone app. Docked: pick-up/return at fixed
stations. Dockless: pick-up/leave anywhere within a defined area.
MOPED SHAREServices providing fleets of
mopeds for short-term rental. Typically dockless: pick-up/return anywhere
within a defined area.
CARSHARINGServices providing access to shared vehicles for trips where users only pay for
time used. Stationary: pick-up/return to same
parking spot. Free-floating: pick-up/leave anywhere within a defined area.
Peer-to-peer: rent from individuals.
mo
vin
g p
eo
pl
e mo
vin
g p
eo
pl
e
mo
vin
g G
OO
DSm
ov
ing
GO
OD
S
Urbanism Next | University of Oregon Section 2 - Potential Impacts of Technology | Navigating New Mobility | October 2019 | 11
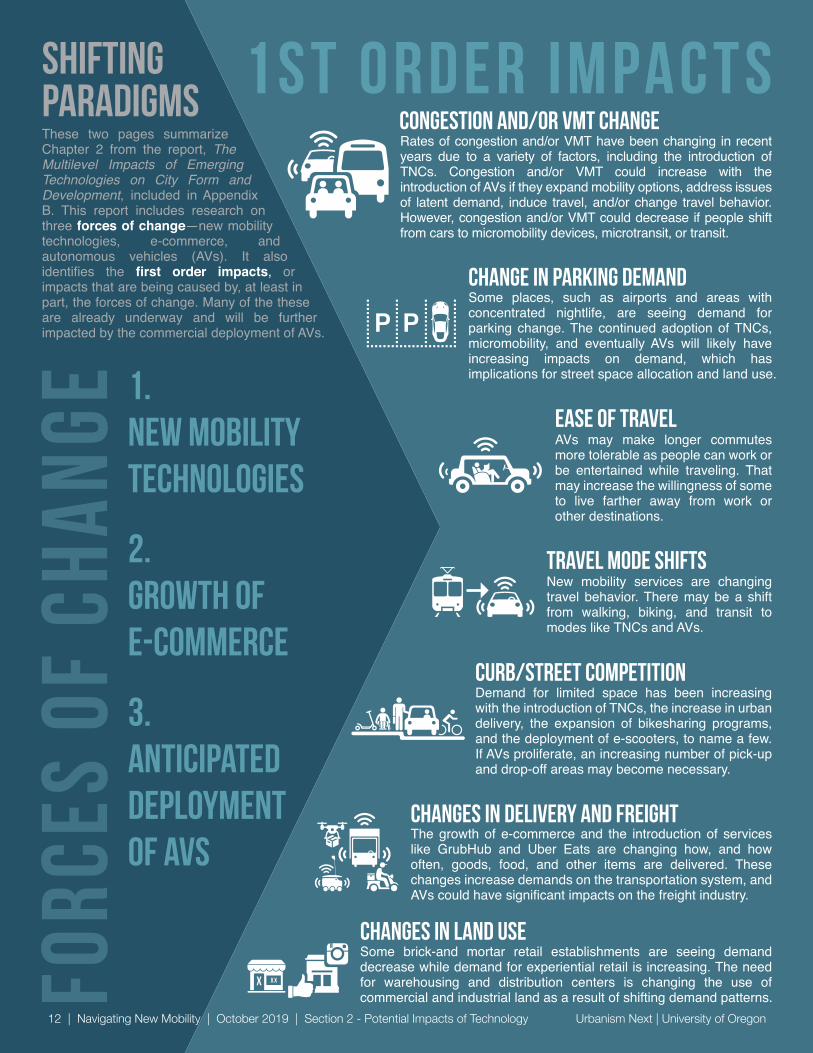
These two pages summarize Chapter 2 from the report, The Multilevel Impacts of Emerging Technologies on City Form and Development, included in Appendix B. This report includes research on three forces of change—new mobility technologies, e-commerce, and autonomous vehicles (AVs). It also identifies the first order impacts, or impacts that are being caused by, at least in part, the forces of change. Many of the these are already underway and will be further impacted by the commercial deployment of AVs.
The Multilevel Impacts of Emerging Technologies on City Form and Development explores how the 1st order impacts could change land use, urban design, transportation, and real estate and the implications of these impacts on equity, health, the economy, the environment, and governance.
ShiftingParadigms
New mobility technologies could have positive equity implications, but they may also exacerbate existing inequities. On the positive side, technology may improve mobility access for underserved populations, increase opportunities for wealth creation, and create jobs. However, technology can also have negative impacts: from excluding those without credit or smart phone access from services; to displacement of workers by automation; to disproportionately benefiting higher-income earners furthering income disparity.
Emerging technologies could make us healthier—AVs have the potential to significantly decrease car crashes and lower exposure to pollution and greenhouse gas (GHG) emissions. New mobility could improve mental health if travel becomes less stressful and food delivery could improve access to healthy food. Active transportation may become more or less attractive depending on the future safety and comfort engendered by AVs; depending on the safety, cost, and potential effects on the built environment, AVs may either help boost bicycling and walking, or could undermine them.
Emerging technologies could have profound impacts on local, regional, and national government budgeting, financing, operations, and business practices. Regulating emerging technology may enable cities to take advantage of the benefits and mitigate the risks. Regulations that are not flexible or adaptive to swift changes in technology could be a barrier to city growth, safety of community members, the management of the technologies, and city priorities. Information from new mobility providers will help governments make informed decisions.
If AVs are primarily electric or hybrid vehicles, there is the potential to greatly reduce GHG and other air pollutants with widespread adoption. However, if the transition is slow, and all those AVs significantly increase congestion, we may see increases in GHG and pollution as gas-powered vehicles get stuck in traffic. AVs could also encourage sprawling development, resulting in loss of habitat and natural systems as they are developed.
The gig economy is significantly increasing the number of people that are working as contractors instead of employees. Additionally, AVs may put millions of people out of work who drive as part of their job. Government finance and budgets will likely change as people pay for less parking, or less in gas taxes if electric AVs proliferate.
Some places, such as airports and areas with concentrated nightlife, are seeing demand for parking change. The continued adoption of TNCs, micromobility, and eventually AVs will likely have increasing impacts on demand, which has implications for street space allocation and land use.
New mobility services are changing travel behavior. There may be a shift from walking, biking, and transit to modes like TNCs and AVs.
AVs may make longer commutes more tolerable as people can work or be entertained while traveling. That may increase the willingness of some to live farther away from work or other destinations.
Demand for limited space has been increasing with the introduction of TNCs, the increase in urban delivery, the expansion of bikesharing programs, and the deployment of e-scooters, to name a few. If AVs proliferate, an increasing number of pick-up and drop-off areas may become necessary.
The growth of e-commerce and the introduction of services like GrubHub and Uber Eats are changing how, and how often, goods, food, and other items are delivered. These changes increase demands on the transportation system, and AVs could have significant impacts on the freight industry.
Some brick-and mortar retail establishments are seeing demand decrease while demand for experiential retail is increasing. The need for warehousing and distribution centers is changing the use of commercial and industrial land as a result of shifting demand patterns.
Rates of congestion and/or VMT have been changing in recent years due to a variety of factors, including the introduction of TNCs. Congestion and/or VMT could increase with the introduction of AVs if they expand mobility options, address issues of latent demand, induce travel, and/or change travel behavior. However, congestion and/or VMT could decrease if people shift from cars to micromobility devices, microtransit, or transit.
Change in parking demand
1.New mobility technologies
3.Anticipated deployment of AVs
2. Growth of E-Commerce
Congestion and/or VMT change Equity
Health
Governance
Travel mode shifts
Ease of travel
Curb/street competition
Changes in delivery and freight
Changes in land use
Environment
Economy
FORC
ES o
f CH
ANGE
1st order impacts I m p l i c at i o n s
Urbanism Next | University of Oregon 12 | Navigating New Mobility | October 2019 | Section 2 - Potential Impacts of Technology

These two pages summarize Chapter 2 from the report, The Multilevel Impacts of Emerging Technologies on City Form and Development, included in Appendix B. This report includes research on three forces of change—new mobility technologies, e-commerce, and autonomous vehicles (AVs). It also identifies the first order impacts, or impacts that are being caused by, at least in part, the forces of change. Many of the these are already underway and will be further impacted by the commercial deployment of AVs.
The Multilevel Impacts of Emerging Technologies on City Form and Development explores how the 1st order impacts could change land use, urban design, transportation, and real estate and the implications of these impacts on equity, health, the economy, the environment, and governance.
ShiftingParadigms
New mobility technologies could have positive equity implications, but they may also exacerbate existing inequities. On the positive side, technology may improve mobility access for underserved populations, increase opportunities for wealth creation, and create jobs. However, technology can also have negative impacts: from excluding those without credit or smart phone access from services; to displacement of workers by automation; to disproportionately benefiting higher-income earners furthering income disparity.
Emerging technologies could make us healthier—AVs have the potential to significantly decrease car crashes and lower exposure to pollution and greenhouse gas (GHG) emissions. New mobility could improve mental health if travel becomes less stressful and food delivery could improve access to healthy food. Active transportation may become more or less attractive depending on the future safety and comfort engendered by AVs; depending on the safety, cost, and potential effects on the built environment, AVs may either help boost bicycling and walking, or could undermine them.
Emerging technologies could have profound impacts on local, regional, and national government budgeting, financing, operations, and business practices. Regulating emerging technology may enable cities to take advantage of the benefits and mitigate the risks. Regulations that are not flexible or adaptive to swift changes in technology could be a barrier to city growth, safety of community members, the management of the technologies, and city priorities. Information from new mobility providers will help governments make informed decisions.
If AVs are primarily electric or hybrid vehicles, there is the potential to greatly reduce GHG and other air pollutants with widespread adoption. However, if the transition is slow, and all those AVs significantly increase congestion, we may see increases in GHG and pollution as gas-powered vehicles get stuck in traffic. AVs could also encourage sprawling development, resulting in loss of habitat and natural systems as they are developed.
The gig economy is significantly increasing the number of people that are working as contractors instead of employees. Additionally, AVs may put millions of people out of work who drive as part of their job. Government finance and budgets will likely change as people pay for less parking, or less in gas taxes if electric AVs proliferate.
Some places, such as airports and areas with concentrated nightlife, are seeing demand for parking change. The continued adoption of TNCs, micromobility, and eventually AVs will likely have increasing impacts on demand, which has implications for street space allocation and land use.
New mobility services are changing travel behavior. There may be a shift from walking, biking, and transit to modes like TNCs and AVs.
AVs may make longer commutes more tolerable as people can work or be entertained while traveling. That may increase the willingness of some to live farther away from work or other destinations.
Demand for limited space has been increasing with the introduction of TNCs, the increase in urban delivery, the expansion of bikesharing programs, and the deployment of e-scooters, to name a few. If AVs proliferate, an increasing number of pick-up and drop-off areas may become necessary.
The growth of e-commerce and the introduction of services like GrubHub and Uber Eats are changing how, and how often, goods, food, and other items are delivered. These changes increase demands on the transportation system, and AVs could have significant impacts on the freight industry.
Some brick-and mortar retail establishments are seeing demand decrease while demand for experiential retail is increasing. The need for warehousing and distribution centers is changing the use of commercial and industrial land as a result of shifting demand patterns.
Rates of congestion and/or VMT have been changing in recent years due to a variety of factors, including the introduction of TNCs. Congestion and/or VMT could increase with the introduction of AVs if they expand mobility options, address issues of latent demand, induce travel, and/or change travel behavior. However, congestion and/or VMT could decrease if people shift from cars to micromobility devices, microtransit, or transit.
Change in parking demand
1.New mobility technologies
3.Anticipated deployment of AVs
2. Growth of E-Commerce
Congestion and/or VMT change Equity
Health
Governance
Travel mode shifts
Ease of travel
Curb/street competition
Changes in delivery and freight
Changes in land use
Environment
Economy
FORC
ES o
f CH
ANGE
1st order impacts I m p l i c at i o n s
Urbanism Next | University of Oregon Section 2 - Potential Impacts of Technology | Navigating New Mobility | October 2019 | 13

Urbanism Next | University of Oregon
Navigating New Mobility | October 2019 | 15
03|NEW MOBILITY POLICIES AND STRATEGIES

Urbanism Next | University of Oregon 16 | Navigating New Mobility | October 2019 | Section 3 - New Mobility Polices & Strategies
Government agencies at the federal, state, and local level are just beginning to address the challenges and opportunities presented by emerging technologies and new mobility services described in Section 2. Cities are considering these impacts and framing their new mobility policies within existing transportation, land use, sustainability, social equity, and other goals. Some cities and organizations developed or are developing strategies and guidance first, such as the City of Seattle’s New Mobility Playbook or the Shared Mobility Principles for Livable Cities (see sidebar), others are using existing land use, transportation, or other documents and updating elements of these policies to accommodate new mobility. This section describes some of the most common topics included in new mobility strategies and implementation regulations across the country, such as improving safety, prioritizing active transportation, and improving social equity. This section breaks it down into ten topic areas:
Source: Unsplash.
Overview
1. safety2. social equity3. active transportation4. Congestion and vehicle miles traveled5. Sustainability and environmental impacts6. Design and management of the right-of-way (ROW)7. land use and metropolitan footprint8. Informed decision making9. ManageD innovation10. Fiscal impacts and new mobility revenue
the Shared Mobility Principles for Livable Cities
The Shared Mobility Principles for Livable Cities is an effort initiated by Robin Chase, the founder of Zipcar. She worked with a consortium of transportation experts to create 10 mobility principles to help guide urban decision-makers and stakeholders towards the best outcome for all. Hundreds of organizations, companies, and governments (and counting) have signed on to the principles.
The 10 Mobility Principles:
1. We plan our cities and their mobility together
2. We prioritize people over vehicles
3. We support the shared and efficient use of vehicles, lanes, curbs, and land
4. We engage with stakeholders
5. We promote equity
6. We lead the transition towards a zero-emission future and renewable energy
7. We support fair user fees across all modes
8. We aim for public benefits via open data
9. We work towards integration and seamless connectivity
10. We support that autonomous vehicles AVs) in dense urban areas should be operated only in shared fleets (Shared Mobility Principles for Livable Cities, 2017)
Jurisdiction Name Date Agency/Group Description
Atlanta, GA Regional Transportation Technology Policy Document Dec 2016 Atlanta Regional
CommissionPolicy and strategy recommendations
Austin, TXSmart Mobility Roadmap Oct 2017 City of Austin and
Capital MetroPolicy and strategy recommendations
Austin Strategic Mobility Plan No Date City of Austin Draft policies
Chandler, AZRidesharing and Autonomous Vehicles Zoning Code Amendments
May 2018 City of Chandler Adopted parking to passenger loading ratio zoning code updates
Denver Metropolitan Region 2030 Mobility Choice Blueprint November
2018 Denver Region Policy and strategy recommendations
Los Angeles, CAUrban Mobility in a Digital Age 2016 LA Dept. of
TransportationPolicy and strategy recommendations
Mobility Plan 2035 Sept 2016 Dept. of City Planning Adopted as part of the General Plan in 2016
Metro Region, OR Draft Emerging Technology Strategy June 2018 Metro
Policy and strategy plan, incorporated into the Regional Transportation Plan
Miami-Dade County Urban Mobility Playbook March 2016
Miami-Dade County and City Innovate Foundation
Policy and strategy recommendations
NY/NJ/CT RegionNew Mobility: AVs and the Region (Component of Fourth Regional Plan)
Oct 2017 Regional Plan Association
Policy and strategy recom-mendations included in the Fourth Regional Plan (Nov 2017)
Portland, OR Portland 2035 Transportation System Plan
May2018 City of Portland Policies and strategies
Seattle, WA New Mobility Playbook Sept 2017 Seattle Department of Transportation
Policy and strategy recommendations
St. Louis, MO Region Emerging Transportation Technology Strategic Plan June 2017 East-West Gateway
COGPolicy and strategy recommendations
Toronto, ON Preparing the City of Toronto for AVs Jan 2018 Transportation Services Report on steps taken and
proposed next steps
Urbanism Next | University of Oregon Section 3 - New Mobility Polices & Strategies | Navigating New Mobility | October 2019 | 17
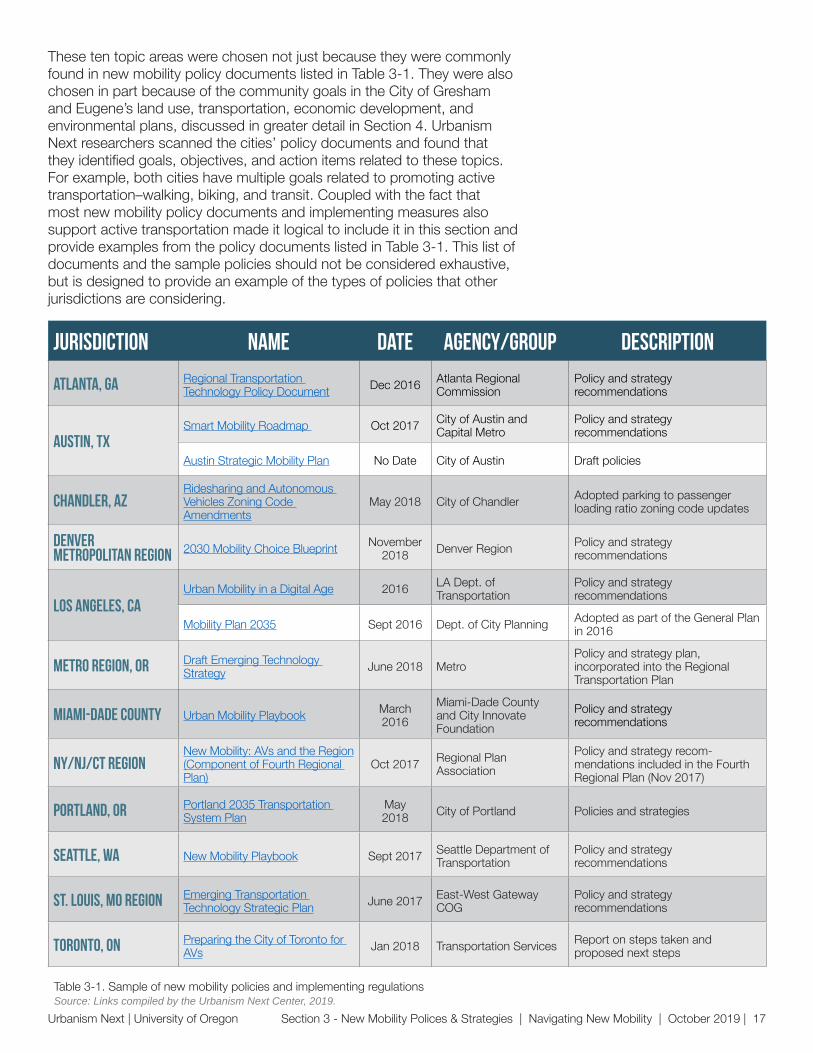
These ten topic areas were chosen not just because they were commonly found in new mobility policy documents listed in Table 3-1. They were also chosen in part because of the community goals in the City of Gresham and Eugene’s land use, transportation, economic development, and environmental plans, discussed in greater detail in Section 4. Urbanism Next researchers scanned the cities’ policy documents and found that they identified goals, objectives, and action items related to these topics. For example, both cities have multiple goals related to promoting active transportation–walking, biking, and transit. Coupled with the fact that most new mobility policy documents and implementing measures also support active transportation made it logical to include it in this section and provide examples from the policy documents listed in Table 3-1. This list of documents and the sample policies should not be considered exhaustive, but is designed to provide an example of the types of policies that other jurisdictions are considering.
Source: Links compiled by the Urbanism Next Center, 2019.Table 3-1. Sample of new mobility policies and implementing regulations

Urbanism Next | University of Oregon 18 | Navigating New Mobility | October 2019 | Section 3 - New Mobility Polices & Strategies
Source: Nacto’s Blueprint for Autonomous Urbanism, pp12-13.
nacto’s principles for autonomous urbanism

Urbanism Next | University of Oregon Section 3 - New Mobility Polices & Strategies | Navigating New Mobility | October 2019 | 19
common Equity approaches adopted by cities
Provide a seat at the table.
Ensure all areas are covered by the service.
Require diverse payment options.
Ensure that companies promote equitable workforce policies.
Accommodate people with disabilities.
Safety
Cities are adopting a number of approaches to include equity issues. Some of the most common are:
Provide a seat at the table. Include a diversity of people to ensure that equity is addressed in plans and strategies as well as implementing regulations. The City of Austin is proposing a policy to partner with the public and private sectors to create new mobility solutions for historically underserved communities (City of Austin, n.d.).
Ensure all areas are covered by the service. Some cities require new mobility services be available to all residents, regardless of where they live. More and more, cities are requiring companies to disperse their vehicles (bike, e-scooter, or other vehicles) in low-income or underserved neighborhoods or across the entire city. During Portland’s e-scooter pilot that ran from July to November 2018, the permit required that each of the three companies participating in the pilot deploy 100 e-scooters in the historically underserved neighborhoods of East Portland. Only one company regularly complied with this requirement. The report found that, “many Black Portlanders and East Portlanders expressed enthusiasm and support for e-scooters, focus group participants also expressed an overall concern with traffic safety and being targeted for racial profiling and harassment. The prohibitive cost of renting and a lack of knowledge of e-scooter laws and low-income plans also presented barriers to use.” (Portland Bureau of Transportation, 2019, p 25). Other cities require a minimum number
social equity
Cities with Vision Zero policies (or their equivalents) must now consider how new mobility services could help them achieve community safety goals. Examples of cities incorporating Vision Zero goals into new mobility strategies and policies:
City of Portland. The City of Portland’s Transportation Plan was updated in 2018. Policy 9.68.a. states that the city should “[e]nsure that all levels of automated vehicles advance Vision Zero by operating safely for all users, especially vulnerable road users.” (City of Portland, Bureau of Transportation, 2018)
City of Seattle. New Mobility Playbook, Strategy 2.2 states the city will, “Ensure that new mobility advances our Vision Zero goal of ending traffic deaths and serious injuries on city streets by 2030.” (Seattle Department of Transportation, 2017) (Also see Social Equity Examples.)
City of San Francisco. San Francisco’s Guiding Principles for Emerging Technologies state, “Emerging Mobility Services and Technologies must be consistent with the City and County of San Francisco’s goal for achieving Vision Zero, reducing conflicts, and ensuring public safety and security.”1
1 San Francisco Municipal Transportation Agency (SFMTA) (no date), Guiding Principles for Emerging Mobility Services and Technology.

Urbanism Next | University of Oregon 20 | Navigating New Mobility | October 2019 | Section 3 - New Mobility Polices & Strategies
of vehicles in each neighborhood or designated zone. Washington, DC requires companies to put e-scooters in every ward, though companies complained that the capping of the total number of e-scooters makes this difficult (Dalgadillo, 2018).
Require diverse payment options. Some jurisdictions require companies to provide a payment option that does not include a smartphone or credit card, or that waives deposits for low-income people. Washington, DC requires companies to offer unlimited 30-minute trips to customers that are at 200% of the federal poverty level.
Ensure that companies promote equitable workforce policies. Ensure that companies reflect the community they serve and offer fair pay, labor policies, and practices.
Accommodate people with disabilities. Several cities encourage companies to provide options for people with disabilities, such as Washington, DC’s adaptive e-scooters.
Examples of cities incorporating equity into new mobility strategies and policies:
City of Seattle. Seattle’s New Mobility Playbook includes principles, plays, and actions to improve safety. The Principles put people and safety first, “Safety is paramount, no matter how you get around Seattle. Our streets should be comfortable and intuitive for our most vulnerable travelers (people walking and biking). Shared, automated, and other new mobility models should not only advance our Vision Zero safety goals, they should also maintain consumer protections.” (City of Seattle, 2018, p 32). Play 1 is to ensure a fair and just transportation system for all. The strategies in this play includes enhancing transportation services for vulnerable groups such as the LGBTQ community, youth, seniors, people with disabilities, and many others; ensure everyone can access smartphone services; ensure a wide array of payment options; make sure new mobility services are ADA accessible, and more.
Washington, DC. The District adopted a new e-scooter and motorized bicycle permit (effective January 1, 2019) that requires e-scooter coverage in every ward (eight total), and allows up to 600 e-scooters per company with the potential to increase that amount by 25% every three months. In addition, companies are encouraged to offer adaptive vehicles that can accommodate people with mobility devices (like wheelchairs). These vehicles are not counted towards the total allowed (District Department of Transportation, 2018).
Cities and transit agencies are considering the impact new mobility services are having on active transportation systems. While many cities include goals related to promoting pedestrian, bicycle, and transit systems and reducing reliance on single-occupancy vehicles, some cities are taking the next step to prioritize walking, biking, transit, over vehicles with a focus on reducing
active transportation (walk/bike/ e-scooter/transit)
Source: Photo by Ryoji Iwata on Unsplash.
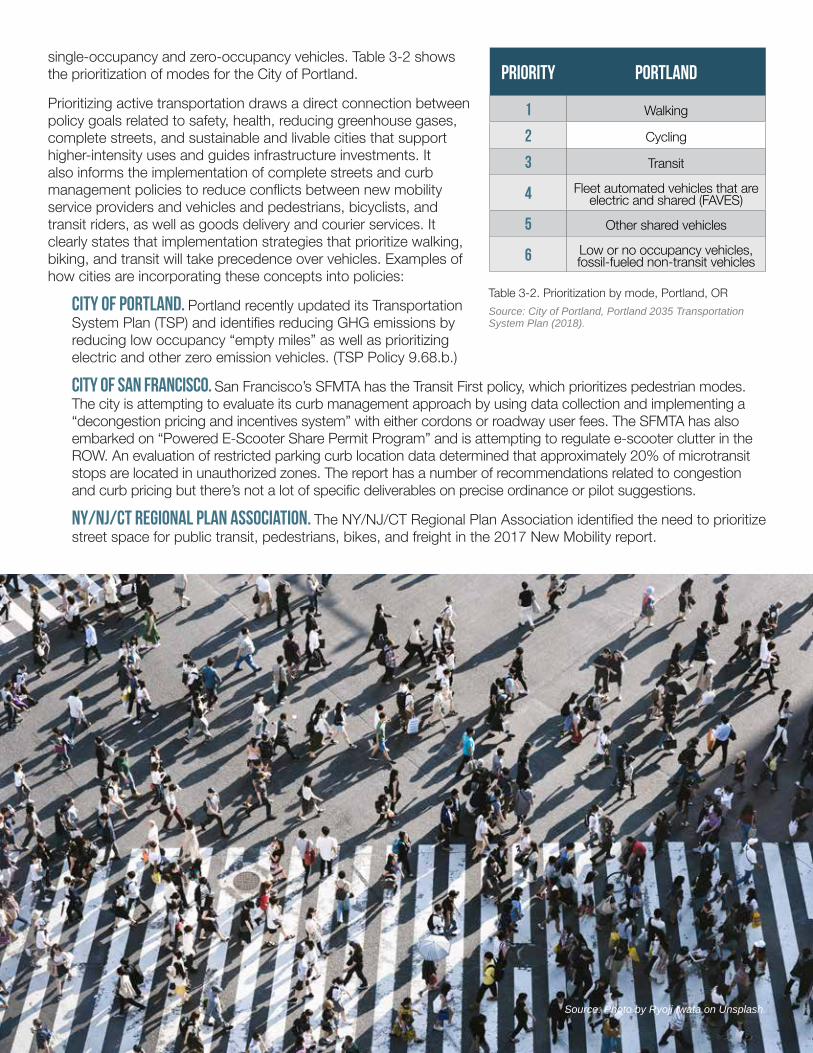
single-occupancy and zero-occupancy vehicles. Table 3-2 shows the prioritization of modes for the City of Portland.
Prioritizing active transportation draws a direct connection between policy goals related to safety, health, reducing greenhouse gases, complete streets, and sustainable and livable cities that support higher-intensity uses and guides infrastructure investments. It also informs the implementation of complete streets and curb management policies to reduce conflicts between new mobility service providers and vehicles and pedestrians, bicyclists, and transit riders, as well as goods delivery and courier services. It clearly states that implementation strategies that prioritize walking, biking, and transit will take precedence over vehicles. Examples of how cities are incorporating these concepts into policies:
City of Portland. Portland recently updated its Transportation System Plan (TSP) and identifies reducing GHG emissions by reducing low occupancy “empty miles” as well as prioritizing electric and other zero emission vehicles. (TSP Policy 9.68.b.)
City of San Francisco. San Francisco’s SFMTA has the Transit First policy, which prioritizes pedestrian modes. The city is attempting to evaluate its curb management approach by using data collection and implementing a “decongestion pricing and incentives system” with either cordons or roadway user fees. The SFMTA has also embarked on “Powered E-Scooter Share Permit Program” and is attempting to regulate e-scooter clutter in the ROW. An evaluation of restricted parking curb location data determined that approximately 20% of microtransit stops are located in unauthorized zones. The report has a number of recommendations related to congestion and curb pricing but there’s not a lot of specific deliverables on precise ordinance or pilot suggestions.
NY/NJ/CT Regional Plan Association. The NY/NJ/CT Regional Plan Association identified the need to prioritize street space for public transit, pedestrians, bikes, and freight in the 2017 New Mobility report.
Source: City of Portland, Portland 2035 Transportation System Plan (2018).
Table 3-2. Prioritization by mode, Portland, OR
priority portland
1 Walking
2 Cycling
3 Transit
4 Fleet automated vehicles that are electric and shared (FAVES)
5 Other shared vehicles
6 Low or no occupancy vehicles, fossil-fueled non-transit vehicles

Urbanism Next | University of Oregon 22 | Navigating New Mobility | October 2019 | Section 3 - New Mobility Polices & Strategies
Almost every new mobility strategy or plan includes a goal to keep people and goods moving. The potential for TNCs and AVs to dramatically increase congestion and VMT is concerning. Numerous reports have documented an increase in TNCs and the corresponding increase in congestion and reduced traffic speeds (Schaller, 2018; SFCTA, 2017; Fehr & Peers, 2018) as well as a reduction in transit use (Graehler et al., 2018). Given the potential for increased congestion and VMT, cities are considering efforts that reduce congestion and promote shared vehicles.
NACTO’s report Blueprint for an Autonomous Future (2017) provides a vision for how cities can design streets to increase throughput while promoting active transportation and autonomous transit. Figure 3-1 shows that streets designed for high-capacity AV transit service could move over 47,000 more people per hour than auto-oriented streets (NACTO, 2017).
At the policy guidance level, the cities of Portland, OR; Seattle, WA; and Vancouver, BC have all indicated they will prioritize shared, electric, autonomous vehicles.
Other potential strategies are to price single-occupancy or zero-occupancy vehicles at a higher rate than shared vehicles. To our knowledge, this idea is conceptual as of early 2019 as most cities and airports charge TNCs by the ride, and the only company offering commercial AV services is Waymo in Chandler, AZ (as of December 2018) and does not charge a city fee for each ride.
Another tactic is to price the curb higher at the most desirable pick-up/drop-off locations. For example, the San Francisco Airport charges TNCs $5 to pick-up/drop-off passengers in front of the terminals (the most convenient location) or $3.60 to get picked-up/dropped-off on the top level of the parking garage.
congestion and vehicle miles traveled
Source: NACTO, Blueprint for an Autonomous Future, 2017
Figure 3-1. Conceptual street capacity of different modes, NACTO, 2017

Urbanism Next | University of Oregon Section 3 - New Mobility Polices & Strategies | Navigating New Mobility | October 2019 | 23
Cities across the country understand that new mobility services provide a new opportunity to decrease greenhouse gas emissions, air pollution, and possibly improve storm water management. Example policies are:
City of Portland. Transportation System Plan Policy 9.68.c. is “Cut vehicle carbon pollution by reducing low occupancy ‘empty miles’ traveled by passenger vehicles with zero or one passengers. Prioritize electric and other zero direct emission vehicles operated by fleets and carrying multiple passengers.” (City of Portland, Bureau of Transportation, 2018).
denver region. The Mobility Choice Blueprint identified promotion of electrification of vehicles as one of its strategies to reduce GHG emissions and air pollution. The tactical actions are:
“5.1. Incentivize TNCs to use electric vehicles. Develop a goal, create a policy and incentivize the deployment and use of electric and other zero-emission vehicles by TNCs.
5.2. Create an electrified mobility development program. Identify regulatory hurdles and develop recommendations to encourage the adoption of electrified vehicles by public and private fleets.
5.3. Transition government fleets to electric and other zero-emission vehicles. Work with public agencies to create an aggressive and agreed-upon goal for converting a portion of their fleets to zero-emission vehicles. The goals may be tailored to fleet types as well as available vehicle technology.” (Colorado Department of Transportation, Denver Regional Council of Governments, Regional Transportation District, & Denver Metro Chamber, 2018).
Sustainability and environmental impacts
Source: Photo by John Cameron on Unsplash
City of Portland. The City of Portland’s Transportation System Plan states that to “ensure that connected and automated vehicles improve travel time reliability and system efficiency by: (1) maintaining or reducing the number of vehicle trips during peak congestion periods; (2) reducing low occupancy vehicle trips during peak congestion periods; (3) paying for use of, and impact on, Portland’s transportation system including factors such as congestion level, vehicle miles traveled, vehicle occupancy, and vehicle energy efficiency; and (4) supporting and encouraging use of public transportation.” (TSP Policy 9.68.b.)
Urbanism Next | University of Oregon 24 | Navigating New Mobility | October 2019 | Section 3 - New Mobility Polices & Strategies
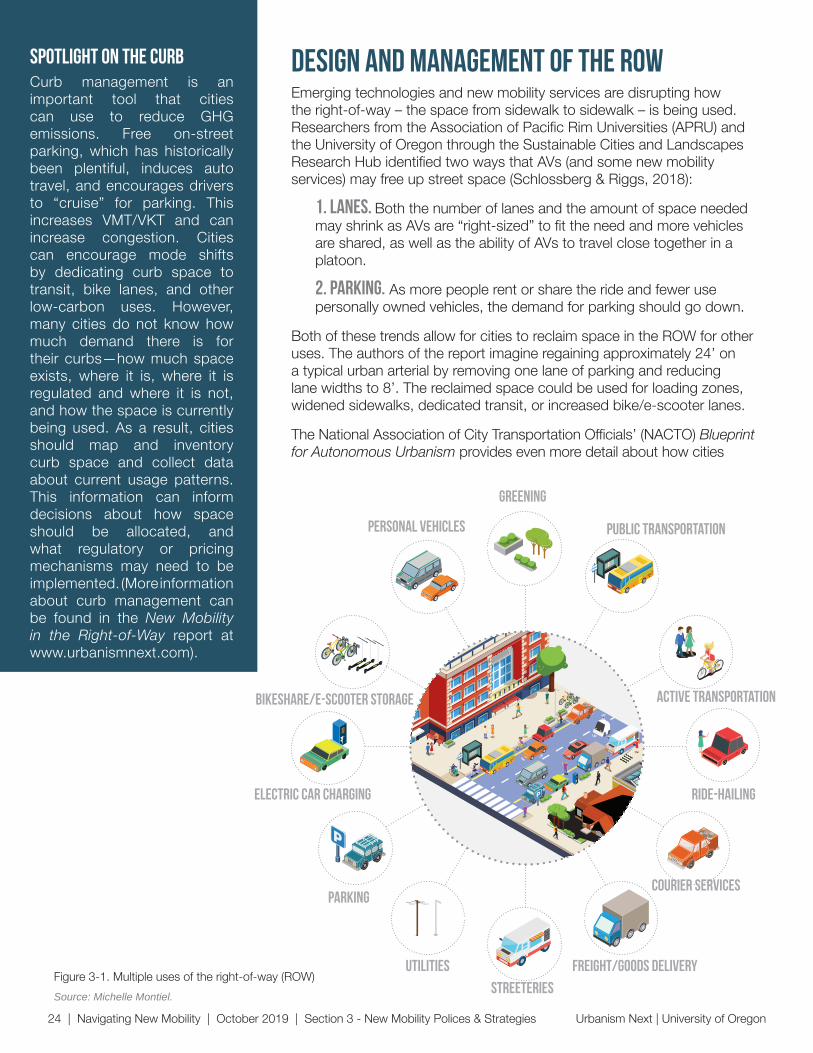
Emerging technologies and new mobility services are disrupting how the right-of-way – the space from sidewalk to sidewalk – is being used. Researchers from the Association of Pacific Rim Universities (APRU) and the University of Oregon through the Sustainable Cities and Landscapes Research Hub identified two ways that AVs (and some new mobility services) may free up street space (Schlossberg & Riggs, 2018):
1. Lanes. Both the number of lanes and the amount of space needed may shrink as AVs are “right-sized” to fit the need and more vehicles are shared, as well as the ability of AVs to travel close together in a platoon.
2. Parking. As more people rent or share the ride and fewer use personally owned vehicles, the demand for parking should go down.
Both of these trends allow for cities to reclaim space in the ROW for other uses. The authors of the report imagine regaining approximately 24’ on a typical urban arterial by removing one lane of parking and reducing lane widths to 8’. The reclaimed space could be used for loading zones, widened sidewalks, dedicated transit, or increased bike/e-scooter lanes.
The National Association of City Transportation Officials’ (NACTO) Blueprint for Autonomous Urbanism provides even more detail about how cities
design and management of the rowSpotlight on the curbCurb management is an important tool that cities can use to reduce GHG emissions. Free on-street parking, which has historically been plentiful, induces auto travel, and encourages drivers to “cruise” for parking. This increases VMT/VKT and can increase congestion. Cities can encourage mode shifts by dedicating curb space to transit, bike lanes, and other low-carbon uses. However, many cities do not know how much demand there is for their curbs—how much space exists, where it is, where it is regulated and where it is not, and how the space is currently being used. As a result, cities should map and inventory curb space and collect data about current usage patterns. This information can inform decisions about how space should be allocated, and what regulatory or pricing mechanisms may need to be implemented. (More information about curb management can be found in the New Mobility in the Right-of-Way report at www.urbanismnext.com).
TNC
TNC
FREE
PARKING
The High Cost of
Free Parking
DONALD SHOUP
personal vehicles puBLIC TRANSPORTATION
parking
bikeshare/e-scooter storage
COURIER SERVICES
active transportation
ride-hailingelectric car charging
utilities
Streeteries
freight/goods delivery
GREENING
Source: Michelle Montiel.
Figure 3-1. Multiple uses of the right-of-way (ROW)
Urbanism Next | University of Oregon Section 3 - New Mobility Polices & Strategies | Navigating New Mobility | October 2019 | 25
should think about autonomous vehicles (NACTO, 2017). NACTO envisions a future where streets are prioritized for pedestrians, bicyclists, and transit riders.
The City of Portland’s hierarchy of modes sets an overarching policy that prioritizes streets and street networks for pedestrians, bikes, transit, and freight above private vehicles or single-occupancy vehicles. A similar policy is identified in the NY/NJ/CT Regional Plan Association New Mobility (p 3) and Seattle’s New Mobility Playbook (Appendix C, p 5).
From adjacent store owners advocating for free parking for customers and employees, to commercial delivery companies demanding parking for trucks, to active transportation advocates requesting protected space to walk, bike, and take transit, battles over the curb are nothing new. What is new is the explosion of dockless bikes and e-scooters where they’ve been introduced and TNC services, along with the anticipation of AVs, that is convincing cities that they must develop new systems to manage, and price, the curb.
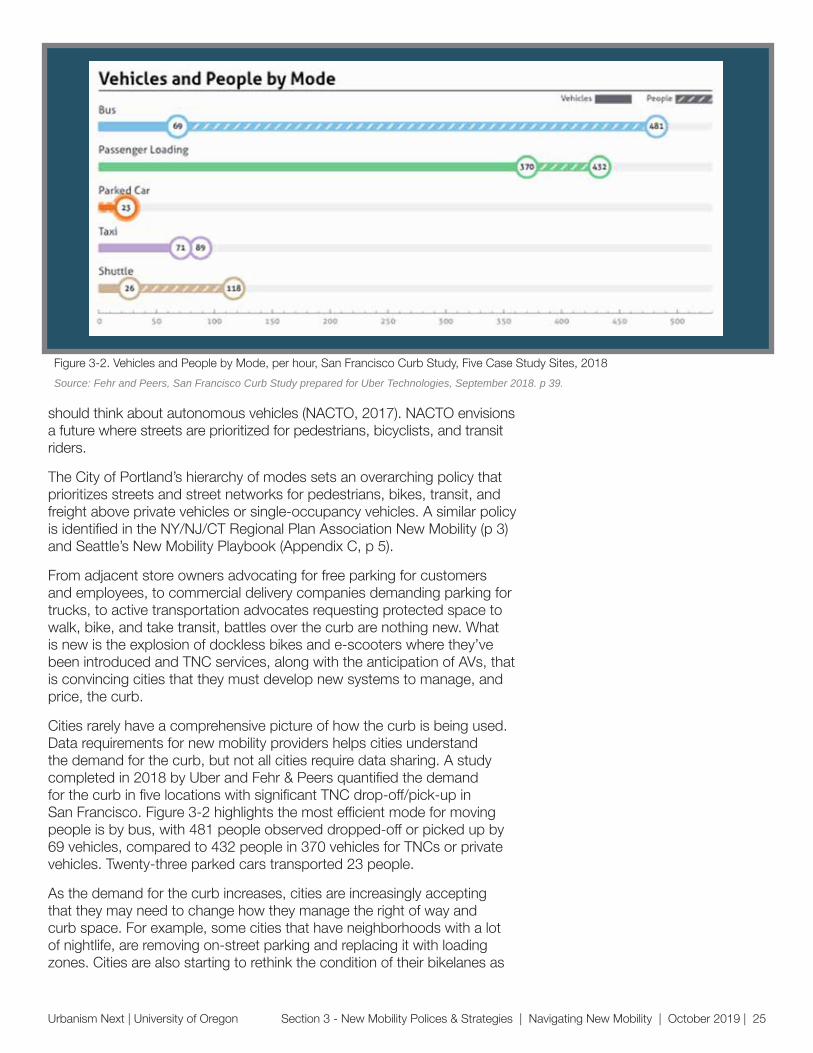
Cities rarely have a comprehensive picture of how the curb is being used. Data requirements for new mobility providers helps cities understand the demand for the curb, but not all cities require data sharing. A study completed in 2018 by Uber and Fehr & Peers quantified the demand for the curb in five locations with significant TNC drop-off/pick-up in San Francisco. Figure 3-2 highlights the most efficient mode for moving people is by bus, with 481 people observed dropped-off or picked up by 69 vehicles, compared to 432 people in 370 vehicles for TNCs or private vehicles. Twenty-three parked cars transported 23 people.
As the demand for the curb increases, cities are increasingly accepting that they may need to change how they manage the right of way and curb space. For example, some cities that have neighborhoods with a lot of nightlife, are removing on-street parking and replacing it with loading zones. Cities are also starting to rethink the condition of their bikelanes as
Source: Fehr and Peers, San Francisco Curb Study prepared for Uber Technologies, September 2018. p 39.
Figure 3-2. Vehicles and People by Mode, per hour, San Francisco Curb Study, Five Case Study Sites, 2018
Urbanism Next | University of Oregon 26 | Navigating New Mobility | October 2019 | Section 3 - New Mobility Polices & Strategies
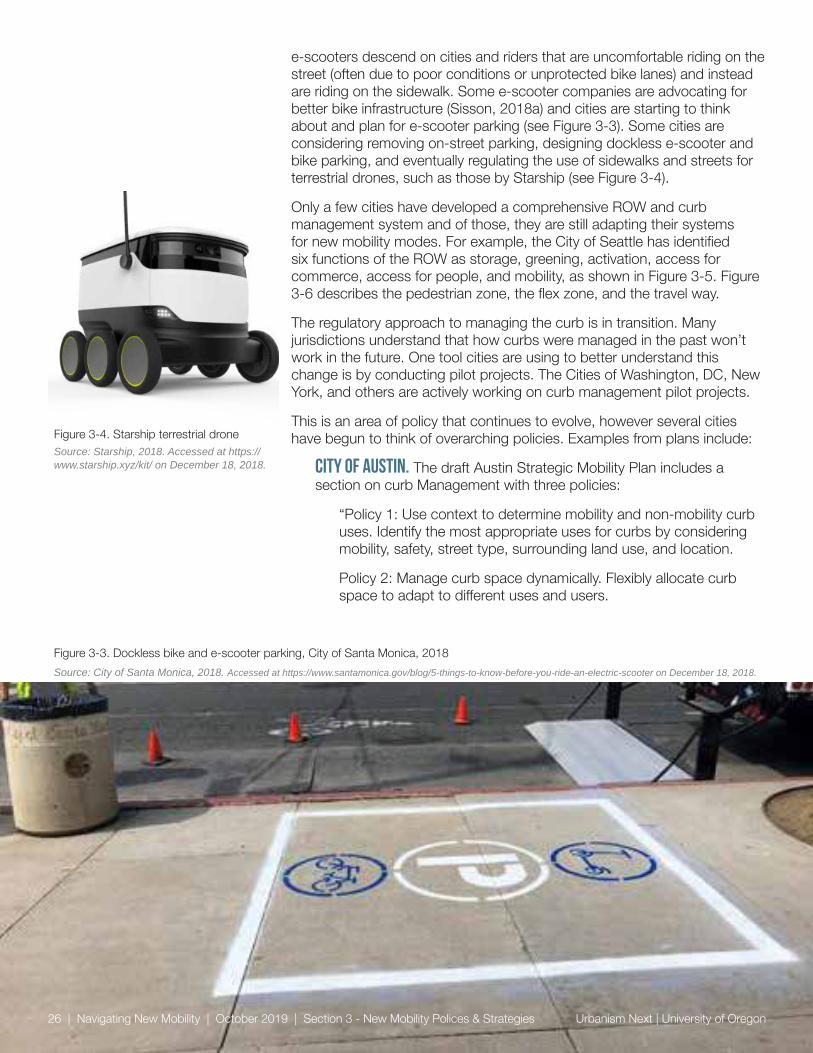
e-scooters descend on cities and riders that are uncomfortable riding on the street (often due to poor conditions or unprotected bike lanes) and instead are riding on the sidewalk. Some e-scooter companies are advocating for better bike infrastructure (Sisson, 2018a) and cities are starting to think about and plan for e-scooter parking (see Figure 3-3). Some cities are considering removing on-street parking, designing dockless e-scooter and bike parking, and eventually regulating the use of sidewalks and streets for terrestrial drones, such as those by Starship (see Figure 3-4).
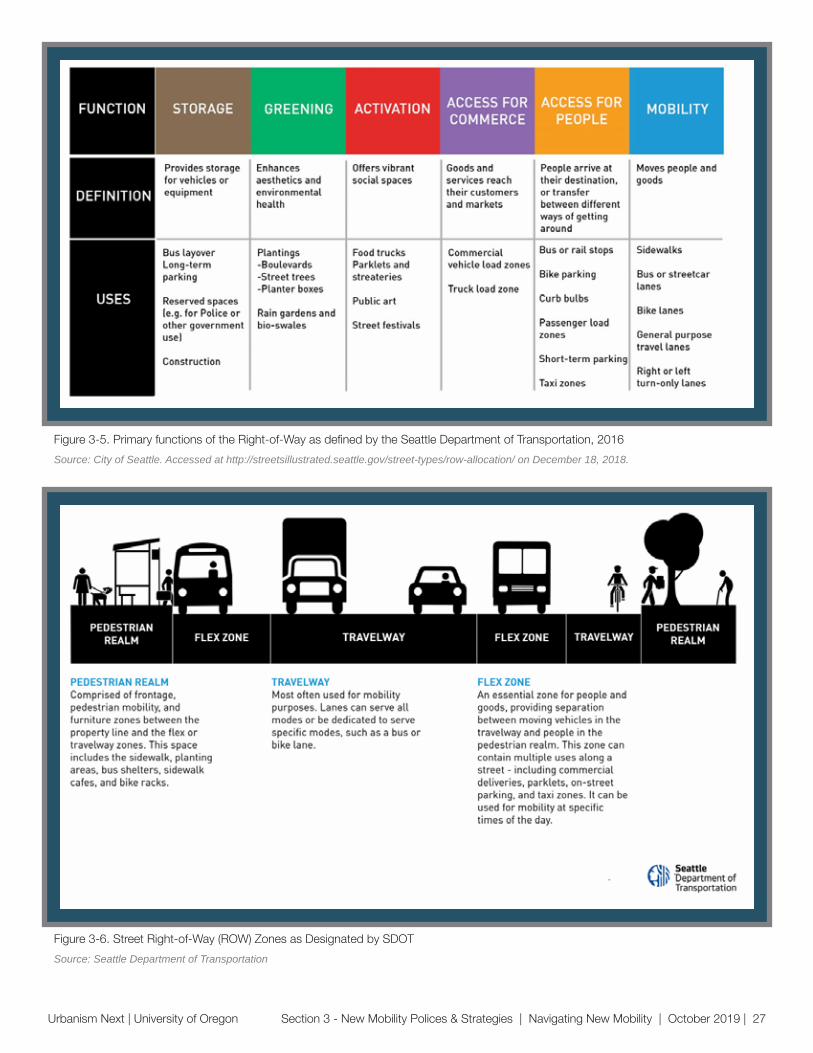
Only a few cities have developed a comprehensive ROW and curb management system and of those, they are still adapting their systems for new mobility modes. For example, the City of Seattle has identified six functions of the ROW as storage, greening, activation, access for commerce, access for people, and mobility, as shown in Figure 3-5. Figure 3-6 describes the pedestrian zone, the flex zone, and the travel way.
The regulatory approach to managing the curb is in transition. Many jurisdictions understand that how curbs were managed in the past won’t work in the future. One tool cities are using to better understand this change is by conducting pilot projects. The Cities of Washington, DC, New York, and others are actively working on curb management pilot projects.
This is an area of policy that continues to evolve, however several cities have begun to think of overarching policies. Examples from plans include:
city of austin. The draft Austin Strategic Mobility Plan includes a section on curb Management with three policies:
“Policy 1: Use context to determine mobility and non-mobility curb uses. Identify the most appropriate uses for curbs by considering mobility, safety, street type, surrounding land use, and location.
Policy 2: Manage curb space dynamically. Flexibly allocate curb space to adapt to different uses and users.
Source: Starship, 2018. Accessed at https://www.starship.xyz/kit/ on December 18, 2018.
Figure 3-4. Starship terrestrial drone
Source: City of Santa Monica, 2018. Accessed at https://www.santamonica.gov/blog/5-things-to-know-before-you-ride-an-electric-scooter on December 18, 2018.
Figure 3-3. Dockless bike and e-scooter parking, City of Santa Monica, 2018
Urbanism Next | University of Oregon Section 3 - New Mobility Polices & Strategies | Navigating New Mobility | October 2019 | 27
Source: City of Seattle. Accessed at http://streetsillustrated.seattle.gov/street-types/row-allocation/ on December 18, 2018.
Figure 3-5. Primary functions of the Right-of-Way as defined by the Seattle Department of Transportation, 2016
Source: Seattle Department of Transportation
Figure 3-6. Street Right-of-Way (ROW) Zones as Designated by SDOT
Urbanism Next | University of Oregon 28 | Navigating New Mobility | October 2019 | Section 3 - New Mobility Polices & Strategies
Policy 3: Streamline objects at the curb to improve safety and mobility. Coordinate the placement, number, and use of objects at the curb with natural features to realize multiple community benefits.”
Denver region. The Denver Region Mobility Choice Blueprint’s 2nd objective is to integrate shared mobility. Tactical Action 2.4 is to implement curbside management standards “for passenger loading and freight delivery by developing policies and employing technologies to monitor, enforce, and monetize curbside operations.” (Colorado Department of Transportation, Denver Regional Council of Governments, Regional Transportation District, & Denver Metro Chamber, 2018).
city of portland. TSP Policy 9.69.b is “Design and manage the mobility zone, Curb Zone, and traffic control devices to limit speeds to increase safety, to minimize cut-through traffic, evaluate future demand for pick-up and drop-off zones, and to prioritize automated electric vehicles carrying more passengers in congested times and locations.” (City of Portland, Bureau of Transportation, 2018).
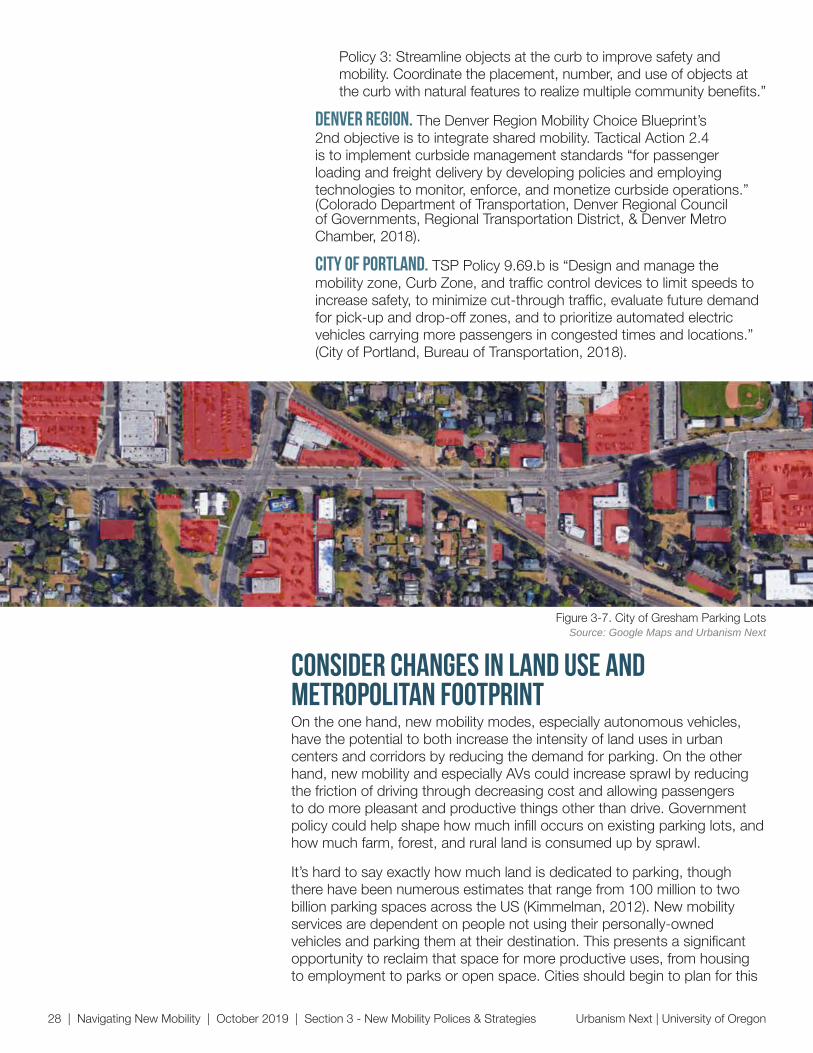
On the one hand, new mobility modes, especially autonomous vehicles, have the potential to both increase the intensity of land uses in urban centers and corridors by reducing the demand for parking. On the other hand, new mobility and especially AVs could increase sprawl by reducing the friction of driving through decreasing cost and allowing passengers to do more pleasant and productive things other than drive. Government policy could help shape how much infill occurs on existing parking lots, and how much farm, forest, and rural land is consumed up by sprawl.
It’s hard to say exactly how much land is dedicated to parking, though there have been numerous estimates that range from 100 million to two billion parking spaces across the US (Kimmelman, 2012). New mobility services are dependent on people not using their personally-owned vehicles and parking them at their destination. This presents a significant opportunity to reclaim that space for more productive uses, from housing to employment to parks or open space. Cities should begin to plan for this
consider changes in land use and metropolitan footprint
Source: Google Maps and Urbanism NextFigure 3-7. City of Gresham Parking Lots
Data is replacing concrete, asphalt and
steel as the foundation of 21st-century urban
transportation planning and management. New technologies have the potential to radically
improve the efficiency, cost, and inclusiveness of our
transport system.
– John Ellis (via Nacto)
Urbanism Next | University of Oregon Section 3 - New Mobility Polices & Strategies | Navigating New Mobility | October 2019 | 29
opportunity and consider the steps that will aid the transition and ensure city codes do not continue to require developers to provide even more parking that likely will not be used in the future. There is additional work to do to convince banks and others that financing parking will be increasingly risky as the demand for parking goes down.
Cities may want to be thinking and planning now for how they can more productively use reclaimed parking spaces. On-street parking can be used for drop-off/pick-up zones, or for transit, bikes, e-scooters, and other micromobility uses. It can also be used for landscaping and to manage storm water. When it comes time to consider what to do with off-street parking, cities will need to determine if the current zoning is adequate for the demand for that use, or if it should re-zone the land for other uses. It is likely that the areas with the greatest potential for redevelopment are in downtowns and corridors with high-capacity transit.
Some cities, like the City of Austin, considering changes to parking focus on on-street parking and how use of the ROW could evolve. The City of Chandler is one of the few places that has changed its zoning code to reduce minimum parking requirements, though it remains to be seen if this policy results in reduced off-street parking. Example policies are:
City of Austin. The draft Austin Strategic Mobility Plan parking policy 3 is “Coordinate on-street parking and curb management strategies for flexibility and adaptability with future parking and mobility technology.” (City of Austin, n.d.)
City of Chandler. To date, the City of Chandler is the only jurisdiction that has adopted minimum parking requirement reductions if a development includes loading zones for AVs. The objectives of the policy are to: “(1) Provide the City with more flexibility to reduce minimum parking requirements as parking demand changes, and, (2) Encourage develo9pments to install passenger loading zones.” (City of Chandler, 2018).
It’s particularly true that it is difficult to manage what you don’t measure, especially in relation to managing a city or regional transportation system. As new mobility services continue to disrupt how people and goods move across a region, decision-makers must better understand those changes and model how movement will change in the future to make sure they can wisely invest millions (or billions) of dollars in transportation funds. New mobility companies and others are collecting movement data, but jurisdictions aren’t likely to get that information from private companies unless they require it. Historically it has been difficult to get information from TNC companies and even when they do share data, it is sometimes protected from the public by non-disclosure agreements. Cities have been more successful requiring data of e-scooter companies. It remains to be seen if cities are successful in requiring data of all new mobility providers in the future.
The City of Los Angeles is a leader in this area and is striving to develop the idea of “Data as a Service.” Data as a Service is the “...rapid exchange of real-time conditions and service information between service providers,
make informed decisions “
”

data and transportation
“The real question is: can LADOT manage the transportation network similar to a data network or a telecommunications network? Should we consider any vehicle like any other “data packets” that need to transverse across a complex network? Can we use technology to change our first-come, first-served system into a fully managed system using software? The answer to all of these questions is yes.”
Source: LADOT Strategic Implementation, p4.
Urbanism Next | University of Oregon 30 | Navigating New Mobility | October 2019 | Section 3 - New Mobility Polices & Strategies
customers and the supporting infrastructure. This requires a seamless data exchange with a variety of partners and stakeholders, privacy and security protections, the capacity to analyze data from a variety of resources, and the ability to integrate this insight into a data-driven decision-making process (as opposed to an anecdotal one) for both system managers and city leaders. Data sharing is a relatively cost-effective way to enhance connectivity and system efficiency without constructing new physical infrastructure. With better data, LADOT will be in a position to become more responsive to the transportation needs of Angelenos as both a service provider and regulator of transportation in Los Angeles.” (Hand, 2016, p ii).
Los Angeles’ data policy recommendations (Hand, 2016) are:
1. Define what can be shared 2. Adopt privacy principles 3. Develop a standard data sharing agreement 4. Create a regional blueprint for system integration 5. Establish design guidelines for digital infrastructure
The City of portland noted in its e-scooter report that not all companies defined terms in the same way, which resulted in underreported vehicles for one company. Given the rapidly evolving nature of both the technology as well as the learning curve, cities have multiple reasons to ensure the data they get from companies is accurate, from enforcing vehicle distribution to collection of fees. Standardization and experience will likely help improve compliance over time. The City of Portland joined with 15 other jurisdictions and six companies to create the Open Mobility Foundation (OMF) . OMF’s goal is to create a governance structure around open-source mobility tools, with a focus on Mobility Data Specification (MDS).
Changes in mobility have been happening so fast that it’s been difficult for cities to keep up. Many new mobility companies have taken the “grenade launching” approach to the introduction of new services by putting them on the street without operating permits. Commercial e-scooter services, first introduced in Santa Monica, epitomizes what can go wrong with a deployment. In an interview for Curbed, Rick Cole, Santa Monica’s City Manager characterized the initial deployment of e-scooters in 2017 as a “punishing experiment.” He joked that when e-scooters were first introduced, “he spent a third of his time running the city, a third of his time answering emails from those who thought e-scooters represented the end of Western civilization, and a third of his time responding to Twitter posts that he was clamping down on the best invention since the iPhone – one that would save the planet” (Sisson, 2018b).
While many cities have been caught without a permitting process for new mobility technologies, they are starting to catch up. That said, they are finding that many city procurement policies may not be the best way to provide services to citizens, given the rapidly evolving technological landscape.
Cities across the country are embracing the use of pilot projects to introduce new mobility services or try to manage mobility services in a
manage innovation
Urbanism Next | University of Oregon Section 3 - New Mobility Polices & Strategies | Navigating New Mobility | October 2019 | 31
small, controlled area. Examples in Oregon include the Portland E-Scooter Pilot project and Metro’s Partnerships and Innovative Learning Opportunities in Transportation (PILOT) program. Pilot projects can be a cost-effective way to better understand how the technology operates, costs, its utility, and other intended and unintended consequences.
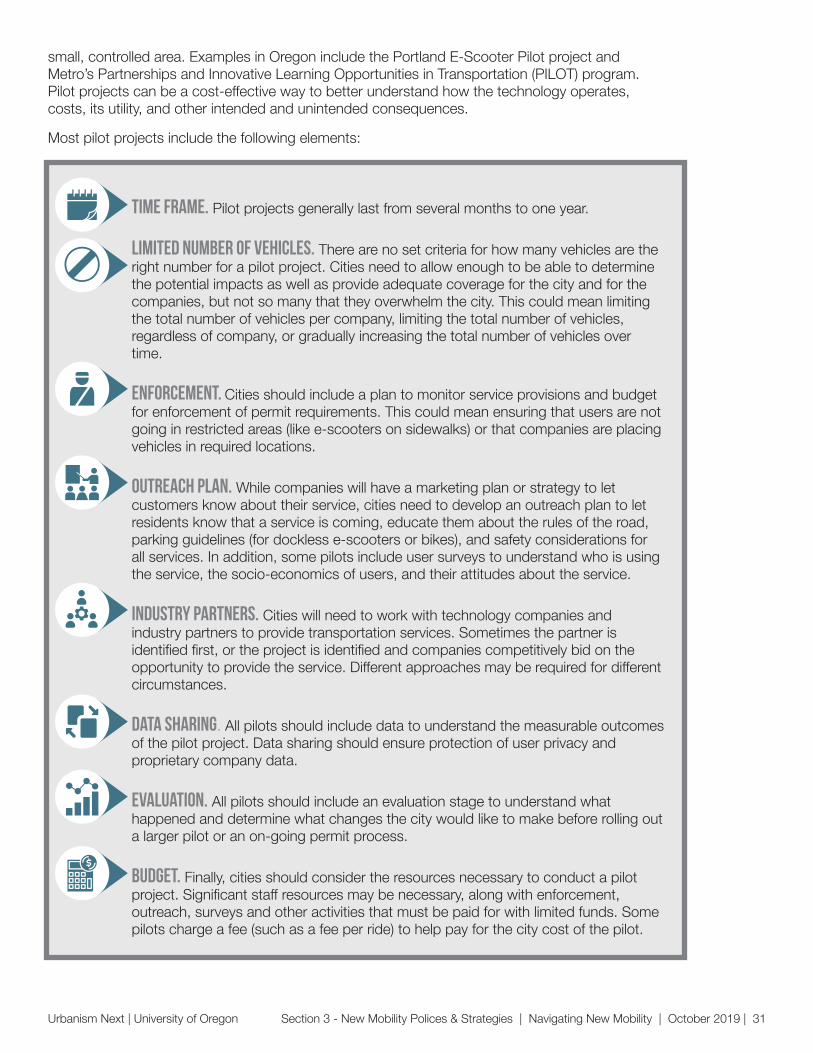
Most pilot projects include the following elements:
Time frame. Pilot projects generally last from several months to one year.
Limited number of vehicles. There are no set criteria for how many vehicles are the right number for a pilot project. Cities need to allow enough to be able to determine the potential impacts as well as provide adequate coverage for the city and for the companies, but not so many that they overwhelm the city. This could mean limiting the total number of vehicles per company, limiting the total number of vehicles, regardless of company, or gradually increasing the total number of vehicles over time.
Enforcement. Cities should include a plan to monitor service provisions and budget for enforcement of permit requirements. This could mean ensuring that users are not going in restricted areas (like e-scooters on sidewalks) or that companies are placing vehicles in required locations.
Outreach plan. While companies will have a marketing plan or strategy to let customers know about their service, cities need to develop an outreach plan to let residents know that a service is coming, educate them about the rules of the road, parking guidelines (for dockless e-scooters or bikes), and safety considerations for all services. In addition, some pilots include user surveys to understand who is using the service, the socio-economics of users, and their attitudes about the service.
Industry partners. Cities will need to work with technology companies and industry partners to provide transportation services. Sometimes the partner is identified first, or the project is identified and companies competitively bid on the opportunity to provide the service. Different approaches may be required for different circumstances.
Data sharing. All pilots should include data to understand the measurable outcomes of the pilot project. Data sharing should ensure protection of user privacy and proprietary company data.
Evaluation. All pilots should include an evaluation stage to understand what happened and determine what changes the city would like to make before rolling out a larger pilot or an on-going permit process.
Budget. Finally, cities should consider the resources necessary to conduct a pilot project. Significant staff resources may be necessary, along with enforcement, outreach, surveys and other activities that must be paid for with limited funds. Some pilots charge a fee (such as a fee per ride) to help pay for the city cost of the pilot.
Created by ProSymbolsfrom the Noun Project

Urbanism Next | University of Oregon 32 | Navigating New Mobility | October 2019 | Section 3 - New Mobility Polices & Strategies
New mobility technologies are already disrupting how cities and other jurisdictions pay for transportation infrastructure as well as operations and maintenance. Some agencies are seeing a benefit from charging for TNC rides, such as the Los Angeles Airport that saw TNC revenues of $24.8 million in 2017, offsetting a decrease in revenues of $3.4 million from bus, limousine, and taxi services (Department of Airports, Los Angeles, CA, 2017). However, many other jurisdictions will need to plan for changes in revenue from parking and parking citations, vehicle registration, moving vehicle citations, and most significantly, reductions in the fuels tax.
Most of the major car companies developing autonomous vehicles are testing hybrid and electric vehicles. A 2017 article in the Verge reported that General Motors, Ford, Tesla, and Waymo have committed to creating AVs in hybrid or electric vehicles (Hawkins, 2017). One reason is that the electronics on AVs require significant battery power. The need for power increases as automation increases. In addition, car manufacturers are ramping up production of zero-emission vehicles to comply with California’s GHG reduction targets. As more people and goods are transported in hybrid and electric vehicles, less money will be spent on fuel taxes. According to the Tax Policy Center, over $43.8 billion in motor fuel tax revenue was collected in the United states in 2015, including $540 million in Oregon.1 Fuel taxes are one of the primary sources of transportation funding. On one hand, cities will need to think about how they will replace funding for transportation infrastructure. On the other hand, emerging technologies are a powerful new tool that can be used to price for congestion.
Currently, some cities and other jurisdictions are charging a per ride fee, a % of the total fee, or a vehicle per day fee for new mobility services. While no city in the United States currently charges for congestion, Oregon is one of a few states that is piloting a road usage charge that has the potential to collect a per mile fee. This may be another model for charging for the use of roads. Another option is to convert on-street parking to drop-off/pick-up pricing (especially for high demand locations). Of course, there are many
1 https://www.taxpolicycenter.org/statistics/motor-fuel-tax-revenue. Accessed 12/17/18.
Consider the fiscal impacts

Urbanism Next | University of Oregon Section 3 - New Mobility Polices & Strategies | Navigating New Mobility | October 2019 | 33
other ways to charge vehicles for traveling in the most congested locations at the most popular times, such as cordon pricing. Cities should consider a full suite of options to determine the methods that are best to achieve community goals.
Cities should make sure their policies include the right to charge new mobility companies a fee to operate in their city, whether or not they actually collect the fee or not.
Examples:
City of Portland. The Transportation System Plan (2018) 9.68.b includes language to “ensure that connected and automated vehicles improve travel time reliability and system efficiency by…(3) paying for use of, and impact on, Portland’s transportation system including factors such as congestion level, vehicle miles traveled, vehicle occupancy, and vehicle energy efficiency.”
Denver Region. The Mobility Choice Blueprint identifies several tactical actions to help fund transportation infrastructure including exploring a road usage charge for the state of Colorado as well as supporting legislation to ensure that AVs generate funding from new user fees, registration fees, and other revenue streams to help fund the transportation system (Colorado Department of Transportation et al., 2018).
City of Los Angeles. The City of Los Angeles envisions a suite of transportation financing options in its Urban Mobility in a Digital Age including charging by the mile, sales tax, public/private partnerships, infrastructure banks, different ownership models, and municipal bonds (Hand, 2016).
Source: Photo by Thought Content on Unsplash
Below: Some agencies are seeing a benefit from charging for TNC rides, such as the Los Angeles Airport that saw TNC revenues of $24.8 million in 2017, offsetting a decrease in revenues of
$3.4 million from bus, limousine, and taxi services (Department of Airports, Los Angeles, CA, 2017).

Urbanism Next | University of Oregon

Navigating New Mobility | October 2019 | 35
04 | Implications for Gresham and Eugene

Urbanism Next | University of Oregon 36 | Navigating New Mobility | October 2019 | Section 4 - Gresham & Eugene
STATE OF OREGON
Now that we’ve discussed some of the first and second level impacts and common policy topics and approaches taken around the country to address these impacts, the Cities of Gresham and Eugene will need to decide what types of policies they will need to consider and adopt. This final section discusses the existing statewide conditions, as well as the unique attributes of each city, the policy plans to consider, and recommends next steps for each city.
Source: University of Oregon, University Communications
Left: Gresham, OR. Right: Eugene, OR
section Overview
Oregon has few statewide policies or regulations specific to new mobility. Oregon is the only state that does not have statewide TNC regulations, though several bills were introduced in the 2019 Oregon Legislature and failed to pass. In the meantime, jurisdictions must negotiate on a city-by-city basis with TNC service providers. Cities that have adopted TNC regulations are Portland, Eugene, Medford, Salem, Ashland, Bend, and Redmond, among others. The state has no regulations for micromobility (e-scooters or bikeshare) beyond helmet requirements and no riding e-scooters on sidewalks.
New mobility regulations
The Oregon Department of Transportation’s (ODOT) Office of Innovation is studying the impacts of autonomous and connected vehicles and released the Emerging Technology Impact Assessment Final Report in March of 2019 (Jacobs, 2019). ODOT plans to engage stakeholders, including Area Commissions on Transportation (ACTs), Metropolitan Planning Organizations (MPOs), and peer state agencies next.
Planning for Autonomous Vehicles

Urbanism Next | University of Oregon Section 4 - Gresham & Eugene | Navigating New Mobility | October 2019 | 37
The Oregon Legislature created the Oregon Automated Vehicle Task Force1 with the passage of HB 4063 in the 2018 legislative session with the purpose of making recommendations on autonomous vehicles to the Legislature. The Task Force was created in May 2018 and its first report focused on licensing and registration, law enforcement and crash reporting, cybersecurity, and insurance and liability was completed in September 2018 (Task Force on Autonomous Vehicles, 2018). The Task Force is planning on submitting a second report to the Legislature in September 2019 that focuses on land use, road and infrastructure design, public transit, workforce changes, and state responsibilities relating to cybersecurity and privacy.
1 Note that one of the authors of this report, Becky Steckler, is a member of the AV Task Force.
The University of Oregon and others have conducted research regarding the potential impact of autonomous vehicles on transportation revenues, especially the gas tax. The state of Oregon has one of the longest running road usage charge pilot projects in the country – OreGo. While the pilot project appears to have successfully considered many of the logistical challenges of charging drivers for the vehicle miles traveled, the political will to do something with that information has stalled. That said, HB 2017, a transportation funding bill passed in the 2017 Oregon Legislative session directed the Oregon Transportation Commission to develop a congestion pricing proposal.
The gas tax and OreGo
Source: OreGo, http://www.myorego.org/Figure 4-1. OreGo tracks mileage–users pay a road usage charge for the amount of miles they drive instead of the fuel tax.

Urbanism Next | University of Oregon 38 | Navigating New Mobility | October 2019 | Section 4 - Gresham & Eugene
CITY OF GRESHAM
The City of Gresham is located on the east side of the Portland metropolitan region. Located within Multnomah County and the Metro regional boundaries, it must comply with Metro’s Regional Framework Plan, Urban Growth Management Functional Plan, and the Regional Transportation Plan, as well as applicable statewide policies. Metro has drafted an Emerging Technology Strategy that focuses on issues related to equity, choices, information, and innovation (Metro, 2018). The strategy also discusses the need to convene partners and establish new mobility policies that align with the strategy.
The City of Gresham currently has no operating regulations for new mobility services. TNCs operate without a permit, and there is no bikeshare program (docked or dockless) that requires regulations. During the 2018 Portland E-Scooter Pilot, Gresham ordered the e-scooter companies to remove any e-scooters that ended up in Gresham. The rationale for requesting e-scooter vendors to remove them was that Gresham was concerned about how the e-scooters would operate and the possibility they could impede access for people with disabilities or create unsafe conditions in the right-of-way. Because Gresham did not have guidelines or standards developed to address this issue, City officials requested removal of e-scooters that ended up in Gresham.
Regional context
Source: https://en.wikipedia.org/wiki/Gresham,_OregonGresham, OR

op
po
rt
un
itie
s &
re
co
mm
en
da
tio
ns
key
TSP - Transportation System Plan (2014)
ATP - Active Transportation Plan (2018)
CP - Comprehensive Plan
Urbanism Next | University of Oregon Section 4 - Gresham & Eugene | Navigating New Mobility | October 2019 | 39
The City of Gresham’s long-range policies for transportation and land use currently include many supportive goals, objectives, strategies, and action items that should be considered when developing new mobility policies. Urbanism Next researchers conducted a preliminary scan of Gresham’s plans, including the Transportation System Plan (2014), the Active Transportation Plan (2018), and the Comprehensive Plan. Table 4-1 shows the policies, actions, and implementation measures in the plans that are relevant to new mobility. These plans are generally supportive of safety, social equity, active transportation, reducing congestion and VMT, sustainability and environment, design and management of the ROW, and changes in land use and metropolitan footprint that should be incorporated into policies and regulations for new mobility services. As the City considers new mobility goals, policies, and actions, it should make sure that they are designed to achieve city goals.
In addition, there are a number of opportunities to expand some specific city policies to address new mobility issues. These are:
Active Transportation: Mobility HubsOpportunity: TSP: Transit System, Policy 3, Action 7 states the City will “Work with TriMet to provide secure and convenient bicycle parking at light rail station and transit centers…”
Recommendation: The City may want to consider working with TriMet to develop multimodal mobility hubs similar to Seattle and other jurisdictions that include bikes, e-scooters, and other modes to ease the transition from one mode to the next.
Active Transportation: Conflict between modesOpportunity: TSP: Bicycle Network, Policy 2, Action 1 directly supports the need for new mobility services to prioritize active transportation and reduce potential conflicts.
Recommendation: The City of Gresham could consider adopting a policy that prioritizes funding for walking, biking, transit, microtransit, and electric modes over conventional gas single- or zero-occupancy modes of travel.
Active Transportation: Conflict between modesOpportunity: TSP: Pedestrian System, Policy 1, Action 1 guides Gresham to “design and build sidewalks…free of hazards…” directs the City to ensure sidewalks are unobstructed.
Recommendation: This policy language could be expanded to also support new mobility policies which ensure that parked or moving dockless vehicles (like e-scooters) do not obstruct or impede pedestrians.
Policy Scan: Relevant goals, policies, and actions; opportunities, gaps, and recommendations
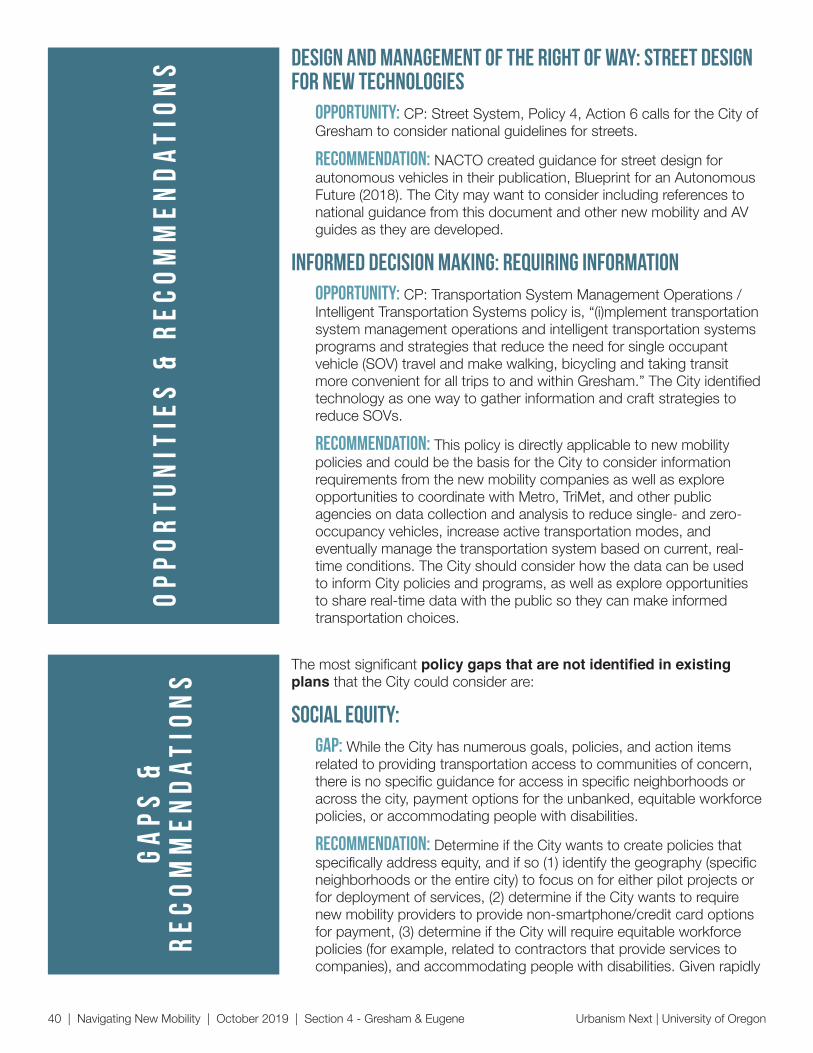
op
po
rt
un
itie
s &
re
co
mm
en
da
tio
ns
ga
ps
&
re
co
mm
en
da
tio
ns
Urbanism Next | University of Oregon 40 | Navigating New Mobility | October 2019 | Section 4 - Gresham & Eugene
Design and Management of the Right of Way: Street design for new technologies
Opportunity: CP: Street System, Policy 4, Action 6 calls for the City of Gresham to consider national guidelines for streets.
Recommendation: NACTO created guidance for street design for autonomous vehicles in their publication, Blueprint for an Autonomous Future (2018). The City may want to consider including references to national guidance from this document and other new mobility and AV guides as they are developed.
Informed Decision Making: Requiring information Opportunity: CP: Transportation System Management Operations / Intelligent Transportation Systems policy is, “(i)mplement transportation system management operations and intelligent transportation systems programs and strategies that reduce the need for single occupant vehicle (SOV) travel and make walking, bicycling and taking transit more convenient for all trips to and within Gresham.” The City identified technology as one way to gather information and craft strategies to reduce SOVs.
Recommendation: This policy is directly applicable to new mobility policies and could be the basis for the City to consider information requirements from the new mobility companies as well as explore opportunities to coordinate with Metro, TriMet, and other public agencies on data collection and analysis to reduce single- and zero-occupancy vehicles, increase active transportation modes, and eventually manage the transportation system based on current, real-time conditions. The City should consider how the data can be used to inform City policies and programs, as well as explore opportunities to share real-time data with the public so they can make informed transportation choices.
The most significant policy gaps that are not identified in existing plans that the City could consider are:
Social Equity: gap: While the City has numerous goals, policies, and action items related to providing transportation access to communities of concern, there is no specific guidance for access in specific neighborhoods or across the city, payment options for the unbanked, equitable workforce policies, or accommodating people with disabilities.
Recommendation: Determine if the City wants to create policies that specifically address equity, and if so (1) identify the geography (specific neighborhoods or the entire city) to focus on for either pilot projects or for deployment of services, (2) determine if the City wants to require new mobility providers to provide non-smartphone/credit card options for payment, (3) determine if the City will require equitable workforce policies (for example, related to contractors that provide services to companies), and accommodating people with disabilities. Given rapidly
ga
ps
& r
ec
om
me
nd
at
ion
s
Urbanism Next | University of Oregon Section 4 - Gresham & Eugene | Navigating New Mobility | October 2019 | 41
changing socio-economic trends, the City should develop flexible policies or revisit them regularly to ensure they continue to address the needs of communities of concern.
Sustainability and Environment: gap: The City does not have explicit sustainability or environmental policies related to new mobility services, specifically the reduction of GHG emissions.
Recommendation: Even absent a Climate Action Plan, the City of Gresham adopted numerous policies and actions items that could result in lower GHG emissions, such as promoting low-carbon modes like walking, biking, and transit, reducing dependence on vehicles, and encouraging compact development close to transit. The City could also consider how these activities could reduce air pollution from vehicles. Finally, the City could take advantage of the opportunities presented by the potential to decrease parking and consider strategies and activities that result in a reduction of on-street parking and improve water quality through stormwater management.
Design and management of the right-of-way: gap: The City does not have any regulations related to management of new mobility in the right-of-way, specifically the curb and sidewalk.
Recommendation: New mobility impacts suggest that the City will need to take a new approach to managing the ROW and especially the curb, specifically in high demand locations like downtown and MAX stations. The City will need to understand changes in demand for the curb for both passengers and freight and goods delivery. The City should prepare residents and adjacent property owners that changes are likely and work with them, as well as continue to monitor promising practices from across the country, to prepare policies that improve the throughput of people and goods.
Changes in land use and metropolitan footprint: gap: The City of Gresham’s policies assume that driving a personally-owned vehicle will be the primary mode of movement in the City.
Recommendation: If new mobility does reduce reliance on personally-owned vehicles, then this assumption would need to be updated in transportation and land use plans. The City may need to reevaluate the amount of land zoned for residential, retial, office, and commercial, as well as industrial land to determine if the supply of land is adequate for the demand (especially if much more of the land is available for development instead of parking). The City may want to consider focusing redevelopment and development of parking lots in key districts/neighborhoods and along high-capacity transit routes. In addition, the City should closely monitor e-commerce and experiential retail trends to determine if it needs to re-evaluate the demand for commercial and retail land in the next update of its Comprehensive Plan.

ga
ps
& r
ec
om
me
nd
at
ion
s
Urbanism Next | University of Oregon 42 | Navigating New Mobility | October 2019 | Section 4 - Gresham & Eugene
Informed decision making: gap: The City of Gresham currently has no goals, policies, or action measures directly related to the collection of data or information from new mobility providers. This information would help the City better understand how the transportation system is being used, as well as how safe the services are, if they are providing affordable services to all Gresham residents, impacts on active transportation, demand for the curb, and other issues. This information is also critical for enforcement of requirements and fees (if applied).
Recommendation: The City of Gresham should review the Los Angeles Data Mobility Specifications and work with regional partners (as well as the City of Portland which has adapted this standard to collect data from e-scooter companies), to adopt a data standard for the City.
Managing innovation: gap: While the City of Gresham has formal relationships with regional partners (TriMet, Metro, and surrounding jurisdictions), coordination on new mobility services is still evolving.
Many larger cities where new mobility deployments are happening first are trying to better manage impacts by conducting pilot projects. The City of Gresham does not have a pilot project process.
Recommendation: Gresham’s plans reference the coordination between its policies and regional and state policies, as well as activities to coordinate those activities. Gresham and regional leaders have an opportunity to coordinate more closely and formally on the collection and analysis of data, coordination on policies regulating new mobility providers, as well as coordination and payment standards for new mobility services.
It is unclear if there will be enough demand for pilot projects in Gresham, but if there is, the City may want to consider creating a pilot project framework. That said, the City may want to initiate pilot projects to better understand new mobility services on the City of Gresham. It may be appropriate to recruit companies for public/private partnerships to test these services.
Fiscal impacts and new mobility revenue: gap: Gresham has no adopted policies that specifically require that new mobility services fund transportation infrastructure and its impact on the transportation system.
Recommendation: The City should evaluate different fee options to create a funding mechanism that helps the City achieve its goals, including paying city costs for managing new mobility (permitting, enforcement, evaluation, etc.), paying for the impact on transportation infrastructure and the transportation system, and investments that increase capacity and throughput of people and goods.

New Mobility Policy Topics
City of Gresham policies and Actions
Safety
TSP: Transportation System Policy 1, Action 1, 4 Policy 2, Action 5 Policy 4, Action 1, 2 The TSP policies related to safety call for
providing and promoting a transportation system and options that are safe, convenient, and comfortable. Investments should focus in part on pedestrian and bicycle improvements that connect to transit and schools. It calls for investments in high-crash locations. The ATP also calls for increasing safety for walkers and bikers. The Comprehensive Plan calls for using design to reduce speeds and crashes as well as ensuring the street system supports healthy, active living.
TSP: Street System Policy 1, Action 4, 7 Policy 2, Action 4 Policy 3, Action 5 Policy 4, Action 4
TSP: Transit System Policy 4, Action 1, 2
TSP: Pedestrian System Policy 1, all Actions, 1
ATP Revised TSP Policy 1
CP: Transportation System Policy 4, Action 1, 2
CP: Street System Policy 4, Action 3, 4, 5, 6
Social Equity
TSP: Transportation System Policy 1, Action 2 Policy 2, Action 5
The TSP policies and actions focus on responding to “all communities’ needs” including those identified by residents. The TSP Transit policies and actions include paratransit service and addressing the needs of the transit dependent such as the elderly, low-income, and people with disabilities.
TSP: Transit System Policy 2, Action 1 Policy 3, Action 3
TSP: TDM Policy 1, Action 2
ATP Revised TSP Policy 7, 8, 9, 10
Active Transportation
TSP: Transportation System Policy 1, Action 1, 3, 5, 7 Policy 2, Action 2, 4
All of the plans identify policies and activities to invest in, promote, and otherwise make walking, biking, and transit use safe, convenient, and more accessible in almost all areas of the city.
TSP: Street System Policy 1, Action 1, 2, 3, 4, 5, 7 Policy 2, Action 8, 9 Policy 3, Action 2, 6 Policy 4, Action 4
TSP: Transit System Policy 2, Action 1 Policy 3, Action 4, 6, 7
TSP: Bicycle Network Policy 1, all Actions Policy 2, all Actions, 1
TSP: Pedestrian system Policies 1, 2, 3, all Actions
TSP: TDM Policy 1, Action 1, 3
ATP All revised TSP Policies, p 18.
CP: Downtown Plan Dist Urban Design Policy 8 Transp & Con Policy 1, 2; Action 1
CP: Transportation System Policy 1, all Actions
CP: Street System Policy 1, all Actions Policy 2, Actions 1, 2
CP: Transit All Policies and Actions
CP: Bicycle System All Policies and Actions
CP: Pedestrian System All Policies and Actions
CP: Community Health and the Built Environment
All Policies and Actions
key
TSP - Transportation System Plan (2014)
ATP - Active Transportation Plan (2018)
CP - Comprehensive Plan
Urbanism Next | University of Oregon Section 4 - Gresham & Eugene | Navigating New Mobility | October 2019 | 43
Table 4-1 shows existing policies in the Transportation System Plan, the Active Transportation Plan, and the Comprehensive Plan for the City of Gresham that relate to new mobility services and should inform policies developed for the operation of those services in Gresham.
Table 4-1. City of Gresham scan of Policies relevant for new mobility

New Mobility Policy Topics
City of Gresham policies and Actions
Congestion and vehicle miles traveled
TSP: Transportation System Policy 1, Action 4, 5, 7, 8The TSP identifies policies and actions to reduce automobile dependence through support and investment in other modes. The TDM policies and actions in the TSP and the Comprehensive Plan are designed to reduce congestion and VMT. Regarding freight, the TSP identifies the need to design streets to provide for efficient and safe movements of trucks.
TSP: Street System Policy 2, Action 5 Policy 3, Action 2
TSP: Transit System Policy 1, Action 3
TSP: TDM Policy 1, Action 1
TSP: Truck and Freight System Action 1, 2
CP: Transportation System Policy 2, Action 6
CP: TDM All Policies and Actions
Sustainability and the Environment
TSP: Transportation System Policy 1, Action 6 Policy 2, Action 3, 7
The TSP calls for protecting natural resources, improving air and water quality, promoting energy-efficient or low- and zero-emissions vehicles and bicycling, transit, and pedestrian modes. The only action directly related to GHG emission reductions is TSP: TDM Policy 1, Action 10: “Support state and regional programs aimed at reducing greenhouse gases and other harmful emissions.”
TSP: Street System Policy 4, Action 1
TSP: Transit System Policy 1, Action 3
TSP: TDM Policy 1, Action 10
CP: Air Quality Policy 3, 4 Action 3, 7
CP: Water Quality Policy 6
CP: Transportation System Policy 2, Action 7
CP: Street System Policy 4, Action 1
Design and management of the right of way
TSP: Transportation System Policy 2, Action 1, 2
Most of the policies and actions in these sections refer to multi-modal street design and ensuring an “efficient” transportation system that takes advantage of the existing capacity and makes it more efficient.
TSP: Street System Policy 2, Action 5 Policy 4, Action 4
TSP: Transit System Policy 3, Action 3, 10
TSP: Truck and Freight System Policy 1, Action 1
CP: Comm Design, Trees and Veg
Policy 1, 11 Action 9, 10
CP: Downtown Plan Dist Urban Design Action 4
CP: Transportation System Policy 2, Actions 1, 2
CP: Street System Policy 2, Action 5, 7, 8 Policy 3, Actions 3, 4
Changes in land use and metropolitan footprint
TSP: Transit System Policy 3, Action 5, 8, 9, 10
Most of the policies, actions, and implementation items identified here are for densities of housing and jobs that support transit and the efficient development of land, especially in downtown and other residential and employment districts.
CP: Commercial Land Use Policy 1, Implementation 2 Policy 2, Implementation 1, 3
CP: Industrial Land Use Action 9, 11, 14
CP: Downtown Plan District Trans & Connection Policy 6; Action 2 Parks & People Policy 1 Economic Development Policy 4 Downtown Housing Policy 1, 6
CP: Street System Policy 3, Action 1
key
TSP - Transportation System Plan (2014)
ATP - Active Transportation Plan (2018)
CP - Comprehensive Plan
Urbanism Next | University of Oregon 44 | Navigating New Mobility | October 2019 | Section 4 - Gresham & Eugene
Table 4-1. City of Gresham scan of Policies relevant for new mobility [cont.]
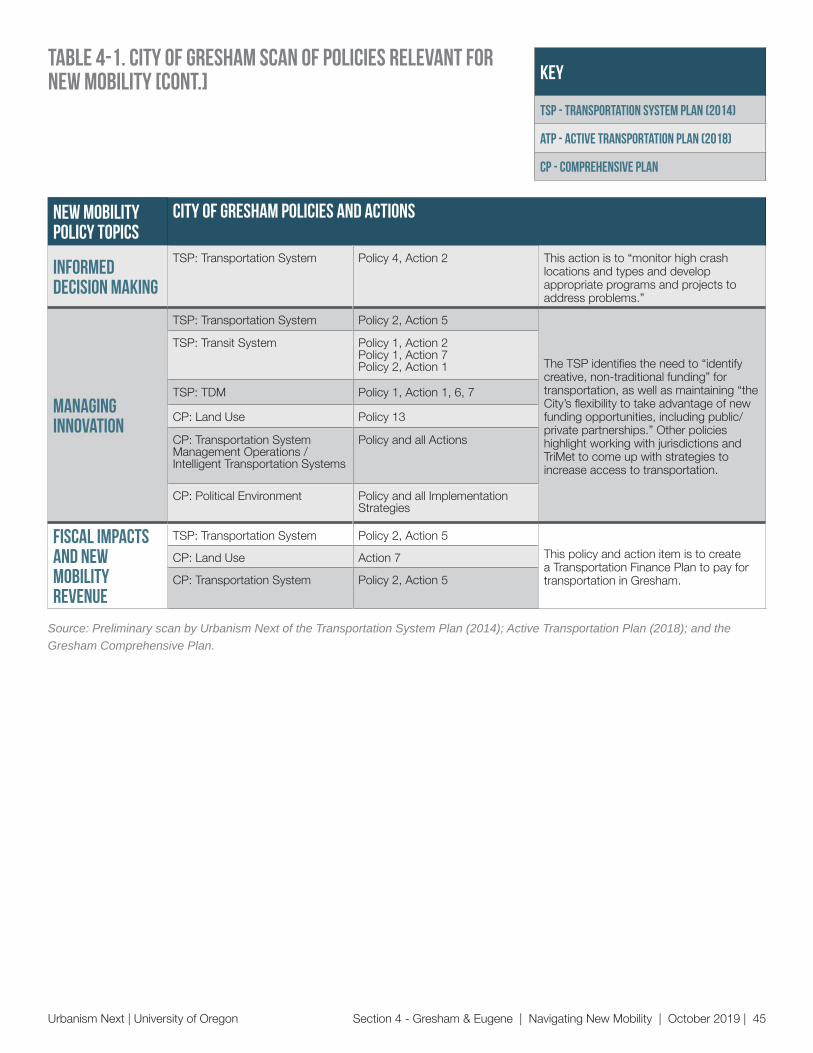
New Mobility Policy Topics
City of Gresham policies and Actions
Informed decision making
TSP: Transportation System Policy 4, Action 2 This action is to “monitor high crash locations and types and develop appropriate programs and projects to address problems.”
Managing innovation
TSP: Transportation System Policy 2, Action 5
The TSP identifies the need to “identify creative, non-traditional funding” for transportation, as well as maintaining “the City’s flexibility to take advantage of new funding opportunities, including public/private partnerships.” Other policies highlight working with jurisdictions and TriMet to come up with strategies to increase access to transportation.
TSP: Transit System Policy 1, Action 2 Policy 1, Action 7 Policy 2, Action 1
TSP: TDM Policy 1, Action 1, 6, 7
CP: Land Use Policy 13
CP: Transportation System Management Operations / Intelligent Transportation Systems
Policy and all Actions
CP: Political Environment Policy and all Implementation Strategies
Fiscal impacts and new mobility revenue
TSP: Transportation System Policy 2, Action 5This policy and action item is to create a Transportation Finance Plan to pay for transportation in Gresham.
CP: Land Use Action 7
CP: Transportation System Policy 2, Action 5
Source: Preliminary scan by Urbanism Next of the Transportation System Plan (2014); Active Transportation Plan (2018); and the Gresham Comprehensive Plan.
key
TSP - Transportation System Plan (2014)
ATP - Active Transportation Plan (2018)
CP - Comprehensive Plan
Urbanism Next | University of Oregon Section 4 - Gresham & Eugene | Navigating New Mobility | October 2019 | 45
Table 4-1. City of Gresham scan of Policies relevant for new mobility [cont.]
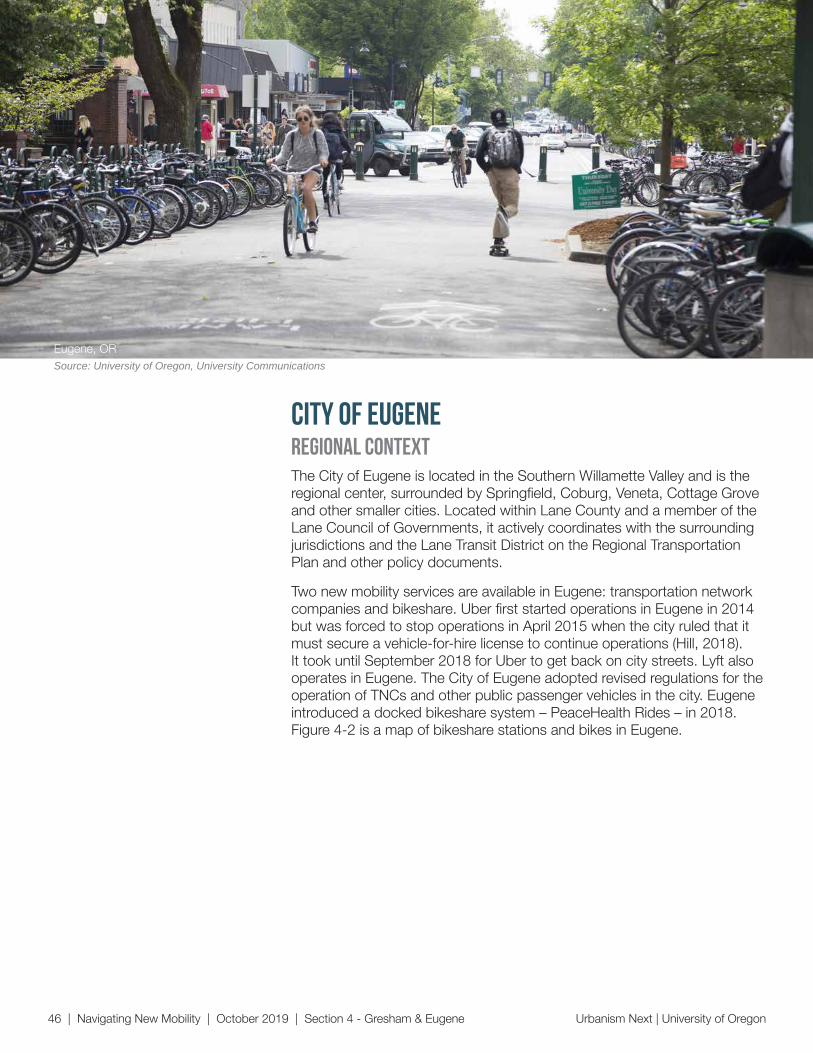
Urbanism Next | University of Oregon 46 | Navigating New Mobility | October 2019 | Section 4 - Gresham & Eugene
CITY OF EUGENE
The City of Eugene is located in the Southern Willamette Valley and is the regional center, surrounded by Springfield, Coburg, Veneta, Cottage Grove and other smaller cities. Located within Lane County and a member of the Lane Council of Governments, it actively coordinates with the surrounding jurisdictions and the Lane Transit District on the Regional Transportation Plan and other policy documents.
Two new mobility services are available in Eugene: transportation network companies and bikeshare. Uber first started operations in Eugene in 2014 but was forced to stop operations in April 2015 when the city ruled that it must secure a vehicle-for-hire license to continue operations (Hill, 2018). It took until September 2018 for Uber to get back on city streets. Lyft also operates in Eugene. The City of Eugene adopted revised regulations for the operation of TNCs and other public passenger vehicles in the city. Eugene introduced a docked bikeshare system – PeaceHealth Rides – in 2018. Figure 4-2 is a map of bikeshare stations and bikes in Eugene.
Regional context
Source: University of Oregon, University CommunicationsEugene, OR

Eugene policies
Urbanism Next | University of Oregon Section 4 - Gresham & Eugene | Navigating New Mobility | October 2019 | 47
Eugene has a number of long-term plans which contain goals, policies, guidelines, and action items that shape ways transportation services serve and interact with the city. Many of these policies already provide useful guidance on how new mobility services can be incorporated into existing service frameworks, but there are also policies which will need to be changed or updated to ensure they continue to meet the community’s goals in the future. Urbanism Next researchers identified the following plans that will likely be impacted by the introduction of new mobility services, or could be used to influence policies to allow these services in Eugene:
Transportation Policies: Eugene 2035 Transportation System Plan (2017) Eugene Vision Zero Action Plan (2019) MoveEUG: Eugene’s Active Transportation Strategy (2017-2021)
land use Policies: Envision Eugene Comprehensive Plan (2017) DRAFT Community Design Handbook (2017)
environmental Policies:A Community Climate and Energy Action Plan for Eugene (2010) (The City of Eugene is currently updating its Climate Action Plan.)
economic Policies:Regional Prosperity Economic Development Plan: Eugene, Springfield, Lane County (2010)
Source: PeaceHealth Rides (screenshot from: https://www.peacehealthrides.com/)
Figure 4-2. Eugene bikeshare map, 2019. Note that green dots are bike share stations and blue dots are bikes that are not at stations.
Policy Scan: Relevant goals, policies, and actions; opportunities, gaps, and recommendations
op
po
rt
un
itie
s &
re
co
mm
en
da
tio
ns
Urbanism Next | University of Oregon 48 | Navigating New Mobility | October 2019 | Section 4 - Gresham & Eugene
These plans articulate goals to improve safety, equity, support and promote active transportation, reduce congestion, vehicle miles traveled, and GHG emissions. The City of Eugene drafted an Urban Design Handbook and has a vision for the urban design of streets that are focused on people, not cars. Any new mobility plans, strategies, and actions the City of Eugene adopts should support these community goals.
Table 4-2 summarizes an initial scan of these plans to help highlight current policies and action items that new mobility policies should support. Included in the list are policies and action items that represent opportunities for expansion or elaboration that could help address new mobility policies. These opportunities are:
Active Transportation: Modal prioritizationOpportunity: TSP: Roadway and Parking Policy 1, the “Complete Streets Policy,” states that “(a) ‘complete street’ allows safe travel for automobiles and emergency responders, bicycles, walking, transit, and freight” but does not specify which of these uses has priority in the street.
Recommendation: Establishing a street usage prioritization that caters to the needs of pedestrians, cyclists, transit, and emergency vehicles over personal automobiles could help support safety, active transportation, sustainability, and community livability goals.
Design and Management of the Right of Way: Local deliveries
Opportunity: The Community Climate and Energy Action Plan for Eugene’s High Priority Action 16.1c calls for a freight transportation system that “(f)acilitates efficient local deliveries” in order to reduce GHG emissions.
Recommendation: Given the trend toward increased numbers of local deliveries with the rise in e-commerce orders and courier network service deliveries, this action could be updated to focus on both efficiency in terms of fuel usage and GHG emissions as well as efficiency in terms of facilitating delivery ease via curb management techniques.
op
po
rt
un
itie
s &
re
co
mm
en
da
tio
ns
Urbanism Next | University of Oregon Section 4 - Gresham & Eugene | Navigating New Mobility | October 2019 | 49
Changes in Land Use and Metropolitan Footprint: Park-and-Ride facilities
Opportunity: TSP: Transit Policies Potential Action B suggests that the City “(c)oordinate with Lane Transit District (LTD) to expand the park-and-ride system within Eugene’s commute shed with an emphasis in developing partnerships to share existing parking facilities.” The City of Eugene’s policies assume that driving a personally-owned vehicle will be one of the primary modes of movement in the City.
Recommendation: If new mobility does reduce reliance on personally-owned vehicles, then this assumption would need to be updated in transportation and land use plans. The City may want to reassess the need for park-and-ride facilities in the long term. The City may want to consider phasing out close-in park-and-rides as personally-owned vehicle use decreases and new mobility services and transit increase.
Changes in Land Use and Metropolitan Footprint: Street parking
Opportunity: The DRAFT Community Design Handbook Design Smart Parking and Circulation Guideline 1 calls for the City to “(p)rioritize on-street parking” while Guideline 2 encourages the City to “(u)tilize shared-parking strategies within development sites and at the district scale.”
Recommendation: New mobility services have the potential to decrease the demand for parking, meaning that prioritizing on-street and shared parking strategies over surface lots will continue to be smart land use strategies. However, the changing nature and increasing demand of curb space by new mobility services could change the demand for spaces currently allocated to on-street parking. Maintaining a mix of parking, loading zones, transit access, and micromobility access along the curb could help balance the demands for these spaces.
Informed Decision Making: Data collectionOpportunity: TSP: System-Wide Policies Potential Action S calls for the City to “Collect and report crash data for all travel modes…”.
Recommendation: Expanding this policy to include broader information about new mobility services, such as trip start and end locations, timing, and other ridership details, could provide the City with the information they need to make their current transportation and transit systems much more efficient and thus better serve their users.

ga
ps
& r
ec
om
me
nd
at
ion
s
Urbanism Next | University of Oregon 50 | Navigating New Mobility | October 2019 | Section 4 - Gresham & Eugene
The most significant gaps or policy areas that are not identified in existing plans that the City could consider are:
Social Equity: gap: While the City has goals, policies, and action items related to providing transportation access to low income, vulnerable, and underserved populations, there is no specific guidance for access, payment options for the unbanked, equitable workforce policies, or accommodating people with disabilities.
Recommendation: Determine if the City wants to create policies that specifically address equity. Transportation equity policies can address specific geographic areas or the city as a whole. Policies requiring cash payment options for the unbanked, outlining accessibility requirements for people with disabilities, and equitable workforce conditions for those working as contractors with new mobility service providers are all examples of ways the City can promote equitable practices in a changing transportation landscape.
Reduce congestion and vehicle miles traveled: gap: Eugene’s current policies related to congestion do address alternatives to personal automobiles, such as transit and active transportation modes, but lack a way to establish quantitative data on baseline or future use.
Recommendation: Adding VMT as a metric for assessing modal split and transportation efficiency would provide a quantifiable means for formulating transportation-related goals and measuring their progress while also promoting non-vehicular modes of travel.
Design and management of the right of way: gap: The impacts of newly emerging mobility trends suggest that the City will need to take a new approach to managing the ROW and especially the curb, specifically in high demand locations like downtown and BRT stations.
Recommendation: The City will need to understand changes in demand for the curb for both passengers and freight and goods delivery. Accommodating this increased demand can also pair with projected decreases in parking demand, allowing the City to take a fresh look at space allocation throughout the ROW and reassign less efficient uses to those which meet these new and growing demands.
Changes in land use and metropolitan footprint: gap: Many of Eugene’s policies already encourage compact urban form, transit-oriented development, and a pedestrian-friendly downtown area, however, these plans assume that personally-owned vehicles will be one of the primary modes of transportation for residents.

ga
ps
& r
ec
om
me
nd
at
ion
s
Urbanism Next | University of Oregon Section 4 - Gresham & Eugene | Navigating New Mobility | October 2019 | 51
Recommendation: New mobility services increase the uncertainty of the demand for parking in the future, which could increase the risk of publicly financed parking structures. The City should conduct a full-risk assessment of any new parking structures, using pricing strategies to help manage the demand for parking in high demand locations, and invest in alternative modes more aggressively to accommodate the demand for access. In addition, the City may want to reconsider minimum parking requirements and consider redevelopment strategies to redevelop parking lots and structures in the future if new mobility services decrease the demand for parking in the future.
Informed decision making: gap: The City of Eugene currently does not have any policies that require new mobility service providers to share data with the City.
Recommendation: In addition to collecting crash data as suggested under its Vision Zero policies, gathering usage data from new mobility providers will also help Eugene’s City staff understand how they can meet transportation-related safety, mode share, equity, and GHG emissions reduction goals. This information is also critical for enforcement of requirements and fees for new mobility service providers (if applied). The City of Eugene should review the Los Angeles Data Mobility Specifications and review the work of the City of Portland which adapted this standard to collect data from e-scooter companies, to adopt a data standard for the City.
Managing innovation: gap: While the City of Eugene has formal relationships with regional partners (Lane Council of Governments, Lane Transit District, and surrounding jusidictions), coordination on new mobility issues is nascent. Many larger cities where new mobility deployments are happening first are trying to better manage impacts by conducting pilot projects. The City of Eugene does not have a pilot project process, but instead has rolled out projects for implementation (bikeshare and TNCs).
Recommendation: The City of Eugene should consider if they want to formally coordinate with regional partners. At a minimum, the City should work closely with Lane Transit District as a key partner to achieving community goals.
Fiscal impacts and new mobility revenue: gap: Eugene has no adopted policies that specifically require new mobility services fund transportation infrastructure and assess its impact on the transportation system.
Recommendation: The City should evaluate different fee options to create a funding mechanism that helps the City achieve its goals, including paying city costs for managing new mobility (permitting, enforcement, evaluation, etc.), paying for the impact on transportation infrastructure and the transportation system, and investments that increase capacity and throughput of people and goods.
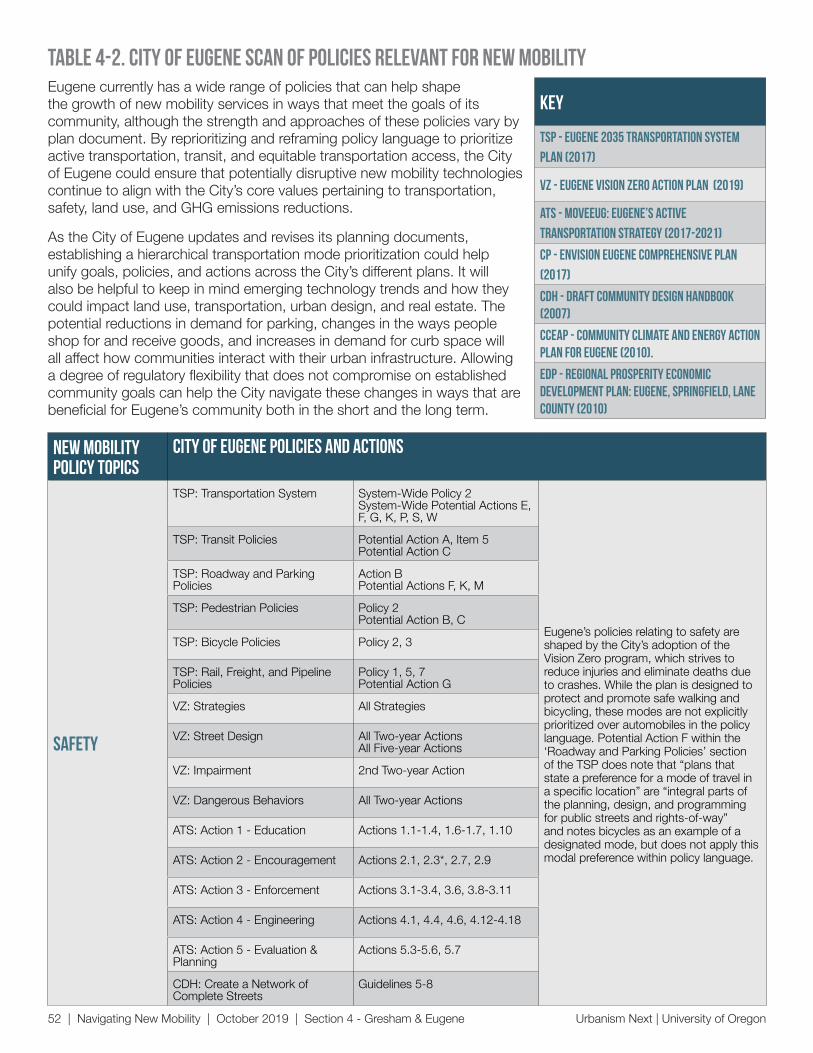
New Mobility Policy Topics
City of Eugene Policies and Actions
Safety
TSP: Transportation System System-Wide Policy 2 System-Wide Potential Actions E, F, G, K, P, S, W
Eugene’s policies relating to safety are shaped by the City’s adoption of the Vision Zero program, which strives to reduce injuries and eliminate deaths due to crashes. While the plan is designed to protect and promote safe walking and bicycling, these modes are not explicitly prioritized over automobiles in the policy language. Potential Action F within the ‘Roadway and Parking Policies’ section of the TSP does note that “plans that state a preference for a mode of travel in a specific location” are “integral parts of the planning, design, and programming for public streets and rights-of-way” and notes bicycles as an example of a designated mode, but does not apply this modal preference within policy language.
TSP: Transit Policies Potential Action A, Item 5 Potential Action C
TSP: Roadway and Parking Policies
Action B Potential Actions F, K, M
TSP: Pedestrian Policies Policy 2 Potential Action B, C
TSP: Bicycle Policies Policy 2, 3
TSP: Rail, Freight, and Pipeline Policies
Policy 1, 5, 7 Potential Action G
VZ: Strategies All Strategies
VZ: Street Design All Two-year Actions All Five-year Actions
VZ: Impairment 2nd Two-year Action
VZ: Dangerous Behaviors All Two-year Actions
ATS: Action 1 - Education Actions 1.1-1.4, 1.6-1.7, 1.10
ATS: Action 2 - Encouragement Actions 2.1, 2.3*, 2.7, 2.9
ATS: Action 3 - Enforcement Actions 3.1-3.4, 3.6, 3.8-3.11
ATS: Action 4 - Engineering Actions 4.1, 4.4, 4.6, 4.12-4.18
ATS: Action 5 - Evaluation & Planning
Actions 5.3-5.6, 5.7
CDH: Create a Network of Complete Streets
Guidelines 5-8
key
TSP - Eugene 2035 Transportation System
Plan (2017)
VZ - Eugene Vision Zero Action Plan (2019)
ATS - MoveEUG: Eugene’s Active
Transportation Strategy (2017-2021)
CP - Envision Eugene Comprehensive Plan
(2017)
CDH - Draft Community Design Handbook (2007)
CCEAP - Community Climate and Energy Action Plan for Eugene (2010).
EDP - Regional Prosperity Economic Development Plan: Eugene, Springfield, Lane County (2010)
Eugene currently has a wide range of policies that can help shape the growth of new mobility services in ways that meet the goals of its community, although the strength and approaches of these policies vary by plan document. By reprioritizing and reframing policy language to prioritize active transportation, transit, and equitable transportation access, the City of Eugene could ensure that potentially disruptive new mobility technologies continue to align with the City’s core values pertaining to transportation, safety, land use, and GHG emissions reductions.
As the City of Eugene updates and revises its planning documents, establishing a hierarchical transportation mode prioritization could help unify goals, policies, and actions across the City’s different plans. It will also be helpful to keep in mind emerging technology trends and how they could impact land use, transportation, urban design, and real estate. The potential reductions in demand for parking, changes in the ways people shop for and receive goods, and increases in demand for curb space will all affect how communities interact with their urban infrastructure. Allowing a degree of regulatory flexibility that does not compromise on established community goals can help the City navigate these changes in ways that are beneficial for Eugene’s community both in the short and the long term.
Table 4-2. City of eugene scan of Policies relevant for new mobility
Urbanism Next | University of Oregon 52 | Navigating New Mobility | October 2019 | Section 4 - Gresham & Eugene

New Mobility Policy Topics
City of Eugene Policies and Actions
Social Equity
TSP: Transportation System System-Wide Potential Actions I, Q
The City’s TSP features a section entitled Equity, Economy, and Community Engagement Practices that addresses many aspects of social equity in transportation planning. Other TSP sections address ADA requirements, community engagement practices, and the creation of context sensitive solutions, while other documents discuss age-based transportation needs and the need for fair economies.
TSP: Transit Policies Policy 3 Potential Action A, Item 3
TSP: Roadway and Parking Policies
Potential Actions F, L
TSP: Equity, Economy, and Community Engagement Policies
All Policies and Potential Actions
VZ: Street Design 7th Two-year Action
VZ: Dangerous Behaviors 3rd Five-year Action
ATS: Action 1 - Education Actions 1.5, 1.9
ATS: Action 2 - Encouragement Actions 2.9-2.11
ATS: Action 3 - Enforcement Action 3.7
ATS: Action 4 - Engineering Actions 4.8, 4.12
ATS: Action 5 - Evaluation & Planning
Actions 5.4-5.5, 5.8
CDH: Create a Network of Complete Streets
Guideline 7
EDP: Strategy 2 Tactic 2.5
key
TSP - Eugene 2035 Transportation System Plan (2017)
VZ - Vision Zero Eugene (2017)
ATS - MoveEUG: Eugene’s Active Transportation Strategy (2017-2021)
CP - Envision Eugene Comprehensive Plan (2017)
CDH - Draft Community Design Handbook (2007)
CCEAP - Community Climate and Energy Action Plan for Eugene (2010).
EDP - Regional Prosperity Economic Development Plan: Eugene, Springfield, Lane County (2010)
Urbanism Next | University of Oregon Section 4 - Gresham & Eugene | Navigating New Mobility | October 2019 | 53
Table 4-2. City of eugene scan of Policies relevant for new mobility [cont.]

New Mobility Policy Topics
City of Eugene Policies and Actions
Active Transportation
TSP: Transportation System System-Wide Policies 1, 3, 4 System-Wide Potential Actions B, C, E, K, M, O, Q
Eugene had a robust selection of active transportation policies, actions, and guidelines. Supporting pedestrian and cyclist activity is an integral part of the City’s TSP and Vision Zero programs and is the basis for MoveEUG: Eugene’s Active Transportation Strategy. Support for active transportation is also found in the City’s Community Design Handbook and Community Climate and Energy Action Plan for Eugene, where walking and biking are recognized as key components in healthy, livable, low-carbon communities.
TSP: Transit Policies Policy 1 Potential Action A, Item 5 Potential Action C
TSP: Roadway and Parking Policies
Potential Actions B, F, K, L, S
TSP: Pedestrian Policies Policies 1, 2 All Potential Actions
TSP: Bicycle Policies All Policies and Potential Actions
TSP: Greenhouse Gas, Climate Change, and Natural Environment Policies
Policies 3, 4 Potential Action I
VZ: Strategies All Strategies
VZ: Street Design 1st, 4th, and 7th Two-year Actions
VZ: Engagement and Accountability
5th Two-year Action 6th Five-year Action
ATS: Action 1 - Education All subactions
ATS: Action 2 - Encouragement All subactions
ATS: Action 3 - Enforcement All subactions
ATS: Action 4 - Engineering All subactions
CDH: Promote Outdoor Lifestyles Guideline 4
CDH: Create a Netowrk of Complete Streets
Guidelines 1, 3, 5-9
CDH: Emphasize Walking, Biking, and Riding Transit
All Guidelines
CCEAP: Objective 13 All High Priority Actions
CCEAP: Objective 15 High Priority Action 15.1
key
TSP - Eugene 2035 Transportation System Plan (2017)
VZ - Vision Zero Eugene (2017)
ATS - MoveEUG: Eugene’s Active Transportation Strategy (2017-2021)
CP - Envision Eugene Comprehensive Plan (2017)
CDH - Draft Community Design Handbook (2007)
CCEAP - Community Climate and Energy Action Plan for Eugene (2010).
EDP - Regional Prosperity Economic Development Plan: Eugene, Springfield, Lane County (2010)
Urbanism Next | University of Oregon 54 | Navigating New Mobility | October 2019 | Section 4 - Gresham & Eugene
Table 4-2. City of eugene scan of Policies relevant for new mobility [cont.]
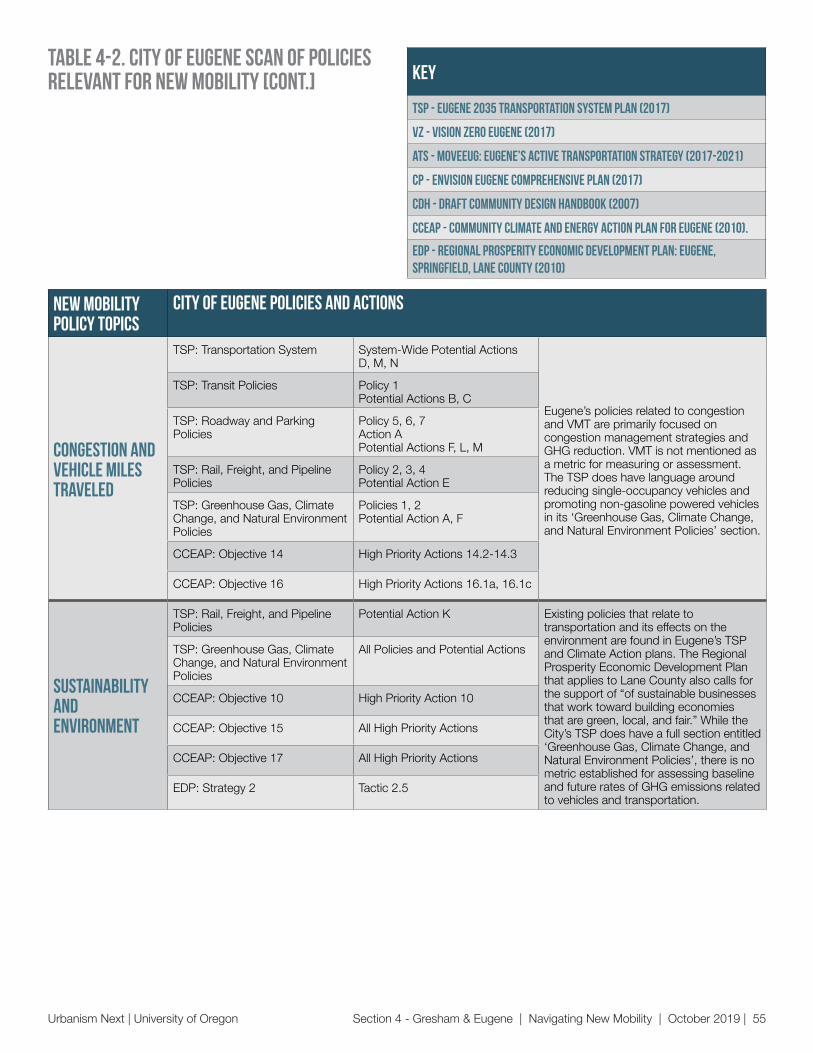
New Mobility Policy Topics
City of Eugene Policies and Actions
Congestion and vehicle miles traveled
TSP: Transportation System System-Wide Potential Actions D, M, N
Eugene’s policies related to congestion and VMT are primarily focused on congestion management strategies and GHG reduction. VMT is not mentioned as a metric for measuring or assessment. The TSP does have language around reducing single-occupancy vehicles and promoting non-gasoline powered vehicles in its ‘Greenhouse Gas, Climate Change, and Natural Environment Policies’ section.
TSP: Transit Policies Policy 1 Potential Actions B, C
TSP: Roadway and Parking Policies
Policy 5, 6, 7 Action A Potential Actions F, L, M
TSP: Rail, Freight, and Pipeline Policies
Policy 2, 3, 4 Potential Action E
TSP: Greenhouse Gas, Climate Change, and Natural Environment Policies
Policies 1, 2 Potential Action A, F
CCEAP: Objective 14 High Priority Actions 14.2-14.3
CCEAP: Objective 16 High Priority Actions 16.1a, 16.1c
Sustainability and Environment
TSP: Rail, Freight, and Pipeline Policies
Potential Action K Existing policies that relate to transportation and its effects on the environment are found in Eugene’s TSP and Climate Action plans. The Regional Prosperity Economic Development Plan that applies to Lane County also calls for the support of “of sustainable businesses that work toward building economies that are green, local, and fair.” While the City’s TSP does have a full section entitled ‘Greenhouse Gas, Climate Change, and Natural Environment Policies’, there is no metric established for assessing baseline and future rates of GHG emissions related to vehicles and transportation.
TSP: Greenhouse Gas, Climate Change, and Natural Environment Policies
All Policies and Potential Actions
CCEAP: Objective 10 High Priority Action 10
CCEAP: Objective 15 All High Priority Actions
CCEAP: Objective 17 All High Priority Actions
EDP: Strategy 2 Tactic 2.5
key
TSP - Eugene 2035 Transportation System Plan (2017)
VZ - Vision Zero Eugene (2017)
ATS - MoveEUG: Eugene’s Active Transportation Strategy (2017-2021)
CP - Envision Eugene Comprehensive Plan (2017)
CDH - Draft Community Design Handbook (2007)
CCEAP - Community Climate and Energy Action Plan for Eugene (2010).
EDP - Regional Prosperity Economic Development Plan: Eugene, Springfield, Lane County (2010)
Urbanism Next | University of Oregon Section 4 - Gresham & Eugene | Navigating New Mobility | October 2019 | 55
Table 4-2. City of eugene scan of Policies relevant for new mobility [cont.]
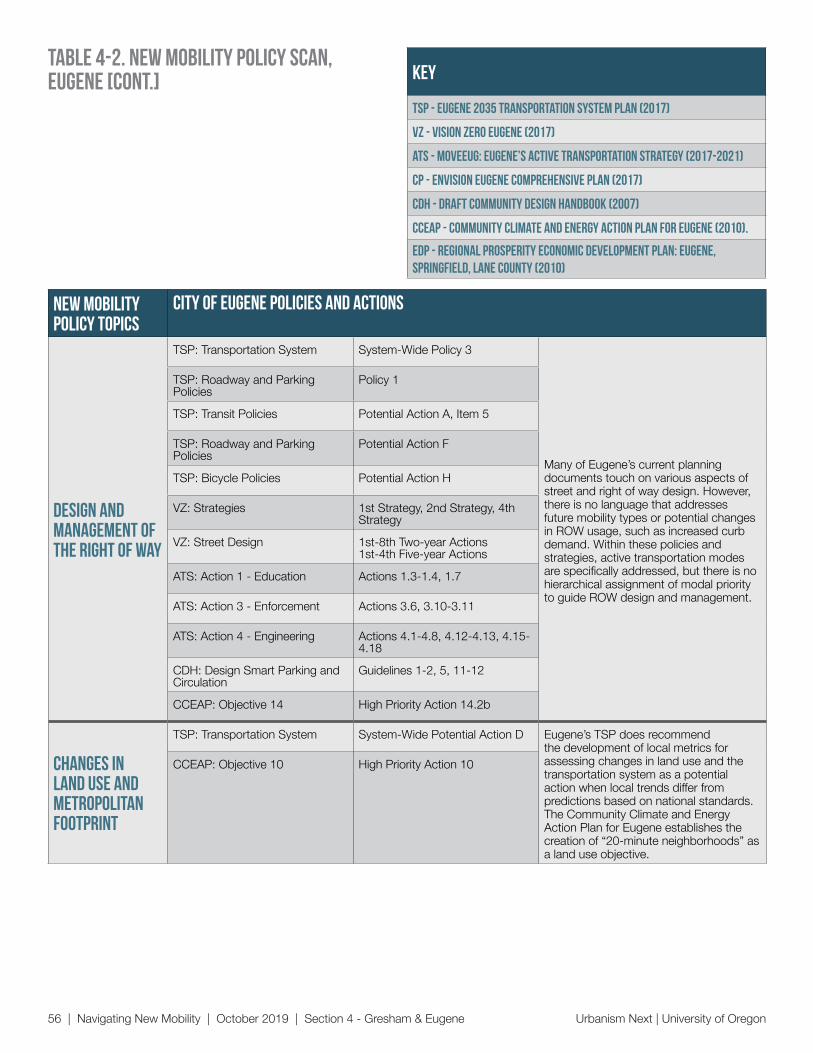
New Mobility Policy Topics
City of Eugene Policies and Actions
Design and management of the right of way
TSP: Transportation System System-Wide Policy 3
Many of Eugene’s current planning documents touch on various aspects of street and right of way design. However, there is no language that addresses future mobility types or potential changes in ROW usage, such as increased curb demand. Within these policies and strategies, active transportation modes are specifically addressed, but there is no hierarchical assignment of modal priority to guide ROW design and management.
TSP: Roadway and Parking Policies
Policy 1
TSP: Transit Policies Potential Action A, Item 5
TSP: Roadway and Parking Policies
Potential Action F
TSP: Bicycle Policies Potential Action H
VZ: Strategies 1st Strategy, 2nd Strategy, 4th Strategy
VZ: Street Design 1st-8th Two-year Actions 1st-4th Five-year Actions
ATS: Action 1 - Education Actions 1.3-1.4, 1.7
ATS: Action 3 - Enforcement Actions 3.6, 3.10-3.11
ATS: Action 4 - Engineering Actions 4.1-4.8, 4.12-4.13, 4.15-4.18
CDH: Design Smart Parking and Circulation
Guidelines 1-2, 5, 11-12
CCEAP: Objective 14 High Priority Action 14.2b
Changes in land use and metropolitan footprint
TSP: Transportation System System-Wide Potential Action D Eugene’s TSP does recommend the development of local metrics for assessing changes in land use and the transportation system as a potential action when local trends differ from predictions based on national standards. The Community Climate and Energy Action Plan for Eugene establishes the creation of “20-minute neighborhoods” as a land use objective.
CCEAP: Objective 10 High Priority Action 10
key
TSP - Eugene 2035 Transportation System Plan (2017)
VZ - Vision Zero Eugene (2017)
ATS - MoveEUG: Eugene’s Active Transportation Strategy (2017-2021)
CP - Envision Eugene Comprehensive Plan (2017)
CDH - Draft Community Design Handbook (2007)
CCEAP - Community Climate and Energy Action Plan for Eugene (2010).
EDP - Regional Prosperity Economic Development Plan: Eugene, Springfield, Lane County (2010)
Urbanism Next | University of Oregon 56 | Navigating New Mobility | October 2019 | Section 4 - Gresham & Eugene
Table 4-2. New Mobility Policy Scan, Eugene [cont.]
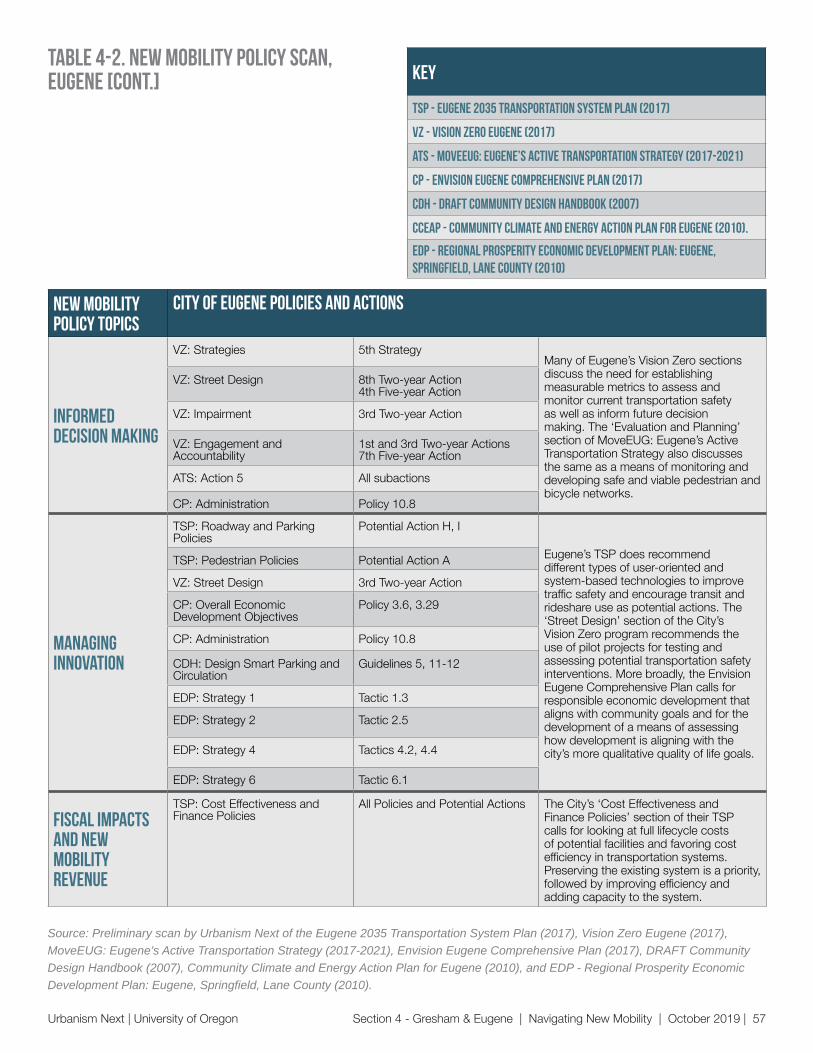
New Mobility Policy Topics
City of Eugene Policies and Actions
Informed decision making
VZ: Strategies 5th StrategyMany of Eugene’s Vision Zero sections discuss the need for establishing measurable metrics to assess and monitor current transportation safety as well as inform future decision making. The ‘Evaluation and Planning’ section of MoveEUG: Eugene’s Active Transportation Strategy also discusses the same as a means of monitoring and developing safe and viable pedestrian and bicycle networks.
VZ: Street Design 8th Two-year Action 4th Five-year Action
VZ: Impairment 3rd Two-year Action
VZ: Engagement and Accountability
1st and 3rd Two-year Actions 7th Five-year Action
ATS: Action 5 All subactions
CP: Administration Policy 10.8
Managing innovation
TSP: Roadway and Parking Policies
Potential Action H, I
Eugene’s TSP does recommend different types of user-oriented and system-based technologies to improve traffic safety and encourage transit and rideshare use as potential actions. The ‘Street Design’ section of the City’s Vision Zero program recommends the use of pilot projects for testing and assessing potential transportation safety interventions. More broadly, the Envision Eugene Comprehensive Plan calls for responsible economic development that aligns with community goals and for the development of a means of assessing how development is aligning with the city’s more qualitative quality of life goals.
TSP: Pedestrian Policies Potential Action A
VZ: Street Design 3rd Two-year Action
CP: Overall Economic Development Objectives
Policy 3.6, 3.29
CP: Administration Policy 10.8
CDH: Design Smart Parking and Circulation
Guidelines 5, 11-12
EDP: Strategy 1 Tactic 1.3
EDP: Strategy 2 Tactic 2.5
EDP: Strategy 4 Tactics 4.2, 4.4
EDP: Strategy 6 Tactic 6.1
Fiscal impacts and new mobility revenue
TSP: Cost Effectiveness and Finance Policies
All Policies and Potential Actions The City’s ‘Cost Effectiveness and Finance Policies’ section of their TSP calls for looking at full lifecycle costs of potential facilities and favoring cost efficiency in transportation systems. Preserving the existing system is a priority, followed by improving efficiency and adding capacity to the system.
key
TSP - Eugene 2035 Transportation System Plan (2017)
VZ - Vision Zero Eugene (2017)
ATS - MoveEUG: Eugene’s Active Transportation Strategy (2017-2021)
CP - Envision Eugene Comprehensive Plan (2017)
CDH - Draft Community Design Handbook (2007)
CCEAP - Community Climate and Energy Action Plan for Eugene (2010).
EDP - Regional Prosperity Economic Development Plan: Eugene, Springfield, Lane County (2010)
Urbanism Next | University of Oregon Section 4 - Gresham & Eugene | Navigating New Mobility | October 2019 | 57
Table 4-2. New Mobility Policy Scan, Eugene [cont.]
Source: Preliminary scan by Urbanism Next of the Eugene 2035 Transportation System Plan (2017), Vision Zero Eugene (2017), MoveEUG: Eugene’s Active Transportation Strategy (2017-2021), Envision Eugene Comprehensive Plan (2017), DRAFT Community Design Handbook (2007), Community Climate and Energy Action Plan for Eugene (2010), and EDP - Regional Prosperity Economic Development Plan: Eugene, Springfield, Lane County (2010).
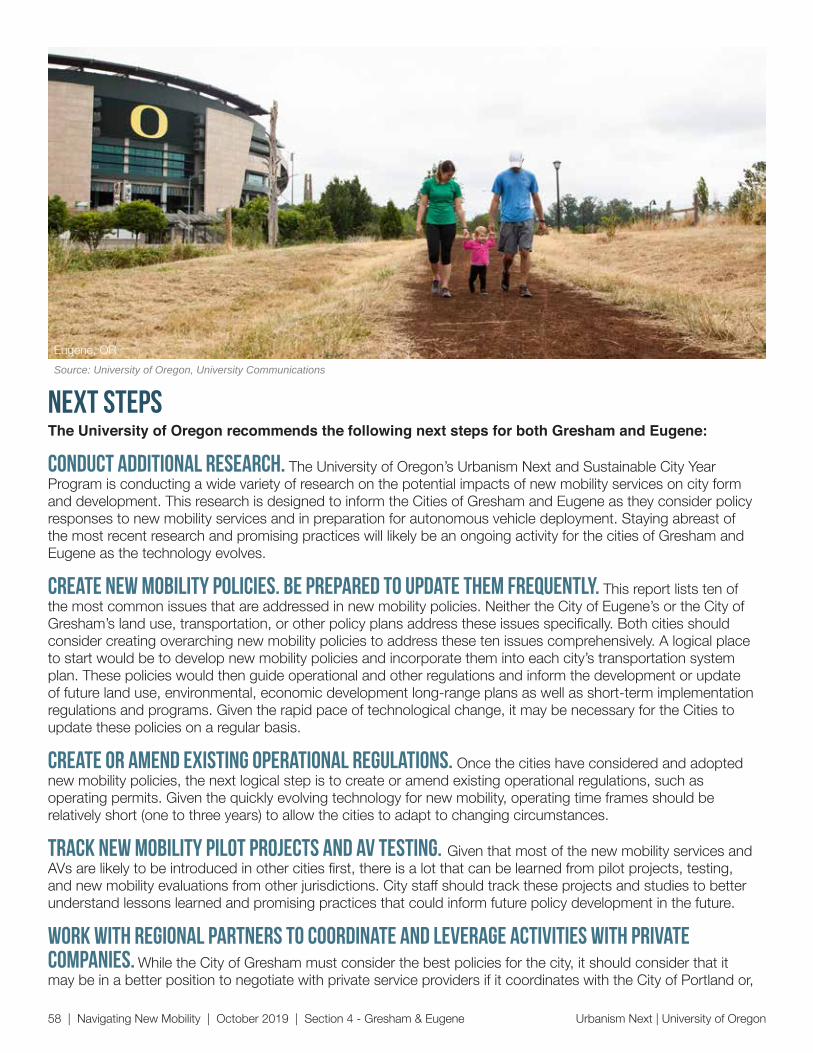
Urbanism Next | University of Oregon 58 | Navigating New Mobility | October 2019 | Section 4 - Gresham & Eugene
NEXT STEPSThe University of Oregon recommends the following next steps for both Gresham and Eugene:
Conduct additional research. The University of Oregon’s Urbanism Next and Sustainable City Year Program is conducting a wide variety of research on the potential impacts of new mobility services on city form and development. This research is designed to inform the Cities of Gresham and Eugene as they consider policy responses to new mobility services and in preparation for autonomous vehicle deployment. Staying abreast of the most recent research and promising practices will likely be an ongoing activity for the cities of Gresham and Eugene as the technology evolves.
Create new mobility policies. Be prepared to update them frequently. This report lists ten of the most common issues that are addressed in new mobility policies. Neither the City of Eugene’s or the City of Gresham’s land use, transportation, or other policy plans address these issues specifically. Both cities should consider creating overarching new mobility policies to address these ten issues comprehensively. A logical place to start would be to develop new mobility policies and incorporate them into each city’s transportation system plan. These policies would then guide operational and other regulations and inform the development or update of future land use, environmental, economic development long-range plans as well as short-term implementation regulations and programs. Given the rapid pace of technological change, it may be necessary for the Cities to update these policies on a regular basis.
Create or amend existing operational regulations. Once the cities have considered and adopted new mobility policies, the next logical step is to create or amend existing operational regulations, such as operating permits. Given the quickly evolving technology for new mobility, operating time frames should be relatively short (one to three years) to allow the cities to adapt to changing circumstances.
Track new mobility pilot projects and AV testing. Given that most of the new mobility services and AVs are likely to be introduced in other cities first, there is a lot that can be learned from pilot projects, testing, and new mobility evaluations from other jurisdictions. City staff should track these projects and studies to better understand lessons learned and promising practices that could inform future policy development in the future.
Work with regional partners to coordinate and leverage activities with private companies. While the City of Gresham must consider the best policies for the city, it should consider that it may be in a better position to negotiate with private service providers if it coordinates with the City of Portland or,
Source: University of Oregon, University Communications
Eugene, OR

Urbanism Next | University of Oregon Section 4 - Gresham & Eugene | Navigating New Mobility | October 2019 | 59
ideally, the region. The City of Portland is taking the lead in the region to create new mobility strategies and policies that help it achieve its equity, mobility, and other goals. They have been relatively successful at requiring and obtaining information and service from new mobility companies. Working in coordination with Portland and Metro may result in better outcomes for the City of Gresham than they could potentially obtain negotiating on their own. At a minimum, the City of Portland is setting a precedent in the region that Gresham can look to when working with some of the same companies that operate in Portland.
The City of Eugene should consider working with its regional partners, including Lane Transit District, Lane Council of Governments, Lane County, and surrounding cities to coordinate on data collection and analysis and to negotiate with private service providers. Activities in the Portland region, as well as other regions across the country such as Denver, may provide lessons learned and useful models.
Educate and involve the public and stakeholder groups. New mobility services represent a new way for people and goods to move and will bring change to our neighborhoods and downtowns. Residents need to understand how this could impact their lives and have an opportunity to shape the policies and programs that are developed to address new mobility issues. It is important that lower-income and vulnerable populations are part of the policy making process.
Consider studying and updating parking management and regulations. While the demand for parking is likely to change, exactly how and when that change will play out in cities like Gresham or Eugene is unknown. Given this disruption, the Cities could evaluate their current policies and consider steps that will encourage redevelopment near transit. The Cities could also consider how street design could change to accommodate active transportation and new mobility modes, as well as future automation of vehicles. This will require the cities to work closely with their transit agencies and regional partners.
Consider changes to design and management of the right-of-way. The cities of Gresham and Eugene should identify some of the neighborhoods and streets with the highest demand for pick-up/drop-off and be prepared to study and adopt management regulations in these areas first. This will likely require the cities to work closely with TNC and taxi companies to ensure their drivers comply with the regulations. In addition, the cities should consider changes at the curb necessary for urban goods and freight and commercial delivery.
Begin planning for a significant change in how transportation is funded. It remains to be seen how disruptive new mobility services will be for cities and other governmental agencies that depend on parking revenue, parking and traffic infractions, gas tax, and registration. Cities should monitor changes at airports and larger cities around the United States (such as San Francisco, Seattle, New York, Washington, DC, and others) to see how new mobility services disrupt revenues and expenses as well as policy responses to this disruption.
Source: https://www.seattlebikeblog.com/2015/08/25/5th-ave-has-a-new-protected-bike-lane-for-one-block/

Urbanism Next | University of Oregon
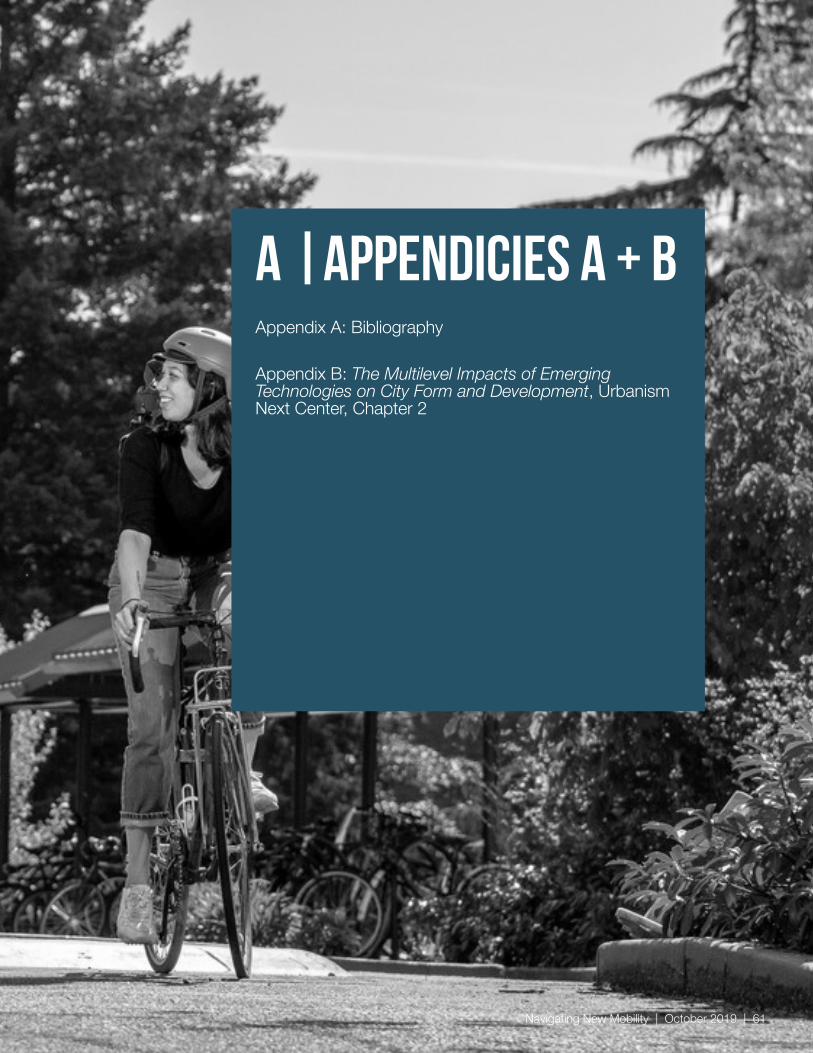
Navigating New Mobility | October 2019 | 61
A |Appendicies A + BAppendix A: Bibliography
Appendix B: The Multilevel Impacts of Emerging Technologies on City Form and Development, Urbanism Next Center, Chapter 2

Urbanism Next | University of Oregon 62 | Navigating New Mobility | October 2019 | Appendix
Appendix A: BibliographyBrinklow, A. (2018, October 16). City blames half of new congestion on Lyft, Uber. Retrieved December 15, 2018, from https://sf.curbed.com/2018/10/16/17984366/tnc-ride-hailing-uber-lyft-sfcta-report
Cabanatuan, M. (2018, April 13). SF scooter problem: City impounds dozens of the two-wheelers - SFGate. Retrieved December 14, 2018, from https://www.sfgate.com/bayarea/article/SF-scooter-problem-City-impounds-dozens-of-the-12832354.php
City of Austin. (n.d.). Austin Strategic Mobility Plan: Developing the Draft Policies. Retrieved December 5, 2018, from https://austin.maps.arcgis.com/apps/Cascade/index.html?appid=66856e8c95244e3b927253fd85878043
City of Chandler. (2018, April 4). ZCA18-0001 City of Chandler/Ride Sharing and Autonomous Vehicles Zoning Code Amendment. City of Chandler. Retrieved from https://www.chandleraz.gov/sites/default/files/documents/imported/ZCA180001.pdf
City of Eugene. (2010a, February 26) Regional Prosperity Economic Development Plan: Eugene, Springfield, Lane County. Retrieved from https://www.eugene-or.gov/DocumentCenter/View/3649/Regional-Prosperity-Economic-Development-Plan?bidId=
City of Eugene. (2010b, September) Community Climate and Energy Action Plan for Eugene. Retrieved from https://www.eugene-or.gov/DocumentCenter/View/44051/Community-Climate-and-Energy-Action-Plan-for-Eugene
City of Eugene. (2017a, February) Eugene 2035 Transportation System Plan. Retrieved from https://www.eugene-or.gov/3941/Transportation-System-Plan
City of Eugene. (2017b, March) Draft Community Design Handbook. Retreived from https://www.eugene-or.gov/2977/Community-Design-Handbook
City of Eugene. (2017c, July) Envision Eugene Comprehensive Plan. Retrieved from https://www.eugene-or.gov/3009/The-Envision-Eugene-Comprehensive-Plan
City of Eugene. (2017d) MoveEug: Eugene’ Active Transportation Strategy (2017-2021). Retrieved from https://www.eugene-or.gov/2594/MoveEug-Active-Transportation-Strategy
City of Eugene. (2017e) Vision Zero Eugene. Retrieved from https://www.eugene-or.gov/3239/Vision-Zero
City of Gresham. (2014) Transporation System Plan. Retrieved from https://greshamoregon.gov/Transportation-System-Plan/
City of Gresham. (2018) Active Transportation Plan. City of Gresham.
City of Gresham. (na) Comprehensive Plan. Retrieved December 19, 2018, from https://greshamoregon.gov/Comprehensive-Plan/
City of Portland, Bureau of Transportation. (2018, May). Portland 2035 Transportation System Plan. City of Portland. Retrieved from https://www.portlandoregon.gov/transportation/67263
Clewlow, R., & Mishra, G. (2017). Disruptive Transportation: The Adoption, Utilization, and Impacts of Ride-Hailing in the United States. Institute of Transportation Studies, University of California, Davis. Retrieved from https://steps.ucdavis.edu/new-research-ride-hailing-impacts-travel-behavior/
Colorado Department of Transportation, Denver Regional Council of Governments, Regional Transportatin District, & Denver Metro Chamber. (2018, November 26). DRAFT Mobility Choice Blueprint. Retrieved from http://www.mobilitychoiceblueprintstudy.com/assets/resources/Mobility_Choice_Blueprint_document_DRAFT_11.26.18.pdf
Dalgadillo, N. (2018, November 12). Bird Says New Scooter Regulations Make It “Impossible” to Serve D.C. Retrieved December 5, 2018, from https://dcist.com/story/18/11/12/bird-says-new-scooter-regulations-make-it-impossible-to-serve-d-c/
Urbanism Next | University of Oregon Appendix | Navigating New Mobility | October 2019 | 63
Department of Airports, Los Angeles, CA. (2017). Los Angeles International Airport Annual Financial Report. Department of Airports, Los Angeles, CA. Retrieved from https://www.lawa.org/-/media/lawa-web/lawa-investor-relations/files/2017_lax_annual_report.ashx?la=en&hash=302D0ECEE68148C6B164ED70D40036814FA58271
District Department of Transportation. (2018, November 5). DDOT Releases New Permit Application for Dockless Vehicles [Government]. Retrieved December 19, 2018, from https://ddot.dc.gov/release/ddot-releases-new-permit-application-dockless-vehicles%C2%A0
Fehr & Peers. (2018). How will autonomous vehicles influence the future of travel? Retrieved December 10, 2018, from http://www.fehrandpeers.com/autonomous-vehicle-research/
Graehler, M., Mucci, R. A., & Erhardt, G. D. (2018). Understanding the Recent Transit Ridership Decline in Major US Cities: Service Cuts or Emerging Modes? (p. 19). University of Kentucky. Retrieved from http://usa.streetsblog.org/wp-content/uploads/sites/5/2019/01/19-04931-Transit-Trends.pdf
Hand, A. Z., AIA, LEED AP BD+C. (2016, August). Urban Mobility in a Digital Age: A Transportation Technology Strategy for Los Angeles. City of Los Angeles, Office of the Mayor and the Department of Transportation.
Hawkins, A. J. (2017, December 12). Not all of our self-driving cars will be electrically powered — here’s why. Retrieved September 7, 2018, from https://www.theverge.com/2017/12/12/16748024/self-driving-electric-hybrid-ev-av-gm-ford
Hill, C. (2018, September 4). Uber set to launch in Eugene next Thursday. The Register Guard. Retrieved from https://www.registerguard.com/news/20180830/uber-set-to-launch-in-eugene-next-thursday
Jacobs (2019, March). Emerging Technology Impact Assessment Final Report. Prepared for the Oregon Department of Transportation.
Kaufman, S. M., Polack, C. F., & Campbell, G. A. (2018). The Pink Tax on Transportation: Women’s Challenges in Mobility (p. 9). NYU Wagner Rudin Center for Transportation. Retrieved from https://wagner.nyu.edu/files/faculty/publications/Pink%20Tax%20Report%2011_13_18.pdf
Kimmelman, M. (2012, January 6). Paved, but Still Alive. The New York Times. Retrieved from https://www.nytimes.com/2012/01/08/arts/design/taking-parking-lots-seriously-as-public-spaces.html
Larco, N., Howell, A., Lewis, R., & Steckler, B. (2018). AVs in the Pacific Northwest: Reducing Greenhouse Gas Emissions in a TIme of Automation, 119.
Men, C. (2018, September 17). Bird scooters impounded by Santa Cruz, following cease and desist order – Santa Cruz Sentinel. Retrieved December 15, 2018, from https://www.santacruzsentinel.com/2018/09/17/bird-scooters-impounded-by-santa-cruz-following-cease-and-desist-order/
Metro. (2018, June 25). 2018 Regional Transportation Plan - Emerging Technology Strategy (Public Review Draft). Metro. Retrieved from https://www.oregonmetro.gov/sites/default/files/2018/07/02/Metro-Emerging-Tech-Strategy-06-2018-Public-Review-Draft.pdf
NACTO. (2017). Blueprint for Autonomous Urbanism (p. 60). National Association of City Transportation Officials. Retrieved from https://nacto.org/wp-content/uploads/2017/11/BAU_Mod1_raster-sm.pdf
Portland Bureau of Transportation. (2019). 2018 E-Scooter Findings Report. City of Portland, Bureau of Transportation. Retrieved from https://www.portlandoregon.gov/transportation/article/709719
Schaller, B. (2018). The new automobility: Lyft, Uber and the future of American cities. Retrieved from http://www.schallerconsult.com/rideservices/automobility.htm
Schlossberg, M., & Riggs, W. (2018). Rethinking the street in an era of driverless cars. Retrieved from https://cpb-us-e1.wpmucdn.com/blogs.uoregon.edu/dist/f/13615/files/2018/01/Rethinking_Streets_AVs_012618-27hcyr6.pdf
Urbanism Next | University of Oregon 64 | Navigating New Mobility | October 2019 | Appendix
Seattle Department of Transportation. (2017, September). New Mobility Playbook. City of Seattle.
SFCTA. (2017). TNCs today: A profile of San Francisco Transportation Newok company activity. Retrieved from https://www.sfmta.com/sites/default/files/agendaitems/2017/6-20-17%20Item%2014%20Transportation%20Network%20Company%20Actvity%20Report.pdf
Shared Mobility Principles for Livable Cities. (2017, October 17). Shared Mobility Principles for Livable Cities. Retrieved December 4, 2018, from https://www.sharedmobilityprinciples.org/
Sisson, P. (2018a, August 2). Scooter startup Bird plans to fund protected bike lanes. Retrieved from https://www.curbed.com/2018/8/2/17641604/bird-scooter-safety-bike-lane
Sisson, P. (2018b, December 7). Scooter City: How Santa Monica, the birthplace of dockless electric scooters, is shaping the multibillion-dollar industry [News]. Retrieved December 13, 2018, from https://www.curbed.com/2018/12/7/18130247/santa-monica-uber-lyft-bird-lime-scooter-bike-app
Task Force on Autonomous Vehicles. (2018). 2018 Final Report to the Oregon State Legislature House Bill 4063 Task Force. State of Oregon.

Urbanism Next | University of Oregon Appendix | Navigating New Mobility | October 2019 | 65

Urbanism Next | University of Oregon 66 | Navigating New Mobility | October 2019 | Appendix
Appendix B: The Multilevel Impacts of Emerging Technologies on City Form and Development, Urbanism Next Center, Chapter 2
In 2018, the University of Oregon’s Urbanism Next Center received a grant from the National Science Foundation to convene experts from around the country to better understand how new mobility, autonomous vehicles, and e-commerce are changing and/or may change city form and development. The goal was to: 1) understand the immediacy of the technology; 2) research the scale of impact from these technological innovations; 3) determine how a diverse range of issues may be connected and impacted; and 4) delineate the important policy and research questions we need to be asking related to city design and municipal administration to maximize the benefits of this new technology while minimizing the negative externalities.
As part of this work, Urbanism Next researchers and contributors created the report, Multilevel Impacts of Emerging Technologies on City Form and Development (Urbanism Next Center, 2019). Chapter 2 of Multilevel Impacts summarizes the forces of change, assumptions, first order impacts, and the implications of the forces of change. It forms a baseline of knowledge which this report draws from.
National Science Foundation Planning Grant
urbanism next center
Multilevel Impacts of Emerging Technologies on City Form and Development OCTOBER 2019
@urbanismnext urbanismnext.com
Urbanism Next | University of Oregon 6 | Multilevel Impacts of Emerging Technology | Chapter 02
Urbanism Next | University of Oregon Chapter 02 | Multilevel Impacts of Emerging Technology | 7
02 | Forces Of Change, Assumptions, First Order Impacts, AND IMPLICATIONS
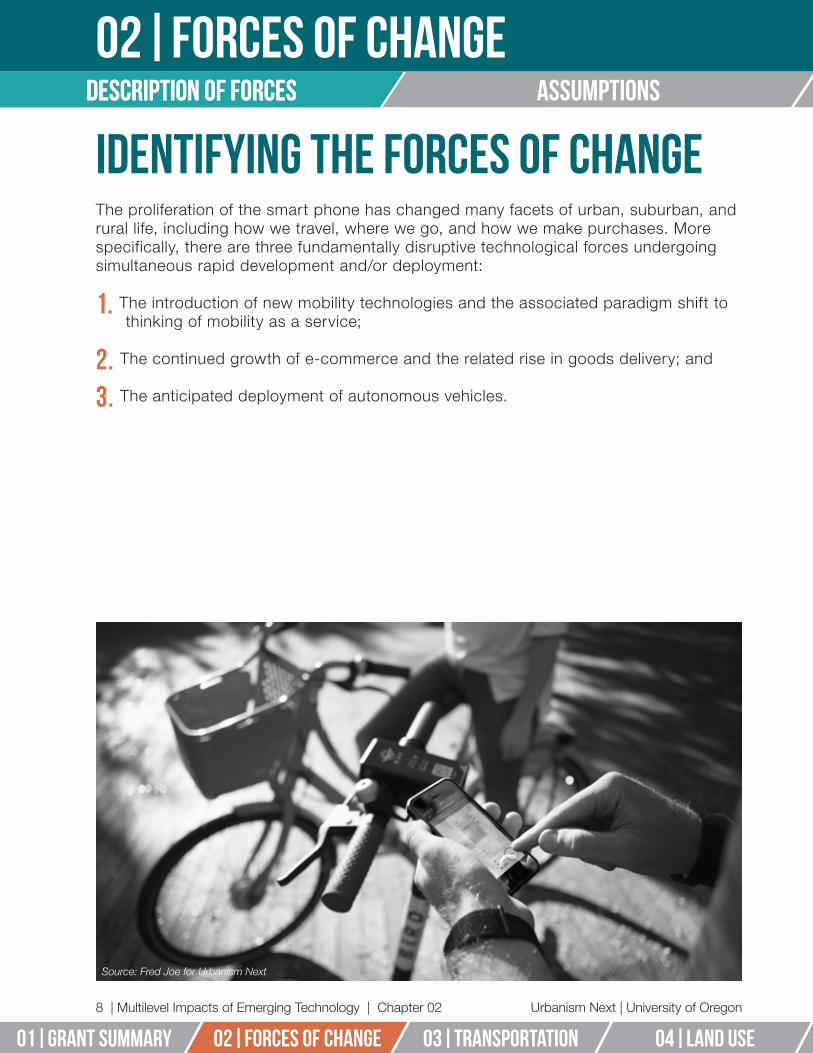
Description of forces
Urbanism Next | University of Oregon
02|forces of changeDescription of forces assumptions
8 | Multilevel Impacts of Emerging Technology | Chapter 02
02|forces of change 01|GRANT SUMMARY 03|TRANSPORTATION 04|LAND USE 05|URBAN DESIGN
Identifying the Forces of ChangeThe proliferation of the smart phone has changed many facets of urban, suburban, and rural life, including how we travel, where we go, and how we make purchases. More specifically, there are three fundamentally disruptive technological forces undergoing simultaneous rapid development and/or deployment:
1. The introduction of new mobility technologies and the associated paradigm shift to thinking of mobility as a service;
2. The continued growth of e-commerce and the related rise in goods delivery; and
3. The anticipated deployment of autonomous vehicles.
Source: Fred Joe for Urbanism Next
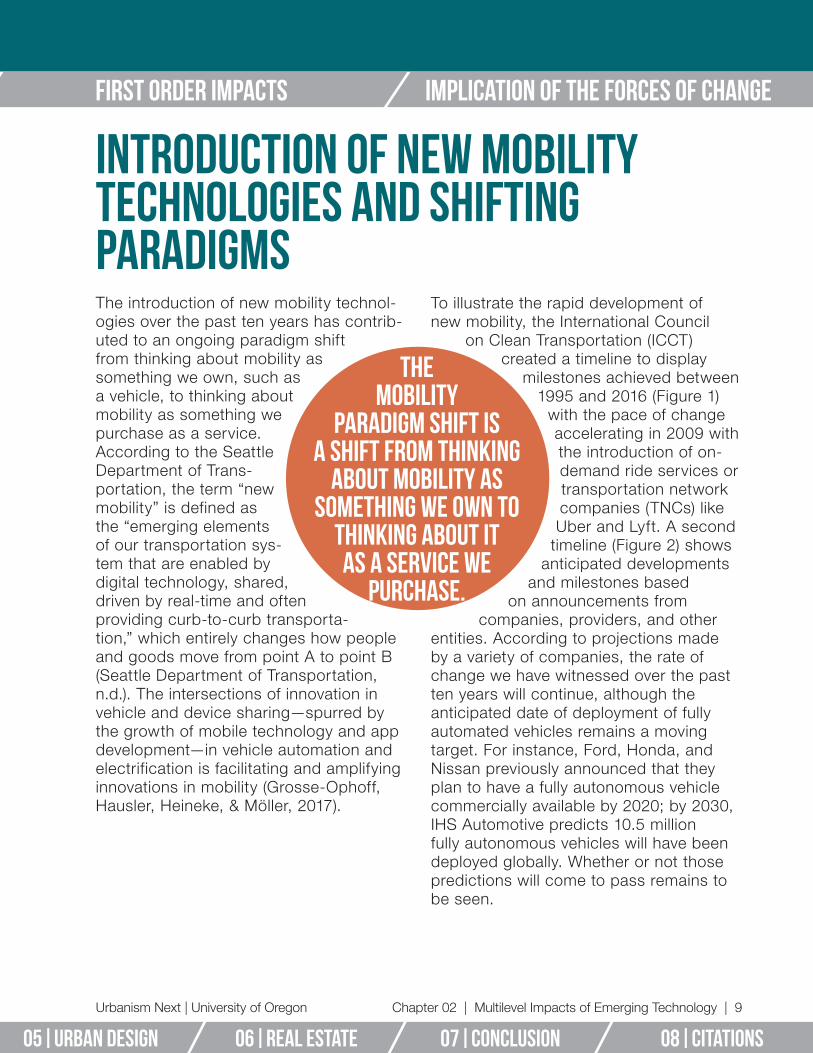
Urbanism Next | University of Oregon
first order impacts Implication of the forces of change
Chapter 02 | Multilevel Impacts of Emerging Technology | 9
05|URBAN DESIGN 06|REAL ESTATE 08|CITATIONS07|CONcLUSION
Introduction of New Mobility Technologies and Shifting ParadigmsThe introduction of new mobility technol-ogies over the past ten years has contrib-uted to an ongoing paradigm shift from thinking about mobility as something we own, such as a vehicle, to thinking about mobility as something we purchase as a service. According to the Seattle Department of Trans-portation, the term “new mobility” is defined as the “emerging elements of our transportation sys-tem that are enabled by digital technology, shared, driven by real-time and often providing curb-to-curb transporta-tion,” which entirely changes how people and goods move from point A to point B (Seattle Department of Transportation, n.d.). The intersections of innovation in vehicle and device sharing—spurred by the growth of mobile technology and app development—in vehicle automation and electrification is facilitating and amplifying innovations in mobility (Grosse-Ophoff, Hausler, Heineke, & Möller, 2017).
To illustrate the rapid development of new mobility, the International Council
on Clean Transportation (ICCT) created a timeline to display
milestones achieved between 1995 and 2016 (Figure 1)
with the pace of change accelerating in 2009 with the introduction of on-demand ride services or transportation network companies (TNCs) like Uber and Lyft. A second
timeline (Figure 2) shows anticipated developments
and milestones based on announcements from
companies, providers, and other entities. According to projections made by a variety of companies, the rate of change we have witnessed over the past ten years will continue, although the anticipated date of deployment of fully automated vehicles remains a moving target. For instance, Ford, Honda, and Nissan previously announced that they plan to have a fully autonomous vehicle commercially available by 2020; by 2030, IHS Automotive predicts 10.5 million fully autonomous vehicles will have been deployed globally. Whether or not those predictions will come to pass remains to be seen.
the mobility
paradigm shift is a shift from thinking
about mobility as something we own to
thinking about it as a service we
purchase.

Description of forces
Urbanism Next | University of Oregon
02|forces of changeDescription of forces assumptions
10 | Multilevel Impacts of Emerging Technology | Chapter 02
02|forces of change 01|GRANT SUMMARY 03|TRANSPORTATION 04|LAND USE 05|URBAN DESIGN
Figure 1. International Council on Clean Transportation’s New Mobility Timeline from 1995 to 2016 (Political Milestones in Blue)
Reprinted from “New Mobility: Today’s Technology and Policy Landscape,” by P. Slowik and F. Kamaketé, 2017, Retrieved from https://www.theicct.org/sites/default/files/publications/New-mobility-landscape_ICCT-white-paper_27072017_vF.pdf. Copy-right 2017 by International Council on Clean Transportation.
Reprinted from “The New Automobility: Lyft, Uber and the Future of American Cities,” by B. Schaller, 2018, Retrieved from http://www.schallerconsult.com/rideservices/automobility.htm. Copyright 2018 by Schaller Consult Inc.
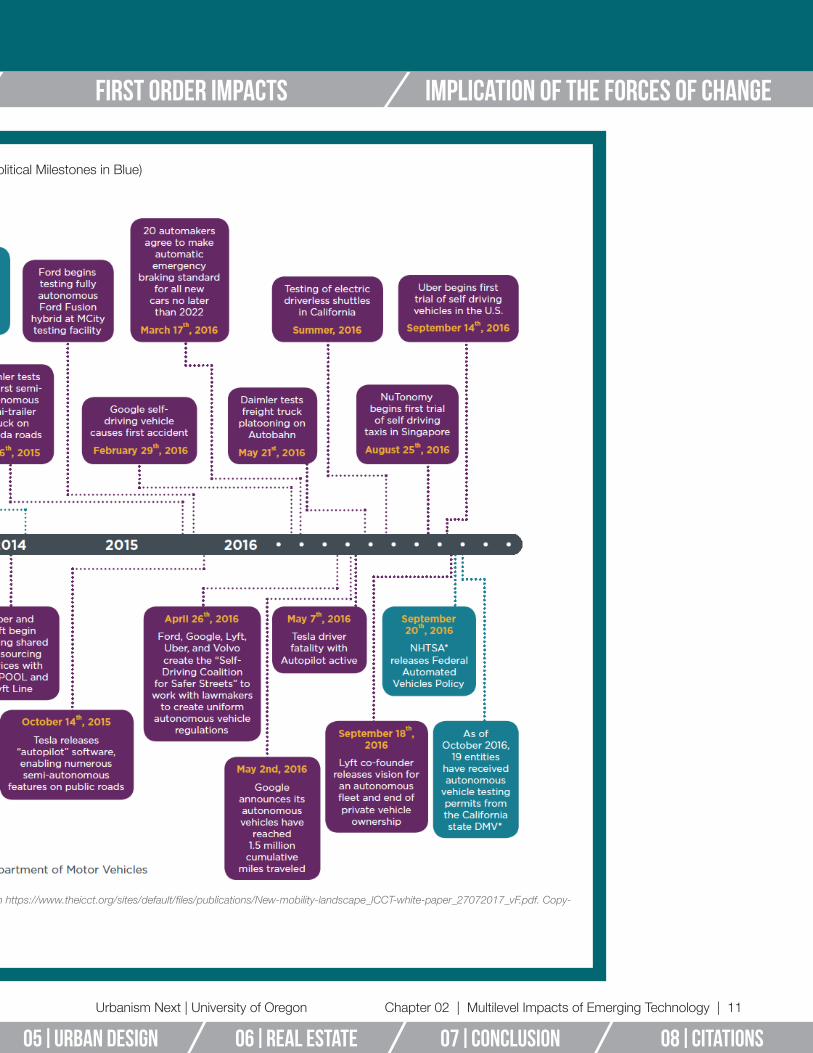
Urbanism Next | University of Oregon
first order impacts Implication of the forces of change
Chapter 02 | Multilevel Impacts of Emerging Technology | 11
05|URBAN DESIGN 06|REAL ESTATE 08|CITATIONS07|CONcLUSION
Figure 1. International Council on Clean Transportation’s New Mobility Timeline from 1995 to 2016 (Political Milestones in Blue)
Reprinted from “New Mobility: Today’s Technology and Policy Landscape,” by P. Slowik and F. Kamaketé, 2017, Retrieved from https://www.theicct.org/sites/default/files/publications/New-mobility-landscape_ICCT-white-paper_27072017_vF.pdf. Copy-right 2017 by International Council on Clean Transportation.
Reprinted from “The New Automobility: Lyft, Uber and the Future of American Cities,” by B. Schaller, 2018, Retrieved from http://www.schallerconsult.com/rideservices/automobility.htm. Copyright 2018 by Schaller Consult Inc.

Description of forces
Urbanism Next | University of Oregon
02|forces of changeDescription of forces assumptions
12 | Multilevel Impacts of Emerging Technology | Chapter 02
02|forces of change 01|GRANT SUMMARY 03|TRANSPORTATION 04|LAND USE 05|URBAN DESIGN
Figure 2. International Council on Clean Transportation’s New Mobility Timeline from 2016 to 2030
Reprinted from “New Mobility: Today’s Technology and Policy Landscape,” by P. Slowik and F. Kamaketé, 2017, Retrieved from https://www.theicct.org/sites/default/files/publications/New-mobility-landscape_ICCT-white-paper_27072017_vF.pdf. Copy-right 2017 by International Council on Clean Transportation.

Urbanism Next | University of Oregon
first order impacts Implication of the forces of change
Chapter 02 | Multilevel Impacts of Emerging Technology | 13
05|URBAN DESIGN 06|REAL ESTATE 08|CITATIONS07|CONcLUSION
Figure 2. International Council on Clean Transportation’s New Mobility Timeline from 2016 to 2030
Reprinted from “New Mobility: Today’s Technology and Policy Landscape,” by P. Slowik and F. Kamaketé, 2017, Retrieved from https://www.theicct.org/sites/default/files/publications/New-mobility-landscape_ICCT-white-paper_27072017_vF.pdf. Copy-right 2017 by International Council on Clean Transportation.
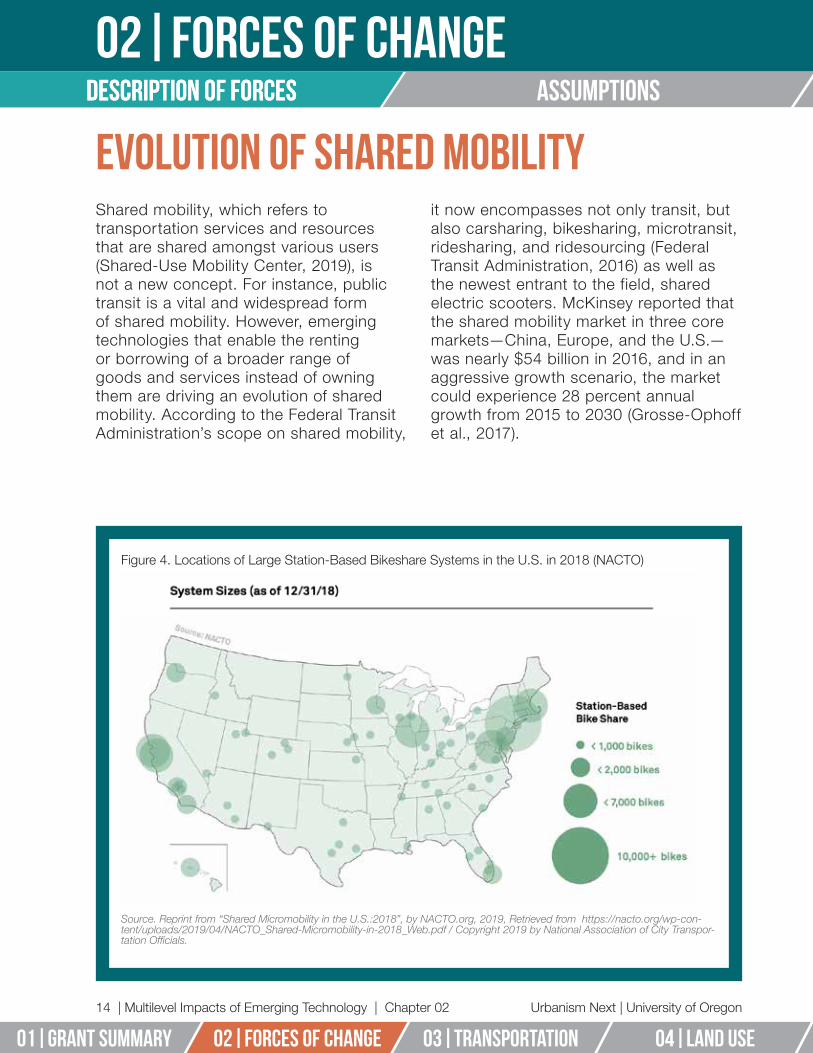
Description of forces
Urbanism Next | University of Oregon
02|forces of changeDescription of forces assumptions
14 | Multilevel Impacts of Emerging Technology | Chapter 02
02|forces of change 01|GRANT SUMMARY 03|TRANSPORTATION 04|LAND USE 05|URBAN DESIGN
Evolution of Shared MobilityShared mobility, which refers to transportation services and resources that are shared amongst various users (Shared-Use Mobility Center, 2019), is not a new concept. For instance, public transit is a vital and widespread form of shared mobility. However, emerging technologies that enable the renting or borrowing of a broader range of goods and services instead of owning them are driving an evolution of shared mobility. According to the Federal Transit Administration’s scope on shared mobility,
it now encompasses not only transit, but also carsharing, bikesharing, microtransit, ridesharing, and ridesourcing (Federal Transit Administration, 2016) as well as the newest entrant to the field, shared electric scooters. McKinsey reported that the shared mobility market in three core markets—China, Europe, and the U.S.—was nearly $54 billion in 2016, and in an aggressive growth scenario, the market could experience 28 percent annual growth from 2015 to 2030 (Grosse-Ophoff et al., 2017).
Figure 4. Locations of Large Station-Based Bikeshare Systems in the U.S. in 2018 (NACTO)
Source. Reprint from “Shared Micromobility in the U.S.:2018”, by NACTO.org, 2019, Retrieved from https://nacto.org/wp-con-tent/uploads/2019/04/NACTO_Shared-Micromobility-in-2018_Web.pdf / Copyright 2019 by National Association of City Transpor-tation Officials.

Urbanism Next | University of Oregon
first order impacts Implication of the forces of change
Chapter 02 | Multilevel Impacts of Emerging Technology | 15
05|URBAN DESIGN 06|REAL ESTATE 08|CITATIONS07|CONcLUSION
Bikesharing (Dockless and Docked)Bikesharing has been in existence for over 24 years in North America, and even longer in Europe. The earliest bikeshare programs, which enabled users to access a shared bicycle as needed, were part of the “first generation of bikeshare” and were free to use. The first bikeshare program to launch in the U.S. was in Portland, OR in 1994, and two years later, the twin cities of Minneapolis and St. Paul launched the first Coin-Deposit system, the first of the “second generation” bikeshare programs (S. A. Shaheen, Guzman, & Zhang, 2010). Second generation bikeshare programs were categorized, in part, by the incorporation of docking stations, setting them apart from the first generation bikeshare programs where bikes could be picked up and left anywhere.
Bikeshare has grown rapidly in the U.S. since 2010. From 2010 to 2016, over 88 million trips were made on a bikeshare bike in the U.S., according to NACTO, or the National Association of City Transportation Officials (NACTO, 2017a). Bikeshare continued growing with 35 million trips in 2017, 25% more than in 2016, and the number of bikes at the end of 2017 (100,000) more than doubled compared to 2016 (NACTO, 2018). Bikeshare further grew in 2018, with a total of 52 million trips on docked, dockless, pedal, and e-bikes combined (NACTO, 2019). Interestingly, dockless systems are somewhat of a return to first generation bikeshare programs since bikes can be deployed with more flexibility, providing users more leeway in where they pick up and drop off a
shared bike. Figure 4 shows the locations of station-based bikeshare systems with 1,000 or more bikes in the U.S. as of 2018 and Figure 5 shows bikeshare ridership in the U.S. from 2010-2019. The majority of the increase in bikeshare between 2010-2017 was from new dockless systems, which comprised 44% of all bikeshare bikes in the U.S in 2017. Dockless bikes continued to be a popular option through 2018, but saw a slow in growth due to the introduction of dockless e-scooters in 2018, which likely replaced some dockless bike trips (NACTO, 2019).
Electric bikes or e-bikes have also grown significantly in popularity. According to a 2018 NACTO report on micromobility, “cities that added e-bikes to their station fleets report that, on average, e-bikes are used twice as frequently as pedal bikes” (NACTO, 2019). Global e-bike sales are expected to grow from over $15.7 billion in revenue in 2016 to $24.4 billion by 2025 (Navigant Research, 2016). Since e-bikes can provide a boost to riders by making it easier to travel further, e-bikes could increase the amount of cycling (both number of trips and total distance) and affect both commuter and leisure travel time (Fyhri & Fearnley, 2015).
Figure 5. Bike Share Ridership in the U.S. Since 2010 (NACTO)
Source. Reprint from “Shared Micromobility in the U.S.:2018”, by NACTO.org, 2019, Retrieved from https://nacto.org/wp-content/uploads/2019/04/NACTO_Shared-Micromobility-in-2018_Web.pdf / Copyright 2019 by National Association of City Transportation Officials.
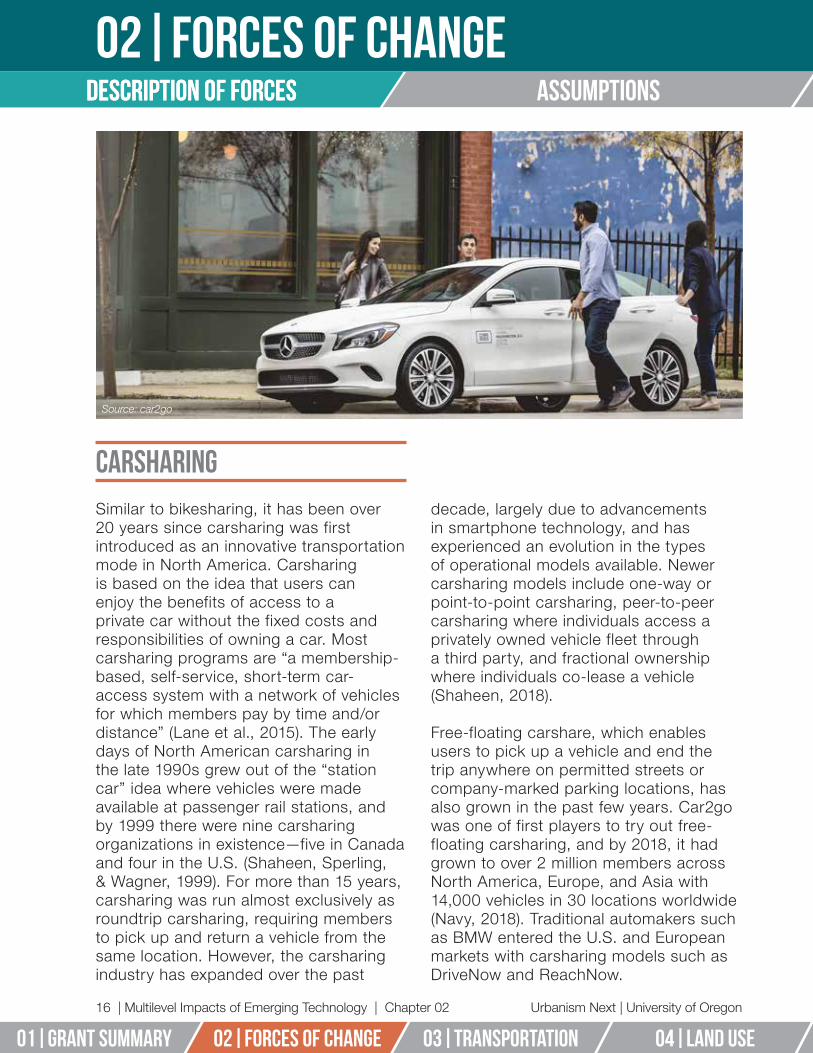
Description of forces
Urbanism Next | University of Oregon
02|forces of changeDescription of forces assumptions
16 | Multilevel Impacts of Emerging Technology | Chapter 02
02|forces of change 01|GRANT SUMMARY 03|TRANSPORTATION 04|LAND USE 05|URBAN DESIGN
CarsharingSimilar to bikesharing, it has been over 20 years since carsharing was first introduced as an innovative transportation mode in North America. Carsharing is based on the idea that users can enjoy the benefits of access to a private car without the fixed costs and responsibilities of owning a car. Most carsharing programs are “a membership-based, self-service, short-term car-access system with a network of vehicles for which members pay by time and/or distance” (Lane et al., 2015). The early days of North American carsharing in the late 1990s grew out of the “station car” idea where vehicles were made available at passenger rail stations, and by 1999 there were nine carsharing organizations in existence—five in Canada and four in the U.S. (Shaheen, Sperling, & Wagner, 1999). For more than 15 years, carsharing was run almost exclusively as roundtrip carsharing, requiring members to pick up and return a vehicle from the same location. However, the carsharing industry has expanded over the past
decade, largely due to advancements in smartphone technology, and has experienced an evolution in the types of operational models available. Newer carsharing models include one-way or point-to-point carsharing, peer-to-peer carsharing where individuals access a privately owned vehicle fleet through a third party, and fractional ownership where individuals co-lease a vehicle (Shaheen, 2018).
Free-floating carshare, which enables users to pick up a vehicle and end the trip anywhere on permitted streets or company-marked parking locations, has also grown in the past few years. Car2go was one of first players to try out free-floating carsharing, and by 2018, it had grown to over 2 million members across North America, Europe, and Asia with 14,000 vehicles in 30 locations worldwide (Navy, 2018). Traditional automakers such as BMW entered the U.S. and European markets with carsharing models such as DriveNow and ReachNow.
Source: car2go

Urbanism Next | University of Oregon
first order impacts Implication of the forces of change
Chapter 02 | Multilevel Impacts of Emerging Technology | 17
05|URBAN DESIGN 06|REAL ESTATE 08|CITATIONS07|CONcLUSION
Ridehailing or Transportation Network Companies (TNCs)Since 2010, a growing number of private companies have entered the for-hire transportation services market offering new travel options that use app-based technology to provide on-demand mobility, known collectively as ridehailing or transportation network companies (TNCs). Previously, for-hire vehicles were primarily taxis and users would call a dispatcher to request a ride. TNCs enable passengers to request rides directly from drivers who generally use their own personal, non-commercial vehicles to transport passengers. TNC services generally follow a point-to-point route and can be dynamically priced based on supply and demand of vehicles, customers, and roadway congestion.
TNCs, such as Uber and Lyft, have had a dramatic impact on mobility in cities. For example, in the U.S., TNCs were
projected to surpass local bus ridership by the end of 2018 (Schaller, 2018). Their overall growth is the result of a number of factors, including, of course, the comfort and convenience of direct point-to-point service. While TNC ridership has increased dramatically over the past few years, taxi ridership has been steadily decreasing (Figure 6). TNC wait times tend to be substantially shorter than for conventional taxis (Wang, 2015), contributing to their increasing popularity compared to taxis. Importantly, TNC drivers have been found to be significantly less discriminatory than taxi drivers (Brown, 2018). A study of ridehailing in Los Angeles County also revealed that TNCs served neighborhoods home to 99.8% of the population (Brown, 2018), providing increased mobility options across all geographies.
Figure 6. TNC and Taxi Ridership in the U.S., 1990-2017.
Reprinted from “The New Automobility: Lyft, Uber and the Future of American Cities,” by B. Schaller, 2018, Retrieved from http://www.schallerconsult.com/rideservices/automo-bility.htm. Copyright 2018 by Schaller Consult Inc.
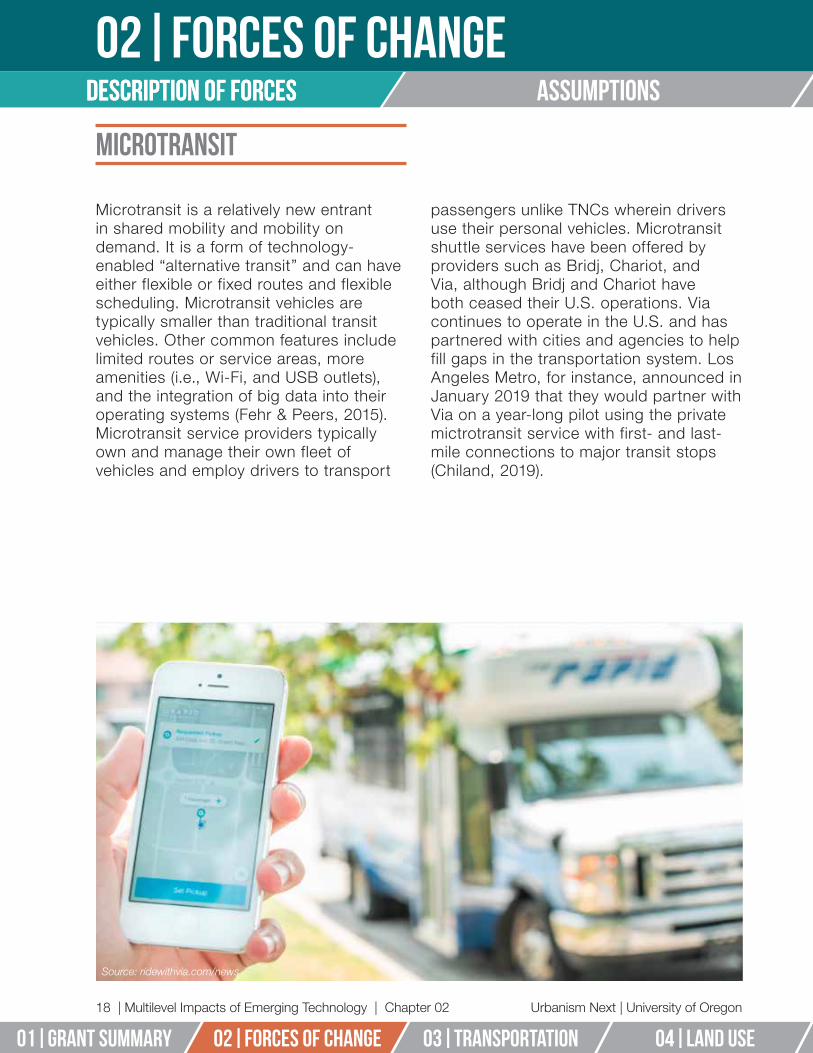
Description of forces
Urbanism Next | University of Oregon
02|forces of changeDescription of forces assumptions
18 | Multilevel Impacts of Emerging Technology | Chapter 02
02|forces of change 01|GRANT SUMMARY 03|TRANSPORTATION 04|LAND USE 05|URBAN DESIGN
Microtransit
Microtransit is a relatively new entrant in shared mobility and mobility on demand. It is a form of technology-enabled “alternative transit” and can have either flexible or fixed routes and flexible scheduling. Microtransit vehicles are typically smaller than traditional transit vehicles. Other common features include limited routes or service areas, more amenities (i.e., Wi-Fi, and USB outlets), and the integration of big data into their operating systems (Fehr & Peers, 2015). Microtransit service providers typically own and manage their own fleet of vehicles and employ drivers to transport
passengers unlike TNCs wherein drivers use their personal vehicles. Microtransit shuttle services have been offered by providers such as Bridj, Chariot, and Via, although Bridj and Chariot have both ceased their U.S. operations. Via continues to operate in the U.S. and has partnered with cities and agencies to help fill gaps in the transportation system. Los Angeles Metro, for instance, announced in January 2019 that they would partner with Via on a year-long pilot using the private mictrotransit service with first- and last-mile connections to major transit stops (Chiland, 2019).
Source: ridewithvia.com/news
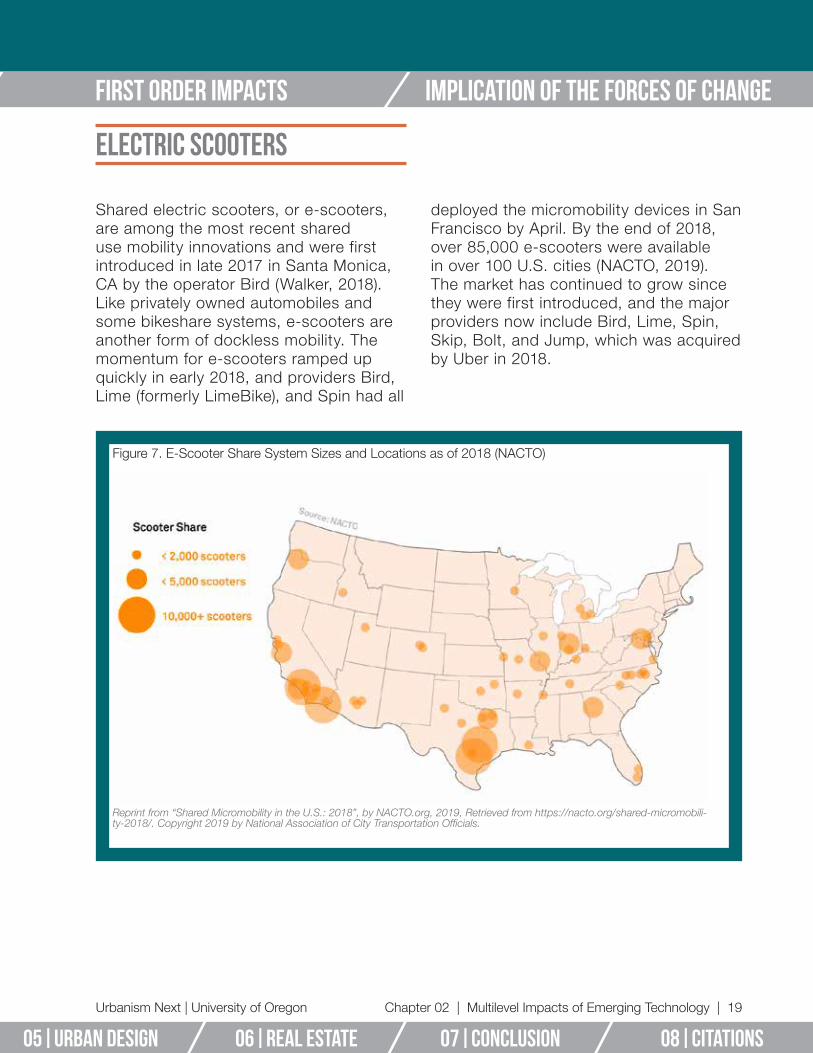
Urbanism Next | University of Oregon
first order impacts Implication of the forces of change
Chapter 02 | Multilevel Impacts of Emerging Technology | 19
05|URBAN DESIGN 06|REAL ESTATE 08|CITATIONS07|CONcLUSION
Electric Scooters
Shared electric scooters, or e-scooters, are among the most recent shared use mobility innovations and were first introduced in late 2017 in Santa Monica, CA by the operator Bird (Walker, 2018). Like privately owned automobiles and some bikeshare systems, e-scooters are another form of dockless mobility. The momentum for e-scooters ramped up quickly in early 2018, and providers Bird, Lime (formerly LimeBike), and Spin had all
deployed the micromobility devices in San Francisco by April. By the end of 2018, over 85,000 e-scooters were available in over 100 U.S. cities (NACTO, 2019). The market has continued to grow since they were first introduced, and the major providers now include Bird, Lime, Spin, Skip, Bolt, and Jump, which was acquired by Uber in 2018.
Figure 7. E-Scooter Share System Sizes and Locations as of 2018 (NACTO)
Reprint from “Shared Micromobility in the U.S.: 2018”, by NACTO.org, 2019, Retrieved from https://nacto.org/shared-micromobili-ty-2018/. Copyright 2019 by National Association of City Transportation Officials.
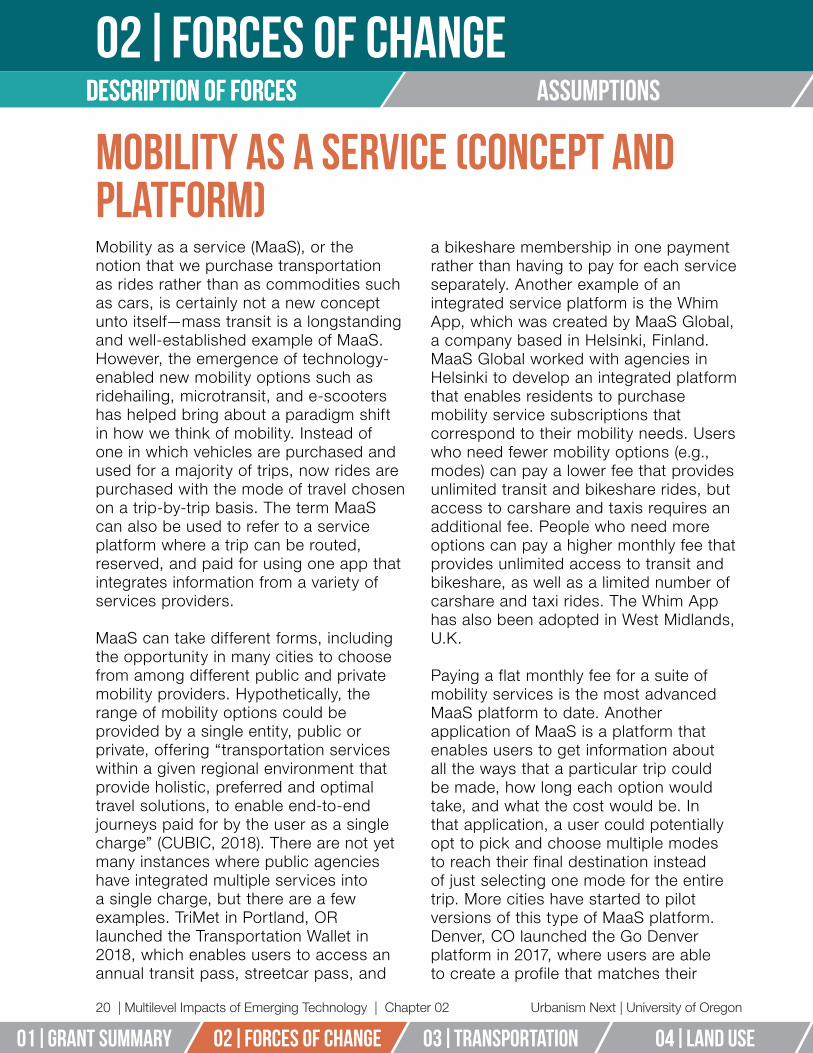
Description of forces
Urbanism Next | University of Oregon
02|forces of changeDescription of forces assumptions
20 | Multilevel Impacts of Emerging Technology | Chapter 02
02|forces of change 01|GRANT SUMMARY 03|TRANSPORTATION 04|LAND USE 05|URBAN DESIGN
Mobility as a Service (Concept and Platform)Mobility as a service (MaaS), or the notion that we purchase transportation as rides rather than as commodities such as cars, is certainly not a new concept unto itself—mass transit is a longstanding and well-established example of MaaS. However, the emergence of technology-enabled new mobility options such as ridehailing, microtransit, and e-scooters has helped bring about a paradigm shift in how we think of mobility. Instead of one in which vehicles are purchased and used for a majority of trips, now rides are purchased with the mode of travel chosen on a trip-by-trip basis. The term MaaS can also be used to refer to a service platform where a trip can be routed, reserved, and paid for using one app that integrates information from a variety of services providers.
MaaS can take different forms, including the opportunity in many cities to choose from among different public and private mobility providers. Hypothetically, the range of mobility options could be provided by a single entity, public or private, offering “transportation services within a given regional environment that provide holistic, preferred and optimal travel solutions, to enable end-to-end journeys paid for by the user as a single charge” (CUBIC, 2018). There are not yet many instances where public agencies have integrated multiple services into a single charge, but there are a few examples. TriMet in Portland, OR launched the Transportation Wallet in 2018, which enables users to access an annual transit pass, streetcar pass, and
a bikeshare membership in one payment rather than having to pay for each service separately. Another example of an integrated service platform is the Whim App, which was created by MaaS Global, a company based in Helsinki, Finland. MaaS Global worked with agencies in Helsinki to develop an integrated platform that enables residents to purchase mobility service subscriptions that correspond to their mobility needs. Users who need fewer mobility options (e.g., modes) can pay a lower fee that provides unlimited transit and bikeshare rides, but access to carshare and taxis requires an additional fee. People who need more options can pay a higher monthly fee that provides unlimited access to transit and bikeshare, as well as a limited number of carshare and taxi rides. The Whim App has also been adopted in West Midlands, U.K.
Paying a flat monthly fee for a suite of mobility services is the most advanced MaaS platform to date. Another application of MaaS is a platform that enables users to get information about all the ways that a particular trip could be made, how long each option would take, and what the cost would be. In that application, a user could potentially opt to pick and choose multiple modes to reach their final destination instead of just selecting one mode for the entire trip. More cities have started to pilot versions of this type of MaaS platform. Denver, CO launched the Go Denver platform in 2017, where users are able to create a profile that matches their

MaaS
2min
total: $2.75
10min $0.25
25min $2.50
arrive: 10:31a (37 min)
$0
Urbanism Next | University of Oregon
first order impacts Implication of the forces of change
Chapter 02 | Multilevel Impacts of Emerging Technology | 21
05|URBAN DESIGN 06|REAL ESTATE 08|CITATIONS07|CONcLUSION
transportation needs and preferences (International Transportation Service, 2017). For example, users can select all their preferred modes and filter out modes they would prefer not to take, and then plan their trips accordingly. LA Metro announced in August 2018 that they were working on developing a MaaS platform for the Transit Access Pass (TAP) Smart Card program to make it a one-stop shop for a variety of mobility services, including transit, bikeshare, and ridehailing, with the option to pay using credit cards or cash (Musulin, 2018).
Some private mobility companies have also started to vertically integrate more services for their users. Unlike some of the applications discussed above, such as the Portland Transportation Wallet or the Go Denver platform which include multiple service providers, some applications are company specific. For
instance, the Uber app allows users to request a ride in a vehicle, or reserve a bicycle or an e-scooter by partnering with bikeshare operator Jump and e-scooter operator Lime (Siddiqui, 2018a). In this instance, multiple modes may be utilized to complete a single trip, but all of the modes are being operated and managed by a single private entity.
It is estimated that the MaaS market is expected to grow nearly tenfold from $38.76 billion in 2017 to $358.35 billion by 2025 (Research and Market, 2018). The acceleration of MaaS and the development of automated services may help with consumer decision-making, make travel more seamless and straightforward, and facilitate more efficient movement by combining various modes to form a holistic transport service ecosystem (KPMG, 2017).
Source: Marsie Surguine for Urbanism Next
Mobility as a Service (MaaS)The mobility paradigm shift is a shift from thinking of mobility as something one invdividually owns (e.g. owning a vehicle or a bike) to approach mobility as a suite of pay-as-you-use transportation services.
The ideal MaaS plataform enables users to get information about all the ways that a particular trip could be made, how long each option would take, what the cost would be, and pay through the app.
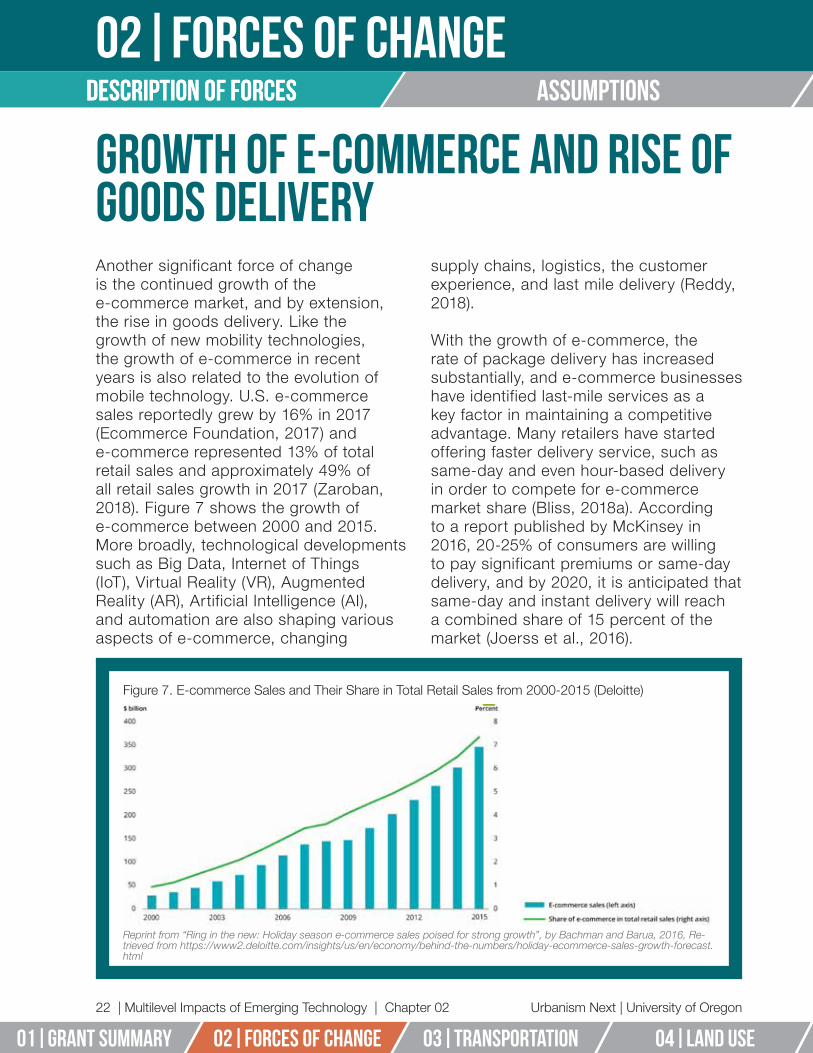
Description of forces
Urbanism Next | University of Oregon
02|forces of changeDescription of forces assumptions
22 | Multilevel Impacts of Emerging Technology | Chapter 02
02|forces of change 01|GRANT SUMMARY 03|TRANSPORTATION 04|LAND USE 05|URBAN DESIGN
Growth of E-Commerce and Rise of Goods DeliveryAnother significant force of change is the continued growth of the e-commerce market, and by extension, the rise in goods delivery. Like the growth of new mobility technologies, the growth of e-commerce in recent years is also related to the evolution of mobile technology. U.S. e-commerce sales reportedly grew by 16% in 2017 (Ecommerce Foundation, 2017) and e-commerce represented 13% of total retail sales and approximately 49% of all retail sales growth in 2017 (Zaroban, 2018). Figure 7 shows the growth of e-commerce between 2000 and 2015. More broadly, technological developments such as Big Data, Internet of Things (IoT), Virtual Reality (VR), Augmented Reality (AR), Artificial Intelligence (AI), and automation are also shaping various aspects of e-commerce, changing
supply chains, logistics, the customer experience, and last mile delivery (Reddy, 2018).
With the growth of e-commerce, the rate of package delivery has increased substantially, and e-commerce businesses have identified last-mile services as a key factor in maintaining a competitive advantage. Many retailers have started offering faster delivery service, such as same-day and even hour-based delivery in order to compete for e-commerce market share (Bliss, 2018a). According to a report published by McKinsey in 2016, 20-25% of consumers are willing to pay significant premiums or same-day delivery, and by 2020, it is anticipated that same-day and instant delivery will reach a combined share of 15 percent of the market (Joerss et al., 2016).
Figure 7. E-commerce Sales and Their Share in Total Retail Sales from 2000-2015 (Deloitte)
Reprint from “Ring in the new: Holiday season e-commerce sales poised for strong growth”, by Bachman and Barua, 2016, Re-trieved from https://www2.deloitte.com/insights/us/en/economy/behind-the-numbers/holiday-ecommerce-sales-growth-forecast.html
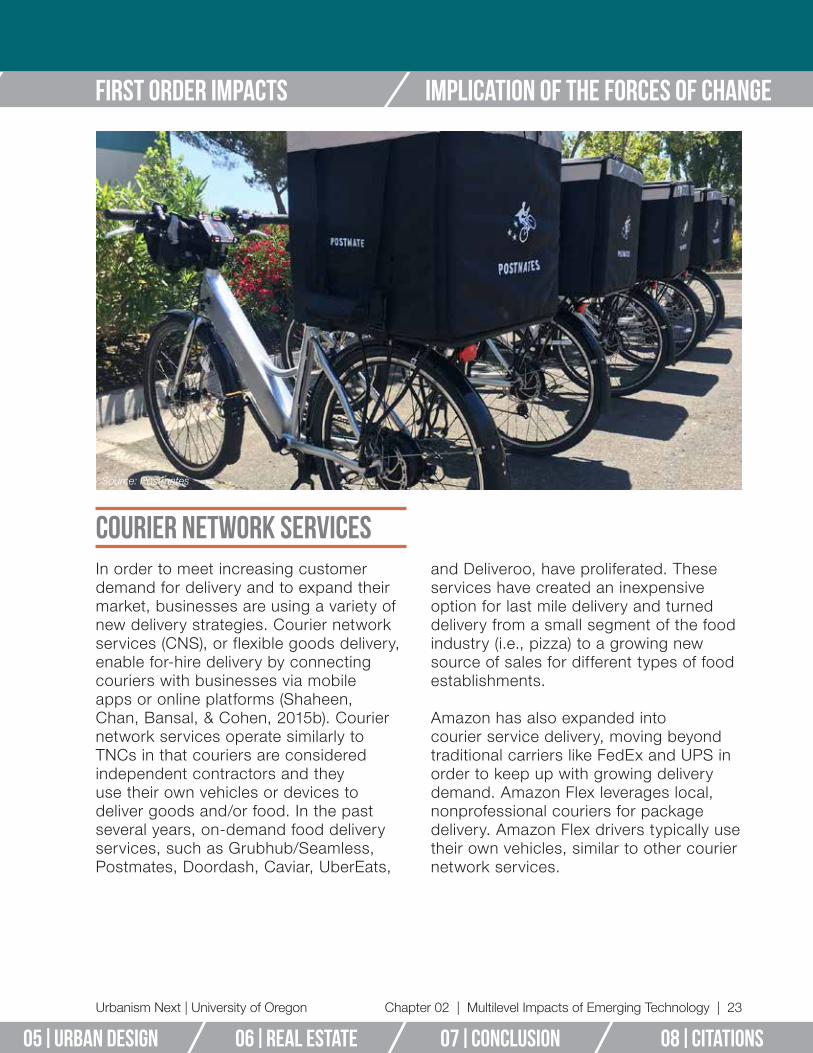
Urbanism Next | University of Oregon
first order impacts Implication of the forces of change
Chapter 02 | Multilevel Impacts of Emerging Technology | 23
05|URBAN DESIGN 06|REAL ESTATE 08|CITATIONS07|CONcLUSION
Courier Network ServicesIn order to meet increasing customer demand for delivery and to expand their market, businesses are using a variety of new delivery strategies. Courier network services (CNS), or flexible goods delivery, enable for-hire delivery by connecting couriers with businesses via mobile apps or online platforms (Shaheen, Chan, Bansal, & Cohen, 2015b). Courier network services operate similarly to TNCs in that couriers are considered independent contractors and they use their own vehicles or devices to deliver goods and/or food. In the past several years, on-demand food delivery services, such as Grubhub/Seamless, Postmates, Doordash, Caviar, UberEats,
and Deliveroo, have proliferated. These services have created an inexpensive option for last mile delivery and turned delivery from a small segment of the food industry (i.e., pizza) to a growing new source of sales for different types of food establishments.
Amazon has also expanded into courier service delivery, moving beyond traditional carriers like FedEx and UPS in order to keep up with growing delivery demand. Amazon Flex leverages local, nonprofessional couriers for package delivery. Amazon Flex drivers typically use their own vehicles, similar to other courier network services.
Source: Postmates

Description of forces
Urbanism Next | University of Oregon
02|forces of changeDescription of forces assumptions
24 | Multilevel Impacts of Emerging Technology | Chapter 02
02|forces of change 01|GRANT SUMMARY 03|TRANSPORTATION 04|LAND USE 05|URBAN DESIGN
Autonomous Vehicles on the HorizonThe force of changes described above are already underway, including the limited deployment of autonomous vehicles. While many factors contribute to the adoption, deployment, and acceptance of autonomous vehicles, it is likely that this next decade will see autonomous ridehailing-type passenger services rolled out, such as those that exist in Phoenix, Arizona. Deployment will not be ubiquitous in all cities, however, as technological challenges will need to be overcome regionally. While the exact speed and scale of AV deployment is uncertain, it is clear their development and use will be disruptive to the existing transportation, real estate, design, and financial structures of cities.
Passenger MobilityTransportation network companies like Uber and Lyft provide a good model of how autonomous vehicles are likely to be used given their on-demand nature, point-to-point service, ease in pooling customers if desired, and ability to dynamically price trips. Accordingly, understanding the use patterns and municipal impacts of TNCs can help provide initial insights about anticipated changes.
There is some evidence that AV operators will adopt a MaaS approach rather than a private vehicle ownership model, although the exact mix of personally-owned versus fleet-based trip-making is hard to predict at this time. For example, Waymo, the self-driving unit under Alphabet, Google’s parent company, ordered over 60,000 AVs to be used in its own ridehailing application in May of 2018 (Boudette, 2018). Ford launched a Smart Mobility Unit in 2016, expanding its offerings beyond personally-owned vehicles and is also heavily investing in a vertically
integrated MaaS strategy, including AVs (Bomey, 2016). Many also believe that ridehailing companies like Uber and Lyft are currently fighting for market share and survival as driverless vehicles may be key to their profitability (Lekach, 2019; Siddiqui & Bensinger, 2019). Other companies, such as Tesla, are betting that AVs will simply represent the next generation of the current model of private vehicle ownership. The future is likely to be a mix of these options, varying by city size, location within a metropolitan area, topography, or other factors, but what is likely different than what many cities experience currently is that the increase in ridehailing with the introduction of AVs is likely to be significant.
AV technology could allow for the emergence of shared autonomous vehicles (SAVs), which are likely be cheaper to take a ride in than human-operated ridehailing and taxi services since the labor cost of the driver would be eliminated (Litman, 2018)driverless or robotic. Ford plans to release fully automated vehicles designed for ‘high-
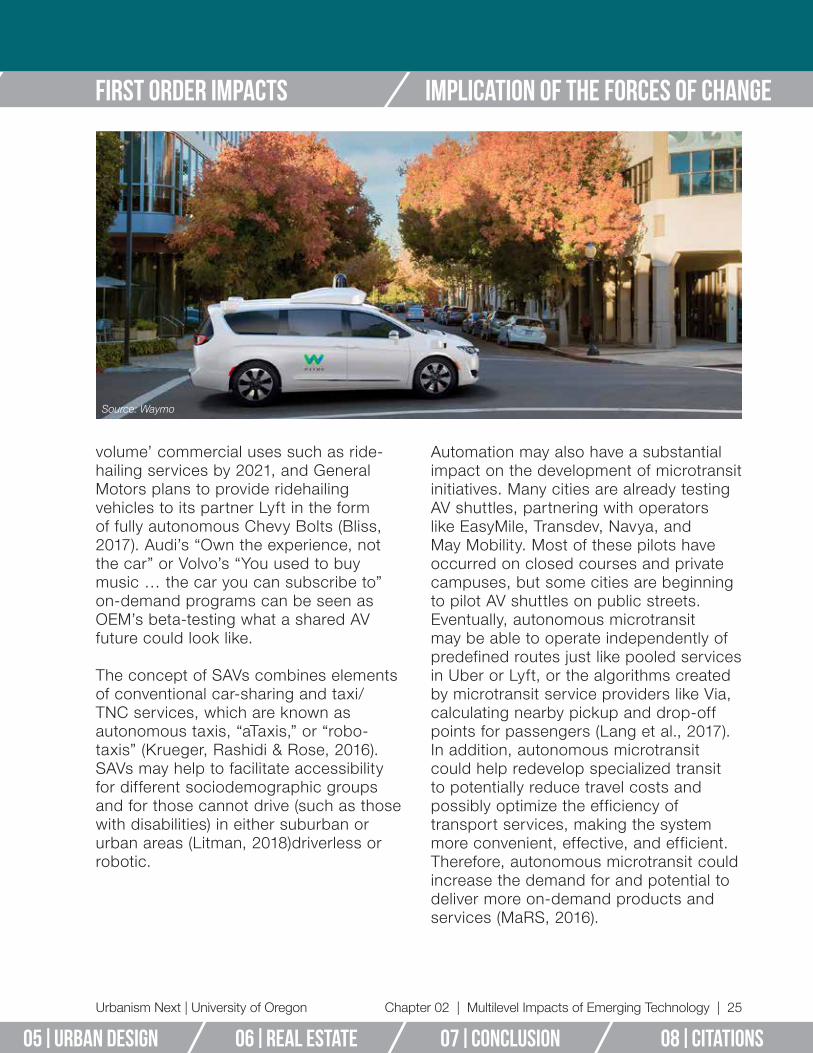
Source: Waymo
Urbanism Next | University of Oregon
first order impacts Implication of the forces of change
Chapter 02 | Multilevel Impacts of Emerging Technology | 25
05|URBAN DESIGN 06|REAL ESTATE 08|CITATIONS07|CONcLUSION
volume’ commercial uses such as ride-hailing services by 2021, and General Motors plans to provide ridehailing vehicles to its partner Lyft in the form of fully autonomous Chevy Bolts (Bliss, 2017). Audi’s “Own the experience, not the car” or Volvo’s “You used to buy music … the car you can subscribe to” on-demand programs can be seen as OEM’s beta-testing what a shared AV future could look like.
The concept of SAVs combines elements of conventional car-sharing and taxi/TNC services, which are known as autonomous taxis, “aTaxis,” or “robo-taxis” (Krueger, Rashidi & Rose, 2016). SAVs may help to facilitate accessibility for different sociodemographic groups and for those cannot drive (such as those with disabilities) in either suburban or urban areas (Litman, 2018)driverless or robotic.
Automation may also have a substantial impact on the development of microtransit initiatives. Many cities are already testing AV shuttles, partnering with operators like EasyMile, Transdev, Navya, and May Mobility. Most of these pilots have occurred on closed courses and private campuses, but some cities are beginning to pilot AV shuttles on public streets. Eventually, autonomous microtransit may be able to operate independently of predefined routes just like pooled services in Uber or Lyft, or the algorithms created by microtransit service providers like Via, calculating nearby pickup and drop-off points for passengers (Lang et al., 2017). In addition, autonomous microtransit could help redevelop specialized transit to potentially reduce travel costs and possibly optimize the efficiency of transport services, making the system more convenient, effective, and efficient. Therefore, autonomous microtransit could increase the demand for and potential to deliver more on-demand products and services (MaRS, 2016).
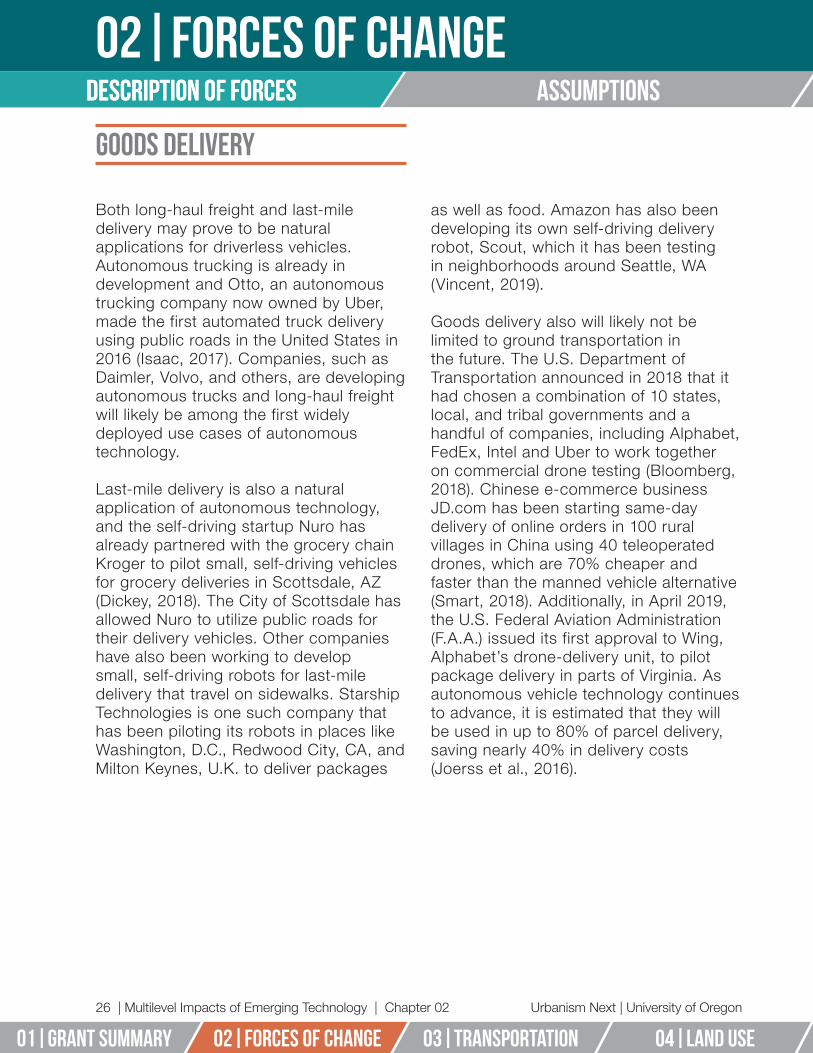
Description of forces
Urbanism Next | University of Oregon
02|forces of changeDescription of forces assumptions
26 | Multilevel Impacts of Emerging Technology | Chapter 02
02|forces of change 01|GRANT SUMMARY 03|TRANSPORTATION 04|LAND USE 05|URBAN DESIGN
Goods Delivery
Both long-haul freight and last-mile delivery may prove to be natural applications for driverless vehicles. Autonomous trucking is already in development and Otto, an autonomous trucking company now owned by Uber, made the first automated truck delivery using public roads in the United States in 2016 (Isaac, 2017). Companies, such as Daimler, Volvo, and others, are developing autonomous trucks and long-haul freight will likely be among the first widely deployed use cases of autonomous technology.
Last-mile delivery is also a natural application of autonomous technology, and the self-driving startup Nuro has already partnered with the grocery chain Kroger to pilot small, self-driving vehicles for grocery deliveries in Scottsdale, AZ (Dickey, 2018). The City of Scottsdale has allowed Nuro to utilize public roads for their delivery vehicles. Other companies have also been working to develop small, self-driving robots for last-mile delivery that travel on sidewalks. Starship Technologies is one such company that has been piloting its robots in places like Washington, D.C., Redwood City, CA, and Milton Keynes, U.K. to deliver packages
as well as food. Amazon has also been developing its own self-driving delivery robot, Scout, which it has been testing in neighborhoods around Seattle, WA (Vincent, 2019).
Goods delivery also will likely not be limited to ground transportation in the future. The U.S. Department of Transportation announced in 2018 that it had chosen a combination of 10 states, local, and tribal governments and a handful of companies, including Alphabet, FedEx, Intel and Uber to work together on commercial drone testing (Bloomberg, 2018). Chinese e-commerce business JD.com has been starting same-day delivery of online orders in 100 rural villages in China using 40 teleoperated drones, which are 70% cheaper and faster than the manned vehicle alternative (Smart, 2018). Additionally, in April 2019, the U.S. Federal Aviation Administration (F.A.A.) issued its first approval to Wing, Alphabet’s drone-delivery unit, to pilot package delivery in parts of Virginia. As autonomous vehicle technology continues to advance, it is estimated that they will be used in up to 80% of parcel delivery, saving nearly 40% in delivery costs (Joerss et al., 2016).

Urbanism Next | University of Oregon
first order impacts Implication of the forces of change
Chapter 02 | Multilevel Impacts of Emerging Technology | 27
05|URBAN DESIGN 06|REAL ESTATE 08|CITATIONS07|CONcLUSION
Demographic ShiftsThere are many simultaneous changes happening in society that will have significant impacts on the form and function of cities. In tandem with the technological advancements described above, we are also seeing demographic shifts in household preferences for housing and transportation. Young people aged 20 to 30 are less likely to move from central cities to suburbs than a decade ago (Cortright, 2016b; Dutzik, Inglis, & Baxandall, 2014). As we move more and more towards a “knowledge economy” it is worth noting what Richard Florida wrote in 2017:
Today, clustering, not dispersal, powers innovation and economic growth. Many people still like living in suburbs, of course, but suburban growth has fallen out of sync with the demands of the urbanized knowledge economy …. The suburbs aren’t going away, but they are no longer the apotheosis of the American Dream and the engine of economic growth (Florida, 2017).
In addition to this, young people, especially Millennials, are less likely than older generations to become licensed drivers (Cortright, 2016a), and they tend to live in more walkable areas or areas equipped with more active transportation options. Also, emerging technologies are providing new ways of experiencing information in urban space. Young people tend to adopt technologies (i.e., smartphones, ridehailing) faster than other age cohorts: research shows that people age between 25 and 34 have the highest usage of TNCs compared to other age groups (Schaller, 2018). According to Pew Research Center, 92% of Millennials own smartphones, compared with 85% of Gen Xers, 67% of Baby Boomers, and 30% of the Silent Generation (Jiang, 2018). As the younger generations age and the newest generation, Generation Z, grows into adulthood, we will likely see greater adoption rates as a share of the total population because the technology needed to hail new mobility services will be more ubiquitous.
Young people aged 20 to 30 are less likely to move from central cities to suburbs than a decade ago.
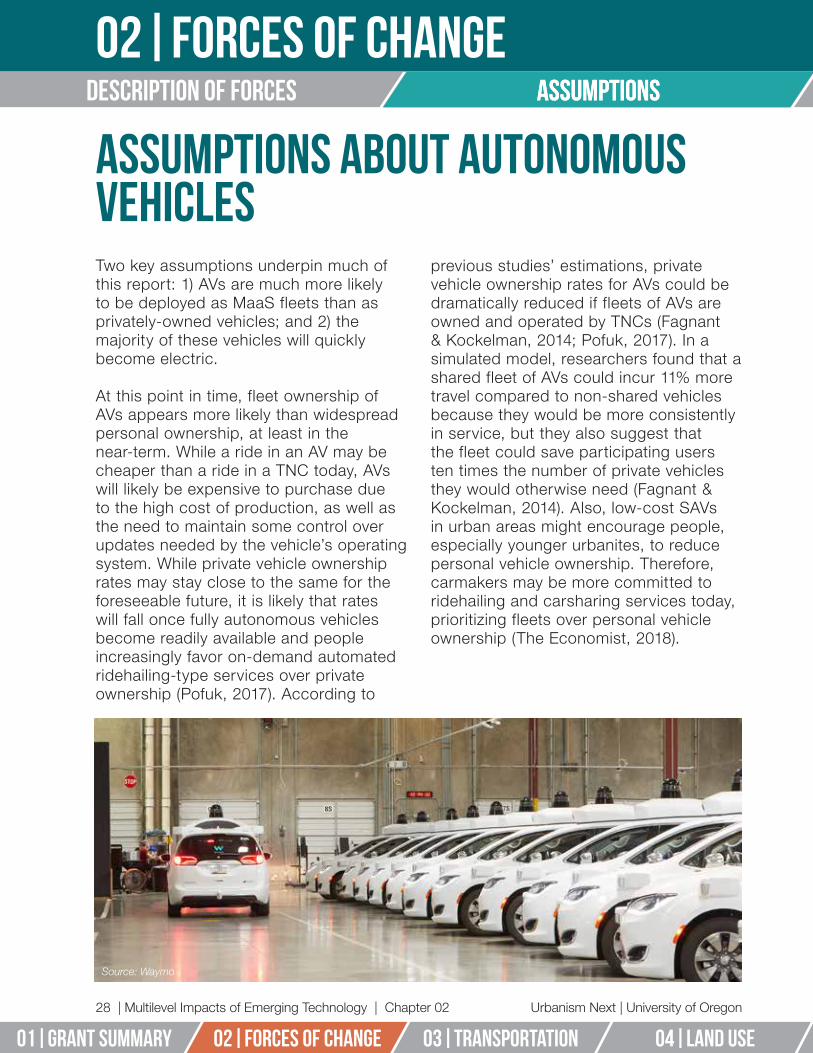
assumptions
Urbanism Next | University of Oregon
02|forces of changeDescription of forces assumptions
28 | Multilevel Impacts of Emerging Technology | Chapter 02
02|forces of change 01|GRANT SUMMARY 03|TRANSPORTATION 04|LAND USE 05|URBAN DESIGN
Assumptions About Autonomous VehiclesTwo key assumptions underpin much of this report: 1) AVs are much more likely to be deployed as MaaS fleets than as privately-owned vehicles; and 2) the majority of these vehicles will quickly become electric.
At this point in time, fleet ownership of AVs appears more likely than widespread personal ownership, at least in the near-term. While a ride in an AV may be cheaper than a ride in a TNC today, AVs will likely be expensive to purchase due to the high cost of production, as well as the need to maintain some control over updates needed by the vehicle’s operating system. While private vehicle ownership rates may stay close to the same for the foreseeable future, it is likely that rates will fall once fully autonomous vehicles become readily available and people increasingly favor on-demand automated ridehailing-type services over private ownership (Pofuk, 2017). According to
previous studies’ estimations, private vehicle ownership rates for AVs could be dramatically reduced if fleets of AVs are owned and operated by TNCs (Fagnant & Kockelman, 2014; Pofuk, 2017). In a simulated model, researchers found that a shared fleet of AVs could incur 11% more travel compared to non-shared vehicles because they would be more consistently in service, but they also suggest that the fleet could save participating users ten times the number of private vehicles they would otherwise need (Fagnant & Kockelman, 2014). Also, low-cost SAVs in urban areas might encourage people, especially younger urbanites, to reduce personal vehicle ownership. Therefore, carmakers may be more committed to ridehailing and carsharing services today, prioritizing fleets over personal vehicle ownership (The Economist, 2018).
Source: Waymo
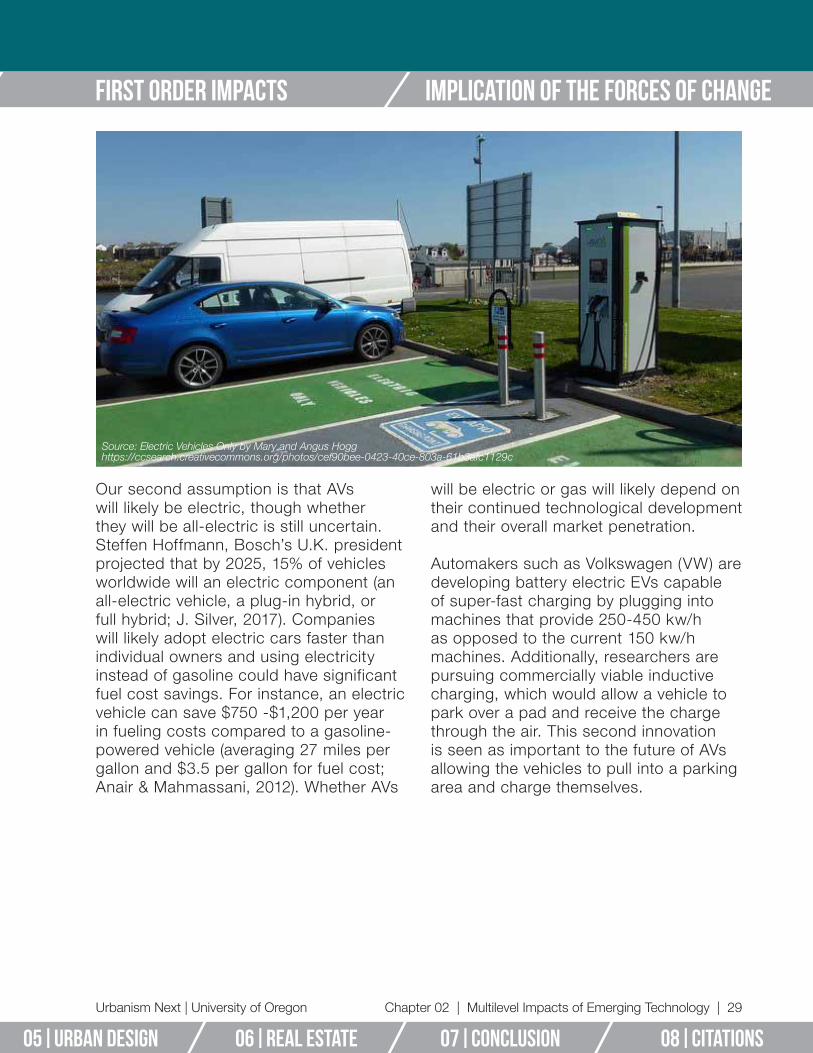
Urbanism Next | University of Oregon
first order impacts Implication of the forces of change
Chapter 02 | Multilevel Impacts of Emerging Technology | 29
05|URBAN DESIGN 06|REAL ESTATE 08|CITATIONS07|CONcLUSION
Our second assumption is that AVs will likely be electric, though whether they will be all-electric is still uncertain. Steffen Hoffmann, Bosch’s U.K. president projected that by 2025, 15% of vehicles worldwide will an electric component (an all-electric vehicle, a plug-in hybrid, or full hybrid; J. Silver, 2017). Companies will likely adopt electric cars faster than individual owners and using electricity instead of gasoline could have significant fuel cost savings. For instance, an electric vehicle can save $750 -$1,200 per year in fueling costs compared to a gasoline-powered vehicle (averaging 27 miles per gallon and $3.5 per gallon for fuel cost; Anair & Mahmassani, 2012). Whether AVs
will be electric or gas will likely depend on their continued technological development and their overall market penetration.
Automakers such as Volkswagen (VW) are developing battery electric EVs capable of super-fast charging by plugging into machines that provide 250-450 kw/h as opposed to the current 150 kw/h machines. Additionally, researchers are pursuing commercially viable inductive charging, which would allow a vehicle to park over a pad and receive the charge through the air. This second innovation is seen as important to the future of AVs allowing the vehicles to pull into a parking area and charge themselves.
Source: Electric Vehicles Only by Mary and Angus Hogghttps://ccsearch.creativecommons.org/photos/cef90bee-0423-40ce-803a-61b3afc1129c
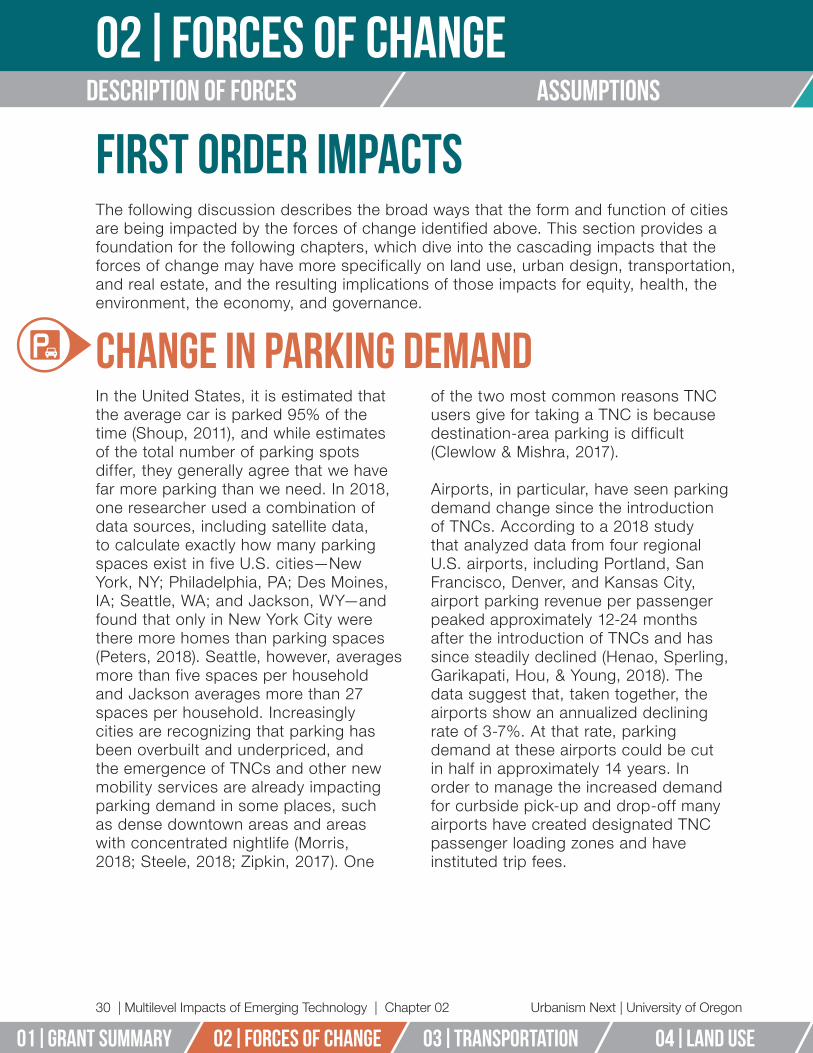
Urbanism Next | University of Oregon
02|forces of changeDescription of forces assumptions
30 | Multilevel Impacts of Emerging Technology | Chapter 02
02|forces of change 01|GRANT SUMMARY 03|TRANSPORTATION 04|LAND USE 05|URBAN DESIGN
First Order ImpactsThe following discussion describes the broad ways that the form and function of cities are being impacted by the forces of change identified above. This section provides a foundation for the following chapters, which dive into the cascading impacts that the forces of change may have more specifically on land use, urban design, transportation, and real estate, and the resulting implications of those impacts for equity, health, the environment, the economy, and governance.
Change in Parking Demand In the United States, it is estimated that the average car is parked 95% of the time (Shoup, 2011), and while estimates of the total number of parking spots differ, they generally agree that we have far more parking than we need. In 2018, one researcher used a combination of data sources, including satellite data, to calculate exactly how many parking spaces exist in five U.S. cities—New York, NY; Philadelphia, PA; Des Moines, IA; Seattle, WA; and Jackson, WY—and found that only in New York City were there more homes than parking spaces (Peters, 2018). Seattle, however, averages more than five spaces per household and Jackson averages more than 27 spaces per household. Increasingly cities are recognizing that parking has been overbuilt and underpriced, and the emergence of TNCs and other new mobility services are already impacting parking demand in some places, such as dense downtown areas and areas with concentrated nightlife (Morris, 2018; Steele, 2018; Zipkin, 2017). One
of the two most common reasons TNC users give for taking a TNC is because destination-area parking is difficult (Clewlow & Mishra, 2017).
Airports, in particular, have seen parking demand change since the introduction of TNCs. According to a 2018 study that analyzed data from four regional U.S. airports, including Portland, San Francisco, Denver, and Kansas City, airport parking revenue per passenger peaked approximately 12-24 months after the introduction of TNCs and has since steadily declined (Henao, Sperling, Garikapati, Hou, & Young, 2018). The data suggest that, taken together, the airports show an annualized declining rate of 3-7%. At that rate, parking demand at these airports could be cut in half in approximately 14 years. In order to manage the increased demand for curbside pick-up and drop-off many airports have created designated TNC passenger loading zones and have instituted trip fees.
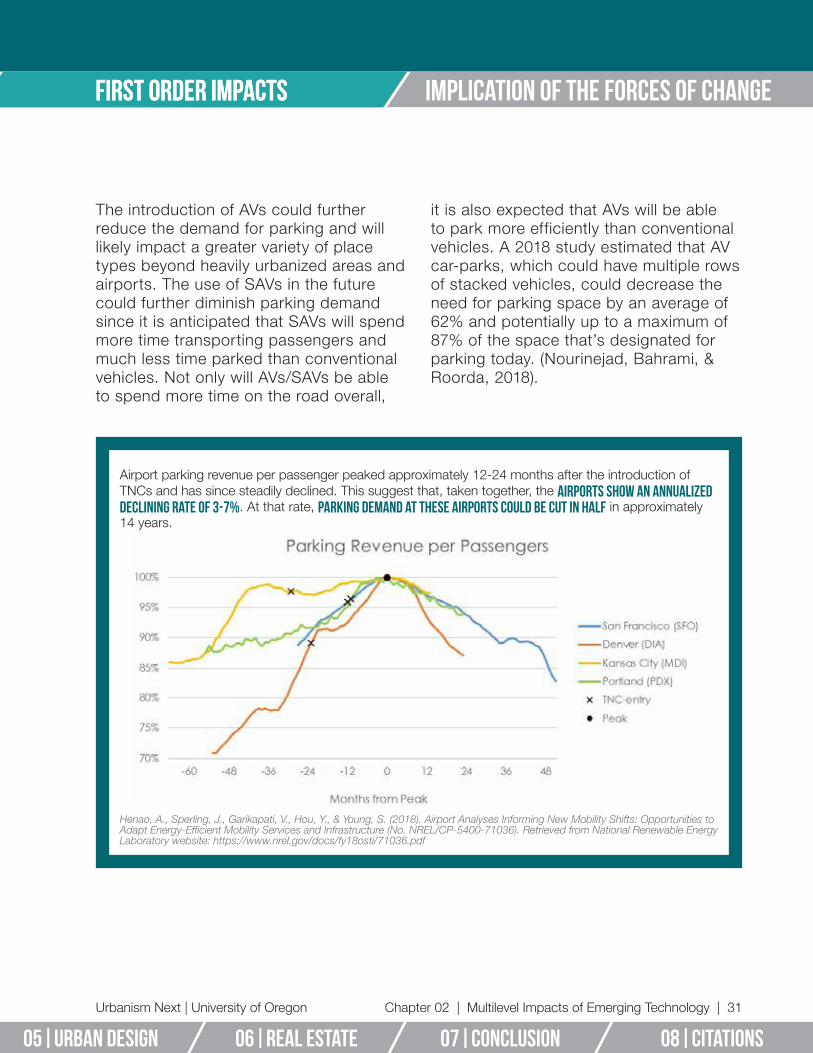
first order impacts
Urbanism Next | University of Oregon
first order impacts Implication of the forces of change
Chapter 02 | Multilevel Impacts of Emerging Technology | 31
05|URBAN DESIGN 06|REAL ESTATE 08|CITATIONS07|CONcLUSION
The introduction of AVs could further reduce the demand for parking and will likely impact a greater variety of place types beyond heavily urbanized areas and airports. The use of SAVs in the future could further diminish parking demand since it is anticipated that SAVs will spend more time transporting passengers and much less time parked than conventional vehicles. Not only will AVs/SAVs be able to spend more time on the road overall,
it is also expected that AVs will be able to park more efficiently than conventional vehicles. A 2018 study estimated that AV car-parks, which could have multiple rows of stacked vehicles, could decrease the need for parking space by an average of 62% and potentially up to a maximum of 87% of the space that’s designated for parking today. (Nourinejad, Bahrami, & Roorda, 2018).
Henao, A., Sperling, J., Garikapati, V., Hou, Y., & Young, S. (2018). Airport Analyses Informing New Mobility Shifts: Opportunities to Adapt Energy-Efficient Mobility Services and Infrastructure (No. NREL/CP-5400-71036). Retrieved from National Renewable Energy Laboratory website: https://www.nrel.gov/docs/fy18osti/71036.pdf
Airport parking revenue per passenger peaked approximately 12-24 months after the introduction of TNCs and has since steadily declined. This suggest that, taken together, the airports show an annualized declining rate of 3-7%. At that rate, parking demand at these airports could be cut in half in approximately 14 years.

Urbanism Next | University of Oregon
02|forces of changeDescription of forces assumptions
32 | Multilevel Impacts of Emerging Technology | Chapter 02
02|forces of change 01|GRANT SUMMARY 03|TRANSPORTATION 04|LAND USE 05|URBAN DESIGN
Change in Vehicle Miles TraveledRecent studies have found that vehicle miles/kilometers traveled (VMT) has in-creased over the past several years and some of that growth has been attributed to the rise of TNCs. In a 2017 UC Davis study on ridehailing, researchers Clewlow and Mishra asked respondents to answer the question, “If Uber and Lyft were unavailable, which transporta-tion alternatives would you use for the trips that you make using Uber and Lyft?” Twenty-two per-cent of respondents said they would have just made fewer trips if they hadn’t used a TNC (Clewlow & Mish-ra, 2017). Since Uber and Lyft were an option, however, these respondents opted to take a vehicle trip that they would otherwise would not have made. This is not necessarily a bad thing since it may be that TNCs are filling transportation gaps and addressing issues of latent demand by expanding mobility for underserved populations, as research findings suggest (Brown, 2018).
Based on existing studies, AVs could contribute to an increase in travel demand due to a variety of factors including, but not limited to: increased mobility options for certain populations (people with disabilities, elderly, etc.); induced demand (people choosing to take trips
they otherwise may not have taken); and people choosing to travel
to destinations that are further away because the
mode of travel is more comfortable. These factors could potentially yield additional VMT because more trips may be generated and more locations/
destinations may be accessible (Childress et
al., 2015; Correia et al., 2016). Gucwa (2014) reported
that VMT could increase between 4-8% by applying different scenarios of road capacity and value of time changes through the introduction of AVs. Bierstedt and colleagues (2014) estimated that at 5% market penetration AVs could increase VMT from 5-20% depending on facility class, and could reach as high as 35% with 95% penetration.
At 5% market penetration AVs
could increase VMT from 5-20% depending
on facility class, and could reach as high as 35% with 95%
penetration.
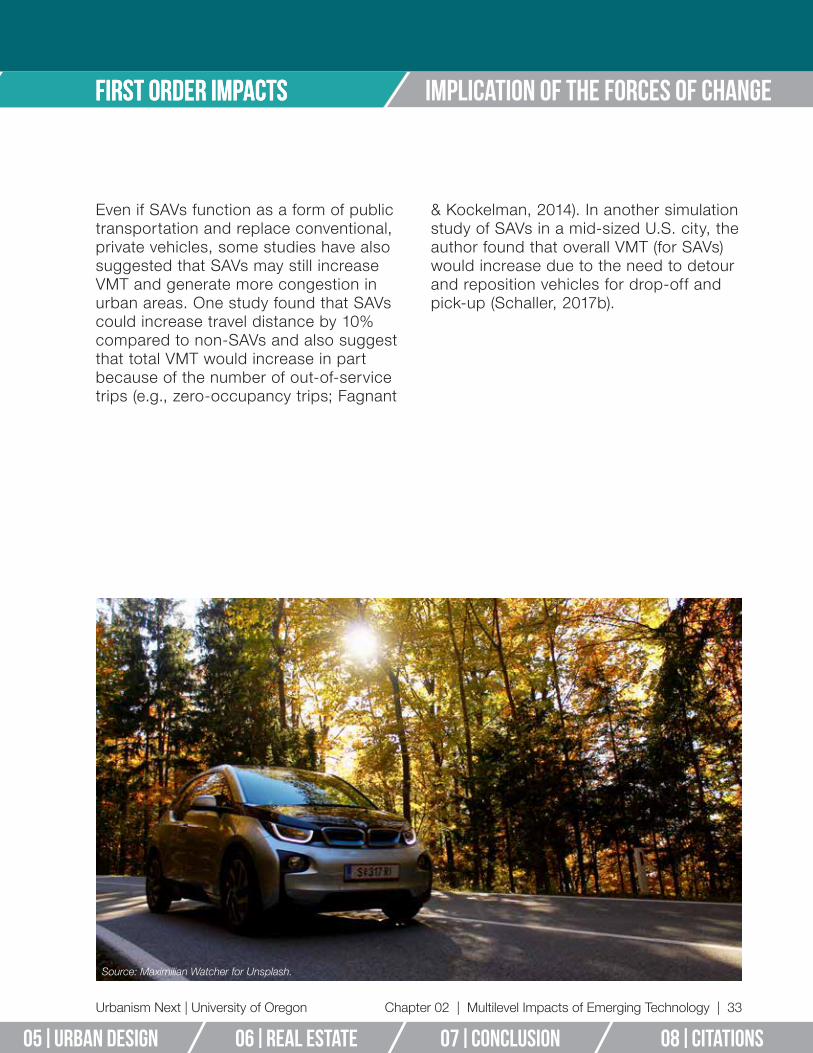
first order impacts
Urbanism Next | University of Oregon
first order impacts Implication of the forces of change
Chapter 02 | Multilevel Impacts of Emerging Technology | 33
05|URBAN DESIGN 06|REAL ESTATE 08|CITATIONS07|CONcLUSION
Even if SAVs function as a form of public transportation and replace conventional, private vehicles, some studies have also suggested that SAVs may still increase VMT and generate more congestion in urban areas. One study found that SAVs could increase travel distance by 10% compared to non-SAVs and also suggest that total VMT would increase in part because of the number of out-of-service trips (e.g., zero-occupancy trips; Fagnant
& Kockelman, 2014). In another simulation study of SAVs in a mid-sized U.S. city, the author found that overall VMT (for SAVs) would increase due to the need to detour and reposition vehicles for drop-off and pick-up (Schaller, 2017b).
Source: Maximilian Watcher for Unsplash.
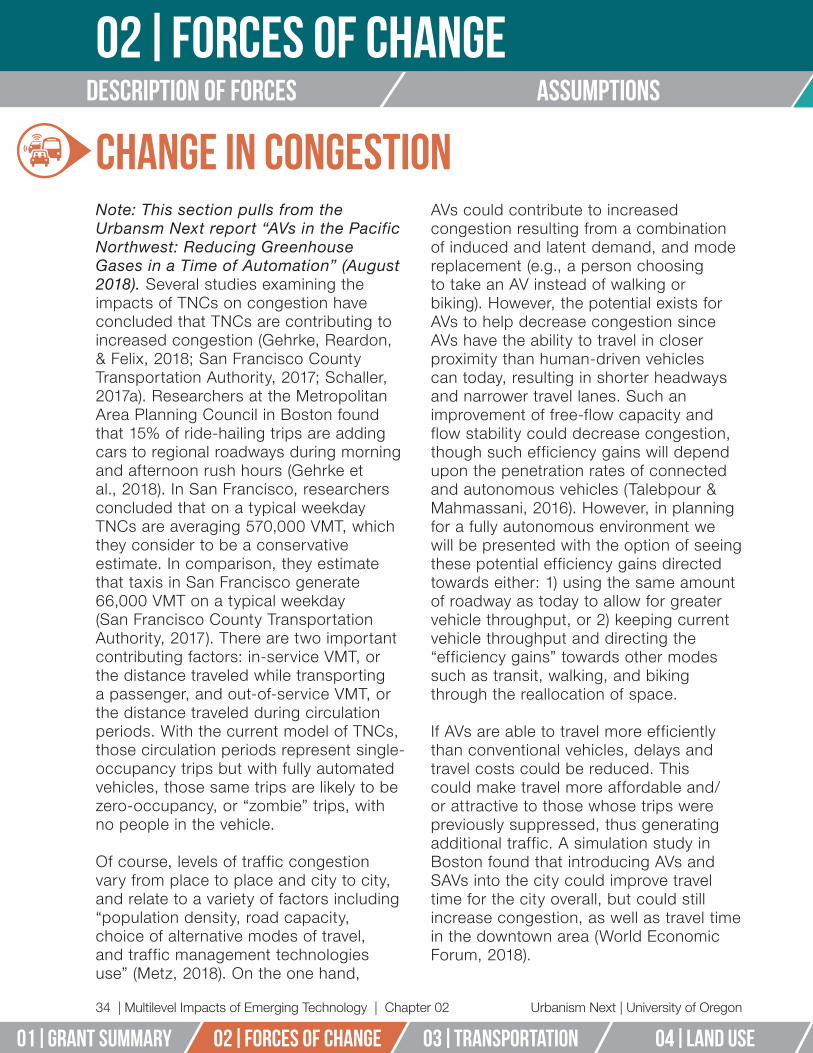
Urbanism Next | University of Oregon
02|forces of changeDescription of forces assumptions
34 | Multilevel Impacts of Emerging Technology | Chapter 02
02|forces of change 01|GRANT SUMMARY 03|TRANSPORTATION 04|LAND USE 05|URBAN DESIGN
Change in Congestion Note: This section pulls from the Urbansm Next report “AVs in the Pacific Northwest: Reducing Greenhouse Gases in a Time of Automation” (August 2018). Several studies examining the impacts of TNCs on congestion have concluded that TNCs are contributing to increased congestion (Gehrke, Reardon, & Felix, 2018; San Francisco County Transportation Authority, 2017; Schaller, 2017a). Researchers at the Metropolitan Area Planning Council in Boston found that 15% of ride-hailing trips are adding cars to regional roadways during morning and afternoon rush hours (Gehrke et al., 2018). In San Francisco, researchers concluded that on a typical weekday TNCs are averaging 570,000 VMT, which they consider to be a conservative estimate. In comparison, they estimate that taxis in San Francisco generate 66,000 VMT on a typical weekday (San Francisco County Transportation Authority, 2017). There are two important contributing factors: in-service VMT, or the distance traveled while transporting a passenger, and out-of-service VMT, or the distance traveled during circulation periods. With the current model of TNCs, those circulation periods represent single-occupancy trips but with fully automated vehicles, those same trips are likely to be zero-occupancy, or “zombie” trips, with no people in the vehicle.
Of course, levels of traffic congestion vary from place to place and city to city, and relate to a variety of factors including “population density, road capacity, choice of alternative modes of travel, and traffic management technologies use” (Metz, 2018). On the one hand,
AVs could contribute to increased congestion resulting from a combination of induced and latent demand, and mode replacement (e.g., a person choosing to take an AV instead of walking or biking). However, the potential exists for AVs to help decrease congestion since AVs have the ability to travel in closer proximity than human-driven vehicles can today, resulting in shorter headways and narrower travel lanes. Such an improvement of free-flow capacity and flow stability could decrease congestion, though such efficiency gains will depend upon the penetration rates of connected and autonomous vehicles (Talebpour & Mahmassani, 2016). However, in planning for a fully autonomous environment we will be presented with the option of seeing these potential efficiency gains directed towards either: 1) using the same amount of roadway as today to allow for greater vehicle throughput, or 2) keeping current vehicle throughput and directing the “efficiency gains” towards other modes such as transit, walking, and biking through the reallocation of space.
If AVs are able to travel more efficiently than conventional vehicles, delays and travel costs could be reduced. This could make travel more affordable and/or attractive to those whose trips were previously suppressed, thus generating additional traffic. A simulation study in Boston found that introducing AVs and SAVs into the city could improve travel time for the city overall, but could still increase congestion, as well as travel time in the downtown area (World Economic Forum, 2018).

first order impacts
Urbanism Next | University of Oregon
first order impacts Implication of the forces of change
Chapter 02 | Multilevel Impacts of Emerging Technology | 35
05|URBAN DESIGN 06|REAL ESTATE 08|CITATIONS07|CONcLUSION
Change in Ease of TravelWhile AVs are predicted to induce trips and increase congestion within central cities (Fagnant & Kockelman, 2014; 2018), studies have predicted that AVs might increase the speed of travel to and from suburban and exurban areas (International Transport Forum, 2015; Patel, Levin & Boyles, 2016) as they take advantage of the potential speed increases on low-conflict roads such as suburban arterials, highways and freeways. This would allow travelers to reach further into the periphery of cities while maintaining their current commute time.
Currently, average commute time in the United States is approximately 26 minutes each direction per day (U.S. Census Bureau, 2017). Although this number has remained fairly consistent in recent years, this might change with the usage of AVs as this new technology allows comuuters to shift our use of time from driving to a range of activities such as social media, working, eating, or sleeping. Thus, it is conceivable that individuals might accept a slightly longer commute time than they have now as travel time gains utility and is not seen as a lost part of the day (Harb, Xiao, Circella, Mokhtarian, & Walker, 2018). While there are conceivable absolute limits to the time individuals will spend on their commute, a slight increase in acceptable travel time, combined with the increased travel speeds offered by AV suburban commutes, could allow travelers to reach even further into the periphery of cities. Marchetti’s Constant, or the notion that approximately 30 minutes of travel time has remained the consistently acceptable range across modes, eras, or geographic locations (Marchetti, 1994),
could shift as commute time is liberated from needing to focus on driving.
The National Association of Realtors yearly survey of housing preferences (Dill, 2015) has consistently reported a dominant preference for larger lots, proximity to open space, and proximity to nature. If it becomes easier to reach areas further in the periphery that have these properties, individuals—without the limits imposed by our current transportation system— may preference these properties over ones closer to the center. If commute times become less important and travel speeds increase, the need for labor to be near employment, and vice versa, may be reduced. This could free up both residential and employment lands for development based on other criteria such as lower land costs, limited land use constraints, and limited neighbor opposition.
Set against this, however, are the preferences, described in Richard Florida’s book “The Rise of the Creative Class” (2002), that knowledge economy workers consistently prefer environments with a “vibrant quality of place” and “an abundance of things to do,” which typically favors denser urban areas. Recent trends point to Millennials (those born between 1981 – 1997), as a demographic that is more diverse than previous generations, less likely to be homeowners, and more interested in intergenerational housing typology, which is typically not found in outer suburbia (Choi, Zhu, Goodman, Ganesh, & Strochak, 2018; Y. Lee, Lee, & Shubho, 2019).
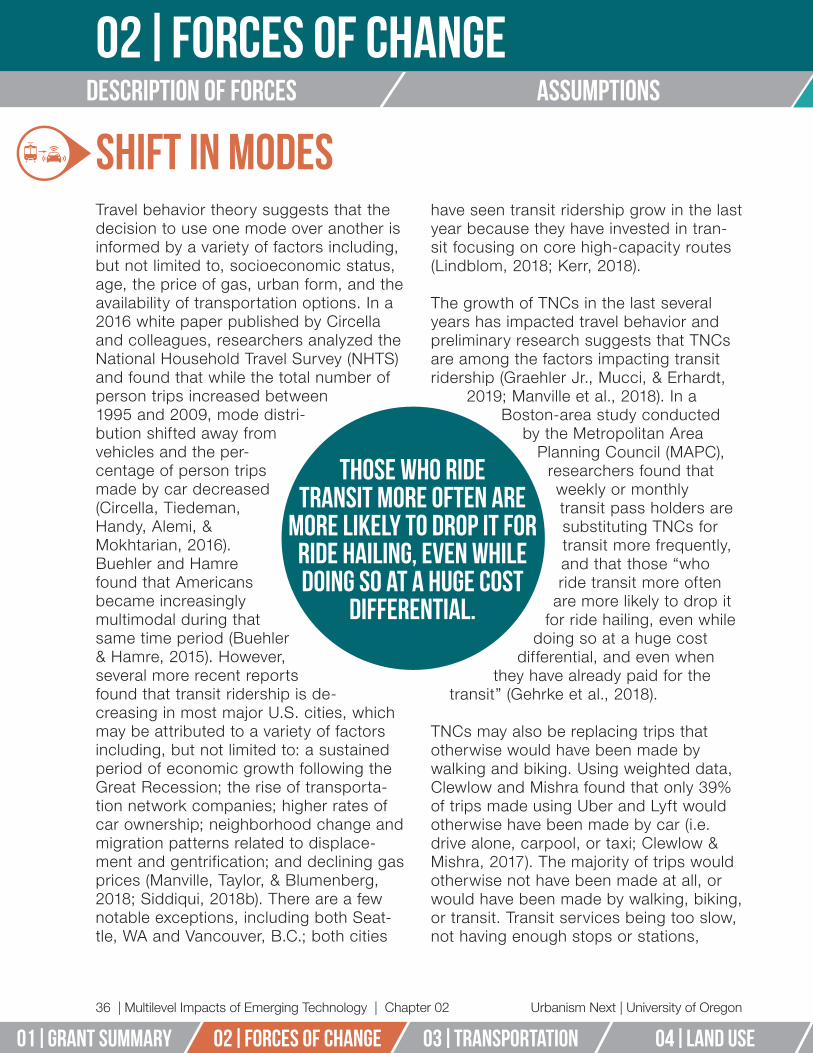
Urbanism Next | University of Oregon
02|forces of changeDescription of forces assumptions
36 | Multilevel Impacts of Emerging Technology | Chapter 02
02|forces of change 01|GRANT SUMMARY 03|TRANSPORTATION 04|LAND USE 05|URBAN DESIGN
Shift in ModesTravel behavior theory suggests that the decision to use one mode over another is informed by a variety of factors including, but not limited to, socioeconomic status, age, the price of gas, urban form, and the availability of transportation options. In a 2016 white paper published by Circella and colleagues, researchers analyzed the National Household Travel Survey (NHTS) and found that while the total number of person trips increased between 1995 and 2009, mode distri-bution shifted away from vehicles and the per-centage of person trips made by car decreased (Circella, Tiedeman, Handy, Alemi, & Mokhtarian, 2016). Buehler and Hamre found that Americans became increasingly multimodal during that same time period (Buehler & Hamre, 2015). However, several more recent reports found that transit ridership is de-creasing in most major U.S. cities, which may be attributed to a variety of factors including, but not limited to: a sustained period of economic growth following the Great Recession; the rise of transporta-tion network companies; higher rates of car ownership; neighborhood change and migration patterns related to displace-ment and gentrification; and declining gas prices (Manville, Taylor, & Blumenberg, 2018; Siddiqui, 2018b). There are a few notable exceptions, including both Seat-tle, WA and Vancouver, B.C.; both cities
have seen transit ridership grow in the last year because they have invested in tran-sit focusing on core high-capacity routes (Lindblom, 2018; Kerr, 2018).
The growth of TNCs in the last several years has impacted travel behavior and preliminary research suggests that TNCs are among the factors impacting transit ridership (Graehler Jr., Mucci, & Erhardt,
2019; Manville et al., 2018). In a Boston-area study conducted
by the Metropolitan Area Planning Council (MAPC),
researchers found that weekly or monthly transit pass holders are substituting TNCs for transit more frequently, and that those “who ride transit more often
are more likely to drop it for ride hailing, even while
doing so at a huge cost differential, and even when
they have already paid for the transit” (Gehrke et al., 2018).
TNCs may also be replacing trips that otherwise would have been made by walking and biking. Using weighted data, Clewlow and Mishra found that only 39% of trips made using Uber and Lyft would otherwise have been made by car (i.e. drive alone, carpool, or taxi; Clewlow & Mishra, 2017). The majority of trips would otherwise not have been made at all, or would have been made by walking, biking, or transit. Transit services being too slow, not having enough stops or stations,
those who ride transit more often are
more likely to drop it for ride hailing, even while doing so at a huge cost
differential.
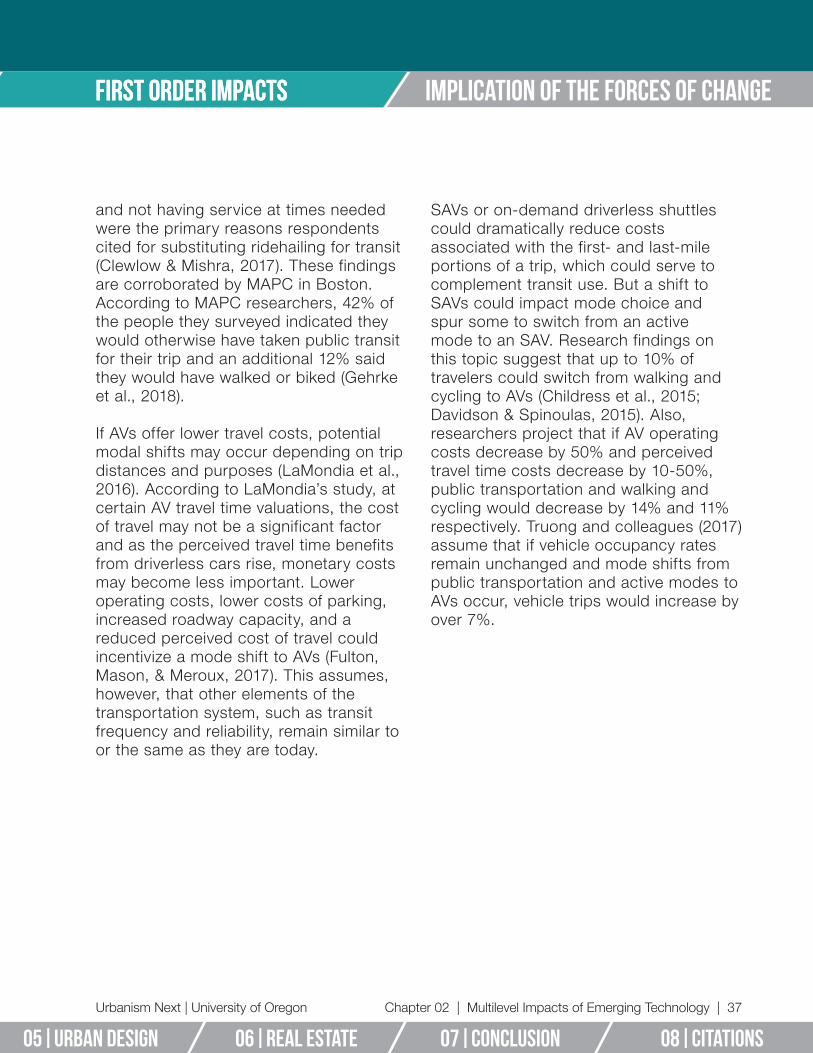
first order impacts
Urbanism Next | University of Oregon
first order impacts Implication of the forces of change
Chapter 02 | Multilevel Impacts of Emerging Technology | 37
05|URBAN DESIGN 06|REAL ESTATE 08|CITATIONS07|CONcLUSION
and not having service at times needed were the primary reasons respondents cited for substituting ridehailing for transit (Clewlow & Mishra, 2017). These findings are corroborated by MAPC in Boston. According to MAPC researchers, 42% of the people they surveyed indicated they would otherwise have taken public transit for their trip and an additional 12% said they would have walked or biked (Gehrke et al., 2018).
If AVs offer lower travel costs, potential modal shifts may occur depending on trip distances and purposes (LaMondia et al., 2016). According to LaMondia’s study, at certain AV travel time valuations, the cost of travel may not be a significant factor and as the perceived travel time benefits from driverless cars rise, monetary costs may become less important. Lower operating costs, lower costs of parking, increased roadway capacity, and a reduced perceived cost of travel could incentivize a mode shift to AVs (Fulton, Mason, & Meroux, 2017). This assumes, however, that other elements of the transportation system, such as transit frequency and reliability, remain similar to or the same as they are today.
SAVs or on-demand driverless shuttles could dramatically reduce costs associated with the first- and last-mile portions of a trip, which could serve to complement transit use. But a shift to SAVs could impact mode choice and spur some to switch from an active mode to an SAV. Research findings on this topic suggest that up to 10% of travelers could switch from walking and cycling to AVs (Childress et al., 2015; Davidson & Spinoulas, 2015). Also, researchers project that if AV operating costs decrease by 50% and perceived travel time costs decrease by 10-50%, public transportation and walking and cycling would decrease by 14% and 11% respectively. Truong and colleagues (2017) assume that if vehicle occupancy rates remain unchanged and mode shifts from public transportation and active modes to AVs occur, vehicle trips would increase by over 7%.
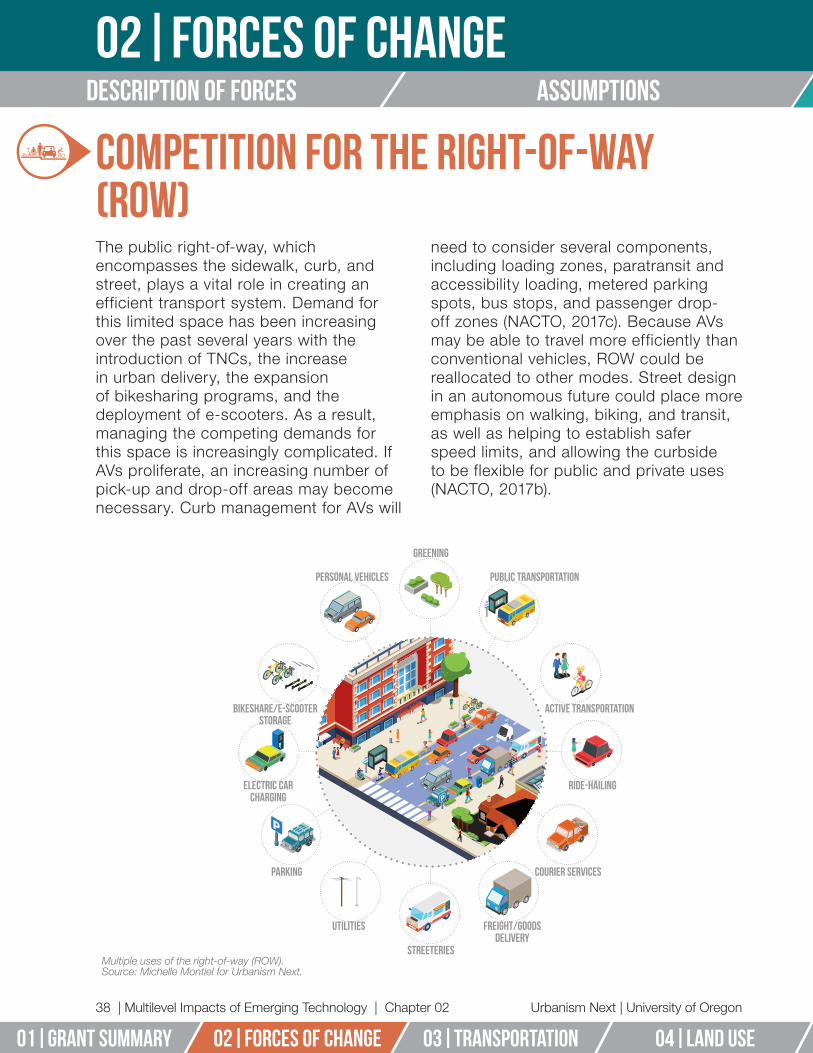
TNC
TNC
FREE
PARKING
The
High Cost of
Free Parking
DONALD SHOUP
GREENING
PUBLIC TRANSPORTATIONPERSONAL VEHICLES
ACTIVE TRANSPORTATIONBIKESHARE/E-SCOOTER STORAGE
RIDE-HAILINGELECTRIC CAR CHARGING
COURIER SERVICESPARKING
FREIGHT/GOODS DELIVERY
UTILITIES
STREETERIES
Urbanism Next | University of Oregon
02|forces of changeDescription of forces assumptions
38 | Multilevel Impacts of Emerging Technology | Chapter 02
02|forces of change 01|GRANT SUMMARY 03|TRANSPORTATION 04|LAND USE 05|URBAN DESIGN
Competition for the Right-of-Way (ROW)The public right-of-way, which encompasses the sidewalk, curb, and street, plays a vital role in creating an efficient transport system. Demand for this limited space has been increasing over the past several years with the introduction of TNCs, the increase in urban delivery, the expansion of bikesharing programs, and the deployment of e-scooters. As a result, managing the competing demands for this space is increasingly complicated. If AVs proliferate, an increasing number of pick-up and drop-off areas may become necessary. Curb management for AVs will
need to consider several components, including loading zones, paratransit and accessibility loading, metered parking spots, bus stops, and passenger drop-off zones (NACTO, 2017c). Because AVs may be able to travel more efficiently than conventional vehicles, ROW could be reallocated to other modes. Street design in an autonomous future could place more emphasis on walking, biking, and transit, as well as helping to establish safer speed limits, and allowing the curbside to be flexible for public and private uses (NACTO, 2017b).
Multiple uses of the right-of-way (ROW).Source: Michelle Montiel for Urbanism Next.

first order impacts
Source: Starship Technologies
Urbanism Next | University of Oregon
first order impacts Implication of the forces of change
Chapter 02 | Multilevel Impacts of Emerging Technology | 39
05|URBAN DESIGN 06|REAL ESTATE 08|CITATIONS07|CONcLUSION
Changes in Goods and Meal DeliveryWith the continued growth of e-commerce coupled with the advent of AV technologies, goods delivery will likely continue to increase to meet consumer demand. The automation of technology will make it easier to haul goods over long distances by road, air, and sea. In a recent survey, 49% of shoppers said that same day shipping would make them more likely to shop online; however, only 15% of global retailers offer same-day delivery (Asper, 2017). Therefore, on-demand delivery provided by AVs may help to grow current and future goods delivery. More brick-and-mortar retailers
and restaurants may choose to deliver their products via driverless methods to cut down on last-mile delivery costs. It also seems likely that the demand for restaurant delivery will continue to grow. UberEats, for example, has expanded to 280 cities in a four-year period between 2014 and 2018 (Kludt & Geneen, 2018). Some restaurants now operate as delivery-only in order to reduce the costs associated with running an eat-in establishment, or use shared commissary kitchens for food preparation for delivery-only meals.

Urbanism Next | University of Oregon
02|forces of changeDescription of forces assumptions
40 | Multilevel Impacts of Emerging Technology | Chapter 02
02|forces of change 01|GRANT SUMMARY 03|TRANSPORTATION 04|LAND USE 05|URBAN DESIGN
Shifting Nature of FreightAV technologies have the potential to profoundly impact many aspects of the freight industry and may help to tackle current issues that the industry faces, such as labor shortages and high rates of driver turnover. With new technology platforms, autonomous trucks could become integrated into the logistics chain, potentially providing players across the supply chain with more transparent information about the status of goods shipments and movements. Highly automated, driverless, or fully-automated trucks may also help increase the speed of delivery, since the need for driver rest periods would be reduced or nullified, and distribution routes could be planned differently (Flämig, 2016). Also, the ability to have autonomous trucks operate in a “platoon” with multiple vehicles
tethered electronically and overseen by one driver could significantly reduce the cost of point-to-point linehaul journeys (Gibbs, 2017). Several companies that are working on developing autonomous trucks, including Uber’s advanced Technologies Group, are relying on a “transfer hub” model. In this model, long-haul autonomous trucks stop at transfer stations in order to exchange trailers with conventional trucks, which are then operated by local drivers to their final destinations (Clevenger, 2018). Automation could improve freight efficiency and capacity, which would reduce transportation costs, and possibly, the cost of the goods themselves. Further reductions in the cost of delivery could also lead to an increase in the demand for goods delivery.
Changes in Demand for Warehousing SpacePackage and parcel volumes have continued to accelerate year-over-year with the continued growth of e-commerce (Synchrony Finance, 2016). As a result, companies are choosing to localize warehousing construction so that supply chains and logistics are moving closer to consumers in order to increase efficiency (Cerasis, 2018). The North American
Industrial Forecast Report predicts that by the end of 2019, 782 million square feet of new warehouse space will have entered the North American market (Cushman & Wakefield, 2017). Technological developments provide opportunities for businesses to make efficiency improvements, and smart warehousing solutions may become the core model.
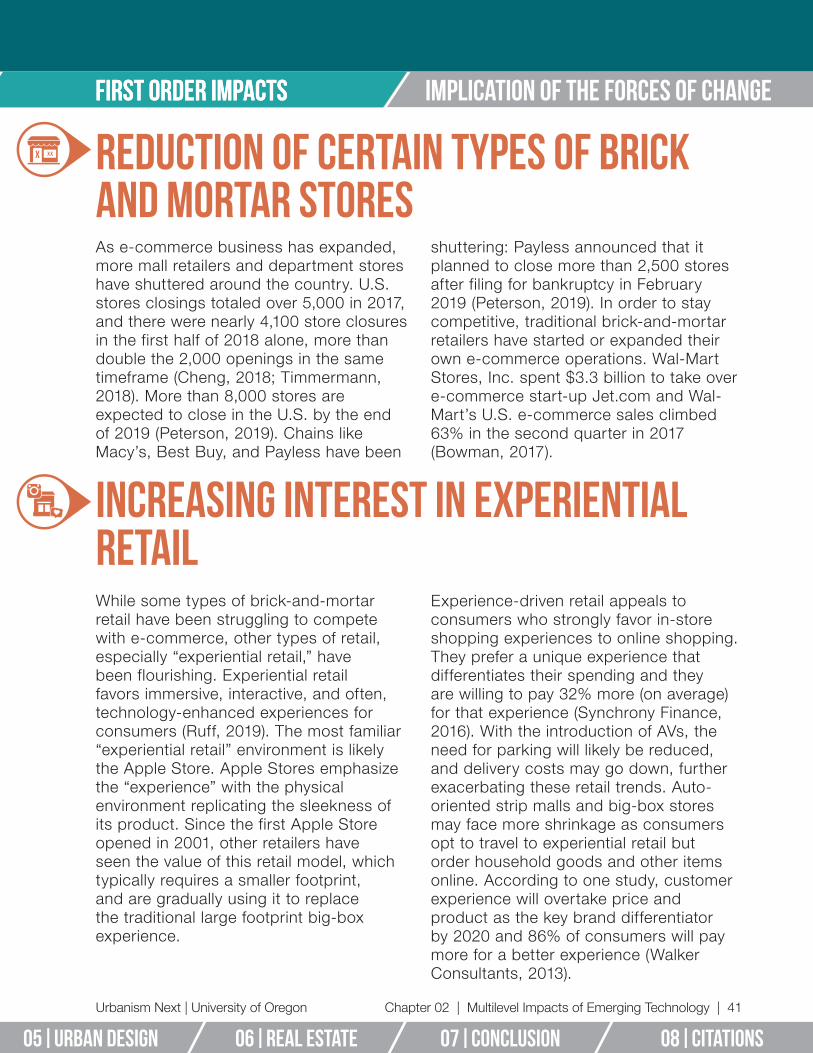
first order impacts
Urbanism Next | University of Oregon
first order impacts Implication of the forces of change
Chapter 02 | Multilevel Impacts of Emerging Technology | 41
05|URBAN DESIGN 06|REAL ESTATE 08|CITATIONS07|CONcLUSION
Reduction of Certain Types of Brick and Mortar StoresAs e-commerce business has expanded, more mall retailers and department stores have shuttered around the country. U.S. stores closings totaled over 5,000 in 2017, and there were nearly 4,100 store closures in the first half of 2018 alone, more than double the 2,000 openings in the same timeframe (Cheng, 2018; Timmermann, 2018). More than 8,000 stores are expected to close in the U.S. by the end of 2019 (Peterson, 2019). Chains like Macy’s, Best Buy, and Payless have been
shuttering: Payless announced that it planned to close more than 2,500 stores after filing for bankruptcy in February 2019 (Peterson, 2019). In order to stay competitive, traditional brick-and-mortar retailers have started or expanded their own e-commerce operations. Wal-Mart Stores, Inc. spent $3.3 billion to take over e-commerce start-up Jet.com and Wal-Mart’s U.S. e-commerce sales climbed 63% in the second quarter in 2017 (Bowman, 2017).
Increasing Interest in Experiential Retail While some types of brick-and-mortar retail have been struggling to compete with e-commerce, other types of retail, especially “experiential retail,” have been flourishing. Experiential retail favors immersive, interactive, and often, technology-enhanced experiences for consumers (Ruff, 2019). The most familiar “experiential retail” environment is likely the Apple Store. Apple Stores emphasize the “experience” with the physical environment replicating the sleekness of its product. Since the first Apple Store opened in 2001, other retailers have seen the value of this retail model, which typically requires a smaller footprint, and are gradually using it to replace the traditional large footprint big-box experience.
Experience-driven retail appeals to consumers who strongly favor in-store shopping experiences to online shopping. They prefer a unique experience that differentiates their spending and they are willing to pay 32% more (on average) for that experience (Synchrony Finance, 2016). With the introduction of AVs, the need for parking will likely be reduced, and delivery costs may go down, further exacerbating these retail trends. Auto-oriented strip malls and big-box stores may face more shrinkage as consumers opt to travel to experiential retail but order household goods and other items online. According to one study, customer experience will overtake price and product as the key brand differentiator by 2020 and 86% of consumers will pay more for a better experience (Walker Consultants, 2013).
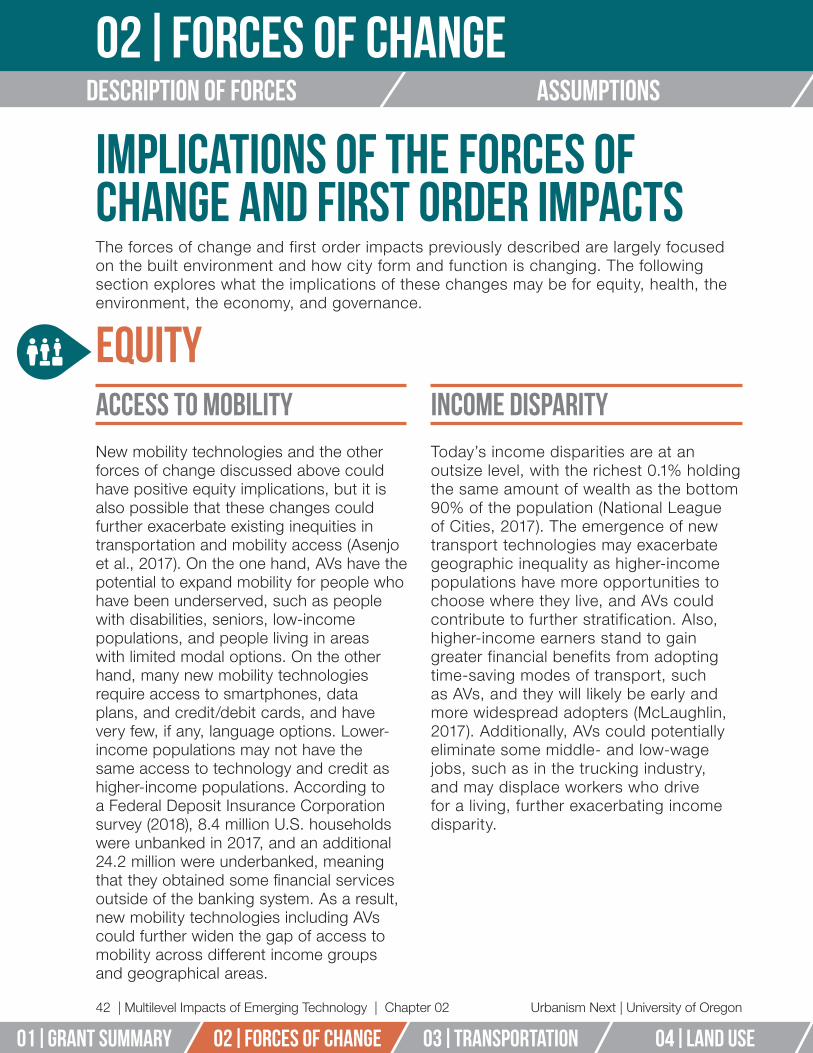
Urbanism Next | University of Oregon
02|forces of changeDescription of forces assumptions
42 | Multilevel Impacts of Emerging Technology | Chapter 02
02|forces of change 01|GRANT SUMMARY 03|TRANSPORTATION 04|LAND USE 05|URBAN DESIGN
Implications of the Forces of Change and First Order ImpactsThe forces of change and first order impacts previously described are largely focused on the built environment and how city form and function is changing. The following section explores what the implications of these changes may be for equity, health, the environment, the economy, and governance.
EquityAccess to MobilityNew mobility technologies and the other forces of change discussed above could have positive equity implications, but it is also possible that these changes could further exacerbate existing inequities in transportation and mobility access (Asenjo et al., 2017). On the one hand, AVs have the potential to expand mobility for people who have been underserved, such as people with disabilities, seniors, low-income populations, and people living in areas with limited modal options. On the other hand, many new mobility technologies require access to smartphones, data plans, and credit/debit cards, and have very few, if any, language options. Lower-income populations may not have the same access to technology and credit as higher-income populations. According to a Federal Deposit Insurance Corporation survey (2018), 8.4 million U.S. households were unbanked in 2017, and an additional 24.2 million were underbanked, meaning that they obtained some financial services outside of the banking system. As a result, new mobility technologies including AVs could further widen the gap of access to mobility across different income groups and geographical areas.
Income DisparityToday’s income disparities are at an outsize level, with the richest 0.1% holding the same amount of wealth as the bottom 90% of the population (National League of Cities, 2017). The emergence of new transport technologies may exacerbate geographic inequality as higher-income populations have more opportunities to choose where they live, and AVs could contribute to further stratification. Also, higher-income earners stand to gain greater financial benefits from adopting time-saving modes of transport, such as AVs, and they will likely be early and more widespread adopters (McLaughlin, 2017). Additionally, AVs could potentially eliminate some middle- and low-wage jobs, such as in the trucking industry, and may displace workers who drive for a living, further exacerbating income disparity.

Implication of the forces of change
Urbanism Next | University of Oregon
first order impacts Implication of the forces of change
Chapter 02 | Multilevel Impacts of Emerging Technology | 43
05|URBAN DESIGN 06|REAL ESTATE 08|CITATIONS07|CONcLUSION
Wealth Creation
Mobility is a crucial component of employment access, which is inextricably linked to wealth creation. A lack of reliable and efficient transportation options is a significant barrier to upward economic mobility (Chetty, Hendren, Kline, & Saez, 2014). New mobility technologies have the potential to improve services, efficiency, and quality of life if they are implemented equitably (National League of Cities, 2017).
Displacement
New mobility can accelerate growth in a city. However, if services are limited to certain areas, they may contribute to increasingly expensive housing in those areas as demand increases, potentially resulting in displacement of certain populations. There has been some evidence to suggest that this been the case around transit stations, with property values increasing in these areas (Buyahar, 2019). New transportation technology, along with redevelopment of space and urban design, may mainly attract—and focus on serving—higher income populations who can afford to live in the places with those services.
Workforce Impacts
The commercial deployment of AVs may have serious and far-reaching workforce impacts. One group of workers that may be displaced by AVs are truckers and for-hire drivers. The World Economic Forum estimates that the confluence of automation technology could displace approximately 5.1 million jobs across 15 major economies by 2020 (World Economic Forum, 2018). Depending on the rate of adoption, autonomous trucks and cars could directly eliminate 1.3 to 2.3 million workers’ jobs over the next 30 years in the United States (Groshen, Helper, MacDuffie, & Carson, 2018). Groshen and colleagues estimate that this could raise the annual unemployment rate by 0.1% and lower the overall labor participation rate annually. Even if technological advancements have the potential to create thousands of new jobs, many of the new roles that are created will require higher skills and education, which can be a barrier to retraining displaced employees for those positions.
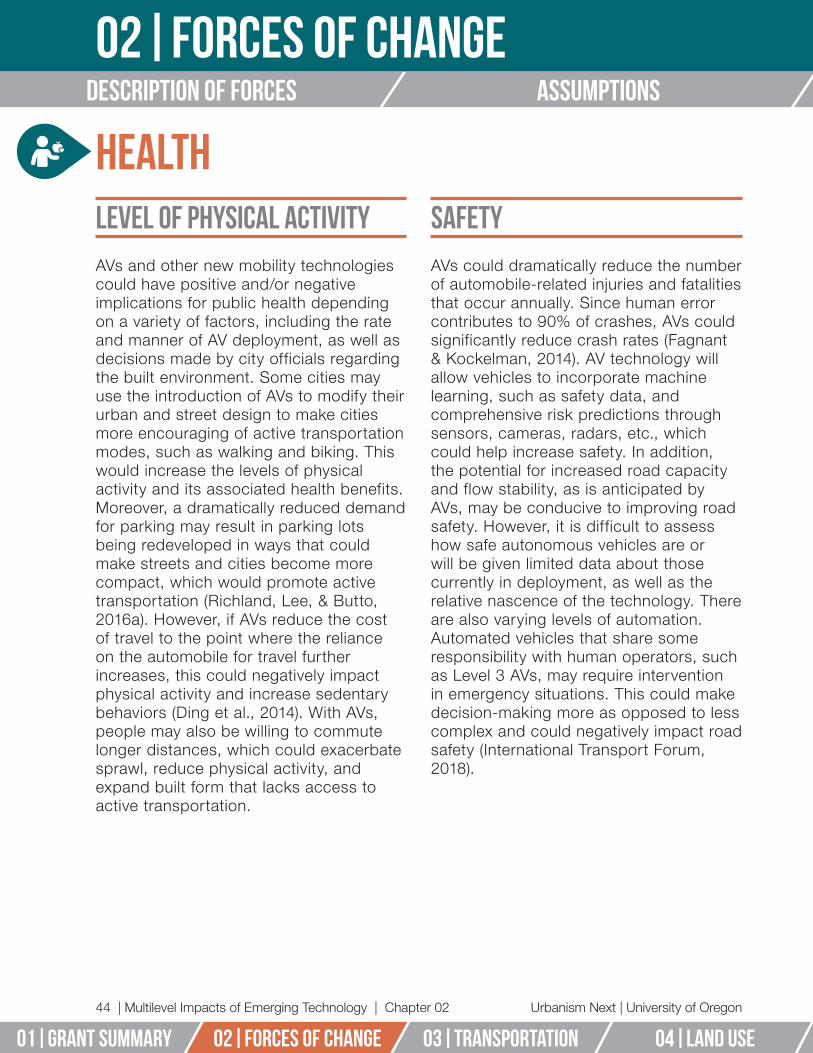
Urbanism Next | University of Oregon
02|forces of changeDescription of forces assumptions
44 | Multilevel Impacts of Emerging Technology | Chapter 02
02|forces of change 01|GRANT SUMMARY 03|TRANSPORTATION 04|LAND USE 05|URBAN DESIGN
HealthLevel of Physical ActivityAVs and other new mobility technologies could have positive and/or negative implications for public health depending on a variety of factors, including the rate and manner of AV deployment, as well as decisions made by city officials regarding the built environment. Some cities may use the introduction of AVs to modify their urban and street design to make cities more encouraging of active transportation modes, such as walking and biking. This would increase the levels of physical activity and its associated health benefits. Moreover, a dramatically reduced demand for parking may result in parking lots being redeveloped in ways that could make streets and cities become more compact, which would promote active transportation (Richland, Lee, & Butto, 2016a). However, if AVs reduce the cost of travel to the point where the reliance on the automobile for travel further increases, this could negatively impact physical activity and increase sedentary behaviors (Ding et al., 2014). With AVs, people may also be willing to commute longer distances, which could exacerbate sprawl, reduce physical activity, and expand built form that lacks access to active transportation.
Safety AVs could dramatically reduce the number of automobile-related injuries and fatalities that occur annually. Since human error contributes to 90% of crashes, AVs could significantly reduce crash rates (Fagnant & Kockelman, 2014). AV technology will allow vehicles to incorporate machine learning, such as safety data, and comprehensive risk predictions through sensors, cameras, radars, etc., which could help increase safety. In addition, the potential for increased road capacity and flow stability, as is anticipated by AVs, may be conducive to improving road safety. However, it is difficult to assess how safe autonomous vehicles are or will be given limited data about those currently in deployment, as well as the relative nascence of the technology. There are also varying levels of automation. Automated vehicles that share some responsibility with human operators, such as Level 3 AVs, may require intervention in emergency situations. This could make decision-making more as opposed to less complex and could negatively impact road safety (International Transport Forum, 2018).
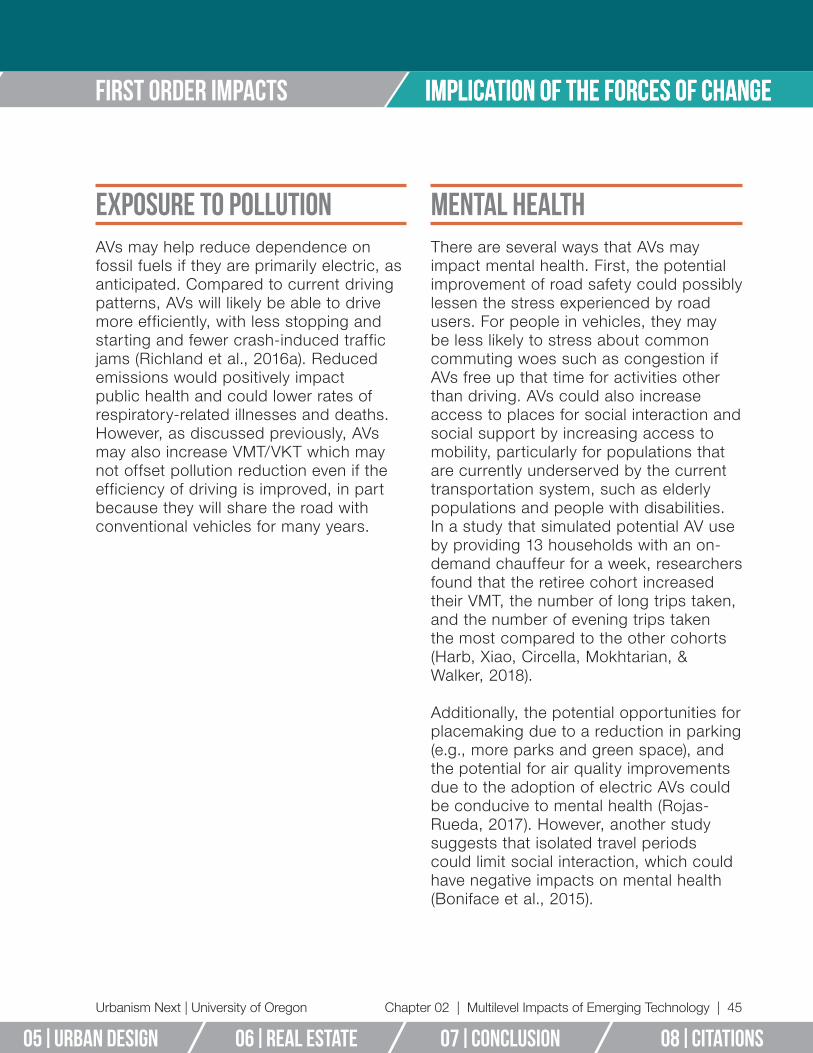
Implication of the forces of change
Urbanism Next | University of Oregon
first order impacts Implication of the forces of change
Chapter 02 | Multilevel Impacts of Emerging Technology | 45
05|URBAN DESIGN 06|REAL ESTATE 08|CITATIONS07|CONcLUSION
Exposure to PollutionAVs may help reduce dependence on fossil fuels if they are primarily electric, as anticipated. Compared to current driving patterns, AVs will likely be able to drive more efficiently, with less stopping and starting and fewer crash-induced traffic jams (Richland et al., 2016a). Reduced emissions would positively impact public health and could lower rates of respiratory-related illnesses and deaths. However, as discussed previously, AVs may also increase VMT/VKT which may not offset pollution reduction even if the efficiency of driving is improved, in part because they will share the road with conventional vehicles for many years.
Mental HealthThere are several ways that AVs may impact mental health. First, the potential improvement of road safety could possibly lessen the stress experienced by road users. For people in vehicles, they may be less likely to stress about common commuting woes such as congestion if AVs free up that time for activities other than driving. AVs could also increase access to places for social interaction and social support by increasing access to mobility, particularly for populations that are currently underserved by the current transportation system, such as elderly populations and people with disabilities. In a study that simulated potential AV use by providing 13 households with an on-demand chauffeur for a week, researchers found that the retiree cohort increased their VMT, the number of long trips taken, and the number of evening trips taken the most compared to the other cohorts (Harb, Xiao, Circella, Mokhtarian, & Walker, 2018).
Additionally, the potential opportunities for placemaking due to a reduction in parking (e.g., more parks and green space), and the potential for air quality improvements due to the adoption of electric AVs could be conducive to mental health (Rojas-Rueda, 2017). However, another study suggests that isolated travel periods could limit social interaction, which could have negative impacts on mental health (Boniface et al., 2015).
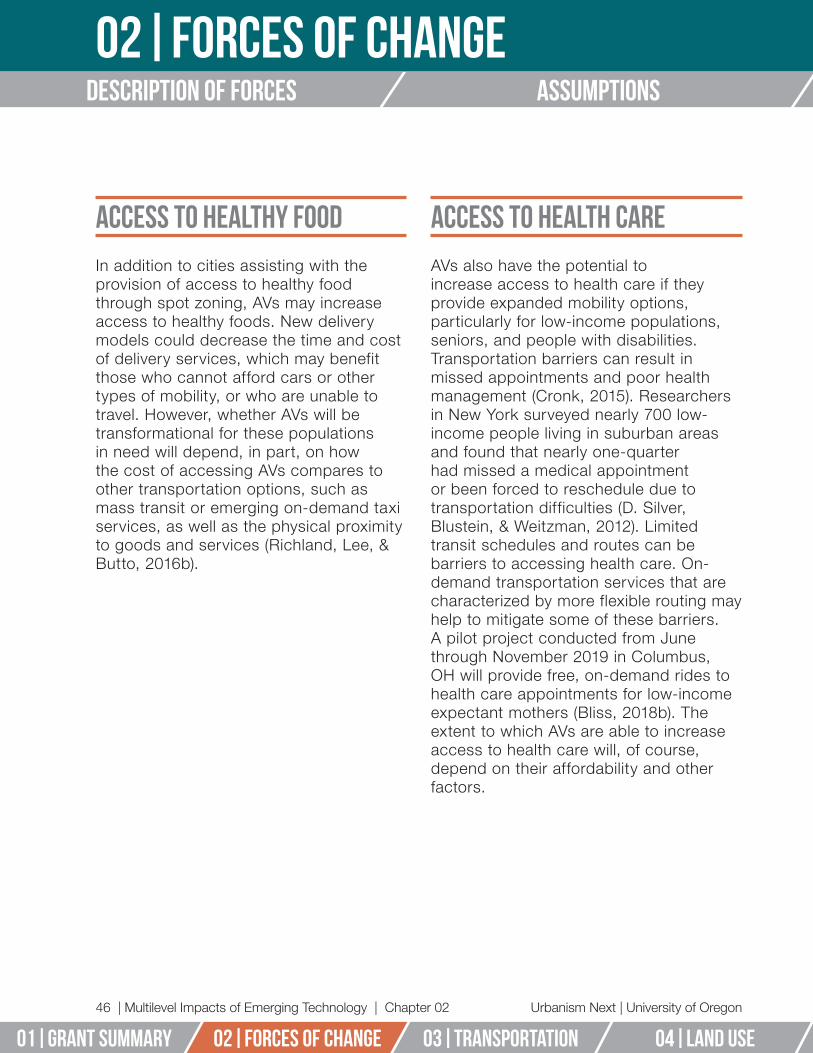
Urbanism Next | University of Oregon
02|forces of changeDescription of forces assumptions
46 | Multilevel Impacts of Emerging Technology | Chapter 02
02|forces of change 01|GRANT SUMMARY 03|TRANSPORTATION 04|LAND USE 05|URBAN DESIGN
Access to Healthy Food
In addition to cities assisting with the provision of access to healthy food through spot zoning, AVs may increase access to healthy foods. New delivery models could decrease the time and cost of delivery services, which may benefit those who cannot afford cars or other types of mobility, or who are unable to travel. However, whether AVs will be transformational for these populations in need will depend, in part, on how the cost of accessing AVs compares to other transportation options, such as mass transit or emerging on-demand taxi services, as well as the physical proximity to goods and services (Richland, Lee, & Butto, 2016b).
Access to Health Care
AVs also have the potential to increase access to health care if they provide expanded mobility options, particularly for low-income populations, seniors, and people with disabilities. Transportation barriers can result in missed appointments and poor health management (Cronk, 2015). Researchers in New York surveyed nearly 700 low-income people living in suburban areas and found that nearly one-quarter had missed a medical appointment or been forced to reschedule due to transportation difficulties (D. Silver, Blustein, & Weitzman, 2012). Limited transit schedules and routes can be barriers to accessing health care. On-demand transportation services that are characterized by more flexible routing may help to mitigate some of these barriers. A pilot project conducted from June through November 2019 in Columbus, OH will provide free, on-demand rides to health care appointments for low-income expectant mothers (Bliss, 2018b). The extent to which AVs are able to increase access to health care will, of course, depend on their affordability and other factors.

Implication of the forces of change
Urbanism Next | University of Oregon
first order impacts Implication of the forces of change
Chapter 02 | Multilevel Impacts of Emerging Technology | 47
05|URBAN DESIGN 06|REAL ESTATE 08|CITATIONS07|CONcLUSION
EconomyShift in Industries/LaborMany industries may face upheaval if they are not able to adapt to the changes that AVs will bring to the market. According to CB Insights, fast food, real estate, military operations, and even industries like home improvement (approximately 33 industries), will shift their strategies in the wake of driverless cars (CB Insights Research, 2018). The demand for insurance may decrease as the risk of car crashes drop, and insurance companies may shift business strategies, such as charging based on the number of miles are driven. Driverless technology may also further expand food delivery services and make delivery operations more efficient, which could further impact
the restaurant industry. Additionally, a reduction in parking demand could reshape the urban landscape, which will likely impact those involved in real estate. AVs will most likely be deployed as fleets rather than private vehicles, at least early on, which may have the effect of turning car dealerships into AV fleet support and service centers. Autonomous technology also requires data centers and high-speed connections to support the infrastructure of AV systems, potentially generating new jobs in information technology and data analysis.
Many industries may face upheaval if ther are not able to adapt to the changes AVs will bring to the market.

Urbanism Next | University of Oregon
02|forces of changeDescription of forces assumptions
48 | Multilevel Impacts of Emerging Technology | Chapter 02
02|forces of change 01|GRANT SUMMARY 03|TRANSPORTATION 04|LAND USE 05|URBAN DESIGN
EnvironmentGreenhouse Gas Emissions The broad deployment of AVs has the potential to reduce greenhouse gas emissions (GHG) if AVs are primarily electric, as anticipated. One study found that AVs with electric power-trains have lifetime greenhouse gas emissions that are 40% lower than vehicles powered by internal-combustion engines (Gawron et al., 2018). Replacing conventional, gasoline-powered vehicles with electric AVs will likely reduce GHGs, but the deployment of AVs will also likely happen in stages. As a result, AVs are expected to share the road with conventional vehicles for years. If the cost of traveling is lowered by AVs and VMT/VKT increases, as previously discussed, this could have the effect of increasing GHGs since there would be more vehicles on the road overall.
Particulate PollutionStudies examining the environmental benefits of electric vehicles compared to conventional vehicles have generally found that EVs offer net positive benefits (Requia, Mohamed, Higgins, Arain, & Ferguson, 2018) which could help policymakers in the objective of making road transportation more sustainable and environmental friendly. This study provides a comprehensive review of the effects of EVs adoption on air quality, greenhouse gas emissions, and human health. Specifically, we (i. However, EVs have been shown to have a greater impact on ground-level ozone (O3) than fine particulate matter (PM2.5; Schnell et al., 2019). Additionally, Schnell and colleagues found that the source of electricity for EVs exhibits greater control over PM2.5, which suggests the impacts of electric AVs on particulate pollution could be more regional and dependent on the local fuel mix.

Implication of the forces of change
Urbanism Next | University of Oregon
first order impacts Implication of the forces of change
Chapter 02 | Multilevel Impacts of Emerging Technology | 49
05|URBAN DESIGN 06|REAL ESTATE 08|CITATIONS07|CONcLUSION
Quality and Extent of Habitat
The potential positive and negative impacts of AVs on air quality and ecosystems are based on the assumptions mentioned above. AVs also have the potential to change and reshape urban areas and how people use space. More people may choose to live further from cities because the travel (monetary and time) costs may be reduced, which could further exacerbate sprawl. This may affect biodiversity and other species’ habitats without land use planning policies to protect natural/farmland areas and restrict development. However, should the potential for improvements to streets and the public realm in cities be realized this could make urban living more attractive, thus offsetting some of the potential induced sprawl.
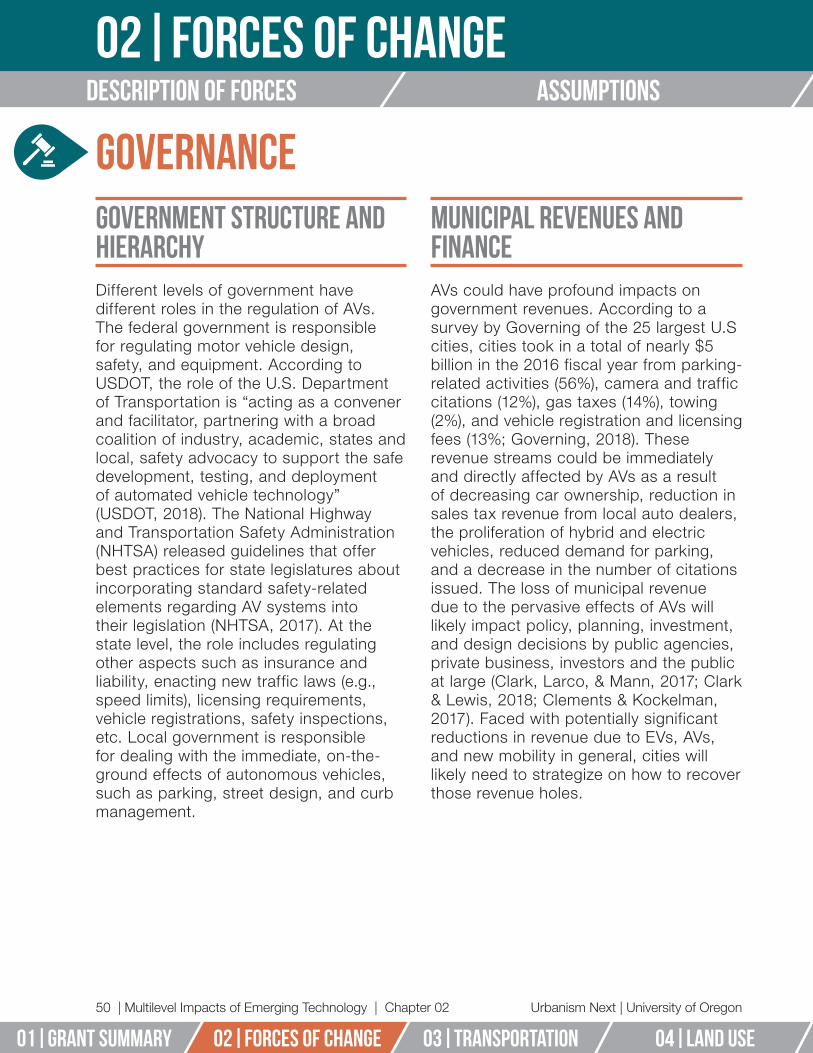
Urbanism Next | University of Oregon
02|forces of changeDescription of forces assumptions
50 | Multilevel Impacts of Emerging Technology | Chapter 02
02|forces of change 01|GRANT SUMMARY 03|TRANSPORTATION 04|LAND USE 05|URBAN DESIGN
GovernanceGovernment Structure and HierarchyDifferent levels of government have different roles in the regulation of AVs. The federal government is responsible for regulating motor vehicle design, safety, and equipment. According to USDOT, the role of the U.S. Department of Transportation is “acting as a convener and facilitator, partnering with a broad coalition of industry, academic, states and local, safety advocacy to support the safe development, testing, and deployment of automated vehicle technology” (USDOT, 2018). The National Highway and Transportation Safety Administration (NHTSA) released guidelines that offer best practices for state legislatures about incorporating standard safety-related elements regarding AV systems into their legislation (NHTSA, 2017). At the state level, the role includes regulating other aspects such as insurance and liability, enacting new traffic laws (e.g., speed limits), licensing requirements, vehicle registrations, safety inspections, etc. Local government is responsible for dealing with the immediate, on-the-ground effects of autonomous vehicles, such as parking, street design, and curb management.
Municipal Revenues and FinanceAVs could have profound impacts on government revenues. According to a survey by Governing of the 25 largest U.S cities, cities took in a total of nearly $5 billion in the 2016 fiscal year from parking-related activities (56%), camera and traffic citations (12%), gas taxes (14%), towing (2%), and vehicle registration and licensing fees (13%; Governing, 2018). These revenue streams could be immediately and directly affected by AVs as a result of decreasing car ownership, reduction in sales tax revenue from local auto dealers, the proliferation of hybrid and electric vehicles, reduced demand for parking, and a decrease in the number of citations issued. The loss of municipal revenue due to the pervasive effects of AVs will likely impact policy, planning, investment, and design decisions by public agencies, private business, investors and the public at large (Clark, Larco, & Mann, 2017; Clark & Lewis, 2018; Clements & Kockelman, 2017). Faced with potentially significant reductions in revenue due to EVs, AVs, and new mobility in general, cities will likely need to strategize on how to recover those revenue holes.
Implication of the forces of change
Urbanism Next | University of Oregon
first order impacts Implication of the forces of change
Chapter 02 | Multilevel Impacts of Emerging Technology | 51
05|URBAN DESIGN 06|REAL ESTATE 08|CITATIONS07|CONcLUSION
AVs could lead to entirely new mechanisms for collecting revenue from transportation. Governments may enact strategies to develop alternative revenue streams to offset the loss of fuel tax, such as introducing a VMT tax to replace revenue lost from gas taxes and parking (T. Lee, 2016), taxing SAVs, pricing the curb, etc. A new regulatory structure may pose different privacy and data concerns compared to the current structure. Data and information from TNCs and logistics industries can help cities adjust pricing regulations by managing the supply and demand spatially and temporally. The flip side may be that the potential for greater efficiencies of AVs could reduce current projected needs for infrastructure.

Urbanism Next | University of Oregon 52 | Multilevel Impacts of Emerging Technology | Chapter 08

Urbanism Next | University of Oregon Chapter 08 | Multilevel Impacts of Emerging Technology | 53
08 | CITATIONS
Urbanism Next | University of Oregon
02|forces of changeDescription of forces assumptions
54 | Multilevel Impacts of Emerging Technology | Chapter 08
02|forces of change 01|GRANT SUMMARY 03|TRANSPORTATION 04|LAND USE 05|URBAN DESIGN
Anair, D., & Mahmassani, A. (2012, June). Anair_2012_State of charge-EV’s global warm-ing emissions and fuel-cost savings across the US.pdf. Retrieved from https://www.ucsusa.org/clean-vehicles/electric-vehicles/emissions-and-charging-costs-electric-cars
Asenjo, I., Dively, C., Edwards, M., Ettensohn, Z., Goldstein, J., Gupte, G., … Matvey, D. (2017). Autonomous Vehicles and Transportation Equity in Pittsburgh.
Asper, D. (2017). Daniel_2017_The timely guide to on-demand delivery.pdf. Retrieved from https://www.shopify.com/guides/on-demand-delivery/same-day-delivery
Bachman, D., & Barua, A. (2016). Ring in the new: Holiday season e-commerce sales poised for strong growth. Retrieved August 24, 2018, from Deloitte Insights web-site: https://www2.deloitte.com/insights/us/en/economy/behind-the-numbers/holi-day-ecommerce-sales-growth-forecast.html
Bierstedt, J., Gooze, A., Gray, C., Peterman, J., Raykin, L., & Walters, J. (2014). Effects of next-generation vehicles on travel demand and highway capacity. 31.
Bliss, L. (2017). Self-driving cars will be for sharing. Retrieved August 8, 2018, from CityL-ab website: http://www.citylab.com/tech/2017/01/the-future-of-autonomous-vehi-cles-is-shared/512417/
Bliss, L. (2018a). The future of suburban retail looks worse than you realize. Retrieved August 9, 2018, from CityLab website: https://www.citylab.com/transporta-tion/2018/03/a-ticking-time-bomb-for-suburban-retail/554882/
Bliss, L. (2018b, December 27). An Uber for Expectant Mothers Is Coming to Columbus. Retrieved July 22, 2019, from CityLab website: https://www.citylab.com/transpor-tation/2018/12/smart-city-columbus-prenatal-ride-hailing/579082/
Bloomberg. (2018, May). Uber Plans to Test Food Delivery by Drone. Retrieved August 16, 2018, from Fortune website: http://fortune.com/2018/05/10/uber-food-delivery-drone/
Bomey, N. (2016, March 11). Ford forms “smart mobility” division. USA TODAY. Retrieved from https://www.usatoday.com/story/money/cars/2016/03/11/ford-smart-mobility-ride-sharing-self-driving-cars/81636682/
Boniface, S., Scantlebury, R., Watkins, S. J., & Mindell, J. S. (2015). Health implications of transport: Evidence of effects of transport on social interactions. Journal of Trans-port & Health, 2(3), 441–446. https://doi.org/10.1016/j.jth.2015.05.005
Implication of the forces of change
Urbanism Next | University of Oregon
first order impacts Implication of the forces of change
Chapter 08 | Multilevel Impacts of Emerging Technology | 55
05|URBAN DESIGN 06|REAL ESTATE 08|CITATIONS07|CONcLUSION
Boudette, N. (2018, May 31). Waymo to Buy Up to 62,000 Chrysler Minivans for Ride-Hailing Service—The New York Times. Retrieved from https://www.nytimes.com/2018/05/31/business/waymo-chrysler-minivans.html
Bowman, J. (2017). 1 Year Later, Wal-Mart’s Jet.com Acquisition Is an Undeniable Suc-cess. Retrieved August 9, 2018, from The Motley Fool website: https://www.fool.com/investing/2017/10/03/1-year-later-wal-marts-jetcom-acquisition-is-an-un.aspx
Brown, A. (2018). Ridehail Revolution: Ridehail Travel and Equity in Los Angeles [Disserta-tion]. University of California Los Angeles.
Buehler, R., & Hamre, A. (2015). The multimodal majority? Driving, walking, cycling, and public transportation use among American adults. Transportation, 42(6), 1081–1101. https://doi.org/10.1007/s11116-014-9556-z
Buyahar, N. (2019, May 2). L.A. homes near mass transit often sell for more, a study finds. Retrieved August 23, 2019, from Los Angeles Times website: https://www.latimes.com/business/realestate/hot-property/la-fi-hp-transit-homes-premium-price-20190502-story.html
CB Insights Research. (2018, May 24). 33 Industries Other Than Auto That Driverless Cars Could Turn Upside Down. Retrieved August 29, 2018, from CB Insights Research website: /research/13-industries-disrupted-driverless-cars/
Cerasis. (2018). The top logistics trends that will impact logistics management in 2018. Retrieved from Cerasis website: https://cerasis.com/wp-content/uploads/2018/02/The-Top-Logistics-Trends-that-Will-Impact-Logistics-Management-in-2018.pdf
Cheng, A. (2018). Brick-And-Mortar Retail Isn’t Dead: Just Look At Who’s Moving Into Empty Toys “R” Us Stores. Retrieved August 9, 2018, from Forbes website: https://www.forbes.com/sites/andriacheng/2018/07/08/brick-and-mortar-retail-is-far-from-dead-just-look-at-whos-moving-in-to-replace-toys-r-us/
Chetty, R., Hendren, N., Kline, P., & Saez, E. (2014). Where is the Land of Opportunity: The Geography of Intergenerational Mobility in the United States. Quarterly Journal of Economics, 129(4), 1553–1623.
Chiland, E. (2019, January 28). Metro tests Uber-like service to get riders to and from stations. Retrieved June 4, 2019, from Curbed LA website: https://la.curbed.com/2019/1/28/18201146/metro-via-microtransit-ride-app

Urbanism Next | University of Oregon
02|forces of changeDescription of forces assumptions
56 | Multilevel Impacts of Emerging Technology | Chapter 08
02|forces of change 01|GRANT SUMMARY 03|TRANSPORTATION 04|LAND USE 05|URBAN DESIGN
Childress, S., Nichols, B., Charlton, B., & Coe, S. (2015). Using an activity-based model to explore the potential impacts of automated vehicles. Transportation Research Record: Journal of the Transportation Research Board, (2493), 99–106.
Choi, J. H., Zhu, J., Goodman, L., Ganesh, B., & Strochak, S. (2018). Millennial Home-ownership: Why Is It So Low, and How Can We Increase It? Retrieved from Urban Institute website: https://www.urban.org/research/publication/millennial-homeown-ership/view/full_report
Circella, G., Tiedeman, K., Handy, S., Alemi, F., & Mokhtarian, P. (2016). What Affects U.S. Passenger Travel? Current Trends and Future Perspectives. National Center for Sustainable Transportation, UC Davis. Retrieved from https://escholarship.org/uc/item/2w16b8bf
Clark, B., Larco, N., & Mann, R. F. (2017). The Impacts of Autonomous Vehicles and E-Commerce on Local Government Budgeting and Finance. University of Oregon.
Clark, B., & Lewis, R. (2018). Future Transport and City Budgets: Getting Bottom-Line Savvy In An Uncertain Future. In Toward Just and Sustainable Mobilities: Driverless Cars, Transport Innovation, and the City of Tomorrow (Edited by William Riggs). Routledge.
Clements, L. M., & Kockelman, K. M. (2017). Economic Effects of Automated Vehicles. Transportation Research Record: Journal of the Transportation Research Board, 2606(1), 106–114. https://doi.org/10.3141/2606-14
Clevenger, S. (2018, June 8). How Drivers and Autonomous Trucks Could Work Together to Move Freight | Transport Topics. Transport Topics. Retrieved from https://www.ttnews.com/articles/how-drivers-and-autonomous-trucks-could-work-together-move-freight
Clewlow, R., & Mishra, G. (2017). Disruptive Transportation: The Adoption, Utilization, and Impacts of Ride-Hailing in the United States. Retrieved from https://steps.ucdavis.edu/new-research-ride-hailing-impacts-travel-behavior/
Correia, C., Milakis, D., van Arem, B., & Hoogendoorn, R. (2016). Handbook on Transport and Urban Planning in the Developed World. https://doi.org/10.4337/9781783471393
Cortright, J. (2016a). Are Millennials Racing to Buy Cars? Nope. Retrieved August 9, 2018, from Streetsblog USA website: https://usa.streetsblog.org/2016/04/25/are-millenni-als-racing-to-buy-cars-again-nope/

Implication of the forces of change
Urbanism Next | University of Oregon
first order impacts Implication of the forces of change
Chapter 08 | Multilevel Impacts of Emerging Technology | 57
05|URBAN DESIGN 06|REAL ESTATE 08|CITATIONS07|CONcLUSION
Cortright, J. (2016b, October 18). City Observatory—The price of parking. Retrieved Au-gust 6, 2018, from City Observatory website: http://cityobservatory.org/the-price-of-parking/
Cronk, I. (2015, August 9). The Transportation Barrier. The Atlantic. Retrieved from https://www.theatlantic.com/health/archive/2015/08/the-transportation-barrier/399728/
CUBIC. (2018). Mobility-as-a-Service (MaaS). Retrieved August 14, 2018, from https://www.cubic.com/innovation/insights/mobility-service-maas
Cushman&Wakefield. (2017). North American Industrial Forecast Report 2018-2019. Re-trieved August 9, 2018, from http://www.cushmanwakefield.us/en/research-and-in-sight/2017/na-industrial-forecast-report
Davidson, P., & Spinoulas, A. (2015). Autonomous vehicles: What could this mean for the future of transport. Proceedings of the Australian Institute of Traffic Planning and Management (AITPM) National Conference, Brisbane, Australia.
Dickey, M. (2018, August). Nuro and Kroger are deploying self-driving cars for grocery delivery in Arizona today. Retrieved August 16, 2018, from TechCrunch website: http://social.techcrunch.com/2018/08/16/nuro-and-kroger-are-deploying-self-driv-ing-cars-for-grocery-delivery-in-arizona-today/
Dill, J. (2015). 2015 National Community and Transportation Preference Survey. Nation-al Association of Realtors and Transportation Research and Education Center at Portland State University.
Ding, D., Gebel, K., Phongsavan, P., Bauman, A. E., & Merom, D. (2014). Driving: A Road to Unhealthy Lifestyles and Poor Health Outcomes. PLOS ONE, 9(6), e94602. https://doi.org/10.1371/journal.pone.0094602
Dutzik, T., Inglis, J., & Baxandall, P. (2014). Millennials in motion: Changing travel habits of young Americans and the implications for public policy (p. 51). Retrieved from https://uspirg.org/sites/pirg/files/reports/Millennials%20in%20Motion%20USPIRG.pdf
Ecommerce Foundation. (2017). Global E-commerce Report 2017. Retrieved August 9, 2018, from https://www.mazars.com/Home/News/Our-publications/Sur-veys-and-studies/Global-E-commerce-Report-2017

Urbanism Next | University of Oregon
02|forces of changeDescription of forces assumptions
58 | Multilevel Impacts of Emerging Technology | Chapter 08
02|forces of change 01|GRANT SUMMARY 03|TRANSPORTATION 04|LAND USE 05|URBAN DESIGN
Fagnant, D. J., & Kockelman, K. M. (2014). The travel and environmental implications of shared autonomous vehicles, using agent-based model scenarios. Transporta-tion Research Part C: Emerging Technologies, 40, 1–13. https://doi.org/10.1016/j.trc.2013.12.001
Fagnant, D. J., & Kockelman, K. M. (2018). Dynamic ride-sharing and fleet sizing for a system of shared autonomous vehicles in Austin, Texas. Transportation, 45(1), 143–158. https://doi.org/10.1007/s11116-016-9729-z
Federal Deposit Insurance Corporation. (2018). 2017 FDIC National Survey of Unbanked and Underbanked Households Executive Summary. Retrieved from Federal Depos-it Insurance Corporation website: https://www.fdic.gov/householdsurvey/
Federal Transit Administration. (2016). Shared Mobility Definitions [Text]. Retrieved from FTA website: https://www.transit.dot.gov/regulations-and-guidance/shared-mobili-ty-definitions
Fehr & Peers. (2015). Microtransit. Retrieved August 8, 2018, from Fehr & Peers website: http://www.fehrandpeers.com/microtransit/
Flämig, H. (2016). Autonomous Vehicles and Autonomous Driving in Freight Transport. In M. Maurer, J. C. Gerdes, B. Lenz, & H. Winner (Eds.), Autonomous Driving: Tech-nical, Legal and Social Aspects (pp. 365–385). https://doi.org/10.1007/978-3-662-48847-8_18
Florida, R. (2002). The Rise of the Creative Class. New York: Basic Books.
Florida, R. (2017, May 2). The New Suburban Crisis. Retrieved June 6, 2019, from CityL-ab website: https://www.citylab.com/housing/2017/05/the-new-suburban-cri-sis/521709/
Fulton, L., Mason, J., & Meroux, D. (2017). Three revolutions in transportation: How to achieve the full potential of vehicle electrification, automation and shared mobility in urban transportation systems around the world by 2050. Retrieved from Institute for Transportation & Development Policy website: https://www.itdp.org/wp-content/uploads/2017/04/UCD-ITDP-3R-Report-FINAL.pdf
Gawron, J. H., Keoleian, G. A., De Kleine, R. D., Wallington, T. J., & Kim, H. C. (2018). Life Cycle Assessment of Connected and Automated Vehicles: Sensing and Computing Subsystem and Vehicle Level Effects. Environmental Science & Technology, 52(5), 3249–3256. https://doi.org/10.1021/acs.est.7b04576

Implication of the forces of change
Urbanism Next | University of Oregon
first order impacts Implication of the forces of change
Chapter 08 | Multilevel Impacts of Emerging Technology | 59
05|URBAN DESIGN 06|REAL ESTATE 08|CITATIONS07|CONcLUSION
Gehrke, S., Reardon, T., & Felix, A. (2018). Fare Choices: A Survey of Ride-Hailing Pas-sengers in Metro Boston. Boston: Metropolitan Area Planning Council.
Gibbs, P. (2017). How autonomous vehicles will impact on the supply chain. Retrieved from Automotive Logistics website: https://automotivelogistics.media/opinion/au-tonomous-vehicles-will-impact-supply-chain
Governing. (2018). Special Report: How Autonomous Vehicles Could Constrain City Budgets. Retrieved August 13, 2018, from http://www.governing.com/gov-data/gov-how-autonomous-vehicles-could-effect-city-budgets.html
Graehler Jr., M., Mucci, R. A., & Erhardt, G. D. (2019, January 13). Understanding the Recent Transit Ridership Decline in Major U.S. Cities: Service Cuts or Emerging Modes? Presented at the 98th Annual Meeting of the Transportation Research Board, Washington, DC. Retrieved from https://uknow.uky.edu/research/under-standing-traffic-impacts-uber-lyft-greg-erhardt
Groshen, E. L., Helper, S., MacDuffie, J. P., & Carson, C. (2018). Preparing U.S. Work-ers and Employers for an Autonomous Future. Retrieved from Securing America’s Future Energy website: https://www.google.com/url?sa=t&rct=j&q=&esrc=s&-source=web&cd=1&cad=rja&uact=8&ved=2ahUKEwjb9sbK7MHjAhVLwVQKHTyYB-k8QFjAAegQIARAC&url=https%3A%2F%2Favworkforce.secureenergy.org%2F-wp-content%2Fuploads%2F2018%2F06%2FGroshen-et-al-Report-June-2018-1.pdf&usg=AOvVaw1-g4-p0dh7w3Rg-z3tkmc_
Grosse-Ophoff, A., Hausler, S., Heineke, K., & Möller, T. (2017). How shared mobility will change the automotive industry | McKinsey. Retrieved August 23, 2018, from https://www.mckinsey.com/industries/automotive-and-assembly/our-insights/how-shared-mobility-will-change-the-automotive-industry
Gucwa, M. (2014). Mobility and energy impact of automated cars. Retrieved from https://higherlogicdownload.s3.amazonaws.com/AUVSI/c2a3ac12-b178-4f9c-a654-78576a33e081/UploadedImages/documents/pdfs/7-16-14%20AVS%20presenta-tions/Michael%20Gucwa.pdf
Harb, M., Xiao, Y., Circella, G., Mokhtarian, P. L., & Walker, J. L. (2018). Projecting travel-ers into a world of self-driving vehicles: Estimating travel behavior implications via a naturalistic experiment. Transportation, 45(6), 1671–1685. https://doi.org/10.1007/s11116-018-9937-9
Urbanism Next | University of Oregon
02|forces of changeDescription of forces assumptions
60 | Multilevel Impacts of Emerging Technology | Chapter 08
02|forces of change 01|GRANT SUMMARY 03|TRANSPORTATION 04|LAND USE 05|URBAN DESIGN
Henao, A., Sperling, J., Garikapati, V., Hou, Y., & Young, S. (2018). Airport Analyses In-forming New Mobility Shifts: Opportunities to Adapt Energy-Efficient Mobility Services and Infrastructure (No. NREL/CP-5400-71036). Retrieved from National Renewable Energy Laboratory website: https://www.nrel.gov/docs/fy18osti/71036.pdf
Hsu, J. (2017). Cargo Industry Tests Seaplane Drones to Deliver Freight. Retrieved from IEEE Spectrum: Technology, Engineering, and Science News website: https://spec-trum.ieee.org/aerospace/aviation/cargo-industry-tests-seaplane-drones-to-deliver-freight
International Transport Forum. (2015). Automated and Autonomous Driving: Regulation Under Uncertainty [Text]. Retrieved from International Transport Forum website: https://www.itf-oecd.org/automated-and-autonomous-driving
International Transport Forum. (2018). Safer roads with autonomous vehicles? Retrieved from https://www.itf-oecd.org/sites/default/files/docs/safer-roads-automated-vehi-cles.pdf
International Transportation Service. (2017). ITS International—Go Denver opens up a world of seamless mobility and better data-driven decisions. Retrieved August 15, 2018, from http://www.itsinternational.com/sections/nafta/features/go-denver-opens-up-a-world-of-seamless-mobility-and-better-data-driven-decisions/
Isaac, M. (2017, December 21). Self-Driving Truck’s First Mission: A 120-Mile Beer Run. The New York Times. Retrieved from https://www.nytimes.com/2016/10/26/tech-nology/self-driving-trucks-first-mission-a-beer-run.html
Jiang, J. (2018, May 2). Millennials stand out for their technology use. Retrieved June 6, 2019, from Pew Research Center website: https://www.pewresearch.org/fact-tank/2018/05/02/millennials-stand-out-for-their-technology-use-but-older-genera-tions-also-embrace-digital-life/
Joerss, M., Schröder, J., Neuhaus, F., Klink, C., & Mann, F. (2016). Parcel delivery: The future of last mile. Retrieved from https://www.mckinsey.com/~/media/mckinsey/industries/travel%20transport%20and%20logistics/our%20insights/how%20cus-tomer%20demands%20are%20reshaping%20last%20mile%20delivery/parcel_de-livery_the_future_of_last_mile.ashx
Kludt, A., & Geneen, D. (2018, June 29). Inside the World’s Fastest-Growing Food De-livery Service. Retrieved August 27, 2018, from Eater website: https://www.eater.com/2018/6/29/17511590/uber-eats-jason-droege-eater-upsell-podcast-listen
Implication of the forces of change
Urbanism Next | University of Oregon
first order impacts Implication of the forces of change
Chapter 08 | Multilevel Impacts of Emerging Technology | 61
05|URBAN DESIGN 06|REAL ESTATE 08|CITATIONS07|CONcLUSION
KPMG. (2017). Reimagine places: Mobility as a Service (p. 32). Retrieved from https://as-sets.kpmg.com/content/dam/kpmg/uk/pdf/2017/08/reimagine_places_maas.pdf
Krawiec, R., & White, V. (2017). Governing the future of mobility. Retrieved August 30, 2018, from Deloitte Insights website: https://www2.deloitte.com/insights/us/en/fo-cus/future-of-mobility/federal-government-and-transportation-of-the-future.html
Krueger, R., Rashidi, T. H., & Rose, J. M. (2016). Preferences for shared autonomous vehicles. Transportation Research Part C: Emerging Technologies, 69, 343–355. https://doi.org/10.1016/j.trc.2016.06.015
LaMondia, J. J., Fagnant, D. J., Qu, H., Barrett, J., & Kockelman, K. (2016). Long-Distance Travel Mode Shifts Due to Automated Vehicles: A Statewide Mode-Shift Simulation Experiment and Travel Survey Analysis. Transportation Research Board 95th Annu-al Meeting, 11.
Lane, C., Zeng, H., Dhingra, C., & Carrigan, A. (2015). Carsharing: A Vehicle for Sustain-able Mobility in Emerging Market? (p. 76). Retrieved from World Resource Institute website: https://www.wri.org/sites/default/files/WRI_Report_Carsharing.pdf
Lang, N., Rüßmann, M., Chua, J., & Doubara, X. (2017). Making autonomous vehicles a reality: Lessons from Boston and beyond. Retrieved August 7, 2018, from Https://www.bcg.com website: https://www.bcg.com/en-us/publications/2017/automo-tive-making-autonomous-vehicles-a-reality.aspx
Lee, T. (2016, January 12). Self-driving cars will reduce government revenue. Retrieved August 13, 2018, from Financial Review website: https://www.afr.com/news/policy/budget/selfdriving-cars-will-reduce-government-revenue-20160111-gm36tt
Lee, Y., Lee, B., & Shubho, M. T. H. (2019). Urban revival by Millennials? Intraurban net migration patterns of young adults, 1980–2010. Journal of Regional Science, 59(3), 538–566. https://doi.org/10.1111/jors.12445
Lekach, S. (2019, March 29). Lyft investors are banking on self-driving cars, not ride-shar-ing. Retrieved June 5, 2019, from Mashable website: https://mashable.com/article/lyft-ipo-self-driving-cars-investors/
Litman, T. (2018). Implications for transport planning. 39.
Manville, M., Taylor, B. D., & Blumenberg, E. (2018). Falling Transit Ridership: California and Southern California. UCLA Institute of Transportation Studies.

Urbanism Next | University of Oregon
02|forces of changeDescription of forces assumptions
62 | Multilevel Impacts of Emerging Technology | Chapter 08
02|forces of change 01|GRANT SUMMARY 03|TRANSPORTATION 04|LAND USE 05|URBAN DESIGN
Marchetti, C. (1994). Anthropological invariants in travel behavior. Technological Forecast-ing and Social Change, 47(1), 75–88. https://doi.org/10.1016/0040-1625(94)90041-8
MaRS. (2016). Microtransit: An assessment of potential to drive greenhouse gas reduc-tion. Retrieved from https://www.marsdd.com/mars-library/microtransit-assess-ment-potential-drive-greenhouse-gas-reductions/
McLaughlin, R. (2017, November 6). How Driverless Cars Could Drive Even Deeper Eco-nomic Inequality. Retrieved August 28, 2018, from Fast Company website: https://www.fastcompany.com/40490471/how-driverless-cars-could-drive-even-deep-er-economic-inequality
Metz, D. (2018). Developing Policy for Urban Autonomous Vehicles: Impact on Conges-tion. Urban Science, 2(2), 33. https://doi.org/10.3390/urbansci2020033
Morris, D. (2018, February 24). Yes, Uber Really Is Killing The Parking Business. Fortune. Retrieved from http://fortune.com/2018/02/24/yes-uber-really-is-killing-the-parking-business/
Musulin, K. (2018, August). LA Metro to develop MaaS system for TAP smart card pro-gram. Retrieved August 15, 2018, from Smart Cities Dive website: https://www.smartcitiesdive.com/news/la-metro-to-develop-maas-system-for-tap-smart-card-program/529316/
NACTO. (2017a). Bike Share in the US: 2010-2016. Retrieved from National Association of City Transportation Officials website: https://nacto.org/bike-share-statistics-2016/
NACTO. (2017b). Blueprint for Autonomous Urbanism (p. 60). Retrieved from https://nacto.org/wp-content/uploads/2017/11/BAU_Mod1_raster-sm.pdf
NACTO. (2017c). Curb appeal curbside management. Retrieved from https://nacto.org/wp-content/uploads/2017/11/NACTO-Curb-Appeal-Curbside-Management.pdf
NACTO. (2018). Bike Share in the U.S.: 2017. Retrieved from National Association of City Transportation Officials website: https://nacto.org/bike-share-statistics-2017/
NACTO. (2019). Shared Micromobility in the U.S.: 2018. Retrieved from National Associa-tion of City Transportation Officials website: https://nacto.org/shared-micromobili-ty-2018/
National League of Cities. (2017). Future of Equity in Cities. Retrieved from http://nlc.org/sites/default/files/2017-11/Future%20of%20Equity%20in%20Cities%202017.pdf
Implication of the forces of change
Urbanism Next | University of Oregon
first order impacts Implication of the forces of change
Chapter 08 | Multilevel Impacts of Emerging Technology | 63
05|URBAN DESIGN 06|REAL ESTATE 08|CITATIONS07|CONcLUSION
Navigant Research. (2016). Electric Bicycles. Retrieved August 20, 2018, from https://www.navigantresearch.com/reports/electric-bicycles
Navy, M. (2018, January 31). Shared Mobility Comprehensive Guide 2018 by Movmi. Re-trieved August 24, 2018, from Shared Mobility website: http://www.sharedmobility.news/shared-mobility-comprehensive-guide/
NHTSA. (2017). Automated Driving Systems: A Vision for Safety. Retrieved from https://www.nhtsa.gov/press-releases/us-dot-releases-new-automated-driving-sys-tems-guidance
Nourinejad, M., Bahrami, S., & Roorda, M. J. (2018). Designing parking facilities for auton-omous vehicles. Transportation Research Part B: Methodological, 109, 110–127. https://doi.org/10.1016/j.trb.2017.12.017
Patel, R., Levin, M. W., & Boyles, S. D. (2016). Effects of Autonomous Vehicle Behavior on Arterial and Freeway Networks. Transportation Research Record, 2561(1), 9–17. https://doi.org/10.3141/2561-02
Peters, A. (2018, July 17). Here’s how much space U.S. cities waste on parking. Re-trieved June 6, 2019, from Fast Company website: https://www.fastcompany.com/90202222/heres-how-much-space-u-s-cities-waste-on-parking
Peterson, H. (2019, August 14). More than 8,000 stores are closing in 2019 as the retail apocalypse drags on—Here’s the full list. Retrieved August 23, 2019, from Busi-ness Insider website: https://www.businessinsider.com/stores-closing-in-2019-list-2019-3
Pofuk, T. (2017). Autonomous Vehicles and the Future of Private Vehicle Ownership. 13.
Reddy, N. (2018). The future of e-commerce (p. 70). Retrieved from https://www.cbin-sights.com/reports/CB-Insights_Future-of-Ecommerce.pdf
Requia, W. J., Mohamed, M., Higgins, C. D., Arain, A., & Ferguson, M. (2018). How clean are electric vehicles? Evidence-based review of the effects of electric mobility on air pollutants, greenhouse gas emissions and human health. Atmospheric Environ-ment, 185, 64–77. https://doi.org/10.1016/j.atmosenv.2018.04.040
Urbanism Next | University of Oregon
02|forces of changeDescription of forces assumptions
64 | Multilevel Impacts of Emerging Technology | Chapter 08
02|forces of change 01|GRANT SUMMARY 03|TRANSPORTATION 04|LAND USE 05|URBAN DESIGN
Research and Market. (2018). Global Mobility as a Service (MaaS) Market Report 2018: Market is expected to grow to US$ 358.35 billion by 2025 from US$ 38.76 billion in 2017. Retrieved August 8, 2018, from https://www.prnewswire.com/news-releases/global-mobility-as-a-service-maas-market-report-2018-market-is-expected-to-grow-to-us-358-35-billion-by-2025-from-us-38-76-billion-in-2017--300645453.html
Richland, J., Lee, J., & Butto, E. D. (2016a). Steering Autonomous Vehicle Policy: The Role of Public Health (p. 29). Retrieved from Altarum Institute website: https://altarum.org/sites/default/files/uploaded-related-files/Autonomous%20Vehicles%20Report_final031816.pdf
Richland, J., Lee, J., & Butto, E. D. (2016b). Steering Autonomous Vehicle Policy: The Role of Public Health. 29.
Rojas-Rueda, D. (2017). Autonomous Vehicles and Mental Health. Retrieved August 28, 2018, from Centre for Urban Design and Mental Health website: http://www.ur-bandesignmentalhealth.com/journal3-autonomous-vehicles.html
Ruff, C. (2019, February 19). What does experiential retail even mean these days? Re-trieved June 7, 2019, from Retail Dive website: https://www.retaildive.com/news/what-does-experiential-retail-even-mean-these-days/548666/
San Francisco County Transportation Authority. (2017). TNCs Today: A Profile of San Francisco Transportation Nework Company Activity. Retrieved from https://www.sfcta.org/projects/tncs-today
Schaller, B. (2017a). Empty Seats, Full Streets: Fixing Manhattan’s Traffic Problem. Re-trieved from Schaller Consulting website: schallerconsult.com/rideservices/empty-seatsfullstreets.pdf
Schaller, B. (2017b). Schaller_2017_Empty Seats Full Streets.pdf.
Schaller, B. (2018). The new automobility: Lyft, Uber and the future of American cities. Retrieved from http://www.schallerconsult.com/rideservices/automobility.htm
Schnell, J. L., Naik, V., Horowitz, L. W., Paulot, F., Ginoux, P., Zhao, M., & Horton, D. E. (2019). Air quality impacts from the electrification of light-duty passenger ve-hicles in the United States. Atmospheric Environment, 208, 95–102. https://doi.org/10.1016/j.atmosenv.2019.04.003

Implication of the forces of change
Urbanism Next | University of Oregon
first order impacts Implication of the forces of change
Chapter 08 | Multilevel Impacts of Emerging Technology | 65
05|URBAN DESIGN 06|REAL ESTATE 08|CITATIONS07|CONcLUSION
Seattle Department of Transportation. (n.d.). New Mobility Program—Transportation | seattle.gov. Retrieved July 9, 2019, from http://www.seattle.gov/transportation/proj-ects-and-programs/programs/new-mobility-program
Shaheen, S. (2018). Peer-To-Peer (P2P) Carsharing: Understanding Early Markets, Social Dynamics, and Behavioral Impacts. https://doi.org/10.7922/g2fn14bd
Shaheen, S. A., Guzman, S., & Zhang, H. (2010). Bikesharing in Europe, the Americas, and Asia: Past, Present, and Future. Transportation Research Record: Journal of the Transportation Research Board, (2143). Retrieved from https://trid.trb.org/view/911158
Shaheen, S., Chan, N., Bansal, A., & Cohen, A. (2015). Shared Mobility: Definitions, In-dustry Developments, and Early Understanding. Retrieved from The Transportation Sustainability Research Center at University of California, Berkeley website: http://innovativemobility.org/?project=shared-mobility-definitions-industry-develop-ments-and-early-understanding
Shaheen, S., Sperling, D., & Wagner, C. (1999). A Short History of Carsharing in the 90’s. The Journal of World Transport Policy & Practice, 5(3), 18–40.
Shared-Use Mobility Center. (2019). What Is Shared Mobility? Retrieved August 23, 2019, from Shared-Use Mobility Center website: https://sharedusemobilitycenter.org/what-is-shared-mobility/
Shoup, D. (2011). The High Cost of Free Parking (Revised edition). Planners Press.
Siddiqui, F. (2018a). Uber is not just for ride hailing anymore. Retrieved August 15, 2018, from Washington Post website: https://www.washingtonpost.com/local/trafficand-commuting/in-the-district-uber-is-not-just-for-ride-hailing-anymore/2018/04/11/3e1f-d9ca-3dc7-11e8-974f-aacd97698cef_story.html
Siddiqui, F. (2018b, March 24). Falling transit ridership poses an ‘emergency’ for cities, experts fear. Washington Post. Retrieved from https://www.washingtonpost.com/local/trafficandcommuting/falling-transit-ridership-poses-an-emergency-for-cit-ies-experts-fear/2018/03/20/ffb67c28-2865-11e8-874b-d517e912f125_story.html

Urbanism Next | University of Oregon
02|forces of changeDescription of forces assumptions
66 | Multilevel Impacts of Emerging Technology | Chapter 08
02|forces of change 01|GRANT SUMMARY 03|TRANSPORTATION 04|LAND USE 05|URBAN DESIGN
Siddiqui, F., & Bensinger, G. (2019, March 29). As IPO soars, can Uber and Lyft survive long enough to replace their drivers with computers? Washington Post. Retrieved from https://www.washingtonpost.com/technology/2019/03/29/even-with-ipo-bil-lions-can-uber-lyft-survive-long-enough-replace-their-drivers-with-machines/
Silver, D., Blustein, J., & Weitzman, B. C. (2012). Transportation to Clinic: Findings from a Pilot Clinic-Based Survey of Low-Income Suburbanites. Journal of Immigrant and Minority Health, 14(2), 350–355. https://doi.org/10.1007/s10903-010-9410-0
Silver, J. (2017, January 15). Twelve things you need to know about driverless cars. The Observer. Retrieved from https://www.theguardian.com/technology/2017/jan/15/driverless-cars-12-things-you-need-to-know
Smart, J. (2018, February 20). Our Amazing Aerial Future—How, When, and Why Air Taxis and Air Deliveries Will Change Our World. Retrieved August 27, 2018, from Medium website: https://medium.com/@johnsmart/our-amazing-aerial-future-how-when-and-why-air-taxis-and-air-deliveries-will-change-our-world-2fc67d6b669
Steele, J. (2018, February 22). Ace Parking says Uber, Lyft have cut parking business up to 50% in some venues. Retrieved June 6, 2019, from San Diego Union-Tribune website: https://www.sandiegouniontribune.com/business/growth-development/sd-fi-ace-parking-uber-lyft-competition-20180222-story.html
Synchrony Finance. (2016). Brick-and-mortar reborn: The future of retail in the era of urbanization. Retrieved from https://www.synchrony.com/Synchrony%20Finan-cial%20-%20Brick%20and%20Mortar%20Reborn%20-%20August%202016.pdf
Talebpour, A., & Mahmassani, H. S. (2016). Influence of connected and autonomous vehicles on traffic flow stability and throughput. Transportation Research Part C: Emerging Technologies, 71, 143–163. https://doi.org/10.1016/j.trc.2016.07.007
The Economist. (2018, March 1). Self-driving cars will require new business models. The Economist. Retrieved from https://www.economist.com/special-report/2018/03/01/self-driving-cars-will-require-new-business-models
Timmermann, M. (2018). Retail alert: More than 100 malls are losing another specialty retailer. Retrieved August 9, 2018, from Clark Howard website: https://clark.com/shopping-retail/major-retailers-closing-2018/

Implication of the forces of change
Urbanism Next | University of Oregon
first order impacts Implication of the forces of change
Chapter 08 | Multilevel Impacts of Emerging Technology | 67
05|URBAN DESIGN 06|REAL ESTATE 08|CITATIONS07|CONcLUSION
Truong, L. T., De Gruyter, C., Currie, G., & Delbosc, A. (2017). Estimating the trip genera-tion impacts of autonomous vehicles on car travel in Victoria, Australia. Transporta-tion, 44(6), 1279–1292. https://doi.org/10.1007/s11116-017-9802-2
U.S. Census Bureau. (2017). Mean Travel Time to Work of Workers 16 Years and Over Who Did Not Work at Home (Minutes) No. GCT0801. Retrieved September 24, 2019, from https://factfinder.census.gov/faces/tableservices/jsf/pages/productview.xhtml?src=bkmk
USDOT. (2018). USDOT Automated Vehicles Activities [Text]. Retrieved August 29, 2018, from US Department of Transportation website: https://www.transportation.gov/AV
Vincent, J. (2019, January 23). Amazon has made its own autonomous six-wheeled deliv-ery robot. Retrieved June 5, 2019, from The Verge website: https://www.theverge.com/2019/1/23/18194566/amazon-scout-autonomous-six-wheeled-delivery-robot
Walker, A. (2018, July 31). How to ride scooters and bikes in Los Angeles. Re-trieved November 30, 2018, from Curbed LA website: https://la.curbed.com/2018/7/31/17623336/bird-lime-scooter-bike-app-locations-cost-hours
Walker Consultants. (2013). The future of B-to-B customer experience in 2020. Retrieved from Walker Consultants website: https://www.walkerinfo.com/Portals/0/Docu-ments/Knowledge%20Center/Featured%20Reports/WALKER-Customers2020.pdf
Wang, A. (2015). The Economic Impact of Transportation Network Companies on the Taxi Industry. 39.
World Economic Forum. (2018). Reshaping Urban Mobility with Autonomous Vehicles: Lessons from the City of Boston (No. REF 140518). Retrieved from World Econom-ic Forum website: http://www3.weforum.org/docs/WEF_Reshaping_Urban_Mobili-ty_with_Autonomous_Vehicles_2018.pdf
Zaroban, S. (2018). U.S. e-commerce sales grow 16.0% in 2017. Retrieved August 9, 2018, from Digital Commerce 360 website: https://www.digitalcommerce360.com/article/us-ecommerce-sales/
Zipkin, A. (2017, December 11). Airports Are Losing Money as Ride-Hailing Services Grow—The New York Times. New York Times. Retrieved from https://www.ny-times.com/2017/12/11/business/airports-ride-hailing-services.html

Urbanism Next | University of Oregon