The Physical Principles Of Thermonuclear Explosives, Inertial ...
Upload
independentCategory
view
4download
0
Technical Report SERDP-99-1July 1999
US Army Corpsof EngineersWaterways ExperimentStation
Strategic Environmental Research and Development Program
Natural Attenuation of Explosives in Soiland Water Systems at Departmentof Defense Sites: Final Report
by Judith C. Pennington, Paul H. Miyares, David B. Ringelberg,Mansour Zakikhani, C. Michael Reynolds, Debra Felt,Richard B. Coffin, Douglas Gunnison, Luis Cifuentes,Herbert L. Fredrickson, Thomas F. Jenkins
Approved For Public Release; Distribution Is Unlimited
Prepared for Strategic Environmental Researchand Development Program

The contents of this report are not to be used for advertising,publication, or promotional purposes. Citation of trade namesdoes not constitute an official endorsement or approval of the useof such commercial products.
The findings of this report are not to be construed as anofficial Department of the Army position, unless so desig-nated by other authorized documents.
PRINTED ON RECYCLED PAPER

Strategic Environmental Researchand Development Program
Technical Report SERDP-99-1July 1999
Natural Attenuation of Explosives in Soiland Water Systems at Departmentof Defense Sites: Final Report
by Judith C. Pennington, Douglas Gunnison, Mansour Zakikhani,Herbert L. Fredrickson, David B. Ringelberg
U.S. Army Corps of EngineersWaterways Experiment Station3909 Halls Ferry RoadVicksburg, MS 39180-6199
Paul H. Miyares, C. Michael Reynolds, Thomas F. Jenkins
U.S. Army Cold Regions Research and Engineering Laboratory72 Lyme RoadHanover, NH 03755-1290
Richard B. Coffin
Naval Research Laboratory4555 Overlook Avenue, SWWashington, DC 20375
Luis Cifuentes
Department of ChemistryTexas A&M UniversityCollege Station, TX 77843
Debra Felt
AScI Corporation1365 Beverly RoadMcLean, VA 22101
Final report
Approved for public release; distribution is unlimited
Prepared for Strategic Environmental Research and Development ProgramArlington, VA 22203
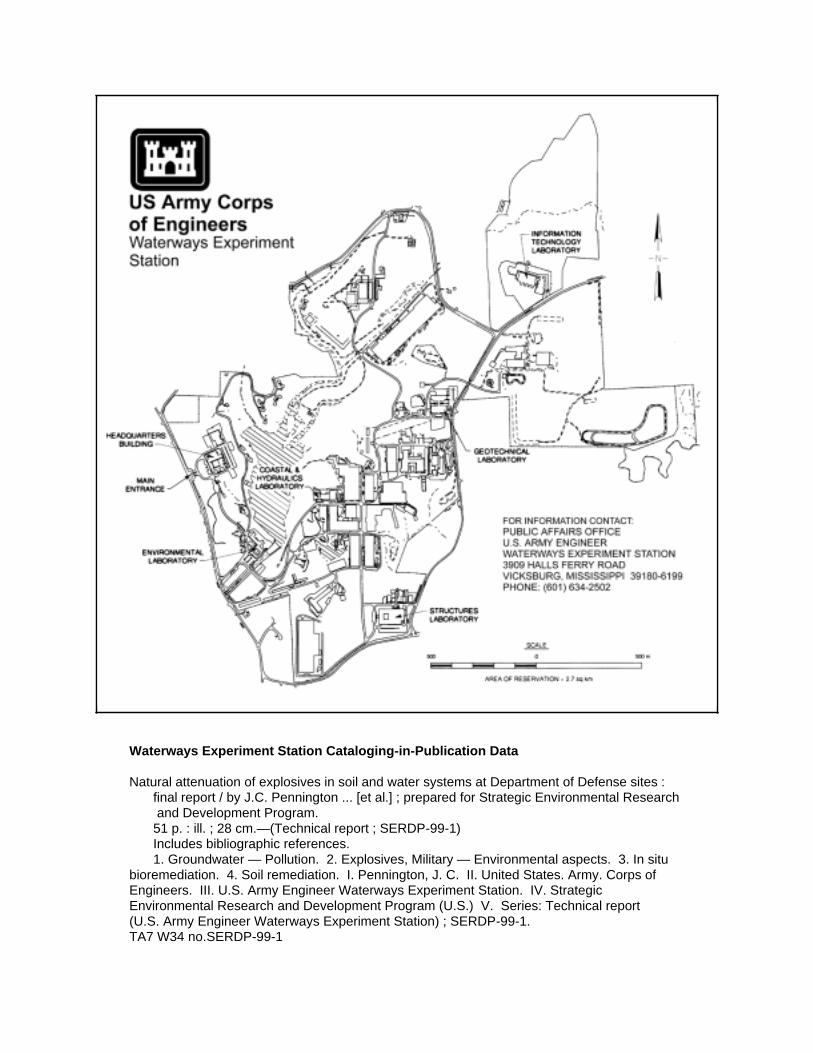
Waterways Experiment Station Cataloging-in-Publication Data
Natural attenuation of explosives in soil and water systems at Department of Defense sites :final report / by J.C. Pennington ... [et al.] ; prepared for Strategic Environmental Researchand Development Program.
51 p. : ill. ; 28 cm.—(Technical report ; SERDP-99-1)Includes bibliographic references.1. Groundwater — Pollution. 2. Explosives, Military — Environmental aspects. 3. In situ
bioremediation. 4. Soil remediation. I. Pennington, J. C. II. United States. Army. Corps ofEngineers. III. U.S. Army Engineer Waterways Experiment Station. IV. StrategicEnvironmental Research and Development Program (U.S.) V. Series: Technical report(U.S. Army Engineer Waterways Experiment Station) ; SERDP-99-1.TA7 W34 no.SERDP-99-1
iii
Contents
Preface . . . . . . . . . . . . . . . . . . . . . . . . . . . . . . . . . . . . . vi
1—Introduction . . . . . . . . . . . . . . . . . . . . . . . . . . . . . . . . . 1
Background . . . . . . . . . . . . . . . . . . . . . . . . . . . . . . . . . 1Groundwater monitoring . . . . . . . . . . . . . . . . . . . . . . . . . 1Site capacity . . . . . . . . . . . . . . . . . . . . . . . . . . . . . . . . 2Biomarkers . . . . . . . . . . . . . . . . . . . . . . . . . . . . . . . . 3Modeling . . . . . . . . . . . . . . . . . . . . . . . . . . . . . . . . . 4
Objectives of This Report . . . . . . . . . . . . . . . . . . . . . . . . . . 5
2—Use of Carbon and Nitrogen Stable Isotopes . . . . . . . . . . . . . . . . 6
Background . . . . . . . . . . . . . . . . . . . . . . . . . . . . . . . . . 6Theory . . . . . . . . . . . . . . . . . . . . . . . . . . . . . . . . . . . 6Previous uses . . . . . . . . . . . . . . . . . . . . . . . . . . . . . . . 7Rationale . . . . . . . . . . . . . . . . . . . . . . . . . . . . . . . . . 8
Objective . . . . . . . . . . . . . . . . . . . . . . . . . . . . . . . . . . 9Methods and Materials . . . . . . . . . . . . . . . . . . . . . . . . . . 10
Instrumental analyses . . . . . . . . . . . . . . . . . . . . . . . . . . 10TNT solutions . . . . . . . . . . . . . . . . . . . . . . . . . . . . . . 11Incubation study 1: Isotope ratio of TNT-amended soil over time . . . 11Incubation study 2: Unlimited contaminant source, maximum loading of soil . . . . . . . . . . . . . . . . . . . . . . . . . . . . . 12Isotope ratios across the contaminated plume at LAAP . . . . . . . . 13Isotope ratios in soils at LAAP . . . . . . . . . . . . . . . . . . . . . 14
Results and Discussion . . . . . . . . . . . . . . . . . . . . . . . . . . 14Method development . . . . . . . . . . . . . . . . . . . . . . . . . . 14Incubation study 1: Isotope ratio of TNT-amended soil over time . . . 16Incubation study 2: Unlimited contaminant source, maximum loading of soil . . . . . . . . . . . . . . . . . . . . . . . . . . . . . 17Isotope ratios across the contaminated plume at LAAP . . . . . . . . 18Isotope ratios in soils at LAAP . . . . . . . . . . . . . . . . . . . . . 19
Summary . . . . . . . . . . . . . . . . . . . . . . . . . . . . . . . . . 20Conclusions . . . . . . . . . . . . . . . . . . . . . . . . . . . . . . . . 24
iv
3—Toxicity Testing of LAAP Subsurface Soils . . . . . . . . . . . . . . . 25
Introduction . . . . . . . . . . . . . . . . . . . . . . . . . . . . . . . . 25Materials and Methods . . . . . . . . . . . . . . . . . . . . . . . . . . 25
Solid phase MicroTox assay . . . . . . . . . . . . . . . . . . . . . . 25MutaTox test . . . . . . . . . . . . . . . . . . . . . . . . . . . . . . 26Data analysis . . . . . . . . . . . . . . . . . . . . . . . . . . . . . . 26
Results and Discussion . . . . . . . . . . . . . . . . . . . . . . . . . . 27Conclusions . . . . . . . . . . . . . . . . . . . . . . . . . . . . . . . . 27
4—Integration of Biomarkers Data into the Model 3DFATMIC . . . . . . 29
Introduction . . . . . . . . . . . . . . . . . . . . . . . . . . . . . . . . 29Code Description . . . . . . . . . . . . . . . . . . . . . . . . . . . . . 31Application . . . . . . . . . . . . . . . . . . . . . . . . . . . . . . . . 32Conclusions . . . . . . . . . . . . . . . . . . . . . . . . . . . . . . . . 33
5—Conclusions . . . . . . . . . . . . . . . . . . . . . . . . . . . . . . . . 35
References . . . . . . . . . . . . . . . . . . . . . . . . . . . . . . . . . . 36
Appendix A: List of Soil Samples from Louisiana Army AmmunitionPlant Used in Stable Isotope Tests . . . . . . . . . . . . . . A1
SF 298
List of Figures
Figure 1. Transect between monitoring wells sampled for determination of N values for TNT in groundwater at LAAP . . . . . . . . 1315
Figure 2. Concentration of TNT, 2ADNT, and 4ADNT over time for the experiment using Charlton soil . . . . . . . . . . . . . . . . 17
Figure 3. Mass of TNT, 2ADNT, 4ADNT and total mass recovered over time for the experiment using LAAP soils . . . . . . . . . 18
Figure 4. Concentration of TNT in the soil and the C value for 15
extractable TNT over time for the experiment using Charlton soil . . . . . . . . . . . . . . . . . . . . . . . . . . . . 19
Figure 5. Concentration of TNT extracted from the soil and the C 13
value for extractable TNT over time for the experiment using LAAP soil . . . . . . . . . . . . . . . . . . . . . . . . . . 20
v
Figure 6. Concentration of TNT extracted from the soil and the C 13
value for extractable TNT over time for the experiment using LAAP soil . . . . . . . . . . . . . . . . . . . . . . . . . . 21
Figure 7. Concentration of N of extractable TNT over time for 15
Incubation Study 2 . . . . . . . . . . . . . . . . . . . . . . . . 22
Figure 8. Sampling locations of biomass data at LAAP . . . . . . . . . . 33
Figure 9. Sampling locations of biomass data at JAAP . . . . . . . . . . . 34
List of Tables
Table 1. Description of Transects Along Which Groundwater Samples Were Collected . . . . . . . . . . . . . . . . . . . . . . . . . . 13
Table 2. Comparison of C and N Values for TNT Subjected to13 15
Different Sample Preparation Processes . . . . . . . . . . . . . 15
Table 3. Concentration of TNT in Solution Versus C Value 13
for TNT . . . . . . . . . . . . . . . . . . . . . . . . . . . . . . 16
Table 4. Mass Recovered from Aqueous and Soil Phases Over Time in Incubation Study 2, moles ± Standard Deviation . . . . . . . 21
Table 5. Concentration and Stable Isotope Data for TNT Extracted from LAAP Groundwater Collected in April 1998 . . . . . . . . 22
Table 6. Concentration and N Values for TNT Extracted from 15
LAAP Groundwater Collected in September 1998 . . . . . . . . 23
Table 7. Statistical Comparison of N Values for TNT Extracted 15
from LAAP Groundwater Collected in September 1998 . . . . . 23
Table 8. MicroTox Results from Seven LAAP Subsurface Soils TM
and Uncontaminated Brown’s Lake Sediment . . . . . . . . . . 27
Table 9. Summary of Linear Correlations (Spearman r and Pearson Product) Between Toxicity Units (TU) and ExplosivesContamination and Microbial Biomass in LAAP Subsurface Soil . . . . . . . . . . . . . . . . . . . . . . . . . . . . . . . . 28
Table 10. Biomass Data for Selected Location at AREA P, LAAP . . . . . 30
Table 11. Sample Location of Biomass for L1 Site, JAAP . . . . . . . . . 31
vi
Preface
This report was prepared by the Environmental Laboratory (EL), U.S. ArmyEngineer Waterways Experiment Station (WES), Vicksburg, MS, a complex offive laboratories of the U.S. Army Engineer Research and Development Center(ERDC), in association with the U.S. Army Cold Regions Research and Engi-neering Laboratory (CRREL), Hanover, NH, another of the ERDC laboratories;AScI Corporation, McLean, VA; Texas A&M University (TAMU), CollegeStation, TX; and the Naval Research Laboratory (NRL), Washington, DC. Theresearch was sponsored by the Strategic Environmental Research andDevelopment Program, Arlington, VA, Dr. John Harrison, EL, and Mr. BradleyP. Smith, Arlington, VA, Executive Directors, Project Number CU1043. ThePrincipal Investigator was Dr. Judith C. Pennington, EL.
The authors of this report were as follows:
Chapter 1 Dr. Judith C. Pennington, ELChapter 2 Drs. Paul H. Miyares, C. Michael Reynolds, Thomas F.
Jenkins, CRREL, Richard B. Coffin, NRL, Luis Cifuentes,TAMU
Chapter 3 David Ringelberg, Dr. Douglas Gunnison, Dr. Herbert L.Fredrickson, EL, and Debra Felt, AScI
Chapter 4 Dr. Mansour Zakikhani, ELChapter 5 Dr. Judith C. Pennington, EL
The report was reviewed by Dr. James M. Brannon, Ecosystem Processes andEffects Branch, Environmental Processes and Effects Division (EPED), EL; andMs. Dorothy H. Tillman, Water Quality and Containment Modeling Branch,EPED. The study was conducted under the direct supervision of Dr. Richard E.Price, Chief, EPED, EL, and Dr. John Harrison (retired), Director, EL.
Commander of ERDC during preparation and publication of this report wasCOL Robin R. Cababa, EN. This report was prepared and published at the WEScomplex of ERDC.
vii
This report should be cited as follows:
Pennington, J. C., Miyares, P. H., Ringelberg, D. B., Zakikhani, M.,Reynolds, C. M., Felt, D., Coffin, R. B., Gunnison, D., Cifuentes, L.,Fredrickson, H. L., Jenkins, T. F. (1999). “Natural attenuation ofexplosives in soil and water systems at Department of Defense sites:Final report,” Technical Report SERDP-99-1, U. S. Army EngineerWaterways Experiment Station, Vicksburg, MS.
The contents of this report are not to be used for advertising, publication, orpromotional purposes. Citation of trade names does not constitute anofficial endorsement or approval of the use of such commercial products.

Chapter 1 Introduction 1
1 Introduction
Background
The regulatory community and the general public are becoming increasinglyaware that solutions to environmental contamination are not as simple asimposing stringent regulations. Environmental remediation technology isevolving toward more practical goals incorporating less expensive, less intrusive,long-term solutions. Natural attenuation may be a legitimate and sensiblealternative to existing remediation techniques if appropriate implementationguidance is developed. Research in support of development of guidance forselection and implementation of natural attenuation for the explosives 2,4,6-trinitrotoluene (TNT) and hexahydro-1,3,5-trinitro-1,3,5-triazine (RDX) wassponsored by the Strategic Environmental Research and Development (SERDP),Environmental Security Technology Certification Program (ESTCP), andU.S. Army Industrial Operations Command. The research focused on thefollowing areas: (a) groundwater monitoring, (b) site capacity estimationparameters, (c) biomarkers, (d) stable isotopes, and (e) modeling. Severalreports are available describing results of those efforts (Pennington, Zakikhani,and Harrelson 1999; Pennington et al. 1998a, 1999a, b, c). The SERDP portionof the research focused specifically on the development of biomarkers, stableisotopes, and modeling of attenuation processes. An interim report describingresults of the project through Fiscal Year 1998 (FY 98) included results in all ofthese research areas except stable isotopes (Pennington et al. 1999b). Theapproach and results for each area presented in the interim report aresummarized in the following paragraphs.
Groundwater monitoring
Declining concentrations of explosives in groundwater over time may beevident from site historical data. If adequate, these historical records provide thefirst line of evidence under the U.S. Environmental Protection Agency (EPA)(1999) policy directive, “Historical groundwater and/or soil chemistry data thatdemonstrate ... declining contaminant mass and/or concentrations....” The firsttask was to evaluate the extensive historical data at Louisiana Army AmmunitionPlant (LAAP), Doyline, LA, for trends in explosives concentration. Since long-term monitoring is required to verify any observed trends, development of a

2Chapter 1 Introduction
monitoring plan was the next task. To optimize the validity of trends, attentionwas focused on the quality of the data generated by the groundwater monitoringplan. Special emphasis was placed on development of techniques for assuringquality data. Efforts included techniques for minimizing the influence of oxygenat the wellhead on sampling formation water; maintaining sample integrity;sample preservation; precision, accuracy, and representativeness of the data; datacomparability; field quality control; and confirmation of analytical chemistry. For monitoring data to support the second line of evidence, “hydrogeologic orgeochemical data that can be used to indirectly demonstrate the type(s) [and rate]of natural attenuation processes active at the site...,” collection of data that wasnot collected during previous monitoring was required. Therefore, an extensivelist of explosives transformation products and geochemical parameters wasincluded in the analyses. The monitoring plan developed for the demonstrationsite, LAAP, was validated at a second site, Joliet Army Ammunition Plant(JAAP), Joliet, IL.
Declining concentrations of explosives over the 2-year monitoring periodwere documented at LAAP. Results support the first line of evidence requiredunder EPA guidance for verification of monitored natural attenuation, i.e.,declining contaminant mass. Methods were developed to optimize accuracy andminimize variability between sampling events, so that trends in concentrationover time were readily demonstrated and reliable. None of the geochemicalcharacteristics of the site correlated with explosives concentrations. Therefore,monitoring geochemical parameters provided no evidence of natural attenuationprocesses at LAAP. Sampling methods developed at LAAP were verified byapplication at JAAP. Although the sampling period at JAAP was limited to9 months, about 20 percent of the wells exhibiting concentrations of explosivesabove detection limits showed significant declines. Geochemical parameterswere unrelated to explosives concentrations as observed at LAAP.
Site capacity
Site capacity for attenuation of explosives is a function of soil sorption,biodegradation, transformation, and chemical interactions with soil organicmatter and clay. Not all of these processes are well-defined for explosives. Nonetheless, site capacity can be measured by simple batch shake and columntests, which quantify contaminant half-life and adsorption coefficients. Thesecapacity measurements can be used to refine predictive capabilities of numericalmodels for the site. Both batch shake and column tests were performed on soilsfrom the LAAP aquifer to quantify sorption coefficients and disappearance ratesfor explosives. These data can support the second line of evidence by providingattenuation rate measurements.
Batch shake test results were demonstrated to adequately describe sorptionand disappearance rate constants in the LAAP soils. Sorption of explosivescompounds by the aquifer soils was limited, with all constituents showingpartitioning coefficient K values below 1 L kg for all soils. These resultsD
-1
indicated that a single average sorption coefficient for each compound in the
Chapter 1 Introduction 3
LAAP soils adequately described sorption for numerical modeling. Disappear-ance rate constants were low in comparison with those typically observed insurface soils. Use of the disappearance rate coefficients in modeling was com-plicated by the proximity of the coefficients to zero and the uncertainty that thiscreated about applying results from short-term bench scale testing to field scale. Use of the disappearance rate coefficients in groundwater models may requireadjustment to accurately depict measured groundwater concentrations that reflectfield conditions and a longer time frame than is possible with bench scale batchand column studies. These results suggest that mass transport limitations ratherthan site capacity restrict transport at LAAP.
Biomarkers
Biomarker techniques have been used to detect the involvement ofmicroorganisms as biocatalysts for the transformation and/or degradation ofcontaminants. The techniques have been used extensively to measure changes inmicrobial community structure and microbial response to contaminants evenafter the contaminant is no longer detectable (e.g., the plume has migratedbeyond the microbial community, or the contaminant concentration has beenreduced to levels below detection). Radiorespirometry provides direct evidencethat transformation and/or complete mineralization can occur in site soils bychallenging the indigenous microflora with radiolabelled TNT and/or RDX. Mineralization is evidenced by evolution of radiolabelled carbon dioxide. Analyses of bacterial polar lipids provide information on microbial communitybiomass and composition and the changes resulting from anthropogenic chemicalperturbations. Analysis of nucleic acids provides a mechanism to detect thepresence of genes encoding enzymes required for explosive degradation in situ. The radioassay results can be correlated with results from the two biomarkersand site geochemical data to build a case for natural attenuation onsite. Biomarkers demonstrate whether (a) a viable biomass is present, active, andcapable of metabolizing RDX and TNT, (b) catabolic genes necessary for in situdegradation are present, and (c) significant positive correlations to explosiveconcentrations, geochemistry, and mineralization properties exist. The third lineof evidence “Data from field or microcosm studies ... which directly demonstratethe occurrence of a particular natural attenuation process ... to degrade thecontaminants of concern...” generally requires laboratory testing of field samples(groundwater and/or aquifer material). Therefore, samples of aquifer soilscollected by cone penetrometry were subjected to biomarker analyses inlaboratory microcosms. Soils from LAAP were used for development andrefinement of techniques while soils from JAAP were used to validateprocedures. The two biomarker techniques, phospholipid fatty acids (PLFA)analysis and microbial DNA analysis, were coupled with radiorespirometry inmicrocosm studies.
Integration of results from radiorespirometry, nucleic acid, and lipidbiomarker techniques was used to evaluate the ability of indigenousmicroorganisms to degrade explosives. For the two sites, LAAP and JAAP, lipidbiomarker technologies provided estimates of viable cell abundance. Identifying

4Chapter 1 Introduction
the amount and nature of the in situ viable microflora in relation to nitroaromaticcontamination established a direct link between the rates of contaminantmineralization observed in the radiorespirometry flasks and the indigenousmicrobial populations. The nucleic acid biomarkers provided the necessaryevidence of a genetic capability for natural attenuation at each site. Biomarkersat both sites provided positive evidence that microbial transformation/mineralization processes play a substantial role in explosives attenuation at thesesites. Rates of TNT and RDX mineralization were very low in LAAP soils, andfew significant correlations with geochemical parameters and biomarkers werefound. At JAAP mineralization rates were considerably higher, possibly becauseof higher organic matter content in the soils to support the cometabolicdegradation. Furthermore, several nucleic acid probes correlated positively withmineralization rate at JAAP as did the following parameters determined by lipidbiomarkers: biomass; abundance of gram-negative, sulfate-reducing, and iron-reducing bacteria; and a sulfite reductase. Aerobic degradation of TNT in LAAPsoils was indicated by the presence of two catechol oxygenase gene probes. Therefore, the microbial population contained genes for explosives mineraliza-tion. At JAAP presence of a gene for a denitrification enzyme suggested themechanism for microbial reduction of TNT. Other observed genes supportedpotential for both anaerobic and aerobic metabolism of the TNT ring. Biomarkertechniques provided an effective tool for demonstrating microbial destructionpotential in field samples. The rate and extent of degradation and transformationwere also estimated. The effectiveness of microbially mediated natural attenua-tion depends upon site characteristics, the composition and abundance of theviable biomass, and the genetic capabilities of the site microflora. Biomarkerswere effective in measuring each of these at LAAP and JAAP.
Modeling
Modeling is essential for (a) conceptualization of the contamination at the siteso that proximity to receptors can best be determined, (b) evaluation of factorsdominating natural attenuation processes at the site, and (c) prediction of long-term contaminant migration and transformation. A numerical model was appliedto the LAAP site using results from the other focus areas, i.e., groundwatermonitoring, site capacity determinations, and biomarkers, in addition to localweather data and other published information. A comprehensive computergraphical and integral modeling system, the Department of Defense GroundwaterModeling System (GMS) (Brigham Young University 1996), was used. Themodel contains tools to facilitate site characterization, conceptualization, geo-statistical computations, and postprocessing. The model links transport andwater quality models to predict the fate and transport of contaminants. Sensi-tivity of the model simulations and predictions to input parameters was coupledwith the desired level of accuracy to determine the level of detail required forfield and laboratory measurements. Contaminant mass was also calculated usingthe measured and predicted explosives concentrations from the model.
The GMS provided efficient numerical tools to integrate and analyze thecomplex, multidisciplinary field data into simpler graphic forms that were used

Chapter 1 Introduction 5
to illustrate fate and transport of the contaminant plumes. The measured andsimulated flow data indicated slow subsurface flow at the LAAP site due to thelow-permeability media and low hydraulic gradients. The TNT and RDXplumes were virtually static. The simulated flow directions were consistent withthe direction of explosives plume propagation. The simulated results indicatedthat explosives at LAAP may be reduced naturally without posing any threat tooffsite receptors. The trigger factors for natural attenuation of explosives at thesite including low degree of sorption, low values of the hydraulic conductivity,and low rate of mineralization were evaluated and illustrated. Even though thereduction process is very slow, the plume is confined to a limited area and is notmoving significantly. The results of contaminant mass calculations indicatedthat the initial mass of TNT and RDX was reduced from 47,173 and 70,760 to907 and 726 kg (52 and 78 to 1 and 0.8 tons), respectively, during 20 years ofsimulation. The sensitivity analysis suggested that the important model inputparameters are the adsorption coefficient rates and the biodecay rates. Thepredicted results should be adjusted and the calibration processes repeated asnew data become available. Significant reductions in mass were also predictedat JAAP, but limited migration of the plume was also predicted.
Objectives of This Report
Three research areas, stable isotopes, biomarkers, and modeling, continued inFY 99 and are the subject of this report. Chapter 2, “Use of Carbon andNitrogen Stable Isotopes,” describes the evaluation of the feasibility of usingstable isotope ratios for carbon and nitrogen in either soil or groundwater tomonitor natural attenuation of explosives. Chapter 3, “Toxicity Testing ofLAAP Subsurface Soils,” describes results for a single biomarker milestonecompleted in FY 99. The objective was to determine whether TNT toxicityaccounted for the negative correlation between TNT concentration and overallmicrobial biomass observed in LAAP aquifer soils. Chapter 4, “Integration ofBiomarkers Data into the Model 3DFATMIC,” addresses a single modelingmilestone completed in FY 99. The objective was to numerically simulate andpredict the effects of microbial biomass on groundwater hydrology and fate andtransport of TNT and RDX at LAAP and JAAP. Chapter 5, “Conclusions,”summarizes results presented in this report.
6Chapter 2 Use of Carbon and Nitrogen Stable Isotopes
2 Use of Carbon andNitrogen Stable Isotopes
Background
Theory
Carbon is composed primarily of two natural isotopes: C, which accounts12
for 98.98 percent of all carbon, and C, which accounts for approximately13
1.11 percent (Craig 1957; Faure 1986; Hoefs 1987). The relative abundance ofC is expressed as C values, which represent the C to C ratio relative to a13 13 13 12
standard ratio from the PeeDee Belemnite (PDB) Formation, Upper Cretaceous,South Carolina. Nitrogen is also composed of two isotopes, 99.4 percent N and14
0.6 percent N (Watson 1985). The relative abundance of N in a sample is15 15
determined relative to that of atmospheric nitrogen.
Isotope ratios are reported as a difference, rather than absolute concentra-tions, because differences are more descriptive of isotope behavior and can bemeasured more precisely (Friedman and O’Neil 1977; Lajtha and Michener1994). These difference values, or “del,” are calculated using Equation 1 andare expressed in parts per thousand, often referred to as “per mil” and generallydenoted as ‰. Compounds that are depleted of the heavy isotope relative to thestandard have negative values; compounds that are enriched in the heavyisotope have positive values.
= [(R/ R ) - 1)] × 1000 (1) s
where
R = absolute isotope ratio in the sample
R = absolute isotope ratio in the standards

Chapter 2 Use of Carbon and Nitrogen Stable Isotopes 7
Previous uses
Stable isotope analysis has been used to address a broad range of topics incarbon, nitrogen, oxygen, hydrogen, sulfur, and chlorine cycling. The naturaldifferentiation in stable isotope values, such as C and N levels, can be used13 15
as tracers for following the long-term dynamics of natural systems (Balesdentand Marlotti 1987; Balesdent and Wagner 1988). In the petroleum industry,petroleum compounds have been linked to the source rock formation from whichthey migrated by relating the C values of specific petroleum fractions with13
those in the kerogen (organic) fraction of the source rock (Stahl 1986). In soilscience, soil organic matter turnover rates have been estimated by comparingchanges in C values for different soil organic fractions (Boutton, Harrison,13
and Smith 1980; O’Brien and Stout 1978), and for determining sources of CO2
evolved from soil (Reardon, Allison, and Fritz 1979). Stable isotope ratios havealso been used to estimate long-term changes in plants and soils (Freeman andHayes 1992).
Stable isotope analysis has also been employed to trace short-term cycling oforganic matter through food chains in ecosystems (Peterson, Howarth, andGarritt 1985; Peterson and Fry 1987). The application of stable isotope analysisof food chains has been developed to study microbial roles in elemental cycling(Blair et al. 1985; Coffin 1989; Coffin et al. 1990; Coffin, Cifuentes, andElderidge 1994). This approach has been applied to delineate carbon sources thatsupport food chains in complex aquatic ecosystems (Coffin 1989; Coffin et al.1990; Coffin, Cifuentes, and Elderidge 1994; Cifuentes et al. 1996a) and toanalyze nitrogen cycling through food chains (Peterson and Fry 1987; Hoch,Fogel, and Kirchman 1992; Hoch et al. 1996). As a result of limits in technologyfor application of stable isotope analysis, preliminary studies have focused onthe major component of elemental cycles in complex pools with numeroussources. Recently, with the development of gas chromatographs/isotope ratiomass spectrometry (GC/IRMS), research has moved to study cycling of specificcompounds in ecosystems (O’Malley, Abrajano, and Hellou 1994; Trust et al.in preparation) and of individual compounds as biomarkers to determinemicrobial roles in biogeochemical cycles (Pelz et al., in preparation). Combiningthe stable isotope ratio measurement with the high resolution of capillary GC hasresulted in a technique that allows measurement of the isotope ratios forindividual compounds within a mixture.
Developments in stable isotope analysis are being employed to evaluateremedial efforts in environments that are contaminated with petroleumhydrocarbons. This technology provides the capability to identify sources ofcontaminants in ecosystems (O’Malley, Abrajano, and Hellou 1994; Kelley,Trust, and Coffin, in preparation). In situ degradation of organic contaminants isstudied using C analysis of CO evolving from soil (Cifuentes et al. 1996b;13
2
Van de Velde et al. 1995). Finally, specific biomarkers have been used toevaluate the bacterial assimilation of contaminants (Pelz et al., in preparation).The combination of these recent developments provides the ability to determinesources and fates of contaminants in an ecosystem.
8Chapter 2 Use of Carbon and Nitrogen Stable Isotopes
The feasibility of using a similar technique to estimate TNT attenuation ratesin subsurface soils was explored. Since TNT was manufactured from petroleum-based compounds, the carbon ring in TNT should retain the depleted C values13
similar to those that are measured in petroleum compounds. A primary fate ofTNT in many environments appears to be bonding to or incorporation with thesoil organic fraction rather than mineralization (Pennington et al. 1995, 1997,1998b); therefore, significant evolution of CO derived from TNT is not13
2
expected.
Rationale
TNT in a contaminated area undergoes two major processes, reaction with thesoil through which it moves and transport with the groundwater. These processesoccur simultaneously to influence the fate of TNT in soil and groundwatersystems, but separation of reaction and fate processes may be possible in thelaboratory. If so, the reaction and transport components could be moremechanistically included in models.
The stable isotopes C and N were used as tracers to track the processes13 15
that occur during TNT degradation. Dual tracers allow measurement ofattenuation whether the process is governed by nitro/amino functionality,aromatic ring/toluene functionality, or both. The following two strategies wereused: carbon-based changes in the soil and nitrogen-based changes in solution.
Soil carbon. Measuring changes in C isotopic ratios in groundwater is notpractical or feasible because of the limited dissolved organic carbon (DOC)typically present. However, incorporation of TNT or covalent bonding ofamino-daughter products of TNT to soil humic material may result in a change inthe C of the soil during or after binding. Several factors influence the13
determination of such measurements:
a. Scant data are available for C values for TNT from different sources.13
Furthermore, soil C values vary due to the origin of parent material13
and the variety of biological-chemical processes possible.
b. Changes in C values may occur very slowly under field situations.13
c. The amount of TNT-derived carbon binding to soil, and hence the changein C of the soil carbon after attenuation, may be too small to measure13
relative to the native carbon levels in the soil. Low-carbon soils wouldhave less “masking” ability than high-carbon soils and would, in theory,require less difference in soil and TNT C values to detect changes.13
Deep aquifer soils, however, may contain very low percentages oforganic carbon, resulting in detection difficulties.
d. The amount of TNT-derived carbon that a soil can bind may be “limited”by the humic content, and therefore the carbon levels, in the soil. High-carbon soils would be expected to bind more than low-carbon soils.
Chapter 2 Use of Carbon and Nitrogen Stable Isotopes 9
Solution nitrogen. Measuring changes in the nitrogen isotopic ratio in soil isnot practical because of the many sources of nitrogen present that would distortthe test results. However, measuring changes in the nitrogen ratio of the TNTspecifically is promising. The amino reduction products of TNT are believed tobond directly to the soil humic material through the amino functional group(Thorn 1997). Therefore, one or two of the nitro groups on the TNT must first bereduced to amino groups. The reduction of nitro groups, whether chemical orbiological, may result in isotopic fractionation due to reaction-rate differencesbetween N and N. If so, a relatively greater percentage of N should be15 14 14
reduced and involved in reactions with either humic material or clay. Thisprocess would leave relatively more N in the TNT remaining in the15
groundwater system. In effect, the N values of TNT in groundwater would15
evolve toward the heavy isotope of nitrogen. Advantages of using the isotopicsignature of TNT in groundwater are that groundwater samples are easier toobtain than subsurface soils samples, and groundwater is a well-mixed systemrelative to the soil. A potential disadvantage is that concentrations of TNT maybe too low to obtain reliable N values. Regardless of the mechanism, changes15
in the N values of TNT in groundwater toward heavier nitrogen would15
indicate that some form of attenuation is occurring.
Two laboratory studies were conducted. The first tracked the degradation of aknown amount of TNT in soil over time, measuring the C and N values for13 15
TNT. The second laboratory study looked at the C and N values for TNT13 15
in a soil system where an unlimited amount of TNT was available to the system.The objective of both studies was to determine whether change in the C and13
N values for TNT could be determined as the TNT degraded.15
Two field studies were conducted: one soil and one groundwater. In the soilstudy, a number of samples were collected from LAAP and analyzed todetermine the TNT concentration and the C value. The objective was to13
determine if a change in the C value for soil carbon could be measured in a13
real sample. In the second field study, groundwater samples were collected alongtransects at LAAP with the concentration and N value for TNT determined.15
The objective was to look at the change in the N value for TNT as TNT15
migrated with the groundwater.
Objective
The objective of this work was to evaluate the feasibility of using C and N13 15
stable isotope analyses as an analytical tool for monitoring natural attenuation atexplosives-contaminated sites. Laboratory studies were conducted to determineif changes in the C and N values for TNT in solution and the C values13 15 13
for the soil carbon could be measured as TNT proceeded through its degradationand attenuation process. Studies were conducted using water from LAAP todetermine whether changes in the C and N values for TNT in groundwater13 15
could be measured as a function of time or distance as the TNT plume migratedthrough the soil. Studies were conducted using soil samples from LAAP to

10Chapter 2 Use of Carbon and Nitrogen Stable Isotopes
determine if the C values for the soil carbon changed over time as a result of13
exposure to and attenuation of TNT.
Methods and Materials
Instrumental analyses
HPLC analysis. Soil and water extracts for high-performance liquidchromatographic (HPLC) analysis were diluted 1:4 volume per volume (v/v)with water, filtered through a Millex SR 0.5 mm filter (Millipore Corporation,Bedford, MA), and analyzed by reverse phase (RP)-HPLC. The chromatographicsystem consisted of a Spectra Physics 8800 programmable pump (SpectraPhysics, Inc., San Jose, CA) operated in isocratic mode, a Spectra PhysicsSpectra 100 variable wavelength detector (Spectra Physics, Inc., San Jose, CA)set to 254 nm, and a Dynatech LC-241 autosampler (Dynatech Corporation,Baton Rouge, LA). The analytes were separated on an LC-8 (150 mm × 3.9 mm)column (Waters Corporation, Bedford, MA) eluted with a binary eluant ofisopropanol/water (15/85, v/v) at a flow rate of 1.4 mL/min. The columntemperature was maintained at 28 °C with a column oven.
GC-IRMS analysis. Stable carbon and nitrogen isotope analysis ofnitroaromatics in soil and water extracts were conducted with a Varian Star 3400CX gas chromatograph (GC) (Varian Instruments, Harbor City, CA) equippedwith a Finnigan Magnum ion trap mass spectrometer (ITMS) (FinniganCorporation, San Jose, CA) and a Finnigan Delta-S isotope ratio massspectrometer (IRMS) (Finnigan Corporation, San Jose, CA). The analytes wereseparated on an SPB-1 fused silica capillary column (15 m × 0.32 mm ID,0.25 mm film thickness) using a temperature program 100 °C to 250 °C at8.3 °C/min. The effluent from the column was split, 10 percent going to theITMS for peak identification and the remainder to the IRMS where the analyteswere combusted in line at 940 °C to CO and N for isotope analysis. For N2 2
15
analysis the capillary transfer line was submerged in liquid nitrogen to removecarbon gases from the N . The standard for nitrogen was atmospheric N and the2 2
standard for carbon was PDB. The detection limits were 1 mg C and 3 mg N andthe precision was ±0.2 ‰ for N and ±0.1 ‰, for C.15 13
Dual inlet IRMS analysis. Soil samples were analyzed isotopically by amodified Dumas combustion method that converts organic carbon and organicnitrogen to CO and N for mass spectral analysis (Macko 1981). Soil samples2 2
were placed in quartz tubes with Cu and CuO, evacuated, and sealed. The quartztubes were then heated to 850 °C at a rate of 4500 °C/hr, kept at 8500 °C for2 hr, and cooled to room temperature at a rate of 600 °C/hr. The slow coolingcycle ensured that any oxides of nitrogen were decomposed to N . The CO was2 2
separated from N by cryogenic distillation. The N gas was then analyzed on a2 2
Nuclide 3-60-RMS. In turn, CO gas was analyzed on a Finnigan MAT 2522
IRMS (Finnigan Corporation, San Jose, CA). The standard for nitrogen was
Chapter 2 Use of Carbon and Nitrogen Stable Isotopes 11
atmospheric N and the standard for carbon was PDB. The detection limits were2
1 mg C and 3 mg N and the precision was ±0.2 ‰ for N and ±0.1 ‰ for C.15 13
Calibration experiment. A series of standard solutions of StandardAnalytical Reference Material (SARM) grade TNT (Army Environmental Center(AEC), Aberdeen Proving Ground, MD) were prepared in acetonitrile (AcN)with concentrations ranging from 2.0 mg/L to 1,000 mg/L. Each standard wasanalyzed by GC/IRMS and the C value for TNT was determined. The13
relationship between concentration and the C value for TNT was computed13
and a minimum concentration threshold where reliable data could be obtainedwas determined.
TNT solutions
An aqueous solution of SARM grade TNT was prepared by placing 250 mgof TNT into 4 L of MilliQ grade water and stirring for 3 days. The solution wasfiltered to remove any undissolved TNT, then analyzed by HPLC. The resultingconcentration was determined to be 49.5 mg/L. This solution was used to spikethe samples in Incubation Study 1.
A second aqueous solution of TNT was prepared by placing 3 g of technicalgrade TNT (Eastman Kodak, Rochester, NY) into 20 L of tap water. Thesolution was stirred for 10 days, then filtered and analyzed by HPLC. Theresulting concentration was determined to be 101 mg/L. This solution was usedto spike samples in Incubation Study 2.
Incubation study 1: Isotope ratio of TNT-amended soil over time
Two soils were chosen for the incubation study, one from Charlton, NH, andthe other from LAAP. The Charlton soil was a sandy loam with 1.3 percent totalorganic carbon. The LAAP soil was primarily sand with a total organic carboncontent of 0.012 percent. Both soils were oven dried at 105 °C, then sievedthrough a No. 20 sieve (0.84 mm). Samples were prepared by placing 25 g of soilinto a 50-mL test tube (50 samples of each soil were prepared). A 2.0-mL aliquotof tap water was added to each sample in order to rewet the soil. The sampleswere incubated in the dark at room temperature for 3 days to allow the restart ofmicrobiological activity. A 4.0-mL aliquot of aqueous TNT (49.5 mg/L) solutionwas added to 35 of the 50 samples. A 4.0-mL aliquot of MilliQ grade water wasadded to the remaining 15 samples to be used as blanks. The samples werereturned to the dark and incubation was allowed to continue at room temperature(22° ± 2°C).
Sampling events took place immediately after preparation (time zero), then at1, 3, 7, 14, 21, and 28 days. For each sampling event, three replicates of eachspiked soil were chosen at random. Blanks were sampled in triplicate on days 0,3, 14, and 28. Each soil sample was quantitatively transferred from theincubation tube to an extraction thimble and extracted by Soxhlet for 24 hr with

12Chapter 2 Use of Carbon and Nitrogen Stable Isotopes
AcN at a rate of six cycles per hour. The final extract was diluted volumetricallyto 250 mL. The soil was allowed to air-dry overnight to allow the AcN toevaporate, then oven-dried at 105 °C overnight to remove any remaining water orsolvent. Extracts were analyzed for concentration of TNT and its transformationproducts by HPLC-UV as described previously and by GC/IRMS for C and13
N values for TNT. The dried soil was analyzed by dual inlet IRMS for C15 13
and N values of the soil.15
Incubation study 2: Unlimited contaminant source, maximumloading of soil
Due to limited quantities of LAAP and Charlton soils for this study, a soilcollected at Hanover, NH, was oven dried (105°C) and sieved as describedpreviously. The Hanover soil was a silty loam containing 1.5 percent totalorganic carbon. Each of 48 slurry samples was prepared by placing 25 g of soilinto 250-mL glass jars and adding 6.0 mL of tap water to rewet the soil. Thesamples were then allowed to incubate in the dark at room temperature for3 days. A 100-mL aliquot of aqueous TNT solution (101 mg/L) was added to39 of the 48 samples. To the remaining nine samples, 100 ml of tap water wasadded. The samples and blanks were shaken on a wrist action shaker for 20 min-utes, then returned to the dark for incubation. Also prepared at this time werethree control samples containing only 100 mL of the TNT spiking solution plus6 mL of tap water (no soil).
The spiked soils were sampled at days 0, 7, 14, 21, 28, and 56. Blanks weresampled at days 0, 21, and 56. At each sampling event, all of the jars wereshaken for 20 minutes on a wrist action shaker, then centrifuged for 45 minutesat 2,000 rpm (RCF = 682 × g). Three samples were randomly selected andplaced to one side for analysis. On the days that blanks were analyzed, threeblanks were also selected. For the remaining samples, the aqueous phase wasdecanted, weighed, then discarded. A fresh 100-mL aliquot of the technicalgrade TNT solution was then added to each sample. The samples were againshaken for 20 minutes, then returned to the dark.
The samples selected for analysis were centrifuged for 45 minutes at2,000 rpm. The aqueous phase was poured off, weighed, then transferred to abrown glass jar. The aqueous phase was analyzed by HPLC as describedpreviously to determine the concentration of TNT and the 2-amino- and 4-amino-dinitrotoluene reduction products. Three subsamples of each soil phase wereplaced in aluminum tins and weighed. The subsamples were air-dried for severaldays until a constant weight was achieved. The dried subsamples were extractedwith AcN and the extracts analyzed by HPLC as described previously todetermine the concentration of the analytes of interest and by GC/IRMS for the C and N values for TNT. The remainder of the soil was extracted by13 15
Soxhlet extractors for 24 hr with AcN, dried, then analyzed by dual inlet IRMSfor the C and N values.13 15
Chapter 2 Use of Carbon and Nitrogen Stable Isotopes 13
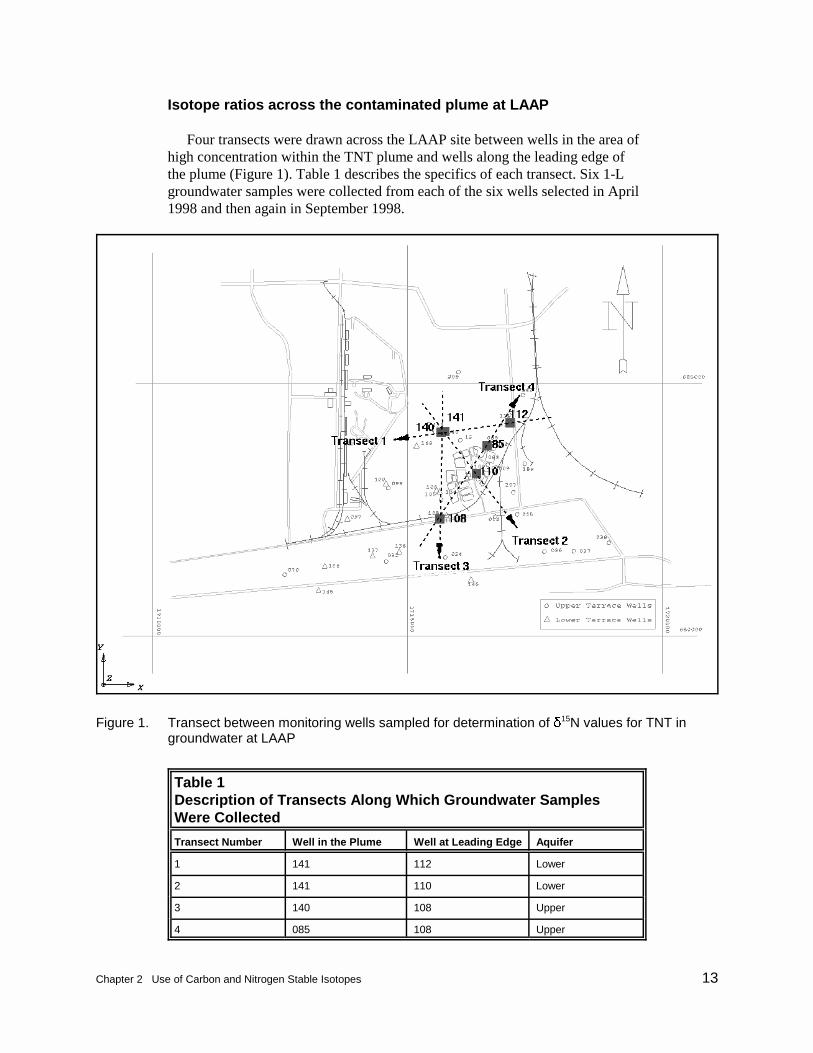
Figure 1. Transect between monitoring wells sampled for determination of N values for TNT in15
groundwater at LAAP
Isotope ratios across the contaminated plume at LAAP
Four transects were drawn across the LAAP site between wells in the area ofhigh concentration within the TNT plume and wells along the leading edge ofthe plume (Figure 1). Table 1 describes the specifics of each transect. Six 1-Lgroundwater samples were collected from each of the six wells selected in April1998 and then again in September 1998.
Table 1Description of Transects Along Which Groundwater SamplesWere Collected
Transect Number Well in the Plume Well at Leading Edge Aquifer
1 141 112 Lower
2 141 110 Lower
3 140 108 Upper
4 085 108 Upper
14Chapter 2 Use of Carbon and Nitrogen Stable Isotopes
The TNT was extracted from the groundwater using Bond Elut EVN200 mg/3 cc solid-phase extraction cartridges (Varian, Harbor City, CA).Duplicate 1-L samples were extracted for the plume samples and duplicate 2-Lsamples were extracted for the leading edge samples. The groundwater sampleswere passed through the cartridges at a rate of approximately 10 mL/min.Because of the high TNT concentration of the samples, two cartridges wereplaced in series to prevent losses of analyte resulting from any breakthrough.The TNT was recovered from the cartridges with 5.0 mL of AcN and theconcentrations determined by HPLC. The extracts were then analyzed byGC/IRMS to determine the C and N values for TNT.13 15
Isotope ratios in soils at LAAP
Soil core samples were collected from six locations at LAAP using a conepenetrometer with a split-spoon sampler (see Appendix A for list of samplelocations). At each location, subsamples were obtained from 5 to 14 differentdepths ranging from approximately 1.5 to 20 m for determination of concentra-tion of TNT and stable isotope ratios for extractable TNT and soil carbon.
The soil samples were air-dried, ground with a mortar and pestle, then passedthrough a No. 20 sieve (0.84 mm). A 2.0-g subsample of each soil was extractedwith AcN. The extract was analyzed by HPLC to determine the concentration ofTNT and the mono-amino-dinitrotoluenes. An additional subsample of each soilwas washed twice with 10 mL of AcN for 18 hr with ultrasonication, air-dried,then analyzed by dual inlet IRMS to determine the C and N values for the13 15
soil.
Results and Discussion
Method development
The initial task for this project was to develop sample preparation techniquesthat would allow isolation and preconcentration of TNT, but would not introduceisotopic fractionation, which would confound results. Two methods, one for soilsamples and one for water samples, were developed for exhaustive extractionwithout isotopic fractionation.
For soil samples, the Soxhlet extractor was chosen as the most effectivemeans of extraction. Previous studies demonstrated that the efficiency of theSoxhlet extractor is equal to that of ultrasonication (Jenkins and Leggett 1985;Jenkins and Grant 1987). Although Soxhlet extractions are slow, this techniquehas the unique characteristic that the analytes are completely separated from thesoil in the extractor. The solvent reservoir/collection vessel and sample holderare physically separated. In the case of ultrasonic extraction recommended in thestandard EPA method, the sample and extraction solvent are in the same vessel.Therefore, complete (100 percent) removal of the solvent in ultrasonic extraction
Chapter 2 Use of Carbon and Nitrogen Stable Isotopes 15
is not possible. Some residual solvent remains with the soil sample, and thissolvent will contain some of the analytes. With Soxhlet extraction, once passedto the collection vessel, the analytes cannot again come into contact with the soil.The results of an extraction kinetics experiment showed that a 24-hr Soxhletextraction was required to obtain 99.9 percent recovery of TNT from field-contaminated soil using AcN as the extraction solvent.
For extraction of TNT from water samples, solid phase extraction (SPE) wasthe method of choice. The groundwater was passed through SPE cartridges at10 mL/min and the analytes were recovered with 5 mL of AcN. The recoveryfor TNT was 99.8 percent.
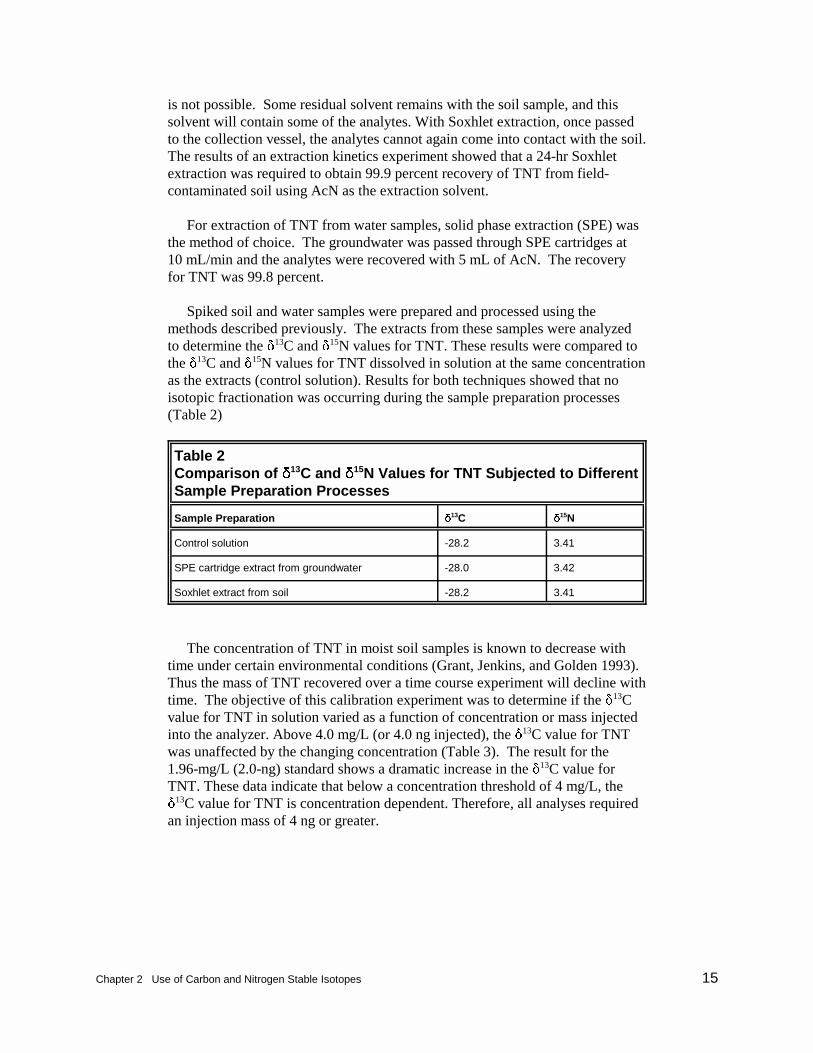
Spiked soil and water samples were prepared and processed using themethods described previously. The extracts from these samples were analyzedto determine the C and N values for TNT. These results were compared to13 15
the C and N values for TNT dissolved in solution at the same concentration13 15
as the extracts (control solution). Results for both techniques showed that noisotopic fractionation was occurring during the sample preparation processes(Table 2)
Table 2Comparison of C and N Values for TNT Subjected to Different13 15
Sample Preparation Processes
Sample Preparation C N13 15
Control solution -28.2 3.41
SPE cartridge extract from groundwater -28.0 3.42
Soxhlet extract from soil -28.2 3.41
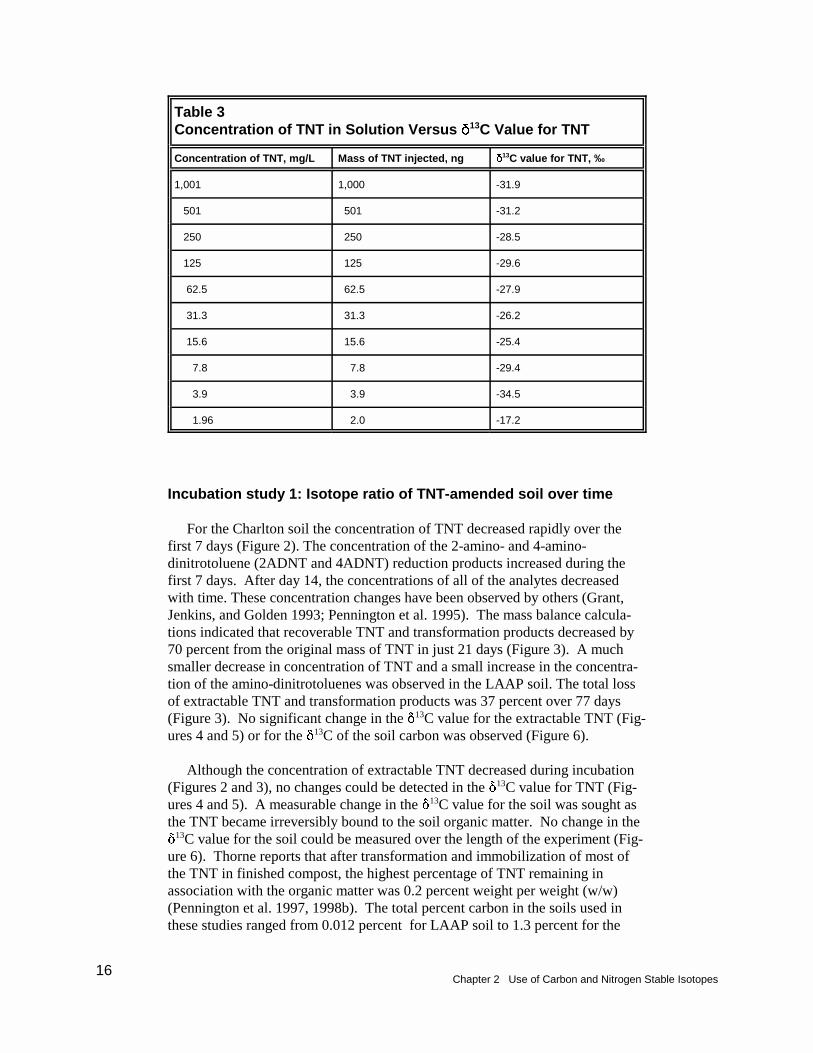
The concentration of TNT in moist soil samples is known to decrease withtime under certain environmental conditions (Grant, Jenkins, and Golden 1993).Thus the mass of TNT recovered over a time course experiment will decline withtime. The objective of this calibration experiment was to determine if the C13
value for TNT in solution varied as a function of concentration or mass injectedinto the analyzer. Above 4.0 mg/L (or 4.0 ng injected), the C value for TNT13
was unaffected by the changing concentration (Table 3). The result for the1.96-mg/L (2.0-ng) standard shows a dramatic increase in the C value for13
TNT. These data indicate that below a concentration threshold of 4 mg/L, the C value for TNT is concentration dependent. Therefore, all analyses required13
an injection mass of 4 ng or greater.
16Chapter 2 Use of Carbon and Nitrogen Stable Isotopes
Table 3Concentration of TNT in Solution Versus C Value for TNT13
Concentration of TNT, mg/L Mass of TNT injected, ng C value for TNT, ‰13
1,001 1,000 -31.9
501 501 -31.2
250 250 -28.5
125 125 -29.6
62.5 62.5 -27.9
31.3 31.3 -26.2
15.6 15.6 -25.4
7.8 7.8 -29.4
3.9 3.9 -34.5
1.96 2.0 -17.2
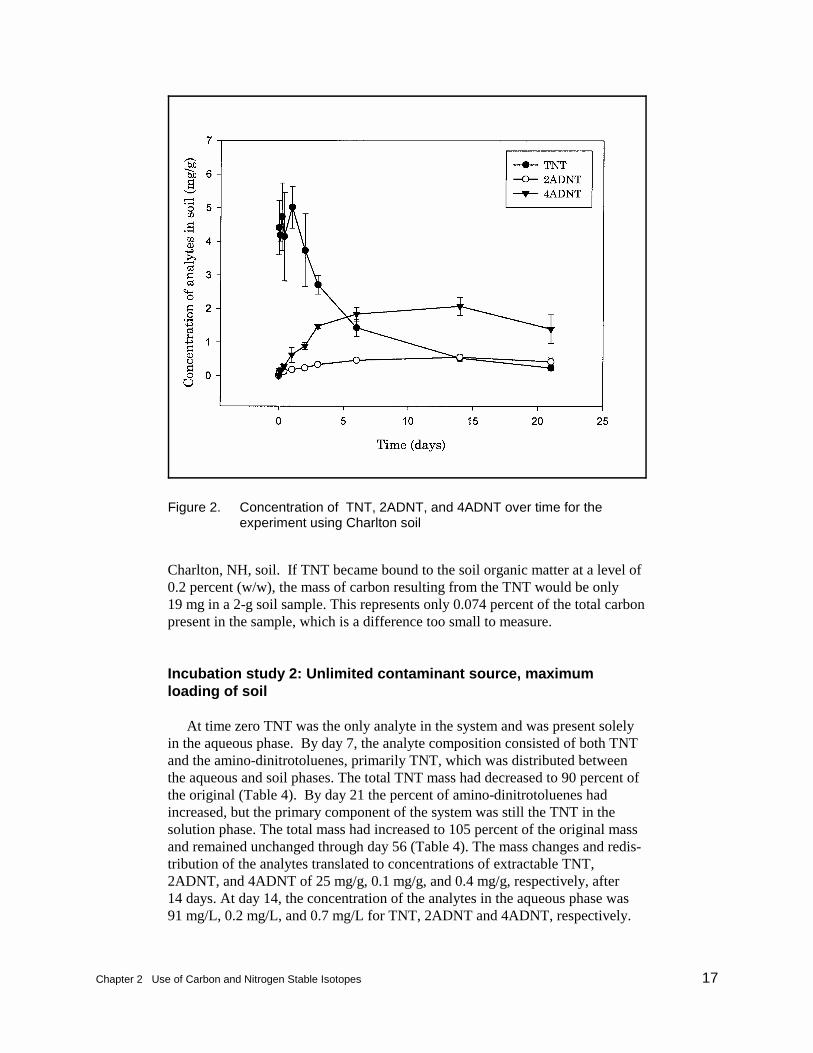
Incubation study 1: Isotope ratio of TNT-amended soil over time
For the Charlton soil the concentration of TNT decreased rapidly over thefirst 7 days (Figure 2). The concentration of the 2-amino- and 4-amino-dinitrotoluene (2ADNT and 4ADNT) reduction products increased during thefirst 7 days. After day 14, the concentrations of all of the analytes decreasedwith time. These concentration changes have been observed by others (Grant,Jenkins, and Golden 1993; Pennington et al. 1995). The mass balance calcula-tions indicated that recoverable TNT and transformation products decreased by70 percent from the original mass of TNT in just 21 days (Figure 3). A muchsmaller decrease in concentration of TNT and a small increase in the concentra-tion of the amino-dinitrotoluenes was observed in the LAAP soil. The total lossof extractable TNT and transformation products was 37 percent over 77 days(Figure 3). No significant change in the C value for the extractable TNT (Fig-13
ures 4 and 5) or for the C of the soil carbon was observed (Figure 6).13
Although the concentration of extractable TNT decreased during incubation(Figures 2 and 3), no changes could be detected in the C value for TNT (Fig-13
ures 4 and 5). A measurable change in the C value for the soil was sought as13
the TNT became irreversibly bound to the soil organic matter. No change in the C value for the soil could be measured over the length of the experiment (Fig-13
ure 6). Thorne reports that after transformation and immobilization of most ofthe TNT in finished compost, the highest percentage of TNT remaining inassociation with the organic matter was 0.2 percent weight per weight (w/w)(Pennington et al. 1997, 1998b). The total percent carbon in the soils used inthese studies ranged from 0.012 percent for LAAP soil to 1.3 percent for the
Chapter 2 Use of Carbon and Nitrogen Stable Isotopes 17
Figure 2. Concentration of TNT, 2ADNT, and 4ADNT over time for theexperiment using Charlton soil
Charlton, NH, soil. If TNT became bound to the soil organic matter at a level of0.2 percent (w/w), the mass of carbon resulting from the TNT would be only19 mg in a 2-g soil sample. This represents only 0.074 percent of the total carbonpresent in the sample, which is a difference too small to measure.
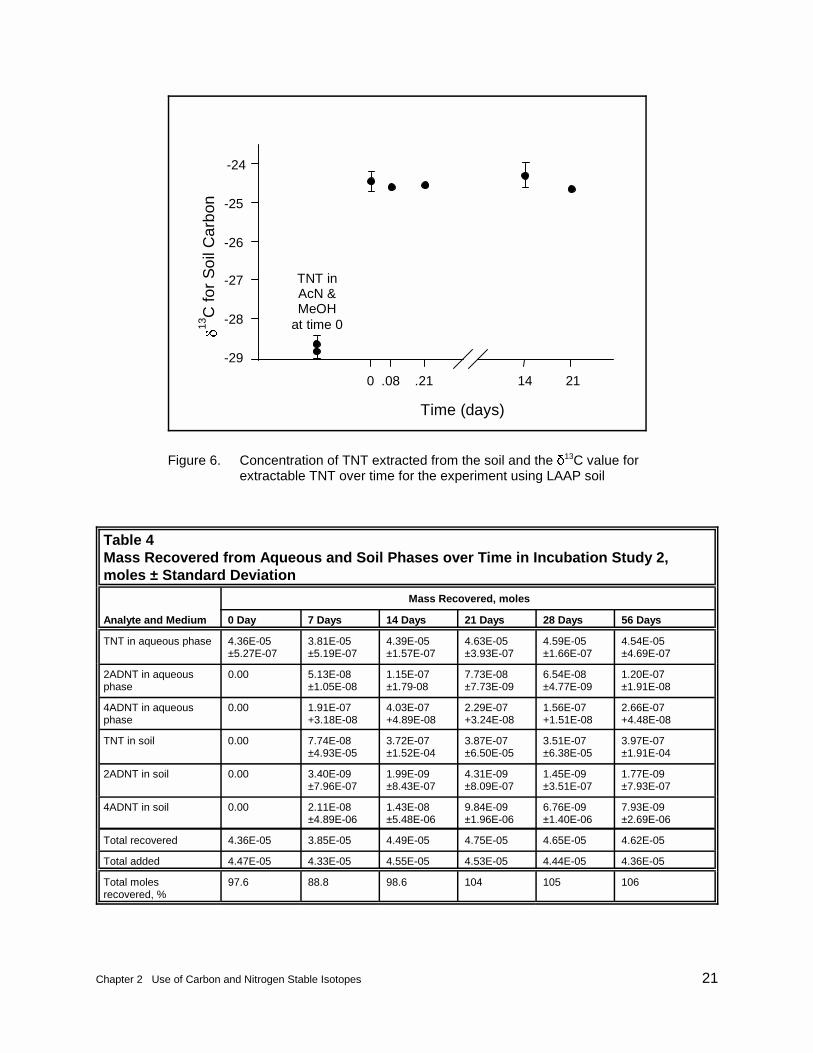
Incubation study 2: Unlimited contaminant source, maximumloading of soil
At time zero TNT was the only analyte in the system and was present solelyin the aqueous phase. By day 7, the analyte composition consisted of both TNTand the amino-dinitrotoluenes, primarily TNT, which was distributed betweenthe aqueous and soil phases. The total TNT mass had decreased to 90 percent ofthe original (Table 4). By day 21 the percent of amino-dinitrotoluenes hadincreased, but the primary component of the system was still the TNT in thesolution phase. The total mass had increased to 105 percent of the original massand remained unchanged through day 56 (Table 4). The mass changes and redis-tribution of the analytes translated to concentrations of extractable TNT,2ADNT, and 4ADNT of 25 mg/g, 0.1 mg/g, and 0.4 mg/g, respectively, after14 days. At day 14, the concentration of the analytes in the aqueous phase was91 mg/L, 0.2 mg/L, and 0.7 mg/L for TNT, 2ADNT and 4ADNT, respectively.

18Chapter 2 Use of Carbon and Nitrogen Stable Isotopes
Figure 3. Mass of TNT, 2ADNT, 4ADNT and total mass recovered over timefor the experiment using LAAP soils
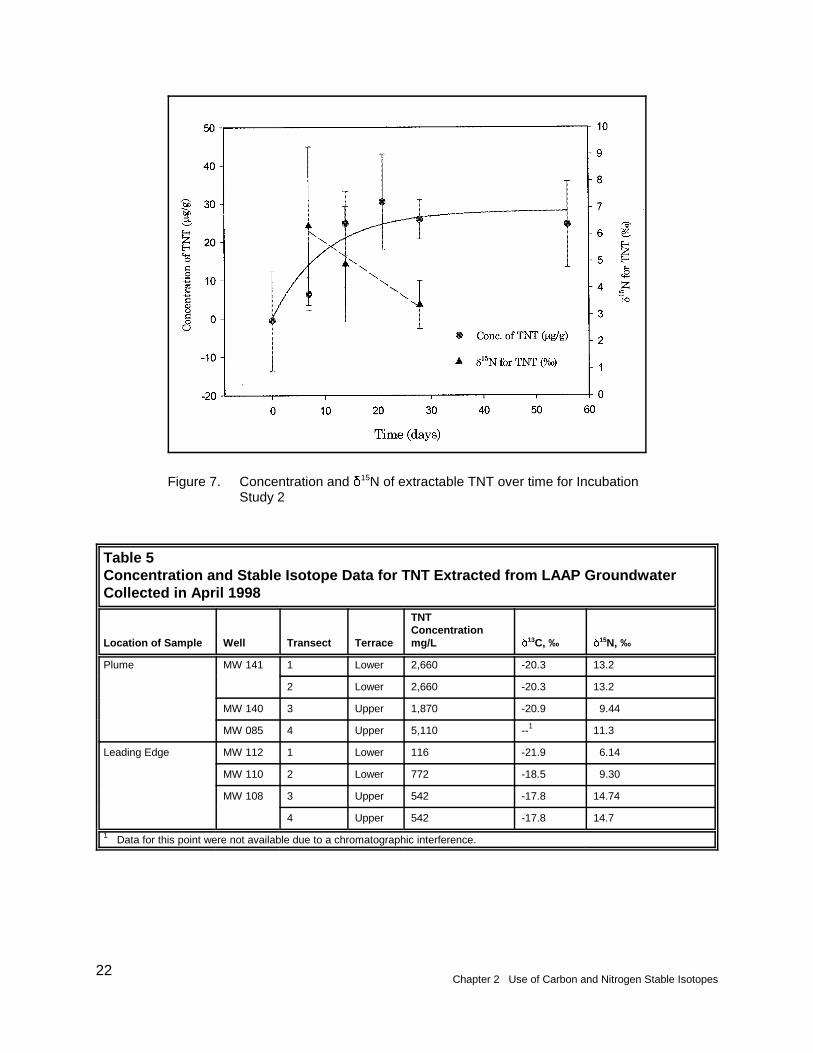
All of these concentrations remained relatively unchanged through 56 days. Thedata plotted in Figure 7 showed definite trends in the change in concentration ofTNT over time. The isotope data suggest a possible trend; however, theprecision of the measurements indicates great uncertainty.
Isotope ratios across the contaminated plume at LAAP
The concentration of TNT in the groundwater near the source region of theplume ranged from 1,870 mg/L to 5,110 mg/L (Table 5). Concentrations alongthe leading edge ranged from 116 mg/L to 772 mg/L. A significant differencebetween the concentration of TNT in the center of the plume and that at theleading edge was evident for both the upper and lower terraces. No significantdifferences were found in the C values for TNT. As predicted, the N13 15
values for TNT increased as the TNT moved away from the source area in theupper aquifer, but for the lower the opposite was observed. Transport may notbe simply away from the center of the plume. The cause for the observed trendis unclear. A second sampling of the wells at LAAP was performed in Septem-ber 1998. Again the TNT was extracted from the groundwater and the concen-tration and N values determined (Table 6). These data showed the same15
concentration gradients along each transect. The statistical analysis of the data

G13
C f
or T
NT
(‰
)
-35
-34
-33
-32
-31
-30
-29
-28
-27
-26
-25
-24
-23
-22
-21
-20
δ13C for TNT
Time (days)
0 2 4 6 8
Con
cen
trat
ion
of
TN
T i
n s
oil
( Pg/
g)
0
1
2
3
4
5
6
7
Conc. TNT in soil (µg/g)
Chapter 2 Use of Carbon and Nitrogen Stable Isotopes 19
Figure 4. Concentration of TNT in the soil and the C value for extractable13
TNT over time for the experiment using Charlton soil
(Table 7) using the Student’s t-test showed a clear increasing trend in the N15
values for TNT, indicating that the TNT was being fractionated and wasbecoming isotopically heavier. These results suggest that as the TNT migratedthrough the soil, a process removed the lighter isotopic fraction of TNT from thegroundwater. Using N measurements of TNT from groundwater to monitor15
the fate or natural attenuation of TNT in the environment is promising. Thecurrent limitation on their use is the lack of kinetics data for the rate of change ofthe N value for TNT as a function of rate of change of the TNT concentration15
as it degrades naturally.
Isotope ratios in soils at LAAP
TNT was detected in most subsamples at concentrations from 0.1 mg/g to1.8 mg/g. Analysis indicated no difference between the C values for blank soil13
samples and those contaminated with TNT. The extractable TNT was alsoanalyzed for N; however, due to the low concentration of TNT in the extracts,15
reliable measurements could not be obtained.

20Chapter 2 Use of Carbon and Nitrogen Stable Isotopes
Figure 5. Concentration of TNT extracted from the soil and the C value for13
extractable TNT over time for the experiment using LAAP soil
Summary
The N data suggested the feasibility of monitoring natural attenuation of15
TNT using N measurements. In two field experiments, increasing N values15 15
for TNT in the groundwater were observed as the TNT migrated through the soil. Data across three of the four transects at LAAP showed a significant increase inthe N values for TNT with decreases in concentrations. These data are15
consistent with the reduction of the nitro groups to amino functional groups,followed by binding of the amino or di-amino products to the soil organic carbon(Pennington et al. 1998b). Both steps in the process involve reactions of thenitrogen groups; therefore, measuring N values is a very promising monitor-15
ing tool for natural attenuation of TNT and its transformation products ingroundwater.
In contrast to the positive results from the N data, the C data proved to15 13
be less useful. The TNT quantities at which reliable isotope ratio values can beobtained were 250 ng and 750 ng for the C and N analyses, respectively. 13 15
Below 4 ng TNT injected on the column, the C measurement was mass13
dependent. This threshold value translated to a soil concentration of 20 mgTNT/g when extracting a 2-g sample with 10 mL of solvent. This is two ordersof magnitude higher than the 0.1-ug/g detection limits of the EPA standard
Time (days)
G13
C fo
r S
oil C
arbo
n
TNT inAcN &MeOH
at time 0
-24
-25
-26
-27
-28
-29
0 .08 .21 14 21
Chapter 2 Use of Carbon and Nitrogen Stable Isotopes 21
Figure 6. Concentration of TNT extracted from the soil and the C value for13
extractable TNT over time for the experiment using LAAP soil
Table 4Mass Recovered from Aqueous and Soil Phases over Time in Incubation Study 2,moles ± Standard Deviation
Analyte and Medium 0 Day 7 Days 14 Days 21 Days 28 Days 56 Days
Mass Recovered, moles
TNT in aqueous phase 4.36E-05 3.81E-05 4.39E-05 4.63E-05 4.59E-05 4.54E-05±5.27E-07 ±5.19E-07 ±1.57E-07 ±3.93E-07 ±1.66E-07 ±4.69E-07
2ADNT in aqueous 0.00 5.13E-08 1.15E-07 7.73E-08 6.54E-08 1.20E-07phase ±1.05E-08 ±1.79-08 ±7.73E-09 ±4.77E-09 ±1.91E-08
4ADNT in aqueous 0.00 1.91E-07 4.03E-07 2.29E-07 1.56E-07 2.66E-07phase +3.18E-08 +4.89E-08 +3.24E-08 +1.51E-08 +4.48E-08
TNT in soil 0.00 7.74E-08 3.72E-07 3.87E-07 3.51E-07 3.97E-07±4.93E-05 ±1.52E-04 ±6.50E-05 ±6.38E-05 ±1.91E-04
2ADNT in soil 0.00 3.40E-09 1.99E-09 4.31E-09 1.45E-09 1.77E-09±7.96E-07 ±8.43E-07 ±8.09E-07 ±3.51E-07 ±7.93E-07
4ADNT in soil 0.00 2.11E-08 1.43E-08 9.84E-09 6.76E-09 7.93E-09±4.89E-06 ±5.48E-06 ±1.96E-06 ±1.40E-06 ±2.69E-06
Total recovered 4.36E-05 3.85E-05 4.49E-05 4.75E-05 4.65E-05 4.62E-05
Total added 4.47E-05 4.33E-05 4.55E-05 4.53E-05 4.44E-05 4.36E-05
Total moles 97.6 88.8 98.6 104 105 106recovered, %
22Chapter 2 Use of Carbon and Nitrogen Stable Isotopes
Figure 7. Concentration and N of extractable TNT over time for Incubation15
Study 2
Table 5Concentration and Stable Isotope Data for TNT Extracted from LAAP GroundwaterCollected in April 1998
Location of Sample Well Transect Terrace mg/L C, ‰ N, ‰
TNTConcentration
13 15
Plume MW 141 1 Lower 2,660 -20.3 13.2
2 Lower 2,660 -20.3 13.2
MW 140 3 Upper 1,870 -20.9 9.44
MW 085 4 Upper 5,110 -- 11.31
Leading Edge MW 112 1 Lower 116 -21.9 6.14
MW 110 2 Lower 772 -18.5 9.30
MW 108 3 Upper 542 -17.8 14.74
4 Upper 542 -17.8 14.7
Data for this point were not available due to a chromatographic interference.1

Chapter 2 Use of Carbon and Nitrogen Stable Isotopes 23
Table 6Concentration and N Values for TNT Extracted from LAAP Groundwater Collected15
in September 1998
Location of Sample Well Transect Terrace mg/L N, ‰TNT Concentration
15
Plume MW 141 1 Lower 2,870 13.3
2 Lower 2,870 13.3
MW 140 3 Upper 1,920 9.7
MW 085 4 Upper 5,950 10.1
Leading Edge MW 112 1 Lower 75.1 17.3
MW 110 2 Lower 1,060 10.0
MW 108 3 Upper 567 13.8
4 Upper 567 13.8
Table 7Statistical Comparison of N Values for TNT Extracted from15
LAAP Groundwater Collected in September 1998
Sample Mean SE F Pooled SE t
Transect #1
141 13.26 0.956 6.32 1.83 -3.16
112 17.35 2.402
Transect #2
141 13.26 0.956 1.42 1.05 4.42
110 9.98 1.137
Transect #3
140 9.69 0.592 3.10 0.48 -12.22
108 13.85 0.336
Transect #4
085 10.10 0.689 4.20 0.54 -9.77
108 13.85 0.336
Critical t Values
t Values (df = 3) 90% 95% 99% 99.9%
2.13 2.78 4.60 8.60
Critical F Values
F Values(df = 3.3.)
90% 95%
29.00 9.28
24Chapter 2 Use of Carbon and Nitrogen Stable Isotopes
method for explosive (EPA 1998). The concentration of TNT in the soil samplescollected at LAAP ranged from 0.1 mg/g to 1.8 mg/g. Even where the soil was incontact with an unlimited source of TNT for several weeks, the concentration ofTNT adsorbed to the soil reached only 25 mg/g, which was just within thedetection threshold. Therefore, a change in the C value for the soil carbon13
resulting from the addition of TNT to the soil carbon cannot be measured due tothe detection limitations of the analysis.
Sample preconcentration would improve detection, but may introduce greatermeasurement uncertainty. Preconcentration may address the limitation foranalytes in solution, but not in soil. One of the key objectives was to measurechanges in the C value for the soil carbon as TNT becomes irreversibly bound13
to the soil organic matter. As discussed, the change in mass of carbon in a soilsample resulting from TNT binding with organic matter in the soil is less than0.1 percent. This is far too small a change to measure precisely.
The prediction that no changes in the carbon isotope ratio would be detectedfor TNT in solution, even with large changes in concentration of TNT, wasverified. Changes in C in soil carbon could not be detected as TNT became13
irreversibly bound to the soil organic matter. In incubation study 1, the con-centration of TNT decreased by sixfold over a very short time, but no significantchange in the C value for the soil was measured. In incubation study 2, the13
concentration of extractable TNT increased to 25 mg/g over 77 days, but nosignificant changes were measured in the C for soil carbon. Attenuation13
processes occur, but do not fractionate the carbon isotopes. Soil samplescollected at LAAP showed no significant differences between samples fromdifferent locations or for samples for different depths at the same locations.
Conclusions
The objective of this work was to evaluate whether C and/or N stable13 15
isotopes measurements of TNT could be used as a monitoring technique fornatural attenuation of TNT. The data clearly did not support the use of C13
measurements because changes in the C value for soil organic matter were too13
small to detect. However, changes in the N values for TNT in groundwater15
could be detected across a contaminant plume. In order to utilize such ameasurement, a quantitative assessment of the rate and magnitude of the changein the N value of TNT as a function of the following will be required: TNT15
degradation rate, the concentration gradient of TNT across a plume, the contacttime with the soil, and the mass of soil through which the TNT has passed.
Chapter 3 Toxicity Testing of LAAP Subsurface Soils 25
3 Toxicity Testing of LAAPSubsurface Soils
Introduction
Analysis of the microbial communities in LAAP soils resulted in a significantnegative correlation between TNT concentration and overall viable biomass(Pennington et al. 1999b). This study was conducted to test the hypothesis thatthis correlation was due to TNT toxic effects.
The dual soil toxicity test developed by Azur Environmental (Azur Environ-mental, Carlsbad, CA) was used to examine the potential acute and mutagenictoxicities of contaminants in soil. The Azur Environmental assays are based onresponses of the marine luminescent bacterium Vibrio fischeri, which producesvisible light as a by-product of its normal metabolic processes. When thesenormal processes are altered by exposure to a toxicant, light output is changed. Therefore, differences in light production are directly proportional to the“bioreactivity” of the sample. In the MicroTox assay, bioreactivity is expressedas the effective concentration that causes a 50 percent reduction in light outputby the microorganism (EC %). The MutaTox assay employs a dark variant of50
Vibrio fischeri. When the dark strain contacts a DNA-damaging compound(genotoxic agent), light is produced in direct proportion to the amount ofgenotoxic agent present. Phenol is used as a positive control to ensure that thedark variant is responsive to a toxic compound. To determine whether or not acontaminant can be transformed to a more reactive (genotoxic) compound byenzymatic activation, mouse liver hepatic enzymes (S-9 solution) is used, andbenzo[a]pyrene is employed as a positive control to ensure that the S-9 mixtureis working properly.
Materials and Methods
Solid phase MicroTox assay
Soil samples from LAAP Site 6-2 (Pennington et al. 1999b), which had beenarchived by freezing at -80 (C, and a control sediment sample from Brown’s
26Chapter 3 Toxicity Testing of LAAP Subsurface Soils
Lake, Vicksburg, MS, were tested. Dry weight equivalent of 7 g of each soil wasmixed and placed into a 50-mL beaker to which was added 35 mL of solid-phasediluent (3.5 percent NaCl solution in distilled water). The mixture was stirredfor 10 min with a Teflon-coated magnetic stirring bar. The MicroTox test wasthen run on each soil following the instructions provided by the manufacturer. Following incubation of the samples, the solids were separated using a filtercolumn supplied with the test. Light output from the filtrate for each sample wasread using an Azur Environmental Model 500 Analyzer. The output file for eachsample was corrected for sample dry weight based on moisture determinationsmade for triplicate soil samples. The Brown’s Lake soil served as theuncontaminated control.
MutaTox test
Phenol and benzo[a]pyrene reagents were used as positive controls for theMutaTox test. The phenol solution was prepared by adding 0.2 g of reagentgrade phenol to 20 mL of a reconstitution solution provided with the test. Thebenzo[a]pyrene solution was prepared by adding 0.01 g of benzo[a]pyrene to20 mL of dimethylsulfoxide (DMSO). Both reagents were stored at 4 (C untilused.
To prepare the soil extracts, 1 g of each soil was extracted with 2 mL ofDMSO, vortexed, sonicated for 2 min in an ultrasonic bath, and then incubatedfor 3 hr at room temperature. The soils and extractants were separated bycentrifuging for 5 min at 250 RCF), and the extractants were decanted and testedaccording to the manufacturer’s instructions for the MutaTox test alone and incombination with the S-9 solution, both employing the dark strain of Vibriofischeri. The light output was measured at 16, 20, and 24 hr of incubation on theAzur Environmental Model 500 Analyzer. Results were corrected for the dryweight value of the soil sample. The Brown’s Lake soil served as theuncontaminated control.
Data analysis
Data were analyzed using the Spearman Rank Order Correlation and PearsonProduct-Moment Correlation in the SigmaStat Statistical Software Package(McClave and Dietrich 1982; Federle et al. 1986; Jandel 1995). To establish adirect relationship between the toxic effect and the measurement system used,the MicroTox toxicity data were expressed as toxicity units (TU) using theformula TU = r(100)/EC , where r is the correlation coefficient (Ghirardini50
et al. 1998).

Chapter 3 Toxicity Testing of LAAP Subsurface Soils 27
Results and Discussion
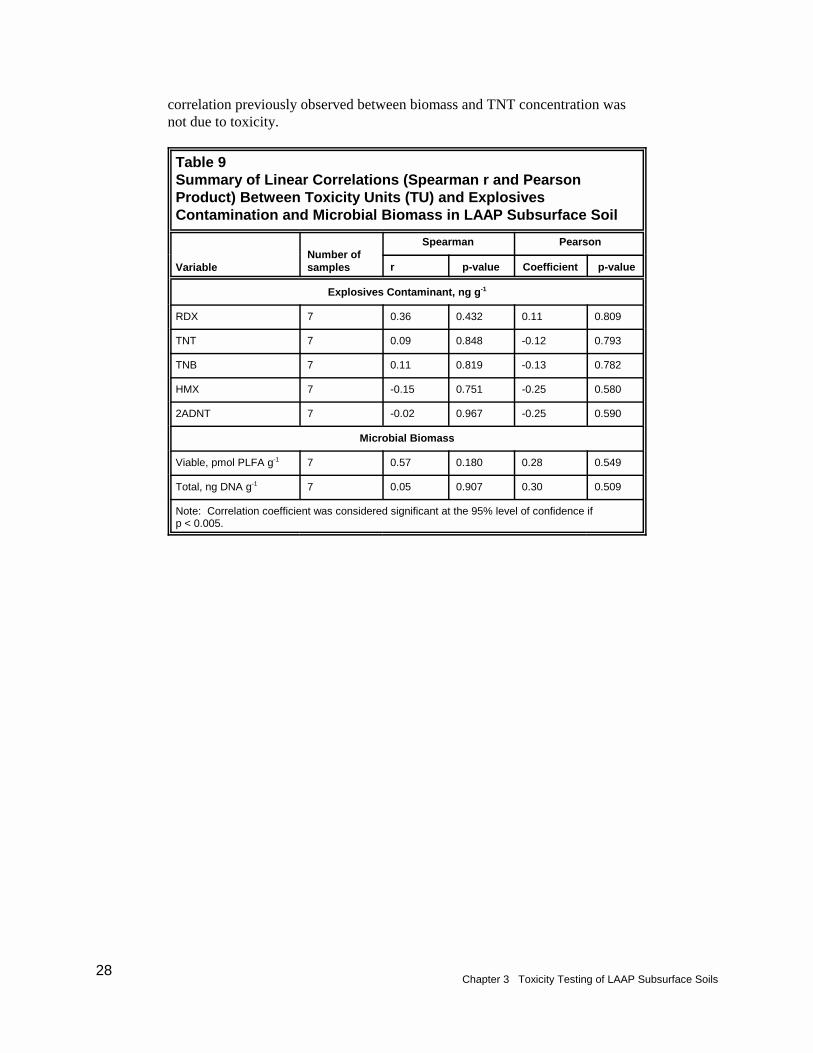
No substantial expression of mutatoxicity was found in any of the samples. When compared to the uncontaminated Brown’s Lake sediment, all but two ofthe LAAP Site 6-2 samples were more toxic (Table 8). However, whencompared with the findings of Ghirardini et al. (1998) for Venice lagoon andinner canal sediments and with those of Simini et al. (1995) for JAAP soils,LAAP Site 6-2 toxicity values were low. The only exception was the LAAP Site6-2 soil from 15.2 m, which had a toxicity in the low to moderate range incomparison with the materials from Venice and JAAP. Toxicity (as TU)typically correlates positively with contaminant concentration; i.e., toxicityincreases in proportion to increases in contaminant concentrations. However,when toxicity results were compared with contaminant concentration andmicrobial biomass, no correlation was found (Table 9).
Table 8MicroTox Results from Seven LAAP Subsurface Soils andTM
Uncontaminated Brown’s Lake Sediment
Depth, m EC % EC % Range Slope Coefficient, r TU50 50
Correlation
LAAP Soils
3.0 0.55 0.42-0.73 3.90 0.97 176.4
6.1 2.56 2.37-2.78 4.17 0.99 38.7
8.2 1.16 0.90-1.40 2.51 0.95 81.9
10.4 1.14 0.85-1.53 1.44 0.88 77.2
12.2 0.43 0.33-0.58 0.88 0.93 216.3
15.2 0.27 0.19-0.37 0.81 0.91 337.0
17.4 1.22 0.68-2.19 0.56 0.78 64.0
Brown’s Lake Sediment
0 1.46 1.31-1.54 1.48 0.99 68.0
Note: EC % values, slopes, and correlation coefficients were used to compute toxicity units50
(TU).
Conclusions
Most of the LAAP subsurface soils from Site 6-2 showed a greater toxicitythan the “clean” (no detectable explosives or other organic contaminants) lakesediment; however, except for the LAAP Site 6-2 soil from 15.2 m, the level oftoxicity was generally lower than that previously reported at an explosive- andheavy metal-contaminated site (JAAP). No correlation was found betweentoxicity values and contaminant chemistry or microbial biomass. Therefore, the
28Chapter 3 Toxicity Testing of LAAP Subsurface Soils
correlation previously observed between biomass and TNT concentration wasnot due to toxicity.
Table 9Summary of Linear Correlations (Spearman r and PearsonProduct) Between Toxicity Units (TU) and ExplosivesContamination and Microbial Biomass in LAAP Subsurface Soil
Variable samplesNumber of
Spearman Pearson
r p-value Coefficient p-value
Explosives Contaminant, ng g-1
RDX 7 0.36 0.432 0.11 0.809
TNT 7 0.09 0.848 -0.12 0.793
TNB 7 0.11 0.819 -0.13 0.782
HMX 7 -0.15 0.751 -0.25 0.580
2ADNT 7 -0.02 0.967 -0.25 0.590
Microbial Biomass
Viable, pmol PLFA g 7 0.57 0.180 0.28 0.549-1
Total, ng DNA g 7 0.05 0.907 0.30 0.509-1
Note: Correlation coefficient was considered significant at the 95% level of confidence ifp < 0.005.
Chapter 4 Integration of Biomarkers Data into the Model 3DFATMIC 29
4 Integration of BiomarkersData into the Model3DFATMIC
Introduction
Accounting for flow, transport, and reaction processes that control bacterialgrowth and migration patterns would enhance modeling capabilities formonitored natural attenuation of explosives. 3DFATMIC (3-DimensionalSubsurface Flow, Fate and Transport of Microbes and Chemicals Model) is anumerical model that has been developed to simulate the coupled reactivecontaminant transport and microbial growth. The code was developed as part ofa cooperative agreement between the EPA National Management ResearchLaboratory in Ada, OK, and Pennsylvania State University (Chen 1995; EPA1987).
Baveye and Valocchi (1989) describe three different conceptual models thatmay be used in mathematical models for growth and transport of microbes in soiland groundwater. These include a biofilm model, a microcolony model, and amacroscopic model. Because the geometric parameters describing the size ofbiofilms or microcolonies are not widely found in the literature, the microbial-chemical reactions in 3DFATMIC are formulated with a macroscopic approach(Chen 1995). The macroscopic approach neglects the microscopic configuration(the way in which the microorganisms are grouped together on the solid surface)and assumes that the microorganisms are attached to and grow on the surface ofsolid particles (see for example, Borden and Bedient 1986).
The biomarker study provided biomass data, which may be used as inputparameters in 3DFATMIC (Table 10 for LAAP and Table 11 for JAAP). Thedata were collected as snapshot samples (collected at the same time) at a fewhorizontal locations and at one time at both sites.
The model 3DFATMIC was selected to provide time-series distribution ofbiomass over domains. The predicted results from modeling could provideinformation on the spatial and temporal distribution of biomass and, with help

30Chapter 4 Integration of Biomarkers Data into the Model 3DFATMIC
Table 10Biomass Data for Selected Location at Area P, LAAPSample Depth, m Biomass, pmol PLFA/g Cells/g (Estimated)1 2
1-1a 7.3152 11.36 2.8E+05
1-1b 9.144 3.16 7.9E+04
1-1c 10.3632 7.86 2.0E+05
1-4a 7.80288 61.21 1.5E+06
1-4b 13.1064 2.27 5.7E+04
2-1a 7.80288 4.49 1.1E+05
2-1b 10.2108 5.90 1.5E+05
2-1c 18.8976 1.71 4.3E+04
2-3a 5.54736 2.28 5.7E+04
2-3b 13.35024 0.36 9.1E+03
2-3c 17.43456 1.30 3.2E+04
2-5a 7.49808 6.70 1.7E+05
2-5b 12.16152 1.11 2.8E+04
2-5c 13.99032 1.88 4.7E+04
3-2a 6.18744 7.92 2.0E+05
3-4a 11.49096 6.67 1.7E+05
3-4b 18.25752 37.13 9.3E+05
3-5a 7.3152 28.56 7.1E+05
3-5b 12.71016 7.14 1.8E+05
3-5c 19.2024 16.71 4.2E+05
3-7a 11.09472 38.67 9.7E+05
3-7b 14.81328 4.04 1.0E+05
3-7c 17.03832 66.26 1.7E+06
4-5a 9.35736 3.22 8.1E+04
4-5b 20.45208 13.63 3.4E+05
6-2a 1.524 163.6 4.1E+06
6-2b 3.048 16.8 4.2E+05
6-2c 4.572 17.4 4.3E+05
6-2d 6.096 0.6 1.4E+04
6-2e 7.62 0.9 2.3E+04
6-2f 8.2296 2.4 6.1E+04
6-2g 9.144 1.8 4.4E+04
6-2h 10.3632 0.6 1.6E+04
6-2i 12.25296 11.9 3.0E+05
6-2j 13.04544 1.3 3.2E+04
6-2k 13.716 2.9 7.2E+04
6-2l 15.24 3.4 8.6E+04
6-2m 17.49552 9.8 2.5E+05
6-2n 18.288 5.0 1.2E+05
Biomass determined by measuring phospholipid fatty acid (PLFA) in soil samples.1
Based on the assumption that 1 pmole of PLFA is equivalent to 2.5 × 10 cells of a typical2 4
subsurface bacterium (Balkwill et al. 1988).

Chapter 4 Integration of Biomarkers Data into the Model 3DFATMIC 31
Table 11Sample Location of Biomass for L1 Site, JAAP
Sample Depth, m Biomass, pmol PLFA/g1
S3T1VP1 0.23 13395
S3T1VP2 0.99 730
S3T1VP3 1.95 138
S3T1VP4 2.82 21
S3T1VP5 4.33 56
S3T1VP6 14.9 54
S4T1VP2 0.23 15245
S4T1VP3 1.14 1167
S4T1VP4 1.78 258
S4T1VP5 2.39 ns
S4T1VP6 3.14 78
S4T1VP7 5.58 80
S5T1VP2 0.23 ns
S5T1VP3 0.87 47
S5T1VP4 1.54 51
S5T1VP5 2.66 62
S5T1VP6 3.38 29
ns = Not significant.1
from other biomarker data, conclusions about effects of biomass on hydro-geology and fate and transport of explosives. In short, the objective of this taskwas to numerically simulate and predict the effects of microbial biomass ongroundwater hydrology and fate and transport of TNT and RDX at LAAP andJAAP.
Code Description
3DFATMIC can be used to investigate saturated-unsaturated flow, contami-nant transport, combined flow and transport, and the fate and transport ofmicrobes and chemicals in the groundwater environment. The special advantagesof 3DFATMIC are flexibility and versatility in modeling a wide range ofproblems. This model can be used for the following conditions and simulations:(a) heterogeneous and anisotropic media consisting of as many geologic forma-tions as desired; (b) both spatially distributed and point sources/sinks that arespatially and temporally dependent; (c) the prescribed initial conditions by input
Gour-Tsyh (George) Yeh, Jing-Ru Cheng, M. Zakikhani, and J. C. Pennington. (1988). 1
“POP3DMIC: Users manual of pre- or post-processor for 3DFATMIC (3DFATMIC: user’s manualof a three-dimensional subsurface flow, fate and transport of microbes and chemical version 1.0)using GMS version 2.1 (Groundwater Modeling Systems),” U. S. Army Engineer WaterwaysExperiment Station, Vicksburg, MS (unpublished).
32Chapter 4 Integration of Biomarkers Data into the Model 3DFATMIC
or by simulating a steady state version of the system under consideration; (d) theprescribed transient concentration over Dirichlet nodes; (e) time-dependentfluxes over Neumann nodes; (f) time-dependent total fluxes over Cauchy nodes;(g) variable boundary conditions of evaporation, infiltration, or seepage on thesoil-air interface for the flow module and variable boundary conditions of inflowand outflow for the transport module automatically; (h) two options of treatingthe mass matrix, consistent and lumping; (i) three options (exact relaxation,under- and over-relaxation) for estimating the nonlinear matrix; (j) automatictime-step size reset when boundary conditions or sources/ sinks change abruptly;(k) Galerkin weighting or upstream weighting for the advection term in thetransport module; (l) mass balance checking over the entire region for everytime-step; and (m) possibility of modifying the code for different field situations.
3DFATMIC requires extensive data input parameters. To facilitate datainputting, Pennsylvania State University has developed a program to link1
3DFATMIC to the DoD GMS for the U.S. Army Engineer WaterwaysExperiment Station. The linkage program provides a user friendly pre- andpostprocessing program for inputting numerous data parameters into3DFATMIC.
For the transport module, concentrations of the following seven componentsare included: substrate, oxygen, nitrate, nutrient, microbe 1 with aerobicrespiration, microbe 2 with anaerobic respiration, and microbe 3 with bothaerobic and anaerobic respiration. When oxygen and nitrate are present, thechemical reactions are processed by reducing oxygen or nitrate. Therefore,oxygen and nitrate act as electron acceptors. Processes including advection,dispersion, diffusion, chemical transformation, and biodegradation are modeled.
For transport simulations, the bulk density, the longitudinal and transversedispersivities, the tortuosity, the chemical transformations rate, and the distri-bution coefficient in each material must be provided. The kinetic parametersregarding microbial-chemical reactions are needed for the calculation of bio-degradation. Among these parameters, the growth rate changes significantlywith temperature and may be specified as a function of temperature.
Application
Two significant problems were encountered in applying 3DFATMIC to thebiomass data from LAAP and JAAP. First, 3DFATMIC requires more extensivedata than were available from the two sites (Tables 10 and 11; Figures 8 and 9).
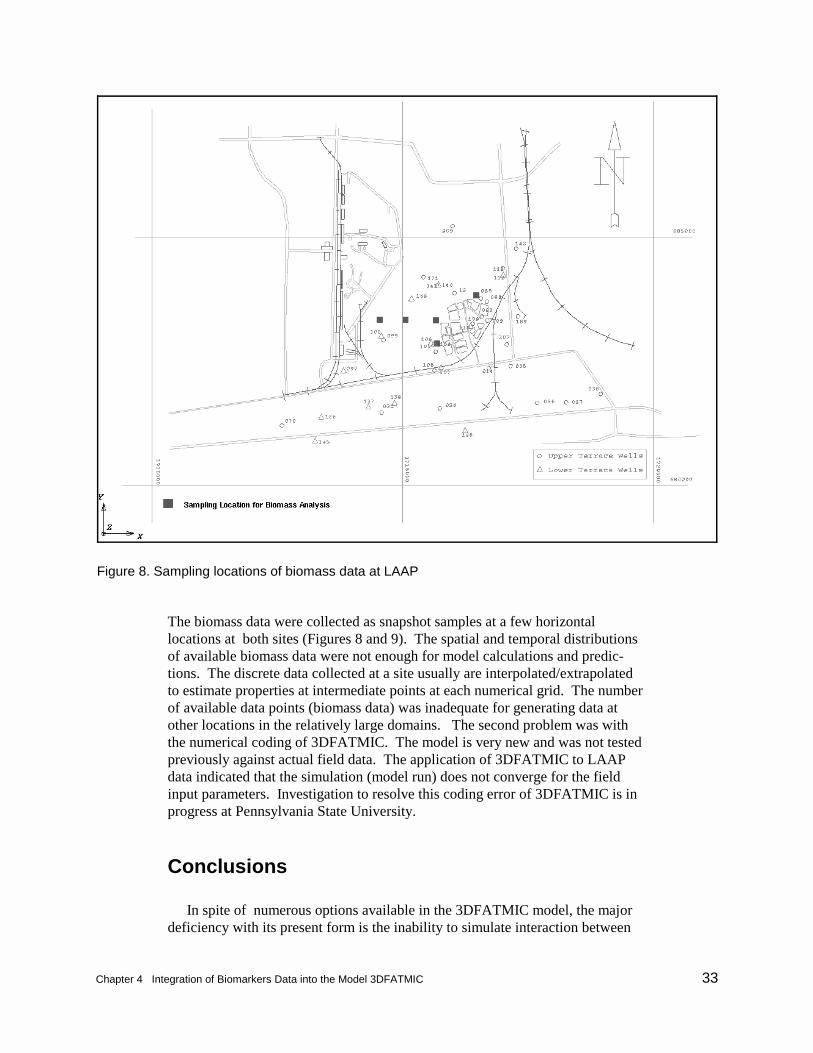
Chapter 4 Integration of Biomarkers Data into the Model 3DFATMIC 33
Figure 8. Sampling locations of biomass data at LAAP
The biomass data were collected as snapshot samples at a few horizontallocations at both sites (Figures 8 and 9). The spatial and temporal distributionsof available biomass data were not enough for model calculations and predic-tions. The discrete data collected at a site usually are interpolated/extrapolatedto estimate properties at intermediate points at each numerical grid. The numberof available data points (biomass data) was inadequate for generating data atother locations in the relatively large domains. The second problem was withthe numerical coding of 3DFATMIC. The model is very new and was not testedpreviously against actual field data. The application of 3DFATMIC to LAAPdata indicated that the simulation (model run) does not converge for the fieldinput parameters. Investigation to resolve this coding error of 3DFATMIC is inprogress at Pennsylvania State University.
Conclusions
In spite of numerous options available in the 3DFATMIC model, the majordeficiency with its present form is the inability to simulate interaction between
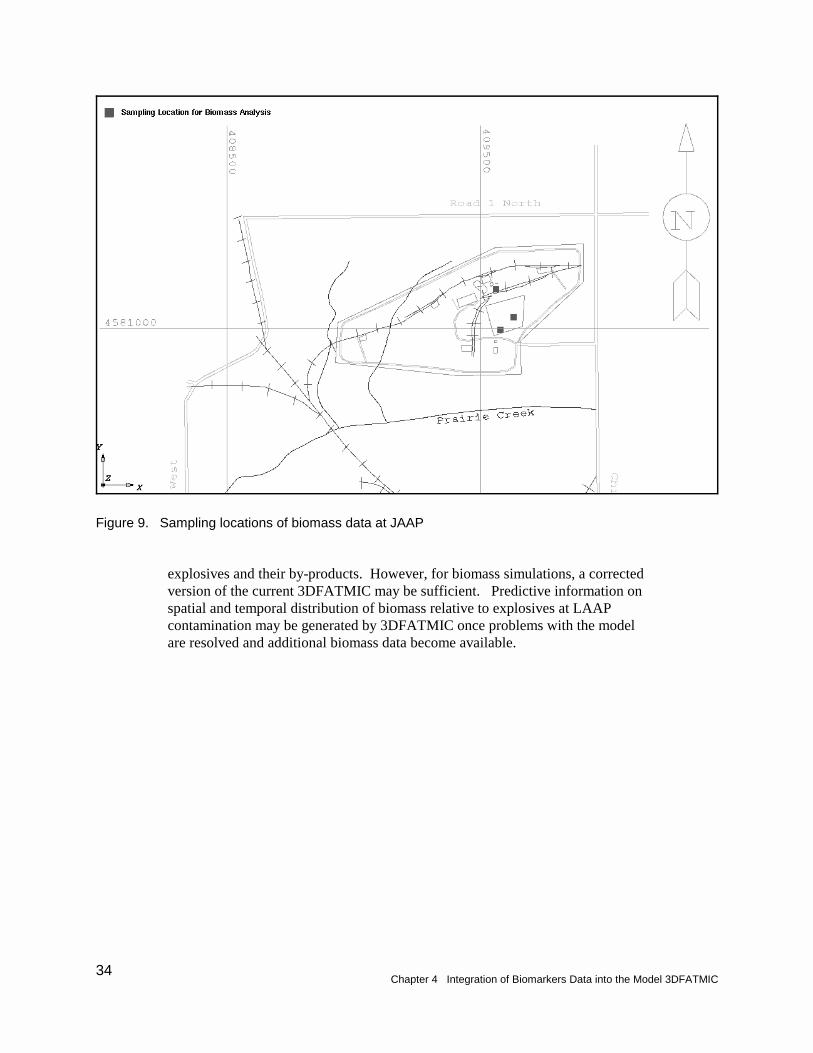
34Chapter 4 Integration of Biomarkers Data into the Model 3DFATMIC
Figure 9. Sampling locations of biomass data at JAAP
explosives and their by-products. However, for biomass simulations, a correctedversion of the current 3DFATMIC may be sufficient. Predictive information onspatial and temporal distribution of biomass relative to explosives at LAAPcontamination may be generated by 3DFATMIC once problems with the modelare resolved and additional biomass data become available.
Chapter 4 Integration of Biomarkers Data into the Model 3DFATMIC 35
5 Conclusions
Changes in stable isotope ratios for carbon in soil organic matter were toosmall to detect and relate to changes in TNT concentration. Therefore, thisapproach is not feasible for monitoring natural attenuation of TNT. However,changes in stable isotope ratios for nitrogen in TNT found in groundwater weredetected across the contaminant plume at LAAP. Monitoring natural attenuationwith nitrogen stable isotope ratios may be feasible once the rate and magnitudeof isotope changes are related quantitatively to TNT attenuation rates.
The significant negative correlation between TNT concentration and viablebiomass in LAAP aquifer soils could not be related to toxicity of TNT to theindigenous microflora. Toxicity assays were restricted to vertical profilesamples from only one location. At this site, toxicity was generally lower thanthose observed at JAAP.
To enhance the usefulness of biomarker data, a new groundwater model,3DFATMIC, was applied to microbial biomass data from LAAP. The modelwas designed to simulate spatial and temporal distribution of biomass in thecontext of hydrogeology and fate and transport of the contaminant. Due to thelimited size of the available data set and a problem with the numerical code,3DFATMIC was unsuccessful with the LAAP biomass data at this stage of themodel development. Predictive simulations may be generated by the model oncethe problems with the model are resolved and additional biomass data becomeavailable. Perhaps this will be possible as LAAP continues to monitor the site.
36References
References
Balesdent, J., and Marlotti, A. (1987). “Natural C abundances as a tracer forstudies of inorganic matter dynamics,” Soil Biology and Biochemistry 19, 25-30.
Balesdent, J., and Wagner, G. H. (1988). “Soil organic matter in long-term fieldexperiments as revealed by carbon-13 natural abundance,” Soil ScienceSociety of America Journal 52, 591-594.
Balkwill, D. L., Leack, F. R., Wilson, J. T., McNabb, J. F., and White, D. C.(1988). “Equivalence of microbial biomass measures based on membranelipid and cell wall components, adenosine triphosphate, and direct counts insubsurface aquifer sediments,” Microbial Ecology 16, 73-84.
Baveye, P., and Valocchi, A. (1989). “An evaluation of mathematical models ofthe transport of biology reacting solutes in saturated soils and aquifers,”Water Resources Research 25(6), 1413-1421.
Blair, N., Leu, A., Munoz, E., Olsen, J., Kwong, E., and DesMarais, D. (1985).“Carbon isotopic fractionation in heterotrophic microbial metabolism,”Annals of Environmental Microbiology 50, 996-1001.
Borden, R. C., and Bedient, P. B. (1986). “Transport of dissolved hydrocarbonsinfluenced by oxygen-limited biodegradation; 1, Theoretical development,” Water Resources Research 22(13), 1973-1982.
Boutton, T. W., Harrison, A. T., and Smith, B. N. (1980). “Distribution ofbiomass of species differing in photosynthetic pathways along an altitudinaltransect in a southeastern Wyoming grassland,” Oceologia 45, 287-298.
Brigham Young University. (1996). “The Department of Defense GroundwaterModeling System, GMS v2.0, Reference Manual.” Brigham YoungUniversity, Engineering Computer Graphics Laboratory, Provo, UT.
References 37
Chen, Jing-Ru C. (1995). “Numerical modeling of three-dimensionalsubsurface flow, heat transfer, and fate and transport of chemicals andmicrobes,” Ph.D. Dissertation, Pennsylvania State University, State College,PA.
Cifuentes, L. A., Coffin, R. B., Solorzano, L., Cardenas, W., Espinoza, J., andTwilley, R. (1996a). “Isotopic and elemental variations of carbon andnitrogen in a mangrove estuary,” Estuarine Coastal Shelf Science 43, 781-790.
Cifuentes, L. A., Coffin, R. B., Downer, R., Kelley, C. A., Roelke, L. A., Salata,G. G., and Trust, B. A. (1996b). “Stable isotope measurements of dissolvedinorganic carbon and soil gases at two bioremediation sites,” In situbioremediation and efficacy monitoring. B. J. Spargo, ed., NRL/PU/6115 -96-317, Naval Research Laboratory, Washington, DC.
Coffin, R. B. (1989). “Bacterial uptake of peptides and proteins in the DelawareEstuary,” Limnology and Oceanography 34, 531-542.
Coffin, R. B., Cifuentes, L. A., and Elderidge, P. M. (1994). “The use of stablecarbon isotopes to study microbial processes in estuaries.” Stable isotopes inecology and environmental sciences. K. Lajtha and R. Michener, eds.,Blackwell Scientific Publishers, Boston.
Coffin, R. B., Velinsky, D., Devereux, R., Price, W. A., and Cifuentes, L. (1990). “Stable carbon isotope analysis of nucleic acids to trace sources ofdissolved substrate used by estuarine bacteria,” Applied and EnvironmentalMicrobiology 56, 2012-2020.
Craig, H. (1957). “Isotopic standards for carbon and oxygen and correctionfactors for mass spectrometric analysis of carbon dioxide,” Geochimicaet Cosmichemica Acta 12, 133-149.
Faure, G. (1986). Principles of isotope geology. John Wiley, New York, 16-40.
Federle, T. W., Dobbins, D. C., Thornton-Manning, J. R., and Jones, D. D. (1986). “Microbial biomass, activity, and community structure in subsurfacesoils,” Groundwater 24, 365-374.
Freeman, K. H., and Hayes, J. M. (1992). “Fractionation of carbon isotopes byphytoplankton and estimates of ancient C0 levels,” Global Biogeochemical2
Cycles 6(2), 185-199.
Friedman, I., and O’Neil, J. R. (1977). “Compilation of stable isotopefractionation factors of geochemical interest,” USGS Professional Paper440-KK, U.S. Geological Survey, Reston, VA, 1-12.
38References
Ghirardini, A. V., Ghetti, P. F., Leo, V. D., and Pantini, C. (1998). “Microtoxsolid-phase bioassay toxicity assessment,” Verh. Interna. Verein. Limnol. 26,2393-2397.
Grant, C. L., Jenkins, T. F., and Golden, S. M. (1993). “Experimentalassessment of analytical holding times for nitroaromatic and nitramineexplosives in soil,” CRREL Special Report 93-11, U.S. Army Cold RegionsResearch and Engineering Laboratory, Hanover, NH.
Hoch, M. P., Fogel, M. L., and Kirchman, D. L. (1992). “Isotope fractionationassociated with ammonium uptake by a marine bacterium,” Limnology andOceanography 37, 1447-1459.
Hoch, M. P., Snyder, R. A., Cifuentes, L. A., and Coffin, R. B. (1996). “Stableisotope dynamics of nitrogen recycled during interactions between marinebacteria and protists,” Marine Ecology Progress Series 132, 229-239.
Hoefs, J. (1987). Stable isotope geochemistry. Springer-Verlag, Berlin, 1-36,82.
Jandel. (1995). SigmaStat Statistical Software user’s manual, JandelCorporation, San Rafael, CA.
Jenkins, T. F., and Grant, C. L. (1987). “Comparison of extraction techniquesfor munitions residues in soil,” Analytical Chemistry 59, 1326-1331.
Jenkins, T. F., and Leggett, D. C. (1985). “Comparison of extraction techniquesand solvents for explosive residues in soil,” CRREL Special Report 85-22,U.S. Army Cold Regions Research and Engineering Laboratory, Hanover,NH.
Kelley, C. A., Trust, B. A., and Coffin, R. B. “Tracing BTEX sources andtransport in contaminated groundwater environments with GC/IRMS/ITMS”(in preparation), Environmental Science and Technology.
Lajtha, K., and Michener, R., eds. (1994). Stable isotopes in ecology andenvironmental sciences. Blackwell Scientific Publishers, Boston, MA.
Macko, S. A. (1981). “Stable nitrogen isotope ratios as tracers of organicgeochemical processes,” Ph.D. Dissertation, University of Texas at Austin,Austin, TX, 181 pp.
McClave, J. T., and Dietrich, F. H. (1982). Statistics. 2nd ed., Dellen,San Francisco, CA.
O'Brien, B. J., and Stout, J. D. (1978). “Movement and turnover of soil organicmatter as indicated by carbon isotope measurements,” Soil Biology andBiochemistry 10, 309-317.
References 39
O’Malley, V. P., Abrajano, T. A., Jr., and Hellou, J. (1994). “Determination ofthe 13C/12C ratios of individual PAH from environmental samples: CanPAH sources be apportioned?” Organics Geochemistry 21, 809-822.
Pelz, O., Cifuentes, L. A., Kelley, C. A., Trust, B. A., and Coffin, R. B. “Tracingthe assimilation of organic compounds using C analysis of unique amino13
acids in the bacterial cell wall,” (in preparation), Federation of EuropeanMicrobiological Societies, Elsevier Science, Amsterdam, The Netherlands.
Pennington, J. C., Zakikhani, M., and Harrelson, D. W. (1999). “Monitorednatural attenuation of explosives in groundwater - Environmental SecurityTechnology Certification Program completion report,” Technical ReportEL-99-7 , U.S. Army Engineer Waterways Experiment Station, Vicksburg,MS.
Pennington, J. C., Myers, T. E., Davis, W. M., Olin, T. J., McDonald, T. A.,Townsend, D. M. (1995). “Impacts of sorption on in situ bioremediation ofexplosives-contaminated soils,” Technical Report IRRP-95-1, U.S. ArmyEngineer Waterways Experiment Station, Vicksburg, MS.
Pennington, J. C., Honeycutt, M. E., Li, A. Z., Thorne, P. G., Felt, D. R.,Allersmeier, C. H., Jarvis, A. S., Marx, K. A., Leggett, D. C., Hayes, C. A.,McFarland, V. A., Walker, J., Porter, B. E., Kaplan, D. L., Gunnison, D.,Fredrickson, H., and Thorn, K. A. (1997). “Explosives conjugation productsin remediation matrices,” Technical Report SERDP-97-7, U.S. ArmyEngineer Waterways Experiment Station, Vicksburg, MS.
Pennington, J. C., Harrelson, D. W., Zakikhani, M., Gunnison, D., Hayes, C. A.,Clarke, J. U., Perkins, E., Ringelberg, D., McGrath, C. J., Fredrickson, H.,and May, J. H. (1998a). “Feasibility of using natural attenuation as aremedial alternative for explosives-contaminated groundwater at Site L1,Joliet Army Ammunition Plant, Joliet, Illinois,” Technical Report EL-98-8,U.S. Army Engineer Waterways Experiment Station, Vicksburg, MS.
Pennington, J. C., Thorn, K. A., Gunnison, D., McFarland, V. A., Thorne, P. G.,Inouye, L. S., Fredrickson, H., Leggett, D. C., Ringleberg, D., Jarvis, A. S.,Felt, D. R., Lutz, C. H., Hayes, C. A., Clarke, J. U., Richmond, M., O’Neal,B., and Porter, B. E. (1998b). “Explosives conjugation products inremediation matrices: Interim Report 2,” Technical Report SERDP-98-12,U.S. Army Engineer Waterways Experiment Station, Vicksburg, MS.
Pennington, J. C., Bowen, R., Brannon, J. M., Gunnison, D., Harrelson, D. W.,Zakikhani, M., Clarke, J., Jenkins, T. F., Mahannah, J., and Gnewuch, S.(1999a). “Draft protocol for evaluating, selecting, and implementingmonitored natural attenuation at explosives-contaminated sites” (in prepara-tion), U.S. Army Engineer Waterways Experiment Station, Vicksburg, MS.
40References
Pennington, J. C., Gunnison, D., Harrelson, D. W., Brannon, J. M., Zakikhani,M., Clarke, J. U., Fredrickson, H., Myers, T., Jenkins, T. F., Perkins, E.,Hayes, C. A., Ringelberg, D., and Townsend, D. M. (1999b). “Naturalattenuation of explosives in soil and water systems at Department of Defensesites: Interim report,” Technical Report EL-99-8, U.S. Army EngineerWaterways Experiment Station, Vicksburg, MS.
Pennington, J. C., Zakikhani, M., Harrelson, D. W., and Allen, D. S. (1999c).“Monitored natural attenuation of explosives in groundwater: Cost andperformance” (in preparation), U.S. Army Engineer Waterways ExperimentStation, Vicksburg, MS.
Peterson, B. J., and Fry, B. (1987). “Stable isotopes in ecosystem studies,”Annual of Review of Ecological Systems 18, 293-320.
Peterson, B. J., Howarth, R. W., and Garritt, R. H. (1985). “Multiple stableisotopes used to trace the flow of organic matter in estuarine food webs,”Science 277, 1361-1363.
Reardon, E. J., Allison, G. B., and Fritz, P. (1979). “Seasonal chemical andisotopic variations of soil C0 at Trout Creek, Ontario,” Journal of Hydrology2
43, 355-371.
Simini, M., Wentsel, R. S., Checkai, R. T., Phillips, T., Chester, N. A., Major,M. A., and Amos, J. C. (1995). “Evaluation of soil toxicity at Joliet ArmyAmmunition Plant,” Environmental Toxicology and Chemistry 14, 623-630.
Stahl, W. J. (1980). “Compositional changes and C/ C fractionations during13 12
the degradation of hydrocarbons by bacteria,” Geochimica et CosmichimicaActa 44, 1903-1907.
Thorn, K. A. (1997). “Covalent binding of the reductive degradation products ofTNT to humic substances examined by 15N NMR,” 213th AmericanChemical Society National Meeting, San Francisco, CA, April 13-17, 1997. Washington, DC, 37(1), 305-306.
Trust, B. A., Kelley, C. A., Coffin, R. B., Cifuentes, L. A., and Mueller, J. “ C 13
values of polycyclic aromatic hydrocarbon collected from two creosote-contaminated sites” (in preparation), Chem. Geol. (Isotope Geoscience).
U.S. Environmental Protection Agency. (1987). “3DFATMIC, Three-dimensionalsubsurface flow, fate and transport of microbes and chemicals model user’smanual version 1.0,” EPA/600/R-97/053, U.S. Environmental ProtectionAgency, Office of Research and Development, Washington, DC.
References 41
U.S. Environmental Protection Agency. (1998). “Method 8330: Nitroaromaticsand nitramines by high performance liquid chromatography (HPLC),”SW 846 On-line Test Methods for Evaluating Solid Waste Physical/ChemicalMethods, Office of Solid Waste and Emergency Response, Washington, DC. http://www.epa.gov:80/epaoswer/hazwaste/test/8330.pdf (June 29, 1998).
U.S. Environmental Protection Agency. (1999). “Use of monitored naturalattenuation at Superfund, RCRA corrective action, and underground storagetank sites,” Directive 9200.4-17P, April 21, 1999, Office of Solid Waste andEmergency Response, Washington, DC. http://www.epa.gov/swerust1/directiv/#9200.
Van de Velde, K. D., Marley, M. C., Studer, J., Wagner, D. M. (1995). “Stablecarbon isotope analysis to verify bioremediation and bioattenuation.” Monitoring and verification of bioremediation, Third International In Situand On-Site Bioreclamation Symposium. R. E. Hinchee, G. S. Douglas, andS. K. Ong, eds., Battelle Press, Columbus, OH, 3(5), 241-257.
Watson, J. T. (1985). Introduction to mass spectrometry. Raven Press,New York.
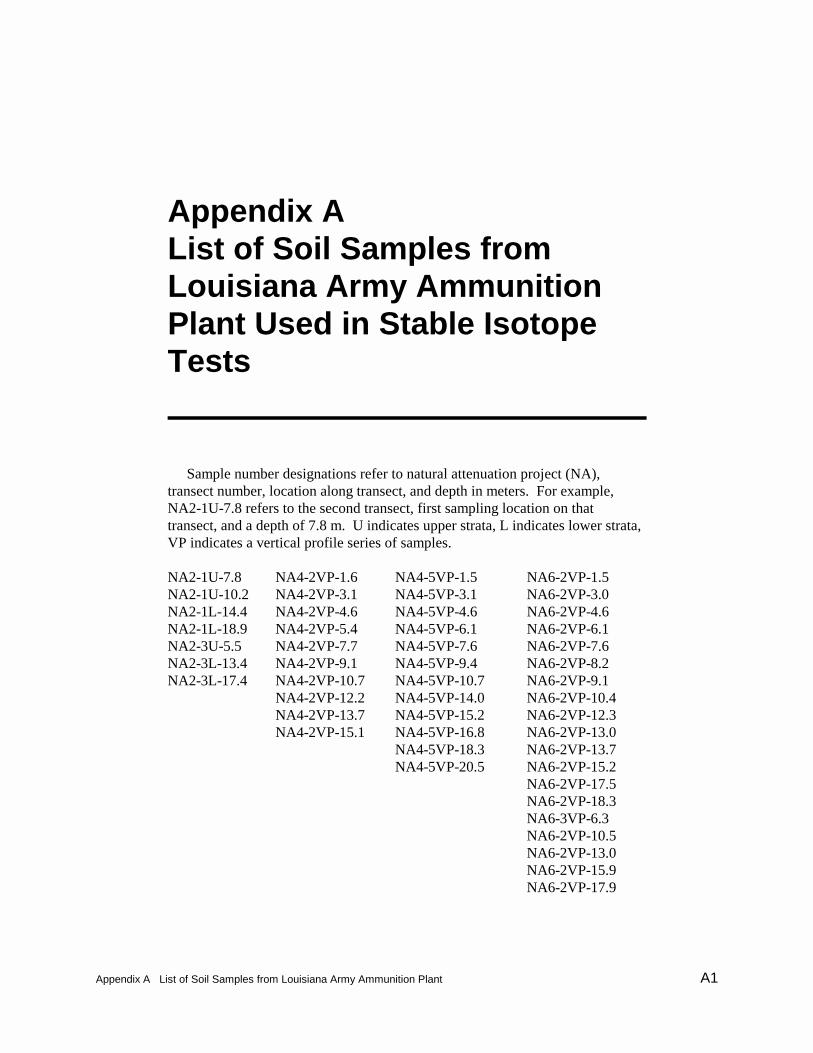
Appendix A List of Soil Samples from Louisiana Army Ammunition Plant A1
Appendix AList of Soil Samples fromLouisiana Army AmmunitionPlant Used in Stable IsotopeTests
Sample number designations refer to natural attenuation project (NA),transect number, location along transect, and depth in meters. For example,NA2-1U-7.8 refers to the second transect, first sampling location on thattransect, and a depth of 7.8 m. U indicates upper strata, L indicates lower strata,VP indicates a vertical profile series of samples.
NA2-1U-7.8 NA4-2VP-1.6 NA4-5VP-1.5 NA6-2VP-1.5NA2-1U-10.2 NA4-2VP-3.1 NA4-5VP-3.1 NA6-2VP-3.0NA2-1L-14.4 NA4-2VP-4.6 NA4-5VP-4.6 NA6-2VP-4.6NA2-1L-18.9 NA4-2VP-5.4 NA4-5VP-6.1 NA6-2VP-6.1NA2-3U-5.5 NA4-2VP-7.7 NA4-5VP-7.6 NA6-2VP-7.6NA2-3L-13.4 NA4-2VP-9.1 NA4-5VP-9.4 NA6-2VP-8.2NA2-3L-17.4 NA4-2VP-10.7 NA4-5VP-10.7 NA6-2VP-9.1
NA4-2VP-12.2 NA4-5VP-14.0 NA6-2VP-10.4NA4-2VP-13.7 NA4-5VP-15.2 NA6-2VP-12.3NA4-2VP-15.1 NA4-5VP-16.8 NA6-2VP-13.0
NA4-5VP-18.3 NA6-2VP-13.7NA4-5VP-20.5 NA6-2VP-15.2
NA6-2VP-17.5NA6-2VP-18.3NA6-3VP-6.3NA6-2VP-10.5NA6-2VP-13.0NA6-2VP-15.9NA6-2VP-17.9
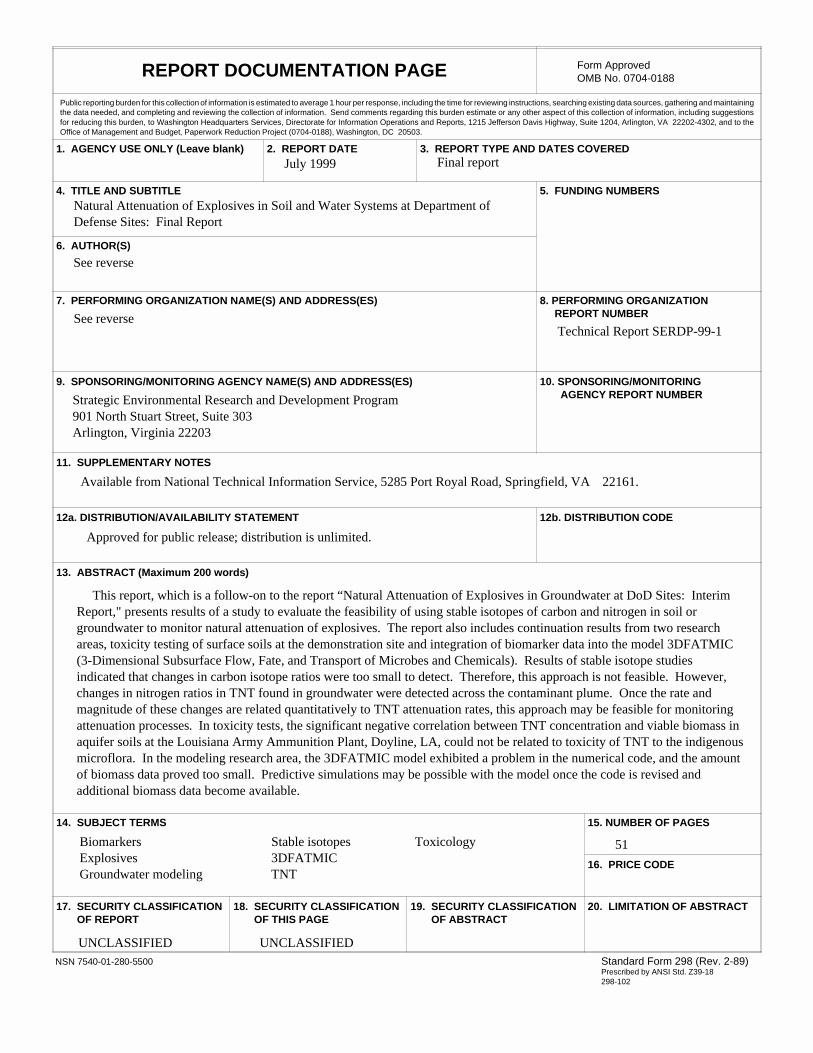
REPORT DOCUMENTATION PAGE Form ApprovedOMB No. 0704-0188
Public reporting burden for this collection of information is estimated to average 1 hour per response, including the time for reviewing instructions, searching existing data sources, gathering and maintainingthe data needed, and completing and reviewing the collection of information. Send comments regarding this burden estimate or any other aspect of this collection of information, including suggestionsfor reducing this burden, to Washington Headquarters Services, Directorate for Information Operations and Reports, 1215 Jefferson Davis Highway, Suite 1204, Arlington, VA 22202-4302, and to theOffice of Management and Budget, Paperwork Reduction Project (0704-0188), Washington, DC 20503.
1. AGENCY USE ONLY (Leave blank) 2. REPORT DATE 3. REPORT TYPE AND DATES COVERED
4. TITLE AND SUBTITLE 5. FUNDING NUMBERS
6. AUTHOR(S)
7. PERFORMING ORGANIZATION NAME(S) AND ADDRESS(ES) 8. PERFORMING ORGANIZATIONREPORT NUMBER
9. SPONSORING/MONITORING AGENCY NAME(S) AND ADDRESS(ES) 10. SPONSORING/MONITORINGAGENCY REPORT NUMBER
11. SUPPLEMENTARY NOTES
12a. DISTRIBUTION/AVAILABILITY STATEMENT 12b. DISTRIBUTION CODE
13. ABSTRACT (Maximum 200 words)
14. SUBJECT TERMS 15. NUMBER OF PAGES
16. PRICE CODE
17. SECURITY CLASSIFICATIONOF REPORT
18. SECURITY CLASSIFICATIONOF THIS PAGE
19. SECURITY CLASSIFICATIONOF ABSTRACT
20. LIMITATION OF ABSTRACT
NSN 7540-01-280-5500 Standard Form 298 (Rev. 2-89)Prescribed by ANSI Std. Z39-18298-102
July 1999 Final report
Natural Attenuation of Explosives in Soil and Water Systems at Department ofDefense Sites: Final Report
See reverse
See reverseTechnical Report SERDP-99-1
Strategic Environmental Research and Development Program901 North Stuart Street, Suite 303Arlington, Virginia 22203
Available from National Technical Information Service, 5285 Port Royal Road, Springfield, VA 22161.
Approved for public release; distribution is unlimited.
Biomarkers Stable isotopes ToxicologyExplosives 3DFATMICGroundwater modeling TNT
51
UNCLASSIFIED UNCLASSIFIED
This report, which is a follow-on to the report “Natural Attenuation of Explosives in Groundwater at DoD Sites: InterimReport," presents results of a study to evaluate the feasibility of using stable isotopes of carbon and nitrogen in soil orgroundwater to monitor natural attenuation of explosives. The report also includes continuation results from two researchareas, toxicity testing of surface soils at the demonstration site and integration of biomarker data into the model 3DFATMIC(3-Dimensional Subsurface Flow, Fate, and Transport of Microbes and Chemicals). Results of stable isotope studiesindicated that changes in carbon isotope ratios were too small to detect. Therefore, this approach is not feasible. However,changes in nitrogen ratios in TNT found in groundwater were detected across the contaminant plume. Once the rate andmagnitude of these changes are related quantitatively to TNT attenuation rates, this approach may be feasible for monitoringattenuation processes. In toxicity tests, the significant negative correlation between TNT concentration and viable biomass inaquifer soils at the Louisiana Army Ammunition Plant, Doyline, LA, could not be related to toxicity of TNT to the indigenousmicroflora. In the modeling research area, the 3DFATMIC model exhibited a problem in the numerical code, and the amountof biomass data proved too small. Predictive simulations may be possible with the model once the code is revised andadditional biomass data become available.

Judith C. Pennington, Paul H. Miyares, David B. Ringelberg, Mansour Zakikhani, C. Michael Reynolds,Debra Felt, Richard B. Coffin, Douglas Gunnison, Luis Cifuentes, Herbert L. Fredrickson, Thomas F. Jenkins
Block 7. (Continued).
U.S. Army Engineer Waterways Experiment Station,3909 Halls Ferry Road, Vicksburg, MS 39180-6199;U.S. Army Cold Regions Research and Engineering Laboratory72 Lyme Road, Hanover, NH 03755-1290;Naval Research Laboratory, 4555 Overlook Avenue, SW. Washington, DC 20375;Department of Chemistry, Texas A&M University, College Station, TX 77843;AScI Corporation, 1375 Beverly Road, McLean, VA 22101
Block 6. (Continued).

Destroy this report when no longer needed. Do not return it to the originator.
Copyright © 2022 FDOKUMEN