Natural and anthropogenic factors of flood hazards in the Somma-Vesuvius area (Italy) / Rôle des...
15
Madame Lina Davoli Madame Paola Fredi Monsieur Filippo Russo Monsieur Alessandro Troccoli Natural and anthropogenic factors of flood hazards in the Somma-Vesuvius area (Italy) / Rôle des facteurs naturels et anthropiques sur les risques d'inondation autour du Vésuve- Somma (Italie) In: Géomorphologie : relief, processus, environnement. Juillet-septembre, vol. 7, n°3. pp. 195-207. Citer ce document / Cite this document : Davoli Lina, Fredi Paola, Russo Filippo, Troccoli Alessandro. Natural and anthropogenic factors of flood hazards in the Somma- Vesuvius area (Italy) / Rôle des facteurs naturels et anthropiques sur les risques d'inondation autour du Vésuve-Somma (Italie). In: Géomorphologie : relief, processus, environnement. Juillet-septembre, vol. 7, n°3. pp. 195-207. doi : 10.3406/morfo.2001.1102 http://www.persee.fr/web/revues/home/prescript/article/morfo_1266-5304_2001_num_7_3_1102
-
Upload
independent -
Category
Documents
-
view
4 -
download
0
Transcript of Natural and anthropogenic factors of flood hazards in the Somma-Vesuvius area (Italy) / Rôle des...

Madame Lina DavoliMadame Paola FrediMonsieur Filippo RussoMonsieur Alessandro Troccoli
Natural and anthropogenic factors of flood hazards in theSomma-Vesuvius area (Italy) / Rôle des facteurs naturels etanthropiques sur les risques d'inondation autour du Vésuve-Somma (Italie)In: Géomorphologie : relief, processus, environnement. Juillet-septembre, vol. 7, n°3. pp. 195-207.
Citer ce document / Cite this document :
Davoli Lina, Fredi Paola, Russo Filippo, Troccoli Alessandro. Natural and anthropogenic factors of flood hazards in the Somma-Vesuvius area (Italy) / Rôle des facteurs naturels et anthropiques sur les risques d'inondation autour du Vésuve-Somma (Italie).In: Géomorphologie : relief, processus, environnement. Juillet-septembre, vol. 7, n°3. pp. 195-207.
doi : 10.3406/morfo.2001.1102
http://www.persee.fr/web/revues/home/prescript/article/morfo_1266-5304_2001_num_7_3_1102

AbstractAbstract Geomorphological hazards and risks in the Somma-Vesuvius area are not exclusively tied tothe volcanic and seismic events, but also to flood events. Historical records show that floods are veryfrequent on the Vesuvius slopes and climatic data indicate that they are triggered by precipitation eventsof about 45-70 mm in two days or 74 in three days, which take place usually every 1 to 3 years. Dataavailable show that floods on the Somma slopes are less frequent and they occur after precipitationevents of about 200 mm in three days. These events have recurrence intervals longer than 30 years.The high amplitude of relief and the lack of dense and organised drainage systems are the mostimportant natural factors of flood hazards. Nevertheless, anthropogenic factors play the primary role.Population growth and intense urbanisation affected mainly the piedmont catchments of the Vesuviussouthern slopes. The subsequent deforestation, the land reclamation practices and the spreadplacement of impermeable covers deeply modified surface runoff and enhanced flood hazards.
RésuméRésumé Les aléas et les risques géomorphologiques dans la région du Vésuve-Somma ne sont pasexclusivement liés aux événements volcaniques et sismiques, mais aussi aux inondations. Les archiveshistoriques révèlent que ces dernières sont très fréquentes sur les pentes du Vésuve ; les donnéesclimatiques indiquent qu'elles sont déclenchées par des précipitations d'environ 45-70 mm en deuxjours ou 74 mm en trois jours, dont la période de retour est d'une à trois années. Sur les flancs duSomma, les inondations sont moins fréquentes que sur les pentes du Vésuve et se produisent à la suitede précipitations de 200 mm en trois jours dont la récurrence excède 30 ans. La vigueur du reliefvolcanique, les dénivellations et l'absence d'un système de drainage dense et hiérarchisé sont lesfacteurs naturels les plus favorables aux inondations. Toutefois, les facteurs anthropiques jouent un rôleprimordial. La croissance de la population et une urbanisation intensive ont caractérisé surtout lesbassins versants des piémonts méridionaux du Vésuve. La deforestation provoquée par l'urbanisation,les modalités de la récupération des terres agricoles et l'accroissement des surfaces imperméabiliséesont considérablement modifié la capacité de ruissellement de surface et ont donc accru les risquesd'inondation.

Géomorphologie : relief, processus, environnement, 2001, n° 3, p. 195-208
Natural and anthropogenic factors of flood hazards in the
Somma-Vesuvius area (Italy)
Rôle des facteurs naturels et anthropiques sur les risques
d'inondation autour du Vésuve-Somma (Italie)
Lina Davoli*, Paola Fredi*, Filippo Russo** & Alessandro Troccoli*
Abstract Geomorphological hazards and risks in the Somma-Vesuvius area are not exclusively tied to the volcanic and seismic events, but also to flood events. Historical records show that floods are very frequent on the Vesuvius slopes and climatic data indicate that they are triggered by precipitation events of about 45-70 mm in two days or 74 in three days, which take place usually every 1 to 3 years. Data available show that floods on the Somma slopes are less frequent and they occur after precipitation events of about 200 mm in three days. These events have recurrence intervals longer than 30 years. The high amplitude of relief and the lack of dense and organised drainage systems are the most important natural factors of flood hazards. Nevertheless, anthropogenic factors play the primary role. Population growth and intense urbanisation affected mainly the piedmont catchments of the Vesuvius southern slopes. The subsequent deforestation, the land reclamation practices and the spread placement of impermeable covers deeply modified surface runoff and enhanced flood hazards. Key words: flood hazards, natural factors, anthropogenic factors, Vesuvius, Italy.
Résumé Les aléas et les risques géomorphologiques dans la région du Vésuve-Somma ne sont pas exclusivement liés aux événements volcaniques et sismiques, mais aussi aux inondations. Les archives historiques révèlent que ces dernières sont très fréquentes sur les pentes du Vésuve ; les données climatiques indiquent qu'elles sont déclenchées par des précipitations d'environ 45-70 mm en deux jours ou 74 mm en trois jours, dont la période de retour est d'une à trois années. Sur les flancs du Somma, les inondations sont moins fréquentes que sur les pentes du Vésuve et se produisent à la suite de précipitations de 200 mm en trois jours dont la récurrence excède 30 ans. La vigueur du relief volcanique, les dénivellations et l'absence d'un système de drainage dense et hiérarchisé sont les facteurs naturels les plus favorables aux inondations. Toutefois, les facteurs anthropiques jouent un rôle primordial. La croissance de la population et une urbanisation intensive ont caractérisé surtout les bassins versants des piémonts méridionaux du Vésuve. La deforestation provoquée par l'urbanisation, les modalités de la récupération des terres agricoles et l'accroissement des surfaces imperméabilisées ont considérablement modifié la capacité de ruissellement de surface et ont donc accru les risques d'inondation. Mots clés : aléa, inondation, facteurs naturels, facteurs anthropiques, Vésuve, Italie.
Version française abrégée treuses répétées ont coûté la vie à de nombreuses victimes et entraîné beaucoup de dommages dans cette zone. La
La région du Vésuve et du Somma est caractérisée par un recherche présentée ici examine les facteurs naturels et volcanisme actif et par une densité de population élevée anthropiques les plus propices aux inondations, (environ 2500 habitants au km2); par conséquent, elle a Le volcan Somma-Vésuve s'est construit dans le secteur toujours été considérée comme une région potentielle- sud d'une dépression morpho-structurale (Plaine de Comment exposée aux éruptions volcaniques. Cependant, les panie ou graben campanien) orientée NW-SE, parallèle- archives historiques révèlent que des inondations désas- ment à la bordure tyrrhénienne de la Campanie (fig. 1). Le
* Dipartimento di Scienze délia Terra, Universita di Roma "La Sapienza", Piazzale A. Moro, S, 00185 Rome (Italy). E-mail: [email protected] ** Facoltà di Scienze Matematiche, Fisiche e Naturali, Universita del Sannio, Benevento (Italy). E-mail: [email protected]

Lina Davoli, Paola Fredi, Filippo Russo & Alessandro Troccoli
volcan actuel, centré et composite, comprend les restes d'un strato-volcan plus ancien, le Mont Somma (1132 m), et le grand cône du Vésuve (1281 m), plus jeune, qui ont été édifiés ensemble dans une caldera. L'activité complexe du volcan Somma-Vésuve a débuté au Pleistocene supérieur et a duré jusqu'en 1944. La caldera du Somma s'est formée il y a 3600 ans et le grand cône du Vésuve s'est construit à l'intérieur, probablement après l'éruption explosive de 472 AD. La figure 2 montre la répartition des principaux produits volcaniques.
Les données géomorphologiques, climatiques, hydrologiques et celles de l'occupation du sol peuvent rendre compte de certains facteurs de déclenchement des inondations. Les pentes et les dénivellations (paramètre Ar indiquant la vigueur du relief), généralement fortes, sont des facteurs importants, car ils renforcent le ruissellement et les écoulements au détriment de l'infiltration. La variabilité de la répartition spatiale du paramètre Ar est forte, mais les valeurs maxima (Ar>500) sont observées à l'amont des pentes nord du Somma ; de fortes valeurs d'Ar caractérisent également les pentes sud du Vésuve jusqu'au littoral, qui ont, du reste, subi de fréquentes inondations (fig. 3).
La longueur et le degré d'organisation des réseaux de drainage sont aussi d'importants facteurs en matière d'aléa d'inondation. Les pentes du Somma sont densément drainées (fig. 4) et les réseaux de drainage sont généralement organisés et fortement hiérarchisés ; cela entraîne un drainage plus efficace par les eaux de surface, comme l'indiquent des temps de concentration plus longs (Te excédant toujours 2 heures, fig. 5). En outre, le débit spécifique des ruisseaux des pentes du Somma n'est pas important (Qs compris entre 5.1 et 6 mVsec/km2, tab. 3), notamment parce qu'une couverture végétale dense diminue le ruissellement (fig. 6). Au contraire, les changements fréquents et marqués de la topographie des pentes du Vésuve, dus à l'activité volcanique récente, n'ont pas contribué à la hiérarchisation ni à l'efficacité des réseaux de drainage. Ainsi, le temps de concentration du drainage est plus court que sur les pentes du Somma et les débits spécifiques des ruisseaux sont plus élevés (Te en général inférieur à 2.5 heures, fig. 5, et Qs compris entre 5.6 and 13.5 m3 /sec/km2, tab. 3).
Les archives historiques montrent que les inondations sont plus fréquentes sur les pentes du Vésuve ; l'analyse des données climatiques révèle qu'elles sont déclenchées par des précipitations d'environ 45-70 mm en 2 jours ou 74 mm en 3 jours, qui surviennent annuellement ou au minimum une fois tous les 3 ans. Les inondations sur les pentes de la Somma sont moins fréquentes, car elles résultent de précipitations d'environ 200 mm, dont la récurrence excède 30 ans. L'urbanisation est probablement le facteur le plus important vis-à-vis des risques d'inondation. Celles-ci se produisent surtout sur les pentes sud qui, initialement perméables, ont été complètement imperméabilisées, ce qui a entraîné, par conséquent, une diminution importante du temps de concentration (fig. 5 et fig. 6). La situation est particulièrement critique entre Portici et Torre Annunziata à cause de la pression anthropique très forte (tab. 4 et fig. 6) ; les dernières décennies ont connu des inondations désastreuses dans cette zone,
entraînant des victimes et des dommages importants aux propriétés et aux cultures.
Introduction
The Somma- Vesuvius area is characterised by active vol- canism and density of population of about 2500 inhabitants per square kilometre; thus it has always been considered as an area highly exposed to volcanic risk. However, historical data show that during the period of volcanic quiescence, like the present which began in 1944, repeated disastrous floods, which cost much in damages and lives, have affected the study area.
People living on the volcano foothills have been aware of this problem since several centuries. Canon C. Celano in the XVIth century wrote about a disastrous flood event which struck S. Sebastiano, on the western slopes of the volcano, causing remarkable damages and the death of 24 people (Celano, 1974). In 1906, an unusual flood destroyed most of Torre del Greco, on the southwestern slopes of the Vesuvius edifice, and caused the loss of 26 lives (Accardo et al, 1981). In October 1908 a sudden flood struck the towns of S. Giorgio a Cremano, Portici and Ercolano (Russo et al. 1995). In more recent times, as several local and national news refer to, many similar events took place.
Unfortunately, historical records do not allow a precise reconstruction of flood events; however, they were repeated in time and were often triggered by moderate and short precipitation events (Catenacci, 1992). Considering this serious problem and the lack of data suitable to establish precisely the recurrence intervals of floods, this paper aims to emphasise the possible natural and anthropogenic factors which are responsible for these disastrous processes.
To this end, geomorphological, climatical, hydrological and land use studies have been carried out. The geomorphic characteristics are strongly conditioned by the volcanic history and they play an important role in making this area prone to flooding. Drainage network density and elevation differences are important factors of flood hazards; for this reason they are examined in detail by means of morphome- tric parameters. The analysis of climatic and hydrologie data focus on the possible relationships between intensity and amount of precipitation, surface running water characteristics and the occurence of the recorded floods. Finally, land use and urbanisation are examined; these are important factors of flood hazard worldwide and probably represent the most important factors of flood hazards in the study area.
Geographical, geological and volcanic setting
The Somma- Vesuvius volcanic complex covers about 158 km2; it is round-shaped with a diameter of about 15 km. It is located in the middle of the Bay of Naples, of which it constitutes the coastal cliff for a long stretch, and is bordered by the city of Naples to the NW, the Campanian plain to the NE and the plain of Samo to the SE (fig. 1). This composite central volcano is made of the remnants of an older
196 Géomorphologie : relief, processus, environnement, 2001, n° 3, p. 195-208

Flood hazards in the Somma-Vesuvius area
13°40'E 14°00' E
Fig. 1 - Geological sketch map of western side of the Campanian Apennines. 1: Quaternary volcanic and alluvial deposits; 2: Upper Miocene-Lower Pliocene eva- porite and clastic deposits; 3: Lower and Middle Miocene terrigenous deposits, 4: Meso- zoic limestones; 5: main faults (from Principe et al., 1987, simplified). Fig. 1 - Carton géologique de l'Apennin campanien occidental. 1 : dépôts volcaniques et alluviaux quaternaires ; 2 : évaporites et dépôts élastiques du Miocène supérieur-Pliocène inférieur ; 3 : dépôts terrigènes du Miocène inférieur à moyen ; 4 : calcaires mésozoïques ; 5 : failles principales (d'après Principe et al., 1987, simplifié).
strato- volcano, the Monte Somma (1132 m), and of the younger great cone of Vesuvius (1281 m), which grew up coaxial inside the caldera. Between the two volcanic edifices, on the northern and eastern sides, the intracalderic depression of " Valle del Gigante" (850 m) extends for about 3 km2 (fig. 2).
The Somma-Vesuvius complex developed in the southern sector of the NW-SE-oriented morpho-structural depression, named Campanian plain or Campania graben, which is parallel to the Tyrrhenian margin of Campania, from Monte Massico to the peninsula of Sorrento (fig. 1). The plain of Campania is an extensional basin which originated between the late Pliocene and early Pleistocene (Ortolani and Aprile, 1978; Brancaccio et al, 1991) in relation to the Tyrrhenian Sea formation. This basin was marked by a strong lowering during the Quaternary and was affected by tectonic activity responsible for the fault systems, along which the local vol- canism (Campi Flegrei and Somma-Vesuvius) took place (fig. 1). The undersaturated and K-rich products of this vol- canism are typical of Quaternary volcanoes belonging to the volcanic belt, known as Roman Comagmatic Province,
which extends from northern Lazio to as far as Calabria (Di Girolamo, 1978).
The present Somma- Vesuvius edifice was built up on the buried remnants of an ancient volcano (Paleosomma), the products of which filled the sector of the plain of Campania between the Sebeto valley and the Sarno valley (fig. 1). The growth of the present vol
canic edifice started at the end of late Pleistocene (Cinque et al, 1987; Santacroce, 1987). The most ancient deposits of the present volcano edifice outcrop about 20 km to the ENE of the volcano, close to the small town of Codola; they are plinian deposits emplaced 25 ka, as indicated by 14C dates (Alessio et al, 1974). Between 25 and 3.6 ka, the Somma- Vesuvius activity was mainly characterised by plinian eruptions and subordinately by effusive events which alternated with periods of quiescence, as suggested by thick buried soils (Rolandi, 1997). According to this author the caldera collapse could have occurred at about 3.6 ka, as a consequence of several plinian eruptions.
Anew period of the volcano activity started around 3.6 ka. It lasted until 1944 (Rolandi et al, 1998). It was characterised by four major plinian and subplinian events (3.6 ka, 79 AD, 472 AD, 1631 AD) which alternated with effusive- explosive inter-plinian episodes. During this period the southwestern sector of the caldera gradually disappeared, being either destroyed or buried under thick pyroclastic products, which generated a wide plateau. Starting from 472 AD, several inter-plinian episodes yielded lava flows and
Géomorphologie : relief, processus, environnement, 2001, n° 3, p. 195-208 197

Lina Davoli, Paola Fredi, Filippo Russo & Alessandro Troccoli
pyroclastic products which have built up on this plateau the great cone Vesuvius (Cinque et al, 1997). The most important event of this period is the plinian eruption in 79 AD, which destroyed all the Roman inhabited places, among which the famous towns of Ercolano and Pompei.
In the period between 1631 and 1944, Vesuvius was active almost continually. Scientific observations allowed to recognise the repetition of the following phases in the Vesuvius eruptive behaviour (Nazzaro, 1997): 1) solfatara activity; 2) alternating strombolian and hawaiian activity often tied to subterminal vents; 3) low energy, explosive-effusive final eruption. The final eruption was always followed by a period of quiescence lasting seven years on average, after which solfatara activity resumed (Mercalli, 1907). Eighteen eruptive cycles have been recorded between 1631 and 1944; the last cycle ended in 1944 with a paroxysmic final eruption, which is responsible for the present morphological aspect of the "Gran Cono Vesuviano" and its crater. The dis
tribution of the main volcanic products in the study area is shown in the simplified lithological sketch of figure 2.
Portici
Ercolano
-100 -) 5
Geomorphic characteristics
The volcanic history is responsible for most of the morphological aspects of the study area. On the one hand, the recent age of volcanic events allowed the preservation of many volcanic landforms, but, on the other hand, it caused fast modifications of the landscape, due to the emplacement of volcanic products which erased or buried previous morphologies (Biasini et al, 1993; Caputo et ai, 1995).
The most impressive volcanic landform is the roughly circular Somma caldera, 15 km in diameter, which covers an area of 158 km2. The caldera rim is very asymmetric, with a very steep inner slope showing, in places, scarps higher than 250 m. The southern outer slope is completely masked by the deposition of the subsequent products erupted by Vesuvius. The remnants of the ancient Somma volcano are still recognisable in the flat surface at the elevation of about 500 m asl, named Piano delle Ginestre (fig. 2).
The northern and eastern slopes of the Somma caldera are the best preserved; stream networks on these old slopes have
the highest development and degree of organisation of the whole area (Strahler, 1957). Stream valleys do not show a simple centrifugal pattern; stream piracies and headward erosion, in fact, allowed the development of amphitheatre valleys (Oilier and Brown, 1971;
Fig. 2 - Simplified Somma-Vesuvius lithological map (after Russo et al. 1995). 1: lava flows; 2: pyroclastic deposits and lava flows; 3: pyroclastic and volcanoclastic deposits; 4: reworked pyro- clastites and epiclas- tites; 5: contour line (m asl). Fig. 2 - Carte lithologique simplifiée du Vésuve et du Somma (d'après Russo et al., 1995). 1 : coulées de lave ; 2 : dépôts pyro- clastiques et coulées de lave ; 3 : dépôts pyroclastiques et volca- noclastiques ; 4 : pyro- clastites remaniées et épiclastites ; 5 : courbes de niveau (équidis- tance 100 m).
ШШШшШШШг 40°45' N 2 km
198 Géomorphologie : relief, processus, environnement, 2001, n° 3, p. 195-208
Flood hazards in the Somma-Vesuvius area
Oilier, 1988; Palacios, 1994; Davoli et al, 1999), with V-cross section on the northern slopes and U-cross section on the eastern ones. In both cases longitudinal profiles evidence, at the elevation of about 700 m asi, a break in slope which causes the formation of hanging valleys and/or the joining of numerous channels in downcutting principal streams, locally known as "valloni" or "cupe". Stream downcutting is particularly active where pyroclastic flows and fall products crop out. At elevations lower than 200 m asl the low slope gradients (about 10°) on lahar deposits allow the development of large and flat-floored valleys, with gentle slopes, known as "Lagni". In the past, these "Lagni" were responsible for repeated floods; nowadays they are channelled, but poorly maintained.
The Somma edifice is affected also by gravity-driven processes. Landslides occur on the caldera inner scarp and are favoured by selective erosion of dykes and sills.
In the area of the younger Vesuvius, volcanic landforms are both positive and negative. The most striking positive landform is the great cone of Vesuvius which rises from the atrio area, named "Valle del Gigante" (fig. 2). It is a cone- shaped stratovolcano, with a diameter of 4 km and an elliptical (650 m x 550 m) summit crater. Parasitic scoria and lava cones interrupt the steep slopes of Vesuvius (up to 40° and more), mainly made by scoriae produced during strom- bolian activity. Lava cones mainly produced aa lavas and subordinately pahoehoe lavas, which show typical tumuli. The subcircular summit crater is the most relevant negative landform; it is about 250 m deep with steep inner walls, sloping from a minimun of 30°, on the western side, to a maximum of about 60° on the eastern side.
"Mature" erosional forms due to the action of surface running waters are lacking in the Vesuvius area, due to its more recent age with respect to the Somma edifice. Streams of low hierarchical order simply follow the maximum slope without joining in more complex networks. The most organised drainage networks are present in the southwestern sector on the "Piano delle Ginestre", which represents the remnants of the old Somma edifice. Downstream of this palaeosurface, streams join in single and long channels which flow across the lava flows as far as the Tyrrhenian Sea. The great cone of Vesuvius is scarcely drained, chiefly because of the permeability of loose pyroclastic deposits. Gullies are widespread and form "parasol ribbing" networks. Scars produced by hot avalanches mark at places the Vesuvius slopes. Most of these avalanches were triggered by the tremors which shocked the area during the 1944 eruption; the scoriae cover slid downslope and formed several lobate tongues at the base of the volcanic cone (Cinque et al, 1997).
Drainage density and relief amplitude
The extent of drainage networks and the differences in elevations are, obviously, two important factors of flood hazards. To make their analysis as unbiased as possible, they have been expressed by the parameters of drainage density (Д km/km2; Horton, 1945) and relief amplitude (Ar,
mum difference in elevation /km2; Centamore et al, 1996). The areal variations of D and Ar in the Somma-Vesuvius area are represented on the mosaic maps of figures 3 and 4.
Drainage density has been evaluated after the identification (at the scale 1: 25,000) of all the possible ways of surface drainage, i.e. of the network of maximum extent which comprehends all the ephemeral streams. The areal distribution of D values evidences deep differences between Monte Somma and Vesuvius, the first being much more densely drained (fig. 3). This can be explained considering the different permeability of lithologies. More erodible and slightly permeable pyroclastic flows are present on the Somma slopes; in contrast, younger pyroclastic deposits and fractured and permeable lava flows prevail in the Vesuvius area. The palaeosurface of Piano delle Ginestre, which represents the remnants of the Somma edifice on the Vesuvius southern slope, shows high values of D, similarly to the Somma northern slopes.
The classes of relief amplitude are symmetrically distributed over the entire area (fig. 4). The values of this mor- phometric parameter are obviously controlled by the volcano morphology; the highest values, in fact, occur on the preserved northern rim of the Somma caldera and on the Vesuvius edifice, whereas mean and low values are found in the distal zones. In the most distal zones, particularly within the contour-line interval 200-100 m, the highest values of Ar are observed on the Vesuvius slopes (fig. 4). Noteworthy, in the southwestern sector of the Vesuvius edifice, values of the parameter ranging from 50 to 100 m are found as far as the coastline stretching from Torre del Greco to Torre Annunziata.
Recorded flood events
Although it is common knowledge that serious floods have repeatedly affected the Somma-Vesuvius area over time, available records are not continuous enough to allow the precise and complete reconstruction of each event and to verify their concomitance with critical rainfalls.
V Catenacci (1992) and F. Russo et al (1995) supply some information on recent floods. Particularly dramatic floods occurred in October 1979 and in December 1982 in the area of Torre del Greco (Russo et al, 1995). In the second case, the flood produced huge damages and two girls died while crossing Via Cavallo, one of the main streets which had been transformed into a rushing stream.
The 1985 and 1986 floods are better described (Catenacci, 1992). The first event took place during the night of the October 31 1985, after 56.6 mm of rainfall had fallen for two consecutive days (Min. Lav. Pubbl, Pres. Cons. Min., 1985). Muddy flows coming from the volcano slopes violently affected the southwestern and densely urbanised coastal belt. Torre del Greco, where Via Cavallo was flooded again, Ercolano, where a man was carried away and killed by a muddy flow, and Portici, where the railway station was flooded, were the most damaged towns. About a fortnight later, another big flood happened; it was triggered by persistent rainfall for three consecutive days from November
Géomorphologie : relief, processus, environnement, 2001, n° 3, p. 195-208 199

Lina Davoli, Paola Fredi, Filippo Russo & Alessandro Troccoli
Boscoreale
2km
Classes of drainage density (D in km/0.25 km2)
D>3.0
2.5<D<3.0
2.0<D<2.5
.5<D<2.0
1 .0<D<1 .5
0.5<D<1 .0 100
D<0.5
contour line (m asl)
Fig. 3 - Map of drainage density. This parameter has been calculated considering the drainage network of maximum extent, which comprehends all the ephemeral streams. The areal distribution of D values indicates that the Somma slopes are more densely drained that the Vesuvian slopes. Fig. 3 - Carte de la densité de drainage. Ce paramètre a été calculé en considérant le réseau de drainage le plus étendu qui inclut tous les ruisseaux éphémères. La répartition des valeurs D indique que le drainage est plus dense sur les pentes du Somma que sur celles du Vésuve.
16 to 18 1985 (205.6 mm; Min. Lav. Pubbl.,Pres. Cons. Min., 1985). The heaviest damages were registered in Portici, Ercolano, Torre del Greco, where five buildings were evacuated, and in Pompei where a camping site was flooded. After the pluviométrie events occurred from November 16 to 18, severe floods took place also on the northern slopes of Mount Somma: many streams between Somma Vesuviana and Ottaviano emerged from their banks, flooding the surrounding plain (Catenacci, 1992).
In 1986, the town of Torre Annunziata and its neighbourhood were affected twice by stream flooding. In the first case, the flood occurred after three days of rainfall (74.2 mm from July 14 to 16 1986; Min. Lav. Pubbl., Pres. Cons. Min., 1986); in the second case flood followed two days of rainfall (45.8 mm on the 25 and the 26 September 1986; Min.Lav.Pubbl., Pres. Cons. Min., 1986).
The year 1992 was another critical one: 69.6 mm of rainfall over 32 hours between 3 and 4 October 1992, triggered a violent flood, which struck the area of Torre del Greco.
Pompei On August 5 1992, another flood was triggered by 14 mm of rainfall in about 20 minutes (Russo et al, 1995).
The recorded events show that the southern slopes of Vesuvius and the southwestern in particular suffer from frequent floods, which are related to moderate pre
cipitations. On the contrary, the northern slopes of the Somma edifice are affected by flood events triggered by heavier rainfalls.
Climatic and hydrologie characteristics
The Somma- Vesuvius area is characterised by a sub- humid mediterranean climate. Annual mean temperature is around 15-16 °C; monthly minimum temperatures occur in February (3 °C), and the maximum in July (26 °C). Northerlies prevail during winter, southerlies and westerlies dominate during the rest of the year. Mean annual rainfalls of 1300 mm/yr are recorded at the Vesuvius summit (1281 m a.s.l). However rainfall quickly decreases with decreasing altitude, so that at the rain gauge of the "Osservatorio Vesuviano" (610 m asl), 957 mm/yr of rainfall were recorded in the period 1921-1996 (Min. Lav. Pubbl.-Cons. Pres. Min., 1921-1996). During the same period the rainiest month was
200 Géomorphologie : relief, processus, environnement, 2001, n° 3, p. 195-208

Flood hazards in the Somma-Vesuvius area
November (142 mm); 35% of annual precipitation fell in autumn and 34% in winter (tab. 1).
The recurrence intervals of rainfalls of 1 to 5 consecutive days (tab. 2) indicate that precipitation, which was responsible for floods recorded in the south and southwestern slopes of Vesuvius, may occur every 1 to 3 years on average. Precipitation, which caused floods also on the Somma slopes in 1985, represents the absolute maximum of the record period (205.6 mm in three days) and has a recurrence interval of 37 years. Similar rainy events, able to cause
Fig. 4 - Map of relief amplitude. This parameter expresses the maximum difference in elevation in each square kilometre. The areal distribution of the values of Ar is clearly influenced by the volcanic edifice. In the distal zones, however, higher values are found on the Vesuvius slopes. Note, that in the southwestern sector high values (ranging between 50 m and 100 m) are found as far as the coastline. Fig. 4 - Carte de l'amplitude du relief. Ce paramètre exprime la différence d'altitude maximum pour chaque kilomètre carré. La répartition aréale des valeurs de Ar est nettement influencée par l'édifice volcanique. Dans les zones distales cependant, des valeurs plus élevées sont observées sur les pentes du Vésuve. Notez de fortes valeurs (entre 50 et 100 m) dans le secteur sud-est jusque sur la côte.
floods of the northern slopes of Monte Somma, have probably occurred also in the past with recurrence intervals of the same duration.
Unfortunately, data on short intense rainfall are lacking; but they probably play a very important role in flood occurrence, as shown by the August 5 1992 event. On that day, 14 mm of rain in 20 minutes in the area of Torre del Greco, were able to trigger a flood, which seriously injured twelve bathers. Some information on maximum hourly precipitations with recurrence interval of thirty years can be drawn from an unpublished study of "Provveditorato allé Opere Pubbliche per la Campania" (Superintendent's Office for Public Works of Campania; in Russo et al, 1995). In this study pluviométrie data recorded by the Hydrographie Service of Naples from 1921 to 1965 were analysed after Fuller's statistical method (Fuller, 1913) and three pluviométrie laws were recognised for the area of Naples. In particular, the two following equations were considered significant for the drainage basins on the Vesuvius slopes (equation A) and for those on the Somma slopes (equation B), respectively:
(A) h = (53+0.0375 H) T 066 (B) h = (36+0.0215 H) T066
S. Giorgio aC,
Porticl
Classes of relief amplitude (Ar= maximum relief in m)
Ar>500
400<Ar<500
300<Ar^400
200<Ar;£300
100<Ar<200
50<Ar^100
Ar<50
contour line (m asl)
Géomorphologie : relief, processus, environnement, 2001, n° 3, p. 195-208 201

Lina Davoli, Paola Fredi, Filippo Russo & Alessandro Troccoli
Average monthly precipitation (mm)
Dec
129
Jan
101
Feb
93
Winter
323
Mar
78
Apr
77 May 58
Spring 213
Jun
32
Jul
22 Aug 29
Summer
83
Sep 80
Oct
116
Nov
142
Autumn
338
Average annual precipitation (mm)
957
1 day
160.0 129.0 88.0 85.2 84.5 83.1 82.0 75.4 73.5 71.0 70.0 69.9 68.0 68.0 67.1 66.2 65.2 62.4 61.7 58.3 56.3 54.0 53.4 52.0 50.4 49.2 46.8 45.2 44.8 44.3 39.8 37.2 36.4 36.0 36.0 31.9 30.0
2 days
199.0 164.2 160.0 131.5 98.3 91.8 91.0 87.8 84.4 84.4 84.2 84.0 83.2 83.2 79.8 79.6 79.0 74.8 73.8 70.9 70.4 69.6 68.8 62.9 62.4 61.1 56.9 56.7 56.6 54.6 54.6 52.4 51.8 50.8 47.2 45.4 45.0
3 days
205.0 168.6 160.6 144.6 118.6 115.0 110.5 105.6 101.9 101.8 101.6 100.6 99.1 92.8 92.8 92.4 89.3 88.5 85.3 84.9 84.0 81.6 81.2 77.7 69.0 68.5 68.5 68.3 66.8 65.2 63.6 62.6 62.6 58.1 56.0 51.0 45.4
4 days
241.0 168.6 160.0 154.2 130.3 129.2 125.8 124.4 121.2 116.3 111.4 109.6 106.8 105.0 104.9 103.2 102.4 102.0 100.4 100.4 96.0 93.7 92.8 91.2 90.2 88.5 87.4 81.2 78.8 73.4 69.8 67.6 67.3 63.6 60.5 54.1 47.2
5 days
248.2 168.6 160.0 156.1 149.0 143.7 138.3 135.7 134.6 134.4 132.3 130.0 123.0 122.5 121.1 115.2 113.1 111.6 106.5 104.6 104.0 102.7 102.4 102.4 102.0 100.2 96.0 92.8 81.7 81.4 80.0 69.8 67.3 65.2 62.9 61.5 53.4
R
37.00 18.50 12.30 9.25 7.40 6.20 5.30 4.60 4.10 3.70 3.40 3.10 2.80 2.60 2.50 2.30 2.20 2.10 1.90 1.85 1.80 1.70 1.60 1.50 1.48 1.40 1.37 1.30 1.28 1.20 1.19 1.16 1.12 1.10 1.06 1.03 1.00
Table 1 - Average monthly, seasonal and annual precipitation recorded at the raingage station of Osservatorio Vesuviano (610 m asl.) in the period 1921-1996 (data of the following years are lacking: 1942-1947, 1951, 1953, 1987). Tableau 1 - Précipitations moyennes, mensuelles, saisonnières et annuelles, enregistrées à la station pluviométrique de l'Observatoire du Vésuve (610 m altitude) de 1921 à 1996 (années manquantes : 1942-47, 1951, 1953, 1987).
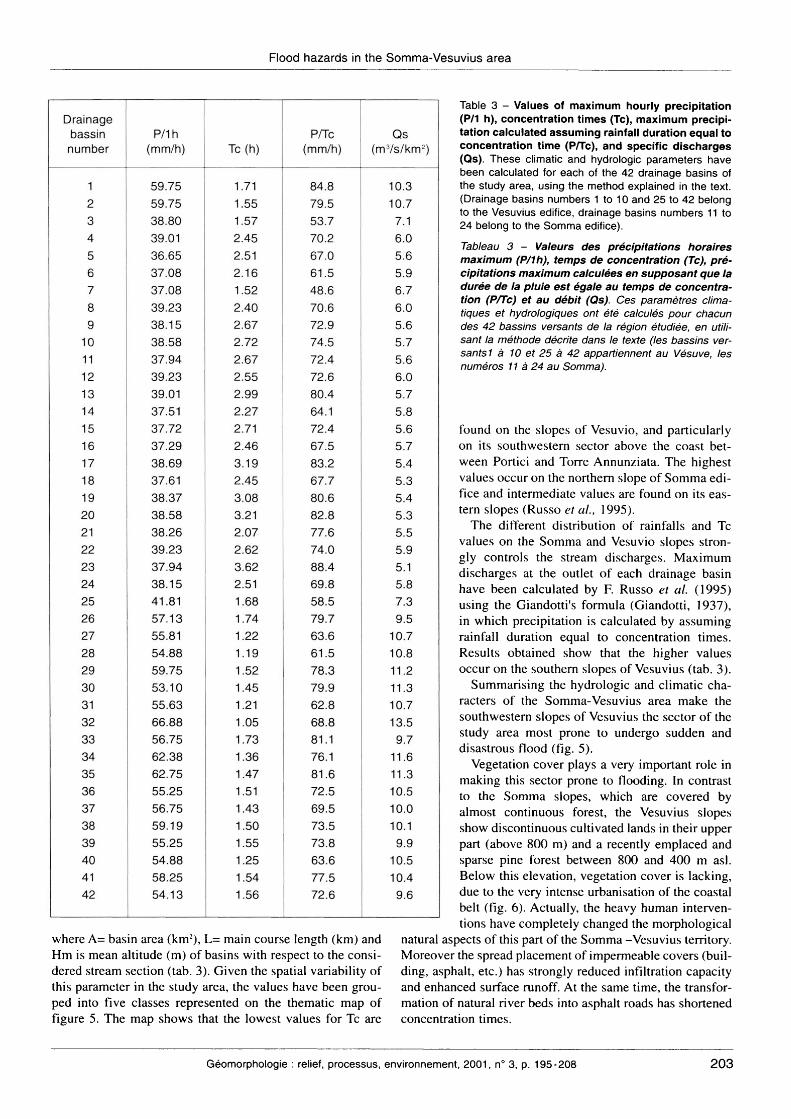
where h is the 30-year maximum precipitation (mm), H is the mean elevation of drainage basins and T is rainfall duration. The values of thirty-year maximum hourly precipitation calculated by equation (A) and (B) are listed in table 3 and their distribution in the study area is shown in figure 5. The highest values are relevant to drainage basins of the southern and southwestern slopes of the Vesuvius edifice. This distribution is in accordance with the very frequent occurrence of orographie rainfalls due to the wet winds, which blow from the Tyrrhenian Sea for most of the year.
Drainage basins of the Vesuvius and Somma slopes also differ in their physical characteristics. The Vesuvius slopes are characterised by small catchments (about 3 km2 as a mean value) drained by main streams shorter than 4 km directly flowing into the sea and showing convex longitudinal profiles. On the contrary, the Somma slopes have wider catchments (10 km2 as a mean value) drained by more complex networks, with main streams longer than 10 km and showing concave longitudinal profiles.
These characteristics strongly control the values of concentration time of runoff, i.e. the time required for water to flow from the farthest point in the watershed to a given stream section. The values of this parameter (Tc) depends upon the amount of precipitations and - rainfall being equal - upon lithology, density and typology of vegetation cover and basin characters (basin area, length of channels, relief amplitude, slope gradients).
Concentration times of runoff have been calculated by F. Russo et al. (1995) following Giandotti's formula (Giandotti, 1937; Ciabatti, 1982):
Tc= 4 лГА" + 1.5L/0.8
Table. 2 - Recurrence intervals for maximum precipitation in 1 , 2, 3, 4 and 5 consecutive days recorded at the raingage station of Osservatorio Vesuviano (610 m asl) in the period 1952-1996 (data relevant to 1953 and 1977-1982 are lacking). Tableau 2 - Intervalles de retour pour des précipitations de 1, 2, 3, 4 et 5 jours consécutifs enregistrés à la station pluviométrique de l'Observatoire du Vésuve (ait 610 m) de 1952 à 1996 (années manquantes : 1953 et 1977-82).
202 Géomorphologie : relief, processus, environnement, 2001, n° 3, p. 195-208
Flood hazards in the Somma-Vesuvius area
Drainage bassin number
1 2 3 4 5 6 7 8 9
10 11 12 13 14 15 16 17 18 19 20 21 22 23 24 25 26 27 28 29 30 31 32 33 34 35 36 37 38 39 40 41 42
P/1h (mm/h)
59.75 59.75 38.80 39.01 36.65 37.08 37.08 39.23 38.15 38.58 37.94 39.23 39.01 37.51 37.72 37.29 38.69 37.61 38.37 38.58 38.26 39.23 37.94 38.15 41.81 57.13 55.81 54.88 59.75 53.10 55.63 66.88 56.75 62.38 62.75 55.25 56.75 59.19 55.25 54.88 58.25 54.13
Tc(h)
1.71 1.55 1.57 2.45 2.51 2.16 1.52 2.40 2.67 2.72 2.67 2.55 2.99 2.27 2.71 2.46 3.19 2.45 3.08 3.21 2.07 2.62 3.62 2.51 1.68 1.74 1.22 1.19 1.52 1.45 1.21 1.05 1.73 1.36 1.47 1.51 1.43 1.50 1.55 1.25 1.54 1.56
P/Tc (mm/h)
84.8 79.5 53.7 70.2 67.0 61.5 48.6 70.6 72.9 74.5 72.4 72.6 80.4 64.1 72.4 67.5 83.2 67.7 80.6 82.8 77.6 74.0 88.4 69.8 58.5 79.7 63.6 61.5 78.3 79.9 62.8 68.8 81.1 76.1 81.6 72.5 69.5 73.5 73.8 63.6 77.5 72.6
Qs (m3/s/km2)
10.3 10.7 7.1 6.0 5.6 5.9 6.7 6.0 5.6 5.7 5.6 6.0 5.7 5.8 5.6 5.7 5.4 5.3 5.4 5.3 5.5 5.9 5.1 5.8 7.3 9.5
10.7 10.8 11.2 11.3 10.7 13.5 9.7
11.6 11.3 10.5 10.0 10.1 9.9
10.5 10.4 9.6
where A= basin area (km2), L= main course length (km) and Hm is mean altitude (m) of basins with respect to the considered stream section (tab. 3). Given the spatial variability of this parameter in the study area, the values have been grouped into five classes represented on the thematic map of figure 5. The map shows that the lowest values for Tc are
Table 3 - Values of maximum hourly precipitation (P/1 h), concentration times (Tc), maximum precipitation calculated assuming rainfall duration equal to concentration time (Ptfc), and specific discharges (Qs). These climatic and hydrologie parameters have been calculated for each of the 42 drainage basins of the study area, using the method explained in the text. (Drainage basins numbers 1 to 10 and 25 to 42 belong to the Vesuvius edifice, drainage basins numbers 11 to 24 belong to the Somma edifice). Tableau 3 - Valeurs des précipitations horaires maximum (P/1 h), temps de concentration (Tc), précipitations maximum calculées en supposant que la durée de la pluie est égale au temps de concentration (P/Tc) et au débit (Qs). Ces paramètres climatiques et hydrologiques ont été calculés pour chacun des 42 bassins versants de la région étudiée, en utilisant la méthode décrite dans le texte (les bassins versants 1 à 10 et 25 à 42 appartiennent au Vésuve, les numéros 11 à 24 au Somma).
found on the slopes of Vesuvio, and particularly on its southwestern sector above the coast between Portici and Torre Annunziata. The highest values occur on the northern slope of Somma edifice and intermediate values are found on its eastern slopes (Russo et al., 1995).
The different distribution of rainfalls and Tc values on the Somma and Vesuvio slopes strongly controls the stream discharges. Maximum discharges at the outlet of each drainage basin have been calculated by F. Russo et al. (1995) using the Giandotti's formula (Giandotti, 1937), in which precipitation is calculated by assuming rainfall duration equal to concentration times. Results obtained show that the higher values occur on the southern slopes of Vesuvius (tab. 3).
Summarising the hydrologie and climatic characters of the Somma-Vesuvius area make the southwestern slopes of Vesuvius the sector of the study area most prone to undergo sudden and disastrous flood (fig. 5).
Vegetation cover plays a very important role in making this sector prone to flooding. In contrast to the Somma slopes, which are covered by almost continuous forest, the Vesuvius slopes show discontinuous cultivated lands in their upper part (above 800 m) and a recently emplaced and sparse pine forest between 800 and 400 m asl. Below this elevation, vegetation cover is lacking, due to the very intense urbanisation of the coastal belt (fig. 6). Actually, the heavy human interventions have completely changed the morphological
natural aspects of this part of the Somma -Vesuvius territory. Moreover the spread placement of impermeable covers (building, asphalt, etc.) has strongly reduced infiltration capacity and enhanced surface runoff. At the same time, the transformation of natural river beds into asphalt roads has shortened concentration times.
Géomorphologie : relief, processus, environnement, 2001, n° 3, p. 195-208 203

Lina Davoli, Paola Fredi, Filippo Russo & Alessandro Troccoli
7 14
/M2 S. Giorgio a C
2km 39 40 41
Classes of hourly precipitations (P = in mm)
Classes of concentration time (Tc = in hours)
35 <P< 50
50 <P< 60
P>60
^-юо -) Contour line (m asl) , --> '^" Main streams
_ _ - ' Divide i, ... ,42 Drainage basin number
1.0<Tc<1.5
1 .5 <Тс< 2.0
2.0 <Тс< 2.5
Y//\ 2.5 <Tc< 3.0 Tc> 3.0
Fig. 5 - Distribution of maximum hourly precipitation with recurrence interval of 30 years, and of the concentration times of runoff. Precipitation has been calculated for each drainage basin on the basis of equation (A) and (B) described in the text; the highest values concentrate on the south and southwestern slopes of the Vesuvius edifice. Concentration times have been calculated using Giandotti's 1937 formula. Note, that the highest values of this parameter are also found on the Vesuvius slopes. (Drainage basins numbers 1 to 10 and 25 to 42 belong to the Vesuvius edifice, drainage basins numbers 11 to 24 belong to the Somma edifice). Fig. 5 - Répartition des précipitations horaires maximum, dans un intervalle de récurrence de 30 ans, et des temps de concentration du ruissellement. Les précipitations ont été calculées pour chaque bassin de drainage sur la base des équations (A) et (B) décrites dans le texte ; les plus forts abats d'eau se concentrent sur les pentes sud et sud-ouest du Vésuve. Les temps de concentration ont été calculés en utilisant la formule de Giandotti (1937). Notez que les valeurs de ce paramètre les plus fortes sont aussi mesurées sur les pentes du Vésuve (les bassins de drainage 1 à 10 et 25 à 42 appartiennent au Vésuve, les numéros 11 à 24 au Somma).
204 Géomorphologie : relief, processus, environnement, 2001, n° 3, p. 195-208
Flood hazards in the Somma-Vesuvius area
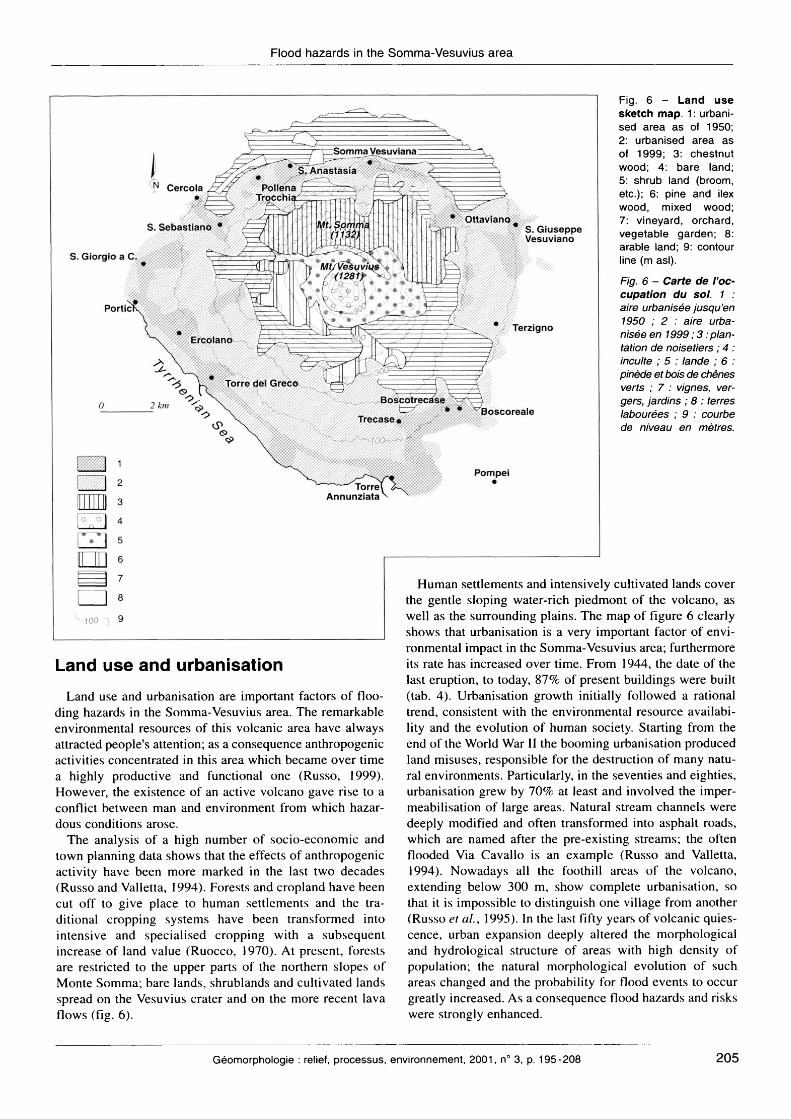
Fig. 6 - Land use sketch map. 1 : urbanised area as of 1950; 2: urbanised area as of 1999; 3: chestnut wood; 4: bare land; 5: shrub land (broom, etc.); 6: pine and ilex wood, mixed wood; 7: vineyard, orchard, vegetable garden; 8: arable land; 9: contour line (m asl). Fig. 6 - Carte de l'occupation du sol. 1 : aire urbanisée jusqu'en 1950 ; 2 : aire urbanisée en 1999 ; 3 plantation de noisetiers ; 4 : inculte ; 5 : lande ; 6 : pinède et bois de chênes verts ; 7 : vignes, vergers, jardins ; 8 : terres labourées ; 9 : courbe de niveau en mètres.
Land use and urbanisation
Land use and urbanisation are important factors of flooding hazards in the Somma-Vesuvius area. The remarkable environmental resources of this volcanic area have always attracted people's attention; as a consequence anthropogenic activities concentrated in this area which became over time a highly productive and functional one (Russo, 1999). However, the existence of an active volcano gave rise to a conflict between man and environment from which hazardous conditions arose.
The analysis of a high number of socio-economic and town planning data shows that the effects of anthropogenic activity have been more marked in the last two decades (Russo and Valletta, 1994). Forests and cropland have been cut off to give place to human settlements and the traditional cropping systems have been transformed into intensive and specialised cropping with a subsequent increase of land value (Ruocco, 1970). At present, forests are restricted to the upper parts of the northern slopes of Monte Somma; bare lands, shrublands and cultivated lands spread on the Vesuvius crater and on the more recent lava flows (fig. 6).
Human settlements and intensively cultivated lands cover the gentle sloping water-rich piedmont of the volcano, as well as the surrounding plains. The map of figure 6 clearly shows that urbanisation is a very important factor of environmental impact in the Somma-Vesuvius area; furthermore its rate has increased over time. From 1944, the date of the last eruption, to today, 87% of present buildings were built (tab. 4). Urbanisation growth initially followed a rational trend, consistent with the environmental resource availability and the evolution of human society. Starting from the end of the World War II the booming urbanisation produced land misuses, responsible for the destruction of many natural environments. Particularly, in the seventies and eighties, urbanisation grew by 70% at least and involved the imperméabilisation of large areas. Natural stream channels were deeply modified and often transformed into asphalt roads, which are named after the pre-existing streams; the often flooded Via Cavallo is an example (Russo and Valletta, 1994). Nowadays all the foothill areas of the volcano, extending below 300 m, show complete urbanisation, so that it is impossible to distinguish one village from another (Russo et al, 1995). In the last fifty years of volcanic quiescence, urban expansion deeply altered the morphological and hydrological structure of areas with high density of population; the natural morphological evolution of such areas changed and the probability for flood events to occur greatly increased. As a consequence flood hazards and risks were strongly enhanced.
Géomorphologie : relief, processus, environnement, 2001, n° 3, p. 195-208 205

Lina Davoli, Paola Fredi, Filippo Russo & Alessandro Troccoli
Conclusions
Geomorphological, climatical, hydrological, and land use data evidence some significant factors of flood hazards which in the study area coexist with volcanic and seismic hazards.
The generally high values of relief amplitude (Ar) are important factors, as they make surface runoff easier to the detriment of infiltration. The areal variability of Ar values indicates that differences in elevation do not differ greatly throughout the area. The highest values of the parameter (Ar>500) are found on the upper part of the Somma northern slopes, but the Vesuvius southern slopes, which suffer frequent floods, show rather high values of Ar as far as the coastline (fig. 3).
Another natural factor that makes this area prone to hazardous processes by surface running water, is the extent of drainage networks. Drainage density variations within the study area indicate that the Somma slopes are much more densely drained (fig. 4). Drainage networks on these slopes have generally a high degree of hierarchical organisation (Strahler, 1957), which in turn means a more efficient drai-
Table 4 - Present population density and increase in buildings from 1919 to 1995 relevant to the most important human settlements located on the slopes of Somma-Vesuvius. Note that the maximum increase in building number took place starting in 1945, just after the 1944 eruption (from Russo etal., 1995). Tableau 4 - Densité de la population actuelle et accroissement des constructions de 1919 a 1995, concernant les agglomérations les plus importantes sur les pentes du Vésuve et du Somma. Notez que la période d'accroissement maximum du nombre des constructions a commencé en 1945, juste après l'éruption de 1944 (d'après Russo et al., 1995).
ning of surface waters, as the longer concentration times show (fig. 5). Moreover, streams of Somma slopes have low specific discharges (tab. 3), also because of the dense vegetation cover, which helps in decreasing surface runoff (fig. 6). On the contrary, the frequent and deep changes of the topographic surface of the Vesuvius slopes, due to the recent volcanic activity, have not favoured the development of hierachically organised and efficient drainage networks. Drainage basins of these slopes have shorter concentration times than those of the Somma slopes and stream specific discharges are higher (fig. 5 and tab. 3).
Historical records show that flood events are more frequent on the Vesuvius slopes. Climatic data indicate that floods in this part of the study area do not depend on the occurrence of unusual rainfalls with long recurrence intervals; instead they are triggered by precipitation events with take place usually every 1 to 3 years (tab. 1 and tab. 2). Floods on the Somma slopes are less frequent and they occur after precipitation events, which have longer recurrence intervals.
Urbanisation is likely to be the most important factor of flood hazards. Population growth and intense urbanisation involved intensive modifications of surface water runoff pattern; deforestation, channelisations and land reclamation practices were needed which caused more water to flow downstream faster, also favoured by the spreading of impermeable covers.
Floods mainly occur on the southern slopes of Vesuvius particularly on the southwestern ones, where the natural pro- neness to floods is greatly enhanced by anthropogenic factors. On these slopes, in fact, human interventions have been so severe that the generally permeable outcropping litholo- gies have been almost completely impermeabilised with the
Human settlements
S. Giorgio a Cremano Portici Torre del Greco Torre Annunziata Boscotrecase Trecase Boscoreale Pompei Ercolano Terzigno S. Giuseppe Vesuviano Ottaviano Somma Vesuviana Sant'Anastasia Pollena Trocchia S. SebastJano al Vesuvio Cercola TOTAL
Area (km2)
4.11 4.52
30.66 7.33 7.18 6.45
11.20 12.41 19.64 23.51 14.08 19.85 30.74 18.76 8.11 2.60 7.24
228.39
Present population
density (inh/km2)
15,117 17,790 3,379 8,258 1,710 1,414 2,200 1,848 2,969
464 1,679 1,015 762
1,121 1,068 3,382 2,579 2,500
Present number of buildings
15,453 20,513 25,653 14,577 3,250 2,362 6,424 5,806
13,316 2,917 5,985 4,970 6,094 5,298 2,121 2,174 4,594
141,507
Number of buildings
before 1919
1,410 3,005 4,639 2,969 1,012 425
1,131 542
2,863 434 825
1,090 1,144
681 358 110 594
23,232
Number of buildings
between 1919 and 1945
573 1,050 2,474 2,105
568 298 877 756
1,271 543 853 714 845 466 213 102 300
14,008
Number of buildings after 1945
13,470 16,458 18,540 9,503 1,670 1,639 4,416 4,508 9,182 1,940 4,307 3,166 4,105 4,151 1,549 1,962 3,900
104,266
Building increase after
1945 (%)
87 80 72 65 51 69 68 77 69 66 72 63 67 78 73 90 80 74
206 Géomorphologie : relief, processus, environnement, 2001, n° 3, p. 195-208

Flood hazards in the Somma-Vesuvius area
subsequent and marked decrease of concentration times (figs. 5 and 6). The transformation of natural stream channels into asphalt roads or their use as sewer system has been a particularly serious misuse. The situation is particularly critical between Portici and Torre Annunziata, due to the very strong human pressure (tab. 4 and fig. 6); the last decades, in fact, have witnessed disastrous floods right in this area with heavy damages to properties and cultivations and, what is worse, with loss of life.
Acknowledgements This research was funded by the Ministry for the
University and the Scientific and Technological Research, by the National Council for Research (C.N.R.), Director of research: Prof. E. Lupia Palmieri, and the Fondo Ateneo Universita del Sannio, (E Russo).
References
Accardo A., Bianucci P., Bonasia V., Gaglione S. (1981) - // bacino imbrifero del Vesuvio dissesti idrogeologici e difesa del territori. Conv. interclubs Rotary club-Lyons club, Torre del Greco, 13 p.
Alessio M., Bella F., Improta S., Belluomini G., Calderoni G., Cortesi G., Turi B. (1974) - University of Rome Carbon 14 dates. XII Radiocarbon, 16, 358-367.
Biasini A., Buonasorte G., Ciccacci S., Fredi P., Lupia Palmieri E. (1993) - Geomorphological characteristics. In Di Filippo M. (Ed.): Sabatini Volcanic Complex. Quad. Rie. Scient. 11, 81-94.
Brancaccio L., Cinque A., Romano P., Rosskopf C, Russo F., Santangelo N., Santo A. (1991) - Geomorphology and neotec- tonic evolution of a sector of the Tyrrhenian flank of the southern Apennines (Region of Naples, Italy). Z. Geomorph. N.F., Suppl. Bd. 82, 47-58, Berlin.
Caputo C, Del Monte, Fredi P., M. Lupia Palmieri E., Pugliese F. (1995) - Geomorphological features. In Trigila R. (Ed.) The Volcano of the Alban Hills, 13-32.
Catenacci V. (1992) - II dissesto idrogeologico e geoambientale in Italia dal dopoguerra al 1990. Serv. Geol. Naz-, Mem. descrittive délia Carta geologica d'Italia, 41, 1-301.
Celano C. - Notizie del bello, dell'antico e del curioso délia città di Napoli. Edited by Mozzillo A., Prof eta A., Macchia F.P. (1974). E.S.I., Napoli, 2134 p.
Centamore E., Ciccacci S., Del Monte M., Fredi P., Lupia Palmieri E. (1996) - Morphological and morphometric approach to the study of the structural arrangement of northeastern Abruzzo (central Italy). Geomorphology, 16, 127-137.
Ciabatti M. (1982) - Elementi di idrologia superficiale. CLUEB Ed., Bologna, 230 p.
Cinque A., Aucelli P.P.C., Brancaccio L., Mele R., Milia A., Robustelli G., Romano P., Russo F., Russo M., Santangelo N., Sgambati D. (1997) - Guide for excursion: volcanism, tectonics and recent geomorphological change in the Bay of Napoli. Suppl. Ill, Geog. Fis. Din. Quat., 123-141.
Cinque A., Hossein H.H., Laureti L., Russo F. (1987) - Osservazioni preliminari sull'evoluzione geomorfologica della Piana del Sarno (Campania, Appennino méridionale). Geog. Fis. Din. Quat., 10, 161 - 174.
Davoli L., Del Monte M., De Rita D., Fredi P. (1999) - Geomorphology and tectonics in the Roccamonfina Volcano (Campania, Central Italy). Z. Geomorph., Suppl. Bd. 114, 11-28, Berlin.
Di Girolamo P. (1978) - Geotectonic settings of Miocene- Quaternary volcanism in and around the Eastern Tyrrhenian Sea border (Italy) as deduced from major elements geochemistry. Bull. Volcanol, 41, 1-22.
Fuller W.E. (1913) - Rood flows. Proc. Am. Soc. Civ. Eng., 1011- 1064, New York.
Giandotti M. (1937) - Idrologia. Barbera Ed., Firenze, 107 p. Horton R.E. (1945) - Erosional development of stream and their
drainage basins: hydrophysical approach to quantitative morphology. Geol. Soc. America Bull, 56, 275-370.
Mercalli G. (1907) - La grande eruzione vesuviana cominciata il 4 apríle 1906. Mem. Pontif. Accad. Rom. Nuovi Lincei, 24, 1-34.
Ministero Lavori Pubblici-Consiglio Presidenza Ministři (1921-1996) - Annali Idrologici. Parte I: Napoli. Istituto Poligrafico dello Stato, Roma.
Nazzaro A. (1997) - II Vesuvio: storia eruttiva e teorie vulcanolo- giche. In Liguori Ed., Biblioteca Scientifica., Ъ1А р.
Oilier CD. (1988) - Volcanoes. Basil Blackwell, Inc., New York, 237 p.
Oilier CD., Brown M.J.F. (1971) - Erosion of a young volcano in New Guinea. Z. Geomorph., Suppl. Bd. 15, 12-28.
Ortolani F., Apríle F. (1978) - Nuovi dati sulla struttura profonda della Piana Campana a Sud Est del F. Voltumo. Boll. Soc. Geol. It., 97, 591-608.
Palacios D. (1994) - The origin of certain wide valleys in the Canary Island. Geomorphology, 9, 1-18.
Principe C, Rosi M., Santacroce R., Sbrana A. (1987) - Explanatory notes to the geological map. In: Santacroce R. Ed.: Somma-Vesuvius. Quad. Rie. Scien. C.N.R., 11-52, Roma.
Rolandi G., Petrosino P., Me Geehin J. (1998) - The interplinian activity at Somma-Vesuvius in the last 3500 years. J. Volcanol. Geoth. Res., 82, 19-52.
Ruocco D. (1970) - Memoria illustrativa della carta della utiliz- zazione del suolo della Campania: fogli 14, 15, 16, 17 e 19 della Carta della utilizzazione del suolo d'Italia. С. N. R. Roma.
Russo F. (1999) - I siti archeologici del Bronzo Antico in Campania interessati dall'eruzione vesuviana delle Pomici di Avellino: elementi geomorfologici e stratigrafici. In Albore Sivadie C. L 'eruzione vesuviana delle Pomici di Avellino e la fades di Palma Campania {Bronzo Antico). Atti Sem. Int. Centra Un. Eur. BB.CC. di Ravello (SA), 2, 93-118.
Russo F., Valletta M. (1994) - Un esempio di coesistenza difficile tra ambiente fisico ed antropizzazione: l'area vesuviana. // Quaternario, 7(lb), 431-436.
Russo F., Valletta M., Granata С (1995) - II rischio geologico sensu lato al Somma- Vesuvio. Rend. Ace. Se. Fis. Mat. Napoli, 62, 125-186.
Santacroce R. (1987) - Somma-Vesuvius. CNR. Quad. Ric.Scientifica, 8, 1-243.
Strahler A.N. (1957) - Quantitative analysis of the watershed geomorphology. Trans. Am. Geoph. Un. 38, 913-920.
Article reçu le 5 décembre 2000, accepté le 18 juillet 2001
Géomorphologie : relief, processus, environnement, 2001, n° 3, p. 195-208 207


![[tel-01057231, v1] Facteurs associés au mauvais contrôle ...](https://static.fdokumen.com/doc/165x107/63280d54cedd78c2b50de16b/tel-01057231-v1-facteurs-associes-au-mauvais-controle-.jpg)


