Native animals lost to tree-clearing in NSW 1998-2015 - WWF ...
16
Native animals lost to tree-clearing in NSW 1998-2015 REPORT 2018 © DOUG GIMESY / WWF-AUS
-
Upload
khangminh22 -
Category
Documents
-
view
0 -
download
0
Transcript of Native animals lost to tree-clearing in NSW 1998-2015 - WWF ...
1 WWF-Australia: Native animals lost to tree-clearing in NSW 1998-2015
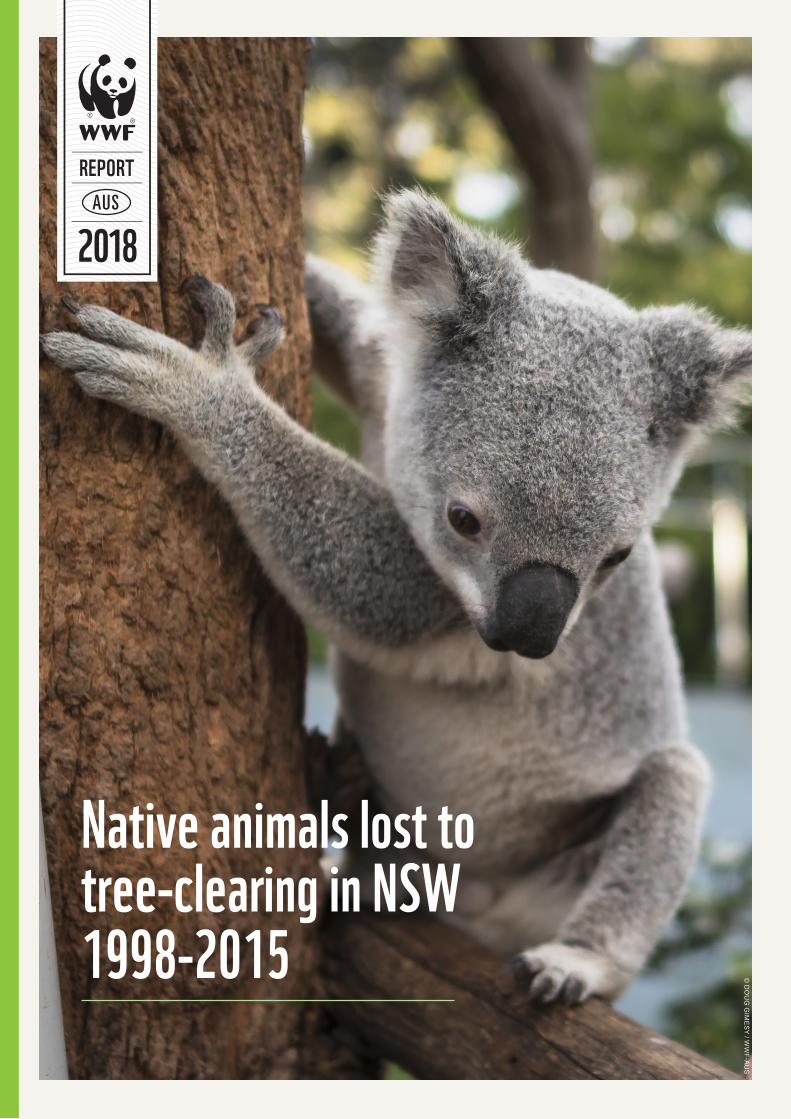
Native animals lost to tree-clearing in NSW 1998-2015
REPORT
2018
© D
OU
G G
IME
SY
/ WW
F-AU
S
2 WWF-Australia: Native animals lost to tree-clearing in NSW 1998-2015
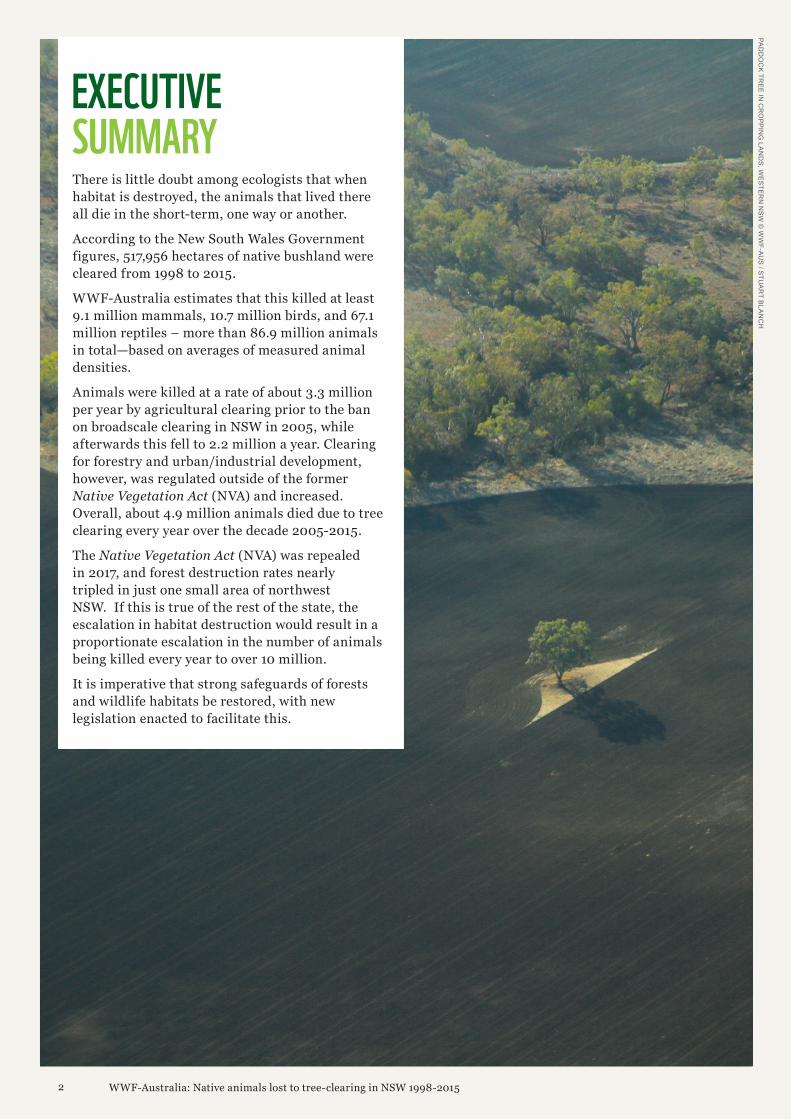
There is little doubt among ecologists that when habitat is destroyed, the animals that lived there all die in the short-term, one way or another.
According to the New South Wales Government figures, 517,956 hectares of native bushland were cleared from 1998 to 2015.
WWF-Australia estimates that this killed at least 9.1 million mammals, 10.7 million birds, and 67.1 million reptiles – more than 86.9 million animals in total—based on averages of measured animal densities.
Animals were killed at a rate of about 3.3 million per year by agricultural clearing prior to the ban on broadscale clearing in NSW in 2005, while afterwards this fell to 2.2 million a year. Clearing for forestry and urban/industrial development, however, was regulated outside of the former Native Vegetation Act (NVA) and increased. Overall, about 4.9 million animals died due to tree clearing every year over the decade 2005-2015.
The Native Vegetation Act (NVA) was repealed in 2017, and forest destruction rates nearly tripled in just one small area of northwest NSW. If this is true of the rest of the state, the escalation in habitat destruction would result in a proportionate escalation in the number of animals being killed every year to over 10 million.
It is imperative that strong safeguards of forests and wildlife habitats be restored, with new legislation enacted to facilitate this.
EXECUTIVE SUMMARY
PAD
DO
CK
TRE
E IN
CR
OP
PIN
G LA
ND
S, W
ES
TER
N N
SW
© W
WF-A
US
/ STU
AR
T BLA
NC
H
3 WWF-Australia: Native animals lost to tree-clearing in NSW 1998-2015
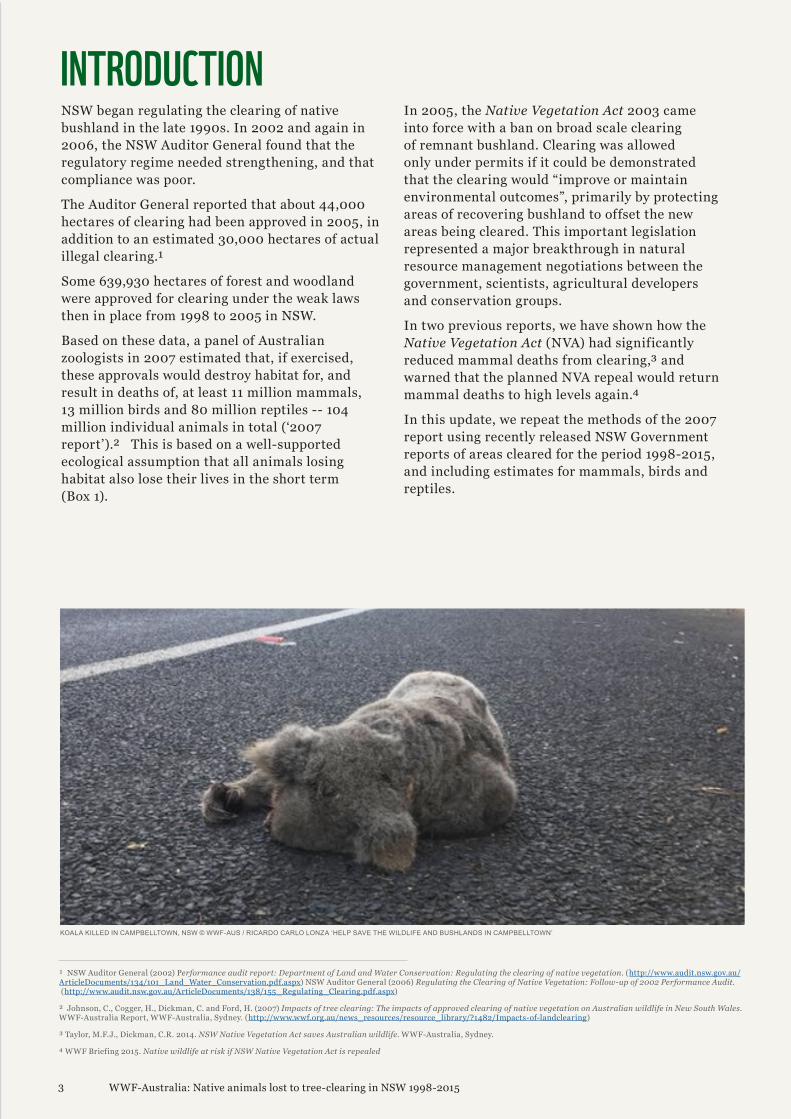
KOALA KILLED IN CAMPBELLTOWN, NSW © WWF-AUS / RICARDO CARLO LONZA ‘HELP SAVE THE WILDLIFE AND BUSHLANDS IN CAMPBELLTOWN’
NSW began regulating the clearing of native bushland in the late 1990s. In 2002 and again in 2006, the NSW Auditor General found that the regulatory regime needed strengthening, and that compliance was poor.
The Auditor General reported that about 44,000 hectares of clearing had been approved in 2005, in addition to an estimated 30,000 hectares of actual illegal clearing.¹
Some 639,930 hectares of forest and woodland were approved for clearing under the weak laws then in place from 1998 to 2005 in NSW.
Based on these data, a panel of Australian zoologists in 2007 estimated that, if exercised, these approvals would destroy habitat for, and result in deaths of, at least 11 million mammals, 13 million birds and 80 million reptiles -- 104 million individual animals in total (‘2007 report’).² This is based on a well-supported ecological assumption that all animals losing habitat also lose their lives in the short term (Box 1).
In 2005, the Native Vegetation Act 2003 came into force with a ban on broad scale clearing of remnant bushland. Clearing was allowed only under permits if it could be demonstrated that the clearing would “improve or maintain environmental outcomes”, primarily by protecting areas of recovering bushland to offset the new areas being cleared. This important legislation represented a major breakthrough in natural resource management negotiations between the government, scientists, agricultural developers and conservation groups.
In two previous reports, we have shown how the Native Vegetation Act (NVA) had significantly reduced mammal deaths from clearing,³ and warned that the planned NVA repeal would return mammal deaths to high levels again.⁴
In this update, we repeat the methods of the 2007 report using recently released NSW Government reports of areas cleared for the period 1998-2015, and including estimates for mammals, birds and reptiles.
INTRODUCTION
¹ NSW Auditor General (2002) Performance audit report: Department of Land and Water Conservation: Regulating the clearing of native vegetation. (http://www.audit.nsw.gov.au/ArticleDocuments/134/101_Land_Water_Conservation.pdf.aspx) NSW Auditor General (2006) Regulating the Clearing of Native Vegetation: Follow-up of 2002 Performance Audit. (http://www.audit.nsw.gov.au/ArticleDocuments/138/155_Regulating_Clearing.pdf.aspx)
² Johnson, C., Cogger, H., Dickman, C. and Ford, H. (2007) Impacts of tree clearing: The impacts of approved clearing of native vegetation on Australian wildlife in New South Wales. WWF-Australia Report, WWF-Australia, Sydney. (http://www.wwf.org.au/news_resources/resource_library/?1482/Impacts-of-landclearing)
³ Taylor, M.F.J., Dickman, C.R. 2014. NSW Native Vegetation Act saves Australian wildlife. WWF-Australia, Sydney.
⁴ WWF Briefing 2015. Native wildlife at risk if NSW Native Vegetation Act is repealed
4 WWF-Australia: Native animals lost to tree-clearing in NSW 1998-2015
⁵ Johnson et al. (2007), cited above.
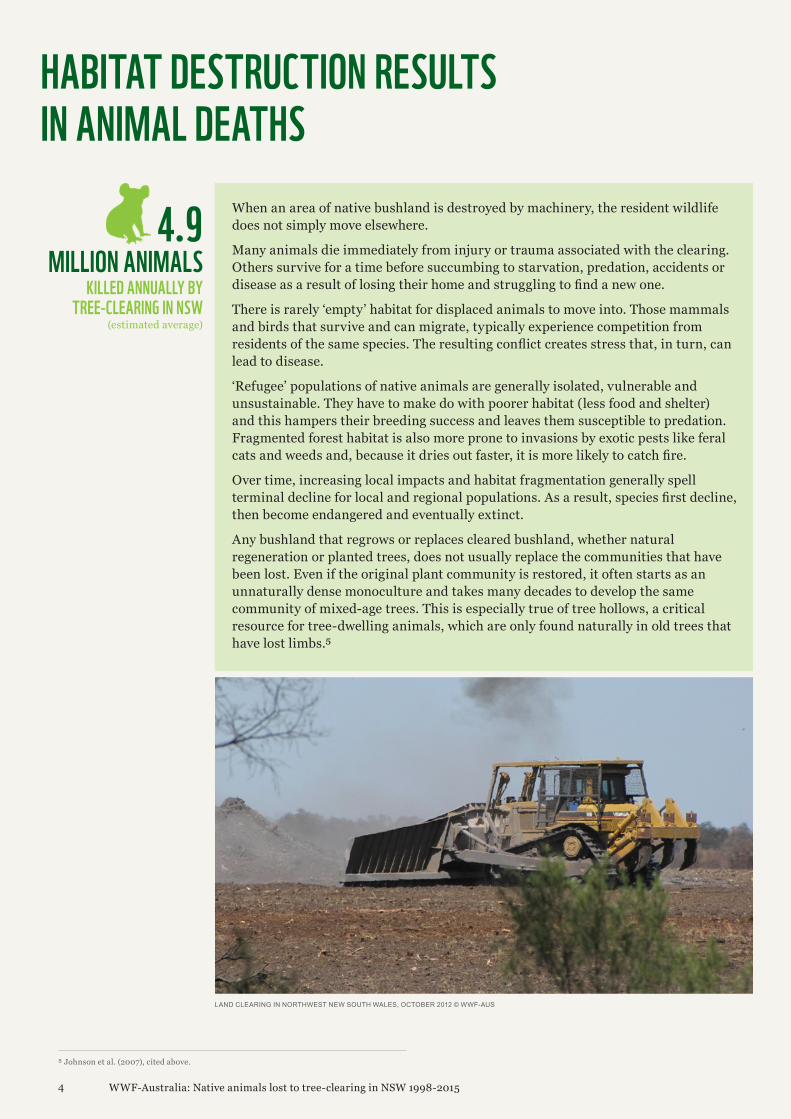
4.9 MILLION ANIMALS
KILLED ANNUALLY BY TREE-CLEARING IN NSW
(estimated average)
HABITAT DESTRUCTION RESULTS IN ANIMAL DEATHS
When an area of native bushland is destroyed by machinery, the resident wildlife does not simply move elsewhere.
Many animals die immediately from injury or trauma associated with the clearing. Others survive for a time before succumbing to starvation, predation, accidents or disease as a result of losing their home and struggling to find a new one.
There is rarely ‘empty’ habitat for displaced animals to move into. Those mammals and birds that survive and can migrate, typically experience competition from residents of the same species. The resulting conflict creates stress that, in turn, can lead to disease.
‘Refugee’ populations of native animals are generally isolated, vulnerable and unsustainable. They have to make do with poorer habitat (less food and shelter) and this hampers their breeding success and leaves them susceptible to predation. Fragmented forest habitat is also more prone to invasions by exotic pests like feral cats and weeds and, because it dries out faster, it is more likely to catch fire.
Over time, increasing local impacts and habitat fragmentation generally spell terminal decline for local and regional populations. As a result, species first decline, then become endangered and eventually extinct.
Any bushland that regrows or replaces cleared bushland, whether natural regeneration or planted trees, does not usually replace the communities that have been lost. Even if the original plant community is restored, it often starts as an unnaturally dense monoculture and takes many decades to develop the same community of mixed-age trees. This is especially true of tree hollows, a critical resource for tree-dwelling animals, which are only found naturally in old trees that have lost limbs.⁵
LAND CLEARING IN NORTHWEST NEW SOUTH WALES, OCTOBER 2012 © WWF-AUS
5 WWF-Australia: Native animals lost to tree-clearing in NSW 1998-2015
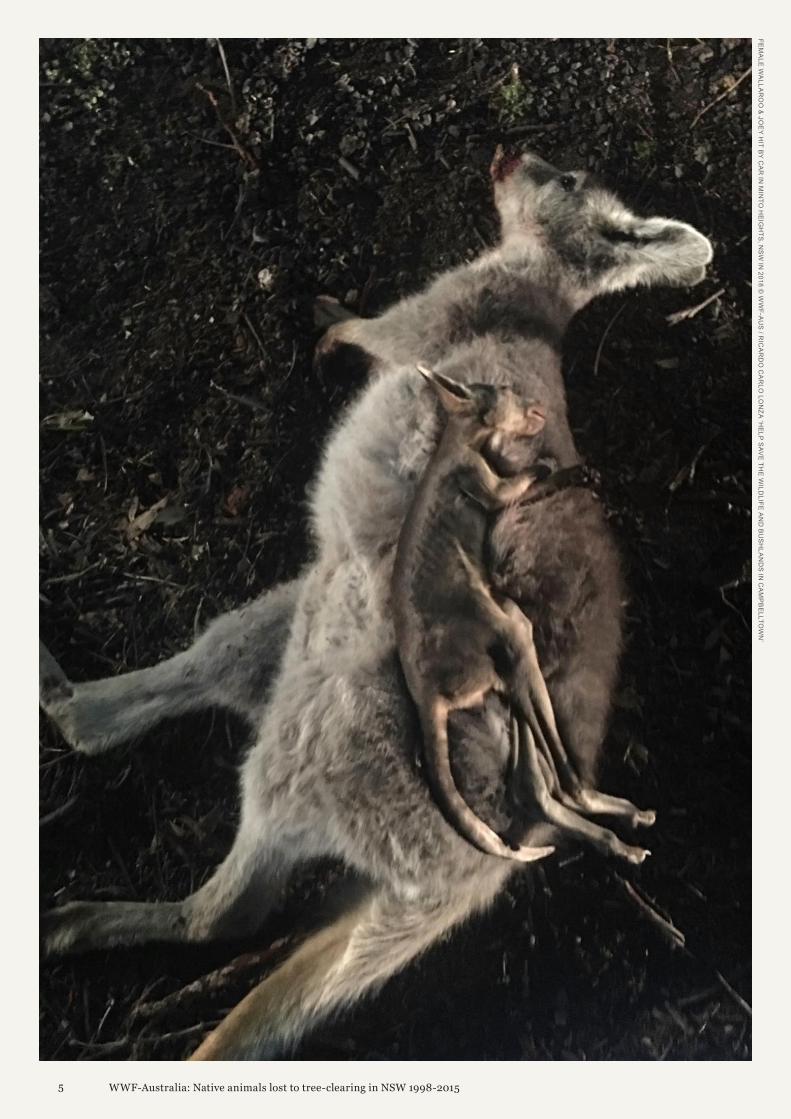
FEM
ALE
WA
LLAR
OO
& JO
EY
HIT B
Y C
AR
IN M
INTO
HE
IGH
TS, N
SW
IN 2018 ©
WW
F-AU
S / R
ICA
RD
O C
AR
LO LO
NZ
A ‘H
ELP
SAV
E TH
E W
ILDLIFE
AN
D B
US
HLA
ND
S IN
CA
MP
BE
LLTOW
N’
6 WWF-Australia: Native animals lost to tree-clearing in NSW 1998-2015
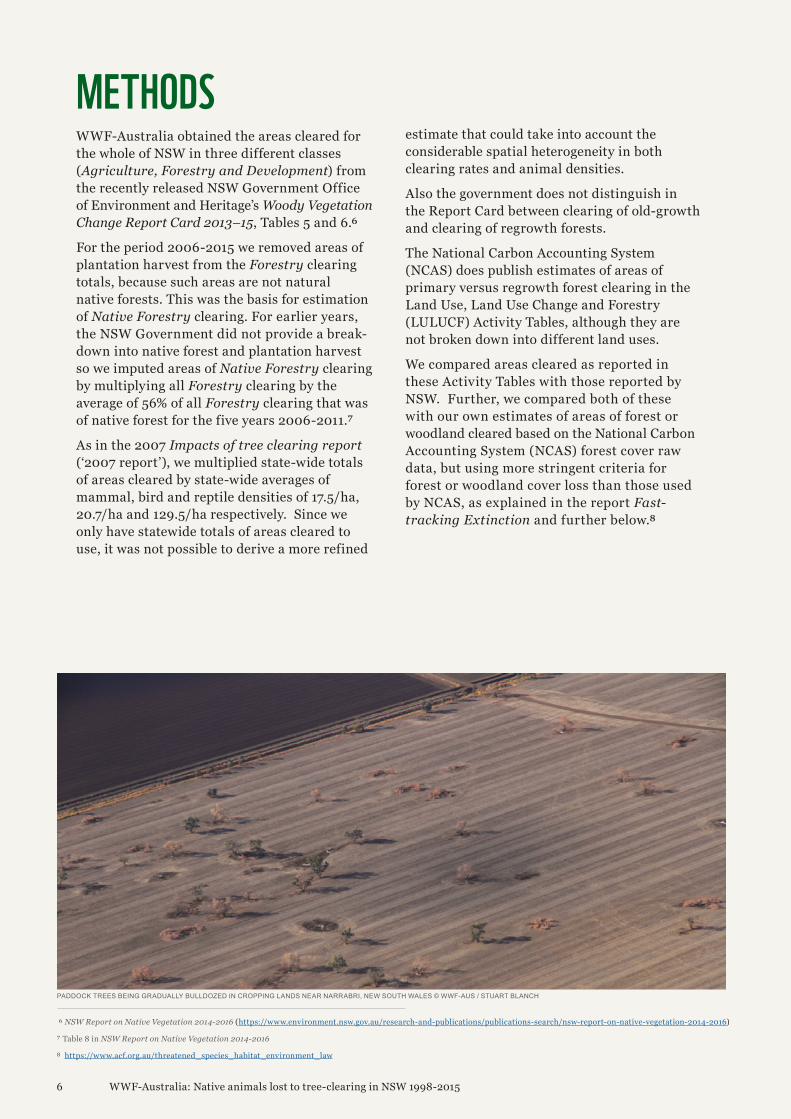
METHODS WWF-Australia obtained the areas cleared for the whole of NSW in three different classes (Agriculture, Forestry and Development) from the recently released NSW Government Office of Environment and Heritage’s Woody Vegetation Change Report Card 2013–15, Tables 5 and 6.⁶
For the period 2006-2015 we removed areas of plantation harvest from the Forestry clearing totals, because such areas are not natural native forests. This was the basis for estimation of Native Forestry clearing. For earlier years, the NSW Government did not provide a break-down into native forest and plantation harvest so we imputed areas of Native Forestry clearing by multiplying all Forestry clearing by the average of 56% of all Forestry clearing that was of native forest for the five years 2006-2011.⁷
As in the 2007 Impacts of tree clearing report (‘2007 report’), we multiplied state-wide totals of areas cleared by state-wide averages of mammal, bird and reptile densities of 17.5/ha, 20.7/ha and 129.5/ha respectively. Since we only have statewide totals of areas cleared to use, it was not possible to derive a more refined
estimate that could take into account the considerable spatial heterogeneity in both clearing rates and animal densities.
Also the government does not distinguish in the Report Card between clearing of old-growth and clearing of regrowth forests.
The National Carbon Accounting System (NCAS) does publish estimates of areas of primary versus regrowth forest clearing in the Land Use, Land Use Change and Forestry (LULUCF) Activity Tables, although they are not broken down into different land uses.
We compared areas cleared as reported in these Activity Tables with those reported by NSW. Further, we compared both of these with our own estimates of areas of forest or woodland cleared based on the National Carbon Accounting System (NCAS) forest cover raw data, but using more stringent criteria for forest or woodland cover loss than those used by NCAS, as explained in the report Fast-tracking Extinction and further below.⁸
⁶ NSW Report on Native Vegetation 2014-2016 (https://www.environment.nsw.gov.au/research-and-publications/publications-search/nsw-report-on-native-vegetation-2014-2016)
⁷ Table 8 in NSW Report on Native Vegetation 2014-2016
⁸ https://www.acf.org.au/threatened_species_habitat_environment_law
PADDOCK TREES BEING GRADUALLY BULLDOZED IN CROPPING LANDS NEAR NARRABRI, NEW SOUTH WALES © WWF-AUS / STUART BLANCH
7 WWF-Australia: Native animals lost to tree-clearing in NSW 1998-2015
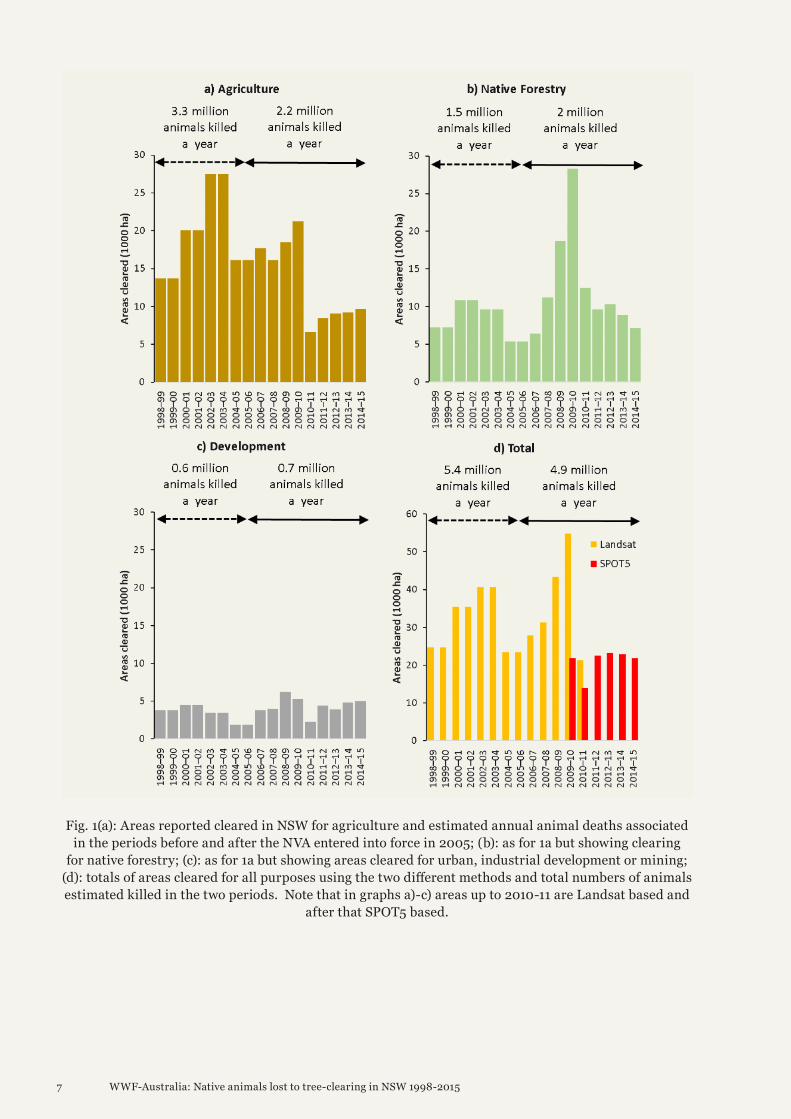
Fig. 1(a): Areas reported cleared in NSW for agriculture and estimated annual animal deaths associated in the periods before and after the NVA entered into force in 2005; (b): as for 1a but showing clearing
for native forestry; (c): as for 1a but showing areas cleared for urban, industrial development or mining; (d): totals of areas cleared for all purposes using the two different methods and total numbers of animals estimated killed in the two periods. Note that in graphs a)-c) areas up to 2010-11 are Landsat based and
after that SPOT5 based.
8 WWF-Australia: Native animals lost to tree-clearing in NSW 1998-2015
RESULTS AND DISCUSSION Scale of clearing and animals killed A total of 517,956 hectares of native bushland was reportedly cleared for agriculture, native forestry and other development from 1998 to 2015, in the NSW Government’s Office of Environment and Heritage (OEH) Woody Vegetation Change Report Card 2013–15.
Multiplying by average densities, this gives estimates of at least 9.1 million mammals, 10.7 million birds, and 67.1 million reptiles killed, over 86.9 million animals in total.
These figures largely bear out the predictions of the 2007 report, but fortunately, are lower than predicted in that report which was based only on areas approved for clearing, not actual areas cleared.
Evidently, only a fraction of the pre-2005 approvals were fully exercised. Clearing after 2005 necessarily also involves new clearing authorisations which also must have contributed to these clearing figures, including permits under Property Vegetation Plans (which would have been offset), and self-assessable code clearing (which does not require a permit) introduced in 2007-8 for private native forestry, and in 2014-15 for Invasive Native Shrub, Thinning and Paddock Tree clearing.⁹
Agricultural clearing brought down by Native Vegetation Act Only clearing rates for agriculture were significantly reduced by the ban on broadscale clearing introduced in 2005 (Fig. 1a). The Native Vegetation Act (NVA) saw about a million fewer animals killed annually by agricultural clearing, going from an average of 3.3 million a year prior to 2005, to 2.2 million afterwards.
In contrast, clearing rates for native forestry and built developments, which were largely regulated outside of the NVA, both increased between the two period 1998-2005 and 2005-2015, resulting in an additional 0.6 million animals killed annually, and undercutting the reductions in animals killed due to agricultural clearing (Fig. 1b, 1c, 1d).
Clearing data provided by the government are complicated by the fact that the government changed methodologies in 2011-12 to one based on SPOT satellite photos. This method was shown in the two previous years to significantly under-estimate clearing relative to the earlier Landsat satellite photo-based method (Fig. 1d).
Nonetheless, both SPOT- and Landsat- derived estimates show a clear and dramatic step-down in agricultural clearing in 2010-11 which continued until at least 2014-15, which is the latest year for which statistics have been published.
⁹ Table 1 of the NSW Report on Native Vegetation 2014-2016 (https://www.environment.nsw.gov.au/research-and-publications/publications-search/nsw-report-on-native-vegetation-2014-2016)
9 WWF-Australia: Native animals lost to tree-clearing in NSW 1998-2015
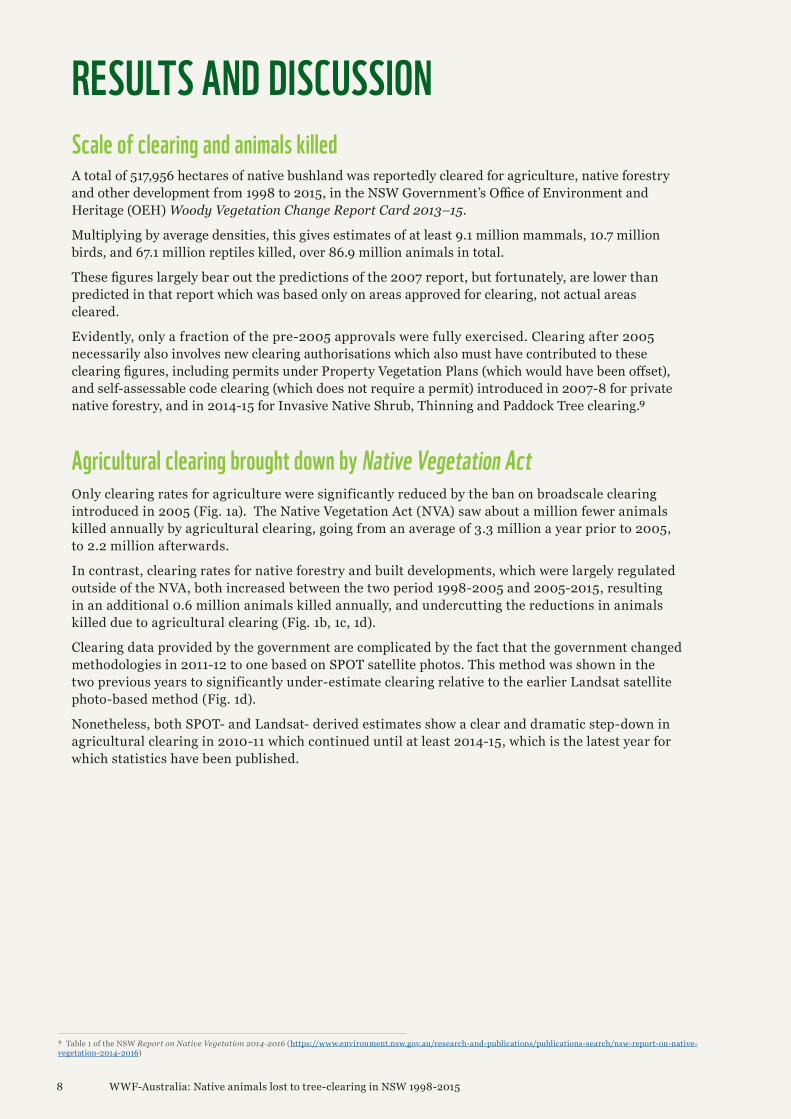
Types of animals killedAs in the 2007 report, the vast majority of animals killed (over three quarters) are estimated to be reptiles, with mammals and birds of the same order. Among mammals, possums and gliders, dasyurids and rodents comprise the bulk of animals killed (Fig. 2). This is an inevitable result of smaller animals having higher population densities on average, although small animals can also be quite localised and rare in their distributions.
These densities may have attenuated somewhat in reality since the studies from which density estimates were derived for the 2007 report, because of repeated droughts and the debilitating effects of fragmentation and habitat degradation on populations over the past decade.¹⁰
However, the density estimates were already deliberately conservative under-estimates of densities of animals in each of these major vertebrate groups. The estimates in this update are likely to still under-estimate actual densities and death rates.¹¹
¹⁰ Seabrook, L., et al. 2011. Drought-driven change in wildlife distribution and numbers: a case study of koalas in south west Queensland. Wildlife Research, 38, 509-524.
¹¹ Johnson et al 2007 cited above.
¹² Johnson, C., Cogger, H., Dickman, C. and Ford, H. (2007) Impacts of tree clearing: The impacts of approved clearing of native vegetation on Australian wildlife in New South Wales. WWF-Australia Report, WWF-Australia, Sydney. (http://www.wwf.org.au/news_resources/resource_library/?1482/Impacts-of-landclearing)
Fig. 2. Relative representation of vertebrate classes in animal densities (LEFT) and relative representation of mammalian groups in the densities of mammals (RIGHT) used in calculating
numbers of animals killed, per Tables 3-6 in Johnson et al. 2007.
10 WWF-Australia: Native animals lost to tree-clearing in NSW 1998-2015
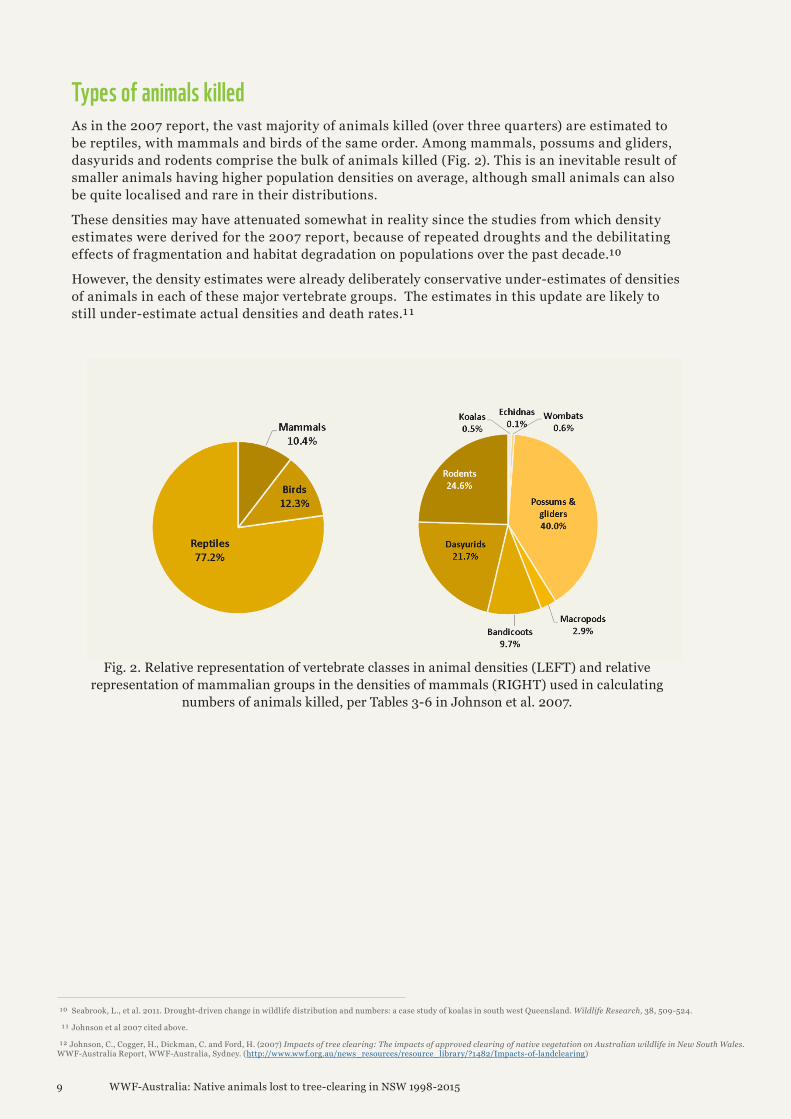
¹³ WWF-Australia and Nature Conservation Council of NSW, 2018. Bulldozing of bushland doubles around Moree and Collarenebri after safeguards repealed in NSW. Online, available at: <https://bit.ly/2IZJGeD> accessed 14 October 2018. NOTE: SLATS spatial data have been re-analyzed and updated to annualised figures 18/10/18. No spatial data after 2014 have yet been released. SLATS areas of woody cover loss due to natural causes, fire, forestry or plantation harvest are excluded to be completely equivalent to the WWF/NCC study methodology.
Fig. 3. Areas cleared per annum in the Moree and Collarenebri study area (inset map) according to NSW SPOT-based SLATS (2009-2014) clipped to the study area, and according to the WWF/NCC study for 2016-18.
11 WWF-Australia: Native animals lost to tree-clearing in NSW 1998-2015
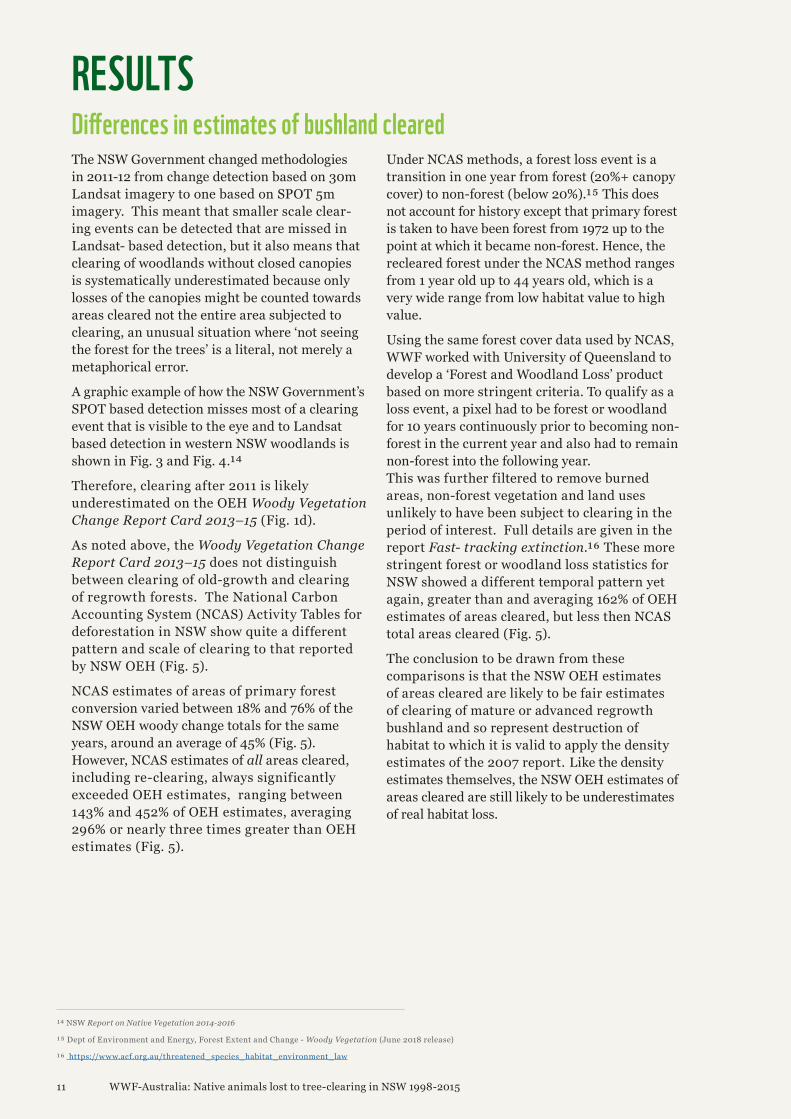
RESULTS Differences in estimates of bushland cleared The NSW Government changed methodologies in 2011-12 from change detection based on 30m Landsat imagery to one based on SPOT 5m imagery. This meant that smaller scale clear-ing events can be detected that are missed in Landsat- based detection, but it also means that clearing of woodlands without closed canopies is systematically underestimated because only losses of the canopies might be counted towards areas cleared not the entire area subjected to clearing, an unusual situation where ‘not seeing the forest for the trees’ is a literal, not merely a metaphorical error.
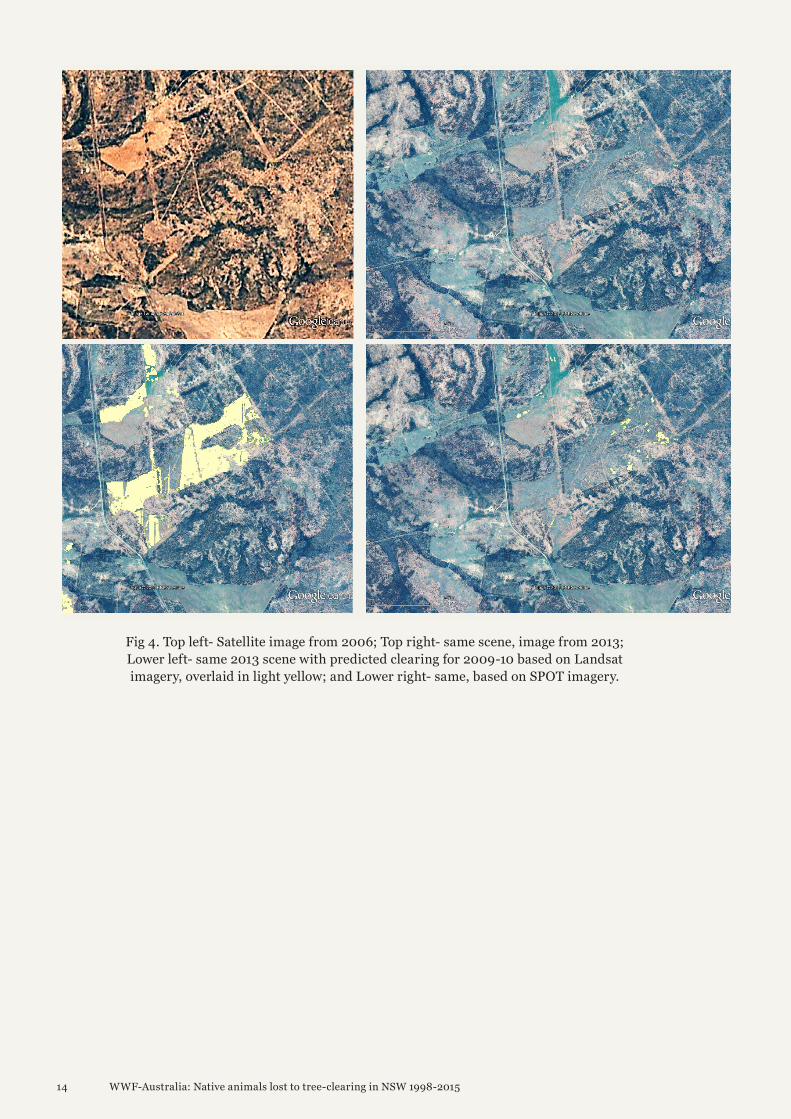
A graphic example of how the NSW Government’s SPOT based detection misses most of a clearing event that is visible to the eye and to Landsat based detection in western NSW woodlands is shown in Fig. 3 and Fig. 4.¹⁴
Therefore, clearing after 2011 is likely underestimated on the OEH Woody Vegetation Change Report Card 2013–15 (Fig. 1d).
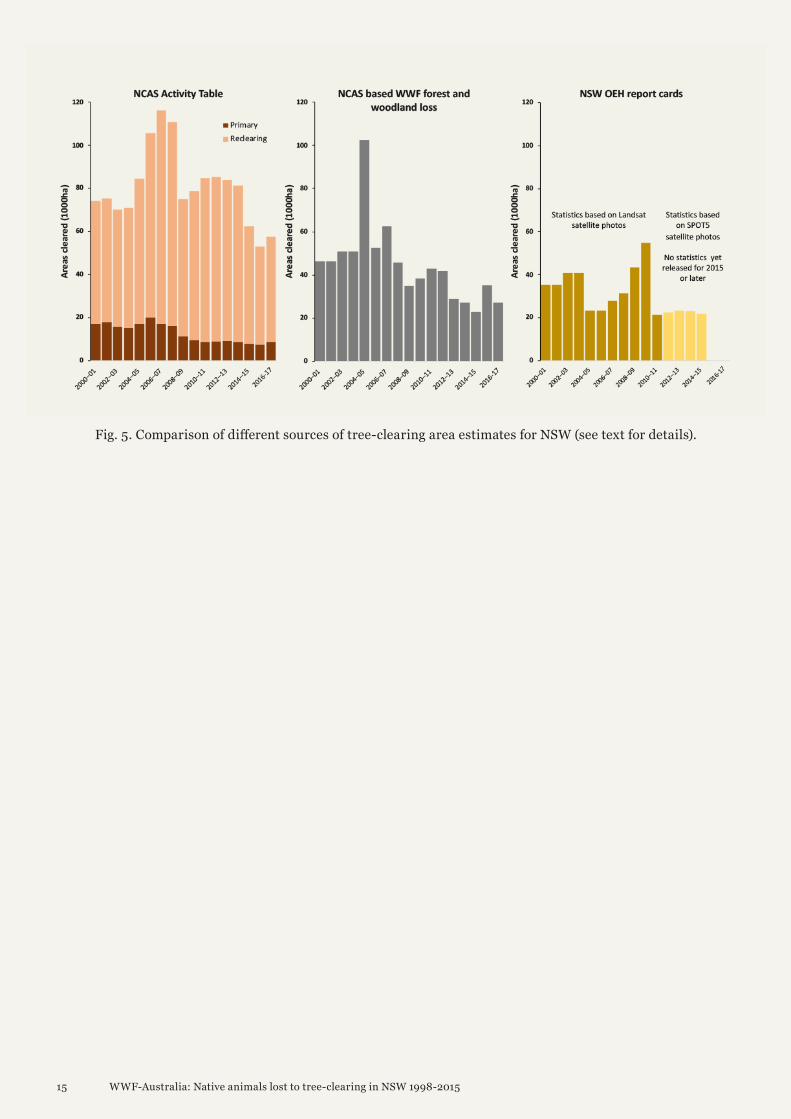
As noted above, the Woody Vegetation Change Report Card 2013–15 does not distinguish between clearing of old-growth and clearing of regrowth forests. The National Carbon Accounting System (NCAS) Activity Tables for deforestation in NSW show quite a different pattern and scale of clearing to that reported by NSW OEH (Fig. 5).
NCAS estimates of areas of primary forest conversion varied between 18% and 76% of the NSW OEH woody change totals for the same years, around an average of 45% (Fig. 5). However, NCAS estimates of all areas cleared, including re-clearing, always significantly exceeded OEH estimates, ranging between 143% and 452% of OEH estimates, averaging 296% or nearly three times greater than OEH estimates (Fig. 5).
Under NCAS methods, a forest loss event is a transition in one year from forest (20%+ canopy cover) to non-forest (below 20%).¹⁵ This does not account for history except that primary forest is taken to have been forest from 1972 up to the point at which it became non-forest. Hence, the recleared forest under the NCAS method ranges from 1 year old up to 44 years old, which is a very wide range from low habitat value to high value.
Using the same forest cover data used by NCAS, WWF worked with University of Queensland to develop a ‘Forest and Woodland Loss’ product based on more stringent criteria. To qualify as a loss event, a pixel had to be forest or woodland for 10 years continuously prior to becoming non-forest in the current year and also had to remain non-forest into the following year. This was further filtered to remove burned areas, non-forest vegetation and land uses unlikely to have been subject to clearing in the period of interest. Full details are given in the report Fast- tracking extinction.¹⁶ These more stringent forest or woodland loss statistics for NSW showed a different temporal pattern yet again, greater than and averaging 162% of OEH estimates of areas cleared, but less then NCAS total areas cleared (Fig. 5).
The conclusion to be drawn from these comparisons is that the NSW OEH estimates of areas cleared are likely to be fair estimates of clearing of mature or advanced regrowth bushland and so represent destruction of habitat to which it is valid to apply the density estimates of the 2007 report. Like the density estimates themselves, the NSW OEH estimates of areas cleared are still likely to be underestimates of real habitat loss.
¹⁴ NSW Report on Native Vegetation 2014-2016
¹⁵ Dept of Environment and Energy, Forest Extent and Change - Woody Vegetation (June 2018 release)
¹⁶ https://www.acf.org.au/threatened_species_habitat_environment_law
12 WWF-Australia: Native animals lost to tree-clearing in NSW 1998-2015
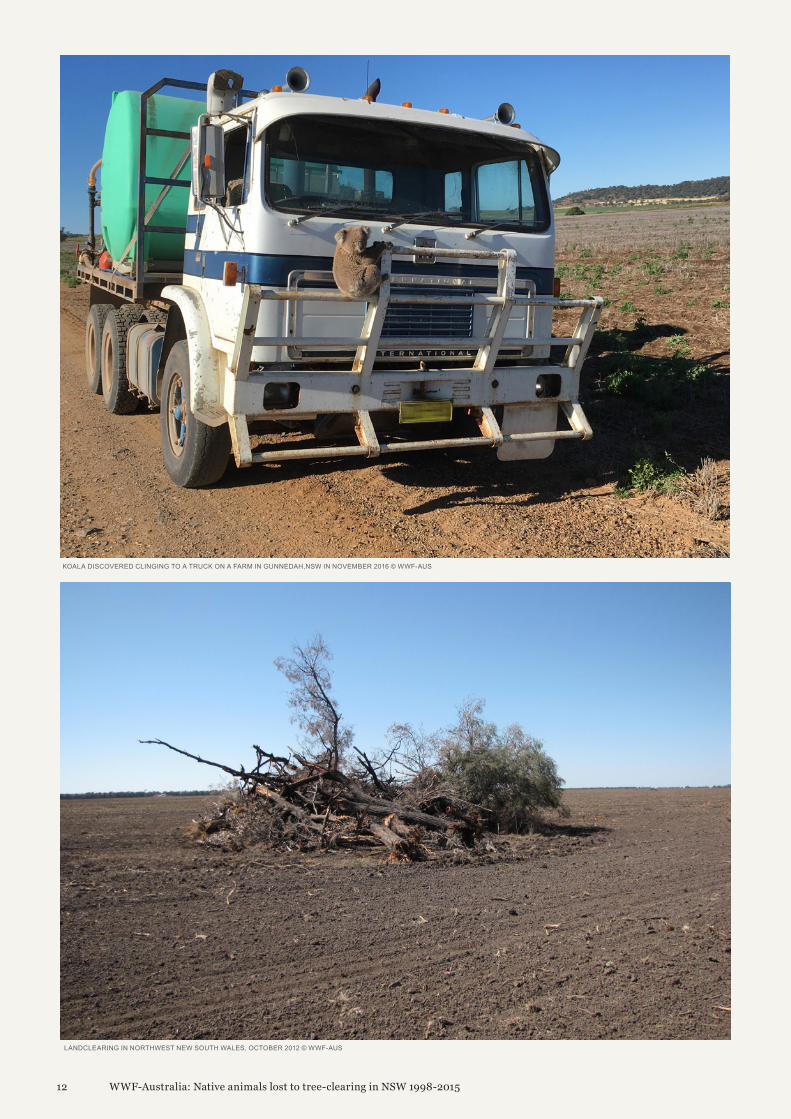
KOALA DISCOVERED CLINGING TO A TRUCK ON A FARM IN GUNNEDAH,NSW IN NOVEMBER 2016 © WWF-AUS
LANDCLEARING IN NORTHWEST NEW SOUTH WALES, OCTOBER 2012 © WWF-AUS
13 WWF-Australia: Native animals lost to tree-clearing in NSW 1998-2015
10.7 MILLION BIRDS
KILLED IN NSW BY TREE-CLEARING
BETWEEN 1998-2015 (estimated average)
What does the future hold for native animals in NSW?The repeal of the NVA in August 2017 has been followed by the near tripling of tree clearing rates in an approx. 200 × 100 km study area in northwest NSW (Fig. 3).
If true of the rest of the state, such a dramatic escalation in clearing rates would wipe out all the gains made under the NVA during the period it was in force and result in levels of native wild animal death and habitat loss greater than observed during the period before the NVA came into force, of as many as 15 million animals a year.
By comparison, Queensland annual animal deaths due to clearing are estimated to be of the order of 45 million animals a year.¹⁷ As in Queensland, this represents not only a conservation crisis but an animal welfare crisis, as these animals also suffer considerably as a result of habitat destruction.¹⁸
Our worst fears for the biodiversity, wildlife and wild animal welfare impacts from repeal of the Native Vegetation Act in NSW are being realised.
It is imperative that strong safeguards of forests and wildlife habitats be restored, with legislation enacted to facilitate this.
Suggested citation: Taylor, MFJ, Dickman, CR (2018) Native animals lost to tree-clearing in NSW 1998-2015. An update to Johnson, C., Cogger, H., Dickman, C. and Ford, H. (2007) Impacts of tree clearing: The impacts of approved clearing of native vegetation on Australian wildlife in New South Wales. WWF-Australia Report, WWF-Australia, Sydney. (http://www.wwf.org.au/news_resources/resource_library/?1482/Impacts-of-landclearing)
CONCLUSION
¹⁷ Cogger H, Dickman C, Ford H, Johnson C and Taylor MFJ, 2017. Australian animals lost to bulldozers in Queensland 2013-15 (Updated to 2015-16). WWF-Australia technical report. http://www.wwf.org.au/ArticleDocuments/353/pub-australian-animals-lost-to-bulldozers-in-queensland-2013-15-25aug17.pdf.aspx ¹⁸ https://www.wwf.org.au/ArticleDocuments/353/pub-tree-clearing-hidden-crisis-of-animal-welfare-queensland-7sep17.pdf.aspx
14 WWF-Australia: Native animals lost to tree-clearing in NSW 1998-2015
Fig 4. Top left- Satellite image from 2006; Top right- same scene, image from 2013; Lower left- same 2013 scene with predicted clearing for 2009-10 based on Landsat imagery, overlaid in light yellow; and Lower right- same, based on SPOT imagery.
15 WWF-Australia: Native animals lost to tree-clearing in NSW 1998-2015
Fig. 5. Comparison of different sources of tree-clearing area estimates for NSW (see text for details).
WWF.ORG.AUAUS
NATIVE ANIMALS LOST TO TREE-CLEARING IN NSW 1998-2015
WWF: advancing environmental protection in Australia since 1978
TREE-CLEARING
LOW CARBON FUTURE
PROTECT OUR MARINE LIFE
SPECIES
FOODWWF-Australia campaigns alongside farmers,
industry and local and state governments to help see excessive tree-clearing in Queensland and
New South Wales significantly reduced.
We promote innovative, low carbon and zero carbon solutions to achieve a more climate
resilient future before 2050.
We work with partners, governments, Indigenous communities and corporate partners to protect the marine migratory pathways of our turtles, whales, penguins and other marine species.
WWF focusses on bringing some of our most-loved Aussie wildlife species, including the black-flanked rock-wallaby, green turtle, quokka, and koala, back from the brink of extinction.
WWF works towards having sustainable food more widely available than ever before while striving for deeper reductions in food wastage.
BA
CK
CO
VE
R P
HO
TO C
RE
DIT ©
NA
SA
Why we are here
wwf.org.au
To stop the degradation of the planet’s natural environment andto build a future in which humans live in harmony with nature.
©1986 Panda symbol WWF ® WWF is a registered trademark
Level 1/1 Smail Street,Ultimo NSW 2007GPO Box 528Sydney NSW 2001
Tel:+1800 032 [email protected]@WWF_Australiawwf.org.au
WWF-Australia National Office