
National Science Teacherssociation, 1742 - ERIC
270
DOCUMENT RESUME 'ED 111 662 SE 019 617 AUTHOR Fowler, John W. TITLE Energy-Environment Source Book. Volume 1: Energy, Society, and the Environment. Volume 2: Energy, Its Extraction, Conversion and Use. INSTITUTION National Science Teachers Association, Washington, D.C. SPONS AGENCY Office of Education (DHEW), Washington, D.C. Office of Environmental Education. BUREAU NO BR-0-047FPA PUB DATE 75 CONTRACT OEC-0-74-8736 NOTE 270p.; For related documents, see SE 019 618 and 619 \N AVAILABLE FROM National Science Teacherssociation, 1742 . Connecticut Amenue,...1, W.,_ Washington, D. C. 20009 1 (Stock Number 471-14692, $4.00 prepaid) EDRS PRICE MF-$0.76 Plus Postage. HC Not Available from EDRS. DESCRIPTORS Conservation (Environment) ; Elementary Education; *Elementary School Science; *Energy; Environmental Education; Instructional Aids; *Instructional Materials; *Natural Resources; Science Education; Secondary Education; *Secondary School Science IDENTIFIERS National Science Teachers Association; NSTA ABSTRACT This source book, one part of a three-part NSTA series on energy-environment, is written for teachers who wish to incorporate material on lie complex subject of energy into their teaching. This work is divided into two volumes, each with numerous tables and figures, along with appendices containing a glossary, mathematics primer, heat engine descriptions, and nucliar energy_ discussion. Volume 1 (Energy, Society, and the Environment) deals with energy and its relationship with conservation, the environment, the economy, and strategies for energy conservation. In Volume 2 (Energy, Its Extraction, Conversion, and Use), topics discussed include the rate of energy consumption, future sources of energy, and the increased cost of energy. (Author/CP) *********************************************************************** Documents acquired by ERIC include many informal unpublished * material not available from other sources. ERIC makes every effort * * to obtain the best copy available. nevertheless, items of marginal * * reproducibility a..-.7e often encountered and_this affects the quality * * of the microfiche and hardcopy reproductions ERIC makes available * * via the ERIC Document Reproduction Service (EDRS). EDRS is not * responsible for the quality of the original document. Reproductions * * supplied by EDRS are the best that can be made from the original. ***********************************************************************
-
Upload
khangminh22 -
Category
Documents
-
view
1 -
download
0
Transcript of National Science Teacherssociation, 1742 - ERIC

DOCUMENT RESUME
'ED 111 662 SE 019 617
AUTHOR Fowler, John W.TITLE Energy-Environment Source Book. Volume 1: Energy,
Society, and the Environment. Volume 2: Energy, ItsExtraction, Conversion and Use.
INSTITUTION National Science Teachers Association, Washington,D.C.
SPONS AGENCY Office of Education (DHEW), Washington, D.C. Officeof Environmental Education.
BUREAU NO BR-0-047FPAPUB DATE 75CONTRACT OEC-0-74-8736NOTE 270p.; For related documents, see SE 019 618 and
619 \NAVAILABLE FROM National Science Teacherssociation, 1742
. Connecticut Amenue,...1, W.,_ Washington, D. C. 20009
1
(Stock Number 471-14692, $4.00 prepaid)
EDRS PRICE MF-$0.76 Plus Postage. HC Not Available from EDRS.DESCRIPTORS Conservation (Environment) ; Elementary Education;
*Elementary School Science; *Energy; EnvironmentalEducation; Instructional Aids; *InstructionalMaterials; *Natural Resources; Science Education;Secondary Education; *Secondary School Science
IDENTIFIERS National Science Teachers Association; NSTA
ABSTRACTThis source book, one part of a three-part NSTA
series on energy-environment, is written for teachers who wish toincorporate material on lie complex subject of energy into theirteaching. This work is divided into two volumes, each with numeroustables and figures, along with appendices containing a glossary,mathematics primer, heat engine descriptions, and nucliar energy_discussion. Volume 1 (Energy, Society, and the Environment) dealswith energy and its relationship with conservation, the environment,the economy, and strategies for energy conservation. In Volume 2(Energy, Its Extraction, Conversion, and Use), topics discussedinclude the rate of energy consumption, future sources of energy, andthe increased cost of energy. (Author/CP)
***********************************************************************Documents acquired by ERIC include many informal unpublished
* material not available from other sources. ERIC makes every effort ** to obtain the best copy available. nevertheless, items of marginal *
* reproducibility a..-.7e often encountered and_this affects the quality ** of the microfiche and hardcopy reproductions ERIC makes available *
* via the ERIC Document Reproduction Service (EDRS). EDRS is not* responsible for the quality of the original document. Reproductions ** supplied by EDRS are the best that can be made from the original.***********************************************************************

NSTA,NationalScience Teachers
_Association
PERMISSION TO REPRODUCE THISCOPYRIGHTED MATERIAL AY MICRO.FICHE ONLY HAS SEEN GRANTED DY
N.S.T.A.TO ERIC AND ORGANIZATIONS OPERATING UNDER AGREEMENTS WITH THE NA710NAL INSTITUTE OF EDUCATIONFURTHER REPRODUCTION OUTSIDETHE ERIC SYSTEM REOUIRES FERMISSION OF THE COPYRIGHT OWNER
U S. ,EPARTMENT OF HEALTH,EDUCATION& WELFARENATIONAL INSTITUTE OF
EDUCATIONDOCUMENT HAS ISEEN FZEPPO
DOCED EXACTLY AS RECEIVED FROMTHE PERSON OR OROANtCA ZION ORIGINATING IT POINTS OF VIEW OR OPINIONSSTAED 00 NOT NI.Ct.::ANILY REPRESENT 04-;,CAL NA TONAL 'NSTITUTEOF
,FOUrAT Ov POSITON OR POLICY
ENERGY-ENVIRONMENTSOURCE BOOK
Volume 1Energy,Society,And theEnvironment
2
Volume 2Energy,its ExtractionCoriversion,And Use

ENERGY-ENVIRONMENTSOURCE BOOK
Volume 1Energy,
Society,
And theEnvironment
John W. Fowler
NSTANationalScience TeachersAssociation
1742 Connecticut Avenue, N.W.Washington, D.C. 20009
Volume 2Energy,
Its Extraction,
Conversion,And Use
Robert L. Silber, Executive Director

ENERGY-ENVIRONMENTSOURCE BOOKJohn M. Fowler
A product of theNSTA Energy-Environment Materials ProjectJohn M. Fowler, Director
The development of these materials was supportedby the Office of Environmental Education under theEnvironmental Education Act of 1970 (P.L. 93-278)...
Contract #OEC -0 -74 -8736Project R0047FRADivision of Technology and Environmental
Education, U.S. Office of Education
Publication and distributionwas supported, in part, bya contract from the Office of Conservation Education ofthe Federal Energy Administration.
Copyright r, 1975 by the National Science Teachers Association.
Copyright is claimed until June 1, 1980, thereafter all portions of thiswork covered by this copyright will be in the public domain.
This work was produced pursuant to a grant(s) from the U.S. Office ofEduqation, Department of Health, Education and Welfare, However,the content does not necessarily reflect the position or policy of thatAgency, and no U.S. Government endorsement should be inferred.
Stock No, 471-14692 Price: $4.00
4

To my children, Lee, Lynn, Kay, Kurt, Leslie, Ada, andMarian, who will need energy for their future.
JMF

PREFACEThiS'Source Book is written for teachers who wish to
incorporate material on the complex subject of energyinto their teaching. I have tried to condense the vo-luminoui informaticin on energy and on its interactionwith society and the environment and to present it in anobjective and readable style.
I was greatly assisted in this endeavor by the projectstaff and in particular by Stephen Smith and James V.De Rose who read and commented on most of themanuscript.
The Advisory Committee, whose members are listedin the Foreword, was helpful through all phases of thisproject. Richard Scheetz, William Burton, Betsy Kraft,Charles Pelzer, and Alice. Tetelman of the AdvisoryComMittee gave assistance well beyond the call of duty.
The Source Book also profited from the attention.ofthe several teacher-reviewers'listed-in Appendix 7.
Nancy Smith edited much of Volume II and compiledthe Glossary. Stephen-Smith wrote the first drafts of theTet.thnical Appendices. Elizabeth Weiner performedthe difficult task of editing before final publication.
The typing was done by Dianne Schroeder andBrenda Gainor. Carol Lee Bloom, the Executive Secre-tary of the project, also drew most of the Source Bookfigures. --
I wish also to extend my personal gratitude and that ofthe project staff to Robert L. Silber, Executive Director,and the people of the National Science Teachers As-sociation for their hospitality and support, and to WalterBogan, Director of the Division of Technology and En-vironmental Education, U.S. Office of Education, whosesupport and encouragement made the project possibleand enjoyable.
JMF
January 1975

FOREWORDThe members of the Advisory Committee of the
NSTA Energy-Environment Materials Project areunW-in-their belief in the importance of this- project.The complex energy-environment subject contains in itsome of the most crucial issues of our time. It is a subjectthat deserves a place in school curricula. We hope andbelieve that these materials will be of great assistance toteachers and students who wish to bring these conceptsand issues into their courses.
The Advisory. Committeemas assembled to gain thediverse perspectives of a variety of interests and pointsof view. We have read these materials, discussed themat several meetings and with individual staff members,and have made suggestions and comments. Many ofthese have been incorporated in the materials. With thediverse points of view represented, complete unanimitycannot be expected, but the Committee is satisfied thatthe materials represent a balanced presentation. Dr.John Fowler, his staff, and the National ScienceTeachers Association should be commended for thisfine' effort. The bivision of Technology and Environ-mental Education of the U.S. Office of Educationshould be likewise commended for financial support ofthis project.
Finally, it should be noted ticailiceinbeiicitiheory Committee speak as individuals and not in an officialcapacity for the organizations with which they are as-sociated.

ADVISORY COMMITTEE
Dean AbrahamsonSchool of Public AffairsUniversity of Minnesota
Ronald RidkerResources for the Future
Robert L. SilberNational Science Teachers Association
Wilfred C. Burton Alice TetelmanCitizens Advisory Committee on Environmental QualityAmerican Gas Asiociation
Richard Cortright_National Education Association.
Ch&le's EddyCouncil on Environmental Quality(Formerly with Ford Energy Project)
Ralph LappQuadri-Science, Inc.. 1+.
,tames W. Latham, Jr.Maryland State Department of Education
Warren MuirCouncil on Environmental Quality
Charles Pelzer',U.S. Atomic Energy Commission.
Richard B. ScheetzEdison Electric Institute
Constance TateBaltimore City Public Schools
James L. AldrichConservation Foundation
Robert CartwrightAmerican Petroleum Institute
Craig2National Scilnce Foundation
Betsy KraftNational Coal Association
Briin J.National Council for the Social Studies
Bernard LukcoU.S. Environmental Protection Agency
Alan McGowanScientists Institute for Public Information
tRepresented by'Burrell Wood, October 29 and December 17
2Represented by Paul Loris, July 31

Contents
Volume I
A Review and a Preview
Chapter 1Evidence of Crisis 1
Chapter 2Energy Production and the Environment 13
Chapter 3Energy Transport and the Environment 23 .
Chapter-4The Environment ana Energy Consumption 31
Chapter 5Energy and the Economic System 47
Chapter 6Prospects and Strategies for Energy Conservation 65
Chapter 7Energy Policy and Options for the Future 85
'Volume II
Chapter 1Energy: What It Is What it Does
Chapter 2The Energy Stockpiles
Chapter 3The Flow of Energy
Chapter 4The Eiponential Century
Chapter 5How Much, At What Price, For How Long
Chapter 6New-FlamesProrrrOld Fuels-
Chapter 7Living On the Inte;rest, the Continuous Sources
Technical Appendices
103
113
131
153
177
191
205
Appendix 1Glossary 223
Appendix 2A Mathematics Primer 233

Appendix 3Force, Work, Energy, and Power 239
Appendix 4Heat and Heat Engines 245
Appendix 5Generation, Transmission, and Distribution
of Electricity.11
253-
Appendix 6'Energy from the Nucleus 261
Appendix 2'Source,Book Reviewers 273
Index 277
es

Figures / Volume I
1 Utility and Coal Projects in theFour Corners- Region
2 Utility and Coal Projects hi theNorth ,Central Plains
iii
vii-
1-1 Cat,gc4.ieS of Energy Consumption 3
1-2- End Uses of Energy 3
1-3. Sources of Energy 3
1-4 Sources of Air Pollution 5
2 -1 Coal Mining Injuries 14
4-1 Distribution of Emissions Species 31
4-2 Sources of the Pollutants 33
4-3 Deaths and Air Pollution in London, 1952 34
4-4 Approximate Distribution of AutomobilePollutants by Source 35
4-5 Water Requirement 1 for Utility OwnedElectric Plants 37
4.6 Annual Production of Radioactive Waste 40
5-1 U.S. Total Energy COnsumptionVersus GNP, 1930-1973 47
5-2 Per Capita Energy ConsumptionVersus GNP, Selected Countries 48
5-3 Energy to GNP Ratio, U.S., 1947-1973 49
5-4 Employment and Energy Consumption UnderDifferent Options 52i
5-5 Household Energy Use by Income Group 53
5-6 Average Family Income and Percent 1.0t,Spent for Energy
g-7 Direct and Indirect Energy Use byIncome Group 55
5-8 Total Energy Use in Fool System VersusCalories of Food Produced 56
5-9 G\rowth in Energy Consumption ofFood System Components 56
5-10 Food Energy Output Versus EnergyInput to Food System 57
5-11 Distribution of Total EnvironmentalExpenditures, 1972-1981 61
6-1 Effect of Speed on Fuel Economy 66
6-2 Potential Energy Saving of EmergencyConservation Programs 67
6-3 Approximate Flow of Energy Through theU.S. Economy. 68
6-4 Passenger Miles Traveled in Urban PassengerTransport and Intercity Passenger Transport 69
6-5 Transportation Energy Efficiency 69
6-6 Energy Intensiveness of Passenger Transport 70
6-7 Composition of Passenger Transport 71
2
r ;-4. .

6-8 Efficiency of Cargo Transport
6-9 Composition of Intercity Freight Transport
6-10 Savings from Conservation Policy Optionsfor $11 Oil
7-1 Base Case Projeclions at $7 and $11Per Barrel Oil ,
7-2 Comparison of Forecaths for 1985
7-3 Comparison of Ford Energy PolicyProjections with Project Independence
72
72
78
92
94
96
Tat; les / volume I
3-1 Sources of Qcean Oil Pollution 23
3-2 Production of Fissionable Material in a1,000 Mw Reactor 27
4-1 Comparison of Other Cooling Systems withOnce-through Cooling 38
4-2 Average Ionizing Radiation Exposure ofU.S. Citizens 39
4-3 Accident Probabilities Per Reactor Year 41
4-4 Reactor AcCident Consequences 41
5-1 The Role of Energy Industries in the Economy 50
5-2 Total Employees in U.S. Energy Industriesand U.S. Energy Intensive ManufacturingIndustries, 1950-1971 51
5-3 Critical Occupations, Energy Operation andMaintenance, and Projected Growth of EnergySector Employment Compared to Total Economy,1970-1985 51
5-4 Critical Occupations, Energy RelatedConstruction 52
5-5 The Percentage of Family Income Spent onEnergy Declines as Income Increases 54
5-6 Percentage of Households Owning MajorAppliances, by Income Group 54
5-7 Annual Indirect Energy Use Per Householdby Income Groups 55
5-8 Energy Use in the U.S. Food System 58
5-9 Cumulative Capital Requirements forEnergy Production, 1975-1985 59
5-10 Comparison of Costs of PowerGenerating Plants 59
5-11, Estimated Total Pollution Control Costs 60
6-1 Energy Savings from Shift of PassengerTraffic from High to Low El Mode 70
6-2 Energy Savings from Load Factor Increasesin Passenger Travel 71
6-3 1974 Gas Mileage from EPASuburban/Urban Test Cycle 72
12

6-4 Energy. Savings from Shift of Freight TrP'ficfrom*High to Low El Mode 73
6-5 Potential Energy Sayings from Low-costMeasures : 74
6-6 Potential Energy Saving's from Homeown JrInvestment 74
6-7 Appliance Energy'Consumption 75
6-8 Energy Savings from Increased Efficiency 75
6-9 Possible Energy Savings in the IndustrialSector 77
6-1-0-CdngervatiorrActions-and-Sayings-at111-Per Barrel Oil, 1980 and 1985 79
7-1 The Oil Corripariies, Total Sales and Ranking byAssets in the Fortune 500 List . 87
7- ) Diversifieation in the Energy Industries by-the-25 Largest Petroleum CoMpaniets - 89
7 -3; Big Eight` Energy Producers 89
7-4 -Federal Retource Ownership and. 1972 Production , _91
7-5 Economic Impact of Base Case, 1985 93
7-6 Economic ResultscotzVariOus Strategies. 94
7-7 Projected Fuel and Energy Consumption Under. Various Strategies for 1985 95
i .7-8 -Environmental-Impacts of Energy Strategies 95
Figures / Volume II
1-1 Power Inputs to Earth 107
,2-1 Presentation of Resgerce Data 113
2-2 U.S. COal-Resources\ 114
2-3 Coal Fields of the U.S. 115
2-4 U.S. Oil Resourcet 116
2-5 Oil and-Gas Fields in the U.S. 116
2-6 U.S. Natural G4s Resources 117
2-7 Major Oil Shale Resources 118
2-8 U.S.-Oil Shale Resources 118
2-9 U.S. Uranium Resources 119
2-10 Uranium Resources, Western United States 120
2-11 U.S. Geothermal Resources 122
2-12 Location of Geothermal Resources 122
2-13 U.S. Ultimately Recoverable Resources 123
2-14 Remaining Recoverable FosSii-Fuel'Resources,Worldwide 124
2-15 Remaining-Recoverable Fossil" FueiReSeurces,by Region 125
3-1 Paths of Energy Conversion 131
3-2 Breakdown of U.S. Energy Consumption 132
3-3 Electrically Heated Homes in the U.S. 133

3-4 Transportation Energy, with Projection to 2000
3-5 Average Costs of Energy Transportation
3-6 Cot----Varison of Annual Per CapitaEnergy Consumption of Various Countriesand Regions,
3-7 PerCapitaConsumption of Energy
139
140
141
By-Economic Sector
3-8 Efficiencies of Important Energy 140
Conversion Processes ti 143
3 -9 Schematic Diagram of a Heat Engine 144
3_10 Efficiency, of Electric Generation. 145
3-11 Efficiency of Automobiles 146/4-12ffirtaSchematic Diagram of a Heat Pump 146
3-13 Approx to Flow of Energy Through' the, .S. Economy 148
4-1 /Historical ReCord of U.S. PopulationGrowth and Energy Cc:psumption 154
472 Historical Record of World Population. Growth and Energ Consumption 154
4-3 U.S. Energy Consu tion andPopulation--Semi) Plot 154
-4-4 World Energy Consumption andPopUlation--Semilog" Blot 154
4-t The Changing Fuel Mix 155
Gpnsurription of 'Fuel Wood 156
7 Consumptioh-of.Coal 156
4-8 U.S. Production and Collumptionof Petroleum 157
4-9 U.S.. Natural GaS Consumption 157
4=16 Electric Energy from Hydroelectric Powei 158
4-11 U.S. Consumption of Electricity 159
4-12 Consumption of Electric Energy in theTwo Major Consuming Sectors 160
4-13 World Energy Production by Source 160
4-14 Percentage. of World Energy Productionfrom the_Fo,yr Major Sources 161
4-)-5 World ProCluction of Electric Energy 162
4-16 Per Capita Consumption of lectric Energyin Various Regions 163
4-17a,b U.S. Population from 100, Linearand bemi!og Plots 164
4-18 Projections of U.S. Energy Consumption 165
4-19Projections of Energy Consumptionby Sectors 166
4-26 U.S. Energy Scenario, 1974-2024 167
4:21 'Projection of Primary EnergyinElectrical Production 168
4 -22 Productivity of U.S. Industry 170
14

4-23 Electricity Demand Projections 171
4-24 Projections of Worldwide Total and PerCapita Energy Consumption 172
4-25 Changing World Fuel Mix 173
4-26 Consumption of-Electric Energy,U.S. and Rest of World 173
5-1 U.S.bil and Gas Consumption 178
5-2 pomastic Drilling Activity 179
5-3 Comparison of National Petroleum CouncilSupply-and:Demand Projections 181
5-4 Average Values of OH, Gas, and4coal 184
5-5 Average Residential Prices of Fuelsand Electricity 186
6-1 HYGAS Coal Gasification Process 192
6-2- Flow Diagram for a,Coalplex 194
6-3 A MHD Generator 195
.6-4 Electric Power Weekly Load Curve' 197
6-5 Sketch of the Kinzua PumpedStorage Project 198
6-6 Uses of Hydrogen as an Intermediate Formof Energy 200
6-7 Schematic of a. Fuel Cell' 201
7-1 Solar Home Heating Feasibility 209
7-2 Home Solar Heating Systeni 210
7-3 Proposed Satellite Power Station 212
7 -4 Solar Farm 213
7-5 Laser-Fusion Power Generator 216
Tables / Volume II
1-1 Some Representative Energy Data 105
1-2 Some Representative Power Data 106
1-3 Energy Content of Various Fuels 108
2-1 Power Per Acre on Continuous U.S. 113-
2-2 U.S. Coal Resources 115
2-3 U.S. Oil Resources 117
2-4 U.S. Natural Gas Resources 117
2-5 U.S. Oil Shale Resources 118
2-6 U.S. Tar Sands Resources 118
2-7 U.S. Uranium Resources 121
2:)$U.S. Thorium Resources 121
fr,9 U.S. Energy Stockpiles 123
2-10 World Energy Cymsumption by Source 124
2-11 Global Distribution of Uranium Reserves 125
2-12 World Uranium Resources 126
World Thorium Resources 126

2-14 Maximum World tidal Power Capacity 126
2-15 World Water Power Capacity 126
3-1 Major End Uses of Energy 133
3-2 Energy Consumption by Sector 1343-3 Sources of Electric Power , 134
3-4 End Uses of Energy in the ResidentialSectors by Percentage 134
_3:5 Fuel Use in the Residential-Sector. 134
3-6 Electric Energy Consumption in theResidential Sector 134
3-7 Approximate PoweF Rating and EstimatedAnnual EnergylConsumption of Electric415lianceslificierNormATUse 135
3=8 End Uses of in*E;e-commerciaL_____:Sector by Percentage
3-9 Fuel Use inthe Commercial Sector 136 .
3-10 Electric Energy Consumption in theCommercial Sector 136
3-11 Industrial Fuels 137
3-12 Fuel lite by the Six Energy Industries 137
3-13 Energy Expenditure in Manufactureof Various,Metals 137
3-14 Energy for Protein Production 138
3715- Total Energy for Transportation 138
3-16 Energy System Efficiency ofElectric Lighting 147
3-17 Energy System, Efficiency ofWater Heating 147
3-18 Energy System Efficiency forSpace Heating 147
3-19 Energy System Efficiency ofthe Automobile - 148
4 -1 Energy ConsuMption by Sectors, 1947-1973 159
4-2 Per Capita/Electric Consumption ofSelected Countries 160
4-3 Projected Increases in U.S. ElectricEnergy Requirements by Classification of Use 169
4-4 Percentage Saturation of VariousElectric Appliances 171
5-1 U.S. Energy Supply, Domestic and Imported 177
5-2 Imports of Crude Oil into U.S 1972 177
5-3 Percentages of Total Energy andOil and Gas Imported 182
5-4 Summary of Cumulative CapitalRequirements, U.S. Energy Industries
-1971 -1985 183
5-5 Balance of Trade Deficit inEnergy Fuels, 1985 183
5.6 esource Lifetimes, U.S. 187

5-7 Resource Lifetimes, World 187
6-1 Comparative Costs-of Coal-DerivedSynthetic, Fuels 193
6-2 Federal Energy Funding for Researchand Development 196
7-1 Amounts of Dry, Ash -free Organic SolidWastes Produced in the U.S. in 1971 206
7-2 Annual Per-Acre Yields of "Energy Crops" 207
7-3 Cbsts of Space Heating 211
'Figures Technical Appendices
A2-1 U.S. Per Capita-Consumption ofElectriCity (Linear Scale) 234
A2-2 U.S. Per Capita Consumption ofElectricity (Semi logarithmic Scale) 234
A2z3Growth-of-t-14)00-at-6-P-ercent___Per Year (Linear Scale) 235
A2-4 Growth 441,000 at Indicated InterestRate (Semi logarithmic Scale) ' 235
A4-1 Comparison of Centigrade and FahrenheitTemperature Scales 245
A4-2 Molecular Model of Pressure on Piston 246
A4-3 Relationship Between Gas Pressureand Temperature 246
A4-4 Work Performed by an Expanding Gas 247 ,
A4-5 Heat Engine 248..
A5-1 Electron Flow in a Wire 253
A5-2 A.C. Voltage 254
A5-3 Generation, Transmission, andDistribution of Electricity 256
A5-4 Generation of an Electric Currentby Moving a Wire in a Magnetic Field 257
A5-5 Model of an Electric Generator 257
A5-6 Model.of a Transformer 258
A6-1 Binding Energy Per Nucleon 264
A6-2 Steps in the Fission Process 265
A6-3 Nudes( Reactor Core' 266
A6-4 Pressurized Water Reactor 267
A6-5 Boiling Water Reactor I 268
A6-6 Liquid Metal Fast Breeder Reactor 269
Tables /, Technical Appendices
A2-1 Large Numbers 233
A3-1 Commonly Used Units of Energy and Poi3er -242
A3-2 ConversionsEnergy Units 242
A3-3 ConversionsPower Units 242
.1 pi

INTRODUCTIONA Review and A Preview
/
.
%
;/

A Review and a PreviewThe "Shootout" at Four Corners
In 1950, Los Angeles was riding the bow wave ofAmerican growth. PopulatiOri, Metropolitan area ex-pressway mileage, economic importance were all in-creasing. Its cohsumption of energy, especially electric-ity, also was rowing. rapidly. The number of au-tomobiles was increasing and, not coincidentally, LosAngeles was in the front rank in another area airpollution.
The growth in electric energy consumption, the de-mand doub\ing every nine years, demanded the con-tinual additiop of new genera, plants. Here, however,the city's eager consumption of electricity, to cool instrwrier afidmarm in winter, and to turn the motors ofindustry, collided with hard meteorological and geo-graphical facts. Although California has ample oil andnatural gas resources, the tendency of air pollutants tohang long inlhe air above the city makes its citizensreluctant to burn even these relatively clean fuels in theirower lents. A decade or so before the rest of the
countryLos Angeles was hung on the horns of theenergy-environment dilemma.
Help was not long in coming. Beyond the mountainsand deserts to the east, in the area surrounding a placecalled Four Corners (the point where New Mexico, Col-orado, Utah, and Arizona join), were enormous re-sources of coal. This coal was not only a potentialsource, of energy, but it underlay a relatively uninhab-ited, arid Jand with no air pollution problems. TheArizona Publit Service Company was building a hugecoal-fired geherating plant there and plans-were madeto transmit the electrical power by high-voltage trahs-missioiLlines to Los Angeles and other Southwesternareas.
The 2 r Corners Plant,-near Farmington, New Mex-ico, b 'peration in the mid-1960s and by that timeplan were he drawing boards (in some cases con-struction ha b n) for five other huge plants. By 1969,the air pollu on fro the Four Corners Plant, the reali-zation of the social and environmental changesthat were taking place, and the complaints Of many ofthe local citizens, attracted national attentior Particu-larly sensitive, and well-suited to dramatic def nse, wasthe proposed location of one of the largest mines onIndian land, the "Black Mesa," the ancestral home of theHopi and Navajo Indians that is considered sacred bymany of them. The Sierra Club and other environmentalorganizations rallied t6opposition, the Governor of NewMexico proposed a moratorium on coal plants in theregion, and the battle was on.
Controversy over the plants in the Four Corners areawas at its height several years ago. It's now ancienthistory. We review it in this introduction, however, be-cause it has in it many of the components of the enlarg-ing energy-enVironment dilemma that we now face as acountry, and because it illustrates the mixture of fact andemotion, reason and irrationality, that is erupting on a
e
national scale. We can best describe this mix by quotingfrom the Senate Hearings' that were held in the springand summer of 1971 on the problems and potential ofthese power plants. These quotations tell their ownstory:
From an advertisement in The New York Times bythe "Black Mesa Defense Fund":
"... LIKE RIPPING APART ST. PETER'S, IN ORDERTO SELL THE MARBLE.
"So that the world can have still more of Los Angeles,Las Vegas, and Phoenix, six gigantic coal-burningpower plants and three huge strip-mines are underwayat and around Black' Mesa, Arizona. When operative,the complex will spread more deadly smog and sootthan currently put out in New York and Los Angelescombined, across eat is now 100,000 square miles ofopen country; the last pure air in America.
"Affected bythe smog will be six national parks, 28national monuments, the Lake Mead and Lake Powellrecreation-areas,-4d-Grand-Canyoit the places peo-ple escape to are being sacrificed to make more ofw7it they escape frorkAlso b6ifigsactifidadT:iribehalfof urban growth: the sacred religious shrines of theHopi and Navajo Indians, who had thought that itcouldn't happen again."2
From the Federal Power Commission:
"Demands for more and more electricity to meetindustrial needs for production of goods and services,society's ,desires for greater comforts and conveni-ences, and commerciat uses associated with the highstandard of living in the United States have resulted inan approximate doubling of electric loads in-each de-cade for a number of years. Forecasts indicate that thistrend is likely to continue throughout the remainder ofthe century.
"The Federal Power Commission's West RegionalAdvisory Committee for the National Power Survey hasconfirmed that the western portion of the United Stateswill likely follow the national trend and that electricgeneration in that region will in 1980 be about twice andin 1990 about four times that in 1970. In the past, muchof the electricity requireMent of the western states hasbeen met by hydroelectric facilities but fewer economi-cally justifiable hydroelectric developments remain forthe future, and a greater share of electricity productienmust come from thermal power plants. The RegionalAdvisory Committee has projected that electricity pro-duction from such sources will increase by a factor ofabout seven during the next 20 years. Coal and nuclearfueled plants are expected to satisfy most of the in-creased requirement. Most of the nuclear generation
"Problems of Electncai Power Production in the Southwest," Hear- ,ings before the Committee on Intenor and Insular Affairs, UnitedStates Senate, 92nd Congress (1971).
2Advertsement in The New York Times, Thursday, May 20, 1971,sponsored by. Black Mesa Defense Fund. (reprinted in the SenateHearings, reference 1)

will be installed in California and the Pacific Northwest.Coal burning plants are expected to be built outside theCalifornia Subregion and about half of the future increase in coal fired generation in the Rocky Mountainarea is planned to serve loads in California...3
From an Indian woman:
"The Earth is our mother. The white man is ruining ourmother. I don't know the white man's ways, but to us theMesa, the air, the water are Hbly Elements. We pray tothese Holy Elements in order for our people toflourish ..."4
From a druggist in Page, Arizona:
"I would like to remark here, it is not in the statement,but I am proud of our nation as an industrial complex,very proud.
"We do not dare stop this forward progress. We mustcontinue to create new Jobs for the upcoming genera-tions. Without electric power this cannot bie done. Wemust have-prddifotitin with
"We save faith in our industrial community and in theFederal Government which is a participant in this prof-ect. We know that through their continued efforts andour continued demands that pollution from the burningof fossil fuels can and -will be controlled and that theNayajo generating station will be the model plant of itskind in the industry."5
The hearings testimony runs the gamut from emotionto reason, doubt to belief, outrage to approval. Therewere facts enough to support any view. Smoke andhaze in the once-clear desert skies. Landmarks, likeShiprock and the Sangre de Cristo Mountains, some-times obscured. High-voltage transmission lines strodeacross the countryside, strip mines opened gashes inthe earth, and a long pipe carried coal mixed with preci-ous water from mine to plant.
Not all the changes were negative. Many of the localpeople favored the power complex. They could see newtax revenues coming in and new jobs, welcome sightsin a i-egion officially classified economically depressed.If they looked further ahead, they could see growthmore buildings and industries served by the electricpower and more people fed with crops grown with thewater that could be pumped from the Colorado River bythis power.
The controversy is fascinating and well-documentedin "The Southwest Energy Complex" by Malcolm F.Baldwin.6 Although "ancient history," it's an unfinished
'Staff report on "Electric Power and Related Devt.lopments in theBlack Mesa and Four Corners Areas," DiviAion of Electric Resourcesand Requirements, Federal Power Cqmmission, May 24, 1971, re-printed; Senate Hearings (see reference 1).
'Statement by Asa Bazhonoodah (83-year-old Navajo woman), re-printed in Senate Hearings of reference 1, pg. 1550.
5Statement by Mack Ward, druggist, Page, Arizona, Senate Hear-ings, reference 1, pg. 1547.
6"The Southwest Energy Complex. Policy Evaluation," Malcolm F.Baldwin, The Conservation Foundation, Washington, D.C., 1973.
ii 1't k
history that previews the many similar "shootouts" thatwill occur in the future. Its ingredients include almost allthe facts and trends, fears and opinions that fuel the'Great Energy Debate" we are now engaged in. For thisreason, we briefly summarize what Four Corners was allabout and point to the further developments and similarissues that you, as teacher and citizen, will-face in thenext decade.
Coal, Electricity, Air, and Water.As the old Navajo woman said, air and water are Holy
Elements- to the Indians. The white man -s9metimesseems to give almost as much reverence to coal andelectricity. It is around these four elements the FourCorners controversy swirled.
They dictated the choice of the Four Corners region.There was coal there, as much as 107 billion tons,accessible to strip mining. (This is 200 times as muchcoal as was consumed.in the United States in 1970:)There was water, not a lot, but apparently enough.There was air, rural air over which air quality controlswere not terribly stringent. There was_a_demarlitforelectricity.
Figure 1, which shows the locations of the six con-troversial plants, sets the story. Since these are generat-ing plants, some idea of their size is necessary. ThePhase I development in thp area (to be complete byabout 1975) is expected to provide about 7,000 millionwatts (Mw)* gerjerating capacity, almost enough elec-tric power for the City of New York. The Phase II de-velopment, to be complete by 1980, will roughly doUblethis capacity.
The Four Corners Plant, the first to be built, was abusiness success from the beginning. The cost ofenergy from the strip-mined coal was the.lowest of anysteam plant in the country. This success encouragedother utilities of the Western Energy and Supply Trans-mission Associates (WEST) to undertake developmentof the six plants shown in Figure 1. Then the stormbroke.
The objections to the Four Corners Plant, and to theothers that followed, can be classified under fourcategories: air pollution, water rights, strip mining, andpolitics and economics. We will look briefly at each ofthese and at the different points of view rogarding them.
Air Pollution
The first Four Corners Plant units were built in theearly 1960s, before the national sensitivitDo-air qualitythat led to the Clean Air Act of 1970. The plant hademission control over the particulates, the small sootand ash particles which go up the stack. The earlycontrol units were not very efficient, however, and theFour Corners Plant sent an enormous plume of smokebillowing out through those once clean desert skies. The
*A watt is a measure of electrical power, the amount of electricalenergy which must be continuuusly provided to a ioad. A million wattsis about the power necessary to light a large sports stadium.

FIGURE 1Utility and Coai.Projects in the Four Corners.Region
NEVADA
a Ns
CALIFORNIA
-----Salt Lake City
UTAH
aDenver
coLoR AD°
1 --HUNTINGTON ill- ICANYON ..." I(430 MW) i
II
0 1
I
I PAROWITS RoX. nee, I
'',... KAIPAROWITS1 ..C..
Lake Powell.k -4.\.. (5,000 MW)
.,,,............... ## .t-45 (660 MW)
A30Dion Canyon Dam(2,3V1 ct MW
1
) FOUR CORNERS- 1 (2,085 MW)
. i ii 1
Gland . {---Canyon1
SAN JUAN
\ Las we. mu ace. Alf.
141.%
Vegas
.\floove
----Davis OaDam --MOHAVE ------- ----
(1,510 MW)
6
Parktr Dam ARIZONA
Phoenix
..= HYDROELECTRIC DAM
------- Cj INDIAN RESERVATION
Santa Fe
NEW MEXICO
9 0.0 0.0 ri 'V 10APPROX-SCALE OF 111L0(
O POWER PLANTSCOAL-SLURRY PIPELINE
-4( NATIONAL PARK OR MONUMENT
1

plume was tracked by private plane for 150 miles ormore? .
The output of particulate matter from the Four Cor-ners Plant was reported as 350 tons per day, almostthree times the total particulate emission of LosAngeles. The emission of smog-forming sulfur dioxide,320 tons per day, was about one and one-half times theLos Angeles total of 225_ tons per day.
The imposition of more stringent air-quality standardscaused the addition of more efficient emission controlsto the Four Corners Plant and will require their installa-tion in the other plants of that area. However, although itis possible to remove most of the particulate matter,(andthe present devices now remove better than 99 percentof them), it is more difficult to remove the sulfur dioxide.The "wet scrubbers" on the Four Corners Plant thatremove the particulates, also remove 20 to 30 percent ofthe sulfur. Fortunately We tern coal is generally low insulfur. The nitrogen oxide , which form the eye-burningphotochemicals in the L s Angeles smog, are not re-moved.
If the air pollution control equipment of these sixplants perforrrrs up to expectations, the pollutant outputfrom these plants wipe as follows:
particulates 73 tons per daysulfur oxides 942 tons per daynitrogen oxides 1,701 tons per day
These totals are roughly comparable to present dailyemission from Los Angeles and New York City.8
We have mentioned one of the visible effects of thispollution: The magic clarity of the desert air has beenlessened. The turn-on of additional plants will increasethe haze. Other effects are to be_expected. These pol-lutants Can harm plant and animal life; sulfur, for in-stance, can combine with water vapor and form sulfuricacid. The acidity of Lake Powell will have to be watched.
As always there may be surprises. There is someindication that the smoke and ash settling in the desert isincreasing fertility. Vegetation near the plants is show-ing increased growth,
Water//'
Power plants need water as well as air. Their majorrequirement is for cooling water, the least expensivemeans of cooling the condenser (in which the steamexhausted from the turbine is changed back to water) isto pump water through it. Sufficiently dear in this andregion, water is recycled at most of these plants through
7Testimony by Dr. Joseph J. Devaney, President, Antl-smog Federa-tion, Los Alamos, New Mexico, Senate Heanng, reference 1, pg.117.
The two-city totals are: particulates-323 tons; SO 1,2.90 tons,and NOx 2291 tons. "Descriptions and Emmissions Data on theSix Power Plants Concerned with the Four Corners Area. Data Com-parisons with New York City and Los Angeles, WEST AssociatesInformation Office, Salt Lake City, Utah, 1971.
Iv
cooling towers and back to a cooling pond. Nonethe-less, by 1980 these plants may consume (by evapora-tion from cooling towers and use in ash removal) asignificant fraction (perhaps 10 percent) of the area'savailable water. In fact, water demand throughout theregion is increasing, driven by the same growth that iscausing the rising demand for electric power.
Water and electric powerre directly related; some ofthe power generated will be used to pump water fromLake Mead for irrigation. We will not try to make thisargument quantitative, to add and subtract the esti-mated acre-feet of water needed for the various uses_Atpresent, however, it is the laaol water rather than worryabout air pollution that is slowing approval of the hugeKaiparowits Plant ih Utah.
WaterJs a more crucial problem for the Mohave Plant,which is fed by coal shipped by a 276-mile "slurry" pipefrom the Peabody Black Mesa mine. The coal from themine is crushed, mixed with water, and then pumped tothe Mohave Plant. Since Peabody was prohibited fromtaking ground water at levels above 1,000' feet (thiswould interfere with the supply of water to Indian wells),the comp-anyhassunk slx deep wells, to depths of about3,600 feet, to tap a large reservoir of clean, fresh water.Encased to preverit connection with the upper reser-voirs, these pumps, at full capacity, are capable of draw-ing 1,500 gallons per minute. There has been concernthat the depletion of the lower water table would affectthe uppelevel, but monitoring of the Indian wells andground water levels has not shown any effect so far.
Strip Mining
What makes the Southwestern coal so attractive, inaddition to its abundance, is its nearness to the surface.It lies on the Black Mesa, less than 100 feet below thesurface, easily reached by the huge "ilraglines"(mechanical scoops) that operate in the mine.
It is the use of large-capacity equipment that makesstrip-mined coal the least expensive on, the market. Thetechnique of strip milting is like deep plowing. The soiland rock above the coal (the overburden, as it is called),is removed in a long trench, the coal extracted, and t.eoverburden from a parallel trench is then dumped in thefirst one. The topsoil iVthus buried under 50 or 100 feetof subsoil. In some arts of that arid land the term"topsoil," of course, is meaningless. Peabody CoalCompany, for instance, reports that tests at their BlackMesa mine show that the fertility of the subsoil is asgood as (or better than) the sandy top layer.
The amount of land involved is impressive. The Pea-body Company will have to 'strip about 400 acres a yearto provide the 40,000 tons of coal a day needed to fuelthe Mohave and Navajo Plants. During the projectdd35-year operation, about 141000 acres, a little less thanone percent of the Black Mesa, will be strip mined. If theUtah International Coal Company, which provides coalfor the Four Corners Plant (from a nearby mind), andthe San Juan Plant mine are as productive, then thetotal land stripped annually in this region will be nearer800 acres. What this stripped land will look like five or
6)().

10 years from now is difficult to judge. It will depend onregulation, motivation, andon climate and other factorscontrolled by nature. With the best of intentions, this dryland will be hard to reclaim. Rain is scarce and such rainas does come carries with it the danger of washingsaline shale down into the surrounding land. Dust willalso.be a, problem.
Regulation, which differs from state to state, is be-.coming stricter. Utah International's lease with theNavajos, drawn up originally in 1957, was much more
`permissive than the Peabody lease with the_liopis and-Navajos-on-thWBIEergesa.,
Attitudes of companies differ also. At last report,9 UtahInternational had regraded only 100 of 1,400 disturbedacres while Peabody had already graded and reseeded300 or so acres from the much smaller total on the BlackMesa.
The Peabody reclamation effort is costing about$2,500 per acre to regrade. and another $50 or so toSpread 25 poUnds of alfalfa, clover, and native grassseeds. It is too early to see how full the recovery will be.
Men, Money, and PoliticsIn addition to the environmental effects we have de-
scribed, the "labor pains" of the Southwest power com-plex involved men, money, and what sometimesseemed to be cross purposes of several Federal Gov-ernment agencies. We will find these components in-teracting again and again in similar issues to be facedelsewhere. A brief rOsum4 of the setting and some of theaction will preview this dimension also.
Money: There is, of course, money to be made fromthe Southwestern coal. At Black Mesa alone coal shouldgross a billion dollars, more or less, for the PeabodyCompany over the 35 years of contracts with the Navajoand Mohave Plants. There is money also for the Hopiand Navajo tribes. Their royalties of 20 to 25 cents a ton(with an escalation clause if the price of coal continuesto rise) are already bringing in a million dollars_a yearand are expected to average $3 million a year during theduration. For these some 125,000 Indians, this amountsto $24 per year. The annual Peabody payroll of $4million makes a much bigger contribution to those In-dian. employees who make up 80 percent of the workforce,
In New Mexico, the net return to the state and to the.Navajos from the utility operation there, was estimatedin the Senate Hearings as follows:
InvestmentEmploymentPayrollRents & Royalties
to NavajosTaxesMaterials & Supplies
Purchased in NewMexico
$294,620,000532 (50 Percent Navajos)$5,900,000 Per Year
$1,180,000 Per Year$1,145,000 Per Year
$1,300,000
'The Southwest Energy Complex," op. cit., pg. 29.
Energy and Indians: The philosophical differencesbetween the goals and values of the Page, Arizona,druggist,5 and those who bought the advertisement InThe New York Times,2 was mirrored w;thin the Hopi andNavajo tribes. To the Tribal Council, the plants and ,
mines offered a way out of economic misery. To other-Indians, it -meant leaving the traditional paths of theirpeople. This latter view was expressed at the SenateHearings-by- a-young_Navajo:
"The Government says that we are ecOnornicallyun-derdeveloped and that w3 should all be overweightand have health problems like the white.people. Theylook at our resources and justify that a good way tobecome economically viable is to develop our ru-sources. Have they ever thought that the Navajos don'tlike to be up with. the national standards in economics,education,-employment, et cetera. We don't like thisidea of keeping up with the Joneses as the white mandoes, but we want to develop at our own pace. This isthe white man's invention, to keep up with theJoneses."10
We will see the same controversy open again in theNorthern plains where alarge coal-electric complex isbeing planned and where Indian-land and water rightsare deeply involved. It will be iniportant for our nationalconscience to make certain that our need for energy.does not come at the expense of the Indipn,and thus addanother unhappy chapter to the others tflat describe ourdealings with these original Americpris.*
Policy and .politics: The plaj4 for the Southwestpower complex began slowly took nourishment from,different sources, and urgency, from different needs.They involved not only tty:, utilities, but several Federalagencies as weii. The 0 agencies camein at different
7/stages in the proj development and, had differentroles. ,
A feature of four Corners development, and the con-troversy that surrounds it, is that most of the Federalagencies involved are part of the Department of theInteriorr. A partial roll call includes the Bureau of Recla-mation, the U.S. Geological Survey, the Bureau of In-dian Affairs, and the National Park Service. The CleanAir Act and the other antipollution laws of the late sixtiesand early seventies gave the Environmental ProtectionAgency a piece of the action. Since many of these sameagencies will be involved in future energy-environm ntissues, we can benefit from an examination of their rol .
The read agency in many ways, theBureau of Reci -mation, had been working for several decades to sp rthe economic growth of the Southwestern ColoradBasin region. It had proposed the two dams on theColorado, above and below the Grand Canyon, for in.stance. (This idea was eventually rejected.) Theplan fodevelop coal resources and build generating plantswas, therefore, quite consistent with its goals.
The other agencies are charged, in one way oranother, more with protection than with development.
10Senate Hearings, op. cit., pg. 1553.

The Bureau of Land' Management, for instance, ischarged with supervising strip mining, and, in general,with assuring that proper "land management" occurs.The Bureau of Indian Affairs supervised the coal leaseand water rights negotiations with the Indians. The Na-tional Park Service has obvious responsibilities in anarea that includes many national parks and monu-ments. The Environmental Protection Agency's chirdrconcern is defining air-quality standards and superis-ing, the data gathering. _ _
The main complaint about the way these agenciescarried out their responsibilities is that the agency thatwas supposed to push, did, but that the agenciescharged with protection were not as aggressive. TheBureau of Reclamation, for instance, has been faultedfor a single-minded commitment to its long-terrn_plansfor bringing irrigation water to central Arizona. Alterna-tives, critics claim, such as less economic growth orpatterns less dependent on Colorado water, have notbeen given serious consideration.
Critics also point to the lack of muscle in the Bureau ofLand Management's strip-mine supervision, to the Na-tional Park Service's failure to protect vigorously theareas under its junsdiction, and to the Bureau of IndianAffairs for its eagerness toaccept the power complex aspart of its plan to change the Indian's lifestyle."
It is neither simple, nor useful, at this date, to try andanalyze various agency actions and inactions. Littlewould be gained from opening up all of those Interlockeddecisions and defenses. Because the Four Cornerscontroversy may well preview similar issues, however, itmay be useful to repeat a criticism here, not of thecontent of the decisions, but of the structure of in-tragovernmental decision-making process.
In any complex and technical issue, such as the onewe have been describing, much of the information perti-nent to decision-making is held by government agen-cies. If the public is to play a role in these decisions, itmust have access to this information. More important, ifthere is disagreement among the Federal agencies,they should be allowed, even encouraged, to makeopen advocacy of their point of view, and to expresstheir doubt and concern about alternative plans. Whenall the agencies are within one department, as was thecase in this instance, the provision for such public de-bate is apparently a difficult matter.,'
Debate over alternative plans must not only be open,it must come early if it is to be constructive. The firstphase of the Southwestern power complex develop-ment was almost completed, and the second phasealready underway with tremendous economic momen-tum, before the plan and the assumptions behind it werebrought to public view.
Early, open planning will assume more relevance infuture energy-environment issues. The greatest fractionof our remaining unexploited energy resources (coal,oil, gas, oil shale, and uranium) is on Government or
For a more complete critical treatment see, for instance, TheSouthwest Energy Complex," op. cit., pg. 32-44.
vi
Indian-owned land. Since the final decisions as to theuse of these resources and the safeguards for the landand people will shape a generation's living, it is impor-tant that new "Four Corners" issues be identified andthe discussion begun at once.
Four Corners as a PreviewWe have sketched the clash of priorities, values, and
needs 'dramatized by the Four Corners controversy inorder to preview both the Source Book and the futureissues with which the Source Book deals. Four Cornersraises a series of questions that will be raised again.Many of these are questions of national priorities and ofthe rights of minorities in the face of majority need.
The Four Corners area, after all, has two outstandingassets: scenery, whose sweep is enhanced by haze-free air, and those large shallow deposits of coal. Who isto decide which of thege is of highest priority? Can thedecision be made solely in the marketplace? It was inlarge part their economic clout that enabled the resi-dents of Los Angeles to have their cake and eat it, too: todemand rapid growth in electric generating capacity andto forbid the construction of fossil fuel-burning plants intheir own neighborhood. On the other hand, theweakened economic situation in the Four Corners areacaused some citizens of the Southwest to place a great-er value on coal and electricity than on scenery, cleanair, and the lifestyle preferences of some Indians.
This scenario has larger echoes. Take, for example,the Four Corners Power Plant which burns New Mexi-can coal. The plant's effluent pollutes New Mexican airand the strip mining of coal disfigures New Mexicanland. Only 10 or 15 percent of the electric power gener-ated by this plant, however, is used in New Mexico. NewMexico's plight is not too different from that of theworld's industrially underdeveloped countries.
What has happened at Four Corners will happenagain with different characters and slightly differingplots. The constant common denominator will be thepressure of energy demand. We'll sketch some of theissues now before us, or soon to be before us, which willshow similar complexity.
"Cowboys and Indians": A similar conflict ofpriorities is building on the North Central Plains of Mon-tana, Wyoming, and the Dakotas. The Indians are in-volved again, but this time the "cowboys," orat leastmany of the local ranchers, are their allies.
The North Central Plains boast a coal lode even great-er than that in the Southwest; 40 percent of the nation'scoal reserves, much of it suitable for surface mining.The plans for power development in this area are cor-respondingly larger. They call for the construction of 42mine-moutS.generating plants, whose locations areshown in Figure 2. The projected generating capacity is50,000 Mw by 1980 and 200,000 Mw by 2000. Themagnitude of the generating capacity designed for thisarea can be put in perspective by comparison. Only theU.S.S.R., the United Kingdom, and Japan presentlyhave larger total generating capacities. Japan's capac-ity in 1968 was 52,650 Mw.
r), zytI et

Some of these plants will be designed 'to generate10,000 Mw each, more than enough power for all of NewYork City. They will be joined by equally huge coalgasification plants. We will see the problems of FourCorners magnified in the North Central Plains; morewater will be needed, more land will be stripped, andmore pollutants will need to be disposed of. The sameclash of priorities will occur between the local desires ofthe Indians and ranchers, who own and love the land,
the residents of distant Midwestern cities, who needthe energy that will be produced.
Mining the mountains: Similar problems, and aneed for early and open planning, will occur in the"Green Rive Formation" of Colorado, Utah, and Wyom-ing Where an enormous potential of oil is locked into theoil staies that make up many of those lovely mountains.This, land has recently been opened to leasing and pilotplants to_extract the oil are being planned. It is almosttoo late tp ask ourselves, "Should we do thisr It is nottoo late to ask, "Are we doing it in the best way?
FIGURE 2Utility and Coal Projects in the North Central Plains
Derricks In the Atlantic: The unrelenting pressure ofour need for oil and gas is driving the oil derricks out tosea. The moratorium on oil production on the PacificCoastal Shelf has been lifted. Pumping has continuedsteadily in the Gulf of Mexico. Now plans are beingreadied for the opening of the Atlantic Continental Shelfto, leasing, exploration and drilling. The or,an is a verydifferent sort, of environment from Fvur Corners, theNorth Central Plains, and the Colorado Hills. Instead ofarid plains, mountains,.and desert, the environment atrisk here is the biologically rich coastal waters, the foodbin and hatchery for ocean life. There are also ques-tions to answer about the change in community struc-tures and the loss of agricultural land that will occur.
Here, at least, the priority decisions will be out in theopen. The.oil wells, and any dam'ge they cause, will bevisible from the playgrounds of the metropolitan areasthatiemand their energy.
Ports and supertankers: Even with a greatly in-creasedpace of exploration on and off the Continent, the
----Unked States will not, for five or ten years, be able tosatisfiltsRojected need for oil from domestic sources.It will take at-least that long to bring new wells intoproduction orsbegib,commercial exploitation of the oilshale. The extra oil and gas, in ever larger quantity, willhave to come from foreign sources.
Our short-term lifeline will be constructed of super-tankers commuting with oil from the Persian Gulf and ofrefrigerated tankers bringingiiquified_natural gas. Wewill need new deep ocean ports, onshore storage, andrefining faCilities to service them. We wil l have to solveyet another set of priority questions aTout the use of
A coastal lands.The breeder reactor: We are presently committed,
by AEC (Atomic Energy Commission) policy and the
the development of a new ,type of nuclei? reac r, thePresident's order in the June 1971 Energy to
breeder reactor, Ivhich will greatly increase the amountof energy we can get from existing uranium ores. To thealready considerable controversy over the dangersfrom present-day nuclear plants, the breeder will bringits topics. We must be prepared to handle not onlyincreased production of radioactive waste and theunique health hazards of plutonium, but also a differentsort of problem opened up by the shipment of largequantities of bomb-grade plutonium.
LEGEND
.Coal depositso Power plants 1.000 to 3,000 MW
Power plants 5,000 to 10.000 MW.....Capital cities
6---- CitiesState borders
The Great Energy DebateThe coming policy issues we have just described are
all part of a continuing "debate" that will occupy us forthe next several years. With the oil embargo serving asa convenient marker, we.have crossed over into a newera. We have left, perhaps forever, the era of inexpen-sive energy' and are now 'faced with shortages andhigher costs of energy and with the'need to pay for theheavy burden we have put on the environment.
In this democracy, if it is to survive, it is necessary thatall citizens participate in "debates" of such pervasiveimportance. It is also necessary that the ultimate deci-sion be fashioned from as thorough an understanding of
vii

the issues as is possible. It is toward the fashioning ofthat understanding that this Source Book is designed.
The Source Book'
There are two categories of knowledge that mustunderlie a thorough understanding of the issues in thisdebate., There are the scientific and technical issuesand the economic/political/societal issues. We under-line these categories by dividing the Source Book intotwo volumes.
Volume I deals with the economic/political/societalissue's:-In it we describetheeconomic and environmen-tal cots of producing and consuming energy.-We alsodescribe the vtiyi in which energy decisions are inter-locked with su issues as inflation, employment, thebalance of trade, and foreign policy.,We look at efiergypolicy in this country and the roles of government andthe "energy companies" in forming and making thatpolicy work. We look at the collision between "no-growth" and "dig and drill" philosophies, and at theregulations, taxes, consumption patternsNind lifestyleswhich each policy assumes.
Volume II provides the scientific and technical back-ground that is needed for a thorough understanding ofthe issues in Volume 1. In the second volume we de-scribe energy, where it comes from, how it is convertedto our use (and with what efficiency), and how much of itstill remains in the stockpiles of the fossil fuels (coal, oil,and natural gas) and uranium. In this volume we alsoexamine the flow of energy through our society, the enduses that take the largest share, and their patterns ofgrowth. In the last two chapters we probe the developingtechnology that will give us the ability to use our presentfuels more flexibly and efficiently, and may open newand larger sources of energy.
Using the Source Book
We have written this Source Book for classroomteachers, hoping to provide the content from which theycan design useful learning experiences for their stu-
st dents. It is these students, now in your classes, whosoon will be the decision-makers, and participants in theGreat Energy Debate.
It must be emphasized that this is a SOurce Book. It isnot a reader, a policy statement, or a polemic for aparticular course of action. While the two volumes'chapters folio* sequentially, it is not necessary, to readthem that way. It is likely, for instance, that social studiesteachers, and those from the humanities, will find them-selves most at home in Volume I, while scienceteachers will be more comfortable in Volume II..
If, however, these volumes are only considered froma narrow diicipline-determined viewpoint, we will havefailed in what we set out to do. Energy-environmentproblems are necessarily multidisciplinary. They cannotbe handled as a set of scientific facts, nor can they bedealt with in pyrely qualitative terms without facts ornumbers. We hope that science teachers will selecttopics for classroom use from the Source. Book whichhelp them teach their science. We also hope they will
vlIl
inform themselves and their students of other dimensions of these topics. We hope to have given the socialstudies and humanities teachers an incentive to bringsome science (and perhaps some science teachers)into their classrooms.
We hope that teachers will find the topics sufficientlycompelling, and the writing sufficiently interesting, towarrant reading both volumes. We expect however thatbusy teachers will select from the menu presented,picking chapters and even topics, here and there, as theneed and interest arise.
As befits a Source Book, we have aimed at a cor9-plete coltection-of-the.datatbase for the energy debateand provide a wealth of tables and graphs in Volume-111-We want to emphasize that this technical volume can beread at different levels, qualitatively to get the perspec-tiveuantitatively to get the numbers and sizes. Wehay !so added, for those who wish to go deeper,seVeral Technical Appendices which give more scien-tific definition to certain important topics.
For many of you we have "told you more about energythan you'wanted to know" (to paraphrase the little girl'sreport on a book about elephants); for others, perhaps,"everything you ever wanted to know, but were afraid toask." But this is part of the message, these issues areenormously complex. Few wiltwant to meet them head,on, most will only want a piece of the action. We havetried to provide the pieces. It is now up to you to providethe action.
')6

_---- ''...)v
I
ENERGY-ENVIRONMENTSOURCE BOOK
Volume 1Energy,Society,And theEnvironment 7
7

Y
/
/
4
al
'Th
CHAPTER 1Evidence of Crisis
,
c°1
N
i

Evidence. of crisis"...the United Staies has entered a
energy, and we have not yet adjustedpectations, and national policies to theArab oil embargo, kile it lasted,_ ma
new age ofur habits, ex-ew age. Thee us keenly
aware that in twentieth century America, a fourtharssen-tial has been added to the age-old necessities of life.Besides food, clothing, and shelter, we must haveenergy. It is an integral part of the nation's life supportsystem. And we can no longer expect to get it with solittle trouble and expense as we,did in the recent past."1
The report by the Energy Policy Project of the FordFoundation, from which this quotation is taken, is one ofa long shelf of books that deal with the energy problemor one of its many facets. Although the energy crisishas now lost its dominant position in the media to theeconomic crisis, its still very visible in newspapers andmagazines, on non-fiction booklifts, on television, andin the titles of conferences andAtopics of after-dinnerspeakers.
The energy crisis is wide and long. It is as wide as ourday-by-day lives and the environment we live them in. Itis atleast as long as this century; for many of us, as longas our lives. It will grow slowly from crisis to crisis, andour responses will be slow to show effect. It cries out,noW for our understanding and action.
In this Source Book we will emphasize understand-ing, a challenging task in itself, for an energy sourcebook must cover a broad range of topics. We will notspeak directly to the need for action other than.to de-scribe some of the paths through the future that havebeen suggested.
As we said in the Introduction, this first volume willdeal primarily with the descriptive aspects of the EnergyCrisis. There will be quarititative detail, but most of thehard data is gathered in Volume II. We will use this firstchapter to overview this multidimensional cnsis, provid-ing both a preview and summary of both volumes.
The Crisis PastOn October 17, 1973, most of the oil producing coun-
tries of the Mideast placed an embargo on oil ship-ments. The shock waves from this action reachedaround the world and were followed by economic andsocial disruption in most of the industrialized nations.
The valves were reopened in March 1974. Oil beganto flow again, but the world was no longer the same. Theenergy crisis was upon us, of course, before the oil flowwas shut off. With oil flowing it is still upon us. Theembargo was an exclamation point, a dramatic dividingline between the era of cheap energy and the expensivepresent and future. It was also an unplanned (and unpleasant) experiment from which there are lessons to belearned. it brought the role of oil in our lives sharply intofocus.
t"A Time to Choose," Final Report by the Energy Policy Project ofthe Ford Foundation, Ballinger Publishing Co . Cambridge, Massachusetts, 1974, pg. 1.
Less Oh and Lessons
In 1972, this country, produced. petroleum products atan average rate of 11.2 million barrels per day (M bblsper day) and consumed the a rateAf16.4 M bbls perday. We imported 5.2 M bbls per day, 32 percentof totalconwmption... By September 1973, the gap betweenprodbcton and demand had risen to 8.6 M bbls per day.At that time we were importing 40 percent (3A7 M bbISper day) of our crude oil,' 40 percent of our fuel oil (2.14M bbls per day) and smaller percentages of gasoline andjet fuel (kerosene).
The oil embargo imposed in October 1973 was notimmediately effective. Tankers were already at sea, andthere was oil in the refineries and storage facilities ofother countries. In February 1974, however, when theeffects of the embargo weremost strongly felt, importsof petroleum products were 31/2 M bbls per day below theprojected demand. They averaged 1.9 M bbls per daybelow projected demand for the entire October-to-February period. in terms of percentages, domestic oilconsumption was reduced by a high of 17 percent inFebruary and by 10 percent over the entire embargo
. period.Since oil supplied 46 percent of'our total energy in
1973, at the depth of the shortage our total energyconsumption was reduced only 7.8 percent. What wasthe reaction to this reduction? Whit were the effects?
The Federal Government, with neither stoted oil norimmediately Occessible oil reserves, met the\shortagewith the only programs that could have immediate ef-fect, allocation of petroleum products and a call forconservation. A fairly successful attempt was made togive industry the energy it needed. The burden of boththese responses fell largely on the residential andcommercial sectors.
The major components of the conservation responsewere lowered highway speed, voluntary reduction intravel, and reduction in home heating by thermostatsetback. These voluntary reductions were backed up byreductions in the quantity of gasoline and fuel oil availa-ble to the individual consumer. There was also a call forvoluntary conservation of electric power.
Such data as are available show that these programshad measurable effects. Consumer energy purchases(chiefly gasoline and fuel oil) dropped by almost 40percent in the first quarter of 1974. The number ofautomobile trips declined and the average householdtemperature during the 1973-1974 heating season was68"F, two degrees lower than the previous season saverage. Elect 'city consumption 'showed the mostElectricitydramatic respo se. Growth for 1974- slowed frorn itshistoric rate of 7 ercent per year to almost no growth(0.6 percent per year). In addition to consumer conser-vation, the mild winter and the beginning recession con-tributed, apparently, to this slowed growth. The resultingcash flow reduction sent several utilities to their state
"Crude oil is oil before refining, essentially as A is produLedet thewell.

regulatory commissions with requests for rates hikes.The economy was affected in other ways, also.
Economic effects: Several measures of theeconomic effects of the embargo are now available. TheGross National Product, the GNP, that magic measureof prosperity, declined from its high of $1,359 billion inthe fourth quarter of 1973 to $1,344 billion in the firstquarter of 1974. It is difficult to determine what fractionof this was due to the embargo, but comparisons offorecasts before and after the embargo suggest Abet itcarried a penalty of about $15 billion.
The economic penalty was apparent also in personalspendirig, where in addition to energy,-which we havementioned, expenditures for automobiles declined (40percent in the last quarter of 1973 and 10 percent in thefirst quarter of 1974). The sales of new cars decreasedby 34 percent in the first quarter of 1974 (as comparedwith 1973). The decrease was specific; the small carsincreased their 1973 total sales by 29 percent whilestandard models dropped 21 percent. The consumerpaid more for all goods, and about one-third of thisinflation was due to increases in energy prices.
Unemployment rose by 500,000 during the embargoperiod; 150,000 to 225,000 of those out of work wereemployed in gasoline stations and airlines, which weredirectly affected by fuel shortages, and the other300,000 or so were largely in the automobile andautomobile-parts industries. The recreational vehiclebusiness was hard hit. One-quarter of the gasoline serv-ice stations (60,000) closed or changed owners in1973. Hotels and motels also showed losses.
Other effects: There were other effects that remindus of the interlocking relationships of all the componentsof the economy. The oil embargo kept many peoplealive; auto fatalities decreased by about 25 percentduring the embargo period due to lower speeds and lesstravel in general, an estimated saving of 4,775 lives. Onthe other side of the ledger are the losses in revenuefrom state gasoline taxes. The estimated losSfrom pro-jected tax revenues (which were based on a continuingincrease) is predicted to be $700 million.
The embargo as preview: The bnef duration of theactual shortage, the cooperation of the public in conser-vation measures (aided by the mild winter of1973-1974), and the relative success of allocation pro-grams considerably softened the effect of the embargoon the economy. There were, however, lasting effects.Energy prices rose almost doubled and show nosigns of fallirig. The car buying habits of many Ameri-cans have been changed, probably permanently. Theindependent gas station ("gas for less") has just aboutdisappeared.
There were other effects which are difficult to quan-tify. Energy seems to have temporarily gained priorityover environmental concern. Air quality standards arebeing revised to allow high sulfur fuels to be burned forelectric geneMtion. The implementation of auto emis-sion standards was postponed.
2
We also became aware of the subtle connectionsbetween energy and our economic health. Plastics be-came scarce along with their oil-derived rawnaterials.Employment dropped not only in the key industries wehave mentioned but also in the aircraft and boat indus-tries, in the dry cleaning and laundry business, and evenin real estate. Perhaps connected with this latter de-cline, a shift away from suburban home buying and amove to multifamily housing nearer to the city seems tohave begun.
Although the oil embargo was an artificial crisis ofshort duration, it caused many of us for the first time `olook closely at this web that energy traces throughoutour daily lives. In the remainder of this chapter we willbriefly summarize the energy picture as it now looks inthe waning n. Iths.of 1974 and trace some of thethreads of this web.
Where We Are NowHow much energy are we now using? What are we
using it for? Where does it come from? A description ofthe present must begin by answering these questions.We also will look briefly at growth in energy consump-tion and identify the areas of immediate critical concern.
Supply and Demand
In 1973 the average per capita consumptiuii* ofenergy in this country was 250,000 Calories per day,and the total for the year was 18.9 quadrillion (Q)"Calories.***
The shanng of this energy between the four sectors,residential, commercial, industrial, and transportation, isshown in Figure 1-1. We also indicate in this pie diagram,the important category, raw materials. Not only arecher{iicals made from coal tar and petroleum importantin the manufacture of plastics and Other synthetic mate-rials, but tar, asphalt, road oil, and lubricating greasesare also examples of non-energy uses of fuels.
In Figure 1-1 we assigned to each of the five sectorsnot only the electricity they used but the fuels that wereused to generate that electricity. In 1973, 5 quadrillionCalories, 26 percent of the total, was used to generateelectricity, but two-thirds of thiS energy was lost aswaste heat at the power plants, so that in fact electricitycontributed only 10 percent of the net energy.
Figure 1-2 gives additional information about our useof energy, it shows the percentage sharing of variousend uses. About half of it was used as heat, an additional third as mechanical work in motors of variouskinds (including automobiles), and the rest as lighting
We will follow practice and use the term consumption butactually, as we explain in Chapter 3, Volume II, energy is 71 "con-sumed" but converted from one form to another.
"We will use the abbreviations 0 for quadrillion(1,000,000,000,000,000), T for trillion (1,000,000,000.000), B for bil-lion (1,000,000,000) and M for million (1,000,000). These abbrevialions are discussed further in Appendix A2.
"'These are the same Calories in which food energy is measured.We define this and other measures of energy in Chapter 1, Volume H.
30

cooling, etc. (A complete breakdown of the pattern ofenergy consumption is given in Chapter 3 of Volume II.)
The mix: We obtain almost all of this energy (95percent) by burning fossil fuels (coal, oil, and naturalgas). Waterpower (4 percent) is used in the generation
FIGURE 1-1Categories of Energy Consumption, 1973
Data from Bureau of Mines, U.S. Department of the Interior.
FIGURE 1-2End Uses of Energy, 1968
Airconditioningand
refrigeration
Data from "Patterns of Energy Consumption in the U.5.7 Office ofScience and Technology (USGPO Stock #41064034)
of electricity and the new entrant, nuclear energy (1 ,7
percent), make up the difference. The contribution ofthese various sources to the total is shown by Figure ,
1-3.The fuel mix has changed with time. Coal, for in-
stance, accounted for three-quarters (78 percent) of themuch smaller total energy in 1920 while petroleum prod-ucts only provided 18 percent; by 1950 .oil and naturalgas accounted for 57 percent between them and coal for38 percent. TheSe replacement cycles (which are de-scribed more thoroughly in Chapter 4, Volume II) con-tinue; oil and natural gas (which provided 76 percent ofthe energy in 1973) are becoming scarce and expensiveand nuclear energy is expected to grow. Some esti-mates have it providing 20 percent of our total energyand almost 30 percent of our electrical energy by 1985.
Growth: We cannot fully appreciate the energy pic-ture with a snapshot of the present, we must look back atthe past and peer into the future. Over the past severaldecades total energy consumption in the United Stateshas grown, on the average, 31/2 percent per yeir..it grewmore rapidly in the recent past, averaging 5 percent peryear from 1965 to 1970. On the average, therefore, ourenergy consumption is doubling every 20 years (every14 years at the 1965-1970 rate of increase).re willexpect to be using double the 1973 total by 1993 if theaverage trend continues. .
This growth is not primarily due to population, whichhas been doubling more slowly (on a 45 year period). In
"fact, we have been at almost the zero population growthlevel since the mid-sixties. What is growing most mark-edly is per capita energy consumption (the total
FIGURE 1 -3 .
Sources of Energy, 1973
Data from Bureau of Mines, U.S. Department of the Interior
3

energy use divided by the total population). We con-sumed abOut 90 million Calories per person in 1973 andper capita consumption has been doubling every 25years.
Although all forms of energy use have been growing,the fastest growth of all is in-the consumption of electri-cal energy. Our consumption of this versatile form ofenergy has been doubling about every 10 years. If thisrate of growth continues, we will need four times thegenerating, capacity-in 1990 that we had,in 1970 andeight times the 1970 capacity in the year 2000.
The multitude of problems which go to make up theEnergy Crisis stem largely from this rapid increase indemand. Each year we need not only to provide asmuch = fuel as,we did the year before, but more. Whatwas enough in the 1960s will provide only half ourneeds in the 1980s. -
Problems of Energy Supply
Energy supply is but one of the critical dimensions ofthe crisis, ,but the recent embargo brought it to theforefront. There are three aspects that deserve and arereceiving our attention: the growing dependence onimported oil, a shortage of natural gas, and a threatenedshortage of generating capacity and fuel for the produc-tion of electricity.
Oil importation: The United States was the first-oilpower and was a supplier of this liquid energy until the1950s. The insatiable appetite of our industry andtransportation for this inexpensive, easily-handled fuel,plus a slowing down (and since 1971 a decline) indoinestic production, has caused us to depend moreand more on foreign sources. We imported 7 percent ofour total energy (in 1960, 12 percent in 1970, and 19percent in 1973. Oil was the major import (we havealways exported a little coal) and the percentage of oilfrom foreign sources, 16 percent in 1960, rose to 23percent in 1970 and soared to 37 percent by 1973. In1974, in spite of a decline in total oil consumption,imports rose by 7 percent over 1973.
This dependence on foreign oil, which had economicroots (foreign oil was cheaper) now presents us withseveral problems. The days of inexpensive Ware overand price is now determined by decisions made byOPEC (the Organization of Petroleum Exporting Coun-tries). More than our economy is threatened by thisdependency. The embargo showed that oil can be usedas a trump card in the high stakes game of internationalpolitics.
There are many factors that enter into the decision toincrease imports or domestic supplies of oil. They in-clude supertankers, new deepwater ports, oil derncksoff the Atlantic beaches, and Arctic pipelines just tomention a few. Their discussion will occupy much of ourattention in the chapters ahead.
Natural gas: The true harbiRger of the Energy Crisiswas not oil but natural gas. In the 1970s the supplieswere insufficient to allow many companies to acceptnew customers, and several times during these pastfour years companies have enforced their interruptabie
4
supply" contracts. (These are a class of contracts tobulk users that give a lower rate on the condition thatdelivery can be Interrupted during periods of short sup-ply.) Many schools, hospitals, and industries have beentemporarily left without fuel and several electric utilities,for instance, have totally or partially converted to otherfuels.
The causes and duration of the supply problems withthis clean fuel are subjects of controversy. Domesticproduction has not increased as fast as the demand.The most often discussed cause is the regulated (andlow) price of gas. The price is now rising and there isstrong pressure to deregulate it. We are increasing ourimports from Canada (5 percent in 1973) and lookingacross the ocean to Algeria and even the U.S.S.R. formore gas.
Blackouts and brownouts: While the Northeastern"Blackout" in November 1965 was not really a symptomof the energy crisis (it was a temporary shortage am-plified by errors in the response of the system), it did drivehome to us the importance of electrical energy. Ourconsumption of electricity has almost doubled sincethen, and r 'though there have been no more large scaleblackouts, we have begun to see "brownouts." Brown-outs are deliberate responses to overdemand. The util-ity company, when it is pressed for more power than itcan provide, lowers the voltage (and, therefore, thepower supplied) to all users. Air conditioners slow down,motors labor, and electric heaters are not as hot.
We are threatened in the next few years with more ofthis inconvenience unless demand slackens or supplyincreases. There are two major factors hampering sup-ply efforts, the utility companies are not able to build newgenerating capacities rapidly enough, and their fuelsupplies are uncertain.
As always, a host of factors contributes .o each ofthese problems. The building of new capacity has beenslowed by controversy over power plant siting (especially nuclear plants). A shortage of money has alsocontributed. Cash flows and dividends are down andinvestor confidence seems to have been shaken by theconflicts over siting and to some extent by performancefailure of the nuclear plants (which make up half or moreof the new plants). The recession hasn't helped. A resulthas been the cancellation. or postponement of 71,000Mw of new plant capacity in 1974. (A Mw is a millionwalls, about the power needed to light a large sportsstadium at night.) This means that 70 or so plants thatwould have been under construction are still on thedrawing boards, 40 of these were to be nuclear and 30fossil fuel burning.
The fuel shortage is also acute. Although there isplenty of fuel for the coal burning plants, new air qualityregulations for the 1970s deny the Northeastern plantsaccess to the close-by Appalachian coal. (Its sulfur con-tent is too high to allow its burning, and the technology toremove sulfur pollution from the stack gases is not yetfully mature.) In response to strict air quality regulations,many utilities converted to oil and gas only to run intoshortages of these fuels. The pervasive uncertainty has
r(0,

caused investors to put their money elsewhere. It willtake assurances of long-range coal supply and a clearpromise either of ready emission control technology orrelaxed restrictions on sulfur pollutants to break thisbottleneck.
Threats to the EnvironmentWe have talked so far about supply and demand, but
in many ways this is the least troublesome part of theenergy problem. It will take five or six years, but giventhe green fight of money and relaxed environmentalrestrictions, the energy companies can close the gap. Amore troublesome dimension ientered when we lookat the effects on our environment of increased energyconsumption and production. When we examine theinteraction of energy and environmental problems the_topic headings remind us of an ,EPA (EnvironmentalProtection Agency) division roster. Almost all the titlesare there: air and water pollution, land and ocean use,radiation pollution and other hazards of radioactive sub-'stances. We will briefly preview the major threajs' ineach of these areas. A fulldiscussion of their sjze andthe hopes of lessening them takes up the middle chap-ters of this first volume.
Air Pollution
Air pollution was one of the early indications that wewere overstressing our environment. It was called to ourattention by the smog disasterit Donora, Pennsylvania,in 1948, and by the air- pplfution in Los Angeles whichworsened steadily through the late forties and fifties.
The five air pollutants for which records are kept arecarbon monoxid ,e, the hydrocarbons (molecules of hy-drogen and wbon), the sulfur oxides (molecules of sul-fur and onigen), the nitrous oxides (molecules of ni-trogen and oxygen), and the particulates (soot, etc.). Anestimated total of 272 million tons of these pollutantswere emitted into the air from various sources in 1969.
The present front runner in the air pollution handicap,,/ is the automobile. It contributed 74 percent (by weight)
of the carbon monoxide, 53 percent of the hydrocarbonsand 47 percent of the nitrogen pollutants in 1970. Theelectric utility industries lead in sulfur pollutant emis-sion with 73 percent and are dose behind the au-tomobile with 42'percent of the nitrous oxides. Industryleads in only one category, it is responsible for 41 per-cent of the particulate matter. A breakdown of the per-centage of total air pollution by source is given in Figure1-4. The hazard of pollutants does not depend on theirweight, however, so we must discuss their effects sepa-rately.
Sulfur smog: The utility plant is the major producer ofthe sulfur pollutants which are the chemical villains ofwhat is called "classical smog." This is the black,smelly, wintertime smog that caused .the 14 Donoradeaths in 1948, almost 2,000 deaths in London in 1952*and 200 in New York in 1966. These were instances of
The Donora and London smog was probably caused by industrialcoal burning rather than by utility furnaces
air pollution disasters. Many more deaths are attributa-ble to the lower levels of more common exposure.
The sulfurpollutants are formed when a fuel contain-ing this impurity is burned. The fuels can be ranked bytheir sulfur content; gas is the cleanest and coal thedirtiest with oil in between.
The utility plants in the fifties and sixties made greatstrides towards eliminating the soot and ashes thatpoured out the smokestacks. Similar technology for thecontrol of sulfur emissions is not yet in large-scale use,and, perversely, low sulfur coals lower the efficiency ofthe "electrostatic precipitators," which are used to re-move the spot. As we have said, both the utility industryand theci:)al industry are going through a period of greatuncertainty as they wait to see whether coal can becleaned of sulfur for its-needed role in electric energyproduction.
The automobile and air pollution: The automobilehas introduced its own characteristic smog, the "photo-chemical smog," which first made its irritating presenceknown in the air-locked Los Angeles Basin.
Photochemical smog is a chemical soup sunlightconcocts from the hydrocarbons and nitrogen oxides ofautomobile exhaust. Its effects.afe not yet fully investi-gated. Its potential for irritating lungs and eyes is pain-fully obvious, however, and its effects on vegetationvisible It has not as yet been shown to be a direct causeof death.
The automobile is also responsible for two other pol-lutants, carbon monoxide and lead. Carbon monoxide islethal at high concentrations and can cause distress atlevels of 50 to 100 parts per million. This threshold for
FIGURE 14Sources of Air Pollution
Fuel Combustionin Stationary
Sources
Solid WasteDisposal 5%
Forest Fires
8%
Mac
10%
21%
IndustrialProcesses
14%
Transportation
42%
Source. National Air Pollution Control Administration, NEW.
5

damage is occasionally reached for short times in, forinstance, automobile tunnels. Lead is released in theburning of leaded gasoline, an estimated 420,000 tonsin 1968 and more and more each year since then. Sinceit accumulates iii the body we must also watch carefullyfor long-range effects of the exposure of our urbanpopulation to this danger.
Photochemical smog and the classical smog aretroublesome only when the "atmospheric disposal"doesn't work and our waste gases hang over our-cities.We discuss the meteorological causes of this disposalfailure and give more details of the costs of and theproposed cures for air pollution in Chapter 4.
Competition for Water
Water is second only to air in its importance for life.Our water supply is threatened in two ways, by con-sumption and by heating. The introductory essay onFour Corners provided an example of both thesethreats. Water is_ a _crucial ingredient at many pointsalong the energy web. It is used in washing coal anduranium ore. It is needed for cooling in many industriesand will be a raw material in the production of gas fromcoal in the "gasification plants" planned for coal country.
The major use of water as a cooling medium is inelectric utility plants. As we explain in Chapter 3 ofVolume II, the efficiency of a "heatengine," such as thesteam turbine that drives most electric generators, de-pends on the temperature difference between the in-coming and the outgoing steam. The input temperaturemust be high and the outgoing temperature low. To getthe low outgoing temperature, large amounts of waterare circulated through the systems. The best steamturbines are only 40 percent efficient (60 percent of theenergy released from the burning fuel is not convertedto electric energy) and the average plant is only 33percent efficient. Therefore, two-thirds of the heatenergy available from fossil fuels (or nuclear energy) iswasted. Although some of this wasted energy goes upthe stack in a fossil fuel plant, most of it (and all theheat-waste from a nuclear plant) goes into the coolingwater and eventually into the river, lake, or pond fromwhich it was drawn.
There is real concern over the effects of heated wateron marine life and we will discuss these effects in Chap-ter 4. We -will focus in this introductory chapter on thestaggering amount of water that is needed.
If the temperature-rise the water is to be held to157, then a modern 1,000 Mw power plant requiresalmost 16,000 gallons of water per second for cooling. Anuclear plant requires somewhat more. Taking into account the mix and number of generating plants predicted for 1990, the total amount of water runningthrougOur utility plants in that year would be 350 billiongallons per day. This is more than three-quarters thetotal available running fresh water in this country. Ofcourse, water can be used more than once and some 30-percent of the cooling is expected to come from seawater rather than freshwater, but this rough calculation
S
does give a perspective on the size of this water de-mand. We must begin to make some choices, on manyrivers there is neither sufficient water or cooling capacityfor all demands to be met.
Land use
The'production and consumption of energy also pre-sents us with difficult decisions on land -use priorities:We have already been introduced to several of these inthe discussion of the Four Corners controversy. Wemust choose between mining and other uses for theland; power plants take up space (about 400 acres for a1,000 Mw coal burning plant), as do transmission linerights-of-way (4 million acres in_1970). We will brieflypreview some of these land use decisions below.
Mining: Coal, uranium, and oil shale will have to bemined either from the surface by strip mining or under-ground. The amount of uranium mined is small enoughto be of no great concern. Oil shale mining has not yetbegun. If we do begin to mine this resource we will haveto remove about seven times as much rock per Caloneas we do to mine coal. Our most serious mining prob-lems at present are with coal.
St, ip mining has left us a legacy of sterile, disorderedland at the mercy of wind and rain. An estimated1,470,000-acres were strip mined for coal from 1930 to1971, an area of 2,300 square miles, about the size ofthe state of Delaware. At present, about a third of thisland has not been reclaimed. Between 1975 and 1985the amount of coal to be strip. mined will double theacreage. The, e is hope that the impact of strip mining inthe next decade will be less damaging than it was in thepast. State laws have been toughened and reclamationhas become an accepted practice at most mines. In fact,in 1971, 73:200 acres were mined and 94,600 acreswere reclaimed (as older banks as well as new oneswere graded and seeded). The and mountains andplains that will feel the shovel in the next decade willpresent a more serious reclamation challenge than didthe rainy Midwest and Eastern coal fields, and it maytake many years (or decades) to bring them back to asemblance of their original state.
Underground mining also produces its negative ef-fects, chiefly acid water which drains out of man abandoned mines and destroys stream life. The new waterquality regulations have been forcing some improve-ment in this historic problem. Subsidence cave-insalso routinely occur and ruin the land above the mines.These costs must also be added to the coal bill.
Opening wild land. A particularly thorny problem ispresented when land character is changed, when landthat is in a natural state is commercialized. The BlackMesa fits that description as does some of the land in theNorth Central Region. The must serious present conflictis in Alaska but the opening of the Colorado, Utah, andWyoming wild mountains and highlands to oil shalemining will present a choice of comparable seriousness.
It is not rust the mining that is worrisome. The trend ismore and more to on site processing, and in the case of
34

coal, on-site generation of electricity. This puts all thepressures of our industrial civilization on the land aswell. It is clear that the special nature of the land thendisappears. We will continue to be faced with thischoice.
Ocean the
There are priority decisions to be made for the oceansas well. Oceans serve as highways over which a grow-ing number of supertankers travel with oil to supplementour domestic production. We will be using more andmore of these huge tankers, some with 180- million gal-lon (4-million barrel) capacity. .Larger ones are beingbuilt. Since.we may import almost 12 million barrel's ofoil per day in 1985, three of these huge tankers will haveto unload at United States ports each day.
The increased flow of oil across the ocean brings anincreased danger of oil spills. The Torrey Canyon,whose wreck severely damaged a portion of the Englishcoastline, was a small supertanker with a capacity ofonly 35-million gallons of oil. These giants bring furtherproblems. We must build deepwater ports to unloadthem as none of our present ports is deep enough.
The danger of spills and the increased handling of oil,offshore and at the coastline, threaten the economi-cally and biologically important coastal fisheries andspawning grounds. The expected waning of the Atlan-tic Continental Shelf to drilling adds to this threat. Theincrease in oil-related activities in coastal regions, thebuilding of ports, refineries, etc., also changes thecharacter of these region's, increases population, bringscities, sewage, etc. All of these considerations must bea part of energy planning.
Nuclear EnergyIn the 1970s we began real commercial use of a new
form of energy, energy from the nucleus. Many plannersare counting on nuclear reactors which use uranium forfuel to provide 30 or 40 percent of our electricity by 1985.
Nuclear energy may help solve some of our pollutionproblems, but it may give us new ones. It could relievesome of the air pollution problems presented by thefossil fuels. Since a conventional nuclear plant using130 tons of uranium per year will produce the sameamount of energy as a coal-fired plant using 2 milliontons of coal per year, we can expect to relieve some ofthe worries over strip mining also. All energy conver-sions pollute, we can take this as a law of nature, andnuclear energy presents its own special hazards.
_ Radioactive pollution: Since man-made radioactiv-ity is a relatively new hazard, there is considerableuncertainty and controversy over its effects. There is noquestion, however, that radiation is harmful. In largedoses it can cause death, in smaller doses ii can causecancer and leukemia and can, through the damage togenes, produce defects in future generations. There isalso no question that radioactive materials are pro-duced in reactors; the debris of the fissioned uraniumnucleus is intensely radioactive. What is in doubt is how
c-)
much .of this radioactive pollution will become a part ofthe environment and what effect it will have on humans.
The environment is exposed at three points in thenuclear fuel cycle. at the reactor, at the fuel processingand reprocessing plants, and at the waste dispoial site.Great care is taken to contain the radioactive effluents atthe plant, but small amounts do get into the air andwater. The prekent regulations are not as strict at fuelprocessing.and reprocessing plants and higher levelshave been measured at some of them. Waste storage isstill a developing technology and it is not clear what thefinal solution of this problem will be. What is certain isthat some mechanism for long-time security will have tobe established, for these wastes remain dangerous forhundreds of years.
There is considerable controversy over the possibleeffects of low levels of radiation exposure. We cansummarize the middle-of-the-road scientific opinion inthe following way: Exposure to radiation from nuclearreactors will be much less at present and in the nearfuture than exposure to natural sources of radiation.There will be some damage, however, hidden in thegreater damage from natural exposure. Some people \may die and some genetic damage is_being done whichcan be statistically blamed on reactors (just as somedamage is done by the sulfuroxides formed by burningcoal). We cannot, however, point specific instances.
If we turn -to the "breeder reactors" for power, ..webring a more dangerous radioactive hazard, plutonium,into the picture. It is one of the most potent radioactivepoisons known to man; it is longer-lived (it will be aroundfor thousands of years), and its biological activity is evenless well understood than that of the other radioactiveproducts. We must prepare to receive it into our envi-ronment with extreme care.
Reactor accidents: A second, and also new, hazardthat will accompany our turn to the nucleus for power isthe danger of catastrophic accident. Nuclear plants aredesigned with two or three overlapping safety systemsand their record so far has been excellent. No one hasbeen killed in an accident at a commercial facility. Thesame enormous release of energy, however, whichmakes the nuclear reactor a favored source of poweralso makes it potentially dangerous. If an explosionwere to spread the radioactive contents of the reactorover the surrounding countryside, it would be disas-trous.
Trying to estimate the chances of such an accident isa little like trying to estimate the probability of being hitby a falling meteor (and we have better data onmeteors). Nonetheless, the presently quoted odds of 1in 10,000 or even 1 in 1,000,000 reactor years" are notcompletely comforting as we face a future with 500 or1,000 reactors in operation.
Hijacking and bombs: As long as we stick to theconventional, so-called light water reactors for our
'A reactor-year is one year s operation of a reactor, 100 reactorsoperating for two years, for instank.e, equals 200 reatAul years.
7

energy, we can keep the question of bombs and reac-tors separate. These reactors cannot accidently ex-plode like a nuclei,* bomb (the explosion we referred toearlier would be a steam exploSion or a small scale"nuclear fizzle "): To make a bomb with stolen fuel or fuelproducts is also impossible, it takes expensive andsophisticated equipment to separate out the pure bombmaterial. As we mentioned earlier, however, with thebreeder reactor we are in a different and much moredangerous ballgame.
The fuel that the breeder makes is plutonium which,because it is chemically different from the uranium it ismixed with, can be more easily separated. Our produc-tion of this material is expected to rise from pounds totons per year as we enter the era of the breeder and wewill have to transport more and more of this potentialbomb material across our country.. There is at presentmuch discussion and deep concern over the threat ofhijacking, sabotage, and the nuclear blackmail that weare opening the world to. We must provide the plans forplutonium security now. It must be an error-free system,for mistakes can be the size of Hiroshima.
The Other ThreadsWe have spent the last sections discussing possible
effects of the production, transportation, and consump-,tion of energy on ourselves and on the biological envi-ronment we are a part of. The threads of the energy webextend as well into our social and economic systems. Wemention some of these threads below; in later chapterswe will follow them in greater detail into these other partsof our total "environment."
Energy and Economic Growth
Energy is the driving power for civilization_ It is both araw material and a "laborer" in industry. It is, necessaryfor our comfort, communication, and transportation. Theindustrialized countries are the large consumers ofenergy; high standards of living mean high per capitaconsumption.
Energy consumption is correlated with The GNP, thatindicator of economic strength. We saw evidence of anegative sort in the drop of the GNP during the oilembargo. Positive evidence is provided by the fact thatalmost all countries which have high per capita GNPsalso have high per capita energy consumption (We willlook at this correlation in detail in Chapter 5:)
In this country, the record over the past few decadesof the relation between the GNP and the consumption ofenergy is an interesting one. The ratio of energy con-sumed per dollar of GNP has been decreasing, we havebeen getting more GNP dollars per unit of energy. In thelate sixties, however, this decrease stopped and it maybe that our long period of improving efficiency is overand additional GNP dollars will be won only by increas-ingly large amounts of energy.
Energy and employment: It is not unexpected fromthe relationship we just examined to find that energy isalso strongly connected with employment. Again, the
8
embargo results back up this conjecture. The links be-tween energy and employment are multiple, howeyer,and different messages are carried along them.
There is no question that direcilinks exist and thatenergy shortages in many industries mean job short-ages. This is particularly true in industries in whichenergy is essentially a raw material, in refining andgasoline and fuel oil marketing, for instance, or in theprimary metals or plastics industries. These latter areparticularly sensitive to energy fluctuation since the rawmaterials come from coal, oil, or natural gas and energyfrom these same fuels is needed to create theproducts.
The energy industries, however, are not large em-ployers, they are,capital intensive rather than labor inten-sive. Most of the workers in this country are hot directlyeffected by energy consumption. It seems quite clearthat a reduction in consumption, which was accom-plished by improving the efficiency of energy utilization,could occur without reducing employment.
Energy cost: The most striking economic signal wehave received from energy has been its soaring cost.For the past two decades energy, in all its forms, hasbeen a bargain compared to other consumer items. Thishas been particularly true of electrical energy, whoseprice (either in constant, uninflated dollars, or actualdollars) has dropped steadily since the 1930s. In 1971this trend turned around and for the first time even theconstant dollar cost of electricity began to rise. It isexpected to rise from its average of 1.5 cents perkilowatt hOur of 1970 to 1.8 cents per kilowatt hour (in1968 dollars) by 1990. With inflation, the actual dollarcost may be as much as 7 cents per kilowatt hour.
The records of other energy forms are similar. Thecost,of a gallon of regular gasoline has gone from about35 cents per gallon in 1972 to 55 cents in 1974, fuel oilfrom 19 cents a gallon in 1970 to 31 cents in 1974,natural gas from 90 cents a thousand cubic feet to 120cents in the same three-year period. The price of coalhas also increased, the TVA paid $4.60 a ton for utilitycoal in 1969 and $28 per ton in 1974.
We are paying more for energy for several reasons.Profits, especially in the oil industry (and especially tothe Mideastern producers), have increased, labor costshave increased, and the cost of environmental protec-tion is beginning to show up in a small way. Whateverthe reasons, the energy bargain days are over, at leasttemporarily.
Energy and the poor: Rising energy prices are in-creasing the gap in energy use that exists between thewell-to-do and poor. The well-to-do household (averageincome $24,500) uses twice as much energy as doesthe poor household (average income $2,500), but only 4percent of the income, in the well-to-do household isspent on energy as compared with 15 percent in thepoor household. As always, rising prices place a heavierburden on the poor.
Energy and the food system; The total amount ofenergy used in the production, processing, and delivery
'36

of food is rising much more rapidly than the total energycontained in the food. It now takes about 10 to 15Calories of largely fossil-fuel energy to get 1 Calorie offood energy from the farm to the table. The inefficiencyof the American food system makes us question itsgrowing role both as a supplier of hungry countries andas an example'for emulation. ,Energy In Foreig6 Affairs
The control of iesources has always been a majorfactor in relations between countries. The shortage of oiland its pivotal role in industry and transportation havecombined to make oil in particular and energy in generala major international policy issue.
The United States has been historiqrally energy self-sufficient. It was an exporter through the first half of thiscentury, selling_raw materials and especially manufac-tured goods tb the world: We -began to-import oil insignificant amounts in the 1950s. it is no coincidencethat by the late 1960s our balance of trade began toshow a deficit. In 1970 our total deficit was $4.7 billionand $2.1 billion of this_was from oil and gas purchases.(We actually imported $3.6-billion worth of energy thatyear, but exports of coal and of oil produdts produced$1.5 billion in revenues.)
The contribution of energy purchases to the tradedeficit will certainly grow for several years: projectionsrange between $9 and $13 billion by 1975 and between$8 billion (for the optimistic supply case) and $32 billion(for the pessimistic one) by 1985. We cannot say withany certainty what effects on our economy and on theworld's economy these huge money shipments willcause.
Foreign polity: There is an immediately obviouseffect, however, on foreign policy. The kabian oil pro-ducers were able to use their control of oil to forcechanges in foreign policy statements, and to some ex-tent, actions by much of the Western world. The UnitedStates and the Netherlands were among the few coun-tries that resisted the embargo-backed demOds. The.control of such a vital international commddikby anarrowly-focused group of countries will cause muchconcern and call for delicate and enlightened negotia-tions during the next decade. The United States with itstraditional support of Israel is in a particularly difficultposition.
The industrially underdeveloped countries are evenmore vulnerable as most of them are also energy import-ers. The challenge to international policy goes beyondloans for oil purchases. It must also include loans ofmoney and "know-how" to enable them to build up localsources of energy. Water, wind, and sun may be theirenergy of the future.
Summary
In this introductory chapter we have given a brief andlargely qualitative picture of the energy web which lacestogether all parts of the biological, sociological, andeconomic environment. The existence of this web wasbrought home to many of us by the jangling it received
from the oil embargo of winter and spring 1973-1974.From that experience, we were able to measure some ofthe relationships of energy to money, work, and play.The GNP declined by about $15 billion, 500,000 Jobswere lost, and all prices increased.
We described in broad outline the input-output statis-tics of energy. The 19 quadrillion Calories of energy weused in 1973 were shared by industry (35 percent),transportation (25 percent), residences (24 percent),and commerce (10 percent). Six percent was used asraw materials. The input was 95 percent from the fossilfuels (oil 46 percent, natural gas 31 percent, and coal 18percer't). The rest came from hydropower (4 percent)and nuclear energy.
We pointed to the energy areas that have or are aboutto become critical ones: the importation of oil, the short-age of natural gas, and the growth problems in theelectric utilities industry. We also summarized the pres-ent and future areas of environmental concern: air pollu-tion, the competition for water use, land use and oceanuse, and the new concerns growing from our increasingreliance on nuclear energy.
We finished with a glance at those strands in theweb which cause energy decisions to interact withour economy and even our foreign policy.
Chapter 1 has been an introduction to a most complexissue. In it we have tried to show both the breadth andthe depth of the energy web. We must now, to an extent,forget the whole and-look at the interconnected partswhich form it. In the next chapter we begin with theenvironment, that source and sink for energy whichsuffers at both ends of the energy flow.
9

CHAPTER 2Energy Production andthe Environment

Energy Production and the Environment
One of the most important lessons of ecology is that"everything is connected to everything else.' Nowhereis this lesson more convincingly taught than in the over-lap between the "Energy Cris& and the 'Environmen-tal:Crisis."
If we begin our study of crisis with energy, and worryabout the inability of supply to meet demand, we areimmediately told that obstruction by "environmen-talists" has slowed down the construction of generatingplants (coal burning as well as nuclear) as well as oilrefineries. Pointed to are delay of the Alaskan pipeline,the moratorium on offshore oil production in thePacific,and attempts to restrict strip mining for coal. We are alsowarned of the need for much more energy to repair pastdamage ,to the environment and to safeguard its future.
If we enter the question by way of the environment wecome immediately to energy. Air pollution is, for themost part, a problem caused by energy consumption.Most of the harmful chemicals in smog come either fromthe fossil:fuel generating plants or the automobile. Theproduction and.trarlsportation of energy. are responsiblefor strip mining, oil spills, and the "aesthetic pollution" oftransmission lines. Energy consumption also causes"heat pollution" of our rivers and of our cities' air and isbehind the new threat of radioactive pollution.
Whatever our approach, whether environmental pro-tection or energy consumption, it is clear, that energyand environment cannot be studied separately. In thenext three chapters we will look at several aspects, ofthese complex interactions. Our focus in this chapter ison the environmental effects of "production" of energy,its extraction from primary sources.
first we look at the primary sources of energy. thefossil fuels, uranium, and the running water that turnsturbines at our many hydroelectric plants. (We descnbethese sources and estimate their sizes, importance, andprospective lifetimes in Chapters 1, 2 and 4 of VolumeII.) To begin, we look at coal, that old fuel which isregaining eminence.
The Environmental Costs of Coal MiningAfter two decades of decline, the production of coal
from this country's mines has begun to grow again. The590,000,000 tons of coal mined in 1973 is expected tobe 850,000,00(y tons in 1980. The historical picture ofcoal mining, the miner with the light on his cap pickingaway at the wall of an underground mine, has changeddrastically. Half of our coal still comes from undergroundmines, though practically none of it is mined by handanymore. The other half is mined above ground by hugestrip-mining shovels and "draglines." Whether drawnfrom deep mines or ripped from the surface, the extraction of coal often damages the countryside that contamed it.
Strip Mining
Surface mining of coal has rapidly gained prominencein the past Iwo decades. In 1950 a quarter of the total
tonnage was produced by strip mining, in 1970 halfcame from surface mines. This method of mining will beimportant for several decades since about a third of the390 billion tons of coal reserves (see Table 2-2, VolumeII) can be mined from the surface.
Strip mining is simple in concept but it requires theuse of some of the most impressively oversized equip-ment in existence. A huge shovel or "dragline" digs along trench to get to the coal seam. Smaller shovels digout the coal and load it into huge trucks for deliveryeither to a nearby "mine-mouth" generating plant or arailroad loading. The largest of these shovels, "BigMuskie," can dig 325 tons of soil in one bite, and trucksor earth movers capable of carrying 100-ton loads are inservice.
Unreclaimed land that has been strip mined is a des-olate sight indeed, and the careless mining practices ofthe past (and the inadequacy of regulation) have left us alegacy of hundreds of thousands of acres of such desol-ation. The effects of strip mining on the land dependsomewhat on the topography, on whether it is flat .orhilly. The basic disruption is similar to deep plowing. Along trench is' dug and its coal removed, then a paralleltrench ch..g and the "overbUrden" (the soil above thecoal) is dumped into the old trench. On flat land thisprocess produces long furrows of upturned earth. Onmountain sides the cuts often circle the peaks With cliffsand "spoil banks" of piled earth. The mountain is peeledlike 'an apple.
For both types of terrain, part of the resulting problemlies in the sterility of what is left. In the past the topsoilwas usually buried under 50 or 100 feet of rock andsterile subsoil. If the stripped area is on a hill or moun-tainside, the problems are further complicated by ero-sion and landslides; there are no roots of trees or grass-es left to give the soil stability. Without stabilitl), even onflat land, wind and water move the residue in unwantedways.
Rainfall not only causes erosion nil nearbystreams and lakes with silt but adds a further hazard.Coal is usually formed with considerable sulfur con-tamination (this is the source of some of the smogchemicals released in its burning). Water leaches outthis sulfur and forms sulfuric acid which, if intenseenough, can kill marine ife in the streams it reaches andlessen or destroy the fertility of the land.
The approximately 5 billion tons of coal taken fromsurface mines between 1930 and 1971 resulted in about11/2 million acres of strip-mined land, according to theBureau of Mines' latest summary.' If strip mining ac-counts for 60 percent of the 8.3 billion tons of coalexpected to be mined between 1978 and 1985, we cananticipate another 11/2 million acres to be added. Thistotal of 3 million acres, or 4,700 square miles, is an areatwice the size of the state of Delaware. At the time of thelast survey, in 1971, about a third of the 11/2 million acres
'Bureau of Mines Information Circular #8642.
$19 13

were unreclaimed and many of the remaining acreswere only partially reclaimed.
We cannot afford the pioneer luxury of leaving thisland desolate. Fortunately, it appears that new statelaws and tighter enforcement of existing laws ekebrought considerable improvement in the overall pic-ture. Reclarnatiorkfforts (which we will discuss in a latersection) have becpme both more sophisticated andmorewidespread. There is hope the 11/2 million acres tobe strip the next decade will be left in better shape.
Underground ing
To firs\ appearan s underground mining is muchless envira mentally des tive than strip mining. It ismessyi but o are many ind The most obviousdamage is fr m land subsidence, from mine cave-ins.Although most, mining laws require that pillars, whichsometimes amount to 50 percent of the coal, be left inplace to hold up the roof; the mines cave in nonetheless.The Department of the Interior estimates that 8 millionacres of land have been undermined by coal extractionand that 2 millionacres have subsided. Most of this is inrural areas and creates problems of land usage. The 7percent of subsidence under urban areas has causedmore serious effects.
Mine acids, from deep mines, are also environmentalthreats. The most troublesome sources are abandonedmines below groundwater levels; the leakage fromdeep and surface mines has contaminated more than10,000 miles Of rivdrs and streams in coal country. TheDepartment of the Interior has estimated the cost ofcontrolling acid mine drainage in the country at$61/2 billion. Pennsylvania alone faces a $1 to $2-billioncost and has embarked on a $150-million 10-year planto restore water quality.
The most serious damage to land and water fromunderground mining may also be behind us. Many stateregulations have been toughened and the new FederalWater Quality Act can also be invoked to protect rivers
---irid-Sfreams-fronr acid-d rain ag e
Waste Heaps and Fires
Forgotten by those who are unfamiliar with coal coun-try are the fires that burn uncontrollably in many under-ground mines. Since 1949 a program of the U.S. Bureauof Mines has successfully brought 150 mine fires undercontrol, but at last count 200 were still burning, damag-ing the surrounding area and consuming valuable re-sources.
Coal mining is the third ranking industrial prJducer ofmineral wastes, most of which come from washing thecoal to remove impurities. There are at present morethan Zbillion tons Of this waste in unsightly banks, manyof them near urban areas where wind and water erosionspread their dust. some are on fire, adding to local airpollution.
The results are Sometimes more immediately tragic.In 1972 a makeshift dam of coal waste gave way atBuffalo Creek, outside (*Man, West Virginia; the disas-ter took 124 lives.
14
Much of this waste material is coal dust and one of themost satisfactory ways of disposing of it would be toburn it to create steam for electric power generation.There is some experimentation to this end.
'Health Hazards
"Warning Coal Mining May be Detrimental to Se:JUIHealth," the sign should read. It cs commonly considered to be the most dangerous industnal occupation.The data supporting this charge are shown in Figure2-1. We show three curves: the total number of fatalinjuries, fatalities per million tons of mined, coal, andfatalities permillion man-hours of mining. Both total fatalinjuries and fatalities per million tons of mined coal havebeen reduced dramatically.since the early part of thiscentury. The total has gone from about 2,500 fatal in-juries in 1920 to around 250 in 1970 and 132 in 1973.Fatal injuries per million tans of mined coal have drop-ped from almost four in '1935 to 0:4 in 1970 and 0.22in i 973. The number of fatalities per man-hours worked,however, has declined mere slowly. It was about 1.6 in1935 and still around on in 1970. Due, one hopes, tothe new Mine Health and Safety Act of 1970, this ratiodropped to 0.72 in 1971, lo 0.56 in 1972 and was about0.45 ih 1973.
The decrease in the total number of deaths, and indeaths per million tons of coal mined, is a result ofmechanization. The increase in the amount of coajmined at the surface haV also contributed to the cif-creasp in fatalitres. In 1972, for instance, the numbeyot
FIGURE 2-1Coal Mining Injuries
ton II1)3 .11.4 ya
Year

fatalities per million man -hours in underground mineswas 0.71 while it was 0.34 in strip mines.
The apparent greater danger of underground miningpresents a difficult choice to land-use planners. Howdoes land abuse balance against the dangers of under.ground mi. g? There is, however, some fairly convinc-ing evidence that coal can be mined undergroundsafely. There are coal companies engaged in under-ground mining whose statistics are better than somest..p mining companies. Most of these exemplary com-panies are owned by the big steel producers. The non-fatal injury rate in U.S. Steel's predominately under-ground coal mining, for instance, was 5.3 per millionman-hours in 1972 and 7.0 in 1973 as compared with53.7 and 50.2 for the Peabody Coal Company, whichproduces 80 percenLof its coal by strip mining. Eventaking into account the fact that some of this diorencemay be due to different injury reporting practices, wecan be encouraged by this comparison to believe thatunderground,mining can be conducted safely. It shouldbe. In the words attributed to Arnolcfyiller, President ofthe United Mine Workers Union. If we can't mine coalsafely, we won't mine it."
Black Lung: The most costly re It of past coal min-ing practices is "Black Lung," a espiratory ailmentcaused by inhalation of coal dust. It is estimated that asmany as 125,000 miners may have this life-shorteningdisease, which is similar to emphysema and is at leasta contributing cause of 3,000 to 4,000 deaths per year.Unless great precaution is taken, mechanization, withits greater dust production, may increase its incidence.
Although the cost of death and disease cannot bemeasured in dollars(Black Lung does have a dollar costthat is already staggering. The 170,000 claims proc-essed in 1970 (out of 250,000 filed) were settled for$151-million. The amount appropriated for 1972 was$385-million, and the final bill has been estimated at58-billion: The early costs of Black Lung claims wereborne by the taxpayer and represented a hidden sub-sidy for coaLAs_of January .974, howe -.I, under the
_____provisiOns of the Mine Health and Safety Act, the costsare borne by the coal company and are therefore addedto the cost of cz.al. This should have a double benefit,the mining companies have a strong incentive to im-,prove mining practices and the coal consumer, whopays directly for this additional cost, thus has addedincentive to use coal as efficiently as possible.
Brightening the Picture
We have painted a rather dreary picture of the dam-age to land and hying things incurred in coal mining. It isa true picture of the recent past but unfinished. Thepicture can be drawn much brighter. We have detailedthese diseconomies of coal not to detract from its impor-tance but because it will be so important in our nearfuture. For at least another decade we will generateaimcst half of our electricity from coal-heated steam. It isimportant that the users of this electricity realize the realcost per kilowatt, more than that, as we have argued
above,/ that they insist that all these costs Of coal beaddedto the bill.
There is now some concrete evidence to support ourhope that the picture is brightening. We have referred tonew state and Federal regulations .and to the drop incoal mine injuries following the new health and safetylaw. This law also may greatly reduce the future inci-dence of Black Lung. MeaSurements of dust levels inmines, taken by the Department of Interior's MiningEnforcement and Safety Administration, show thatmine dust has been lowered to the specified levels
Reclamation: The strip-mining picture has bright-ened considerably, also. Most strip-mined land can bereclaimed, if not to productivity at least to stability Theminimal steps are to regrade to the original contour andto reseed. This is important (but more complicated) onmountain and hillsides if landslides and erosion are tobe prevented.
What determines the final condition of the land isoften rainfall. In the Appalachians, the contour cuts mustbe dammed to prevent drainage of acid water, in theWest, there is a danger of insufficient rainfall for reseed-ing and a worry that such rains as do occur may leachalkaline salts from the up-turned soil and create a prob-lem soil which is too- alkaline.
Reclamation is now a routine component of mining atmost strip mines. The European practice of setting top-soil aside to put back on top after grading is comingmore and more into practice. All states require gradingand seeding and in many states the bonds posted by thecoal companies are not released until vegetation haslasted through three growing seasons.
The brightening of the picture even extends to thestatistics. According to the;Bureau of Mines circular onstrip Mining we referred to earlier, 73,200 acres werestrip mined for coal in 1971 and 94,600 acres werereclaimed. It appears that even some of strip mining'sdesolate legacy is being erased.
Uranium MiningUranium mining is carried out on a much smaller
scale than coal mining. 6.$ tons of :Lis ore weremined in 1968, for instance, as compared with about
.550 million tons of coal mined that year. Uranium ismined in both deep and surface mines, and its earlyhistory provides appalling, examples of carelessness,radioactive waste water was dumped into rivers andhomes were built on mina tailings. (The State of Col-orado and the AEC have recently begun a program toremove the uranium waste used as fill dirt in severalhousing developments in that state.)
Uranium miners face the same dangers as coal miners, accidents, exposure to dust (which can cause respiratory problems similar to Black Lung-), and fumes.The fact that the ore they seek is radioactive creates anadditional hazard.
Uranium gives off a radioactive gas, radon, which,since it is heavier than air, concentrates in mine shafts.Breathing this air exposes sensitive lung tissue to radiation ancilthe miner to the danger of lung cancer. A study
15 .

of 3,400 uranium miners in 1968 found'70 cases of lungcancer, an incidence of this disease which is six timesgreater than in comparable groups. Since it takes 10 to20 years, on the average, for lung cancer to develop, weare juit beginning to see the first signs'of what may be aserious human cost of production of this energy fuel.
Offshore and Arctic Wells
The search for oil and gas has taken man and hisequipment deep into the continental Unite States. Inthe future it will take him into the rola ely shallowwaters of the continental shelf and under, Arctic icewhere (as we describe in Chapter 2 of Volume II) morethan half our yet-to-be-discovered oil is expected to liehidden. In both cases he will expose a delicate environ-ment to a new pollutant.
and.the Ocean
We have produced oil from marine wells for sometime, chiefly in the Gulf of Mexico and to a lesser extenton the Pacific Coast. Statistically, the record has beengood. Of the more than 14,000 offshore wells drilled uy1970, only 25 have blown out of control. When this rareaccident takes place, however, the results are dramaticand depressing. In the Santa Barbara spill of a fewyearsago, 50,000 barrels of oil caused considerable damageto the beaches and the shoreline life.
In addition to the rare "blowout;" the development ofoffshore oil production also threatens the environmentthrough leaks or breaks in the pipelines that carry oil toshor3 or through discharge of oily waste water intoshore waters. A pipeline accident in the Gulf of Mexico in1967 spilled 167,000 barrels of oil Into the Gulf. Some3;000 barrels of oily waste are also discharged annually.
It is estimated that worldwide offshore production ofoil discharged 700,000 barrels of oil into the ocean in1969 and that onshore refinery operations addedanother 2 million barrels? In Table 3-1 -we compare thispollution with other sources of the ocean's oil burden.
The environment at risk from these coastal opera-tions is delicate and important. The deep ocean is adesert, as far as life per square mile is concerned. Therichness we associate with it Is confined to the shallowcoastal areas, the bays, estuaries. and salt marshes.These are the incubators and the pantries of ocean life.We don't know very much about the long-term effects ofoil on marine life. In large amounts it is toxic. There isgrowing evidence that some of the most toxic elementsin oil are water soluble and are taken up and retained byocean life. Since some of these are carcinogens (cancercausing), we may be threatening more than the oceandwellers. We may find these carcinogens accumulatingin the fish we eat.
Oil on Ice
The Arctic is similarly vulnerable. It is a harsh envi-ronment at best, its balance easily tipped against its
2"Man's Impact on the Global Environment' (Cambridge, ;..as-sachusetts: MIT Press, 1970), pg. 267.
16 '12
inhabitants. It is also a region in which small changescan bring about large effects on our climate. For thatreason alone we must allow change only when pre-ceded by a thorough understanding of the conse-quences. .
Drilling for oil and gas on United States land area hashad minimal and localized effects. Small areas. havebeen damaged hy oil spills and the concentrations ofmen and machines. Oil spills in the Arctic, however, inparticular those on the ice or ones that get under the ice,can have much more serious effects. A large spill wouldblatken the ice, making it more absorptive of the sun'sradiation and\ causing it to warm and melt. Since openwater is also more absorbent than ice, the warmingprocess trigg red by the spill could continue as thewater absorbs radiation, was heated and melted moreice.
The Arctic region is the incubator of much of theNorthern Hemisiaherfs weather and there is convincingevidence that changes in the ice cover there have beenassociated with la: ge-scale climate change. A reductionof the Arctic ice cover from 1924 to 1944 was accom-panied by changed wind paths and rainfall patterns.Summer droughts in the northern temperate zone be-came more frequent.
Since the U.S.S.R. and Canada, as well as the UnitedStates, have large-scale Arctic oil exploration effortsunder way, the threat of oil on ice is a real one. It isimportant that we have a thorough understanding of thedangers and the technology to prevent them before webegin to handle large quantities of oil in the Arctj ._.
OH ShaleWe are beginning to look to the vast oil shale deposits
of Colorado, Utah, and Wyoming for our future oil sup-plies. (The extent, nature, and means of exploiting thesedeposits are briefly discussed in Chapter 2, Volume II.)There are threats to the environment in this operation.
Mining the shale and extracting the oil from it byretorting (heating it to drive out, the oil and gas) is themethod nearest commercial viability. The mining will beaccomplished both by strip or open pit mining and byunderground mining. The impact of this miningthreatens to be greater than that of the coal mining wehave examined earlier. The energy content of an aver-age ton of shale is only one - seventh that in a ton of coal;more of it must bemined to produce an equal amount ofenergy.
After the extraction of oil from the shale, there will bean enormous amount of spent shale to dispose of. Theshale in the Piceane Creek Basin of Colorado (seeFigure 2-2, Volume II), which is the region attracting themajor interest at present, averages about 25 gallons ofoil per ton of rock. Thus, for each barrel of oil (42 gallons)extracted, 1.7 tons of shale must be mined. After treat-ment this crushed shale will require disposal. Becauseof the crushing and the heating, the actual volume ofrock to be disposed of will be greater than the space itoccupied before mining.

The Green River region presents challenges similarto those faced in Western strip mining. Much of the areaexperiences low rainfall so that reclamation will be slow,the crushed rock will expose many unwanted chemicalsto be leached out by such rain as does occur. The deepmining may change existing ground water flow patterns.
Some of the environmental impact of mining and ex-terior retorting of oil shale can be lessened if the tech-nique of In situ production can be successfully de-veloped In this technique a region of shale is drilled andfractured either by hydraulic pressure or explosives.The shale is then set on fire and the fire sustained byompressed air. What bums are the volatile gases driv-
en from the rock, the oil vaporizes and then condenseson cooler rock surfaces and collects at the bottom of thecrushed region from which it can be recovered by addi-tional wells. In situ production avoids the problems ofwaste rock disposal. It is not yet a viable commercialprocess and there are still questions to be answeredabout its deleterious environmental impact. Its effect onground water supply and purity, for instance, needsmore study. It will also be a relatively inefficient meansof utilizing the oil shale.
The similarity with the Four Corners situation con-tinues when aesthetic and recreational values are considered. Not only is the beauty of the mountainous areathreatened but one of the largest herds of mule deer inNorth America winters in the million-acre Piceane CreakBasin where the shale development effort is now fo.cused. There is serious concern over the effects ofdestroying thei traditional habitat.
The emerge ce of a shale industry of the sizetargeted by esent Department of Interior plans1,000,000 barrels of oil per day by 1985 will not onlyrequire the mining and disposal of about 1,700,000 tonsof shale per day but will also completely change thesocio-economic characteristics of the region. The 150present inhabitants will be augmented by much largerwork force to support the industry. Cities, roads, com-munication systems, schools, etc. will need construcLion. Water demand in this water-short region will increase.
The future of oil shale is very uncertain, especially sosince the "Black Friday" decision of Octobei 4, 1974.The production of oil from these rocks was expected totake its first giant step forward from the "Colony De-velopment Operation,' a pilot, 50,000 barrel- a day processing plant that was to be built by a consortium of oilcompanies. On Black Friday" the plans were called off.
One of the important factors was the inflation in construction costs. The 1973 estimate of plant cost was$450 million, the :atest estimate $800 million. The corresponding estimates of shale oil cost soared from $6per barrel to $12 per barrel. Given the uncertainty of thefinal price of Mideastern oil, $6 barrel oil is worth agamble but $12-oil is not.
The uncertainty of shale oil costs is accompanied byuncertainty over the net energy gain. There are twostudies which claim that if the costs of mining, process
ing, transporting, etc. are taken into account and if theenergy costs of the manufactured materials ,to be usedby the shale industry are added, no net energy is gainedin processing oil shale. This analysis is contradicted byDepartment of Interior studies that show output to inputenergy ratios as high as 10 to 1, but which do notapparently include manufacturing energy. The netenergy question deserves a definitive answer before oilshale mining and processing, with its large environmen-tal and sociological impact, are allowed to begin.
A program to obtain our needed energy from oil shalemus(be put in the same category of questionable solu-tions as was large-scale Western coal mining, offshoreand Alaskan oil and gas drilling and the breeder reactorprogram. All of these carry as yet unmeasured environ-mental risks and should be entered into only after propersafeguards are established and only then when theneed for this additional energy is clearly established.
These four issues (Western strip mining, offshoreand Alaskan oil, the breeder reactor program, and oilshale) are among the most chajlenging ones which facethe readers of this Source Book and their students. Afifth related and equally crucial issue should be added,large-scale importation of oil and gas, which raisesquestions concerning the effects of transporting andhandling these fuels. We will discuss this issue in thefollowing .chapter. The answers cannot be based simplyon environmental information, but must take into ac.count the supply and demand information of Chapters 4and 5 of Volume II, the alternative energy sources discussed in Chapters 6 and 7 of Volume II, and the social,economic, and political factors which are dealt with inthe last two chapters of Volume I. These five issueshave perhaps the highest priority of any discussed in theSource Book, but there are others of only slightly lessimportance and we continue with their review.
Dams and ReservoirsHydroelectric power produces only 15 percent or so
of our electric power and is of major importance only inthe West. The train of energy conversions here is a shortone, the mechani :al kinetic energy of water is transferred to a turbine and electric energy is produced by agenerator. The environmental effects are correspondingly sn.aller hit they are not nonexistent. The environmental impact which derives from tapping this source ofenergy differs from most of the others in that one canpoint to benefits other than the energy provided.
The creation of reservoirs, in fact, has counteractedsome of our other activities (water pollution and algaestimulation from over fertilization) which are destroyinglakes. A reservoir provides recreational benefits, increases certain fish populations, causes local and oftenbeneficial changes in ground water level and atmospheric moisture. Flood control is improved, a humanbenefit that may have deleterious effects on marine life,which counts on seasonal flooding for food and uses theflood plains for spawning and nursery areas.
rj.c 3 17

The effects of dams have not been adequatelystudied, and while we are probably nearing the end ofthe dam-building period i t this country, there is muchadditional waterpciwer tc be harnessed in the world (aswe document in Chapter?, Volgme II). To the extent thatwe play a role in this activity elsewhere, we must re-.member the lesson in ecology taught by the Aswan Damon the Nile. The ecological assessment was not done inadvance of the engineering and as a result there are, inaddition to electric power and irrigation, a ruined sardinefishery at the Nile's mouth and an epidemic of a water-borne parasite in the irrigated regions.
We must not forget, in these ecological evaluations ofdams, their most obvious impact. Dams are most pro-ductive in deep canyons with/swift streams. Such spotsare usually among our most scenic ones. Glen Canyonin Utah is now Lake Powell. The Bureau of Reclamationpreceded its advocacy/of the Four Corners evelop-ment with a proposaLto build two dams in the GrandCanyon region. These were stopped by public outcry ashas been the plan .to dam Hells Canyon, the deepestgorge in North America. These are again examples ofchoices between en rgy and environment.
Pumped Storage
While it is likely th Lthe drive to dam rivers is abating,much attention will have to be given in the next decadeto the environmental effects of pumped storage facilities(a sketch of one such facility ip prdyided in Figure 6-5,Volume II). All that is needed here -is a,eource of waterand a modest hill (200 feet or so high) to build a reservoiron. One of the bitterest confrontations between the en-vironmental spokesmen and the energy producers,however, came over the plans of Consolidated Edisonof New York to build a storage plant on Storm KingMountain on the Hudson River. Building a reservoir onthat summit would have leveled it, flooded 240 acres ofwilderness area, and destroyed (in the words of one ofthe opponents) "one of the grandest passages of riverscenery in the world." The construction of Storm Kinghas been held up for eight years and is still in doubt.
There is an additional, generally unremarked effect ofpumped storage, especially near urban areas like NewYork City. The advantage of pumped storage is that itallows the baseload plants (the big fossil fuel or nuclearplants which run at a steady level of power production)to store energy during off-peak periods (generally night-time) when demand is low. If the baseload plants arefossil fuel burning, however, this would mean a con-tinued production of air pollution into the night skies. Forthis reason it is anticipated that pumped storagefacilities will be built primarily in conjunction with nuclearbaseload plants.
The Non-polluters of the FutureIn most of this chapter we have painted a somewhat
disturbing picture of the interaction between energyproduction and the environment. It is true that, as far asour present energy sources are concerned, we extractenergy only at environmental cost. This general rule will
18
probably always hold, it is a corollary of you can't getsomething for nothing." As we look ahead to some of theenergy sources of the future, hgyvever, we seethe pos-sibility at least of extracting energy with less environ-mental i pact.
Solar/ nergy1p Chaptc:- 7 of Volume II we investigate several sug-
gestions for tapping the enormous flux of power thatArrives each day from the sun. These schemes rangefrom those which draw from secondhand solar sources
wind, water power, and photosynthesis to thosewhich convert the direct energy of sunlight. Ali of thesemethods of energy storage have some environmentalimpact. However, since these techniques involve thecollection of energy rather than its extraction from someecological niche, the environmental damage is gener-ally less.
The most promising techniques for tapping the sec-ondhand sources are which involve the production of methane,or thedirect burning of organic material(organic waste is of particular interest). This cor..asioncan be polluting. IL:is a potential source of particulateMaterial and therefore must be controlled. Most organicmaterial, hoWever;boes not contain sulfur and thus thatproblem is lessened. The use of organic waste as a fuel,while it may present some problems of air pollution,offers a solution to the equally troublesome problem ofits disposal.
The other secondhand solar sources, wind andwaterpower, should have only minimal impacts on theenvironment. We have already discussed dams andreservoirs. Wind power is, at present, largely an un-known quantity environmentally. As we mentioned ear-lier, a major effort to extract kinetic energy from the windmight change weather patterns, and a study of theseeffects must therefore be a part of the technologicalassessment of this form of energy conversion. A largesystem of windmills across the country would also haveaesthetic drawbacks.
Solar energy farms: A scheme for collecting ther-mal energy in desert areas and converting it to electricalenergy was described in Chapter 7, Volume II. Sincelarge amounts of land will have to be covered with solarcollectors, this has environmental impact. The esti-mated 10,000 square miles to produce half the 10 billionMw-hr of electrical energy projected for the year 2000,however, is only 2 percent of the land we now use togrow food and will not be much more environmentallydisturbing. Cattle, for instance, could graze among thecollectors pictured in that description. In addition, as weexplain in that chapter, the radiation balance of thedesert is preserved.
.Solar seapower: There is also reason to believe thatcollecting energy from the temperature difference be-tween surface and deep seawater would have a minimalenvironmental impact. The energy available there is suvast that large amounts could be tapped without causing appreciable temperature changes.

In this last section we have contrasted the environ-mental impact of some future techniques of energy ex-traction with those that now provide primary energy. Thecontrast is encouraging. lt appears that if we can suc-cessfully negotiate the dangerous times directly aheadof us, the next 20 years, more or less, and can turn tosome of these new sources for energy, we can removemuch of the threat that energy extraction now places on
. us and on our environment.
Summary
There are measurable environmental costs of extract-ing energy from primary sources. These are most obvi-ous in the case of coal where our experience is mostcomplete. The choice seems to be between strip min-ing, which has already overturned some 2,400 squaremiles of land leaving much ofit ruined, and undergroundmining, which causes cave-ins and ruins streams withits acidic drainage. Coal mining, especially under-ground mining, also extracts a price from the miners. It isamong the most dangerous Occupations and injury anddisease must be counted in coal's cost.
We also mentioned some recent statistics which sug-gest the coal mining picture is brightening. The regula-tion of strip mining has been tightened and the reclama-tion technique4 have become more sophisticated. In1971, in fact, more land was reclaimed than new landwas stripped.
There has also been progress in mine safety and inprevention of Black Lung since the passage of the MineHealth and Safety Act. The Federal Water Quality Stand-ards have brought ab\out improvement in the acidwater pollution of coal-country water.
In this chapter we alsO briefly listed the environmentalcost.of extracting energy irither forms. Several futuresources carry warning signs. tf we turn to the oil shalesfor energy, we will be entering a'rnining operation largerthan the one for coal. Oil shale has only about one-seventhlhe energy per ton of coal and most of the shalebecomes waste rock to be disposed of. Oil shale is alsoa prime example of the continuing problem of turningrelatively wild areas into mining and producing sites.
In turning offshore and to the Arctic for oil we arethreatening a much more delicate environment than didpumping oil from the soil of Texas, Louisiana, or Califor-nia. The shallow coastal regions can be seriously dam-aged by oil and the Alaskan't'undra is threatened by allthe activity taking place on it. We mentioned in particularthe chance that oil spills on the ice might bring changesin climate.
The purpose of this chapter is twofold: to inform read-ers of the various environmental costs of digging anddrilling (and damming) for energy, and to enlist their aidin making sure that future energy demands are weighedagainst these costs.
4.
19

46
-CHAPTER 3Energy Transport andthe Environment

Energy Transport and the Environment
Energy, unlike money, draws no interest when it sitsunused. To obtain value from it we must deliver it to acustomer. In some cases, the means for delivery haveimportant environmental effects.
Energy is shipped in several ways. OH and gas travelby pipeline across this country and oil is moved in largerand larger quantity by tanker from foreign sources. Coaltravels primarily by rail, electricity by wire. We discussthe relative dollar costs of these different methods oftransport in Chapter 3, Volume H. Transportation alsohas its environmental costs.
Moving Oil
As the United' States begins to deplete its own conti-nental resources of oil and looks to Alaska and to theMiddle East for supplementary supplies, a new class ofenvironmental problems is opened. It is impossible, ap-parently, to transport these millions of barrels of oil perday without spilling some. And, as we have indicated inthe previous chapter, oit does not mix well with water or
Oil Splits
The Torrey Canyon disaster off the coast of Englandin 1968 dramatically broughtto our attention the grow-ing environmental hazard posed by ocean shipment ofoil. It was the size of the disaster, not the occurrence,that made it noteworthy. The Torrey Canyon was one ofthe first "supertankers," the huge floating oil cans whichhave begun to dominate international oil transport.
The Torrey Canyon had a cargo of about 35 milliongallons of crude oil e which some 29 million gallonswere spilled. The cleanup bill totaled about $22 million.This. ship, by today's standards, was a small super-tanker. Its "deadweight tonnage" (DWT, the "dead-weight" is the load in long tons 2,240 lbs. that canbe carried) was about 100,000. The largest supertankernow in service (the Globtick Tokyo) has a DWT of477,000 and a capacity of 180 million gallons of oil.Larger tankers are being built and tankers of 1,000,000DWT are on the drawing boards.
The effects of the Torrey Canyon wreck are still ap-parent. Oil-covered beaches and the 70 to 100thousand seabirds killed were the most visible results,but the detergent used to disperse the oil did evengreater darbage1O eggs and larvae and other parts ofthe ecological web of sea life. Divers reported large killsof shellfish on the ocean bottom.
It seems to be only a matter of time before one ofthese larger tankers comes to grief. Already the 206,000DWT Japanese-built Metula ran aground, in the StraiPofMagellan on August 9, 1974, spilling about 15 milliongallons of her cargo into Chilean waters. The remainderwas pumped out before she broke up in rough seas.
The Metula accident was little noted in- the press,although the oil slick covered 1,000 square miles ofocean and fouled 75 miles of coastline. What it remindsus of is that these ungainly, unseaworthy ships too
large for ny of the canals are taking the historicroutes ar d Cape Horn_ and the Cape of Good Hope.They are th iling through some of the roughest seasthat can be found. The difficulty of handling the cleanupoperation also augurs poorly for the proposed Alaskantanker route we shall mention later.
Other oil leaks: Accidents are the most dramaticcauses of oil pollution but not the most important ones.An estimated 2.4 million tons of oil were spilled ordumped into the ocean by man's activities in 1969 (seeTable 3-1) and accidental spills of all kinds shipcollisions, well blowouts, etc. only contributed200,000 tons, one-tenth of the total.
Half of the total was attributed to "normal ship opera-tions." Since oil flows in one direction only, from sourceto consumer, and since the consuming countries haveno bulk liquid to ship in return, most tankers returnempty. In order to remain seaworthy they fill up withwater as ballast. It is the dumping of this water, nowmixed with oil, that is the major cause of ocean pollution.We have mentioned some of the other sources, spillageand discharges from onshore operations, for Instance.
Oil is also a major pollutant in the nation's rivers andthis oil makes its way to the ocean. Most of the oil in therivers finds its way there from sewage used crank-case oil is one of the major components. Some of it,however, is also there due to transportation accidentssuch as the one on the Mississippi in 1973; four bargescarrying diesel oil struck a bridge and spilled 12,000barrels of Unto the river. The next day the oil slickcovered 160 miles of the river.
Table 3-1 summarizes the most import-int sources ofthe ocean's oil pollution. The total is quite uncertain,most of these squrces are quite difficult to judge andestimates of the total range from 1.8 million to 11 milliontons. The amount contributed by natural seepage, forinstance, is in considerable doubt.
Since all the man-made sources should contribute inrough proportion to the total amount of oil produced andshipped, oil pollution, without corrective measures,should grow with consumption, doubling every 10years.
TABLE 3-1Sources of Ocean Oil Pollution, 1969
Thousands ofTons of Oil
Normal Ship Operations 1,100Normal Offshore Production 110Refinery Operations 330Oil in Sewage and Rivers 660Accidental Spills 220
Total Oirect Input by Man 2,420Natural Seepage (est.) 110
2,530
Source. Man s Impact on the Global Environment, Cambridge,Massachusetts. MIT Press, 1970, p267.
23

Reducing the input: There are ways to reduce oilpollution. Since the contribution from normal ship operations is such a large fraction of the total a new definitionof "normalcy" seems to be needed. International effortsare now under way to make "load on top" operationstandard procedure. Since oil floats on water it is possi-ble to pump most of the relatively clean water ballast outfrom under the oil and then let the oil, with a little remain-ing water, settle in a "slop tank" at the bottom of thestorage tanks. New oil is then loaded on top.
There have been other suggestions for reducing theoil in ballast, separate ballast tanks, rubber membranesto separate the oil and water, etc. There ate also impor-tant procedures on shore, during loading and unloading,which could reduce oil spills. What is needed is a fullrecognition of the importance of keeping oil out of theseas. i
Oil from Alaska
An important fraction of the oil we will be using in thelate 1970s and the 1980s will be coming from Alaskanwells, shipped via the Trans-Alaskan Pipeline from thes)bstantial reserves located in the North Slope oil fields
ar Prudhoe Bay, Alaska. This pipe, upon completioni the late 1970s, will carry 2 to 3 million barrels of oil per
ay to the Port of Valdez in Southern Alaska, where itill be loaded on tankers for shipment to West Coast
iefineries.There will be two major points of environmental im-
pact from the transport of this oil, the effects on theAlaskan ecosystem of the pipeline and the effects oftanker shipments at Valdez. We will briefly considereach of these.
The pipeline: The pipeline is being constructed of"48" pipe, 789 miles-of it. The fact that this oil is to beshipped in the Arctic causes several unique difficulties.The oil will have to be heated (to about 140" F) in order toinsure its flow. This hot oil causes some of the mostserious difficulties.
The northern part of Alaska is covered by tundra, athin layer of topsoil on a permanently frozen subsoil,called permafrost. The hot oil line, it is feared, will killnearby vegetation and the strip of dead vegetation willno longer be able to hold the soil from shove) over themelted permafrost. A major soil slippage could breakthe pipe.
The tundra ecosystem is a very delicate one. Oilspillage could cause damage which might take decadesto repair. Of equal concern is the damage which will bedone by the construction work itself, such as the miningof sand and gravel for the pipeline and maintenanceroads. This disturbed land will also be slow to heal.
The pipe may present a, problem to the Alaskancaribou. This deer like animal congregates in largeherds on the northern tundra in the summer and mi-grates to the southern forests when cold weather comes.Their migration must cross the pipeline route. It is notknown whether the pipe, plus the barren, muddy stripalong it, will be a barner to caribou migration. The factthat the pipeline will be raised on stilts for much of its
24
length (in order to avoid the danger of slippage men-tioned earlier) puts another barrier of uncertain impor-tance in their path. The pipeline company is, of course,aware of these dangers and IS committed to practicesand construction that will not cause damage to thisimportant species. We will not know the results, however, until the pipeline is completed.
The Alaskan pipeline is not a direct threat to man'shealth. It will not darken our skies or heat the water in ourrivers or the air in our cities. Like the oil shale develop-ment in Colorado or the desert power plants in NewMexico, what it threatens is the nature of the land itself.The land the pipeline traverses is the largest wildernessarea left in this country. It is threatened in many'ays bythe construction activity and by the roads which willopen up the region to casual tourists. A break in the linecould be disastrous. Such a break could, as we haiesaid, be caused by slippage on the permafrost. Thepipeline, for much orits length, is in country with a highincidence of earthquakes and one of these could alsocease a break.
There is a shut-off system in the pipeline to take careof emergencies, of course. Thousands of gallons of oilcould be spilled, however, before the pipe was closedand the broken system emptied. If this oil were spilledonto tundra the damage would at least be ,localized.Spilled into marsh land where ducks and geese migrateto hatch their young, or into the Gulkana River, animportant spawning ground for salmon, the damagecould be widespread.
We cannot yet say with precision what effect thepipeline will have on the Alaskan wilderness. We cansay with certainty, however, that it will be changld.
Problems at the South End
The environmental problems posed by the pipeline do.not end when the oil is delivered to Valdez. Valdez islocated on Prince William Sound, a difficult port for anyship. Not only is it dotted by islands and rocks, but it isnoted for fogs and violent storms. If past exjerience isany guide, it will be impossible to prevent some spillagein the transfer of oil from storage facilities to rankers atthe port and equally impossible to prevent an occasionaltanker accident on the trip south. The great number oftankers needed to keep the oil moving (five "TorreyCanyons" every two days) will add to the risk of collisionat the port itself.
As we have discussed in Chapter 2 of this volume, oilspills in the Arctic are especially troublesome. Theyevaporate and disperse much more slowly there and theArctic marine life takes longer to recover.
The Alaskan pipeline is one of the most controv ersialprojects we have undertaken in this country as well asone of the most expensive ($2.8 billion was the 1973estimate and $7.5 billion the present one). Its environmental impact was the subject of an extensive study bythe Department of the Interior. It was the subject ofdebate, lawsuits, and finally Congressional action. Themajor pressure which drove it through the barriers
,

erected against it was this country's thirst for oil. Satisfy-ing that thirst will bring profit to the consortium of oilcompanies building the pipeline, employment andeconomic gain to the citizens of Alaska, and tax revenue
\to the state. The costs will be more difficult to total butthat total must be made to guide our further excursionsinto the wilderness in search of energy.
Transmission Lines and Other PipelinesSupertankers and the Alaskan pipeline are new ways
to transport energy and are adapted to oil, the item inmost demand on the energy menu. Energy, however,has been routinely shipped around this country for sometime, in other less newsworthy ways. We will catalogsome of these below andsummarize their environmen-tal impacts.
Transmission. fines
Electricity is shipped by wire. It is transformed to veryhigh voltages, 500,000 to 750,000 volts (to be com-pared with the 120 volts of home wiring). At these highvoltages it is carried across the country on the familiarwirestrung towers.
The environmental impact of these lines is largely`visual. They occupy a lot of space and interrupt a lot ofscenery. In 1970 there were about 300,000 miles ofthese lines in the United States and their rights-of-wayoccupied 4 million acres of land, 6,250 square milesa right-of-way-2 miles wide across the country. In 1990,according to projectionsby the Federal Power Commis-sion, there will be 500,000 miles of line occupying7 million acres of land.
As we go to higher and higher voltages a new ques-tion is raised. Will the large electric fields around thesewires cause any health problems for people exposed tothem? There is now enough evidence ,that there areeffects to warrant a call for a thorough study before wecommit ourselves to transmission voltages of 1,000,000or even 1,500,000 volts.'
There is little hope that we willsee less of these linesbefore the end of this century. Underground high volt-age transmission is too expensive, too much energy islost and there is little hope for breakthroughs of technol-ogy "Superconducting cables," metal at near liquidhelium temperatures, are far from realization and willhave to carry enormous power loads (all of New YorkCity, for instance) to be price competitive.
Sometime in the future we may turn to hydrogen as a'preferred intermediate energy (see Chapter 7, VolumeII for a description) and replace the shipment of electric-ity by wire with shipments of hydrogen by pipe. We lookat that technique of energy transport at the end of thischapter.
Pipelines
Oil and gas are transported across the country bypipelines and gas is also distribute'd and delivered by
' "Pollution by Electncal Transmission Lines," LB. Young and H.P.Young, The Bulletin of the Atomic Scientists, 30, 34-38, December1974.
pipe. Some 800,000 miles of gas pipe make up thissystem and much of it is under the metropolitan areas.That much of this pipe network is now old and in poorcondition is evidenced try the gas leaks and the occa-sional explosions that are reported. If we are to continueto depend on natural gas for another decade or two wemust ask for a thorough study of the safety of the pipesystem bringing it to us.
Shipping Nuclear Fuels and WasteWe have concerned ourselves so far in this chapter
with the environmental impact of the shipment ofenergy, oil in tankers, oil and gas through pipelines, andelectricity through wires. When we turn to considertransportation and the environment where nuclearenergy -is concerned, things are, as always, different.Nuclear fuel uranium ore for the present -- is' soconcentrated that massive shipments are not what is ofconcern. Fuel deliveries to a 1,000 Mw nuclear plant, forinstance, might involve 3,000 to 4,000 railroad carsduring a year while shipment of fuel to a coal burningplant would need 25.,000 carloads.
Transportation of nuclear materials has the possibilityof environmental impact in two different ways, in thereturn of radioactive debris to the fuel reprocessingplant, and in the transport of materials which could beused to construct nuclear weapons. Since we are still atthe beginning of the nuclear age and these problemsare still largely before us, it is well to examine them nowand to foresee, if possible, any policies which mightlessen-their impact.
Transporting Nuclear Waste
Nuclear fuel in its present form is not a particularlydangerous material. It is weakly radioactive and chemi-cally more or lessinert. The danger is on the return trip.
As we describe in Technical Appendix 6, only a smallpercentage of the uranium in a fuel rod within the reactoractually undergoes fission. After six months or a year,however, the combination of fission and the changeswhich have occurred in the fuel rod during its intenseneutron bombardment make it necessary to return therod for "fuel reprocessing." This is a recycling operationduring which the fissionable uranium is recovered alongwith plutonium, a useful nuclear fuel formed by neutronbombardment of the non-fissioning uranium.
When these spent fuel assemblies are first removedfrom a reactor they are intensely radioactive and arestored underwater for several months to allow the mostintense components to die out. After this initial cooling-off period the fuel assemblies are then shipped in mas-sive containers to the reprocessing plants. Present con-tainers (which carry one assembly) weigh 30-35 tons;one is about a truckload.
The shipment of these radioactive materials has notbeen a cause for concern to date. There have beeninstances of misrouted shipments and there was appar-ently a radioactive shipment (not material from reactors,however) on a plane hijacked to Cuba, but the recordshows no serious losses or accidents.
/19 25,

Concern remains, however, fed by the magnitude ofthe potential harm that cotttd be caused,by spillage ofthis material and by the rapidly increasing amount ofmaterial which will need shipment as the nuclear reactorbecomes a major part of our energy system. If theradioactive debris within the shipping container werespread by a train or truck wreck it could contaminate alarge area. A spill into a water supply would be articu-larly catastrophic. The containers, however, ire wilt tostand quite a wreck and have already remains \un-broken through a train derailment.
Not only is it necessary to carry fuel assemblies bacIand forth from the plant, but there are large amounts of\low-level wastes to begotten rid of. The AEC2 estimatedthat one 1,000 Mw reactor requires 80 fuel shipmentsand 65 shipments of low-level waste perear. Thus in1974 there were about 2,000 fuel shipments and 1,625shipments of low-level waste in the country. This will riseto 10,400 fuel shipments and 8,450 low-level wasteshipments per year by 1980 52 shipments per day ascompared with 4 shipments per day in 1974.
Hijacking and Nuclear Blackmail
The increased traffic in nuclear material causes theconcern we have just described: that an accident mightspill dangerous radioactivity. There are other worries.
In this day of hijackers and terrorists the radioactivewaste could be deliberately stolen and used as a threator a weapon. As far as present reactors are concerned,this is unlikely for two reasons: the spent fuel elementsare extremely dangerous to handle, and stored as theyare ,in massive containers, they are difficult to move.Unfortunately, as the dependence orr nuclear energygrows, the trucks and trains will be carrying a muchmore valuable target for hijackers and terrorists theraw material for nuclear bombs.
To develop the first' "Atomic Bomb" the United Statesspent several million dollars on the so-called ManhattanProject, which culminated with the successful Trinity testnear Alamogordo, New Mexico, in 1945. The recipe fornuclear weapons remains a carefully guarded secret,but the test itself revealed the most important part of thesecret, that the nuclear explosive works.
Since that time many countries have developed nu-clear fission weapons, but the task of constructing abomb still seems to most of us one which needs anational effort to succeed. We have been spared thedo-it-yourself atomic bomb maker.
If, however, we look at all the skills, materials, andequipment needed to build a bomb, we see, in fact, thatonly the preparation of the bomb raw material is ex-tremely sophisticated. The rest of the steps are withincapability of many technically trained people
A nuclear weapon consists of a certain amount offissionable material, 'a "critical mass." When a critical
2We will in this chapter refer to the AEC, although that agency wasabolished on January 19, 1975. Its research and development ac-tivities will be carried on by the Energy Research and DevelopmentAdministration (ERDA; and its regulatory responsibilities by the Nu-clear Regulatory Commission (NRC).
26
mass of fissionable material is assembled' it will ex-plode. The trick, therefore, is to build a weapon in whichthe fissionable material is stored in pieces smaller thanthis critical mass and then to bring them all together withsome triggering explosion. A simple way is to have twosubcritical masses at opposite ends of a pipe and useexplosives to ram them together.
_The size of the critical'mass depends on the type ofmaterial and its purity. There are three kinds of fissiona-ble materials now in use, uranium 235* (the rare form ofuranium which makes up only 0.7 percent of ordinaryuranium ore), and the two man-made forms, plutonium239 and uranium 233.
Uranium 235 is the fuel for present-day reactors andis therefore contained in fuel assemblies shipped to thereactors and in the spent fuel asetamblies carried from\hhem. In neither form, however, is it usable as bomb
aterial, it is mixed with the much more abundant andc4mically identical uranium 238 whose presencekeeps the explosive "chain reaction" from taking place.On the return trip it is highly radioactive.
In the spent fuel, however, there are appreciablequantities of plutonium 239.produced from the uranium238 by neutrons in the Teactor. At the fuel reprocessingplant this plutonium is separated out and preserved. It isa valuable reactor fuel itself.
Since plutonium is chemically different from theuranium and the contaminants in tile spent fuel, itsseparation is relatively easy and almost pure plutoniumis produced. It is not pure plutonium 239, however. It ismixed with a sister product, plutonium 240 which hasdifferent nuclear properties and acts, in fact, as apoison to the chain reaction.,EVen with the 10 to 20
percent plutonium 240 typical of today's reactor fuel,however, this recovered plutonium can be used to makea bomb. The critical mass (if surrounded by a copper orsteel neutron reflector) would be about 8 kilograms (18pounds).3
At present the relatively small amount ofthis potentialbomb material produced so far is stored at the reproc-essing plants and is elatively secure. This security isthreatened by several coming changes in the nuclearenergy picture. The first of these is the policy ofplutonium recycling, plutonium is to be added touranium 235 in fuel elements and sent back to thereactors. It is thus exposed to theft during transit.
The major worry over nuclear theft, however, comeswith the breeder reactors scheduled to begin operationin the 1980s. There are two types of breeders, theLiquid Metal Fast Breeder Reactor (LMFBR), which willproduce plutonium 239 from uranium 238,, and the HighTemperature Gas 1:leactor (HTGR), which will produceuranium 233 from another nuclear material, thorium232. Uranwm 233 can also be used to make a bomb
The number ide ifies the isotope, the form of the nucleus It is thetotal number of pr ons and neutrons in the nucleus Isotopes arefurther described in Technical Appendix 6
"Nuclear Theft. Ri and Safeguards." Minch and Taylor (Cam
bridge, Massachusetts, allinger Publishing Company) 1974 p12
53

although it typically has a contaminant which gives off apenetrating radiation and this makes it dangerous towork with and less attractive to the bomb maker. Itscritical mass Is somewhere between 11 and 25 kilo-grams (24 to 55 pounds) depending on the reflector used.
Plutonium 239 and uranium 233 appear at differentpoints in the nuclear fuel cycle as different compounds,sometimes combined with oxygen, for instance, buttheir separation is not very difficult. The oxides also canbe used as bomb material.
The important and worrisome point of the study' fromwhich we drew the preceding data is that it does not takea lot of this material, expensive equipment or sophisti-cated technique, to make a crude bomb. It is thereforeim ortant to see what quantities of these raw materialsa mg produced. We summarize in Table 3-2 thepr tion of plutonium 239 or uranium 233 by the
.7. ent . Lip ht Water Reactors (LWR) with and with-out plutonium ecycling and by the breeders. We seethat each re for produces enough raw material forseveral bom , 26 plutonium bombs per year from theLWR, 37 fr m the LMFBR, etc.
These ar6 the production rates of single reactors. Thecumulative oduction is much more disturbing in itsimplications. his same study estimates that by 1980,26,000 kil ams (almost 29 tons) of plutonium 239 willbe xtrac :d each year, enough for more than 3,000bom
Security
The raw material for bombs will be available in quan-tity in the 1980s and will be vulnerable to possiblehijacking during storage and shipment. It could alsoconceivably be stolen in small amounts at the reprocess-ing plant itself. Plutonium's value of $10,000 per kilo-gram makes it attractive and, of course, it will take ongreater value to a group (or a country) attempting nu-clear blackmail. Its great value, of course, also makes itdoubly worthwhile to safeguard.
The danger has been recognized by the AEC andplans to increase security measures are being de-veloped. The danger is so great that the cure may alsobe damaging. The establishmeht of a National SecurityForce" for its protection is one suggestion receiving
TABLE 3-2'Production of Fissionable Material in a 1,000 Mw Reactor
1
LWRReactor Type LWR (Pu Recycle) LMFBR
Pu 239 (kg) 210 50' 300U 233 (kg) 150-230
Source: Nuclear Theft: Risks and Safeguirds Mason Willrich andTheodore B. Taylor (Cambridge, Massachusetts: Ballinger, 1974)P. 12.
`Net production, input minus output.rf
'ibid.
serious attention. It would be ironic, to say the leas ifthe generation of electricity with nuclear energy wouforce us to accept even this variation of a national policeforce we have so long resisted.
The dangers of theft and the lesser worries over nclear waste transport are among the arguments fo u-clear Parks", groupings of reactors, reprocessing andfuel fabrication plants and industries to use the electric-ity. This grouping would reduce transport miles andallow centralized security. However, they would haveother environmental problems to deal with, waste heatdisposal, for instance. They would also require a re-structuring of our utility system.
The threat of the 'theft of bomb materials increaseseach year as production of these fissionable materials isincreased. A bomb constructed from these materialswould not have the sophisticated power of destruction ofthe bombs produced for military use, it might fizzle out atonly a few hundred tons of TNT equivalence rather thankilotons. The damage that such a "fizzle" could do in acity, however, beggars description. We must add thisdanger to the cost of nuclear-generated electricity andsatisfy ourselves that it is not too high a price to pay forenergy from this source.
Future ProblemsWe have just described a growing problem of energy
transport. There are others, not so dramatic, that willalso-have to be faced.
Deep Ocean Ports
Earlier in this chapter we described the supertankerswhich will haul more and more oil to us from theMiddle East. These huge ships are not only big, they liedeep in the water. By 1972, there were 237 supertank-ers of greater than 200,000 DWT in service and ships of400,000 to 500,000 DWT on order. A ship of 250,000 to300,000 DWT draws 65 to 77 feet of water; a 500,000DWT tanker greater than 90 feet. There are no UnitedStates ports that can receive these tankers. Long Beachand Los Angeles can handle 100,000 DWT ships, thelimit 3t New York, Philadelphia, and Baltimore is 55,000DWT.
A proposed solution is to build deep water ports "ev-eral miles offshore where the shigs can unload and thenpipe the oil ashore. The environmental threat here hasbeen described, oil spills in transfer, pipeline breaks,etc. The industrialization of the shore area by refineriesand associated industry must also be considered. It isclear that the overall environmental impact of each ofthese ports must be carefully considered and weighednot only against our need for oil but also against thealternate sources and forms of energy.
Refrigerated Tankers
As our demand for natural gas exceeds our domesticsupply, we are turning to foreign sources. The Texas ElPaso Gas Company has signed a long-term contractwith Algeria to buy liquified natural gas (LNG). There are
27
also small spot shipments of LNG arriving at East Coastports.
To ship gas, it is first liquified at -260°F and thenshipped in refrigerated tankers. These tankers may con-
. tain up to 1 billion cubic feet of gas and their arrival incrowded port cities is a cause for concern. If a tankershould break up, the holocaust would be impressive.There is at present little information as to the safety ofthis form of energy shipment. There was a LNG disasterin Cleveland in 1944 when a tank exploded. The LNGgot into the sewer system causing fires, explosions, andthe death of 133 people.
LNG is dange.rous even unexploded. At the loweredtemperature it is heavier than air and heated from theground it could flow as a dense mass for some distance.A billion cubic feet could form a cloud large enough toasphyxiate the inhabitants of a good-sized city. It wouldseem that the plans to increase the delivery of LNG toport cities, to bring tankers into the narrow confines ofNew York, for instance, would call for a carefully pre-pared "Environmental Impact Statement" but so farsuch a statement has not been prepared. We cannot,however, feel very comfortable until we are told what thedangers are and what security measures are needed.
Shipping Hydrogen
Somewhat further in the future is the prospect ofturning to hydrogen as an intermediate form of energy.We discuss the advantages of hydrogen for storing andtransporting energy in Chapter 6, Volumed!.
At first glance it would seem that a gas like hydrogenwould be an ideal fuel in a country already set up todistribute and utilize a gaseous fuel. Hydrogen, how-ever, is very different from methane, the major compo-nent of natural gas. The hydrogen molecule, Hz, is muchsmaller and lighter than methane, CH4. Because of this itis very difficult to control, it will leak easily through valveswhich would hold methane. It has the additional trouble-soine property of easily diffusing into metals, somesteels, for instance, and in doing so renders them verybrittle and easy to break. Use in our present pipelinedistribution may take modification. of valves and theremoval of easily affected metals. The cast-iron pipesthemselves, however, are thought to be satisfactory.We are thus a long step toward the possibility of a'hydrogen distribution system.
Hydrogen is also potentially dangerous becausewhen mixed with air it can explode. We have, however,a fairly long history of dealing with explosive fuels,methane and gasoline, for example. The care that itsexplosive properties will require will be in large partbalanced by the innocuous nature of the combustionproduct, H2O water. The fact that hydrogen is light willbe an advantage if it leaks or is accidentally-spilled. It willquietly disperse and thus there will not be a danger fromasphyxiation as there is with methane, for instance. Atthis stage the environmental problems of shipping andstoring hydrogen are overshadowed by the economicproblem of producing it cheaply. If the economic prob-lem is solved, the physical one no doubt will be also.
28
Summary
In this chapter we have looked at the environmentalcosts of energy transport. The major concerns focus onthe transport of oil and of nuclear materials.
Oil transportation has environmental impact in sev-eral ways. The most dramatic is through the danger ofmassive oil spills from the large tankers. These super-tankers now carry hundreds of millions of gallons of oilas contrasted with the 29 million gallons spilled from theTorrey Canyon off the coast of England several yearsago. As our importation of oil increases we will need theequivalent of three or four of these tankers per dayunloading at our ports.
Oil tanker spills are the most dramatic, but the dump-ing of oily ballast water in routine operations causes fivetimes the contamination of all oil accidents combined. Ifwe are to preserve our vulnerable shallow coastal wa-ters, we must find ways to cut down the spillage from allforms of oil transportation near our shorelines.
If spills are the most dramatic danger, the transporta-tion of oil across Alaska by pipeline has been the mostpolitically sensitive one. The TransAlaskan pipeline,now under construction, will carry 2 or 3 million barrelsof oil per day from the rich North Slope oil fields to thesouthern port of Valdez. The effect of the heatedpipeline on the delicate tundra with its underlying per-mafrost is a cause of concern as is the danger of break-age from earthquakes. The pipeline also cuts across themigration paths of the caribou find its effect on them willbear watching.
transportation of nuclear materials is increasingrapidly. There were almost 4,000 shipments of fuel andwaste materials within this country in 1974 and thenumber grows with the growth of the nuclear industry.While great precautions have been taken fo keep thematerials safely encased, the results of spillage aresufficiently serious to warrant continual surveillance.
The growing role of plutonium as a nuclear fuel intro-duces a new worry. This material is being shipped andstored in a form from which ,,nuclear bombs could beconstructed. Since even a crude bomb of 40 or 50pounds could do enormous damage and sinceplutonium production by the end of this decade will bemeasured in tons-per-year (28 tons per year in 1980),we must develop a much more sophisticated securitysystem than we have at present if we are to make majorfuel use of this material.
These hazards of the transport of oil and nuclearmaterials are joined by the land use problems of traris-mission lines and the worry over the thousands of milesof gas pipe under our cities.
A working energy policy for the future must weigh theenvironmental costs of energy transportation along withother environmental effects and against the end uses ofthat energy.

1
CHAPTER 4.The Environment andEnergy Consumption
5 :3
N

The Environment and Energy Consumption
In the last two chapters we may have given energy abad name by concentrating on the environmental ef-fects of producing it in its various forms and delivering itto consumers. This chapter will continue that unflatter-ing association of energy with environmental damage.We will now took at what happens at the end of the flowpattern. It is here, 4f course, that we use energy to ourgreat benefit, to warm our homes and offices, providetransportation, and,power the many engines and proc-esses of industry, It is also here, at the consuming end,that we see, smell, and feel some of energy's mostobvious environmental impacts.
We can gain much insight into the nature ofconsumption-related environmental problems by look-ing at the way we convert energy to our use. Most of ourenergy, 95 percent of it in 1973, comes from the fossilfuels. To convert their stored energy to our use we burnthem. In burning we produce smoke and other lessvisible gases, and we produce heat. Air pollution andthermal (heat) pollution are, therefore, the major typesof pollution we will find.
Although its present percentage share of the energymarket (1 percent in 1973) does not warrant much con-sideration, the future prospects of nuclear energy re-quire that we must also look at the new forms of pollutionthat it will introduce. And we must, for completeness,..-loot ahead to some of the other hazards that may ac-company the nuclear. generation of electricity.
We will first look at that form of pollution that is beforeour noses, so to speak.
Air Pollution: Causes and EffectsThe evidence for the existence of air pollution is not
hard to come by, it is all around us. It is a more subtleobservation to realize that this pollution is costing usmoney for much of the damage to places, plants, andpeople is indirect. In a.recent estimate by the Environ-mental Protection Agency, the total bill for. air pollutionfor 1968 was set at $16.2 billion, about $80 for everyperson in the country.
A partial breakdown of these costs included:
$6.1 billion for health effects$4.8 billion for effects on materials (rust, corrosion,
damage to fabrics, cost of protectivecoatings, etc.)
$5.2 billion for damage to residential property (in-cluding reduction in value)
$120 million for damage to commercial crops
There are other costs: damage to art, the aestheticand psychological costs of dirty living and workingareas, the damage to residential flowers and shrubs, forinstance. It is difficult to put a dollar sign on these costs,and it is difficult to correctly price death, disease, anddiscomfort; but these all arecosts that must be weighedinto the _balance.
What is air pollution? What are the damage-causingagents, where do they come from, how do they get into
the air, what happens to them there, and what do theydo to the world beneath them when they come bark toit? We turn next to these questions.
The five pollutants and their chemical shorthandsymbols are. carbon monoxide (CO), the nitrogenoxides (there are several and we mil refer to them a;4 asNOx), the particulates isoot, tar, fly ash and othermiscellaneous material, thei as no appropriate charmcal symbol), the hydrocarbons (HC), and the sulfuroxides (S0x). The relative percentages of these poll::tants in the total mass of pollutants is shown in Figure4-1.
All five of these are combustion products. Carbonmonoxide is fwmed when carbon is burned with insufhdent oxygen. The hydrocarbons are also products ofincomplete burning, but here the fuel is a hydrocarboniamolecule made of carbon and hydrogen like those thatmake up gasoline and other petroleum products. COand the HCs are, thus, products of inefficiency, for thereIs energy left in them which could be released by furthercombustion.
The nitrogen and sulfur oxides are products of morespecific combuttion situations. The NOxs are formedahenever there is a hot fire in air. The type of fire is notimportant, all that is needed is that air reach a temperature of 1,000nF or so. At that temperature tor abov e), theoxygen and the nitrogen molecules of air tOl and Noare torn apart and the atoms combine to form NO, nitriteoxide. Others of this group are formed by adding onadditional oxygen atoms.
The formatic:: of sulfur oxide is even simpler to understand, it is a product of the oxidation (burning) of
FIGURE 4-1Distribution c aissions Species, Percentage by Weights
Sulfur Oxides
15%
Hydrocarbons
Particulates
_13%
tistrosenOxides
10%
CarbonMonoxide
Source: "The Automobile and Air Pollution A P gram for Progress." Part 11, U.S. Department of Comme Le, Der..embel1967.
31

sulfur. It is produced, therefore, whenever a sulfur-containing fuel is burned.
The particulates are the most visible of the pollutantsfor they make up smoke and soot. They are also, in part,products of inefficient burning, as some of Them areunburned, heavy hydrocarbons (tar) andcarbon (soot).The "fly ash," the fine particles of fhineral imPUrities, isalso an important particulant,impurity.
There is a sixth air pollutant which is assuming anunwanted importance, lead releaied in 'the burning ofleaded gasoline. We will look briefly at it in this chapter.
The Pollutors and Pollutants
From the brief description of the five air pollutants wehave strong clues as to their sources.;This evidence isconfirmed by the pie diagrams of Figure 4-2 which showthe percentage contribution of the various sources tothe mass of each of the five: Transportation (and youcan read this "the automobile'') is the major source ofCO (74 percent), HC (53 percent), and NOx (47 per-cent). Stationery fuel combustion (the fossil fuel burningelectric generating plants) is the major producer ofSOx (73 percent) and a close second.in the productionof NOx (42 percent). Only in the produCtion of particu-lates does a non-energy source,industry, take the lead.
A summary of the overall responsibility for all these airpollution products was provided by Figure 1-4. Thedominance of energy conversions is clear. Transporta-tion accounts for 42 percent of the total mass and theelectric utilities 21 percent.
The type of pollution produced by the automobile andthe power plants, the effects of these pollutants, and themeans for their control differ. We will look at the distinc-tive smog produced by these two sources separately.
Fossil Fuels to Electricity
As we see from Figure 4-2, the fuel-burning powerplants are a source of sulfur oxide, particulates, andnitrogen oxide. Major concern at the present is focusedon SOx. Most power plants now employ 'electrostaticprecipitators which remove the bulk of particulate mat-ter from their exhaust. The NOxs are not presently con-sidered a power plant problem, although the con-tinuing growth of these plants may soon cause usto wory about this pollutant also.
oke, SOx, and high humidity (fog) are the ingre-dients of the "classical" smog which has been associated with the worst air pollution disasters. Donora,Pennsylvania in 1948, London in 1952, and New York in1966. The most troublesome agent in the smog is sulfuric acid (H2SO4) which is formed by a reaction of S03(sulfur trioxide) with water.
The fine aerosol (droplets in air) of sulfuric acid isresponsible for much of the damage. It corrodes anddissolves metal, stone, labrics, etc., and is particularlyharmful to precision equipment. Sulfuric acid does not
'The smoke particles are attracted to electrically charged platesmuch in the same way that hair.or bits of paper are attracted to acharged comb. The accumulated particulates can then be washedaway.
r- ""'`
32
long remain in the atmosphere, in two days to a week itis usually brought down by rain. In the past few yearsmeasurements have shown that rain and, therefore,lakes and rivers have been becoming noticeably moreacidic. This has been particularly troublesome in theNetherlands and Scandinavia and serious effects onfish life in some Norwegian streams and lakes havebeen reported..
Effects on humans: The effects of the sulfuroussmog on humans are not completely cataloged. It pro-duces irritation- n the upper respiratory tract and in thelungs when car ed there by parkles of the proper size.One of its subtl effects is to increase the "airway resis-tance," that is, make it harder to breathe.
These effects on hurhans illustrate a property of airpollution called "synergy." The synergistic effects of anagent, of sulfuric acid for instance, are those that resultfrom a combination of agents and factors operatingtogether. As an example, sulfuric acid by itself is re-mQved from air by the filtering action of the nasal pas-sages. If it exists in combination with soot particles (as itdoes in smog), then it will form an absorbed layer onthese small particles; and if some of them are smallenough to get down to the lungs, then the sulfuric acidcan do more serious damage. The increase in airwayresistance can also produce synergistic effects. Ahealthy person is only a little bothered by this, but itmay be fatal to someone with emphysema or a weakheart.
Because of this general, indirect relationship to deathor disease, it is hard.to make quantitative relationshipsbetween air pollution and health. One can rarely say,"This person died from air pollution." The evidence is
. usually of a statistical nature. Figure 4-3 is the classicalexample which shows that an increase in deaths (inLondon in 1952) followed closely after (and had ener-ally the same shape as) the pollutant increase. There issimilar evidence, for instance, that lung cancer is muchhigher (three times as high) in urban smokers thanin non-urban smokers. There seems to be a synergistic
'relationship between smoking and air pollution inthe, producti n of lung cancer. ,
From su statistical studies we can lay blame for theworsenin of a long list of respiratory and heart diseaseson the sulfurous smog.
Clean and dirty fuels: The fuels can be ranked, asfar as sulfur is concerned, from clean to dirty. Naturalgas is the clean fuel, it has little sulfur in it, and that whichIs there is easily removed in normal cleaning operationsOil can have sulfur contamination of from as high as 2percent down to 0.5 percent. (It is believed that Alaskanoil will be low in sulfur.) Coal is the dirty fuel, ranging upto 7 percent sulfur. Coal burning plants produce 90percent of the sox and the particulates produced in thegeneration of electricity. ./..
Air quality standards in many urban areas require thatfuels have less than 1 percent sulfur to be used. It hasbeen sometimes difficult in the last few years to find fueloil to meet that standard. Low-sulfur coal is in even

FIGURE ,4-2Sources of the Pollutants
/Stationary fuel Corn.
s
Industry
Solid Waste 041disixnalStationary Fuel Corn.
Transportatio
Misc.
Solid WasteDisposal
Transportation
Transportation
Solid Waste Disposal Industry
Source: "The Automobile and Air Pollution. A Program for Progress," Part II, U.S. Department of Commerce, December 1967
33

shorter supply, particularly near the Eastern cities. Thegenerally low sulfur content is part of the attraction of theWestern coals.
Technology to the rescue; The cheapest and moststraightforward way to reduce the SOx in our air is toburn clean fuels, but the clean fuels are in shortestsupply. The present approach is to remove the sulfur.Nature, however, shows her perversity here, not onlywill the "electrostatic precipitators,'" which are so effecbye on soot particles, not remove SOx, but, in fact, theywork less well on low-sulfur coal. The electncal properties of the ash are difielent.
There is a crash program underway to take the SOxout of the power plant effluent. Several appi...aches areunder development. Ground limestone can be injected
FIGURE 4-3Deaths and Air Pollution in London, 1952
into the furnace, for instance, and calcium nitrates areformed as fine particles which can then be removed bythe electrostatic precipitators and the "wet scrubbers"(devices that wash the impunties off the collector walls).There are some of these SOx control devices on a fewexisting plants but they have not yet received overallacceptance in the utility industry.
Until such devices are available, the power plants relyon tall smokestacks to disperse the pollutants to the
. winds. The average height of stacks built in 1969 was600 feet, and stacks as high as 1,000 feet are hangbuilt. (The Washington Monument is 550 feet tall.)
If and when sulfur-removing device., come into prac-tical use, we will see another exarrpie of the reach of theenergy web throughout one system. In the world about70 million tons of sulfur are released each year by theburning of fossifuels. Total World-productiondf-sulfur-bmining is 30 million tons. Thus, we may see a completechange in the market structure of sulfur and the cessa-tion of sulfur mining as such.
As we look at growth projections in electricity demand(such as are discussed in Chapter 4, Volume II), we seehow urgent the solution of the SOx problem is. Theamount of electric energy used may be allowed to quad-ruple between 1970 and 1990 but we cannot let the SOxconcentrations rise accordingly. Controlling this pollu-tant will cost both money and energy. The precipitatorsand SOx removal devices may consume 3 to 4 percentof the electric energy produced by the plant. They addseveral tens of millions of dollars to the cost of the plant.The price of these controls or of the damage we havedescribed must be paid for when we buy the conveni-ence of electricity.
The Automobile and Air PollutionSulfurous smog is the classical smog which, we read,
offended the eyes and noses of 19th-century Englishroyalty. In this country we have, along with our inventionof the automobile, invented a new kind of smog. It is thisso-called "photochemical smog" that Los Angeles hasmade famous. It is, unfortunately, now in evidenceeverywhere that automobiles are clustered.
In photochemical smog the indirect and synergisticeffects that we have just described are even more obvi-ous. The troublesome smog components, ozone andthe PANS (for peroxyacetyl nitrates), for instance, arenot "primary"pollutants emitted by the auto but are"secondary" pollutants formed from the primary onesby action of sunlight (hence photochemical)
The necessary ingredients for this solar stew are thehydrocarbons and the nitrogen oxides from auto ex-haust. By a series of complicated reactions, which de-pend on the energy provided by sunlight, ozone (03), amolecule made up of three oxygen atoms, along with agroup of complicated organic molecules, and the PANsare produced. These latter are the most irntating compo-nents. Ozone is responsible for the sharp, urtleasantodor of smog and with the PANs contributes to eyeirritation. It is one of the NOxs, nitrogen dioxide (NO2),which gives smog itc typical brownish color. Because of
1,000
750
64
500
250
0
0
I
I t I 1 1 1 1 t 1 1 1 1
4 6 8 10
Date
12
2.0EE
O
1 0 tn
14 0
Deaths, sulfur dioxide concentrations, and particulate mass concentrations during the December 1952 episode in London. (After E.T.Wilkins, Journal of the Royal Sanitation Institute, 74, 1, 1954)
34

1
,,r
the dependence on sunlight,,e photochemical smogusually shows up in the afteoon, after sunlight hasworked ri the lingering exhaust of the morning andprevious evening's rush hour.
The hazards of photochemical smog: The irritatingeffects of photochern;cal smog are easily demon-strated. It is harder to demonstrate more serious dam-age to health. Because photochemical smog rarely oc-curs in intense single periods that can be studied, anddoes not lead to an easily marked increase in deaths,statistical evidence connecting this smog to deaths isdifficult to obtain. It is expected that the more thoroughstudies under way will tell us more about its effects.
It is the photochemical smog that causes most of thedarbage to vegetation. Levels of PAN as small as 0.01or 0.05 parts per million can produce damage within anhour, and ozone is almost as bad. Leafy vegetables arethe most sensitive, but even trees can be damaged, It isno wonder that they are replacing real trees with plasticones along the Los Angeles freeways (and ozone willeventually destroy them).
Carbon monoxide: Another troublesome pollutantfrom the automobile that co-exists with photochemicalsmog is carbon monoxide. This odorless, but deadlygas is produced by the incomplete burning of the carbonatoms in hydrocarbon molecules. It is, as we have seen,the major pollutant on the basis of weight. six times asmuch is produced in auto exhaust as NOR. It is lethal atlevels of 600 parts per million (ppm) and can causeheadaches and other problems at 100 ppm. It acts byreducing the mobility of oxygen in the blood, replacingthe oxygen molecule in hemoglobin and causing nearbyhemoglobin molecules to hold on to their oxygen. It isfound wherever automobiles congregate, levels of 50and even 100 ppm have been found in heavy traffic,automobile tunnels, etc.
Lead: Lead is another poisonous contaminant theautomobile favors us with (although there are someindustrial sources of lead, and it is released by incinerat-ing certain waste materials). In gasoline, a lead atom ishooked on to a hydrocarbon molecule to slow down therate of burning and thus prevent premature filing ui"knocking." It was the addition of lead that gave au-tomobile engines the sharp efficiency increase in the1940s that is shown in Figure 3-10, Volume II. It is nowan additive to the environment. Studies on the icesheets in Greenland show its year-by-year increase. It isalso found in a city's air in proportion to the gasoline itscars consume. There seems no question of its source.
Its effects, like those of the other pollutants, are dif-ficult to predict. We know it accumulates in bone and inlarge enough quantity can cause "lead poisoning." Wenow have, unfortunately, a large exposed populationand will soon be able to determine its effects with someprecision.
Lead may be the first pollutant to go. It has run into thepowerful opposition of the automobile industry becauseit damages the "catalytic converters" with which theyhope to control the other pollutants.
I.: Q01)
1
Emission controls: The sources of the various pol-lutants within the automobile's anatomy are shown inFigure 4-4. Some of these can be handled easily. Evap-oration from the carburetor has been reduced by betterseals, and the 'blowby" gases are being fed backthrough the engine. The exhaust, however, remains aproblem.
It looked easy at first. Since CO and the HCs bothresult from incomplete burning, their production can bereduced if a leaner mixture (increased air to fuel ratio)is used. This, incidentally, is a More efficient mixture(more miles per gallon). The cars in the 1960s wereadjusted to leaner mixtures and their CO and HC emis-sions were reduced. Unfortunately, the leaner mixturesburned at a higher temperature thus increasing the pro-duction of the NOR. The NOR levels in California didincrease in the 1960s while the CO and HC levelsdropped. In 1971 the restrictions were extended to in-
,clude NOR.
The Clean Air Act of 1970 specified that the 1975 caremit no more than 10 percent of the CO and the HC of1970 models, and that 1976 models emit no more than10 percent of the Nox of 1971 models. Auto companiesresisted this edict and implementation was postponeduntil at least 1977.
Emission reduction in the near future will be accomplished by add-on devices rather than by engine rede-sign. The current choice is the catalytic converter, whichconverts CO to carbon dioxide (CO2) and hydrocarbonsto water. They will not at the same time remove NOR, butthe engine can be adjusted to a "richer" mixture toreduce these emissions.
The richer mix and the converters themselves lowergasoline mileage by 7 percent or so, a major argumentin the campaign against the restrictions, In fact themileage penalty is about the same as that imposed byair conditioning and considerably less than that causedby the increasing weight of cars.
FIGURE 4.4Approximate Distribution ofAutomobile Pollutants by Source
. NY I I 1.
FUEL TANK and N.... ". \CARBURETOR EVAPORATION 1
20% of thehydrocarbons
---ZI:250
EXHAUST100%100% of the carbon monoxtd00% of the oxides of nitrogen100% of the lead compounds
55% of the hydrocarbons\ _ ---e------ ---"----
CRANKCASEBLOWBY
25% of thehydrocarbons
Source: "The Automobile and Air Pollution: A Program for Pro-gress," Part II, U.S. Department of Commerce, December,1967.
35

The major problem of the converters is their vulnera-bility to damage by high velocity lead particles in thegasoline. It is this vulnerability that has caused the de-mand for unleaded gasoline.
The possibility of reducing exhaust emission by en-gine redesign has been adequately demonstrated, al-though American companies have shown little interestso far. The Honda "stratified charge" engine, for exam-ple, accomplished pollutant reduction by providing twocombustion regions in the engine: a high temperature"rich" region (lowered NOx) which then ignites a "lean"mixture (lowered COand HC).
It may be that the combination of fuel shortage and airpollution surplus will eventually bring about, at long last,some radical changes in the American automobile in-dustry.
Air Pollution Meteorology
Before we leave the subject of air pollution, we mustbalance our emphasis.on pollution with a word about air.Since man lit his first fire, he has been polluting the air.Why has it suddenly (so it appears) reLised to act as our"disposal"? Most of the answer can be found in thesection on growth in Chapter 4, Volume II. The otherpart of the story we'll tell here.
This "atmospheric disposal- works through twomechanisms, dilution and dispersal. Gaseous pollu-tants are first mixed in the huge reservoir of air and thendispersed by the winds. Winds, in fact, play a secondrole as vertical air currents provide for the mixing thataccompanies dilution. What has recently become clearis that there are times when the disposal doesn t work.
The great atmospheric engine its circulating tradewinds, cyclones, hot and cold fronts, as well as localcurrents and breezes are all powered by the sun. Ail thismovement can be traced back to the fact that the groundabsorbs more solar heat than the atmosphere, that airnear, the ground is heated, and that hot air rises.
If a parcel of air near the ground is heated, it expands,becomes less dense than its surroundings and floatsupward like a balloon on the cooler, denser air around it.As it rises, however, and keeps expanding, it cools. (Anygas, air included, cools when it expands.) Whether ornot it continues to rise depends on whether it becomesas cool as the air around it.
Normally atmospheric temperature decreases withdistance from the earth. There are conditions, however,which cause a "temperature inversion, the tempera-ture increases with altitude. Under these conditions therising, cooling air soon finds itself surrounded by air atthe same temperature or warmer. It can rise no more.When there is a temperature inversion, there are novertical currents to carry pollutant gases away and theyhang over us. We have all seen days when smokeflattens out as if against a barrier in the sky.
There are several causes of temperature inversions.Sea-cooled air blowing in over land is part of the LosAngeles problem. A high pressure region caused bysubsiding air (air moving toward lower altitudes) isanother. The increase in pressure warms the air at lower
36
altitudes. Temperature inversions are a fact of nature.They were not always considered threats, summerDog Days," warm, lazy, picnic-times, are generally
inversions. It is our overload of the atmospheric disposalthat makes us fe them.
A Surplus of RestAs we stress in Chapter 3, Volume II, all the
energy that flows through the many conversion devicesof our society eventually ends up as heat. In many cases
in our homes in winter, in a hoSt of industrial pro-cesses heat is the desired product. There aretimes, however, when heat is a waste product and there-fore a pollutant. This so-called "thermal pollution" is oneof the growing environmental problems of energy con-sumption. -
There are many industrial processes where heat isused and then must be removed. Water, because it ischeap and plentiful and because it makes good thermalcontact and is able to carry a lot of heat energy perpound (more than air, for instance), is the preferredcooling medium. With the rapid growth of energy use,we are in danger of running short of cooling water.
While many processes demand cooling water, 85percent of the total is used at electric power plants. Aswe describe (Chapter 3, Volume II), steam tur-bines, which turn the generators in all but the 15 percentof plants which use water power, are heat engines. Toget as high an efficiency as possible the steam leavingthem must be cooled. (The technical reasons for this areexamined further in Technical Appendix 4 of Volume II.)
The easiest and cheapest (and therefore the tradi-tional) way to cool the condensers of the big steamplants is to pump cold water from a nearby strear orlake through the condenser and discharge the warmedwater back into the source. This is called, appropriatelyenough, once-through cooling. It is the reason most ofour generating plants are built near a river, lake, bay, orocean. To meet our demand for electricity, we've built t,omany plants that we are in danger of running out of coolwater, or at least of raising average temperature inmany rivers and lakes, etc. enough to interfere withother uses.
The amount of cooling water we need can be fairlyeasily computed. The average fossil fuel burning powerplant and the present .1,4 nuclear plants are only about33 percent efficient. This means that two-thirds of theenergy released by burning a fuel, or by the nuclearreaction, has to be disposed of. A fossil fuel plant sendsabout 15 percent of its wasted energy up its smokestack, whereas all the waste heat from a nuclear reactorhas to go into the river. To give an idea of quantityneeded. a 1,000 Mw coal burning plant needs 12,000gallons of water per second, a 1,000 Mw nuclear plantneeds 15,500 gallons per second when running at fullcapacity. To give a different perspective, 45 gallons ofwater must flow through a fossil fuel burning plant foreach kilowatt-hour of electrical energy it generates,while a nuclear plant of the same efficiency needs 56gallons per kilowatt-hour.
59

The new models of generating plants, nuclear andfossil fuel fired, will be more efficient. (The best plantstoday are 40 percent efficient.) With improvements'taken into account, and using generating capacitygrowth projections, we compute that by the year 1990we will need about 350 billion gallons of cooling waterper day, a large fraction of the average daily availablesupply of 1,200 billion gallons. A projection by the Fed-eral Power Commission of the cooling water demand,which takes into account the 30 percent or so that will besatisfied by salt water, is shown in Figured -5. Evenwithsome of the load borne by salt water and by coolingtowers (which we will discuss later in the chapter), theprojected daily fresh water needs amount to one-sixththe average daily fresh water run-off.
This does not mean, fortunately, that one-sixth of ourstreams and rivers will run throdgh steam plants. Muchwater will be used over and over. Nonetheless, this is anenormous amount of water and the drain on a river canbe heavy during the dry season. The 1,200 billion gal-lons per day was an average, but two-thirds of the totalflows during flood season The Hudson, for instance,
has a flood run-off of 310,000 gallons per second but alow of 15,000 gallons per second during dry periods.This is only enough cooling water for one 1,000 Mwnuclear reactor. It is in the Northeast and the Midwest,where heavy power demands coincide with tintedwater, that the pinch will be felt.
The Effects of Hot Water
Water used in once-through cooling re-enters the river15 or 20"F hotter than it left. It cools as it moves down-sti ,..drn, but waterfrom a big plant may need 25 miles-tocool to the temperature of its surroundings.
Water is a splendid cooling agent. itthis were Its onlypurpose, we would have no problem. But water is alsoused as a drink, a cleansing agent, a recreationalmedium, a sewer, a transportation medium, and, byaquatic life, as a home. Inci easing its temperature af-fects all these uses in different ways.
The major resulting changes are a decrease in itsoxygen holding ability and an increase in the rate atwhich chemical reactions take place. It is, therefore,cheaper tIt purify warm water, but, because of lessened
FIGURE 4-5Water Requirements for Utility Owned Electric Plants
Billions of gallons per day
Note: nation's annual average runoff 1,200 billion gallons per day.
61; 37

c4), vgen, it cannot as easily assimilate the waste dumpedinto it.
Temperature is also an important determinant of theaquatic ecosystem. The oxygen demand and the rate ofmetabolic processes increase with temperature whilethe oxygen content of the water decreases. Temperature regulates many of the life processes growthrates, reproduction, respiration and migration, forexample.
The reaction to change is varied. what's good for abass is uncomfortable for a trout, for instance, and atcertain critical periods in a fish's life, the livable range oftemperature is only 5 or 10 degrees. The most certainstatement, therefore, that one can make is that even asmall change in temperature will cause a shift in theaquatic ecosystem. With this sensitivity in mind, therecommendations generally are to keep the changessmall.
Cooling towers: Although the once-through coolingis the least expensive cooling technique, the technologyexists to cool power plants with much less impact onrivers and lakes by the use of cooling towers.
There are two types of cooling towers, wet and dry. Inthe wet towers, which are now coming into limited use inwatershort region (the Four Corners area, for in .stance); the warm water is.allowed to run down over alattice work. Air flows past it, either blown by fans orrising naturally ("forced draft" or "natural draft" towers),and the water is cooled by evaporation. These towersstill use water, it evaporates, and it has to be replaced;but the total water used is only one-tenth or a twentieth ofthat used in the once-through cooling.
Wet cooling towers have environmental effects, theychange the humidity and can cause clouds and fog.There is also the possibility of damage from the "fallout"of chemicals put into the water to reduce slime growth
Dry cooling towers are even less environmentallyimpacting. They are like a huge automobile radiatorThe water is not in contact with the air but runs through asystem of cooling fins. They are, of course, much themore expensive system.
The cost of cooling: The cost of these alternatecooling techniques has slowed their growth. It is not thatthey add much to the consumer cost of electricity.(Table 4-1 compares several systems. Additional cost is .
greatest in the case of the dry towers, but even thesetowers add only about .05 cents to the present 1.5 to 2.0cents per kilowatt-hour charge.) The real drawback isthe additional investment capital they call for, whichranges (and these are 1969 figures) from $5 million to$9 million for a wet tower to $20 million or t25 million fora dry tower. The problem of investment capital is particu-larly acute in the money-short mid-seventies.
Thermal enrichment: The ideal solution to the wasteheatproblem is to stop wasting it. It is a paradox that in asociety where half of our energy is used for heating, wewaste an additional 20 percent in the form of heat.
There are many schemes for using this heat. In sev-eral cities small power plants sell hot water to heat
38
nearby buildings. This is not, however, a realistic optionfor the sprawling, dirty coal plants or the controversialnuclear plants. Experimental attempts are being madeto use the hot water to stimulate growth in marine ':foodfarming,' and to heat greenhouses, there are dreams ofkeeping pavements snow-free and harbors ice-free.
This is an area that needs new ideas, daring planning,and financial support. Each Calorie of "wasted heat"that can be put to use reduces our total energy needs bythat Calorie and relieves the environment of the need toget rid of it.
Nuclear Energy: A Mixed Balance SheetTo discuss the environmental effects, particularly the
hazards to humans, of nuclear reactors is to enter a fieldof raging controversy. It is our intention to stay as farabove that controversy as we can. It will not be possible,of course, to stay out of it. We will seem to be pro-nuclear to the nuclearphobes" and anti-nuclear to the"nuclearphiles."
In the following sections we will describe the kinds ofhazardscOntque to nuclear reactors. They fall into threecategories. radioactive pollution, radioactive wastestorage, and nuclear accident danger. We will look atspecific aspects of these problems and at new, poten-tially more serious ones that will arise if we begin to relyheavily on breeder reactors. In each discussion, we willindicate the range of uncertainty and the differing view-points.
A brief description of the operation of nuclear reactors(both the present Light Water Reactors, LWR, and theLiquid Metal Fast Breeder Reactor, LMFBR) is given inTechnical Appendix 6. What follows, is a simplified de-scription of these complex devices. We invite the in-terested reader to turn to that Appendix for more detail.
A nuclear reactor is a device which converts thestored nuclear energy of certain heavy nuclei first tokinetic energy and then to heat energy. The heavy nu-cleus (uranium 235 in the LWR) fissions, splits into twopieces. These two new nuclei (fission products) are
TABLE 4-1Comparison of Other Cooling-Systems with Once-through Cooling (add-on costs in mills* per kw-hr)
Cooling System Mills` per kw-hr
Oncethrough Sea WaterCooling Pond ok
Wet Mechanical Draft TowerWet Natural Draft TowerDry Towers
0.030.030.160.14
0.5"
Source. environmental Effects of Producing Electric Power,-Part 1. hearings before the Joint Committee on Atomic Energy,91st Congress, October and November 1969, Table 1, pg. 1,052.
1,1)11 i; or...Itenth of a cent. -
est mate added to original data.
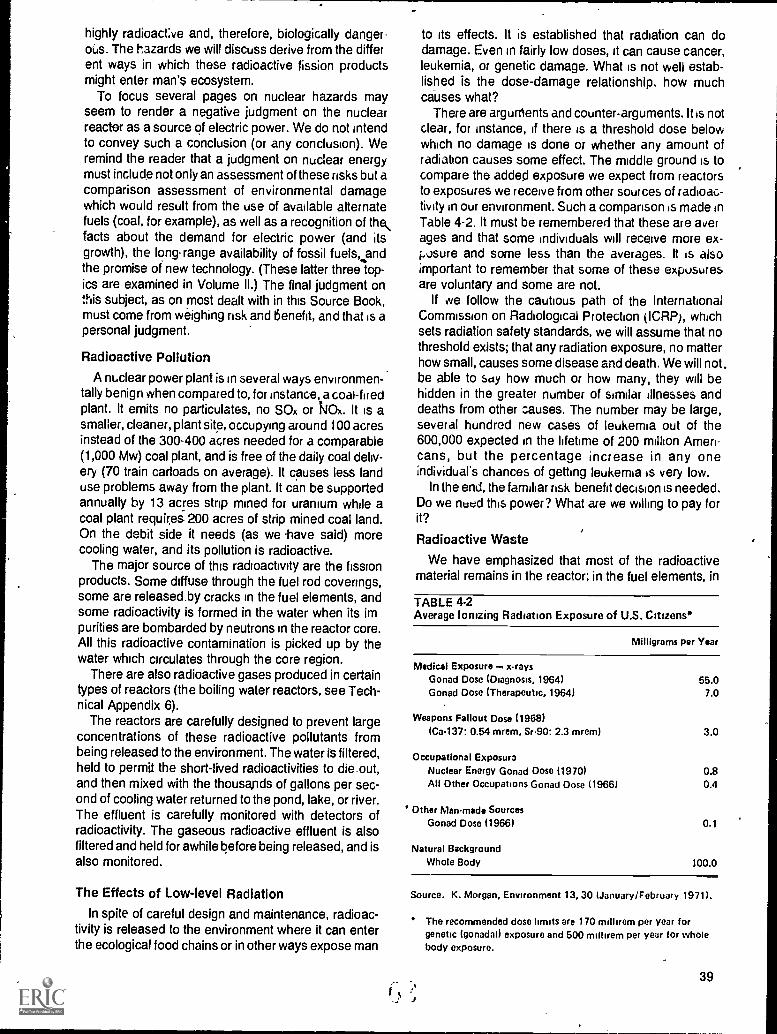
highly radioactive and, therefore, biologically danger-ous_ The hazards we will discuss derive from the different ways in which these radioactive fission productsmight enter man's ecosystem.
To focus several pages on nuclear hazards mayseem to render a negative judgment on the nuclearreactor as a source of electric power. We do not intendto convey such a conclusion (or any conclusion). Weremind the reader that a judgment on nuclear energymust include not only an assessment of these risks but acomparison assessment of environmental damagewhich would result from the use of available alternatefuels (coal, for example), as well as a recognition of the\facts about the demand for electric power (and itsgrowth), the long-range availability of fossil fue1s,..andthe promise of new technology. (These latter three top-ics are examined in Volume II.) The final judgment onthis subject, as on most dealt with in this Source Book,must come from weighing risk and t5enefit, and that is apersonal judgment.
Radioactive Pollution
A nuclear power plant is in several ways environmen-tally benign when compared to, for instance, a coal-firedplant. It emits no particulates, no SOx or 1\10x. It is asmaller, cleaner, plant site, occupying around 100 acresinstead of the 300-400 acres needed for a comparable(1,000 Mw) coal plant, and is free of the daily coal deliv-ery (70 train carloads on average). It causes less landuse problems away from the plant. It can be supportedannually by 13 acres strip mined for uranium while acoal plant requires 200 acres of strip mined coal land.On the debit side it needs (as we have said) morecooling water, and its pollution is radioactive.
The major source of this radioactivity are the fissionproducts. Some diffuse through the fuel rod coverings,some are released.by cracks in the fuel elements, andsome radioactivity is formed in the water when its impurities are bombarded by neutrons in the reactor core.All this radioactive contamination is picked up by thewater which circulates through the core region.
There are also radioactive gases produced in certaintypes of reactors (the boiling water reactors, see Tech-nical Appendix 6).
The reactors are carefully designed to prevent largeconcentrations of these radioactive pollutants frombeing released to the environment. The water is filtered,held to permit the short-lived radioactivities to die-out,and then mixed with the thousands of gallons per sec-ond of cooling water returned to the pond, lake, or river.The effluent is carefully monitored with detectors ofradioactivity. The gaseous radioactive effluent is alsofiltered and held for awhile before being released, and isalso monitored.
The Effects of Low-level Radiation
In spite of careful design and maintenance, radioac-tivity is released to the environment where it can enterthe ecological food chains or in other ways expose man
to its effects. It is established that radiation can dodamage. Even in fairly low doses, it can cause cancer,leukemia, or genetic damage. What is not well estab-lished is the dose-damage relationship. how muchcauses what?
There are arguments and counter-arguments. It is notclear, for instance, if there is a threshold dose belowwhich no damage is done or whether any amount ofradiation causes some effect. The middle ground is tocompare the added exposure we expect from reactorsto exposures we receive from other sources of radioac-tivity in our environment. Such a comparison is made inTable 4-2. It must be remembered that these are averages and that some individuals will receive more ex-i.Jsure and some less than the averages. It is alsoimportant to remember that some of these exposuresare voluntary and some are not.
If we follow the cautious path of the InternationalCommission on Radiological Protection (ICRP), whichsets radiation safety standards, we will assume that nothreshold exists; that any radiation exposure, no matterhow small, causes some disease and death. We will not,be able to say how much or how many, they will behidden in the greater number of similar illnesses anddeaths from other causes. The number may be large,several hundred new cases of leukemia out of the600,000 expected in the lifetime of 200 million Ameri-cans, but the percentage increase in any oneindividual's chances of getting leukemia is very low.
In the end, the familiar risk benefit decision is needed.Do we need this power? What are we willing to pay forit?
Radioactive Waste
We have emphasized that most of the radioactivematerial remains in the reactor; in the fuel elements, in
TABLE 4.2Average Ionizing Radiation Exposure of U.S. Citizens*
Milligrams per Year
Medical Exposure x-raysGonad Dose (Diagnosis, 1964)Gonad Dose (Therapeutic, 1964)
Weapons Fallout Dose (1968)(C,a137: 0.54 mrem, Sr-90: 2.3 mrem)
Occupational ExposuroNuclear Energy Gonad Dose (1970)All Dther Occupations Gonad Dose (1966)
' Other Manmade SourcesGonad Dose (1966)
55.07.0
3.0
0.80.4
0.1
Natural BackgroundWhole Body 100.0
Source. K. Morgan, Environment 13, 30 (JanuarylFebruary 197th
The recommended dose limits are 170 millirem per year forgenetic (gonadal) exposure and 500 milhrem per year for wholebody exposure.
39
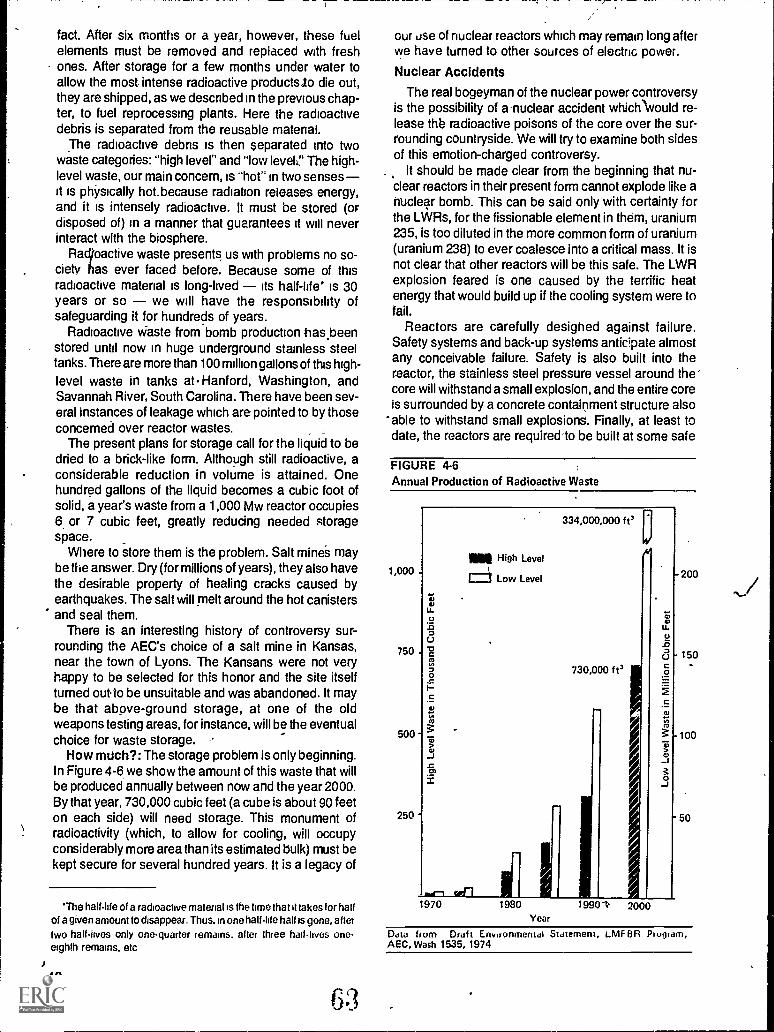
J
fact. After six months or a year, however, these fuelelements must be removed and replaced with freshones. After storage for a few months under water toallow the most intense radioactive productslo die out,they are shipped, as we described in the previous chap-ter, to fuel reprocessing plants. Here the radioactivedebris is separated from the reusable material.
The radioactive debris is then separated into twowaste categories: "high level" and "low level:7 The high-level waste, our main concern, is "hot" in two sensesit is physically hot.because radiation releases energy,and it is intensely radioactive. It must be stored (ordisposed of) in a manner that guarantees it will neverinteract with the biosphere.
Racctoactive waste presents us with problems no so-ciety has ever faced before. Because some of thisradioactive material is long-lived its half-life* is 30years or so we will have the responsibility ofsafeguarding it for hundred_ s of years.
Radioactive waste from bomb production has,beenstored until now in huge underground stainless steeltanks. There are more than 100 million gallons of this high-
level waste in tanks at. Hanford, Washington, andSavannah River, South Carolina. There have been sev-eral instances of leakage which are pointed to by thoseconcerned over reactor wastes.
The present plans for storage call for the liquid to bedried to a brick-like form. Although still radioactive, aconsiderable reduction in volume is attained. Onehundred gallons of the liquid becomes a cubic foot ofsolid, a year's waste from a 1,000 Mw reactor occupies6, or 7 cubic feet, greatly reducing needed storagespace.
Where to store them is the problem. Salt mines maybe the answer. Dry (for millions of years), they also havethe desirable property of healing cracks caused byearthquakes. The salt will melt around the hot canistersand seal them.
There is an interesting history of controversy sur-rounding the AEC's choice of a salt mine in Kansas,near the town of Lyons. The Kansans were not veryhappy to be selected for this honor and the site itselfturned oath be unsuitable and was abandoned. It maybe that above-ground storage, at one of the oldweapons testing areas, for instance, will be the eventualchoice for waste storage. -
How much?: The storage problem is only beginning.In Figure 4-6 we show the amount of this waste that willbe produced annually between now and the year 2000.By that year, 730,000 cubic feet (a cube is about 90 feeton each side) will need storage. This monument ofradioactivity (which, to allow for cooling, will occupyconsiderably more area than its estimated bulk) must bekept secure for several hundred years. It is a legacy of
The half-life of a radioactive material is the time that it takes for halfof a given amount to disappear. Thus. in one halflife half is gone, after
two half-lives only one-quarter remains. after three hail-lives one-eighth remains. etc
40
our use of nuclear reactors which may remain long afterwe have turned to other sources of electric power.
Nuclear Accidents
The real bogeyman of the nuclear power controversyis the possibility of a nuclear accident which\vould re-lease thb radioactive poisons of the core over the sur-rounding countryside. We will try to examine both sidesof this emotion-charged controversy.
It should be made clear from the beginning that nu-clear reactors in their present form cannot explode like ahUcleqr bomb. This can be said only with certainty forthe LWRs, for the fissionable element in them, uranium235, is too diluted in the more common form of uranium(uranium 238) to ever coalesce into a critical mass. It isnot clear that other reactors will be this safe. The LWRexplosion feared is one caused by the terrific heatenergy that would build up if the cooling system were tofail.
Reactors are carefully desighed against failure.Safety systems and back-up systems antic'pate almostany conceivable failure. Safety is also built into thereactor, the stainless steel pressure vessel, around thecore will withstand a small explosion, and the entire coreis surrounded by a concrete containment structure also
'able to withstand small explosions. Finally, at least todate, the reactors are required'to be built at some safe
FIGURE 4-6Annual Production of Radioactive Waste
1,000 .
750
500 -
250
(III High Level
1:-= Low Level
LLU.07
0IC
J
arn970 1980
Year
334,000,000 ft'
730,000 ft'
11901. 12000
-200
U.
.0- 150
c0
4-tel
0J
- 50
Data from Draft Environmental Statement, LMF BR Program,AEC, Wash 1535, 1974

distance from any large population center. This lastrequirement, under the pressure of energy needs, maybe the first to be abandoned.
The record of the nuclear power industry is very goodthere have been no deaths from accidents in com-
mercial reactors. But there have been only about 200reactor years of operation to date. Given the conse-quences of even one accident, we are understandablyinterested in estimating the probability and effectsof a serious-accident.
The accident most feared is a loss of coolant, whichwould result from a double break in the large pipes thatcarry the cooling water to and from the reactor core. It isunlikely, but an earthquake, or sabotage, or careless-ness could cause it. (This accident is essentially whatoccurred at the Fermi plant outside of Detroit in the early1960s ) If this were to happen, the water would beblown nut of the reactor by the steam pressure. Whilethe loss of moderator (and the automatic "scramming-)would shut off the reactor, the core, bebause of the highlevels of radioactivity in it, would quickly heat up. Withina few minutes, it Would begin to melt, unless the back-upemergency core cooling operated at once and success-fully If the core remained hot, a pressure explosionmight occur which would rupture the containment ves-sels, or it could melt through them and perhaps melt itsway down into the ground exhibiting what is called the"China Syndrome."
We do not know what will happen. The core cooling isbacked up by an emergency core cooling system, andthere is great controversy as to whether it will work aswell as the theoretical calculations say it will. It has(fortunately) never been tested in actual practice, and itmay never be.
In an effort to give a quantitative basis to the esti-mates of the probability for a serious accident and itsconsequences, the AEC funded a $3 million safetystudy at MIT; the results have just been released.' Theapproach of this study was to try to establish a probabil-ity for each of the many different failures or malfunctionsthat could lead to a specific reactor accident, and then
TABLE 4-3Accident Probabilities Per Reactor Year
chance in 150,000 that the accident will involve 10 or moredeaths
chance in 2,000,000 that the accident will involve 100 or moredeathschance in 100,000,000 that the accident will involve 1,200 ormore deathschance in 1,000,000,000 that the accident will involve 2,300 ormore deaths
Source: "Reactor Safety StudiesAn Assessment of Accident Risksin U.S. Commercial Nuclear Power Plants," USAEC, WASH 1400,August 1974.
'"Reactor Safety Study An Assessment of Accident Risks inU.S. Commercial Nuclear Power Plants," WASH-1400, August 1974.
by combining these probabilities come up with an esti-mate of the probability of an accident. They have used asimilar approach to estimate possible damages of anaccident. What is the probability of a certain directionand spied of wind? How many people are likely to beliving in the affected area? How many of them can beevacuated in time? These are the kinds of questionsevaluated.
This "WASH-1400' report is over 3,300 pages inlength, and we will not attempt a summary here. Tables4-3 and 4-4 give some of its conclusions and an idea ofaccident probabilities and their consequences. Table4-3 presents the "largest accident conceivable and theaverage accident. The average accident is 100,000times more probable, 1 chance in 50,000 per reactoryear. If there are 1,000 reactors operating by the year2000, this translates to 1 chance in 50 for each year ofoperation that at least one person will receive a seriousradiation exposure and $500 million in damage will re-sult. f '
In :WASH-1400- the risk to an individual from a nu-clear accident is compared to other nsks, being killed inan airplane accident, for instance, or to being struck by ameteor. (The nuclear risk is closer to the latter.) Thedollar damages of nuclear accidents are compared toother man-caused or natural disasters, and it is reportedthat a nuclear accident causing $1 billion is 100 timesless probable than an equivalent man-caused disasterand 1,000 times less probable than an equivalentnatural disaster.
"WASH-1400- is already drawing criticism from nu-clear skeptics. They point to the great uncertainties ofmany of the individual probabilities and assert that thefinal probabilities will have a similar range of uncer-tainty. In particular, the question of accuracy of thejudgment that the emergency core cooling system willwork remains the central question. WASH-1400 givesa rather large probability, 1 in 3,000 per reactor year(which becomes almost 1 for 100 reactors operatingfor 25 years), for a break to occur in the regular coolingsystem. If the emergency system doesn t work, then thisis likely to become the "Largest Accident" of Table 4-4.
\ ...-
TABLE 4-4Reactor Accident Consequences
ConsequenceLargest Average
Accident Accident
DeathAcute IllnessProperty DamageProbability
(per reactor year)
92 0.05200 0.1
1.7 0.5-..
1 in 5 billion 1 in 50,000
Source: "Reactor Safety StudiesAn Assessment of Accident Risksin U.S. Commercial Nuclear Power Plants," USAEC, WASH 1400,August 1974.
In billions of 1973 dollars.
41

1
The..--
"WASH-1400" reply is that the judgment0of the
nuclear engineers is that the emergency system willwork 99 out of 100 times. The critic says, "How do youknow, since you have no data?" and "What happens ifit fails on the Indian Point reactor with a wind blow-ing toward New York 25 miles away?"
This is about as far as we can go in discussing thesafety issue. Those who believe that reactors are assafe as they need be can continue to do so, the uncon-vinced remain unconvinced. What is lacking is experi-ence data. The "WASH-1400" study was based onabout 100 reactor years of operation, and that experi-ence is not wide enough to provide probability estimatesfor all the many accident probabilities. It is the beststudy, perhaps, that could be done with limited data; butit remains, in the end, a projection based on a limitedsample. Reactor building continues, there were 52 inoperation in September 1974 and 187 under construc-tion or on order. It seems that we shall be accumulatingbetter data year by year.
Plutonium: Before we leave this "what if" land ofnuclear energy, we must return again to the controver-sial new fuel, plutonium. Because plutonium is a fueland valuable ($10,000 per kilogram) and because it isdangerous, every effort will be made to keep it confinedThere remains, however, the possibility that some willescape from damaged fuel elements or during fuel re-processing. We have already discussed two of thedarker sides of this fuel: it will appear at some times andplaces in the fuel cycle in a form from which nuclearbombs can be constructed, its long half-life (24,000years) will keep the waste piles hot a long time. There isa third dark facet.
Plutonium is weakly radioactive, it emits a short-range particle (an "alpha particle") which cannot passthrough human skin. It does little harm outside the bodyIf, however, particles of plutonium should get inside thelungs, the story would be different, for there irradiation ofthe sensitive tissue might produce lung cancer
The lungs, of course, have defenses which filter outlarge particles; but plutonium, in its common form asplutonium dioxide, forms particles of a size that cancarry into the lungs. There is a danger, therefore, thatlocally intense radiation may occur from an overallplutonium dose that ig, \very small. This danger 'fromplutonium "hot particles,, as they are calied, is also asubject of much controversy. There are those who be-lieve that breeder reactors should be ruled out on thisbash alone, others point to the existing exposure to
-plutonium from past bomb testing as evidence that itcan't be all that bad.
As in all these cases of controversy over nucleareffects, what is lacking is experimental evidence.Plutonium is an artificially created nucleus. It has onlybeen around for 25 years, and reasonable medicalstatistics on it only go back to about 1964. Since cancerstake 15 to 30 years to develop, we must wait for ouranswers a few more years. A resolution of this problemmay be the most important determinant of the future ofnuclear energy.
42
Long-range and Large-scale Effects
We have so far dealt with localized effects: air pollu-_tion over cities, local heating in a river, and the intenseradioactivity of stored reactor waste. We ust now giveconsideration to some seemingly small bffects whichhav,e global significance and may, in the I ng run, havemore important consequences than all others. The mostimportant of these is the increase in carbon dioxide(CO2) in the atmosphere. This molecule is formedwhenever carbon is burned. As we burn the fossil fuels,therefore, we release it to the atmosphere. Such meas-urements as we have, show that the amount of CO2 inthe atmosphere has increased over the past century byabout 10 percent.
In the atmosphere CO2 plays a sensitive role. It actsas a "window" to radiation allowing the incoming sun-light to pass through, but absorbing heat radiated outfrom the earth and reradiating some of it back to theearth. This is called the "Greenhouse Effect" becausethe glass in a greenhouse acts in a similar fashion. Theeffect of an increase in CO2 will be to warm the atmos-phere.
Fortunately all the CO2 from fossil fuel burning doesnot stay in the atmosphere; one-half to two-thirds of it isabsorbed by plant life or in the top layer of the ocean.With that reduction taken into account, it is estimatedthat the CO2 added to the atmosphere will be twice the1970 levels by 1990, and that by the year 2000 theincrease over the 19th-century levels will be 25-30 per-cent. Burning all our fossil fuel resources might increasethe amount by as much as fourfold.
Since the CO2 levels have measurably increased, wecan look for changes in atmospheric temperature in thiscentury. What we find is an increase of about 0.6°C fromthe end of the 19th-century until about 1940 and sincethen a 0.2°C cooling. These are small changes, outclimate Is so sensitive to temperature that the 0.2°Ccooling has/ been accompanied by increased sea ice inthe North Atlantic, the growth of glaciers, and changesin the rainfall patterns.
Nature has made the point that small changes areoften associated with large effects, but we are left towonder why the temperature dropped instead of in-creasing. There is speculation that a different pollutant,dust, is causing this by reflecting some solar radiationback out into space. The jury is still out and it may be thatthe two effects are cancelling. What is clear, however, isthat the buildup of both types of pollutants will bearcareful watching.
Direct heating: With this worry over small changesone might begin to worry about the one inescapablepollutant of energy conversion heat. It is the endproduct of all the energy we use. On a global basis weare fairly safe, our total energy release is only about oneone-thousandth of the average incoming heat from thesun. In local areas we make a more impressive showing. In the 4,000 square miles of the Los Angeles basin.
6r, jfar instance, man's heat generation is about 5 percent of

the incoming solar energy. By 2000 it may be almost 20percent.
What we threaten by heat release is the radiationbalance of the earth the difference between the in-coming and outgoing energy. This is again a very sensi-tive balance, a change by a few tenths of a percentwould, it is claimed, melt all the polar ice. The effects areminiscule at present, only a thousandth of a percent, butwe cannot afford many more energy doublings.
Cities as heat islands: We have already changedthe climate locally. Our cities now are "heat islands,"*10° to 20° warmer than the countryside, causing changesin rain and snowfall, in wind speeds, fog coverage, etc.All the changes, however, are not energy-related. Acity's tall buildings act as a heat trap for incoming radia-tion, the asphalt and concrete stores it, and there is littlewee to dissipate it by evaporation. Most of this extraheat, therefore, comes from the sun and only one-fourthor so from the consumption of energy (although thepercentage may be higher in the winter).
We are beginning to make a difference in global pat-terns. Since we are fooling with massive mechanisms,this difference will require careful study, and a con-tinued increase in energy consumption will need a longpreview.
Fusion and the Environment
We will close this long list of energy-environmentrelationships by looking beyond this century to theenergy source we hope will be important in the nextone. What is the expected environmental impact of fu-sion?
This other "Big If" of the future (along with the solargeneration of electricity) is discussed in Chapter 7, Vol-ume II. While fusion reactors will not be as environmen-tally benign as solar energy devices, they have (as faras we can judge at present) less potential hazard thanthe fission reactors. The process itself produces onlyone radioactive residue directly, the radioactive form ofhydrogen called tritium. Tritium can be of some dangeras it will combine with oxygen to form water, and water,of course, is biologically important. Tritium, however, is afuel for fusion rather than a waste product and so theincentive to control and retain it is very high. It will beeconomically, as well as environmentally, unwise to iet itpollute.
Other radioactive products will be formed by neutronbombardment of the material of the fusion plant, but theamount of this will be one-tenth or a hundredth of thatproduced per kilowatt-hour by fission plants.
Fusion also will reduce worries about "nuclear acci-dents." The threat of an explosion is much less, there isno chance of a "critical mass" effect, and little radioac-tive debris to be spread around. Of equal importance isthe fact that bomb materials are not made in the fusion
'Heat Islands the city atmosphere is warmer than the surround-ing atmosphere
process, we will not have to worry about hijacking, nu-clear blackmail, etc.
At this long range, therefore, fusion looks to be asource of relatively clean energy. We will. have to watchthe total heat release but can perhaps relax our vigil-ance elsewhere. This view is at long range, however,and the true environmental impact will emerge step bystep as we move into future.
Summary
This chapter finishes the triumvirate on environmen-tal effects of energy. We looked at these effects at thesource, during delivery, and at the point of use.
The major environmental effects of energy consump-tion fall into three broad categories. air pollution, heatpollution, and nuclear energy hazards, From a differentpoint of view, we could have used two other headingsthe environmental effects of electricity generation and ofautomobile use. The generation of electricity claims ashare of all three pollution categories, while the au-tomobile owns much of the air pollution category.
In the discussion of air pollution we assigned thepresence of 75 percent of the carbon monoxide, 53,percent of the hydrocarbons, and 47 percent of thenitrogen oxides to the automobile, and 73 percent of thesulfur oxides plus 42 percent of the nitrogen oxides tothe fossil fuel burning power plants. Of the fossil fuels,coal is the chief offender.
Electric power generation is responsible for most ofthe cooling water demand, 85 percent of the total. It mayuse as much as one-sixth our total average fresh waterrun-off by 1990. The switch to the nuclear reactor will nothelp here, as it demands more water than the fossil fuelplants.
The nuclear power plants are new on the scene, butthey have not come quietly. There has been much pro-test and concern. Environmentally, criticism has hadthree foci. radioactive pollution, radioactive waste, andthe danger of nuclear accident. Recently a concern overthe threat of plutonium In the lungs has been added. Asis often the case, these controversies continue strongbecause scientific data are lacking. Nuclear energy istoo brtafly with us. In most of the specific instances,however, concern is over statistically Improbable butindividually large effects. The pro and anti-nuclear posi-tions usually involve more than the effects themselves.They are based on a complete and often hidden per-sonal risk judgment. This is as it should be. It is tofacilitate these, and related judgments, that the facts ofthis Source Book have been assembled.
43

CHAPTER 5Energy and theEconomic System
67

Energy and the Economic System
The production, delivery and consumption df energyall have impact on the natural environment, and eitherdirecily-or indirectly, on man's physical and psychologi-cal well-being. We have examined the most important,Impacts in the geviots three chapters and have pointedto ways in which harmful ones could be lessened. Whatwe Saw emerging were heretofore hidden costs ofenergy. It is becoming clear, however, that such costscannot continue to be hidden, that dollar signs must beput on them so that they can give appropriate signals inthe marketplace.
In tnis chapter we will not be so subtle. We will dealwith energy as a commodity whose buying and selling isalready part of the marketplace. We will follow thethreads of the energy web into that complex region ofsociety where'men buy and sell, produce and consume.
Energy has many different contact points in theeconomic system and there are many relationships toinvestigate. We will look, for instance, at the relationshipbetween energy and economic growth, energy and em-ployment, and energy andaffluence. We will take a lookat the role of energy in food production, since the foodcrisis is also one of major concern.
We will also look specifically at some other dollarsigns, at the need for dollars to increase the rate ofenergy extracts In and to increase our capacity of elec-tric power genet. tion. We will finally estimate the size ofthe dollar investn ents needed to repair and protect theenvironment.
We begin with a national perspective and examinethe role of energy in stimulating the ever-growing pro-duction of goods and services by which the wealth ofAmerica is measured.
Energy and Economic GrowthIn Chapter 4, Volume II, we look at some of the
upward-swinging curves that are a mark of the Expo-nential Century" it) which we live. We show growth intotal national energy consumption and in individual (percapita) consumption. That overall growth is reflected insimilar growth curves for the production and consump-tion of many forms of energy (especially the popularforms: oil, natural gas, and electricity).
Over the same time-scale, America's population hasbeen growing as has her affluerce if the latter ismeasured by personal income and gross nationalproduct.* Since the sufficiency of our energy suppliesis now in question (at least their sufficiency at a pricewe can afford), we need to try and discover just howenergy-dependent our economic growth is.
Energy and the GNP
The traditional measure of a country's economicwell-being is the GNP. A large per capita GNP indicates
The gross national product. GNP. is the dollar value of the goodsand services produced by a country.
national wealth, and the potential, at least, for thecivilized lifestyle we associate" with national wealth.Among the goods included in the GNP is energy thevalue of the fossil fuels, and the uranium and electricitythat are consumed. Energy also contributes directly tothe GNP those dollars used to extract, ship, and refinefuels and to generate electricity The direct energy con-tribution to the GNP, even taking into account all thedollars generated by the activities we have just men-tioned, is not large, no more than 10 percent of the total
Energy has a much larger indirect effect on the GNP,of course. In some industries, the plastics or aluminumindustry, for example, it is essentially a raw material,and in all industries it is energy plus labor that producesgoods.
It would-be surprising, therefore, not to find somerelationship between the total consumption of energyand the GNP.
In Figure 5-1 we have plotted the United States GNP(in 1958 dollars) against the total United States con-sumption of energy for the past 40 or so years Iris hardto avoid the judgment that there is a fairly strong comer.,tion between the two. As energy consumption In-creases, the GNP goei up (or vice versa; it Is difficult tosay which is leading end which is following) We gosome independent evidence on this last question fromthe results of the oil embargo (see.Chapter 1, Volume i)When energy consumption was forced to decrease, theGNP also declined.
It should be said quitalirrply Opus point that althougnthe evidence drawn from FigtTre 5-1 and frorTi the oilembargo experience suggests' a relationship betweenenergy and the GNP, it does not prove that one ems'sand certainly does not prove a one-to o) e correspondence. In particular, we cannot draw the corclusionfrom these data that a policy of conserving energy
FIGURE 5.1U.S. Total Energy Consumption Versus GNP, 193Q 1973
15r.
0C
.910
E
0U
9) 5
w
0
19 55
1960.'1945
1930 '194019 35
100 200 300 400 500 600 700 3G0 900
GNP in Billions of 1958 Dollars
47
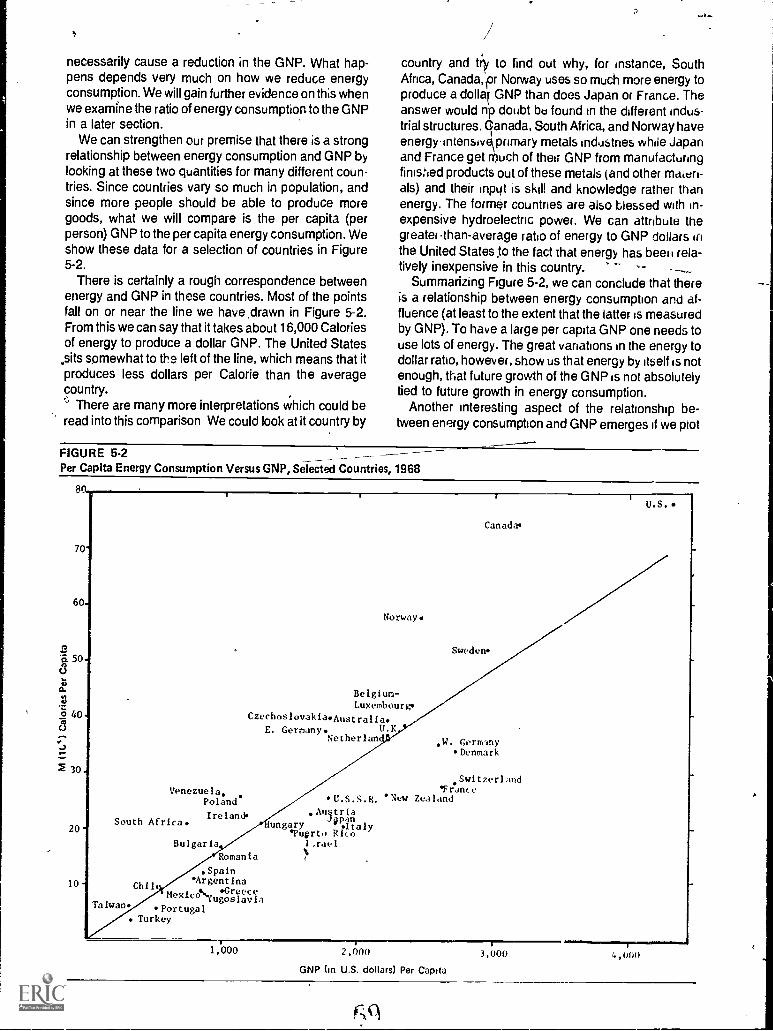
necessarily cause a reduction in the GNP. What hap-pens depends very much on how we reduce energyconsumption. We will gain further evidence on this whenwe examine the ratio of energy consumption to the GNPin a later section.
We can strengthen our premise that there is a strongrelationship between energy consumption and GNP bylooking at these two quantities for many different coun-tries. Since countries vary so much in population, andsince more people should be able to produce moregoods, what we will compare is the per capita (perperson) GNP to the per capita energy consumption. Weshow these data for a selection of countries in Figure5-2.
There is certainly a rough correspondence betweenenergy and GNP in these countries. Most of the pointsfall on or near the line we have ,drawn in Figure 5-2.From this we can say that it takes about 16,000 Caloriesof energy to produce a dollar GNP. The United States
sits somewhat to the left of the line, which means that itproduces less dollars per Calorie than the averagecountry.
There are many more interpretations which could beread into this comparison We could look at it country by
country and tile to find out why, for instance, SouthAfrica, Canada, pr Norway uses so much more energy toproduce a dollar GNP than does Japan or France. Theanswer would n doubt be found in the different indus-trial structures. ganada, South Africa, and Norway haveenergy-intensive\ primary metals industries while Japanand France get much of their GNP from manufacturingfinished products out of these metals (and other maeri-als) and their input is skill and knowledge rather thanenergy. The former countries are also blessed with in-expensive hydroelectric power. We can attribute thegreater-than-average ratio of energy to GNP dollars inthe United States to the fact that energy has beei i rela-tively inexpensive in this country. --
Summarizing Figure 5-2, we can conclude that thereis a relationship between energy consumption and af-fluence (at least to the extent that the latter is measuredby GNP). To have a large per capita GNP one needs touse lots of energy. The great variations in the energy todollar ratio, however, show us that energy by itself is notenough, that future growth of the GNP is not absolutelytied to future growth in energy consumption.
Another interesting aspect of the relationship be-tween energy consumption and GNP emerges if we plot
FIGURE 5-2 --- ---Per Capita Energy Consumption Versus GNP, Selected Countries, 1968
8
60
-6.508
O
O 40
30
20
10
Venezuela.Poland.
IrelandSouth Africa.
Taiwan*
Chi
Norway.
Belgium-Luxembourg
CzechoslovakiaAustralia.
E. Germany. U.KNetherlan
Bulgaria
Romania
.SpainArgentina
'GreeceMexi"-YugoslaviaPortugal
. Turkey
U.S.S.R. New.Austria
Joanungary Io taly
*Pucrto RicI ,rael
Canada'
Sweden
W. Germ3ny*Denmark
Switzerland'Frame
Zealand
I U.S.
1,000 2,000
GNP (In U.S. dollars) Per Capita
3,000
48

the ratio of total energy consumed to the GNP. Thisnumber tells us roughly how many Calories are neededto produce one dollar in the GNP. The historical recordof this ratio in the United States since 1947 is shown inFigure 5-3. What vi -ee in this figure does not show upin the earlier one. tells us that although there is arelationship between. the consumption of energy andthe GNP, the ratio fluctuates. Even more important,shows that over the 20 years from 1947 to 1966 theratio, although fluctuating, dropped steadily. We interpret this as meaning that o er the period it took lessenergy each year to produce a dollar of GNP. Alterna-tively, we could say that the efficiency of energy utilization (as measured by the production of GNP dollars)was increased. This period of increasing dollar produc-tion efficiency corresponds to a period in which energyconversion efficiency was also increasing (some exam-ples of this are shown in Chapter 3, Volume II).
In the four years 1967-1970, the ratio stopped de-creasing and the amount of energy needed to.produce aGNP dollar increased each year. This caused consider-able consternation as.it suggested that the efficiency ofenergy in producing money had stopped improving.Since the ratio went back to its downard trend in 1972and 1973 we are uncertain about the long range trend.The upswing of the ratio in the late 1960s does warn us,however, that it is dangerous to assume this ratio willcontinue to drop.
The speculation about the continuance of this rela-tionship is important only because of the view of thefuture it might owe us. Cne of the energy policy optionswe will conside is the emphasis on energy conserva-tion. (We discuss this in detail in Chapter 6, Volume I). Ifa reduction in energy consumption means a reduction inGNP, this option will not be very enthusiastically ac-cepted. Since most of the drive toward conservation willbe aimed at using energy more efficiently, however, wecan hope, at least, that this form of energy conservationwill cause an Increase in the efficiency of producingGNP dollars (to correspond with the 1947-1966 period)and that the GNP wilt continue to grow faster thanenergy consumption.
Energy and PeopleMoi.o important than the relationship between energy
and the nation's financial status is the one betweenenergy and individual finances. We will investigate bothends of this relationship between energy and people:energy and employment and energy consumption as afunction of personal income.Energy and Employment
Evidence of the strong tie between energy and em-ployment is not difficult to find. The oil embargo showed adirect connection. The sudden reduction in oil consump-tion forced on us resulted in the temporary loss of some500,000 jobs. Most of these were in industries that deal
FIGURE 5.3Energy to GNP Ratio, U.S., 1947-1973
1947 1952 1957Year
1962 1967 1972
49

with energy directly service stations and airlines, forinstance with the others in the automotive andautomotive-related industries.
There are also many examples of longer rangechanges in which energy played an essential role.When the gas pipelines were finished in the post-waryears and natural gas became available in the East, itdisplaced coal from many markets. The consequentloss of 300,000 jobs in the coal industry since 1947created problems for Appalachia which have neverbeen really'solved.
Changes in the total energy consumed and in the mixof energy forms in use have their greatest impact on twoindustry groups. those that produce energy as a productand those that use large amounts of energy essentiallyas a raw material. We will look at employment levels andtrends in these groups in order to obtain someguidelines to possible effects of changes in energy consumption.
Eniployment in the energy industries: The energyindustries are those which extract, refine, distribute, andsell energy. The major industrial groups are: coal mining; oil and natural gas extraction, coal and petroleum-refining; pipeline'companies, utilities (both gas and electric); the wholesalers of gas, oil and coal, and the retail-ersgasoline service stations and heating oil dealers.
In Table 5-1 we provide a breakdown of the role of theenergy industries within the economy. The energy industries as a group account for only 3 percent of totalemployment and contribute 12 percent of the "valueadded."' They are, for the most part, "capital intensive"industries, that is, they rely on capital (for machinery,plants, etc.) rather than labor for their productivity.
Employment in all the energy industries has increased only 5.5 percent from 1950 to 1971. (Total
'The value added is the difference between the value of the productdelivered and the cost of the raw materials. labor, and energy toproduce it.
United States employment increased 41 percent duringthat period.) Most of the increase came in the utilitiesand fuel marketing industries. Employment, in fact, de-creased in mining, refining, and the pipeline industry.A summary of employment changes is given in Table5-2.
Employment decrease was brought about by the re-placement of men by machines and thus, to a considerable degree, of men by energy. It is only .n the servicecategories (service station attendants, repair-men, etc.) that employment has grown.
The continued growth in energy demand, and specifi-cally the growth in the utility industry, will create newdemand for manpower. Much of this manpower willhave to be technical and skilled. The building of re-fineries, the opening of new mines, and the building ofutility plants will also make demands on the constructionindustry. Tables 5-3 and 5-4 are projections of man-power needs in critical occupations from the FEA Proj-ect Independence report. We see the urgent need fornuclear engineers, health technicians, and millwrights,for instance, and the necessity to double the number ofengineering and science technicians each year from1978 to 1980. We need to begin the flow of these futureemployees through our schools immediately if we are tomeet the manpower demand of the late 1970s.
Employment in energy-intensive industries. Theother group of industri es directly, affected by changes inthe availability and price of energy is that in whichlarge amounts of energy is used in production. (Welist the six most energy-intensive industrial groupsin Table 3-11, Volume II, and indicate the amount andform of energy each uses.) The most energy-intensiveindustrial groups are the primary metals, chemical,food, and paper industnes, and the manufacturers ofstone, bricks, cement, etc. (Petroleum refining is con-tained in this group in Table 3-11, Volume II, but, for thisdiscussion, we include it with the energy industries.)
TABLE 5.1The Role of Energy Industries in the Economy (by percent), 1971
EconomicMeasure
All EnergyIndustries
Coal & OilProduction
Coal & OilRefining Pipelines Utilities Wholesale Retail
Employment 3.0 0,54 0.26 0 02 0.89 0.29 0 97
ProductionValue Added 12.0 5.12 180 NA 5.07 NA NA
Plant andEquipmentInvestment 27.0 2.2 7.2 0.1 17.3 0 4 03
ConstructionInvestment 15.2 NA NA 0 33 14.50 NA NA
' The "value added' is the difference between the value of the product delivered and the cost of the labor anq enei LA, top. oduce themNA means not available.
Data from. "A Time to Choose, final report of Energy Policy Project, Ford Foundation, Cambridge, Massachusetts Ballingel, 1974.
50

The record of employment from 1950 Id 1971 for thisgroup is included in Table 5 2. The energy intensiveindustries, as a whole, employ only 7 percent of thenation s workers and consume some two-thirds ofindustry s share of energy. Overall employment in theseindustries has increased only 2.5 percent. Their consumption of energy, however, increased 106 percentover the same period.
These are also capital-intensive rather than labor-intensive' industries. Machinery and electricity ha,..been increasingly substituted for manpower.
Energy and employment; a summary The energyindustries and those for which energy serves as a rawmaterial account for,only 10 percent of the total workforce. Although ceitain industries (utilities, gas and oilretailers, chemicpi and paper) have shown significantincreases in employment since 1950 (but none as highas the average increase of 41 percent) the group as awhole has remained largely static. Thus the few-percentchange inthe total amount of energy consumed underthe various energy policy options open to us will not beexpected to cause large changes in employment.
TABLE 5.2Total Employees in U.S. Energy Industries and U.S. Energy Intensive Manufacturing Industries, 1950-1971
Industry Classification 1950 1971
1950.1971(Percent Change)
Percent of 1971Total Employment
Total Employment in U.S. Energy Industries 2,075,000 2,190,000 +5.5 2.96
Anthracite, Bituminous Coal & Lignite Mining .441,000 138,000 -69.0 .19
Oil.& Natural Gas Extraction 266,000 261,000 -2.0 .35
Petroleum & Coal Products 218,000 191,000 -12.0 .26
Pipline Transportation 24,000 18,000 -25.0 .02
Electric Companies & Systems 239,000 296,000 g-4-0 .40
Gas Companies & Systems 118,000 168,000 +42.0 .23
Combination Companies & Systems 169,000 J90300 +12.0 .26
Petroleum Bulk Stations, Terminals & Other Wholesale 1 Q00- ---- 212,000 +61.0 .29
Gasoline Service Stations --469,000 618;000 +53.0. .84
Fuel & Ice Dealers NA 99,000 NA .13
Total Employment in Energy Intensive Manufacturing 4,709,000 4,828,000 +2.5 7.31
Primary Metals 1,247,000 1,178,000 -5.5 1.6
Stone, Clay, and Glass 547,000 588,000 +7.5 .8
Food & Kindred Products 1,790,000 1,582,000 -11.6 2.1
Paper & Allied Products 485,000 635,000 +30.9 .9
Chemicals & Allied Products 640,000 845,000 +32.0 1.1
Total Employment in U.S. Energy Industries& Energy Intensive Industries 6,784,000 7,603,000 +12.1 10.27
Source. A Time to Choose, final report of Energy Policy Project, Ford Foundation, Cambridge, Massachusetts Bellinger, 1974.
TABLE 5.3Critical Occupations, Energy Operation and Maintenance, and Projected Growthof Energy Sector Employment Compared to Total Economy, 1970.1985
Energy SectorDirect ProductionEmployment 1970
Energy SectorRequirement
in 1985
Percent Growthin Energy
Sector 1970-85
Average AnnualGrowth in Energy
Sector 1970.85
Average AnnualGrowth in Total
Economy 1970.80
Nuclear Engineers 1,038 5,295 409.7 27.3 NA
Metallurgical Engineers 418 1,051 151.4 10.1 2.9
Mechanical Engineers 6,976 13,149 88.5 5.9 22Health Technicians 313 1,345 329.6 22.0 NA
Physicists 808 1,896 134.6 9.0 2.6
Electricians 18,061 25,768 43.6 2.9 2.3
Plumber/Pipefitters 7,477 12,581 68.3 4.6 3.0
Mine Operators NEC* 113,316 129,642 14.4 1.0 --1.9
Millwrights 426 1,221 187.0 12.5 1.2
Power Station Operators 20,495 35,671 74.0 4.9 -0.6
Source: "Project Independence Report," Federal Energy Administration, 1974, Table V-32.
NEC means not elsewhere classified
51

That employment may not be overly sensitive to totalenergy consumption was borne out by studies undertaken by the Energy Policy Project of the Ford Founda-tion. The project report compares the employment re-sults of three different policy options.* As shown inFigure 5-4, total energy consumed in 2000 will differ byalmost a factor of 2 between the extreme options whiletotal employment is expected to remain about the same.
It is, in fact, possible to conceive of an increase inemplciyment in a future with reduced energy consump-tion A swing away from the capital-intensive energyindustries to labor-intensive service industries wouldincrease" employment. As just one example of a low-energy future with higher employment, we can point tothe energy savings that would accrue from buildingfewer automobiles, but building them to last. We wouldfind, in all likelihood, that more man-hours per car wouldbe required to build to more stringent standards, but that
whatever employment loss occurred would be compen-sated for by an increased need for repair and service-men. Tne example also shows, however, that changesin the energy-employment picture must have long leadtimes in order to provide the training and retraining thejob changes will require.
Energy and Personal Income
It does not appear from the previous discussion that adrastic decline in employment is a necessary conse-quence of a reduction in energy consumption nor, in fact,that an increase will increase employment. Energy andmany of the goods for which it is an important rawmaterial make a bigger impact on capital gains andlosses than on employment. We are, therefore, led to
*These options will be disc.ussed further in Chapter 6, volume I.
FIGURE 5-4
Employment and Energy Consumption Under Different Options
1975
1985
2000
Employment9 100
Energy Consumption200 300 Billion Man-Hours
Historical Growth
Technical Fix
111111 Zero Energy Growth
19,75
1985
2000
Quadrillion Calories25 50
i
1111111111 11111111
11111111111111111111
Source. "A Time to Choose,'" final report of Energy Policy Pi viect, Ford Foundation, Ballinger, Cambridge, Massachusetts, 1974, pg. 91.
TABLE 5.4
Critical Occupations, Energy Related Construction
Projected Energy-RelatedConstruction Equipment
1975'Energy Construction
Requirement 1978.19802
Average Annual Growthin Energy Construction
1975.1980
Average Annual ProjectedGrowth in Total Construction
Employment 1973-1980
Pipef itters/Plu mbers 15,398 31,998 21.6 1.9Welders 5,782 10,480 16.3 3.7Electricians 8,639 17,393 20.3 1.3Boilermakers 1,764 3,810 23.2 2-2.9Millwrights 3,870 8,316 23.0 4.7Carpenters 2,760 5,454 19.5 0.9Electrical Engineers 1,038 1,961 17.8 4.7Geologists 264 486 16.8 6.6Engineering & Science
Technicians NEC' 596 2,035 48.3 42.1Draftsmen 3,237 4,852 10.0 10.0
Source: "Project Independence Report," Federal Energy Administration, 1974, Table V33.
'Survey by National Planning Association2 Average annual employmentNot elsewhere classified
52

wonder What happens at the other end of the energyflow. Who buys it, in what form, and how much?
In several chapters of this Source Book (notablyChapter 3, Volume II) we look at average consumptionpatterns. We see that within these averages on aworldwide basis there are large disparities that anaverage American uses about 50 times the energy anaverage Indian does. Are there similar disparities in ourown country?
According to a recent survey' the average Americanhousehold consumes a total of 86 million (M) Calories ofprimary energy each year. Six percent of the income ofthis average household is spent for this amount ofenergy, the equivalent of 848 gallons of gasoline,142,000 cubic feet of natural gas (for heating and cooking) and 8,000 kilowatt hours of electricity (the primaryenergy used to create this electricity is also included inthis summary).
The first departure from this average comes if we lookat household energy use as a function of income level.We see in Figure 5-5 that although there are smalldifferences in the use of basic energies electricity andnatural gas over the range of incomes studied, thebiggest difference is in gasoline consumption. The ratioof total consumption in the "well-to-do" household to thetotal consumption in the "poor" household (as defined inFigure 5-5) is about two to one, a much smaller ratiothan that of their respective incomes. There is.only somuch direct energy one can use.
This-last observation suggests that the poor mayspend a larger share of their income on energy than dothe rich. The data of Figures 5-5 and 5-6, summarized inTable 5-5, bear this out. The poor usdless energy thanthe rich but spend a larger shard of their income for it.And they pay more per Calorie fOr it, also, at least in thecase of natural gas and electricity, for which rates arelower for the large-volume user.
The study goes on to look at the various end uses forenergy and at the rich/poor differential. It found, forinstance, that although the poor live in smaller housesand apartments, they are less well-insulated, and as aresult they require about as much natural gas to heat asdo the houses of those in higher-income brackets.
The data on appliance ownership by income group isalso pertinent to the energy future. These are collectedin Table 5-6. It is interesting to note that the definition of"poor" is a relative one, since a quarter of the house-holds in that group own color televisions, frost-free re-frigerators, etc. .
One of the energy traps the poor are caught in (andthey are joined there by many from other incomegroups) is that they do not have enough cash to saveenergy. They cannot insulate or buy storm windows.They are stuck with first-cost comparisons, they have to
'A national survey by the Washington Center for MetropolitanStudies reported in "A Time to Choose," the final report of the EnergyPolicy Project of the Ford Foundation (Cambridge, MassachusettsBallinger Publishing Company, 1974)
buy the cheapest refrigerator, air conditioner, etc., andas we find in stqy after study, the least expensiveenergy converting device is often the least efficient one.We return to this subject in Chapter 6 where we look inmore detail at some energy-conserving strategies.
The greatest energy use gap between rich and pooris in the transportation sector. (This is shown by thelarge difference in gasoline consumption we saw inFigure 5-5.) Seventy-nine percent of well-to-do house-holds own two or more cars, while nearly half the poorown none. Thus those households in the low-income 17percent use only 5 percent of the total gasoline con-sumed.
We have, so far, looked at the disparity in directenergy use of fuels or electricity. Thereds also an obvi-ous difference in the sharing, among income groups, of
FIGURE 5-5Household Energy Use by Income Group
125
100
75
50
25
Million Calories Per YearCD Gasoline
E2=21 Electricity
IM Natural Gas
IN
Poor LowerMiddle
Average Upperfor all Middle
Households
WellToDo
Source. Washington Center for Metropolitan Studies.
Note: Includes only natural gas, electricity, and gasoline.
53

TABLE455The Percentage of Family Income Spenton Energy Declines as Income Increases
AverageIncome Status Income
Percent ofAverage TotalAnnual Average Annual
Calories (Mil, Annual Incomelions per Cost per Spent
Household) Household on Energy
Poor: Total $2,500a 52 S379 15.2Natural Gas 30 , 147 5.9Electricity 14 131 5.2Gasoline 9 101 4.0
Lower Middle: Total $8,000 74 572 7.2Natural Gas 33 153 1.9Electricity 20 167 2,1Gasoline 22 252 3.2
Upper Middle: Total $14,000b 102 832 5.9Natural Gas 36 166 1.2Electricity 27 213 1.5Gasoline 39 453 3.2
Well Off: Total $24,500b 121 994 4.1Natural Gas 44 200 .8Electricity 31 261 1.1
Gasoline 46 533 2.2
Source: Washington Center for Metropolitan Studies Lifestyle andEnergy Surveys, 1972-1973.
Note: Electricity and natural gas expenditures based on billing datarkeived from utilities. Gasoline expenditures estimated from re-spondents' quantitative information and the average 1972-1973price of 370 per gallon.
a77 percent of the poor had incomes less than ,$3,000.bCalculated from unpublished census data.
TA3LE 5.6Percentage of Households OwningMajor Appliances, by Income Group
%
Appliance PoorLowerMiddle
UpperMiddle Well Off
Stove 95 97 99 98
RefrigeratorManual Defrost 74 51 39 30
Frost-free 24 48 60 69
Total 98 100 100 100
Separate food freezer 23 30 38 47
Dishwasher 3 13 39 55
-Clothes washerWringer 19 11 7 3
Automatic 44 64 84 90Total 62 75 89 91
Clothes dryer 24 46 70 81
Television8Iackandwhite 74 63 57 64Color 27 48 63 74
Total 94 96 98 98
AiroonditioningWindow 17 34 39 33
Central 4 10 19 32
Total 22 45 58 64
Source: Washington Center for Metropolitan Studies, Lifestyle andEnergy Household Survey, 1972.1973.
FIGURE 5.6Average Family Income and Percent Spent for Energy
Average Income
Poor
Lower Middle
Upper Middle
Well Ott
4,000 8,000 12,000
15.2%
7.2%
5.9%
16,000 20,000 24,000
\ \s \ \\\. \\4.1%
Dollars
Source A Time to Choose," final report of Energy Policy Project, Ford Foundation, Ballinger, Cambridge, Massachusetts, 1974.
54

the indirect energy used to manufacture homes, furnaces, furniture, cars, clothing, etc., and to servicehouseholds. This energy is much harder to trace sincethere is no complete set of statistics available on theenergy requirectto build a house or a stereo set, to printor deliver a magazine, etc. An estimate from the FordEnergy Project study is shown in Table 5-7. The fourcategories shown do not account for all indirectenergy use. Entertainment, clothing, books, furniture,etc., are not included, nor is the energy expenditure bythe government f6r postal services, the military, thespace program, etc. Even without taking into accountthe uneven distribution of this additional indirect energyamong income g;oups, the spread between total directand indirect energy consumed by the extreme groups isalready large, as shown in Figure 5-7.
There are two final points we wish to make beforeleaving this section on income and energy. The first isthe obvious one that changes in our energy policy, inparticular changes brought about through pricing, mustnot be designed so they increase the energy gap be-tween rich and poor. Increasing energy s price increasesthe already-large percentage of income the Door pay forit. Similarly, the poor buy energy primarily for neces-sities home heating and cooling, cooking, water heat-ing, etc. Cutting back on energy use may well meancutting into essential uses.
TABLE 5-7Annual Indirect Energy Use Per Householdby Income Groups (million Calories)
Income Group Food Autos Housing Appliances Total
Poor 9,5 8.8 2.5 1.5 22.3Lower Middle 16 20 2.8 1.8 40.6Upper Middle 20 30 3.3 2.1 55.4Well Off 24 37 4.0 2.5 67.5
Notes:Income Group is defined in Table 5.5.
Flood: Includes tractor fuel, fertilizer manufacture, containerrt nufacture, food processing, trade, and transport.
Aut s: Includes auto manufacture and support industries such ashighway construction, repairs, tires, operation of service stations,and insurance companies. Allocated among the income groupsaccording to auto ownership patterns and miles driven, fromWashington Center for Metropolitan Studies Lifestyle and EnergySurveys, 1972.1973.
Housing Materials and Construction: Based on estimated energyconsumption per ,sq-are foot of housing, amortized over 50-yearlifetime for house. Allocated among income groups according tosquare footage of homes, estimated from WCMS data on number of
, rooms.
Appliances: Total energy use for manufacturing appliancesamortized over 8 years for water heaters, 14 years for all otherappliances. Allocated among the income groups according toownership data from WCMS.
Taken from: "A Time to Choose," final report of Energy PolicyProject, Ford Foundation, Cambridge, Massachusetts. Ballinger,1974, Table 78.
The second point comes from a companson of directand indirect energy. It is striking, for instance, that the 26M Calories of food energy per year charged to thewell-to-do is 7.4 times as large as the 3.5 M Calorieswhich a family of 3.2 persons (the size of the averagehousehold in the study) would consume (at 3,000Calones per day). What we are measunng is the irieffi-ciency of the overall food system. It is also worth notingthat the annual indirect gnergy cha;gcd to manufactur-ing automobiles, providing roads, operating service staLions, etc. is almost as large as the fuel used directly topropel the car. In both these instances the upper-income ackets, because they dominate the market,set tne standards which the market follows and withwhich the poor must Jive. These standards are energy-intensive ones.
Energy in Food ProductionWe will pick up the hint .of the previous paragraph: if
the energy expended in growing, processing, packag-ing, and transporting food is divided by the food con-sumed per household we find a factor of 7 or 8. What thismeans, at face value, is that it requires 7 or 8 Calories offossil fuel energy to get 1 food Calorie on our plate.We are eating fossil fuels. The food crisis and theenergy crisis are therefore joined.
There are several reasons why it is important that weexamine our food industry from an energy point of view.It uses a significant amount of energy, 12 or 13 percentof the national total. It is important, therefore, to under-stand in what form and for what purposes that energy isused in order to make rational choices among the vari-ous energy futures before us. More important, however,is the worldwide food shortage and America's role as
I
FIGURE 5.7Direct and Indirect Energy Use by Income Group
100
=a111.1
Well Of
==11
Direct 1111111111111
Indirect
Total
Upper LOWER',
Middle Middle
11111
11111.101r,
Poor
'See Table 5.7 for a breakdown of indirect energy uses.
55

food suriplier What are the energy implications of thatpolicy? Finally, we may want to examine our food pro-duction system as a model fa, others to copy. Is thissystem one that can meet world needs?
The energy cost of U.S. food production: Howmuch energy does it take to put a Calorie of food beforean American consumer? To answer this question it isnecessary to determine the energy consumption in thefou' r major components of the food systerit the farm, theprocessing industry, the commercial retailing industryand the home. In each of these there are direct uses(fuel and electricity) and indirect uses (energy con-sumed in the manufacture of food-related equipment, orin transportation and in the manufacture of fertilizers,pesticides, herbicides, etc.).
We present in Table 5-8 the results of an energy auditof the food system from 1940 to 1970. (The source ofthat study is indicated on the table.) In Figure 5-8 we plotthe total energy and compare it with the energy of thefood produced. Figure E 3 shows the growth in theamount of energy in each of four component sectors(see Table 5-8) which make up the total.
We are prepared for the comparison of Figure 5-8 byour earlier rough estimate. The ratio of the amount ofenergy used in the system to the number of Calorieseaten by the population has grown from 5.3 in 1940 to10 9 in 1970. Figure 5-9 shows us where this growth has
FIGURE 5.8Total Energy Use in Food System Versus Calories of FoodProduced (food is population times 2,700 Calories per day)
0F-
w
1,000-
500-
4
Total Energy Input to Food System
Total Energy of Food Produced
01940 1950
Data from Table 5.8.
/660 1670
Veit.
56
occurred. Energy consumption has grown in each of thethree categories but the fastest growth has been in theenergy (direct and indirect) used on the farm. Over the30-year period, total farm energy use increased by afactor of 4.2 (cqmpared with 3.0 for food processing and1.2 for the commercial and home sector). We can seufrom Table 5-8 that fuel use, electncity, fertilizer, and theenergy to build farm machinery accounted for most ofthat growth.
It should be emphasized that even with the detail ofTable 5-8 these data are still fairly rough. There is noaccount,taken, for instance, of food wasted or the grow-ing amount of food exported. It is certainly accurateenough, however, to raise some serious questions forthe future.
If we look at the data of Figure 5-8 in a somewhatdifferent way, and plot the food energy output againstthe fossil fuel energy input, we obtain the interestingcurve of Figure 5-10. This looks suspiciously like theS curve we discuss in Chapter 4, Volume II. It is a curvewhich suggests the end of growth. It is easy for us tointerpret this figure in the present context. It suggeststhat we cannot gain very much more food energy fromour system by merely putting more fossil-fuel energyinto it.
It does not say that we are farming as efficiently aspossible, for we are considering all the energy used inthe system and as we see_in Figure 5-9, the farm energy
FIGURE 5-9Growth in Energy Consumptionof Food System Components
2,000
1,500
1,000
500
0
0F-
w
Total
Commercial and Home
Processing
Farm
1940
Data from Table 5-8.
19T50
Year
1960 1970

only represents a quarter of the total. From otherstudies,2 however, it appears that with some crops, cornis the example quotd, we are already using 1,000Calories of energy per square meter (farm energyalone) and achieving energy yields of 2,000 Calories ofenergy per square meter from the grain alone. Thesenumbers are to be compared with 5,000 Calories persquare meter of energy that the corn plants can take infrom sunlight. Since the energy output is almost one-halfthe captured solar energy it is unlikely that we can gainmuch more farming efficiency by adding more fertilizers,plowing more often, using more herbicides, etc. In fact, ifwe look at yields per acre as tons of fertilizer applied peracre, we obtain a curve similar to the one shown inFigure 5-10. It is an S-curve and we are on the flat top.We- cannot buy much more plant productivity withenergy.
Agricultural practice is a deep and engrossing sub-ject, and there is much more which could be said. Thereare a variety of suggestions for increasingyields withoutincreasing acreage, by reducing fertilizer per acre andbringing such "soil bank" land as remains unused backinto production, or by using more of the organic wastewe produce, as, land conditioners and supplementaryfertilizer. We will leave that fuller discussion to others.
There are conclusions we can suggest, however,from this energy-focused consideration. The first is thatfood prices will rise with energy prices. They are, in fact,expected to rise more rapidly than energy since a largepart of the energy input is of the indirect sort expended inmanufacturing. It may be that energy costs will becomehigh enough to make farming depart from its path ofincreasing capital intensiveness and make a partial re-turn to farm labor an economic alternative.
2"Food Production and the Energy Crisis, Pimentel, Hurd, Bellotti,Forester, bka, Sholes, Whitman, Soler& 182, 443.449, November2, 1973.
FIGURE 5.10 'Food Energy Output Versus Energy Input to Food System
0 500 1,000 1,500
Input Energy in T (104 ) Calories
Data from Table 5,8,
2,000
This energy analysis of agriculture also raises ques-tions as to the wisdom of continuing in the direction offood "mass production" practices. We question it fromour own point of view, it has not proven to be an energy-efficient way to feed our own people (although it hasbeen labor-efficient, and so far capital-efficient). It iseven less attractive as a way to feed the world's hungrypeople. As it is now practiced, we are exporting energywhen we export grain, 5 or 10 Calories for every foodCalorie it contains. That is not a wise strategy for anenergy-importing country.
It is an even more questionable decision to considerexpc,rting our agricultural practices. We are engaged inthat at present. The so-called "Green Revolution" isbased on new strains of high-yield grains, but these newgrains require both fertilizer and irrigation. As we seefrom Table 5-8 both of these are energy expensive. (Theirrigation energy expenditure in Table 5-8 is based onirrigation of only 5 percent of our crop land.)
We may in fact have something to learn from foreignagricultural practices. By relying on human labor someother countries get many more Calones from the earthand sunlight than they put in. The Chinese peasant gets50 Calories of food,energy back for every 1 he expendson his wet lice fields. The primitive "slash and burn-agriculture of the tropics, in which a new field is clearedof trees every two or three years, gains Calories inalmost a 20 to 1 ratio.
We are, of course, not prepared to become a nation offa mers again in order to save some of the energy usedin farming. Somewhere, in the chain of energy conver-sions from farm to table, careful analysis should turn upsome uses which could be omitted. The growing ofplants, after all, should be an energy-producing activityfueled by the always abundantenergy of the sun. Ourfossil fuel Calories are becoming too expensive to eat.
Financing Energy Growth andEnvironmental Protection
In our analysis of the energy supply-aid-demandpicture for the next decade or so (Chapter 5, Volume II),we included among the necessary supplies the invest-ment capital needed to explore for oil, build Ports andtankers, open new coal mines, etc. A summary of thebillions of dollars needed under iarious supplyscenarios is given by Table 5-4, Volume II. The totalsrange from $451 billion (1970 dollars) for the case whichprojected high oil imports to $547 billion for-the all-domestic case. If we deduct from these National Pe-troleum Council estimates those amounts of capital thatwere used to finance items which can be deducted fromprofits before taxes (and thus cost nothing); the averageof these four cases of Table 5-4 is $380 billion. Thisamount is to be split among the various energy needs asshown in Table 5-9.
In this section we will examine these financial needsand ask whether this money can be raised or whether alack of investment capital in the next four years mightlimit energy growth. We will rely, in this discussion, on
57

the analysis of financial constraints provided by the FEAProject Independence Report.
The question of the availability of investment moneycan only be answered with reference to the past. SinceWorld War II, investment in the energy-producing Industries (coal, oil, gas, uranium, and the utilities) hasranged between 20 and 25 percent of total businessinvestment. The capital market should, therefore, beable to handle future demand from the energy industry ifit falls within that percentage range of the expectedtotal investment money.
We must therefore look to the future, to expectedgrowth in the GNP-and in business investment, to seewhether 20 or 25 percent of the expected totals are largeenough to meet the projected needs. The projections ofavailable dollars range trom a low of $366 billion to ahigh of $502 billion. The conclusion is that the moneywill be available even for the FEA Accelerated SupplyCase" of Table 5-9.
Trouble at the utilities. The details of the FEA studyare optimistic for oil and gas and for coal (where the totalamount is low and the oil companies are expected toinvest heavily). The investment picture for the utilities,however, is nOt as bright.
As we see from Table 5-9, the utilities will need toraise something between $186 billion and $315 billion inorder to begin construction of the nuclear and coal-f:redplants and transmission lines needed in the next 10years if they are to meet expected electric power demand. The record this year has not been very encouraging. Some 70 plants which were to have been startedhave been delayed or abandoned.
The major reasons for the uncertainty making utilityInvestment unattractive, at least at the moment, havealready been discussed. The conservation efforts bypower company customers have been extremely suc-cessful and cash flows (and dividends) have been lowered. The air quality criteria have put fuel supplies,especially coat, into question. The performance of thebigger units (of about 1,000 Mw), especially the nuclearones, has been erratic they have operated on theaverage at considerably less than the expected 75 percent capacity.
A final note of uncertainty is entered by the demandprojections themselves. As we said in Chapter 1, thegrowth rate of electric energy, which has been 6 or 7percent per year for 20 years or so, dropped below 1percent this year. It is not clear as yet whether this was ashort-term response by the public or whether some
TABLE 5-8Energy Use in the U.S. Food System (in 1012 Calories)
Component 1940 1947 1950 1954 1958 1960 1964 1968 1970
On FarmFuel (direct use) 70.0 136.0 158.0 172.8 179.0 188.0 213.9 226.0 232.0Electricity 0.7 32.0 32.9 40.0 44.0 46.1 50.0 57.3 63.8
Fertilizer 12.4 19.5 24.0 30.6 32.2 41.0 60.0 87.0 94.0Agricultural Steel 1.6 2.0 2.7 2.5 2.0 1.7 2.5 2.4 2.0Farm Machinery 9 0 34.7 30.0 29.5 50.2 52.0 60.0 75.0 80.0Tractors 12.8 25.0 30.8 23.6 16.4 11.8 20.0 20.5 19.3
Irrigation 18.0 22.8 25.0 29.6 32.5 33.3 34.1 34.8 35.0Subtotal 124.5 272.0 303.4 328.6 356.3 373.9 440..5 503.0 526.1
Processing IndustryFood Processing Industry 147.0 177.5 192.0 211.5 212.6 224.0 249.0 295.0 308.0Food Processing Machinery 0.7 5.7 5.0 4.9 4.9 5.0 6.0 6.0 6.0Paper Packaging 8.5 14.8 17.0 20.0 26.0 28.0 31.0 35.7 38.0
Glass Containers 14.0 25.7 26.0 27.0 30.2 31.0 34.0 41.9 47.0
Steel Cans and Aluminum 38.0 55.8 62.0 73.7 85.4 86.0 91.0 112.2 122.0
Transport (fuel) 49.6 86.1 102.0 122.3 140.2 153.3 184:0 226.6 246.9
Trucks and traitors(manufacture) 28.0 42.0 49.5 47.0 43.0 44.2 61.0 70.2 74.0
Subtotal 285.8 407.6 453.5 506.4 542.3 571.5 636.0 787.6 841.9
Commercial and HomeCommercial Refrigeration
and Cooking 121.0 141.0 150.0 161.0 176.0 186.2 209.0 241.0 263.0Refrigeration Machinery
(home and commercial) 10.0 24.0 25.0 27.5 29.4 32.0 40.0 56.0 61.0
Home Refrigeration andCooking 144.2 184.0 202.3 228.0 257.0 276.6 345.0 433,9 480.0Subtotal 275.2 349.0 377.3 416.5 462.4 494.8 594.0 730.9 804.0
Grand Total 685.5 1,028.6 1,1134.2 1,251.5 1,361.0 1,440.2 1,690.5 2,021.5 2,172.0
Source: "Energy Use in the U.S. Food System," C. Steinhart and J. Steinhart, Science 184, 307.315, 1974, Table 1.
58

deeper adjustment is taking place. The decisions hereare complicated by the size of the financial commitmentneeded for an individual plant and the time that d takesto build one.
The relevant data on which these decisions rest aresummarized in Table 5-10. The fuel costs favor thenuclear plant followed by the coal plant. The operatingand maintenance costs also favor the nuclear plant. Thequestion that must be answered, however, has to dowith the capacity level at which the plant will operate andthe time it will take to get the plant into operation. Operat-ing at 70 percent capacity, the nuclear plant is expectedto provide the least expensive electricity followed bycoal, oil, and gas. At 40 percent capacity the coal plant isthe choice. At 10 percent capacity the order is almostreversed from the high-capacity case; it is gas, coal, oil,and nuclear.
What the utilities fear is the following chain of events.Projecting growth at the traditional rate (demand doubl-ing every 10 years) they choose to build a big nuclear (orcoal) plant. They ask for and receive the rate increasesnecessary to enable them to attract the capital to buildthe plant and they begin the seven to 10-year job ofplanning.and building. Due to rate increase, however,demand does not grow as rapidly as projected andwhen the plant comes on line its full capacity is notneeded, it is forced to run at lower capacity, the cost ofthe electricity it produces is higher than estimated, andthe vicious circle continues. In this atmosphere of uncer-tainty the temptation is to choose the gas turbine whichcan be built quickly and relatively cheaply, but which willproduce more expensive electricity and will bethreatened by a shortage of natural gas.
TABLE 5-9Cumulative Capital Requirements for EnergyProduction, 1975-1985 (in billiont of 1973 dollars)
IndustryNPC
Projection(a)
FEAAccelerated
Supply(b)
Oil and Gas(incl. refining) 133 98.4
Coal 11.9Synthetic Fuels 10 0.6Nuclear 7 138.5
Electric Power Plants(excluding nuclear) 137 60.3
Electric Transmission 42 116.2Transportation 43 25.5Other (solar, shale,
waste treatment, itc.) 0 2.2
Total 380 454
Source; Project Independence Report, Federal Energy Administra-tion, 1974, Table V-21.
(a)Average of the four supply cases of Table 5.4, Chapter 5, VolumeII, with $107A billion of deductible outlays subtracted.(b)This is the FEA option which is the most optimistic as far asdomeestic supplies are concerned.
1, +r'1.1
We are in the midst of the decision making time.There are interesting lessons on the operation of ourcapital markets to be learned. The result of the deci-sions will have an impact throughout the energy web; allthe way from the plains of t:arth Dakota to the electricbill in the nearest mailbox.
Paying for Pollution
Among the new costs of energy in the next ten yearswill be the dollars needed to prevent continued degrada-tion of the environment. The Council on EnvironmentalQuality (CEQ), in its fourth annual report (1973), sum-marized these costs under lour headings: damagecosts, due to illness and property damage; avoidancecosts, which include such costs as the expense of trav-eling further to find a clean swimming beach;transactional costs, the cost of making and enforcingregulations, and abatement costs, to reduce pollutionthrough sewage treatment plants or emission controldevices.
The major costs are abatement costs, for control ofparticulates and SOx, for control of automobile exhaust,and for water pollution and solid waste. The CEQ sum-mary of these total costs is given in Table 541. Theresponsibility for these expenditures is expected to beshared between the public and private sectors, asshown in Figure 5-11.
The cumulative total overall pollution cost categoriesfor the period 1977-1981 is projected to be
TABLE 5-10Comparison of Costs of Power GeneratingPlants (M Kw-hr at the generating plant)
Nuclear Coal Oil Gas Turbine
Fuel Cost 2.50 5.56# 15.83# 23.54+O&M 1.50 2.75 2.65 2.50Fixed ChargeCapacity (.7) 14.84 11.48 10.45 5.12Factor (.4) 25.97 20.10 18.30 8.96
11) 103.88 80.37 73.18 35.84Total Cost
Capacity (.7) 18.84 19.79 28.93 29.88Factor (.4) 29.97 28.41 36.78 32.76
(.1) 107.88 88.68 91.66 52.93+Plant Cost 455.0b 352.00 320.00 117.80$ per kwYears to Build 10 7 7 2
Source: Project Independence Report, Federal Energy Administration, 1974, Table V-24.
Fixed charges are those costs associated with depreciation, interest,return on equity, State and local taxes plus Federal income tax andare assumed to be 20 percent of plant cost." "The fraction of maximum capacity in use.stFuel costs are $14.52 per ton for coal, $10.59 per bbl for residualoil used in the oil turbine, and $11.77 per bbl lot distillate o4ed ingas turbines.
+Operation and maintenance including environmental costs.
59

/
$274.2 billion. The largest energy-related share of thisis the $105.6 billion from air pollution, although $1 billionfrom radiation and $4.5 billion from surface mining mustalso be added.
These amounts of money are large, but the costs ofthe damage they are designed to prevent are also large.The $11.3-billion estimate for air pollution control in1971 must be compared with The $16.1 million esti-mated damage from air pollution in 1968. The largecosts when considered from this viewpoint are a goodinvestment.
Who pays: As we see from the breakdown of Figure5-11, it is anticipated that the private sector will paytwo-thirds of the bill. There is concern, however, thatthese costs may be spread in an inequitable fashion
through the income distribution of our society. It will beunfortunate if they are loaded on the backs of the pour,for they do not stand to benefit as much from many of thecontrol measures as do the rich. They do not, for in-stance, use recreational facilities as. much as the rich.Air pollution abatement, however, will benefit the inner-city residents, for pollutant levels are higher there thanin the suburbs.
Generally speaking the government expense col-lected through taxes will come in greater proportionfrom the upper income-brackets. Private expenditures,however, are likely to be added to the cost of basicenergy goods and services. Since, as we have seen, thepoor pay a larger share of their income for energy thando the rich, they will alsC pay a slightly larger share of
TABLE 5-11Estimated Total Pollution Control Costs (in billions of 1972 dollars)/ ,
Pollutant/rnedi umO&M'
1971
CapitalCosts'
TotalAnnualCosts' O&M'
1981
CapitalCosts'
TotalAnnualCosts'
Cumulative-1972.81
CapitalI nvest-
mint O&M'
TotalAnnualCasts'
Air PollutionPublic 0.2 <.05 1.0 "0.2 1.2 1.4 7.1 8.4Private 1
,
1.1 <.05 1.2 6.2 - 4.3 10.5 27.1 ' 39.1 58.8Stationary .4 .3 .7 4.2 .1.5 5.7 11.4 27.0 38.4Total 1.7 .3 2.1 11.4 6.0 17.4 39.9 732 105.6
Water PollutionPublic
Federal .2 NA NA .7 NA NA 1.2 2.8 NAState and Local 1.2 3.8 5.0 2.6 7.0 9.6 47.2 20.0 76.9
PrivateManufacturing .4 .3 .7 2.2 1.5 3.7 12.3 15.8 27.5Utilities .2 .1 .3 1.6 .9 2.5 6.8 10.9 16.5Feedlots 0 0 0 <.05 <.05 <.05 .2 <.05 .2Construct ion sediment' <.05 NA NA <.05 <.05 <.05 .3 <.05 .2Total 2.0 4.2 6.0. 6.6 9.4 15.8 68.0 49.5 121.3
Noise
Commercial jet aircraft NA NA NA NA NA NA (.4-1.6) NA NA)
RadiationNuclear powerplants` NA NA NA <.05 . .2 .2 1.2 <.05 1.0
Solid wastePublicPrivate
1.02.0
.2
<.051.22.0
1.7
3.1
.4
.1
2.1
3.22.6
.3
13.825.2
16.325.5
Total 3.0 .2. 3.2 4.8 .5 5.3 2.9 39.0 41.8
Land reclamation'Surface mining NA 0 NA .8 0 .8 0 4.5 4.5
Grand Totals 6.7 4.7 11.3 23.6 16.1 395 112.0 166.2 274.2
Source: Environmental Quality 1973, Council on Environmental Quality (Washington. USGPO) 1973.
'Operating and maintenance costs.2 Interest and depreciation.30&M plus capital costs.`Excludes heavy-duty vehicles.s Includes only sediment control for housing and highway construction.
60
6 Radiation figures include incremental costs only. The total costs ofradia on control are inseparable from other cats of building andoper ng a nuclear powerplant.7 Lan reclamatiqdn costs are assumed to be current expenditures.a Ooes not includ noise control.

pollution expenses This is an inequity which must alsobe taken into account by energy policy pranning.
The general worry that investment for pollution con-trol will retard the economy and drive prices sky highseems to have been mitigated by the results of the mostrecent CEQ study. In a recent news release3 it wasreported that only 2peident of the firms sampledclaimed that investment in pollution control had dis-placed any of their planned investments for moderniza-tion or expansion It also reported that the results of fourseparate analyses indicate that pollution control expend-itures were responsible for only one-half of 1 percent ofthe -17 percent increase in the wholesale price indexfrom 1973 to 1974. (This is to be cpmpared to the rise inthe price of energy which contributed a third of the totalincrease ) We can, apparently, afford pollution control.
Summary
In this chapter we looked at some of the relationshipsbetween energy and another of the big Es, theeconomy. The energy web, of course, reaches into ellparts of our economic system and we tried to selectsectors to examine that either were crucial to our well-being or interesting (or both).
'News release, Counal on Environmental Quality, December 9,1974.
FIGURE 5.11Distribution of Total EnvironmentalExpenditures, 1972-19811
Public1 37% $1015 billion
0Pfivat;63% 5-172,7 bdlan
Source "1973 Environmental Quality." Council on Environmental Quality
Figures do not total doe to rounding.
We found that there was at least a rough-corrqspond-ence between high energy consumption and largeGNP, both in international comparisons and in our ownhistorical record. We found further that the efficiencywith which energy_produces a dollar of GNP had beenrather steadily increasing over the past 20 or 25 years(the ratio of Calories to GNP dollars has been decreas-ing). In the late 1960s, however, that increase stoppedand the ratio of Calories to GNP dollars increased. Wewere left with some uncertainty as to the tong-rangetrend.
The predictions in the energy-employment area weresomewhat easier td make. Although a sharp decreasein available energy (as occurred during the embargo)would have serious effects, changes over longer time-frames should have little effect if properly anticipated.The energy-producing industries and the industrieswhich use large amounts of energy / e "..capital-inten-sive" and do not employ a large of thenation's workers.
We examined the rel ti nship between dinergy con-sumption and inc found that en ergylike wealthis inequitabl istributed in this country. The danger ofthe prefienl trend is that increasing energy prices willwi0erfthe energy gap.
We used this chapter to examine brieflAinothertroubletompart of the energy web, the energy neededby the food system. What we found on analysis is thatyear by year the number o Calories that must go intathesystem in order to get a fo d Calorie out is now about 10,and growing. The food crisis and the energy crisis arethus firmly joined.
The final digussion w s of the $380 billion in capitalneeded to assure the nticipated expansion of theenergy supply. All project ons seemed reassuring as faras the total is concerned. e are, however, in the midstof the moment of decision for the utilities companies asthey search for investment capital and begin tO movetheir next big plants off the drawing boards.
We only looked at segment of the economy in thischapter. The Source Book itself is not big enough toconsider all of the interlacings between these two Es.The most importankonclusion we can draw from thoseaspects of the system we did examine is that ,arefuiplanning is needed We have crossed a riew tiuntiei ,i,toan era of expensive energy, the familiar iandrnai NS al egone We can continue our journey only with a l.atetu,,ydrawn map, The making of that map, the Cun tS.( uutiun utan energy policy, will be the subject of the concludingchapter of this Source Book. In the next chapter we vim;look at a set of modifications that should be a part of anyenergy policy; strategies for energy conservation
61

ICHAPTER 6Prospects and StrategiesFor Energy Conservation
1
)

Prospects and StrategiesFor Energy Conservation
"Turn out the light when you leave the room." "Shutthe door, were you born in a barn?" These once familiarphrases from a conservation oriented past have rarelybeen heard, or at least rarely attended to, by the under-thirty generation. The energy crisis may bring them backintb vogue.
In the two volumes of this Source Book, we havedocumented and described the multidimensional prob-lem which we abbreviate as "the energy crisis." Wehave examined consumption, its growth, and the prob-lems of supply and demand which accompany thisgrowth,...,We have looked at changes in the economic,sector, and in other sectors of society, which were mar-shalled in by this era of high-priced energy. In the earlierchapters of this Volume, we have examined the impactof the production, transportation, and consumption ofenergy on the environment and on man as a pail of thatenvironment. In Volume II, Chapters 6 and 7, we lookbeyond the present at some of the technological ad-vances that might ease the crisis.
There are many suggestions in these volumes ofways to improve this or that aspect of the energy crisis. Ifwe look at any individual piece of it, at the environmentalimpact of coal mining, ix...the danger of plutonium 239theft, or the shortage of investment capital, we candevise a "cure." There are very few of these "cures,"however, that have general application. The messagethat cries out from analysis after analysis, and the re-sponse which could have the most immediate and posi-tive impact on the widest range of problems, is a simpleone. We must use less energy.
It will take four or five years at the minimum to openenough coal mines, build enough refineries, drill enoughwells, or float enough new tankers to begin to make adent in the supply-demand problem. This country dem-onstrated, however, in the five or six months of the oilembargo, that we could immediately implement proce-dures to significantly reduce our consumption of fuel oil,gasoline, and electricity.
The data on energy consumption in 1974 give ussome concrete evidence on which to base our expecta-tions of the savings which could be effected. In 1974, forthe first time since 1952, total energy consumption de-creased. After rising at an average annual rate of 4.1percent since 1960, consumption fell by 2.2 percent,from 18.9 0 Calories to 18.5 Q Calories.
The reduction in the consumption of electricity wasparticularly starting. After two decades of growth at anannual rate of almost 7 percent, electric consumptionfell in 1974 by 1.9 percent, from 1.495 T kilowatt-hoursin 1973 to 1.466 T kilowatt-hours.
Even more impressive was the cutback in oil con-sumption from 6.317 f3 bbls (billion barrels) in 1973 to6.080 B bbls in 1974 This reduction averages out to 815M bbls per day which is almost equal to the 1 M bbls per
day which is the targeted figure for Administration con-servation strategies. Unfortunately, in spite of the over-all reduction and the oil embargo, the amount of crudeoil rnported in 1974 rose by 7 percent, from 1.18 B bblsto 1.27 B bbls.
The reductions in consumption were not all due tospecific conservation measures, voluntary or enforced.The recession, the embargo, and the mild winter allp ayed important roles. There is no doubt, however, thatthe rise in the price of energy, which is itself a suggestedconser cation tactic, was an important contributor to thesavings.
It is of interest to look at the savings in electricalenergy in terms of fuel. In 1973 the primary energy forelectric generation came from coal, 43.5 percent, oil,18.5 percent, and natural gas, 18.6 percent. Hyd-ropower contributed 15.0 percent and nuclear reactors,4.5 percent. In 1974 the percentages were coal, 44.1percent/ oil, 16.9 percent; natural gas, 17.6 percent;hydropOwer, 15.4 percent, and nuclear, 6.0 percent.Coal use increased by 2.3 M :ins, while oil used wasreduced by 34.7 M bbls and natural gas use reduced by0.34 TCF (trillion cubic feet).
The environmental impact of these chariges from1973 to 1974 is also interesting. The increase in coaldemand by the utility industry led to the strip mining (at10,000 tons per acre) of perhaps 230 additional acres.For the United States as a whole, however, coal con-sumption decreased by 16.5 M tons. If half this camefrom strip mining, the energy savings translate into 800fewer acres of strip mined land. In spite of the utilitiesreduction in oil use, the overall increase in imported oilof 84.7 M bbls required an additional 102 trips by super-tankers of Torrey Canyon size and we can expect statis-tically that 0.1 percent of this imported oil, 84,700 bbls,was spilled. The reduction in oil and gas consumptionoverall led to a reduction in air pollution. The 16.5 M tonsof coal not burned reduced the sulfur oxide. pollution byperhaps 3.2 M tons and reduced expected miningdeaths by 4, and so on.
Even these specific ripples, which spread from thereduction in energy co[isumption, do not exhaust theresults. We could also compute the dollars saved by theconsumer in not buying this energy and balance itagainst the wages lost by workers in energy-limitedindustries.
Taken all together these several results providestrong support for those who urge this country tochoose, as its major energy policy theme, a deliberate,carefully plannod program of energy conservation. Noother policy option can produce results SJ rapidly, andno other option impacts so positively on the broad spec-trum of energy-related problems.
With this general justification for such a policy, we willdevote this chapter to a survey of the most promisingtargets for conservation strategies and to an analysis ofsome of the mechailsms, economic and political, forimplementing them.
65
IMMIIIMMEIMEMIMIMEMNIMMEMMIMI111111tYritlitll

Less May Be MoreThere are two somewhat different approaches we
can take in order to save energy. We can tighten ourbelts and use less energy, drive fewer miles in our cars,turn off lights, turn down thermostats, take shortershowers, etc. In other words, we can move to a less af-fluent lifestyle. We can also use less energy by improv-ing energy productivity, by getting more useful heatand work from each extracted Calorie of primaryenergy. By an emphasis on improving energy productiv-ity, by improving the efficiency with which we convert itto our use, we maybe able, with less per capita energyexpenditure, to live as well or better. Less may be more.
It is likely that we will have to use both strategies, atleast in the beginning. The belt-tightening approach canbe implemented most rapidly, it requires for the mostpart changes in personal practices rather the ri changesin physical quipment and industrial or political proc-esses. The attack on energy inefficiency can providethe more solid, long-term gains.
Short-term Responses
It is well to look briefly at some of the most obviousand practical of the belt-tightening strategies. We havebehind us some experience (and data) collected byvirtue of the oil embargo. The short-term strategies werealmost all targeted to the individual consumer. Thistarget is recommended, as we have said, by the prom-isepf quick implementation.
The major effort of conservation during the embargowas aimed at automobdetransportation and home heat-ing. These are large targets. Private automobiles con-sume half of the energy used in transportation and 28percent of all the petroleum we burn (1972 data). Almostthree-quarters of the energy used in the residentialsector (2.3 Q Calories out of the 1972 total United Statesconsumption of 18.2 Q Calories) was used in residentialheating.
k
FIGURE C-1Effect of Speed on Fuel Economy
20-c0
C-
10- Urban Driving.
Steady Cruising
20 /,0 60Miles Per Hour
Data Source: EPA, "A Report on Automotive Fuel Economy," 1974.
66
Gasoline consumption was attacked in two ways. Thehighway speed limits were lowered to 55 miles per hour(MPH), and gasoline stations were closed on Sundays.The justification of the former is given by the data ofFigure 6-1. Automobiles get better gasoline mileage atlower speeds. A drop from 70 MPH to 50 MPH, forinstance, increases gasoline mileage by about 20 per-cent. Actual savings are, of course, lower than this; 5percent was the Department of Transportation esti-mate, since automobiles don't go a steady 70 MPH.
The expected savings from the Sunday sales banwas to come from reducing the 25 percent of totalmileage that was accumulated in weekend driving. Themodest goal was a 10 percent saving, and the twostrategies together were expected to save 1 M bbls of oilper day.
The short-term goal of saving energy by loweringhome comfort levels was based on the following experi-ence. The rate at which heat leaks through a barrierdepends on the temperature difference. Less heat iSlost in the winter (and less cooling needed in the sum-mer) if the inside/outside temperature difference is de-creased. In the average American home, a one-degreechange in the thermostat setting (up Li the summer,down in the winter) reduces fuel consumption by 3 to 4percent. A 5°F change in daytime "comfort temperature" and a 10"F change at night should produce anestimated 15 to 20 percert fuel saving. These energysaving techniques, of course, also save money.'
These are the easy strategies as far as their im-plementation is concerned (although enforcementmight be difficult). From the embargo experience andfrom the numerous energy studies that have takenplace during the past year, the Federal Energy Administration (FEA) has developed a more elaborate repertoire of short-range strategies, which is shown inFigure 6-2.
Figure 6-2 is a mixture of easy and difficult strategiesas far as lifestyle disruption is concerned. All of themcould, in theory, be turned on rapidly (the FEA estimate,as we see from this figure, is 60 days to completion),The three emergency measures we have just discussedare shown along with some important newcomers.
The savings are given in terms of million barrels of oilper day, since oil is the sensitive energy form. They canbe converted to Calories using the data of Table 1-3 ofVolume II; 1 barrel of oil = 1.5 million Calories; there-fore, 1 M bbls = 1.5 trillion (T) Calories. The importanceof the savings can also be judged by comparing themwith the approximate 20 M bbls per day of oil consump-tion in 1974 and to the 6 to 8 M bbls per day of that whichwas imported.
Figure 6-2 gives us a strong due to targets for ourlonger-range strategies. The big savings come fromimproving the efficiency of transportation. These arefollowed by savings obtained through belt-tightening in
'The embargo period produced several' how to save energy' book-lets The best of these ale referenced in Section IV of the EnergyEnvironment Materials Guide
+1%

the comfort area, reductions not only in heating andcooling energy, but also in that used for lighting.
Withihis as preview, let us now turn to a considerationof energy efficiency and some ways to improve it.
Long-range StrategiesImproving Energy Productivity
In order to identify our targets clearly, we look again atthe energy flow diagram of Chapter 3, Volume II, whichwe show again as Figure 6-3. These data are from 1971arid the absolute values have changed. The 1974 com-parable total (minus raw materials made from energyfuel) was 17.1 Q Calories. The percentage distribution,however, is roughly similar.
The targets stand out. Of the 4.3 Q Calories used bytransportation, 3.8 Q Calories were wasted, 2.7 out of4.9 Q Calories were wasted in industry and 1.1 out of 4.1Q Calories were wasted in the residential and commerdal sector. Another prime target is the generation ofelectricity, 2.5 out of 3.9 aCalories are lost there. Ourstrategies, therefore, have the highest potential of return in transportation and industry, but we will not ne-glect the residential and commercial sec,..4 because weexpect to find some easy target., the:. e. In all sectors wewill look for ways to reduce the consumption of electricity. Every kilowatt-hour we turn off at the point of con-sumption saves 2 kilowatt-hours equivalent of primaryenergy back at the plant.
Energy Efficiency in Transportation
With an efficiency of utilization (see Figure 6-3) ofabout 12 percent and an appetite that accounted for aquarter of our total energy in 1973, transportation is a fattarget.
There are two basic purposes to transportation: tomove people and to move things. We will also break itdown for our study into two further categories, intercitytransport (trips greater than 100 miles) and urban trans-port. This gives us four categories. urban passengertransport (UPT), intercity passenger transport (`ICPT),,urban freight transport (UFT), and intercity tretght trans-port (ICFT).
We examined the historical record of energy con-tumption in these four categories in Chapter 3, VolumeII (Figure 3-4). Let us now examine the efficiency withwhich that energy is used.
Moving people: The Job of moving people consumes60 percent of transportations total energy. As we see inFigure 3-4 of Volume II, urban passenger transportkUPT) uses about 40 percent more energy than intercitypassenger transport (ICPT). In Figure 6-4, we comparethe total passenger miles traveled in the two forms. Herethe picture is reversed, ICPT accounts for 60 percentmore passenger miles than UPT. This provides a hint ofinefficiency.
A second suggestion can be formed by lookingclosely at the growth of the two curves. Energy use is
FIGURE 6.2
Potential Energy Saving of Emergency Conservaticin Programs (assuming complete 100% cooperation)
.3MLit.4s
Per Day
r3
O 2Mbbls -
0Per Day
C
21Mbbls.Per Day
C
a
/50-MPH Speed LimitReduction of Ugh
Shut Oil Fur Pilot Lights in SummerRange Over(Pilot Whit// Increase Aircraft Load Factors from 50% to 65%
2',. Incrt4se trk IrMuStry Enerco,Utilization
Increase gy 1 (from 1 3 to 2 3)Average Number of Commuters in Autos
Cold Water Washing
Mandatory Auto Tune-ro
Commercial Building EnergySorings (heating ,nil tightins)
Reset Thermometers 3W.nter Si,ongsSummer &Wings
450.000100 000
0 30 60 so
1
120 150 180 210 Time (in days)
Source. "Project Independence Report," Federal Energy Administration, November 1974, Figure 1-1.
67

increasing more rapidly than passenger allies. (This isconsistent with the decline in automobile miles per galIon which we showed in Figure 3 10, Volume IL) We aredriving more miles each year but getting fewer milesper gallon.
There are several strategies which could be used toimprove the,efficiency with which we move people. Wecould improve engine efficiency. we could increase loadfactors (put more people in each car, bus, or airplane),or we can switch from low to high-efficiency modes.
In order to compare the efficiency of the variousmodes of passenger transport, we need to define amore meaningful measure than miles per gallon. Wechoose what we call "energy intensiveness" (El), whichfor passenger transport is in Calories per passengermile. We show in Figure 6-5 a comparison of the El for anumber of modes of passenger transport. We see agreat range of Els from the loaded VW microbus to theyacht. We also see a pattern in ,vhich speed and convenience bring inefficiency (higher Els). Here as elsewhere, "haste,makes waste. What is also instructive isto look at the historical record of the change in the Els ofthe important passenger modes of travel. These areshown for ICPT and UPT in Figure 6-6.
From the data we have now assembled, we seesomething of the problem and some suggestions forcures. All El's except that of the railroad have beenincreasing. (The switch from steam to diesel improvedrailroad efficiency.) The final comparison needed is of
the percentages of the passengers carried by the majortransport modes. This comparison is given in Figure6-7. In both cases, the high El modes are increasingat the expense of the low 0 modes. Air travel is increas-ing in importance in ICPT (rising from 2 to 10 percent)while bus and rail traffic decline. The automobile takesover from the bus in UPT.
We could, therefore, cut down on energy use in trans-portation by improving (lowering) the El of the dominantmode (the automobile), by improving its engine effi-ciency, by shifting people from automobiles and air-planes to buses or trains, or by increasing the load fac-tors (the percentage of capacity carried) of transportmodes. Let us look briefly at potential savings fromthese possibilities.
Switch from high to low El modes. We show inTable 6- 1 the benefits of some rather modest shifts ofpassengers from high to low El modes. Of particularinterest is the shift from automobiles to walking or bicycl:rig. Both of these latter modes are essentially zero El,they use that human energy we can usually afford toexpend. We show, in addition to savings per billionpassenger miles and total savings at 1970 leve)s ofoperation, the percentage of the 1970 energy consump-tion which could have been saved. It amounts to arespectable 2.2 percent.
Increasing load factors. We could reduce energyconsumption in transportation by increasing the load
.
FIGURE 6.3"Nom: 'nate Flow of Energy Through the United States Economy, 1971, in Q (1015) Calories
147
(GROSS
PRODUCTION CONSUMPTIONPower 01t
E',4,9YloitmOtrwetonand Trensmshon of ErKtn.c.ty
END-USE CONSUMPTION
fttroletimA,4Natural 6as
45
CAOOM44
M450,477
5 .
Household and Conwee4414d
1.'40590,1"C.43
lMUltrrdE43 22
102
58
Source: Earle Cook, Texas A&M University
68'

FIGURE 6-4Passenger Miles Traveled in Urban Passenger Transport(OPT) and Intercity Passenger Transport (1CPT)
1,000
500
MIMMM..wrwr.wmrwrr.rMwO
ICPT
mm.
UPT
4
1950 1960
Year
1970
Source. -Transportation Energy Use and Conservation Potential,Eric Hirst, Science & Public Affairs, XXIX (36) Novem-ber 1973.
factors. For automobiles in UPT, for instance, the loadfactor is 28. This means that on the average a5-passenger car carries 28 percent of its capacity (1.4persons).
Increasing average load factors is the goal of prop-aganda for car pooling. A 10 percent increase in theUPT load factor, from 28 to 38 percent (from 1.4 to 1.9persons, per car), would reduce the average El for theurban automobile (see Figure 6-6) from 2,050 Caloriesper passenger mile to 1,525 Calories per passengermile. At the 1970 level of urban travel 690 billionpassenger miles this small change would have saved0.36 Q Calories of energy 8.8 percent of the totaltransport energy.
Significant savings could be attained in ICPT by in-creasing the load factors in airplanes. In 1971, after aneconomically disastrous year, three airlines were per-mitted to meet together and plan overall schedule re-ductions between several cities. The reductions in-creased the load factors from an average of 39 to 54percent. Savings of $e,5 million and 120 million gallonsof fuel were reported for the year's operation. If the CivilAeronautics Board's goal of an industry-wide goal of 55percent load factors is attained, 800 million ,gallons offuel would be saved.
In Table 6-2 we show the savings of a variety of loadfactor changes, and the energy these changes wouldhave saved at 1970 levels of operation. The biggest
FIGURE 6-5Transportation Energy Efficiency
Number ofPassengers
OBSOLETE SYSTEMSS S "Queen Mary" 1.6001930 V.16 Sedan 21850 Steam Train 80Double-deck Urban Bus 20
CURRENT SYSTEMSCabin Yacht '4Helicopter . 24Automobile turban use) 1
Corporate Jet 8Modern Cruise Liner 1,250Pullman Train 100DC-8 Jet 78DC 6 Jet 33Jumbo Jet (13.747) 210Taxi 3Airbus (DC.10) 180Automobile (average use) 2Private Plans 3
Urban Bus (noon) 12
P C C Street Car (noon) 36Volkswagen "beetle" 2Motorcycle (5 h p 1 1
London Manchester Train 400Two level Commuter Train 1,200Highway Bus 22Motorcycle h 1(2 p)Volkswagen Microbus
SOME PROPOSED SYSTEMSUS SST 150
482W- m p h TACVTilt wing VTOL 48Urban Monoraa lone car) 20
I1.000 2.000 3.000 4,000 0,000
it a i /j a
fiSiESMESMI
c mss_
-20
1.000 2,000
Calories Per Passenger Miles
a
3,000 4.000 8.000
note change in scale
Adapted from "System Energy and Future Transportation," Richard A. Rice, Technology Review, January 1972.
69

rts
FIGURE 6-6Energy Intensiveness of Passenger Transport ,
t
2,000
7.4.! 1,500
QOfC0.I.
wU,totoZ 1,000w> -F/5ZwiZ>-L7CCtoZto 500
0
1950 1960
Year
2,000
1,500
1,000
5001
we
r----URBAN AUTO
.00,__e e___.
AVERAGE El
.00
lama
Nom
UPT
URBAN MASS TRANSIT
i0
saw
MN
MOM
1970 1950 1960
Year
1970
Source. "Energy Consumption for Transportairon in the U.S.," Eric Hirst, Oak Ridge National Laboratory, ORNL NSF EP 15.
!CPT: intercity passenger transport, UPT: urban passenger transport.
TABLE 6-1Energy Savings from Shift of Passenger Traffic from Hi h to Low El Mode
Transport Mode Savings per Billion Total Savings Percent of 1970
Shift" Passenger Miles at 1970 Level US. Total Energyla)
20% UPT, Auto - Bus 1.1 x 10'2 Cal. 15 x 10" Cal. 0.9
5% UPT, Auto - Bycycle, 2.05 x 10'2 Cal. .47 x 1015 Cal. 0.4Walking
20% ICPT, Auto - Bus .45 x 10' 2 Cal. .09 x 10' 5 Cal. 0.520% ICPT, Auto - Train .15 x 1012 Cal. .03 x 10' $ Cal. 0.2
20% ICPT, Air Train 1.4 x 10¹² Cal. .03 x 10' 5 Cal. 0.2
UPT: urban passenger transport, ICPT: intercity passenger transport.
(a}Taken as 17 x 10' s Calories.
70kc)

savings, of course, come from changes in the au-tomobile travel pattern. Car pooling has been difficult toimplement, so far, but during the World War II gasrationing the average number of passengers per au-tomobile increased from 2 to 2.7. Also, the embargoemergency did cause an increase of a few percent inurban bus loads.
improving engine efficiency: The most straightforward way to save energy in transportation is to improve
engine efficiency. We have all become aware of therange in efficiency as measured by miles-per-gallonperformance. A selection of the EPA (EnvironmentalProtection Agency) mileage test results is shown inTable 6-3.
The FEA, in its massive energy study Project Inde-pendence," examined the gains to be expected if im-prov ement of average gasoline mileage from 13.5 MPG(miles per gallon), which was typical of .1972 cars, were
TABLE 6-2Energy Savings from Load Factor Increases in Passenger Travel
Transport Mode Load FactorChang.
Savings per BillionPassenger Miles
Total Savingsat 1970 Levels
Percent of 1970US. Total Energy(b)
UPT Automobile 28(0)-38 .65 x 10'2 Cal. .36 x 10" Cal. 2.2UPT Automobile 28-50 .90 x 1012 Cal. .62 x 10" Cal. 3.7UPT Bus 20 (0)-30 .32 x 10'2 Cal. .07 x 10" Cal. 0.4UPT Bus 20-50 .57'x 10' 2 Cal. .12 x 10" Cal. 0.7ICPT Airplane 40(0)-50 .42 x10" 2 Cal. .05 x 10" Cal. 0.3ICPT Airplane 40-60 .70 x 1012 Cal. .08 x 10" Cal. 0.5
UPT: urban passenger transport, ICPT: intercity passenger transport.
(0)These are approximate present levels, 28 means 28 percent full (1.4 passengers in a 5.passenger auto).(b)Taken as 17 x 10'2 Calories.
FIGURE 6.7Composition of Passenger Transport
100%
10%
Sharing of Intercity Passenger Travel, in Percent Sharing of Urban Passenger Travel, in Percent
1950 1960
Year
Source' "Energy Consumption for Transportation in the UO.," Eric Hirst, Oak Ridge National Laboratory, ORNLNSF-EP-15.

I I
increased (by mandatory legislation, for instance) to 20MPG in 1980. They estimate that such a measure wouldsave 0.25 Q Calories in 1980 (if oil prices are about $7per barrel) and 0.67 Q Calories in 1985. These savingsare respectively f and 2 percent of the total energyconsumption projected for those years (Figure 4-18,Volume II).
There is, of course, always the hope that Detroit willsee the light (or perhaps "see the darkness" is morefitting) and come out with energy-efficient cars without alegislative push. The record of increasing car weightsdoes not support this hope. The enormouainvesImentnecessary to make design changes assures thatchange will be slow in coming.
Moving things: In Figure 3-4, Volume II we show thegrowth in the energy consumed in frP'oht transport.Thera is also wide variety in transport modes and in theEls of that transport mix. We show the Els of the mostimportant modes in Figure 6-8. The advantage of water
TABLE 6-31974 Gas Mileage from EPA Suburban/Urban Test Cycle
Model Manufacturer Might Class MPG
Civic Honda 2,000 29.1Corolla-1 sedan Toyota 2,000 24.8Datsun 13210 Nissau 2,250 24.9Super Beetle V.W. 2,250 20.9
- Fiat 128-sedan Fiat 2,250 17.4V.W. Stationwagon V.W. 2,500 23.7Opel 1900 Opel 2,500 18.2Vega Hatchback Chevrolet '2,750 24.6Dodge Coltwagon Mitsobishi 2,750 22.8Pinto Ford 2,750 '22.8Mazda RX3 Wagon Toyo Kogyo 2,750 10.8Mustang Ford 3,000 20.1
Datsun 2607 Nissau 3,000 16.1
Volvo 144 Volvo 3,000 16.1
Gremlin American Motors 3,000 15.9Maverick Ford 3,000 15.0Plymouth Compact Chrysler- Plymouth' 3,500 16.7Nova Htachback Chevrolet 3,500 15.2Javelin American Motors 3,500 13.2
Torino Ford 4,000 14.0Pontiac Ventura GM-Pontiac 4,000 9.9GTO GMPontiac 4,000 8.9Matador American Motors 4,500 10.0Cutlass S GM-Oldsmobile 4,500 9.5Plymouth Intermed. Chrysler-Plymouth 4,500 9.2Cougar Ford 4,500 9.5Ford Ford 5,000 10.7Lesabre GM-Buick 5,000 10.4Plymouth Chrysler-Plymouth 5,000 10.4Silver Shadow Rolls Royce 5,000 9.3Chrysler Chrysler-Plymouth 5,000 9.1
Bonneville GMPontiac 5,000 7.8Eldorado Cadillac 5,500 10.4Buick Estate Wagon GMBuick 5,500 9.6Ford Station Wagon Ford 5,500 9.5Chrysler Wagon Chrysler-Plymouth 5,500 8.9Lincoln F 5,500 7.9Toronado GM-Old bile 5,500 6.8
Source: "1974 Gas Mileage Guidemental Protection Agency, Febru
72
or Car Buyers,' U.S. Environ-y 1974.
freight transport over land is apparent, and we see againthat we buy speed and door-to-door delivery at theexpense of energy. The historical record of the percen-tage of ICFT carried by each mode (we do not have dataon UFT), Figure 6-9, shows the increasing importance
FIGURE 6-8Efficiency of Cargo Transport
Pipeline
Inland Serge Tow
15,000 -ton Containershio
100,000-ton Supertanker
200-car frinceit Train
100car Fie !phi Train
404ai Fteight Train
3
Turboprop Ali Ftwento,
165-ton Hovercraft
Small Cargo Jet 17071 1
Large Caw Jet 1747/ I 1
60-ton Helicopter
20 ton HtlicoPter
404on Track1 10 100 1,000
Ton-miles per gallon
Source: "Energy Consumption for Transportation in the U.S.,"Eric Hirst, Oak Ridge National Laboratory, ORNL-NSF-EP-15.
FIGURE 6-9Composition of Intercity Freight Transport
100
80
60
40
20
10/
0.2 .
Pipeline and Waterway
Rail
Truck
.15%
Air0
1950 1960Year
1970
Source. "Energy Consumption for Transportation in the U.S.,"Eric Hirst, Oak Ridge National Laboratory, ORNL-NSF-EP-15.

of the inefficient (low El) modes, in particular the growthof air freight.
In looking for conservation strategies in freight trans-port we find even. more inflexibility than we did in pas-senger transport. Some loads can't be shifted (you can'tship automobiles by pipeline nor would you want to shipoil by airplane) It has proved difficult even to get truck-ers to reduce speeds. The changes that are most practi-cal are to shift some trulk freight to train and sqme airfreight (the lowest El mode) to truck or train.
A summary of savings which could have been ob-tained at 1972 levels of energy consumption is shown inTable 6-4. Only the savings in the truck-to-train shift arebig enough to be significant. Air freight, however, isgrowing rapidly, and the same shift in 1980 would save(at the estimated rate of growth) 10 times the amountshown in Table 6-4, or 0.10 Q Calories.
Lowering the Home Fires
In the residential-commercial area there are alsotargets for energy conservation, even though the overallefficiency of this sector is fairly large (we compute 73percent from the data of Figure 6-3). This combinedsector consumed about 6 Q Calories of energy in 1972,32 percent of the total. Most of this energy, 70 percent,was used in residential buildings, the rest in commercialones. We provide in Chapter 3, Volume II, the details ofthe distribution of this energy among various end-uses.This can be summarized as follows:
57 percent for space heating and air-conditioning33 percent for equipment and appliances (includ-
ing cooking, wiater heating, and -office ap-pliances)
10 percent for lighting
This breakdown gives us our targets and even sug-gests strategies. reduce heating and cooling, makemore efficient appliances, and lower lighting levels. Wewill look at the range of energy-conserving actions thatcan be taken in each of these areas.
Heating and cooling: There are several differentbut parallel approaches that can be taken to save someof the energy used to heat buildings in winter and coolthem in summer. The change in the thermostat settinghas been discuised. A second approach is to improvethe insulation and sealing of the house to prevent theescape of heat (or its entry in summer) through roofs,
windows, and cracks. There is also energy to be savedby changing the type of heating device, from electricresistance heating to gas,or to a heat pump, for in-stance.
Thermostat lowering is the least expensive changeand saves not only-energy, but money. There are sev-eral other rather simple and inexpensive things thehomeowner (or the commercial landlord) can do to de-crease energy consumption, these are listed in Table6-5. Also shown are the expected energy savings ifthose actions were to be taken by all homeowners in1977.
COuntryWide compliance would save 0.37 Q Calories.The FEA projects that heat energy, on the average, willcost $9 per million Calories in 1977 (with $7 per barreloil). Thus, there would be expected $3.33 billion savedby lowered heating bills froin that action alone. If 70percent of this savings is in the residential area and isspread among the 73 million homes (1977 estimate),the savings would be about $320 per home. From thesimple thermostat change enough money should besaved to pay for the minor tune-ups, etc., which are alsosuggested in Table 6-5. These in turn will save moreenergy and money.
. Improving insulation: Similar large savings inenergy can be obtained by reducing the percentage ofenergy used to heat and cool the outdoors. Some ideaof the size of this "heat leak" is given by the followingstatistics:2 An average home (one of 1,600 square feetof floor space and located in an average climate, suchas St. Louis), if completely uninsulated, uses 1,600 gal-lons of fuel oil per year ,forheating. Full insulation, 6inches of insulation in the ceiling and 31/2 inches in thewalls, reduces the consumption to 900 gallons a year, a
'45 percent saving.The attic is a prime target, it is usually accessible and
about half the heat is lost there. A reasonably handyhomeowner can insulate it himself at a cost of around$150 and fuel savings will return the cost plus 'in-terest in under five years.
Another large heat loss in homes and other buildingsis by air cracks around doors and windows. Storm doors
2Taken from testimony in -Energy Conservation." Hearings beforethe Subcommittee on Consumer Economics of the Joint EconomicCommittee of the U.S. Congress, November 19, 1973 (pp 54-79).
TABLE 6-4Energy Savings from Shift of Freight Traffic from High to Low El Mode
Transport Mode" Savings per BillionShia Ton miles
Total Savingsat 1970 Level
Percent of 1970US. Total Energy(s)
20% 1CF, Truck - Train20% ICF, Air - Truck20% ICF, Air - Train
.5x 10'2 Cal.9.6x 10'2 Cal.
10.1 x 10' 2 Cal.
.21 x 10' 5 Cal.
.01 x 10' 5 Cal.01 x 10's Cal.
1.3
ICF: intercity freight transport.
fah7 x 10' s Calories.
, 73

and caulking can thus give significant returns. The po-tential savings (in 1977) of these kinds of investments inpresent houses are shown in Table 6-6. The total costper home in the FEA Project Independence estimate is$600. The savings in the one year, 1977 (based on theestimated 73 million homes and $9 per M Calorie),amounts to $370 per home, more than half the cost.
The inefficiency of electric resistance heating: Aconversion which would be more difficult to undertake,but which would conserve a considerable amount ofprimary energy, would be to replace electric resistanceheating by gas (or oil) heat. Electric resistance heatingis 100 percent efficient at the point of use, but as we seein Table 3-17, Volume II, its system efficiency- is only25 percent compared to 53 percent for oil and 70 per-cent for gas.
We can realistically only expect to make a differencein new homes. The number of new homes to be heatedelectrically is expected to grow from about 4 million in1970 to 10 million in 1980 (see Figure 3-3, Volume II).The average home heating unit used 14,000 kilowatt-hours in 1970. With conversion losses and transmissionlosses included, each kilowatt-hour requires abOut2,500 Calories for its generation. The 6 million electricheaters added between 1970 and 1980 are, therefore,projected to use 84 billion kilowatt-hours of electricity and210 T Calories of primary energy in 1980. If replaced by70 percent efficient gas heaters, the energy equivalentof the 84 B kilowatt-hours could be obtained from 100 TCalories of primary energy. In just the one year, 1980, atotal savings of 110 T Calories could be attained. Thiswould amount to about 5 percent of the projected totalenergy used for residential heating in that year.
At first glance it may not seem reasonable to replaceelectric energy with gas or oil, both of which are in shortsupply. Gas and oil, however, are both used to produceelectricity. What's being examined here is the systemefficiency of converting their energy to heat, then toelectricity, and then back to heat again. We have, ofcourse, oversimplified the problem. electricity comesfrom a variety of sources, and it is not possible toguarantee that gas-heated homes will replace gas
generated electricity. The calculation, however, doesproject a large enough savings to make the reduction ofelectric resistance heating worthy of consideraticih
There is an interesting alternative form of heatingwhich could use electricity more efficiently the heatpump which we describe in Chapter 3, Volume II, AFeat pump, on the averc.2e, delivers 2 units of heatenergy for each 1 unit of elec;ical energy input Since 3units of fuel energy are required at the power plant foreach 1 unit of electrical energy produced, the overall officiency of the heat pump of two-thirds, or 67 percent, isabout the same as for a home gas heater. The FEAestimates that new homes which install heat pumpsinstead of electric resistance heating could save 35percent of their annual heating,bill.
Heat pumps have had maintenance troubles, andthey are more expensive than resistance systems. Theyhave the added advantage, however, of providing airconditioning in the summer, another of their positivefeatures that should lead to growth it this form ofheating and cooling.
Lighting: About 1 Q Calorie of total energy is used inlighting, 20 percent of all the electrical energy There isconsiderable evidence that,much of this lighting energyis wasted, that too much light is used in many commer-cial areas in particular. Lighting standards have steadilyincreased in the past two decades. Recommendedclassroom levels have risen from 20 footcandles* in1952 to 60 in 1971, library lighting from 20 in 1952 to 70in 1971. Commercial lighting has similarly risen and, inaddition, the theory of "no-contrast lighting" has oftencaused these levels to be applied to non-working space
The Federal Government has shown the way in thisarea by applying what is referred to as the "50.30-10standard" (50 footcandles at work stations, 30 footcan-dles in work areas, and 10 footcandles in corridors andhallWays). Application of these standards to Federalbuildings in 1973 reduced consumption 20 to 40 per-cent. If such a standard were applied to the country as awhole, 0.33 Q Calories per year could be saved in 1980,according to the FEA Project Independence estimate
Reduced lighting has a double conservation benefit incommercial buildings. Not only is energy saved directly,
TABLE 6-5 -
Potential Energy Savings From Low-cost MeaSuresPrimary Energy Saved (in Q (1O' '1 Calories)
'A footcandle is the traditional measure of light intensity
TABLE 6.61977 Potential Energy Savings From Homeowner
Investment (in CI (10" 1 Calories)Thermostat Setback Heating (68 day/60 night) .37
Water Heating (120) Type of Investment 1977
Air-conditioner (78) .03
Reduce Hot Water Use by 1/3 .12 Insulate Ceilings of Existing Buildings .18
Furnace Tune-up .15 Weatherstrip and Caulk Existing Homes .08
Air-conditioning Tuneup .23 Install Storm Windows and Doors on Existing Homes .03
Total 1.05 Total .30
Source. 'Project Independence Report, Federal Energy Adminrs Suurce. "Project Independence Report," Federal Energy Admin:stration, November 1974, Table AIII-12. tration, November 1974, Table AIII-11
74 It -7)

but an additional 10 percentoor so is saved by reducingthe load on the air conditioners. Many buildings need airconditioning just to rtmove the heat energy released intheir overlit space. d
Appliance inefficiency: There is a host of targetsfor energy savings among the appliances. Theee rangein importance from large to small, but among themthey account for about 8 percent of United Statesenergy consumption. We show, in Table 6-7, the esti-mated total energy consumed by each of the majortypes of appliances.
Water heeting is the largest category, and typicalsystem efficiencies in this sector are low (see Table3-17, Volume II) The Project Independence estimate isthat the efficiency of ^a 40-gallon water heater (costing$120). couid be improved considerably by an additional$15 expense (bringing electric heaters to 26 percentand gas heaters to 67 percent efficiency). This invest-ment would be expected to pay for itself in a year.Overall energy savings would be 0.02 Q Calories in1977.
TABLE 6-7Appliance Energy Consumption, 1970'(in Q (10"1 Calories Per Year)
Residential Energy
Water Heaters 0.44'Gas 0.26 '/Electric 0.18
Refrigerators 0.19
Ranges 0.17Gas 0.09Electric 0.08
Television 0.11
Room Air-conditioners 0.09
Clothes Dryers 0.06Gas 0.02Electric 0.04
Freezers 0.06
Other 0.03
Total Residential 1.15
Commercial
Refrigeration 0.09Hot Water 0.03'Miscellaneous 0.12
Total Commercial 0.24
Total Appliances 1.37
Source: "Project Independence Report," Federal Energy Admin-istration, November 1974, Table,A111-16.
clothes washers 10%, dishwashers 5%, sinks, bathing etc. 85%
There are similar small savings to be gained fromimprovements in other appliances. Freezers could bebetter insulated. Frost-free models use 11/2 times asmuch energy as standard models. The replacement ofthe pilot light with electric ignition devices has beensuggested and improvement in oven insulation couldsave energy used in cooking. Pilot lights use i5 -30percent of the gas used in gas cooking ranges.*
Room air conditioners are also a prime target. Theirefficiency, from the least to the most efficient model,varies by almost a factor of 3. The least efficientmachine uses 2.6 times as much electricity as the mostefficient to provide the same amount of cooling. Consid-erable improvement can be made for a 10 to 20 percentincrease in the cost, with resulting large savings overthe life of the device. As an example, if a 12,000 BTUroom air conditioner selling for $250 is made twice asefficient, its initial cost would be about $290. The sav-ings in operating cost (electricity) are estimated at $23per year.
A summary of the energy that can be saved in thear?pliance area by modifications such as these is pro-wled by Table 6-8. The total of 0.27 0 Calories is about1 aercent of the projected 1977 Total consumption in theresidential-comm4rcial category.
Savings in the Industrial Sector
Tha industrial sector consumed 5.9 .0. Calories in1972 at an efficiency of 55 percent. Thus, the amount ofenergy and the low efficiency recommend that wefocus some attention in this sector.
In Tables 3-11 and 3-12 of Volume II, we display thebreakdown of this energy use by fuel, and also show itsdistribution among the Si:: most energy-intensive indus-tries. The primary metals industries are the big users,followed by chemicals (and allied products) and pe-troleum.
There are some general prescriptions that can beapplied to all industry. In addition to the ones that were
Not all of this is wasted If the house is being heated, the pilot lightcontributes usefully.
TABLE 6.8Energy Savings from IncreasedEfficiency (in Q [10' ] Calories)
Appliances and Equipment 1977
Increase Room Air-conditioner Efficiencies .01
Increase Refrigerator/Freezer Efficiencies .04
Retrofit Electric Ignition for Furnace Pilots .10
Electric Ignition in New Furnaces and .01
Better Insulated New Water Heaters (4.71 .02
Improve Efficiency of Other Appliances .04
Total 0.22
---Source: "Project Independence Report," Federal Energy Adminis-tration, November 1974, Table A111-17.
75

described in the previous section thermostat set-back, insulation, turning off hea in unoccupied space,and reducing ventilation the others that have beenrecommended are. burning of combustible waste (drainoil, sawdust, etc.) for heat, recirculating furnace wasteheat for preheating, improving furnace controls, etc. Toconserve electrical energy it is recommended that light-ing levels be reduced (we described the 50-30-10 stand-ard earlier), that loads be shifted toward off-peakhours, by starting air-conditioning or heating early inthe morning, and shutting it off before closing, .or byshifting working hours themselves.
In addition to these general ones, there are somespecific conservation targets. New production technol-ogy in the steel industry offers hope of energy efficiencywhich may reduce the overalllenergy required for s eelproduction by 20 percent in 1985. There energylc\ besaved in the petroleum refining operations, `chieflythrough better equipment maintenance and through re-cycling waste heat: Again, the FEA estimate is 20 p4-cent reductjon per processed unit by 1985.
In the plastics industry energy is an unusually impok-tent input. It takes a large amount of energy to make theproducts (see Table 3-13, Volume II), and the raw marterials are generally petrochemicals derived from oil orgas. For these reasons, this industry is much moresensitive to the cost of energy than are others. Thesharply rising costs are creating strong incentive, notonly to develop new processes, but also to reduce pro-duction of the most energy-intensive plastics, and toshift from petrochemicals to feedstock materials madefrom coal. The FEA estimates consumption in thisgroupof industries can be reduced 25 percent by 1985.
ti
The food processing industry uses 5.6 percent of thenation's total energy. The major savings achievablethere are through better heat management, the use ofheat pumps to generate heat from waste hot water, forinstance, and the burning of waste to generate heat.The FEA sees a 35 percent saving by 1985 as realistic.
In the paper products industry there are countertrends. The need for better pollution control is increas-ing energy use as_is the increasing demand forbleached products and the decreasing use of recyclednewsprint. These have been balanced somewhat by thedevelopment of more efficient processes. If recyclednewsprint were used instead of virgin material, up to 30percent of the, energy consumed could be saved. TheFEA estimate is for a 35 percent reduction by 1985.
There are also savings possible in the ement indus-try, which uses a large amount of fossil fu energy in itsdrying kilns. There are several techniques which couldsave energy in this process. heat recovery systems,more insulatiOn on the kilns, etc. Energy savings of 35percent are projected.
Aluminum is a particularly energy-intensive product,18.8 M Calories per ton compared with 6.5 M Caloriesper ton for steel. Since most of this energy is electric, theactual consumption of primary energy is almost threetimes as large 42 M Calories per ton. We are currentlyimporting energy in this area since we import both the
76
raw material, bauxite, and raw aluminum that has beenprocessed elsewhere. This practice will probably con-tinue. New refining and processing procedures underdevelopment may bring about a 25 percent overall re-duction by 1985.
The food cycle, from farm to table, uses 12 percent ofthe nation's total energy. (It provides, however, onlyabout 4 percent of the total as food energy.) The farmoperator accounts for about half the 'total.* The majordirect energy uses in agriculture are fuels for equipmentand fertilizer.
Farm equipment is going diesel in order to take ad-vantage of the higher efficiency of diesel engines, theyuse 27 percent less fuel fpr the same amount of work. By1980 the percentage of diesel tractors is expected tohave risen to 57 percent and by 1985 to 75 percent from40 percent in 19741
There are other energysaving practices available.Plowing is being reduced, multipurpose equipment isbeing used to reduce the number of trips over the fields,and the use of natural fertilizers (compost and animalovastes) haS energy advantages. There is even a returnon some farms to windmills forwater pumping. All-in-all,a.saving of 20 percent is hoped for in this sector.
Recycling and waste recovery: Importantstrategiesfor industrial energy conservation are the useof waste materials as file's and the replacement of virginmaterials by recycled materials.
We discuss the potential for generatingenergy from waste in Chapter 7, Volume II. The utiliza-tion of the techniques described there could have pro-duced about 0.21 Q Calories of energy in 1971 (thisassumes burning only municipal waste in the large met-ropolitan areas).
Certain of these v.astes are even more valuable ifrecycled. Recycling a ton of aluminum, for instance,saves eight-ninths of the total energy, a saving of 37 MCalories per ton. Recycling iron saves 3 M Calories perton. Recycling paper'is also energetically useful, as wehave said, although this energy gain is somewhat offset'by the loss of energy which could have been obtained byburning it. (The environmental analysis obviously favorsrecycling.)
A much publicized form of recycling is the use ofreturnable containers instead of "throw aways." TheSize of the savings realizable here is given by the calcuration that 0.06 Q Calories of energy could have beensaved in 1972 if all beverage containers had been refillable and had been refilled at least 10 times.
In most of the previous sectors we have' providedestimates of the total energy savings believed,possibleby 1985. They total to about 4 Q Calories, about 12percent of the projected 1985 consumption in the indus-trial sector. Table 6 -9 gives the realistic expectations of
'Here we arelimiting the discussion to direct energy while in Chap-ter 5 our discussion of energy use in the food system included indirectenergy

Federally stimulated conservation strategies in this sec-tor. The Federally assisted program (the FEA 'Conven-
t tional Option," Project Independence Report) achieves10 percent of these potential savings, or 0.4 Q Calories,in 1985.
Elettric UtilitiesMany of the conservation strategies we have just
described save electric energy. There is a bonus in thisconservation. Each time electrical demand is reducedby one kilowatt-hour, three kilowatt-hours worth ofprimary energy is left unburned at the power plant.
In addition to the frontal attack on electric energyconsumption, we could save primary fuels by smoothingout the peaks and valleys in the demand. (We show asample of the fluctuating weekly load in Figure 6-4,Volume II.) The fluctuations in the demand for electricity,which occur on an hourly, daily, weekly, and even sea-sonal basis, are rather large. Average demand is onlyabout 60 percent of peak demand. To provide for thatpeak demand a variety of generally less-efficientgenerating systems is used (see Chapter 6, Volume II,for details). Any change that would lower these peaksand thus allow more reliance on the more efficient base-load generators (the large fossil-fuel and nuclear-powered plants) could save significant amounts ofenergy. A 10 percent reduction in peak load would save0.065 Q Calories at 1985 energy levels.
There are several parallel approaches that could helpsmooth out demand. The customer's aid could be en-listed by developing a rate structure keyed to load;off-peak power would be sold for less. This approachwould call for the development of meters which wouldstore more complicated information and perhaps alsocontain a simple signal mechanismihat would tell theuser the demand level and, thus, the price of the electric-ity at any given time ( Don't use your dryer when themeter light is red").
TABLE 6-9Possible Energy Savings in the IndustrialSector (in Q [11;)" I Calories)
Strategy
13 Calories
(1980)Saved
(1985)
Industrial Investment in Energy Con-serving Technology-(with Federalresearch, development, and demon.stration) 0.125 0.275
Solid Waste Recovery Systems (technicalassistance from government) 0.040 0.095
Reusable Containers and Packages(steppedup information to states) 0.005 0.010
Total 0.070 0.380
Source: "Proiectlndependence Report,- Federal Energy Adminis-tration, November 1974, Table AIII-21.
The utilities themselves can cooperate to fedu...epeaking by interconnecting systemk with different demend characteristics. Boston Edison, for inbtant.e, hasa summer peaking problem, while Greet. Mountasi.Power, in Burlington, Vermont, 200 miles away, has asharp winter peak. Regional power pools to meet theseproblems are becoming more and more routine
The third leg of the approach we have already de-scribed; peaks,could be flattened if peak energy coiaitbe stored and then used dunng valleys v'Ve CirsCuSSI
some of the existing and potential systems for storingelectrical energy In Chapter 6, Volume II.
The potential for conservation; a summary: In themassive Project Independence Report the FEA has putforward several of the conservation strategies we describe in the previous sections. Their analysis of theresults of these programs is indicated in Figure 6 10We also show the projected total consumption in thoseyears and the percentage Of the total projected consumption which these savings represent. Currentgrowth rates of energy consumption are 3 to 4 percerifper year. These savings are appreciable when cornpared -to the expected growth.
The data pictured in Figure 6-10 are displayed in Table6-10 along with brief descriptions of the type of government and private actions necessary to achieve suchsavings. We will finish this chapter with a discussion ofthese and the other mechanisms economic and patical which may be necessary to bring about theenergy-conserving practices whose results we havebeen estimating.
The Means of ConservationWe have spz,,nt our words, so far in this chapter, in a
description of the various energy conserving modifiztions which may be needed in our system They are of alltypes. Some are essentially nondisruptive lowering-thermostat settings and speed limits are essentially ofthis type while the switch from the convenient per-sonal transportation of the automobile to less energy-intensive mass transportation might cause some disrup-tion of lifestyle. Some of the modifications could beaccomplished at no initial cost, they, in fact, save moneywhile others require an initial investment, at least, be-fore any savings occur. They all have one feature Incommon., None will occur spontaneously A variety ofmechanisms will need to be set in place in the complexworkings of our society to bring them about
What are the mechanisms that can cause individualsand co lorations to adopt one or the other of thestrategies we have just descnbed? There are severalbut the bulk fall into one of the following categoriesmarketplace pressures, government assistance and in-centive, and government regulation The final mix ofthese mechanisms this country chooses will form theskeleto.i of that rare beast, an "Energy Policy Thedesign of that beast is now under way in hundreds ofgovernment offices and corporate board rooms If weare to contribute as informed citizens to that design. we
77

FIGURE 6-10Savings from Conservative Policy Options for S11 Oil
1.75 so
1.50 4.
tit1,25
CD
CI 1.0
cn
to>-cnL-a)c .75
.50
.25
0
4
/Savings 3% of Tots},/
Savings4.7% of Total
Savings 7.2% of Total
/
/ / .
/ //
/
vitaial
44
1977 1980 198519.0 21.6 25.7
Projected Projected ProjectedTotal Total Total
TOTAL SAVINGSIndustrial
Household &Commercial
25 PercentTax Credit
15 PercentInvestmentCredit
ThermalStandards
Lighting
Appliances
Transportation
FuelStandards
MassTransit& AutoDisincentives
Source: "Project Independence Report," Federal Energy Administration, November 1974, Figure III-2.
78

need to have some insight into the variety and effective-ness of mechanisms available to us.
The Pressures of the Marketplace
It is a canon of a free enterprise society that decisionsshould be made in the marketplace. Only through themyriad of signals that come from the interplay of supplyand demand can we achieve a stable system The pricesystem -so this canon goes should do a better job ofplanning than any "planning committee." Only in themarketplace can it be decided'how much oil is needed,for instance, by determining what the consumer will pay
TABLE 6-10Conservation Actions and Savings At $11 PerBarrel Oil, 1980 and 1985 (in Q [1W s l Calories)
Conservation Actions 1977
$11 Oil1960 1985
TransportationEstablish a mandatory 20 mpg auto efficiency
standard .07 .17 .47
Enact legislation and establish programs thatwould substantially increase the use ofpublic transit and discourage the ineffi-cient use of automobiles, such as a gaso-line conservation fee .21 .22 .31
Total Transportation Sector' .28 .39 .78
Residential and Commercial'Subsidy such as a 25% tax credit for retrofit
of existing homes, expiring in 1980 .07 .12 .21
Subsidy such as a 15% investment credit forenergy reduction investments in existingcommercial buildings, expiring in 1980 .04 .04 .05
National thermal efficiency standards fornew residential & commercial buildings .07- .24
Mandatory lighting standards for commercialbuildings .05 .06 .08
Appliance efficiency standards .01 .05 .12
Total Residential and Commercial Sector 24 .40 .70
IndustrialAggressive conservation programs assisted
R&D for increased efficiency in industrialprocesses .09 .23 .38
Total Net Savings' .60 1.01 1.85
Utilities'Demonstrations in support of adding energy
conservation standards to the FederalPower Act .02 .12 .23
Source: "Project Independence Report," Federal Energy Adminis-tration, November 1974. Table 111.5.
Savings not entirely additive since auto disincentives would inducesome increased new car efficiency.'The gross savings wold be higher since losses due to generation anddistribution of electricity would be included.Savings in electrical generation result from decreasing the fossil fuel
input required to generate the electricity demand in the three end
user sectors.
for it, only in the marketplace can the question of howmuch oil should be produced be answered, by findingout what it costs to produce it. The "marketplace" an-swer to an energy shortage is "raise the price."
It seems clear from our recent experience, as well asfrom sophisticated analysis of economic models, thatthe soaring price of energy will bring some semblance ofbalance, and that the projections of energy consump-tion made in the late 1960s (see Chapter 4, Volume II)already overestimate energy growth. The FEA analysisin the Project Independence Report projects annualgrowth rates of 2.7 and 3.2 percent (depending on theprice of oil) instead of the average of 3.5 percent ofFigure 4-18 (Volume II). (As we have reported, energyconsumption fell by 2.2 percent in 1974.)
Unfortunately the multidimensional problem we de-scribe in this Source Book cannot be handled on asimple supply-demand basis. There are two seriousdistortions of the price system which make the presentenergy price unrealistic. On the one hand energy is
subsidized, while on the other hand there are energycosts (environmental costs, for instance) that are notreflected in the price.
Subsidies: There is a great variety of visible andhidden subsidies which conspire to make the apparentprice of energy to the consumer lower than its real price.Energy for some time has been "expensive except forthe price," to quote Lawrence Moss of the Sierra Club.3
One' type of subsidy has received most notoriety inthe oil business-the depletion allowance and other taxwrite-offs - but such alloWances are working againstenergy conservation elsewhere.
The depletion allowance provides a tax exemption fora portion of the net income received from producing anational resource. These allowances are based on theperceived importance of the energy resource: oil, gaS,and uranium have a 22 percent depletion rate (22 per-cent of the income is exempted); oil shale has a 15percent rate, and coal 10 percent. They are intended toencourage and reward continued production of impor-tant natural resources.
The oil companies have several other tax advan-tages. They, along with other resource producers, forinstance, are allowed to deduct some of the investmentexpenses of exploration and development. Another sig-nificant tax break for the international oil companies istheir ability to write off the heavy foreign taxes on the oilthey produce overseas. Many economists believe thatthese royalties paid to foreign governments should beclassified under expenses. The present provision al-lows them to be deducted from the United States taxesdue on income. This deprives the Treasury and thetaxpayer of several billion dollars.
The net result of these various tax-related subsidies isto make the apparent price of energy lower than thecost. The difference is made up by an assessment on
'Testimony before the Energy Conservation Hearings of the Com-mittee on Interior and Insular Affairs, Part I, Serial *93-7, March 1973,
p. 225.
79

taxpayers, but in hiding it this way, the clarity of the pricesignal is lost and customers buy more energy than theyshould.
There is also a set of hidden subsidies that encourageoil consumption in transportation in particular. An ex-ample is the tax money that builds roads and airports.Gasoline cost, therefore, does not show the real cost ofthe trip any particular user may make and, further, thesesubsidies favor the truck over the less energy-expensive railroad for freight transport..
A similar distortion is at work in the electric utilityindustry. The utilities are what economists call a"natural monopoly." It does not make sense to havemore than one utility and, therefore, more than one setof power or gas lines serving a community. The way tooperate a natural monopoly is by what is called "margin-al cost pricing." The price should be based on the costof the last unit prOduced since this price will tell thecustomer what it will cost him to buy the next unit.
The electric power industry for several decades was adecreasing cost industry. (This is typical of all rapidlyexpanding industries.) The last unit of electricity pro-duced (from the new efficient generator) had beencheaper than the average cost. If the price were set atthis cost, the utilities would lose money. In order to avoidthis and to take advantage of theSe decreasing costs,the public agencies which regulate the utilities alloweddiscriminatory pricing different prices to differentclasses of users and the so- called "declining blockrates."
In this rate structure the charge to each class ofcustomer decreases as consumption increases. In thefirst block electriCity might cost 2.5 cents per kilowatt-hour, in the next 2 cents, and so on. Thus, demand isincreased, the production systeM is enlarged and be-comes more efficient, and average costs to all de-crease.
The economic situation has changed in the past twoor three years. The utilities (gas and electric) are nolonger declining cost industries. All costs are now in-creasing and the utilities .are no longer appreciably im-proving efficiency with new equipment or larger sys-tems. Increased demand often calls into service olderplants or less efficient peaking units. The last unit ofenergy produced is now the most expensive.
Many economists, therefore, are now calling for revi-sions in the rate structure which would reflect presentrealities and inhibit, rather than stimulate, growth. If puremarginal cost pricing is applied, however, the com-panies,would get 'windfall profits, for the average costis, and will continue for some time to be, less than thecost of the last unit produced. New rate structures willhave to be designed which give the proper price signals.One suggestion is for a reverse declining block.' whichprices the first block low (so as to provide inexpensive
; energy for the poor) and raises the price to the bulkconsumer (who may then pass it along on the goods heproduces).
Many economists are now calling for a return to atleast the principle of marginal cost pricing in all energy
80
industries. If natural gas costs 45 cents per million cubicfeet, on the average, but $1.00 for the last few millioncubic feet, then the customer better not be allowed tobuy gas at 45 cents for he will increase his demand. The"windfall profits" that a real marginal cost pricing wouldbring could, it is argued, be reduced by taxes and usedfor further energy research, for instance. Only with sucha change can the price system bring energy supply anddemand into balance.
The energy economists make-a convincing -case forchanges in the energy price system. What thesechanges should be, of course, is far from clear and theadvocacy and opposition to various proposals shouldkeep us informed and entertained for some years.
There is substantial agreement, however, that a pureprice system will not suffice, that government interven-tion will be needed if we are to establish a realisticeneegy policy.
An "energy policy," in fact, means intervention since itsets up goals that are different from simplesupply/demand goals. The government, of course, hastraditionally intervened. The subsidies we have just de-scribed were intervention. The "oil import quotas,"which were in place for many years, were another formof intervention. They were designed to encouragedomestic production of oil so that we would not becomeoverdependent on foreign sources. They kept oil priceshigher in this country than abroad for several years, butin the end were removed because, in fact, domesticproduction did not keep up with demand.
It seems clear, from our history as well as from ourpresent state of confusion, that we must design a na-tional energy policy. We have discussed some of themechanisms of policy-setting in a previous chapter andwill summarize some of our options in the next chapter.In the remaining paragraphs of this chapter we willbriefly describe some of the methods of interventionwhich may be effective in bringing about the energy-conserving practices we have described.
The Carrot and the Stick
Government intervention, of course, can take manyforms and have many points of application, but, gener-ally, we can classify them under the "carrot" of taxincentives, for instance, or the "stick" of punitive taxes,regulation, etc. We will look at several of the suggestedactions.
A sample of the types of measures suggested isprovided by the items of Table 6-10. There are several"carrots" there. The retrofitting of older houses withinsulation, storm doors and windows, etc. is to be encouraged by a tax credit for the investment. A similar taxincentive is to be provided for commercial landlords.
A different sort of carrot is suggested in the industrialsector and for utilities. There the Federal Government, itis proposed, will take the leadership in carrying out thenecessary research and development for energy-con-serving practices and equipment and will also supportdemonstrations of these developments.

There are 'sticks- suggested also. The improvementin automobile gasoline mileage is to be achieved bymandatory legislation. A variety of techniqutds is avail-able to increase the use of public transportation. Con-sumer costs could be increased by raising tolls onbridges and highways leading into cities, by increasingurban parking fees and by establishing auto-free zonesin cities. Higher gasoline taxes are also a formidablestick that is being seriously considered, and behind thatstands the specter of rationing.
There are also some carrots available to entice peo-ple to mass transit. It is suggested that Federal moneybe used to subsidize the improvements needed to makethe service more attractive and effective.
The carrot of tax incentive for retrofitting existingbuildings could be backed up by the stick of stricterthermal efficiency standards for all buildings. This, ofcourse, will require massive revisions of building codes,etc. One could add to these standards mandatory andlowered lighting standards for commercial buildings.
Caveat emptor let the buyer beware: An addi-tional carrot to the consumer, in these times of highenergy prices, is information on the efficiency and thefuel and operating costs of large and small appliancesoffered to him for purchase.
An effective effort in this direction will need be acooperative one. It will have to be required by law, nodoubt, but will need the cooperation of the many indus-trial trade associations and monitoring perhaps by theBureau of Standards.
What is aimed for'here, and in many of the actions forenergy conservation, is a change in public thinking. Weare presently geared to first cost. "What is the purchasecost?" We must change to life-cycle costing. 'What willit cost year by year?" It is only through an appreciation oflife-cycle Costs that the price system, through increasedenergy prices, can get the energy conservation mes-sage to the pocketbook where It will make a difference.
The hidden environmental costs: Even with thechanges we have lust described, one of the goals of anenlightened energy policy will not be served. There areneither sticks nor carrots described whose purpose is toimprove and protect environmental quality.
We must put this goal into the price system by inter-nalizing' (in economic Jargon) the costs of environmen-tal damage. We must rpake visible, in the bill for energy,the cost of reclaiming strip mines, of using land, air, andwater as dumping grounds for pollutants, of protectingnuclear fuels from theft, and generally of preventing andcorrecting the damage and hazards we described inChapters 2, 3, and 4.
To accomplish this we will have to call into play avariety of strategies. Pollutant emission ca.. be taxed orregulated. Strip mine operators can be required by lawto reclaim land to a certain standard as they increas-ingly are). Beneficial uses of waste heat can be de-veloped and demonstrated, development of non-polluting energy technology can be supported and encouraged. The whole structure of taxes and regulation
must be re-examined from a new pewit of view. Presentfreight rates, for example, now discriminate against re-cycled materials in favor of virgin materials. The deple-tion allowance available to pulpwood producers makesit possible for them to undersell recycled newsprint. Thesame depletion allowance operates against the recycl-ing of lubricating oils.
If we are to have effective energy conservation, it willhave to be on a "pay-as-you-go" basis. We must seethat the system is restructured to take into account allthe costs of energy. We must be certain the price is right.
SummaryA component of all likely energy policy options is the
requirement to conserve energy. This may vary in itsintensity from option to option and its urgency maychange over time if we emphasize "dig and drill" or asnew energy sources come on line. The shortages, theincreasing prices, and the need for adding on environ-mental costs, however, will cause the price system byitself to force wiser use of energy.
In this chapter we reviewed the short-term conserva-tion strategies and then looked at the potential forlonger-term savings in the various economic sectors.The short-term strategies are largely aimed at the indi-vidual consumer. He is asked to lower his speed, driveless, and reduce the comfort level in his house andoffice. These requests can be backed by allocation and,if necessary, rationing.
The transportation sector is a prime target for longterm as well as short-term strategies. It uses a quarter ofour energy (and that inefficiently) and the most sensitivefuel, oil. The strategies proposed are all aimed at reduc-ing overall energy Intensiveness (El), at reducing theCalories per ton or per passenger mile. This can beaccomplished by improving engine performance, by,switching passenger or ton miles from high to low Elmodes (from the aut--nobile to mass transit or bikes, forinstance) and by increasing load factors (the percen-tage of filled capacity in a mode of transport).
In the building sector (residential and commercial)long-range strategies require modification both of struc-ture and practice. Improvement of insulation and theaddition of storm doors and windows could save trillionsof Calories. A switch away from electric resistance heat-ing either to direct fuel use or to the electric heat pumpwould also reduce primary energy consumption. Light-ing is a special target, lowering levels would not onlyreduce energy use directly but indirectly, in many in-stances, by lowering the air-conditioning load.
In the industrial sector a variety of energy-conservingchanges could be brought about. Waste heat can bereused and waste materials burned for heat. New proc-esses are being developed which are-less energy in-tensive. Recycling offers important energy savings par-ticularly in the production of paper, steel, and aluminum
In the final section we examined some of themechanisms that will be needed to implement theseconservation strategies. The price syst.,m, with the pres-ent distortions of tax incentives, special rate structures,
81

etc., and without the inclusion of environmental costs, isnot working. We will have to be led toward energy con-servation by a ..,'carrot and stick" approach. Among thecarrots are tax incentives to insulate existing buildingsand subsidies for mass transportation systems. Amongthe sticks, for instance, are mandatory legislation ofbetter gasoline economy (20 MPG by 1980), gasolinetaxes, stricter thermal standards on new buildings, andtaxes and laws to require environmental restoration andprotection.
The FEA in its Project Independence study lookedcarefully at the options and the mechanisms for imple-menting energy-conserving strategies. They forecast areal possibility of savings, growing from 3 percent of theproje,ced total energy in 1977 to 7 percent in 1985.Som6.-of the changes which must be brought about aresimple and non-disruptive, some will disrupt sectors ofthe economy and our lifestyles. We are, however, in anew era and energy is no longer free. It is time to openthe savings account.
82

CHAPTER 7Energy Policy andOptions for the Future
Energy Policy and Options for the Future
Throughout this volume of the Source Book we havetried to evoke the image of a web interconnecting all ouractivities as a symbolic representation of energy'sbroad role. We examined several of the web's strands:those which connect energy at many points to the envi-ronment, to the production and consumption of goodsand services, to employment and consumer spending,to the growing of food, and even to foreign pokey.
The web analogy, however, fails us in this chapterwhen we begin to think of policy. The web produces animage of centralized power and decision-making, andenergy policy-making in this country does not evoke thatimage. Rather than a single center of policy-making,which coordinates, disseminates, and implementssome master plan, energy decisions in this country havebeen made in semi-autonomy in -almost 100 differentagencies and departments. There has not been a 'Na-tional Energy Policy."
For a long time, of course, there seemed no urgentneed for an energy policy, just as there seemed no needfor a land-use policy when land was plentiful. The day offree energy is over, however, for at least the threedecades or so it will take our experiments with solarenergy and fusion power to prove out (see Chapter 7,Volume II). The web we have been describing is nowstretched tight and if it is jangled anywhere, the distur-bance spreads throughout the system. We must nowput intelligent planning at the center.
The Fragmented Past
The responsibility of directing the production ofenergy in this country has been shared between theprivate and public sectors. The production of oil, coal,and uranium has been almost entirely under the aegis ofprivate enterprise. While gas production is left to theprivate sector, its transmission and distribution, andtherefore its price, have been regulated by governmentbodies. Hydroelectric and nuclear power have beendeveloped under public and regulated private owner-ship. Of the other segments of the utility industry, thosewhich are investor owned, are publicly regulated whilethose which are publicly owned are not regulated.
That such a crazy-quilt pattern of planning and controlwas able to function at all was due to the simplicity of themotto common to all the component groups: "More isbetter." Such a motto was an obvious choice of theenergy-producing operations in the private sector. Gov-ernment actions at the state and Federal levels weremostly supportive and promotional.
We presented some sampling of the confusion thatthis fragmentation of jT)lanningandconli otbrought aboutin our brief description of "The Shootout at Four Cor-ners" in the introduction. In the Department of the In-terior alone, the Bureau of Reclamation, the Bureau ofLand Management, the U.S. Geological Survey, theBureau of Indian Affairs, and the National Park Servicewere all involved. At least two additional independentFederal agencies were also deeply embroiled, the Fed-
eral Power Commission and the Environmental "rotec-tion Agency. Before the ruckus had died down the U.S.Congress and the courts also played important roles.Outside of the Federal Government, of course, impor-tant decisions were being made in state houses, tribalcouncil meetings, and corporate boardrooms.
We ,cannot take the space here, nor do we feel itappropriate in this Source Book, to undertake a detailedanalysis and critique of the policy decisions and non:decisions which brought us to this point of over- demandand under - supply.' What we will do is briefly sketch thefunctional structure of the various government agencieswith major energy-environment responsibilities, thentake a look at past policy trends and future policychoices in the areas of fossil fuels and electric utilities.
Government Energy ResponsibilityThe energy-environment responsibilities of the Fed-
eral Government are divided among the three branchesin the same manner as are all responsibilitieS. Congressmakes the laws, the Executive Branch implementsthem, and the Judicial Branch judges and referees themand their application. All of these branches have playedactive and important roles in determining past energypolicy and will play similar roles in the future.
Government responsibility can be broken down alongfunctional lines also, and we will use such categories inthis discussion.2 The four areas of most importance are:policy development; regulation; research and develop-ment, and energy resource development. We will con-sider each. of these briefly:
Policy development: As we have said, there hasbeen relatively little attention paid to this area in thepast, and the recent past has been confused by author-ity for policy-making shifting back and forth among Pres-idential "Energy Advisers," the Federal Energy Office,and Cabinet members.
The Federal Energy Administration (FEA), estab-lished in 1974 for a two-year term, is presently chargedwith policy development, data collection, and some reg-ulatory functions. Under William Simon it was the dom-inant energy policy body, but its role at present is notas clear. In a later section we will discuss the "ProjectIndependence Report" of the FEA, the most thoroughpolicy document now in existence at the Federal level.
Other Federal agencies which play some policy roleare the Office of Management and Budget, theCouncil on Environmental Quality, which advises thePresident on energy-environment matters, and theCouncil on Economic Advisors, for which energymatters have assumed a high priority.
There are several Congressional committees whichhave conducted hearings and developed legislation of-a
'Several books and articles on U.S. energy policy are referenced inSection XI, Part of the NSTA Energy-Environment MaterialsGuide, which was Produced along with this Source Book.
2In this section we summarize material that is presented in moredetail in Appendix E of A Time to Choose, final report of the EnergyPolicy Project, Ford Foundation, Cambridge, Massai.busetts. Sallinger, 1974.
85

policymaking nature; reference to them will be found inthe bibliographies of "The Energy Environment Materi-als Guide."3
Regulation and control: There are several differenttypes of regulation and control in the energy-environment area: economic regulation, fuel allocationand control, energy facility siting and land use, andenvironmental and safety regulation.
The major responsibility for economic regulation fallson the Federal Power Commission (FPC), which regu-lates the price of natural gas and has some control overelectricity sold wholesale in interstate commerce. TheFPC also exercises what amounts to a policy role withits Federal Power Surveys that project national needs.
Other agencies with regulatory input are theSecurities and Exchange Commission, which looksat ownership and financing in the energy industry, andthe Justice Department, which enforces the laws. TheInterstate Commerce Commission sets freight ratesand has important effects on recycling, for instance, bydetermining the difference between freight rates on vir-gin and recycled materials. At the state level there arealso Utility Commissions, which set the consumerprices for electricity and natural gas.
The area of energy facility siting and land use hasbeen a chaotic-one, with most decisions---.-- where polderplants and refineries will be built, or what strip-minereclamation is required made at state and locallevels. The FPC approves siting of hydroelectricfacilities and the (now defunct) Atomic Energy Com-mission licensed nuclear plants. (This function will becarried out by the National Regulatory Commission, seediscussion below.)
Decisions on environmental protection and safetyhave also been fragmented. The principal responsibilitydefined by various environmental protection legislationof the past few years has fallen on the EnvironmentalProtection Agency (EPA). This agency sets guidelinesfor state enforcement. It is most active in air, water, andland pollution. The responsibility for assuring the safetyof nuclear facilities has been with the AEC, but with itsdemise it now falls to the new National RegulatoryCommission (NRC).
The regulation of public land use falls on the Bureau ofLand Management of the Department of the Interior withthe technical assistance of the U.S. Geological Sur-vey. The enforcement of the new Mine Health andSafety Act is the responsibility of the Interior De-partment's Mine Enforcement Safety Administration(MESA).
Energy research and development: The responsi-bility for research and development has been divided.
____Thelargestamounts_oLmoney in the past two decadeswent to the AEC for the development of atomic power.The Bureau of Mines and the Office of Coal Researchof the Department of the Interior had some money forfossil fuel-R&D. The National-Science Foundation and
'op cit.
86
lately the National Aeronautics and Space Adminis-tration (NASA) have also supported basic research inthe energy area.
In the new reorganization, the R&D responsibility willfall to the Energy Research and Development Ad-ministration (ERDA), which will absorb the AEC re-search and development functions and some othersthat have been scattered throughout the various agen-cies.,
Energy resource management This important re-sponsibility, to find and assess the worth of public-owned energy resources and then to lease them andsupervise their extraction, falls to the Department ofthe Interior. The work is performed for the most part bythe Bureau of Land Management and the U.S. Geo-logical Survey. The Bureau of Reclamation alsooccasionally gets into the act with its plans for develop-ing regional programs that involve energy resources.
Energy conservation: In the past. there_ has beenlittle federal (or other) direction for energy-conservationefforts. But for the past year the FEA has had a conser-vation division which has undertaken studies and sup-ported research in the building, transportation, and in-dustrial areas. It is to be hoped that conservation effortswill be vigorously-pushed forward by ERDA or the FEA.
ttiePiivati-tecioRather than try to break down the private sector by
companies, councils, etc., we will look at the policy-decision trends of the recent past and future for thethree fuels and electricity generation.
Oil: The giants in the energy business are the oilcompanies. Of the 10 largest indutrial corporations inthe United States, 4 are oil companies; of the 15 largestmultinational companies, 7 are oil companies.* Thecomnied dollar sales of the top four United States oilcompanies (Exxon, Texaco, Gulf Oil, and Shell) was$57 billion in 1973, more than the total GNP of manycountries. The 1972 sales of the 20 largest UnitedStates oil compahies are shown in Table 7-1.
The great economic power of the oil companies is, ofcourse, accompanied by political power. To a largeextent they have been the policymaking body as far asoil production is concerned, deciding how much oil wasproduced, and whdre. Government policy and interven-tion in the market have been support:vs. We briefly men-tioned several components of gc vernment policy,in theprevious chapter: the subsides provided by the "oildepletion allov'ance," the deduction of intangible drillingcosts, and the deduction from United States incometaxes of the money levied on crude oil produced onforeign soil. For many years domestic production wasprotected by the import quota from competition from(previously) inexpensive foreign crude oil, and by "pro-rationing," a system of state controls on production that
'Exxon. Standaid of California, Standard of Indiana. RoyalDutch/Shell, British Petroleum, Texaco, and Gulf. With the FrenchCompagnie Francaise des Petroles, they produce about twothirds ofthe world's oil.

matched well-by-well production to demand, and madecertain that there was little surplus oil on the market.Prorationirig was necessary in oil fields on which sev-eral owners were pumping from the same pool (likeseveral straws in the same soda) for it prevented a madrush to get all the oil out of the ground. It protectedresources, but it also thwarted the marketplace pres-sures and supported oil prices.
All of these government programs were designed tostimulate domestic.production of petroleum. In spite ofthem, however, as we show in Chapter 5, Volume II,domestic petroleum production peaked in 1970 and hasbeen declining since. And in spite of these favorableprovisions, we have experienced a growing shortage ofpetroleum products and our dependence on unstableforeign supplies has increased each year. To under-stand how these supportive policies led nonetheless toshortages and high prices, we must look at the way inwhich government policy interacted with oil companypolicy and structure.
Structure plays a most important role. The oil industryis dominated by 18 huge companies (see Table 7-1 fortop 20). These 18 companies are among the 200 largestcompanies in the country, 10 are in the top 40 and fourinthe top 10. They are "vertically integrated companies,"which means they operate at each of the four basiclevels of the petroleum, industry crude oil production,refining, trafisportation, and marketing. The four topcompanies, for instance, controlled 37 percent of theproven reserves in 1970 and the top eight, 64 percent.The same dominance exists at other levels. The top fourown a third of the refining capacity (the top eight, 58percent). The major companies own outright, or jointly,most of the pipelines. Not unexpectedly this dominance
extends to marketing, the top tour made 31 percent ofthe total, gasoline sales in 1970 (the top eight, 55percent).4
With this integrated structure, the major oil com-panies have significant advantages over independentproducers, refiners, and marketers. Because of thisstructure, the previously mentioned policies, designedto protect and stimulate domestic production, have notalways achieved that end. We will take a few examplesfrom the Senate investigation of 1973 to make thispoint.5
The Oil Import Control Program restricted crude oilimports and limited imports of gasoline almost to zero.This restriction on foreign crude plus the majors' controlof most domestic crude, and of the pipelines, made itvery unprofitable for an independent refinery to operate.They could not be assured of the raw material. For avariety of reasons, and local opposition to refinery sitingis only one of them, the majors did not build the addi-tional refinery facilities needed during the 1960s andsince independent refineries were discouraged, we en-tered the 1970s without sufficient refinery capacity.
The control of all phases of petroleum production andmarketing enables the major companies, if they desire,to use the depletion allowance and the other tax advan-tages for a competitive edge over independent refinersand marketers. These tax advantages are applied to the
4These data on the major oil companies structure are from TheInvestigation of the Petroleum Industry, Permanent Subcommitteeon Investigations of the Commdtee on Government Operations, U SSenate, July 12, 1973.
5Ibid.
TABLE 7-1The Oil Companies, Total Sales and Ranking by Assets in the Fortune 500 List, 1972
Company500 Ranking
by Assets500 Ranking
by Sales
Gross Sales
(Millions of Dollars)
1. Exxon 1 2 20,310
2. Texaco 3 8 8,693
3. Gulf 6 11 6,243
4. Mobil 7 7 I 9,166
5. Standard of California (Chevron) 9 12 5,829
G. Standard of Indiana (Amoco) 12 15 4,503
7. Shell 14 17 4,076
8. Atlantic-Richfield 16 25 3,321
9. Phillips Petroleum (66) 25 36 2,513
10. Continental Oil Company (Conoco) 26 24 3,415
11. Sun Oil (Sunoco) 28 59 1,918
12. Union Oil Co. 30 52 2,098
13. Cities Service Company (Citgo) 35 63 1,862
14. Getty Oil Company 42 100 1,405
15. Standard of Ohio 55 95 1,447
16: Mi-falfien Oil Company 77 113 1,278
17. Amerada Hess Corporation 90 107 1,334
18. Ashland Oil Incorporated 93 70 1,780
Source. Albert,J-Eutsch_and John W. Egan, Big Oil. A Citizens Factbook on the Major Oil Companies, Centel for Science in the PublicInterest, Washington, D.C., 1973. -
o5 87

production of crude oil. It is thus possible for the inte-grated companies to sell themselves crude oil at highprofits (an internal transaction) and then to lower theincome taxes on these-profits by these special deduc-tions. They can then operate their refining and market-ing operations at cost and thus obtain_ an importantadvantage over the nonintegrated independents whohave to actually buy the high-priced crude oil and makesuch profits as they can from refining and/or marketing.In 1973 the rise in crude oil prices and the shortage ofgasoline drove many independent retailers out of busi-ness by removing the price differential which had beentheir major advantage.
We have described the operation of the special provi-sions to show that they were designed to help the oilcompanies and thus stimulate the production of thisprecious resource. They have certainly helped. The oilimport quota, while it was in operation, kept our oilprices a dollar or so a barrel higher than they would havebeen if foreign oil had been allowed to compete. Thedepletion allowance is of great importance to small, in-dependent domestic oil producers.
One could, of course, also argue that the existence ofthe quota kept our dependence on foreign oil at lowerlevels than it would have been otherwise. Unfortunately,the tax deduction allowed on the money paid to foreigngovernments worked inhe other direction. This is madeclearer with a little arithmetic. Suppose a United 'Statesoil company earns $100 million abroad and pa's $60million of this to the foreign government. The UnitedStates tax liability on the $100 million would normally be48 percent, or $48-million dollars. If the $60 million istreated as income tax paid to a, foreign government (thepresent interpretation), then the company owes no Un-ited States taxes because the $60-million deduction isgreater than the taxes owed. If the $60 million had beentreated as a business expense, then the companywould have deducted it from the $100 million and paid48 percent taxes on the remaining $40 million, about$19 million. The advantage of this tax interpretation isthat the multinational companies paid income taxes in1971, for instance, of about 7 percent on their totaloperation (as against the 48 percent that other corpora-tions, including independent refiners and marketers,pay).6 It has thus been economically much more attrac-tive for these international companies to developMiddle-Eastern wells rather than American ones.
The oil import quota has been rescinded and thedomestic "prorationing" is no longer effective sincedomestic wells are now operating at 100 percent ofcapacity. As we stated in Chapter 6, there are strongarguments to remove the other subsidies from oil pro-duction. On the face of it they do not seem to haveserved to increase domestic production as they weredesigned to do and they have resulted, overall, in con-cealing from the consuming public some of the costs of
oil products. Their removal, and the subsequent pricerise, should encourage more efficient use of this preci-ous liquid and also encourage the development of otherenergy sources which have not had similar subsidy.
Gas: The government has not been quite so suppor-tive in its handling of natural gas. Gas is produced alongwith oil at many locations and so enjoys the same taxbenefits. It has not been imported from the Mideast andso is not helped by the write-offs we have just examined.The big difference has been in the regulation of its priceby the FPC, a practice that was upheld by the U SSupreme Court in 1954.7
Regulation of gas prices was established to protectthe consumer. Since in the beginning most natural gaswas discovered along with oil, the companies couldreap "windfall profits" if they were allowed to take thesame tax breaks and sell gas at prices similar to oil. As aresult of the regulation, natural gas has been an energybargain and its use, as we show in,Chapter 5, Volume II,has grown rapidly.
Natural gas is now in even shorter supply than oil, andexploration for it has also been declining. There is now
'great pressure to deregulate its price and promises aremade that the supply will increase rapidly as the pricerises. Proponents of this course of action point to thefact that more natural gas is produced now as "unas-sociated gas," gas found independently of oil. A largerreturn on investment, they argue, would encouragemore exploration for gas. However, if all gas (new andold, so to speak) is deregulated, great profits will berealized on the gas already being produced. A vigorousdebate is going on within the concerned agencies andwithin Congress over the wisdom and effectiveness ofderegulation.
With the shortage of domestic gas has come in-creased interest in importing liquid natural gas,(LNG),and a new form of government intervention. Our gov-ernment is heavily subsidizing United States construc-tion of LNG tankers and the Maritime Administrationguarantees 75 percent of the ship mortgages Theseare again costs borne by the taxpayer and hidden fromthe consumer. They tend, therefore, to encourage in-creased consumption of this fuel.
Coal: Coal has operated more nearly in a free marketeconomy without the subsidies and tax advantages wehave mentioned. It has a depletion allowance of only 10percent. Coal production has not expanded very muchsince the 1940s (see Chapter 5, Volume II, for data)Rather than encouraging production, in fact, FederalGovernment policies have been a handicap in manyways.
One example of this was examined in Chapter 3 ofthis volume. The passage of the new Mine Health andSafety Act has had the beneficial effects we described,dramatically reducing accident rates. It also promiseslower incidence of Black Lung and brings the payments
' Energy, The New Era, S.D. Freeman, Vintage Books, New York. 'Phillips Petroleum Company v. Wisconsin. 347 U S 672. June 7,
1974. 1954.
4 C88 ; t

for this disease out in the open, causing it to be added tothe price of coal. It appears, however, that the newsafety regulations have driven many small mines out ofbusiness. The strict air pollution laws have also comedown hardest on coal.
In addition, the Federal Government has created avigorous competitor for coal's major market, the electricutility industry. As we see-in Chapter 6,'-Volume II, theAtomic Energy Commission has been putting largesums of money into the development of nuclear reactorsfor the production of electricity. If comparable funds hadgone into coal R&D there seems no reason to doubt thatby now we could have had clean fuel from coal andliquid and gaseous fuels as well. This provides anotherexample of the failure or lack of an energy policy. TheAEC did its job in pushing the development of "atomicenergy." There was, however, no equally well-financedand determined agency to give a similar push to coal. Asa result of its worsening competitive position, our mostabundant national fossil fuel resource has been steadilylosing its share of the market.
Uranium: The uranium industry is relatively youngand is enjoying the benefits of the fact that forsome time(until 1970) its only customer was the government. It iseven more carefully protected than oil. There is an abso-lute ban on importation of foreign uranium and the gov-ernment is only slowly releasing its own $800 millionstockpile of surplus uranium in order not to lowerdomestic prices. As the demand for this fuel grows, wewill expect to see it subjected to the true signals from themarketplace.
The Energy Companies
If we look a bit further into the uranium industry, webegin to see familiar faces-:- the oil companies. In 1970,17 oil companies controlled\48 percent of the uraniumreserves and 28 percent of the uranium ore processingcapacity. If we had looked into the corporate structure ofcoal companies, we would again have found the namesof oil companies, for they control perhaps 20 percent ofthe production and 30 Percent of the reserves in thisindustry. In the past 10 to 20 years, by a series ofmergers, expansions, and acquisitions, the oil com-panies have become energy companies. We can showthis in several ways. In Table 7-2 we provide a list of thevarious energy holdings of the top 25 oil companies (in1970). We see from this diversification the justificationof calling these "energy companies." The largesturanium producer is Kerr-McGee, a relatively small oilcompany (22 on the list of Table 7-2). The secondlargest coal producer is Consolidated Coal Companyowned by Continental Oil. The overall ranking of thecompanies, in the terms of total energy supplied (in1970), is as shown in Table 7-3.
There are reasons both to applaud and decry thisdominance of the production of primary energy by arelatively few large firms. Throughout our recent historyit has been the increases in the size of our variouscorporations that have given us "efficiencies of scale"resulting in lowered prices. The big energy company, as
well as the big electric utility, automobile manufacturingcompany, or supermarket, can usually achieve savings,some 9f which are passed on to the consumer. It is alsotrue that enormous financial resources are now neededto drill for offshore oil, to build supertankers, refineries,
TABLE 7-2Diversification in the Energy Industries by the 25Largest Petroleum Companies, Ranked by Assets, 1970
PetroleumCompany
RankIn
Assets
ENERGY INDUSTRY
Oil Ura-Gas Shale Coal nium
TarSands
Exxon 1 X X XTexaco 2 X XGulf 3 X X XMobil 4 XStandard Oil
of California 5 ),5
Standard Oil(Indiana) 6 X X X
Shell 7 X X X XAtlantic Richfield 8 X X X XPhillips Petroleum 9 X X XContinental Oil 10 X X XSun Oil 11 X X X X XUnion Oil of
California 12 X X XOccidental 13 X XCities Service 14 X X XGetty 15 X XStandard Oil
(Ohio) 16 X X XPennzoil
United, Inc. 17 X XSignal 18 XMarathon 19 XAmerada-Hess 20 X XAshland 21 X X XKerr-McGee 22 X X XSuperior Oil 23 X XCoastal States
Gas Producing 24 XMurphy Oil 25 X
Source: The Energy Cartel, Who Runs the American oil Industry,Norman Medvin (New York: Vintage Books) 1974, pg. 25.
TABLE 7-3Big Eight Energy Producers, 1970
1
1. Standard Oil of New Jersey (Exxon)2. Continental Oil3. Texaco4. Gulf Oil5. Shell6. Standard Oil of Indiana (Amoco)7. Peabody8. Atlantic Richfield
Source. A TIme to Chouse,' final report ol Energy Policy Project,Ford Foundation (Cambridge, Massachusetts. Baihrigell 1914,
89

and uranium processing plants. Only these large com-panies,have comparable resources.
On the other side of the coin is the difficulty of regulat-ing firms with such potential. political influence. Theycan, and do, for instance, obtain much better informa-tion about energy resources on public lands than theless well-staffed government agencies. The diversifica-tion of these companies to all energy sources givesthem de facto control of energy policy. They can decidewhich forms to develop and which to neglect. In particu-lar it is not to be expected that they will support thedevelopment of less profitable (for them) energysources such as solar energy or energy from wastes. ANational Energy Policy of the next few decades mustfind some way to harness the strength of these massivecompanies to national goals.
The Electricf Utilities
As we pointed out in previous chapters the electricutilities are somewhat of an anomaly as businesses goThey are, if taken as a group, the largest industry, withcapital assets of $125 billion in 1973 It is not, of course,a single industry, but rather 3,500 separate and inde-pendent systems which are a mix of investor-ownedutilities, publicly owned (mostly, municipal) utilities.cooperatives, and Federal agencies. The breakdown ofthese by type (in 1968) was 405 investor-owned utilities,2,075 public utilities (nonfederal), 960 cooperatives,and five Federal utility agencies Most of these utilities(70 percent), however, are engaged in distribution onlyThis is true of 93 percent of the cooperatives and 66percent of the public (nonfederal) ones The generationof electricity is dominated by the investor-ownedutilities. The 200 largest investor-owned systems oper-ate 75 percent of the generating capacity, the Federalsystems an additional 12 percent. They dominate thesales also; the investor-owned systems serve about 80percent of the total customers of the electric powerindustry and the five large Federal utility agencies 13percent.
Policy has been set in this area oniy in a piecemealmanner. The state regulatory agencies establish ratestructures; the Federal Power Commission (FPC)shares in overall planning, projection, and data collec-tion. The Rural Electrification Agency makes loans torural cooperatives, etc. The utilities themselves dosome joint planning through regional power pools, etc
For the first three-quarters of this century all of ,theconcerned agencies, from the Federal Power Commis-sion on down, took as their charter some variation on thetheme "...assuring an abundant supply of electricenergy throughout the United States with the great4stpossible economy and with regard to the proper utiliza-tion and conservation of national resources " Theoperative part of the charter has been the first part andthe utilities and the supportive agencies have, as we cansee from the data of Chapter 4, Volume II, deliveredabundant low-cost energy.
'ram the Federal Power Act 16 U.S.C. 824 a (a) Section 202a.
90t C)
As with other energy sectors, however, the utility in-dustry has now reached a point in its growth Where it toomust examine the "More Is Bette( motto As we pointedout in previous chapters, it is no longer a,declining costindustry and the new electric power will, it appears, cos,more, in both an-economic and envirohmental sense
The policy problems faced by the utility industry gothr-o-tighotit the levels of the system. We describedChapter 6 pf this volume some of the suggestions forrate changes which could lead to more efficient use ofelectric energy. Modification of the promotional ratesor "declining block rates" which are designed to encourage consumption is one challenge to utilities, regulatory agencies, and the citizens who control thorn Wealso passed along the suggestion for a rate structurethat discouraged use during peak power periods. Thisalso needs analysis.
If the industry is to expand fast enough to keep up withdemand it must receive help in other areas, particularlyin the area of power plant siting. There is now a gauntletof hearings, etc., which must be run, and uncertaintydogs the planner s steps. Since it takes five to sevenyears to design and build a plant, and since electricdemand has been doubling every 10 years, the utilitiesare hard presses to open new generating facilities fastenough. It has been suggested that long-range andparticipatory planning for site selection is needed so thatthe utilities can know in advance what sites are open.
Long-range site planning should probably be done ona regional rather than a statewide basis. In fact, considerations of efficiency suggest that utility systems getlarger and that the trend toward power pools and re-gional planning continue. There are a number of deci-sions which, it would appear, should be made on aregional basis some even at the national level. TheFour Corners controversy provided an example. Itwould seem that national input is required into the dec.,mon to use coal from a scenic region like this to providepower to Southern California. We have given Lithe, examples.
It follows, however, that regional planning and im-plementation will need-regional regulation. The stateswill be challenged to provide a mechanism for not onlyregional planning but for consumer input into this pia.'rung. Among the choices available to a region, for in-stance, should be that of getting by on less power. Theutilities must also be opened up to competition andcooperation with mime generation of electricity and withthe so-called total power systems.' We must also lookfor ways to get more research carried out in the utilities(this activity, once virtually nonexistent. has greatly increased) so that they can become partneis in the sedichfor alternative energy sources.
The role of the FPC will also be crucial in the decadesahead, especially its panning role. The industry relies
in such a system a he.mino area. school. or industry rn,ght chociseto generate Its own electnoty and use the waste heat in nonvintrgways.

r
heavily on the projections oIfuture demand, but as wesay elsewhere (Chapter 4, Volume II) projections in theelectric utility area are apt to be "self-fulfillingprophecies." OyersLipply_was not a serious problemwhen electric energy was cheap, but each newgenerating plant now ties up $400 to $500 million incapital and 100 to 600 acres of land often riverside orcoastal land. The future must be much more closelytargeted.
It's Our Energy
An important fact of energy which also must be addedto the calculations for a future energypolicy is that mostof the future resources of primary energy are owned bythe American public it is our energy. The factual.basisof this statement is docuthented in Table 7-4. On Fed-eral land (and-this includes Indian la'nd) are to be found37 percent of,the oil resources, 43 percent of the gasresourcesj.48 percent of the coal reserves, 81 percentof the richer oil shale, and about 50 percent of bothgeothermal sources and uranium. Thus, whether welike it or not, the Federal Government, and therefore thisnation's - citizens are thoroughly involved in the deci-sions of What to produce, where, and-for-how-much,
Citizen groups have, since 1970, become more activea.id effective in their efforts to protect the environmentfrom some of the damage caused by Federal as 4vd asprivate energy-environment decisions. The National,Environmental Policy Acjt (NEPA) has in it a number ofrequirements for actions to ensure environmental pro-tection. In particular, all major Federal projects are re-quired to develop "environmental impact statements."This applies, for instance, to the Department of theInterior and its resource development plans. To someextent, because of court decisions, impact statementshave been produced for the Outer Continental Shelfleasing plan and for oil shale development. Suchstatements have not been produced so far for coaldevelopment or onshore oil or gas leasing.
There is much criticism that the present leasing sys-tem is not sufficiently competitive or productive, either ofrevenue or energy supplies.9 Without passing judge-ment on this criticism it does seem clear that the U.S.Geological Survey, for instance, is seriously short of the
9See, for Instance, "A Time to Choose,' Ford Foundation EnergyPolicy Project, Cambridge, Massachusetts. Ballinger, 1974, Chapter
TABLE 7-4Federal Resource Ownership and 1972 Production
Reserves
Percent ofs
Percent ofDomestic Domestic
Total Resources Total Production
Percent ofDomestic
Total
Oil(Billions of barrels)
OCS(3) 8.7-10.7 11 58-116 30 0.41 10Onshore 2.8- 3.3 4 15- 30 8 0.22 5
Total 11.5:14.0 15 73.146 37 .63 16
Gas
(Trillion cubic feet)OCS(8) 57.8-76.8 15 355-710 36 3.04 16
Onshore 24.2-31.2 6 75.150 8 1,06 6Total 82.0-108.0 21 430.860 43 4.1 22
Coal(All categories,
billion tons) 186.9 48 Not available 10 million tons 2
Oil Shale(Billions of barrels oil)
25 gallons-per-ton shale (No commercial(10-olus thickness) 480 81 production)
15-25 gallons-per-ton shale(15plus thickness) 900 78
Geothermal No breakdown availableapproximately 50 percentof domestic total
(No commercialproduction)
Uranium 1 No breakdown availableapproximately 50 percentof domestic total
Source. "A Time to Choose," final report of Energy Policy Project, Fold Foundation (Cambridge, Massachusetts. Ballinger 1914, pg. 271.
(a) Outer Continental Shelf
ti
9 91

scientific manpower heeded? enable accurate esti-mates to be made of the true worth of the variousresource-bearing larids. And at the present they do nothave routine access to the data obtained by energycompany explorations. Our future policy for the de-velopment of these publicly owned resources mustbebased on the best data obtainable. The resource own-ing public should at least-have before it the choice of.paying for the enertgy Its they buy it or subsidizing itthroue lost public revthlue.
A Look st the OptionsWe have so far in this chapter sketched some of the
history of energy policy and underlined some of thepolicy decisions soon to be before us. The clearestmessage from the past, and a message which should becarried by the various facts we have collected in'thisSource Book, is that We must at once develop a NationalEnergy Policy. We can no longer be guided simply by'ore Is' Better.",
Asa nation we are in the turbulent first steps of thatdevelopment and change is taking place. Through thepast two years the major share of energy planning hasfallen to the Federal Energy Administration (FEA). This
-----ptanning-has-resulted-ine-massive report, the "ProjectIndependence Repory:/ which has been mentioned inprevious chapters.This report lays out several differentpaths into the future, requiring differing amounts ofenergy and different energy-environment decisions toimplement th ='01. We will finish this chapter, and thisvolume, by giving brief descriptions of these options.
Parallel with (but of course independent of) theFEAstudy, the Ford Foundation sponsored an "Energy pol-icy Project," which also develops, as examples, threeenergy options for the immediate future. We Wilkie-scribe them and compare them with those of ProjectIndependence.
Project Independence
The FEA study evaluates four d.,,erent energystrategies:
A Base Case, which is essentially a continu-ation of existing. policies.
An Accele=rated Supply Strategy, which issimilar to the optimistic Supply Case I of theNational Petroleum Council we examine/inChapter 5, VolumeII. It calls, for instancel' foracceleration of offshore leasing, opening. the_Naval Petroleum Reserves to commercial de-velopment, and speeding up nuclear plant con-struction.
9 Conservation Strategy, which would re-duce demand by some of the tactics we de-scribe. in the previous chapter; increasing au-tOmobile mileage and residential insulation, forinstance.,
An Emergency Preparedness Strategy, inwhich a standby curtailment program is readied(see Figure 6-2, Volume I) and a stockpile ofcrude oil is built. up. ,A 4
Energy demand and supply are examined under sev-eral oil price assumptions, since this seems to be one ofthe most sensitive factors in the entire energy pictureMost of the projections are made from two oil prices, $7'per barrel, which seems a reasonable figure based on \
the present situation, and $11 per barrel, a price thatwas reached during the shortage and one that couldperhaps be sustained if the OPEC (Organization ofPetroleum Exporting Countries) cut back their produc-tion by about 50 percent. We will now look in a bit more..,detail at each of these four cases, compare their projec-tions with the more traditional (and older) ones of Chap/ter 4, Volume II, and summarize some of the economicand environmental decisions that must accompanyeach option.
The Base Case: Even the Base Case, in the newpost-embargo energy framework, projects a lower totalenergy consumption by 19851han did the earlier projec-tions we summarize in Figure 4-18, Volume II. Thetotal energy consumption and petroleum exports arecompared in Figure 7-1 with 1972 levels and withytheaverage of Figure 4-18, Volume II.
It is clear from this data that we would be very nearself-sufficiency in 1985 with the higher oil price. TotalImports-would onlybe about 6 percentas_comp_ared with23 percent at $7 per bbl world oil prices and 16 percentin 1972. The assumptions and policy decisions, etc.,which will be necessary to make the Base Case possi-ble are the following:
Natural gas production will not be discour-aged by regulation (or, alternatively, it will bederegulated),
Clean Air Act provisions will be modified toallow existing fuels to be burned.
Tax laws, depletion allowances, profits, etc.,will remain unchanged.
Natural gas will be available from Canada at$1.20 per thousand cubic feet and liquifiednatural gas will be available at $2.00 perthoUsand cubic feet.
FIGURE 7-1Base Case Projections at $7 and $11/Bbl Oil
40
200a
92
(18.3 Q Cal.)
Imports
AverageFig. 4.18
27.7 Q Cal.
Imports-`"26.00 Cal.
1972 67/8bl 1985 $11/8b1

1The Trans-Alaskan Pipeline will be corn-
,-pleted on schedule.No new Pacific, Atlantic, of Gulf of Alaska
offshore_ leasing.wilLoccur.
In addition to the total energy and import projections,it is Interesting to see the economic implications of thetwo different oil prices. In the first place, at the higher oilprice, with lowered imports, we are more secure againstinterruption. At $11 per bbl oil we would only be import-ing 3.3 million barrels per day (M bbls.per day) and only1.2 Mbbls per day wouldbe "insecure" (from the MiddleEast) as compared with 6.2 M bbls per day of insecureimports out of a total of 12.4 M bbls per day at $7 perbarrel oil. The cost to our economy of a one-year inter-ruption would be $205 billion at $7 per barrel oil and $40
. billion at $11 per barrel oil.The other economic indicators which were examined
are energy cost, the inflation rate, the rate of growth ofthe GNP, and the outflow of money to buy oil. These.arepresented in Table 7-5. We see that the more expensiveoil raises the price of energy, increases the inflation rateslightly, lowers the rate of growth of the GNP, but re-duces the outflow of money by about a factor of three.
There arealso environmental costs of the Base Caseprogram but we will postpone their disdission to a finalcomparison.
The Accelerated Supply Strategy: It is projectedthat with certain additional actions to-facilitate and en-courage domestic production, the import deficits shownin Figure 7-1 (23 percent for $7 per bbl oil and 6 percentfor $11 per bbl oil) could be reduced to 15.5 percent for$7 per bbl oil and zero at $11 per bbl di. At $11 per bblthe Accelerated Supply Strategy could make us energyself-sufficient.
The policy considerations necessary for this strategyare:
Speedup of nuclear plant licensing to in-crease its contribution by 18 percent abovethe Base Case estimate by 1985.
Opening of Naval Petroleum Reserves to full-scale commercial development.
Significant new oil expldration and leasingoffshore on the Atlantic, Pacific, and Gulf ofAlaska.
Additional oil and gas pipelines from Alaska.Development of oil shale.Federal assistance in obtaining necessary
manpower, materials, and equipment.
In the Accelerated Supply Strategy with the high oilprice, domestic production would rise, additional oilwould be developed in Alaska, oil shale would produce1 M bbl pe; day and tar sands, 0.3 M bbl per day. Thecost of energy would drop, as would the outflow ofmoney. We ,will compare all the economic indicators
.later (see Table 7-6).The other supply cases: We examine the Conser-
vation Strategy in some detail in Chapter 6. It reducestotal consumption (see Figure 7-1) from 27.7 Q Calories($7 per bbl oil) and 26.0 Q Calories ($11 per bbl oil) to
25.1 Q Calories and 23.8 Q Calories respectively. Thereare corresponding economic payoffs which we shallcompare later.
The fourth strategy, Emergency Preparedness, envi-sions stockpiling oil against an embargo. Extrapolatingfront the recent embargo experience projects that anembargo that reduced imports by 1 M bbls per day for ayear would cost the economy $33 billion. it is possible tobegin a program of buying surplus oil and storing it insteel tanks, at aliout $2 per bbl per year, or in salt domes(underground cavities roofed with salt similar to theplaces oil is found), at about $1.25 or $1.30 per bbl peryear. The example given is the following: A one-yearinterruption amounting to 3 M bbls per day would costthe economy $99 billion. To store enough oil in 10 yearsto ward that off would cost $19 billion. Thus if the oddsare as high as 1 in 5 that such an interruption will occur, itwould pay to begin a storage program.
The Project Independence ProjectionsA Comparison
We have briefly reviewed the assumptions and someof the projections of each of the Project Independencestrategies. We will LLQW look at the important .conse-
"quences of each of the four major strategies: the BaseCase, the Accelerated Supply'Case, and the Case of
'each of these with Conservation.The total energy and import projections are shown in
Figure 7-2. We see that at $7 per bbl oil the combinationof Accelerated Supply and Conservation cuts the importdeficit to a manageably small ,amount (5.6 percent)while at $11 per bbl oil, evepsmaller imports are re-quired. Either the Accelerated SUpply, or its combina-tion with Conservation, can make -us entirely energyself-sufficient.
The projections of the economic indicators are also ofinterest and we show them in Table 7-6. As far as thesedata go, the economic advantages seem to favor Aced::erated Supply plus .Conservation. Domestic energycosts less, the dollar outflow is less, and vulnerability toembargo is less.
It is also of interest to look at the sources of energyunder the different strategies for these give strong duesas to the type of environmental impact expected. These
TABLE 7.5Economic Impact of Base Case, 1985
Indicator
Domestic Energy Cost $5.15 per M Cal. $5.55 per M Cal.Inflation Rate (1973-1990, CPI) 6.2% 6.4%Average Annual Growth in GNP 3.7% 3.2%
(1973-1985)Annual Outflow of Funds from
U.S. in Payment for Oil $31.7 billion $13.2 billion
Source. 'Project Independence Report, Federal Energy Admm-stration, November 1974, pg. 31.
93

TABLE 7.6Economic Results of Various Strategies
Indicator. BC AS AS+C
$7 Per Bbl Oil
Domestic Energy Cost (1985) , $5.15 per M Cal. $4.90 per M Cal. $4.85 per M Cal. $4.65 per M Cal.
Inflation Rate (1973 -199Q) 6.2% NA NA NA
Annual Growth of GNP 3.7% NA NA NA
Dollar Outflow for Oil (1985) $31.7 Billion $21.8 Billion $25.0 Billion $14.3 Billion
Cost of 1 Year Interruption $205 Billion $149 Billion $172 Billion $99 Billion/
$11 Per Bbl Oil
Domestic Energy Cost (1985) $5.55 per M Cal. $4.95 per M Cal. $5.05 per M Cal. $4.50 per M Cal.
Inflation Rate (1973.1990) 6.4% 6.3% NA NA
Annual Growth of GNP 3.2% 3.2% NA NA
Dollar Outflow for Oil (1985) $13.2 Billion 0 $4.8 Billion 0 .
Costof 1 Year Interruption $40 'Billion 0 0 0
Source: "Project Independence Report," Federal Energy Administration, November 1974, Chapter 6.NA - Not Available.BC Base Case, AS - Accelerated Supply, C - Conservation.
FIGURE 7-2CoMparison of Forecasts for 1985
40
BC AS C
AS AS+ +C BC AS C C
77-;,f
$7 per Bbl Oil
BC Base Case,AS Accelerated SupplyC Conservation
Imports
$11 per Bbl Oil
94
I
I

are summarized for 1985 in Table 7-7. A close readingof this table gives hints of the futures open under theSeveral options. The Base Case (business as usual)uses oil and gas over coal when oil is in the lower pricerange-and likewise Conservation saves these-two pref-erentially over coal. At the low oil price, the efforts toincrease domestic supplies (the Accelerated SupplyCase) are directed mostly to natural gas and to nuclearenergy which increases at the expense of coal.
With oil at $11 per bbl the priorities change. In theBase Case, coal is used in preference to oil and produc-tion goes over a billion tons per year. Natural gas pro-duction also increases a little. The Accelerated SupplyStrategy produces a little more oil and gas as moreexpensive domestic extraction techniques becomeeconomically feasible. Nuclear power is again called onto make its maximum feasible contribution. Conserva-tion, again, is mostly saving of oil and gas.
The complimentary picture to Table 7-7 is provided byTable 7-8, which summarizes -the- environmental im-pacts of the three energy strategies and compares themwith the 1972 data. Many of the 1985 impacts are, lessthan 1972 due to the anticipated improvements in pollu-tion control. Nonetheless, the heavy reliance on coal(Table 7-8 is based on $11 per bbl oil) increases solidwaste and land disruption and the increase in the ni-trogen oxides, NOR, is also obvious.
There are, of course, many environmental factors notconsidered here. In the Accelerated Supply Case oilspills are reduced as oil imports are replaced by domes-tic production, but solid waste is increased by oil shalemining as the now virgin areas of Colorado, Utah,Alaska, and the Outer Continental Shelf are mined or
TABLE 7-7Projected Fuel and Energy ConsumptionUnder Various Strategies for 1985
BC AS BC+C AS+C
$7 per Bbl Oil
Coal (M tons) 866 762 713 635Petroleum (M bbls) 8,730 8,666 7,729 7,506Natural Gas (B ft3) 23,205 23,976 21,817 22,889Nuclear Power (B kw-hrs) 1,251 1,471 1,251 2,471Utility Electricity (B kwhrs) (3,724) (3,692) (3,370) (3,341)
Total ((11 Calories) 27.6 27.7 25.1 25.2
$11 per Bbl Oil
Coal (M tons) 1,005 918 850 700Petroleum (M bbls) 6,989 7,005 6,171 6,536Natural Gas (B ft3) 24,007 24,873 22,943 23,970Nuclear Power (B kw-hrs) 1,251 1,471 1,251 1,471Utility Electricity (B kw-hrs) (3,615) (3,559) (3,250) (3,197)
Total ((11 Calories) 26.0 26.2 23.8 24.2
Source. "Project Independence Report," Federal Energy Adminis-tration, November 1974, Chapter 6.
drilled for energy. The social impact and others that welooked at in Chapter 2 also must be considered. TheConservation Strategy, of course, has, as expected,the least environmental impact.
From even this brief summary of the Project-Independence projections we can draw se%..erai conclusions.Even without deliberate conservation strategies thehigher energy prices are expected to bring consumptionbelow the earlier predictions. Utility electricity, in particu-lar, which the consenLus of Figure 4-21, Volume II,shows as 3,800 B kilowatt-hours, is reduced somewhat.At $11 per bbl oil and with conservation the reductionsbelow earlier predictions are quite significant.
There is much more that could be said about thedetails of this report, but our lack of space requires thatwe leave it to the reader to translate millions of barrels ofoil saved into fewer tankers or offshore wells, millions oftons of coal into acres strip mined, etc. The data forsuch conversi_ons are in--this Source Book.
The Ford Energy PolicyN*60otThe three-year, $4-million study of energy policy by
the Energy Policy Project funded by the Ford Founda-tion has added much necessary data and projection toour too-scant store. Its results, which are still beingpublished at this writing, are also too broad to sum-marize satisfactorily. We have examined some of itsprojections and study results elsewhere in the SourceBook. We will concentrate here on the three energyprojections that are the focus of the final report, A Timeto Choose."
The Historical Growth Scenario, which is their ver-sion of business asusual.
TABLE 7.8Environmental Impacts of EnergyStrategies (Selected Indicators)
1985 at $11 Oil ImportsAlternate Energy Strategies
Base Accelerated Conser-Air Pollution 1972 Case Supply vation
Particulates(tons per day) 1,00 2,200 2,300 1,800NOx (tons per day) 30,000 46,800 43,000 38,400SOx (tons per day) 58,900 53,700 48,800 41,500
Water Pollution
Dissolved Solids(tons per day) 37,000 5,800 5,500 5,000Suspended Solids 7,600 300 260 210
Solid Waste
1,000 Tons pei ty 900 1,100 2,300 900Land Disruption
1,000 Acres 19,800 26,700 21,800 17,900
( ) - Not added Into totals. Source: "Project Independence Report," Federal Energy Admin-BC - Base Case, AS - Accelerated Supply, C - Conservation. istration, November 1974, pg. 40.
95

The Technical Fix Scenario, in which improved effi-ciency of energy-utilization and other conservationschemes are expected to lower growth.
The Zero Growth Scenario, which examines thepossibility of slowing energy-growth to zero by 1990 andholding it constant after that.
We show the energy consumption projections of allthree of these scenanos in Figure 7 3 and for referencehave added some projections for 1985 from ProjectIndependence we only show four of eight points inTable 7.7 since the others are almost identical).
As one might expect, there is considerable similaritybetween the Energy Policy Project (EPP) HistoridalGrowth Scenario and the Project Independence (PI)Base Case. The PI Base Case projects lower energyconsumption so that it becomes an S -curve (this Sinto it, whereas the EPP scenario projects historica!rates of gl,owth.
The EPP Technical Fix Sce no is also quite similarto the PI cases with consery tion, although the EPPprojection is a bit more optimistic about the amount ofenergy ihhich can be saved.
The unique contribution of the EPP study is the ZeroGrowth Scenario. We will spend a few words in a moredetailed description of how energy growth might bebrought to zero and what the 'consequences of thatdramatic change in our energy consumption trajectorymight be.
An energy S-curve: In the terms of the discussion ofgrowth in Chapter 4, Volume II, what is being proposedhere is a turnover of the exponential growth in energyconsumption so that it becomes an S-curve (this Sshape can be distinguished in Figure 7-3). The ques-tions to be answered are: Why? How? and What Hap-pens? Why is it proposed that the growth in energyconsumption slow to zero? How can this be accom-plished? What will consequences be in each of thesensitive sectors of our lives?
The "Why?" is the easiest one. All we have said in thisvolume should suggest that our problems are intimatelyassociated with energy consumption growth and thatwe have a better chance of solving them if that growth isslowed. Then we can choose more-freely among thecontroversial primary energy supply options, the pollu-tion problems will be lessened, we can reduce importsand free oil for other markets, easing international ten-sions, etc.
How shall we do it? Slowly and with careful planning isthe first part of the answer. We have already suggestedsome of the energy-conserving steps which can betaken. The major targets are transportation, in which adetermined effort would be made to reduce our em-ployment of energy-inefficient forms of transport, andhousing, in which tightened building and lighting codeswould save energy. Along with these energy-savingstrategies, the EPP suggests the elimination of deple-tion allowances on virgin oil, etc., and the end of dis-criminatory freight rates so that recycling is encouraged.The Federal Government would be expected to step
96
up energy R&D, especially that part of it aimed at im-proVing the itilization of energy.
The major and most controversial policy change sug-gested is for an energy tax" on all energy consumedwhich would grow from 3 percent-of-the-retail-price-in1985 to 15 percent by 2000. There are a variety of waysin which this tax could be imposed, but its aim is to putmarketplace pressure behind energy conservation. Therevenues collected could be used to further theenergy-saving goals by improving the mass transportsystem and by supporting needed low-energy serv-ices like health care, education, law enforcement, etc.
What will the consequences be? One can expectimprovements in the environmental area. The real worryis in the economic area. What about jobs? What abouteconomic growth? We discussed, in Chapter 6, somereasons behind the belief that neither empl2 rce.DLnorthe GNP need be drastically affected. In a society whereenergy-intensive industrial practices become muchmore expensive we might even expect an increase inemployment. The GNP is also projected to grow atnearly the same rate as under other strategies. As weshowed in Figure 5-4, the EPP projection is that the year2000 GNP in the Zero Growth Scenario is only 4 percentless than in the Historical Growth Scenario even though
FIGURE 7-3Comparison of Ford Energy PolicyProjections with Project Independence
v,
0
20
0
0
O Project Independence Base Case,S7 per Bbl oil
Project Independence Base Case,$11 per Bbl oil
o Project Independence Base Casewith Conservation, $7 per Bbl oil
Project Independence Base Casewith Conservation, $11 per Bbl oil
Energy Policy Project
IYaw IOW 10)5 I") Year''' *00 1.16 2000
Data from. "Project Independence Report, Federal Energy Ad.ministration, November 1974, and Ford Energy PolicyProject.

the total energy use in the latter scenario is almostdouble the former. The EPP projection is that there willbe a slight shift, of 1 percent, from goods to services asenergy production and the production of energy-
-intensive-goods-slow down. It-is-their-firm-belief; and-a-finding of their study, that economic growth and energyconsumption growth can be uncoupled.
On to 1985
These then are the options presented to us as wehesitate at the crossroads of energy policy. There is notmuch more to say. We have triad to summarize the datawhere it exists and evaluate the effects of changes inenergy policy at all those point where the energy webconnects to our environment and our society. We havedescribed where our present energy comes from andwhere the energy of the future may come from. We haveunderlined those energysupply decisions which seemto us the mostcontroversial: offshore and Alaskan oildrilling, increased oil importation, Western coal mining,
-nuclear energy (the breeder reactor in particular), and oilhale-development We-bave_finally,ip _this_stpla ter,
looked briefly at energy policy andpolicymakers in eachof the major fuels and energy areas and have finishedwith a description of the latest in the series of options forthe future which have been put before us.
We end this volume as we began it. The decisionsnow before us in this country, and in the world, aresurely the most important onesfaced in this century. It isoften thus at the end of an era, and we have come tosuch an end. The responsibility for decision making, inthe final analysis, resides with citizens. Thus- theteacher-readers of this Source, Book have a dual chal-lenge, as citizens and as molders of citizens. What wehave tried to do is lighten the educational task bygathering in one place as much of he backgrounddata, conjecture, and projection as we could. We leavethe rest to you.
97
ENERGY-ENVIRONMENTSOURCE BOOK
Volume 2Energy,Its Extraction,Conversion,And Use
1 riS3jt,r,1

CHAPTER 1Energy: What It. Is, What It Does
N

Energy: What It Is, What It Does
"A rose is a rose is a rose" is a definition of a rose onlyto someone who has seen these flowers. We can dolittle better in talking about energy; we can only define itto someone who already has some idea of what it is.
There are, of course, scientific statements we couldmake about energy, about its relation to such otherscientific concepts as force, work, and power, or aboutthe laws that govern it. We will, however, take a bareminimum of words from the vocabulary of science, onlythose needed to understand the twin crises of energyand environment. We will begin the story with "energy isenergy." .
Energy IsIt is not possible to be unaware of energy; it forces
itself to our attention from all parts of our life. Newspa-pers and magazines carry articles about the EnergyCrisis and the ways we are moving to meet it. Televisioncarries advertisements about oil exploration anddocumentaries about Strip mining on the WesternPlains. There is an image of energy in the smoke from apower plant or a steel mill, in transmission lines alongthe road or the oil truck on it. There is energy in theelectric toaster and in its hot buttered toast. Energy isdefined to us in all these ways and many more.
Whenever we have heat, or light (or the otherforms of radiation: radio, x-rays, ultraviolet, etc.),or motion, we have energy in action. Wheneverwe have something, such as a lump of coal, abattery, or a piece of uranium, that can ultimatelyprovide us with heat, fight, or motion, we knowthat energy is stored in that something.
When faced with such diversity, our first step towardunderstanding is to set up categories, to reduce thediversity of form that energy shows by classifying it. Wehave already. suggested the first classification. Energyin the form of motion, heat, or light is called kineticenergy. The energy stored in bread, gasoline, or bat-teries, in the nucleus of the uranium atom, orin any of itsother clever hiding places, is potential energy. Kineticenergy is energy in transit, energy on the move. We useit in this form. Potential energy is stored energy and it isin this form that we dig it from mines, pump it from wells,ship it, and stockpile it. The whole story of energy isfound in the description of these two forms, and in theconversions between them.
To use energy it must be in the kinetic form. We useenergy because we want to do something to matter.move it, illuminate it, or warm it. A moving car has kineticenergy. The electrons flowing through the toaster'sheating element and the photons of light coming to usfrom the sun have their energy in kinetic form.
We store energy in the potential form. It is, of course,possible to store kinetic energy, the flywheel of an en-gine stores kinetic energy in its rotating mass and kinetic
-
energy is stored in the rotation of the moon about theearth. We can, also, store heat energy in Thermos bot-tles. Light energy is almost impossible to Store. Kineticenergy storage, however, is,quite different from poten-tial energy storage. It is temporary, we trap or insulatekinetic energy, it is a caged tiger ready to run free.
Potential energy storage is more permanent. It isaccomplished within the structure of matter. Energy isstored, for instance, in the carbon atom and releasedwhen that carbon atom is combined with an oxygenmolecule in the chemical reaction we call burning. Theproduct of this reaction is carbon dioxide, CO2. Thenucleus of the uranium atom stores energy that is re-leased when that nucleus is split in two in the fissionreaction. A simple way to store energy is to lift some-thing away from the earth. Energy is stored when wateris pumped to the top of a water tower, then converted tothe kinetic energy of motion when the water is allowed torun through the pipes to its final destination. In general,to store energy we must move things around against theaction of some force, lift a weight, force electrons into abattery or compress a spring, for instance. - _
The Energy LawsFrom.whaLwohave said so far, it should be becoming
clear that the story of energy is one of flow and change.Energy is not really like allower, but like a chameleon; ithas a basic identity but constantly changes form. It canbe potential energy stored in coal, but when the coal isburned in a power plant furnace, it changes to a kineticform, the heat energy of steam. When the steam isallowed to strike the blades of a turbine, some of thisheat energy becomes the kinetic energy of motion ofthis engine. The turbine turns an electric generator andsome of the same energy that was released from thecoal becoines electric energy, the kinetic energy of themotion -of- electrons in wires-And. still the flow doesn'tend; electricity goes out through the wires to perform agreat variety of tasks, from running ¶he turntable of ourstereo to making ice cubes in the refrigerator.
These changes of form are not free or arbitrary, theyare governed by strict laws. The first of these is quitereassuring, it seems to say that there can't be an EnergyCrisis Called the Law of Conservation of Energy (or theFirst Law of Thermodynamics, if you want a fancy name)it states:
Energy can be neither created nor destroyed.
This says that once you have a certain amount ofenergy, the 200 Calories you get from eating a candybar, for instance, it never disappears. It may becomeheat energy in your body, or power your muscles, or beused in the processes in your brain. It may be stored asfat. More likely, it does some of all these things all atonce, but it always remains 200 Calories of energy.
This first law is good news. We can never run out ofenergy. Where then is the problem? The second law,which is named The Second Law of Ther-modynamics," but which well call The Heat Tax,"gives the bad news:
103

In any conversion of energy trom one form toanother some of it becomes unavailable forfurther use.
It becomes unavailable because it becomes heat andit is not possible to convert a given amount of heatenergy completely back into another form. Said inanother way, in any conversion or use of energy there isa "heat tax"; some of the energy becomes heat and isno longer usable. This unusable heat energy leaksaway and gradually warms up the earth (and finally-theuniverse). it is this second law that is behind the EnergyCrisis.
It is also clear that this second law puts heat energy ina unique position. It is possible to convert all of a certainamount of mechanical energy to heat, by rubbing twosticks together or putting on the brakes of a car, forinstance. It is possible to convert all the chemical energyof coal into heat energy by burning it. These conver-sions cannot go to completion in the other direction,however. In the language of science they are "irreversi-ble." Heat energy stands at the end of a one-way street,all other energy forms ultimately can be converted intoheat, but only a limited amount of heat energy is con-vertible back to other forms.
We are only skimming some interesting science withthese statements. Why do we believe these laws? Whatis the nature of this strange energy we call heat? Howcan we convert heat energy to mechanical energy? Weanswer some of theseuestions more fully in Appendix4. For now we must get on with our story and look atenergy from the narrow perspective of man.
Energy, Work, and Power
So far we have defined energy by asking you toobserve it around you as light, motion, or heat, or as thecapacity to produce these conditions. There is anothermad, vrtni,, that ;a aaauk.,;ated v.;th oI a.u'y. It iS Lind tOdescribe man's use of energy in- mechanical form:transporting things, rearranging, or distorting them. Wedo work when we lift a weight, push a cart, pull back abowstring, or swing a golf club. Work, therefore, is thesame as energyit is mechanical energy in use.
Power: A second term associated with man's energy-consuming activities is power. We talk of the power of acar or a motor or a stereo amplifier. As we look deeperinto this concept, we find that time is involved in itsdefinition. Power is the rate of doing work, or, moregenerally, the rate at which energy is used. Inmathematical terms, power is the amount of energyused (or work dope) divided by the time it takes to dothat work. In symbols
P (power) =W (work)
T (time to do the work)
We also see from this that W (work) = P (power) x T(time).
Work and power play different roles in our discus-sions. We use work terms to describe things that mustbe done and for which time is not important. It takes a
104
certain amount of work (or energy) to lift a box, melt anice cube, or refine aluminum. Power enters when we aredealing with continuous input (or output) of work; withlightbulbs or automobiles, for instance.
When we buy gasoline, we are buying energy and,,ultiMately, work. We pay for the work to get the car fromCity A to City B. When we bought the car, however, webought power. We paid for the horsepower of the enginewhich determines how fast it can burn the gasoline andthus how fast it can do the work, how quickly it can get usfrom City A to City B.
Units
We are defining energy by describing it. The final stepin this definition is measurement, and to report a meas-urement we need units feet, seconds, pounds arefamiliar ones.
There are many different units for work and power.They were defined for different purposes at differenttimes. The "horsepower," for instance, an old unit, is therate at which a horse can perform.work for an extendedtime. The kilowatt, a newer electrical unit, is defined interms of electric.current and voltage. There is a similarrange of choices fOr energy and work.
In Appendix 3 we define all of the commonly-usedunits of energy (work) and power. We also provide therethe rules and numbers for converting from one unit toanother. In this section we introduce and define onlythose units that will be in our basic vocabulary for thisSource Book.
Since work and energy are interconvertible, a widevariety of choices of units is open to us. We will use theCalorie, with capital C (in scientific terminology thekilocalorie), which originated as a unit of heat energy.-Itis the amount of work (or energy) necessary to raise thetemperatUre of one kilogram (2.2 pounds) of water, 1°C,oagrAA oRntigrAdA, nr C.W.9111c, which is thA preferredterminology). It is also the same unit we use to measurethe energy value-of food; the normal dietary intake is2,000 to 3,000 Calories per day. Calories are based onthe kilograms and degrees Celsius of the metric system,and since the United States is reluctantly, but inevitablyconverting to this universal system, it seems a reasona-ble choice.
The unitof power most frequently used in the SourceBook is the electrical unit, the kilowatt, as electricity isbecoming our most important form of power. A kilowatt(kw) is one thousand watts, about the amount of electricpower needed to provide the heat for an electric toaster.The definition of the watt is developed in TechnicalAppendix 3. Since power is work divided by time, we canproduce a work, or energy, unit, by multiplying a unit ofpower by time. Occasionally we use a unit derived in thisway, the kilowatt-hour (kw-hr), to measure electricenergy.
Numbers and Sizes
The other troublesome aspect of our quantitative de-scriptions of energy and power is that we have to dealwith a broad range of numbers, from the 100 watts of the

lightbulb, for instance, to the approximately400,000,000,000 watts (400 billion watts) that is thepresent total generating capacity of this country. We willwork with millions of toris of coal, billions of barrels of oil,trillions and even quadrillions of Calories. To keep thisterminology as simple as possible we abbreviate thesenumbers in the manner shown in Table A2-1 of Apr*n-dix 2; a. million is M; a billion, 1,000,000,000, i, B, atrillion, 1,000,000,000,000, is T;_ a quaJrillion,1,000,000,000,000,000, is Q, etc. We discuss theselarge numbers a bit more in Appendix 2.
In Tables 1-1 and 1-2 we show some details of thisrange of sizes. Table 1-1 shows some of the referencepoints on an energy scale that stretches from the in-
.comprehensibly small energies involved in molecularevents to the equally incomprehensibly large numbersthat measure earth's daily income of solar energy.Table 1-2 presents similar reference points in a powerrange stretching from a hummingbird's power upthrough the-SST and, finally, to a similar ultimate, theincoming solar power. It is often necessary to comparequantities whose growth takes them from the thousandsto the billions, this leads us to the "semilogarithmic"presentation of data we will introduce in Chapter 4 andalso discuss in Technical Appendix 2.
The Flow of Energy on Earth
With regard to food, mineral resources, air, and water,earth is .aspaceship entirely on her own. She carriesmuch of her energy with her,,but, fortunately, there is aMothership, sun, that beams in a fresh energy supplyevery day. Earth's energy resources, therefore, are a
mikture of stored,,potential energy, and transient, kine-tic energy. There are two basic questions to ask: Whatare the forms of energy available,to us? What are theirrelative amounts? We will focus on the first of thesequestions in this chapter and leave the assessment ofthe resource size to Chapter 2.
Figure 1-1 gives the quantitative information that al-lows comparison of the various flows of energy (power)to and from earth. We also indicate the two depletablesources of energy, the fossil fuels and nuclear energy.The flow from Mothership.sun dwarfs all others; at thetop of the atmosphere, the earth receives 173-trillionkilowatts, 173 T kw, of power. For comparison, the totalelectric generating capacity of the world in 1968 (the lastfigure available) was about 900 M kw, only 1/200,000of the power we receive from the -sun.
Of course not all of the sun's energy is available to ourpurposes. As we see from Figure 1-1, 30 percent of thisis immediately reflected by the atmosphere, andanother 47 percent is absorbed by the atmosphere, theoceans, and the land, and then reradiated. All in all,about half of the total power reaches the ground. Most ofthe power that is not absorbed and then reradiated, 40 T,kw, or 23 percent of the total, is used to evaporate water,providing the energy for the important water cycle ofearth. The rest of the processes use less than onepercent of the total. The impressive power of wind,waves, and ocean currents is not so impressive whenmeasured against these totals, 370 B kw are used onthe average in this way, 0.5 percent of the total. Thepower used to sustain life is, on this scale, miniscule, 40B kw at the most,.an almost negligible 0.04 percent of
TABLE 1-1Some Representative Energy Data
Calories
Energy in 1 Photon of Ultraviolet LightIN 2250A) () 21.2 x 10'22
Energy (gravitational) of 1 Pound of Mass 1 Mile.Above Sea Level 2
Energy To Melt 1 Pound of Ice (at 0°C) 36
Energy To Evaporate 1 Pound of Water 245
Energy (chemical) Released by Exploding 1 Pound of TNT 520
Energy (chemical) Released by Burning 1 Pound of Wood 1,250
Energy (chemical), Released by Burning 1 Pound of Sugar 1,860
Energy (chemical) Released by Burning 1 Pound of Coal 3,300
Energy (chemical) Released by Burning 1 Pound of Gasoline 4,750
Energy Needed To Manufacture an Automobile(b) 5,200,000
Energy Needed To Send Apollo 17 To Moon NI 1,420,000,600
Energy (nuclear) Released by Fusing 1 Pound of Deuterium 32,000,000,000
Energy (nuclear) Released by Fission of 1 Pound of U233 137,000,000,000
Energy Equivalent of 1 Pound of Mass (E.mc2 I 9,800,000,000,000
U.S. Daily Energy Consumption (1970) 47,000,000,000,000
World Daily Energy Consumption (1970) 140,000,000,000.000
Energy Needed To Boil.Lake Michigan (CI) 400,000,000,000,000
Solar, Earth's Daily Total at Top of Atmosphere 3.6 x 10"World Supply of Recoverable Fossil Fuels(*) 5.0 x 10"Sun's Daily Output 7.8 x 10²'
wavelength, A angstrom, 10' I meter;.lb) R. Stephen Berry, 'Recycling, Thermodynamics, and Environmental Thrift,- Bulletin of the Atomic Scientist, May 1972.10 Courtesy Marshall Space Flight Center.1E115.8 x 10' 2 kg. raised from 25°C to 100°C.(*) M. King Hubbert, "The Energy Resources of the Earth," Scientific American, 224, 61, September 1971.
1051 /
fa,

the incoming energy. Even this small number is, how-ever, 40 times as large as the total generating capacityof the world we quoted earlier.
Measured against this munificence, the nonsolarsources of energy seem puny. There are four. Some ofthe sun's energy has been stored as chemical potentialenergy in the fossil fuelscoal, oil, and natural gas. Theestimated maximum size of the fossilized carbon isabout 7,000 Q kilograms. At the 8 Calorie per kilogram ofenergy released in combustion, this would produce atotal of 56,000 Q Calories, which (by the conversions ofCalories to kw-hr of Table A3-2) is equivalent to 65 Qkw-hr. By burning all of the fossil carbon, formed overmillions of years, we would produce only as muchenergy as the sun sends in during 15th days. This value,65 Q kw-hr, is, of course, an upper limit; it represents allof the fossil carbon and only a small fraction of that, aten-thousandth or less, is actually available to us. In ourburning and conversion we lose much of this energy.We will come back to this number in a later section.
'More than 90 percent of the energy that powers oureconomy comes from burning fossil fuels. In addition tothis chemical source of potential energy, there are threeothers that we show in Figure 1-1: geothermal energy(energy whose source is the earth's molten interior), theenergy of the tides, and the new sou rce,nuclear energy.The total power leaking from the earth's interior is only32 B kw, one five-thousandth of the incoming solarenergy, while tides and tidal currents provide only 3 Bkw, one fifty-thousandth of the solar input.
TABLE 1-2Some Representative PowerData
Bird Flying (hummingbird)Human at RestDog Running FastFish Swimming (dolphin)(')Human Walking at 2 mphHorse Working Steadily (one horsepower)Human RunningHuman (top athletic performance) I').U.S. Per Capita Power (1973)Automobile at 60 mph (b1Automobile at Top Acceleration (c)Bus (dl
Commuter Train Id]707 Jet (diSST WIFossil Fuel Consumption in Urban Area
(per square mile) (e) 625,000U.S. Electric Power Consumption
(1973 average) 7,350,000World Total Power Consumption (1970) 6,000,000,000Solar Power Involved in Photosynthesis 40,000,000,000Incoming Solar Power (total) 173,000,000,000,000
Kilowatts0.0070.0170.06oil0.230 75
0.931.21.7
11.929.3
100150
3,00021,000
180,000
111"Locomotion: Energy Cost of Swimming, Flying, Running,"SchmidtNielsen, Science 177, 222 (1972).
DA A 5,000-pound car uses 39 H.P. under average conditions at 60mph, Thomas C. Austin, EPA, private communication.
1cl A 4,735-pound automobile accelerates to 60 mph in 11 seconds.Id) "Lost Power," Environment, April 1972.(')The 1970 National Power Survey, Federal Power Commission.
106
The primary sources of energy available to us onearth are, therefore, five. solar, chemical, geothermal,tidal, and nuclear. Three of these solar, geothermal,and tidal are in kinetic form, the other two thechemical energy of the fossil fuels and nuclear energy
are stored potential forms. We will briefly discusseach of these in the sections that follow.
Solar energy: Solar energy is kinetic energy. It is,more precisely, radiant energy, much of it in the form ofvisible light. What arrives at the top of the atmosphere isabout half ultraviolet radiationthe invisible blue radia-tion that-gives us sunburn and half visible light. Whensolar radiation enters the atmosphere, several thingscan happen. It can be reflected, and as we see fromFigure 1-1, 30 percent. of this energy is immediatelyreflected back into space. It can be absorbed by themolecules of, the atmosphere, the ocean, or the landsurface and increase their energy. This added energyheats them, some of it is reradiated away,and lost, somegoes into the kinetic energy of their motion. The solarenergy that gets to the earth's surface is the importantpart for us. It heats the land'and the ocean and is thesource of energy for the great 'currents, the winds andthe waves, in air and ocean.
Man gets some of his energy from the motion of windand water. The sun's energy evaporates water whichrises and is carried on the winds. If it falls on the moun-tains, we get some of it for our use by letting themountain-fed streams and rivers turn the turbines ofhydroelectric plants. In this example we have solar kinet-ic energy being converted to heat energy, then to gravi-tational potential energy as it is lifted, then to mechani-cal energy as it runs back down the reountainsides,and, finally, to electric energy as it is converted by thegenerator the turbine turns. In a much less importantway, we also use converted solar energy with windmillsand sailboats. Here the conversion route is light energyto heat energy to mechanical energy.
The other important way in which radiation interactswith matter is 'chemically. If radiation of the properenergy strikes a molecule, it can cause molecular rear-rangements chemical reactions to take place. Oneof these, the production of ozone at the top of the at-mosphere, protects life on earth's surface. The other,photosynthesis, fuels life.
Ozone is formed when solar radiation splits an ox-ygen molecule into two oxygen atoms. One of theseatoms then combines with another molecule of oxygento form 03, ozone. This molecule strongly absorbs ul-traviolet radiation. The 03 layer at the top of the atmos-phere thus acts as a protective layer against thisenergetic radiation which oth91wise would arrive atearth's surface in lethal amounts.
Photosynthesis is a more familiar reaction. We candescribe what takes place in the following way:
Carbon dioxide (CO2) + Water (H2O) + Energy,Carbohydrates [Cx(H20)y ] + Oxygen (02)

The carbohydrate molecule, whose general formulawe give, is an important part of plant life. Ordinary sugar,fi3r instance, is a carbohydrate whose formula is
C12 (H20)11 (with x = 12 and y ---- 11)
The process of photosynthesis is one, therefore,which converts radiant energy to chemical potentialenergy. The energy stored in the carbohydrate can berele,ased by burning it (or in chemical terms, oxidizing it).This reaction is the reverse-of the one above.
Carbohydrate -i- 02. CO2 t H2O t Energy
Photosynthesis is the source of the foo'cl energy wedepeaiton. It is also the source of the chemical energy
that was stored in the swampy jungles of ancient earthand formed the fossil fuelscoal, oil, and naturalgas. When we burn these fuels we are using storedsolar energy.
We should not leave our brief discussion of solarenergy without mentioning its source. The sun's energyis "thermonuclear" in origin. The sun's interior is hotenough that a "nuclear reaction" takes place Bare bydrogen nuclei, protons, Stripped of their atomic electronsby countless collisions, combine (fuse) to form heliumIn the process some of the mass of the hydrogen isconverted into energy; it is this energy converted toradiant form which travels the 93 million miles to earth
Only a small fraction reaches earth, of course. Thesun radiates in all directions and only 4 parts in 10 billionof the total power emitted reaches earth. But this is
FIGURE 1.1Power Inputs to Earth
Solar Radiation173 T kw
Short Wavelength
Direct Reflection (30%)
52 T kw
Absorption and Reradiation (47%)
81 T kw
Evaporation,Temporary
Storage in
Water, Ice
Long wavelength ,
Tidal Energy
3 8 kw
0*Im4
A°(23%) Conduction TI rough Rocks
Wind, Waves, Currents, etc.,
370 B kw
Photosynthesis
40 B kw
Plant
Storage
Bank
Volcanoes,Hot Springs, Convection
300 M kw
Animals
Total Energy inFossilized Carbon
65 0 Icwhrla)
0 Quadrillion, 1,000,000,000,000,000T Trillion, 1,000,000,000,000B Billion, 1,000,000,000M = Million, 1,000,000
r,
Nuclear Energy(Fission & Fusion)
Earth'sThermalEnergy
NuclearDecay
(a) This is an energy unit times time.
Data from M. Kong Hubbert. The Energy Resources of the Earth," Scientific American 224, 62-63, September 1971.
107
- ., ' 4

plenty, the 173 T kw shown in Figure 1-1, if stored for 24minutes, could provide for all the energy used by thehuman race in 1970.
Chemical energy: The most important form of storedenergy is the chemical potential energy of the fossilfuels. The energy in coal, for instance, was originallysolar energy 300 ar so million years ago. The hugemosses and ferns of the Paleozoic coal swamps diedand fell into the mud. They were acted on.by anaerobicbacteria that released much of their hydrogen as a gas.This in turn-was- driven off by the heat and pressuregenerated by the tons of sediment that covered them, Inthe process the carbohydrates were converted to thealmost pure carbon of coal.
When the carbon atom is burned (oxidized), it re-leases the remaining stored energy in the reaction.
C 02--* CO2 + Energy
Some plant and animal life sank to the bottom of thegreasea beds and went through a different chemicaltransformation under pressure and heat to form the"hydrocarbons," the complicated molecules of hy-drogen and carbon characteristic of petroleum. Theirstored energy is also releasedty burning.
in Table 1-3 we show thenamounts of energy con-tained in the traditional measures of the fossil fuels; tonsof coal, barrels of oil, and, thousands of cubic feet ofnatural gas. For comparisor We also show the energyper pound of all of lhese-Jhis latter comparison showsthat energy per pound (the energy density) is greatestfor natural gas, which is one of the reasons for thepopularity of this fuel.
Chemical energy is used by man in other forms.Food energy is of this form. The energy stored in abattery is also chemical, stored in molec.ular rear-rangements there and released when electrons are al-lowed to move through an external circuit. An important
TABLE 1-3Energy Content of Various Fuels
Fuel Amount
EnergyEquivalent
(M Calories)
Energypar
Pound(Calories)
CoalSoft coal (bituminous) . one ton 6.1 3,100Hard coal (anThracite) one ton 6.4 3,200
Oil, distillate (includingdeisel) barrel 1.5 4,900
Gasoline berrel 1.3 4,800
Natural Gas 1,000 ft' .26 5,000
Wood 1 cord(b) 5.3 1,250
(a)Million.(b)One cord is a pile of wood 4 ft. long, 4 ft. high, and 8 ft. long.
108
device of the future, the fuel cell, will also convert chem-ical energy to electrical energy, it will be described in alater chapter, _
Nuclear energy: A form of potential energy of grow-ing importance is stored in the nucleus, the tiny, densecore of the atom. Nuclei are made up of the elementaryparticles, protons and neutrons. It is by rearrangingthese particles that nuclear energy is stored and re-leased. The fission reaction and the fusion reaction aretwo important examples of this. In the fission reaction aheavy nucleus, such as uranium, is split into two lighterones In this process mass is converted into energy andit is this energy we obtain from the hot interior of anuclear reactor. We describe this in more detail in Tech-nical Appendix 6.
The fusion reaction involves very light nuclei. It is, aswe have said, the source of the sun's energy.n a typicalexample, four hydrogen nuclei, bya complicated seriesof reactions, form a helium nucleus (two protons andtwo neutrons). Again; some of the mass has been con-verted to energy. It is a fusion reaction involving a rareform of hydrogen, deuterium, which scientists are nowtryingto master so that we can use the deuterium in theocean as the fuel in a controlled fusion reaction. Ouronly duplication of the sun's process so far has been toperfect the so- called- "hydrogen bomb," and that didlittle to help us in our quest for energy.
Geotherm0-energy: The earth's interior is moltenrock, "magma" the geologists call it. There is, of course,a tremendous amount of geothermal energy in theearth. It is stored kinetic- energy heat energy insu-lated by the solid, thin crust on which we live.
We are not sure how the energy got there; it may havebeen stored in the molten blob of original earth or it mayhave come from the impact of countless chunks of mat-ter pulled to it by the earth's gravity in that formativeperiod. We are fairly certain, however, that it is theradioactivity of some of the material in the earth whichkeeps it hot. There seems to be enough uranium, potas-sium, radium, and other naturally radioactive material inthe earth's interior to produce the relatively smallamount of heat needed to make up for that lost throughthe surface. In this sense, geothermal energy is nuclearenergy.
Energy from the core leaks out in different ways. Aswe see in Figure 1-1, the largest amount, 32 B kw, isconducted through the crust-in the same way that theheat from a hot pan of water is conducted through thesides of the pan. The insulation of the crust is not per-fect. As we dig down into it, it gets hotter, 48°C for eachmile we go in.
This temperature difference is not great enough to beof use as an energy source, although, in the future, wemay pipe water down heating it to warm our houses. Theleaks that are useful to us are in those regions where themagma is close to the surface. Volcanoes, geysers, andhot springs are evidence of this. The total power arrivingat the surface by "convection " that is, by the move-ment of hot rock, water, or steam is estimated inFigure 1-1 as 300 M kw.

Of this total output, only a limited amount can be used.If available as hot water or steam, it can be used to heatbuildings. Some 500 ,homes and offices in KlamathFalls, Oregon, are heated by hot water drawn from a hotspring running under the town, The only large-scale useof it in this country is in the Geysers Valley in Californiawhere dry steam steam so hot there is no water in itis piped to steam turbines and used to generate electric-ity. There are now generators there producing a total of500,000 kw of electric power, about half of SanFrancisco's needs.
Geothermal energy, like nuclear energy, is an energyof the future. We will describe later on more of the detailsof its use, its potential, and its problems.
Tidal energy: The last of the big five, tidal energy, isprobably the least in importance for man's use. It isrelatively big, on a human scale, 3 B kw (see Figure 1-1),but is dispersed over all the oceans' shores.
The.source of this energy is the kinetic energy storedin the rotation of the earth-moonsystem. Like geother-mal energy, it is another example of the successfultemporary storage of energy in the kinetic form. Thisenergy is converted to the motion of the oceans throughthe gravitational attraction of the moon on their con-tents. The oceans' water is pulled toward the moon onthe near side (and bulges in the other direction on the farside). The up and down (in and out) motion of the watercan be used to turn a turbine. Tidal energy is finallydissipated by friction with the ocean shores, warmingthem imperceptibly.
Tidal generation of electricity is only practical wheregeologic peculiarities cause high tides. The first tidaldam and generator was built in the Rance estuary onFrance's Brittany coast, where tides rise and fall asmuch as 44 feet. It has a total generating capacity ofabout 300,000 kw.
There has also been some interest in building a tidalconversion facility at Passamaquoddy Bay 'on the farnorthern coast of Maine, but it does not yet appearcommercially feasible. We cannot expect much con-tribution to our total supply-of, energy from the tides!
Summary
In this chapter we have tried to introduce you to thevarious forms of energy, the laws that govern its conver-sion from one form to another, and the patterns ofenergy flow that power the great natural engines ofearth as well as man's puny manufactured ones.
Energy can be classified into two types, kinetic andpotential energy. It is used in the kinetic form as heat,light (or, more generally, radiation), and motion. It isstored in the potential form.
Energy is used by conversion from potential to kineticform or from one kinetic form to another. We havepresented and discussed the two laws that govern allthese conversions:
1. Energy can be neither created nor destroyed.2. In any conversion of energy from one form to
another some of it becomes unavailable forfurther use.
This second law, the "heat tax," will prove to be themost important to our understanding ,of the EnergyCrisis.
In this chapter we define and give examples of theunits in which we measure energy and power. We alsodefine work, which is the word we commonly use formechanical energy in man's use. The standard unit ofwork and ener,gy in our piesentation will be the Calo-rie, the energy required to raise the temperature of onekilogram of water, one degree Celsius. The power unitwill be the unit of electric power, the kilowatt (kw),whose definition we defer to Technical Appendix 3.
In the final section we look at the patterns of energyflow on earth. We see the dominance of the spier inputand compare it with the nonsolar continuous sources ofpower, the tides aid the molten interior of the earth. Weend with the identification, from Figure 1 -1, of the fiveprimary forms of energy on earth. the three kineticforms, solar, geothermal, and tidal, and the two poten-
--tiallErms, the chemical energy of the fossil fuels andthe nuclear energy stored in the atom's core.
The rest of our story will revolve around these fiveforms and what happens when they are mined, tapped,or trapped and then burned or otherwise turned to ouruses. The next question is, howe' er, "How much isthere?" We shall answer that in the next chapter.
109

CHAPTER 2The Energy StockpileS-

The Energy Stockpiles
In the preceding chapter we describe the five majorenergy flows to and on earth. Three of these are kineticenergy, the constantly radiated energy from the sun andthe energy stored in the rotation of the Earth-Moonsystem and in the Earth's molten interior The other twomajor flows are from potential energy, stored in theatoms of the fossil fuels and in the nuclei of uranium orsimilar heavy elements.
More important than the kinetic-potential distinction isthe distinction between continuous and depletable re-sources. From our myopic view of the sweep of time,solar and tidal energy can provide a continuous flow ofpower, while chemical and nuclear potential energy aredrawn from a limited stockpile. Geothermal energy fallsin between. Although the ultimate source of this energyis so large that it is for all practical purposes infinite, theactual geothermal reservoirs are not infinite and can beexhausted by drawing the heat energy out of them fasterthan it comes in from below. For the purposes of thischapter we will consider it a depletable resource.
Figure 1-1 gave thebig picture of these energy flows.A more human-sized catalog is provided by Table 2 -1 inwhich the various sources of power (continuous energysources) are presented in terms of power per acre. Inthis table we show not only the big one, solar power, butthe sources of "secondhand" solar power, the winds,photosynthesis, and the energy of running water. Forcomparison we also show the United States power con-sumption in 1973 (the total energy consumption inkilowatt hours divided by the number of hours in a year)averaged over the 2,310 million acres of the 48 contigu-ous states.
Table 2-1 shows us that man has gone big time. Hisconsumption of power per acre is larger than all but thetotal of the winds and the direct solar energy. If weharnessed all the running water in this country, it couldonly provide atenth of our needed power; geothermalpower, in this reckoning, could provide one-fifth. Most
TABLE 2-1Power Per Acre on Continuous U.S.
Source Kilowatts per _acre
Sunlight at Top of Clouds (day/night average)Sunlight Absorbed at Ground Level (averaged)All the windsAU the TidesNatural Geothermal (steam and hot water)All PhotosynthesisAll Hydropower
1,420.810.
2.80.020.250.320.12
1973 U.S. Energy Consumption, average peracre 1.1
Source: Briefings before the Task Force on Energy of the Subcom-mittee on Science, Research, and Development, Committee onScience and Astronautics, U.S. House of Representatives, 92nd Con.gress, Serial Q, March 1972, pg. 79.
it
surprising, perhaps, is the insufficiency of photosyn-thesis. If we burned all the biological growth our landproduced in one year, we would obtain one-third thepower we now consume.
The message.of Table 2-1. is "look to the sun," and wewill, in Chapter 7 of this volume, consider ways of using'this enormous energy flow to meet our growing needs.Now, however, we turn away from these energy flows tothe stockpiles of chemical and nuclear energy and try togauge their size.
The Fossil FuelsThe stockpiles of the fossil fuels are difficilt 1C meas-
ure. They are in fact part of the small planet we live onand must be discovered and extracted before we reallyknow how much is there. Our numbers will, therefore,have built-in uncertainty.
In order to give some idea of the degree of uncer-tainty, we will present our data in the categories indi-cated on the graph illustration of Figure 2-1. Theresource estimates will have two distinctions applied tothem, "identified" and "undiscovered," "recoverable"and 'submarginal." The first distinction is an obviousone. In the distinction between recoverable and sub-marginal resources, both price and technological "know-how" must be taken into account. Ir. ;he .,ase of coal, forinstance, it is not presently economical to mine highgrade coal from seams thinner than 42 inches. In thecase of oil shale, all of this resource was consideredsubmarginal until the increase in oil prices in 1973-1974made it appear economically feasible to begin to extractthis oil from rock. We will present, in the text and illustra-tions which follow, the estimates of resources in thesevarious categories relying on data from the U.S.Geological Survey.1
' "Energy Resources of the United States." P.K. Theobald, S.P.Schweinfurth, and D.C. Duncan. Geological Survey Circular 650.Washington, D.C. 1972.
FlpURE 2-1Presentation of Resource Data (Area of rectanglesare proportional to resource amount)
Recoverable
Subinarginal
Identified
(Reserves)
Certain <
Undiscovered
Uncertain

Recovery: It is, unfortunately, not enough to presentestimates for the total amounts of resources. What weare really interested in is how much of the resource wecan mine-or pump for our use. We need, therefore, to.know more about the actual extraction process. In thetraditional method of underground coal mining, for in-stance, the mine roofs are supported by pillars of coaland about 50 percent of the coal is left in the mine for thispurpose. In surface (strip) mining 75-80 percent of thecoal is recovered.
The situation with oil is even worse. With presenttechniques, only 31 percent of the oil is extracted, twobarrels are left in the ground for every-one recovered.Techniques are under development to improve this re-covery percentage. In one an underground oil pool is seton fire along one side with the hope that the fire, advanc-ing across the pool, will heat the remaining oil, increaseits pressure, and drive more of It up the wells. In otherssteam and water under pressure are used to force moreoil up the wells and detergents are added to make thickoil flow more easily.
Natural gas, being highly mobile, is more easily re-coverable than oil. We are able to extract about 80percent of the total discovered amount of this fuel.
These recovery percentages are used in the resourcesummaries which follow to compute the "recoverable"amount of a fuel (50 percent in the case of coal, forinstance), while the nonrecoverable amount is includedin the "submarginal' categories. Let us now briefly con-sider each of the fossil fuels.
Coal: Coal is the most plentiful of these fuels. We callit fossil because it is made up of the remains of once-living plants. It dates from the Paleozoic era, 300-500million years ago. The earth at that time was warm andwet and the atmosphere had a higher carbon dioxidecontent than it does now. In this "greenhouse" environ-ment vegetation flourished. The carbon we burn as coaltoday was taken from the air's carbon dioxide by thestrange jungles of giant mosses and ferns which cov-ered much of the earth in that era.
These plants died, fell into the mud and water of thoseswampy jungles, were preserved from decay (whichwould have released their energy) by the water coveringthem, and gradually built up, layer after layer, into a thickdeposit. These layers were covered by tons of earthwashed down from the mountains. Under that pressure,and the resulting high temperatures, the volatile gases(hydrogen and oxygen and their compounds) and thewater were driven off resulting in almost pure carbon.Coal is as much as 80 percent carbon in contrast to the50 percent or so in living material. Since the energyresides largely with the carbon (and is released by ccm-bination with oxygen in burning), coal has a higherenergy density than living material. Burning a pound ofwood, for instance, releases only about 1,250 Caloriesof energy, while one pound of high grade coal releases3,100 Calories when burned (see Table 1-3).
Knowing how coal was formed helps greatly in findingit. It is possible from outcroppings, drillings, etc. to esti-mate fairly accurately how much is in a given seam. The
114
U.S. Geological Survey estimates of this resource aregiven in Figure 2-2. Figure 2-3 shows where it is andhow it can be mined.
The "reserves," the coal that has been identified andis economically recoverable, amount to 390 billion (B)tons. For comparison, about 600 million (M) tons of coalwere mined in 1974. In addition to these reserves,another 1,200 B tons of coal that is not at presenteconomically feasible to extract has been identified.This "submarginal-identified" resource includes theother 50 percent of the coal left in the ground when thereserves are extracted. The Geological Survey warnsus that the reserves are known to an accuracy of onlyabout 20-50 percent while the undiscovered submarg:-nal resources might be in error by as much as a factor offive or 10.
We summarize the resource picture in terms ofCalories as well as B tons in Table 2-2. The question ofwhat totals to display returns to trouble us. The "re-serves" seriously underestimate the potential fuel, oil,for instance, is being discovered every day and added tothe reserve category. The sum of all the four blocks offigures like 2-2 are misleading in the other direction,much of the submarginal category will never be minedor pumped or perhaps even discovered. The choice wehave made is shown in Table 2-2. We show the "re-serves" which are the lower limit of the fuel available,and then the total of the "recoverable" category, whichis effectively an upper limit consistent with present tech-nology and economics. The third category, "total re-sources," does not provide a realistic estimate of poten-tial, we include it to show that even this category, whilelarge, is still finite.
FIGURE 2-2U.S. Coal Resources (in billions of tons)
Identified resourcesUndiscovered resources
03.000 It overburden (c)
Recoverable
2001a)
.
1.300
0new
Submarginal 1.2001 340
Source. Energy Resources of the U.S.," P. K. Theobald, S. P.Schweinfurth, and D. C. Duncan, Geological Survey Circular 650, Washington, D.C. 1972.
(a) Recoverable coal in beds 42 inches or more in thickness for bituminous coal and anthracite and 10 feet or more in thicknessfor subbitummous coat and lignite.
(b) Additional coal recoverable in beds 20-02 inches in thickness fa.bituminous coal and anthracite and 3 5 feet in thickness for sub-bituminous coal and lignite.
(c) 3000.6000 ft overburden

The coal resources, in contrast to oil resources, as weshall see, are pretty well known. No further recoverableresources of coal are expected to be discovered. The390 B tons of reserves are, however, already large com-pared to other fuels and the improvement of under-ground coal mining to bring its recovery factor above 50percent will shift some of the 1,200 B tons of submarginalresources into the reserve category.
OH: Oil is formed by a process similar to the one thatproduces coal. Instead of being4he fossil remains ofplant life, however, oil seems to have been formed fromsea animals as well as plant remains which sank to thebottom of the great seas that covered the earth in earliergeologic periods. OH is younger than coal, only a fewtens of million years old instead of hundreds of millions.It was also formed by pressure and the resulting heat.Instead of the simple carbon atoms which form thecrystalline solid of coal, petroleum consists of a greatvariety of complicated hydrocarbon molecules, largemolecules of carbon and hydrogen. The petroleum prod-ucts themselves range from the thick heavy tars andasphalts (the largest molecules), through the oils,gasoline, and kerosene, to the natural gases likemethane, which is a carbon atom plus four hydrogenatoms. The various lighter components of petroleum areformed from the heavier ones by "cracking", they arebroken down by the heat. It is this same process which is
used in a refinery to produce gasoline (one of the lightermolecules) and the other products, kerosene, diesel oil,the fuel oils, etc.
We can again, from the rough knowledge of its forma-tion, guess where oil will be found. The areas to exploreare the sedimentary basins which were once oceans.Oil, however, is not as predictable as coal, and the samekind of rock which will be loaded with oil in Iran will be dry
TABLE 2-2U.S. Coal Resources
Category Amount(B tons(a)) (0 Calories( 1))
Reserves(b)Thick Seams(c)Intermediate Seams(d)
Ultimately RecoverableTotal Resource
390200190
no additional discovery3,200
2,3801,2201,160
19,500
Source. P.K. Theobald, S.P. Schweinfurth, and D.C. Duncan, "En-ergy Resources of the United States," Geological Survey Circular650, Washington, D.C., 1972.
(a)8 (billion, 109) tons; 0 (quadrillion, 101s) Calories.(b)A recovery of 50 percent is assumed.(c)Greater than 42' for high grade coal and 10' for lower grade coal(028" to 42" for high grade and 5' to 10' for low grade coal
FIGURE 2-3 '1.
Coal Fields in the United States
COAL FIELDS
SURFACE mum; REGIONSANALYZED
Source: U.S. Energy Outlook, National Petroleum Council, December 1972.
A4115

in Australia. Even in the well-explored United States it isestimated that more than half the oil is yet to be dis-covered.
The U.S. Geological Survey estimates of total UnitedStates oil resources are shown in Figure 2-4. The re-serves are again relatively small, 52 billion barrelsFIGURE 24U.S..0i1 Resources (in billions of barrels)
11114-Sal 1feet
Undiscovered Resources
Recover.able
52 450
Sub.marginal
No
...
2,100
Source: "Energy Resources of the U.S.," P. K. Theobald, S. P.Schweinfurth, and D. C. Duncan, Geological Survey Cir-cular 650, Washington, D.C. 1972.
(B bbls) of oil which can be recovered (at a 35 percentrate of recovery) from identified oil fields. The map ofFigure 2-5 shows the United States oil fieids.
Even this oil will not be easy to extract; of the 52 B bblsof reserves, 11 B bbls are in Alaska, 6 are offshore fromthe United States and Aliska, and the remaining 35B bbls are on the United States land area. Of this latter,much is accessible only to keep drilling.
Identified submarginal oil, 290 B bbls, includes all theoil left in the ground from past extraction and that whichwill be left by present techniques when the reserves areextracted.
As we did in Table 2-2 for coal. in Table 2-3 we showthe total B bbls and Calories for oil of the three resourcecategories. The 50213 bbls is thus a fairly realistic upperlimit of the total amount of oil we can count on. It will takeconsiderable improvement in technology to enable us toget more of the existing oil out of the ground and thusmove some of the 290 B bbls of identified- submarginaland 2,100 B bbls of undiscovered-submarginal oil upinto the "reserve" category.
Natural gas: Natural gas is formed by the sameprocesses which form oil. It consists primarily ofmethane, as we have said, but contains as well smaller
FIGURE 2-5Oil and Gas Fields in the U.S.
Source: Department of the Interior, U.S. Energy Fact Sheets 1971, February 1973.
116 9

amounts of other similar but more complex hydrocar-bons. Some of these are liquid at room temperature butbecome a gas at 8lightly higher temperatures. These"Natural Gas Liquids," like propane and butane, areNGLs.
Natural gas originates with oil and in fact often helpsprovide.the pressure which drives the oil from the well.Such gas is called "associated" gas. Sinc.e it is so muchmore mobile, however, gas can move through crackedrock or sandstone and collect in a separate deposit,referred to, not unreasonably, as "non-associated" gas.
Because of its mobility and its discovery with andwithout oil, it is extremely difficult tv estimate the size ofundiscovered resources. One can determine the aver-age amount of gas formed per barrel of oil and use thisto estimate the "associated" gas in oil resources. Theamount of "non-associated" gas discovered per foot ofdrilled well fluctuates wildly from year to year and pro-vides no reasonable statistics.
With this admission of uncertainty, we show, in Figure.2-6, the natural gas resources (in trillions of cubic feet,
TABLE 2-3U.S. Oil Resources
Category AmountCB bbls(a)) (Q csioriosoo)
Reserves(b) 52 78
U.S. Land Area 35 53Offshore 6 9Alaska 11 16
Ultimately Recoverable(b) 502 753
Total Resource 2,892 4,340
Source. P.K. Theobald, S.P. Schweinfurth, and D.C. Duncan, "En-ergy Resources of the United States," Geological Survey Circular650, Washington, D.C., 1972.
(a)B bbls (billion, 10' barrels); Q (quadrillion, 10' 51 Calories.(b)A recovery factor of 35 percent is assumed.
FIGURE 2-6U.S. Natural Gas Resources (in trillions of cubic feet)
Irt Ma Unchioovered Resources
Recoverable 290 2,100
Submargmal
170
4,000.
Source: P.K. Theobald, S.P. Schwainfurth, and D.C. Duncan,"Energy Resources of the U.S.," Geological Survey Cir-cular 650, Washington, D.C., 1972.
TCF). The 170 TCF of identified but submarginal naturalgas includes that 20 percent left. when the identified,recoverable gas (reserves) is extracted, plus otheridentified quantities whose recovery is not presentlyprojectable.
Of the 290 TCF of reserves, 30 TCF are in Alaska, 40TCF offshore, and the remaining 220 TCF on the UnitedStates land area. As was the case with oil, those 2,560TCF of ultimately recoverable gas will be increasinglymore difficult to find and extract. It is expected thattwo-thirds of this amount will be in operationally difficultareas, at deeper than 15,000 feet, for instance, oroffshore, or in Alaska. This gas will therefore be muchmore expensive to produce.
Estimates of the total gas resource vary by a factor ofthree, with the highest total almost double the one weshow in Figure 2-6. For consistency with this chapter,however, we will use the U.S. Geological Surveydata throughout. In Table 2-4 we provide a summaryof the total number of TCFs and Calories of naturalgas in the three resource categories.
Oil shale: A new entry on the list of resources is oilshale. Some of the petroleum formed at the bottom ofthe sea beds did not escape as a liquid or gas but wasinstead-bound into the clay sediment itself which, aftereons of pressure and heat, pecame a flaky, soft rockcalled shale. The amount of petroleum bound in theserocks can be quite high, Some of the shale in the de-posits in pre-war-Estonia average 11/2 to 2 barrels of oil(63 to 84 gallons) per ton of rock and can be burned as itis. Most of the shale, however, assays, at only a fewgallons per ton.
The most significant United States oil shale depositsare in the Colorado, Wyoming, Utah area shown on themap of Figure 2-7. The richer shales shown by thedarker shading have oil content of at least 25 gallons perton and these will be the first shales mined. The variousresource categories are shown in Figure 2-8.
The recovery of oil from oil shale is just beginning tobe economically feasible. The rock must be mined,crushed, and then heated to drive out the oil. At the time
TABLE 2.4U.S. Natural Gas Resources
Category Amount(TCF(2)) (Q Caloriesii))
Reserves(b) 290 75
U.S. Land Area 220 57
Of fshqp,e 40 10
Alaska 30 8
Ultimately Recoverable 2,560 621
Total Resource 6,560 1,710
Source: P.K. Theobald, S.P. Schweinfurth, and D.C. Duncan, "En-ergy Resources of the United States, Geological Survey Circular650, Washington, D.C., 1972.
(8)Triilion (1012 ) cubic feet; Q (quadrillion, 10' s )(b)Recovery factor of 80 percent is assumed.
117

of preparation of Figure 2-8, the expected cost of recov-ery of this oil, about $6 per barrel, was too high to allow itto compete with cheap Mideastern and South Americanoil. The tremendous price increases in 1973-1974 allowus to change the designation of the 160-600 B bbls shown
FIGURE 2.7Major Oil Shale Resources
Great Donde Basra
Rock Springs
Washalde Basal
WYOMING
COLORADO
Sand Wash Basin
Rifle
BattlementMex..
1111111111
gio
Area underlain by the Green River Formation
Approximate extent of se/acted minable seam in theMahogany Zone (at least 30 feet thick and averagingat least 30 gal:/ton).
Source' U.S. Energy Outlook, National Petroleum Council, Decem-ber 1972.
FIGURE 2-8U.S. Oil Shale Resources (in billions of barrels)
Identtfied ResourcesUnehuovered Resources
11127:1=111=1717M172".. L1120111717:11"171
Pararnartnal
Submarpnal 2,500 20,000
(a) Oil content greater than 25 gallons barrels per ton.
Source: "Energy Resources of the U.5.7 P. K. Theobald, S. P.Schweinfurth, and D. C. Duncan, Geological Survey tir-cular 650, Washington, D.C. 1972.
118
as "paramarginal" in the original U.S. _Geological Sur-vey presentation to "identified recoverable" in our ver-sion. We shouldstill caution, however, that large-scaleprocessing of oil shale is only just beginning and it is notat all certain that we should really consider oil from shaleas a "reserve." We continue in this cautious interpreta-tion in Table 2-5 and include under "ultimately recover-able" only-the 600 plus 850 B bbls from the "identified"and the "extension of known resources" categories ofFigure 2-8.
Tar sands: There is a fourth, rather small potentialsource of oil similar to the shales. In this case the oil,rather than impregnating shale rock, has been formed insand and binds this material together. It must be proc-essed in a manner similar to shale, mined and thenheated. There is essentially no United States experi-ence with tar sand (although the Canadians are miningtar sands in Alberta), so the only category which it canbe put into at present is that of total resource. The 18-28B bbls resource shown in Table 2-6 is an estimate of thecontent of some known deposits in Utah.
Nuclear Fuels
The 'nuclear reactor is a newcomer in the energyscene. Only in the past three or four years, in fact, havethese plants begun to produce more electricity than theyconsumed in their manufacture and in the processing ofnuclear fuel.
TABLE 2.5U.S. Oil Shale Resources
Category Amount(B bbls(a)) (0 Calories(a))
Reserves(b)
Ultimately RecoverableTotal Resourca(c)
160.6001,010.1,4505,110.5,550
240-9001,520-2,1807,670.8,330
Source: P.K. Theobald, S.P. Schweinfurth, and D.C. Duncan, "En-ergy Resources of the United States," Geological Survey Circular650, Washington, D.C., 1972.
(a)B bbls (billion, 10') barrels); Q (quadrillion, 10' 5 ) Calories.(b)Oil content greater than 25 gallons per ton and deposits greaterthan 10 feet thick. One hundred percent recovery assumed for lackof relevant experimental data.(c)Includes only "identified recoverable" and "extension of knownresources" from Figure 1.6.
TABLE 2.6U.S. Tar Sands Resources
Category
Total Resource(b)
Amount(B bbls(a))
18.28(0 Calories(0)
27-42
Source: P.K. Theobald, S.P. Schweinfurth, and D.C. Duncan, "En-ergy Resources of the United States, Geological Survey Circular650, Washington, D.C., 1972.
(a)B bbls (billion, 10' barrels); Q (quadrillion, 101 5 ) Calories.(b)No estimate of recovery factor.
1

There is much of interest to say about nuclear reac-tors, about how they work and their advantages anddisadvantages compared with other sources of power.We will enter this discussion in a later chapter. In thisone, we will limit ourselves to an estimate of the size ofthe fuel stockpile and discuss the process of using thisfuel only where it is essential to understanding thatestimate.
_ Uranium: The most important nuclear fuel isuranium, one of the heaviest of the elements. It is aradioactive element and, in fact, the uranium prospec-tors, so much in evidence in the 1950s, used detectorsof radioactivity, "Geiger counters," to look for it.
Uranium is a rare mineral. On the average it occurs ina ratio of 2 parts per million (ppmin the crust. Itoccurs in greater concentrations in certain rocks andores; this concentration ranges from 4 ppm in granite, to70 ppm in the Chattanooga shales, to 2,000-3,000 ppmin the uranium ores whiCh are mined commercially,
If the "breeder reactors," which we will describe in thechapter on new energy technology, come into being,some of the dilute uranium ores, even the Chattanoogashales and granite, could be used as fuel. At present,however, we will explore the size of the resource interms of the richer ores.
Uranium is mined and refined to a uranium oxide,U308. The resources are traditionally expressed interms of tons of U308 -and we will follow this practice. Inassigning the amounts of identified ore to the various
categories, the price for the recovery of the U308 is thedominant factor. In 1970 the ore was proTurid for $8per pound dr less and that price is chosen for the cut-off be-tween the recoverable and the submarginal categories.In this latter category only uranium that can be producedfor less than $15 per pound is listed. As the price ofelectricity increases, more expensive ores can beadded to the resource estimate. This will be especiallytrue if the "breeder reactor" enters the picture, for thenthe cost of the ore will be only a small part of the. totalcost of electricity.
Figure 2-9 shows the U.S. Geological Survey esti-mate of uranium resources, and Figure 2-10 gives thelocation of themostimportant-deposits: TO the recover-able and submarginal categories already discussed, weadd a third category, "by-product." There are two exist-ing processes that produce uranium as a by-product.One of these is copper mining and the other the miningand refining' of phosphate rock in the manufacture offertilizer. It ts estimated that at least 1,000 tons per yearof U308 at,under $10 per pound could be obtained fromthe copper ores and that similar amounts could be ob-tained from the phosphate rock. It must be pointed outthat these prices for the U308.assume that the recoveryof uranium is part of the mining-refining process forthese ores. If the uranium is thrown away, as it is now, itis removed from the by-product category, and its costof recovery increases.
The summary, Table 2-7, is presented in terms ofprice as this is the most important determinant of the
FIGURE 2-9U.S. Uranium Resources (in thousands'of tons)
IdentifiedUndiscovered
fin known districts)(In unknown
districts)
Recoverable(a) 250 500
250
Submarginal(b) 200 400
By Product" 1,000
119

recoverable or submarginal classification. The conver-sion of tons of U306 to Calories, however, cannot bemade without some reference to what takes place in thereactor. For the present we will base our results on twopieces of information (from the Atomic Energy Commis-sion). A 1,000 megawatt (million watt, Mw) conventionalreactor plant operating at 75 percent capacity usesabout 130 tons of U308 per year. During that year it willgenerate 6.6 B kw-hrs of electricity. Since, at the presenttime, electric energy is the only output of the reactor,we will use for our_conversion 130 tons of -U308 as the
of 5:6- B kw-hrs (5.7 T Calories) of energy or44 B Calories per ton. The energy equivalents of thevarious classes of uranium resources shown in Table2-7 use this conversion.
What is surprising is the relatively small size of theuranium resource. It must be remembered, however,that this computation of Calories is based on the genera-tion of electricity in the present, not very efficient, "lightwater reactor," whereas the other fuels are converted toCalories at full value. The price factor also enters in. Wehave included only the total resource available at lessthan $15 per pound. If we were to move the scale up to$30 per pound, we could add another 1,300,000 tons tothe total resource. Even with thiS' explanation, Table 2-7reminds us that uranium is also a finite resource. It has,however, a potential of extension the others do nothave. The present reactors use a rare form of uranium,the isotope U235 ("Isotopes" and the meaning ofnumbers like 235 are explained in Appendix 6.) U235
FIGURE 2-10Uranium Resources Western United States
toto.t4t4
11111111
PRINCIPLE KNOWN URANIUM RESERVEAND RESOURCE AREAS
OTHER AREAS GEOLOGICALLYFAVORABLE FOR EXPLORATION
-----1-durac-0.S: Energy Outlook, National Petroleum Council, December 1972.
120

is present as less than 1 percent of the total amount ofuranium. The rest of the uranium, the isotope U238, isnot used. If the breeder reactor works and is judged safeenough to use, it can convert the common U238 to fuelas well and the resources tabulated in Table 2.7 will bemultiplied by perhaps a factor of 50. The uranium re-sources then begin to rival coal in energy content.
Thorium: The other naturally occurring nuclear fuel isthorium. This is also a rare material, a metal-likeuranium that is also radioactive. It is more abundantthan uranium, averaging about 12 ppm in the earth'scrust as against uranium's 2 ppm.
Thorium is used only in one existing reactor, the hightemperature gas reactor (HTGR) at Peach Bottom,Pennsylvania, where it makes up only 10 percent of thefuel load. Another HTGR is under construction at FortSt..Vrain, Colorado. The HTGR is a breeder reactor andthe thorium is converted into a uranium isotope, U233.We describe these reactors along with the others inTechnical Appendix 6. For now it is sufficient to say thatthorium is a submarginal fuel which waits on furthertechnological develqpment for full use.
A large supply of thorium awaits utilization. In theNorthwest, at Lemki Pass in Idaho and Montana, some47,000 tons of thonum oxide ore have been identified andanother 33&000 tons is inferred there. There are alsodeposits in the Southeastern United States.
We show, in Table 2-8, the most recent AEC esti-mates of thonum ore available at less than $10 perpound. These are minimal estimates since very littleexploration for thorium has actually taken place. We donot convert the tons of ThO2 to Calories in this table, asthe conversion process is still too new to give us areliable guide. Since the energy ultimately availablefrom a pound of thorium is about the same as is availa-ble from a pound of uranium, we see by reference toTable 2-7 for uranium that there is also much energywaiting for us in the thorium deposits.
The Other Sources
We have now summarized the extent of our re-sources of fossil fuels and have also looked at thenuclear fuels we will be counting on more and more
TABLE 2-7U.S. Uranium Resources
Category Amount(Millions of tons) (Q Calories(2))
-.-
Reserves (less than $8 per pound) 250 11
Ultimately Recoverable(less than S8 per pound) 1,000 44
Byproduct(less than $10 per pound) 1,000 44
Total Resource(less than $15 per pound) 2,600 114
Source: P.K. Theobald, S.P. Schweinfurth, and D.C. Duncan, "En-ergy Resources of the United States, Geological Survey Circular650, Washington, D.C., 1972.
heavily in the next several decades. We wilifiriM ujithictabulation by looking briefly at three other sources ofenergy of varying importance. These are tidal energy,which is not presently used in the United States al-though it is used elsewhere, geothermal energy, whichis beginning to assume some importance here andglobally as well, and the oldest one of them all, theenergy of falling water.
Energy from the tides: As we can deduce fromeither Figure 1-1 or Table 2-1, we cannot expect muchhelp from the tides. The amount of energy in them isfairly small. The practical restrictions are even greater.There must be a tidal change of 15 feet or so to makesuch an operation worth considering, there must be aconsiderable flow of water, and so on. The only seriousstudy of such a project in the United States has focusedon the Passamaquoddy Bay between Maine andCanada. The studies have not so far showed a reason-able commercial feasibility.
Geothermal energy: The steam created by conduc-tion from the earth's molten interior is an old, newsource. Steam from the Lardello, Italy, geothermal fieldhas been turning electric generators since 1904. We didnot begin to use this free energy in this country, how-ever, until 1960 and even now our one operating field,California's The Geysers, has a total capacity of 500Mw, only about 0.1 percent of the nation's total generat-ing capacity. This capacity, however, is now the largestof any of the world's geothermal generating systems.
From such meager experience with geothermalenergy, resource estimates are very uncertain. TheU.S. Geological Survey estimates are shown in Figure2-11. (We consider geothermal energy here as a finiteresource for reasons we have already mentioned theavailable energy can be used up faster than the heatconduction can replace it.) A map showing the cluster-,ing of these resources in the far West is shown asFigure 2-12.
The resource estimate shown in Figure 2-11 differsfrom the others in that it is given directly in Calories, Thisis appropriate because this resource is already in the
TABLE 2.8U.S. Thorium Resources (Th02 )
Category Amount(Thousands of tons)
Reserves (identified and less than $10 perpound) 65
Lemki Pass 47
S.E. United States 18
Ultimately Recoverable (identified andinferred at less than $10 per pound) 400
Lemki Pass 382S.E. United States (no additional
discovery as yet) 18
Source. P.K. Theobald, S.P. Schweinfurth, and D.C. Duncan,"Energy Resources of the United States," Geological Survey Circular 650, Washington, D.C., 1972.
121

form- of heat energy-inarrivingatthe 2,250 Q Calories,the total amount of heat energy available in steam fromthe Geysers and other known areas (excluding those in
FIGURE 2-11U.S. Geothermal Resources'(in Q [10151 Calories)
!donut'ReSOUrCe
Undiscovered Resources
ecoverabl 2.250
Sub.Magma! >10.000.000
Source: P.K. Theobald, S.P. Schwemfurth, and D.C. Duncan,"Energy Resources of the U.S.," Geological Survey Cir-cular 660, Washington, D.C., 1972.
our National Parks) is reduced by the 15 percent effi-ciency with which this steam is produced. There areabout 2,000 0 Calories of measured resource and3,000 Q Calories inferred in the Geysers alone, andanother 10,000 Q Calories inferred or measured else-where. Thus, from this total of 15,000 Q Calories, wecan only expect to extract 2,250 Q Calories.
The much larger submarginal figure of greater than10,000,000 Q Calories is of a different sort altogether.The Geysers turbines use "dry steam," steam that is sohot there is no water mixed with it, and very little in theway of other impurities. Such steam can be piped di-rectly,to the turbines with only some simple screening toremove abrasive particles. The recoverable re-sources estimate is also restricted to dry steam fields. Ifwe also include steam that is not so hot, hot water, andeven hot rocks at a reasonable depth' of 10 kilometers(about 6 miles), we get the much larger submarginalestimate. To use these forms of geothermal energy willtake new. technology. We will, therefore, look again atthis resource in Chapter 7.
Water power: The oldest of the sources of energy wehave been considering here is water power. Waterwheels were put into use by the Romans at about the
FIGURE 2.12Location of Geothermal Resources in the U.S.
Data from "Project Independence Report," Federal Energy Administration, November 1974.Areas of Promise
122

time of Christ and were, with wind, a source of powerlong before the steam engine.
Table 2-1 warns us that it is not a source with largepotential Except for a few grain mills, in this.country weuse it exclusively for the generation of electricity, towhich it contributes about 15 percent of the total. Fromstream-flow data it is found that the production of this 15percent already uses about a third of the total potentialenergy from flowing water available to us. Much of theremaining potential is protected by legislation such asthe., Wild and Scenic Rivers Act. The Federal PowerCommission predicts,that the 51,600 Mw of 1970 hyd-ropower generating capacity will increase to 82,000 Mwby 1990. There is not\ much potential for increasebeyond that.
United States Energy StOckplies
Table 2-9 summarizes the resource information wehave just discussed, the same data is presented graphi-cally in Figure 2-13. These presentations emphasizeagain the dominance of coal in the resource picture, it is30 times as abundant in the reserves category as oil ornatural gas. Oil shale, in fact, is the next largest reserve,but the practical availability of that fuel is yet to betested. The actual amount of energy from this source wewill extract and consume will, in all likelihood, be con-siderably smaller than the amount we show as a reservein Table 2-9.
World Energy SuppliesOne of the most important lessons of the science of
ecology is that "everything is connected to everythingelse." We are beginning to learn that lesson on a humanand global basis where energy is concerned. Welearned -the obvious lesson of our dependence on theoil-rich countries of South America and the Mideastduring the embargo the Arab countries placed on oilshipments in 1973-1974. We will see subtler instancesof it as energy shortages in other countries cause politi-cal, social, and economic changes which affect us. It isnecessary, therefore, even in a Source Book,intendedfor a home audience, to look at least briefly at the energy
TABLE 2.9U.S. Energy Stockpiles (Q Calories)(a)
FuelCategory
Reserves Ultimately Recoverable
CoalOilNatural GasUraniumOil Shale
Total
2,380787511
240.900
2,380(b)753621
881,520.2,180
2,784.3A44 5,362.6,022
Source: P.K. Theobald, S.P. Schweinfurth, and D.C. Duncan, "En.ergy Resources of the United States," Geological SurveyCircular 650, Washington, D.C., 1972.
(a) (;) (quadrillion, 101 S) Calories.(b) No additional discovery is expected but new recovery techniques
could add significantly to this total.(ci Includes "by-product" at under $10 per ton (See Table 2-7).
resources of the world. We will follow our previous pat-tern and consider the fossil fuels, the nuclear fuels, andthose three "others."
The Fossil Fuels
The world also depends heavily on the fossil fuels Ona percentage basis (1972 data) the world drew on thevarious sources in the percentages shown in Table2-10. Only water power of the non-fuel sources made anappreciable contribution, 7.4 percent to fossil fuel's 92 2percent. It is thus important to look at the size of theWorld's stockpiles of coal, oil, and natural gas and toalso look beyond these traditional forms to oil shale andtar sands.
We show these resource data in two different ways.Figure 2-14 shows the total worldl"recoverable re-sources" of each of these five types of fossil fuels. In thispresentation we have already built inithe recovery fac-tors, 50 percent for coal, 35 percent for oil, etc. dis-cussed earlier. The restrictions of price and availability(the depth of coal seams, etc.) have also been takeninto account. As was the case with )United States re-sources, we see that coal overshadows all others, fol-lowed by the still questionable resource of oil shale.
Figure 2-15 compares the have and have-not regionsof the world. The recoverable resources of the UnitedStates in the five categories (coal, oil, etc.) we usedpreviously are compared with the eight other continentalareas. Several facts stand out. In particular, we see thatthe superpowers are rich in energy resources, and wesee why the Middle East is so concerned about its oil; ithas no other energy resource.
FIGURE 2-13U.S. Ultimately Recoverable Resources
2,000
1,500
1,000
500
1973Consmpt
19.1 OCal I
Coal Oil Natural Uranium Oil ShaleGas
123

Nuclear Fuels
Other countries are looking to the nucleus for help inthe energy crunch also. By 1980 it is expected that theimportance f the world's use of nuclear energy will
. have grown from the 0.3 percent of Table 2-10 to 4,7percent. It is thus of importance to judge this stockpilealso.
Table 2-11 shows the major landlords of uraniumreserves. The dominance of the United States in this
TABLE 2-10World Energy Consumption by Soc. te, 1.172
Source Q Calories(*) Percent of Total
CoalOilNatural GasHydroNuclearTotal
16.322.410.81.00.2
50.7
32.547,318.02.00.3
testa from. Energy Facts, Science Policy Research Division, Con-gressional Research Service, Library of Congress, Washington, D.Z.,1973.
(a) Q (quadrillion, 101s) Calories.
picture is due in part to the more thorough search whichhas taken place here.
To give comparison data, we calculate, in Table 2-12,the world uranium resources in terms of Calories, basedon the same conversion factors we used earlier in Table2-7 for domestic uranium. It should be said, even morefirmly in this case, that these are estimates. Only theUnited States has been reasonably well explored foruranium, and resources in the Communist countries arenot even known.
The world also has enormous supplies of thorium.Table 2-13 shows the amount of this rare metal availa-ble at under $10 per pound already known to exist orinferred in various parts of the world. We see that wehave already, without thorough exploration, discoveredalmost as much cheap thorium as we have cheapuranium.
The Other Sources
The world shares in the distribution of the three"other" sources tidal, geothermal, and water power.The first of these is not very important globally. There isa tidal plant on France's Brittany Coast, on the Ranceestuary, which produces 240 Mw of electric power from24 generators. A second tidal generator is reported to
FIGURE 2-14Remaining Recoverable Fossil Fuel Resources, Worldwide
55,000
50,000
45,000
40,000
35,000
30.000
25,000
20.000
15.000
10,000
5.000
I
Coal andLignite
Natural Gas PetroleumResource
Oil Shale Tar Sands(Canada
1
Source. "Fossil Fuel Resources," R. Williams, Chapter 2, in Energy and Human Welfare, Volume Ii, Commoner Boksenbaum and Cart (Riverside, NeW Jersey: MacMillan Informbtion, 1975.
124
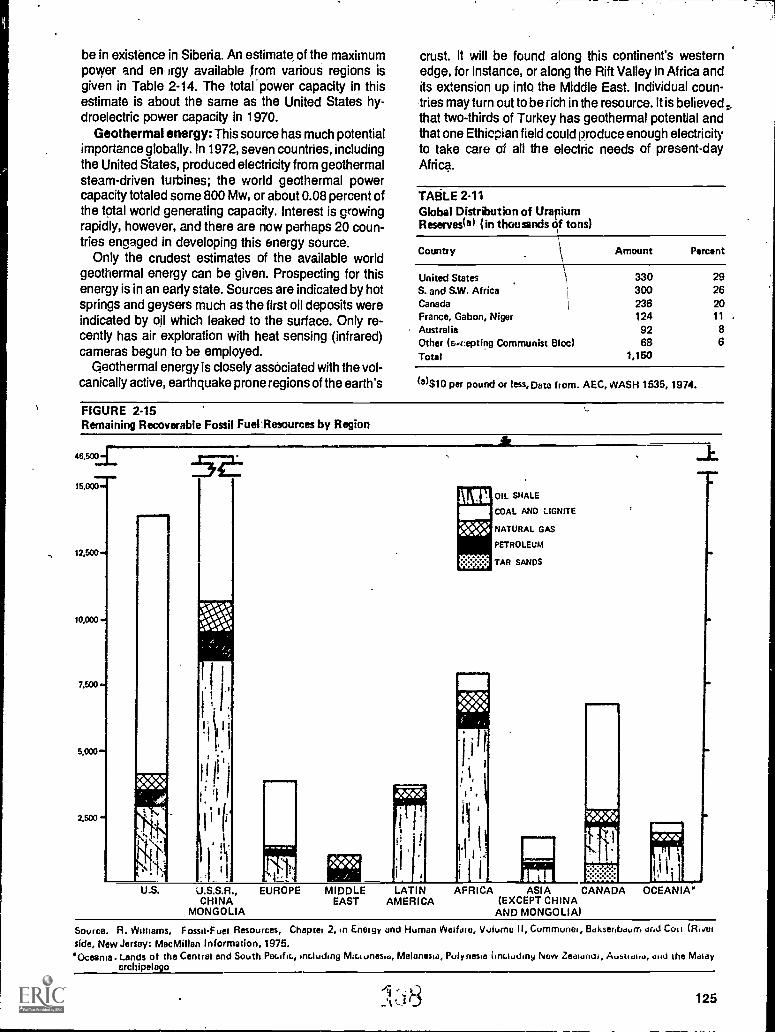
be in existence in Siberia. An estimate of the maximumpower and en irgy available from various regions isgiven in Table 2-14. The total power capacity in thisestimate is about the same as the United States hy-droelectric power capacity in 1970.
Geothermal energy: This source has much potentialimportance globally. In 1972, seven countries, includingthe United Slates, produced electricity from geothermalsteam-driven turbines; the world geothermal powercapacity totaled some 800 Mw, or about 0.08 percent ofthe total world generating capacity. Interest is growingrapidly, however, and there are now perhaps 20 coun-tries engaged in developing this energy source.
Only the crudest estimates of the available worldgeothermal energy can be given. Prospecting for thisenergy is in an early state. Sources are indicated by hotsprings and geysers much as the first oil deposits wereindicated by oil which leaked to the surface. Only re-cently has air exploration with heat sensing (infrared)cameras begun to be employed.
Geothermal energy is closely associated with the vol-canically active, earthquake prone regions of the earth's
crust. It will be found along this continent's westernedge, for instance, or along the Rift Valley in Africa andits extension up into the Middle East. Individual coun-tries may turn out to be rich in the resource. It is believed,that two-thirds of Turkey has geothermal potential andthat one Ethiopian field could produce enough electricityto take care of all the electric needs of present-dayAfrica.
TABLE 2-11Global Distribution of UraoiumReserves(a) (in thousands df tons)
Country Amount Percent
United StatesS. and S.W, AfricaCanadaFrance, Gabon, NigerAustraliaOther (s.cepting Communist Bloc)Total
3303002361249268
1,150
29262011 .
86
6)810 per pound or less, Data from. AEC, WASH 1535, 1974.
FIGURE 2-15Remaining Recoverable Fossil Fuelflesources by Region
46,500
15,000.
12,500.
10,000
7,500.
5 0 0 0
2,500"
I
MN.41
U.S.S.R., EUROPECHINA
MONGOLIA
MIDDLEEAST
I!
I
LATINAMERICA
4.1101111
OIL SHALE
COAL AND LIGNITE
NATURAL GAS
PETROLEUM
TAR SANDS
111
AFRICA ASIA CANADA(EXCEPT CHINA
AND MONGOLIA)
OCEANIA"
.1111110
Source. R. Williams, Fossil-Fuel Resources, Chapter 2, in Energy and Human Welfare, Volume U, Communei, Baksenh-dual and Coll (13,wet
side, New Jersey: MacMillan Information, 1975.'Oceania. Lands of the Central and South Pacific, including Micionesia, Melanesia, Polynesia tinciuding New Zeaianui, Austi ditO, and the Mindy
archipelago
125

For a world-wide accounting we turn to one made byD.E. White of the U.S. Geological Survey. He estimatesthat a total of 1019 Calories of heat energy in hot water orsteam sources were present above a depth of 10 km(6.6 miles). If 1 percent of this were used at a conversionefficiency (to electric energy) of 25 percent, it couldproduce 60,000 Mw of electric powerover a period of 50years. This is 60 times the present installed geothermalcapacity but is only about the size of the tidal resourcesof Table 2-14, and a little larger than the total UnitedStates hydropower generation.
White's estimates are not the most optimistic onesand the new interest in this source of free energy maydevelop data that will prophesize a more important fu-ture. The-total contribution of geothermal energy, how-ever, will be a small fraction of the world's total con-sumption of electric energy.
Water power: The world has made much use of itswater power, but it has been erratic. Canada and Nor-way, for instance, generate a large percentage of theirelectric power from their abundant fast-flowing streams,while the African countriestiave developed very little ofthe potential of theirs.
A summary of world water-power capacity is providedby Table 2-15 which shows both the power capacity forthe various regions and the amount of that capacity that
TABLE 2-12
World Uranium Resources
Category
Amount(Thousands of tons)(Q Calories(o))
Reserves (under $10 per pound) 826Estimated Additional (under $10
per pound) 743
Submarginal Identified($10$30 per pound) 1,358
Total Identified and Inferred(under $30 per pound) 216
36
33
60
Source: Office of Economic Development, 1967.
(a) Q (quadrillion, 10")
TABLE 2-13
World Thorium Resources(a)(in thousands of tons of ThO, )
Country
India
CanadaAfricaAustraliaBrazil
Total
ReasonablyAssured
30065
1005010
10
535
Possible
Additional Total
25033515550
20810
550400255100
1030
1,345
(11)At $10 per pound or less; data from AEC, WASH 1535, 1974,
126
has been developed (as of 1962). It is clear that onlyNorth America and Western Europe are using their re-sources to a significant fraction of their potential It isalso clear that South America and Africa, which, as wesaw from Figure 2-15, are not blessed with fossil-fuelresources, are rich in water power. The past decade hasseen the beginning of plans to utilize this energy asset inthose regions.
Summary
The energy resources we have considered in thischapter are of two forms. Some are best described asenergy flows power and others as stockpiles ofstored energy. Solar and tidal energy fit into the firstcategory; we have somewhat arbitrarily put geothermalenergy, along with chemical and nuclear energy, intothe latter.
TABLE 2-14
Maximum World Tidal Power Capacity
Location
Average PowerPotential(Mw)(a)
Bay of Fundy 29,000Argentine 5,870\England 1,700France 11,100
U.S.S.R. 16,000
Total 63,800
PotentialAnnualEnergy
(B kw.hr)(b)
255
5
560
Source. Brian J. Skinner, Earth Resources (Englewood Cliffs, NewJersey: Prentice Half, ) 1968.
(a)Megawatts (million, 10' watts)(b)Billions of kilowatthours.
TABLE 2-15
World Water-Power Capacity(in thousands of Mw)(a)
Rogicn PotentialPercent
of TotalAmount
Developed
North America 313 11 59
South America 577 20 5
W. Europe 168 6 47
Africa 780 27 2
Middle East 21 1 --
Southeast Asia 455 16 2
Far East 42 1 19
Australia 45 2 2
U.S.S.R., China,and Satellites 466 16 16
Total 2,857 152
Source: Brian J. Skinner, Earth Resources (Englewood Cliffs, NewJefiey: Prentice Hall) 1968.
(a)Mw = megawatts (million, 106 watts).

These energy flows, or continuous sourceswesometimes term them, are all large enough td 'makeuseful contributions to our needs. One of them, solarpower, could take care of us now and in years to come.However, we have developed little in the way of tech-nology to allow use of these forms of free power anddepend almost exclusively on energy from our depleta-ble stockpiles. It is on the assessment of these stock-piles, for the United States and the world, that we fo-cused this chapter.
The relevant data are summarized graphically in Fig-ures 2-13 and 2-14. In both the United Slates and theworld, coal is the largest stockpila. Ther0' is at least 10times more coal (30 times more in the LLS.) than of oil orgas, although if the production of °HAI0m oil shale be-comes practical, this resource will rival that of coal. Wealso found, somewhat surprisingly, that the stockpile ofuranium, due to our present inefficient conversion of itsenergy to electrical form, is not' a large one. Improve-ment in conversion techniquei and increased explora-tion will probably change that part of the picture.
The data of this chapter give us some idea of the sizeof our energy stockpiles. The next question would seemto be, "How long will they last?" Before we can answerwe must have some information about the use of thesefuels, and that will be the subject of the following chapter.
127

CHAPTER 3The Flow of Energy
141

I
The Flow of Energy
In the previous chapters we became familiar with theprimary sources of energy, the sizes of kinetic energyflow, and the stockpiles of potential energy avail-able to us. It is now time to look more closely at energyin the service of man, to follow energy from these pri-mary sources through our industrial system. We will beinterested in the amciunt of energy that goes into each ofour major consuming sectors as well as the form ofenergy used (whether it is electric, chemical, etc.). Mostimportant, we will want to know the efficiency with whichit is used. All this information will be pertinent when wetry to design strategies for energy conservation in a laterchapter. Those sectors in which large amounts ofenergy are used inefficiently will be the prime targets.
This chapter, therefore, has two distinct parts. In thefirst half we survey the pattern of energy consumption inthis country and add on some of the gross features ofworld energy consumption. In the latter half we considerthe question of the efficiency of the most importantenergy conversions.
Consumption by Conversion
A sailboat sailing gracefully in the wind and a water-wheel grinding corn are among the few remaining ex-amples in our complex industrial society of energy beingused in its original form. In almost all other cases whenwe speak of "using" energy, we are really talking aboutconverting it from one form to another. Energy is notconsumed in our system, it flows through it, with only theabsolute amount (the total Calories) remaining (as thefirst law tells us) the same.
We symbolize this flow in a crude way by Figure 3-1.We classify energy in three different ways. as primarysources, which we described in Chapter 1 and meas-ured in Chapter '2, as intermediate forms, and as enduses. Figure 3-1 is not a precise diagram, thermalenergy, for instance, is an end use in home heating orsteel-making, but an intermediate form in the au-tomobile engine: In the generation of electricity, severalintermediate forms of energy occur. In a coal-firedgenerating plant the primary (chemical) energy of coal isconverted to thermal energy in the furnace, converted tomechanical energy is converted to electric energy bymechanical energy is converted to electrical energy bythe generator. The nuclear generation of electricity isalso a multistep conversion.
As we have said, the primary sources occur both askinetic and potential energy; solar, geothermal, and tidalare kinetic, while chemical and nuclear are potential.The intermediate forms are all kinetic, they are energy intransit from one form to another. Electric energy is theprototype intermediate form; it must always be con-verted to be useful to man.
The end uses, as were the sources, are split betweenkinetic and potential types. When we use energy toproduce work, light (or other forms of radiant energy)) orheat, we are using kinetic energy. A significant amount
of the energy expended in the industrial sector goes intothe rearranging of molecules and thus into chemicalpotential energy. Some of the energy used in refiningraw materials is stored in this way; plastics manufactureis an example. This stored energy is then releasedwhen plastics burn or metals rust.
With the qualification that consumption means con-version, we will now give a quantitative dimension to thequalitative picture of Figure 3-1.
Patterns of Consumption.,In 1973 we consumed, on the average, 52 Trillion (
Calories of energy per day in this country. This wasreduced to 51 T Calories in 1974.) How was this energyused? The only reported thorough study of this questionwas made by the Stanford Research Institute for theU.S. Office of Science and Technology using 1968 asthe reference year. The qualitative results of this study,as far as the percentages expended in the various sectors are concerned, apply with little change today, al-though the total amount consumed in each category hasincreased.
FIGURE 3-1Paths of Energy Conversion
Intermediate
THERMAL MECHANICAL ELECTRICAL
SOLAR
warati02,f0ImarAsfIIIII/111/1111111
10,CHEMICAL MO1=0
NO1111111111,11111/winewje 14
21 0
ANUCLEAR 2
GEOTHERMAL / ;00011
P/°°.$1
TIDAL0
0
FLOME
0
0
0 /MiME 1
1010d
THERMAL
'i Ar0Ar9MECHANICAL
0d
CHEMICALAA
RADIANT040
Legend. The smaller ones.-? imamate relabveiy unomportint svnvelswns
131

In 1968 a total of 15.3 Quadrillion (Q) Calories ofenergy was consumed in this country. (The total in1973 was 18.9 ()Calories and in 1974, 18.5 Q Calories.)This energy was divided in the percentages shown inFigure 3-2 among the four major sectors. Residential,Commercial, Industrial, and Transportation. This figurealso shows the major end uses of the energy within eachsector. Electric energy gives us a problem since twothirds of the energy used to generate it is wasted. InFigure 3-2 we assign to each sector not just the electric-ity consumed but all of the primary energy (from fossil ornuclear fuels) used to generate this electricity.
Another way of looking at energy consumption is by abreakdown of end use. Table 3-1 provides the per-centage of total of the top 12 end uses. Of the 100 or soways in which energy is used in our economy, these 12accounted for 97 percent of the total in 1968. The topfour alone accounted for 71 percent. We see that heatenergy in one form or another dominates this list of enduses, accounting for about half of the total, Mechanicalwork (transportation and electric drive) accounts for anadditional third.
An important end use to remember is the one called'feedstocks. The fossil fuels are not only sources of
energy, but also provide raw materials for many indus-trial products, from asphalt to synthetic fibers. If theseraw materials are evaluated at their energy equivalent,they account for about 6 percent of the 1968 total. Theirpercentage share is increasing rather rapidly and deple-tion of the fossil fuel resources is, perhaps, morethreatening in the long run on this account than from thepoint of view of energy. It may be easier to find alternatesources of energy than to replace the precious andcomplex molecules nature has stored for us in coal andthe petroleum products.
The Electric Utilities as a Consuming Sector
A In the following sector breakdowns of energy con-sumption it will be useful, for several reasons, to payspecial attention to electric energy. Its consumptionshows the fastest growth of any of the energy forms andt fs has led to shortages -- blackouts and brownouts
generation and transmission are very inefficient andhis leads both directly and indirectly to many of theenvironmental problems we consider later on.
In order to single out the amount of energy used in thegeneration of electricity, we show a different Breakdownof consumption in Table 3-2. These 1973 data show the
FIGURE 3-2Breakdown of U.S. Energy Consumption, 1968
Total 15.3 Q (1015) Calories
Transportation Percent
v. Fuel 24.9
u. Raw Materials .3
Industrial Percent
t. Other 7.5
s. Feed Stocks 3.6
r. Direct Heat
q. Electrolytic
11.4
Processing 1.2
p. Electric Orive .8
o. Process Steam 16.7
Residential Percent
e. Space Heating 11.0
b.
c.
d.
e.
f.
9.
Water Heating 2.9
Cooking 1.1
Clothes Drying .3
Refrigeration 1.1
Air-conditioning .7
Other 2.1
Commercial Percent
h. Space Heating 6.9
i. Water Heating 1.1
j, Cooking .2
k. Refrigeration 1.1
1. Air-conditioning 1.8
m. Feed Stocks 1.6
n. Other 1.7
Source; Patterns of Energy Consumption in the united States, Office of Science and Technology, Lecotive Office of the President,Washing
ton, D.C., 1972.
132

percentages of the primary sources (the fossil fuels,hydropower, and nuclear energy) used by the varioussectors (residential and commercial are combined) andthe electric utilities. In that year the utilities used 26percent of the total primary energy, but the electricityproduced amounted to only 8 percent of the total energyconsumed. In 1974 these percentages were, respec-tively, 27 and 8.7.
The various sources of energy to the utility sector areidentified in Table 3-2. Then the contributions fromthese sources are displayed as percentages in Table3-3. Coal is the major source and, even with the rapidgrowth expected in nuclear generating facilities, willcontinue to be the major source until the 1990s.
Only three of the four consuming sectors are impor-tant consumers of electricity, 31 percent of it was used inthe residential sector, 24 percent in the commercialsector, and 45 percent in the industrial sector. Transpor-tation used only about 5 Million (M) kw-hr out of a total of1,330 M kw-hr used that year.
In the following sections we provide details of the enduses of this eledricity within each sector.
'Residential C nsumption of Eneigy
The 2.94 Q alories of energy used by the residentialsector in 1968 ere divided among the various end usesin the percentages shown in Table 3-4. We also show1960 data to( emphasize the changes that are takingplace.
Of the various end uses, "comfort energy," theenergy used to heat and cool living space, accounts foralmost two-thirds of the total. The most rapid growth
TABLE 3-1Major End Uses of Energy, 1968
Percentof
Total
Transportation (fuel; excludes tubes and greases) 24.9Space Heating (residential, commercial) 17.9Process Steam (industrial) 16.7Direct Heat (industrial) 11.5Electric Dirve (industrial) 7.9Feedstocks, Raw Materials (commercial, industrial,
transportation) 5.5Water Heating (residential, commercial) 4.0Air-conditioning (residential, commercial) 2.5Refrigeration (residential, commercial) 2.2Lighting (residential, commercial) 1.5Cooking (residential, commercial) 1.3Electrolytic Processes (industrial) 1.2
Total 97.1
Source: Patterns of Energy Contumption in the United States, Of-fice of Science and Technology, Executive Office of the President,Washington, D.C., 1972.
was in air conditioning, but consumption by all ap-pliances, except cooking, is increasing.
In the residential sector natural gas, which is used inspace and water heating, cooking, and in some clothesdriers, is the most important fuel (as is shown in Table3-5). Electric energy is next in importance, if we, in-dude the two-thirds which is lost, in its generation.
The end uses of electric energy in the residentialsector are shown in Table 3-6 along with the record ofgrowth from 1960 to 1968. The rapid increase in electricspace heating is worth special note. Only about 3 millionhomes, 7 percent of the total, used electric heat in 1968while 43 percent used fuel oil and 50 percent naturalgas. This total had increased to 4 million by 1970 andabout one-third of the new homes built that yeai wereheated electrically. The Federal Power Commission'sprojection (see Figure 3-3) is for a continued increase to12.5 million in 1980 and 24 million in 1990. They antici-pate that 40 percent of the homes constructed from1970-1980 will be all-electric as will half of those con-structed in 1-980-1990. This is one of the changes that isbringing about the rapid growth in electricity demand weshall examine later.
It is also helpful in analyzing the consumption of elec-tric energy to have data on the power rating and theaverage yearly consumption of energy of the variouspopular household appliances. We show that data inTable 3-7.
Overall energy use in the residential sector grew at anannual rate of 4.3 percent from 1960 to 1968. This rateof growth causes a doubling of total consumption every16 years.
FIGURE 3.3Electrically Heated Homes in the U.S.
20
E0
00
10
.
1100 1270 143 140
Year
133
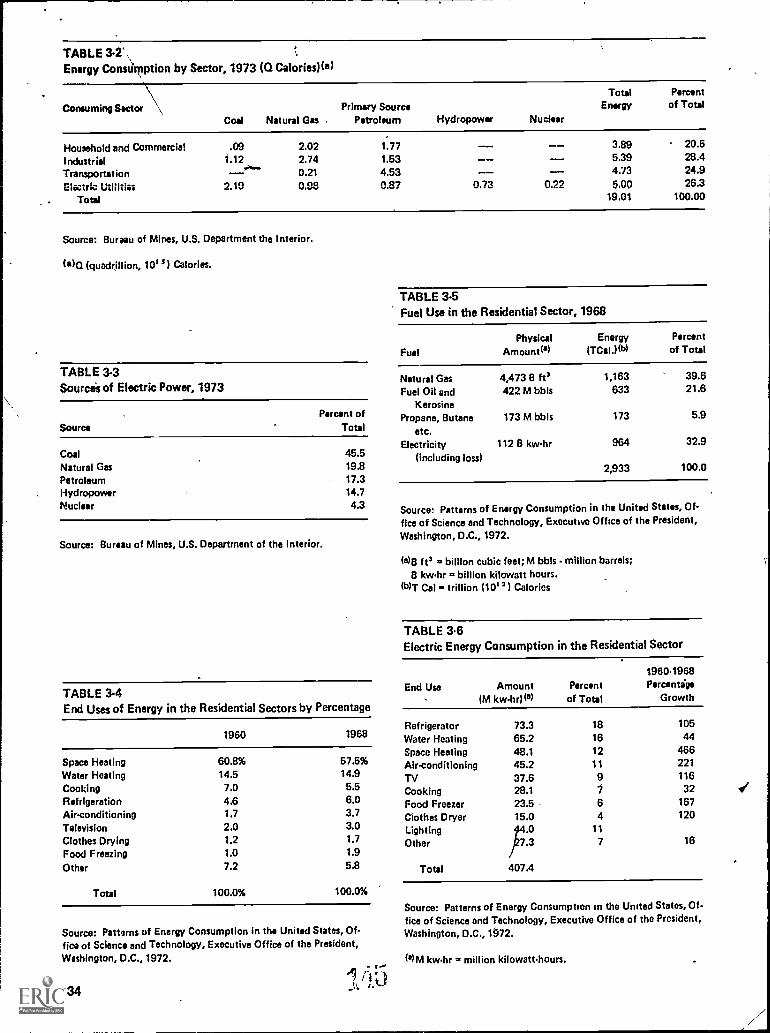
TABLE 3-2',Energy ConsUmption by Sector, 1973 (Q Calories)(a)
Total Percent
Consuming Sector\ Primary Source Energy of Total
Coal Natural Gas . Petroleum Hydropower Nuclear
Household and Commercial .09 2.02 1.77 3.89 20.5
Industrial 1.12 2.74 1.53 5.39 28.4.....
Transportation 0.21 4.53 -- -- 4.73 24.9
Electric Utilities 2.19 0.98 0.87 0.73 0.22 5,,00 26.3
Total 19.01 100.00
Source: Bureau of Mines, U.S. Department the Interior.
(*)(2 (quadrillion, 1015) Calories.
TABLE 3-3Sources of Electric Power, 1973
Source
Percent ofTotal
Coal 45.5Natural Gas 19.8Petroleum 17.3Hydropower 14.7
Nuclear 4.3
Source: Bureau of Mines, U.S. Department of the Interior.
TABLE 3.5Fuel Use in the Residential Sector, 1968
Physical Energy Percent
Fuel Amount(') (TCaI.)(b) of Total
Natural Gas 4,473 B 1,163 39.6
Fuel Oil and 422 M bbls 633 21.6
KerosinePropane, Butane 173 M bbls 173 5.9
etc.Electricity 112 13 kw-hr 964 32.9
(including loss)2,933 100.0
Source: Patterns of Energy Consumption in the United States, Of-fice of Science and Technology, Executive Office of the President,Washington, D.C., 1972.
(8)E1 ft3 = billion cubic feet; M bbls million barrels;B kwhr = billion kilowatt hours.
(b)T Cal trillion (1012) Calories
TABLE 3.6Electric Energy Consumption in the Residential Sector
End Use Amount(M
Percentof Total
1960.1968Percentige
GrowthTABLE 3.4End Uses of Energy in the Residential Sectors by Percentage
Refrigerator 73.3 18 1051960 1968 Water Heating 65.2 16 44
Space Heating 48.1 12 466Space Heating 60.8% 57.5% Air-conditioning 45.2 11 221Water Heating 14.5 14.9 TV 37.6 9 116Cooking 7.0 5.5 Cooking 28.1 1 32Refrigeration 4.6 6.0 Food Freezer 23.5 6 167Air-conditioning 1.7 3.7 Clothes Dryer 15.0 4 120Television 2.0 3.0 Lighting .0 11Clothes Drying 1.2 1.7 Other 7.3 7 16
Food Freezing 1.0 1.9
Other 7.2 5.8 Total 407.4
Total 100.0% 100.0%
Source: Patterns of Energy Consumption in the United States, Of-fice of Science and Technology, Executive Office of the President,Washington, D.C., 1972.
134
Source: Patterns of Energy Consumption in the United States, Of-fice of Science and Technology, Executive Office of the President,Washington, D.C., 1972.
kwhr = million kilowatt hours.
Ill

Ii
Consumption of Energy inthe Commercial Area
The commercial category is a catch-all, includingeverything that is not residential, industrial, or transpor-tation. In 1968 the commercial buildings, small busi-nesses, hotels, restaurants, schools, colleges, etc., thatcomprise this category used 2.21 Q Calories, 14 per-cent of the total. A breakdown by end use is given inTable 3-8. If we set aside "asphalt and road.oils," whichare raw material uses of these fuels, the largest use is,again, of comfort energy. The fastest growing sector,"other," includes lighting, elevators, and such, and isthus mainly powered by electricity.
A breakdown of fuel consumed in the commercialsector is provided by Table 3-9. We see that electricity is
\\
already the primary energy form if generation losses areadded in. Specific end usesof this electricity are shownin Table 3-10. Here we see the importance of the"other" category, which accounts for 35 percent of theelectricity consumed. More than half of that electricenergy goes into lighting. From Table 3-10 we see thatthi "other" category is the most rapidly.growing one.
mmercial energy consumption is growing morerapid than any other sector. Its annual growth rate (for1960 t 1968) was 5.4 percent, corresponding to adoubling every :13 years. Residential and commercialcombined onsumed 6.39 Q Calories in 1973 as com-pared to 5. Q Calories in 1968. This is a 24 percentincrease in fie years. In 1974, the consumption in thiscombined category was 6.33 Q Calories.
TABLE 3-7Approximate Power Rating and Estimated Annual Energy Consumption of Electric Appliances Under Normal Use
AverageWattage
Est. kwhr(s)ConsumedAnnually
AverageWattage
Est. kwhr(s)ConsumedAnnually
FOOD PREPARATION COMFORT CONDITIONINGBlender 386 15 Air Cleaner 50 216-Broiler 1,436 100 Airconditioner (room) 860 860Carving Knife 92 8 I3ed Covering 177 147Coffee Maker 894 106 Oehumidifier 257 377Deep Fryer 1,448 83 Fan (attic) 370 291Dishwasher 1,201 363 Fen (circulating) 88 43Egg Cooker 516 14 Fan (rollaway) 171 138Frying Pan 1,196 186 Fan (window) 200 170Hot Plate 1,257 90 Heater (portable) 1,322 176Mixer 127 13 Heating Pad 65 10Oven, Microwave (only) 1,450 190 Humidifier 177 163Range
with Oven 12,200 1,175 HEALTH & BEAUTYwith Self-cleaning Oven 12,200 1,205 Germicidal Lamp 20 141
Roaster 1,333 205 Hair Dryer 381 14Sandwich Grill 1,161 33 Heat Lamp (infrared) 250 13Toaster 1,146 39 Shaver 14 1.8Trash Compactor 400 50 Sun Lamp 279 16Waffle Iron 1,116 22 Tooth Brush 7 0.5Waste Disposer 445 30 Vibrator 40 2
FOOD PRESERVATION HOME ENTERTAINMENTFreezer (15 cu ft) 341 1,195 Radio 71 86Freezer Radio/Record Player 109 109
(Frostless 15 cu ft) 440 1,761 TelevisionRefrigerator (12 cu ft) 241 728 Black 8iWhiteRefrigerator (frostless 12 cu ft) 321 1,217 Tube Type 160 350Refrigerator/Freezer Solid State 55 120
(14 cu ft) 326 1,137 Color( frostless 14 cu ft) 615 1,829 Tube Type 300 660
Solid State 200 440LAUNDRYClothes Dryer 4,856 993 HOUSEWARESIron (hand) 1,008 144 Clock 2 17Washing Machine (automatic) 512 103 Floor Polisher 305 15Washing Machine (nonautomatic) 286 76 Sewing Machine 75 11Water Heater 2,475 4,219 Vacuum Cleaner 630 46
(quick recovery) 4,474 4,811 Based on 1,000 hours of operation per year. This figure will varywidely depending on area and specific size of unit.
Source: Edison Electric Institute.
(a)Kwhr Kilowatt-hour.
1 ilk. J.,9 135

The Industrial SectorThe big energy consumer is the industrial sector, 6.31
Q Calories in 1968, or 41 percent of that year's totalconsumption. This sector's share has been decreasingslowly (although total consumption has increased). Thistrend is expected to continue._ In 1973 the industrialsector used 7.44 Q Calories, 39 percent of the total, andin 1974, 7.42 Q Calories, 40 percent of the total.
Table 3-11 shows the percentages of Industrialenergy supplied by the various fuels. Coal retains asignificant industrial market although its importance isdeclining from 27 percent of the market in 1960 to 18
TABLE 3-8End Uses of Energy in theCommercial Sector by Percentage
percent in 1968. In 1974, coal's share was only 14percent. Natural gas made up 34 percent of the marketin 1960 and 37.3 percent in 1968. Even with the naturalgas shortage its percentage share of the industrial mar-ket grew from 36.9 percent in 1973 to 37.9 percent in1974. Electricity grew from about 20 percent in 1960 to23 percent in 1968. Its 1974 share of 27.9 percent is uponly slightly over the 1973 share of 27 percent. Table3-12 identifies the energy-intensive industries. Thesesix industries account for two-thirds of industrial energyconsumption. This table also identifies the primaryenergy source. The two major users, the primary metals
TABLE 3-9Fuel Use in the Commercial Sector, 1968 data
1960 1968 Fuel
PhysicalAmount(a)
Energy(TCal)(10)
Percentof Total
Space Heating 54.2% 47.7% Coal 23.4 M tons 143 6.5
Asphalt and Road Oils 12.8 11.2 Oil 405 M bbls 607 27.5
Water Heating 9.5 7.5 Natural Gas 1,792 B ft' 466 21.0
Air-conditioning 10.0 12.7 ElectricityRefrigeration 9.3 7.6 (incl. losses) 870 B kwhr 748 33.8
Cooking 1.7 1.6 Asphalt (roadOther 2.5 11.7 oil, etc.) 248 11.2
Total 100.0% 100.0% Total 2,212
Source: Patterns of Energy Consumption in the United States, Of-fice of Science and Technology, Executive Office of the President,Washington, D.C., 1972.
Source. Patterns of Energy Consumption in the United States, Offlee of Science and Technology, Executive Office of the President.Washington, D.C., 1972.(a)M tons = million tons; M bbls = million(a) tons = illion tons; M bbls - million barrels; B ft' . billioncubi feet* kwhr = billion kilowatt hours.(b)T Ca . trillion (1012) Calories
TABLE 3-10Electric Energy Consumption in the Commercial Sector
End Use
Amountkw-hri(a)
Percentof Total
1960-1968Percentage
Growth
Water Heating 24.6 7.8 19
Refrigeration 71.5 22.6 36
Air-conditioning 108.6 34.3 84
Cooking 2.3 0.7 57
Other 109.6 34.6 611
Lighting 59.0 183Advertising and Display
Lighting 7.9 2.5
Elevators 11.7 3.7
Fans and Air-handling Equipment 10.3 3.3
Pump and Motors 5.3 1.7
Miscellaneous 15.2 4.7
Total 316.5 100.0 106
Source. Patterns of Energy Consumption in the United States, Office of Science and Technolugy, ExiNutive Office uf the Pi esident. Wash;ng
ton, D.C., 1972.
:a)M Kwhr = million kilowatt-hours
136

industries (steel, aluminum, copper, etc.) and the chem-ical industries, differ significantly in fuel requirements.Steel companies, for instance, use large amounts ofcoal, while the chemical companies are major users ofpetroleum.
An important cause of the declining percentage of thetotal consumption in the industrial sector is the im-provement in the efficiency of production. Said other-wise, it now takes less energy to produce a ton of steel,paper, etc. than it did a decade ago, 7.6 M Calories perton of steel in 1960 as against 6.6 M Calories in 1968,and 8.6 M Calories in 1960 but only 6.6 M Calories in1968 for a ton of paper.
The energy cost of materials: When we look lateron at strategiesior energy conservation, it will be impor-tant to know how much energy is needed to produce apound of steel, plastic, paper, etc. This information willguide us not only in modifying our consumption pat-terns, but will also suggest categories in which recyclingmay be important. We have gathered together in Table3-13 these data for a large variety of manufactured.
TABLE 3-11Industrial Fuels (by percentage)
Energy Source1960
Percent of Total1968 1974
Coal 26.7 22.6 14.3Natural Gas 34.3 37.3 37.9Petroleum Products 19.3 18.0 19.8Electricity 19.7 22.6 27.9
Source: Patterns of Energy Consumption in the United States, Of-fice of Science and Technology, Executive Office of the President,Washington, D.C., 1972, and Bureau of Mines, U.S. Department ofthe Interior.
products. One interesting group of materials in this list isthe plastics. We see that they require more energy perpound than steel, and certainly more than paper withwhich they often compete. Muchof this energy could berecovered by burning the plastics to produce steam.They contain as much as 5,000 Calories per pound
TABLE 3-13Energy Expenditure in Manufacture ofVarious Materials (M Calories per ton)(a)
Material Energy
MetalsSteel 6.5Aluminum 18.8 (41.8)bLead 7.8Copper 10.0
Zinc 11.5.13.Cement, Clay, Glass
Cement 2.5
GlassPlate & Bottles 3.545Technical Glassware 13.5Handmade Glassware 20.
Porcelain & China 10.
Tile 1.
Bricks .25-1.5Plastics
Polyethylene 34.Polypropylene 36.Polyvinylchloride 26.Polystyrene 11.
Source: Patterns of Engrg) Consumption in the United States, Of-fice of Science and Technology, Executive Office of the President,Washington, D.C., 1972.
WM (million, 106) Calories per ton.(b)The figure in parentheses includes the electric conversion losses.
TABLE 3-12Fuel Use by the Six Energy Industries, 1968 (in T Calories)(a)
Industry Group CoalNatural
Gas
PetroleumProducts
Elec-tricity
TotalEnergy
Primary Metals 571 213 77 323 1,325Chemicals and Allied Products 167 305 357 407 1,234Petroleum Refining and Related
Industries 253 391 56 707Food and Kindred Products 66 148 34 85 332Paper and Allied ProductsStone, Clay, Glass, and
117 85 53 70 325S.
Concrete Products 102 112 22 70 306
Subtotal 1,160 1,119 938 1,01b 4,228
All Other Industries 244 1,195 180 393 2,013
Total 1,404 2,315 1,119 1,153 6,240
Source. Patterns of Energy Consumption in the United States, Office of Science and Technulugy, Executive Of fii.e of the President, Washing-ton, D.C., 1972.
(s)T (trillion,101 3 ) Calories.
.1, r4 1 (
--3
.,
Included in all other industries.
137
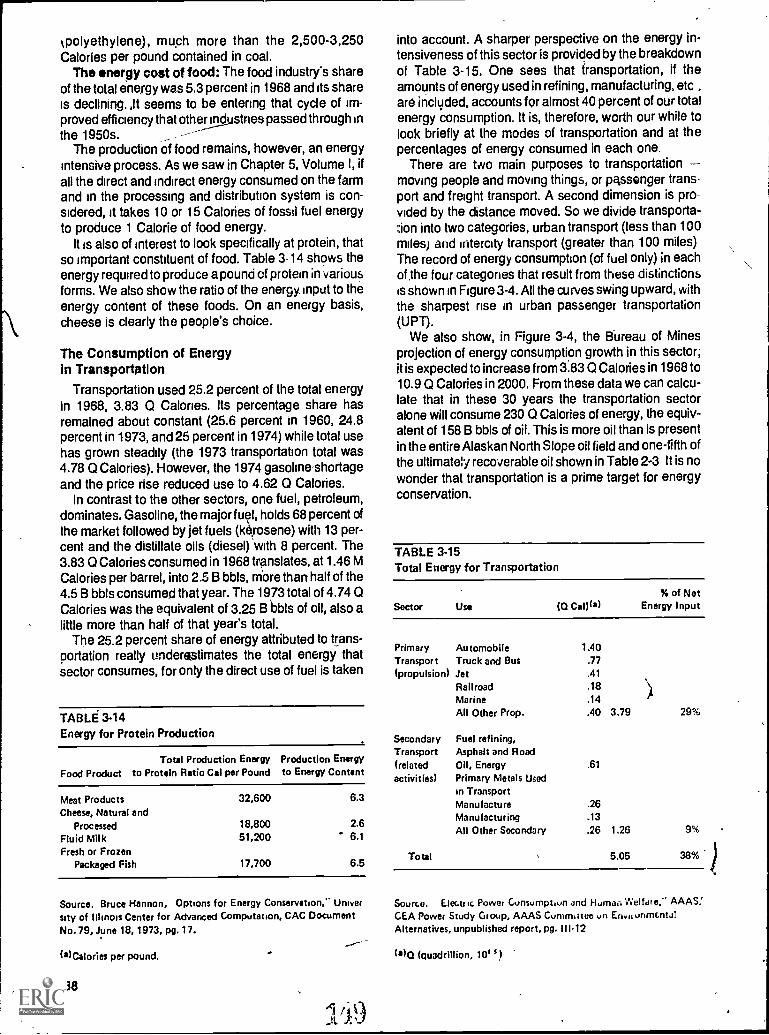
kpolyethylene), much more than the 2,500-3,250Calories per pound contained in coal.
The energy cost of food: The food industry's shareof the total energy was 5.3 percent in 1968 and its shareis declining. slt seems to be entering that cycle of im-proved efficiency that others rs_u/ striespassed through inthe 1950s. - --
The production of food remains, however, an energyintensive process. As we saw in Chapter 5, Volume I, ifall the direct and indirect energy consumed on the farmand in the processing and distribution system is con-sidered, it takes 10 or 15 Calories of fossil fuel energyto produce 1 Calorie of food energy.
It is also of interest to look specifically at protein, thatso important constituent of food. Table 3-14 shows theenergy required to produce a pound of protein in variousforms. We also show the ratio of the energy input to theenergy content of these foods. On an energy basis,cheese is clearly the people's choice.
The Consumption of Energyin Transportation
Transportation used 25.2 percent of the total energyin 1968, 3.83 Q Calories. Its percentage share hasremained about constant (25.6 percent in 1960, 24.8percent in 1973, and 25 percent in 1974) while total usehas grown steadily (the 1973 transportation total was4.78 Q Calories). However, the 1974 gasoline-shortageand the price rise reduced use to 4.62 Q Calories.
In contrast to the other sectors, one fuel, petroleum,dominates, Gasoline, the major fuel, holds 68 percent ofthe market followed by jet fuels (kerosene) with 13 per-cent and the distillate oils (diesel) with 8 percent. The3.83 Q Calories consumed in 1968 translates, at 1.46 MCalories per barrel, into 2.5 B bbls, more than half of the4.5 B bbls consumed that year. The 1973 total of 4.74 QCalories was the equivalent of 3.25 B bbls of oil, also alittle more than half of that year's total
The 25.2 percent share of energy attributed to trans-portation really underestimates the total energy thatsector consumes, for only the direct use of fuel is taken
TABLE 3-14Energy for Protein Production
Total Production Energy Production Energy
Food Product to Protein Ratio Cal per Pound to Energy Content
Meat ProductsCheese, Natural and
Processed
Fluid MilkFresh or Frozen
Packaged Fish
32,600
18,80051,200
17,700
6.3
2.66.1
6.5
Source. Bruce Hannon, Options for Energy Conservation,- University of Illinois Center for Advanced Computation, CAC DocumentNo. 79, June 18, 1973, pg. 17.
(4)Calories per pound.
138
into account. A sharper perspective on the energy in-tensiveness of this sector is provided by the breakdownof Table 3-15. One sees that transportation, if theamounts of energy used in refining, manufacturing, etc ,are included, accounts for almost 40 percent of our totalenergy consumption. It is, therefore, worth our while tolook briefly at the modes of transportation and at thepercentages of energy consumed in each one.
There are two main purposes to transportationmoving people and moving things, or passenger trans-port and freight transport. A second dimension is pro-vided by the distance moved. So we divide transporta-tion into two categories, urban transport (less than 100miles) arid intercity transport (greater than 100 miles)The record of energy consumption (of fuel only) in eachof the four categories that result from these distinctionsis shown in Figure 3-4. All the curves swing upward, withthe sharpeSt rise in urban passenger transportation(UPT).
We also show, in Figure 3-4, the BOreau of Minesprojection of energy consumption growth in this sector;it is expected to increase from 3.83 Q Calories in 1968 to10.9 Q Calories in 2000. From these data we can calcu-late that in these 30 years the transportation sectoralone will consume 230 Q Calories of energy, the equiv-alent of 158 B bbls of oil. This is more oil than is presentin the entire Alaskan North Slope oil field and one-fifth ofthe ultimate/ recoverable oil shown in Table 2-3 It is nowonder that transportation is a prime target for energyconservation.
TABLE 3.15Total Energy for Transportation
Sector Use to Ca11(8)
% of NotEnergy Input
Primary Automobile 1.40Transport Truck and Bus .77(propulsion) Jet Al
Railroad .18Marine .14All Other Prop. AO 379 29%
Secondary Fuel refining,Transport Asphalt and Road(related Oil, Energyactivities) Primary Metals Used
in Transport
.61
Manufacture .26Manufacturing .13All Other Secondary .26 1.26 9%
Total 5.05 38%
Source. Electric Power Cunsumptun and Human Welfare." AAAS.'CEA Power Study Group, AAAS Cummatee un En.0 urancntalAlternatives, unpublished report, pg. 111-12
WO (quadrillion, 10' )

Transportation of energy; Of particular interestamong the various cargoes that are shipped across thiscountry and around the world is energy itself. Tate differ-ences in th i) amount of energy per pound'of the variousfuels (see Table 1-3) and the efficiencies of the differenttransport modes that are available to solid, liquid, andgaseous fuel conspire to make the dollar costs perCalorie of energy transported vary significantly frommode to mode.
We have gathered the relevant data together in Fig-ure 3-5. We see that the cheapest form of energy trans-port is tanker shipment of oil, hence the building of thesupertankers. The bigger the tanker, the lower price perCalorie-mile. The liquid fuels, oil and LNG (liquifiednatural gas), are all at the bottom of the price list, reflect-ing the ease with which a liquid can be handled and thehigh energy density (Calories per pound) of these fuels.The liquid fuels are followed by coal, which istrans-ported in specially constructed trains and then bypipeline gas.
In contrast to the apparently easy transport of electric-ity, we see that it is, overall, the most expensive energyto ship and that its price climbs rapidly as the distanceincreases. We also see That the price is reduced as the
FIGURE 3-4Transportation Energy, with Projection to 2000\
10.0-
i
/////
UPT(a)
--- .- icp-r(a...
...-1----.4---z...-
......IcF( b)UF (and other)(b)
1950 1970
Year
//
//-
//
1990 2000
Source. Bureau of Mines, U.S. Department of the Interior
la) UPT = Urban passenger transportation, ICPT = Intercity passen-ger transportation;
(b) ICF = Intercity freight transport; OF = Urban freight transport
transmitting voltage is increased. At 700,000 volts, thecost per mile is less than that of oil by rail tank car. Forthis reason higher and higher transmission line voltagesare being used.
It must be pointed out that prices are influenced bymore than the energy density of the fuel and the inherentefficiency of the transport mode. A host of freight regula-tions and direst and ir.lrect subsidies play roles thatcould cause some shifts in the rankings of Figure 3-5.
We should also comment that uranium has an energydensity so much larger than any of the others its ship-ment costs are negligible and so are not displayed forthis comparison.
With this discussion of transportation we completeour description of the consumption of energy in theUnited States. We will now take a brief look at where theworld's energy goes.
Patterns of Consumption in the World
In 1972he total amount of energy consumed in theworld was reported to be 50.7 Q Calories. The 18,2 QCalories consumed that year in the United States, whichhas 6 percent of the world's population, were 36 percentof the world's total. The per capita consumption is evenmore unbalanced. On the average, the world citizenused 13:3 M Calories in 1972. In the United States, theper capita consumption was 87.4 M Calories, almostseven times the world average. The disparity betweenthe United States consumption and certain countriescan be even greater as is shown in Figure 3-6. TheUnited States, for instance, has almost 60 times the percapita consumption of India. To some extent this differ-ence between the United States and the econothicallyunderdeveloped countries is exaggerated by , thesedata, for what is reported is commercial energy, andcountries like India and Brazil use large amounts ofnoncommercial fuel. In India, it is estimated, 100 milliontons of cow dung and vegetable waste are burned eachyear. This would raise her per capita consumption figureby perhaps as much as 30 percent. Even with thiscorrection-the United States per capita consumption isstill 46 times greater.
In spite of the great differences between countries,we also see from Figure 3-6 that many are now showinggrowth in per capita energy consumption that is greaterthan the United States growth rate. Since their popula-tions in some instances are also growing more rapidlythan, ours, the United States share of the total worldenergy has been dropping; frbm 45 percent in 1950 to36 percent in 1960. As we can see from the data ofFigure 3-6, however, it will take decades of growth forthe per capita consumption in most other countries toapproach ours.
We can gain some further insight into the differencesby looking at the way in which energy is used in variouscountries. We do not have the same kind of detailbddata available for the world that we have referred to forthe United States. Figure 3-7 compares the energy ex-penditures of three industrial countries andiwo under-developed countries in each of three different
) 139

FIGURE 3-5Average Costs of Energy Transportation
3.5
3.0
2.5
2.0
1.5
1.0
0.5
0.0
40..id
,._7-
,:44.06-
r A,sk r-o
al.4i-A 0.,,,,....
wc,twoori?19."0_IllOPP.°"raddil
0.01.00
c,c, .NIA'_00
i000
flAnrtopFIPIr- All
v-011111
, Coal
Gast ?. e"e
alb %""4r-r a1n
Oil b PIP6ine
LNG
Oil by Tankship
b Tankshi
Oil by
b Bare
Eler9e
200 300 400 500 600
Distance in Miles
700 800 900
Source: "The 1970 National Power Survey, Part III," Federal Power Commission.
(a) A Mill is 0.1 cent or S0.001
FIGURE 3-7Per Capita Consumption of Energy by EconomicSector. 1964 (in millions of calories)
United States
Great Britain
Japan
Brazil
India
0 5 10 15 20 25
INI111111111111111111111.1i111141111111111111111i
L eg end:11111111211Transportation, r-1 Domestic,munllnunl Industrial
Adapted from: N.B. Guyol, Energy in the Perspective of Geogra-phy, (New York: Prentice Hall, 1971.).
140
categories (1964 data). We see that the industriallyunderdeveloped countries expended the greater por-tion of their energy on domestic needs. We &so see thelarge energy investment in transportation in our bigcountry. Brazil, which like the United States is big, alsohad a relatively large expenditure for transportation,while the smaller countries, Japan and Great Britain,showed relatively smaller transportation energy expend-iture. The overriding point from the comparison of thethree industrial countries is that the United States usesits energy lavishly. In Japan and Great Britain a muchlarger percentage of the total energy expenditure isdirected into industrial production.

FIGURE 3-6Comparison of Annual Per Capita Energy Consumption of Various Countries and Regions
10
Year
-it
North America
Oceania(a)
Western Europe
World
Central PlannedEconomies
Central Amer.
South America
Middle East
AfricaAsia
1950
....,,,, U.S.
*---
41"""""" Great Britain
U.S.S.RaJapan
ei#0
1970
-
r
.
I
IMP
WO
Source: 1969 Statistical Yearbook, Statistical Office of the United Nations, Department of Economic and Social Affairs (New York United
Nations) 1970, p. 324.
(a) Oceania: Lands of the Central and South Pacific, including Micronesia, Melanesia, Polynesia (including New Zealand), Australia, and the Ma
lay archipelago,
t--) :141

Energy EfficiencyIn tracing the energy flow through our economic sys-
tem we have, so far, treated it as if the system wereperfect. It is now time to look at the leaks, the losseswhich occur at each one of the conversions, from pri-mary source through intermediate form or forms) toend use.
We must make it clear from the beginning that our useof the term "loss" is meant to indicate that energy is lostfor further useful conversion. It does not, of course,disappear; the First Law guarantees that. It is the Sec-ond Law, which imposes the "heat tax" on all energyconversions, that is important here.
Irreversibility
A concept from physics that is useful to us is that ofirreversibility. All natural energy conversions are ir-reversible, which is to say that energy converted fromone form to another cannot then be completely con-verted back to its original form. As an example, a fallingrubber ball has its original amount of gravitational poten-tial energy converted to the kinetic energy of motion.When it strikes the ground, this kinetic energy is con-verted, by distortions of the molecules within the ball, toelastic potential energy. A large fraction, but not all, ofthis elastic potential energy is then converted back tokinetic energy when the ball rebounds. No ball (not eventhe "super ball") bounces all the way back to its originalheight. We could gain a strong clue as to where this"lost" energy resided if we could take the temperature ofthe ball before and after its bounce. We would find itwarmer afterward. some of the original mechanicalenergy is converted to heat energy, the 'heat tax iscollected.
This "heat tax," of course, is collected in all theenergy conversions we showed in Figure 3-1. In con-versions to and from mechanical energy, some of theheat tax is paid through the dissipative force, friction. Inthermal conversions, some of the heat leaks out of thesystem. In electrical conversions, some of it is changedto heat by the electrical resistance and leaks away. Theheat tax is also paid in energy storage conversions.When water is pumped uphill, for instance, some of theinitial energy is lost again to friction in the pump, in thewater, and between the water and the pipe.
In all the conversions we have been considering,therefore, there are losses ', energy is diverted from itsintended use. A measure of the importance of theselosses is the efficiency of an energy conversion device.
Efficiency
An efficient person is one who seems to get a lot ofwork done with a minimal expenditure of effort. Thephysical definition of efficiency is similar, the efficiencyof any energy conversion is the ratio of the useful workor energy that is derived from the conversion, to thework or energy put into it. In symbols, the efficiency E is
Work or Energy OutE . X 100Work or Energy In
142),j
(The multiplication by 100 allows us to express theefficiency as a percent.)
As an example, if we burn a gallon of gasoline in anautomobile engine set on a test block and measure themechanical work output, we find that it amounts to 8,200Calories. The chemical potential energy of the gallon ofgasoline is 32,830 Calories. The efficiency of the en-gine, therefore, is
8'200 Calories X 10eE =32,830 Calories
= 25 percent
The efficiencies of other energy conversions are de-fined in like manner. Although it is theoretically possibleto convert all of a given amount of chemical potentialenergy to heat by combustion, furnaces are not 100percent efficient, some of the fuel is not completelyburned and some of the heat energy is lost through thefurnace walls. The efficiency of a conversion to heatenergy is, therefore,
Heat DeliveredE X 100Chemical Energy Input
These two examples are of conversions to kineticforms. In the conversions of kinetic to potential energy,the storage conversions, the efficiency, again, alwaysfalls below 100 percent. The "heat tax" is imposed. Inthe "pumped storage" generating plants, which are de-scribed in Chapter 6, surplus electric power is used topump water uphill. When more power is needed, thatwater is allowed to flow back through the turbine and togenerate electricity. It is found that if 3 kw-hr of electricenergy is used to pump the water, 2 kw-hr are producedwhen the water runs back through the turbines. Theefficiency, therefore, is
2 kw-hr (output)E X 100 = 67 percent
3 kw-hr (input)
We have gathered together in Figure 3-8 data on theefficiencies of most of the important energy conversionprocesses. The conversions to and from electricenergy stand at the top of the list, the large generatorshave efficiencies of near 100 percent (but not 100 per-cent). Next in line are the conversions from chemicalenergy to thermal (heat) energy. The heat engines,which as we have said are involved in half of our indus-trial energy conversions, all have efficiencies that areless than 50 percent. The automobile engine, both theconventional internal combustion engine and the Wankel (rotary) engine, are 25 percent efficient, or less.Further down the list are, for instance, the solar cell,which converts light energy to electrical energy, and thelightbulb, which accomplishes tne reverse conversion.
If we now look back at the data on energy consump-tion in the preceding section, we begin to see the signsof waste an inefficiency in our system. One-quarter of

FIGURE 3-8Efficiencies of important Energy Conversion trocesses
Electric Generator
Large Electric MotorDry Cell BatteryLarge Steam Boiler
Home Gas Furnace
Storage Battery
Home Oil FurnaceSmall Electric MotorFuel Cell
Liquid-Fuel RocketSteam Turbine
Steam Power PlantGas LaserDiesel EngineAircraft Gas TurbineIndustrial Gas TurbineHigh-Intensity LampSolidState Laser
Automobile Engine
Flourescent LampWankel Engine
Solar CellSteam LocomotiveThermocouple
90
70
60
50
40
30
20
Incandescent Lamp 0
Efficiency of entireprocess from sourceto use.
17//h Other conversions in-volved in process.
/1
I/
*,ae,, 0 A10 o o Ii Ii Ii t., 'A IA
C.t00'. °:'
I' e6Ct..Z. 2l C.> S e4c) S S_,,, 'AG eo °,e, 1.-
e"o -A C, ve '6ct, 0 c Ct
en .n'
9 '' 01 SI :: Ct
00 C%e '2. '2, 1. Ii.t 1., 1,c.,
e'.>
0>0>
Adapted from Energy and the Future, Hammond, Metz, Maugh, AAAS, Washington, D.C., 1973, pg. 133.
143
I 1I. i
,- tk /

the total energy is used in the transportation sectorwhere the engines are at best 25 percent efficient. Thismeans that three-quarters of that energy is wasted.Another quarter of the total energy is used in generatingelectricity, most of this in the fossil-fuel fired plants.They are at best 30 percentefficient, two-thirds of thisenergy is wasted. The situation is, in fact, worse thanthis as we shall see when we discuss the concept of"system efficiency." Before we introduce that concept,however, let us look briefly at these heat engines thatwaste so much energy and see why this happens.
heat Engines andthe "Thermal Bottleneck"
Any device that converts heat energy into mechanicalenergy is called a heat engine. This is an important classof devices, accounting for about half of our energy con-versions. The inefficiency of this conversion is respon-sible for much of the waste of energy in our system.Unfortunately, it is an inescapable inefficiency; it isguaranteed by the laws of physics.
In Chapter 1 we paraphrased the "Second Law ofThermodynamics" as
In any conversion of energy from one form toanother some of it becomes unavailable forfurther use.
This is an interpretation of the actual law. In its moreprecise form it would be
No device Can be constructed, which operatingin a cycle (like an engine) accomplishes only theextraction of heat energy from a reservoir and itscomplete conversion to mechanical energy(work).
This statement can be read, "You can't build a 100percent efficient heat engine." In practice, however, theapplication of this law has an even stronger penalty.
There is much interesting science in the story of whatheat energy really is and how it can be transformed intomechanical work, but we won't take the space to tell ithere. We do provide some of that story in TechnicalAppendix 4. We will content ourselves with the high-lights and the results here.
The form of energy we call heat energy shows itself asthe random, chaotic motion of molecules. As the heatenergy increases, as the material gets hotter, the tem-perature (which is an indicator of "hotness") increases.As we show in Technical Appendix 4, the temperature ofa substance depends directly on (is a measure of) theaverage kinetic energy of the molecules of the hotsubstance.
The hot substance in heat engines is usually a gas. Inthe reference appendix we describe the way in whichsome of the random motion of the gas molecules can beconverted to the mechanical motion of a piston. We willskip those details and look at the process schematically.
For our purposes the important happenings in a heatengine are the following: gas is heated (by combustion
144
within the engine in an internal combustion engine andoutside of it in a steam engine), the hot gas drives apiston (does work) and is then exhausted at a lowertemperature. This is a cyclic process (it is repeated) andthe gas (or steam) is but a carrier for energy. Such acycle is diagrammed in Figure 3-9. An amount of heatenergy, Qin, is removed from a hot reservoir (thefurnace-boiler of a steam plant, for instance), an amountof work W is accomplished, and the remaining energy,( :2 out, is exhausted to a cold reservoir (the outside at-mosphere, for instance).
In this diagrammatic form we can think of a heatengine working like a waterwheel. Energy flows from ahigh-temperature region to a low-temperature regionand-does work in the process.
The difference in temperature between the gas at thebeginning of the working cycle and the end provides a
FIGURE 3-9Schematic Diagram of a Heat Engine
High TemperatureReservoir
Tout
Qin
EngineCycle
Qout
Low-TemperatureReservoir
Legend:Qin= Input heat energy
(lout' Output heat energyW= Work produced by engineTm= Input temperature
Tout' Output Temperature

measure of the efficiency of the cycle. The temperatureis a measure of the energy contained in the gas. The factthat it is lower at the end of the cycle shows that energywas removed work was accomplished.,The efficiencyrelation for a heat engine is, in fact:
Tin ToutE = X (100)/in
In words, this says that efficiency is the difference be-tween the input and output temperature (which is propor-tional to the work done) divided by the input temperature(which is proportional to the input energy). This expres-sion can be rewritten in a more useful form (by dividingby Tin) as
E = 1 (Touti,--,) X 100
This expression gives the efficiency of a "perfect en-gine" (one with no losses to friction or leakage) operat-ing between Tin and Tout. Real engines are even lessefficient than this.
Before we go on to apply this, one further explanationis necessary. The temperatures Tin and Tout must bemeasured on an "absolute" scale, that is a scale onwhich zero is taken at the temperature called "absolutezero." As we show in Technical Appendix 4, whereabsolute temperature is explained, to convert conven-tional Fahrenheit temperatures to an absolute scale wehave to add 460°F, to convert Celsius temperatures tothe appropriate absolute scale we add 273°C. In thisform we have further evidence that 100 percent effi-ciency is impossible. There are only two ways thatthe equation we have just written can give us 100percent. Either Tout is zero or Tin is infinite. Both of thesetemperatures are physically impossible to reach.
Let us make the prediction of the equation more con-crete by an example. In a modern steam turbine thesteam comes in at 1,000°F and exhaust temperaturecannot be less than 212°F (the temperature of boilingwater). Thus, its highest possible efficiency is
( (212 + 460) )E = 1 X 100
(1,000 + 460)
= (1 .46) X 100
= 54 percent
Actual turbines reach 40 percent efficiency.This efficiency equation, in fact, suggests how to in-
crease efficiency. We must either raise Tin or lower Tout.
Unfortunately, steam turbines now work very near thepractical limits imposed by the strength of the boilers,pipes, etc. and the projected limits are temperatures ofaround 1,500°F. The input temperature can't go muchhigher. We cannot gain much at the other end either, forwe cannot take steam below the temperature of boiling
water. It may be possible, however, to use fluids (am-monia for example) that boil at lower temperatures andreduce Tout. We will discuss some of these "bottomingcycles- in Chapter 6 along with some ideas that maygive us a higher Tin.
The efficiency of the automobile engine can also beanticipated by the use of this equation. The input tem-peratures are high, perhaps as high as 4,000°F. Theexhaust gas, however, is still very hot (as anyone whohas accidentally touched an exhaust pipe knows), onthe order of 1,000T. An upper limit on automobile engine efficiency is, therefore,
E = 1 (1'000 + 460)X 100
(4,000 + 460)
= (1 .33) X 100
= 67 percent
In a real engine, however, much of the heat energyleaks out through the engine and, as we have said,actual efficiencies are less than 25 percent.
These two examples were chosen, of course, be-cause of the importance of the turbine and the au-tomobile engine. For this reason it is of interest to ex-amine the historic trend of efficiency. In Figure 3-10 weplot the generation of electricity over the past few dec-ades. This efficiency includes the efficiency of thegenerator, the boiler, etc. as well as the turbine; but aswe have seen in Figure 3-8, these other efficiencies arequite high. What we see from Figure 3-10 is great im-provement over the past decades, but a flattening out
FIGURE 3-10Efficiency of Electric Generation, 1947 to 1969
.... 04,Ca)c.)
a)CL
C
2a)
4: 20a
ii6
'
. 4Best Plant
4--U S. Average
1950 19160
Year
1970
145

that tells us not to expect much further improvement.We are approaching the limiting value given by ourefficiency equation.
Figure 3-11 shows the historic record of the efficiencyof automobile engines. What is plotted is miles pergallon, but since miles are the desired output and gal-lons the input this can be read as a plot of efficiencyFigure 3-11 is disturbing in that it does not show im-provement, except that recorded in the 1940s whenleaded gas and high-compression engines were intro-duced. The efficiency has, in fact, decreased over thepast decade or so. The causes of this unhappy trend areseveral; cars have gotten heavier, more complex (au-tomatic transmission, power brakes, etc.), and air condi-tioning, stereo, and other life-support systems havebeen added. There has been much recent criticism ofthe miles-per-gallon penalty of the emission control sys-tems. We will comment on this later. We can, if we like,view the data of Figure 3-11 as good news. There isroom for improvement here.
We will add one further note about heat engines. Wesee from the efficiency equation that heat energy at ahigh temperature has extractable energy in it. When welet it degrade to low temperature without obtaining workfrom it, we are wasting potential. In a home furnace, forinstance, the temperature may be as high as 7,000°Fand this is degraded to the 70°F or so of a comfortableroom. The amount of heat energy is still the same, amuch larger volume of gas has been heated, but thepotential of doing work has been lost. The electricalresistance heater with its high-temperature wires suffersthe same defect. A more efficient way to heat a roomwas first described in the 19th century. It works on theprinciple of a refrigerator.
FIGURE 3-11Efficiency of Automobiles
15
14-
\NB
4920 1940Year
1
1960 1980
Data from1940.56 Energy in the American Economy, Schurr and
Netschert, Maryland: The Johns Hopkins Press,Baltimore, 1966.
1957.73 A Report on Automotive Fuel Economy, U.S. En.vironmental Protection Agency, Washington, D.C.,1974.
146
Heat Pumps, Heat Engines In Reverse
The heat engine that we showed schematically inFigure 3-9 can be turned around and used, as we showin Figure 3-12, to pump heat from a cold region into ahotter one. This is the principle of the refrigerator. Work,W (electric energy in most refrigerators), is used to ex-tract heat energy, Qin, from a cold region and pump it toa hotter one. We won't go intothe operating details of arefrigerator other than to say that a condensed gas is putinto contact wan the interior, it expands and absorbsheat energy and is then pumped outside, compressed(which raises its temperature) and it then gets rid of thisexcess heat energy since it is now hotter than its sur-roundings. The cycle is then repeated. The work goes
FIGURE 3.12Schematic Diagram of a Heat Pump
Tout
Legend:
Qin =
CloutW=
Tin "Tout '
High-TemperatureRegion
Q 0.
I I
RefrigerationCycle
in
Low-TemperatureRegion
Input heat energy
Output heat energy
Work required to transfer heat energy
Input temperature
Output temperature

into pumping the gas around the system and compress-ing it. Anyone who has investigated a refrigerator at ail,or has been near one in the summer, is aware that itgives off heat.
Air-conditioners work on the same general principle;they, as refrigerators, "pump heat" from the cooler re-gion to the warmer one. In both these appliances the heatis an unwanted by-product. It need not be so. The home"heat pump," which is used in several hundredthousand hbuses (mostly in the regions of moderateclimate) in this country, works like an air conditioner inreverse; it cools the outdoors and pumps heat indoors.These devices are, in fact, reversible and can be used tocool the indoors in the summer.
Why they are more efficient than the electric resis-tance heater can be made clear with a simple example.In a resistance heater a kilowatt is converted into acertain number of Calories (860 to be exact). In a heatpump this same kilowatt can be used to run the motorsand compressors and to pump two or three times thatnumber of Calories from the outside in. What is accom-plished by a "heat pump" (of a refrigerator) is to move acertain amount of heat through a relatively small tem-perature difference. This is s:milar to the options youmight have if you had a reservoir on a hilltop over yourgarden. You could let the water run down and irrigateyour garden. You could g much more water to yourgarden if you used the en rgy of the water to turn awater wheel that pumped ter to the garden from apond lying slightly below the arden. Heat pumps aresimilarly more efficient when t ey pump heat through arelatively small temperature di erence. It may be thatthe increasing cost of electric e gy will cause us toturn to this more efficient device.
System Efficiencies
In this chapter we have dealt with the pattern of con-sumption and with the efficiency of individual energyconversion processes. Now it is useful to bring theseideas together with the concept of-system efficiency.In this approach we-look-at the end use (home heating,for_ instance), at the primary source (which could bepetroleum), and at all the steps along the way. At each ofthe conversions a "heat tax" must be paid, some of theenergy is lost as far as further use is concerned. Tomake meaningful comparisons between alternateenergy forms and to be able to assess the real energycost, for instance, of automobiie transportation, it is use-ful to know the efficiency with which the energy of thefossil fuel in the ground is used for its intended purpose.
We collect, in Tables 3-16 to 3-19, the system ef-ficiencies of electric lighting, of space and water heatingby electricity or fossil fuels, and of automobile transpor-tation. In all these examples of overall processes, verylittle of the energy we begin with ends up delivered to theintended use. The comparison between space heatingby electricity and by the fossil fuels is particularly reveal-ing. We will consider the implications of this further in thechapter on energy conservation.
el"rIt
With these system efficiencies in mind we can nowprofitably consider the United States energy flow from asystem efficiency point of view. A schematic diagram of
TABLE 3-16Energy System Efficiency of ElectricLighting (from coal-fired generation)
Step
Efficiency ofStep
(in percent)
Production of CoalTransportation of CoalGeneration of ElectricityTransmission of ElectricityLighting, Incandescent
(fluorescent)
96973385
5 (20)
CumulativeEfficiency
(in percent)
969331
26
1.3 (5.2)
TABLE 3-17Energy System Efficiency of Water Heating
Step
Efficiency ofStep
(in percent)
CummulativeEfficiency
(in percent)
Electric (coalfired)
Production of CoalTransportation of CoalGeneration of ElectricityTransmission of ElectricityHeating Efficiency
Natural Gas
Production of Natural GasTransportation of Natural GasHeating Efficiency
9697338592
969764
969331
2624
969360
TABLE 3-18Energy System Efficiency for Space Heating
Step
Efficiency ofStep
(in percent)
CumulativeEfficiency
(in percent)
Electric (coalfired)
Production of CoalTransportation of CoalGeneration of ElectricityTransmission of ElectricityHeater Efficiency
Fuel Oil
Production of Crude OilRefining of Fuel OilTransportation of Fuel OilFurnace Efficiency
Natural Gas
Production of Natural GasTransportation of Natural GasFurnace Efficiency
9697338595
96909763
969775
969331
2625
96868453
969370
147

this is provided by Figure 3-13. We see that in 1971 14.2Q Calories worth of energy were extracted from domesticpnmary sources, 2.2 Q Calories of energy were imported(petroleum and natural gas), and 0.4 Q Calones ex-ported (metallurgical grade coal).
Of the 3.9 Q Calones that went for the generation ofelectricity, 2.5 Q Calories, two-thirds of it, were wasted.
TABLE 3-19Energy System Efficiency of the Automobile
Stop
Efficiency ofStep
(in percent)
CuinmulativeEfficiency
(in percent)
Production of Crude Oil 96(a) 96Refining of Gasoline 87(a) 84Transportation of Gasoline 97(u) 81
Thermal to MechenicalEngine 1b125 30(c) 2024Mechanical Efficiency-Transmission
(includes auxiliary systems) 50-60(0 10-15
Rolling Efficiency 60(c) 6-9
(a)Energy Sources, The Wealth of the World, E. Ayres, C. Scarlott(New York: McGraw-Hill) 1952.(b)"The Conversion of Energy," Claude Summers, Scientific American 224, #3, p. 153, 1971.(c)"The Energy Outlook for Transportation in the U.S.." M. E.Campell, American Highways, 52, #3, p. 25, 1973.
Of the 4.1 Q Calories used in the household and com-mercial sector, 1.1 Q Calories were wasted as were 3.8Q Calories, almost 90 percent, of the 4.3 Q Calories usedin transportation. In the industrial sector, 2.7 Q Caloriesof the 4.9 Q Calories input were wasted. Overall, of the16.0 Q Calories input to the system, 10.2 Q Calorieswere wasted and only 5.8 Q Calories actually producedthe end use work or heat. The overall efficiency of thesystem, therefore, was 36 percent; a little less thantwo-thirds of the energy is lost as far as the intendedpurpose is concerned. The future prognosis, as far asthis efficiency is concerned, is not bright. Electricenergy consumption and transportation, the two mostwasteful sectors, are rapidly growing sectors. We willlook again at this energy flow diagram when we con-sider strategies for energy conservation.
The One-way StreetWe have followed energy in this chapter from the
primary sources coal mines and wells for oil and gasto the end uses. It has been a trip down a one-way
street. At each conversion of energy along the, route,some of it has gone into waste heat. This waste heat isdischarged into the atmosphere or into our rivers andlakes by the electric utility plants, it is given off by thewires that carry electricity, lost from our poorly insulatedhouses and commercial buildings, lost by inefficientfurnaces and, in great quantities, lost to the atmosphereby the inefficient engines of our automobiles.
PGURE 3-13Approximate Flow of Energy Through the United States Economy, 1971, in G(1O") Calories
14 2
PRODUCTIONGROSS
CONSUMPTIONtivc114, Pow*, 01,
kyd,0901WkI
Nalval Gas
Net 1 au 02
lotootnen AndNoval Ges
1...zods49
r2.0
61$1
impoqs
f9
I
Eno. gy U140Electonty
39
For
10 - ti o
45 33
Fuel Cr..Iv/OWIn End taus
119
63 43
I
,pmts0 4
Imports22
Ent9y Lost on Gowstton.14 Tronsmission of Electooty 25
ENOUSE CONSUMPTION
Household fond Corrorne(cost41
Tonsoortaton43
1 I
27
30
Inri.strq,
0
ris
1.19futHoot
Work
41 22
102
56
Source; Earle Cook, Texas A&M University
148

Heat is also the end product of all the conversions.The electric energy that is produced and delivered tohomes and industry is eventually converted to heatdirectly (in baseboard heaters, toasters, and ranges) orindirectly (by the friction in electric motors, for instance).The kinetic energy of the moving cars, trucks, etc. of ourtransportation system is converted to heat by brakes, airresistance, and other dissipative forces.
. In the end, all the primary forms of energy convertedto our use end up in the form of heat. Furthermore, itquickly becomes low-temperature heat in the air andwater, and, as we see from our efficiency equation,
E = 1Tout
X 100Tin
it is of little further use to us. Since Tin is now the ambienttemperature, the average temperature of the surround-ings, it is not possible to use it efficiently in some furtherengine (Tin is about the same as Tout and E is, therefore,about zero). What happens to it was shown back inFigure 1-1, it is reradiated out from earth into the vastreaches of space. We are Warming up the universe.
The one-way nature of the conversion to heat energyis a consequence of the Second Law of Ther-modynamics which we discussed in the section on effi-ciency. We 41 e stuck with the heat tax; it can't berepealed. The only direction in which we can move withprofit, therefore, is toward processes that don't involveheat energy as an intermediate form, that is, away fromheat engines. We need conversion techniques to gofrom chemical or thermal energy directly to electricenergy. We will-discuss some of these possibilities inthe chapter on energy technology. For the immediatefuture, however, we will continue to send most of ourenergy through the thermal bottleneck and must becontent with trying to plug up some of the leaks.
Summary
In this chapter we looked in detail at the flow of energythrough our society. We examine the amount of energythat goes into the various consuming sectors and at theefficiency with whibh it is converted.
In 1968 a total of 15.3 Q Calories of energy wasconsumed in this country. (The total in 1974 was 18.5 QCalories.) Of the 1968 total, 41 percent was consumedby industry, 25 percent by transportation, 19 percent inthe residential sector, and 15 percent in the commercialsector. (These percentages remain about the same.)The major end use was heat, for space heating and forthe various heat-driven industrial processes. More thanhalf the total energy was used for heat, an additionalthird was used as mechanical energy.
If the production of electric energy were treated as aseparate consuming sector, it would account for a littlemore than a quarter of the total primary energy in 1973.This electricity was, in turn, consumed in only threesectors; 45 percent in industry, 31 percent in the resi-dential sector, and 24 percent in the commercial sectorin 1968.
The Second Law of Thermodynamics assures that allenergy conversions are less than 100 percent efficient.Among those that are important in our economy are thesteam turbine, 40 percent efficient at best,,and the au-tomobile engine, which converts heat to mechanicalwork with an efficiency of about 25 percent. As wepointed out, a more important measure than the effi-ciency of a single conversion device is the system effi-ciency, the cumulative efficiency of a process from theextraction of the fuel to the final delivery of the desiredenergy product. We displayed these system efficien-des. electric lighting, 1 percent efficient (5;percent forfluorescent lights); water heating, 24 percent efficientwith electricity and 60 percent efficient with gas; spaceheating, 25 percent efficient with electricity, 53 percentefficient with fuel oil, and 70 percent efficient with naturalgas. The final one, automobile transportation, is 6 to 9percent efficient as a system.
Taking this point of view, we look at the United Statessystem and find an approximate 36 percent overall effi-ciency.
The major offender, when we look at these efficiendes, is the heat engine. About half of our energy flowsthrough the "thermal bottleneck," the conversion ofthermal energy to mechanical energy. The Second Lawof Thermodynamics assures us that much of the 'newtenergy to this process will become unavailable as low-temperature heat energy.
In the end, of course, all our primary energy ends up,after many conversions, as heat and is radiated away toimperceptibly warm the universe. This is the real energycrisis and it is unavoidable.
149

CHAPTER 41 \
The Exponential Century
I

The Exponential Century
A large percentage of the problems of the 1970sare problems of growth, we have suddenly become toomany and the world and its resources have become toosmall. We have too many cars and too much highway,we need too much food and too many houses, etc. Notsurprisingly, a large part of the crisis in energy and theenvironment can also be traced to growth, an aspect wewill examine in this chapter. We will enter the hazy areaof projection and prediction and try to assess theamount and the form of energy this country, and theworld, will require for the remainder of the century. Andsince the past is often (but not always) a key to thefuture, we will also examine the historical record ofgrowth in overall energy consumption and in productionand consumption of the individual energy forms.
We can state much of the facts of growth pictorially. InFigure 4-1, two curves are shown, the growth of popula-tion and of energy consumption in this country. Figure4-2.shows similar world data.
Plotted linearly these figures dramatize the growth.The Figures 4-1 and 4-2 curves, especially the energycurves, rise sharply during the 70 years of this century.To make a point about the relationship of energy con-sumption and population growth, we have started bothcurves from the same point (by shifting the axis of theenergy curve). What becomes clear from this presenta-tion is,that energy consumption is growing more rapidlythan population, and, therefore, that per capita con-sumption is growing. Population growth accounts foronly a small percentage of total growth.Semi log Plots and DoublingTimes An Aside
When dealing with growth, in particular with the rapidgrowth we see here, it is much easier to study it if we plotthe data in a "semilogarithmic" graph. We discuss thesemilog" plots, and the "exponential curves- for which
they prove so useful, in some detail in Technical Appen-dix 2. We will briefly summarize that discussion here.
Whenever a quantity grows at a constant annual rateof increase, like compound interest, for instance, it in-creases in a manner called exponential. The worldenergy consumption or the population growth of Figure4-2, if smoothed out, would be good examples, of thistype of growth. If such an exponential curve is plotted ona semilogarithmic graph, one in which the vertical axisrepresents the logarithms of the numbers rather thanthe numbers themselves, the exponential curve becomes a straight line. We replot the data of FigureF. 4 1and 4-2 in this way as Figures 4 2 and 4-4.
Reading semilog graphs: Reading these semiloggraphs is not as difficult as it may appear at first. It is thegraph paper on which the numbers are plotted that hasto worry about logarithms. What we plot, and what youread, are the numbers themselves. Thus on Figure 4 3,to find out what the United States population was in1950, you look to the point at which the vertical line from1950 crosses the curve and then travel horizontally fromthis intercept to the right-hand population scale and
read the number, which is about 151 million.Doubling times and rates of growth: These
semilog presentations have long regions in which thedata can be fairly well represented by sa straight line.During these periods, therefore, the growth was expo-nential. United States energy consumption from1850-1895 and from 1935-1973 are two examples. (Theexponential growth of energy consumption in both ex-amples was broken by the depression of the 1930s.)The usefulness of this straight-line relationship is in theease with which the doubling time can be read from it.A definitive characteristic of exponential growth of aquantity is that it doubles at a constant rate. Thus energyconsumption in the United States, 10.0 quadrillion (Q)Calories in 1954, will reach 20 Q Calories (the extendedstraight line) in 1974. The doubling time is 20 years.Similarly, the doubling time for population over the sameperiod can be found from the graph to be 45 years(1922-1967), and energy consumption doubled every27 years in the latter half of the 19th century.
Another useful quantity, the annual rate of growth(the percentage by which the quantity increases eachyear), is related to the doubling time and can also beeasily found for the straight-line portions of these curves.The relation, where r is the rate of growth in percent peryear, is
r 70doubling time (in years)
Thus the annual rate of growth of United States energyconsumption since about 1935 has been r = 70 ÷ 20, or3.5 percent per year. Population over that same periodincreased atr = 70 ÷ 45, or 1.56 percent per year. We willleave it to the reader (or the students) to compute fromFigures 4-3 and 4-4 other doubling times and annualrates.
The Historical Recordthe Fuels
With the previous exercise as preparation, we willlook now at the historical record of both the productionand consumption ends of the energy flow pattern. Therecord shows growth and change. A new fuel is found,new uses are invented that increase the demand, and,finally, the demand stimulates the invention or discoveryof new fuels. This interplay is displayed for the importantprimary energy sources in Figure 4-5, which shows thepercentage of total energy supplied by each during thepast hundred or so years.
Figure 4-5 shows three cycles of change. wood dominated the latter half of the 19th century, coal was thefavored fuel in the first half of the 20th century and thepetroleum products have now taken over. In the decadeof the 1970s we may see the beginning of a fourthcycle nuclear energy, 1 percent of the total in ,1970, isexpected to provide 40 percent of the total by 2000.Water power (hydro) has remained around 5 percent.
What must be remembered, of course, is that eventhough the percentage contribution of a certain fuel maydecline, the absolute amount consumed is growing. Wesee this clearly in the data on energy production from
otheedividual sources which follow._'t taca
153

w
0.1
N
_.... Energy*--- Population
1850 1900 Year1950
300
200
100
50
20
FIGURE 4-4World Energy Consumption and Population - Semilog Plot
100
Nco=
c
0
z 10.:0.
ctono..8
...
3,000o8
6"
2,000
1,000
830.07.
TaU0.,
70.-- 20-dcc00.E 10-Ec8>g)cim 0
FIGURE 4-1 .
Historical Record of U.S. PopulationGrowth and Energy Consumption
r
/
20.0
15.0-
10.0,
5.G
0-
1850
4 '
FIGURE 4-3U.S. Energy Consumption and Population - Semilog Plot
100,
4. .-.,.._ Populationo Energy
8 (note shift in zero of energy scale)
1900 1950
Year
20000
FIGURE 4-2
Historical Record of World PopulationGrowth and Energy Consumption
sa., (um'
Population
Energy
(note shift in zero of energy scale)
1820 1850 1900
Year
19500
154
CIc>,..o)aL. )c
im
.--- Energy' Population
0.1
,1840 1900 1950
/- , Yeari
.. -
3,000'
2,000-
1,000-

Wood
The record of fuel wood consumption in this country isshown in Figure 4-6. A favored fuel in this forested -country for a hundred years or so, consumption reacheda peak of almost 140 million cords in 1870 and hassteadily declined since then. (A cord of wood is a stackof wood 4 feet by 4 feet by 8 feet that produces roughly 5million (M) Calories of energy.)
Much of this wood was used in home heating, anestimated 17.5 cords per house per year in 1850-1860,and by tl.e end of the century wood 11,..c1 also begun toplay an important role in industry and transportation.Although wood is no longer an important fuel as far as itspercentage contribution is concerned, large amountsare still burned. We see from Figure 4-6 that only twiceas much wood was bumeil in 1850 as in 1950. In 1950 itstill contributed 10 percent of the residential energy andan estimated 70 percent of rural heat.
Coal
The first of the great replacement cycles featuredcoal. Although used extensively for fuel in Europe in the18th and 19th centuries, the European immigrants toThis country turned to coal only after the great forestshad been chopped down. Coal, plentiful in the EasternAppalachians near the developing industries, had ahigher energy density than wood (more Calories perpound) and is thus the preferred fuel if it has to bebang:fide:I. The demand for coal was fed by changes inthe induOrial and transportation sectors; the steel indus-try used ,oke, a coal-derived fuel, and the growingrailways 11 coat-fired steam engines.
The historical record of coal consumption in this coun-try is given in Figure 4-7. Coal use has gone through itsown cycles. It peaked in 1920 at 660 M tons, then beganto fall as oil cut into the heating market. It peaked againduring the petroleum-short period of Worl War II, thendropped swiftly as the diesel en,gi an to replacethe coal-fired steam locomotive. The rapidly increasingdemand for electricity has brought about a third periodof growth, since coal provides about half the energy for
FIGURE 4-5The Changing Fuel Mix
01850 70 90 1900 20 40 60
Year
eleicity generation. Demand will also be fed by plants,that turn coal into gaseous and liquid fuels. Coal's pro-jected tonnage consumption will go well beyond the1920 peak. At present our most abundant energy re-source, coal is also responsible, in its combustion withpresent techniques, fora large share of the environmental problems and health hazards of energy. production.We will have more to* say about coal.
on
Petroleum, also, is a fuel of antiquity. The "GreekFire" of the Roman sieges was burning asphalt, and anoil well dug in 1640 outside of Modena, Italy, flowed for200 years providing, among other uses, kerosene forstreet lighting. The first United States oil well, a well only69.5 feet deep, was drilled in August 1859 outside ofTitusville, Pennsylvania.
The growth of oil production and consumption isshown in Figure 4-8. We see again the almost straight-line growth of an exponential with a doubling time ofabout 10 years in the early part of this century and 20-25years at present. The United States was an oil exportingnation until the 1950s.but, as we have recently learnedto our dismay, has +increasingly become an importingone. We impeded 3l; percent of our petroleum supplies(crude oil plus refined products) in 1973. In 197 ourcrude oil imports-rose, from 1.18 B bbls to 1.27 Bbbls,and made up 37 percent of the total petroleum supply.
The interaction of growth and change is particularlyobvious in the pattern of oil consumption. The enormoussupply of this cheap fuel led to the development of avariety of uses; kerosene for lamps, heavier oils forheating, and oils and greases for lubricating. The inven-tion of the gasoline engine, in about 1880, produced thepresent dominant market. Gasoline and fuel oil accountfor almost 90 percentpf the market and their productionin the refinery creates the sort of inflexibi!ity we saw inwinter 1973 and 1974. If fuel oil is short in the winter, therefineries produce more of it at the expense ofgasoline for the automobile driver in the sprang.
Oil replaced coal in heating and as the energy sourcefor railroad transportation. Coal dropped from 75 per-cent of the total in 1910 to less than 30 percent by 1955,while petroleum grew over this same period from 10percent to 65 percent. Petroleum products accountedfor 77 percent of our energy in 1974. Within the pe-troleum boom, however, a mini-cycle was taking placewith the growing popularity of the "Mr. Clean" of fuelsnatural gas.
Natural Gas
Natural gas has increased its share of the energymarket from 5 percent in 1925 to 30.4 percent in 1974. Itis also an old fuel, used by ancient civilizations in Chinaand Egypt.
The early history of natural gas in this country wasone of conspicuous waste. It is estimated that 90 per-cent of this fuel produced in the rich fields of Oklahoma,Texas, and California was burned at the well or lost inother welt. When the problems of 'transporting and
155

storing this fuel were overcome, however, its cleanli-ness and the simplicity of gas furnaces made it increas-ingly popular.
The growth of demand for natural gas is shown inFigure 4-9. This is almost pure exponential growth witha doubling time of 8 to 10 years: It is a preferred fuel notonly from the point of view of cleanliness and simplicity,but, as we have seen in Tables 3-17 and 3-18, from anefficiency viewpoint, also. And it is also more economical to ship than electricity. The fuel cell, which we shallstudy later, may open up a new market of on-site electricpower production. The future of natural gas, however,depends on its availability, and that is in question.
Hydropower and Other Sources
In its energy use, the United States was still in ecolog,ical balance in the late 19th century. Most energy wasconsumed in the home, with wood (secondhand solarenergy) the major source. Growing United States indus-try was also built on secondhand solar sources; wood,wind, and water. In 1850 the sailing ship was of majorimportance in ocean travel and waterwheels, mostlyalong New England's streams, were the "prime mov-ers" of industry. In 1850, for instance, wind and waterprovided 64 percent of the mechanical work for thiscountry, coal, 19 percent, and wood, 17 percent By1870 these percentages had turned around. They werewind and water, 33 percent; coal, 58 percent; and wood,
FIGURE 4-6Consumption of Fuel Wool
150
1850 60 80 1900 20Year
40 60
Data from Schurr and Netschert, Energy in the American Econo-my, 1850-1975. Baltimore The Johns Hopkins Press,1960.
(a)A cord is a stack of wood 4'X4'X8'. It contains approximately 5million Calories.
156-
1
9 percent. Also important in mid-19th-century Americawas a different kind of solar "engine," farm animals(primarily horses and mules). Their total horsepowercontribution in 1850 was greate ithan all others and wasstill equal to them by 1870. By 1900 their contributionhad declined to 23 percent, but the number of animals,even in 1920, was still about the same as in 1900 (anestimated 25 million) and one-quarter of the total acresdevoted to agriculture was required to feed them.
It is tempting to bemoan the conversion we see inthese statistics. from a nation that lived in balance withnature, on the interest so to speak, to a nation drawingon its nonrenewable fossil fuel capital. It is well to look,again at Figure 3-6, at our per capita energy use. In1850 per capita consumption was 25.6 M Calories, withwood, used very inefficiently and mostly for space heat-ing, contributing 23.2 million (M) of these Calories. In1973, on the other hand, per capita energy consumptionwas 90.4 M Calories with only 15.4 M of those Caloriesused in the much more extensive space heating in ex-istence. As environmentally satisfying as that balancewith nature appears, we could not have built our presentstandard of living on it.
While some of the old sources of energy, as we shallseein a later chapter, may come back into limited popu-larity (energy from wood and other organic waste or newsophisticated windmills, for instance), water power has
FIGURE 4-7Consumption of Coal
660630
569
1860 80 1900
Year
30 50 1970
(19731
Data from Schurr and Netschert, Energy in the American Econo-my, 185a-1975. Baltimore The Johns Hopkins Press,1960.

continued to be of steady, if minor, importance. The firstelectric generator, at the Pearl Street Stati9n in NewYork City in 1882, was a coal-fueled steam engine. Thesecond one, in operation a few months later on the FoxRiver near Appleton, Wisconsin, was water powered. Itis in the generation of electricity that water power hasfound its continuing role, and it is presently responsiblefor about 15 percent of the total generating capacity ofthe United States.
We plod`, in Figure 4-10, the annual total of kilowatt-hours produced by by iroelectric power in this countryfrom that beginning station to the present era of hugedams and reservoirs. The growth has the exponentialshape. The total hydro-generated electric energy hasbeen doubling every 16 years during the last few dec-ades. As we saw in Chapter 2, however, the potential forfurther expansion is limited and we should see a perma-nent turnover of this curve in the next decade or two.
FIGURE 4-8U.S. Production and Consumption of Petroleum
10
1.0
L-iuto9-0
U.S. Crude OilProduction
0.1
6.30 (1973)
3.36 (1973)
U.S. Consumption ofPetroleum Products
..
0.01I
I
1860 1880' 1900 1920 1940 1960 1280Year
Data from Schurr and Netschert, Energy in the American Econo-my, 1850.1975. Baltimore. The Johns Hopkins Press,1960,
The Historical RecordConsumption- In Chapter 3 we gave a detailed breakdown of thepattern of energy consumption as of the last careful tally(1968) This pattern has undergone growth and changesimilar to that which occurred in the fuel mix. In Figures4-1 and 4-3, we showed the historical record of UnitedStates consumption. We will look briefly now at thechanges in importance that have occurred in the fourconsumption categories. In the late 19th century, thedomestic sector utilized 90 percent or more of the totalenergy. Table 4-1 summarizes the data for selectedyears since 1950. We see the expected growth in con-sumption in all categories, with the household andcommercial sectors growing more rapidly than the indus-trial sector (whose percentages share steadily de-creases until the slight increase in 1974). The percent-age used by transportation fluctuates near 30 percent.
Electric Energy
In Table 4-1 the kilowatts of electric energy used ineach sector are converted to Calories (by multiplying by860 Calories per kw-hr) and added to the appropriatetotals. The subtotal for each year, therefore, is less thanthe total primary energy used because of the loss ofenergy in the generation of electricity. In order to provide
FIGURE 4.9U.S. Natural Gas Consumption
10;000
1,000
100
1860 80 1900 20Year
22,245 (1973)
21,780 (1974)
40 60 80
Data from Schurr and Netschert, Energy in tho American Econo-my, 1850-1975. Baltimore. The Johns Hopkins Press,1960.
and Bureau of Mines, U.S. Department of the Interior. and Bureau of Mines, U S. Department of the Interior
IC4
157

this comparison, we have added the losses incurred inconverting primary energy to electricity to the bottom ofeach column, and display the percentage of the totalenergy lost through conversion, Because of the increasmg use of electric energy, this percentage is also increasing.
Electric energy deserves separate consideration be-cause of its importance as an intermediate form ofenergy. Figure 4-11 provides a historical record of itsconsumption in this country since 1900. The consump-tion of electricity also shows long stretches of exponen-tial increase, broken, as was most energy consumption,by the depression years. Consumption during the 1950sand 1960s showed a 10-year doubling time; during1950-1970 the doubling time was about 13 years.
The major consumers of electric energy are thehousehold and commercial sectors and the industrial
FIGURE 4-10Electric Energy from Hydroelectric Power
1,000
100-10
0 .
0
0
*CO
C)
w10
1
290 B kwhrs (1974)
90b 1920 1940
Year
1960 1970
Data from
and
158
Schurr and Netschert, Energy in the American Economy, 1850.1975. Baltimore. The Johns Hopkins Press,1960.
Bureau of Mines, U.S Department of the Interior
sector. Very little electric energy is used in transporta-tion. We show, in Figure 4-12, the changes that haveoccurred in the division of the total electric energy between those two groups. In the last 20 years the household and commercial sector has become the dominantconsumer, its percentage share increasing from 48 per-cent in 1950 to 58 percent in 1970. It remained at 58percent in 1974.
The World PictureGrowthand Change
We have, so far, focused our attention on growth andchange in the patterns of energy production and con-sumption in this country. Growth and change are alsooccurring in the world's energy flow patterns and theseare worth a brief report and comparison with the UnitedStates data.
We presented the gross energy consumption data inFigures 4-2 and 4-4. The record of the production ofenergy from the various primary sources is shown inFigure 4-13. The percentage share of the total energyderived from each of the four major primary sources isshown in Figure 4-14.
The gross features of world consumption are similarto those we have just seen in the United States data.The total energy consumption rises steadily, as doesthe production from the four primary sources. We seefrom Figures 4-13 and 4-14 that coal is losing ground tooil and natural gas, oil's share having grown from 13percent in 1925 to 43 percent in 1968, and natural gas'sshare from 3 percent to 18 percent over the sameperiod. Oil and natural gas production (Figure 4-13)both show almost perfect exponential growth, and theirdoubling times since 1950 have been about 8 years.Hydroelectric power has contributed only a small per-centage of the total, but its total contribution has alsorisen steadily, doubling every 10 years.
We see in Figure 4-14 only one replacement cycle,the replacement of coal by oil. There existed, of course,an earlier replacement of wood and other organic fuelsby coal, but we do not have the data to show this one.The nuclear cycle is only just beginning, it contributedless than 0.1 percent of the world's total energy in 1968.
The omission of data on the "noncommercial"sources of energy, wood in Brazil, cow dung in India,sugar cane residue in Cuba, etc., causes some under-estimation of world energy consumption in comparisonwith the more complete record for the United States. Ithas been estimated (in 1950) that 51 percent of theenergy consumed in Africa was of this unreported, non-commercial type, as was 35 percent of CentralAmerica's energy, 45 percent of South America's and58 percent of Asia's. Since noncommercial fuel isburned very inefficiently, leaving it out does not causeas big an error as one might first suspect.
In a closer comparison between the United Statesdata of Figure 4-5 and the world data of Figure 4-14, wesee that the replacement cycles in the world are generally later than similar cycles in the United States. Coal,for instance, dropped below 50 percent of the total in

about 1940 in the United States, and by 1960 oil andnatural gas between them accounted for 75 percent ofthe total. The comparablefigures for the world show thatcoal dropped below 50 percent in 1950, and even in1968 oil and natural gas accounted for only 61 percentof the total. This same lag in the shift to new sourcesshows up in the production of electricity, which we shallexamine next.
Electric Energy-The World Picture
Following the United States lead, the world is becom-ing more and more turned on to electricity. Figure 4-15shows the almost pure exponential growth of world elec-tric energy consumption, with a doubling time of 8 years.Comparison of Figure 4-15 with 4-13 and conversion ofkilowatt-hours to Calories shows that in 1968 electricenergy (with losses taken into account) accounted for 8percent of the total world energy consumption, while itaccounted for slightly more than 10 percent of theUnited States total that year.
The absolute values of per capita electric consump-tion and the growth in this Fzepsure are quite differentaround the world and at home. The data are sum-marized in Figure 4-16 for the various continents and inTable 4-2 for selected countries. You will note that it isnecessary in Figure 4-16 (as it was in Figure 4-13) touse "four-cycle semilog"paper to take care of the greatrange in data, from the 4 kw-hr per person per year in theMiddle East in 1925 to the 7,448 kw-hr per person peryear in North Americain 1968. Figure 4-16 shows notonly the great differences in per capita electric energyconsumption between the continents but also the dif-ferences in growth. The U.S.S.R., Communist bloccountries, and the Middle East are showing particularlyrapid growth, while Africa's electrification proceeds veryslowly.
Table 4-2 shows the per capita consumption of elec-tricity in various countries. The highest, twice the United
States consumption, is in Norway, where climate andgeology provide great hydroelectric capacity, supplying
FIGURE 4-11U.S. Consumption of Eiec
10
1.0
0
0
0.01.
0.001
1.590 T kwtus.4.1973)1.561 T kwr-hrs (1974)
1900 1950Year
2000
Data from Schurr and Netschert, Energy in the American Economy, 1850.1975. Baltimore: The Johns Hopkins Press,1960.
and Bureau of Mines, U.S. Department of the Interior.
TABLE 4-1Energy Consumption by Sectors, 1947-1973 (in 0 Calories(a) and Percent(b))
Sector 1947Cal (%)
1955Q Cal (%)
1960Q Cal (%)
1965Q Cal (%)
1970Q Cal (%)
1973Q Cal (%)
1974Q Cal (%)
Household andCommercial 1.81 (25) 2.39 (27) 2.90 (30) 3.47 (30) 4.29 (30) 4.55 (31) 4.42 (29)
Industrial 3.35 (45) 3.82 (44) 4.08 (42) 4.89 (42) 5.91 (41) 6.08 (39) 6.03 (40)Transportation 2.23 (30) 2.49 (29) 2.74 (28) 3.27 (28) 4.16 (29) 4.78 (30) 4.62 (31)
5ubtot.: 7.39 8.70 9.72 11.63 14.36 15.41 15.07
ConversionLosses(c) .89 (11) 1.21 (12) 1.46 (13) 1.90 (14) 2.95 (17) 3.39 (18) 3.35 (18)
Grand Total 8.28 9.91 11.18 13.53 17.31 18.87 18.46
Data from Bureau of Mines, U.S. Department of the Interior.
(1)(1 (quadrillion, 10' S) Calories.IbIThe percentages shown for the three consuming sectors are wath respect to the subtotal. The percentages shown for the conversion losses arewith respect to the grand total."Hydropower and nuclear power are converted at the prevailing fossil fuel efficiency, whit.h slightly over-estimates the tosses,
159

99 percent of their electricity. Among the other coun-tries, Canada gets 77 percent of its electricity from waterpower, Great Britain almost none of its respectableamount from that source, and Ethiopia almost all of its
paltry consumption from water power.In the world, as in the United States, we greet the
growth in the popularity of electric energy as a mixedblessing. Its growing use is a signal that other people in
TABLE 42Per Capita Electric Consumptionof Selected Countries, 1968
Country Per Capita Electric Consumption(icw-hrs)(1)
Norway 15,730
Canada 8,450U.S. 7,175
Great Britain 4,030U.S.S.R. 3,550
Japan 3,675
Brazil 433
Ethiopia 150
India 94
Source: The 1968 Statistical Yearbook, Statistical Office of theUnited Nations, Department of Economic and Social Affairs, NewYork, 1969.
(aikw-hrs .. kilowatt-hours
FIGURE 412Consumption of Electric Energy in theTwo Major Consuming Sectors
20
15 -
10--
0.5 -
52%
48%
IndustrialSector
Household andCommercial Sector
1950,\\\- \
1960 1970
Year
42%
58%
1980
Data from Bureau of Mines, U.S. Department of the Interior.
160
other lands are beginning to enjoy the benefits of thisvery flexible form of energy that is so essential in themodern electric world. Generated as it is with ineffident heat engines, however, its growth means thatmore and more primary energy is being wasted
Future GrowthThe HazyCrystal Ball
With the historical record of growth behind us, we cancomplete our study of energy matters in the "Exponen-tial Century" by looking at the predictions of the growthin demand during the remaining quarter of the century.
If the future takes its cue from the past, we could justplot all the data of production and consumption onsemilog paper, lay a ruler along the points, and continuethe straight line into.the future. Some of the predictionswe will look at in this section seem, in fact, to have beenproduced by that method.
One of the firmest lessons from nature, however, isthat exponential growth cannot continue. In terms of
FIGURE 4-13World Energy Production by Source
100
10
0.1
-o- Total- o-- Coal6-- 0 i l
- -4. Natural Gas.._,...- Hydropower
*Nuclear (1972)
0.011925 1950
Year1970
Data from Darmstadter, Teitelbaum and Polach, Energy in theWorld Economy. Baltimore The Johns Hopkins Press,1971.
and The 1973 Statistical Yearbook, Statistical Office ofthe United Nations, Department of Economic andSocial Affairs, (New York. United Nations) 1974.
i

doubling time, we know that nothing can keep on doubl-ing forever Exponential growth may take place fora while a colony of bacteria may double at a constantrate for awhile, the number of uranium nuclei splitting ina "chain reaction" may double at a constant rate fora while Eventually, however, the reaction from the envi-ronment takes over Food runs out and toxic wastesbuild up to slow the bacteria growth. Control rods areinserted or the uranium mass flows apart to slow the"chain reaction."
These growth-stunting forces build up in the energy-environment area, also, and we describedsome of themin Volume I What do we expect to happen when anexponential growth curve collides with the facts of life?Typically, it turns over and becomes an "S" (or Sigmoid)curve Figure 4-17, a projection of populatio growth,provides an example of this. The lessening o e slope,which we see here, means that the doubling time isgetting longer and longer, the annual rate of growth (the"interest," so to spqak) is getting smaller, and the curveis approaching the stable or no-growth condition of ahorizontal straight line. We will look for evidence of suchbehavior in the projections of demand that follow.
U.S. Energy Consumption, 1970-2000
Prediction is an uncertain art. As we have said, the
simplest method is to extrapolate the past into the fu-ture. The dangers of this are obvious, as every stock-market speculator or horse bettor knows. More elabo-rate procedures have been developed, the growth ofvarious components of the economy are individuallyexamined and their contributions summarized, and pre-dictions of overall growth arrived at. The projections wesummarize in Figure 4-18 have been made by variousexperts and have employed many different methods.
The individual projections of total energy consump-tion in this figure are shown as dots, the x's are theaverages. We can make several points from Figure4-18. The future curve does not yet show the' S" shape,it continues to rise at an annual rate of about 3.5 per-cent. Another obvious feature is the lack of agreementamons,eAperts, which becomes greater as they movefurther ihto the future. The predictions for 2000, forinstance; vary from a high of 60 Q Calories to a low of33.8 Q Calories. That this uncertainty is deserved canbe verified by looking at the projections for 1970. Thefour projections shown, all made in the early 1960s,were all low, the extreme one missed the mark by 13percent. Thirteen percent is not a large error, and yet 13percent of the 1970 total energy of 17.4 Q Calories isequivalent to 430 M tons of coal, three-quarters of thetotal tonnage of .coal mined that year. Since it is much
FIGURE 4.14Percentage of World Energy Production from the Four Major Sources
100
0
Hydro
Natural Gas
Oil
Coal
1925 1930 1940
Year
1950 1960 1970
Data from Darmstadter, Teitelbaum, and Polach, Energy in the World Economy, Baltimore. The Johns HopkinsPress, 1971.and The 1973 Statistical Yearbook, Statistical Office of the United Nations, Department of Economic and Social Affairs New York.
United Nations, 19741.
161

more serious to underestimate energy demand than tooverestimate it, industries, like the electric utilities, thatdeal with difficult-to-store energy forms, tend to overes-timate demand.
If we stick to the averages as the most realistic projec-tions, continued exponential growth with a doubling timeof 20 years is the prediction. Thus, consumption in 2000is expected to be 11/2 times the 1920 total. It is of interestto look at the basic assumptions that underlie theseprojections. The five most important variables and theassumptions concerning them were
(1) Gross national product (GNP).*.Generally, arate of increase of 4 percent per year was assumed
(2) Population. Generally, the Bureau of CensusSeries projection of 1.6 percent per year was used
(3) Price of fuels. This assumption refers both to theprice of fuel relative to other fuels and to the general
The GNP is the total value of goods and services produced by a
country.
FIGURE 4-15World Production of Electric Energy
10#
5-
0.5
//
0.1
1925 1940 1950 1960 1970
Year
F
Data from Darmstadter, Tr, mum, and Polach, Energy in theWorld Economy...altimore The Juhns Hupitais Press,1971.
and The 1973 Statistical Yearbook, Statistical Office ofthe United Nations, Department of Economic andSocial Affairs. (New York: United Nations) 1974.
162
price level. Most assume existing relative shares of themarket will prevail in the future.
(4) Availability of fuels. The usual assumption isthat there will be no limitation on gross availability.
(5) Technology. Most assume no revolutionarychanges, but they do foresee a sizable increase in nu-clear generating capacity.
Two other assumptions also seem to have beenmade, first, that there would be no gross swings in thebusiness cycle, and, second, no major overseas warwould occur so defense spending would continue at itspresent relative level.
These assumptions seem much more optimistic nowthan they did when originally made. The 4 percentgrowth of the GNP, for instance, is much more than thepresent rate, in fact, the GNP declined in 1974. There isalso some evidence that the energy-to-GNP ratio ischanging from its historic pattern and that the-amount ofenergy per dollar GNP is now increasing.
The other assumptions can be questioned, also. The1.6 percent population growth is significantly higherthan the actual 1.3 percent growth of the last decade;the assumption of no change in relative prices seems tocontradict the presently observable rapid rise of oilprices relative to coal and natural gas. We have justpassed through several months of an oil shortage andthe threat still hangs over us. The last assumption issurely the most conservative, for by it we give up anyhope for help from technology in the next 30 years nofusion, no fuel cells, no big improvement in electricgenerating efficiency from magnetohydrodynamic(MHD) generators Or other technologies discussed inChapter 6.
With all these qualifications we can say little about theprobable accuracy of Figure 4-18 other than to warnagainst blind reliance. The net result of most of thechanges the past two or three years have brought to thepicture soaring energy prices and general inflationare the most drastic ones leads to a cautious expec-tation of less growth than Figure 4-18 shows. The pre-dictions of growth that have come out of the most recentstudies, and which we look at in Chapter 7, Volume I,are, in fact, much more conservative than any of these.The change that has taken place in our thinking aboutour energy future can be seen by comparing Figure4-18with Figure 7-3 of Volume I.
As we try to assess these projections and, more im-portantly, as we look at target areas for energy conser-vation, it is helpful to look at the three sectors (residen-tial and commercial, industrial, and transportation)separately. Figure 4-19 summarizes a Bureau of Minesprojection. There are no great surprises here; all sectorsgrow, with transportation growing most rapidly. The res-idential and commercial sector also is expected togrow faster than the industrial sector. These projec-tions, made by the Bureau of Myles in 1968, are alreadyoff as far as their absolute numbers are concerned. Theactual consumption in 1973 was greater than the pro-jected 1980 total.
,..-3
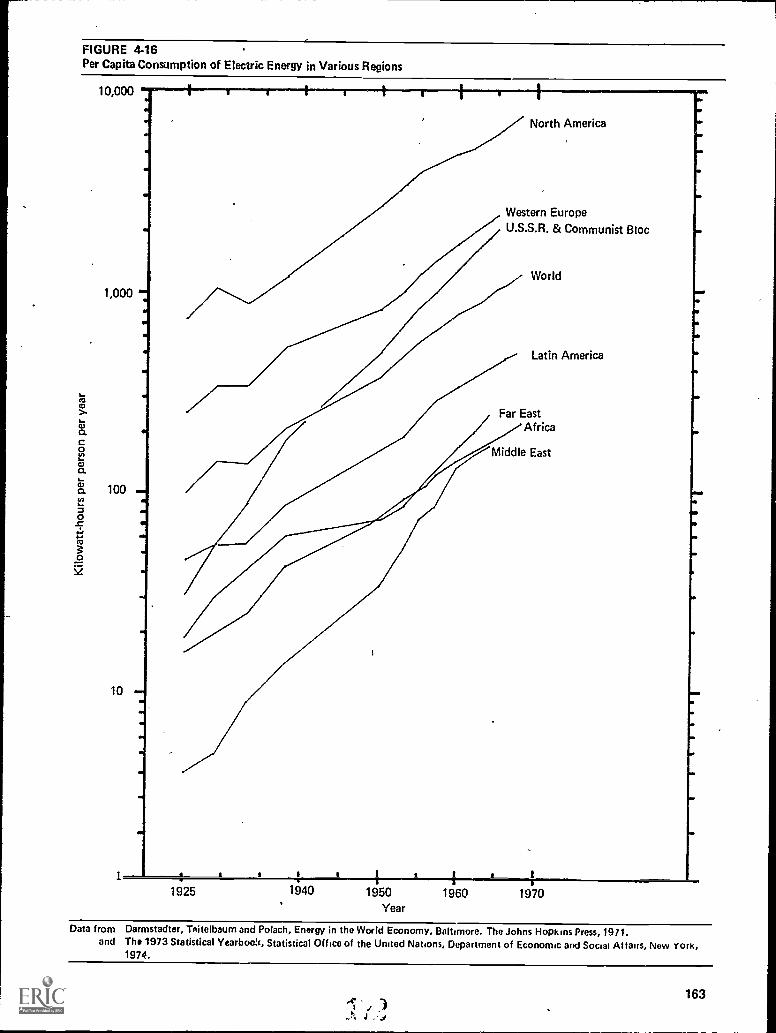
FIGURE 4-16Per Capita Consumption of Electric Energy in Various Regions
10,000
1,000
100
10
1
North America
Western Europe
U.S.S.R. & Communist Bloc
World
Latin America
Far EastAfrica
Middle East
1925 1940 1950Year
1960 1970
Data from Darmstadter, Teitelbaum and Polach, Energy in the World Economy, Baltimore. The Johns Hopkins Press, 1971.and The 1973 Statistical Yearboth, Statistical Office of the United Nations, Department of Economic and Social Attairs, New York,
1974.
163
t JJ

2000 and beyond; We will end our crystal ball gazingwith Figure 4-20, projections by Ralph Lapp in which thegrowth of all the forms of energy is individually shown.
- Total energy curves for different growth rates are shownon it. (He has chosen 2.4 percent per year as the mostlikely.) Figure 4-20 also shows the peaking of oil and gasproduction in the early 1980s, and the expected growthof coal and nuclear energy. By this scenario, fuel sharesin 2020 would be: nuclear, 48 percent; coal, 24 percent;oil, 11 percent, natural gas, 3 percent, and hydropower3 percent. A review of Figure 4-5 reveals the greatchanges Lapp expects in the fuel mix.
Growth in Electric Energy Consumption
In many ways the most troublesome of the growthcurves is the one for electric energy. We showed, inFigure 4-11, the impressive historical record of this in-termediate energy form, demand doubling every 10 or15 years. Rising prices, shortage of investment capital,and environmental impact (which we shall discuss later)will continue to attrac attention to this sector. What arethe projections for its growth?
A summary of expert projections of electric energyconsumption is shown in Figure 4-21. The averages fallalong a line of 6 percent annual growth, or a 13-yeardoubling time. Roughly, this means that we will double
FIGURE 4-17aU.S. Population from 1800
400
E 300O
200O
a.0. 100,fn
0
Annual growth decreases by0.02% per year after 1970 /
1800 1900 2000Year
2100 2200
FIGURE 4.17bU.S. Population from 1940
2. 400
c 300O
ao.
toi
200
100
Same date as above(semilog plot) ----------- - - -
Exponential (straight line)1.4% increase/year
1940 1980 2020. .
2060 2100 2140Year
2180
164
our consumption of electric energy for 1970-1980, dou-ble it again by WO, and again by the year 2000 an
almost eight -fol increase in 30 years.If we look at our present use of electricity, it is difficult
to see how we can use 8 times as much. We can haveonly so many televisions, toasters, and teakettles Sinceelectricity is such an important form of energy, it is wortha little space to look in more detail at the causes of itsgrowth.
The Federal Power Commission's projections forgrowth in electricity demand in the various consumingsectors are shown in Table 4-3. We see that the highestgrowth rate is expected in the commercial sector, fol-lowed closely by the residential, and then the industrialsector. Space heating and air conditioning are the biggrowth areas in the commercial and residential sectors,with lighting also important in the commercial sector.We have shown, in Figure 3-3, the expected growth inelectric space heating and find in these data more sup-port for these projections. There is also room for growthin appliances. In Table 4-4 we show the percentagesaturation of various appliances as of 1970. There isclearly room for significant growth in the numbers of airconditioners, food freezers, clothes dryers, dish-washers, and color television sets. The number ofappliances will grow as the number of households in-creases and as the percentage saturation increases. In
addition to this, however, the energy consumed perappliance is increasing as they are used more, and asenergy-intensive innovations ("frost-free" refrigeratorsand self-cleaning ovens, for example) are introduced.
The expensive substitutions: In all sectors, but inthe industrial sector in particular, the growth in electricenergy consumption is being driven by three differenttypes of substitution: the substitution of electric energyfor other direct forms (electric heating for oil, for in-stance), the substitution of energy-intensive materialsfor energy economic ones, and the substitution of elec-tric power for manpower.
We have given one example of the first type of sub-stitution. More important ones are occurring in the pri-mary metals industries, where electric fumaces are re-placing fuel-fired ones, and in the chemical industry,where new techniques are also electrical.
Much of the growth is spurred by the popularity ofenergy-intensive materials: aluminum for steel or wood,plastic for paper and glass, synthetic fibers for cottonand wool, etc. We have provided the basis for some ofthe pertinent energy comparisons in Chapter 3.
It is also clear that electric power has been increas-ingly substituted for manpower. Between 1947 and1967, for instance, the electric input to industry doubled,while manpower increased only 14 percent. We find aneven more interesting comparison when we look atproductivity (defined as the value added to goods di-vided by the manhours input). We show three compari-sons of this value added (the value of the goods minusthe cost of energy, wages, and materials) in Figure 4-22:

FIGURE 418Projections of U.S. Energy Consumption, 1970-2000
70
60--
50
. 40
30
20
15
10
:/
1973 0
1
1960 1970 1980
Year
1990 2000
Data from Survey of Energy Consumption Projections, Committee on Interior and Insular Affairs, USGPO 94.459, 1972.
165

"energy productivity," "manpower producti,ity," and"electric power productivity" (value added per kw-hr).We see that "manpower productivity" has almost dou-bled over that period, there was a rise of "energy pro-ductivity" (during the period of great improvements inenergy efficiency) and then a flattening out, and there
has been a decrease in 'electric power productivity."The implied conclusion is that manpower productivity isincreasing because a fewer number of men can multiplytheir effects with electric devices and the electric bill
rises.We have discussed electric demand growth in detail
because of the inefficient production of this intermediateenergy form. To the projection of total electric energyconsumed we have added a curve showing the energy
that will be lost in the generation of this electricity (Figure4-21). These losses are an important part of the price wepay for the use of this convenient form of energy Thiswasted energy was 17 percent of the United States totalenergy consumption in 1970, and taking the projectionsof Figures 4-18 and 4-21 together, we see that in thegeneration of electricity we will waste 23 percent of ourtotal energy in 1980, 26 percent in 1990, and 33 percentin 2000. The percentage of the total energy wastedgrows even though the efficiency of generation im-proves because of the increased percentage of totalenergy supplied by electricity. The 14 4 0 Calories ofheat that is expected to be wastedin 1990 in the genera-tion of electricity is a little more than the total UnitedStates energy consumption of 13 6 Q Calories in 1965
FIGURE 4-19Projections of Energy Consumption by Sectors
30
20
10
1960
28%
30%
Actual 1973 0
29%
31%
1 r
Transportation
Residential andCommercial
34%
32%
41%
1970
Year
39%
1980
Industrial
1990
34%
2000
Data from Survey of Energy Consumption Projections, Committee on Interior and Insular Affairs, USGPO 94 .459,1972.
166 ,«4' i ')

FIGURE 4.20U.S. Energy Scenario, 1974.2024
o
1,000
TOTAL ENERGY
/-- 4%/../// / 3%/ .
1 ./ . N +C +O +H +G
..--- -2%. ..--// . ..--..... / ..../ ,
....Nuclear/ 1. .
N..
100
. // Coal
/ ciN,..**.I. C
0'
10
Coal //Nuclear
1ydHro
/ A.0.11'.1." H
ier..yO Natural Gas
G
,er
Oil
0
Nuclear
Projected ----*
0.5
1900 1920 1940 1960
Year
1980 2000 2020
Source Ralph Lapp, QuadriScience, Inc., Washington, D.C., private communication, 1974.
/6 167
3

FIGURE 4-21Projection of Primary Energy Use and Electric Production, 1970-2000
500
100
10
1
I 1
Total Primary Energy ------4For Electrical Generation(in kwhr)
69%
I I
I
1
//
itii-- 1973 Actual
61%
Total Electric Energy
,-,
PO
1960 1970 1980 1990 2000
Year
Data from Survey of Energy Consumption Projections, Committee on Interior and Insular Affairs, USGPO 94459, 1972
s
168

There are other wasteful uses of energy in our soci-ety, and we will focus on strategies for energy conservetion in a later chapter. We do, however, want to continu-ally emphasize the price we pay for the convenience ofelectricity_ We should add kilowatt hours to our energybill with great care.
A Dissenting Opinion
The rising exponential of Figure 4 21 has other seri-,ous implications in addition to the growing waste wehave just mentioned. The almost quadrupling ofgenerating capacity by 1990 means four times as manyplants, twice as many transmission lines, more air pollu-tion, and radioactive waste. It also makes serious de-mands on investment capital, building supplies, andmanpower.
The electric industry, because it deals with a perisha-ble product, must sell the energy it produces im-mediately. This fact, combined with the short (about 10years) doubling time and the long (7 or 8 years) time ittakes to put a new plant in line, makes prophesies, suchas those of Figure 4-21, to a large extent self-fulfilling.For this reason, these prophesies must be as accurateas possible. There is now reason to suspect that thecontinued rising demand we have pictured is not com-pletely realistic.
In a study reported in Science Magazine (November1972), three economists, Chapman, Tyrell and Mount,investigated the influence of four factors on the demand
for electricity: its price, the growth in population, theaverage national income, and the price of natural gas.What they were looking for is called the "elasticity" ofeach of these factors, that is,.the percentage increase ordecrease in the demand for electric energy that followsa percentage increase in any one of the factors. Theyfound that an increase in the price of electricitylowereddemand by 1.3 to 1.7 percent for each price increase of1 percent. The other factors showed positive elas-ticities, demand increased with increases in the factor.The price of electricity has already begun to rise (after40 years of decrease) and is expected to rise from 20 to10Q percent in the next three decades.
Using different projections for all these four factors,Chapman et at, produced the demand curves of Figure4-23. We see that all the curves predict similar totalelectric energy consumption in 1975, but that the projec-tions from their study are three to five times lower thanthe high estimate of Figure 4-21 for 2000. It is only byassuming a 1.4 percent population increase, and a,decreasing cost of electricity, that a projection (cite Fof Figure 4-,22) consistent with Figure 4-21 ispbtained.
The most recent data are consistentyvith the Chap-man et al. prediction. In 1974, afterdecades of growth,electric consumption declined 2-percent.
Because of the self-fulfilling nature of.electric energydemand projections-ritis most,important that like studiesbe continued and that their results be used to shape'official" prOjections such as those made by the federalPower Commission.
TABLE 4-3Projected Increases in U.S. Electric Energy Requirements by Classification of Use 1965-1990
Clam of Use Increase in Energy Requirements 1965.1990
(Million megawatt-hrs.) Percent
AverageAnnualRate ofGrowth
(in percent)
INumber ofYears toDoubts
Consumption
Electric Utilities
Residential (nonfarm) 1,155 454 7.08 10Irrigation & Drainage Pumping 23 209 4.62 15Other Farm' 70 259 5.24 14Commercial 948 498 7.41 10Industrial 1,950 447 7.04 10Street & Highway Lighting 31 344 6.14 12Electrified Transport' 3 60 1.90 37Other `Uses 182 569 7.90 9Loss*: & Unaccounted for 410 446 7.04 10
Total Utility 4,772 452 7.06 10
Industrial EstablishmentsInPlant Generation' 48 47.1 1.55 45
Total 4,820 4162
Source: 1970 National Power Survey, Part I, Federal Power Commission, Washington, D.C., 1971.
'Includes residential use on farms; other residential uses in rural areas included under "Residential."Excludes electrification of automobiles.
3 Excludes industry sales to electric utilities.
't 0 169

FIGURE 4-22Productivity of U.S. Industry
EnergyProductivity:
($ per million BTU's)(81
oft,
Manpower -oProductivity <-o o
(S per manhours) c
1
1
1
,... ,...47 4- .7o..b-
la .4riPower -0 fe .6
1:3Productivity < La
($ per kilowatt-hr) o("46 .5- ...3 ED A
ManhoursPer
kilowatthrs
175
5 150
C.)4-0 125
=w"c o VJO
175
.50
s
i CI
(
t
, _ _
"'rrl--r'T"-rl""T-rT"Y-f'r-rlrr''T-'i T7
-1....t....1..J.-.1..,14-:-.4-4-1--I--t-'6 49 50 52 54 56 58 60 62 64 66 63
YEAR
SdUrce: Commoner, Boksenbaum and Corr, Energy & Human Welfare, Volume 3, Chapter 4, MacMillan Information, Riverside, N .1 , 1974
170

Demand Growth in theRest of the World
Given the uncertainties we have already discussed,making projections of world-wide energy consumptionfor the next 25 years is doubly hazardous. The numberof political, technological, and economic uncertaintiesare multiplied and the data and reference values areless reliable.
It is still useful, however, in order to provide someperspective for the supply and resource problems wediscussln the next chapter, to make some projection ofworld demand. The one shown as Figure 4-24 is basedon a population growth of 2 percent per year (slowing abit toward the end of the century), and a growth inenergy consumption of 5 percent during the next dec-ade and 4.5 percent afterward. These growth ratesare to be compared with the 3.5 percent projected forthe United States (the U.S. data are shown for compari-son). They are lower than the growth rate of 5.5 percentthe world experienced in the 1960s. We also show, inFigure 4-24, the projected growth in per capita con-sumption for the United States and the world. We seethat although the world total and per capita are growingmore rapidly than ours, parity is still many years off.
To complete the world picture we look at two otherprojections; that of the fuel mix (Figure 4-25) and that ofelectric energy production (Figure 4-26). The fuel mix
TABLE 44Percentage Saturation of Various Electric Appliances, 1970
Appliance Saturation (in percent)
Cooking Hengelo) 56 (44)Water Heaterl) 32 (68)Refrigerator 96Clothes Dryerlo) 27 (13)Television
Black-and-White 141
Color 30Air-conditioner 41
Clothes Washer 92
Vacuum Cleaner 92Dishwasher 27
Waste Disposal 26
Source: The 1970 National Power Survey, Part I, Federal PowerCommission, Washington, D.C., 1971.
(a)These appliances compete with gas appliances whose percentagesaturation is shown in parentheses.
picture continues the trends we saw earlier, in Figure4-14. It reproduces, with a time delay, the United Statespattern. Coal declines in importance, oil and gas rise inimportance until the 1980s and then begin to decline,and nuclear energy enters the picture, reaching 20 per-cent of the total (and 40 percent of electric generatingcapacity) by 200'0. This reliance on nuclear energy,given the high capital costs of nuclear plants, may placean intolerable burden on the poorer nations. They willneed financial as well as technological help.
The upsurge of electric demand in the works, shown inFigure 4-26, is even more impressive than the projec-tions for the United States we have just looked at. Thetotal and per capita curves are rising at a steeper slopethan their United States counterparts; the average worldper capita consumption of electric energy will reach, in1980, the United States level of 1945, and by 2000 willreach the United States level of 1960.
FIGURE 4.23Electricity Demand Projections
Source: Chapman, Tyrrell, and Mount,"Electricity Demand Growth
and the Energy Crisis" Science 178, 703 Nov 1972
171

FIGURE 4-24Projections of Worldwide Total and Per Capita Energy Consumption
100 0
10 ...,
3
U.S. per Capita r
0//// 43' /,,,,' /. /- /-, / /.."' / /
.() // .---7. / World Total
JO/ /.."" / // // /// 0//
/ /47/ / World minus U.S.// // // // //
/ /U.S. Total
71 ). '/ /
SY ./ .//////
/ ,/<
/KY
/
."./
World per Capita
)D
.0
1950 1950 1970 1980 1990 2000Year
100
10
3
Data from. Darmstadter, Energy, Economic Growth and the Environment, AppendiA, Baltimuie. The Juhns Hopkins Pi es, 1972.
J
172t.

FIGURE 4-25Changing World Fuel Mix
J1
Data from Darmstadter, Energy, Economic Growth and the Environmont, Appendix. Baltimore: The Johns HopkinsPress, 1972.
FIGURE 4-26Consumption of Electric Energy U.S. and Rest of World
100,000
,.: 10,0001
0
10
U.S. per Capita
/U.S. Total
a
/0
c
tV"..
.or
/
1,000
/ / 0Rest of World Totalz , 0 26/ / /
>.
oE
I-
C
.',
1-
/ Rest of World per CaPitaz+, tu
/ 41t..;/ 0it'To;1-' --" " 11.0
1950 1960 1970 1980 1990 2000Year
Data from Darmstadter, Energy, Economic Growth and the En.vironment, Appendix, Baltimore: The Johns HopkinsPress, 1972.
Summary
In this chapter we have looked at the historic rec-ords and the future projections of energy productionand consumption in this "Exponential Century."
The United States production of energy from theprimary sources has grown relatively steadily with adoubling time of about 20 years (if the no-growth periodof the Great Depression is neglected). The record of thefuels, however, shows a cyclic pattern; wood replacedby coal, and coal, in turn, by the petroleum products.
The pattern of change in consumption has not beenso dramatic in the past 25 years. The industrial sector'spercentage share has decreased from 45 percent to 39percent, while the residential and commercial sectorshave increased their combined shares from 25 to 31percent.
With appropriate cautionary statements, we alsolooked at projections of energy consumption for the nexttwo and a half decades. Although there was considera-ble variation in individual projections, the average pro-jections climbed steadily at an annual growth rate of 3.5percent, and consumptiOn in the year 2000 is thus pro-jected to be 11/2 times the 1970 consumption.
The most rapidly growing energy demand is for elec-tricity. Its use has been douplirfg every 10 or 15 yearsand this doubling rate 1 5 1 9 4 acted to continue through-out the remainder o f t ipecentury. Demand for electricityis driven by increaseg in electric space heating, moreappliances in more households, important replace-ments of primary energy by electricity in industry, and aproliferation of electric devices in the commercial sec-tor Since electricity is presently generated at only 30percent efficiency from primary energy (this may be 40percent by 2000), the wasted energy is becoming animportant part of the total national energy consumption,growing to 30 percent of the total by 2000.
We looked also at projections of world consumption,which are growing even more rapidly than domesticconsumption (at an annual rate of 5.5 percent as againstour 3.5 percent). World consumption of electricity isgrowing rapidly also, signaling the same problems ofinefficiency, environmental impact, etc., and the samemodernization that the growth of this popular form ofenergy have in the United States.
Most of the curves we looked at in this chaptershowed the straight-line shape in semilog representa-tion that is characteristic of exponential growth. No-where did we see the beginning of the no-growth 5-curve. Exponential growth of demand, however, cannotcontinue; it is bout id to be slowed by problems of supplyor of environmental hostility. We will look at the ade-quacy of energy supplies in the next chapter.
173

CHAPTER 5How Much, At What Price,For How Long?
,

How Much, At What Price,For How Long?
In Chapter 2 we identified the primary sources ofenergy in this country, in Chapter 3 we looked at themanner in which we spend this energy, and in Chapter 4at the historic trends in production and consumption andtheir extensions into the future. It is now time to take apractical focus and ask for a realistic estimate of ourenergy future over the short range, between now and1985 How much oil, oas, and coal can we expect toproduce domestically in the next few years, how muchof our energy will have to be imported? What are theconditions, especially the financial incentives, that theenergy industries will insist on in order to provide t isenergy What will this new energy cost us? Thesethe questions whose answers we will seek in this chap-ter With these hard facts in hand, we will then look againat the energy stockpiles of Chapter 2 and try to make arealistic estimate of how long these depletable supplieswilt last.
The Supply Picture, 1974
Let us, as a starting point, look at the supply picture in1970 and 1974 by pulling together for our analysis inTable 5-1 some of the data from Chapter 4 and somenew data. We see in this table the amount of energy (in
TABLE 5-1U.S. Energy Supply, Domesticand Imported, 1970, 1973, 1974
Energy SourceEnergy Equivalent, CI Calories1970 1973 1974
Domestic
Oil 5.32 5.59 5.32Natural Gas 5.65 5.47 5.37Coal 3.30 3.32 3.29Hydropower(a) .68 .76 .77Nuclear(12) .06 .22 .29
Total Domestic 15.01 15.36 15.04
Imported
Oil 1.88 3.34 3.26Natural Gas .24 .27 .24
Total Imported 2.12 3.61 3.50Total Consumption 17.13 18.97 18.54
Imports as Percentof Total Consumption 12 19 19
Imported Oil asPercent of Oil 26 37 38
Imported Gas asPercent of Gas 2 5 4
Data from Bureau of Mine-, U.S. Department of the Interior.
(1)Kilowatt-hours converted to Calories at average heat rate forsteam plants of 2,820 Calories per kw-hr.
CI quadrillion, 10's ) Calories.
quadrillion, Q, Calories) of coal, oil, and natural gasproduced domestically and the additional energy (usedsolely for the generation of electricity) that came fromhydroelectric plants and nuclear-powered generators.We also show the additional oil and gas that was im-ported to meet the demand.
The entries indicate the growth in production andconsumption we highlighted in Chapter 4, however,they also show the increasingly serious failure ofdomestic production to keep up with demand. The per-centage of our domestic energy consumption that hadto be supplied by imports was 12 percent in 1970 and 18percent in 1973 and 19 percent in 1974. The importswere entirely petroleum products. The 26 percent of oiland oil products imported in 1970 grew to 38 percent in1973 and 44 percent in 1974. The 2 percent of ournatural gas imported in 1970 grew to 5 percent in 1973,but dropped back to 4 percent in 1974.
Where do we obtain these imports? Gas comes in bypipeline from Canada or by tanker carrying liquid naturalgas (LNG). The origin of oil is shown by the breakdownin Table 5-2 of crude oil imports for the year 1972.Canada was the largest supplier followed by Ven-ezuela, Nigeria, and then Saudi Arabia. Overall the Arabcountries supplied 230 million barrels (M bbls) out of atotal of 811 M bbls imported, or 28 percent of the crudeoil imported that year. Crude oil accounts for only about40 percent of the total petroleum imports; that sameyear we imported 924 M bbls of refined products, chieflyfuel oil of various grades. Most of this came from West-ern Hemisphere sources, although an appreciable frac-tion of the crude oil from which these products wererefined may itself have come from the Middle East.
TABLE 5.2Imports of Crude Oil Into U.S., 1972
M bbls(a)Percent of
total inport
Canada 312.4 39Columbia 1.7
Ecuador 5.3Venezuela 93.3 12
Algeria 31.8 4EgyptLybia .1 5Nigeria . 11
United Arab Emerates 26.9 3
Iran 49.7 6Iraq 1.3
Kuwait 13.2 2
Qatar 1.3Saudi Arabia 63.6 8Indonesia 59.6 7
Others 19.0 2
Total 811.1 100
Source: Energy Facts, Science Policy Research Division, Congres-sional Research Service, Library of Cungres, Washavu s, D.C.,1973.
OW bbls = Million barrels.
177

Rough estimates of our overall dependence on MiddleEastern oil in all forms suggest that this region supplied5 percent of the petroleum products we consumed in1970, and that this had risen to perhaps as high as 10percent by the time of the embargo in late 1973. It is wellto note and remember the disruption which that em-bargo, never 100 percent effective, was able to accom-plish by cutting off that relatively small oil flow. We sum-marize some of the effects of the oil embargo in Chapter1, Volume I.
The gap between domestic petroleum supply anddemand is growing. How is it that a country with as largea resource supply as we have tabulated in Chapter 2has become dependent on imported energy? Can thisdependency be removed and self-sufficiency restored?These are the questions we will examine next.
Domestic Production,of Oil and Gas
Why did the United States oil industry turn away fromdomestic production to foreign sources? That it did isnot in question, domestic crude oil production peaked in1970 at 4.12 billion barrels (8 bbls) and declined (as
shown in Figure 5-1) in 1972, 1973, and 1974. Figure5-1 also shows a similar peaking in the domestic pro-duction of natural gas. This decline is expected to con-tinue at least until the addition, in two or three y,:ars, ofoil from the Alaskan North Slope field.
One cause for the decline in domestic production isthat oil and gas explorations have fallen off in this country. The actual footage of wells drilled has decreasedFigure 5-2 shows these data for oil and for gas. Drillingfor oil has been decreasing since 1955; for gas since1962. Why this has happened cannot be summed up ina brief and simple (and uncontroversial) manner. Theunderlying causes are, of course, economic, physical,and political with the economic causes dominating Wediscussed some of the factors in this decline in Chapter6 of Volume I
The main economic cause of the decline in domesticoil production has been the relative cheapness offoreign oil, particularly Middle Eastern oil. The de-velopment of overseas production facilities have thusbeen more attractive to investors.
The reasons for the decline in ga.. production aresimilar. Some gas is found with oil, so lowered oil explo-ration automatically leads to lowered gas availability.
FIGURE 5.1U.S. Oil and Gas Production
4.0
2.0
I i I i 1 I
GAS
OIL
I I I
1962 63
1 I I
64 65 66 67 68Year
69 1970 71 72 73 74
20.0
.0a
0C
10.0 c
ci
Source Energy Facts, Science Policy Research Division, Congressional Research Service, L.biaiy of Cungiess, Washington, D C 1973
178

There is a further economic factor in the case of gas.The price of gas is regulated by the Federal Govern-ment. This regulation was originally imposed to preventthe industry from obtaining exorbitant profits from gas,which was essentially a low cost by-product of oil explo-ration The gas producers now charge that the regulatedprice of gas is too low and that it does not provideenough incentive for further exploration for, and de-velopment of, gas wells. These regulations are now inthe process of revision and we shall see if the increasedprices, which are sure to result, do stimulate productionto meet our needs.
Although these economic factors are probably themost important determinants of domestic oil production,there are other important factors that should be mentioned. The reduction in drilling activity that we havedocumented has led to a consequent reduction in thenumber of drilling rigs and of technical manpower. In thepast 20 years the number of independent companiesengaged in drilling and production has decreased from40,000 to less than 4,000 and the number of drilling rigsfrom 5,300 to 1,400. 1 hese 1,400 rigs are presentlycommitted for the next year and a half. It will not be,physically possible to speed up exploration and drillinguntil new rigs are built. In addition, bigger and moresophisticated rigs are needed for new drilling areas. Theremaining oil to be recovered, as we pointed out in
Chapter 2, will be found offshore, in Alaska, or in deeperpools. It will take time to build the new rigs needed forthis kind of exploration.
It will also take time and money to develop and im-plement the secondary and tertiary recovery techniquesthat can allow the production of more oil from existingreservoirs. These techniques are, for instance, the in-jection of water or gas to increase the pressure anddrive more oil out of the well. As we have also mentionedearlier, detergents are used to reduce the viscosity ofthe oil to enable it to move more freely, there has evenbeen experimentation with setting thick oil afire in thehope that the heat will drive much of the rest of the oil upthe well.
Finally, one should point out that some of the barriersto increased production of oil have come from the so-called environmental movement. Part of the blame forthe shortage of refinery capacity has been laid on thisopposition. The fact that the large companies are nowbudding refineries weakens that argument somewhat. Itis clear, however, that opposition from environmentalinterests has slowed the construction of the Trans-Alaskan pipeline and the opening of the Pacific andAtlantic area to offshore prospecting and Culling. Thepressure provided by the oil and gas shortages maynow be turning the tide to favor the diggers and drillersand we may return to the search for fuels as a first
FIGURE 5-2Domestic Drilling Activity (excludes Alaskan drilling)
200
150
Oil
Total Oil Drilling
50
0
Oil Exploratory Drilling
1 1 1 I 1 1
1955 1960
Year
1965 1970
100
90
80
Gas
20
10
0
1955
I !II !
1960
Year
1965 1970
Source U.S. Energy Outlook, Natior 31 P3troleum Council's Committee on U.S. Energy Outlook, ihashinc,.on, D.C., December 1972.
179
I GO'

priority. It is as an alternative to this choice that energyconservation gains some of its support.
As we will see when we look at the supply options putbefore us by the National Petroleum Council, the deci-sion to increase domestic production is a complex one.It should be made by a public that is well informed andwe have tried to develop the most relevant body ofinformation for that purpose in the first volume of thisSource Book. With this brief summary of oil and gasproduction behind us, let us look at the case of coal.
Problems of Coal ProductionDomestic coal production has not been under the
same demand pressure that has characterized the petroleum industry. With the reconversion of same utilitiesto coal and the generally incre--:ed demand for fuel, it isimportant, however, to assess that industry's capabilityand determination to meet demand.
The record of the past few years is not encouraging.Even with the energy crisis upon us, coal productiondropped from 595 million (M) tons in 1972 to 590 M tonsin 1973 and dropped again in 1974. The goal of -ProjectIndependence,- the Federal Government's plan toachieve energy self-sufficiency by 1980, calls for pro-duction of 962 M tons of coal per year in 1980. What arethe factors that will help or hinder the industry as it toolsup to meet that goal?
An expansion of coal production faces some of thesame problems that oil and gas producers faced, andmany more. The environmental protector's opposition ismore direct and more effective. The "Clean Air Act" of1970 will not allow the burning of much of the available
s. high sulfur coal. Economically viable technology toremove sulfur from exhaust gas is in an early anduncertain stage of development. There is also strongresistance to an expansion in strip mining, particularly inthe Western Plains which are the new mining target.The effect of all this opposition combined with thenatural pessimism of this industry, which has experi-enced so many years of declining demand, makes theinvestment capital necessary for expansion difficult toobtain.
A related problem has already produced effects Coalis not only dirty, it is dangerous to mine, especially whenthe mining is done underground. Congress, in 1969,passed a strong "Coal Mine Health and Safety Act."Many mines, especially small mines, have shut downrather than implement the expensive safety require-ments.
Coal production is also hampered by a historical lackof research and development emphasis. There was amassive change in the 1950s from manual methods tomining machines, but "long wall mining," for instance,long used in Europe to substantially increase the recov-ery factor (which is about 50 percent in this country), isonly just being experimented with in this country. (In thistechnique an armored min;ag machine progresses intoa seam and allows the ceiling to collapse behind it. Thiseliminates the necessity of leaving so much coal behindas pillars.)
180
Not only does the coal industry face problems ofretooling, it also faces a shortage of miners. From apeak of 625,000 miners in the late 1940s, the miningforce has dropped to 150,000. There is a specific short-age of young miners. It will take time to open newmines, build new equipment, and attract new workersThe increase in coal production will be slow in coming
The Fueling of the Next DecadeWe have, so far, examined the supply picture as it
stood in 1974 (the latest year for which complete dataexist), and have described some of the barriers to in-creased production of domestic coal, oil, and gas. In thissection we will present the energy policy options thatresulted from an extensive study by the National Petroleum Council, an industry dominated advisory committee to the Department of the Interior.
In their report, "U.S. Energy Outlook" (December19741 they investigated the supply-and-demand picture in the light of different assumptions about the various factors that affect domestic energy supplies. Theythen matched domestic supplies against high, medium,and low demand projections (which cover the range ofprojections in Figure 4-18.)
Factors influencing domestic production include, forinstance, prices, exploratory activities and results, taxlaws, environmental opposition to nuclear plants,offshore drilling, refinery construction, etc., and Federalsupport of research and development in synthetic fuels(the liquid and gaseous fuels made from coal that aredescribed in Chapter 6).
The four supply cases and their assumptions regarding these factors were:
Case I' estimates the possible outcome from amaximum effort to develop domestic fuel sources.Case I assumes oil and gas drilling increases at arate of 5.5 percent per year, and a high projectionof oil and gas discovered per foot drilled. Thenuclear power projections are based on the as-sumption that all new base-load generating plantsordered between now and 1985 will be nuclear.Production of coal for domestic consumption isincreased at a rate of 5 percent per year. Syntheticfuels are developed and produced at the max-imum rate physically possible, without any restric-tions due to environmental problems, economics,etc.Case IV, the lowest supply case, assumes thatrecent trends in United States oil and gas drillingactivity, and the success from such efforts, willcontinue; that the siting and licensing problemswith nuclear plants will continue; that incentives todevelop new coal mines will not improve; and thatenvironmental constraints will continue to retardaevelopment of resources.
'U.S. Energy Outlook, A Report ut the Ndliundi PettuleurnCouncil's Committee on U S Energy Outlook, December 1972

Case II assumes a less optimistic future supplypicture than Case I. Oil and gas drilling activitygrows at a slower rate 3.5 percent per yearthan in Case I but with the same finding rates perfoot drilled. For nuclear, Case h assumes prob-lems in 'manufacture and installation lead timeswill be solved quickly. Coal production is in-creased at a rate of about 3.5 percent per year.Synthetic fuels are developed and produced at amoderate build-up rate.Case III assumes that there will be improvementover Case IV but not to the level of Case II in thedevelopment of indigenous energy supplies_ Oiland gas drilling grows at the same average an-nual rate of 3.5 percent per year experienced inCase II, but the trends of oil and gas finding per
foot drilled are lowered to those of Case IV, whichreflect recent actual experience. The develop-ment of nudear power proceeds at about the ratein the AEC's most favorable forecast. There is nosignificant difference between Cases II and Ill forcoal and synthetics.'
In Figure 5-3, the projected domestic supplies ofenergy from these four cases are matched against pro-
, jected demand, with the high, medium, and low rangeindicated. We see in these projections a worsening ofthe domestic supply situation in 1975. The gap betweenoptimistic Case I and low demand is 14 percent and itfalls short of the high demand by 19 percent. The actualgap was 19 percent in 1974. The pessimistic Case IVmisses the low demand by 23 percent and the highdemand by 27 percent.
FIGURE 5.3Comparison of National Petroleum Council Supply-and-Demand Projections
0
150
100
50
ActualDemand Actual
DomesticSupply
H ....Demand
ro
Projected
ProjectedDomesticSupply
Projected
H
M
Demand
ProjectedDomesticSupply
III
H"ProjectedDemand
ProjectedDomesticSupply
I
II
III
IV
M
L
L
I
II
\ III\
IV
IV
1970 1975 1980 1985
Year
Data from US. Energy Outlook, National Petroleum Council's Committee un U.S. Energy Oulluuk, ItVashingrun, D.C.. December 1972.
Note: H, M, & L indicate high, medium and low demand projectionsI, II, III, & IV indicate the NPC Supply cases.
181

The message here is that little can be done in fiveyears to correct our energy imbalance. This is againevidence of the unavoidable delay in bringing aboutchange in the energy pictuuettlakes five to seven yearsto open new oil fields or coal mines, build refineries orpower plants, etc. Given the green fight of Case I, theenergy companies promise an improved situation by1980 and self-sufficiency by 1985. The Case I gap in1980 between low demand and supply is 4 percent, withhigh demand it is 12 percent. Case I meets even highdemand by 1985.
On the other hand stands the pessimistic Case IV.The gap with low demand grows from 23 percent in1975 to 33 percent in 1980 and 31 percent in 1985.Case IV will require that we import 40 percent of our fuelin 1985 if we consume at the high demand level.
Unfortunately, the situation is more complicated thanthis. One cannot make a simple comparison of totalsupplies with total demand, the fuels are not completelyinterchangeable -you can't run automobiles on coal ornuclear energy, for example.
What is most interesting is the amount of energy wemust import to meet the various demand levels. Sincecoal and nuclear energy are totally domestic sources,the imports considered were oil and gas. We can gainsome idea of the range of possibilities by looking at theextreme cases, the high and low demand and the supplyCases I (maximum supply) and IV (minimum supply).
The specific figures for the percentages of oil and gasimported are shown in Table 5-3. The NPC prediction isthat by 1975 we will import about 40 percent of our oil(the 1974 percentage was 44). This will fall to 15 percentof the minimum demand in 1980 and to zero in 1985 forthe optimistic supply Case I. The comparable figures forthe pessimistic supply Case IV are, assuming minimumdemand, 61 percent (1980) and 57 percent (1985) Thedata of Figure 5-3 and Table 5-3 make the case for the"dig and drill" proponents: the choice is between theoptimistic Case I, in which the energy companies aregiven maximum incentive for exploration and minimuminterference from environmentalists, there is a maxim' 11 increase (5 percent per year) in coal production,
TABLE 5.3Percentages of Total Energy and Oil and Gas Imported
Supply Percent of Total Percent of Oil Percent of Gas
Case Energy Imported Imported Imported
Demand Year Max. Min. Max. Min. Mas. Mm.
IV
1975 19.7 42A 4.7
1980 18.0 9.7 34.7 14.9 12A 12.41985 14.2 0.9 26.7 0.0 9.5 2.9
1975 26.0 41.2 5.1
1980 39.3 33.2 R7 4 60.6 17.8 17.8
1985 40.3 31.1 67.9 56.7 29.2 29.2
Source: US. Energy Outlook, National Petroleum Council's Commit-tee on U.S. Energy Outlook, Washington, D.C., December 1972.
improved finding rates for oil and gas and all new powerplants are nuclear, and Case IV, which is the energycompany nightmare, where there is no improvement inexploration and finding, there are environmental con-straints on both resource development and power plantsiting, and so on.
It should be pointed out that the optimistic supplyCase I is indeed optimistic. It predicts, for instance, thatoil shale will be producing 750,000 barrels of oil a day in1985 (4 percent of the total), and that oil from coal willadd another 4 percent. The recent pessimism about oilshale and slow progress in coal liquefaction belie thesefigures. Case I also projects that stimulation of naturalgas production by nuclear explosions will add 4 percentto the gas supply, again a questionable assumption inview of the questionable results of preliminary experiments with this technique. The Case I assumption is that42 percent of the energy to produce electricity will benuclear in origin by 1985, and this too is a difficult targetto reach.
New energy sources that would improve all the pro-jections are not included in the NPC assumptionsThere is no expectation of energy supply contributionsfrom solar energy or from organic, waste, two potentialnew sources we will discuss in a later chapter Suchsources are not viewed with much enthusiasm, apparently, by the energy industry.
The Cost of EnergyWhatever route the future takes, whether it goes
through Case I and high demand or Case IV and lowdemand or any of the more likely intermediate assump-tions, one thing is certain. the cost of energy will rise.This prophecy will come true whether we are talkingabout dollars or about cost to the environment. In thischapter we will take a brief look at dollar cost. We haveconsidered some of the environmental cost in Volume I.
There are several aspects of dollar cost. Investmentin energy extraction will have to increase, more shipsand pipelines will be needed to transport oil and gas,new refineries and utility plants will require money forconstruction. The NPC estimate of the total capital re-quirements is summarized in Table 5-4. We see notsurprisingly, that the capital requirements are higiwtfor Case I and lowest for Case IV. What is bought withthis capital varies. Case I calls for large investment inexploration and production and in pipelines for naturalgas. Case IV has a large budget item for tankers andterminals.
Ships and ports: It is well to pay special attention tothe need for tankers and ports to handle the largeamount of oil and liquified natural gas that must beimported in the next 10 years. Taking the Case III studyfor discussion (it is the modestly conservative one), thegrowth in waterborne petroleum imports will rise from2.7 M bbls per day in 1970 to 10.7 M bbls per day in1985. This increase in the total is only one facet of thechange that must take place. In the past, most of thetanker deliveries were from Caribbean ports, and smalltrkers were used in this trade. Since an increasingly
, _

large fraction of the oil in the next 15 years will comef'om the Middle East and Africa, we will have to lookmore and more to the large tankers that provide themost economical long-distance transport. In Chapter 3,Volume I, we discussed some of the problems super-tanker oil shipment will bring.
Not only does economy of transport call for theselarge tankers, but numbers do also. A 250,000 DWTtankship has a capability of 26 M bbl per day in move-ment from the Persian Gulf. (This takes into accountaverage travel, loading and unloading time, repair andmaintenance, etc ) In 1970 the equivalent of six 70,000DWT tankers per day had to be unloaded at someUnited States port to deliver the 2.7 B bbls of petroleumproducts imported that year. Two of the 250,000 DWTtankers per day could have done the job. Since theamount of imported oil is projected to triple (under Case
TABLE 5-4Summary of Cumulative Capital Requirements U.S. EnergyIndustries 1971-1985 (in billions of 1970 dollars)
I
Supply Cases
U III IV
Oil and Gas
Exploration & Production 171.8 144.8 135.1 88.0Oil Pipelines 7.5 7.5 7.5 7.5Gas Transportation 56.6 46.9 39.8 29.5Refining 19.0 24.0 30.0 38.0Tankers, Terminals \ 2.0 9.0 16.0 23.0
Subtotal 2166.9 232.2 228.4 186.0
Synthetics \From Petroleum Liquids 5.0 5.0 5.0 5.0From Coal (Plants Only) 12.0 4.6 4.6 1.7From Shale (Mines & Plants) 4.0 2.2 2.2 0.5
Subtotal 21.0 11.8 11.8 7.2
Coalt
Production 14.3 10.4 10.4 9.4Transportation 6.0 6.0 6.0 6.0
Subtotal 20.3 16.4 16.4 15.4
Nuclear
Production, Processing, Enriching 13.1 11.0 8.5 6.7
Total All Fuels 311.3 271.4 265.1 215.3
Electric Generation, Transmission 235.0 235.0 235.0 235.0
Water Requirements 1.1 0.8 0.8 0.7
Total Energy Industries 547.4 507.2 500.9 451.0
Source. U.S. Energy Outlook, The National Petroleum Council's Commit-tee on U.S. Energy Outlook, Washington, D.C., December 1972.
Based on maximum U.S. requirements, some of which may bespent outside the United States.
tCases I IV do not include capital requirements for coal productionfor synthetic fuels. These requirements in billions of 1970 dollarsare as follows: Case 1-2.0; Cases II/111-0.8; Case IV-0.3.
HI) by 1985, the crowding of United States ports willbecome serious unless large tankers are used. It is clearthat deep-water, offshore ports on the East, West, andGulf Coasts would be highly desirable.
A second kind of ship has also begun to appear on theocean, the refrigerated tankship, to haul liquified naturalgas. These ships carry natural gas at -260T ( -130` C).By 1980, 40 or so of these ships will be needed (and$2.2 billion to construct them), by 1985, 40 ships moreplus an additional almost $2 billion. Total capital invest-ment is doubled with the building of plants, terminals,etc. needed to handle this new matenal. Large scaledelivery of this new form of fuel will begin in 1975, whengas from Algeria (350,000 cubic feet per day) isscheduled to arrive at a Texas port for use by the ElPaso Gas and Electric Co.
The offshore ports, the increased transoceanic ship-ment of oil, and the liquified natural gas all raise theprospect of the new environmental problems we dis-cuss in Chapter 3, Volume I.
Exporting money: There is another serious financialimplication of this supply picture: the money we will haveto spend to buy this imported oil and gas.
In 1970 the United States imported $3.4 billion worthof oil and $0.2 billion of gas and exported oil productsand coal worth $1.5 billion for a net energy-trade deficitof $2.1 billion.
In 1975 the energy-trade deficit for the four cases, it isestimated, will grow to between $9.4 and $13.1 billion.This is two or three time the totan 974 balance of tradedeficit of $4.7 billion. ;,,
Except for Case I, these deficits are expected to groweach year. Trade deficit estimates for 1985 are shown inTable 5-5. It must he remembered that these are yearlyfigures. The international as well as national problemsthat may grow from such huge transfers of capital arediscussed in some detail in Volume I of the SpurceBook. A
Prices: The large amounts of money we have beendiscussing will, of course, have obvious repercussionsin the price of energy. Figure 5-4 shows the recent
TABLE 5-5Balance of Trade Deficit inEnergy Fuels, 1985 (in billions of dollars)
Case I Case 11 Case III Casa IV
Oil Imports (delivered) 5.4 13.1 20.4 29.1Natural Gas and LNG Imports 4.9 5.0 5.3 5.4
Total Energy Fuels Imports 10.3 18.1 25.7 34.5Oil Exports (0.4) (0.4) (0.4) (0.4)Steam Coal Exports (0.3) (0.3) (0.3) (0.3)Metallurgical Coal Exports (2.1) (2.1) (2.1) (2.1)
Total Energy Fuels Exports (2.8) (2.8) (2.8) (2.8)Total Energy Fuel Deficit 7.5 15.3 22.9 31.7
Source: U.S. Energy Outlook, National Petroleum Council's Commit-tee on U.S. Energy Outlook, Washington, D.C., December 1912.
Including synthetic gas feedstocks.
183

FIGURE 5.4Average Values of Oil, Gas, and Coal, in Current and Constant Dollars*
Dollars Per Barrel
4.00
3.00
2.00
1.00
0.00
Oil, At Wellhead
Current Dollars
11.111.011"ii of a t,i4,............ ..,"...do* Fla. e
wfl
Constant 1948 Dollars
Dollars Per Thousand Cubic Feet0.20
0.15
0.10
0.05
0.00
Natural Gas, At Well
Current Dollars
000tt*Constant 1948 Dollars
\
---
Dollars Per8.00
6.00
4.00
2.00
0.00
I I
Coal, F.O.B. Mine...... ._..
°°°°°°°°OOOOO :-* -
Cirrent Dollars
ed1
Constant 1948 Dollars
#.
1 1 I I1948 1950 1955 1960
Year1965 1970 1972
Source: Resources for the Future, 1973 Annual Report, Washington, D.C., pg. 35.
Current dollars are actual prices, constant 1948 dollars are corrected for inflation.
184

historical record of the price of the fossil fuels and elec-tricity. Recent increases, even in terms of constant dol-lars, are striking. The projections for the future, how-ever, could be characterized as "you ain't seen nothingyet." The NPC projections for price rises (in terms ofconstant 1970 dollars) are:
Oil at the wellhead. up 60 to 125 percentGas at the wellhead. up 80 to 250 percentCoal at the mine: up about 30 percentUranium ore. up about 30 percent
To these projections we can add a 1970 one from theFederal Power Commission: the price of electricity willincrease by 19 percent by 1990 in terms of constant1968 dollars. The price increases in the two years sincethe FPC projections make their forecast seem overlyconservative.
To give a consumer's picture of what this means, weshow in Figure 5-5 the historical record of typical con-sumer prices of gasoline, fuel oil, and electricity. Themathematically minded reader can use these data andthe percentages noted above to estimate his 1985energy bill a most depressing exercise. High prices,however, may be the most effective incentive for energyconservation.
The Fossil FuelsHow LongWill They Last?
As a final note in this chapter on supply and demand,we will look again at the stockpiles and estimate theirlifetimes under various conditions of growth. It is not ourintention in this section to make thqtypical "doomsayer"prediction: "In X years we will ruri'out of oil." What wewish to demonstrate is that the-gtockpiles are limitedand that at present rates of consumption they con-ceivably could be exhausted within the lifetime of stu-dents in school today.
ON
We will start with the fossil fuel on which most of ourattention is now focused. From Table 2-3 we see that atthe last accounting (1972) our oil reserves were 52 Bbbls and it was estimated that there were 502 B bbls ofoil in the "ultimately recoverable" category. Oil con-sumption in 1973 (including imported oil) was 6 as bblsAt that constant rate of consumption the reserves, if wedrew all our oil from this domestic supply, would only lasteight years and the ultimately recoverable stockpilewould be gone in 80 years. This assumes a constantrate of consumption; our rate of consumption is actuallyincreasing. We saw from Figure 4-8 that the doublingtime was about 16 years over the past decade anannual growth rate of 4.4 percent. If we assume that thisgrowth rate continues, how long will the oil last?
This problem is analyzed in an old riddle. A farmer hasa pond with a lily pad on it. The lily pad doubles in sizeevery day and the farmer knows that in 30 days it willcompletely cover the pond. He does not want this tohappen but is so busy that he decides to wait until itcovers half the pond before he cuts it oat. When will the .)
lily pad cover half the pond? Since it doubles every day,it will cover half the pond on the 29th day:The moral forthe farmer is, of course, that he must take his correctiveaction within that one day or his pond is lost. There is dlesson in this for us as well.
We can use the lily pad analogy. A day for us is adoubling time; we'll use the 16 years that was characteristic of oil in the past decade. From 1958 to 1973, weconsumed 73.3 B bbls. This is about 15/100 of ourultimately recoverable resources of 502 B bbls (seeTable 2-3). In one doubting period 16 years from now
we will have used 30/100 of our supply and in the next16 years we use 60/100 more. In 40 years, therefore, 90percent of- the ultimately recoverable resource will begone (90 percent of the farmer's pond is covered). It isclear that the total will be used up well before the end ofthe third doubling time. From this crude estimate we cansay that, at the present rate of demand growth, 4.4percent per year or a 16 year doubling, the ultimatelyrecoverable/resources of oil (Table 2-3) will last onlyabout 35 years. Given this example, and rememberingthe relationship between annual growth rate and dou-bling,tiine (see Chapter 4), Tdouble = 70 years divided byr (percent per year), the reader can calculate resourcelifetimes for other assumed growth rates.
Before we apply this technique to natural gas andcoal, we should remind the worried reader that the pre-vious calculation assumed that we get all our oil fromdomestic sources. If we import half of it, the supply willlast twice as long.
We cannot, of course, import oil forever; world sup-plies are also finite. The total world oil stockpile, Figure2-14, is equivalent to about 3,000 Q Calories of energy.World oil consumption has, in the past few years, dou-bled about every nine years. In the most recent doublingtime (1959-1968), the world used about 110 Q Caloriesof oil, or about 4/100 of the total ultimately recoverableresources. In the firSt nine-year doubling time(1968-1977), 8/100 of the total will be used, by 1986, 8
16 or 24/100, and by 1994, 24 + 32 or 56/100 of thetotal, a little more than half. All will be gone before theyear 2003. We can thus estimate the world oil supplylifetime to be less than 35 years (1968-2003). This shortlifetime for world supply is caused by rapid growth, nineyears doubling instead of 16, used in world calculation.Since the numerical estimates are rather crude, the onlymeaningful conclusion we can draw is that the world willnot be able to make up our production-consumptiondeficit for very many years.
Natural Gas
We can apply the same technique to demonstrate theshort future of natural gas as a fuel. The total reserves,from Table 2-4, are 290 trillion (10'2) cubic feet (TCF)and 2,560 TCF ultimately recoverable resource. Consumption in 1973 was 22.9 TCF. Thus, at this constantrate of consumption the reserves will last about 13 yearsand the ultimately recoverable resources 112 years.
To make the lily pad calculation we need the douciing time, about eight years from Figure 4-9. In the past
185

FIGURE 5.5Average Residential Prices of Fuels and Electricity (in current dollars including taxes)
110 Match 1974
*CPI .= Consumer Price Index
March 19741
I -,
2.50
-2.40
-2.30
-2.20
-2.10
2.00
, March 197430
20
15
1960 1962 1964 1966 1968
Year
1972 1974
Source: Bureau of Mines, U.S. Department of the Interior.
186 -

dbubling period (1963-1970) we consumed 159.7 TCF,about 7/100 of our ultimately recoverable resource.Thus, in the next eight years (1970-1978) we will use14/100, and 28/100 more in the eight years after that; fora total of 42/100 consUrned by 1986. This is almost halfthe total, so before the end of the next doubling time, by1994, the gas will be about gone; at this rate of con-sumption it is projected to last only about 30 years.
We can make a similar rough estimate of the lifetimeof world natural gas resources. The ultimately recover-able resources of Figure 2-9 are about 3,500 0Calories. World consumption doubles every nineyears and during the past nine years 57.3 Q Calorieswere consumed, 16/1000, of the total. If we double this,32/1000 are gone by 1977, 32.+ 64 or 96/1000 by 1986,96 128 or 224/1,000 by 1994. Continuing, we find that480/1000 or just about half is.9one by 2003 and, thus, itall will be essentially gone by 2012. The lifetime of theworld ultimately recoverable resource of natural gas is,thus, about 45 years.
Coal
The reserves of coal, which we shoVett iqTable 2-2,amount to 390 B tons. Consumption in 1973 was 563 Mtons. Thus, at this constant rate our coal reserves willlast 693 years. There are no additibnal ultimatelyrecov-erable resources of coal.
Coal consumption has fluctuate greatly:so the ap-plication of doubling time to coal carries lithe meaning.We can use the National Petroleuerli CounCil's Case I(optimistic estimate) supply to gain some perspective.They assume (see Chapter 4) that coal production in-creased at 5 percent per year. This gives a 14-yeardoubling time (70 years/5). During the past 14 years(1960-1973), we produced 7,130 M tons, or about2/100 of the reserves. Thus, 4/100 will be used upbetween 1973 and 1987 and 12/100 by 2001. Followingthrough the calculation we find that 60/100 are gone by2029; thus, the period 2029-2043 is the 29th day. All thecoal (at this rate of production) will be gone before 2043,70 years from now.
We must remind you again that this estimate is basedon the 390 B tons of coal in the reserves; new miningtechniques will probably open up more of the 3,200 B
TABLE 5-6Resource Lifetimes, U.S.("Ultimately Recoverable Resources")
Resource Lifetime (in years)Constant 1973 With increased Doubling Time
Consumption Consumption for Column 2
Oil 80 35 16Natural gas 112 30 8Coal 693 70 15Uranium 27 3
Based on 2,250,000 tons of U30, (Table 2.7) and 130 tons con-sumed per 6.6 billion kilowatt-hours.
Ai 0;5
tons of total resources. It also uses the very high growthrate of 5 percent per year that is unlikely to continue intothe next century. The calculation shows, however, thateven coal is not inexhaustible.
Duringthe past decade the world has consumed coalat a fluPtuating rate, also, and so we cannot apply our"lily pad" calculation. Consumption was nearly con-stant, in tact, between 1963 and 1961, averaging about2,460 M tons per year, or 15 Q Calories per year. At thatconstant rate, the 54,000 Q Calories of Figure 2-14 willlast 3,600 years.
The End of the Fossil Fuels
We put all these estimates together in Table 5-6 forthe United States and in Table 5-7 for the world. None ofthese estimated times is long when compared to ourown lifetimes (except for domestic coal). We want, how-ever, to emphasize again that these are not predictions;what they show are the lifetimes if the past rates ofconsumption continue. The "lily pad" calculation driveshome the'fact that doubling of consumption at a fixedrate cannot continue for very long. Even coal, of whichweconsumed only 2/100, or 2 percent, of,the reservesin the past 14 years, only lasts five 14-year doublingtimes. But after four doubling periods, 56 years fromnow, we would be using 32 times as much coal as we didin 1973, 18. billion tons per year. It is no wonder wepredict that the supplies run out.
Uranium
We have limited ourselves so far in this chapter to thefossil fuels. As we saw in Chapter 2, however, uraniumis not in great supply either, if we are restricted to theinefficient use characteristic of present-day reactors. It isof some interest, therefore, to make some similar esti-mate of the lifetime of this resource.
It makes little sense to project a constant rate, sincewe are just beginning to use this form of energy. Thenuclear growth curve of Figure 4-20 shOws a doublingtime from 1970 until the early 1980s of about threeyears. In the three years from 1970 to 1972, we pro-duced 120.9 billion kilowatt-hours (B kw-hrs) of electric-ity from nuclear reactors. Using a previous estimate(from Chapter 2), that 130 tons of U308 are the equiva-lent of 6.6 B kw-hrs of electric energy, we can calculatethat 2,380 tons of uranium ore were needed to fuel thisthree -year, period. This is about 1/1,000 of the total sup-ply of under-$10 U308 (including the "by-product"uranium) of Table 2-7. Using the "lily pad" calculation,we find that the total of 2,250,000 tons will last-throughnine doubling periods, or. 27'yeaz until 1999.
TABLE 5-7Resource Lifetimes, World
Resource
OilNatural Gas
Lifetime;years)
3545
AssumedDoubling Time
(years)
9 1
9
187 I

We must again caution the reader against taking thisas a prediction. We have assumed a very steep rate ofgrowth (the doubling time for nuclear energy in Figure4-20 remains at three years only for the 15-year periodfrom 1965 to 1980). As the rate slackens, the lifetime ofthe fuel lengthens. We have also used the present reac-tor efficiency, and it is not unrealistic to expect someimprovement in the kw-hr per ton figure.
The result of this calculation can be interpreted in twodifferent ways. Twenty-seven years is a' short time to belooking to the end of inexpensive uranium fuel. It is,however, a period of time long enough to allow somehope that a new energy source, solar generated electric-ity or fusion, for instance, might have reached a stage ofdevelopment that would allow it to take up the task ofproducing electricity.
Finally, we must'remind you that this .calculations-,sumed that the reactors were fueled with fresh U308
/ each time. If the plutonium 239 that generated in thefuel rods (see Technical Appendix 6 for discussion) isrecycled, this lifetime also is lengthened.
Summary
In this chapter we focused our attention on the supplyaspect of the energy picture. We reviewed the 1973supply pattern with particular emphasis on imports ofgas and oil; and then looked at the predictions of theNational Petroleum Council for the years 1970-1985.This report estimates domestic supplies obtainableUnder four Supply Cases, whose assumptions rangedfrom the optimistic Case I: increased exploration anddiscovery of oil and gas (including offshore and Alas-kan), minimum interference from the environmentalists,etc., to the pessimistic Case IV; decreasing domesticdiscovery, environmental constraints, etc. Although allestimates are for increased dependence on foreign oil in1975 (40 percent to be imported), under the assump-tions of the optimistic case we are self-sufficient by1985. In thepessimistic Case IV we will still import 57percent of our oil in 1985.
We examined, also, financial and other costs of thevarious supply cases; the optimistic case required amaximum in capital investment, around $550 billion,and the pessimistic Case IV projected the greatest bal-ance of trade deficit, $32 billion in 1985. We looked atother requirements, in particular the tankers anddeepwater ports needed for this increasing reliance onforeign oil. All of .these costs will be reflected in in-creased energy prices; and we examined the recordand projections in this area.
In the final section we examined resource lifetimes bytaking the data on the sizes of thpertinent stockpilesthat were given in Chapter 2 andapplying to them thepredictions of growing demand obtained in Chapter 4.Although the projections varied by a few tens-of-years,we showed that even the huge stockpile of coal can onlystand five or six doublings of our present rate of con-sumption.
Chapter 5 has in it a description not only of the effectsof accelerating demand, but a suggestion that one of the
188
effects cost will break this acceleration. "Natureabhors an exponential" is, if not a law, a good rule ofthumb, and the increased price is one of the signalsthat tells us that consumption must and will be slowed.

I;
fig-..!,
CHAPTER 6New Flames from Old Fuels
New Flames from Old Fuels
In Chapter 5 we focused our attention on the supply-and-demand picture of the next decade, 1975 to 1985.What we saw, except for the hoped for maturing ofnuclear energy, was essentially a scaled-up version ofthe past decade. Although the fossil fuels are only ex-pected to Contribute a little over 80 percent of the totalenergy in 1985, as against 95 percent in 1973, we will, inall likelihood, actually burn more of them in 1985 thanwe did in 1973. :
By 1985, however, we can hope to see thebeginningof change. We should be deep into research on some ofthe new energy sources described in Chapter 7. Weshould also be entering the developmental phase ofsome technological advances that will help us get moreand cleaner energy from the fossil fuels. It is on thesetechnological advances that this chapter focuses. Wewill look at developing techniques for getting differentforms and cleaner energy from coal, and at techniquesfor improving the energy conversion efficiency of fossiland nuclear fuels, including the direct conversion ofchemical 'energy to electric energy in a fuel cell. Finally,we will look at the potential and problems of storingelectric energy by separating water molecul into ox-ygen and hydrogen. First, coal.
Clean, Versatile Energy from CdalCoal, the old-new fuel, is, as We have documented in
previous chapters, beginning to regain some of theprominence it had in the 1920s and again in the 1940s.Much of this resurgence is due to its abundance;we cancount on it for several decades. Coal, however, is asolid, and its energy can only be efficiently released byburning it in large, stationary furnaces. It cannot, in itspresent form, provide for that part of our energy con-sumption that demands piped energy liquid or gase-ous fuels of high energy density. At present, only oil ornatural-gas can give the kind of qUick-starting, controll-able, and clean fires that are needed in our mobile heatengines (cars, trucks, and trains) and in otherspecialized heating tasks.
In order to give coal versatility to match its abun-dance, several determined and relatively well-financedresearch and development efforts are now under wayto produce gaseous and liquid fuels from coal. We willbriefly describe the present state of some of these ef-forts and look at some intriguing designs for new powerplant systems, "coalplexes," which could give moreversatility.
Gas from Coal
Crude techniques for producing a fuel gas from coalhave existed for hundreds of years. In fact, "coal gas,"the volatile, combustible gas driven from coal in cokemaking, was used for street lighting inearly-19th-century London and even in the UnitedStates long before natural gas became popular. This"coal gas" (or "fuel gas," as we will term it here) has a
low energy density, producing only about 80 Caloriesper cul:*foot as compared with the 250 Calories percubic fattif natural gas. This low energy fuel gas will,no doubt, be produced in significant quantities by thecommercial processes now under development. Sinceit can be used industrially, it may become an importantfuel for electric poweFplants. It is also possible to pro-duce a synthetic "natural" gas, SNG, from coal that iscompletely equivalent to natural gas. SNG, no doubt,will be used as- utility fuel, too, but it may also become areplacement for natural gas as shortages and demanddrive up the price of that fuel.
We can identify, the major terphnical problem of coalsification by looking at the composition of the raw
material, coal, and the 'de-Sired end product, methane.The typical grade of Oa' (bituminous coal) used insteam generation contains about 75 percent carbon (byweight), 5 percent hydrogen, and 20 percent undesira-ble materials minerals (which are left as ash) andsulfur (which creates the, sulfur oxides of smog).Natural gas, on the other hand, is almost pure methane,CH4, which is 75 percent carbon and 25 percent hy-drogen. To create methane gas from coal requires that aconsiderable amount of hydrogen be added or thatsome of the carbon be rejected. With either choice (anda combination of both are used), the sulfur and miner-als must be taken out if the SNG is to burn as cleanly asnatural gas.
Six coal gasification schemes- are now at variousstages of devdopment in this country. One of these, theLurgi process, which was developed in Germany and isin commercial use in Europe, will be used.in the firstcommercial development in this country. The El PasoNatural Gas Company is building a Lurgi gasificationfacility in northwestern New Mexico that will cost $500 or$600 million and produce 250 million cubic feet of gasfrom New Mexican coal.
Gas from theturgi processhaslower heatvalue thannatural gas (less than 100 as compared with 250Calories per cubic foot) and will probably be used as afuel for utility plants.
Of the several other projects designed for SNG pro-duction, perhaps the most advanced is the HYGASprocess developed by the Institute of Gas Technology inChicago. A diagram of the various steps of this, processis shown in Figure 6-1. A reaction between coal (carbon)and hydrogen takes place in the hydrogasifier at hightemperature and pressure (1 ,400-1,6WF and 1,000psi).* The hydrogen is formed in the gasifier by reactingcoal with steam.** The gas from the hydrogasifier con-,tains a high percentage of methane along with carbonmonoxide and dioxide (CO and CO2). ufater, hydrogen,and sulfur compounds. The impuritie-, are removed inthe gas purification system. A great advantage of coalgasification is that sulfur is removed as a gas, H2S
'The chemical formula of this is roughly C 2H2 heat.
eplr chemical description is C H20 + heat CO + H2.
191

(hydrogen sulfide, the "rotten egg" gas). Elemental sul-,fur can be reformed and its sale could reduce the cost ofthe SNG.
The final step, methanalion, combines carbonmonoxide arid hydrogen (in the presence of a catalyst)to form more methane.
A HYGA$ pilot plant at the Institute of Gas Technol-ogy produces 1.5 million cubic feet of pipeline qualitygas per day from 75 tons per day of coal. Since the gascontains about 0.26 million (M) Calories per 1,000 feetaand the coal 6.1 M Calories per ton (Table 1-3), theefficiency of this gasification process is about 85 per-cent. Some energy from other sources is used and,therefore, the actual efficiency of gasification is nearerto 35 or 70 percent. Some of the coal energy is lost, butsince we lose the smog-producing sulfur and the ashes,also, it is a good bargain.
It has been suggested by Squires' that it is not neces-sary to wait for these advanced SNG plants to begin tosupplement our gassupplies with coal. The lower-heat-content fuel gas can be made much more simply insmall plants and could rather quickly (his estimate is twoyears) replace natural gas in small industrial planti; andin providing heat for brick and glass manufacture, etc.This replacement, and even the utilization of fuel gas in
'A. Squires, "Clean Fuels from Coal Gasification," Science 184,340, April 19, 1974.
utility plants, will depend on its price competitivenesswith natural gas.
OH from Opal
It is also possible to make oil from coal, as was dem-onstrated by the Germans during.World War II, but it isnot presently economical. Although a typical gasolinemolecule, such as heptane (C7Fh6), has a smaller per-centage of hydrogen than methane (15 percent insteadof 25 percent), it is a more complicated molecule andmore difficult to form.
There are continuing efforts under way in researchlaboratories aimed at producing gasoline and light oilsfrom coal. The first large-scale contribution If liquid fuelfrom coal, however, will likely be a heavy, lowsulfurfuel oil for use in electric utility furnaces. Typical of theseresearch and development efforts are those produc-ing SRC, "solvent refined coal."
SRC is a solid, like tar or pitch, that can be melted (at180°C) and therefore, shipped by tank car or pipelineand used as liquid fuel. SRC is formed by dissolving coalin a solvent (which may, in fact, be an oil derived fromthe coal itself) at high temperature and pressure. Sincethe carbon is now in a liquid form, it is easy to filter outimpurities, such as ash and sulfur. In some processeshydrogen is added so that lighter molecules will beformed and, most important, H25 will be formed, whichexpedites removal of the sulfur impurities.
FIGURE 6-1 .
HYGAS Coal Gasification Process
fuel gas
6'Pipeline Gas
Pretreater
Methanation
Hydrogasifier
raw hydrogenrich gas
steam
residual char
Gas Purification
carbon dioxide, liquid aromatics,sulfur, ammonia
Gasifiar
oxygen
ash
Source: Institute of Gm Technology (Chicago, Illinois).
192

The cleaned liquid is then heated to evaporate thesolvent (and the light oils and gases) from the coal; theresulting hard, brittle and high-energy-content residue,the SRC, can be shipped. The solvent and the hydrogenfrom H2S are recycled. The overall efficiency is ex-pected to be 67 percent; that is, 67 percent of the energycontent of the coal plus the hydrogen containing naturalgas is retained by the SRC and the distilled oils.
The main advantage of SRC is that it produces auniform, energy-rich, ash-free, low-sulfur fuel from anykind of coal. The energy value of SRC is 8 M Caloriesper ton as against 5 to 6.5.M Calories per ton for coals.The ash level may be as low as 1 percent and thesulfur content 1 percent or less. The SRC process willprobably find its most competitive application to the high-ash-content, low- sulfur, and low-energy-contentWestern coals. A 50-ton-per-day pilot plant, supportedby the Office of Coal Research, is nearing completionnear Tacoma, Washington; a-similar plant, funded pri-vately, is planned for Alabama.
Generally, liquifaction of coal lags well behind gasifi-cation in its development, and unless large amounts ofmoney are made available for R & D, it will not make asignificant contribution to the energy problem for thenext, two decades. The National Petroleum Council(NPC) optimistic Case I forecast is for about 680,000barrels (bbls) per day in 1985 (4 percent of the antici-pated domestic oil production of 16.89 M bbls) and thepessimistic Case IV assumption, is for no coal-derivedoil in 1985.Cost
The cost of the coal-derived liquid or gaseous fuelsdepends, of course, on the cost of coal. In Table 6-1 wegive expected costs of these three fuels for two differentcoal prices (which are representative of the high-pricedcoal from Eastern underground mines and the lower-priced coal from Western surface mines). As a refer-ence against which to judge these prices, oil at $7.00
---perbarret (it S approximate currenrprice) can provide a
TABLE 6-1Comparative Costs of Coal-Derived SyntheticFuels (in dollars per M Calorie (a))
Utility"GasEastern Coal (d)
$12 per tonWestern Coal (d)
S6 per trio
Utility gas(fuel gas)
Uroid Fuel (SRc)(b)Pipeline Ges (SN)(c)
5.008.0010.80
3.606.809.60
Source: "Project independence Report," Federal Energy Admin-istration, November 1974, pg. 130.
(a)M Calorie million Calories.(b)SRC solvent refined coal.(c)5NG synthetic natural pas.(d)The cost of synthetic fuels derived from Western coal rolative tothat from Eastern coal is higher than might be anticipated by therelativ costs of Western and Eastern coal. This results from differingtransportation costs from the plants, which must be near the sourceof coal, to the consuming region.
61tk
million Calories at about $4.70, while at $11.00 perbarrel a. million Calories would cost $7.30. Liquifiednatural gas, on theother hand, is Projected to sell for $6to $8 per million Calories. It would appear that syn-thetic fuels will soon be at least marginally competitive.
"Coalplexes" in Our Future?
Some coal engineers look to a future in which coalconversion plants will serve several different purposesand produce different products. One of the most articu-late and farsighted spokesmen for this view is A.Squires of City College, of the City University of NewYork (whom we have quoted earlier).
He proposes a coal treatment complex, a "coalplex,"that has as its Main goals sulfur and ash removalbefore combustion clean fuel and much higherefficiency of thermal to mechanical energy conversion
cheap power. The important ingredients in the ac-complishment of these goals are a new furnace-boilerdesign, the "fluidized bed," to replace the present-PFboilers, and the addition of a gas turbine "toppingcycle." We will define both these terms in what follows.
In the PF (for pulverized fuel) firing, which is thepresent system, powdered coal is injected by an airblast and burhed, the ashes settling through a grate.Modern furnaces of this type are huge; the 1,000megawatt (MW) Ravenswood Station of New YorkCity's Con Edison has two firing chambers 34 by 64 feetby 138-feet-high:
These PF boilers are simple and relatively efficient.With fairly simple add-on equipment, they also canhandle the ash and soot problem, the "particulate"emissions we discussed in Chapter 3, Volume I. So far,however, no economically viable method of removingthe sulfur oxides from the stack exhaust has beeninvented. Squires is among a growing number of coalengineers who stress the advantages of a different typeof furnace, the "fluidized bed." Among its advantages isprecombustion removal of sulfur.
In this combustion system, crushed coal is buoyedup, floated by a blast of high-pressure air froth below. Itburns in the air blast, reaching a temperature of 2,000°F,at which point the ash has the fortunate property ofsticking to itself, "agglomerating," and then droppingdown and out the grate.
The hot gases rise above the shallow region wherethe coal is burning and drive volatile gases out of thecoal floating in this area. This degassed coal, char, isnow more nearly pure carbon, and heavier. It sinksdown into the combustion region and burns. If steam isadded to these hot gases, hydrogen, liberated from thewater molecule, will combine with the sulfur to make'hydrogen sulfide, H2S. The H2S can then be filtered orotherwise removed from the fuel gas.
The fuel gas that is produced is an important fuel forthe "topping cycle." This is a cycle that operates at veryhigh input temperatures (Tin of the,-efficiency equation ofChapter 3) and exhausts its working fluid at a tempera-ture (Tout) that is still high. Steam turbines are nowoperating at about as high a temperature (1,000°F) as is
193 elk

realistic. The fuel gas from the fluidized bed we have justdescribed, however, can be burned and injected into agas turbine that can operate at 2,000°F; and above. Thegas turbine can extract mechanical energy from the gasand the still-hot exhaust gas can then create steam for aconventional, steam turbine. An overall efficiency of 50percent maybe obtained, giving more energy and lesswaste heat ,to be disposed of in the environment.
This "combined cycle" electric generating plantwould be the heart of the coalplex. Variations on it arepossible. In the "topping cycle," the gas turbine might bereplaced by the MHD generator, which we will discuss inthe following section. It is also possible to add, as a"bottoming cycle," a turbine run by the expansion of afluid with a boiling point lower than water and thusextract energy from the exhausted steam. Efficienciesas high as '60 percent may be reached in such a com-bined cycle plant.
The overall coalplex operatiork is shown in the flowdiagram of Figure 6-2. In the main chamber a fuel gas isdistilled from the coal, part of it is combusted there toprovide heat and part goes to run the gas turbine. Thedesulfurization also takes place there: The heat pro-duced in this chamber creates steam for a steam powerplant that also receives a contribution from the gas.turbine exhaust. The produCts, in addition to electric
, power, are sulfur and a low-sulfur fuel, coke or "char,"which, with its high-energy and low-sulfur content isworth shipping to other distant power plants.
For most economical operation these large coal-plexes would be located at the mine. One of the 'scalebeing described here might process 13 M tons of coal ayear, produce 1,000 Mw of electric power itself andprovide sulfur-free fuel for another 5,000 Mw as wellas 400,000 tons of sulfur. Squires further projectsthese evolutionary steps:
1. The first coalplexes would be justified simply fortheir economy in dealing with sulfur.
2. Later, modifications would "cream off" limitedamounts of pipeline gas andliquids from volatilematter. Simplicities in the processing of volatilematter would result from opportunities to throw offhigh-level waste heat to steam for power.
FIGURE 6-2Flow Diagram for a Coalplex
AIRAIR COMPRESSOR
GAS _p,BASELOADTURBINE POWER
-.IC0.464.5110+11AIR ATHIGH PRESSURE LEAN
FUEL GAS
COAL DISTILLATION
PARTIAL COMBUSTION.OF VOLATILE MATTER
DESULFURIZATION OF COKE
t'SATELLITE*
STEAM POWER
STATION
----J-HIGHPRESSURE STEAM
COAL SULFUR TO MARKET
LOW-SULFUR' COKETO POWER STATIONS
AT A DISTANCE(VARIABLE POWER)
194
3. As time passed, further modifications would ex-pand production orgas or liquid.
4. Ultimately, in an economy powered principally bybreeder reactors, a coalplex would evolve forwhich power might be a relatively minor by-product, and fixed Carbon would be shippedmainly for metallurgical or electrochemical use.
This is, in many ways, an attractive scenario. It offershope of improving the energy situation as well as abat-ing air and thermal pollution.
It appears likely that coal gasifiCation plants will beginlimited operation in the 1980s. Whether liquid fuels orthe multipurpose coalplexes will become a reality ismore problematical and depends to a large extent onour commitment to nuclear energy. All three Of thesetechniques remove much of the pollution coal releasesat the consumption end of the energy flow. At the pro-duction end, however, the problems described in Chap-ter 2, Volume I, remain.
More Efficient Conversions:Other Techniques
The new combustion techniques and the, toppingcycle we have just described offer hope for higher ef-ficiencies in the conversion of the chemical energy of
) coal to the highly desired intermediate form, electricity.There are other techniques using other fuels as'well ascoal that havethe same goal. One with an impressivename is the magnetohydrodynamic (MHD) generator.
This device is designed to shortcut some of the con-version steps in the long pathway from chemical energyto electric energy. A schematic diagram of MHDgenerator is shown in Figure 6-3. The fuel (which couldbe coal, oil, or gas) is burned and the hot combbstiongases enter from the right. They are ionized, inside thegenerator, that is, the electrons are separated from therest of the atom. When-this-ionized-gas-enters-Viemagnetic field region at the left end, the electrons arebent by the field in one direction, strike the collectors inthe wall, and the now positively charged atoms (some ofwhose electrons were removed) are bent and collectedon the opposite wall. Since one set of collectors iscollecting positive charges and the other set negative
,charges, connecting the-two sides through some load(any device Or:, uses electric energy) will cause currentto flow and leulric we* to be converted to work orheat. Tho MHD generator, thus, converts thermalenergy directly to eleceric energy and bypasses the
:.seam turbine and generator steps of a conventionalsystem.
The MHD generator is only 20 to 30 percent efficient.Itoan, however, be added on as dtopping cycle and thehot exhaust gaS used to power a conventional steamturbine. Overall efficiencies may be as high as 50 to 60percent
The United States has lagged in MHD development.England, France, Germany, Japan, and Poland all havemore ambitious programs under way. ie U.S.S.R. has

the most advanced program a 75 Mw unit fueled bynatural gas is being tested..
There are several difficult problems to be solved be-fore MHD generators come into routine use. There isserious corrosion of the duct and the electrode at' thehigh temperatures, and the task of providing a largemagnetic field near such a high-temperature gas is alsochallenging. Since it has no moving parts, however, itshould, when perfected, be an almost trouble-free addi-tion to electric power generators.
Bottoming Cycles
We have discussed two topping cycles that useotherwise wasted high-temperature heat energy. Heatenergy wasted at the other end could be converted in abottoming cycle.
The steam exhausted from a steam turbine may be300 to 500°F and thus have considerable heat energyleft in it. To use this in a heat engine, however, we needa fluid that boils at a temperature well below water's212°F. Ammonia, for instance, boils (at atmosphericpressure) at 92°F. The exhausted steam can vaporizesuch a low-boiling-point liquid, cause it to expand, andthis high-pressure vapor can then turn a small turbine togenerate additional electricity. The overall efficiency ofthe combination is still given by
(1 ToutETin
x 10p
but with topping and bottoming cycles Tin can be veryhigh and Tout can be as low as the temperature of the air,making for higher efficiencies.
The bottoming cycles are not only of use in steampower plants but also will be useful in opening up some
of the low-temperature geothermal reservoirs to exploi-tation and will be essential to the solar seapowergenerator we will discuss in the next chapter.
Money
In the previous sections we outlined several of theimportant contributions coal research can make to theneeded development of gaseous and liquid fuels and toa cleaner environment. There is a certain sense of frus-tration in making this review, for much.that is reported isnot really new. The knowledge of the techniques forthese conversions has existed for a long time; what hasbeen missing has been R & D money. We will examineoverall R & D funding elsewhere. The important com-parison is between research on coat and on nuclearenergy. Expenditures for coal research and for nuclearfission research are compared for the years 1969 to1975 in Table 6-2. Only in the 1975 projections (andsuch projections can't always corne to pass) does coalresearch support compare with support for the nu-clear alternative.
With this less-than-gracious introduction, let us nowlook at the promise of nuclear fission.
More Effergy from the NucleusThe Light Water Reactor, LWR, which is being rapidly
phased into our electric generating network, is not veryefficient (We discuss these reactors and describe theirfuel and operation in Technical Appendix 6.) Presentefficiencies are about 30 percent, less than the 40 per-cent efficiency of the best fossil-fu tfired steam turbineplants. For fuel the LWR uses "en iched" uranium con-taining 2 to 4 percent U235. We saw in Chapter 2 that thestockpile of this fuel is not impressively large.
FIGURE 6-3A MHD Generator
CoolantOut
Power Take-OffTerminals
CoolantOut
Load Current
Fuel Injectors
. .............. ...................................
Channel
MagneticField Coolant
InSupersonic
Nozzle
Combustion Chamber J
CoolantIn
FlameHolder
1Seed
Oxidizer
Source: Avco Everett Research Laboratory, Inc., Everett, Massachusetts.
195
201

On the drawing boards and in the laboratories ofERDA and their contractors a most interesting (and con-troversial) new type of reactor is undergoing final designand testing. This breeder reactor is expected to be'demonstrated in the 1980s. When it begins large-scaleoperation, targeted for the 1990s, it will greatly increasethe amount of energy available from the uranium stock-piles. The name of this reactor comes from its ability tocreate new fissionable fuel in addition to providingenergy. As we describe in Technical Appendix 6, one ofthe important by-products of the fissiuning (splitting) of auranium nucleus is the neutron (a basic building block ofthe nucleus). It is these neutrons that strike other fissileuranium nuclei and cause them to split and thus keepthe chain reaction going. The LWR fugl, U235, is rare,only 0.7% of natural uranium. The major component isU235, which is not fissionable by these by-product neu-trons. The neutrons from the U235 splittingrhowever, canbe captured by U23a and initiate a 'series of nuclearreactions that produce plutonium (Pu239), a fissionablenucleus that can be used as a reactor fuel.
The measure of the effectiveness of a breeder reactoris its "breeding ratio," the ratio of the arnount of Pu239produced to the fuel us . If this is greater than 1, thenthe breeder will produce more fuel than it consumes_
The LMFBR
The breeder reactor That is 16 be demonstrated in1980 is called a Liquid iMetal Fast Breeder Reactor,LMFBR. To be the protdtype of the next generation ofnuclear plants, it could, using the presently availablestocks of uranium, provide us with electric power forhundreds, perhaps thousands, of years. In spite of thispromise, its entry into the energy picture has not beenuniversally acclaimed. It willbring us, in addition to moreenergy, a number of perplexing problems.
First, the good news: The breeding ratio of the dem-onstration breeder is expected to be .about 1.2; it willcreate 20 percent more fuel than it burns. The largerplar4ts that will follow it mayhave breeding ratios as highas 1.4 or 1.5. In these plants the "doubling time," the
time that it takes to produce enough fuel for anotherreactor, will be about 10 years. It is this rapid doublingthat makes it attractive; it doubles fuel about as fast asour consumption of electric energy is doubling.
The LMFBR can create fissile fuel from the leftoverU235 that accompanies fuel preparation and can, there-fore, be brought into operation without further mining ofuranium. Since it can use 50 to 70 percent of the availa-ble uranium as fuel rather than the 2 percent or lessused in LWR's, it increases the size of the uraniumstockpile (see Table 2-7) by almost a factor of 50. Infact, it will use such a small quantity of uranium as fuel,11h tons per year as against 130 tons per year in theLWR, that the price of the electricity it will produce willnot be sensitive to the'price of uranium. Even if uraniumgoes to $100 per pound (it is now about $10 per pound),the price of breeder reactor-produced electricity wouldchange hardly at all. (The price of electricity producedby a LWR would increase by 75 percent.)
So insensitive is the LMFBR to the price of uranium, itis conceivable that it can be made to operate economi-cally on much lower-grade uranium ores, such as gran-ite. With its uranium content made fissionable 'in abreeder, a ton of granite has more energy potential than
_a ton of coal.The hope held out to us by proponents of the LMFBR
is that of plentiful, inexpensive electricity. This reactor, itis claimed, not only will produCe cheap electricity itselfbut will provide a growing stockpile of Pu239 that can beused in the LWRs to reduce their fuel costs.
That's the good news, but it is balanced by bad news.Many problems await solution before the LMFBRs canjoin the utility team. They will be very expensive, requir-ing large capital investment (the demonstration plantwill have a capital cost at least twice that of the present-day LWRs). It is anticipated that they will be more dif-ficult to control; there are other technical problems grow-ing frori-: their use of liquid sodium as a coolant. Perhapsthe most serious reservations concern the Pu239 theyproduce. This artificially produced material is not only anextremely &rigorous radioactive poison, it is also the
TABLE 6-2Federal Energy Funding for Research and Development, 1969-1975 (in millioris of dollars)
FY 1968 1970 1971 1972 1973 1974 1975
Coal ResourceDevelopment 23.3 30.4 49.0 76.8 85.1 164.4 426.7
Nuclear FissionBreeder Reactors 132.5 144.3 167.9 237.4 253.7 357.3 473.4
Other CivilianNuclear Power 144.6 109.1 97.7 90.7 152.8 173.2 251.7
Total Fission 277.1 253.4 265.6 328.1 406.5 530.5 725.1
Source: Table 5, "Exploring Energy Choices," Energy Policy Project of the Ford Foundation,Washington, D.C 1974.
Estimated**Proposed
196

raw material for atom bombs. We discuss some of theseproblems in Chapters 3 and 4 of Volume I.
There is considerable opposition to the breeder reac-tor and it is one of tho major issues in the "energydebate" under way in this country. To make a judgmentfor or against the breeder, however, would take us wellbeyond, -Ole physical description we have given here, oreven the environmental and human hazards we de-scribe in the first volume. What providei the thrust to itsdevelopment is this country's increasing need for elec-tric energy and the continuing depletion of the fuels wehave historically used to generate it. Alternative sourcesof energy, whose promise and problems we examine inChapter 7, are, therefore, of particular pertinence.
The Ups and Downs ofElectric Demand
Electricity, in many ways the "All-American Energy,"is nonetheless flawed. We have examined one of theseflaws, the inefficiency of the heat engines that turn the
electric generators. The most serious flaw, however,stems from its kinetic nature. It is energy on the fly,difficult to store, and must be used at once.
The kinetic nature of electrjcity creates other difficul-ties. It contributes to inefficiency. Since electricity can-not be effectively stored, it must be generated on de-mand (we will discuss some of the small-scale storageattempts batteries and pumped storage in thefollowing section). This means that the utility plant musthave sufficient generating capacity to meet maximumdemand and, therefore, that generating capacity muststand idle when demand falls below peak level. Aglimpse at the problem faced by an electric utility isprovided by Figure 6-4, which shows the typical weeklyfluctuation in demand. In this illustration we see not onlya day to night change of 40 percent but, for instance, a25 percent difference between the Wednesday andSunday peaks. If we looked at Figure 6-4 with a magnify-ing glass, we would see that the demand is constantlyfluctuating.
FIGURE 6-4Electric Power Weekly Load Curve
a
11
10
Sunday l Monday Tuesday I Wednesday Thursday Friday I Saturday
Source; The 1970 National Power Supply Part I, Federal Power Commission, USGPO Washington, D.C., 1971, pg, 1 -7.5.
213197

This fluctuating demand can only be met with a flexi-ble generating system. The large steam-drivengenerators (coal-tired or nuclear) that provide 75 or 80percent of the power are, howeVer, not very flexible.They are designed to operate at Maximum effictency atmaximum power output. And, as you can easily im-agine, they are ,difficult to turn on and off quickly.__
The large generators provide what is called the baseload, the more or less constant amount of power that isalways needed. To take care of the intermediate load,gas or loil-fired furnaces are used. Controlled by au-tomatic equipment, they can be started or stoppedquickly. The peak loads, then, are provided for bygenerators driven by diesel engines or gas turbines.The hydroelectric plants, in particular the "pumpedstorage" systems we dekribe below, also are used tosupply peak loads, as they, too, can be quickly turned onand off.
The efficiencies of these various reserve units vary.The diesels and gas turbines used to meet peak de-mand are the least efficient, 20 to 30 percerirafbest,and, inaddition, they burn costly fuel. For these reasonspeak electricity is expensive. The price of electricity
could be lowered. If the peaks were smoothed out-andthe valleys filled in; if, in other words, most of th _loadcould be carried by the big, efficien xpensivelyfueled base-load generators.
Storing ElectricityOne way to fill in the peaks is to store electricity. (We
mention briefly in Chapter 5, Volume I, some changes inthe rate structure that might have similar effects.) Atpresent, only two methods of storing electric energy areavailable to us. Batteries are used for the storage ofsmall amounts of energy, and !!_pumped storage" plantsare being built to provide larger storage capacity.
Considerable research is under way to improve bat-teries. The search is on for new battery materials thatwill have a higher energy density that is, will store
more kw-hr per pound and for batteries that can becharged and recharged many times. Such batteries ofthe future could be useful for "off-peak" power storage(power generated during low demand) and could makea non-polluting electric automobile possible.
Pumped storage: Figure 6 -5 shows a sketch of apumped storage plant. This storage technique has been
FIGURE 6.5Sketch of the Kinzua (Pennsylvania) Pumped Storage Project
deollter4
C
7.1,
r f V.' ..ort
\13.164,e,
.
, 1II,
4. li//'1 _ ./
4.....
/ 1V`:,......",... ......"-
, ,r el' -NI / /0"// 4..e-i-e- e""}...,/ /I
Awe.
A.1 - .4
4.1-rim
Source: The MO National Power Survey Part I, Federal Power Commiuion, USGPO, Washington, D.C., 1971, pg.1-7-7.
198
t1,4

/-made -possible- by-the-perfecting of, reversible pump-
turbines. These devices can be run as turbines whenwater is flowing through them and then can be quicklyreversed to pump.the water back uphill, storing gravita-tional energy. The water is pumped up into the reservoirduring off-peak times when there.is no demand for theextra power available from the big.generators..Attimesof peak demand; the water runs back down through theturbines to turn the generators. Even though these re-versible turbines are only 66 percent efficient one-third of_ the energy is lost in this storage step thedifference between the cost of peak and off-peak powerMakes them practical. This form.of storage is expectedto grow rapidly in the next decade.
Hydrogen as Intermediate Energy
The need fo store electric energy economically, whichwill become more and more acute as we turn to nuclearpower Plants, has caused a great deal of interest in thepotential of hydrogen 'for intermediate energy storage
\ and for use as a secondary fuel.The storage technique is simple. Hydrogen can be
separated from the oxygen in the water molecule by-forcing-aWelectric current through water. This is theprocess of electrolysis-, which most of us have seendemonstrated in high school chemistry. It takes energyto separate the hydrogen and oxygen, and that energy.can be reclaimed by burning the hydrogen. In factthis isone of the' exciting additional advantages of hydrogen.Bailing it, combining it with oxygen (which is the defini-tion of burning), produces Water again; it is unpollUtingcombustion.
Hydrogen has a second important advantage as anintermediate form of energy. As we show in Figure 3-5, itis three to five times less evensive to ship energy as agas in a pipeline'thap as electricity in a high-Voltage'transmission line. Not only is electric energy lost intransmission, but the transmission involves expensivetechnology and uses expensive land for rights -of -way,
What is being suggested, therefore;., is that largequantities of electridity could be generated by hugegenerating plants used to produce hydrogen fromwater, and the hydrogen could then be stored, shipped,and used as needed.
The end useeavallable from hydrogen are almost asvaried as'from electricity itself. Some idea of the varietyis given in Figure 6-6. It can be burned to producethermal energy to provide heat for homes, induttry, etc.It may even become economical to bum it to regenerateelectricitY. It could beused as a hiel for cars, and evenairplanes. However,-gaseQus hydrogeh, although it hasa large heat value (three times as much' per pound asgasoline), takes up too much space. It, is readily ab-sorbed in some metals, and in future automobile tanksmay be stored in metallic granules,from which bereleased-by heating when needed.
Hydrogen is also potentially useful in many chemicaland other industrial processes. The availability of plenti-ful cheap hydrogen would make coal liquifaction andgasification much more economical, for instance. The
by-product oxygen coutdalso be extremelyuseful. Themost important end use-of hydrogen, however, may turnout to be its attractiveness .as a fuel for the "fuel cell,"another highly promising product of technology that wediscuss in the last section of this chapter.
We are not able, however, to turn immediately to ahydrogen-fueled economy. It has its drawbacks. Sorrieof these are technical. Hydrogen is very light gas (it isthe smallest atom), and this makes it difficult to storeand pipe. It diffuses into metals and this weakens them.It is explosive (but so is gasoline).
Its biggest drawback at present is price. One estimateis that hydrogen will cost $6 to $10 per M Calories ifelectricity costs 4 to 7 cents per kw-hr. Natural gas nowcosts $1 to $4 per M Calories, so we must await anothertechnological breakthrough to lower the price of hy-drogen before it becomes competitive. There is consid-erable research under way atpresent not only aimed atincreasing the efficiency of electrolysis, but also at dis-covering other ways to disassociate water. Here is oneof the areas into which more research money should bechanneled to insure that economical hydrogen will bepossible when the scarcity of natural gas and theavailability of cheap electricity makes its use feasible.
Hydrogen storage will not only be advantageous inconnection with the fossil -fuel -fired and nucleargenerators, but also for same of the exotic electricgenerators of the future. This will be particularly true ifwe tutn toSome of the continuous but erratic sourcesthe wind or solar energy for our electricity. The mostintriguing future possibility for the conversion of hy-drogen, however, is in the fuel cell and we shall &scutsthat device next.
A Fuel Cell in Your Future?
One of the most exciting products of energy technol-ogy is the fuel cell; a device that generates electricenergy directly from chemical energy. It is somewhatlike a battery in this regard; but differs significantly in thatthe chemical energy, rather than being stotedjs fed intoit continuously.
The fuel cell operates, in a sense, as a slowed-downcombustion reaction, as slow-motion burning. In com-bustion, electrons are removed from the fuel molecules("oxidizing- them in chemiCal terms)and are attached tothe oxidizer molecule ("reducing" them). Four Caloriesof energy per kilogram are released in the reaction. Inchemical symbols the burning of hydrogen is written.
t.H2 + 0 -* H2 ++0-- + energy
where the + 's indicate that each hydrogen atom.hasgiven up an electron and the 's indicate that the ox-ygen atom has attached them.
When Ifidrogen burns in air (or oxygen), the reactiontakes place very rapidly and the energy is released
, explosively at heat _ln_the fuel cell the same transfer ofelectrons takes place, butte fuel and the oxidizermolecules are physically separated and the electrons
905. 199._
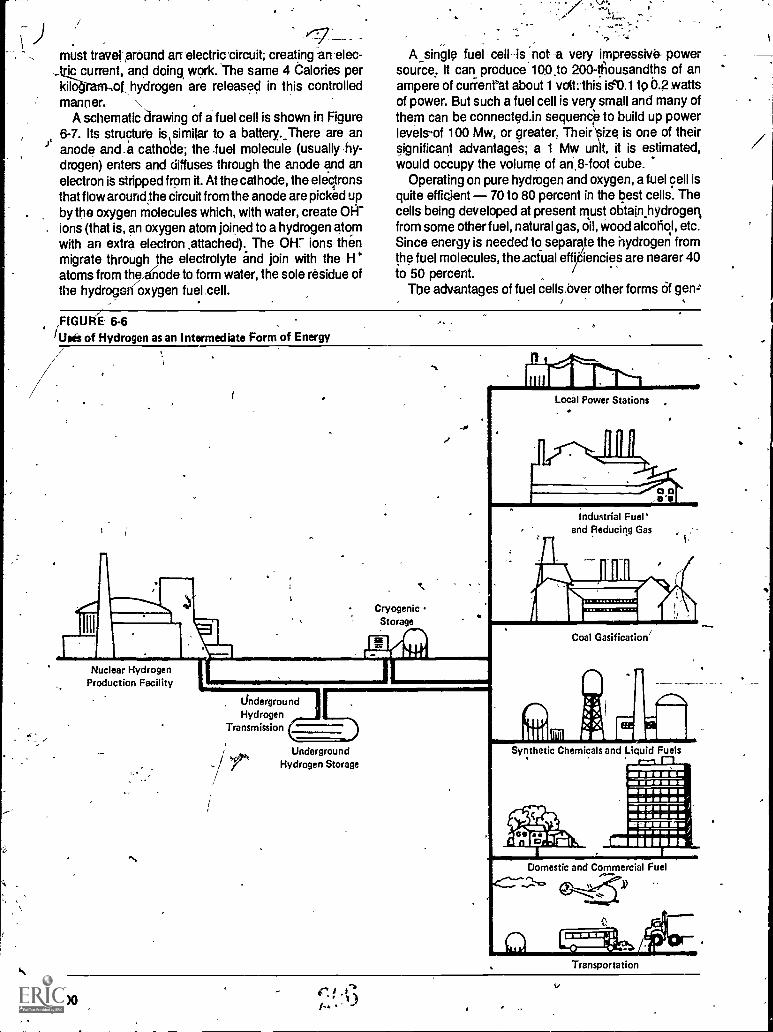
must travel around arr electric-circuit; creating an-elec-Aric current, and doing work. The same 4 Calories perkilo4ram-or hydrogen are released in this controlledmanner. \
A schematic drawing of a fuel cell is shown in Figure6-7. Its structure is similar to a battery...There are ananode and.a cathode; the .fuel molecule (usually hy-drogen) enters and diffuses through the anode and anelectron it stripped from it. At the cathode, the electronsthat flow around.the circuit from the anode are picked up
moleculesby the oxygen which, with water, create OH-. ions (that is, an oxygen atom joined to a hydrogen atom
with an extra electron ,attached). The OW ions thenmigrate through the electrolyte and join with the H+atoms from the/node to form water, the sole residue ofthe hydrogorizoxygen fuel cell.
A..single fuel cell is not -a very impressive- powersource, It can produce 10.0.to 200-thousandths of anampere of currenrat about 1 volt: this iscal to 0.2 wattsof power. But such a fuel cell is very small and many ofthem can be connected.in sequence to build up powerlevels-of 100 Mw, or greater, Their ize is one of theirsignificant advantages; a 1 Mw un t, it is estimated,would occupy the volume of an,8 -foot cube.
Operating on pure hydrogen and oxygen, a fuel cell isquite efficient 70 to 80 percent in the best cells. Thecells being developed at present must othainhydrogerlfrom some other fuel, natural gas, oil, wood alcohol, etc.Since energy is needed to separa e the hydrogen fromthe fuel molecules, the actual effi. iencies are nearer 40to 50 percent. .
The advantages of fuel cells,bver other forms of gen=
,FIGURE 6-6/Uses of Hydrogen as an Intermediate Form of Energy/
CryogenicStorage
ar
Local Power Stations.
000111
Nuclear HydrogenProduction Facility
UndergroundHydrogen
Transmission
UndergroundHydrogen Storage
Industrial Fuel'and Reducing Gas
Coal Gasification`
illlliSynthetic Chemicals and Liquid Fuels
1-1
MN 111111111111111
to EP Elm
MMMMMMsisalm.
Domestic and Commercial Fuel
.4)
0Transportation
"-1r.f--'

eration -are numerous.They are competitive in efficiency. They are quiet. The only moving parts are fansand pumps. They pose no pollution threat since thewaste products are carbon dioxide waieL_
The fact that they can use gas as a.fuel-is a mostInteresting advantage. As we have said, it is three to fivetimed less expensive td pipe energy in gaSeous form asit is-6 transmit the same-amdunt in the form of electric-ity. Thus, even though a modern fossil fuel generatingplant Mali be as efficient as a fuel cell, the fact that thefuel cell can create electricity at the site from piped-ingas,results in the fuel cell producing 10 to 25 percent
.1 more energy than. the power plant delivers from thesame amount of fuel.
The fuel dell is being developed for several applica-tions. The goal of one $42-million program'OtPratt andWhitney Aircraft and a group of utilities is to developa 26Mw hydrocarbon-aiOuel cell generator for use at sub-stations and load centers within existing electric sys-tems. Such a device could give much more'efficient and,therefore, inexpensive peak-power response than canthe generators we discussed earlibr.
A second program, also carried out' by Pratt andWhitney for a group of gag utilities, is TARGET (Team toAdvance Research on Gas Energy Transformation).The goal of this program is to develop rnallcapacity,12.5 kw fuel cells for on:site conversion of naturargas-to electricity in offices, small bush iesses,--apartmentbuildings,ehools,.groups of residences, etc. TARGEThas already tested this concept in 65 locations of thistype and expects on-site fuel cells to be in service by theend of the decade.
The fuel cell proponentg remind us that a considera-ble amount of natural gasis burned to generate electric;ity and point out the energy gains And benefit to theenvironment that on-site fuel cell conversion couldbring. They also look ahead with great anticipation to theavailability of hydrogen and the increased efficiency inconversion, that could be obtained by putting back to-gether, in a fuel cell, the hydrogen and oxygen originally
FIGURE 6-7Schematic of.a Fuel Cell
Fuel -e.In
Load
Electrons
00
6
OxidizerIn
Porous Elzctrodes
OxidationProducts
Out
separated-by:electrolysis-at-some-hugerdistant-powerplant. It is not an unattractive vision.
SummaryMany of the problems that beset us in these troubled
1970s seem to have been caused by a technologythat runs ahead of its time, that has not been carefullypreplanned and integrated into the global ecology. Be-cause of this, some-modern-day Luddites are turningaway from future technology. We cannot turn back fromtechnology, however. We cannot continue much longerto meet existing demand for energy with our presentdeVces and techniques. To provide the growth requiredto allow all our citizens access to the comfort, conveni-ence, and necessity that air-conditioners, freezers,dryers, etc. bring, we will need more energy, inparticu-' lar, more electric energy. Part of this will be supplied bynew energy converting devices.
Goals of the technological contributions examined inthis chapter are: more efficient' conversion of energy,more variety in energy - forms; and-less-environmentaldamage. We looked at progress in five areas: (1) theconversion of -coal into liquid and gaseous fuels, -(2)topping and bottoming cycles to use the - h energythat is now wasted at the high-teMperature and low--temperature ends of -stationary heat engines, (3) thebreeder_reactar that promises new energy from oururanium stockpiles, (4) the need for improved storagetechniques for electric energy and the separation ofhydrogen from water, which may prove to be .a veryusefuway to store such energy, and (5) the "fuel cell,"which converts the chemical energy of gas directly intoelectric-energy: =
In a priority ranking, we would probably have to rankcoal gasification and the fuel cell as offering the mostexciting near term promise, followed by the controver-sial breeder reactor, and the multipurpose coal convert'Mg plants (the coalplex), which ,could create heat forelectricity-and new and clean-gaseous and solid fuels.
Still in the "blue sky," but showing enormous proMise,is the use of hydrogen as an intermediate form ofenergy. Hydrogen can beseparated from water by elec-trolysis, storing,electric energy. It can then be used itself.as a fuel in a stationary furnace or in a mobile heatengine (an automobile or an airplane,- for instance). Itcould have an important role in all sorts of industrialprocesses, from metallurgy to coal gasification. Mostimportant, used in connection with a fuel cell, it couldproduce electricity at the poireof use more efficientlythan wO do now, and without the noxious pollutants (theresidue of the fuel cell reaction between hydrogen andoxygen is water).
TO obtain plentiful 'hydrogen requires moreelectricity. In our present framework, this means morecoal or more uranium,,and both these sources causeenvironmental problems. It may be that the true promiseof hydrogen as a fuel is beyond the present framework,that its future lies with some of the new means of gen-erating electricity that are the central topics of Chapter 7.
910 201

, 7'
21J8
_CHAPTER 7Living on the Interest:The Continuous Energy Sources

Living on the Interest:The-Ciiiitifiubui Energy Sources
There are many ways that we can stretch our fossilfuel supplies, and we have just described some of thetechnological assistance that is in the offing. There isalso, as we described in Chapter 5, more fuel to bediscovered and extracted if we give free rein to the"diggers and drillers" and support to extractive technol-bijy:ThiS energy "capital;"-stored bylhe plants of long-ago earth, will prObably last into the next century, buteven if we follow this environmentally threatening pol-icy, we will be simply postponing the inevitable. Thesupplies of fossil fuels are finite and they will run out. Setagairitt our enormous and growing demand even therich legacy of coal vanishes in a puff of smoke if wemeasure time in centuries rather than years. Spaceshipearth carries fuel for onlya limited voyage.'
But Spaceship earth is not really on her own; shereceives a vast and continuous supply of energy fromher Mothership, the sun. As we saw in Table 2-1, theamount of power received from the sun per acre of thiscountry's land area is 700 to 800 times as large as theaverage power we consume per acre, With the deple-tion of the fossil fuels, we are finally turning the inven-tiveness of our technology to the domesticatioaof thissource of power. We are, to use an imprecise metaphor,beginning the design of a future in which we live off theinterest rather than the capital.
There are other continuous sources that we can tap, afew so large that we can consider them as almost con-tinuous. Some of these are; in fact, "secondhand" solarsources. Hydropower, the power of falling water, wehave already assessed. Wind is also a secondhandsolar source. Its kinetic energy derives from the sun'sheat which is absorbed in the earth's surface layer andsets into motion the complex currents of the atmos-phere. We areenewing our interest in this source. Weare also returning with new interest to the secondhandsolar source in longest use, living material that storesthe sun's energy by photosynthesis.
We Will, in this chapter, look at the state of our tech-nological mastery of these secondhand sources. Wewill also try to glimpse the future role of the non-solarsource, geothermal energy, energy from the earth'smolten core. We will not say more about tidal energy (itis too small for any important role in our future). Our besthope for the future, however, lies with the direct use ofenergy from the sun and in the development of fusionpower, which could draw on the ocean's hydrogen forfuel. We will first look at the secondhand solar sources,as help is nearer realization in them. jThe Secondhand Solar Sources
Wind, water, and wood, important sources of energyin this country at the end of the 19th century, have beendisplaced by the fossil fuels. They lost out because theywere not properly packaged for man's use. Wind iserratic, waterpower is difficult to transport, and woodcannot supply enough energy per pound to allow it to
compete with the fossil fuels. The final blow to the fewwindmills and waterwheels-that-tasted-into-the-20thcentury was struck by electricity. Relatively cheap, eas-ily transported, convertible into almost any desirableform of energy, electricity, in addition, can be turned onand off at the flick of a switch.
The one secondhand source whose importance hassurvived and even grown is hydropower, for it was easilyadapted to the generation of electricity. We have as-sessed its future in Chapter 2. Our technological ad-vances allow us to look again at some of these sec-
., ondhand sources, and it is the possibility of using themto generate electricity that receives our first priority.Wind-Power
Wind was harnessed by the primitive technology ofearliest civilizations to move men and materials acrossthe oceans. It has, since the time of the Romans, beenused through the windmill for a variety of mechanicaltasksgrinding grain, pumping water, etc.
The wind carries much energy. It is estimated that thepower potential of the winds over the continental UnitedStates, across the Aleutian Islands and Alaska, and offthe East Coast totals 100 billion (B) kilowatts, 200times our present generating capacity.' The estimateshown in Figure 2-1 is that the winds of the continentalUnited States alone have aboutfive times the total of ouraverage power demand.
At the turn of the century this country made good useof wind energy. Our clipper ships were the most grace-ful and efficient sailing ships ever built and our westernprairies were dotted with thousands of American:builtwindrnillithat pumped water and generated electricity.The clipper ships, however, eventually retired in theface of competition.from the steady power of the stearmship and the dependability of its iron hull. The Westernwindmills lost the battle to-inexpensive (subsidized, infact) electricity from the REA (the Rural ElectrificationAdministration).
But windpower may be coming back. A large electricgenerator, 1.25 Mw, was built in the 1940s in Grandpa'sKnob in Vermont, but was shut down and never remod-eled after a blade failure. The study of windmill turbineshas rbaetitaken up again in New England, and WilliamHeronemus, a professor of engineering at the Univer,-sity of Massachusetts, Amherst, has proposed_ an instal-lation with aeroturbines of advanced design off the NewEngland coast. He projects the possibility of generating160 B kw-hr of electricity per year. (The New Englandregion used 108 B kw-hr of electricity in 1970.)
A major drawback of wind power, as it is of solarpower, is its variability. It is not possible to feed anelectric system whose demand peaks and declines, awe show in Figure 6-4, with a source That cannot bepredicted and controlled. It' is here that some of thetechnology discussed in Chapter 6 will be called upon. Acomplete and dependable wind-powered electricgenerating system could store its energy as hydrogen,electrolysed from waterbythe generated electricity, andthen provide electric power on demand.y using fuelcells to regenerate. electricity from that hydrogen.
9(19 .205
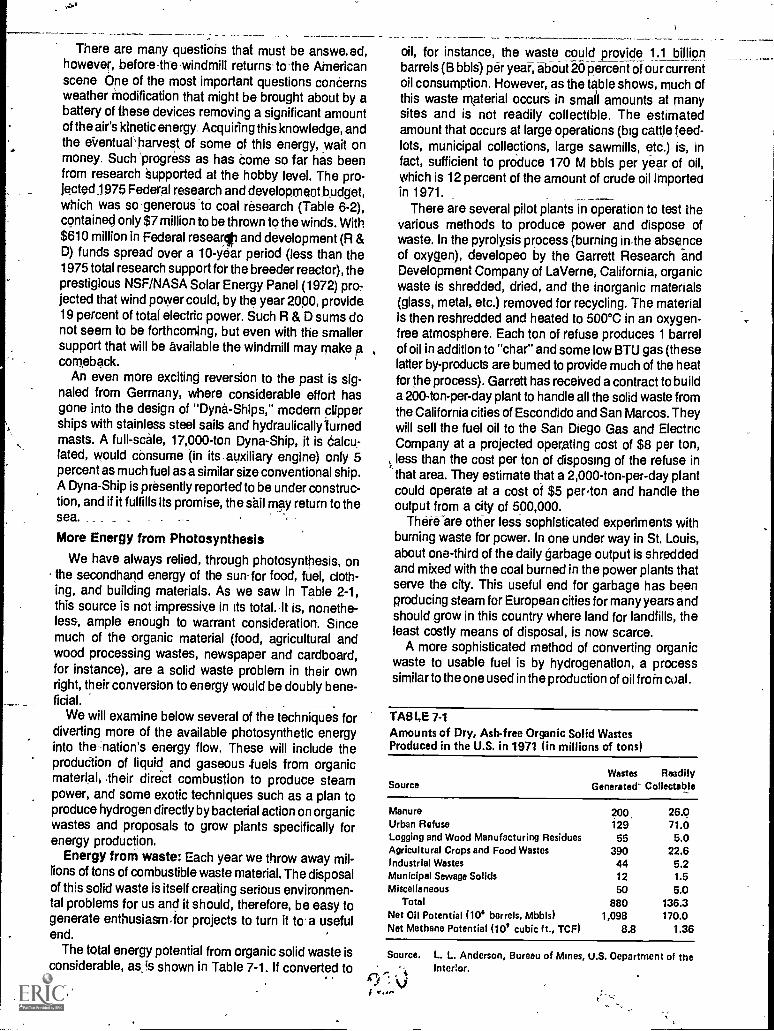
There are many questions that must be answe. ed,however, before the-windmill returns -to -the Americanscene One of the most important questions concernsweather modification that might be brought about by abattery of these devices removing a significant amountof the air's kinetic energy. Acquiring this knowledge, andthe eVentual 'harvest of some of this energy, wait onmoney. Such 'progress as has come so far has beenfrom research Supported at the hobby level. The pro-jected 1975 Federal research and development budget,which was so generous to coal research (Table 6-2),contained only $7 million to be thrown to the winds. With$610 million in Federal researli and development (R &D) funds spread over a 10-year period (less than the1975 total research support for the breeder reactor), theprestigious NSF/NASA Solar Energy Panel (1972) pro-jected that wind power could, by the year 2090, provide19 percent of total electric power. Such R & D sums donot seem to be forthcoming, but even with the smallersupport that will be available the windmill may make acomeback.
An even more exciting reversion to the past is sig-naled from Germany, where considerable effort hasgone into the design of "Dyne- Ships," modern cUpperships with stainless steel sails and hydraulically turnedmasts. A full-scale, 17,000-ton Dyna-Ship, it is Calcu-lated, would consume On its - auxiliary engine) only 5percent as much fuel as a similar size conventional ship.A Dyna-Ship is presently reported to be under construc-tion, and if it fulfills its promise, the sail may return to thesea. _
More Energy from Photosynthesis
We have always relied, through photosynthesis, onthe secondhand energy of the sun, for food, fuel, cloth-ing, and building materials. As we saw in Table 2-1,this source is not impressive in its total. -It is, nonethe-less, ample enough to warrant consideration. Sincemuch of the organic material (food, agricultural andwood processing wastes, newspaper and cardboard,for instance), are a solid waste problem in their ownright, their conversion to energy would be doubly bene-ficial.
We will examine below several of the techniques fordiverting more of the available photosynthetic energyinto the nation's energy flow. These will include theproduCtion of liquid and gaseous .fuels from organicmaterial, .their direct combustion to produce steampower, and some exotic techniques such as a plan toproduce hydrogen directly by bacterial action on organicwastes and proposals to grow plants specifically forenergy production.
Energy from waste: Each year we throw away mil-lions of tons of combustible waste material, The disposalof this solid waste is itself creating serious environmen-tal problems for us and it should, therefore, be easy togenerate enthusiasm-for projects to turn it to- a usefulend.
The total energy potential from organic solid waste isconsiderable, as, is shown in Table 7-1. If converted to
206'
oil, for instance, the waste could provide 1.1 billionbarrels (B bbls) per year, abbut 20 percent of our currentoil consumption. However, as the table shows, much ofthis waste material occurs in small amounts at manysites and is not readily collectible. The estimatedamount that occurs at large operations (big cattle feed-lots, municipal collections, large sawmills, etc.) is, infact, sufficient to produce 170 M bbls per year of oil,which is 12 percent of the amount of crude oil Importedin 1971.
There are several pilot plants in operation to test thevarious methods to produce power and dispose ofwaste. In the pyrolysis process (burning in -the- absenceof oxygen), developeo by the Garrett Research andDevelopment Company of LaVerne, California, organicwaste is shredded, dried, and the inorganic materials(glass, metal, etc.) removed for recycling. The materialis then reshredded and heated to 500°C in an oxygen-free atmosphere. Each ton of refuse produces 1 barrel
, of oil in addition to "char"and some low BTU gas (theselatter by-products are bumed to provide much of the heatfor the process). Garrett has received a contract to builda 200-ton-per-day plant to handle all the solid waste fromthe California cities of Escondido and San Marcos. Theywill sell the fuel oil to the San Diego Gas and ElectricCompany at a projected operating cost of $8 per ton,less than the cost per ton of disposing of the refuse inthat area. They estimate that a 2,000-ton-per-day plantcould operate at a cost of $5 per,ton and handle theoutput from a city of 500,000.
There are other less sophisticated experiments withburning waste for power. In one under way in St. Louis,about one-third of the daily garbage output is shreddedand mixed with the coal burned in the power plants thatserve the city. This useful end for garbage has beenproducing steam for European cities for many years andshould grow in this country where land for landfills, theleast costly means of disposal, is now scarce.
A more sophisticated method of converting organicwaste to usable fuel is by hydrogenation, a processsimilar to the one used in the production of oil froM coal.
TABLE 7-1Amounts of Dry, Ashfree Organic Solid WastesProduced in the U.S. in 1971 (in millions of tons)
SourceWastes Readily
Generated' Collectable
Manure 200. 26.0Urban Refuse 129 71.0Logging and Wood Manufacturing Residues 55 5.0Agricultural Crops and Food Wastes 390 22.6Industrial Wastes 44 5.2Municipal Sewage Solids 12 1.5Miscellaneous 50 5.0
Total 880 136.3Net Oil Potential (10' barrels, Mbbls) 1,098 170.0Net Methane Potential (10' cubic ft., TCF) 8.8 1.36
Source. L. L. Anderson, Bureau of Mines, U.S. Oepartment of the
C.t?
Interior.

in waste is heated at high pressure andtemperaturem an atmosphere of carbon monoxide andsteam. Some 99 percent of the carbon content can beconyerted to fuel oil, and even after recycling some ofthis oil (to provide for the steam), 1.25 barrels of oil pertort of.dry waste are obtained. The sale of oil and thereaction in volume of waste to be disposed of makethis operation competitive with other solid waste dis-posIll methods.
In many ways the simplest way to obtain energy fromorganic- waste- is-to- produce - methanefact,\occurs naturally and many sewage disposal plantstrap ts gas and use it forheating. Methane is producedby an erobic (oxygen-free) digestion of organic materi-als bymicro:organisms. This "fermentation" process, itis est mated, could produce 10,000 cubic feet ofmeths e or 25,000 Calories of energyfrom a ton of solidwaste The estimated potential of collectible waste(from.Table 7-1) is 1.36 trillion cubic feet (TCF), 6 per-cent of the 1971 natural gas consumption,
An advantage of this system (5 that sewage alreadywas a large component of the water that is_needed as a'growth mediumlbr the bacteria. Methane as a fuel is, ofcourse, very degirable and can be, by existing tech:.niques, easily cleaned of potential pollutants. (Wastederived from fuels is generally low in sulfur.)
Energy farming: In this period of escalating fuelprices, it may even turn out to be commercially viable to_grow plants .specifically for their energy content.. Al-though plants are not impressively efficient in theirenergy, conversion processes (they average about 0.1percent), there are some plants that can produce im-pressive amounts of organic material per acre.Table 7 -2 provides some examples of the mostproductive species.
A) proposal that has sporadically attracted interestrecommends the conversion of appropriate crops toalcohol. There have been times, in recent history, whenindustrial alcohol (as well as some popular beverages)has been derived from cereals. In the war years(1940-1945), for instance, most industrial ethyl alcoholwas made from molasses and other natural sources.When petroleum became cheap an plentiful again,alcohol derived from it completely took Vet the market.
TABLE 7-2Annual per Acre Yields of "Energy Crops"
Tons perAcre
Rubber (Hsvea)
Super Cane
Sugar Boots
1
4 (sugar)
4 (pulp)
2 (sugar)
0.7 (pulp)
Sours: M. Calvin, "Solar Energy by Photosynthesis," Science, 184,April, 1974; p. 375.381.
The.rapid.risekt.the,priceof oil has brought fermenta-tion produced alcohol back to a nearly price cohipetitiveposition. Alcohol from sugar cane, for instance, can beproduced for about 90 cents per gallon. Petroleum de-rived alcohol, although it is price controlled at 66 centsper gallon (and scarce), sells at $1 per gallon if boughtoutside the United States.
Sugar cane is an ideal crop for converting sunlight tosugar.. It has thehighest efficiency of solar energy con-version (0.6 percent) of any plant. It produces 4 tons Ofsugar"? torAofalcohol or 625 gallons) per acre, andincluding 543 pulp, -6 tons of carbohydrate per a-creJf`,-1n-Hawaii, for instance, one-third of the molasses pro-duction were Converted to alcohol, it would make itunnecessary to import the 15 M gallons of gasoline thestate uses to reit its agricultural machinery. (Alcohol canbe added to gasoline at up to 25 percent without anyengine changes, and has the advantage of lowering theemission,of poliutants.) There are other similar pos-sibilities; the 7 M bushels of grain that spoil each year inNebraska dlula produce 20 M gallons of alcohol.
The rubber lant is an interesting potential source ofenergy. It pro ces a pure hydrocarbon, not a car-bohydrate conta ing oxygen that requires fermenta-tion. It now yields about a ton of hydrocarbon per acreper year and the rubber growers predict that they couldraise this yield to 3 tons. It is quite possiblethat this plantcould take over much of the raw materials market (theequivalent of about 730 M bbls of oil per year, 6 percentof the total energy budget). It may well be that the rising
:price of oil will drive us back to the land for energy andthat large "energy farms" will bring needed wealth to thetropicalareas of the world,
Trees as fuel: A second way to bring more photo-synthetic energy into the system is proposed by Dr.
,George Szego ofinterTechnology Corporation. He hascalculated that trees growing in sunny areas convert upto 3.percent of available solar radiation into energy inwood. The trees grown in an area of between 100 and 600square miles of woodland could fuef(depending on theclimate) a 1,000 Mw power plant over its 30-yearlifetime, (Trees would be harvested in groups etvery 10years.) Over the same -30 -year period the plant wouldhave used 74 M.tons of coal, causing the strip mining of40 square miles of land. The tree farm would haVeseveral advantages. The land could be used for recrea-tion before and after logging, wood ashes are useful asfertilizer, and wood is low in sulfur content. Dr. Szegois convinced by his calculations that wood as fuel couldbe economically competitive with coal.
This scheme and many of the others ultimately suf-fer from the facts of life. The efficiency of photosynthesisis very small. It will probably be the case, therefore, thatrather than cover land with these less efficient convert-ers (even trees), these areas will be put to better use bycovering them with, for instance, the more efficient"energy farm" of Meinels' vision we discuss in a follow-ing section.
207

The most practical proposals are those that entail thedoriverSiori of olgabie Waste to erier0,-foT we are al-ready paying to dispose of that waste. Even here thereis a hidderijoker. These large amounts of waste areproduced, in most cases, by inefficient practices else-where. We have so much waste paper because wedOn't recycle it, we have large amounts of cattle manureat feed lots because of the extremely inefficient practiceof fattening cattle on grain to produce prime meat (meatmarbled with fat). We will, in all likelihood, do better inthe long run by replacing inefficient, waste-producingpractices; ratherthan trying to extract some energy fromthe residue of these practices.
Geothermal PowerIn Chapter 2 we took a brief look at the "energy
stockpile" in geothermal form. Geothermal energy, ispresently in usin the generating plants of California'sThe 'Geysers field that provide about half of San'Francisco's electricity. These plants use supersatu-rated "dry" steam, steam so hot that there is no water init. This steam can be fed into conventional steam tur-bines.
There is much more energy available from the earth informs other than dry steam, but its domestication willrequire a significant assist from technology. There is apotentially large-reservoir-of-thermal energy in hot wateror "wet" steam (steam at less than 350°) and in hot butdry rocks. The hot water wells could be tapped with agenerator of the type we described as a "bottomingcycle" in Chapter 6, using as a working fluid a low boilingpoint liquid that could be vaporized and drive a turbine.The U.S.S.R. is reported to be using this technique withwater at 108°F. A plant using isobutane has been de-signed for the United States, but money for pilot plantconstruction has not been forthcoming.
In addition to these low temperature cycles, othertechnological barriers awaiting penetration are: meansof recharging hot, dry sources with new water, tech-
miqdes of artificial stimulation (explosive fracturing for in-stance), and deep high-temperature drilling techniques.
Beyond pure electric power, the possibilities ofgeothermal energy broaden in a very interesting way. Inmany fortunate, c:tuated areas, Klamath Falls,Oregon, and Boise, Idaho, in this country and in manyareas in the U.S.S:R., Hungary, Japan, -Iceland, andNew Zealand, the hot water is -also used for .homeheating, industrial processes (a paper and pulp corn-pany in New Zealand), and even air-conditioning (work-ing on the "adsorption-desorption" principle we de-scribe in the following section).
In addition to heat, an important output from geother-mal sources is water. The next big geothermal project inthe United States -is planned for the Imperial Valley.Under the Colorado River Basin Act, the Department ofthe Interior is to provide 2,500,000 acre-feet of water, peryear for the Colorado River. It-is' being proposed that amultipurpose geothermal development in the ImperialValley could produce power, water, and minerals. Toproduce clean water, the hot brine would`be pumped
208
into a succession of "stills" at less than atmosphericpressure, the water woUltiboil, the stearrrpiped-Off,:and-.,the now-clean water allowed to liquify. The material thatremains in the end is rich in many types of chemicalsleached from the rocks and perhaps can be sold.
Withdrawing water at the rate being considered, forthe Imperial Valley brings on the danger of subsidence. Itis proposed that water be reinjected either irrigationrunoff water or ocean water pumped inland. If thisworks, the Imperial Valley will, in fact, be a huge "geo-'thermal desalination plant" Over a petiod_of, perhaps 100years, hot water wilt bewithdrawn, distilled with-its-ownheat, replaced by salt water (or contaminated irrigationrunoff), and this water will in turn be heated by themagma, drawn off, purified, etc. The projected cost ismuch less than any presently operating desalinationplant. ,
Power from the SunAs we saw in Table 2-1, all the secondhand sources
Of solar energy taken together do not form an impres-sive total of available power. With the continuing growthin demand, we are giving more and more serious atten-tion to "mainlining': solar energy, converting it directlyfor our uses.
This search is not a new one; through the ages manhas been impressed by the power of the_sumand evenoccasionally turned it to his uses. Archimedes, accord-ing to the legend, used focusing mirrors to set fire toinvading Persian ships, and small, solar-heated steamengines had_some success a century ago. But,, tech-niques.to use solar energy as a reliable and largejscafesource of power have not been developed, for obviousreasons. Solar energy is dilute, so that a large capacityrequires a large collection area. To obtain 1,000 Mw ofpower, for instance, requires, according to Table 2-1,about 1,250 acres or about 2 square miles of surfacearea at 100 percent collection efficiency. At lower collec-tion efficiencies, the areas are correspondingly larger-20 square miles at 104 percent efficiency.
It is also an erratic rather than a,reliable source,fluctuating on the predictable day-night cycle and un-predictably with the cloud cover. We are, therefore,faced not only with the need for a large collection area,but also with the problem of storing the-energy once it iscollected.,
These handicaps have served so far to keep ex-perimentation with this energy,atthe hobby level. Ournewly realized energy shortage has, however, caused anew flow of federal research support into solar energyresearch, and several methods for domesticating thesun are now being actively investigated. Work is pro-ceeding along three different lines,solar home heatingand cooling, solar cells for direct conversion to electric-ity, and large central solar power plants for the pro-duction of electricity.
Solar Homes
The most simple energy conversion for the incomingsolar radiation is into heat energy.
.912

There is much to recommend emphasis on direct useof solar energy in the home. There is a large potentialmarket; some 20 percent of the total energy bill goesinto heating and cooling residential and commercialbuildings, and, further, the conversion to heat energy is ahighly efficient one. It follows the arrow of the secondlaw. Collectors capable of converting as much as 80percent' of the. incident radiation' to. heat have beendemonstrated.
The techniques of heating and cooling with solarenergy are quite simple./ A dwelling's roof providesample-collection area The solar incidence of Table 2-1is equivalent to 350 Calories per square foot per day.,Atypical residence for a *lily of four with 1,600 squarefeet of roof area will receive, on the average, 2,000 MCalories of War energy in a year, some six times theaverage 32.5 M Wades required for space heating.Theseaverabes, ofcourse, do not display the difficulties
the major fraction of this energy arrives during thesummer months,/when heat is not needed. Even-with-this disclaimer in mind, however, there are large areasof the United States thatdo receive enough steady solarpower to take care of their total need for space andwater heating.
These areas are shown as the zone of "maximumfeasibility" in Figure 7-1: The second zone, roughlycovering the middle latitudes of the United States, is oneof 'engineering feasibility"; some auxiliary heatingwould hive to be provided. For the zone of "minimumfeasibility," solar heat would be the auxiliary heatsource supplementing conventional systems in thespring and fall.
Heating is accomplished by "flat plate collectors,"essentially blackened plates covered by one or severaltransparent insulating layers. The transparent layersprevent cooling of the blackened absorbent plate by-air.currents. They can be made selectively transparent,admitting the incident short wavelength radiation, butreflecting back to the absorbing plate the longerwavelength infrared "heat radiation." Water pipes arethen put in thermal contact with the back of the plate andcarry the heat energy into some kind of a storage reser-voir. The complete solar home might look like that inFigure 7-2.
Several storage techniques have been tested; hotwater storage is sufficient for a few days as are heatedrocks or pebbles. More sophisticated techniques nowbeing developed use salts that are melted (absorbing
FIGURE , 7-1
Solar HomliHmating Feasibility
The regions of the different degrees of feasibility of heating houses by solar energy. In the white areas houses may be entirely heated in thisfashion, In the lightgray areas a large portion of the heat can be obtained, and in the darker areas only a small part of space-heatingneeds canbe provided by trapped solar energy.
Ssouice:- Energy Sources,the Wealth of the World. Ayres and Scarlott, (New York: McGrawHill) 1952.
4:1 209

energy) during the collection period and then solidify,releasing energy, when it is needed.
Such a system could carry the heating load by itself inthe maximum feasibility zone shown in Figure 7-1. In thezone of engineering feasibility, a back-up heating sys-tem would be needed for a succession of cold cloudydays. If these two systems are combined, if an electricalback-up system is provided, for instance,the storagesystem can be recharged when necessary by electricheaters during the night time,_using low-cost off-peakpower,
The technology, to accomplish what has been de-scribed already exists. In fact, solar heated houses havebeen operating in various parts of this country for manyyears one in Boston has consistently supplied about
, haltalts own total heat needs for 20 years. They havealready demonstrated cost competitiveness. Table 7-3shows the results of the most recent analysis of therelevant data and compares the cost of solar heat (dol-lars per M Calories) with electric, gas, and oil heating. Inthis analysis, the comparison takes into account fuelcosts as well as capital requirements and operatingcosts, and assumes a 20-year life cycle for the building.
FIGURE 7-2Home Solar Heating System
Rays
Collector
Stones 1,600-gallon Drum(hot water)
Air Space
Ground Level
CirculatingPump
InsulationGlass
Black Surface
Pipe
Roof
Solar Collector
It is clear, even from this data, that solar space andwater heating is the most economical one in some partsof the country (it appears to be competitive with gas andoil in Santa Monica, California). In most_parts of thecountry, it is mar: economical than electric heating. Inlight of this knowledge, one wonders why electric homeheating has been enjoying the boom we described inChapter 4 (a 470 percent increase from 1960 to 1968),while solar heating is still a novelty.
The answer to that question underlines the real bar-riers to wide utilization of solar heat. These barriers arenot technological but economic and practical. The dom-
lnant consideration in the purchase of a home seemsto be the purchase price the capital investment. Solarheating is add-on heating, since it at least has to bebacked up by a conventional heating capability. Even inthe zone Where SOlarheating alone is_ enough, the initialcost of the solar equipment is larger than the cost ofconventional facilities. Solar heating systems are capi-tal intensive. This means that the mortgage companygets into the act, that the house may be harder to sell,etc. Electric heating, on the other hand, is initiallyeconomical; it requires no complex equipment, no fur-nace ducts or pumps. Also, it is convenient to operateand maintain, another primary consideration to thepurchaser. With thepresent mobility of Americans, weare not accustomed to considering l;20 or even 10-yearlife cycles of houses, and this set of mind is present not .only in buyers, but in builders, insurers, and all theothers involved in the housing business. But it is only onsuch a basis that the savings from free fuel will becomeimpressive.
These savings are now more impressive than areshown in Table 7-3. Even in the instant since 1970; theoverall energy picture has changed drastically, greatlyenhancing the competitive position of solar energy. The$1.85 per million BTU1 for natural gas that Table 7-3shows for Massachusetts is now $3.00. Other "fuels,even electric energy, are rising in similar fashion. Theclear esse& df all our energy studies is that thisincrease will continue. It would seem that new efforts tostimulate mass productiorof solar heating units,-afia tochange building codes, insurance and mortgage regula-tions etc., can now be justified on an economic as wellas an energy ethic.
Additional economies accrue if solar energy is used toprovide cooling as welilas heating. The inherent advan-tage of solar cooling is the obvious one: cooling is mostneeded at the time when the maXimurtemount of solarenergy is available. Since a fairly large solar collector isneeded (1,000 square feet for an ordinary house), thesolar collector itself, if mounted on the house roof, pro-vides insulation that reduces cooling need. This largecollector system is also more than sufficient for thewinter heating requirements.
In the process of solar cooling the energy required tocompress and circulate the refrigerant fluid is provided
IA BTU is equivalent to about 0.25 Calories.
C.210 ;`

by heat Instead of by electric pumps. One ,prototypedesign uses ammonia which is evaporated by heat ab-'sorbed in the area to be coaled. Ammonia is chosenbecause its boiling point is -40°C, well below the insidetemperature of a refrigerator. The ammonia vapor carry-ing the heat is then absorbed in a water-salt solution andcirculated (by convection currents caused by the tem-perature difference) in tubing outside of the refrigerator orhouses where the heat is released to the surroundihgs.The solar energy source then is used to drive the am-monia vapor out of the water-salt solution and regener-ate 'the ammonia liquid.
Even simpler solar cooling is used in several solarhouses by reversing the solar heating cycle. Water fromthe storage tank is circulated through the roof-top collec-tor at night radiating heat into the night sky. The now-cool water is stored and used to cool the house in thedaytime.
All in all, expert opinion is that the technology for solarcooling, as well as for solar heating, is ready for large-scale application. Given the ready status of technologyin the heating/cooling front and the lack of action to date,it is encouraging to see even small movements in theright direction. There has been increased support fromCongress, where there has been discussion of legisla-tion to provide for the construction of 5,000 or so dem-onstration solar homes. This project, if carried out,should lead to the needed breakthroughs in architec-ture, building, regulation, finance and other relatedareas. There appears, at last, to be the beginning ofserious commercial plans to produce solar equipment.Within five years, we may be able to judge what portionof the home comfort energy can be taken from the sun.
Solar Cells
The most glamorous conversion techniques use'solarcells to convert radiant energy directly into electricenergy. The energy conversion is accomplished by the
photovoltaic process; on striking certain materials solarradiation is absorbed and causes a separation of theelectrons from the atoms. The migration of these elec-trons in one.direction and the positively charged ions inthe other produces a small potential difference, ,-typicallyabout 0.5 volts. An array of these cells can produce auseful electric power capacity..
The present handicaps are many: solar cells must bemade from very high purity materials; single crystals ofsilicon are preferred. While silicon is the most abundantmaterial in the earth's crust, it is not easily refined andshaped for use in solar cells. With - present technologythe cells are produced virtually one by One, in what isessentially a "cottage industry." They cannot yet bemass produced. Although efficiencies of conversionhave increased from 9 percent in 1965 to 11 percent in197-f, and energy conversion costs in dollars per watthave decreased by nearly a factor of 10, the cost of theenergy they produce is still beyond any reasonablecompetitive range. The present costs of the best solarcells for spacecraft use are $300 to $1,300 per watt (thismust be.compared with $250-300 per kilowatt in fossil ,
fuel andsnuclear reactors) and 3,000 to 13,000 mills* perkw-hr (compared to 6-8 mills per kw-hr from- conven-tional sources). It is clear that reductions of severalhundred-fold in solar, cell cost will be needed to allowtheir serious consideration for any use other than inspace or very remote terrestrial locations.,
There are many who believe these cost reductionscan be achieved, and advance planning for their usecontinues. One of two very different but illustrativeproposals calls for their incorporation into.the roof of a
, residence - now being implemented at the Universityof Delaware. The other would put a large array of solar
*A mill is C.1 cent, or $0.001.
TABLE 7-3Costs of Space Heating (1970 Prices in dollars per million BTU(a) useful delivery**)
Location
Optimized Solar HostingCost in 25,003 BTU/Dailres-day House, Capital Charges
06%, 20 years
Collector (11 Collector$2/ft. $4 per ft.
ElectricHeating,
usage
30,000kw-hr per year(b)
Fuel Heating,Fuel Cost
Only
Gae Oil
Santa Maria 1.10 1.59 4.28 1.52 1.91Albuquerque 1.60 2.32 4.63 0.95 2.44Phoenix 2.05 3.09 5.07 0.85 1.89Offish. 2.45 2.98 3.25 1.12 1.56Boston 2.50 3.02 5.25 1.85 2.03Charleston 2.55 3.56 4.22 1.03 1.83Seattle-Takoma 2.60 3.82 2.29 1.96 2.36Miami 4.05 4.64 4.97 3.01 2.04
Source: R.A. Tybout, and G.O.G. Lof, "Solar House Heating," Natural Resources Journal 10 (2), April 1970, pp. 268-326.pp. 268.326.(6)Heating values are usually given in BTUs. For comparison with other Source Book data remember that 1 Calorie 4 BTU.(b)kwhr kilowatt-hours.
215 211

cells into a synchronous orbit to collectby
convertsolar energy and beam it back to earth by microwave.
There are several interesting features of the Dela-ware house. The roof is ered with transparent panelsthat shield the solar c II collectors. The panels alsocollect heat, which is st edin a "frozen f.-.1!!" reservoir
--Of-the_type we- have d scribed. A ';seat pump!' (seeChapter 3) tiansfere heat_ from f.Ile reservoir to thehouse, or pumps heat from the nouse to cool it. Thisconibination increases the overall efficiency to perhaps60 percent. The solar generators are to be connected toutility- lines. in a two-way arrangement. When they-aregenerating more power than the house needs, it is sentthrough the utility lines and credit is received. When thesolar cells cannot produce enough power, the flow isreversed. Since the solar cells generate maximumpower during the afternoon peak-load period, the sys-tem works to the utility company's advantage in mostinstances. The test of this interconnected system will bewatched with interest.
Central Power StationsAt the other extreme is the proposal by Peter Glaser,
of Arthur D., Little, Inc., to put a large array of solar cellsinto a synchronous orbit about the earth and beam thecollected energy back as microwave radiation. A sketchof the proposed arrangement is shown in Figure 7-3.
The a&antages of the satellite solar array come from itsnearly constant expo,sure to full sunlight. By interceptingthe sunlight before it is reflected by the atmosphere, byremoving .the day-night cycle and avoiding clouds, itcould be expecte,d to receive at least six and maybe as
_much as 1,5 times more energy per square feet than aground location.
Even with this higher level of input power, the size ofthe array, if it is to generate a significant amount ofpower, is impressive. A 10,000 Mw generator wouldneed 25 square miles of solar cells, and these arrays ,
would have to be steered to face the sun. The mi-crowave antenna that beams the power to earth wouldbe a mile on a side, and the receiving microwave arrayon earth would be six miles on a side.
It is clear that the expensive solar cells used inspacecraft presently, that cost $3,000-$13,000 persquare foot, cannot be used in such an array; 25 squaremiles of these solar cells would cost $2 trillion, twice.theUnited States GNP. If the cost can be lowered by afactor of 100 orso by technological breakthroughs andmass production efficiencies, the beaming and receiv-ing of such large amounts of power can be accom-plished efficiently, and with transportation provided atreasonable cost, these satellite stations might becomefeasible. They are now some decades, at least, in ourfuture.
FIGURE 7-3Proposed Satellite Power Station
Sun Solar Collector5 x 5 Miles
Rotary Joints,
ElectricTransinission Line
2 MilesWaste Heat Radiator
Microwiive Antenna1 x 1 Mile
Control Station
CoolingEquipment
Receiving Antenna6 x 6 Miles
Source: Peter E, Glaser, Arthur D. Little, Inc.
212

There is a reasonable hope that less expensive solarcells can be built from materials other than silicon. Cellsbuilt with cadmium show promise. (Cadmium sulfidecells are used in the Delaware solar house.) Dr. K.W.E315er, of the University of }Delaware, believes that thecost of these cells, if made by mass production tech-niques, could be brought below $5,000 per kilowatt.
While we await further reduction in the price of solarcells, we can experiment with another method of obtain-ing electricity from sunlight.
Solar Energy Firms: While the use of large arrays ofsolar cells to convert solar energy to electricity does notappear economically feasible for a decade or so, thereis growing interest in a simpler thermal collector, systemthat may reach the pilot model stage within the nextdecade. The strongest advocates of this plan are ahusband and wife team, the Meinels of the University ofArizona. They propose to trap and focus solar radiationby rows of transparent collectors, pump the heat to acentral plant, generate steam, and produce electricity inthe conventional manner. An artist's conception of thecollector array on a "solar farm" is shown in Figure 7-4.Sodium, a proposed heat transfer material, would beliquified by the heat, and conceivably temperaturescould reach as high as 1,000°F.
The heart of the system is the collector shown inFigure 7-4. The liquid sodium, which will carry the heat
energy to the generating plant, is enclosed in a pipe thathas a very efficient absorbent coating on it. To increasethe amount of energy collected, there is a curved mirrorunder the pipe that focuses sunlight on the pipe. All thisis enclosed in a vacuum to reduce heat leakage.
The rest of the system is fairly standard. The heatedmaterial in the pipe flows to a storage tank (which hasenough capacity to last through a couple of cloudy days)and then generates steam for the turbine. The overallsystem efficiency expected by the Meinels for their"Early" system is 14 percent and the "Mature" sys-tem, 28 percent. The near 30 percent efficiency of the"Mature" system compares very favorably with conven-tional electric generating efficiency.
To produce half the 10 B Mw-hr (which is the highprojection of Chapter 4 for the consumption of electricenergy in the year 2000), 10,000 square miles of landwill be needed. That is a parcel of land 100 miles on aside. This is a lot of land, but distributed through the six toeight "Sunshine states" the total impact would not beoverwhelming. The Meinels call their system a solarfarm to emphasize the compa;igon between setting landaside to convert solar energy to food energy, and theirplanned,conversion to electricity. Since some 500,000square miles of land are now set aside to grow food (atless than 1 percent efficiency), which only provides 1percent of our total energy consumption, the compari-son makes its point.
FIGURE 7-4Solar-Farm
-.+,...o... Via, , ;J. 4y .---' \_......it- ':-:-.=L L,_....-- :..--,..1-.0-1;%$4...,.._,ti' ..f. ---n aMBEL4--.7"... ..-r'r''4:.'-''.....,05wai....,:44... -e. 1
_ n . ... -., _ -l- A
I ;
11% :11...4yt, - *.
Source: "Solar Energy," Arthur R. Tamplin, Environment, 15, #5, June 1973.
01 7i 213

As we have said, solar energy enjoys a big advantageover most other forms. It can be used without unbalanc-ing natural cycles. The solar farm makes the pointbeautifully. Under normal circumstances, the desert ab-sorbs about 65 percent of the incident Sunlight andreflects the remaining 35 percent. With the collectors inplace, 95 percent of the incident radiation is absorbed,but 30 percent of this (the generated electricity) istransmitted to other areas, and the remaining 65 per-cent is returned as leftover heat. Thus the local balanceremains the same. We should also point out that thesame potential uses of leftover heat exist for the solarplant as for any other thermal plant desalination ofwater is one suggested use.
Tre Meinels have received some National_ScienceFoundation research support to study the technicalproblems associated with such preliminary matters asthe absorbing coatings. They are hopeful of forming alarge group to begin planning and constructing a pro-totype plant that will show that their estimate of 5 to 6 Mkw-hr eleCtricity is within the range of possibility by themid-1980s. They may well have started us on the wayto much more efficient farming of the sun's free energy.
The Sea as Solar CollectorThe problem in utilizing solar energy on a large scale
is that massive collection areas are needed. A crowdedworld may not be able to spare enough land area forsuch use. It is natural, therefore, to turn toward seas,whose surfaces we put to minimal use. <,
Since the seas are warmed from the top rather thanfrom the bottom, they do not have the strong verticalmixing currents characteristic of the atmosphere. Their"winds" are the gentle currents like the Gulf Stream. Asa result there are significant temperature differencesbetween the surface and the deeper layers. In tropicalregions this difference may be as high as 20°C (36°F)between surface and 1,000-foot level. It is possible toconceive of a heat engine operating on this difference.
_In order to operate at such a low temperature, a solarsea plant would have to employ some low boiling pointliquid, such as ammonia, as the working fluid. The smalltemperature difference would, of course, set a smallupper limit, perhaps 5 percent, on the thermal efficiency(since Tin is almost equal to Tqut in the efficiency equa-tion), and practical efficiencies of 2 to 3 percent are allthat can be actually expected. ,
The operation of the power plant is Similar to thesteam plant. Cool ammonia liquid at relatively highpressure is pumped to the surface region and is warmedby surface water flowing through a heat exchanger,becoming a high-pressure vapor that can turn a turbine.The vapor, now at a somewhat cooler temperature, ispumped back down to the condenser, where thecooler water.condenses it to the liquid state.
The solar sea power plant has several theoreticaladvantages. Neither high temperatures nor pressuresale encountered. In fact, the hydrostatic pressure of thesea water could be used to balance the pressure in that,
214
boiler :-.nd condenser. The resulting system could con-ceivably have routine maintenance performed while it isrunning. .)
The problem of energy storage or transmission couldbe solved, it is suggested, by using electricity toelectrolyse water with the resulting hydro en and ox-ygen shipped or piped to shore. By condu ng the elec-trolysis at great depths, the gases coy be producedand stored under pressure, thus a'm' ating the cost ofcompressors.
.
the energy reservoir. It is :estimated that the ulf,
The largest advantage is, of course, the enor of
Stream, which brushes the Florida coast, could prpvide182 B kw-hr of electric energy 75 times the expectedUnited States demand by 1980. A group at theUniver-sity of Massachusetts is presently preparing and seek-ing preliminary support for a 400 Mw solar plant to belocated about 15 miles offshore from Miami.
Solar sea plants could provide other useful productsin addition to power. Sea life might blossom in thenutrient-rich cold water pumped to the surface. gn-vironmental effects seem to be potentially benign also.Since the heat transferred from the warm surface to thedeeper layers will be replaced by more solar absorptionat the surface, the net effect would be a slight overallwarming.
In spite of the size of the resource, and the-optimisticpredictions of cost ($165 per kw or 3 mills per kw-hr),there has been no appreciable funding of research inthis area. It may well be that the first step will be todevelop the techniques of low-temperature turbines,which are crucial to the success of these plants. Suchturbines are also useful as "bottoming cycles" on con-ventional plants and in the development of the lowertemperature geothermal sources. The proposals forsolar sea power currently in the literature may be, aswas the similar proposal by the French physicist,D'Arsonval, in 1881, "before their time." Mg largethermal reservoir of the ocean, however, will continue toattract the attention of energy seekers.
FusionThe Big IfThe confluence of increasing demand and finite m-
esoi4rcespat we have pictured lemies us with uncertainprospects of an energetic future only the breederreactors give promise of fuel for as long as thousands ofyears. We have seen in this chapter that there are somepromising technologies that may, sometime within thenext 5 to 30 years, enable us to stretch the fossil fuelsupplies and even tap into some of the energy that iscontinuously supplied to earth. Solar energy is the big"if" of the continuous sources. There is an equally big'if" among the depletable sources that we have not yetdiscussed the fusion reaction that would tap thenuclear energy of light nuclei. An understanding of thesource of this energy begins with the plot of "bindingenergy per nucleon" vs "mass number" of TechnicalAppendix 6. As we point out in that discussion energyis released when two light nuclei combineuse to form a heavler one. The most productive

nuclear reactions of this type are expected to be reac-tions involving the "isotope" of hydrogen deUterium(H2), which has a neutron as well as a proton in itsnucleus, and a radioactive form of hydrogen calledtritium (H3), which has two neutrons and a proton. Thereare several nuclear reactions (rearrangements of theparticles within the nucleus) involving these hydrogennuclei that release significant amounts of energy.
The fusion reaction has..several advantages as anenergy- producing reaction. First, the radioactivity re-lease is much less serious than it is in ftssion; only tritiumamong all the participating nuclei is radioactive. Sec-ond, the fuels (isotopes of hydrogen) are very plentiful,since hydrogen is the most abundant element. Eventhough deuterium is a rate form of hydrogen (only oneout of each 6,000 hydrogen atoms will be in the form ofH2), the sea is a potentially huge source. If we can makethese nuclear reactions work, then one cubic kilometerof sea water has energy content greater than all thefossil fuels on earth. Said in another way, the deuteriumcontent of the oceans (only 1/6,000 of their water) canprovide. the energy equivalent that the oceans wouldprovide if they were filled with gasoline and 300 timesas large. Here is energy potential stretching into ourdistant-.future. That's the good news.
The bad news, is that we have not mastered thisreaction in spite of $40p million in research funds spentduring the past 25 years in the United States and $1billion in the world. The prOblem is not inpOtaining puredeuterium; it is relatively easy to separate H2 fromsince one is twice as heavy as the other. The problem isiri bring4 deuterium nuclei together closely enough tomake them stick; that is, closely enough to let the veryshort-range nuclear forces take over. Since the nucleiare electrically charged, they normally repel each other.To force them together takes energy; they have to climban electric hill, so to speak. The only practical way togive a large number of nuclei such energies Is to heatthem. But there is the catch; in order to assure that asufficient number of nuclei have enough energy. tocause fusion, the sample of deuterium must be at atemperature of at least 50 million° C, hotter than thetemperature at the-center of the sun. The only success-ful heating to that scale that we,have so far achievedwas by exploding the A-bomb and in this way triggeringthe fusion reaction of the H-bomb. This method inlarge-scale use would provide a solution of sorts to ourenergy crisis but not a very humahe one.
The scope of the problem becomes clearer. Toachieve fusion, solid deuterium or deuterium gas at anappreciable density muss be held in a container andheated to temperatures at which any container will va-porize. Thus, means must be found to achieve this heat-ing of deuterium, and yet keep it out of thermal contactwith its container. There are two ways that this problemis being approached, by magnetic confinement and bylaser bombardment.
There are several approaches using magnetic con-finement undergoing active experimentation. In these
91911fv*
processes the deuterium gas is decomposed into a"gas" of charged particles, a "plasma." The energy toaccomplish this is provided in several ways, usually bycausing a large electric current to flow throug h_the gas.Charged particles can be controlleAby_magnetic fields.Several diffe,rent magnetic field sh*Ts are being tried,a doughnut shape (the torus), a straight pipe withmagnetic fields that turrithe particles around at the ends(the "magnetic mirror"), and a pulsed field that tries tobring everything together at once with a single largeburst of magnetic fields (the "theta pinch").
There are three parameters which must be controlledto make fusion work: the temperature, the density, andthe confinement time. The deuterium has to be hotenough, dense enough, and hang together longenough, to produce a self-sustaining fusion reaction. Acrude measure of feasibility is provided by the so-called"Lawson criterion," which predicts that for a deuterium-tritium fuel mixture heated above the ignition tempera-ture (50 million°C), the product of the density and pres-sure must be at least 'IV seconds- fuel ions per cubiccentimeter. Breaking this down, the rough criteria arethat densities i;)f 1014 - 1015 fuel ions (corresponding topressures of one ten-thousandth or one hundred-thousandth of atmocpheric pressure) must beheld to-gether for 0.1 - 1 second. yVhil? each of the three targetvalues of temperature, density, and confinement timehas been separately reached, no tingle experimenthas yet been able to put them all together. The closestcontender so far is one of the "doughnut" machines, the,ST Toko.naft, an American adaptation of a Russian de-vice. This machine has achieved a time-density productof 3 to 6 x 10¹¹ (but at a temperature well below igni-tion). It is expected, however, that the Tokomak princi-ple will produce a successful controlled fusion reactionwhen larger machines are tested in the late 1980s.
Achievement .of the necessary' temperatures, den-sities, and .pressures will demonstrate scientific feasi-bility, beyond that is the uncertainty, of engineer-ing feasibility. But before we explore that region, wemust mention the second apprpach to fusion, laserbombardment.
Laser Fusion
In this approach, the problems of density and con-finement time are to be circumvented by bombarding asmall pellet (about one millimeter in diameter) of frozendeuterium-tritium (frozen fat 20° above absolute zero)with an energetic laser beam. The pulse of energy fromthe laser is to be poured into the pellet so quickly that itsinertia holds it together while it heats to fusion ignitibrrtemperatures.
The laser fusion arrangement is shown schematicallyin Figure 7-5. The target pellets drop one by one into achamber and are struck by a focused pulse of laserenergy. Each pellet heats rapidly, fusion occurs, and thepellet explodes with the force of 500 pounds of TNT. Theamount of laser energy needed and the problems ofholding the pellet together are minimized if laser beams
(215

are broken up by a series of mirrors and focused on thepellet from all sides. This technique produces an "im-plosion," greatly increasing the pressures and tempera-
-tures in the interior of the pellet.The explosion products fly out until they strike the
walls of the chamber, where their kinetic energy is con-verted to thermal energy that can beused to generatesteam. The implementation of this process faces sev-,eral difficulties. The.construction of a chamber that canhold up under steady explosions is one of them. Laserp6wer is a second requirement. We have no laserscapable of the necessary power at present. A furtherproblem is the cost of the pellet. Since each explosionwill release energy, which when converted to electricityis only worth about 1 cent, extremely inexpensivemeans orpellet fabrication must be found.
Laser fusion, in its infancy, has generated much en-thusiasm and greatly increased research support. Itsproponents see it as providing power sources of conve-niently small size 50-1.00 Mw of electriogeneratingcapacity' -- allowing dispersion to industry, use in shippropulsion, and providing on-site power for urban areas.Its detractors don't believe it can be made to Work. Theandwers may come first from the U.S.S.R., where anew, more powerful laser may be the first to cause thistype of fusion to occur.
Fusion Power Plants
It is conceivable that scientific feasibility of the fusionreactor may be demonstrated in the 1980s. The prob-lems, however, will be only beginning. While the"fusionprocess does not have the huge radioactive inventory offission to deal with, it has a new problem, high-energyneutrons. The large fluxes of these neutrons will causestructural damage, the seriousness of which is difficult
FIGURE 7-5Laser-Fusion Power Generator
Laser
LaserPowerInpuf
Shutter
'Blest'ConfinementDevice
Capsule
"Factory"
Energy
Converter
Power Output
Source. Briefings, ask Force on Energy, Subcommittee onScience, Research and Development, Committee onScience and Astronautics, U.S. House of Representatives,Serial M, 1971 p.47.
218
to estimate. It is feared, however', that it may be impos-sible to find materials that will stand Up under them longenough to make commercial operation practical.
The large magnetic fields required will also be a prob-lem; they will probably have to be provided by super-conducting magnets operating at near liquid heliumtemperatures. Thus the reactor will be 100 M degrees atits center and a few meters away will need to benearabsolute zero. The magnets will else have to beshielded from neutrons.
As we have earlier suggested,-the only-fusion reac-tion in use for a considerable time will probably be theone using tritium. This also poses problems. Tritium will,no doubt, be bred from lithium by fast neutrons. Thereacting chamber will probably be surrounded bylithium, liquified by the heat. The tritium created byneutron bombardment is pumped from the lithium to beused as a fuel, and the hot lithium creates the steam fora generator.
There are some drawbacks to reliance on the H2 + H3reaction that requires lithium for the production of H3.Lithium is not a plentiful material; proved lithium re-sources (reserves) would only provide energy equal tothat available_frem all the, fossil fuels. There has, how-ever, been no intensive search for lithium, and the avail-able resources are probably great enough to power usfor least thousands of years.
Fusion reactors might be used to increase our energysupplies in a different way. The existence of the largeflux of high-energy neutrons might eventually make itpossible for the "breeder reactions" using U238 andTh232, which we have mentioned, to take place, and thusallow the fusion reactors to supersede the controversialbreeder reactors as a source of fissile materials for lightwater reactors.
Because of the high temperature of the steam pro-duced, the fusion reactor could be very efficient, 50-60percent. Since in the H2 + H3 reaction the products arecharged particles, it may also be possible to separatethem in a weak magnetic field that covers a large area ina fashion similar to that used in the magnetohy,drodynamic generator (MHD). This direct conversion ofkinetic energy to electric energy would be even moreefficient, perhaps approaching 80 percent.
When?
Within three years after the discovery t at U235 couldproduce a chain reaction, Fermi and hiS c (leagues haddemonstrated one in apile of graphite blo ks under theUniversity Of Chicago's football field, Stagg Stadium. Ithas now been more than 20-years that the physicsfusion has been well understood, but its "Stagg:Stadium" has not yet occurredFor this reason,prophecylsdubious. It does appear, however, that theincrease in research support that the energy crisis hasstimulated will allow the construction of biggermachines, and tilat from one or more of them we willobtain evidence of scientific feasibility sometime beforethe mid-1980s. As we have said, however, achieving
t
,scientific4easipility is the equivalent of getting our headsabove water;the long swim to shore is still ahead:
We are accustomed in this exploSive century to see-ing all .dreams come true. Any, idea that is conceivablecan eventually, through genius and the magic of money,be implemented. One has to be reminded from time toMile that the inevitability.of progress from conception tocommercial realization is a belief, not a law of nature.The engineering difficulties, on whose solution thecommercial future of fusion waits, are enormous."Theoptimists confidently predict pilot plants by 100, thepessimists warn us that-this future may.never come.
Sum Mary
in this chapter we have examined some of the poten-tial energy sources that may make energy again abun-dant. There are only two sources of a size not dwarfedby our rapidly expanding consumption, solar energyand energy frbm the fusion of hydrogen isotopea.
Solar energy is, of course, the major source of earth'senergy, at present providing food and -fuel, and thesecondary sources of water and wind power. The size ofthis source and its daiiy delivery are 'causing us to turnmore directly to it. There are no technological barriers tothe immediate employment of solar energy for home
,heating and cooling, and the new energy situationshould cause rapid advances in that area. Large-scaleconversion of solar energy to electric energy waits onthe development of more economical solar cells and onthe mastering of the complexity of large-scale collectionand thermal conversion.
There are other continuous sources that are begin-ning to attract attention and of these, geothermal energyand improved use of photosynthetic energy show themost promise. Both of these are potentially benign en-vironmentally and some of the proposals for improvedphotosynthesis, thoSe which Use organic waste as fuel,hold out the promise of mitigatingother environmentalproblems as well.
Some of the other continuous sources could makelarge contributions. However, at present there is littleevidence,of .concrete interest in wind power or in solarsea power, which need exotic technology to realizetheir potential.
The other "Big If" is fusion power, which could drawits fuel from the sea and cater to our needs for hun-dreds of thousands of years. The difficulties of this"If" are technological: it has not yet been possible to_hold enough deuterium togethedong-enough aTid get ithot enough. The optimiSTSTook to the demonstration ofscientific feasibility by the mid-1980s, but it is clear.thateven in such an optimittic view, fusion reactors will notMatte much of a contribution to our 20th-century needs.'
The visions that are put forward in Chapter 7 have,perhaps, lifted some of the gloom that has been growingthroughout the book. There is hope for the future. Noneof these techniques, or sources offers. immediate reliefto our present desperate state,- but they do give us in-centive to attack the problems of the present withdetermination and optimism.
217
0

44-
ENERGY-ENVIRONMENTSOURCE BOOK
TechnicalAppendices
1;

APPENDIX 1Glossary
9r).2
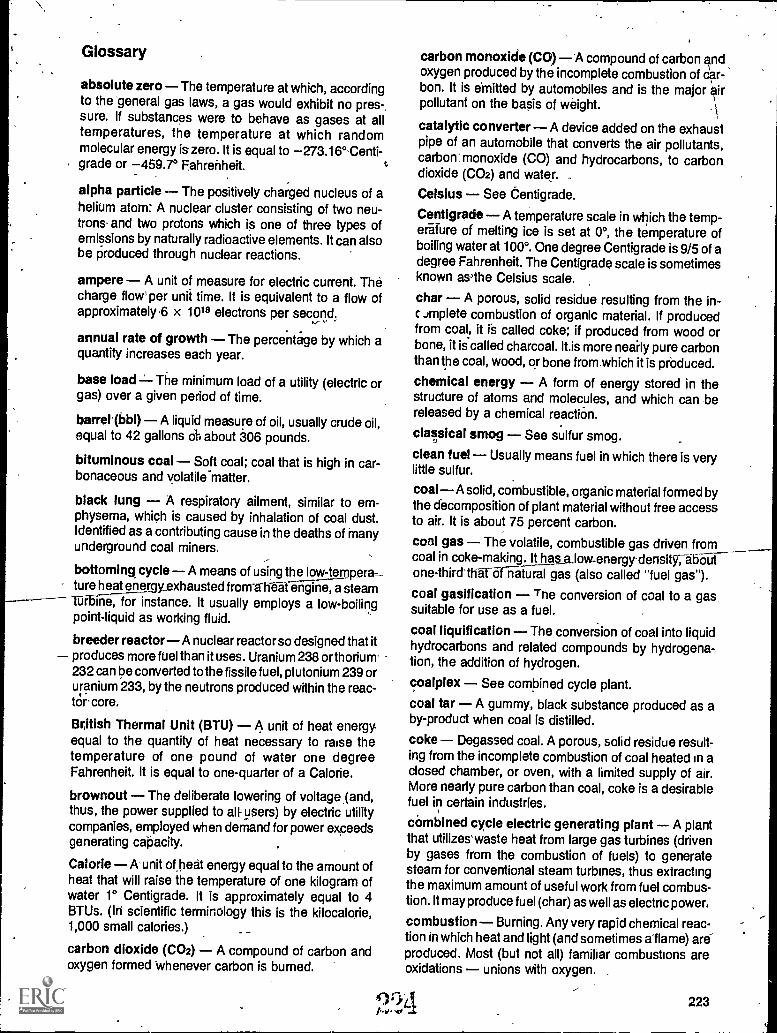
Glossary
absolute zero The temperature at which, accordingto the general gas laws, a gas would exhibit no pres-,sure. If substances were to behave as gases at alltemperatures, the temperature at which randommolecular energy is zero. It is equal to 273.16°-Centi-grade or 459.7° Fahrenheit.
alpha particle The positively charged nucleus of ahelium atom: A nuclear cluster consisting of two neu-trons' and two protons which is one of three types ofemissions by naturally radioactive elements. It can alsobe produced through nuclear reactions.
ampere A unit of measure for electric current. Thecharge flow' per unit time. It is equivalent to a flow ofapproximately 6 x 10¹⁸ electrons per second.,
annual rate of growth The percentage by which aquantity increases each year.
base load -- The minimum load of a utility (electric orgas) over a given period of time.
barrellbbl) A liquid measure of oil, usually crude oil,equal to 42 gallons o1 about 306 pounds.
bituminous coal Soft coal; coal that is high in car-bonaceous and volatile matter.
black lung A respiratory ailment, similar to em-physema, which is caused by inhalation of coal dust.Identified as a contributing cause in the deaths of manyunderground coal miners.
bottoming cycle A means of using the low-temperatureheat energy_exhausted from -a-rat engine, a steam
-turbine, for instance. It usually employs a low-boilingpoint-liquid as working fluid.
breeder reactor A nuclear reactor so designed that itproduces more fuel than it uses. Uranium 238 or thorium-232 can be converted to the fissile fuel, plutonium 239 oruranium 233, by the neutrons produced within the reac-.tor. core.
British Thermal Unit (BTU) A unit of heat energyequal to the quantity of heat necessary to raise thetemperature of one pound of water one degreeFahrenheit. It is equal to one-quarter of a Calorie.
brownout The deliberate lowering of voltage (and,thus, the power supplied to all-users) by electric utilitycompanies, employed when demand for power exceedsgenerating capacity.
Calorie A- unit of,heat energy equal to the amount ofheat that will raise the temperature of one kilogram ofwater 1° Centigrade. It is approximately equal to 4BTUs. (In scientific terminology this is the kilocalorie,1,000 small calories.)
carbon dioxide (CO2) A compound of carbon andoxygen formed -whenever carbon is burned.
carbon monoxide (C0)'A compound of carbon andoxygen produced by the incomplete combustion of car-bon. It is emitted by automobiles and is the major airpollutant on the basis of weight.
catalytic converter A device added on the exhaustpipe of an automobile that converts the air pollutants,carbon- monoxide (CO) and hydrocarbons, to carbondioxide (CO2) and water.
Celsius See Centigrade.
Centigrade A temperature scale in which the temp-erature of melting ice is set at 0°, the temperature ofboiling water at 100°. One degree Centigrade is 9/5 of adegree Fahrenheit. The Centigrade scale is sometimesknown asJthe Celsius scale.
char A porous, solid residue resulting from the in-t Jmplete combustion of organic material. If producedfrom coal, it is called coke; if produced from wood orbone, it is called charcoal. Itis more nearly pure carbonthan the coal, wood, or bone from.which it is prbduced.
chemical energy A form of energy stored in thestructure of atoms and molecules, and which can bereleased by a chemical reaction.
classical smog See sulfur smog.
clean fuel Usually means fuel in which there is verylittle sulfur.
coalA solid, combustible, organic material formed bythe decomposition of plant material without free accessto air. It is about 75 percent carbon.
coal gas The volatile, combustible gas driven fromcoal in coke-making. It has.alow energy-densIty;aboa-one-thirdtraTernitural gas (also called "fuel gas").coal gasification Tne conversion of coal to a gassuitable for use as a fuel.
coal liquification The conversion of coal into liquidhydrocarbons and related compounds by hydrogena-tion, the addition of hydrogen.
coalplex See combined cycle plant.
coal tar A gummy, black substance produced as aby-product when coal is distilled.
coke Degassed coal. A porous, solid residue result-ing from the incomplete combustion of coal heated in aclosed chamber, or oven, with a limited supply of air.More nearly pure carbon than coal, coke is a desirablefuel in certain industries.
combined cycle electric generating plant A plantthat utilizes' waste heat from large gas turbines (drivenby gases from the combustion of fuels) to generatesteam for conventional steam turbines, thus extractingthe maximum amount of useful work from fuel combus-tion. It may produce fuel (char) as well as electric power,
combustion Burning. Any very rapid chemical reac-tion in which heat and light (and sometimes aflame) areproduced. Most (but not all) familiar combustions areoxidations unions with oxygen.
gc>4 223

comfort energy Any form of energy whose end useis the heating, and cooling of buildings and homes.
conduction The transmission of energy directly frommolecule to molecule.
convection The transfer of energy by moving mass-es of matter, such as the circulation of a liquid or gas.
conversion process A process by which energy isconverted from one form to another, such as radiantenergy to heat or electric energy.
cooling towers Devices for cooling power plants.There are two types: wet towers, in which the warmwater is allowed to run over a lattice at the base of atower and is cooled by evaporation; and dry-towers, inwhich the water runs ,through a system of cooling finsand is not in contact with the air.
cord of wood A stack of wood 4 feet by 4 feetby 8feet. Burned, it produces approximately 5 millionCalories of energy.
cracking Processing that breaks down and rear-ranges the molecular structure of long hydrocarbonchains in ways that produce lighter hydrocarbons fromheavier ones. It is used in the production of volatile fuels,such as gasoline, from crude oil.
work or energy outE X -100 percent
work or energy in
electric current A flow of charged particles, usuallyelectrons (see below).
electron An elementary particle with a negativecharge that orbits the nucleus of an atom. Its mass atrest is approximately x 10-28gram, and it composesonly a tiny fraction of the mass of an atom. Chemicalreactions consist of the transfer and rearrangement ofelectrons between atoms.
electrostatic precipitator A device that removes thebulk of particulate matter from the exhaust of powerplants. Particles are attracted to electrically chargedplates and the accumulation can then be washed away;
energy A quantity having the dimensions of a forcetimes a distance which is conserved in,.all interactionswithin a closed system. It exists in many forms and canbe converted from one form to another. Common unitsare Calories, joules, BTUs and kilowatt-hours.
energy density Energy per unit of weight containedin a fuel.
energy intensiveness (El) A measure of energycrude oil A mixture of hydrocarbons in liquid form utilization. For passenger transport, for example, it is a
found in natural underground petroleum reservoirs. It is measure of Calories used per passenger mile.the raw material from which most refined petroleum environmental impact statement Analytical state-products are made. ments that attempt to balance os:itseod_benefits-of-----declining block rates A rate structure in which the_ as well as economicjame_for.energy-decreasevaalhe arnT:itirit consumed, point of view.
exponential growth Growth for which the percen-tage increase for a given time interval is constant. Ifsuch growth is plotted on a semilogarithmic graph, inwhich the vertical axis represents the logarithms of thenumbers rather than the numbers themselves, the ex-ponential curve becomes a straight line. A savings ac-count at compound interest is a familiar example.
Fahrenheit A temperature scale in which the tem-perature of melting ice is set as 32° and the temperatureof boiling water as 212°. One Fahrenheit degree is equalto five-ninths of a Centigrade degree.
fermentation ;,A process in which carbohydrates arechanged to hydrocarbons by the action of microor-ganisms.
increases.
depletion allowance A Federal tax exemption kr aportion of the net income received from producing anatural resource. The amount of the exemption is basedon the perceived importance of the energy resource.For oil, gas, and uranium, 22 percent of the income ispresently exempted.
deuterium A hydrogen isotope, the nucleus of whichcontains one proton and- one neutron. (Ordinary hy-drogen atoms have only a proton in the nucleus.) About0.0164 percent of hydrogen occurs naturally asdeuterium, which is expected to be the priMary fuel forfusion power plants.
distillate oils Any fuel oil, gas oil, topped crude oil orother petroleum oil derived by refining or processingcrude oil or unfinished oils, which has a boiling range atatmospheric pressure from 550 to 1,200°F. Distillateoils account for 25-30 percent of refined petroleum
'products.
doubling ime The time it takes for a quantity todouble.
dry steam Steam so hot that.no water droplets aremixed with it.
efficiency The efficiency of an energy conversion isthe ratio of the useful work or energy output to the workor energy input.
224 ref: ri
First Law of Thermodynamics Also called the Lawof Conservation of Energy. It states. Energy can neitherbe created nor destroyed.
fission The splitting of heavy nuclei into two parts(which are lighter nuclei), with the release of largeamounts of energy and one or more neutrons. Theemitted neutrons can be absorbed by and initiate fis-sion in other, similar, nearby nuclei, thus producing achain reaction.
fluidized bed A furnace design in which the fuel isbuoyed up by air or some other gas. It offers advantagesin the removal of sulfur during combustion.
t

force Intuitively, a "push or pull." Operationally, anon-zero force is defined by the relation f = ma where f
pis the force, m Is the, mass, and a is the acceleration ofthe object. More accurately, the rate of change ofmomentum of the object
fossil fuels= Any naturally occurring fuel such as coal,-crude oil, or natural gas, formed from the fossil remainsof-i*anic materialfuel Any substanc that can beumed to produceheat. Sometimes includes materials that- can -be fis-sioned in a chain reaction 'to produce heat
fuel cell A device for combining fuel and oxygen in anelectrochemical reaction to generate electricity. Chem-ical energy Is converted directly into electric energywithout combustion.
fuel gas See-coal gas.
fuel mix.1 The percentages of various fuels thatmakeup total fuel consumption:
final reprocessing A recycling operation. Fissiona-ble uranium and plutonium arerecOvered from uraniumfuel rods which ha e_undergone-intense-aiii nnifbom-
-bait rri"TeAin a nuclear reactor.
fusion The formation of a heavier nucleus from twolighter ones, such as hydrogen isotopes, with an atten-dant release of energy. The mass of the new, heayier_nucleus is lesathan the combined manses of the originalnuclei; the lost mass appears as energy.
gasoline A refined petroleum distillate composedprimarily of light-hydrocarbons. Since light hydrocar-bons are -a relatively small percentage of crude pe-troleum, most gasoline Is produced-by refining ("crack-ing") crude oll. Gasoline has a boiling range at atmos,pheric pressure from 80°F to 400°F.
generator A device which produces electric energyfrom mechanical energy.
geothermal energy The heat energy in the earth'scrust whose source is the earth's molten interior. Whenthis energy occurs as steam, it can be used directly insteam turbines. .
gravitational energy The energy of attraction be-tween two material bodies. Gravitational force is directlyproportional to the product of the masses of the twobodies and inversely proportional to the square of thedistance between their centers.
greenhouse effect The warming effect of carbondioxide, CO2, In the atmosphere. CO2 is transparent toincoming sunlight but absorbs and reradiates thy in-frared (heat) radiation from earth.
Gross National Product .(GNP) A measure ofeconomic activity. GNP is the total market value of allgoods' and services produced in a country. Depreciationand other allowances for capital consumption are notdeducted.
half -life The half-life of a radioactive element is thetime it takes for one-half of a given amount to decay into
another element. After two half-lives,. one-fotirth of theamount remains; after three half- lives, one-eighth re-mains, etc.
heat A form of kinetic energy that flows from onebody to another' because of a-temperature differencebetween them. The effects of heat result from the mo-tion of molecules. Heat is usually measured In Caloriesor British Thermal 'Units (BTU).
heat- engine Any device that- converts heat energyinto-mechanical energy.
heat pumpA device that transfers heat frorri a coolerregion to a warmer one by the expenditure of mechanl-cat or electric energy. Heat pumps work on the samegeneral principle as refrigerators and air-conditioners,but are reversible and can pump outside heat into warmor inside heat out to cool.
heat tax The heat energy that becomes unavailablefor further use whenever energyis converted from oneform to another. (See also the Second Law of Ther-modynamics.)
eavy waterWater in which all hydrogen atoms havebeen replaced by deuterium. It ismseetas a ehoderator insome nuclear power plants.
high temperature gas reactor (HIGRI-ucleamactor_whIch-differsfroarlight water reactors in havinggraphite as a moderator and helium as a coolant. Al-though not primarily a breeder reactor, thorium 232 canbe added to the core and converted into uranium 233which Is -a reactor fuel.
horsepower (hp) A standard unit of power equal to746 watts.
hydrocarbons Molecules composed of carbon andhydrogen atoms in various proportions. They are usu-ally-derivea from living materials.
hydroelectric plant An electric power plant in whichthe energy of falling water is converted into electricity byturning a turbine generator.
hydropower Power produced by falling water.
Import quota Government-set limits on the importa-tion of foreign products,
indirect energy Any form of energy used in themanufacture of goods or provision of services whichthemselves may or may not use energy.
Intermediate energy forms Energy in transit from itsnatural form to the form in whidh it is useful. For exam-ple, energy of coal or falling water (the primary energyform) is converted to electricity (the intermediate form)which in turn is converted to heat energy (the final form)in a radiator.
in situ In the natural or original position or location. Insitu production of oil shale, for instance, is an experi-mental technique in which a region of shale is drilled,fractured, and set on fire. The volatile gases burn off, theoil vaporizes, then condenses and collects at the bottomof the region, from which it can be recovered by a well.
9'3'6se+ 225

There also has been some experimentation with in situconversion of coal.
ionization Removal of some or all electrons from anatOm, leaving the atom with a positive charge, or theaddition of one or more electrons, resulting in a negativecharge.
IsotopeAny of two or more species of atomshavingthe same number of protons in the nucleus (or the sameatomic number) but with differing numbers of neutrons.All isotopes -of -an element-have the same number ofelectrons and have identical chemical properties, butthe different nuclear masses produce slightly differingphysical properties. Since nuclear stability is governedby nuclear mass, one or more isotopes of an element
may be radioactive or fissionable, while other isotopesof the same element may be stable. In the usual notationisotopes of the same element are identified by the totalof neutrons and protons in the nucleus, for example,uranium 235 and uranium 238._ _
joule A metric unit of work or energy; the energyproduced by a force,Of one newton operating through adistance of one meter.kerosene or kerosine A mixture of hydrocarbonsobtained .by the fractional-distillation-orgetroleumirieused as a fuel for jet engines andgas turbines. It con-sists of slightly heavier hydrocarbons than are found ingasoline and naphtha.
kilowatt (kw) A unit of power, usually used for elec-tric power, equal to 1,000 watts, or to energy consump-tion at a rate of 1,000 joules per second.kilowatt-hour (kw-hr) A unit of work or energy equalto that expended by one kilowatt in one hour. It is equiv-alent to about 853 Calories of heat energy.
kinetic energyThe energy of motion; the ability of anobject to do work because of its motion.
laser A device that can produce high-intensity, co-herent radiation. Coherent radiation or light is producedwhen the atoms or molecules in a material are forced toradiate at the same time, in step with one another, ratherthan randomly and independently as in a normal light.bulb.
Law of Conservation of Energy See First Law ofThermodynamics.
life cycle costs The cost of an item year by year,including initial purchase price as well as cost of opera-tion, maintenance,' etc. over the life of the item
light Electromagnetic radiation which can affect theeye. The portion of the electromagnetic spectrum con-sidered visible light is wave lengths from approximately430 millimicrons to 690 millimicrons. (1 millimicron10-9 meter.)
light wafer reactor (LWR) /Nuclear reactor inwhich water is the primary cooant/moderator. Theypresently use slightly enriched uranium 235 as fuel
which fission is caused by fast neutrons. It uses uranium235 or 'plutonium 239 as fuel an q produces additionalplutonium 239 from the uraniuth 238 in a "blanket"around the reactor core.
liquified natural gas (LNG) Natural gas that hasbeen cooled to approximately 160°C, a temperature atwhich it is a liquid. Since liquification greatIeduces thevolume of the gas, the costs of storage and shipmentare reduced.
load factors The percentage of capacity actuallycarried. For example, the average number of passen-gers for a certain size car divided by the passengercapacity of that size car would equal the load factor.
long wall mining A technique in which an armoredmining machine progresses into a seam and allows theceiling to collapse behind it. This eliminates theneces-sity of leaving coal behind as pillars, thus substantiallyincreasing the recovery factor,
urgi proCess A coal gasification process de-veloped in Germany and already in commercial use inEurope. It produces a gas of somewhat lower heat valuethan natural gas.
-magma =Moften rock within the e interior.
magnetohydrodynamic (MHD) generator n ex-pansion engine in which electricity is generated from thecombustion of fuels without going through an inter-mediary steam turbine. Hot, partially ionized gasesmove through a magnetic field, generating a current thatis then collected by electrodes lining the expansion,chambers.
marginal cost pricing The basing of price on thecost of the last unit produced.
mechanical energy One form of energy. It is ob-serVable as the motion of an object.
megiwatt (mw) A unit of power. A megawatt equals1,000 kilowatts, or 1 million watts.
microwave Electromagnetic radiation withwavelengths of a few centimeters. It falls between in-frared and radio wavelengths on the electromagneticspectrum.
mine acids Acid;;, usually a sulfuric acid formed bythe action of water on sulfur left over from coal miningoperations.
mine mouth plant An electric generating plant lo-cated at the source of coal and relying on high voltagetransmission lines to carry the electricity to distant loadareas.
moderator A material used in a nuclear reactor toslow the speed of neutrons and thus control the rate offission. Common moderators are graphite, water,deuterium, and beryllium.
moleculeAtoms combined to form the smallest rec-ognizable unit of a substance. For example, the water
liquid metal fast breeder .reactor (LMFRR) A molecule is composed of two atoms of hydrogen andnuclear breeder reactor cooled by molten sodium in one atom of oxygen.
226 p.. r

natural gas A naturally occurring mixture of hy-drocarbons found in porous geologic formations underthe earth's surface, often in association with petroletim.It is almost pure methane, CH4, but also contains smallamounts of various more complex, hydrocarbons.
natural gas liquid CompOnents of natural gaswhich'are liquid at room temperature but become gasesat slightly higher temperatures. Propane and butane areexamples.
neutronAn elementary particle which is present in allatomic nuclei except for the most common isotope ofhydrogen'. Its mass is approximately that of a proton, butit has no electric charge. Neutrons are released in fis-sion and fusion reactions.
nuclear energy The energy released during reacttions of ,atomic nuclei.
nuclear reactor A device in which a fission chainreaction can be initiated, maintained, and controlled. ltsessential component is, a core, with fissionable,fuel; Itusually has a moderator, shielding, coolant, and controlmechanisms.
nucleus The extremely dense, positively chargEdcore of an atom. It contains almost the entire mass,of anatom, but fills only a tiny fraction of the atomic volume.
"off-peak" power Power generated during a/periodof low demand.
oil import quota See import quota.
oil depletion allowance See depletion allowance.
oif shale A sedimentary, rock containing a solid or-gartitMaterial called kerogen. When oil shale is heatedat high temperatures, the oil is driven out' and can berecovered.
once-through cooling Cooling Of an electricgenerating or industrial plant by pumping cold waterfrom a river or lake through the condenser and thendischarging the heated water back into the source.
OPEC The Organization of Petroleum ExportingCountries. An organization of countries in the MiddleEast, North Africa, and South America which aims atdeveloping common oil-marketing policies.
overburdenThe material (soil, rocks, etc.) that over-lies an ore or coal deposit. The,overburden is removedin strip mining before the coal or ore is mined.
ozone A molecule contaihing three oxygen atoms(03). It is formed when solar, radiation splits an.oxygen(02) molecule into two oxygen atoms, one of which thencombines with another oxygen molecule. At the top ofthe earth's atmosphere, it acts as a protective layer. byabsorbing ultraviolet radiation. It is also a major compo-nent of photochemical smog; it has a sharp, unpleasantodor and is an eye irritant.
PANS Peroxyacetyl nitrates, components of photo-chemical smog foraled by the action of sunlight on thenitrogen oxides and hydrocarbons of air pollution.
pararnarginal resource An identified resource thatis, not recoverable under current economicor technolog-ical conditions.
particulates The small soot and ash particles pro-?' duced by burning.
1, peak loadThe maximum amount of:power deliveredduring a stated period of time.
permafrostThe permanently frozen subsoil found incolder areas of the world such as northern Canada andAlaska.
petrochemicalsChemicals derived from petroleum.
petroleum (or oil) An oily, flammable liquid thatmay vary from almost colorless to black and occurs inmany places in the upper strata of the earth. It is acomplex mixture of hydrocarbons ih-dis-fh-e-raw mawial for many products.
photochemical smog Smog produced by the actionof sunlight on the pollutants 'emitted by automobiles.The major components of photochemical smog are
_ozone-and-peroxyacetyl nitrates (PANs).
photons -- A quantum (the smallest unit) of elec-tromagnetic radiation. It has no mass or electric charge,but behaves like both a particle and a wave in its interac-tions with other particles.
photosynthesis The process by which green plantsconvert radiant energy (sunlight) into chemical potentialenergy. Carbon dioxide and water are converted intocarbohydrates (such as glucose). Carbon dioxide (CO2)+ water (H2O) + energy = carbohydrates Cx(H20)Y +Oxygen (02).
photovoltaic process The process by which radiantenergy is converted directly into electric energy. Solarradiation striking certain materials is absorbed, causingseparation of .electrons from atoms. The migration ofthese eledtrons in one direction and of the positivelycharged ions in the other produces a small potentialdifference, typically' about 0.5 volts.
plasma. A "gas" of charged particles which existsonly at temperatures high enough to strip all electronsfrom atomic nuclei.
potential energy "Stored" energy. Energy in anyform not associated with motion; such as that stored inchemical or nuclear bonds, or energy associated withthe relative position of one body-to another.
power The rate at which work is done or energyexpended. It is measured in units of energy per unit oftime such as Calories per second, and in units such aswatts and horsepower.
primary energy Energy in its naturally-occurnngform coal, oil, uranium, etc. before conversion toend-use forms.
productivity The value added to goods divided bythe man-hours input.
41418 227

proton, An elementary particle present in all atomicnuclei. It has a. positive electric charge. Its mess isapproximately 1,840 times that of an electron.
pumped storage Reversible pump-turbines usesurplus electric power to lift water into a reservoir whendemand is. low and then use it to generate power when it
is needed. I
pyrolysis Th application of high temperature to asubstance and t the resultant transformation of that sub-stance into one or more other compounds.
radioactivityThe spontaneous transformation of anatomic,nudeus during which it changes from one nu-clear species to another with the emission of particlesAnd energy:
radon A radioactive gas which is formed by thedecay-of-uraniutriLancLoth_er radioactive materials.
recoverable resource That portion of a resourceexpected to be recovered by present-day techniquesand under present economic conditions. Includesgeologically expected but unconfirmed resources aswell as identified mserves.
reserve Thot portion of a resource that has beenactually discovered and that is presently technically andeconomically extractable.
residual fuel oil =The heavy residue of petroleum thatremains after lower boiling fractions are distilled. It isused primarily for generating electricity in industry andlarge commercial buildings.
resource = The total estimated amount of a mineral,fuel, or energy source; whether or not discovered orcurrently technologically or economically extractable.
retorting The heating of oil shale to drive out the oiland gas.
secondary recovery Recovery techniques usedafter some of the oil and gas has been removed and thenatural pressure within the reservoir has decreased.
Second Law of Thermodynamics One of the twolimit laws" whloh govern the conversion of energy.Referred to here as the "heat tax," it can be stated inseveral equivalent forms, all of which describe the in-evitable passage of some energy from a useful toe,lessuseful form in any energy conversion.
solar cell A device which converts radiant energydirectly into electric energy by,:the photovoltaic process.Each cell produces a small potential difference,typicallyabout 0.5 volts; an array of cells can provide a usefulelectric power capacity.
solar collector A device for collecting solar energyand converting it into heat.
iolventrefined coal. (SRC) A tar-like fuel producedfrom coal by dissolving it in a solvent. It is higher inenergy value andcontains less sulfur or ash than coal.
stored energy See potential energy.
strip miningA mining technique used when depositsof coal lie relatively near the surface (less than 100 feet).The overburden (the soil and rock aboie the coal) isstripped away, the coal removed, and the overburdenfrom a trench dumped in the previous, and parallel, one.Strip mining is used primarily for coal, but may be usedextensively in the mining of oil shale as well.
submarginal resource That porton of a resourcethat cannot presently be extracted economically. As theeconomic picture and technology change, some sub-marginal resources may become recoverable re-sources.
solar energy The electromagnetic radiation trans-mitted by the sun. The earth receives about 4,200 trillionkilowatt-hours per day.
solar farm Not yet in existence, these "farms" wouldconsist of an array of solar collectors, a heat transfersystem, and electric generating,facilities.
228
subsidence-----A-sinking-down-ota_partnf the earth'scrust due to underground excavations. If extensive, acave-in can result.
sulfur smog (classical smog) This smog is com-posed of smoke particles, sulfur oxides (SOx), and highhumidity (fog). The sulfur oxide (SO3) reacts with waterto form sulfuric acid (H2SO4) droplets, the major causeof damage.
supertankers Extremely large oil tankers that canhold up to 4 million barrels,(170 million gallons) of oil.The largest ones will require deepwater ports.
synthetic natural gas (SNG) A gaseous fuel man-ufactured from coal. It contains almost pure methane,CH4, and can be produced by a number of coal gasifica-tion schemes. The basic chemical reaction is coal (C) +2H2 CH4 ± heat.
system efficiency The cumulative efficiency of aprocess from-the extraction of the natural fuel to the finaluse.
tar sand A sandy geologic deposit in which oil isfound. The oil binds the sand together.
temperature Intuitively, the "hotness" or "coldness"of a substance, a measure of the changes which resultfrom heat energy transfer. The temperature of a sub-stance is proportional to the average kinetic energy of itsatoms or molecules.
tertiary recovery techniques Use of heat and othermethods to augment oil recovery (presumably occurringafter secondary recovery).thermal energy Heat energy.
thermal pollution An increase in water or air tem-perature which disturbs the ecology of the area Mostoften thermal pollution is associated with electricgenerating plants, which require large amounts of cool-ing water to remove waste heat.
thettmodyr,amIcs The science and study of the rela-tionship petween heat and mechanical w6rk.
thermonuclear reaction A fusion reaction which isinitiated by intense heating.

threshold doseThe largest "safe" radiation dosage.Theoretiaally, no damage would occur below.this level.It is not presently possibleto determine whether there isa threshold dose or whether any amount of radiationcauses some effect.
topping-cycle A means to use high-temperatureheat energy that cannot be used in a conventionalsteam turbine. Ag as turbine, for instance, might operateas a:topping-cycle on furnace gases of 2 000°F and itsexhaust could then heat steam for aturbine operating at1,000°F.
transmission line A cable or wire through whichelectric pOWerisTniiikid-frorrrelectric power generatingplants to areas of use by consumers. It usually is oper-ated at greater than 250,000 volts.
tritium A radioactive isotope of hydrogen in whichthe nuclei of the hydrogen atoms contain one proton andtwo-neutrons.
tundraA thin layer of topsoil on top of the permafrost,a permanently frozen subsoil.
ttirbine A bladed, wheel-like device which convertsthe kinetic energy of a gas or liquid into the mechanicalenergy of a rotating shaft. A motor turned by a stream offluid or gas under pressure.
ultraviolet radiation Electromagnetic radiationwhose wavelength is somewhat shorter than that forvisible light but longer than that for x-rays.
value added The difference between .the value of adelivered product and the cost of the raw materials,labor, and energy to produce it.
voltage The potential difference measured betweentwo points in an electric circuit. The work per unit chargerequired to move an electric charge between two points.
water table The level below the surface at which theground becomes saturated with water.
watt (w) A metric Unit of power usually used inelectric -measurements which gives the rate at whichwork is done or energy expended. One watt equals onejoule of work per second.
work Energy that is transferred from one body toanotherin such a way that a difference in temperature isnot directly involved. The product of an external forcetimes the distance an object moves through its applica-tion.
x-ray-- Electromagnetic radiation with a very shortwavelength (about the diameter of an atom).
230229

APPENDIX 2 I Is*,A Mathematics Pri Mer
031

A Mathematics Primer
There are very few mathematical expressions in this,Source Book. We have made a determined attempt to
"Sise this language sparingly. It is not, however, possible4e talk about energy without some numbers and tools ofmathematics, We will Use this Appendix, therefore, as aprimer for those fevi tools large number codes,semilogarithmic graphs, exponential functions, doubl-
\ ing times, and rates of growth which WQ do employ.
Codelor LargeNumbers
this country, millions of people use millions of tonsof c I to generate trillions of kilowatt-hours of electric-ity. ince one trillion is written 1,000,000,000,000, wecan justify using an abbreviation code to save spacealone. The code we use is suggested by the written-outform above: One.trillion is 1 followed by 12 zeros. Ourcode is based on this, on powers of 10. We are familiarwith the operation of squaring a number and know that102 is 100. The 2 is called the "power" and 102 is "ten tothe second power." The familiar powers of 10 are: 102 =100, 103 L and 104 = 10,000. We note that thepower is equal to the number of zeros to the right of the 1and our code is born. (We do have to add, by fiat, that10° = 1.)
We summarize, in Table A2-1, the range of numbersthat occur in this book, expressed first as a power of 10,
-------then,as a word, and, finally, in the last column, wegivethe cocleitsed-throgghout the text.
TABLE A2-1Large Numbers
Power of Ten Notation Won! Abbreviation
100
101
102
103104
105
106
109
1010loll1012
10'31014
1015
na, no abbreviation
The terms in the parentheses are the common prefixes which wewill use, kilowattt.or megawatts, for instance, meaning thousandsor millions of watts.
one
ten
hundred
thousand (kilo)ten thousand'
hundred thousand
million (mega)ten million
hundred million
billionten billion
hundred billiontrillionten trillionhundred trillion
quadrillion
nana
na
k
10k
100k
M
tomloom
1013
10013
T
10T
10(iT
CI
As an example: the total energy,consumed In' theUnited States in 1974 was 18,500,000,000,000,000Calories or 18 quadrillion, 500 trillion Calories. We writethis in power of 10 notation as 18.5 x 10¹⁵ Calories. Thepower, in this case 15, gives the number of places to theright of the decimal point. We could write it equivalentlyas 1.85 x 10¹⁶ Calories"or 18,500 x 1012 Calories. Inorder to have as concise and consistent a form aspossible for these large numbers, we write this figure fortotal energy as either 18.5 Q Calories or 18,500 TCalories.
We stop our table at a quadrillion, 1015, even thoughsome of our numbers (the total amount of heat energyavailable from coal resources, for instance) are as largeas 10'46. We just write that as 1,000 Q.
The power of 10 notation can take us in the otherdirection also, to and smaller and smaller numbers. Forthese numbers e use negative powers, which meanreciprocals. Ont over 10, one-tenth (1/10 or 0.1), iswritten 10-'; one-hundredth, or 0.01, is written 10-2, etc.Small numbers, (towever, occur infrequently in this bookand we have no set up an abbreviation code for them.
Samilogarithm c Graphs
We use not on y the language of mathematics but itsvisual repretentations also. Much of the Source Bookdata is most efficiently shown maphically. Many of thesegraphs are cast in the same familiar form as the stockmarket's ups and 'downs or cost-of-living curves; thevertical axis, which measures the increase (or de-crease) of the quantity being studied, has a linear scale.(Each vertical unit, each vertical inch on the scale, fotinstance, measures the same amount of increase ordecrease.)-All-data, however, cannot be handled on a simple
linear graph-. Whanever a quantity changes dUring theperiod of concern by more-than a factor of 10, we beginto lose detail in presenting itinTsvay. Figure A2-1,.forinstance, shows the growth in the per capita consump-tion of electric energy in this country during the period1890-1970. Consumption increases from about 100kw-hrs per person to above 8,000 kw-hrs per personover this period. A fault of the linear scale is that detailsof changes in consumption in the 100-1,000 kw-hrs perperson range are not as clearly shown as are those athigher consumption levels. When the same data are plot-ted on a graph in which the vertical scale is logarithmic,Figure A2-2, these details become more evident.
The basic idea behind the logarithmic stale is asfollows: when a quantity spans a wide range, from 10 to10,000, for instance, and it is desired to emphasizefluctuations between 10 and 100 as strongly as thosebetween 100 and 1,000, then the same amount of verti-cal space on the scale must be allottid to the 10 to 100range as to the 100 to 1,000 range. In Figure A2-2, youwill notice the vertical distances from 10 to 100, from 100to .1,000, and from 1,000 to 10,000 are the same.
The "logarithm" accomplishes this allotment. Youmay remember that the logarithm, say X, of a number 11_,
3 7hr, J 233

"to the base 10" is the value of.X that-satisfies theequation
N = 10x,
that is, the power to which 10 must be raised to equal thenumber N. We can see from this equation that thelogarithm of 10 is 1 (since 101 = 10), of,100 is 2 (since102 = 100), and of 1,0001s 3 (since 103 = 1,000). Thus, ifwe plot as equal distances along a vertical scale thelogarithms X = 1, 2, 3, rather than the numbers, we canobtain a scale that greatly compresses the data. All thenumerical values between 1 and 10 fall .into the firstdivision, those between 10 and. 100 into the second, etc.The vertical scale of Figure A2-2 is laid out in this fash-ion equal distances are-.equivalent to equallogarithms rather than equal numbers.
Eicponential Functions
An _even more important reason for using this"semilog" presentation is that it offers great simplicity indisplaying quantities that increase in size "exrionen-tially;" as do many of the quantities we study in thisSource Book.
When a quantity's net increase over a given period oftime depends on its size at tte beginning of that period,we say it grows exponentially with time. In mathematical
r language this is written
AN = rNAt
Eq. A2-1
FIGURE A2-1U.S. Per Capita Consumption of Electricity (Linear Scale)
1900 1920 1940
Year
1960 1980
234 ,
where N is the quantity which is growing with time, A Nisthe Change in N (read A, the capital Greek-delta, as."change in'), A t the time period, and r is the constantpercentage increase during A t. With this formula inview, we can define exponential growth as growth with aconstant percentage rate of increase.
A savings account provides a good example of expo-nential growth. In this example, N is the amount ofmoney in the account at the beginning of the interestperiod (A t), r is the interest rate for that period, and A Nis the amount of interest the account draws.
If N $1,000 and r is 6 percent per year, then after ayear (A t = 1 year) the increase in A N
AN =
= year X $1,000 X 1 year
OIY =1$60
At the beginning of the next year, N = $1,060, and thecalculation is repeated. We show, in Figure A2-3, alinear plot of N against t in years. This is an exponentialcurve in which we see that N grows to $10,000 after 40years.
FIGURE' A2-2U.S. Per Capita Consumption ofElectricity (Semilogarithmic Scale)
1.000000100700
0
a.V
o.
05
100
0 laY 10
toSO
40
00
1
1100 1010 0070 1100 1040
Year

This same data are plotted on semilog graph paper inFigure A2-4. The exponential growth curve on a semilogplot is a straight line. The relationship betweenlogarithms and exponentials is such that this has to be,but we will not develop the analysis here. What we needto know is why a straight-line representation of an expo-
' nential is important and how it can beinterpreted.A straight line is the preferred representation of a
growing quantity because, since it'is straight, one caneasily project it can see where it is going. If we projectthe savings account of Figure A2-4, we see that itreaches $30,000 after 58 years. A curve, such as isshown in the linear plot of Figure A2-3, cannot be pro-jected with such accuracy. A straight line has the sig-nificant advantage of being determined by two points,
,which means it can be extended in either direction bythat simple tool, the ruler. We are, therefore, at a con-siderable advantage In dealing with these exponentialcurves of growth when we plot them as s ilog graphs.
Doubling Time
We can see from the savings accoun example meifrom Equation A3-1 that the constantr is of great impor-tance in characterizing exponential growth: it deter-mines how rapid the growth will be. In the case of asavings account, r Is the interest, generally, it is theannual rate of growth, the annual percentage increase.If r is large, the straight line slopes up more steeply thanif it is small. Thus; a savings account with interestr of 10percent will follow the dotted curve in Figure A2-4 (andthat account reaches $10,000 much more rapidly thanthe one at 6 percent). The annual rate of growth is amost important quantity, and we refer to it often.
FIGURE A2-3Growth of $1,000 at 6 Percent Per Year (Linear Scale)
10 20 30 40Year
0.4)%-f
34
A second and related measure of growth is doublingtime, the time it takes for a quantity to double in size.This is also constant for exponential growth, as we cansee from Figure A2-4. The savings account at 6 percentinterest doubles in 12 years, doubles again (goes from$200 to $400) in the next 12 years, and continues todouble every 12 years. Doubling time, therefore, is 12years. The doubling time for the account at 10 percentinterest is shorter, about seven years. An exponentialcurve can be defined by the fact that it has a constantdoubling time.
Doubling time is an important quantity in the SourceSoo for, as we poini out, many of the difficulties of theener y crisis are due to the fact that the doubling time ofelectri energy consumption is 10 years. Ten'years is ashort t me in which to build the necessary generatingplants nd other facilities. Annual rate of growth r anddoublin timeare, of course, related. We will not derivethis rel tlonship (although it is a simple exercise inmathematics). An appropriate statement of it is that
Tdouble =70 years
Eq. A2-2r (percent per year)
In words, the doubling time in years, Tdouble, is equal to70 years divided by the annual rate of growth in percentper year. We will leave it to the reader to verify this forthe growth curves of Figure A2-4.
The ease with which the doubling time, and thereforethe annual rate of growth, can be read off of the straight
FIGURE A2-4Growth of $1,000 at Indicated InterestRate (Semilogarithmic Scale)
00
830.000
140.000'
*Me&
$20,000 .
800.000.
MOOG,
$11.000. Rate g 10 percent$LOW.
3140,73
$4.000.
$LOOP
$2,004
u.
4-1Rate 6 percent
10 20 30 40 50 60Year
235

line, samilog plot of an exponential, is a further reasonfor usingthis kind of a representation.
We should not leavethis discussion of doubling timewithout emphasizing what an enormous change adoubling is. As an example, let's take the total energyconsumption in this country, which is increasing at anannual rate of about 3.5 percent. From Equation A2-2,
"we find that the doubling time is about 20 years (70years + 3.5 = 20 years). This means that during the past20 years we have consumed as much energy as we didin our entira previous history. in the next 20 years we willagain consume an amount of energy equal to the totalprevious consumption, and so ,on.
Inflation provides another example. Ten percent infla-tion means a doubling time of 70 10, or seven years.Prices double every seven years.
Proportionality and Equations
This final section of the primer deals with some of thephrases and sentences of mathematics. Is proportionalto is one of these, it tells us how one quantity dependson another. For example, the area of a circle dependson the square of its radius. If we use A for area and r forradius, the phrase is written
A cc-r2
Such a relationship telli us that a circle with twicetheradiu.:. of another has four times its area, for instance. Itdoes not allow us to compute the area knowing theradius. For that we need an equation. To make anequation out of the proportionality we need a constant,which we will. symbolize hyk, and write
Area (circle) = kr2
We find, of course, in this example, thatk is the constantIT, which is 3.14159, and obtain the familiar equation
A = r2
Knowing it and r, we can compute A. In our earliersavings account equation, the constant was r, the an-nual rate of interest.
It is this constant that makes the units on either side ofthe' equation match (be the same), as they must. Forexample, the energy available from gasoline is propor-tional to the amount of gasoline you have, E « N(gallons). To make an equation out of that proportional:ity we must write it as
Energy = k x N (gallons)
The actual numerical value of k depends on the unitswe desire for energy: if we want Calories, then k =33,000 Calories per gallon; if we want BTUs,lhen k =130,000 BTUs per gallon. If we wish to find the amount
236
AP'
of energy in Calories available in a gasoline tank of, say,10 gallons, we would use the equation
E (Calories) = 33,000 X 10..gaUen
= 3.3 X 10⁵ or .33M Calories
Note we have treated the units, gallons, like numericalquantities and cancelled them leaving only Calories onthe right as units to equal the Calories on the left. This isa handy way of checking to see if ware using thecorrect units fork.
We repeat in closing this Appendix that you can un-derstand most of the Source Book without the vocabu-lary we have introduced here. These simple additions,however, can greatly deepen that understanding:

23f3
APPENDIXForce, Work, Energy,and Power/

Force, Work, Energy, and Power
What is energy? In the beginning of Volume II of thisSource Book, we said: "energy is energy." A. commondefinition is that "energy is the capacity to do work."Unfortunately, neither definition is satisfactory; workand energy are both left undefined.
In science, where verbal statements usually havemathematical expression, precision of definition is ofprimary importance. To gain precision, terms such asenergy, force, and work are defined "operationally,"that is, by the operation necessary to observe or meas-ure them. In this Appendix we will make sqme suchdefinitions, review the relationships between thesequantities, and provide some of the mathematical ex-pressions which allow us to represent them by numbers.We also provide a table of conversion factors betweenthe various units in which energy and power are meas-ured.
Force, Maas, and Acceleration
We will get at the definition of energy indirectly bylinking it with force. Force is an easier concept to under-stand; you might say we have some "feel" for it.
If asked to define a force, we might say "a push orpull," but this is still not precise. We cannot put numbersin such a statement. The operational definition of a forceconnects it to the change in velocity, the acceleration, ofan objeCt. it walk Isaac Newton, the great 18th-centuryphysicist, who gave us this definition in his famousrelation
f = ma Eq. A3-1
This equation connects force f to acceleration a (where= A v / A t, the change in velocity A v divided by the
time A t over which' that change took place), the con-stant in the equation, m, is the mass of the object.
We can measure a by measuring the change in veloc-ity and the time. The operational definition of force there-fore, will be complete if we provide a way to measuremass m. Fortunately, this is easy. There are standardsof mass ("measure" means, after all, "compare with astandard"). In the scientific system the standard mass isthe kilogram, a thousand grams. Thus, to measure massone compares the unknown mass with the standardusing a balance of some sort.
The units of mass and acceleration are kilograms andmeters per second per second respectively. Force thushas the units
f = ma (kg meters per sect)
We define a unit of for e, the newton, as 1 kg x 1 m/sec2or, equivalently, a f of one newton will cause aone-kilogram mass to i crease its velocity one meterper second each second. This is a satisfactorily precisedefinition of force.
To use a familiar example; a mass near the surface offhe earth feels a force on it which we call its weight. (Theweight is, of course, the pull of the earth's gravity on theobject.)-This force is defined as
f = mg Eq. 'A3-2
where m is mass as before and we use g for theacceleration of gravity, 9.8 meters per second2. A 1kg object, therefore, weighs 9.8 newtons. In the (soon todisappear) English system, weights are in pounds. Therule for conversion from one to another is
1 pound = 4.45 newtons
Force, Work, and Energy
We need now to connect the concept of force to themore abstract concept of energy. We do have someintuitive comprehension of energy; we avoid movingcars, stay out from under lifted pianos, and move awayfrom the front of bent bows. In all these examples afamiliar object has had something added to it whichmakes it different; the car because it is moving, thepianO because it is lifted, the bow because it is bent. Thisadded quantity is energy.
In Chapter 1, Volume II, we describe the two kinds ofenergy: kinetic energy, the energy of motion; andpotential, or stored energy. In our examples the car haskinetic energy, the lifted piano and bent bow have poten-tial energy. From the relationship between these twoenergy forms in the familiar example of a falling body,we can gain some insight into the relationship betweenforce and energy.
Suppose we drop a ball of mass m from a distance habove the ground. Justbefore it strikes the ground it hasan amount of kinetic energy
KE = 1/2 mv2 Eq. A3-3
(Equation A3.3 is the general expression for kineticenergy.)
Where did this kinetic energy come from? Clearly, itwas stored in the ball by the action of lifting it the heighth. Already we see the necessary involvement of a force,it took a force to lift the ball. We can make the relation-ship precise by inserting Into Equation A3-3 the velocityv in terms of the acceleration of gravity g and the heighth. This is
Or
v = \/2gh
v2 = 2gh*
Inserting this expression for v2 into Equation A3-3gives
KE = mgh
'This expression can be found by simple calculus from the relation-ship between the acceleration and the velocity.
937 239

On the left we have the kinetic energy, on the right aterm that Involves a force mg (the weight, see discus-sion of Equation A3-1) and the distance h,,This termmust be the potential Anergy (the kinetic energy mustequal the potential energy, according to the First Law ofThermodynamics see discussion in Chapter 1, Vol-ume II). Thus the potential energy of an object of massm lifted a height h is increased by the amount of mgh.
The potential energy is the product of a force times adistance. To store this potential energy we had to exert aforce (we'll call it the lifting force) throughout that dis-tance h, and that lifting force had to oppose the force ofgravity.
In every case of stored energy we investigate, we findthe same factors: a force must operate against an op-posing force. The application of this force over a dis-tance is what we call work. It is this work that producesthe change in potential energy which occurs in lifting theobject. It is also work that produces the change in kineticenergy when the object is dropped. In that, case, theforce is the gravitational force itself, acting over thedistance h, pulling the mass back to earth. In the firstinstance we did work, in the second the earth's gravitydid the work.
The computation of the work, the product of forcetimes distance, is relatively easy when the force is con-stant and in the same direction as the motion. If, how-ever, either of these conditions is altered the computa-tion of the work becomes more complicated (and weleave it to physics texts).
Work as the Change In Energy
We are much concerned in this book with energyconversions. Since we know that energy is neithercreated nor destroyed, its use must be through conver-sion. Work is the name we give to a large class of thoseconversions, those which are to, or from, mechanicalforms. Thus we do work in lifting the object we havebeen describing and in so doing convert mechanicalenergy to gravitational potential energy. We obtain workfrom an electric motor, which converts electric kineticenergy to mechanical kinetic energy. Work is charac-terized, as we have seen, by the operation of a forceover a distance. If the system supplies the fothe falling body case, then work is done by the system. Ifthe force is supplied externally, by a man lifting theobjects, then work is done on the system. The finalresult of the investment of work, on or by a system, is achange in the energy of at least that part of the systemon or by which the work is done.
We can make a further very important point aboutenergy storage before we leave it. Consider the liftingforce we had to apply to store potential energy. in thelifted mass. We treated it as if it were equal to the force ofgravity. In fact, however, it must be a little greater thanthe weight mg if it is to cause the mass to move. Thusthe energy expended (the work done, since it is theproduct of the lifting force times h) is a littlegreater than
the stored potential energymgh. This extra work is the"heat tax" we introduced in Chapter 1, VoluMe Hit doesnot go into potential energy. It goes Instead into heat,*frictional heat with air and energy that is converted 4rheat in our arm muscles (or somewhere). when we stopthe object at the heighth. in.every case of stored energywe might consider in the charging of a battery, forinstance the force that.causes the storage must be alittle larger than the force it opposes, and the extraenergy pays the heat tax.
Work Against Dissipative Forces
We have so far considered work done in storingenergy. Much work is done-also just to move thingsaround. In this case there are also opposing forces thatuse up the Work. We call these "dissipative forces." Wewill not try to either list or describe all the various impor-tant dissipative forces, only to make some generalstatements about them. Most of these dissipative forcesoppose motion. The most common example-is friction
caused by the adhesive forces between solid sur-faces in contact. The result of moving an object againstthis force is to convert work to heat energy. Anotherexample is air resistance, a complicated resistance tomotion that depends on the velocity of the moving ob-ject. Again the kinetic energy is converted to heatenergy. Other important dissipative forces are the onedue to electrical resistance (which we will discuss.inAppendix 5) and the more sophisticated force whichopposes the motion of electric conductors in magneticfields.
It is these dissipative forces which are, for the mostpart, responsible for the heat tax on energy conversionsand for the eventual downhill run of all forms of energy toheat energy.
The Three Basic Forces
We have now provided the link between force andenergy. In order to change the energy of an object wemust apply a force over a distance and either move itthus giving it kinetic energy or change its state insome way to.give it potential energy. In this latter appli-cation, the storage of energy, the force works against anpposing force.This relationship between force and energy provides
a great simplification of the forms of potential energy.There are only three basic forces in the universe, thegravitational. force, the electrical force, and the nuclearforce. Thus, since we must work against one or the otherof these to store potential energy, there can be onlythree kinds of potel Alai energy in the universe, gravita-tional potential energy, electrical potential energy, andnuclear potential energy.
We can rate these forces by their strengths. Thegravitational force_is by far the weakest. We must dealwith very large masses mountains or the earth or thesun before we notice its effects.
The electrical force is next in size. It is about 1036 (a 1and 36 zeros) times stronger than the gravitationalforce. It is the most important force on a man-sized
,J

scale: It holds atoms and molecules together and is thusresponsible for most of the secondary forces familiar tous: the forces of springs and rubber bands, surfacetension, friction, adhesion, air 'resistance, and so on. Itshould be clear that the dissipative forces are almost allelectrical in nature.
The strongest force is the nuclear force. We don'tknow as much about it as we do about the other two, butit has to be stronger than the electrical force because itholds a nucleus full of protons together. (Since protonsare alike they electrically repel each other.)
The potential energies that derive from the gravita-tional and nuclear forces are fairly obvious. The energyof water lifted to a mountaintop by air currents is gravita-tional potential energy. The energy released in fission orfusion comes from nuclear potential energy. It is theelectrical force that provides the greatest variety. Theenergy stored in coal, oil, natural gas, or wood is electri-cal potential energy. (We call it "chemical energy" inChapter 1, Volume II, but that means the same thing.)The energy 'of a stretched string, d bent bow, or acharged battery is also electrical potential energy storedin the molecular changes in the substance. Nuclearenergy powers the sun and stars, gravitational energy isstored in the great masses of the universe, but electricenergy shapes and fuels the world of man.
Units
We have defined force, work, and energy. In Chapter1, Volume II, we defined that other important quantity,power, as the work done per unit time, or symbolically
P =tNone of these definitions are complete, however, until
we discuss units. These tell us the size of the "measur-ing stick" we are using, whether we have a foot ruler or ayardstick, to carry out the analogy. Since work is definedas the change in energy, both, work and energy areexpressed as force times distance. In the metric system,force is in newtons and distance in.meters; the unit ofwork is newton-meters and is- called a joule, after theScottish physicist, James Joule, who did much to estab-lish the Law'of Conservation of Energy. A 50 kg woman(weighing 490 newtons, or 110 pounds) who lifts herself&vertical distance of 6 meters'(about 20 feet) by walkingup a flight-of stairs will do 2,940 joules of work.
In the English system of units, force is in pounds,distance in feet, and the unit of work is foot-pounds. Inthese units the woman does about 2,200 foot-pounds*of work.
Since work can bring abOut changes in other forms of, energy and can in turn be derived from conversion of
other forms of energy, other units are often employed inthe discussion of work and energy. The most importantof these are the units by which heat energy is measured:
'2,940 joules divided by .305 milt divided by 4.45 newtons/lb 7--2,166 ft-lbs.
the Calorie and the British Thermal Unit (BTU), and theelectric energy, unit, the kilowatt-hour. This latter unit isobtained by multiplying a unit of power by a time. Thereis similar variety in the units of power. Since power iswork or energy divided by time, obvious units are joulesper second or foot-pounds per second.
The most familiar unit of power is the horsepower,which is roughly the rate at which a horse can work-foran extended time. The definition now has been mademore precise: one horsepower is defined as 550 foot-pounds of work per second. Thus, in the example of thewoman climbing the stairs, if she made it up the 20-footflight in 10 seconds, she would have operated at justunder one-half horsepower. If, however, she raced upthem in 5 seconds, her output would have been almostone horsepower.*
The unit of power used in this Source Book is thewatt, the name given (in honor of James Watt, whocontributed so much to the understanding of the steamengine) to the power unit, one joule per second. It isapplicable to any measurement.of power. One horse-power, for instance, is equivalent to 746 watts of power.The watt, and its larger brother, the kilowatt (1,000watts) are most often used, however, to measure elec-tric power (which will be discussed in a later appendix).
In order that you can move easily among the manyunits in which the energy-environment crisis is de-scribed, we provide, in Table A3-1, definitions of all thecommonly used units of energy (work) and power, and,in Tables A3-2 and A3-3, the appropriate rules for con-verting one to another.
'a) 2,166 ft-lbs/10 sec = 217 ft-lbs/sechorsepower = (217 ft-lbs/sec) x (1 H.P.) / (550 ft-lbs/sec) = 0.4 H.P.
b) 2,166 ft-lbs/5 sec = 433 ft-lbs/sechorsepower = 433/550 = .79 H.P.
241
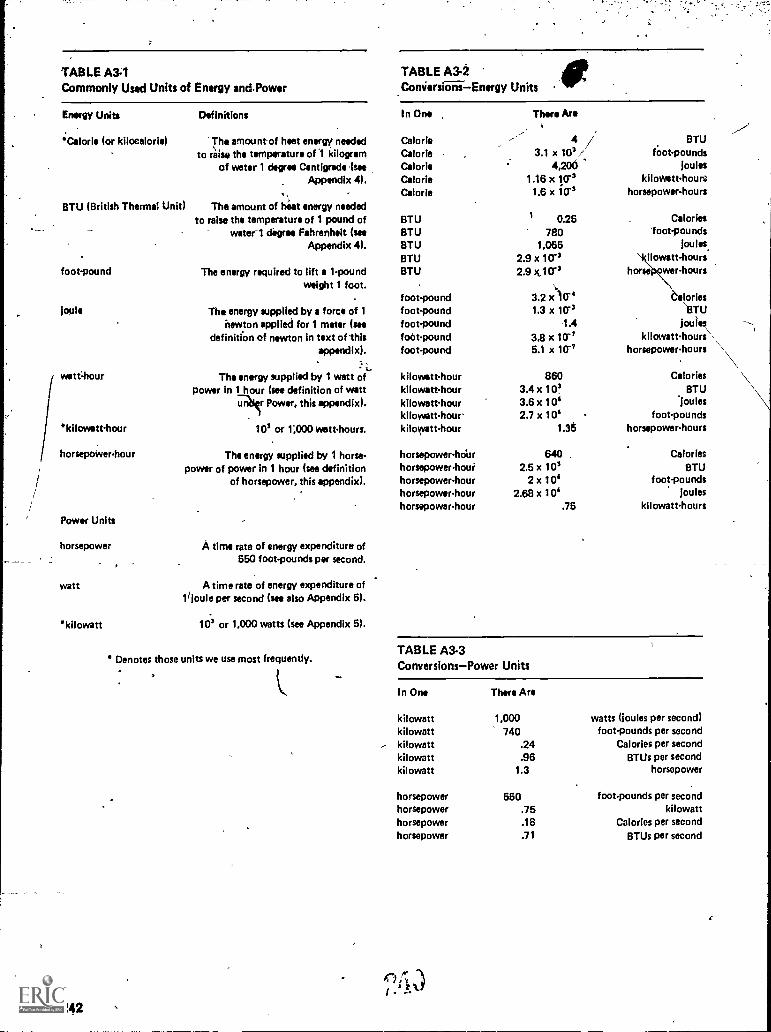
TABLE A3-1Commonly Used Units of Energy anPower
Energy Units Definitions
Calorie (or kilocalorie) The amount of heat energy neededto raise the temperature of 1 kilogram
of water 1 degree Centigrade (saeAppendix 4).
BTU (British Thermal Unit) The amount of heat energy neededto raise the temperature of 1 pound of
water-1 degree Fahrenheit (seeAppendix 4).
foot-pound The energy required to lift a 1.poundweight 1 foot.
10910 The energy supplied by a force of 1newton applied for 1 meter (see
definition of newton in text of-thisappendix).
watt=hour
kilowatt-hour
horsepoWer.hour
Power Units
horsepower
watt
kilowatt
242
The energy supplied by 1 watt ofpower in 1 hour (se* definition of watt
un r Power, this appendix).
103 or 1;000 wett-hours.
The energy supplied by 1 horse-power of power in 1 hour (see definition
of horsepower, this appendix).
A time rate of energy expenditure of550 foot-pounds per second.
A time rate of energy expenditure of11joule per second (see also Appendix 6).
103 or 1,000 watts (see Appendix 5).
" Denotes those units we use most frequently.
TABLE A3-2Coniersiiiiii-Energy Units
In One
CalorieCalorieCalorieCalorieCalorie
BTUBTUBTUBTUBTU
foot -poundfoot -poundfoot-poundfoot-poundfoot-pound
kilowetthourkilowatt -hourkilowatt-hourkilowatt.hourkilowatt-hour
horsepower-hourhorsepowerhourhorsepower-hourhorsepowerhourhorsepower-hour
Then Are
4 /3.1 x 103/
4,2001.16 x 10'3
1.6 x 10⁴
0.25780
1,0652.9 x 10'32.9 x.,10's
3.2 x)1741.3 x 10.3
1.4
3.8 x 1045.1 x 10-1
8603.4x 10!3.6x 10'2.7 x 10³
1.35
6402.5 x 103
2 x 1042.68 x 103
.75
BTUfoot-pounds
jouleskiloWstt-houre
horsepowerhours
Calories'foot-pounds
joules.,
ilowatt-hourshorse wer-hours
6alories\BTU
jouleskilotvatt-hours\
horsepower-hours \Calories
BTU*joules
foot-poundshorsepower-hours
CaloriesBTU
foot-poundsjoules
kilowatt-hours
TABLE A3-3Conversions-Power Units
In One There Are
kilowatt 1,000kilowatt 740kilowatt .24kilowatt .96kilowatt 1.3
horsepower 550horsepower .75horsepower .18horsepower .71
watts (joules per second)foot-pounds per second
Calories per secondBTUs per second
horsepower
foot-pounds per secondkilowatt
Calories per second
BTUs per second

APPENDIX 4Heat and Heat Engines
241

Heat and Heat Engines
Although we rarely think about i it is a near miraclethat we can bum a fuel and use the h at energy to cause
0- an engine to turn. It is that "miracle" e analyze in thisAppendix. We begin with a consideratio of the remark-able form of energy we call heat: As alwa we must firstestablish a vocabulary for its description nd lead off ,
with, temperature, for it is clear that the con =pts of hotand coldare somehov+i related to heat energ
Temperature
We can distinguish between hot and cold objec byfeel, and can easily rank a group of similar items fr mhottest to coldest. If we are to use the hot-cold conceitscientificallY, however, we have to measure to punumbers with it. For that purpose we need to find somematerial that undergoeS a distinctive change in property(in color, length, or electrical resistance, for instance) as .it becomes hotter or colder, and use it tq construct a"therrrio-meter." Mercury, the liquid metal, fills the bill.Confined in a small-diameter transparent tub,e it re-sponds to temperature change by. expanding or con-tracting. These changei in height can be calibrated togive numerical values to the temperature. This is thecommon mercury thermometer.
The numerical calibration is, of course, the key. Wemust establish a temperature scale. Two referencetemperatures and a decision on the size of the divisionsare needed:*
There are two common numerical scales now in use,the Fahrenheit scale and the Centigrade* scale. For theFahrenheit scale, the two reference temperatures origi-nally chosen were: zero degrees Fahrenheit (0°F) as thetemperature of 'a mixture of salt and ice (and water);100°F as the temperature of the normal human body.
The choices of reference temperatures of theFahrenheit scale were not good ones as neither tern-perature is precisely determined. The choices for theCentigrade scale were more successful: zero degreesCentigrade (0°C) was established as the freezing pointof water; 100°C as water's boiling point (both at atmos-pheric pressure). The Fahrenheit scale was eventuallystandardized to the same points, so that now, in de-grees Fahrenheit, water freezes at 32°F and boils at212°F.
The relationship between these two scales is shownin Figure A4-1. From this figure we see how to convertfrom one scale to another. There are 180 Fahrenheitdegrees between the freezing point and the boiling pointof water, and 100 Centigrade degrees between thesame reference points. Thus, the desired Centigradetemperature will be represented by 100/180, or 5/9, asmany degrees as the Fahrenheit interval. If theFahrenheit temperature is 122°F, then the interval is
'Also called the Celsius scale.
242
122° minus 32°, or 90°F. The desired Centigrade tem-perature, Tc, is, therefore,
Of
Tc = 5/9 (TF 32)
Tc = 5/9 X 90
= 50°C
Eq. A4-1a
To find a Fahrenheit temperature TF given a Centigradeone, we work backward.ff the Centigrade reading is 80°,the TF is 9/5 x 80, or 144°P above the freezing point. TheFahrenheit temperature is, therefore, 144 + 32176°F. Symbolically,
TF = 9/5 (Tc) + 32
= 9/5 (80) + 32
= 17eF Eq. A4-lb
Heat Energy and Hot Gases
With the concept of temperature in hand, so to speak,we can now attack the concept of heat energy. It wasThe English physicist, Joule, who demonstrated theexact equivalence between mechanical energy andheat energy, and also the equivalence between electricenergy and heat energy. Through many experiments heverified that there are fixed "exchange rates" betweenthe different energy forms, in much the same mannerthat thereare fixed exchange rates between the curren-cies of different countries,. In other words, he demon-strated that heat and electricity are forms of energy inthe same way dollars and francs are forms of money.
Heat, however, occupies a unique role in the energypicture. An amount of energy of one form can be entirelyconverted to an equivalent amount of heat energy, but a
FIGURE A4-1Comparison of Centigrade and Fahrenheit Temperature Scales
Centigrade
Boiling Point'of Water
Freezing Pointof Water
Fahrenheit
too°c
oo°c
122° 2°
212°F
122°F
32.F
245
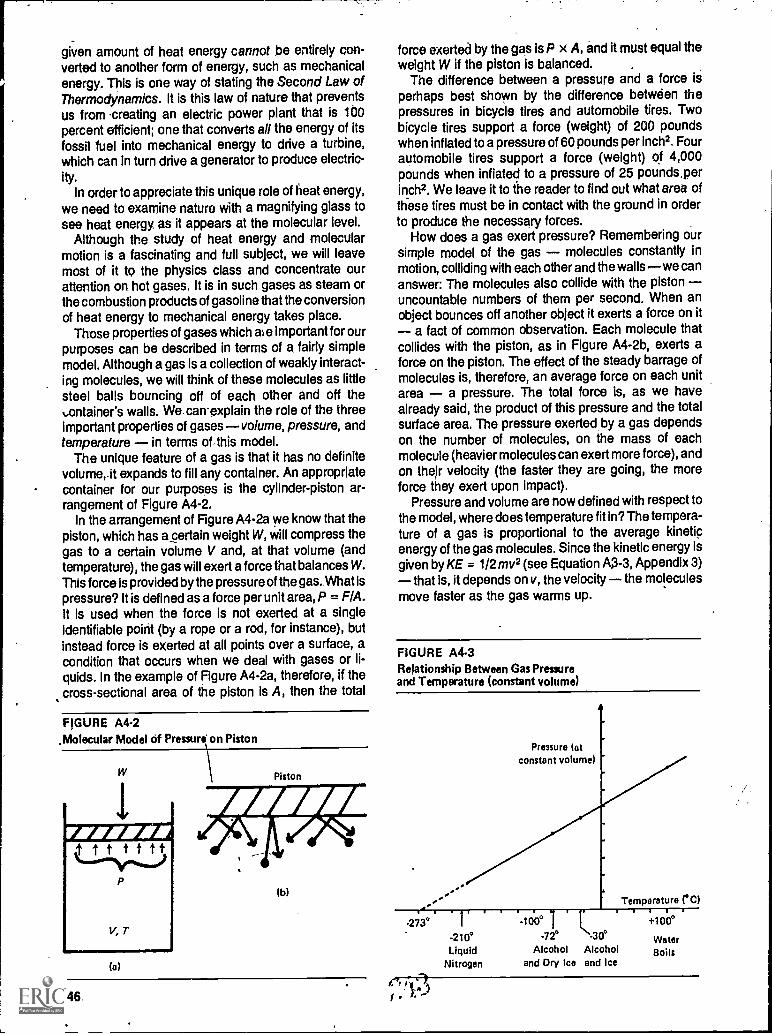
given amount of heat energy cannot be entirely con-verted to another form of energy, such as mechanicalenergy. This is one way of stating the Second Law ofThermodynamics. It is this law of nature that preventsus from 'creating an electric power plant that is 100percent efficient; one that converts all the energy of itsfossil fuel into mechanical energy to drive a turbine,which can in turn drive a generator to produce electric-ity.
In order to appreciate this unique role of heat energy,we need to examine nature with a magnifying glass tosee heat energy, as it appears at the molecular level.
Although the study of heat energy and molecularmotion is a fascinating and full subject, we will leavemost of it to the physics class and concentrate ourattention on hot gases. It is in such gases as steam orthe combustion products of gasoline that the conversionof heat energy to mechanical energy takes place.
Those properties of gases which m e important for ourpurposes can be described in terms of a fairly simplemodel. Although a gas is a collection of weakly interact-ing molecules, we will think of these molecules as littlesteel balls bouncing off of each other and off the,..ontainer's walls. We-can explain the role of the threeimportant properties of gases volume, pressure, andtemperature in terms of-this model.
The unique feature of a gas is that it has no definitevolumerit expands to fill any container. An appropriatecontainer for our purposes is the cylinder-piston ar-rangement of Figure A4-2.
In the arrangement of Figure A4-2a we know that thepiston, which has a_certain weight W, will compress thegas to a certain volume V and, at that volume (andtemperature), the gas will exert a force that balances W.This force is provided by the pressure of the gas. What ispressure? It is defined as a force per unit area, P = F /A.It is used when the force is not exerted at a singleidentifiable point (by a rope or a rod, for instance), butinstead force is exerted at all points over a surface, acondition that occurs when we deal with gases or li-quids. In the example of Figure A4-2a, therefore, if thecross-sectional area of the piston Is A, then the total
FIGURE A4.2.Molecular Model of Pressure' on Piston
(0)
Piston
246.
force exerted by the gas is P x A, and it must equal theweight W if the piston is balanced.
The difference between a pressure and a force isperhaps best shown by the difference between thepressures in bicycle tires and automobile tires. Twobicycle tires support a force (weight) of 200 poundswhen inflated to a pressure of 60 pounds per inch2. Fourautomobile tires support a force (weight) of 4,000pounds when inflated to a pressure of 25 pounds,perinch2. We leave it to the reader to find out what area ofthese tires must be in contact with the ground in orderto produce the necessary forces.
How does a gas exert pressure? Remembering oursimple model of the gas molecules constantly inmotion, colliding with each other and the wallswe cananswer: The molecules also collide with the pistonuncountable numbers of them per second. When anobject bounces off another object it exerts a force on it
a fact of common observation. Each molecule thatcollides with the piston, as in Figure A4.2b, exerts aforce on the piston. The effect of the steady barrage ofmolecules is, therefore, an average force on each unitarea a pressure. The total force is, as we havealready said, the product of this pressure and the totalsurface area. The pressure exerted by a gas dependson the number of molecules, on the mass of eachmolecule (heavier molecules can exert more force), andon their velocity (the faster they are going, the moreforce they exert upon impact).
Pressure and volume are now defined with respect tothe model, where does temperature fit in? The tempera-ture of a gas is proportional to the average kineticenergy of the gas molecules. Since the kinetic energy isgiven by KE = 1/2 mv2 (see Equation A3-3, Appendix 3)
that is, it depends on v, the velocity the moleculesmove faster as the gas warms up.
FIGURE A4-3Relationship Between Gas Pressureand Temperature (constant volume)
-273°
Pressure (atconstant volume)
-210°Liquid
Nitrogen
100°
-72° -30°Alcohol Alcohol
and Dry Ice and Ice
Temperature (' 0)
+100°
WaterBoils

This relationship between temperature and kineticenergy hides a condition of the temperature we mustnow make explicit. It should be clear, upon reflection,that temperature can no longer be defined arbitrarily asit was in the previous section. Kinetic energy is a specificquantity that is always positive we can't use negativetemperature.
The temperature scale we will use in the rest of thisdiscussion will be the "absolute temperature scale."Thisis a scale for which zero is "absolute zero." WhatwRinean by absolute zero can be made clear with thehelp of -Figure, A4-3.
Suppose we take a simple gas like nitrogen, confine itin a container (fixed volume), and then change its tem-perature and record its pressure. The solid straight line ofFigure A4-3 would result. At some point most gasesbecome a liquid (nitrogen at 210°C) and the straight-line relation ceases. If, however, we extrapolate that lineto zero pressure, it intersects at 273°C. The remarka-ble feet is that all gases, even though their straight lineshave different-slopes, intersect at this same tempera-ture. This point, where the pressure of an ideal gasbecomes zero, is absolute zero. Since the pressure ofthe gas depends on the motion of the molecules, thisimplies that Molecular motion ceases also at that tem-perature and, therefore, that the kinetic energy becomeszero. Absolute zero, of course, is alimiting temperature,it can't be reached. Helium, however, liquifies within adegree or so of 273.2°C. It is only for a temperaturescale with zero at 273.2°C (or equivalently at459.7°F) that the proportional relationship betweenT and K.E. holds.
With this new temperature scale in use, the behaviorof the pressure, volume, and temperature of a simplegas is summed up in the equation
PV= constant Eq. A4-2
This tells us all we need to know for our purposes. Wewill look at one or two instances just to make the opera-tion of Equation A4-2 clear.
Suppose we hold the temperature constant and re-duce the volume. This could be accomplished with theapparatus of Figure A4-2 by pushing the piston fartherinto the cylinder. What happens to the pressure? ByEquation A4-2, if T is constant and V decreases, then Pmust increase if the total is to remain constant.
Alternately, we might hold V constant and increasethe press,ure (by pumping more gas into the cylinder, forinstance). In this case the temperature must-increasealong with the pressure in order to keep the entire termconstant. We see this relationship demonstratedwhenever we pump up a tire.
The most important consequence of Equation A4-2as far as heat engines are concerned results from hold-ing P constant and increasing T by building a fireunder the cylinder, for instance. In this case V mustincrease, the piston must move and work is per-formed.
2/14
WOrk from Haat
The fundamentals of an engine are shown in FigureA4-4. A gas at a pressure P, temperature T, and occupy=ing a volume V, is put into thermal contact with a "hotreservoir," which is any large source of heat energy (likea steam boiler, for instance) that can continue to supplyenergy without changing its own temperature.
if the temperature of the cylinder (TR) is greater thanthe temperature of the gas in,the cylinder (T), then heatenergy will flow into the gas, increasing its kinetic energyand, thus, the temperature of the gas. Since the piston isfree to move, its weight keeps the pressure constantand, as we saw earlier, the result is that the pistonmoves upward increasing. the volume. That work isdone becomes obvious when we see that a force thepressure times the area A of the cylinder operatesover the distance d.
This work comes from the heat energy provided bythe hot reservoir. It is transmitted by the moleculesbouncing off the piston. Since the piston is moving awayfrom them when they hit it, they bounce off with a lowervelocity than they came in with and thus carry away lessenergy-than they came in with.
In this example all the heat energy was converted towork. This seems to violate the Second Law of Ther-modynamics as we stated it earlier. The Second Law,hoWever, applies to a complete cycle, not a simple,one-step operation as we have just considered. It isnecessary, if we are to have an engine,to bring the gas
FIGURE A4-4Work Performed by an Expanding Gas
P, r, v0
Hot Reservoir
TR
247

(the "working fluid") back to its original condition so thecycle can be repeated. In the simple cycle we couldpush the piston back down, doing work anci_heating upthe gas. The extra heat energy, would then go back intothe reservoir and we would have obtained no net work.A more complex cycle is needed.
The.Perfect Cycle
Figure A4,5 shows an idealized four-cycle engine. Itis for this engine that the efficiency equation of Chapter3, Volume ll, is derived. The operation of this "perfect"engine is as follows.
Step A The gas (it can be steam or air or a mixtureof combustion products) expands as heat energy istransferred from the hot reservoir to the gas.
Step B The cylinder is removed from the heatsource and placed on an insulated stand. The weight onthe piston is reduced slightly and the gas continues toexpand, doing work at the expense of its internalenergy. Its temperature drops to the "exhaust tempera-ture" T and, due to the collisions with the piston, thekinetic energy of the molecules decreases. The molecu-lar collisions keep the piston moving.
Step C The cylinder is now put into contact with acold reservoir at temperature Tout. Gas heat energy nowflows from the gas to the lower temperature cold reser-voir. The molecules transfer some of their kinetic energy,to the cold reservoir and, as a result, the gas volumededreases. The piston is performing work on the gas.This is an energy-wasting step, but clearly necessary ifthe pistonis to get back to its initial condition so that itcan repeat the cycle.
Step D The cylinder is moved again to the insulatedstand. The we9ht on the piston is now increased, allow-ing the compression to continue. During this step work isdone on the gas, but, since no heat flow is allowed, thiswork increases the internal energy and, therefore, the
temperature of the gas. At that point, the cycle's end, thepressure has returned to its original value and the tem-perature is at Tin; the process can be repeated.
The efficiency of this engine cycle is given by
energy outefficiency -
energy inX 100 percent
The useful energy out is, of course, the work; the onlyenergy input is the heat which flowed in from the hotreservoir. Therefore,
efficiency - Wout X 100 ent
Heat energy Qin was put in during Step A and some heatenergy Qout was rejected during Step C. Sincelh is anideal machine (no friction or heat leakage), the workdone must be the difference between these two (sineenergy must be conserved). Therefore,
Wout = Qin Qout and the efficiency is,
efficiencyQ in Clout
X 100 percentuln
or
= 1 4271t X 100 percent
The next step is a big one. We won't derive it but onlyargue for its plausibility. The question is, what can theheat input and output, Qin and Qout, depend on? There isonly one property available, the temperature of the res-ervoirs. Since we have seen earlier that the amount of
FIGURE A4-5Hat Engine_
la Ile MP 1111
rffIff
MP
NO OD
=EEL
Hot Reservoir 1 Insulated Stand
Tin
(a) (b)
Cold. Reservoir
;tit
1111,MI GM dab a..
ea O. MEP MP
Insulated Stand
(c) (d)
248

heat transferred. depends on the temperature differ-ence, we set the Qs proportional to the Ts; that is,Qin I Qout = Tin / Tout, and write:
Toutefficiency = 1 -.7-7-n X 100 percent Eq. A4-3
fiwhere Tout is e exhaust temperature and Tin the inputtemperature."- The fact that this cycle is reversible, that it can run
backward using the work to lift heat from the cold to thehot reservoir, is dueto its ideal nature; there are nolosses due to friction, leakage, etc. It is this reversibilitythat makes it the "perfect engine." Carnot stated andproved that, in fact, no heat engine operating between,the same two'temperatures, Tin and Tout, can be moreefficient than this "perfect engine." All reaLonginesoperating through the same temperature drop will havelower efficiencies. Such real enginesare discussed inChapter 3 of Volume IL
We see from this discussion 'that 100 percent effi-ciency is not possible. Even for the perfect engine whichwe have hypothesized, it is not possible to obtain Tin = 0(for this is absolute zero) or Tout = infinity. It is becausesome heat energy must be rejected in Step C that heatengines are intrinsically inefficient. We are stuck withthis inefficiency as long as we have to rely on heatenginet to convert fuel to work.
246
4
249

247
APPENDIX 5Generation, Transmission, andDistribution of Electricity

Generation, Transmission, andDistribution of Electricity
In Chapter 1, Volume Ii, we identified three inter-mediate forms of energy, thermal, mechanical, andelectric. The first two of these are also important enduses of energy most of the energywe use is in one orthe other of these forms. Electric energy, however, isuniquely intermediate; it is energy in transit and must beconverted to, another form toe be used. Electric energy iskInetic,energy that is obtained when electric chargesare set into motion by electric forces, just as mechanicalkineft energy is obtained when mass Is set in motion.
We begin this Appendix with a vocabulary for electric-ity. We define the terms charge, current, voltage, andresistance with which electric energy and power arediscussed. From these defihitions we go on to discussgeneration, transmission, and distribution of electricity.
Vocabulary of ElectricityElectric Charge
Electric charge resists verbal definition as tenaciouslyas does mass or any other of the fundamental quantitiesof science. It must be defined operationallyas that quan-tity which gives rise to measurable electric forces andelectric currents just as mass gives rise to gravitationalforce and momentum.
Electric charge differs qualitatively from mass in twoimportant ways: 1. there are two kinds of electric charge
thus the electric force can be either repulsive orattractive; 2. electric charge is "quantized" it comesin chunks.
Although the two kinds of charge are called positiveand negative, they could have been called black andwhite, or male and female, or any other set of nameswhich would have underlined their oppositeness. Posi-tive and negative are convenient choices, since in com-bination the two can cancel, as happens in most bulkmatter.
The most important carrier of negative charge is theelectron, the elementary particle that is present in theouter "shell" of the atom and determines its chemicalproperties. The most important positive charge carrier isthe proton, the nuclear "building_ block" that-is 1,840times- as -heavy -as electron. Protons along withuncharged, but massively similar, neutrons make up thenucleus the core of the atom.
The proton and the electron have equal amounts ofcharge, even the'agh there is the fundamentaldifferencein quality positive and negative. A series of experi-ments has shown that this amount is, in fact, the smal-lest amount of charge that exists in nature, and that allother charges are multiples, 1,2,3,4...etc., of the chargeof an electron.
Charge can-be measured in many different units. Itcould be measured in electron charges a charge of1,2, or 1024 electrons, for instance, but the smallness ofthis charge unit makes this impractical. We normallyhave to deal with too many electrons. The unit we will
use is the coulomb, named after Charles Coulomb,whose experiments led to the measurement of electriccharge. The coulomb is a large unit of charge: the sparkthat zips from your finger to the doorknob after you haveshuffled across a deep-pile rug carries only about 10-6 \coulombs of charge; a bolt of lightning has only about 20coulombs of charge. The charge on one electron is 1.6x 10⁻¹⁸ coulombs or, conversely, it takes 6.25 x 10¹⁸electrons to. make one coulomb 6f-charge.
Electric Current
The reason for choosing such a large unit becomesclearer when we talk of electric current the transportof electric charge. It is easiest to define current in thecase of electrons moving through a wire, as in FigureA5-1. The current, normally designated i, is the amountof Charge passing through the cross-section A in onesecond. The common unit of'current, theampere (oftenshortened to amp), is one coulomb per second. There-fore, one ampere of current can consist of 6.25 x 10¹⁸electrons passing through A in one second.
Voltage
Most people know that electric circuits in house wiringare labeled "110 volts." The volt is a unit of "potential,difference," a term closely related to potential' energy.We will define it by analogy to the gravitational case.
The potential energy of a mats m, lifted a distance habove the earth's surface is increased by mgh. Thisincrease depends, obviously, on the mass m as will thework that produces that change. We can, however,define a quantity, potential difference,- which is inde-,pendent of m by dividing mgh by m. This gravitationalpotential difference gh describes the work per unit massrequired to raise a mass a distanceh.
In a similar manner, we can speak"Of a potentialdifference which is associated with electric charges andforces. In order to move apart two charges of oppositepolarity (+ and ), which attract each other, or movetogether two charges of similar polarity (+ +, or ),which repel each other, work must -be performed onthem. In doing this work we increase theirpotential---energy. As in the_gravitational-case, we can define a
-potential difference as the increase (or decrease) inelectric potential energy per unit charge or, equiva-lently, as the work per unit charge required to. movecharges. Electrical potential difference will, therefore,have the units of joules per coulomb. This combinationof units has been given the name volt (after the Italian
FIGURE A5-1Electron Flow in a Wire
948Vir 253

physicist Alessandro Volta, who invented the first bat-tery) and is defined as
1 volt = 1 joule of work per 1 coulomb of charge
To say that a potential difference exists between twopoints in an electric circuit, is to say that charge at onepoint will have a greater potential energy than at theother. If 1t free to move, charge will "roll down thePotential charge travels from + to potentialand charge in the reverse direction.
If you have a "12-volt" battery, this means that apositive charge at the positive terminal is at a higherpotential energy than it would be at the negative termi-nal. That charge will "fall" in going froni the 4 to theterminal, performing 12 joules of work for each coulombof charge that travels around the connecting circuit. Thiswork comes at the expense of the chemical energy ofthe battery materials.
Electric Current in Wires
Given these definitions, we can discuss the nature ofelectric current within materials. The most importantmedium in which charged particles move, from our pointof view, is metal the copper and aluminum wires thatcarry electric currerit.,In metals, atoms are bound to-gether in ,a regular and repeating structure called a"lattice" in such a way that their outermost electrons areessentially "free"; the electrons are bound to the mater-ial but not to any particular atom. If an electric force isapplied to the material, these free electrons can movefrom atom to atom within the lattice.
It is the "free electrons'; which constitute the current ina wire. We visualize these electrons-moving in the fol-lowing way. A copper wire is-used to connect the termi-nals of a battery. For the electrokthe + terminal is a lowpotential, it is "downhill." Electronsat that end of thewire move on to the + terminal leaving that region of thewire positively charged. Free electrons-from the regionnext to this one move in to fill the vacancy and leave theirown vacancy behind therVntbis_manner theele-ctiekis
___in_the-metal are all sefiFi motion toward the + terminal.It is obvious that the circuit must be,completed some-
how. If the electronS just piled up on the + terminal, theywould soon be numerous enough to \repel any otherelectrons which tried to leave the wire and the currentwould cease to flow. It is the job of the battery to "lift"these electrons from the + terminal up to the - terminalwhere they can enter the wire at the other end.
When a piece of wire is connected betweentatteryterminals, there is a potential difference set up im-mediately throughout its length. Said another way, eachfree electron in the wire feels a force that causes I*begin to move. This force field is set up very rapidlyessentially with the speed of light. When you switch on alight, electrons all along theicircuit begin to move, cur-rent begins to flow, and the light comes on immediately,even though it will take a long time for an electron fromthe switch region to finally reach the light itself, if it everdoes.
254
D.C. and A.C. Voltages
As we,have already shown, the minimal componentsof an electric circuit are wires to provide and carry theelectrons of the current, and a source of potential differ-ence, which.causes the electrons to move. We have sofar considered only a constant potential difference suchas is provided by a battery. A voltage (as we shall beginto designate potential difference) of the type put out by abattery is called D.C. (for direct current) voltage. Such avoltage plotted against time maintains a constant valueand direction (that ic, the positive terminal remains' thepositive termina! and the voltage remains 12 volts or 6volts or whatever).
D.C. voltages have certain important applications. inautomobile electric systems, in flashlights, and in elec-troplating, for example. From the point, of view of totalelectric use, however, the more important type is A.C.(for alternatingscurrent) voltage. As is suggested by thename, an A.C. voltage changes in both magnitude anddirection the polarity of the output, + or. -, regularlychanges as does its numerical value. We will later de-scribe how generators (or alternators, as they are called)produce such a voltage.
An A.C. voltage has the form, as a function of time, of
V = Vmax sinda
which is shown in Figurek5-2.The parameter (.0 determines how many times a sec-
ond an A.C. voltage changes from + to -. In the UnitedStates system, A.C. voltages "cycle" 60 times a second,that is, (.0 is 60 cycles per second (nowadays called 60hertz) and the polarity is reversed 120 times per second.As we can see from Figure A5-2, it is'no longer possibleto talk of "the voltage" (or "the current") in the A.C. case,as both these quantities vary with time. What is usuallyspecified is the "rms"* value, which is about .7 times the
' rms means root mean square, the square ioot of the average ofthe voltage squared. For a sinusoidal voltage as snown above, therms value is V2/2 times the maximum.
FIGURE A5.2A.C. Voltage
Voltage

maximum value. Thus for 110-volt house current, since110 volts is the rms value, the maximum value is 156volts.
Resistance
We have identified electric current irLwires with themovement of free electrons. When you try to move acharged particle electron, proton, or ion throughany medium gas, liquid, or solid. the motion wiliberesisted. The are, after all, otheratoms about and theirelectrons will be attracted or repelled by the movingcharge. They will take up some of its energy just as amoving billiard ball loses energy by collision with otherbilliard balls. This lost energy contributes to the motionof the atoms of the transmitting medium and, therefore,heats It up.
The motion of the free electrons through the metal is,thus, very erratic. In the first place, the electrons vibraterandomly at relatively high speeds due to the tempera-ture. The applied voltage gives them a small componentof motion in the direction along the wire. Thus, theelectrons arebouncing wildly about.but are drifting onthe averagein the direction of the electric field. In themetals used for wire, this drift speed depends only onthe voltage applied. For this important class of conduc-tors, the current i is proportional to the applied voltage V:
i cc V
We can write this as an equation,
VEq. A5-1
where R is a constant that takes into account the resis-tance to _motion just described. It depends on thecross- sectional area of the wire and on its length. R iscalled the "resistance" of the conductor. As the resis-tance increases, the current decreases and vice versa.
The common unit of resistance is the ohm (named foryet another pioneer in electricity, a German high schoolteacher, Georg Simon Ohm, whose experiments led togguetion A5-1). If V in Equation A5-1 is one volt and i isone ampere, then R is one ohm.
It is this resistance that accounts for much of the lossof electric energy in moving it from place to place.Those electric devices whose purpose 'is to convertelectric energy to heat energy space and waterheaters, toasters, irons, for instance depend uponhigh-resistance wires for the conversion. This conver-sion of electric energy to heat energy can be 100 per-cent efficient.
The discussion we have just given for resistanceholds true whether the applied voltage is A.C, or D.C.The electrons are light enough to respond easily to theChange in propelling force produced by an alternatingvoltage. Thus, the current in a resistive circuit has thesame form and the same time relation (it peaks whenthe voltage peaks) as the A.C. voltage of Figure A5-2.
Electric power
The final addition to the basic vocabulary of electricity iselectric power. PoWer is work per` unitime. Since poten-tial difference voltage is wort( per unit charge andcurrent is charge flow charge per unit time poweris dimensionally the product of volts times current.
work chime workPower = voltage X current =chaide time time
Symbolically:
P = iV Eq. A5-2
Equation A5-2 is exact for D.C. voltages and currents.If A.C. voltages and currents are being considered it canbe more complicated, since the voltage and current maynot peak together (may be "out of phase," in the jargon).If the electric circuit is purely resistive, however, Equa-tion A5-2 holds for A.C. also.
The unit of electric. power is
P = volts X amps -
joules)C
copl6mbs joulescouloots second second
One joule per second is the "watt" we discussedearlier. One watt of power is, therefore, present whenone amp of current flows across a potential difference ofone volt.
We can also combine Equation-A5-2 with EquationA5-1 and-learn an important fact about electric powertransmission. if we want to deliver a certain amount ofpower through a transmission line, then, since P = NV, wehave a choice. We can deliver the power at high currentand low voltage or the same amount of power at highvoltage and low current. the product determines thepower. To force a current i against the resistance R ofthe transmission line requires a potential difference VA- IR. Thus, an amount of electric power Nn, is used upjust in transmitting the current i through the line, it is"lost" as heat. This lost power Pr, depends only on thecurrent, that is:
orPo = i x VR = I x IR
Pe = PH Eq. A5-3
It increases, in fact, as the square of the current. It is lesswasteful, therefore, to ship electric power at high volt-age and low current. We wii! examine this further in ourdiscussion of the transmission of electricity.
The Commercial Generationof Electric Power
The three major steps in the journey of electric powerare generation, transmission, and distribution. Each
"5,0 255

step has its own characteristic problems and makes itsown contribution to the national energy-environmentproblem. The complexity of the ppwer industry is wellsymbolized by Figure A5-3, which shows all the majorsteps from fuel delivery to end uses of electricity in acity. The generation of electricity begins with a naturalenergy source such as gas, oil, or coal. The fuel mightthen goAhrough special processing before it is sent intothe furnace where it is burned to produce steam, whichin turn powers the inevitable (and not very efficient) heatengine the steam turbine. The conversion sequenceis chemical energy to thermal energy to mechanicalenergy. At the end of the production line, the electricgenerator makes the final conversion to electric energy.
Generators
A simple system which illustrates the principle of elec-tric poWer generation is shown in Figure A5-4. A"U"-shaped piece of copper wire with a cross piece thatcan slide on it is placed in a magnetic field. The magnet-ic field (indicated by the +s on the figure) Is perpendicu-lar to the plane of the paper. It could be formed by anorth pole of a magnet above the paper* and a southpole below the paper.
As we have mentioned before, in a piece of metal,such as copper; the atoms align themselveS so thatthere are loosely-bound electrons, which we called freeelectrons. If the sliding cross piece is moved from posi-tion a to b, theselectrons will be physically moved inthe magnetic field. _
Charges which. nove in a magnetic field are acted'upon iby a magnetic force. This is a strange force in
comparison to the electric and gravitational forces*. Itdepends on the velocity of the charge If the charge isnot moving, there is no magnetic force. Its direction ofpush or pull is strange also. It does not act along eitherthe direction of magnetic field or the direction of motionof the charge, but is perpendicular to both of these.Thus, in Figure A5-4, where the magnetic field is pointedlike an arrow into the plane of the paper and the motionof the wire moves the charge to the left in the plane of thepaper, the magnetic force points from the bottom of thefigure to the top. In other words, as the wire is moved tothe left, free electrons are forced to move upward in thewire by the magnetic force.
If it were not for the rest of the circuit, the electronswould pile up at the end of the wire. The remainingcircuit allows theft) to flow as a current i, shown by thearrows in the figure. The situation is almost the same asif the top of the slider wire was the positive terminal of abattery and the bottom the negative terminal; theU-shaped loop would be the circuit inside the battery. Inother words, there exists a potential difference, a volt-age, between the top and bottom of the slider.
This is tha basic generator principle. A conductingwire is moved in a magnetic field, a force operates onthe free electrons causing them to move and, if thesystem is properly constructed, a current can be causedto flow across a potential difference and electric power
The magnetic force, however, is not a fourth basic force but, as canbe shown using Einstein's relativity relations, is derived from theelectric force.
FIGURE A5-3Generation, Transmission, and Distribution of Electricity
Steamturbine
Electric Transformernerator Substation
138,000.765,000v
[TTSteamPlant
Industrial User Commercial War
- 1117
//120v 12,500v
Home User
Jam 0, -1 till II.
120v
Transportation Street Lights DistributionTransformer
256 rit I

becOmes available. We will come back to the questionof "properly constructed" later. Let us examine thismagic electric power more closely.
We seem to have gotten something for nothing. Bysliding a conductor through a magnetic field we createdenergy. We know, however, that we did not createenergy but converted it from one form to another. Wehad to do work to create the potehtial difference in thewire. How did this work come about? Let us look again atFigure A5-4.
Moving the conductor to the left in the magnetic fieldcauses the current i to flow as shown. But a current ismade up of moving charges. These charges are nowmoving up (in the drawing) and they also feela magneticforce this one is perpendicular to the direction ofcurrent flow and to the magnetic field. If we work out thedirection of this force, it oppoes v. We must, therefore,push against it to keep the conductor moving and, thus,do the work that is converted to electric energy.
The simple system of Figure A5-4 is not of much useas a practical generator. We would get tired pushing theslide wire back and forth. It is much more practical toturn a loop in a magnetic field, as we show in FigureA5-5. Rotary motion is easy to come by, turbines orengines produce it.
To see how we can generate a potential difference byturning a loop we must use_a general law discovered100 years ago by the English physicist, Michael Fara-day.
In the example of Figure A5-4, we described thegeneration of a potential difference in terms of forces. Itcan-be described equivalently in-terms of a "magneticflux." We can .think of this magnetic flux, which we willsymbolize by the Greek phi, (13, as being the amount ofmagnetic field in the area A surrounded by the "U" andthe slide wire. Figuratively, it could be thought of as thenumber of +s (arrows seen from the rear) in the en-closed area. Faraday showed that a potential differenceis generated whenever the magnetic flux 4 changes.
FIGURE A5-4Generation of an Electric Current by.Moving a Wire in a Magnetic Field
+'s indicate presence of magnetic field. North pole is above paper onesouth polo is below paper
In Figure A5-4 we. changeAlY by-that-tying the area,making it smaller. (1) will change, -however, when theloop of Figure A5-5 rotates in the field, for the areaavailable to the +s becomes smaller as the plane of thecoil goes from a position perpendicular to the field to aposition lined up with the field. In this latter position, theflux is zero sinceno arrows can go through the loop. Youcan perhaps visualize this if you think of one pole of themagnet as a flashlight and the other as your eye. As theloop rotates, the area enclosed by the shadow of theloop is first a maximum, then after a 90°-turn it is zero,then another 90°-turn brings another maximum, andthen after 270°, another minimum.
Since the area is varying, the magnetic flux is varying,inducing (according to the physical law developed byFaraday) a potential difference, and a current will flowthrOugh the complete circuit.
It should be clear that the voltage generated by arotating loop will alternate. It will be a maximum in onedirection when the loop is perpendicular to the magneticfield, go to zero after a 90°-turn and then/build back up toa maximum in the other direction after 180°, go to zeroagain and so on. From simple geometry, in fact, you canshow that the voltage will have on average the form, sinwt, described previously.
The rest of the generator is fairly straightforward. Toconnect the wire loop to an outside electric circuit foruse, the ends of the wires are connected to two continu-ous rings which also rotate. Wire brushes at the end ofconnecting wires can be used to rub againstAhe rings asthey rotate, enabling the current to flow in an exteriorcircuit.
FIGURE A5-5Model of an Electric Generator
Turbine
Brushes
Wiresto Outside Circuits
Magnet
1
Magnet,11
Magnetic Field
257

These then are the basic features of electricgenerators. The actual generators in use today aremuch more complicated devices than the one shown,but they have the same features a series of coils thatturn in a magnetic field and sliding contacts (brushes) tobring out the generated current.
The generator is, of course, only part of the system. Itrequires something to turn it. There are presently onlytwo important sources of mechanical energy to turngenerators the heat engines discussed in Appendix 4and "hydropower" from the kinetic energy of "falling'water. The heat engines dominate the picture, providingmotive power for 85 percent of the generated electricity,with hydropower providing the remaining 15 percent. Ofthe various heat engines, the most important is thesteam turbine, which generates 76 percent of the elec-tricity. The efficiGncof this conversion thermal tomechanical to electrical is inexorably limited by theefficiency limits on heat engines we have discussed inChapter 3 of Volume II: electric power has to comethrough the "thermal" bottleneck. The emergence ofnuclear-fueled generating plants will not bypass thisbottleneck for, as we shall discuss in Appendix 6, nu-clear energy is also converted to thermal energy. Theelectrical conversion in these plants will also be madeby a steam turbine generator set.
It should be emphasized that the generathr itselfneither stores nor produces energy. What it accom-plishes, and with efficiencies close to 100 percent, is theconversion of kinetic mechanical energy into kineticelectric energy. Sitting still it is just a lump of metal.
Transmission and Distributionof Electric Power
Electricity is kinetic energy; it must move out from thegenerating plant, be transmitted to the consuming area,and then be distributed to individual users. Electricity isproduced at 12,500 to 25,000 volts, depending on thegenerator. It is not transmitted at these relatively lowvoltages, however, for as we discussed earlier, lossesdue to the resistance in the transmission lines are pro-portional to the current squared (P). Electric power is thustransmitted at the highest voltages (and lowest cur-rents) possible, as high as 765,000 volts on sometransmission lines and agreater than 200,000 volts inmost places.
Electric power is transmitted across the country in thefamiliar "high-tension lines." There are now .about300,000 miles of these lines in service across the coun-try, and 500,000 miles are anticipated by 1990.
TransformersThe voltage has to be increased for transmission and
then decreased (to 110 volts) for use. Fortunately, thereis a device which accomplishes this called, appro-priately enough, a "transformer." et
Figure A5-6 is a schematic drawing of a simple trans-former. The Important components are the tv,o sets ofcoils wound around opposite sides of a continuous"core" of iron. Suppose we first consider a low voltage
258
say 100 volts applied to the side with the singlecoil, the "primary" winding. Current in a coil wrappedaround iron sets up a magnetic field in the iron. (This ishow electromagnets are built.),The magnetic field goesall around the iron core (as shown by the B lines) and,specifically, it passes through the many coils (we havedrawn 10) on the other side. This is the "secondary"winding.
if the 100 volts which are applied from the left are A.C.,the magnetic field in the iron varies in the same way. Itstarts at a maximum, goes to zero, reverses its direc-tion, and goes to a maximum in the new direction. Whatwill be the effect of this changing magnetic field on the"secondary" coils?
The changing magnetic field that passes through themany coils of the secondary winding produces a chang-ing magnetic flux cb through these coils. As a result, apotential difference is induced in each of the coils of thewinding according to Faraday's law discussed earlier.Whereas the changing flux in the generator model ofFigure A5-4 was due to changes in the area perpendicu-lar to the magnetic field enclosed by the wire loop, herethe area of the loop is constant but the strength of themagnetic field changes.
The origin of the changing flux in the secondary coil isthe changing flux in the primary coil produced by theapplied 100 volts A.C. Since the changing flux in eachsecondary coil must be the same, the induced potentialdifference, or voltage, in each turn must be equal to 100.The coils are connected, and, therefore, these potentialdifferences (voltages) add on and the total voltage in thesecondary coil is 10 times the primary voltage. Thestep-up in voltage, therefore, depends on the ratio of thenumber of coils in the secondary to the number in theprimary. It should be obvious that to step voltage down,one merely works the transformer backward.
Since energy is conserved (or nearly so, since theheat losses are small), the input and output power(energy per unit time) must be the same. If the voltagechanges, something else must change. The current isthe only candidate. Thus, on the left we have low volt-age, high current and on the right we have high voltage,low current.
--FIGURE A5-6Model of a Transformer
PrimaryCoil
100v
1 Loop
SecondaryCoil
1,000v
10 Loops
Iron Core

Distribution
Returning to Figure A5-3, we see that after the ele;,tricpower arrives at the many transmission substations thevoltage is reduced to, 12,500 volts by transformers andsent out over the distribution system. Two paths areavailable: the wooden poles, with their insulator-dottedcross-arms, or underground cables. The distributionsystem is the individualized performer. it must getpower to where it is needed and provide it at the rightvoltage and quantity to the ultimate consumer. It ac-complishes this through additional voltage transforma-tion at the point of use.
A large steel company, for example, takes its powerdirectly from the high-voltage transmission lines and theutility company's transformer steps the voltage down to34,000 volts. Huge amounts of power at this voltage willbe used to heat electric arc furnaces for the productionof steel.
For the residential consumer and the commercial cus-tomer, the voltage is steppeddown -toeither420-or-240-----volls-Ttive usually refer to it as 110 and 220 volts theactual values differ a bit from company to company). Inthis form it is ready for our use to power lights;' ap-pliances, and other home electric conveniences.
Electric power production and consumption is inmany ways symbolic of the crises in energy and theenvironment. It has been, for the' past two decades, themost rapidly increasing form of energy and .its readyavailability is the definition of "modern." In its produc-tion, from coal or oil or uranium, however, we threatenour environment in myriad ways. Description anddiscussion of these threads of the story of electric poweroccur throughout the two Source Book volumes.
9qg

\
APPENDIX 6/Energy froni the Nucleus
1
1
1
^,
,

/Fr-i/
Energy from, the Nucleus-
In this Appendix, wewill explain why there is energystored in the nucleus, and how we can get it out. We willconfine ourselves to the minimal nuclear physicsneeded to = understand nuclear reactors and their by-produtts.
Nuclear StructureTermincilogy
Thebasic chemical structure is the atom. At its centeris a small, dense core called the nucleus; about 10-12centimeters in diameter-1/10,000 the size of an atom
like a jelly bean in the center of the Astrodome. (If ajelly bean were as dense as the 'nucleus, however, itwould weigh about 100 million tons.)
The nucleus is composed of electrically chargecfpro-tons and uncharged neutrons. Protons have the sameamount of charge as electrons (ills of opposite sign) andare about 2,000 times heavier. Neutrons are similar inmass but slightly heavier than protons.
The number of protons in a nucleus is equal to thenumber of electrons in the shell of the atom. Thus,atoms are uncharged. Since the atom's chemical prop-erties are defermined by the number of electrons, anucleus can have the same number of protons but dif-ferent numbers of neutrons and still be the same ele-ment. Nuclear species with identical proton numbersbut with different neutron numbers are called isotopes.Hydrogen, for example,, has a rare, -heavier isotope,called deuterium, that his one neutron in its nucleus inaddition to its one proton. It also has a radioactiveisotope, tritium, with two neutrons plus a proton in thenucleus. We identify the isotopes by an initial whichdesignates the atomic element and give, as asuperscript, the number of particles the number ofneutrons, plus protons in the nucleus. For example,H1, H2, H3 designate hydrogen, deuterium, and tritium,respectively.
While we are introducing terminology, we will alsodefine the energy unit most commonly used in nuclearphysics the MeV, which stands for million electron-volts. It was found in the study of atomic structure thatatoms could be taken apart by bombarding them withelectrons accelerated by a potential difference (see Ap-pendix 5) of a few volts. Since charge times potentialdifference is energy, the natural unit of energy in atomicphysics became the eV (electron-volt). The natural unitof nuclear energy is a million times larger, MeV instead'of eV, since the nuclear force is so much stronger thanthe electrical force.
Compared to one Calorie, however, one MeV is asmall quantity. There are 2.6 x 10¹⁶ MeV in eachCalorie or, equivalently, 1 MeV - 3.83 x 10 17Calories.This may seem a paradox. The natural unit of nuclearphysics, which is associated with the tremendous ener-gies released in atomic bomb blasts, Is so much smallerthan the unit associated with the energy content of thefoods we eat. The answer, of course, lies in the fact that
6
when we speak Of food Calories, we are describing theenergy in an average. serving be it a cup, a pint, orthree tablespoons and not the energy resulting fromone atom interacting with another atom. For example, Inthe very basic reaction of the burning of carbon, about 2Calories are released for each gram of CO2 (carbondioxide). However, in 1 gram of CO2 there are roughly1.3 x 1022 molecules. Thus only1 ,x 10-23Caloties arereleased in the formation of one molecule of CO2through "burning" carbon, a number of Calories equal toabout 4 eV.
This should suggest to you that the energies we canobtain, in nuclear reactors from grams of materials aregoing to be much larger than the chemical energies weget from burning common fuels. How these energies areobtained is the next part of the story.
Energy, Stability, and Nuclear Structure
In the nucleus of the atom, the neutrons and protonsare in constant motion. They are held there by the verystrong nuclear force. Like most systems in nature, neu-trons and protons like to arrange themselves in the.nu-cleus in a stable structure in a position of minimumpotential energy. Like loose rocks on a hillside, they willseek positions which cannot easily be disturbedthey"roll into the valley." Also, because nuclei have a com-plex structure, some are more eager to accept neutronsor protons (more loose rocks) than others. If their struc-ture is unstable, they are radioactive. They undergo a":rockslide," a nuclear transformation, to change theirinternal structure and gain' stability.
It is relatively easy to distinguish stable nuclei theyare the ones that are most plentiful in our planet's soiland rocks. Unstable, or radioactive, elements orisotopes have long ago transformed, or are transform-ing, themselves into stable ones.
We can learn something about the conditions of nu-clear stability by looking at the characteristics of all stablenuclei. What we find is that the light nuclei, those withatomic weights (the sum of the number of neutrons andprotons) less than 40, seem to have equal numbers ofneutrons and protons. As the atomic weight increases,stable nuclei prefer to have more neutrons than protons.There are several reasons for this, but the most impor-tant one is easily understood. the electrical repulsionhinders the addition of more protons, but there is norepulsion for the uncharged neutrons. As the number ofparticles gets very large (greater than about 210), how-ever, even these large nuclei are no longer stable. It is inthis region that we find the fissionable nuclei, U235, U238,and Th232.
As with rocks which have fallen into a well, it takesenergy to remove neutrons and protons from a nucleus.The characteristics of stable nuclei indicate that it takesdiffering amounts of energy to remove particles fromdifferent nuclei. For very heavy nuclei, less energy isneeded. This variation is shown in Figure A6-1, whichdisplays the "average binding energy" per nuclear par-ticle in the nucleus. The binding energy (B.E.) is thetotal energy necessary to take a nucleus apart, one
263

nucleon at a time. A, the number of nuclepnS, equals thesum of the number of neutrons plusjproions. What wesee is that B.E. perA fluctuates for the very light nucleibut is always less than 8 MeV. It then climbs to a broadmaximum of a little more than8 MeV from A = 50 to A =100 and then falls slowly as A gets larger. The reasonsthat B.E. perA is less than 8 MeV in the region of thelight nuclei are too complex to discuss here, but themain contribution to the large nuclei fall-off is the electri-cal repulsion of protons,,which we have mentioned.
The curve in Figure A6-1 tells us, in effect, the moststable configuration of a given number of nuclear parti-cles. For example, if we have four particles (A = 4), wefind from the curve that the total binding energy of amass 4 nucleus, would be. 1 nucleus x.4 nucleons pernucleus x 7 MeV per nucleon = 28 MeV. In contrast,two nuclei of mass 2 would only have a binding energyof: 2 nuclei x 2 nucleons per nucleus x 1.1 MeV pernucleon = 4.4 MeV. Thus, the nuclear "well' is deeperfor forming one nucleus out of four nucleons as com-pared to forming two nuclei of two nucleons each; themass 4 nucleus, He4, is more stable than two mass 2nuclei, H2.
The two ways in which nuclear reactors can provideenergy are summed up in Figure A6-1. One way is totake the two light nuclei we mentioned, H2, and put themtogether to make He4. Since the binding energy is notonly a measure of the stability of a nucleus but also ofthe energy given off in its formation, excess energyequivalent to 28 MeV minus 4.4 MeV = 24 MeV wouldbe given off in the reaction. In other words, the potentialwell the H2 fall into when they combine to form He4 is alittle deeper than the one they were in separately and soenergy is released. This is the fusion reaction whose
FIGURE A61Binding Energy Per Nucleon
9
8
o 7O
U6
1.7
C
at
W 3co
2
5
4
1
0fc) 4
JI
8 U 16 2024 33 60 90 120 150
Mass Number A
Note: horizontal scalechanges at A 30.
180 210 240
264
potential for practical realization we discuss in Chapter7 of Volume II.
Energy can also be gained by working from the otherend. If we take a heavy nucleus, like U235, and split it intotwo nuclei, like Sr98 and Xe137 (strontium and xenon), wesee that B.E. perA is greater for either of the two than itwas for U235. B.E. per A is approximately 7.6 MeV pernucleon for U235, wt.. ;roes for Sr 98 and Xe137, it isroughly 8.5 MeV per nucleon. The difference betweenone nucleus of 235 particles and two nuclei of approxi-mately half the number is about 1 MeV per nucleon. Thetote/ energy released by the 235 nucleons involved,therefore, is around 200 MeV. The U235 nucleus isenergetically, so to speak, up on the side.of the hill; it canfall down and split into two nuclei and be in a more stablesituation.
There is another way to say the same thing. Einsteinshowed as one of the consequences of his theory'ofrelativity that mass and energy are two forms of thesame thing and related by the famous equation E = Mc2(where E is the energy, M the mass and c, the conver-sion constant, is the velocity of light).* What we have justsaid about the difference in binding energy could havebeen said in the following equivalent way. If (in thefusion example) we measure the mass of the twodeuterium nuclei, H2, and the mass of the helium nu-cleus, He4, we find that the Hes has a little bit less massthan the sum of the masses of the two H2's. It is thismissing mass that is converted into energy. Similarly, inthe fission example, the two nuclei, Sr98 and Xel37 haveless mass than did the original U235 the difference hasbeen converted to energy.
The 200 MeV released per nucleus is not muchenergy. As we pointed out before, a MeV is small com-pared to a Calorie. However, in a kilogram of uranium,there are 2.6 = 1024 nuclei. Thus, in theory, the totalenergy available from the fissioning of all the nuclei in akilogram of uranium is E = 2.6 x 1024 nuclei x 200 MeVx 3.83 x 10-" Calories per MeV, which is 2 x 10¹⁰Calories, or 20 B Calories, the energy equivalent of3,090 tons of coal. Let's look at this fission reaction moreclosely.
Fissioning for EnergyWe have shown how very heaVy nuclei are energeti-
cally ripe for fissioning. They can be viewed as liquiddroplets, which are not spherical but football-shaped,with the protons concentrated at the en Since thenuclear force is very strong, the droplet remains to-gether. However, anything that stretches the nucleusfarther will encourage the electrical repulsion betweenthe opposite ends of the football and split the nucleus. Itis all set to fly apart, all it needs is a trigger.
Neutrons provide the trigger. This uncharged particleis an ideal projectile; the strong electrical force of thehighly charged nucleus can't keep it away. When theneutron hits the nucleus, it not only gives up its own
M is expressed in kilograms and c is taken to be 3 x 10s metersper second, then the energy unit of E will be the joule.

kinetic energy but it drops into the energy well of thenucleus and its binding energy is released.
The nucleils which captured the neutron now is un-stable, it must rid itself of the extra energy. Although thereare many different ways by which this can be accom-plished,, we will consider only the one that leads to fission.That mode is illustrated in Figure A6-2. These heavynuclei are elongated, as in Figure A6-2a, and the nu-dear forces are weak at the ends. tf they go into a certainkind of vibration, they may begin to "neck down," as inFigure A6-2b. When this happens the electrical repul-sion between the protons begins to dominate, the neckstretches, and then breaks, as in Figures A6-2c andA6-2d. The two pieces fly apart carrying the Q00 MeV ofenergy. This kinetic energy is quickly converted to heatenergy by collisions within the nuclear fuel material.
Any heavy nucleus can be caused to fission if it is hitwith a sufficiently energetic neutron, say one of a fewMeV. The nuclei used as bomb and reactor fuel, how-ever, have a very special structural feature: their well foradditional neutrons is deep; the neutrons release 6 MeVor so of binding energy when absorbed by the nuclei.The neutron does not need to bring much kinetic energyof its to such a nucleus, even a very low-energyneutron (a "slow," or "thermal," neutron) wandering bycan be captured, and with the released binding energy,start the fission-producing vibrations. Furthermore, aslow neutron stays in the vicinity of a nucleus longer andis, therefore, more easily,,captured than a fast (ener-getic) one.
There is only one naturally occurring nucleus, the rareisotope of uranium U235 which can capture theseslow neutrons and undergo fission. Two other nuclei,U233 and Pu239, can be produced in a reactor and willalso serve as nuclear fuel. (It is the capacity to producethese fuels that creates most of the interest in thebreeder reactor which we will discuss later.) The reac-tors we presently depend on use U235, which makes uponly 0.7 percent (one nucleus out of 140) of naturaluranium ore. Luckily, U238 is the dominant isotope. Itneeds a fast neutron to make it fission. If this were not
FIGURE A6-2Steps in the Fission Process
(al
the case, any chunk of uranium ore would blow itselfapart, triggered by the "slow" neutrons constantly bom-barding earth from cosmic radiation.
Chain Reactions and Their Control
In order to use U235 as a fuel, we must first gatherenough of it together, then set it off, and, most importantof all, control the reaction. A single U235 nucleus willcapture a neutron, receive the 6 MeV binding energy, gointo the vibrations we describe, and, finally, fission. Thetwo pieces, the so-called "fission products," carry off the200 MeV of kinetic energy.
The 200 MeV from one nucleus is, as we have said,not very much energy. To get usable amounts of energywe have to find some way to make essentially all the1025 or so U235 nuclei in a chunk of uranium undergofission. For this we must rely on the other pieces, theneutrons, which also fly out when the nucleus fissions.These neutrons have a considerable amount of energy,which they quickly lose by collisions with the matteraround them. After they are slowed down, they canstrike other U2" nuclei and cause them to fission.They offer, therefore, the possibility of igniting a "chainreaction" one nucleus releasing neutrons whichcause other nuclei to fission releasing more neutrons,and so on. It is of obvious importance to know how manyneutrons are released per fission. if only one, on theaverage, is released, then the reaction started by a blastof neutrons doesn't grow, but at least continues. Withlessthan one neutron released, it dies out. The explo--sive release of energy we are looking for needs morethan one neutron released per fission. Fortunately, forour need of electric power, the average number of neu-trons released in the fission of U2" is 2.6. This is morethan enough for a chain reaction.
For the chain reaction to proceed, these neutronsmust remain available. They must also be slowed down,for as we have mentioned earlier, slow neutrons aremuch more readily captured by U235. The most effectiveway to accomplish this is to have the neutron strikesomething of its own size a proton, for instance. Insuch a 'collision it loses half of its energy, while in strikinga much heavier nucleus it will only lose a small fractionof its energy. Thus, water, H20, would seem to be agood substance to slow down neutrons a good"moderator," in reactor terminology. Of course, the U238which is always abundantly present in a nuclear fuelsample, also acts as a moderator, but it takesmany morecollisions with this heavy nucleus to slow the neutrons.Other commonly used moderators are "heavy water,"D20, in which the hydrogen is replaced by its chemicallyidentical isotope deuterium (0 is the H2 we have earlieridentified) and carbon, C12 (usually in the form ofgraphite)'. These latter two moderators have.the advan-tage that they do not' "capture" neutrons as hydrogendoes and thereby take them out of the chain reaction.
The size of the uranium fuel assembly is also ofimportance to the success of a chain reaction. If it is toosmall, then neutrons go out through the sides and arelost in that way. The size criterion is embodied in the
265

term "critical mass," which became familiar in discus-sion of the fission bomb. A certain amount of 0235 of agiven concentration is needed before the chain reactioncan occur. When this "critical mass" is assembled,however, the chain reaction begins: a U235 nucleus fis-sions when struck by a slow neutron, the two or moreneutrons released in the fission of this first nucleus flyoff, are Slowed down by collisions with the moderatingsubstance, captured by other U235 nuclei and causethem to fission and release more neutrons, and so on.The chain reaction grows and involves the entire fuelelement in a few thousandths of a second. Uncontrolled,the critical mass explodes. Roughly, this is how an"atomic bomb" works. The fuel is kept in pieces smallerthan the critical mass and then brought together whenon target. What is needed for a nuclear reactor is someway to control, slow down, the "chain reaction."
Controlled fiselon:.To control a fission chain reac-tion, it is necessary to find some way to take enoughneutrons out of circulation with each generation of fis-sion dvents so that the explosive build-up does notoccur. In fact we want sometimes to be able to take outso many neutrons that less than one per fission is avail-able, and thereby to shut off the chain. reaction.
There are several substances which can captureneutrons; boron is one commonly used. This material isput into a control rod which can be pushed into or pulledout of the assembly of fuel rods of the reactor core, as isshown in Figure A6-3. The number that are inserted and
FIGURE A6-3Nuclear Reactor Core
. I:
(1) Control Rods
Coolant Out
(2) Reactor Vessel (top isremovable for refueling)
(3) Thermal Shield
(4) Biological Shield
(5) Core of Solid FuelElements
(6) Water Used as Coolantand Neutron Moderator
Coolant In
Source: "Nuclear Reactors," USAEC, Division of Technical Edu-
cation, P9. 3-
286
the depth to which they are inserted determine the. neutron flux and thus the power level at which the reac-
tor operates.Electronic "neutron counters" are used to control the
setting of the control rods and, when the neutron countraises to a dangerous level, to "scram" the reactor; thatIs, to shoot extra control rods into place and shut thereactor off. ,
In addition to the control rods, it is also possible tostop the chain reaction by adding boron, in the form ofboric acid, to the cooling water circulating in the reactor.MO.St reactors have both of these control and safetytechniques available. Soautomatic. it must be, forrapid and succeeding geseconds apart. Fortunate'
e of the control operation isie build up of neutrons is veryerations are only about 10-4
, in the conventional "lightwater:' reactors (we'll explain this term in the next sec-tion) some neutrons from each generation are delayedby several seconds and thus provide some leeway. Oneof the worries with the plutonium-fueled reactors, suchas the breeder (which we shall discuss later), is thatsince there are not as many delayed neutrons, the con-trolaituation is much more delicate.
Nuclear Power PlantsIn the crude picture of a nuclear reaction which we
have sketched, there are three main elements: fuel,moderator, and controls. The energy is released by thefuel, the moderator feeds low-energy neutrons back intothe fuel to sustain the fission reaction, and the neutron-absorbing controls take the neutrons out of the chainreaction and slow,it down or stop it. Let us look now inmore detail at reactor structure.
Reactor Construction
The working components of a fission reactor areshown schematically in Figure A6-3. The fuel, usually in.,the form of a "sintered" pellet of uranium dioxide, UO2,is contained in a series of "fuel rods." These rods areabout one-half inch in diameter and 12 feet long. Thefuel is contained inside a "Cladding" of some noncorro-sive, light, strong metal such as zirconium.
These fuel rods are then arranged in a bundle of 40 or50 rods and assembled with the "control rods" to form afuel assembly. A commercial reactor contains severalhundred individual fuel rods. In Niagara Mohawk's NineMile Point generating unit, with 625 Mw capacity, thereare 532 bundles of 49 rods containing 115 tons ofuranium oxide pellets.
The rods are surrounded, in United States reactors,by water, which serves a dual purpose. It acts as amoderator by slowing down the fast neutrons releasedby fission, and it also serves as a coolant. This latterfunction is equally important. As we have said, theenergy of the fission products is quickly converted toheat energy by collisions with the remaining material inthe rod. Thus the fuel rods get very hot and wouldquickly melt if the circulating water did not continually
'Heated and formed into a ceramic.

remove the heat energy. This is also the mechanism bywhich the energy of the reactor is retrieved.
'Noes of Reactors
A fuel core and 6ontrol rods plus circulating water, ascoolant and moderator, are the basic components of anoperating nuclear energy conversion device, Also re-quired are ways, to get this heated water to a heatengine, convert it to mechanical work, and turn agenerator. It is in the accomplishment of this heat trans-fer that differentiation between various reactor typestakes place. In this country, at the present time, allcommercial reactors'are thermal, or slow, neutron reac-tors. Light water-moderated, they use enriched uraniumas fuel; that is, uranium in which the amount of U235 hasbeen enhanced by three to four times its natural abun-dance. There are two basic types now in use: the boilingwater reactors, BWR; and the pressurized water reac-tors, PWR. Generically these are the light water reac-tors, LWR.
PWR: The pressurized water reactor contains, as thename suggests, water under very high pressure, as highas 2,000 pounds per square inch. There are, in fact, twoseparate water circulation systems, as is shown in Fig-ure A6-4, and it is the high-pressure system that is incontact with the reactor core. At such high pressureswater does not boil at the normal 212°F and, therefore, itremains a liquid at the 600°F it reaches in the reactor
core. This heat energy is then transferred through a"heat exchange" to the second circulating system of lowpressure water in which it produces steam to drive thesteam turbine.
From the turbine on, the operating machinery is basi-cally the same as in a fossil fuel plant. In particular thereis still need for a third water circulating system to con-dense the steam back to water. In contrast to the firsttwo systems, which are essentially closed, this last oneis open and connected to a body of water or a coolingtower.
In the PWR it is easier to contain the radioactivematerials that inevitably leak through the fuel rod clad:ding. The first pressurized system is completely sepa-rated from the other parts of the system and, in particu-lar, from' the turbine.
The PWR reactor was the first one to be put intocommercial service, at the Shippingsport, Pennsyl-vania, plant in 1957. It Is also the type used in nuclearsubmarines,
BWR: The boiling water reactor has only one circulat-ing water system in which the water is at lowerpressure(about 1:000 pounds per square inch) and is allowed toboil. As is shown in Figu re A6-5, the steam generatedbythis boiling rises to the top of the core region and, afterpassing through steam separators and dryers, is pipeddirectly to the turbo-generators.
FIGURE A6-4Pressurized Water Reactor (PWR)
267

Since the steam comes in contact with the fuel rods inthe BWR, this reactor could release radioactive pollut-ants to the environment. There is always some leakageof fission products from the rods and some water-borneimpurities made radioactive by the neutron flux in thecore.-It is thus important that the steam be tightly con-.tamed and not allowed to escape.
. The first commercial BWR was installed at Common-wealth Edison's Dresden, Illinois, plant in 1960.
HTGR: There is some interest in a new type of reac-tor, thehigh temperature gas-cooled reactor. This reac-tor, while it is a "converter" (like the BWR and PWR) andnot a "breeder," does produce new fissionable material.It differs from the light water converters in havinggraphite as a moderator and helium as a coolant. Thehelium circulating through the core reaches a tempera-ture of 1,400°F and, through a "heat exchanger" (coilsimmersed in water), produces steam at 1,000°F. TheHTGR thus offers the possibility of a thermal efficiencyof 40 percent comparable to the best fossil fuelplants. Studies are also under way on the feasibility ofusing the hot helium directly in gas turbines, whichwould increase their efficiency even more. A problem ofthe HTGR is that the helium must be forced to circulate
rapidly in rder to carry the heat away'. A power loss isthus extra ely serious.
In the H R it is possible to add thorium, Thg32, to thereactor an create more fuel. The thorium nucleus cancapture a sl w neutron and be converted to U233, which,like U215, is good nuclear fuel. This reactor is called an"advanced onverter" since it does create some fuelfor itself out f the non-fissioning component.
An experimental HTGR of 40Mw is in operation at thePhiladelphia Flectric Company's Peach Bottom site,and another of 330 Mw is being constructed at Fort StVrain, Colorado. Whether this type will become important in the future depends on the experience with theseplants and on.the success of the breeder reactors, whichthey to .some extent anticipate.
Breeder ReactorsThe reactors we have discussed so far are classified
as "converters," their major purpose is to convert thefissionable fuel almost exclusively U"5 intoenergy. Although the energy these reactors produce,per ton of fuel, is quite impressive when compared withfossil fuel plants less than 200 tons of uranium peryear for a 1,000 Mw reactor as against 2 million tons of
FIGURE A6-5Boiling Water Reactor (BWR)
268t 4

coal for a coal-fired plant of the same capacity, there arenot many thousands of tons of uranium around. It wasnatural, from the beginning of the nuclear age to look forother fissionable fuels.
What is required to make a nucleus fissi noble byslow neutrons is a particular structure. It has to ave,,sotb speak, a hole for a neutron to fall into so that theprobability of neutron capture will be high and a suffi-cient amount of energy will be reposed. U235 is the onlynaturally occurring nucleus which has that structure.
There are two artificial isotopes, U233 and Pu239, thatcan be created in neutron reactions. U233 is produced bythe neutron bombardMent of Th232 (thorium). Pu239 isproduced in the same way from U238. Since thorium isactually alittle mdre plentiful than uranium, and U238 hasbeen, so far, coiisidered a waste material, the additionof these two elements promises to greatly extend thesupply of fissionable fuels.
In order to "breed" fuel, to produce more fuel by thesereactions than is used in the core, there must be morethan two neutrons per fission available. One of thesesustains the chain reaction and the otherys Used toconvert U238 or Th232. The success of a breeder ismeasured by the breeding ratio, B.R., the ratio of theamount of fissile fuel produced to that used up. A sec-ond measure of importance is the "doubling time," thetime it will take fo; a breeder reactor to produce enoughfuel to run a second reactor.
There are two types of breeder reactors. the thermalbreeder reactor, which uses slow neutruns, and the fastbreeder, which uses more energetic neutrons. Thethermal breeder works with Th232 as fuel and the fastbreeder with U239. Most of the present research anddevelopment effort is going into the fast breeder.
The LMFBR: In the liquid metal fast breeder reactor,(Figure A6-6), unmoderated, "fast" neutrons from the
FIGURE A6-6Liquid Metal Fast Breeder Reactor (LMFBR)
latern4diateHeatExchanger
1150° FPrimary
1100°FSecondarySodium
PrimaryPump
Condensate
Pump Preheater
Steam Generator
01269

.7
chain reacting core produce Pu231 in a surroundingblanket of U238. hl this reactor, the B.R. may be as highas 1.5 and the doubling time 8-10 years. This is ofparticular significance since it is about the doubling timeof electric energy consumption. Thermal breeders areslower, the B.R. is 1.05 and the doubling time 21 years.
Since the neutrons in the LMFBR must be unmoder-ated, water cannot be used as a coolant. What isneeded is a relatively heavy material (to minimize colli-sion energy losses) with good heat transfer propertiesand a high heat capacity. The current choice is moltensodium.
The LMFBR will have the major components shown inFigure A6-6. The reactor core will be immersed in liquidsodium, which, because of its high boiling point, can beheated to 1,150°F. Since this sodium will be made highlyradioactive by neutron bombardment, there will be asecondary sodium' coolant loop between the reactorand the steam generator which wil! produce steam atabout 1,000°F, giving an anticipated thermal efficiencyof 40 percent.
The core will be surrounded by a "blanket" regioncomposed of bundles of rods fabricated from theuranium left over arthe enrichment plant uraniumdepleted of U235, almost pure U238. Pu239 will be pro-duced, therefore, in the blanket as well as in the fuelrods.
There are many problems posed by using sodium asa coolant. It is opaque, making it difficult for the operatorto see into the reactor during refueling and other coremaintenance operations. Sodium also has troublesomechemical properties. While it is compatible and noncor-rosive with stainless steel, it reacts explosively burnsrapidly and instantly on exposure to either air dr waterand great care must be taken to insulate it from either ofthese materials.
At ordinary temperatures, the sodium becomes asolid, which also makes maintenance difficult and posesproblems for reactor start-up. The sodium is slow tobegin its essential circulation and cooling. A' host of
(minor design problems, the need for new types ofvalves, pumps, etc. to handle this liquid metal, awaitsolution.
In the discussion of thermal reactors, we commentedon the stabilizing properties cf the delayed neutrons. Inthe fast neutron breeders this feature is largely missing;only about 0.25 percent of the neutrons (as against 0.7percent in U235 fission) are delayed in U233 or PU239fission, The control situation is, thus, much more deli-cate, fOr there are not as many delayed neutrons to usein correcting mistakes. The fast neutrons add to theproblem. While slow neutrons create another genera-tion of fission events in 10-4 seconds, fast neutronscreate the next round in 10$ seconds. This islaster thaneven most electronic devices can respond. The LMFBRwill be a tricky beast.
Summary
We-have described in this section the conversion ofthe nuclear potential energy of heavy elements into
270
kinetic and then thermal energy by nuclear reactors. Wehave, for the most part, focused our attention on howthey work.
As Source Book readers are surely aware, theemergence of these devices has drawn mixed reactionin the scientific community and from the public. Thepromise of abundant electricity, is not an unmixed bless-ing. To some extent nuclear reactors represent atrade-off the obvious disadvantages of coal as afuel for dangers still largely unquantified. We havedescribed some of the nsks in Chapters 3 and 4 ofVolume I.
It seems apparent, however, that the next decade willbe dominated by reactor building. The nuclear genie isout of his bottle, we will now see how well he is trained.

APPENDIXSource 13 ok Reviewers
264

Source Book Reviewers
Jill BeckerKindergarten TeacherGreenbelt, Maryland
Harold BloomScience CoordinatorAnne Arundel County
Public SchoolsAnnapolis, Maryland
Helen CareyMartin Luther King
Junior High SchoolBeltsville, Maryland
John Fans lerLongfellow Elementary
SchoolColumbia, Maryland
Lorraine GoldingMartin Luther King
Junior High SchoolBeltsville, Maryland
Judith, GreenbergMartin Luther King
Junior High SchoolBeltsville, Maryland
Deborah HeironimusMartin Luther King
Junior High SchoolBeltsville, Maryland
Gloria MacNeesMartin Luther Kihg
Junior High SchoolBeltsville, Maryland
Jerry O'ShaughnessyArgyle Junior High
SchoolSilver Spring, Maryland
Kenneth M. SellHarmony Hills SchoolWheaton, Maryland
V. Jeanne VaughnGovernor Thomas Johnson
High SchoolFrederick, Maryland
273

INDEX
(-4
'3'66

index
Absolute zero, 145, 245absolute temperature scales, 245'definition of, 245
Acid mine drainage, 6, 13, 14Air pollution, ii-iv, 5.6, 31-36
composition of, 31-32, 35control of, 34, 35, 36cost of, 31effects on humans; 32Four Corners, ii-ivmeteorology, 36sources, of, 5-6; 32-35
Alaskan.pipeline, 24-25, 177Aluminum production, 76, 137
recycling, 76Appliances, 75, 135, 162, 169
percent saturation of, 169power rating and energy consumption, 135
Arctic oil, 16, 116, 176See also Alaskan pipeline
Atomic energy, See Nuclear energyAutomobile emission controls, 35-36
Balance of payments, 9, 93-94, 181Black lung, 15Black Mesa, See Southwest utilities complexBottoming cycle, 193Breeder reactor, vii, 7-8, 26, 266-268
plutonium from, 26technology of, 266-268
Brownouts, 4BTU, See Units
Calorie, 104See also, Conversion factors
Capital requirements of energy industry, 57-68, 180,181
Carbon dioxide, See Greenhouse effect, Photosyn-thesis
Carbon monoxide, See air pollutionClimate and energy, 16, 42, 43Coal, ii, iv, vi, 114-115, 153, 178, 185, 189-192
consumption of, 153new technology, 189-192production of, 178resources, 114-115, 185
Coal gasification, See Coal, new technologyCoal mining, iv-v, 13-15Coal mining, underground, 14Combustion, 107, 108Commercial energy conservation, 73-75Commercial energy consumption, 135Continuous sources, See Solar; Geothermal; Wind
powerConversion factors, 240Cooling towers, See Thermal pollution
)57
Demand for energy, See Energy consumptionDams and reservoirs, environmental effects of, 17, 18Deepwater ports, 7, 27, 180-181Domestic energy sources, See Energy supply, Energy
resources, U.S.
Efficiency, 142-149, 246-247equations for 145of heat engines, 142-146, 246-247
Electric charge, 251Electric current, 251-252Electric energy storage, 196-197Electric power, 132-133, 155-158, 162-169, 253-257
consumption, growth in U.S., 162-167consumption, growth in world, 169
-consumption, U.S., 132-133, 155-156consumption, world, 157-158definition of, 253energy loss in transmission, 253generation, 253-256transmission, 256-257
Electric power plants, See Nuclear power plantsElectric utilities, ii -vii, 58-59, 90-91
Four Corners, ii-iiiNorth. Central Plains, vi-vii
Electric energy consumption, See Electric powerElectrical resistance, 253 -
Electricity, 59, 182-183, 251-253price of, 59, 182-183terms and definitions, 251-253
Emission control, See Air pollutionEmployment in the energy industries, 50-51Energy, 47-57, 103-106, 139
and economic growth (GNP), 47-49and the food system, 55-57and personal income, 52-55definition of, 103flow on earth, 105-106transportation of, 139
Energy conservation, 65-82industrial sector, 75-77in residential and commercial sectors 73-75in transportation, 67-73policies, 79-80short-term strategies, 66
Energy companies, 86-90Energy consumption, 131-141, 155-171
by electric utilities, 132-133commercial sector, 135historical record, 155-158industrial sector, 136.138projections of, U.S., 158-162projections cif, world, 169-171residential sector, 133-135transportation, 138-139world, 139-140, 156-158
Energy -crisis,,1 , 2Energy far ping, 205
See alIo Solar energy farmsEnergy, kinetic and potential, 103, 237-239
,277
Energy, from waste, 204-2'05Energy in food production, 8-9, 55-57Energy in foreign affairs, 9Energy Laws, 103-104, 144Energy policy, Federal, See Federal energy policyEnergy policy, private sector, 86-91
coal, 88-89gas, 88oil, 86-88uranium, 89
Energy Policy Project, Ford Foundation, 1, 55, 95-97Energy prices, 93-95, 180-183, 209Energy productivity, 162-167
See also energy and economic growthEnergy resources, 113-127, 183-186
lifetimes, 183-186U.S., 113-123world, 123-127
Energy supply, 175-182Exponential growth, 153, 231-234
doubling time, 153, 233
Federal energy policy, v-vi, 85-92First Law of Thermodynamics, 103Fission, 262-264Fission reactors, See Nuclear power plants
.Food energy, 104Force, 237-239
definition of, 237oissipative forces, 238relationship between force and work, 237-239weight, 237
Fossil fuels, See Coal; Oil; Natural gasFour Corners, ii
See also Southwest utilities complexFuel cells, 197-199Fuel mix, 3, 153-158
U.S. 3, 153world, 156-158
Fusion, 43, 212-217, 262feasibility, 214-215, 216-217laser fusion, 215-216envirsnniental effects, 43
Gasoline, See Energy consumption, transportationGenerators, See, Electric power, generationGeothermal energy, 108-109, 121-122, 206
resources, 121-122GNP, 2
See also Energy, and economic growthGreenhouse ffect, 42
Heat 104, 137, 142, 243-246Heat engine, 144-147, 245-247
efficiency of, 144-146, 245-247ideal cycle, 246
Heat islands, 43Heat pump, 74, 146-147Heat tax, 142, 149, 238Hijacking and bombs, 7-8, 25-27
278
Horsepower, See' UnitsHydrocarbons, 108
See also 'Air pollutionHydroelectric power, 122-126, 154-158
U.S. 122-123, 154world, 126, 157-158
Hydrogen, 28, 197
Industrial energy consumption, 131-138in materials production, 137
Industrial energy conservation, 75-77recycling and waste recovery, 76
Insulation, 73-74Internal combustion engine, See Heat engineIron and steel production, See Industrial energy con-
sumption
Kilowatt, See Units
Land use, 6-7See also Strip mining
Large numbers, notation, 104-105, 231Laser, See FusionLaw of Conservation of Energy, See Energy LawsLead, See Air-pollution-LMFBR, See Breeder reactors
Magnetism, 254-255Magnetohydrodynamic generator (MHD), 192-193Mass, 237MeV, 261
Natural gas, 25, 116-117, 123, 153-154, 183-85'history of consumption, 153-154resources, 116-117, 123resource lifetime, 183-185transportation of, 25
Nitrogen oxides, See Air pollutionNorth Central power complex, vi-vii, 6Nuclear accidents, 40-42Nuclear energy, 108, 261-262
terminology, 261Nuclear force, See ForceNuclear fusion, See FusionNuclear materials shipment, 25-26
See also Hijacking and bombsNuclear power plants, 38-39, 264-268Nuclear waste, 7, 25-26, 39-40Nucleus, See Nuclear energy
Offshore oil, vii, 7, 16, 116Oil, 115-116, 123, 153, 176-183
domestic production, 176-178history of consumption, U.S., 153history of consumption, world, 156importation, 4, 87, 92-95, 178-181resource lifetime, 183resources, U.S. 115-116resources, world, 123
744

Oil embargo, 1-2-Oil shale, vii 6, 16-17, 117-118
resources, 117-118Oil spills, 23-24Ozone, See Air pollution
PANs, See Air pollutionParticulate matter, See Air pollutionPetroleum, See OilPhotochemical smog, See Air pollutionPhotosynthesis, 106-108, 204-206Pipelines, 25
See also Alaskan pipeline; Energy, transportation of;Transportation, energy consumption
Plastics manufacturing, See Industrial energy con-sumption
Plutonium, "vii, 7, 26-27, 42:267-268Pollution control and abateMent, See Air pollution;
Thermal pollutionPollution costs, 31, 59-61Power, 104
Sco also Conversion factors; UnitsPower plantg, See Electric power plants; Nuclear power
plants; Hydroelectric powerPressure, definition of, 244-245Project Independence, 74-77, 92-95Proportionality and equations, 234Pumped storage, 18, 196-197
See also Hydroelectric power; Dams and reservoirs__environmental effects, 18
Pyrolysis, 204
Radioactivity, 261Radioactive pollutants and pollution, 39-40
See also Nuclear wastesReactor accidents, See Nuclear accidentsReclamation, strip mining, See Strip miningRecycling, See Industrial energy conservationRefrigerated tankers, 27-28Refrigerators, See Heat pumps; Residential energy
conservation; Residential energy consumptionResidential energy conservation, 73-:75Residential energy consumption, 133-134Resource lifetimes, See Coal; Natural gas; Oil; UraniumResources, See Energy resources, U.S. and world;
Energy suppliesRespiratory disease, See Air pollution; Black lung
Second Law of Thermodynamics, 103-104, 144,148-149
Semi logarithmic graphs, See Exponential growthShale oil, See Oil shaleSmog, See Air pollutionSolar energy, 18, 105-108, 113, 203-212
comparison with other sources, 113environmental effects, 18secondary sources, 203-206solar cells, 209-210solar homes, 206-209'solar sea plant, 212
Solar energy farm, 211-212Solar satellite power station, 212-213Soot, See Air pollutionSources of continuous power, See Solar energy;
Geothermal energy; wind power; Hydroelectric,power
Southwest utilities complex, i-vi, Steam turbine, 145Strip mining, iv-v, 6, 13-14, 15
See also Oil shale; Uraniumreclamation, 15
Sulfur oxides, See Air pollutionSupertankers, vii, 7, 23, 57, 180-181System efficiencies, 147-148
Tar sands, 118Temperature, 243
See also Absolute zeroTemperature inversion, See Air pollutionThermal pollution, 6, 36-38Thermonuclear reactions, See FusionThorium, 121-, 124
See also. Breeder reactorsresource, U.S., 121resource, world, 124
Tidal energy, 109, 121, 203Topping cycle, 191, 192Transformers, 256Transmision and distribution of electric power,
Electric powerTransportation, energy conservation. in, 67-78
energy intensiveness of various modes, 68-70Transportation, energy consumption in, 138, 140Transmission lines, 25
See also Energy, transportation of; Electric power,transmission of
Transportation of energy, See Energy, transportation of
Units, 104, 239Uranium, 15-16, 119-121, 124, 185-186, 262-264
mining, 15-16resource lifetimes, 185-186resources, U.S. 119-121resources, world, 124
Voltage, 251-253A.C. and D.C., 252
Water power, See Hydroelectric powerWankel engine, 142Water pollution, See 'thermal pollutionWater use, iv, 6
See also Thermal pollutionWatt, See UnitsWind power, 106, 203-204Winds, See Air pollution, meteorologyWood, 153
See also Energy farmingWork, 104, 237.238
definition of, 238World energy supplies, See Energy resources, U.S. and
world
See
-279

.
:
.