User Virtual Environment for Ecosystem Science - ERIC
15
International Journal of Virtual and Personal Learning Environments, 5(4), 1-15, October-December 2014 1 Copyright © 2014, IGI Global. Copying or distributing in print or electronic forms without written permission of IGI Global is prohibited. ABSTRACT In incorporating technology in science education, some have expressed concern that the value added by technology is primarily due to the novelty or excitement about using the devices, resulting in no lasting effect on student motivation or learning in science. This research addresses this concern through evaluation of student motivation during a two-week, multi-user virtual environment (MUVE)-based curriculum for middle school ecosystems science. Analysis of multiple surveys at the beginning, middle, and end of the curriculum found that students continued to find the activity engaging from beginning to end, while student value of its utility in helping them learn science increased significantly. Furthermore, while initial student engagement resided primarily at the technology interface level, with time and experience students became increasingly engaged in the student-led, collaborative inquiry experiences afforded by the embedded scientific investigation. Shifts in Student Motivation during Usage of a Multi- User Virtual Environment for Ecosystem Science Shari Metcalf, Harvard Graduate School of Education, Cambridge, MA, USA Jason Chen, College of William & Mary, Williamsburg, VA, USA Amy Kamarainen, Harvard Graduate School of Education, Cambridge, MA, USA Kim Frumin, Harvard Graduate School of Education, Cambridge, MA, USA Trisha Vickrey, University of Nebraska-Lincoln, Lincoln, NE, USA Tina Grotzer, Harvard Graduate School of Education, Cambridge, MA, USA Chris Dede, Harvard Graduate School of Education, Cambridge, MA, USA Keywords: EcoMUVE Pond Module, EcoMUVE, Inquiry-Based Teaching, Multi-User Virtual Environments (MUVEs), Virtual Avatar DOI: 10.4018/IJVPLE.2014100101
-
Upload
khangminh22 -
Category
Documents
-
view
2 -
download
0
Transcript of User Virtual Environment for Ecosystem Science - ERIC
International Journal of Virtual and Personal Learning Environments, 5(4), 1-15, October-December 2014 1
Copyright © 2014, IGI Global. Copying or distributing in print or electronic forms without written permission of IGI Global is prohibited.
ABSTRACTIn incorporating technology in science education, some have expressed concern that the value added by technology is primarily due to the novelty or excitement about using the devices, resulting in no lasting effect on student motivation or learning in science. This research addresses this concern through evaluation of student motivation during a two-week, multi-user virtual environment (MUVE)-based curriculum for middle school ecosystems science. Analysis of multiple surveys at the beginning, middle, and end of the curriculum found that students continued to find the activity engaging from beginning to end, while student value of its utility in helping them learn science increased significantly. Furthermore, while initial student engagement resided primarily at the technology interface level, with time and experience students became increasingly engaged in the student-led, collaborative inquiry experiences afforded by the embedded scientific investigation.
Shifts in Student Motivation during Usage of a Multi-
User Virtual Environment for Ecosystem Science
Shari Metcalf, Harvard Graduate School of Education, Cambridge, MA, USA
Jason Chen, College of William & Mary, Williamsburg, VA, USA
Amy Kamarainen, Harvard Graduate School of Education, Cambridge, MA, USA
Kim Frumin, Harvard Graduate School of Education, Cambridge, MA, USA
Trisha Vickrey, University of Nebraska-Lincoln, Lincoln, NE, USA
Tina Grotzer, Harvard Graduate School of Education, Cambridge, MA, USA
Chris Dede, Harvard Graduate School of Education, Cambridge, MA, USA
Keywords: EcoMUVE Pond Module, EcoMUVE, Inquiry-Based Teaching, Multi-User Virtual Environments (MUVEs), Virtual Avatar
DOI: 10.4018/IJVPLE.2014100101
Copyright © 2014, IGI Global. Copying or distributing in print or electronic forms without written permission of IGI Global is prohibited.
2 International Journal of Virtual and Personal Learning Environments, 5(4), 1-15, October-December 2014
INTRODUCTION AND THEORETICAL FRAMEWORK
Multi-user virtual environments (MUVEs) are an internet-based technology that has become increasingly popular. A MUVE can be described as a 3-D graphical world or worlds used to create a simulated immersive experience. The user is represented by a virtual avatar, and interacts with the environment by controlling the moves and actions of this avatar through the 3-D environment. Participants in a MUVE may have a variety of tools with which to interact with virtual objects, and also opportunities to communicate and interact with other users and with computer-based agents in simulated environments.
MUVE’s have also become recognized as promising educational platform. MUVEs can simulate environments otherwise impossible in school settings, providing opportunities for classroom students to explore simulated worlds, travel in space and time, and explore events at different scales (e.g., Barab, Thomas, Dodge, Carteaux, & Tuzun, 2005; Kafai, 2010; Omale, Hung, Luetkehans, & Cooke‐Plagwitz, 2009). In particular, there has been significant recent work on the use of MUVEs in science education, and MUVEs have been found to be effective in engaging middle and high school students in learning science, through shared participation in rich immersive experiences (Clarke, Dede, Ketelhut, & Nelson, 2006; Trindade, Fiolhais, & Almeida, 2002; Lim, Nonis, & Hedberg, 2006; Nelson & Ketelhut, 2007; Dede, 2009).
One issue involved in incorporating any new technology in science education, however, is the concern that the value added by technol-ogy is primarily due to the novelty effect - “the increased effort and attention research subjects tend to give to media that are novel to them” (Clark, 1983). More recent studies using multi-user virtual environments (MUVEs) for education have found that in the short term, students enjoy these virtual worlds primarily because the technology is new to them, in particular the ability to move around freely in a 3D space, to interact with virtual people and
simulated experiences (Hew & Cheung, 2010). For example, research with one science MUVE found that most students said they enjoyed the MUVE because of the freedom to explore, which could serve as an extrinsic motivation to learn science concepts, but they also report that often, engagement in the MUVE did not necessarily lead to engagement in the learning task, and could in fact be a distraction (Lim et al., 2006). Research on the use of technology for learning therefore emphasizes the importance of designing the technology in ways that best serve the learning goals (e.g., Tamim, Bernard, Borokhovski, Abrami, & Schmid, 2011), and taking advantage of the learning affordances of MUVEs, so that “sound instructional design and pedagogy will prevail over the mere novelty of the technology” (Dalgarno & Lee, 2010).
This paper presents research on changes in student motivation during EcoMUVE, a two-week, MUVE-based curriculum (Metcalf, Kamarainen, Tutwiler, Grotzer, Dede, 2011). A motivation survey was administered three times to students, at the beginning, middle, and end of the curriculum, and the student responses were analyzed to determine whether student engagement can be attributed to novelty, which may attenuate with exposure to the technology, or whether engagement centers on the learning activities – the student-led, collaborative inquiry experiences afforded by the immersive virtual environment.
EcoMUVE is a 10-day middle school sci-ence curriculum that supports learning about causal patterns in ecosystems. It consists of two ecosystem modules, Pond and Forest, each centered on an immersive virtual environment that represents a complex causal scenario. The software is designed using an inquiry, role-based jigsaw pedagogy. Students work individually on computers, using a virtual avatar to explore the 3D ecosystem. They work together in teams of four in which each student has a distinct “role” (water chemist, microscopic specialist, natural-ist, and private investigator). Students collect data specific to their roles, and then work with their team to analyze the combined data and understand the ecosystem interrelationships
Copyright © 2014, IGI Global. Copying or distributing in print or electronic forms without written permission of IGI Global is prohibited.
International Journal of Virtual and Personal Learning Environments, 5(4), 1-15, October-December 2014 3
and investigate an ecological “mystery.” The module culminates in each team creating an evidence-based concept map representing their understanding of the causal relationships in the ecosystem and presenting it to the class.
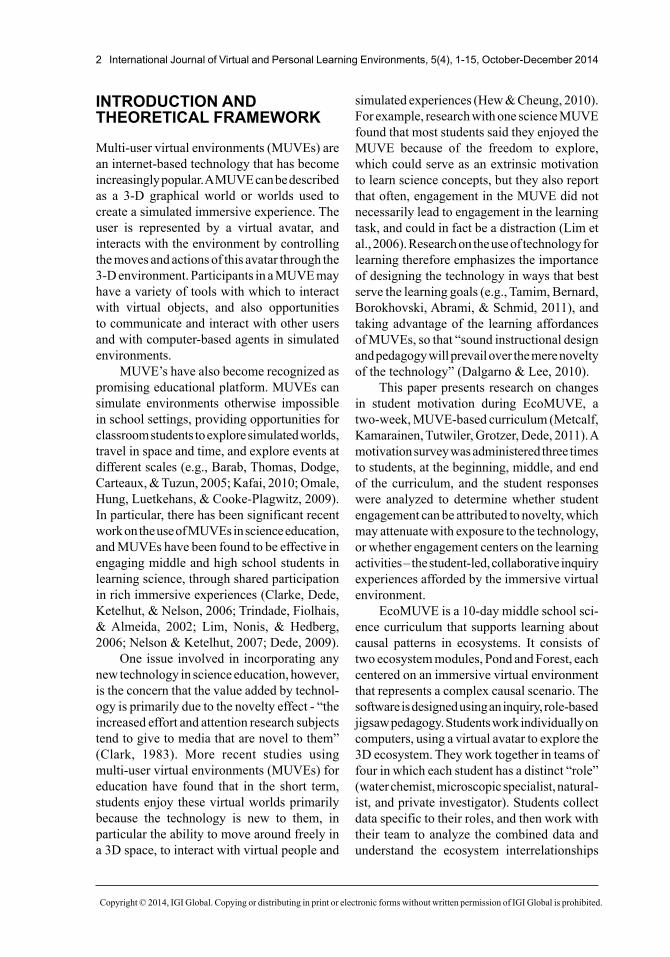
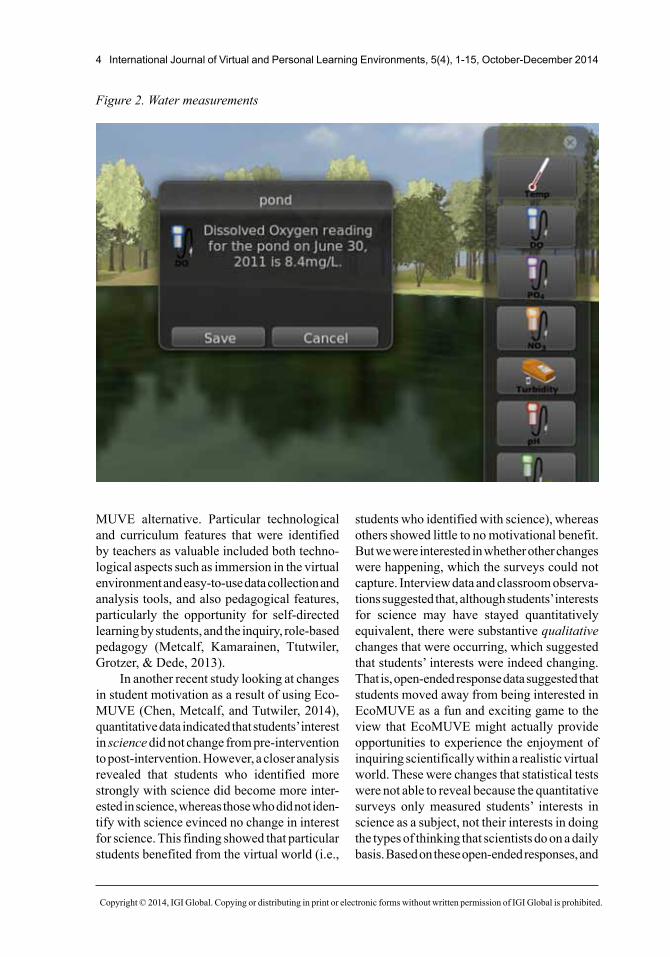
In the EcoMUVE Pond module, used for the study presented in this paper, students explore a pond and its surroundings (Figure 1). They can travel in time over eight virtual days during a simulated summer. They discover that on one day late in the summer, all of the large fish have died. To figure out the causal relationships that led to the fishkill, they can explore, observe, and collect data – they find and photograph organisms, shrink to microscopic size, travel in time, collect water, weather, and population measurements, track atoms, and use tables and graphs to view and analyze data over time (Figure 2). Each team creates a final concept map and presentation of their hypotheses, which may include factors including fertilizer runoff
from a nearby housing development or golf course, measurements of phosphates, nitrates, turbidity, temperature and dissolved oxygen, weather factors of wind, temperature, and cloud cover, and populations of fish, herons, algae and bacteria.
Prior research with EcoMUVE has demon-strated significant student gains in ecosystem science knowledge and causal understanding (Kamarainen, Metcalf, Grotzer & Dede, 2012; Metcalf, Kamarainen, Tutwiler, Grotzer & Dede, 2011). A study on teacher perceptions of EcoMUVE in the classroom surveyed 16 teachers who had used the curriculum with their students, about the value, effectiveness, and feasibility of EcoMUVE based on their experiences, and some teachers additionally participated in a comparison study of EcoMUVE with a non-MUVE curriculum. Teachers felt EcoMUVE was effective, aligned well with standards, and compared favorably with a non-
Figure 1. Pond module
Copyright © 2014, IGI Global. Copying or distributing in print or electronic forms without written permission of IGI Global is prohibited.
4 International Journal of Virtual and Personal Learning Environments, 5(4), 1-15, October-December 2014
MUVE alternative. Particular technological and curriculum features that were identified by teachers as valuable included both techno-logical aspects such as immersion in the virtual environment and easy-to-use data collection and analysis tools, and also pedagogical features, particularly the opportunity for self-directed learning by students, and the inquiry, role-based pedagogy (Metcalf, Kamarainen, Ttutwiler, Grotzer, & Dede, 2013).
In another recent study looking at changes in student motivation as a result of using Eco-MUVE (Chen, Metcalf, and Tutwiler, 2014), quantitative data indicated that students’ interest in science did not change from pre-intervention to post-intervention. However, a closer analysis revealed that students who identified more strongly with science did become more inter-ested in science, whereas those who did not iden-tify with science evinced no change in interest for science. This finding showed that particular students benefited from the virtual world (i.e.,
students who identified with science), whereas others showed little to no motivational benefit. But we were interested in whether other changes were happening, which the surveys could not capture. Interview data and classroom observa-tions suggested that, although students’ interests for science may have stayed quantitatively equivalent, there were substantive qualitative changes that were occurring, which suggested that students’ interests were indeed changing. That is, open-ended response data suggested that students moved away from being interested in EcoMUVE as a fun and exciting game to the view that EcoMUVE might actually provide opportunities to experience the enjoyment of inquiring scientifically within a realistic virtual world. These were changes that statistical tests were not able to reveal because the quantitative surveys only measured students’ interests in science as a subject, not their interests in doing the types of thinking that scientists do on a daily basis. Based on these open-ended responses, and
Figure 2. Water measurements
Copyright © 2014, IGI Global. Copying or distributing in print or electronic forms without written permission of IGI Global is prohibited.
International Journal of Virtual and Personal Learning Environments, 5(4), 1-15, October-December 2014 5
the literature discussed above, we hypothesized that students’ interests experienced a qualitative shift from enjoying the “fun” and novel aspects of EcoMUVE to an enjoyment of solving prob-lems in a scientific fashion.
For this study, we administered an open-ended motivation survey at the beginning, middle, and end of the ten-day EcoMUVE curriculum, in order to explore qualitative changes in student motivation during the study. We predicted that student responses after the first day might center on excitement with the ability to explore and interact in a virtual world, consistent with related research on novelty and technology. However, by the end of the two-week experience, we predicted that the students, like their teachers, would be more likely to praise the pedagogical aspects of the curriculum in getting to work together, like scientists, to solve an ecological mystery.
METHODS
Participants were the 6th grade students (11-12 years old) of two science teachers at a relatively affluent and 70% White suburban school in the Northeastern United States. Each teacher taught five classes, for a total of 250 students. Of that population, we analyzed data only from the students who completed all three checkpoint surveys, for a total N=198.
The students were not surveyed for com-puter literacy or prior experience with MUVEs, but computer gaming is almost universal among this demographic – one recent survey found that in the United States 11- to 14-year-olds spend an average of an hour and a half a day playing video games (Rideout, Foehr, & Roberts, 2010). Another survey reports that 97% of American youth aged 12 to 17 play computer, console, portable or cell phone games, and half of teens play on any given day, usually for about an hour (Lenhart, Kahne, Middaugh, Macgill, Evans, & Vitak,, 2008). However, MUVE-based classroom curricula are rare; this was almost certainly the students’ first experience with
MUVEs in a classroom environment. Some of the students’ survey comments indicated their initial excitement at that novelty, e.g., “This is kind of like playing a game in school!”
Students used the EcoMUVE Pond cur-riculum module over 10 consecutive classes. Students were polled with identical “check-point” surveys at the beginning, middle, and end of their use of EcoMUVE: after day 1, day 5, and day 10. The survey included a total of 8 Likert-scale questions on their value beliefs, and four open-ended questions.
The Likert-scale variables assessed were as follows: Interest (four questions such as, “I like using EcoMUVE”), utility (two questions such as, “I think the skills that I’m using with EcoMUVE will be useful”), and cost value (one question: “It was a waste of time doing EcoMUVE.”). One additional Likert-scale question assessed whether students thought they learned anything by using EcoMUVE. We did not include this in the quantitative analysis, however, because this question did not neces-sarily fit into a specific theoretical framework of motivation. Instead, we looked at students’ thoughts about what they had learned using EcoMUVE during the open-ended response section (see below).
Students used a 6-point scale to select how true or false each statement was for them: 1=Definitely false, 2=Mostly false, 3=A little bit false, 4=A little bit true, 5=Mostly true, 6=Definitely true. Mean scores were then cal-culated for each variable, with the exception of cost value, which only had one item.
The four open-ended questions were de-signed to probe for qualitative responses about interest and utility, as follows:
• What do you like about EcoMUVE so far?• Is there anything you don’t like about
EcoMUVE?• In what ways do you think EcoMUVE is
helping you learn science?• How is learning science with EcoMUVE
different from typical activities you’ve done in science class?
Copyright © 2014, IGI Global. Copying or distributing in print or electronic forms without written permission of IGI Global is prohibited.
6 International Journal of Virtual and Personal Learning Environments, 5(4), 1-15, October-December 2014
The open-ended questions were analyzed using an initial coding that focused on our research questions about the impact of the technology and the impact of the curriculum. Since students often wrote answers that included more than one element, a long answer might receive more than one code. Emergent codes were added during the coding process to classify responses that did not match previous codes. A second phase of analysis identified similarities and grouped the codes into larger themes. Using the final set of codes, the responses were scored by two independent scorers with inter-rater reli-ability assessed at 89% overall, ranging from 73% to 100% for the categories.
FINDINGS
Quantitative Changes in Interest, Utility, and Cost Value
Two one-way, repeated measures ANOVAs were conducted to evaluate the change in stu-dents’ beliefs about interest, utility, and cost value across the three time points. Sphericity tests showed that the sphericity assumption was not violated in any of the cases. Therefore, degrees of freedom did not need to be cor-rected. Results from these analyses showed that interest in EcoMUVE decreased significantly from Checkpoint 1 to Checkpoint 2 [F(1, 194) = 10.14, p=.0017] and from Checkpoint 2 to Checkpoint 3 [F(1, 194) = 6.70, p=.0104]. De-spite this, students’ interest in EcoMUVE overall remained very high throughout the duration of the two-week activity (i.e., ratings remained between 5 and 6, which correspond to responses of “mostly true” and “definitely true”).
Regarding students’ beliefs about the utility of EcoMUVE, results showed that stu-dents’ evinced a significant improvement in their beliefs about how useful EcoMUVE was from Checkpoint 1 to Checkpoint 2 [F(1, 195) = 20.73, p<.001], but no significant change from Checkpoint 2 to Checkpoint 3 [F(1, 195) = 1.03, p=.3110]. Finally, regarding students’ beliefs about whether EcoMUVE was worth the time and effort, students reported a significant
decrease in EcoMUVE being a “waste of time” from Checkpoint 1 to Checkpoint 2 [F(1, 194) = 47.69, p<.001], and a small but significant increase in that belief from Checkpoint 2 to Checkpoint 3 [F(1, 194) = 5.20, p=.0237]. Mean Likert-scale responses for each of the three measures, over the three checkpoints, are presented in Figure 3.
To look for potential population-level differences in student engagement with the EcoMUVE, we also examined Pearson product-moment correlations between a proxy measure of student learning potential, a question asking teachers to rate how well they expect their students to be able to learn science content, and three of the affective outcomes: interest, utility, interest, and cost value. We found that teacher expectation was not linearly related to utility and interest, though there was a moder-ate negative statistically-significant correlation (r=-0.243, p<.05) between teacher expectation and cost value.
Qualitative Changes in Interest and Utility
Open-Ended Response 1: “What Do You Like About EcoMUVE So Far?”
Student gave a wide variety of answers to this question, from a simple “It was fun.” to long answers describing details of the software and/or the activities. Many of the answers were given multiple codes. In our analysis, we focused on two categories of responses – elements of the technology and elements of the curriculum.
Responses that were coded for technology include those that mentioned computers, virtual worlds, games, or being online. For example:
• That you got to use a computer.• I like that there is a virtual pond.• It is like a video game, also it has lots of
animals and stuff.
Responses coded for interactive features include those that mentioned features like re-alistic graphics, specific EcoMUVE tools, or

Copyright © 2014, IGI Global. Copying or distributing in print or electronic forms without written permission of IGI Global is prohibited.
International Journal of Virtual and Personal Learning Environments, 5(4), 1-15, October-December 2014 7
interactive activities like searching, finding, and exploring. For example:
• In EcoMUVE, I really like how you can go underwater with a submarine and take pictures of living things. Two of the reasons I like EcoMUVE is because I can travel through time and gather different measurements.
• I liked the animals and taking pictures and finding populations.
• I liked how you had a field guide to know more about living things.
Some responses were coded for both tech-nology and for interactive features. For example:
• What i like about ecomuve so far is that it is a virtual world kind of like simms the game. It is fun to search for objects.
• I like how it is easier to do things, and I can take measurements quicker. It is fun going online and doing science.
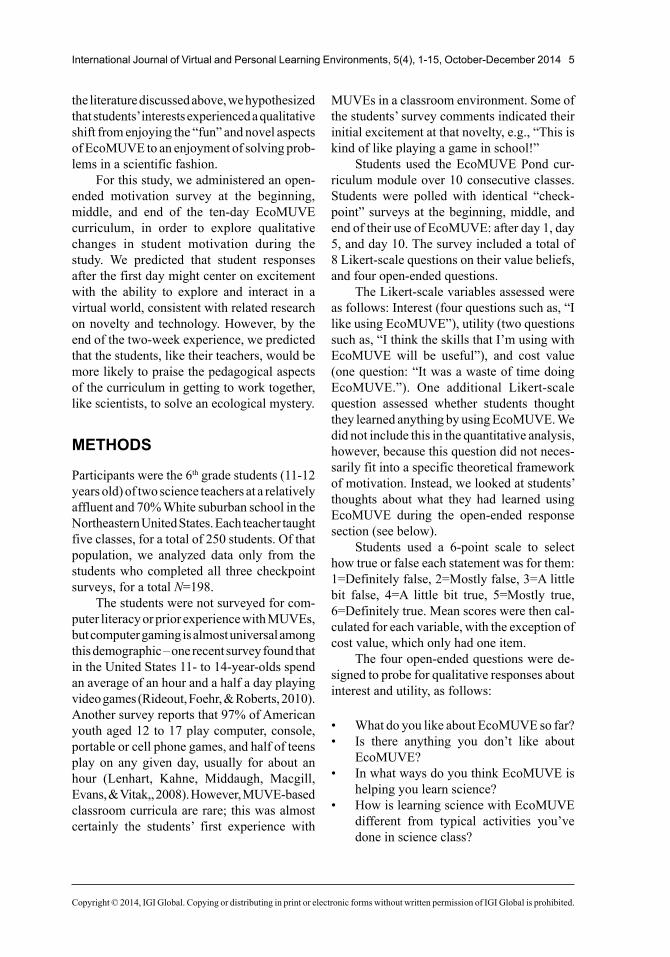
The percentage of responses that specifi-cally mentioned the technology itself remained about the same through the three checkpoints, around 20%. References to interactive features were found in 70% of responses in checkpoint 1, decreasing but still frequent at 42% at check-point 2 and 46% at checkpoint 3 (Figure 4).
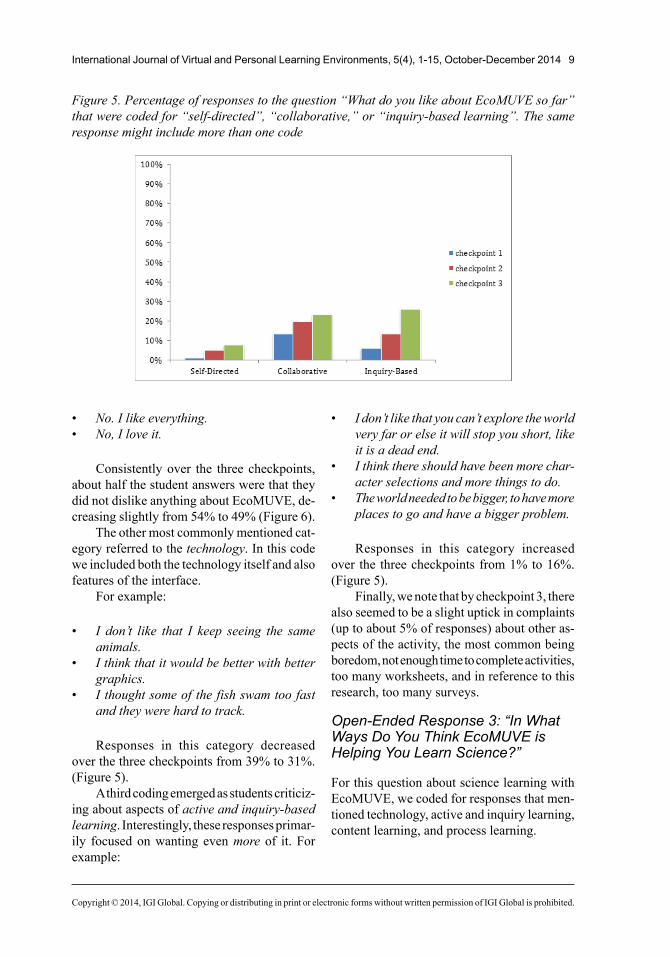
The second category of coding referred curricular elements – aspects of the pedagogical design. Here, the specific codes we identified referred to self-directed, collaborative, and inquiry-based activities.
Responses that were coded for self-directed include those that mentioned freedom, being on your own, getting to control elements of the interface, work independently, or take on a role. For example:
• I like how I can learn to do new things by myself.
• I like that it’s created so that I’m in control. I like that I can change the date whenever I want to.
• There was a lot of freedom.
Figure 3. Mean Likert-scale responses for interest, utility value, and cost value, over the 3 checkpoints
Copyright © 2014, IGI Global. Copying or distributing in print or electronic forms without written permission of IGI Global is prohibited.
8 International Journal of Virtual and Personal Learning Environments, 5(4), 1-15, October-December 2014
Responses that were coded for collabora-tive mentioned working with others or on a team. For example:
• I liked how we were able to interact and work together with people in our groups.
• I love it! I think it is an amazing idea to get students working together.
Responses that were coded for inquiry-based mentioned solving a mystery, figuring out what killed the fish, or being like a scientist. For example:
• I liked how you could go into nature to find out what was wrong. Not just talking about it.
• I like how you learn facts, and face problems like a scientist.
• The fact that we are using what we find in the pond to solve the mystery of the fish dying.
Some responses included more than one of these elements, as follows:
• I like that you can see and chat with your friends in your group. Also I like how we
can try to solve a mystery. (collaborative and inquiry-based)
• I like to use EcoMUVE because I love to play different roles with my friends to find a solution to a problem. (self-directed, col-laborative, and inquiry-based)
• It helps us in science because we do this with a group to help us. Instead of having the answer told to us, we did the EcoMUVE to find it out ourselves. (self-directed, col-laborative, and inquiry-based)
The percentage of responses started low and increased in each of these three pedagogical categories increased over time, up to 26% who mentioned inquiry-based learning in checkpoint 3 (Figure 5).
Open-Ended Response 2: “Is There Anything You Don’t Like About EcoMUVE?”
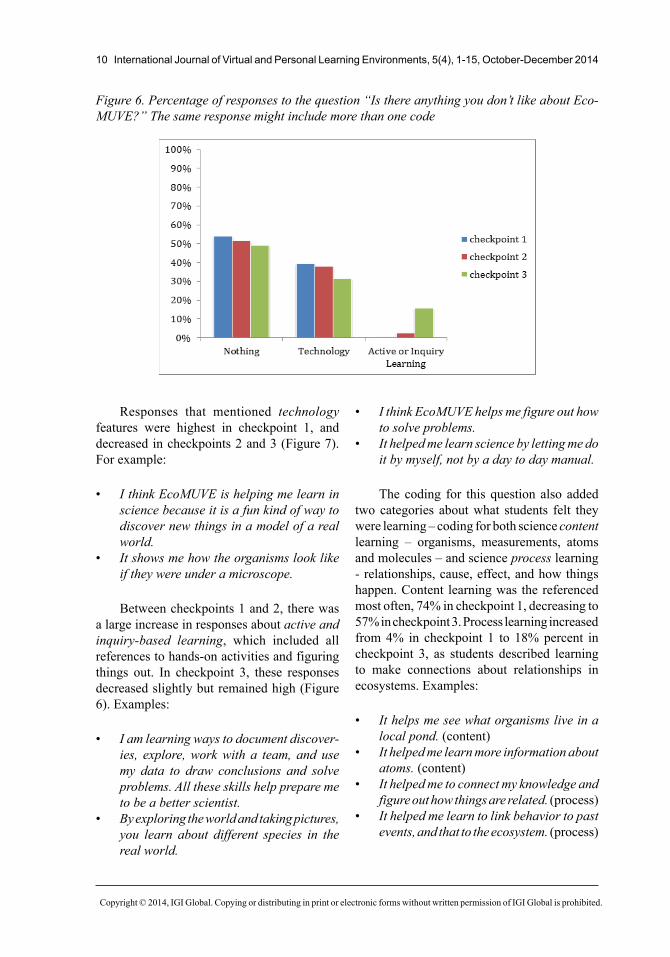
The second question on each checkpoint survey asked if there was anything the student didn’t like about EcoMUVE. Gratifyingly, we found that by far the most common response to this question was that there was nothing the student didn’t like about EcoMUVE:
Figure 4. Percentage of responses to the question “What do you like about EcoMUVE so far” that were coded for “technology” and for “interactive features of the software.” The same response might include more than one code. (All percentages reported based on (N=198) responses.)
Copyright © 2014, IGI Global. Copying or distributing in print or electronic forms without written permission of IGI Global is prohibited.
International Journal of Virtual and Personal Learning Environments, 5(4), 1-15, October-December 2014 9
• No. I like everything.• No, I love it.
Consistently over the three checkpoints, about half the student answers were that they did not dislike anything about EcoMUVE, de-creasing slightly from 54% to 49% (Figure 6).
The other most commonly mentioned cat-egory referred to the technology. In this code we included both the technology itself and also features of the interface.
For example:
• I don’t like that I keep seeing the same animals.
• I think that it would be better with better graphics.
• I thought some of the fish swam too fast and they were hard to track.
Responses in this category decreased over the three checkpoints from 39% to 31%. (Figure 5).
A third coding emerged as students criticiz-ing about aspects of active and inquiry-based learning. Interestingly, these responses primar-ily focused on wanting even more of it. For example:
• I don’t like that you can’t explore the world very far or else it will stop you short, like it is a dead end.
• I think there should have been more char-acter selections and more things to do.
• The world needed to be bigger, to have more places to go and have a bigger problem.
Responses in this category increased over the three checkpoints from 1% to 16%. (Figure 5).
Finally, we note that by checkpoint 3, there also seemed to be a slight uptick in complaints (up to about 5% of responses) about other as-pects of the activity, the most common being boredom, not enough time to complete activities, too many worksheets, and in reference to this research, too many surveys.
Open-Ended Response 3: “In What Ways Do You Think EcoMUVE is Helping You Learn Science?”
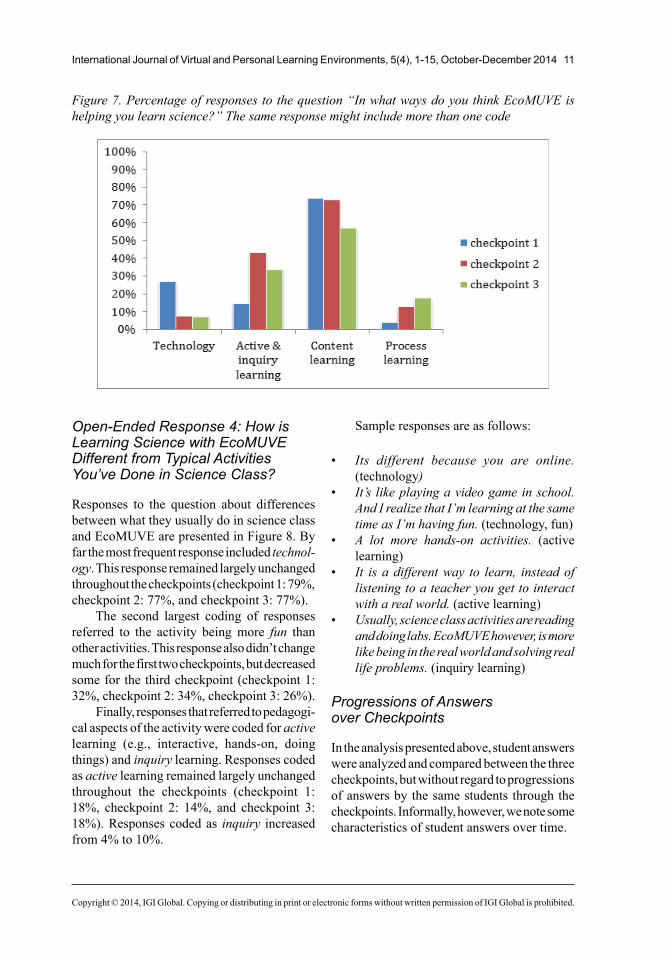
For this question about science learning with EcoMUVE, we coded for responses that men-tioned technology, active and inquiry learning, content learning, and process learning.
Figure 5. Percentage of responses to the question “What do you like about EcoMUVE so far” that were coded for “self-directed”, “collaborative,” or “inquiry-based learning”. The same response might include more than one code
Copyright © 2014, IGI Global. Copying or distributing in print or electronic forms without written permission of IGI Global is prohibited.
10 International Journal of Virtual and Personal Learning Environments, 5(4), 1-15, October-December 2014
Responses that mentioned technology features were highest in checkpoint 1, and decreased in checkpoints 2 and 3 (Figure 7). For example:
• I think EcoMUVE is helping me learn in science because it is a fun kind of way to discover new things in a model of a real world.
• It shows me how the organisms look like if they were under a microscope.
Between checkpoints 1 and 2, there was a large increase in responses about active and inquiry-based learning, which included all references to hands-on activities and figuring things out. In checkpoint 3, these responses decreased slightly but remained high (Figure 6). Examples:
• I am learning ways to document discover-ies, explore, work with a team, and use my data to draw conclusions and solve problems. All these skills help prepare me to be a better scientist.
• By exploring the world and taking pictures, you learn about different species in the real world.
• I think EcoMUVE helps me figure out how to solve problems.
• It helped me learn science by letting me do it by myself, not by a day to day manual.
The coding for this question also added two categories about what students felt they were learning – coding for both science content learning – organisms, measurements, atoms and molecules – and science process learning - relationships, cause, effect, and how things happen. Content learning was the referenced most often, 74% in checkpoint 1, decreasing to 57% in checkpoint 3. Process learning increased from 4% in checkpoint 1 to 18% percent in checkpoint 3, as students described learning to make connections about relationships in ecosystems. Examples:
• It helps me see what organisms live in a local pond. (content)
• It helped me learn more information about atoms. (content)
• It helped me to connect my knowledge and figure out how things are related. (process)
• It helped me learn to link behavior to past events, and that to the ecosystem. (process)
Figure 6. Percentage of responses to the question “Is there anything you don’t like about Eco-MUVE?” The same response might include more than one code
Copyright © 2014, IGI Global. Copying or distributing in print or electronic forms without written permission of IGI Global is prohibited.
International Journal of Virtual and Personal Learning Environments, 5(4), 1-15, October-December 2014 11
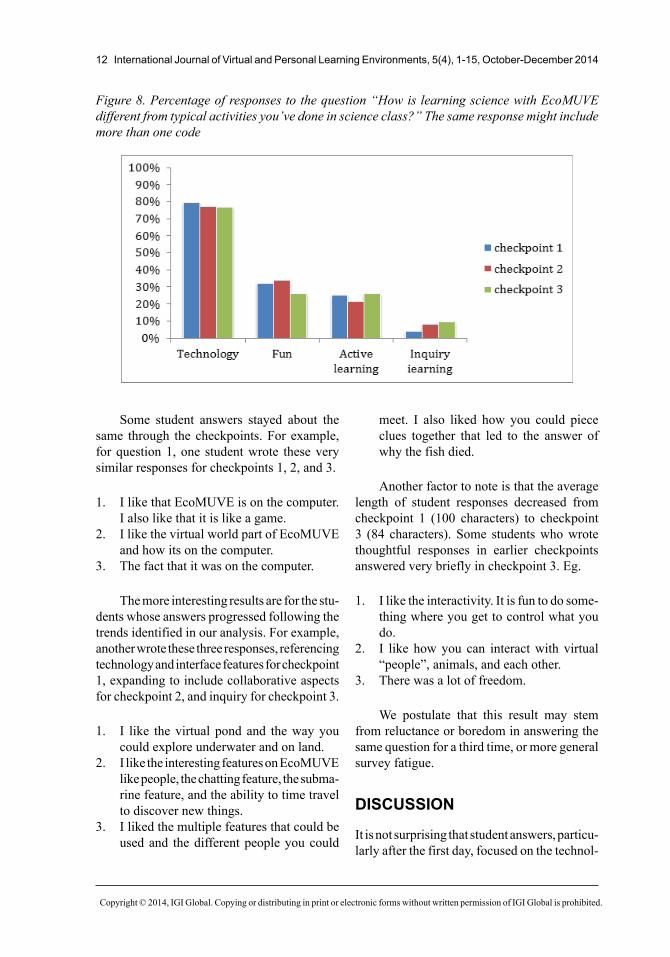
Open-Ended Response 4: How is Learning Science with EcoMUVE Different from Typical Activities You’ve Done in Science Class?
Responses to the question about differences between what they usually do in science class and EcoMUVE are presented in Figure 8. By far the most frequent response included technol-ogy. This response remained largely unchanged throughout the checkpoints (checkpoint 1: 79%, checkpoint 2: 77%, and checkpoint 3: 77%).
The second largest coding of responses referred to the activity being more fun than other activities. This response also didn’t change much for the first two checkpoints, but decreased some for the third checkpoint (checkpoint 1: 32%, checkpoint 2: 34%, checkpoint 3: 26%).
Finally, responses that referred to pedagogi-cal aspects of the activity were coded for active learning (e.g., interactive, hands-on, doing things) and inquiry learning. Responses coded as active learning remained largely unchanged throughout the checkpoints (checkpoint 1: 18%, checkpoint 2: 14%, and checkpoint 3: 18%). Responses coded as inquiry increased from 4% to 10%.
Sample responses are as follows:
• Its different because you are online. (technology)
• It’s like playing a video game in school. And I realize that I’m learning at the same time as I’m having fun. (technology, fun)
• A lot more hands-on activities. (active learning)
• It is a different way to learn, instead of listening to a teacher you get to interact with a real world. (active learning)
• Usually, science class activities are reading and doing labs. EcoMUVE however, is more like being in the real world and solving real life problems. (inquiry learning)
Progressions of Answers over Checkpoints
In the analysis presented above, student answers were analyzed and compared between the three checkpoints, but without regard to progressions of answers by the same students through the checkpoints. Informally, however, we note some characteristics of student answers over time.
Figure 7. Percentage of responses to the question “In what ways do you think EcoMUVE is helping you learn science?” The same response might include more than one code
Copyright © 2014, IGI Global. Copying or distributing in print or electronic forms without written permission of IGI Global is prohibited.
12 International Journal of Virtual and Personal Learning Environments, 5(4), 1-15, October-December 2014
Some student answers stayed about the same through the checkpoints. For example, for question 1, one student wrote these very similar responses for checkpoints 1, 2, and 3.
1. I like that EcoMUVE is on the computer. I also like that it is like a game.
2. I like the virtual world part of EcoMUVE and how its on the computer.
3. The fact that it was on the computer.
The more interesting results are for the stu-dents whose answers progressed following the trends identified in our analysis. For example, another wrote these three responses, referencing technology and interface features for checkpoint 1, expanding to include collaborative aspects for checkpoint 2, and inquiry for checkpoint 3.
1. I like the virtual pond and the way you could explore underwater and on land.
2. I like the interesting features on EcoMUVE like people, the chatting feature, the subma-rine feature, and the ability to time travel to discover new things.
3. I liked the multiple features that could be used and the different people you could
meet. I also liked how you could piece clues together that led to the answer of why the fish died.
Another factor to note is that the average length of student responses decreased from checkpoint 1 (100 characters) to checkpoint 3 (84 characters). Some students who wrote thoughtful responses in earlier checkpoints answered very briefly in checkpoint 3. Eg.
1. I like the interactivity. It is fun to do some-thing where you get to control what you do.
2. I like how you can interact with virtual “people”, animals, and each other.
3. There was a lot of freedom.
We postulate that this result may stem from reluctance or boredom in answering the same question for a third time, or more general survey fatigue.
DISCUSSION
It is not surprising that student answers, particu-larly after the first day, focused on the technol-
Figure 8. Percentage of responses to the question “How is learning science with EcoMUVE different from typical activities you’ve done in science class?” The same response might include more than one code
Copyright © 2014, IGI Global. Copying or distributing in print or electronic forms without written permission of IGI Global is prohibited.
International Journal of Virtual and Personal Learning Environments, 5(4), 1-15, October-December 2014 13
ogy and features of the virtual world interface. The opportunity to use computers in science class is rare and exciting, and that excitement is conveyed by students’ focus on how “cool” the virtual world is, and how much more “fun” it is than traditional science activities.
What this study demonstrates, however, is that over time that enthusiasm about the technol-ogy begins to fade, and students become more aware and appreciative of the kinds of activities that EcoMUVE supports – the opportunities it affords for self-directed learning, for inquiry-based activities, and for collaboration with a team. Even the question about what students didn’t like, followed this pattern – over time there was an increase in requests for more ac-tive and inquiry-based learning, wanting more exploration, more things to find, more mysteries to solve. We also note that many of the survey responses coded for inquiry could apply to any inquiry-based curriculum, not necessarily a computer-based one; the compelling virtual interface does not overshadow the interest in “solving a mystery,” and “to figure out why the fish died without having to be told.”
Time on task, or time in the virtual world, can help to reduce the distraction of surface features of the environment and promote learn-ing. Because the EcoMUVE curriculum covers about 10 days of classroom time, students have time to get used to the technology. This resonates with the findings of Omale et al. (2009), who recommend that MUVE-based activities build in “play time” to allow students to become more familiar with and move beyond the novelty on the virtual world. In their review of research on 3-D learning environments, Dalgarno and Lee (2010) cite the importance of research on pedagogic strategies and tools and to determine how tasks can be designed to be intrinsically motivated within a virtual environment. Our work with EcoMUVE suggests intrinsic motiva-tion can be supported through experiences that focus on engaging, inquiry-based, collaborative activities within the MUVE.
In light of the next generation science stan-dards and their focus on the practices of science (NGSS Lead States, 2013; National Research
Council, 2012), it was interesting to see that an increasing number of students referred to pro-cess and inquiry-based aspects of the learning experience. Further, the NGSS emphasize the need to address content learning in conjunction with development of process-based skills. Our work suggests (Figure 7) that students have op-portunities for both types of learning within this richly contextualized virtual world. Education reform efforts over the past two decades have focused on inquiry-based approaches to learning and aim to support teachers in implementing rich inquiry curricula.
Inquiry-based teaching can be difficult to implement (Anderson 2002) and even in cases where a “hands-on” activity is used to engage students in scientific inquiry, those activities may not be “minds-on.” Here we present a study in which the curriculum is not “hands on” in a traditional sense, yet seems to sup-port students in their application of scientific thinking. Recent work suggests that carefully designed technology-supported curricula can support the creative synergy of thinking and doing that we hope students will engage in when conducting scientific inquiry (Campbell and Jane 2012), and our work aligns with these ideas in that significant numbers of students cited the utility of EcoMUVE for both active/inquiry learning and content learning. New and emerging technological approaches to teaching science bring to light interesting research ques-tions around blending hands-on inquiry lessons with technology tools that support students in implementing “minds-on” approaches that are engaging on a deeper level than the 3-D graphical interface.
CONCLUSION
In summary, over the two-week EcoMUVE curriculum experience, student interest in EcoMUVE decreased somewhat but remained high; students’ beliefs about EcoMUVE’s utility increased; and students saw EcoMUVE as less of a “waste of time”. Student responses to questions of what they liked about EcoMUVE changed
Copyright © 2014, IGI Global. Copying or distributing in print or electronic forms without written permission of IGI Global is prohibited.
14 International Journal of Virtual and Personal Learning Environments, 5(4), 1-15, October-December 2014
from being primarily about the opportunity to interact in a virtual computer environment, to an increasing appreciation of the pedagogi-cal aspects of the self-directed, collaborative, inquiry-based activities.
These findings demonstrate that, although there is a novelty effect for EcoMUVE, engage-ment didn’t ultimately depend on novelty. This is an important contribution to the teaching and learning of science because it demonstrates and reinforces the importance of sound pedagogical methods. As technology becomes more preva-lent in science classrooms, this study serves as a reminder that, regardless of the medium, it is fundamental to design the technology to allow for active, collaborative student involvement in inquiring about scientific phenomena.
As technology becomes more ubiquitous in everyday life, and as computer access improves across all schools, we can expect that there will be more development of technology-rich science curricula. With increased accessibility, research on the effectiveness of immersive environments to support student learning is becoming increasingly important. Affordances of technology merged with best practices in teaching can contribute to bolstering students’ interest in doing science, and facilitating the belief that learning science is a useful and worthwhile pursuit.
ACKNOWLEDGMENT
This work is supported by the Institute of Educa-tion Sciences, U.S. Department of Education, Grant No. R305A080514 to Chris Dede and Tina Grotzer. All opinions, findings, conclusions or recommendations expressed here are those of the authors and do not necessarily reflect the views of the Institute for Education Sciences.
REFERENCES
Anderson, R. D. (2002). Reforming science teaching: What research says about inquiry. Jour-nal of Science Teacher Education, 13(1), 1–12. doi:10.1023/A:1015171124982
Barab, S., Thomas, M., Dodge, T., Carteaux, R., & Tuzun, H. (2005). Making learning fun: Quest Atlantis, a game without guns. Educational Tech-nology Research and Development, 53(1), 86–107. doi:10.1007/BF02504859
Campbell, C., & Jane, B. (2012). Motivating children to learn: The role of technology education. Interna-tional Journal of Technology and Design Education, 22(1), 1–11. doi:10.1007/s10798-010-9134-4
Chen, J. A., Metcalf, S. J., & Tutwiler, M. S. (2014). Motivation and beliefs about the nature of scientific knowledge within an immersive virtual ecosystems environment. Contemporary Educa-tional Psychology, 39(2), 112–123. doi:10.1016/j.cedpsych.2014.02.004
Clark, R. E. (1983). Reconsidering research on learn-ing from media. Review of Educational Research, 53(4), 445–459. doi:10.3102/00346543053004445
Clarke, J., Dede, C., Ketelhut, D. J., & Nelson, B. (2006) A Design-based Research Strategy to Promote Scalability for Educational Innovations. Educational Technology 46, 3 (May-June), 27-36.
Dalgarno, B., & Lee, M. J. W. (2010). What are the learning affordances of 3-D virtual environments? British Journal of Educational Technology, 41(1), 10–32. doi:10.1111/j.1467-8535.2009.01038.x
Hew, K. F., & Cheung, W. S. (2010). Use of three-dimensional (3-D) immersive virtual worlds in K-12 and higher education settings: A review of the research. British Journal of Educational Technology, 41(1), 33–55. doi:10.1111/j.1467-8535.2008.00900.x
Kafai, Y. B. (2010). The World of Whyville: Living, Playing, and Learning in a Tween Vir-tual World. [Special Issue]. Games and Culture. doi:10.1177/1555412009351264
Copyright © 2014, IGI Global. Copying or distributing in print or electronic forms without written permission of IGI Global is prohibited.
International Journal of Virtual and Personal Learning Environments, 5(4), 1-15, October-December 2014 15
Kamarainen, A. M., Metcalf, S., Grotzer, T., & Dede, C. (2012). Relating student actions to learning gains: using immersive virtual worlds to support under-standing of ecological systems. National Association of Research in Science Teaching. Indianapolis, ID: NARST.
Lenhart, A., Kahne, J., Middaugh, E., Macgill, A. R., Evans, C., & Vitak, J. (2008). Teens, Video Games, and Civics: Teens’ Gaming Experiences Are Diverse and Include Significant Social Interaction and Civic Engagement. Pew Internet & American Life Project.
Lim, C. P., Nonis, D., & Hedberg, J. (2006). Gaming in a 3D multiuser virtual environment: Engaging students in Science lessons. British Journal of Edu-cational Technology, 37(2), 211–231. doi:10.1111/j.1467-8535.2006.00531.x
Metcalf, S. J., Kamarainen, A., Tutwiler, M. S., Grotzer, T. A., & Dede, C. J. (2011). Ecosystem science learning via multi-user virtual environments. International Journal of Gaming and Computer-Mediated Simulations, 3(1), 86–90. doi:10.4018/jgcms.2011010107
Metcalf, S. J., Kamarainen, A., Tutwiler, M. S., Grotzer, T. A., & Dede, C. J. (2013). Teacher per-ceptions of the practicality and effectiveness of immersive ecological simulations as classroom cur-ricula. International Journal of Virtual and Personal Learning Environments, 4(3), 66–77. doi:10.4018/jvple.2013070105
National Research Council. (2012). A framework for K-12 science education: Practices, cross-cutting concepts, and core ideas. Washington, DC: The National Academies Press.
NGSS Lead States. (2013). Next Generation Science Standards: For States, By States. Achieve, Inc. on behalf of the twenty-six states and partners that col-laborated on the NGSS.
Omale, N., Hung, W. C., Luetkehans, L., & Cooke‐Plagwitz, J. (2009). Learning in 3‐D multiuser virtual environments: Exploring the use of unique 3‐D at-tributes for online problem‐based learning. British Journal of Educational Technology, 40(3), 480–495. doi:10.1111/j.1467-8535.2009.00941.x
Rideout, V. J., Foehr, U. G., & Roberts, D. F. (2010). Generation M2: Media in the Lives of 8-to 18-Year-Olds. Henry J. Kaiser Family Foundation.
Tamim, R., Bernard, R., Borokhovski, E., Abrami, P., & Schmid, R. (2011). What forty years of research says about the impact of technology on learning: A second-order meta-analysis and validation study. Review of Educational Research, 81(1), 4–28. doi:10.3102/0034654310393361
Trindade, J., Fiolhais, C., & Almeida, L. (2002). Sci-ence learning in virtual environments: A descriptive study. British Journal of Educational Technology, 33(4), 471–488. doi:10.1111/1467-8535.00283