Nanaji Deshmukh Krishi Sanjeevani Yojana – Water Budget
17
Nanaji Deshmukh Krishi Sanjeevani Yojana – Water Budget Prof. Milind Sohoni Shubhada Sali Parth Gupta POCRA Team IIT Bombay 22 January’18, POCRA, Mumbai
-
Upload
khangminh22 -
Category
Documents
-
view
1 -
download
0
Transcript of Nanaji Deshmukh Krishi Sanjeevani Yojana – Water Budget

Nanaji Deshmukh Krishi SanjeevaniYojana – Water Budget
Prof. Milind SohoniShubhada SaliParth GuptaPOCRA TeamIIT Bombay
22 January’18, POCRA, Mumbai
Agenda
• Review Delivery according to MOU
• Review of Existing Rollout
• To obtain key inputs for Phase III delivery • Zonal Vs Village level water budgeting• Multicrop Vs Single Crop model
• Improved Linkage of Water Budget to Planning• Well data• Farm Ponds• Change in Crops• Land use Management• Community Vs Individual Assets

Basic Outline of Process
Accepted Steps in Water Budgeting process
Forwardedto Rohit Gujjar

Deliverables
Phase I1. Water Balance Model Framework and Report2. Excel Based Water Balance Point ModelPhase II1. QGIS plugin for water balance computation2. Water Budget format for Microplanning process3. Water Budget Format for PoCRA Microplanning AppPhase III1. To support Planning Framework based on water budget as
chosen by PMU/Yashada

Review of Field Visit
1. Importance of Land Use in Planning2. Better Management of Non-Agricultural Lands3. Yield Watering Relation4. Small Storage
Review of Planning Process1. Zonal Planning Approach2. Planning Perspective based on Water Budget

Village, Taluka Year Crop/LURainfall (mm)
Runoff in Monsoon (mm)
Soil Moisture Crop end (mm)
GW Recharge in Monsoon (mm)
AET Crop End (mm)
PET Crop End (mm)
Cropduration Deficit(PET-AET) (mm)
Wadhvi, Karanja 2016 soyabean 929 459 59 41 358 463 105
scrub open 929 506 1 37 385 544 159
scrub forest 929 412 1 100 415 670 255
deciduous open 929 464 1 46 418 670 253
overall 929 459 54 43 361 463 114
• Higher amount of GW recharge from Non Agri forest lands• Higher runoff from fallow or scrub open land• Their impact on overall water balance• Necessity for better land management practices
Land use and its impact on Water Balance

Continued: Land use and its impact on Water Balance
Village, Taluka Population
Total Area (Ha.)
Agricultural Area (Ha.)
Non-agricultural degraded lands (Ha.)
Kharif sown (2017-18) (Ha.)
Rabi sown (2017-18) (Ha.)
Wadhvi, Karanja
1400 660 479 181 479 12
Wai, Karanja 1585 1261 964 114 964 114Lohara, Karanja 2224 672 605 67 584 12Kinkhed, Karanja
1155 385 375 10 375 15
Deochandi, Karanja
NA 297 216 81 216 5
Isafpur, Karanja NA 129 116 13 116 6Mandawa, Karanja
NA 416 279 137 269 6
Kisan Nagar, Karanja
NA NA NA NA NA NA
Source: TAO reports and JYS 15-16 and 16-17 data

Yield – Watering – Storage Capacity
Village,Rainfall (mm)
CropPET (mm)
Deficit (mm)
Run-off (mm)
Storage in Drain-line (mm)
Storage in Area treatment (mm)
Storage in Farm Pond Water
Application Index.
Wadhvi, Karanja
473 Soyabean 452 176 145 0.75 0.44 0.35 0.61
Wai, Karanja 473 Soyabean 452 161 110 0 0 0 0.64
Lohara, Karanja
473 Soyabean 452 162 117 3.72 0 0.31 0.65
Kinkhed, Karanja
473 Soyabean 452 163 122 7.79 4.15 0 0.66
Deochandi, Karanja
473 Soyabean 452 165 129 0 0 0 0.63
Isafpur, Karanja
473 Soyabean 452 153 130 NA NA NA 0.66
Mandawa, Karanja
473 Soyabean 452 197 146 NA NA NA 0.56
Kisan Nagar, Karanja
473 Soyabean 452 153 100 NA NA NA 0.66
• Kharip Crop Stress –2-3 additional wateringsneeded• Small storage
capacity• Around 65% water
application Index• Loss in yields
Source: JYS 15-16 and 16-17 reports and water balance model

0
5
10
15
20
25
30
0 0.05 0.1 0.15 0.2 0.25 0.3
Yiel
ds
(qu
inta
l/A
cre)
Watering Index
Kharip Bajra
0
20
40
60
80
100
120
0 0.2 0.4 0.6 0.8 1 1.2
Yiel
ds
(qu
inta
l/ac
re)
Watering Index
Kharip Onion
0
50
100
150
200
250
0 0.2 0.4 0.6 0.8 1 1.2
Yiel
d (
qu
inta
l/ac
re)
Watering Index
Rabi Onion
Sinnar - Yields

Need for Zonal Planning
• Considerable Variations in water balance seen between zones
• Variations in Water Balance seen between crops
• Necessary to ensure zonal water security
Village
Zones
Crop Rainfall
(mm)
Runoff
(mm)
Ground
Water (mm)
Soil
Moisture
(mm)
PET
(mm)
AET
(mm)
Deficit
(mm)
Makner-
1
Soyab
ean823 393 28 107 453 293 160
Makner-
2823 361 39 113 453 308 145
Makner-
3823 385 26 113 453 297 157
Makner-
1
Bajra823 507 17 138 292 162 130
Makner-
2823 482 12 162 292 166 127
Makner-
3823 425 11 230 292 157 134
Makner-
1
Tur
823 401 6 18 626 398 228
Makner-
2823 372 12 28 626 411 215
Makner-
3823 392 7 18 626 407 219
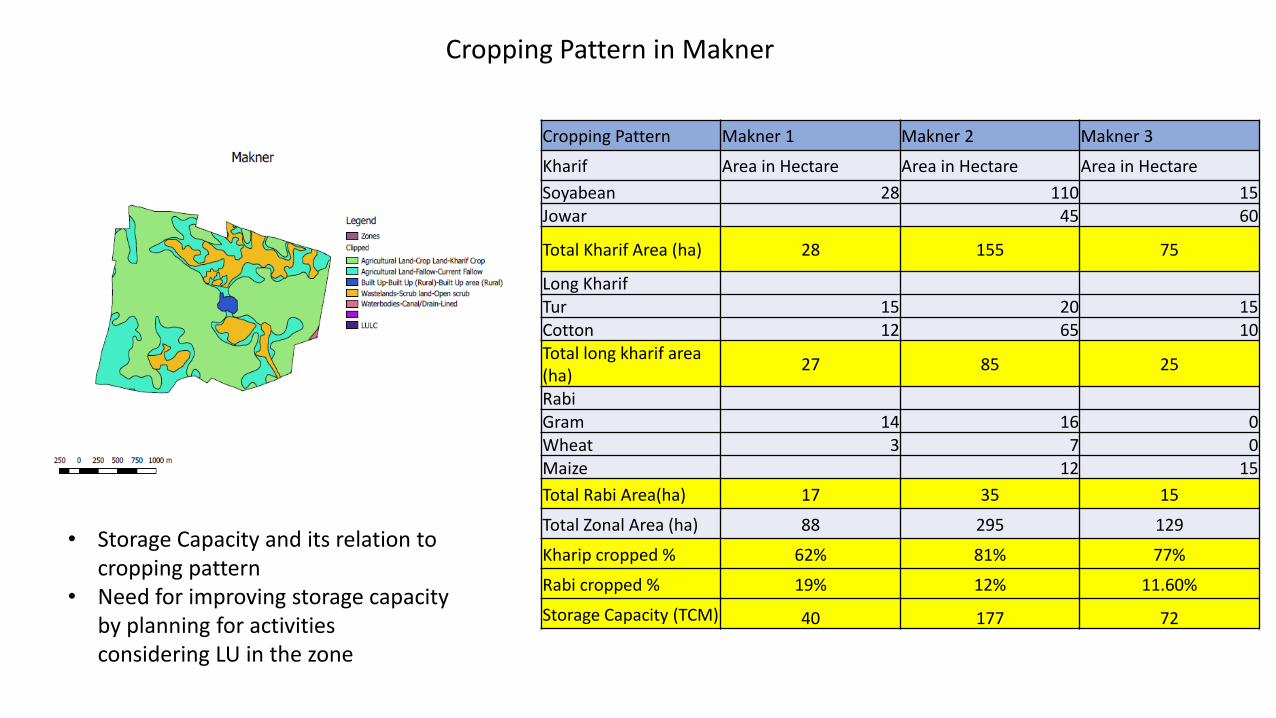
Cropping Pattern in Makner
Cropping Pattern Makner 1 Makner 2 Makner 3
Kharif Area in Hectare Area in Hectare Area in Hectare
Soyabean 28 110 15Jowar 45 60
Total Kharif Area (ha) 28 155 75
Long KharifTur 15 20 15Cotton 12 65 10Total long kharif area (ha)
27 85 25
RabiGram 14 16 0Wheat 3 7 0Maize 12 15
Total Rabi Area(ha) 17 35 15
Total Zonal Area (ha) 88 295 129
Kharip cropped % 62% 81% 77%
Rabi cropped % 19% 12% 11.60%
Storage Capacity (TCM) 40 177 72
• Storage Capacity and its relation to cropping pattern
• Need for improving storage capacity by planning for activities considering LU in the zone

Zonal Water BudgetMakner 1 -
TCM
Makner 2 -
TCM
Makner 3 -
TCM
Village -
TCM
Demand
Total Water Requirement(K+A+LK)317.4 1339.1 510.6 2295.7
Kharif protective irrigation req. (deficit) 121.4 474.3 182.7 834.0
Rabi + Summer Total Water Requirement48.5 119.5 60.0 228.0
Rabi + Summer Additional water Requirement
(deficit) 21.2 13.6 16.7 51.1
Supply
Water Available from Runoff (80%) 171.8 688.3 308.4 1215.0
Water Available from Soil Moisture 18.3 51.2 24.6 94.1
Water Available from GW 9.1 54.7 18.7 82.8
Existing Storage Total Runoff Storage Capacity 41.0 176.9 71.9 289.8
Additional
StorageWater Available for New Structures
130.8 511.4 236.5 925.2
Target 1: Kharif Protective Irrigation Demand: 834 TCM
Target 2: Rabi + Summer Deficit: 51.1 TCM
Water available for new structures: 952.2 TCM
Linkage of Water Budget to Planning

Structures storage
capacity No./Ha
Storage
Capacity/unit
Total Storage
Capacity (TCM)
MNB 1 5 5
CNB 5 8.3 41.5
Community FP 4 30 120
Total capacity 43.3 166.5
Target 1: Kharif Protective Irrigation Demand: 834 TCM
Target 2: Rabi + Summer Deficit: 51.1 TCM
Water available for new structures: 952.2 TCM
Storage Capacity through new structures: 166.5 TCM
Water Requirement for Fruit Trees: 4 ha *1600 mm/100 = 64 TCM
Plan Check
Target 1+Target 2+ Water requirement for Fruit trees – Storage Capacity through new structures
= 834 +51.1+ 64 – 166.5
= 782.6 : Deficit (structures will get filled but new capacity will not be able to meet target 1 and target 2
demands
Demands No./Ha
Fruit Trees 4
MNB 1
CNB 5
Community FP 4
Wells 30
Well Recharge 5
Water and soil conservation structure demands and storage capacity
Planning of New Structures – Village Level

Need for Zonal Planning
Village Zones
CropRainfall (mm)
Runoff (mm)
Ground Water (mm)
Soil Moisture
(mm)PET (mm) AET (mm)
Deficit (mm)
Umali-1
Soyabean
823 388 32 107 454 296 158
Umali-2 823 431 22 83 454 287 166
Umali-3 823 340 41 123 454 319 134
Umali-4 823 361 32 124 454 306 148
Umali-5 823 403 31 103 454 286 168
Umali-6 823 386 32 111 454 295 159
Umali-1
Tur
823 395 9 20 626 399 227
Umali-2 823 393 7 20 626 402 224
Umali-3 823 428 9 3 626 382 244
Umali-4 823 372 7 25 626 418 207
Umali-5 823 409 7 18 626 389 237
Umali-6 823 440 18 15 626 350 208
• Considerable Variations in water balance seen between zones
• Necessary to ensure zonal water security

Cropping Pattern Umali-1 Umali-2 Umali-3 Umali-4 Umali-5 Umali-6
Kharif Area in Hectare Area in Hectare Area in Hectare Area in Hectare Area in Hectare Area in Hectare
Soyabean 65 87 57 180 49 111Jowar 0 4.8 0 22.2 8.5 5.2Udid 0 4.4 2.2 2 1.8 2Moong 1 2.4 0.2 3 2.8 4.6
Total Kharif Area (ha)
66 98.6 59.4 207.2 62.1 122.8
Long KharifCotton 26 35 82 60 26 46Tur 16 18 14 30 11 20
Total long kharif area (ha)
42 53 96 90 37 66
RabiGram 16 4 0 8 11 23Wheat 2.4 2.4 0 1 1.4 2.4Maize 1 0.8 0 4.5 1.1 6Onion 0.8 0 0 1.8 1.4 0Total Rabi Area(ha)
20.2 7.2 0 15.3 14.9 31.4
Total Zonal Area (ha) 68 167 250 322 159 327
Kharip cropped % 159% 91% 62% 92% 62% 58%
Rabi cropped % 30% 4% 0% 5% 9% 10%StoreageCapacity (TCM)
0 0 0 0 0 0
Cropping Pattern in Umali

Current Process and Planning Perspective
• Observations in Current process• Gaps in Zonal data collection process –well survey, zonal cropped area and zonal storage capacity
data generally patchy• Poor coverage of individual farmers cropping data, assets, access to water – difficulty in providing
guidance on matching benefit packages with farmers actual needs• Unavailable inputs such as Crop sowing data, existing interventions data before the process for
provision of supply tables• Issues in zonal budget computation due to data unavailability
• Zonal Planning Approach• Accurate cropping pattern and storage capacity data collection at zone level necessary for its linkage
to planning• Data collection of individual farmers demanding individual assets necessary for decision making on
individual assets (data required -their cropping pattern, yield, watering, access to water and other assets)
• Well survey of atleast 5 -7 wells in the zone• Computation of zonal water budget and Linking it to zonal planning
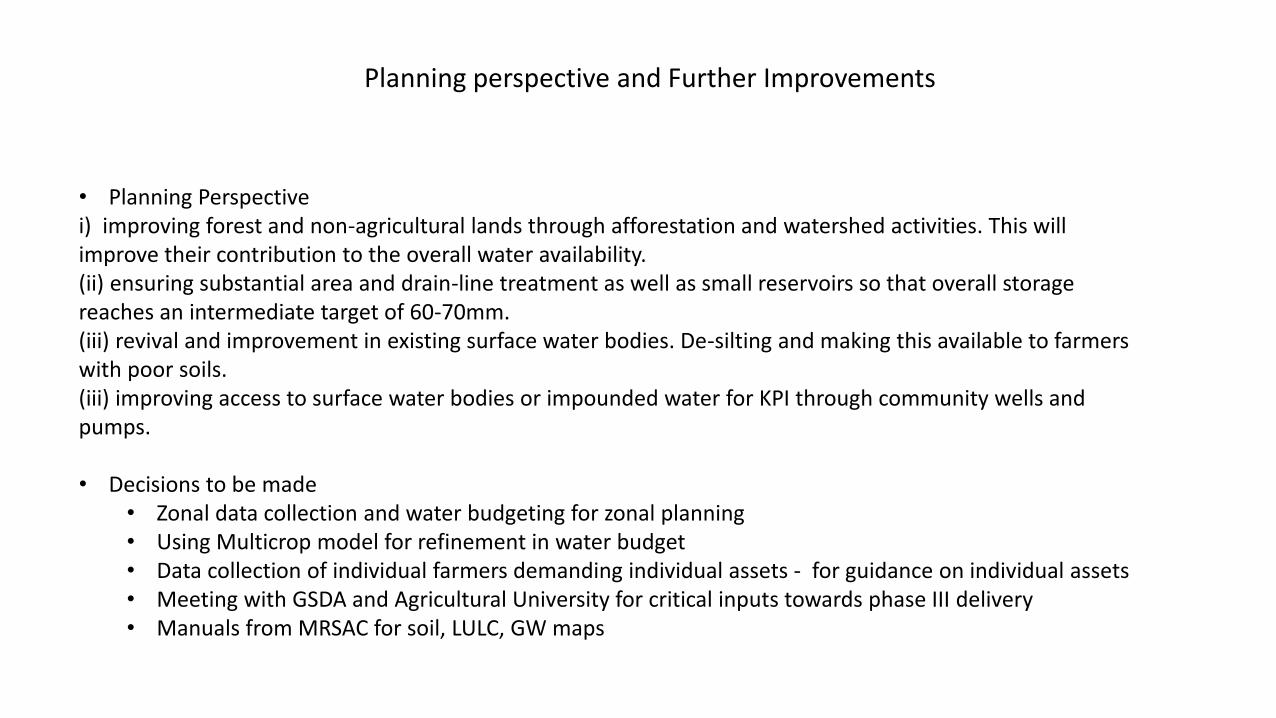
• Planning Perspectivei) improving forest and non-agricultural lands through afforestation and watershed activities. This will improve their contribution to the overall water availability. (ii) ensuring substantial area and drain-line treatment as well as small reservoirs so that overall storage reaches an intermediate target of 60-70mm. (iii) revival and improvement in existing surface water bodies. De-silting and making this available to farmers with poor soils. (iii) improving access to surface water bodies or impounded water for KPI through community wells and pumps.
• Decisions to be made• Zonal data collection and water budgeting for zonal planning• Using Multicrop model for refinement in water budget• Data collection of individual farmers demanding individual assets - for guidance on individual assets• Meeting with GSDA and Agricultural University for critical inputs towards phase III delivery• Manuals from MRSAC for soil, LULC, GW maps
Planning perspective and Further Improvements