N57.pdf - International Association of Survey Statisticians (IASS)
50
January 2008 No. 57
-
Upload
khangminh22 -
Category
Documents
-
view
0 -
download
0
Transcript of N57.pdf - International Association of Survey Statisticians (IASS)

January 2008 No. 57


Editor
Steven G. Heeringa Section Editors
John Kovar — Country Reports James Lepkowski — Software Review
Production Editor Gail Arnold
Circulation
Claude Olivier Anne-Marie Vespa-Leyder
The Survey Statistician is published twice a year in English and French by the International Association of Survey Statisticians and distributed to all its members. Information for membership in the Association or change of address for current members should be addressed to:
Secrétariat de l’AISE/IASS c/o INSEE-CEFIL Att. Mme Claude Olivier 3, rue de la Cité 33500 Libourne - FRANCE E-mail: [email protected]
Comments on the contents or suggestions for articles in The Survey Statistician should be sent via e-mail to:
Dan Hedlin [email protected] and Annica Isaksson [email protected]
In This Issue No. 57, January 2008 1 Letter from the President 3 Report of the IASS Scientific Secretary 5 IASS Election Results 5 Report from the 2009 Program Committee 7 IASS President’s Report 11 Country Reports 11 Australia 12 Brazil 13 Canada 14 Malaysia 15 Philippines 16 Poland 16 Spain 18 United Kingdom 18 United States 20 Software Review 26 Analysis of complex samples in R 26 Articles 26 Congratulations, Gunnar Kulldorff 27 Félix Rosenfeld 30 New Members 33 Announcements 33 ISBIS-2008 33 European Conference on Quality in Official Statistics 34 Summer Institute in Survey Research, University of Michigan 34 Cochran-Hansen Prize 2009 35 IASS Web Site 36 In Other Journals 36 Journal of Official Statistics 38 Statistics in Transition — n s 39 AStA — Advances in Statistical Analysis 42 IASS Officers and Council Members
Change of Address Form Institutional Members
N o . 5 7 J a n u a r y 2 0 0 8

The Survey Statistician 1 January 2008
Lett
er fr
om th
e Pr
esid
ent
Dear Colleagues, It is both an honor and a big challenge to preside IASS after Gordon Brackstone’s term in the presidency. He directed the activities of our Association to high standards of excellence, provided a steady leadership and certainly knew how to get the best from collaborators in the Associations’ executive committee, council and membership. Testimony to this is provided in his presidential report presented to our general assembly in Lisboa, which appears elsewhere in this issue of our newsletter. I hope that all members will join me in giving Gordon due recognition for his services to the IASS and a big THANK YOU. Time also to thank outgoing members of the Executive, Vice-presidents John Kovar and Jelke Bethlehem, and Scientific Secretary Lilli Japec, for their many contributions to IASS during the past 2 ½ years. John will now be busy running the ISI Programme Coordinating Committee for ISI Durban in 2009, a challenging role for which we wish him well. Lilli Japec’s report on the six short courses held in Lisboa is also included in this issue. Attendance was good despite the limited funding we had available to support student participation. We must once again present our gratitude to all those involved in this massive effort, especially the course presenters for donating their time and providing such stimulating learning opportunity for so many. I rate the IASS short courses quite highly amongst the services provided by our Association to the membership, and hope we can expand this program in the future. I welcome aboard our elected members of the Executive: Pierre Lavallée and Seppo Laaksonen, as
vice-presidents, and Steve Heeringa as Scientific Secretary. In addiction to contributing to the other activities and debate within the Executive, Seppo agreed to look into ways of improving our network of country representa-tives, Pierre will look after the scientific meetings activities, and Steve will coordinate the short course program for ISI 2009 in Durban – see the call for course proposals presented later in this issue. Susan Linacre also joined our Executive as president-elect, to serve as president from 2009-11.
Congratulations, Susan, and welcome. Thanks are also due to outgoing council members Pascal Ardilly, J-J. Droesbeke, Guido Ferrari, Linda Hewitt, Naman Keita and Hiek Som. Remaining council members (2005 – 2009) Giuliana Coccia (Italy), Geoffrey Lee (Australia), Leila Mohadjer (United States), Sarah M. Nusser (United States), Don Royce (Canada) and Wei Juan (China) are now joined by incoming council members (2007-2011) Jairo Arrow (South Africa), Louise Bourque (Canada), Kathryn Inglis-Clark (Australia), Dalisay Maligalig (Philippines), Paul-André Salamin (Switzerland), and Shyam Upadhaya (Nepal). Such diversity of geographic and professional representation in Council shall ensure that our decisions and actions reflect the core values and goals of our Association. I welcome the opportunity to work together with such a distinguished group of Survey Statisticians from all over the world. Last but not the least, we continue to enjoy the generous support of INSEE in France from our Executive Director, Michel Péronnet, and Secretariat, with Anne Marie Vespa and Claude Olivier, for which we are also very grateful. I shall soon visit them in Libourne to discuss ways in which we can improve the services and communications with our membership. I hope those of you who attended the ISI meetings in Lisboa have enjoyed it
The Survey Statistician 2 January 2008
as much as I did. The 14 Invited Paper Meetings (IPMs) organised or co-organised by the IASS program committee under David Steel were all well attended. We thank David, all members of his programme committee, together with organizers, authors and discussants who worked to make them a success story. As many of you will know, preparations for the IPMs to be organised or co-sponsored by IASS during the 2009 meetings in Durban are well underway under the leadership of our council member Leila Mohadjer, and a list of the topics for these sessions appears later in this issue. The full list of topics for IPM sessions appeared in the September issue of ISI Newsletter, and is available from the ISI website at (http://isi.cbs.nl/Nlet/NLet073.htm). I am pleased to announce that council member Geoff Lee agreed to chair the IASS Programme Committee to prepare the programme of IASS invited paper meetings for the Dublin session of the ISI in 2011. Geoff will now appoint his committee, to work towards this goal. Those wishing to contribute to this objective, please feel free to get in touch with him directly.
Let me use my first letter of president in our newsletter to set out some goals and ideas for my term in office. This is meant to provide all members with a chance to know what we intend to do, and to contribute their views, critics, and suggestions. I wish to increase IASS´s membership and participation in all activities promoted by the Association. Members are therefore encouraged to take an active role in recruiting new members. If each one of us commits to recruiting a single new member, we could quickly double the membership! I believe that membership to IASS is good value for money: discounted subscription to the two excellent journals: Survey Methodology and the Journal of Official Statistics; cheaper registration fees to the ISI and all other meetings organised by our Association; excellent newsletter and website; the opportunities to take the short courses we offer in combination with the ISI sessions every two years; networking in general, as well as contact opportunities with the leaders
in our field from around the world, are just a few of the benefits of membership that you can use to attract fellow statisticians to become members. If you think that there are other services we could aim to provide members with, please let us have your ideas and suggestions. But meanwhile, please help to recruit at least one new member for IASS: at just 10 Euro for those in developing countries, or 20 Euro for other members, this is a very attractive membership package. The registration form can be found on our website (http://isi.cbs.nl/iass/) . One of the rich parts of our activities is the program of professional and scientific meetings which we either organise directly, or co-sponsor with sister societies. Just after the ISI in Lisboa, we sponsored a satellite meeting on “Innovative Methodologies for Censuses in the New Millennium”, which took place in Southampton, UK. Papers and presentation materials for this conference are available from http://www.s3ri.soton.ac.uk/isi2007/programme.php . It is time to consider ideas for similar satellite meetings to take place around the time of the Durban ISI in 2009. Ideas and proposals for such meetings are welcome. Members are also invited to be proactive in proposing, promoting and taking active part in the Association’s activities. Do let us know if you have suggestions about activities that we could sponsor or help to promote and organise. Let me now turn to the publication of our
newsletter. Steve Heeringa (editor) and Gail Arnold (production manager) have taken care of The Survey Statistician over the past 4 ½ years. We must pay tribute to their dedication and competence, which is evident in the quality we find in our newsletter. But it is time to move on, since Steve is taking over his Scientific Secretary role. I am very pleased to announce that Dan Hedlin ([email protected]) and Annica Isaksson ([email protected]) from Sweden will be the new joint editors of The Survey Statistician, starting with the June 2008 issue. We wish them well, and encourage you to send them any suggestions or contributions to our newsletter. In particular, I urge our country representatives and other collaborators to keep their country reports coming, so that we

The Survey Statistician 3 January 2008
can all keep abreast of the developments and activities worldwide. We welcome members´ contributions in the form of short news articles, information about statistical activities in their countries, news of events and developments, as well as information education or professional opportunities that might be available and should be disseminated to the IASS membership. The new editors will in due course set out their own plans for the newsletter.
We are also fortunate to have Eric Rancourt continuing to look after our website (http://isi.cbs.nl/iass/allUK.htm). I plan to work closely with Eric to enhance our website even further, seeking to make it home to more services to our membership and to increase its use as a means to facilitate communication with and amongst the membership.
Let me finish this first letter by inviting you to help strengthen our association by taking part and keeping in touch. I look forward to working with you all. Pedro Silva. [email protected]
Report of the IASS Scientific Secretary Steven Heeringa
This issue of the Survey Statistician follows the biennial transition to new leadership of the IASS. As the departing Editor of the Survey Statistician and the newly elected Scientific Secretary, I would like to begin my report by saying thank you to the IASS members who have assisted me in past activities and to those who prepared me for my new role. I wish to thank Anders Christianson, John Kovar, Eric Rancourt, Dennis Trewin, Claude Olivier, Lilli Japec and Gordon Brackstone for their editorial and production contributions to the Survey Statistician. A special note of appreciation is due to Gail Arnold who served as production editor for the Survey Statistician and did the lion’s share of the work in assembling and formatting each semi-annual issue since January of 2004. As I move into new duties as Scientific Secretary, I wish to acknowledge the mentorship and support of Lilli Japec, IASS Scientific Secretary 2005-2007, and Pedro Silva, IASS President.
The principal role of the office of IASS Scientific Secretary is to support and promote the scientific exchange, education and training activities of our association. To that end, I encourage you to send me information on conferences, workshops, web-based or in-person training resources that you feel might benefit the general IASS membership. I will see that this information is included in regular reports here in the Survey Statistician and is also posted to the IASS website. Please send your notices to me by e-mail at [email protected]. The most significant educational activity of the IASS is the program of short courses in Survey Statistics and Methodology that are offered immediately prior to the biennial meetings of the International Statistical Institute (ISI). The following section provides the text of the final report that Lilli Japec, Scientific Secretary 2005-2007, prepared following the Lisboa, 2007 short courses. Immediately following Lilli’s report is a Call for Proposals for new short courses that the IASS Executive will consider as it plans the program for the 2009 meetings in Durban, South Africa.
IASS Short Courses, Lisboa 2007 (Report prepared by Lilli Japec)
A traditional IASS activity is to offer a number of short courses in survey methodology in connection with the ISI meetings. These courses provide an opportunity for survey statisticians to attend courses given by high-level experts and to meet with other methodologists that are working in the survey field. The organisation of the 2007 short courses started almost immediately after the ISI Session in Sydney 2005 and the program was advertised through several dissemination channels, e.g., brochures and other information materials were sent to several organizations, journals, IASS web site, and ISI newsletter. This year the World Bank provided some funding to support attendance at the ISI meetings. These funds were also eligible for students at our courses. In addition to this IASS offered some direct, albeit limited,

The Survey Statistician 4 January 2008
support to assist a few students to attend the courses in Lisboa. The students who have registered for the courses this year come from 29 countries. Many students register for more than one course and the total number of registered students is 158. The courses offered are: Course A: Workshop on Survey Sampling, Presented by: Colm O’Muircheartaigh and Steven Heeringa. Number of students registered: 33 Course B: Variance Estimation in Complex Surveys, Presented by: Wayne Fuller, Kirk Wolter, F. Jay Breidt, and Anthony An. Number of students registered: 23 Course C: Workshop on Editing and Imputation of Survey Data, Presented by: John G. Kovar and Eric Rancourt. Number of students registered: 31 Course D: Introduction to Survey Quality, Presented by: Paul Biemer and Lars Lyberg . Number of students registered: 37 Course E: Statistical Disclosure Control, Presented by: Anco Hundepool, Eric Schulte Nordholt and Peter-Paul de Wolf. Number of students registered: 11 Course F: Design and Analysis of Repeated Surveys, Presented by: David Steel and Craig McLaren. Number of students registered: 23 Finally, I want to thank the lecturers for taking the time to plan and hold the courses, and to INE and the Local Organizing Committee, in particular Evelise Domingues and Pinto Martins, for their professional support in the organization of the courses. Special thanks also to Anna-Lena Carlström at Statistics Sweden for the administrative support and to Peter Lundquist, also at Statistics Sweden for taking on the on-site responsibilities associated with two of the courses. Lilli Japec IASS Scientific Secretary
Call for Proposals for IASS Short Courses, Durban, 2009
As Lilli’s report describes, the IASS offered six short courses immediately prior to the formal opening of the Lisboa 2007 meetings of the ISI. Several IASS members have already volunteered ideas for new courses that they feel would be a valuable addition to the pre-conference training program for 2009. The IASS Executive is now actively planning for 2009 and is interested in hearing proposals for new short courses to be offered in Durban. If you have a short course topic that you feel would be a valuable addition to the Durban 2009 program, please send a short proposal for the new course to Steve Heeringa ([email protected]). Proposals for new short courses need not be overly formal; however, it is important that your description of the course address each of the following areas: • Course title and subject area description • Name of text (if applicable), source of
other instructional materials • Syllabus for a course of approximately
two days ( 12-16 contact hours) • Target audience for the course,
evidence of demand (optional) • Statement of relevance to the general
IASS membership • Statement of special relevance to
statisticians in developing and transition countries, in particular junior statisticians from African countries that will be attending the Durban 2009 meetings of the ISI.
Please submit your proposal for a new short course to Steve Heeringa ([email protected]) by April 1, 2008. After that date, the IASS Executive will review the historical offerings and the new proposals and establish a preliminary program of short courses for Durban 2009. Steve Heeringa IASS Scientific Secretary, 2007-2009
The Survey Statistician 5 January 2008
IASS Election Results Results of the recent IASS Elections were as follows: President Elect, 2007-2009: Susan Linacre (Australia) (to serve as President, 2009-2011) Vice-Presidents, 2007-2009: Seppo Laaksonen (Finland) Pierre Lavallée (Canada) Scientific Secretary, 2007-2009: Steven Heeringa (United States) Council Members, 2007-2011: Jairo Arrow (South Africa) Louise Bourque (Canada) Kathryn Inglis-Clark (Australia) Dalisay Maligalig (Philippines) Paul-André Salamin (Switzerland) Shyam Upadhaya (Nepal) These members will serve with President Pedro Silva, 2007-2009, and the six Council members previously elected for 2005-2009. Congratulations to the successful candidates and thanks to all those who stood for office. Report from the 2009 Program Committee
Leyla Mohadjer The IASS Program Committee for the 57th session of the ISI was formed in the summer of 2006. The Committee includes the following members (table, next page). The committee came up with an initial list of about 80 topics for the 2009 Invited Program Meetings. In addition, suggestions were solicited from the IASS membership through announcements in the newsletter. The initial list was first reduced to about 35 topics by consolidating similar topics, and eliminating
topics that were covered in recent ISI meetings. The committee then created a final list of 23 topics that was submitted to John Kovar, the Chair of the ISI 2009 Program Coordinating Committee, prior to the 2007 ISI meetings. In creating our final list of topics proposed for the 57th session, we looked for a balance of theoretical and practical statistical topics. Preference was generally given to topics of wide and practical interest with an emphasis on new developments. In addition, special attention was given to topics addressing problems faced by developing countries, and especially topics of interest to Southern Africa. The committee came up with a list of organizers and in many cases, lists of potential speakers for the proposed topics with the goal of having a good geographic (including transition and developing countries), gender, and age representation. However, in many cases we were unsuccessful in bringing in organizers or speakers from the developing countries as lack of resources prohibits these colleagues from traveling to Durban. In addition, the Committee actively engaged in discussions with other sections, looking for opportunities to collaborate. The following is a list of proposed IASS sponsored (or cosponsored) sessions as reported by the 2009 ISI Program Coordinating Committee and included in the ISI Newsletter, Vol. 31, no. 3, 2007 (table, next page). I would like to take this opportunity to thank the Committee members for all their efforts in putting together such a strong list of proposed topics for the 57th session. I appreciate the attention they gave to this task given their very busy schedules. I would like to thank Gordon for his guidance and support in organizing the committee and the subsequent activities, and many thanks to John Kovar for his effective leadership of the Coordinating Committee.

The Survey Statistician 6 January 2008
IASS Program Committee Members Name Affiliation Country 1. Jairo Arrow Statistics South Africa South Africa 2. Oztas Ayhan Department of Statistics Turkey
3. Wilton de Oliveira Bussab Department of Informative & Quantitative Methods
Brazil
4. Jean-Hugues Chauchat University of Lyon France
5. Langhui Huang National Bureau of Statistics China
6. Benjamin F. Kiregyera (Prof. Ben Kiregyera)
Uganda Bureau of Statistics Uganda
7. Geoffrey Lee Australian Bureau of Statistics Australia
8. Ralf Munnich University of Trier Germany
9. Don A. Royce Statistics Canada Canada
10. Natalie Shlomo Central Bureau of Statistics Israel
11. Paul Smith Office for National Statistics UK
12. Romulo Virola National Statistical Coordination Board Philippines
13. Tommy Wright U.S. Bureau of the Census US
Proposed IASS Sponsored / Cosponsored Sessions
IASS Related Invited Paper Meetings for the 57th ISI Session, Durban, South Africa
Session number
Invited Paper Meeting Title Committee(s)Responsible
OrganizerName, country, e-mail
IPM16 Comparing Poverty and Prices across National Boundaries - the ICP Programmed and Poverty PPPs
IAOS IASS
Local Hosts
Mirriam Babita, South Africa,
IPM27 Uncertainty in Statistical Matching IASC IASS
Mauro Scanu, Italy, ISTAT, [email protected] and Tomas Aluja-Banet, Spain, [email protected]
IPM47 Designing and Conducting Surveys in Adverse Conditions (tentative title).
IASS GTC
To be determined, c/o Leyla Mohadjer, [email protected]
IPM48 Sampling and Estimation Issues in Health Statistics
IASS Local Hosts
Wilton Bussab, Brazil, [email protected]
IPM49 Measuring and Assessing Respondent Load
IASS Local Hosts
Richard Penny, New Zealand, [email protected]
IPM50 New Developments in Monitoring and Controlling Field Data Collection Activities
IASS Dina Neiger, Australia,
IPM51 Recent Developments in Survey Methodology Research - Design and Estimation
IASS Paul Smith, UK, [email protected]

The Survey Statistician 7 January 2008
Proposed IASS Sponsored / Cosponsored Sessions (continued)
IASS Related Invited Paper Meetings for the 57th ISI Session, Durban, South Africa
IPM52 Outliers in Complex Sample Surveys IASS Julie Gershunskaya, USA, and Partha Lahiri, USA, [email protected]
IPM53 Nonresponse Bias in Surveys IASS Jelke Bethlehem, Netherlands, [email protected]
IPM54 New Developments in Modeling and Analysis of Survey Data
IASS Jay Breidt, USA, [email protected]
IPM55 New Methodologies in Sampling Rare and Elusive Populations
IASS Sanghamitra Pal, India,
IPM56 Modeling Business Data to Produce Small Area Estimation
IASS Mike Hidiroglou, Canada, [email protected]
IPM57 Integrated Household Surveys - Design, Implementation, and Estimation
IASS Denise Silva, UK and Brazil, [email protected]
IPM58 Issues In Price Index Methodology and Measurement
IASS Sylvie Gauthier, Canada, [email protected]
IPM59 Dissemination of Survey Results to Public
IASS Tommy Wright, USA, [email protected]
IPM60 What Role, If Any, Should Weights Play in the Analysis of Survey Data
IASS Phil Kott, USA, [email protected]
IPM67 Models of modern data and metadata systems
GTC IFC
IASS
To be determined, c/o Paul van den Bergh, [email protected]
IPM97 Estimating demographic statistics with flawed vital registration systems
GTC IUSSP IASS
John Cleland, UK, [email protected]
International Association of Survey Statisticians
President’s Report of Activities 2005-2007
The International Association of Survey Statisticians (IASS - AISE) was founded in 1973. Operating in English and French, it aims to promote the study and development of the theory and practice of sample surveys and censuses. It also aims to increase the interest in surveys and censuses among statisticians, governments and the public in the different countries of the world. At present, the IASS has approximately 1000 members from 120 countries, and more than 20 institutional members.
Executive Committee The IASS Executive Committee for the years 2005-2007 was composed as follows: President: Gordon Brackstone President-Elect: Pedro Luis do
Nascimento Silva Vice-Presidents: Jelke Bethlehem John Kovar
Scientific Secretary: Executive Director: Director ISI:
Lilli Japec Michel Péronnet Daniel Berze (ex officio)
Council Members The policies and main decisions of the Association are discussed and decided by the Executive Committee with the support of the Council, which is composed of twelve members elected for a four-year period.

The Survey Statistician 8 January 2008
The 2007 Election Nominations Committee, chaired by Beverley Carlson, worked diligently during 2006 to identify candidates for the posts of as President-Elect, Vice-Presidents (2), and Scientific Secretary for the period 2007-2009, as well as Council members (6) to serve from 2007-2011. They are to be thanked for coming up with an excellent slate of candidates whose names went into the 2007 Election process administered by our Secretariat. The Election results are reported in the Executive Director’s report. Secretariat The IASS headquarters is situated in Libourne, France, and operates with financial support and facilities kindly provided by INSEE, the French statistical agency. Executive Director: Michel Péronnet Treasurer: Michel Kagan (replaced
François Fabre during 2006, recently resigned)
Executive Secretary: Anna Maria Vespa Secretary: Claude Olivier
Survey Statistician The Newsletter of IASS, the Survey Statistician, continued to be published twice each year, in English and French, under Editor, Steve Heeringa, and Production Editor, Gail Arnold. The Newsletter provides members with current information about activities of the Association and other events of interest, about developments and applications of survey methodology across the world, and about methodological issues of current interest. The Section Editors have been: John Kovar for Country Reports, James Lepkowski for Software Review and Anders Christianson for Ask the Experts. IASS is very grateful to these volunteers who have helped to produce our newsletter regularly, and to the Australian Bureau of Statistics for their help in printing and distributing Survey Statistician, to Statistics Canada for its translation into French, and to INSÉE for publication and distribution of the French version. Unfortunately, some of these volunteers will not be continuing in their roles after the Lisboa meetings and need to be replaced. Our network of country representatives continues to maintain a flow of country reports to the Survey Statistician. But it also has
some gaps. We have about 80 names in the list, but have valid e-mail addresses for only 60 of them. Without a valid e-mail address we cannot communicate effectively with them. Of these 60, about 40 are labelled “active” – meaning that we have heard from them in recent years. The IASS website (http://isi.cbs.nl/iass/index.htm) The IASS website continued to provide a well-structured source of current information, in English and French, for members of IASS. The Survey Statistician has also been made promptly available on the website. We are indebted to our IASS Webmaster, Eric Rancourt, who has continued to provide direction of the site and to ensure that information remained current. The site is housed with the ISI in Voorburg and we are grateful for the technical support of the ISI office in facilitating improvements and updates. Cochran-Hansen Prize The IASS established the Cochran-Hansen Prize in celebration of its 25th anniversary in 1998. The Prize is awarded every two years to the best paper on survey research methods submitted by a young statistician from a developing or transitional country. Following discussions in Sydney, and some disappointment with the number of entries for the 2005 Prize, we initiated a renewed effort to attract interest and submissions for the 2007 Prize, under the leadership of Sarah Nusser. These efforts have paid off with a strong slate of entries for 2007. A Prize committee, consisting of Sarah Nusser, Jelke Bethlehem, Linda Hewitt, Geoffrey Lee, and Pedro Silva, was struck to review the entries and select the winner. The winning paper will receive the Cochran-Hansen Prize in the form of financial support to present the paper at the ISI Session in Lisboa as well as books or journal subscriptions to the value of about € 500. IASS Invited Paper Meetings, Lisboa 2007 David Steel has chaired the IASS Programme Committee for the ISI Session, Lisboa 2007. IASS is sponsoring 14 sessions, four of these jointly with IAOS, and one with IASE. The session topics cover a broad range from the
The Survey Statistician 9 January 2008
more theoretical to the highly practical. Among other themes, the program reflects a lot of interest in the combination of data from different sources or different methods of collection, concerns for data quality, and the role of survey research in the information age. In addition, IASS President-Elect, Pedro Silva, has been serving as chair of the overall ISI Programme Coordinating Committee for ISI 2007. IASS Short Courses, Lisboa 2007 A traditional and popular IASS activity is the organisation of Short Courses on survey methodology in connection with each ISI Session. They represent an opportunity for survey statisticians to follow Courses given by high level international experts. Lilli Japec, Scientific Secretary, started organising the Short Courses shortly after the ISI Session in Sydney and has been working hard ever since to ensure that all arrangements are in place for Lisboa. The preliminary programme of courses was advertised through several dissemination channels. The courses are listed in the Report of the Scientific Secretary. With funding for students from developing countries no longer available from the U.N. Statistics Division, other international agencies were approached to seek funding. Only the World Bank has responded positively with some funds being made available generally for attendance at the ISI meetings, for which students of our courses could apply. In addition to this we have offered some limited direct IASS support to assist a few students to attend the courses in Lisboa. However, we may again experience difficulties in attracting registrations from developing countries for these courses, and direct IASS funding is not a feasible ongoing solution. IASS Satellite Meetings to the 2007 ISI Session IASS has agreed to sponsor two satellite meetings following the 2007 ISI session. A Conference on Small Area Estimation will be held September 3-5 2007 in Pisa, Italy, and a Conference on Innovative Methodologies for Censuses in the New Millennium will be held in Southampton, U.K. from August 30 to September 2, 2007. Details of these meetings have been advertised by IASS, ISI and elsewhere.
IASS Invited Paper Meetings, Durban 2009 In 2006 the IASS Programme Committee for 2009 was formed under the leadership of Leyla Mohadjer The Committee includes 13 members and has been very active consulting and developing a proposed program topics for the 2009 session. These have been submitted to the ISI Programme Coordinating Committee (chaired by IASS Vice-President John Kovar) to be considered, along with the proposals from other sections, by that Committee during the Lisboa sessions. International Conferences between ISI Sessions Since the 2005 ISI session, IASS has co-sponsored a variety of important conferences on topics of interest to survey statisticians. Immediately following the Sydney Session a Conference on Complex sampling, retro-spective sampling and missing data (in honour of Alastair Scott) was held in Auckland, New Zealand. In May 2005, the fourth francophone Colloque francophone sur les sondages (Symposium on sampling techniques) was held in Quebec, Canada. In August 2005. a Conference on Small Area Estimation (SAE 2005) was held in Jyvaskyla, Finland. In January 2006, the 2nd International Conference on Telephone Survey Methodology took place in Miami, U.S.A. This was followed in April by Q2006, the 3rd European Conference on Quality in Survey Statistics, held in Cardiff, Wales. At that meeting IASS organised a panel discussion on the role of survey statisticians in managing data quality. The International Conference on Methodology of Longitudinal Surveys took place in July 2006 in Colchester, U.K. Finally, IASS co-sponsored two conferences that took place in June 2007 - ICES III, the 3rd International Conference on Establishment Surveys in Montreal, Canada, and the 2nd Baltic-Nordic Conference on Survey Sampling in Kuusamo, Finland. Our sponsorship of these eight conferences has varied between an explicit financial commitment in one case to simply merely lending our name and logo to the event. Wherever appropriate we have used these
The Survey Statistician 10 January 2008
opportunities to display the work and activities of IASS Proposals for changes to the structure of ISI Since the Sydney session the Executive has been monitoring closely the evolving discussion of possible “restructuring” within ISI. This discussion has included possible changes to membership categories, governance structure, and the finances of ISI and its Sections, and has been prompted by concerns about the future relevance, demographics and financial stability of ISI given recent trends. We have commented on several issue papers that have been put forward for comment. Generally we have been supportive of the directions proposed which are aimed essentially at strengthening the family ties between ISI and its Sections and ensuring the ongoing relevance and financial viability of the ISI family. Our primary concern, and it is a serious one, is that the arrangements so far proposed seem to involve a significant increase in fees for current IASS members who are not already ISI members in order for them to continue to belong to a new ISI, which would embrace all section members. This, of course, could lead to significant attrition among section membership and loss to the ISI family, thus defeating one prime purpose of the change, which is to strengthen ISI membership. These concerns, and those expressed by others,
have been considered by the ISI Executive over the past few months. Papers that take account of these concerns have been distributed for review and discussion during the Lisboa session. At this point there is not, in my view, a clear resolution of these issues on the table, and we will need to be creative and vigilant in seeking a solution that will ensure the continuing viability of ISI without jeopardising its main source of new members and activities, namely the Sections. Conclusion I would like to end by thanking again all those who have helped IASS so much over the past two years, including, of course, our Executive, Council and Secretariat, but also the many unelected members who have chaired or served on committees (including particularly the important work of the Nominations committee and the Program committees), produced or contributed to our newsletter, maintained our website, presented our courses, organised the conferences we have sponsored, and planned and organised the sessions we are sponsoring at the Lisboa session. Thanks to you all and I wish similar support and good luck to my successor, Pedro Silva, as he takes over the Presidency. Gordon Brackstone President, IASS July 2007, Ottawa
CHANGE OF ADDRESS
Members are encouraged to inform the IASS Secretariat of changes of address as soon as possible. Mailings of “The Survey Statistician” will be delayed and may be lost if the Secretariat does not have your correct address. You may notify Ms. Claude Olivier of your change of address by completing and mailing the Change of Address form given at the end of this newsletter. Alternatively, you can provide the same information to Ms. Olivier by email to [email protected].
The Survey Statistician 11 January 2008
Australia Paul Sutcliffe
In August 2007 the Australian Bureau of Statistics (ABS) produced an Experimental Monetary Water Account for Australia analysing revenue and expenditure associated with the supply and use of distributed water in the Australian economy. In particular, these accounts matched some of the physical flows of distributed water with monetary transactions for the year 2004–05 and this has provided a number of insights into the way we currently supply and use distributed water. For example, in 2004-05, the household sector consumed 23% of distributed water and contributed 61% of total payments. In contrast, the Agriculture, forestry and fishing industry consumed 64% of distributed water and contributed 8% of total payments. Agreements developed by the Council of Australian Governments (CoAG) in 1994 and 2004 aim to increase the productivity and efficiency of Australia’s water use. One of the key elements of the 2004 National Water Initiative (NWI) was to introduce best practice water pricing and institutional arrangements to promote economically efficient and sustainable use of water resources, water infrastructure assets and government resources devoted to the management of water. The information provided by linking monetary and physical water accounts could be useful for determining efficient water allocation, achieving cost recovery for water infrastructure assets and analysing trade-offs between alternative water and economic policies. Monetary water accounts also support commensurability with monetary measures of
other natural resource stocks and flows (such as land, oil and gas stocks and depletion of these stocks), thereby supporting potentially powerful analytical frameworks such as the United Nations' System of Environmental and Economic Accounts 2003 (SEEA). While the estimates are experimental in nature and involve a number of data gaps and data deficiencies, they assist in demonstrating the usefulness of linking physical and monetary water data within a robust accounting framework. In the future, analyses could be further enhanced by including not only distributed water, but also monetary valuation of self-extracted water flows and of water stocks themselves (that is, the value of water held in dams, aquifers etc.). For more information please contact Peter Comisari at [email protected] . In October 2006 the Australian Bureau of Statistics (ABS) published the first national information framework for emergency management initiatives in Australia, the Emergency Management Information Development Plan (EMIDP), after its endorsement by the Australian Emergency Management Committee. Its development involved extensive consultation with a large range of national, state and territory agencies as well as emergency management peak bodies and other non-government organisations. The EMIDP sets information requirements within the context of emerging national emergency management policy and looks at six key priority information gaps within emergency management with associated proposals for the development of sources to fill these gaps. These gaps are:
The Survey Statistician 12 January 2008
• Understanding the full impact of costs (economic, social and environmental) of emergencies - will allow more effective targeting of service delivery leading to safer communities and create new data standards for the emergency management sector;
• Better models and tools to allocate investment across prevention, preparedness, response and recovery - methodologies to better assess resource needs and priorities within emergency management and a framework for evaluating the effectiveness of emergency service investment to optimise community risk treatment;
• Volunteers in the community - quantification of the contribution of volunteers to national emergency services to enable better bases for management of, and support for, volunteers;
• Assessing the impact of emergencies in the community - a common framework for assessing the impact of emergencies on communities, including standards and definitions, to support provision of consistent and comparable data and to provide better recovery outcomes;
• Information in specific hazards - better understanding of the risks and vulnerabilities of Australian communities to specific hazards such as cyclones, storm tides/storm surges, severe winds and floods to lead to a better basis for preparation, mitigation and recovery; and
• A greater understanding of the influence of our environment on the management of emergencies - a better understanding of the availability of water and the impact of environmental changes is essential for emergency management planning.
There is commitment from both national and state and territory emergency management jurisdictions to progress the development activities identified. The ABS is currently working with the sector to address some of these gaps, particularly in relation to consistent and comparable national performance indicators for the emergency services organisations (ESOs).
The ABS would be interested in hearing from other statistical agencies with experience in this sector. For more information on the EMIDP or on performance indicators for ESOs please contact Jill Tomlinson at [email protected] .
Brazil Marcel de Toledo Vieira
The Brazilian Institute for Geography and Statistics (IBGE) conducted both the Agriculture Census and the Population Count Survey between April and August 2007. Over 90 thousand census agents and interviewers were recruited for visiting approximately 5.2 million agricultural establishments and 34 million households where over 110 million residents live. In both surveys IBGE has, for the first time, fully replaced the traditional paper questionnaire with electronic questionnaires on handheld devices (Personal Digital Assistants - PDAs) equipped with a global positioning system (GPS). This has reduced considerably the time necessary to process the survey and improved the general quality of the collected data, as answers could be verified and edited automatically during the interview. Furthermore, both non-response caused by interviewers’ errors and the data entry phase of the survey have been eliminated. The Population Count Survey is a less detailed survey than the Demographic Census (conducted by IBGE every ten years) and was undertaken in 2007 only in municipalities with population up to 170 thousand inhabitants (totalling therefore 5,514 municipalities) investigating only four characteristics: age, gender, migration, and household conditions. Results of this survey will be used to update the information adopted for the calculation of population projections and estimates that have been released annually by IBGE since 1989. The use of PDAs in the 2007 Agricultural Census also allowed the geographic coordinates of every agricultural establishment and property in Brazil to be registered. This survey, based on the reference period between January and

The Survey Statistician 13 January 2008
December 2006, has examined the number of establishments and their sizes, what agricultural items are currently being produced, the number of employees in the sector, the techniques currently being utilised, and the use of environmental resources, among other characteristics. The full release of the results is being eagerly anticipated since the previous Agricultural Census was conducted over ten years ago, in 1996. IBGE expects to publish the final results of both surveys by July 2008. For further information, please contact Antônio José Ribeiro Dias at [email protected] or see www.ibge.gov.br/english/ . The First Brazilian School on Sampling and Survey Methodology - 1st ESAMP was held at IBGE’s Centre for Documentation and Information Dissemination (CDDI) in Rio de Janeiro between 21st and 23rd November 2007. This conference, with over 150 delegates from most Brazilian states, has brought together for the first time in Brazil survey statisticians, researchers from both official statistics offices and universities, and students, with the aim of discussing the most recent methodological developments on survey sampling design and the analysis of complex survey data. In addition to contributed papers, there were nine invited lectures and a short course on ‘Repeated Sampling over Time’. The 1st ESAMP was coordinated by a team of young researchers from the Federal University of Pernambuco (UFPE), Federal University of Juiz de Fora (UFJF), and the National School of Statistical Sciences (ENCE), which belongs to IBGE. This scientific event was jointly sponsored by ENCE/IBGE, Joaquim Nabuco Foundation (Fundaj), and SEBRAE, and was supported by the Brazilian Statistical Association (ABE). For further information, please contact Cristiano Ferraz at [email protected], Eduardo Lima Campos at [email protected], or see www.fundaj.gov.br/1esamp/
Canada John Kovar
In September 2006, Statistics Canada decided to conduct a review of the quality
assurance practices in the production of nine key indicators programs: Labour Force Survey, Retail Trade Survey, Monthly Survey of Manufacturing, Consumer Price Index, International Trade, Gross Domestic Product by Industry, Income and Expenditure Accounts, Labour Productivity and Balance of Payments. The review was completed in March 2007 and a summary of the results was published in Statistics Canada’s Daily on June 4th (www.statcan.ca). The review was carried out simultaneously by teams of three middle managers and one senior manager assigned to each program. The review focused on factors that put the accuracy of the data at risk during the execution of the program (i.e. the production process). The review also focused on the certification or validation step of the programs, as well as the dissemination step. The review was based on information obtained during interviews with the managers responsible for the programs and from existing docu-mentation. A follow-up evaluation of the review process indicated that it was beneficial to the development of middle managers and the management of quality in the programs. For more information, please contact Claude Julien at [email protected] The Canadian Health Measures Survey (CHMS) was launched in March 2007. The CHMS is Statistics Canada’s first health survey employing a comprehensive battery of direct physical measurements. From March 2007 until May 2009, CHMS will collect key information on the health of Canadians in the form of direct physical measurements such as blood pressure, height and weight, blood and urine sampling and physical fitness testing. Collection consists of a combination of personal interviews using computer-assisted interviewing software and a visit to a mobile clinic for the physical examination. These mobile examination centres stay at each site for approximately six weeks. Two mobile clinics are being used for CHMS and they alternate from one site to the next. Fifteen collection sites situated in different regions of Canada will be visited during the two years of collection. Different options for survey designs were considered and evaluated between the pilot

The Survey Statistician 14 January 2008
results in 2004 and the actual implementation of the survey in 2007. The final sampling plan for CHMS is based on a three-stage design and uses the Canadian Labour Force Survey (LFS) area frame geography for one of its stages and the 2006 Census for another. The design is based on the objective of getting 5000 respondents completing the household questionnaire as well as the physical measures at the mobile clinics. The sampling frame covers approximately 97% of the Canadian population aged 6-79. As of mid-October 2007, four sites out of the 15 have been collected: two in Ontario, one in Quebec and one in the Atlantic region. Preliminary results show better than expected overall response rates at the clinic. However, some age groups, especially the young ones, had somewhat fewer respondents than expected. Sampling fractions are recalculated for subsequent sites in order for CHMS to meet the targeted number of respondents. There is some early indication that the contact and response rates differ from site to site. Close monitoring of collection is performed on a continuous basis. So far, weather condi-tions have not been a major issue for the mobile clinics and their transportation from site to site, but close attention will be paid by the CHMS team as they enter the winter months. For more information, please contact Suzelle Giroux at [email protected] .
During a recent review of its program, the Methodology Branch of Statistics Canada committed itself to examine various options for strengthening the leadership, coordination and support of methodology research. The initiative culminated with the creation of the Statistical Research and Innovation Division (SRID) within the Methodology Branch on June 21, 2006. The new Division is staffed with a small group of talented researchers under the leadership of Dr. Michael Hidiroglou. SRID will be responsible for researching, developing, promoting, monitoring, and guiding the adoption of new and innovative techniques in statistical methodology in support of Statistics Canada’s statistical programs. Its mandate also includes the provision of technical leadership, advice and
guidance to employees elsewhere in the Statistical Methods Program. SRID will also provide the opportunity for Program employees to carry out sustained research projects lasting from six months to one year within SRID. For more information, please contact Mike Hidiroglou at [email protected] .
Malaysia Aziz Mohammad
In 2005, the Department of Statistics, Malaysia (DOSM) conducted a Baseline Census of Small and Medium Enterprises (SMEs). More than 550,000 establishments were captured in the census. The census covered three main sectors namely the manufacturing, services and agriculture sectors, and a report was generated at the end of 2006. A primary objective of the census is to develop a comprehensive SME database for the purpose of long term planning and monitoring, as well as to fulfill the increasing demand for analysis at the micro level. Each record in the database comprises of more than 200 fields or data items. Besides SME information from the Baseline Census, the database also contains secondary data from administrative records of the relevant agencies. In the long run, the database system is expected to trace the progress of individual SME establishments, for example, in terms of size: from micro to small and then to medium and so on. Implemented in a web-based medium, access to the database system is currently given to 10 main user agencies. For further information, please contact Azahari Mohd Raslan at [email protected] DOSM has agreed to be the host of MalaysiaInfo in February 2007; that is, to take the lead role in maintaining and updating it. MalaysiaInfo is a user-friendly database built on a customized web-based version of DevInfo 5.0. MalaysiaInfo is organized around the Millennium Development Goals (MDGs) and their targets, as well as thematic sectors which encompass the economy, population, gender, education, environment, health, poverty and security. MalaysiaInfo includes data and indicators at the various levels of

The Survey Statistician 15 January 2008
disaggregation, e.g., national/state/district. With MalaysiaInfo, it is convenient for users to retrieve data, view time trends, display data arrays, chart and map data. The United Nation’s office in Malaysia provided financial assistance for the project: Optimizing the Use of MalaysiaInfo and the fund will be used for activities planned for 2007. The activities include training sessions on user interface and data administration, purchase of servers and an evaluation workshop. Further information on the project can be obtained from Nazaria Baharudin, at [email protected]. DOSM has conducted a Pilot Survey on Wages and Salary in 2006 which becomes a routine survey starting in 2007. The wages and salary data are collected using the household approach via the Labour Force Survey. The survey covers both urban and rural areas of all states in Malaysia. A stratified multi-stage sample design is used for the survey, with a sample size of about 24,000 private living quarters. Salary and wages data are only collected for respondents aged 15 years and above whose employment status is either private or government employees. The survey was undertaken in the months of January, February and March of the respective years. Further details about the survey can be obtained from Nazaria Baharudin at [email protected].
Philippines Gervacio G. Selda, Jr.
The Statistical Research and Training Center (SRTC), the research and training arm of the Philippine Statistical System (PSS), along with the National Statistics Office (NSO) and Bureau of Agricultural Statistics (BAS) are implementing a project on the “Development of Alternative Sampling Design and Survey Strategies for the Conduct of the Census of Agriculture and Fisheries.” The project aims to come up with an optimum sampling design and strategy for the conduct of the Census of Agriculture and Fisheries (CAF) in 2012 given the available resources of PSS and the constraints inherent in the conduct of said activity. Specifically, the project seeks to: (a) evaluate the sampling design and strategies utilized in the previous censuses of
agriculture and fisheries; (b) find alternative sampling designs given the available frames or other frames to be constructed with the proposed sampling design; (c) study area frames as possible option to be tested and piloted in selected areas to compliment the current list frames; and (d) recommend alternative survey designs and census methodologies for the conduct of the CAF that will provide rather reliable data at the least possible cost. The output of the project is expected to be made available at least a year before the next CAF is to be undertaken.
The Philippine Statistical System (PSS), which has a highly decentralized set-up, is currently undergoing an extensive review in line with the directive of the President of the Philippines to conduct a strategic reassessment of the operations and organizations of the Executive Branch for the purpose of improving the quality and efficiency of the government services. This work is being conducted by the Special Committee to Review the Philippine Statistical System, an independent body composed of five respected statisticians and eminent persons who are knowledgeable and familiar with the situation prevailing in the system. The committee is expected to come up with a set of recommendations on the overall improvement of the system in relation to its effectivity, efficiency, objectivity and integrity in the delivery of statistical products and services to the various clients and stakeholders. The review work started last July 2007 and expected to be completed within seven months. The Philippine Statistical System has recently established a Scientific Career System for Statisticians (SCSS) to enable it to attract and retain professional statisticians to the government service. In general, the SCSS is a system of recruitment, career progression, recognition and reward of statisticians in the government service. The system provides an avenue to recognize relevant and outstanding contributions of the statisticians in the country and at the same time, promote statistics as a profession In this manner, statistician scholars and scientists would be encouraged to stay in the government while they continue to develop their expertise, enjoys incentives and rewards and grow professionally. The guidelines to implement the SCSS includes, among others: (a) creation of agency-based Scientific Career Evaluation Committees
The Survey Statistician 16 January 2008
(SCECs) which will handle the assessment of application of their nominee-statisticians and monitor/evaluate the performance of their scientists; (b) creation of a PSS-wide SCEC to assist agencies that have no SCEC of their own nor the capacity to create one; and (c) creation of a Secretariat for the PSS-wide SCEC that will be based at the Statistical Research and Training Center.
Additional information on the above activities can be obtained from Dir. Gervacio G. Selda, Jr. of the Statistical Research and Training Center at [email protected]
Poland Tomasz Zadlo
In 2007 a number of new surveys are being conducted by the Polish Central Statistical Office in the following areas of interest: • in public finance statistics new areas of
financial activities of units of public financial sector are studied
• the survey of activities of leasing companies
• the survey of grouping processes of enterprises
• the survey of structure of Polish farms • the survey of export and import price
indexes • the survey of accidents at work and
health problems connected with work • preparation to census in 2011 • the survey of inflation influence on
consumption demand, savings and debts of households
• healthcare survey in households • the survey of economic situation of
tourist companies • quarterly financial accounts by
institutional sectors (conducted by Polish Central Bank with cooperation with Polish Central Statistical Office).
Starowicz et al. (2007) conducted the commercial project for the survey of passengers using communication lines managed by the Municipal Transport Union of the Upper Silesian Industrial District. The survey involved stratified sampling design and the use of generalized regression estimation
technique and aimed at the estimation of number of passengers both in the whole system as well as in individual municipalities. For details of the methodology used in the survey contact Wojciech Gamrot at [email protected] On 8-9 September 2008 two conferences will take place in Katowice, Poland: “Survey Sampling in Economic and Social Research” and “Statistics in Social and Economic Practice.” For details contact Tomasz Zadlo at [email protected]
Spain Dolores Lorca
During the last decade, the statistical systems have been compelled to assimilate the necessity of carrying out diverse Surveys on Environmental Topics, particularly in the fields of waste generation and treatment, the use and treatment of water, and environmental protection expenditures. Administrative sources play a major role in environmental surveys, since important aspects of statistical infrastructure such as the classifications of characteristics, the delimitation of the observation units, and their population frames are not appropriately integrated within the general statistical system of registers. This is the case for waste facilities, irrigation entities, water purification or waste water treatment plants, among others. This also has consequences in the estimation procedures, either direct or model assisted, some of which present very challenging particularities when compared with other establishment surveys. The approach undertaken by the Spanish National Statistic Institute (NSI) with respect to some of these surveys is summarized bellow through examples of several innovative projects implemented during the last decade. Water Surveys: The statistical approach to an inquiry on water can be undertaken from three major perspectives: quantity, quality and price. Either water flows or water stocks can be studied. Flows refer to fresh water (which is supplied to households or used for irrigation purposes) or to sewage that stems from economic activities and households.
The Survey Statistician 17 January 2008
In order to study water use within the agricultural context, a Survey on Water Use in Agriculture (SWUA) is carried out via irrigators associations. These associations provide water to nearly two-thirds of the total irrigated agricultural land in Spain. Water use in the remaining irrigated area is estimated by means of the Survey on Waste Generation in Agriculture (SWGA), which is addressed to farms. The estimation procedure for the SWUA uses irrigated regional total area, classified according to the irrigation technique for calibration purposes. This information is available annually from an area-based micro-census carried out by the Ministry of Agriculture (MA). Three flow types (water abstraction, water supply and waste water collection and treatment) are investigated throughout the same statistical operation, the Survey on Water Supply and Treatment (SWST). The Central Business Register (CBR) does not suffice as an appropriate basis on which to build the survey frame, so a database has been created that links the municipal districts to the microdata identification of the corresponding CBR units or, else, the administrative units, whose main activity could even be unrelated to water services, for the different types of water services. That database has also been linked to the one defining the survey frame for urban waste data collection. To estimate water supply at the regional level, take-all strata are defined in order to attain full coverage of territorial units with a population above 20,000 inhabitants. For the remaining population, a ratio estimator is used based on the number of residents in the municipalities being served. The statistical study of water is completed through a special module of water-related questions included in the waste generation survey questionnaires, as addressed to the different economic sectors. On the other hand, the relevance of the sewage treatment questions, also included in that module, is to be underlined because of the potential environmental effects of sewage and its treatment in some industrial branches. Waste Surveys: The Spanish NSI produces waste statistics to satisfy users’ demands in three areas of interest: waste generation, the
type of treatment applied to waste, and the treatment facilities’ characteristics. This activity gives rise to a system of statistical operations, in the form of sample surveys, whose design differs significantly from survey to survey, according to the sector and the target variables, combined with other projects of administrative or mixed nature. Waste Generation: Although aggregates on hazardous waste collected can be made available through administrative sources, the users’ demand (national and international) for data on waste generation, both hazardous and non-hazardous, as well as the need for activity-branch waste data break-up, make the development of specific surveys within the statistical system unavoidable. Waste generation surveys can be targeted at the same type of units as those addressed by other structural surveys. The CBR constitutes the initial survey frame for waste generation surveys. For the manufacturing sectors, however, a sample of establishments drawn from the CBR is combined with a sub-sample of establishments from the annual industrial production survey. Model-assisted estimation procedures are applied based on exogenous information on the number of employees or on the production value. For the SWGA, calibration techniques are used that rely on external marginal values such as cultivated land per crop or livestock figures obtained annually from administrative records of the MA. Urban Waste: Household waste generation is one of the most difficult environmental issues to estimate, and at the same time is being strongly demanded by users either at the national or international level. The main source for estimation is the Collection and Treatment of Urban Waste Survey (UWS) whose frame has been built in a similar manner to that of the Water Supply Survey. Thus, we are dealing with a survey frame consisting of territorial units to which the establishment-type unit supplying the waste collection service is linked. When selecting the truncated sample within a region, we aim at a population coverage close to 60%. As population coverage for the municipal waste collection service of both “mixed and undifferentiated materials” from construction

The Survey Statistician 18 January 2008
and “household and similar wastes” is virtually 100%, weights in sampled (“take-some”) strata are based on resident population. Taking into account that “take-all” strata coverage amounts to more than 40% of the territory as a whole, estimation-related biases are fairly bounded. Waste Treatment: There exist two feasible approaches to frame building for operations dealing with these issues. As waste treatment facilities are typically associated with a physical site, locating a facility’s mail address is not a difficult task. Consequently, the “facility-oriented approach” is perhaps the most advisable one, although it is not inconvenience-free. The second approach that can be used to build a frame is the “waste managers” approach. The frame would consist of a statistical unit (whether a firm, establishment or a local activity unit) with a valid license that enables its holder to manage waste, especially of the hazardous type. In a first step, a sample of waste managers is drawn from administrative records as provided by the regional environmental authorities. When selecting the sample, stratifying variables loaded from the CBR are taken into account. Whether a sampled unit is within the scope of the study is detected through fieldwork and, if appropriate, waste treatment data are required for each waste category and type of treatment, along with the capacity of the facilities where waste management is performed by the unit. On the other hand, both the number and total capacity of several types of facilities are externally available for each region. This information has statistical value by itself, as several regional environmental indicators can be built from it. More important here is that the aforementioned information can be used as an ancillary variable when estimating total treated waste. For further information: results, methodology, questionnaire, please contact Jorge Saralegui at [email protected] or Cesar Berrade at [email protected]
United Kingdom Peter Lynn
The British Crime Survey (BCS) has been running since 1982, and has been a continuous survey since 2001, involving interviews with around 45,000 persons aged 16 or over per annum. The focus is on measuring trends in victimisation. Details of methodology and results from the 2006-07 survey can be found at http://www.homeoffice.gov.uk/rds/bcs1.html. Two innovations are being considered for the 2008-09 BCS. The first is to extend the sample to include 10-15 year-olds; the second is to test a module of questions being developed by Eurostat which are intended to provide a common method for measuring levels of victimisation across the European Union. The BCS covers England and Wales. In Scotland, the Scottish Crime and Justice Survey (SCJS) will begin field work in April 2008 with a target of 16,000 interviews per annum. The SCJS is a successor to the Scottish Crime Survey - which ran as a face-to-face survey in 1993, 1996, 2000 and 2003 – and the Scottish Crime and Victimisation Survey, which ran as a telephone survey with a larger sample in 2003-04 and then as a smaller face-to-face survey in 2006. The SCJS aims to monitor trends in crime and victimisation, including prevalence of illicit drug taking and domestic violence, as well as collecting perception and attitudinal data.
United States Howard Hogan
WesVar(c) Software Upgraded to Version 5. WesVar, a computer program developed and distributed by Westat for calculating survey estimates and measures of sampling precision has been upgraded to version 5. New features include analysis of extreme data, batch capabilities for preparing tables and intermediate files, and the calculation of additional statistics. WesVar is used by both Westat staff and other researchers that need to analyze data

The Survey Statistician 19 January 2008
from surveys having complex sample designs. Westat has employed a number of different methods for distributing WesVar to the research community. Early versions of WesVar were distributed free on diskettes to interested individuals. Later versions of WesVar were distributed over the Internet by permitting users to download a 30-day-free demonstration version, which could be con-verted to a permanent version by the purchase of a WesVar license. With the release of version 5, Westat had decided to cease charging new WesVar license holders and to return to its initial mode of free distribution. Westat staff are currently using WesVar version 5. Westat's statistical Group is provid-ing information to current WesVar license holders about the procedure for downloading version 5 from Westat's web site. Individuals that are not current WesVar license holders can download a permanent free version of the prior version of WesVar, version 4.3, from the following Internet location: https://www.westat.com/wesvar/download/ download.cfm?version=4. General information about WesVar is available at http://www.westat.com/westat/wesvar/index. html . For the past two decades, the Survey of Income and Program Participation (SIPP) has been the leading source of data on the economic well-being of Americans. Recently, the U.S. Census Bureau initiated a project to reengineer the SIPP in order to provide crucial information in a timely manner and at reduced cost through reengineered survey design, improvements in processing efficiency, and a focused content scope. The main purpose of SIPP is to provide a nationally representative sample that can be used to evaluate the annual and sub-annual dynamics of income, the movements into and out of government transfer programs, and the effect on family and social context of individuals and households. There are five main activities in the reengineering program:
1. Improving the instrument and processing system
2. Integrating administrative records and survey data
3. Investigating the use of the American Community Survey (ACS) for the sampling frame
4. Developing and evaluating the use of an event history calendar in the data collection instrument
5. Reviewing the survey content and developing reimbursable
One of the innovative components of the reengineering effort has been the development and evaluation of the event history calendar. The use of an event history calendar (EHC) to capture sub-annual transi-tions is a relatively new feature in automated demographic survey instruments. The Panel Study of Income Dynamics (PSID) conducted by the University of Michigan, the Health and Retirement Survey (HRS), as well as the labor surveys of Statistics Canada (SLID) and Statistics Netherlands currently use or are planning to use this methodology, which ties life events to program participation, health insurance, and job transitions. An EHC inter-view is centered on a customized calendar that shows the reference period under investigation. The calendar contains timelines for different domains, for example work his-tory, residence history, household compo-sition and other domains relevant to the topic of the study. Landmark events such as holidays and birthdays can be used to aid the respondent’s memory. A conference on the use of, evaluation of data from, and training of Field Representatives for the EHC method-ology is planned for December 2007. Plans are also underway to conduct a test of the EHC methodology, comparing responses to a paper instrument to the responses in the current SIPP, as well as administrative records data available for some of the questions.
The ongoing research into better ways to elicit correct responses in surveys (such as EHC) and reduction of respondent burden needs to continue as SIPP continues. The work on these improvements to date has many carryover benefits for the future of SIPP data collection and processing. These improve-ments are still in their beginning stages and implementation will not occur until 2011/2012. For more information please contact [email protected] .

The Survey Statistician 20 January 2008
Software reviews over the last several years have presented summaries of the features of a number of systems or components of systems that deal directly with survey estimation issues, particularly sampling error and weighting procedures. They have addressed such systems as EpiInfo, Wesvar, SUDAAN, SAS sampling error PROCedures, Stata, IVEware, and software for generalized regression weighting. Some of this software is available for free over the internet, and others require payment of a licensing fee. We are considering additional reviews, and we would like to get reader advice about
software that has not been reviewed to date, or for updated reviews on some software. We also would like to hear from you about whether there are software systems that address other survey sampling issues that you'd like us to review. Please keep in mind that we review only software that is available for purchase or for free download. We do not review proprietary or other software that our readers cannot purchase or access through a download. Please send your advice and ideas to Jim Lepkowski, the review editor, at [email protected].
Analysis of complex samples in R Thomas Lumley
Department of Biostatistics University of Washington
What are R and the survey package? R (http://www.r-project.org) is a free, open source, implementation of the S language developed at Bell Labs. R and S have always provided good facilities for model-based data analysis, but until recently did not support design-based inference. R is an interactive, command-line system, with a powerful object-oriented programming language. Most of R is itself written in R, and user-written functions (such as the survey package) have the same look and feel as built-in code. R and S-PLUS (the commercial package based on Bell Labs’ S) are particularly popular for disseminating new statistical methods, due to the ease of programming and the availability of a platform-independent package system. R is available for Windows, Macintosh OS X, and most Unix and Linux systems.
The flexibility of R comes at a price in performance: it is often slower and usually requires more memory than competing systems. This disadvantage is becoming progressively less important as computers improve. Analyses of data from substantial national surveys such as NHANES are feasible on modern desktop (and laptop) computers, and R can take advantage of 64-bit computers with large amounts of memory if these are available. The survey package is one of more than 1000 add-on packages available from the websites of the Comprehensive R Archive Network (CRAN: http://cran.r-project.org). CRAN provides a central repository for packages, and makes prebuilt versions of packages for Windows and Macintosh users who are unlikely to want to build their own. CRAN also enforces some code and documentation quality control, to the extent that this can be readily automated. A much earlier version of the survey package was described in Lumley (2002). The most
SOFTWARE REVIEW
The Survey Statistician 21 January 2008
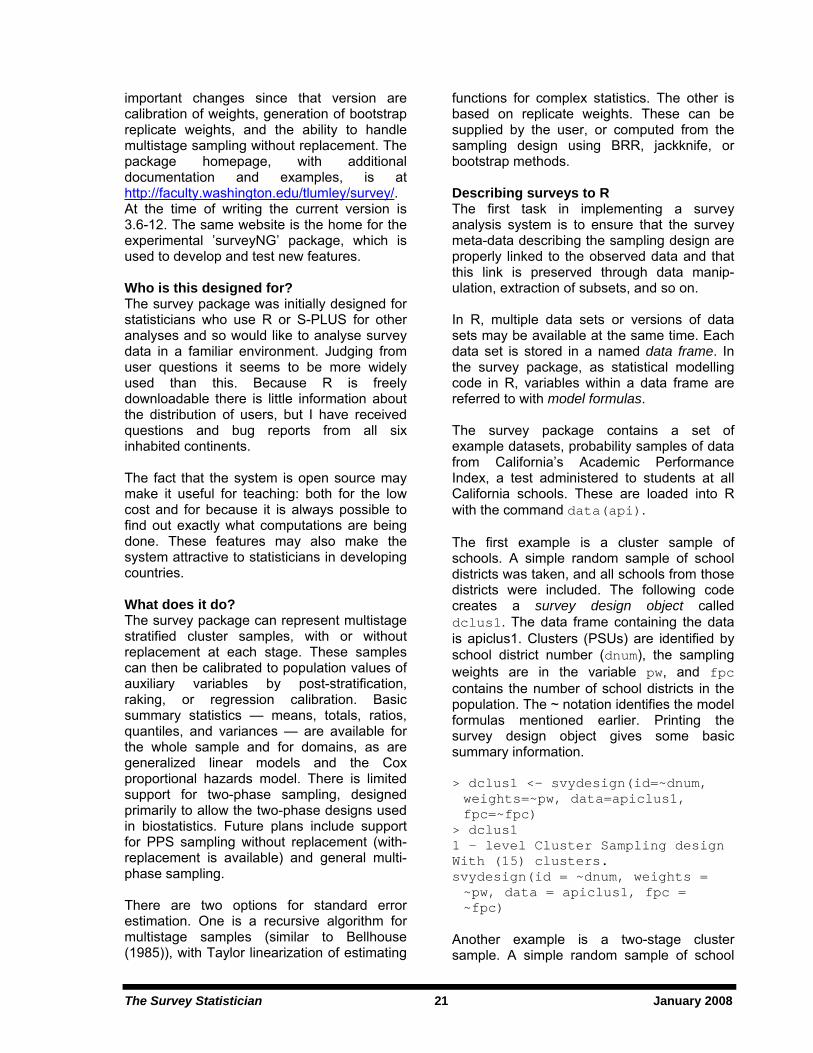
important changes since that version are calibration of weights, generation of bootstrap replicate weights, and the ability to handle multistage sampling without replacement. The package homepage, with additional documentation and examples, is at http://faculty.washington.edu/tlumley/survey/. At the time of writing the current version is 3.6-12. The same website is the home for the experimental ’surveyNG’ package, which is used to develop and test new features. Who is this designed for? The survey package was initially designed for statisticians who use R or S-PLUS for other analyses and so would like to analyse survey data in a familiar environment. Judging from user questions it seems to be more widely used than this. Because R is freely downloadable there is little information about the distribution of users, but I have received questions and bug reports from all six inhabited continents. The fact that the system is open source may make it useful for teaching: both for the low cost and for because it is always possible to find out exactly what computations are being done. These features may also make the system attractive to statisticians in developing countries. What does it do? The survey package can represent multistage stratified cluster samples, with or without replacement at each stage. These samples can then be calibrated to population values of auxiliary variables by post-stratification, raking, or regression calibration. Basic summary statistics — means, totals, ratios, quantiles, and variances — are available for the whole sample and for domains, as are generalized linear models and the Cox proportional hazards model. There is limited support for two-phase sampling, designed primarily to allow the two-phase designs used in biostatistics. Future plans include support for PPS sampling without replacement (with-replacement is available) and general multi-phase sampling. There are two options for standard error estimation. One is a recursive algorithm for multistage samples (similar to Bellhouse (1985)), with Taylor linearization of estimating
functions for complex statistics. The other is based on replicate weights. These can be supplied by the user, or computed from the sampling design using BRR, jackknife, or bootstrap methods. Describing surveys to R The first task in implementing a survey analysis system is to ensure that the survey meta-data describing the sampling design are properly linked to the observed data and that this link is preserved through data manip-ulation, extraction of subsets, and so on. In R, multiple data sets or versions of data sets may be available at the same time. Each data set is stored in a named data frame. In the survey package, as statistical modelling code in R, variables within a data frame are referred to with model formulas. The survey package contains a set of example datasets, probability samples of data from California’s Academic Performance Index, a test administered to students at all California schools. These are loaded into R with the command data(api). The first example is a cluster sample of schools. A simple random sample of school districts was taken, and all schools from those districts were included. The following code creates a survey design object called dclus1. The data frame containing the data is apiclus1. Clusters (PSUs) are identified by school district number (dnum), the sampling weights are in the variable pw, and fpc contains the number of school districts in the population. The ~ notation identifies the model formulas mentioned earlier. Printing the survey design object gives some basic summary information. > dclus1 <- svydesign(id=~dnum, weights=~pw, data=apiclus1, fpc=~fpc)
> dclus1 1 - level Cluster Sampling design With (15) clusters. svydesign(id = ~dnum, weights = ~pw, data = apiclus1, fpc = ~fpc)
Another example is a two-stage cluster sample. A simple random sample of school
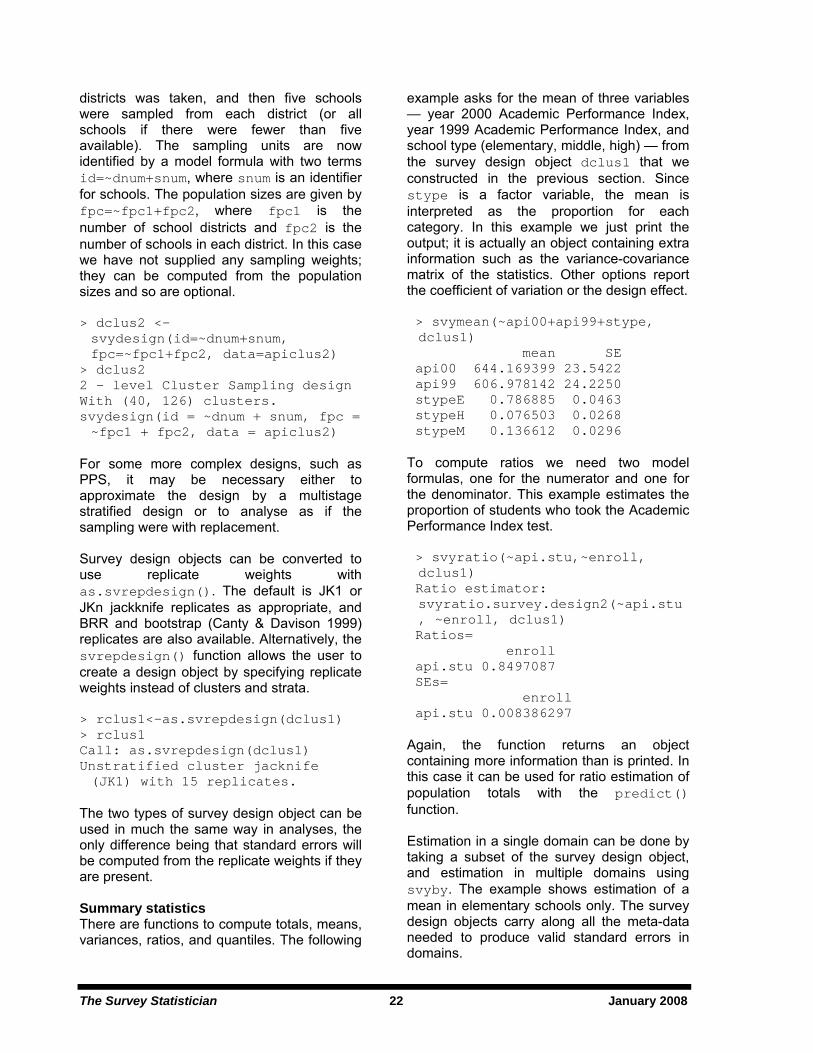
The Survey Statistician 22 January 2008
districts was taken, and then five schools were sampled from each district (or all schools if there were fewer than five available). The sampling units are now identified by a model formula with two terms id=~dnum+snum, where snum is an identifier for schools. The population sizes are given by fpc=~fpc1+fpc2, where fpc1 is the number of school districts and fpc2 is the number of schools in each district. In this case we have not supplied any sampling weights; they can be computed from the population sizes and so are optional. > dclus2 <- svydesign(id=~dnum+snum, fpc=~fpc1+fpc2, data=apiclus2)
> dclus2 2 - level Cluster Sampling design With (40, 126) clusters. svydesign(id = ~dnum + snum, fpc = ~fpc1 + fpc2, data = apiclus2)
For some more complex designs, such as PPS, it may be necessary either to approximate the design by a multistage stratified design or to analyse as if the sampling were with replacement. Survey design objects can be converted to use replicate weights with as.svrepdesign(). The default is JK1 or JKn jackknife replicates as appropriate, and BRR and bootstrap (Canty & Davison 1999) replicates are also available. Alternatively, the svrepdesign() function allows the user to create a design object by specifying replicate weights instead of clusters and strata. > rclus1<-as.svrepdesign(dclus1) > rclus1 Call: as.svrepdesign(dclus1) Unstratified cluster jacknife (JK1) with 15 replicates.
The two types of survey design object can be used in much the same way in analyses, the only difference being that standard errors will be computed from the replicate weights if they are present. Summary statistics There are functions to compute totals, means, variances, ratios, and quantiles. The following
example asks for the mean of three variables — year 2000 Academic Performance Index, year 1999 Academic Performance Index, and school type (elementary, middle, high) — from the survey design object dclus1 that we constructed in the previous section. Since stype is a factor variable, the mean is interpreted as the proportion for each category. In this example we just print the output; it is actually an object containing extra information such as the variance-covariance matrix of the statistics. Other options report the coefficient of variation or the design effect. > svymean(~api00+api99+stype, dclus1)
mean SE api00 644.169399 23.5422 api99 606.978142 24.2250 stypeE 0.786885 0.0463 stypeH 0.076503 0.0268 stypeM 0.136612 0.0296 To compute ratios we need two model formulas, one for the numerator and one for the denominator. This example estimates the proportion of students who took the Academic Performance Index test. > svyratio(~api.stu,~enroll, dclus1)
Ratio estimator: svyratio.survey.design2(~api.stu, ~enroll, dclus1)
Ratios= enroll api.stu 0.8497087 SEs= enroll api.stu 0.008386297 Again, the function returns an object containing more information than is printed. In this case it can be used for ratio estimation of population totals with the predict() function. Estimation in a single domain can be done by taking a subset of the survey design object, and estimation in multiple domains using svyby. The example shows estimation of a mean in elementary schools only. The survey design objects carry along all the meta-data needed to produce valid standard errors in domains.

The Survey Statistician 23 January 2008
> svymean(~api00, subset(dclus1, stype=="E"))
mean SE api00 648.87 22.362 More complicated tables can be made with svyby() and then formatted with ftable(). For example, we can compute the mean 1999 and 2000 API by school type and by whether the school-wide growth target was met, and tabulate these means with standard error and design effects > b <- svyby(~api99 + api00, ~stype + sch.wide, rclus1,
+ svymean, deff = TRUE) > print(ftable(b), digits = 2) to obtain the table in Figure 1. Sch.wide No Yes api99 api00 api99 api00 stype E svymean 601.7 596.3 608.3 653.6 SE 70.0 64.5 23.7 22.4 DEff 6.3 6.6 5.6 6.0 H svymean 662.0 659.3 577.6 607.5 SE 40.9 37.8 57.4 54.0 DEff 1.4 1.4 3.0 3.0 M svymean 611.4 606.4 607.3 643.2 SE 48.2 48.3 49.5 49.3 DEff 1.8 1.8 3.1 3.4 Figure 1: Formatted table of summary statistics
There are also functions for several design-based tests of independence in two-way contingency tables. Regression models Regression models may be a low priority for official statistics, but are very important for social science and public health researchers analysing complex surveys such as the NHANES series or the British Household Survey. Regression models are also interesting because of their relationship to domain estimators, which provides one of the validation tests used for quality control in the survey package. The svyglm() function fits generalized linear models, including linear and logistic regression. The function returns an object, and the summary() function prints a summary of it. Here we are doing a linear regression (the default type) to relate the 2000
API for a school to the proportion of ‘English language learners’ (ell), the proportion eligible for subsidized meals (meals), and the proportion who have moved from another school during the past year (mobility). These variables are all negatively associated with the Academic Performance Index, but only meals is statistically significant. > linearmodel <- svyglm(api00~ell+meals+mobility, design=dclus1)
> summary(linearmodel) Call: svyglm(formula = api00 ~ ell + meals + mobility,
design = dclus1) Survey design: svydesign(id = ~dnum, weights = ~pw, data = apiclus1, fpc = ~fpc)
Coefficients: Estimate Std.Err t value Pr(>|t|) (Intrcpt) 819.2791 21.3900 38.302 <2e-16 *** ell -0.5167 0.3240 -1.595 0.113 meals -3.1232 0.2781 -11.231 <2e-16 *** mobility -0.1689 0.4449 -0.380 0.705
(Dispersion parameter for gaussian family taken to be 3157.85) Rather than modelling the Academic Performance index we might want to examine whether schools met their API target, indicated by the binary variable sch.wide. Logistic regression would be the standard approach. To fit a logistic regression model we specify the family argument to svyglm(). > logistic <- svyglm(sch.wide~ell+meals+mobility, design=dstrat, family=quasibinomial())
> summary(logistic) Call: svyglm(formula = sch.wide ~ ell + meals + mobility,
design = dstrat, family = quasibinomial())
Survey design: svydesign(id = ~1, strata = ~stype, weights = ~pw, data = apistrat,
fpc = ~fpc)

The Survey Statistician 24 January 2008
Coefficients: Estimate Std.Error t value Pr(>|t|) (Intercept) 0.835837 0.455551 1.835 0.0681 . ell -0.002490 0.013251 -0.188 0.8512 meals -0.003152 0.009199 -0.343 0.7322 mobility 0.060897 0.031925 1.908 0.0579 . Graphics Easy production of high-quality graphics has always been a strength of R and S, and the survey package provides some facilities for probability-weighted graphics. Figure 2 shows two examples. On the left is a hexagonal binning plot of data from NHANES II, showing concentrations of iron and of transferrin (a protein involved in
iron transport) in blood serum. This is an alternative to a scatterplot, which can handle large data sets and weighting. The size or color of each plotted hexagon depends on the estimated population size in that subregion of the graph. On the right is a pair of smooth curves estimating the proportion of internet users by age and gender in the 2001 Scottish Household survey. The points are simple subset estimates for a specific age and gender and the curves are a kernel regression estimator.
Figure 2. Two graphical examples. On the left, a hexagonal binned scatterplot; on the right, a kernel smoother. In addition to these scatterplots produced by svyplot() and svysmooth(), svyhist() draws probability-weighted histograms, svyboxplot() does weighted boxplots, and svycdf estimates the population cumulative distribution function. Using auxiliary variables The postStratify and rake functions perform classical post-stratification and raking on a survey design, and the calibrate function performs calibration (or generalized raking). These functions take an uncalibrated survey design as an argument and return the calibrated design. In this example we post-
stratify a cluster sample of California schools. We know there are 4421 elementary, 1018 middle, and 755 high schools in the population. Post-stratifying reduces the uncertainty in total enrollment substantially, since high schools and middle schools tend to be larger. > svytotal(~enroll, rclus1) total SE enroll 3404940 932235 > pop.types <- data.frame(stype = c("E", "H", "M"),
Freq = c(4421, 755, 1018))
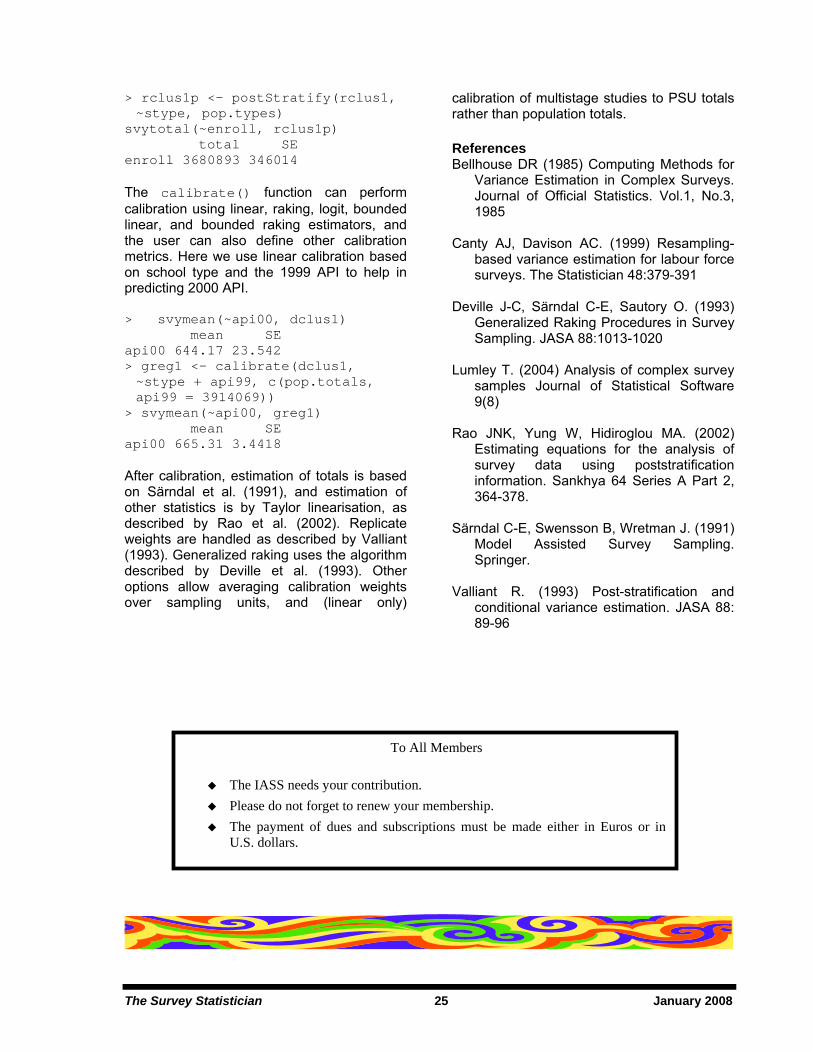
The Survey Statistician 25 January 2008
> rclus1p <- postStratify(rclus1, ~stype, pop.types)
svytotal(~enroll, rclus1p) total SE enroll 3680893 346014 The calibrate() function can perform calibration using linear, raking, logit, bounded linear, and bounded raking estimators, and the user can also define other calibration metrics. Here we use linear calibration based on school type and the 1999 API to help in predicting 2000 API. > svymean(~api00, dclus1) mean SE api00 644.17 23.542 > greg1 <- calibrate(dclus1, ~stype + api99, c(pop.totals, api99 = 3914069))
> svymean(~api00, greg1) mean SE api00 665.31 3.4418 After calibration, estimation of totals is based on Särndal et al. (1991), and estimation of other statistics is by Taylor linearisation, as described by Rao et al. (2002). Replicate weights are handled as described by Valliant (1993). Generalized raking uses the algorithm described by Deville et al. (1993). Other options allow averaging calibration weights over sampling units, and (linear only)
calibration of multistage studies to PSU totals rather than population totals.
References Bellhouse DR (1985) Computing Methods for
Variance Estimation in Complex Surveys. Journal of Official Statistics. Vol.1, No.3, 1985
Canty AJ, Davison AC. (1999) Resampling-
based variance estimation for labour force surveys. The Statistician 48:379-391
Deville J-C, Särndal C-E, Sautory O. (1993)
Generalized Raking Procedures in Survey Sampling. JASA 88:1013-1020
Lumley T. (2004) Analysis of complex survey
samples Journal of Statistical Software 9(8)
Rao JNK, Yung W, Hidiroglou MA. (2002)
Estimating equations for the analysis of survey data using poststratification information. Sankhya 64 Series A Part 2, 364-378.
Särndal C-E, Swensson B, Wretman J. (1991)
Model Assisted Survey Sampling. Springer.
Valliant R. (1993) Post-stratification and
conditional variance estimation. JASA 88: 89-96
To All Members
The IASS needs your contribution. Please do not forget to renew your membership. The payment of dues and subscriptions must be made either in Euros or in
U.S. dollars.

The Survey Statistician 26 January 2008
Articles
Congratulations, Gunnar Kulldorff Professor Gunnar Kulldorff has just left Minsk, Belarus, where he has attended the 7th International Conference on Computer Data Analysis and Modeling. He has given a talk about the importance of sample surveys for the society, the history of survey sampling,
international co-operation of survey statisticians, and the Baltic-Nordic Network with its possible extension to Ukraine and Belarus. He has listened to Belarus songs under the guitar playing and he has danced with the students. Gunnar Kulldorff was born in Malmö, Sweden, on December 6th, 1927. He started his professional life as a lecturer of statistics at the University of Lund in 1954, and continued in 1965 as a professor of Statistics, and in 1966 as a professor of Mathematical Statistics at the University of Umeå, Sweden. His interest has been in the sampling field for a very long time. He has had many administrative duties at his university, he has been a visiting professor at several universities in USA, member of the International Statistical Institute (ISI), the International Association of Survey Statisticians, the Bernoulli Society for Mathematical Statistics and Probability, the Biometric society, the American Statistical Association, the Swedish Statistical Association, and an honorary member of the Finnish Statistical Society. He has had many duties in professional societies over the years, and he was President of ISI 1989-1991. Feeling an unavoidable need of sampling surveys in the Baltic countries, he organized a Baltic-Nordic Network on Survey Sampling in
1992. More than 100 month-long exchange visits have been made by university teachers, research students, and official statisticians of Estonia, Latvia, and Lithuania to partner universities. Survey sampling courses have been introduced into the curriculum at the universities of the Baltic countries, and more than 100 bachelor and master theses in survey sampling have been defended in the Baltic countries during the past 15 years. A series of scientific conferences and workshops, initiated by Professor Gunnar Kulldorff, have been organized annually since 1997 in different Baltic and Nordic countries. The Network includes people from universities, national statistic institutes and statistical societies from the Baltic and Nordic countries. The main idea of the co-operation is the exchange of knowledge between generations. The Network has been supported by grants from the Visby Programme of the Swedish Institute (1997-2004, 2007) and from the Nordic Council of Ministers (2004-2007). In 2006 Prof. Gunnar Kulldorff was awarded a Doctor Honoris Causa degree by the University of Vilnius for his international merits in statistical science and for his contribution to studies of statistics at Vilnius University and in the Baltic states.
Our friend Gunnar is celebrating his 80th birthday this year. We send our sincere congratulations to Professor Gunnar Kulldorff, who is so young in his heart and so active in his life. We have learned a lot of things from him, we are thankful to him for the fruitful co-operation, and we wish to spend together much nice time in the future.
September 27, 2007
With love and respect Members of the Baltic-Nordic Network
on Survey Sampling

The Survey Statistician 27 January 2008
Félix Rosenfeld Submitted by Gérard Théodore It is with great sadness that we learned of the passing on January 12, 2007, of Félix
Rosenfeld at the age of 91, in Paris. Throughout his life, he greatly contributed to developing the field of statistics in France and other countries around the world, not only as a scholar but also as a practitioner. His main
accomplishments, recounted here, are taken from his book Mémoires d’un Terrien du XXe siècle, published in 2002 by Editions des Ecrivains.
Background Born in Alexandria in 1915, to an Austrian father and an Italian mother, he grew up in a cosmopolitan universe, conducive to international exchange. In fact, before the opening of the Suez Canal, Alexandria connected Asia to Europe. The city was managed in part by foreigners: Greeks, Italians, Lebanese, French, English, Swiss, Germans… Consequently, Félix Rosenfeld spoke French as well as he spoke Italian and occasionally Greek and Arabic. Education In 1937, he graduated from the Institut de Statistique de l’Université de Paris (ISUP), completing a thesis on infant mortality in Alexandria. Created in 1922, ISUP was the only teaching centre for statistics in France for twenty years, until the ENSAE was founded in 1942. Brought in to collaborate with Georges Darmois and Emile Borel in their work at the Henri Poincaré Institute Laboratoire de Statistique, he soon became a member of the Société de Statistique de Paris. He wrote his thesis on actuarial science and graduated in 1939 from the Institut des Finances et des Assurances (IFA). He then returned to his native country to join the research department of the National Bank of Egypt. His career as an international expert In the summer of 1942, a professor of law in Cairo and officer in the Free French Forces asked Félix Rosenfeld to create a statistical
service for the French Government in the Levant (Syria and Lebanon were still under French mandate). With his young bride, he left Cairo for Beirut. He gathered the information needed for calculating the price index in both countries of the Levant, along with figures on agricultural production and imports, in order to determine the extent to which the population’s food requirements were met. “Every day we also noted the price of gold. This metal was the yardstick for wealth in these countries. The value of a building was estimated in number of gold pounds sterling and a family’s wealth in the number of gold pound containers in their possession. Every day we would ask the operators for the exchange rate for ‘George’ (the gold pound with the head of King George V) as well as the exchange rate for ‘Georgette,’ the nickname given to the coin with the head of Queen Victoria. Although it weighed the same and had the same content in gold, it had a lower value than ‘George’ because it could not be used by pilgrims going to Mecca.” After the Allies landed in Normandy in June 1944, Félix Rosenfeld acquired French citizenship which enabled him to join the French Forces in the transmissions branch. He would leave military life to accept an offer from the Banque de Syrie et du Liban in Paris. There he prepared the applications for these two countries to join the new post-war monetary and banking organizations: the International Monetary Fund (IMF) and the International Bank for Reconstruction and Development (IBRD). The INSEE approached him and he agreed to be appointed to Indochina where he became comparable to an INSEE administrator. In 1947, Indochina was made up of five territories (Tonkin, Annam, Cochin-China, Cambodia and Laos). The first three formed Vietnam. Félix Rosenfeld’s mission was to support these three countries in achieving independence (which did not occur until 1954) and to facilitate their relations with international institutions. Under the authority of the Haut Commissariat de la République, he re-established the statistical service and oversaw the publication of a newsletter and a directory. He developed contacts with the Economic Commission for Asia and the Far
The Survey Statistician 28 January 2008
East (ECAFE) and was sent on assignment throughout Asia, in particular to Phnom Penh where he laid the groundwork for a statistical service, then to Singapore, Hong Kong, Shanghai and India. At the same time, he gave courses in statistics at the Faculty of Law and Economics in Saigon. He was very methodical and created highly valuable records on the countries with which he had worked. Ho Chi Minh’s Nationalist Party was starting to oppose France’s presence in order to gain independence. Félix and his wife, especially, were injured in the explosion of a Viet Minh grenade. These events caused him return to Paris in 1950. His work as an international expert led him to Geneva where he worked for the FAO (United Nations Food and Agriculture Organization), liaising with Washington and Ottawa. His mission was to help countries that had suffered from the war in restoring their statistical services on Agriculture, in view to carrying out a worldwide census. With the FAO in Rome, he made French the working language of the Agricultural Statistics Committee. In Portugal, he suggested improvements to the procedures for statistical data collection with more effective use of the data processing equipment available at the time. In Ankara, he helped found the training centre for agricultural statisticians and also taught French. Among his accomplishments, the dominant role he played in promoting agricultural statistics in developing countries, particularly in Africa, must not be overlooked. In Tunisia, his skills in assessing investment projects would lead him to work for the World Food Programme in the selection of agriculture projects for funding by the World Bank. In Sub-Saharan Africa, in Ibadan, Nigeria, he created an FAO training centre for agricultural statisticians in English- and French-speaking African countries. In Cameroon, he participated in creating a development plan to steer the country’s economy during its first years of independence. The objective was to double the national average income per capita over twenty years. In Ivory Coast, he collaborated with the organization in charge of managing the public debt and for a long time
worked for the Abidjan stock exchange. Everywhere he went, he created bonds of friendship with individuals he would meet again later, upon his return to France. His career as a financial analyst and portfolio manager Back from Rome in 1955 he began his banking career, entering Paribas to study the new American methods for selecting stocks and bonds in building portfolios. He directed a financial research company created jointly by Paribas, insurance companies and the Lehman Brothers Bank, also brokers with the New York Stock Exchange. His job was to gather the information required in understanding and assessing business activities, earnings and development policies, a very arduous job at that time as publication of companies’ accounts was not mandatory. At this time he began as a financial analyst. He then joined the S.E.M.A. (Société d’Economie et de Mathématiques Appliquées), which belonged to the Paribas group. Starting in the 1960s and for over twenty years, he was an Expert with the bank Lombard, Odier et Cie. One particular mandate was to seek from IBM, the New York computer builder, technologies that would allow a better understanding of the content, evolution and earnings of a financial investment portfolio, using “big machines that operate with punched cards and whose memories were reels of magnetic tape.” The numerous exchanges he had with IBM continued in the form of a collaboration that would endure some twenty years. In fact, he suggested to IBM a monitoring and performance measurement system for the management of employee profit-sharing portfolios, a program introduced in France in 1967 under Charles de Gaulle. The firm Carrefour then asked him to provide the same services as well as manage several of their portfolios. In the early 1970s, he set up and directed a financial analysis service for a large investment house in Paris. Stock market activity underwent considerable transformation with the arrival of the personal computer, the emergence of a statistical and mathematical theory for appraising financial assets and a considerable increase in stock market speculation. The main research in this
The Survey Statistician 29 January 2008
area consisted in adjusting graphs representing variance in the price of the securities and market indexes in order to remove insignificant fluctuations and better show the trends. But Félix was primarily interested in the concrete, directly usable aspects of these mathematical methods. Besides, he never wanted to get involved in “the new management methods that had been in vogue for twenty or so years, transforming the stock market into a real gaming house,” as mentioned in his biographical book. He was aiming at forward transactions on derivative instruments. For him, the stock market should have remained the place where savings are sustainably invested in businesses that want to increase their capital. In 1985, he managed portfolios and mutual funds with the Banque Rothschild. He left in 1989 at the age of 74. His teaching career and publications At the end of his secondary education, he began teaching physics and chemistry to students at the lycée in Alexandria. He was an excellent teacher and loved to share his knowledge, continuing to teach to a very advanced aged. In the 1950s in Europe, Asia and Africa, he trained numerous agricultural statisticians as part of the FAO programs. In the early 1960s, he asked Daniel Dugué, who was then Director of the ISUP, about teaching financial analysis at the Institute. He held this position from 1961 to 1983, also teaching national income accounting. At the Institut d’Etudes Pour le Développement Economique et Social (IEDES), he taught project analysis and evaluation methods, training a large number of students from developing countries. When he ran the Centre de formation à l’analyse financière et à la gestion de portefeuille in Geneva, he taught statistics to financial analysts and methods for evaluating shares. The SFAF (Société Française des Analystes Financiers) was created in 1963. Dunod then
published his first volume of a series of works dealing with financial analysis and securities management. Reprinted and expanded in the 1980s, he added younger collaborators such as financial analyst Roger Hannoset, economist Rémi Sabatier, actuary Michel Piermay and a graduate of the Ecole Polytechnique, Jean-François Boulier. These works served for many years as support to the SFAF’s teachings. He was elected to the International Statistical Institute in 1967. He wrote for numerous journals, including the Journal de la Société de Statistique de Paris and the Bulletin de l'Institut International de Statistique. He contributed greatly to the creation in 1997 of the Société Française de Statistique (SFdS) which is recognized being of public interest and issued from the merger of the Société de Statistique de Paris (SSP) and the Association pour la Statistique et ses Utilisations. He was its honorary President. The same year he wrote Histoire des Sociétés de Statistique en France, on the occasion of the 51st session of the ISI in Istanbul. For a number of years, he performed the duties of Treasurer of the La Science Statistique foundation and in 1997 funded a generous endowment for the Foundation’s scholarship students. The man, Citizen of the World Félix was open and young at heart, with a strong sense of initiative; he loved to share his vast knowledge. From a technical perspective, he always gave good counsel. He was clear, realistic and efficient. As a person, his warmth, the interest he took in his friends’ lives, made him a fascinating being and a loyal friend, always ready to lend a hand. He wanted to be a citizen of the world. His career, areas of interest, and contributions demonstrate that he was, indeed, succeeded.

The Survey Statistician 30 January 2008
We are very pleased to welcome the following new members:
Country First Name Last Name Azores, Madeira Sofia Ferreira Argentina Roberto de Miguel Australia Jill Charker Austria Christian Beer Karin Wagner Belgium Elke Moons Benin Aristide Djossou Brazil Cristiano Ferraz Brazil Marcel de Toledo Vieira Cameroon Arouna Njoya Anjuen Eric Jazet Kengap Symplice Ngah Ngah Central African Republic Réginald Bida-Kette Denmark Klaus Andersen Ireland Kathryn Carty Tara Galvin Stephen Mc Donagh Keith McSweeney Kieran Walsh Ivory Coast Youssouf Traore Latvia Andris Fisenko Martins Liberts Lesotho Bonang Makoko Malaysia Mahmod Mahmod Othman Moldavia Lilian Galer Ana Grecu Ala Negruta Stela Rotaru New Zealand Eleisha Jewell John Lopdell Nigeria Bertram Ugochukwu Azuwuike Aloy Onyeka Adebayo Otolorin Philippines Dalisay S. Maligalig Poland Agnieszka Maria Chmielecka Portugal Antonio Afonso Filipa Alves Jose Francsico Antonio Ana Paula Bordelo Rodrigues Rui Caldeira Maria Joao Carrelhas
Welcome New Members!

The Survey Statistician 31 January 2008
Country First Name Last Name Portugal Daniel Carvalho Marisa Chinak Ana Chumbau Maria José Correia Teresa Crespo Isabel Cristina Ferreira Jorge de Oliveira Correia Maria Dos Anjos Campos Maria Espinho Rui Evangelista Isabel Antunes Farinha de Almeida Daniel Fernandes Carla Ferreira Elsa Fontainha Ines Geraldes Eduarda Gois Maria Goretti Roda Rita Lages Rita Lameira Susana Filipa Lima Margarida Madaleno Paula Marques Margarida Martins Patricia Martins Teresa Mendes Silvia Mina Isabel Morgado Jose Alexandre Neves Ana Luisa Papoila Luis Pereira Ana Barbara Pinto Bruno Pires Leandro Pontes Manuela Raminhos Goretti Roda Sofia Rodrigues Sonia Santos Fransisco Sardinha Catarina Silva Laurinda Silva Leal Ana Simao Rita Sousa Sonia Torres Isabel Maria Valente Maria Irene Varges Sabino Marta Veloso Singapore Tze Chow Heng South Africa Azam Khan Nthbiseng Makhatha Themba Mohoto Muthetho Solomon Nkwlnlka

The Survey Statistician 32 January 2008
Country First Name Last Name South Africa Vincent James Parker Marlize Pistorius Mosala Klaas Seelamo Spain Jose Luis Alafaro Navarro Monica Maria Bécue-Bertaut Sweden Gunnar Arvidson Peter Gidlund Anders Norberg Jorgen Svensson Switzerland Jennifer M. Powell Tanzania Sango Abas Halfan Simba Tunisia Maurice Mubila Ukraine Olga Lysa Nataliia Vashchaieva United Kingdom Solange Correa Leonardo Trujillo United States Paul Fields Nancy M. Gordon Howard Hogan
Dear New Member: For questions or input regarding The Survey Statistician, please contact: Dr. Dan Hedlin Dr. Annica Isaksson Statistics Sweden Statistics Division Dept of Research and Dept of Computer and Information Development Sci (IDA) Box 24 300 Linköping University SE-104 51 Stockholm SE-581 83 Linköping Sweden Sweden [email protected] [email protected]

The Survey Statistician 33 January 2008
First announcement and Call for Papers: ISBIS-2008, Prague 1 – 4 July 2008
ISBIS-2008 is an international symposium sponsored by the International Society of Business and Industrial Statistics, focusing on quantitative aspects of Banking, Insurance and Finance, and important statistical issues relating to productivity improvement and decision-making at all levels of business and industry. Many world-class quantitative financial analysts and industrial statisticians will be participating. The symposium will be held in the beautiful medieval city of Prague, in the Czech Republic, during 1-4 July, 2008. The symposium will provide a varied and stimulating scientific program of invited and contributed papers, and excellent opportunities for formal and informal exchanges. Authors will have the opportunity to submit extended versions of their papers for publication in a special edition of the Society's journal, Applied Stochastic Models in Business and Industry. For further information, please visit www.action-m.com/isbis2008 or send an email to Milena Zeithamlova at [email protected].
European Conference on Quality in Official Statistics
Rome, 8-11 July 2008 First announcement and call for papers The European Conference on Quality in Official Statistics has become a traditional biannual meeting for statisticians from European Member States, National Statistical Institutes, International Organisations and Academies. The Conference is intended to serve as a forum at a European level for discussing recent developments and achievements in the field of quality and methodologies for survey
statistics, with a special focus on official statistics. The Q2008 Conference will be jointly hosted by Istat - the Italian National Institute of Statistics - and Eurostat. The Conference encompasses relevant topics for improving quality in the European Statistical System. Areas covered by the Conference are: • quality management
models for quality management and their implementation
• measuring quality process indicators, measuring accuracy in complex surveys, control surveys
• process quality process variables, quality tools, monitoring systems
• quality assessment self-assessment, internal and external auditing, peer review, quality labeling, quality certification
• standardisation tools current best methods, guidelines, standards, recommended practices
• communicating quality to users quality reports, quality declarations
• satisfying user needs collecting user needs, measuring user satisfaction
• Eurostat activities for quality implementation of the European Statistics Code of Practice
• special issues on census planning • administrative data • survey design • questionnaire design and testing • reducing response burden • data collection modes • editing and imputation techniques • confidentiality and disclosure control • data integration • metadata and documentation
Training courses In the first day of Q2008 short courses on important quality-related issues will be given
Announcements
The Survey Statistician 34 January 2008
by outstanding lecturers. Course programs are available on the Conference website q2008.istat.it. If you want to present a paper Please submit an abstract not exceeding 500 words with three key-words to the email address [email protected] by 18 January 2008. For further information All information concerning Q2008 is available and updated on the Conference website q2008.istat.it If you have any questions you can email to [email protected]
Summer Institute in Survey Research Techniques, University of Michigan
Now in its 61st year, the University of Michigan Summer Institute in Survey Research Techniques provides graduate training in all phases of survey research. The Summer Institute in Survey Research techniques draws on a renowned group of instructors from within Michigan’s Survey Research Center (SRC) and the University community, and on other experts from outside the University of Michigan. The 2008 Summer Institute classes start June 2 and meet through July 25. One, two, four and eight- week courses are offered on a range of topics including survey sampling, principles of survey measurement, questionnaire design, data collection, survey nonresponse and the analysis of survey data. The Sampling Program for Survey Statisticians provides an intensive eight-week program in the theory and methods of survey sampling and the analysis of complex sample survey data. The Leslie Kish Fellowships and the Frank Andrews Fellowships are competitive awards that provide tuition, travel and financial stipend for qualified students. For more details about course descriptions, the Fellowships and other relevant information about the Michigan Summer Institute, please visit the website, www.isr.umich.edu/src/si/.
Cochran-Hansen Prize 2009: Competition for Young Survey Statisticians from Developing and Transitional Countries In celebration of its 25th anniversary, the International Association of Survey Statisticians established the Cochran-Hansen Prize to be awarded every two years to the best paper on survey research methods submitted by a young statistician from a developing or transitional country. Participation in the competition for the Prize is open to nationals of developing or transitional countries who are living in such countries and who were born in 1969 or later. Papers submitted must be unpublished original works. They may include materials from the participant's university thesis. They should be in either English or French. Papers for consideration should be submitted to the IASS Secretariat at the address below to arrive by December 29, 2008. Each submis-sion should be accompanied by a cover letter that gives the participant's year of birth, na-tionality, and country of residence. The cover letter must also indicate if the work submitted is the result of a PhD thesis and, in the case of joint papers, the prize candidate must state clearly what his/her contribution to the paper is. The papers submitted will be examined by the Cochran-Hansen Prize Committee appointed by the IASS. The decision of the Committee is final. The winner of the Prize will be invited to present his/her paper at the 57th Session of the International Statistical Institute to be held in Durban, South Africa, August 16-22, 2009, and the name of the winner will be announced at the ISI General Assembly in Durban. The author of the winning paper will receive the Cochran-Hansen Prize in the form of books and journal subscriptions to the value of about € 500, and will have reasonable travel and living expenses paid in order to pre-sent the paper at the ISI Session in Durban. For further information, please contact: Madame Claude OLIVIER, IASS Secretariat International Association of Survey Statisticians CEFIL-INSEE, 3 rue de la Cité, 33500 Libourne, France Tel : +33 5 57 55 56 17 E-mail : [email protected]
The Survey Statistician 35 January 2008
Visit the new and improved IASS web site and read The Survey Statistician on line!
http://isi.cbs.nl/iass/index.htm
International Association of Survey Statisticians (IASS)
The Premier World Organization representing who’s who in Sample Survey and Census Methodologies
FOUNDATION AND OBJECTIVES:
Founded in 1973, the International Association of Survey Statisticians (IASS) has as its charge and mandate to promote the study and development of the theory and practice of sample surveys and censuses. It also aims to increase interest in surveys and censuses among statisticians, governments, and the public the world over.
MEMBERSHIP AND EXECUTIVE: At present the IASS has approximately 1.200 members from 130 countries and 38 institutional members. IASS headquarters are situated in Libourne (FRANCE) and operate, to a large extent, under the auspices of the French statistical agency INSEE, which lends its expertise and status to aid and promote the association’s work. The society is run by an Executive Committee elected for a period of two years and a Council elected for a four-year period. Anyone interested in learning more about IASS should contact Michel Péronnet IASS Executive Director 3 rue de la Cité 33500 Libourne France 33 (0)5 57 55 56 02 e-mail: [email protected]
Association Internationale des Statisticiens d’Enquête (AISE)
More about the IASS Becoming a member Services for members Survey Statistician Publications IASS Conferences Ask the experts Links What’s new
Important Notices
A PDF file of the newsletter is available on the IASS web site. Currently, a few members prefer to be notified only when a new issue is posted, instead of receiving the hard copy. At this point we do not have a process in place to support this option. A process will be developed when an adequate number of members choose the above. Until that time, all members will continue to receive hard copies of the newsletter. Please send an e-mail to [email protected] or [email protected] if you would like to take advantage of this option.
Members are encouraged to view the IASS website (http://isi.cbs.nl/iass/index.htm) and provide comments or suggestions to Eric Rancourt: [email protected].

The Survey Statistician 36 January 2008
In Other Journals
Journal of Official Statistics
An International Review Published by Statistics Sweden
JOS is a scholarly quarterly that specializes in statistical methodology and applications. Survey methodology and other issues pertinent to the production of statistics at national offices and other statistical organizations are emphasized. All manuscripts are rigorously reviewed by independent referees and members of the Editorial Board.
Contents: March, Vol. 23, No. 1, 2007 Challenges to the Confidentiality of U.S. Federal Statistics, 1910-1965 Margo Anderson, William Seltzer ...................................................................................................................... 1 Efficient Stratification Based on Nonparametric Regression Methods Enrico Fabrizi, Carlo Trivisano ........................................................................................................................ 35 A Selection Strategy for Weighting Variables Under a Not-Missing-at-Random Assumption Barry Schouten ............................................................................................................................................... 51 Imputing for Late Reporting in the U.S. Current Employment Statistics Survey Kennon R. Copeland, Richard Valliant ............................................................................................................ 69 Incentives in Random Digit Dial Telephone Surveys: A Replication and Extension Richard Curtin, Eleanor Singer, Stanley Presser ............................................................................................. 91 Methods for Achieving Equivalence of Samples in Cross-National Surveys: The European Social Survey Experience Peter Lynn, Sabine Häder, Siegfried Gabler, Seppo Laaksonen ................................................................... 107 Book and Software Reviews ......................................................................................................................... 125
Contents: June, Vol. 23, No. 2, 2007
Estimation of Nonresponse Bias in the European Social Survey: Using Information from Reluctant Respondents Jaak Billiet, Michel Philippens, Rory Fitzgerald, Ineke Stoop ........................................................................ 135 Measuring Disability in Surveys: Consistency Over Time and Across Respondents Sunghee Lee, Nancy A. Mathiowetz, Roger Tourangeau .............................................................................. 163 Quantifying Stability and Change in Ethnic Group Ludi Simpson, Bola Akinwale ........................................................................................................................ 185 Seasonal Adjustment of Weekly Time Series with Application to Unemployment Insurance Claims and Steel Production William P. Cleveland, Stuart Scott ................................................................................................................. 209 Finite Population Small Area Interval Estimation
The Survey Statistician 37 January 2008
Li-Chun Zhang.............................................................................................................................................. 223 Predicting Natural Gas Production in Texas: An Application of Nonparametric Reporting Lag Distribution Estimation Crystal D. Linkletter, Randy R. Sitter ............................................................................................................ 239 Disclosure Avoidance Practices and Research at the U.S. Census Bureau: An Update Laura Zayatz ................................................................................................................................................ 253 Book and Software Reviews Stephen Mistler ........................................................................................................................................... 267
Contents: September, Vol. 23, No. 3, 2007 The Morris Hansen Lecture 2006 Statistical Perspectives on Spatial Social Science Michael F. Goodchild .................................................................................................................................... 269 Using Geospatial Information Resources in Sample Surveys Sarah M. Nusser .......................................................................................................................................... 285 Discussion Linda Williams Pickle .................................................................................................................................... 291 Optimizing the Use of Microdata: An Overview of the Issues Julia Lane ..................................................................................................................................................... 299 Benchmarking the Effect of Cell Adjustment on Tabular Outputs: The Shortcomings of Current Approaches Paul Williamson ............................................................................................................................................ 319 Summary of Accuracy and Coverage Evaluation for the U.S. Census 2000 Mary H. Mulry ............................................................................................................................................... 345 Resampling Variance Estimation in Surveys with Missing Data A.C. Davison, S. Sardy ................................................................................................................................. 371 Nonresponse Among Ethnic Minorities: A Multivariate Analysis Remco Feskens, Joop Hox, Gerty Lensvelt-Mulders, Hans Schmeets ......................................................... 387 Procedures for Updating Classification Systems: A Study of Biotechnology and the Standard Occupational Classification System Neil Malhotra, Jon A. Krosnick ..................................................................................................................... 409

The Survey Statistician 38 January 2008
STATISTICS IN TRANSITION— n s Journal of the Polish Statistical Association
Contents: Vol. 8, No. 2, August 2007
From the Editor ............................................................................................................................................. 213 A Confidence Interval for ARPR – “at-risk-of-poverty rate” Ryszard Zieliński) .......................................................................................................................................... 217 Modern Approach to Optimum Stratification: Review and Perspectives Marcin Kozak, Med Ram Verma, Andrzej Zieliński ........................................................................................ 223 Innovative Role of Imputation Method/Analysis in Clinical Trial on Remnant Ablation in Differentiated Thyroid Cancer Prem Chandra, SN Dwivedi, CS Bal, Ajay Kumar, Arvind Pandey ................................................................ 251 Effect of Non-response on Current Occasion in Search of Good Rotation Patterns on Successive Occasions G.N. Singh and Kumari Priyanka .................................................................................................................. 273 On the Bias Reduction in Linear Variety of Alternative to Ratio-Cum-Product Estimator Rajesh Singh, Pankaj Chauhan, and Nirmala Sawan .................................................................................... 293 Estimating the Proportion of People Bearing a Sensitive Issue with an Option to Item Count Lists and Randomized Response Sanghamitra Pal ............................................................................................................................................ 301 Efficient Estimation Using Deep-Post Stratification Under Two Way R X R Set-Up Manish Trivedi and D. Shukla ....................................................................................................................... 311 Small Area Estimation for Spatially Correlated Populations—A Comparison of Direct and Indirect Model-based Methods Hukum Chandra, Nicola Salvati, and Ray Chambers .................................................................................... 331 European Surveys in the Scope of Service Statistics Małgorzata Dytman and Agnieszka Matulska-Bachura ................................................................................. 351 Changes of Employment Structure in Poland and EU Countries Anna Malina and Piotr Malina ....................................................................................................................... 369 Meta Analysis: What, Why and How Chandra Bhushan Tripathi, Prem Chandra, Neeraj Pandey, and Nilanjan Roy ............................................. 383 Celebrating Statistics: Conference in Honour of Professor Kazimierz ZAJĄC Józef Pociecha .............................................................................................................................................. 399

The Survey Statistician 39 January 2008
AStA — Advances in Statistical Analysis
AStA — Advances in Statistical Analysis, a journal of the German Statistical Society, is published quarterly and presents original contributions on statistical theory, methods and applications. Papers on applications should make substantial use of statistical methods. Articles on probability or formal methods are welcome if they take a statistical or practical problem as a starting point. Statistical problems that arise in the analysis of economic and social phenomena are traditionally at home in this journal. Nevertheless, submissions from other areas are strongly encouraged. Review papers in areas of current research as well as Special Topics clusters will be published from time to time: proposals should be sent to the editor. Also, selected books are reviewed in the Advances in Statistical Analysis. Not only are new fields emerging, but there are also exciting new methodological developments in traditional areas. Advances would like to offer researchers in these fields a forum to both act as an introduction to and promote the active discussion of their research. To ensure that each topic receives due individual attention, proposals involving emerging topics are particularly welcome. They should include a description of the prospective field and its principal sources of research, together with a selection of authors who may be willing to contribute. Authors should submit a pdf file of their manuscripts electronically to the Editor:
[email protected] Alternatively, four print copies can be sent to: Prof. Dr. rer. nat. Wilfried Seidel Faculty of Economics and Social Sciences Helmut Schmidt University Holstenhofweg 85 22043 Hamburg, Germany Once a paper is accepted, authors will be requested to submit the source files including suitable figure files. Authors should prepare their manuscripts with LaTeX (preferred) or Word.
Allgemeines Statistisches Archiv
Contents Vol. 90, Issue 4, 2006 The 2005 Plenary Meeting on ‘‘Missing Data and Measurement Error’’ Ulrich Rendtel ............................................................................................................................................... 493 Conceptual, computational and inferential benefits of the missing data perspective in applied and theoretical statistical problems Donald B. Rubin ........................................................................................................................................... 501 Combining information from multiple surveys for assessing health disparities Trivellore E. Raghunathan ............................................................................................................................ 515 Der Einsatz von Missing Data Techniken in der Arbeitsmarktforschung des IAB Susanne Rässler .......................................................................................................................................... 527 Fehlende und fehlerhafte Daten in der amtlichen Statistik. Neue Herausforderungen und Lösungsansätze Walter Radermacher and Thomas Körner .................................................................................................... 553 Missing data methods in official statistics in the United Kingdom: Some recent developments Gabriele B. Durrant ...................................................................................................................................... 577
The Survey Statistician 40 January 2008
Prekäre Einkommenslagen in Deutschland. Ein Ost-West-Vergleich 1996–2002 Herbert S. Buscher and Juliane Parys .......................................................................................................... 595 Fokus, Fokus, Fokus? Zur künftigen Rolle der außeruniversitären Wirtschaftsforschungsinstitute Christoph M. Schmidt .................................................................................................................................... 617 Book Review: Schmid Friedrich, Mark Trede: Finanzmarktstatistik Matthias Fischer ............................................................................................................................................ 623 Book Review: K. Takezawa: Introduction to Nonparametric Regression Karsten Webel .............................................................................................................................................. 625 Book Review: Pascal Ardilly, Yves Tillé: Sampling Methods: Exercises and Solutions Götz Uebe ..................................................................................................................................................... 627 Book Review: Studium der BWL und VWL, Methoden, Anwendung und Interpretation Karl-Heinz Tödter .......................................................................................................................................... 629 Book Review: Zivot Eric and Jiahui Wang, Modeling Financial Time Series with S-PLUS Matthias Fischer ............................................................................................................................................ 631
AStA — Advances in Statistical Analysis
Contents Vol. 91, Issue 1, 2007 Editorial Wilfried Siedel ................................................................................................................................................... 1 A Hausman test for Brownian motion Martin Becker, Ralph Friedmann, Stefan Klößner and Walter Sanddorf-Köhle ................................................. 3 Asymmetric monitoring of multivariate data with nonlinear dynamics Alessandro Fass‘o and Samuele Locatelli ....................................................................................................... 23 Sequential monitoring of minimum variance portfolio Vasyl Golosnoy ............................................................................................................................................... 39 Multivariate Lorenz dominance based on zonoids Gleb A. Koshevoy and Karl Mosler .................................................................................................................. 57 Bootstrapping a hedonic price index: experience from used cars data Michael Beer ................................................................................................................................................... 77 Proportions, sums and ratios Saralees Nadarajah and Samuel Kotz ............................................................................................................ 93 Book Review: Pascal Ardilly, Yves Tillé: Sampling Methods: Exercises and Solutions Götz Uebe ..................................................................................................................................................... 107
Contents Vol. 91, Issue 2, 2007 Comparison of different estimation techniques for portfolio selection Yarema Okhrin and Wolfgang Schmid .......................................................................................................... 109 Testing for linearity in simple regression models Stefan Niermann ........................................................................................................................................... 129
The Survey Statistician 41 January 2008
Inflation and the Divergence of Relative Prices: Evidence from a Cointegration Analysis Juliane Scharff.............................................................................................................................................. 141 An application of cartographic area interpolation to German administrative data Melanie Arntz and Ralf A. Wilke ................................................................................................................... 159 A new approach to the measurement of polarization for grouped data Eckart Bomsdorf and Clemens Otto ............................................................................................................. 181 Consistency of completely outlier-adjusted simultaneous redescending M-estimators of location and scale Martin Bachmaier ......................................................................................................................................... 197 Book Review:Wilkinson, L.: The Grammar of Graphics Götz Uebe .................................................................................................................................................... 221 Book Review: G. Molenberghs and G. Verbeke: Models for Discrete Longitudinal Data Karsten Webel .............................................................................................................................................. 223
Contents Vol. 91, Issue 3, 2007 Semiparametric multinomial logit models for analysing consumer choice behaviour Thomas Kneib, Bernhard Baumgartner and Winfried J. Steiner ................................................................... 225 A structured variational learning approach for switching latent factor models Mohamed Saidane and Christian Lavergne .................................................................................................. 245 Diagonal uniform association symmetry modelsfor cumulative probabilities in square tables Sadao Tomizawa and Nobuko Miyamoto ..................................................................................................... 269 On the inefficiency of propensity score matching Markus Frölich .............................................................................................................................................. 279 Analysis of short-term systematic measurement error variance for the difference of paired data without repetition of measurement Klaus Martin and Annette Böckenhoff .......................................................................................................... 291 Assessing the bias due to non-coverage of residential movers in the German Microcensus Panel: an evaluation using data from the Socio-Economic Panel Edin Basic and Ulrich Rendtel ...................................................................................................................... 311 Book Review: van der Hoek, J. and Elliott, R.J.: Binomial Models in Finance Götz Uebe .................................................................................................................................................... 335 Book Review: StatSoft, Inc., Tulsa, OK.: STATISTICA, Version 8 Christian H. Weiß ......................................................................................................................................... 339

The Survey Statistician 42 January 2008
IASS Officers and Council Members
President (2007−2009): Pedro Luis do Nascimento Silva (Brazil) [email protected] President-elect: Susan Linacre (Australia) [email protected] Vice-Presidents (2007-2009): Seppo Laaksonen (Finland) [email protected] Pierre Lavallée (Canada) [email protected] Scientific Secretary (2007-2009): Steven Heeringa [email protected] Council Members: (2005-2009) Giuliana Coccia (Italy) [email protected]
Geoffrey Lee (Australia) [email protected] Leyla Mohadjer (United States) [email protected] Sarah M. Nusser (United States) [email protected] Don Royce (Canada) [email protected]
Wei Yuan (China) [email protected] Council Members: (2007-2011) Jairo Arrow (South Africa) [email protected] Louise Bourque (Canada) [email protected] Kathryn Inglis-Clark (Australia) [email protected] Dalisay Maligalig (Philippines) [email protected] Paul-André Salamin (Switzerland) paul-andré[email protected]
Shyam Upadhaya (Nepal) [email protected]
Committee Chairs: 2009 Programme Committee: Leyla Mohadjer (USA) [email protected] 2011 Programme Committee: Geoffrey Lee (Australia) [email protected] The Secretariat: Executive Director: Michel Péronnet (France) [email protected] Treasurer: Daniel Malaquin (France) [email protected] Executive Secretary: Anna Maria Vespa-Leyder (France) [email protected] Secretary: Claude Olivier (France) [email protected]

INTERNATIONAL ASSOCIATION OF SURVEY STATISTICIANS
CHANGE OF ADDRESS FORM
If your home or business address has changed, please copy, complete, and mail this form to: IASS Secretariat c/o INSEE-CEFIL Att. Ms. Claude Olivier 3, rue de la Cité 33500 Libourne – France
Name: Mr./Mrs./Miss/Ms. _______________________ First name: _________________________
E-mail address (please just indicate one): _______________________________________________
May we list your e-mail address on the IASS web site?
Yes No
Home address
Street: ________________________________________________________________________________
City: __________________________________________________________________________________
State/Province: _______________________________ Zip/Postal code: _____________________
Country: ______________________________________________________________________________
Telephone number: ____________________________________________________________________
Fax number: __________________________________________________________________________
Business address
Company: ____________________________________________________________________________
Street: ________________________________________________________________________________
City: __________________________________________________________________________________
State/Province: _______________________________ Zip/Postal code: _____________________
Country: ______________________________________________________________________________
Telephone number and extension: ______________________________________________________
Fax number: __________________________________________________________________________
Please specify address to which your IASS correspondence should be sent:
Home Business

Institutional Members
4 International Organizations
AFRISTAT CICRED
EUROSTAT UNITED NATIONS STATISTICAL DIVISION
31 Bureaus of Statistics
ARGENTINA - INSTITUTO NACIONAL DE ESTADISTICA Y CENSOS - INDEC
AUSTRALIA - AUSTRALIAN BUREAU OF STATISTICS BELGIUM - INSTITUT NATIONAL DE STATISTIQUE
BRAZIL - INSTITUTO BRASILEIRO DE GEOGRAFIA E ESTATISTICA - IBGE CANADA - STATISTICS CANADA CHINA - GOVERNO DE MACAU
COTE D'IVOIRE - INSTITUT NATIONAL DE LA STATISTIQUE CZECH REPUBLIC - CZECH STATISTICAL OFFICE
DENMARK - DANMARKS STATISTIK FINLAND - STATISTICS FINLAND
FRANCE - INSTITUT NATIONAL DE STATISTIQUE ET D'ÉTUDES ÉCONOMIQUES - INSEE GAMBIA - CENTRAL STATISTICS DEPARTMENT
GERMANY - STATISTICHE BUNDESAMT GREECE - NATIONAL STATISTICAL SERVICE OF GREECE
IRAN - STATISTICAL CENTER OF IRAN ITALY - INSTITUTO CENTRALE DI STATISTICA - ISTAT
MEXICO - INSTITUTO NACIONAL DE ESTADISTICA, GEOGRAFIA E INFORMATICA - INEGI NETHERLANDS - CENTRAL BUREAU OF STATISTICS
NEW ZEALAND - STATISTICS NEW ZEALAND NIGERIA - FEDERAL OFFICE OF STATISTICS
NORWAY - CENTRAL BUREAU OF STATISTICS PORTUGAL - INSTITUTO NACIONAL DE ESTATISTICA - INE
REPUBLIC OF KOREA - NATIONAL STATISTICAL OFFICE - NSO SPAIN - INSTITUTO NACIONAL DE ESTADISTICA
SWEDEN - STATISTICS SWEDEN SWITZERLAND - OFFICE FEDERAL DE STATISTIQUE
TANZANIA - BUREAU OF STATISTICS UNITED KINGDOM - OFFICE FOR NATIONAL STATISTICS
USA - BUREAU OF THE CENSUS USA - DEPARTMENT OF EDUCATION
USA - DEPARTMENT OF HEALTH AND HUMAN SERVICES
6 Universities, Research Centers, Private Statistics Firms
ARGENTINA - UNIVERSITAD NACIONAL DE TRES DE FEBRERO DENMARK - SFI
EUROPE - A.C. NIELSEN MANAGEMENT SERVICE FRANCE - INSTITUT NATIONAL D'ÉTUDES DEMOGRAPHIQUES - INED
USA - RESEARCH TRIANGLE INSTITUTE USA - Westat


Read The Survey Statistician
on line!
http://isi.cbs.nl/iass/index.htm
No. 57 January 2008