N 2O and CH 4 emissions from soils under conventional and no-till management practices in Goiânia (...
11
N 2 O and CH 4 emissions from soils under conventional and no-till management practices in Goiânia (Cerrados, Brazil) Aurélie Metay a,b, ⁎ , Robert Oliver c , Eric Scopel d , Jean-Marie Douzet e , José Aloisio Alves Moreira f , Florent Maraux g , Brigitte J. Feigl h , Christian Feller b a ISTOM, 32 bd du Port 95094 Cergy-Pontoise Cedex, France b IRD, UR179 SeqBio, ENSAM, 2 place Viala, bâtiment 12, 34060 Montpellier cedex 1 France c CIRAD, UPR RELIER, TA B-78/01, Avenue Agropolis, 34398 Montpellier cedex 5, France d CIRAD PERSYST, UMR System, EMBRAPA-Cerrados Km 18, BR 020 - Rodovia Brasília/Fortaleza CP 08223 CEP 73310-970, Planaltina, DF Brazil e CIRAD PERSYST, URP SCRiD, BP 230 Antsirabe 110, Madagascar f EMBRAPA-CNPAF Rodovia Goiânia a Nova Veneza, km 12, Fazenda Capivara, C.P. 179 75375-000 Santo Antônio de Goiás, GO, Brazil g CIRAD, UPR Gestion de l'eau/UMR G-EAU Avenue Agropolis - TA 73/09 Bât. 2, Bur. 16 34398 Montpellier Cedex 5, France h CENA/ USP, CP 96, 13400-970 Piracicaba - São Paulo, Brazil Received 28 August 2006; received in revised form 13 April 2007; accepted 17 May 2007 Available online 27 June 2007 Abstract Nitrous oxide (N 2 O) and methane (CH 4 ) are important greenhouse gases (GHG) produced respectively by the naturally occurring microbial processes of incomplete denitrification or nitrification and methanogenesis. Tillage practices and climate affect the release of GHGs. No tillage (DMC) systems may increase CO 2 –C fixation in soil but also N 2 O and CH 4 emissions. The aim of this article is to question whether the positive effect of a DMC system observed on carbon storage for the topsoil layer in Cerrado soils is offset or not by the N 2 O and/or CH 4 emissions. Two 5-year-old systems, tillage (disc on the first 15 cm called offset: OFF) and a direct-sowing mulch-based crop system (DMC) with an additional cover crop were studied during a cropping cycle. N 2 O and CH 4 fluxes are determined using a closed-chamber, N 2 O and CO 2 concentrations are measured at 3 depths (10-, 20- and 30 cm). No significant difference between treatments was observed for both gases (for emissions and concentrations). Soil N 2 O contents increase from surface to depth (30 cm) and range from 300 ppbv to 3 ppm for both treatments. Total annual estimated emissions of N 2 O range from 31 to 35 g N 2 O–N ha - 1 year - 1 for DMC and OFF respectively which is low and corresponds only to 0.03% of the total N-fertilizer applied. Monthly means N 2 O emissions were strongly correlated to monthly means of N 2 O content at 10 cm depth (R 2 =0.66) and seem to increase exponentially with monthly mean Water Filled Pore Space WFPS (0–10 cm layer) (R 2 = 0.33). CH 4 fluxes were very low as well: both treatment act as source of CH 4 (245 and 403 g CH 4 –C ha - 1 year - 1 for DMC and OFF respectively. On a CO 2 –C equivalent basis these results correspond to 4.1 and 4.7 kg CO 2 –C ha - 1 year - 1 for N 2 O and to 1.9 and 3.1 kg CO 2 –C ha - 1 year - 1 for CH 4 for DMC and OFF respectively. As a result, the carbon sequestration balance taking into account the CO 2 , CH 4 and N 2 O on a CO 2 –C equivalent basis is in favour of DMC treatment considering that this treatment increases carbon storage originated from CO 2 –C for the topsoil (0–10 cm) layer (350 kg C ha - 1 year - 1 ) in comparison with OFF treatment. © 2007 Elsevier B.V. All rights reserved. Keywords: No tillage; CH 4 ;N 2 O; Soil C sequestration; Cerrado; Brazil 1. Introduction In the last few centuries, human activities, industry, transport and agriculture, have directly or indirectly contributed to the increase in concentrations of the major greenhouse gases (GHGs) in the atmosphere (IPCC, 2001). Agricultural land use, land use changes and forestry play an important role in the production and/or consumption of these gases. Tillage practices and climate affect the release of GHGs but only a few integrated studies have tried to quantify gas released or to characterize the mechanisms involved in their release. Nitrous oxides are formed Geoderma 141 (2007) 78 – 88 www.elsevier.com/locate/geoderma ⁎ Corresponding author. Fax: +33 1 30756261. E-mail address: [email protected] (A. Metay). 0016-7061/$ - see front matter © 2007 Elsevier B.V. All rights reserved. doi:10.1016/j.geoderma.2007.05.010
Transcript of N 2O and CH 4 emissions from soils under conventional and no-till management practices in Goiânia (...

007) 78–88www.elsevier.com/locate/geoderma
Geoderma 141 (2
N2O and CH4 emissions from soils under conventional and no-tillmanagement practices in Goiânia (Cerrados, Brazil)
Aurélie Metay a,b,⁎, Robert Oliver c, Eric Scopel d, Jean-Marie Douzet e,José Aloisio Alves Moreira f, Florent Maraux g, Brigitte J. Feigl h, Christian Feller b
a ISTOM, 32 bd du Port 95094 Cergy-Pontoise Cedex, Franceb IRD, UR179 SeqBio, ENSAM, 2 place Viala, bâtiment 12, 34060 Montpellier cedex 1 Francec CIRAD, UPR RELIER, TA B-78/01, Avenue Agropolis, 34398 Montpellier cedex 5, France
d CIRAD PERSYST, UMR System, EMBRAPA-Cerrados Km 18, BR 020 - Rodovia Brasília/Fortaleza CP 08223 CEP 73310-970, Planaltina, DF Brazile CIRAD PERSYST, URP SCRiD, BP 230 Antsirabe 110, Madagascar
f EMBRAPA-CNPAF Rodovia Goiânia a Nova Veneza, km 12, Fazenda Capivara, C.P. 179 75375-000 Santo Antônio de Goiás, GO, Brazilg CIRAD, UPR Gestion de l'eau/UMR G-EAU Avenue Agropolis - TA 73/09 Bât. 2, Bur. 16 34398 Montpellier Cedex 5, France
h CENA/ USP, CP 96, 13400-970 Piracicaba - São Paulo, Brazil
Received 28 August 2006; received in revised form 13 April 2007; accepted 17 May 2007Available online 27 June 2007
Abstract
Nitrous oxide (N2O) and methane (CH4) are important greenhouse gases (GHG) produced respectively by the naturally occurring microbialprocesses of incomplete denitrification or nitrification and methanogenesis. Tillage practices and climate affect the release of GHGs. No tillage(DMC) systems may increase CO2–C fixation in soil but also N2O and CH4 emissions. The aim of this article is to question whether the positiveeffect of a DMC system observed on carbon storage for the topsoil layer in Cerrado soils is offset or not by the N2O and/or CH4 emissions. Two5-year-old systems, tillage (disc on the first 15 cm called offset: OFF) and a direct-sowing mulch-based crop system (DMC) with an additionalcover crop were studied during a cropping cycle. N2O and CH4 fluxes are determined using a closed-chamber, N2O and CO2 concentrations aremeasured at 3 depths (10-, 20- and 30 cm). No significant difference between treatments was observed for both gases (for emissions andconcentrations). Soil N2O contents increase from surface to depth (30 cm) and range from 300 ppbv to 3 ppm for both treatments. Total annualestimated emissions of N2O range from 31 to 35 g N2O–N ha−1 year−1 for DMC and OFF respectively which is low and corresponds only to0.03% of the total N-fertilizer applied. Monthly means N2O emissions were strongly correlated to monthly means of N2O content at 10 cm depth(R2=0.66) and seem to increase exponentially with monthly mean Water Filled Pore Space WFPS (0–10 cm layer) (R2=0.33). CH4 fluxes werevery low as well: both treatment act as source of CH4 (245 and 403 g CH4–C ha−1 year−1 for DMC and OFF respectively. On a CO2–C equivalentbasis these results correspond to 4.1 and 4.7 kg CO2–C ha−1 year−1 for N2O and to 1.9 and 3.1 kg CO2–C ha−1 year−1 for CH4 for DMC and OFFrespectively. As a result, the carbon sequestration balance taking into account the CO2, CH4 and N2O on a CO2–C equivalent basis is in favour ofDMC treatment considering that this treatment increases carbon storage originated from CO2–C for the topsoil (0–10 cm) layer (350 kg C ha−1
year−1) in comparison with OFF treatment.© 2007 Elsevier B.V. All rights reserved.
Keywords: No tillage; CH4; N2O; Soil C sequestration; Cerrado; Brazil
1. Introduction
In the last few centuries, human activities, industry, transportand agriculture, have directly or indirectly contributed to the
⁎ Corresponding author. Fax: +33 1 30756261.E-mail address: [email protected] (A. Metay).
0016-7061/$ - see front matter © 2007 Elsevier B.V. All rights reserved.doi:10.1016/j.geoderma.2007.05.010
increase in concentrations of the major greenhouse gases(GHGs) in the atmosphere (IPCC, 2001). Agricultural land use,land use changes and forestry play an important role in theproduction and/or consumption of these gases. Tillage practicesand climate affect the release of GHGs but only a few integratedstudies have tried to quantify gas released or to characterize themechanisms involved in their release. Nitrous oxides are formed

79A. Metay et al. / Geoderma 141 (2007) 78–88
both through the aerobic process of nitrification and theanaerobic process of denitrification. A synthesis of results onN oxide (N2O+NO) fluxes from natural and derived, butunfertilized, systems in the humid tropics indicates that thefluxes are positively correlated with some measure of Navailability (soil inorganic N), with the nitrification potentialoften producing the best correlation with N2O flux, and alsowith water-filled pore space (WFPS) (Granli and Bockman,1995; Verchot et al., 1999; Davidson et al., 2000).
Some studies have reported higher N2O emissions from no-tillage than conventional tillage soils (Ball et al., 1999), as a resultof increased soil moisture content, water conservation and lowersoil gas diffusivity, whereas other studies report no significanteffects of tillage on N2O emissions (Elmi et al., 2003; Yamulkiand Jarvis, 2002). No-tillage (DMC)may increaseN2O emissionsand the CO2–C fixation of carbon by decreasing carbon dioxide(CO2) emissions. Hence, true mitigation is only possible if theoverall impact of DMC adoption reduces the net global warmingpotential (GWP) determined by GHG fluxes (Six et al., 2002).Only a few studies in the tropics have addressed this problem,especially for N2O (Mummey et al., 1998; Six et al., 2002).Studies of CH4 fluxes from different land-use systems in thehumid tropics are fewer than for N2O but indicate that upland,well-drained forest soils consume CH4 (Keller et al., 1986; Kellerand Reiners, 1994; Steudler et al., 1996; Verchot et al., 2000).Conversion of tropical forest soils to agriculture in general hasbeen shown to reduce the sink strength for CH4 (Keller et al.,1990). Tillage, liming, nitrogenous fertilization and irrigation canall influence the size of the CH4 sink in upland soils, often incontrasting directions (Keller et al., 1990; Mosier et al., 1996;Weier, 1999).
Some studies (Steudler, 1989; Mosier and Delgado, 1997)but not all (Mosier and Delgado, 1997; Mosier et al., 1998;Weier, 1999) have reported reductions in CH4 consumptionwith N fertilization, since CH4 may compete with CH4 oxida-tion enyzmes (Steudler, 1989).
Net CH4 flux is controlled by the interplay of biotic andabiotic factors that affect the rates of both CH4 production andconsumption. Linn and Doran (1984) showed that water-filledpore space (WFPS) is closely related to soil microbial activity.Soil texture, in turn, is a primary determinant of gas diffusivityin soils that is modified by the WFPS. Using data of CH4 fluxesfrom a variety of temperate and tropical native and managedecosystems, Del Grosso et al. (2000) showed that the activity ofsoil microbial processes responsible for CH4 production andconsumption can be roughly predicted from soil WFPS.
In a previous paper (Metay et al., 2007) we showed thepositive effect of DMC practices on soil organic carbon (SOC)storage for a cultivated clayey Oxisol in the Cerrado region ofBrazil.
The present paper provides results on CH4 and N2O fluxesover a 5-month-period for the same soil, with a comparisonbetween tilled and no-tilled systems. This paper is probably oneof the first contribution to reporting N2O fluxes and N2Oconcentrations profiles from a fertilized tropical site under no-till management. In the present paper we report results on N2Oand CH4 fluxes measurements from tilled and no-tilled soils at
the soil surface and N2O concentrations in the soil. It alsoexamines the interactions between soil physical factors and thebiological processes responsible for the GHGs production andconsumption in soils.
2. Materials and methods
The experiment was carried out in Goiânia, state of Goiás,Brazil. The local climate is tropical with a humid season fromOctober to April and a dry one from May to September. Themean annual temperature is around 22.5 °C and the meanannual precipitation is 1500 mm The soil is a clayey Oxisolaccording to the USA classification, a “latosolo vermelhoescuro distrofico” according to the Brazilian classification and aFerralsol according to the ISSS Working Group R.B. (1998).Climatic data (rainfall, temperature), SOC storage, inorganicnitrogen and soil moisture have been monitored for more than1 year as potential determinants of the GHG fluxes.
2.1. Experimental design
The experiment is located on a 400×150 m2 field, 25 kmfrom North-Goiânia, at EMBRAPA - CNPAF (EmpresaBrasileira de Pesquisa Agropecuaria - Centro Nacional dePesquisa sobre Arroz e Feijão) experimental station. In this field,six terraces (10 m in width) were installed in the eighties. Therewere used in 1998 to set the actual experimental design as part ofa joint CIRAD (Centre International de Recherche Agronomi-que pour le Développement) and EMBRAPAproject. It includedseveral tillage, rotation and fertilization treatments in order tostudy their impacts on productivity and environmental issues.Each plot is made of 25 cropped rows (50 m long), i.e. 500 m2.
2.2. Treatments
In our study, only two soil management treatments werestudied with two kinds of cover crop for the no-tilled treatments:
- OFF: Offset or disc arrowing treatment in which soil wastilled only to 15 cm depth,
- DMC: direct seeding mulch based treatment with covercrops of Brachiaria (grass).
- DMCc: direct seeding mulch based treatment with covercrops of Crotalaria (leguminous plant).
The rotation started with Rice (Oryza sativa). There weretwo crops in rotation, Rice followed by Brachiaria ruziziensis(after Rice's harvest) then Soya followed by Crotalariaspectabilis (after Soya's harvest). However, present studyonly concerns the Rice plots.
Each treatment was applied on 12 cultivated plots. Pre-emergent herbicides were used to protect the crop. In DMCplots, glyphosate was spread before planting as needed for weedcontrol. Fertilization was similar in all three treatments and wasrepresentative of the agricultural region. The N fertilizer for theRice crop was ammonium sulfate (NH4)2SO4 (100 kg ha−1)applied immediately after seeding on 2002, November 13th;
80 A. Metay et al. / Geoderma 141 (2007) 78–88
urea (NH2)2CO (100 kg ha−1) was applied on 2002, 10th ofDecember (28 days after sowing) and on 2003, 7th of January(56 days after sowing). This amounts to 114 kg N ha−1 for acropping cycle. The P and K fertilizers were P2O5 (120 kg ha
−1)and K2O (60 kg ha−1) respectively.
Due to a large initial soil variability within the experimentaldesign, only 2 plots per treatment were selected according totheir similar initial SOC content (for more details see Metayet al., 2007).
2.3. Sampling of gases at the soil surface
We selected sampling periods in order to cover more likelyperiods for gaseous fluxes (Fig. 1) according to literature:
(i) the wet season (October–March) is the most relevantperiod to measure CH4 and N2O fluxes under tropicalconditions (Baggs et al., 2003),
(ii) the first days after N-fertilizer application (December andJanuary) are a key period for N2O emissions (Davidsonet al., 1996),
(iii) the first stages of cover residue decomposition (fromgrass or legumes) (October-November) are favourable toCH4 and N2O emissions (Smith et al., 2003).
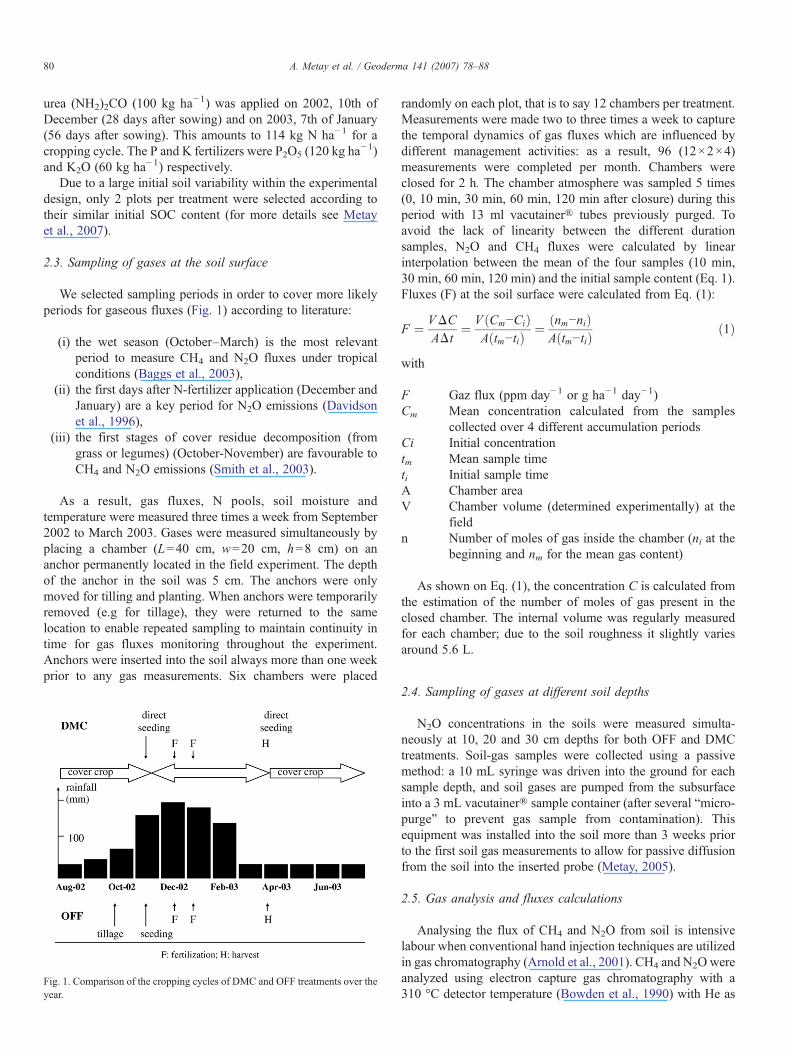
As a result, gas fluxes, N pools, soil moisture andtemperature were measured three times a week from September2002 to March 2003. Gases were measured simultaneously byplacing a chamber (L=40 cm, w=20 cm, h=8 cm) on ananchor permanently located in the field experiment. The depthof the anchor in the soil was 5 cm. The anchors were onlymoved for tilling and planting. When anchors were temporarilyremoved (e.g for tillage), they were returned to the samelocation to enable repeated sampling to maintain continuity intime for gas fluxes monitoring throughout the experiment.Anchors were inserted into the soil always more than one weekprior to any gas measurements. Six chambers were placed
Fig. 1. Comparison of the cropping cycles of DMC and OFF treatments over theyear.
randomly on each plot, that is to say 12 chambers per treatment.Measurements were made two to three times a week to capturethe temporal dynamics of gas fluxes which are influenced bydifferent management activities: as a result, 96 (12×2×4)measurements were completed per month. Chambers wereclosed for 2 h. The chamber atmosphere was sampled 5 times(0, 10 min, 30 min, 60 min, 120 min after closure) during thisperiod with 13 ml vacutainer® tubes previously purged. Toavoid the lack of linearity between the different durationsamples, N2O and CH4 fluxes were calculated by linearinterpolation between the mean of the four samples (10 min,30 min, 60 min, 120 min) and the initial sample content (Eq. 1).Fluxes (F) at the soil surface were calculated from Eq. (1):
F ¼ VΔCAΔt
¼ V Cm−Cið ÞA tm−tið Þ ¼ nm−nið Þ
A tm−tið Þ ð1Þ
with
F Gaz flux (ppm day−1 or g ha−1 day−1)Cm Mean concentration calculated from the samples
collected over 4 different accumulation periodsCi Initial concentrationtm Mean sample timeti Initial sample timeA Chamber areaV Chamber volume (determined experimentally) at the
fieldn Number of moles of gas inside the chamber (ni at the
beginning and nm for the mean gas content)
As shown on Eq. (1), the concentration C is calculated fromthe estimation of the number of moles of gas present in theclosed chamber. The internal volume was regularly measuredfor each chamber; due to the soil roughness it slightly variesaround 5.6 L.
2.4. Sampling of gases at different soil depths
N2O concentrations in the soils were measured simulta-neously at 10, 20 and 30 cm depths for both OFF and DMCtreatments. Soil-gas samples were collected using a passivemethod: a 10 mL syringe was driven into the ground for eachsample depth, and soil gases are pumped from the subsurfaceinto a 3 mL vacutainer® sample container (after several “micro-purge” to prevent gas sample from contamination). Thisequipment was installed into the soil more than 3 weeks priorto the first soil gas measurements to allow for passive diffusionfrom the soil into the inserted probe (Metay, 2005).
2.5. Gas analysis and fluxes calculations
Analysing the flux of CH4 and N2O from soil is intensivelabour when conventional hand injection techniques are utilizedin gas chromatography (Arnold et al., 2001). CH4 and N2O wereanalyzed using electron capture gas chromatography with a310 °C detector temperature (Bowden et al., 1990) with He as

81A. Metay et al. / Geoderma 141 (2007) 78–88
carrier gas. The automated gas sampling system is easy tooperate and provides acceptable results (standards ranging from1.0–5.0 ppmv CH4 and 0.342–2.0 ppmv N2O had coefficientsof variation ranging from 1 to 6% determined under laboratoryconditions) while providing an economical approach foranalysing large numbers of gas samples with minimal labourand equipment cost. Data are presented as mean values for theday or the month with their standard deviations. They weretested for statistical significance by Student's unpaired t-test.
2.6. Climatic data and soil temperature
Atmospheric barometric pressure and ambient air, surface,5-, 10-, 20-, 30- and 60-cm soil temperatures were measured,and soil moistures and inorganic N were always measured onthe day of the gas measurement in the 0–10 cm first layer.
2.7. Soil moisture and bulk density. Calculations of WFPS
Soil moisture was gravimetrically determined by drying asub-sample to 105 °C during 24 h each time gas fluxes weremeasured. Bulk density was determined in six replicate soilsamples per plot at the beginning of the cropping cycle(October), collected at 0- to 10- and 10- to 30-cm in depth.Samples were collected using a fixed-volume core (250 cm3 or561.8 cm3) and then heated at 105 °C to dry them up. The soilwater content was expressed as WFPS (Water-Filled Pore Spacein %).
WFPS ¼ volumetric moisture content
1− bulk density2:65
� � ð2Þ
where 2.65 is the assumed particle density.
Table 1Monthly average rainfall (mm) and WFPS (%) for both treatments from October2002 to February 2003 for the 2 layers (0–10 cm and 10–30 cm)
Treatment Depth(cm)
Oct-02 Nov-02 Dec-02 Jan-03 Feb-03
WFPS(%)
DMC 0–10 10.63 58.1 57.2 59.7 61.8
10–30 13.81 57.9 53.4 56.8 56.1
OFF 0–10 8.8 53.0 55.7 57.5 56.810–30 15.56 61.9 64.1 63.8 64.2
Rain (mm) 59.3 196.5 216.7 288.4 303.6
2.8. SOC contents and stocks
Carbon contents and were calculated on the same samplesused for bulk densities (6 replicates per depth and per plot). Thisanalysis was repeated on the two plots of a particular treatment,and for each treatment. Percent C (the carbon relative content)was determined by dry combustion in a LECO CN-2000 ana-lyzer from sub-samples dried to 60 °C (for more details, seeMetay et al., 2007).
2.9. Inorganic-N
Soil surrounding each of the permanent bases was sampledto 30 cm (0–10 and 10–30 cm) on the same day as the gassampling i.e. 2 to 3 times a week and samples were assessed fornitrogen availability (soil inorganic N).
Soil samples for determination of N pools, soil moisture, soilpH, and soil inorganic-N (NH4
+, NO3−) were collected at as
composite of six replicates per plot. NH4+ and NO3
− concentra-tions were determined by colorimetry, following methodsdescribed by Anderson and Ingram (1989). Inorganic-Nextraction was done in situ with KCl (1 M). After shaking theslurry for 1 h, the mixture was settled for 2 h and an aliquot of
10 mL was sampled with a sterilized syringe and filtered at0.2 μm. Suspensions were stored in sterile and cold conditions(4 °C) in venoject® till the dosage.
3. Results
3.1. Climatic data and soil temperature
Between the first sampling period in October and lastsampling in March, there was a total rainfall of 871 mmdistributed as shown in Table 1.
Minimum and maximum ambient air temperatures during themeasurement period ranged from to 24.3 to 28.6 °C. Soiltemperatures measured twice a week at the soil surface, 5-, 10-,20-, 30- and 60-cm depth did not significantly vary between thedifferent treatments and ranged from 23.7 (Jan, 0 cm, DMC), to28.6 (Dec., 10 cm, OFF) showing higher values at the soilsurface than at 60 cm depth.
3.2. SOC, bulk density and WFPS
At the setting up of the experiment in October, SOC weresignificantly higher for DMC treatment for both 0–10 cm and10–30 cm layers (17.6 (+/−2.1) g C kg−1 soil and 15.5 (+/−0.5)g C kg−1 soil for DMC and 16.0 (+/−1.1) g C kg−1 soil and 14.7(+/−0.5) g C kg−1 soil for OFF). Bulk densities were almostidentical across the entire study area; we only noticed a slightbut non significant increase in bulk density in the 10–30 cmlayer of the “OFF treatments” plots (after 5 years) (1.27 and1.25 g cm−3 for DMC and 1.25 and 1.34 g cm−3 for OFF for 0–10 cm and 10–30 cm respectively) (for more details, see Metayet al., 2007). This is probably due to the effect of disc at 15–20 cm depth. WFPS (Table 1) was lowest in October andhighest in February, which is consistent with the transition fromdry to wet seasons. For the 0–10 cm layer, ranges of WFPSwere slightly higher for DMC than OFF (21–84% and 14–79%). For the 10–30 cm layer WFPS were significantly higherfor OFF during the whole season.
3.3. Inorganic soil N (NH4+, NO3
−)
Inorganic N (NH4+ and NO3
−) was higher for OFF than forDMC; this is particularly relevant at the first date at thebeginning of the rainy season (Fig. 2).

Fig. 2. Inorganic N content (NO3−, NH4
+) (mg N kg−1 soil) in the soil fromOctober 2002 to February 2003 (monthly mean and standard deviation).
Fig. 4. N2O fluxes (g N2O–N ha−1 day−1) measured in situ from DMC and OFFtreatments from November 2002 to February 2003 (monthly mean (n=20)).
82 A. Metay et al. / Geoderma 141 (2007) 78–88
A low NO3− level was also observed at the end of the
sampling period (0.48 and 0.29 mg N-NO3− kg soil−1 for OFF
0–10 cm and 10–30 cm respectively; 0.66 and 0.46 mg N-NO3−
kg soil−1 for DMC 0–10 cm and 10–30 cm respectively).NH4
+ concentrations range from 2.00 to 2.93 mg N kg soil−1
and are always under NO3− concentrations (ranging from 0.48 to
21.06 mg N kg soil−1) for OFF until February 2003 for theupper 10 cm layer and until January 2003 the 10–30 cm layer.The difference between NH4
- and NO3− is smaller at the end of
the cropping cycle.For both treatments and both NO3 and NH4, coefficients of
variation were around 15%.
3.4. N2O and CH4 fluxes at the soil surface and concentrationswithin the soil profile
3.4.1. N2O fluxes at the soil surfaceThe studied soils acted as a source of N2O. N2O emissions
range from 0 to 0.83 g N ha−1 day−1 and from 0 to 1.53 g Nha−1 day−1 for DMC and OFF respectively (Fig. 3).
Error bars represent the standard deviation for 20 measure-ments. A high variability and no significant difference wereobserved for both gases on a daily (Fig. 3) or monthly scale(Fig. 4).
Fig. 3. N2O fluxes (g N2O–N ha−1 day−1) measured in situ from DMC and OFFtreatments from October 2002 to March 2003 (mean daily values).
The total annual fluxes were calculated on the basis of linearinterpolation between successive sampling days. The observa-tions from this study were extended to the dry period using alow estimate of 0.1 g N2O–N ha−1 day−1 for the dry periodbased on early September measurements (data not shown) As aresult, the annual balance for N2O emissions ranges from 30.66to 35.31 g N2O–N ha−1 for DMC and OFF respectively. Theseannual balances roughly represent 0.03% of the total amount(114 kg) of N applied to the cropping system.
3.4.2. Effect of fertilizationThere is no clear correlation between N fertilization and N2O
fluxes level (Fig. 3). Perhaps a higher variability is to beobserved shortly after each fertilization, which is consistentwith other studies under tropical (Nobre, 1994) and temperateconditions (Mosier, 1989).
3.4.3. Soil N2O concentrationsFig. 5 shows original data on N2O concentrations in the soil
atmosphere at different soil depths. Soil N2O concentrationsrange from 1 to 30 times the atmospheric natural concentration.Although results show a large variability, the general trendhighlights a slightly higher concentration at 30 cm depth. Thisnegative gradient might explain the possible diffusion from thedeeper sampling point to the soil surface.
Fig. 5. Soil N2O concentrations (ppm) at 3 depths (−10, −20 and −30 cm) forboth treatments during the cropping cycle. (⁎): missing data.
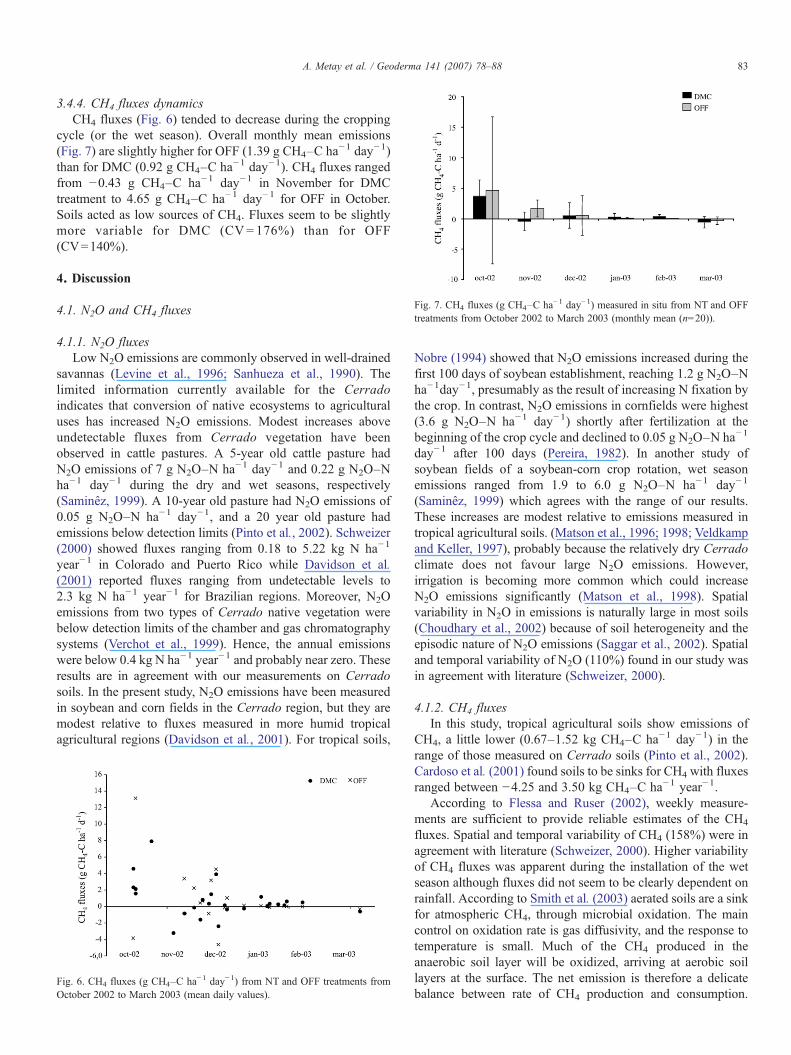
Fig. 7. CH4 fluxes (g CH4–C ha−1 day−1) measured in situ from NT and OFFtreatments from October 2002 to March 2003 (monthly mean (n=20)).
83A. Metay et al. / Geoderma 141 (2007) 78–88
3.4.4. CH4 fluxes dynamicsCH4 fluxes (Fig. 6) tended to decrease during the cropping
cycle (or the wet season). Overall monthly mean emissions(Fig. 7) are slightly higher for OFF (1.39 g CH4–C ha−1 day−1)than for DMC (0.92 g CH4–C ha−1 day−1). CH4 fluxes rangedfrom −0.43 g CH4–C ha−1 day−1 in November for DMCtreatment to 4.65 g CH4–C ha−1 day−1 for OFF in October.Soils acted as low sources of CH4. Fluxes seem to be slightlymore variable for DMC (CV= 176%) than for OFF(CV=140%).
4. Discussion
4.1. N2O and CH4 fluxes
4.1.1. N2O fluxesLow N2O emissions are commonly observed in well-drained
savannas (Levine et al., 1996; Sanhueza et al., 1990). Thelimited information currently available for the Cerradoindicates that conversion of native ecosystems to agriculturaluses has increased N2O emissions. Modest increases aboveundetectable fluxes from Cerrado vegetation have beenobserved in cattle pastures. A 5-year old cattle pasture hadN2O emissions of 7 g N2O–N ha−1 day−1 and 0.22 g N2O–Nha−1 day−1 during the dry and wet seasons, respectively(Saminêz, 1999). A 10-year old pasture had N2O emissions of0.05 g N2O–N ha−1 day−1, and a 20 year old pasture hademissions below detection limits (Pinto et al., 2002). Schweizer(2000) showed fluxes ranging from 0.18 to 5.22 kg N ha−1
year−1 in Colorado and Puerto Rico while Davidson et al.(2001) reported fluxes ranging from undetectable levels to2.3 kg N ha−1 year−1 for Brazilian regions. Moreover, N2Oemissions from two types of Cerrado native vegetation werebelow detection limits of the chamber and gas chromatographysystems (Verchot et al., 1999). Hence, the annual emissionswere below 0.4 kg N ha−1 year−1 and probably near zero. Theseresults are in agreement with our measurements on Cerradosoils. In the present study, N2O emissions have been measuredin soybean and corn fields in the Cerrado region, but they aremodest relative to fluxes measured in more humid tropicalagricultural regions (Davidson et al., 2001). For tropical soils,
Fig. 6. CH4 fluxes (g CH4–C ha−1 day−1) from NT and OFF treatments fromOctober 2002 to March 2003 (mean daily values).
Nobre (1994) showed that N2O emissions increased during thefirst 100 days of soybean establishment, reaching 1.2 g N2O–Nha−1day−1, presumably as the result of increasing N fixation bythe crop. In contrast, N2O emissions in cornfields were highest(3.6 g N2O–N ha−1 day−1) shortly after fertilization at thebeginning of the crop cycle and declined to 0.05 g N2O–N ha−1
day−1 after 100 days (Pereira, 1982). In another study ofsoybean fields of a soybean-corn crop rotation, wet seasonemissions ranged from 1.9 to 6.0 g N2O–N ha−1 day−1
(Saminêz, 1999) which agrees with the range of our results.These increases are modest relative to emissions measured intropical agricultural soils. (Matson et al., 1996; 1998; Veldkampand Keller, 1997), probably because the relatively dry Cerradoclimate does not favour large N2O emissions. However,irrigation is becoming more common which could increaseN2O emissions significantly (Matson et al., 1998). Spatialvariability in N2O in emissions is naturally large in most soils(Choudhary et al., 2002) because of soil heterogeneity and theepisodic nature of N2O emissions (Saggar et al., 2002). Spatialand temporal variability of N2O (110%) found in our study wasin agreement with literature (Schweizer, 2000).
4.1.2. CH4 fluxesIn this study, tropical agricultural soils show emissions of
CH4, a little lower (0.67–1.52 kg CH4–C ha−1 day−1) in therange of those measured on Cerrado soils (Pinto et al., 2002).Cardoso et al. (2001) found soils to be sinks for CH4 with fluxesranged between −4.25 and 3.50 kg CH4–C ha−1 year−1.
According to Flessa and Ruser (2002), weekly measure-ments are sufficient to provide reliable estimates of the CH4
fluxes. Spatial and temporal variability of CH4 (158%) were inagreement with literature (Schweizer, 2000). Higher variabilityof CH4 fluxes was apparent during the installation of the wetseason although fluxes did not seem to be clearly dependent onrainfall. According to Smith et al. (2003) aerated soils are a sinkfor atmospheric CH4, through microbial oxidation. The maincontrol on oxidation rate is gas diffusivity, and the response totemperature is small. Much of the CH4 produced in theanaerobic soil layer will be oxidized, arriving at aerobic soillayers at the surface. The net emission is therefore a delicatebalance between rate of CH4 production and consumption.
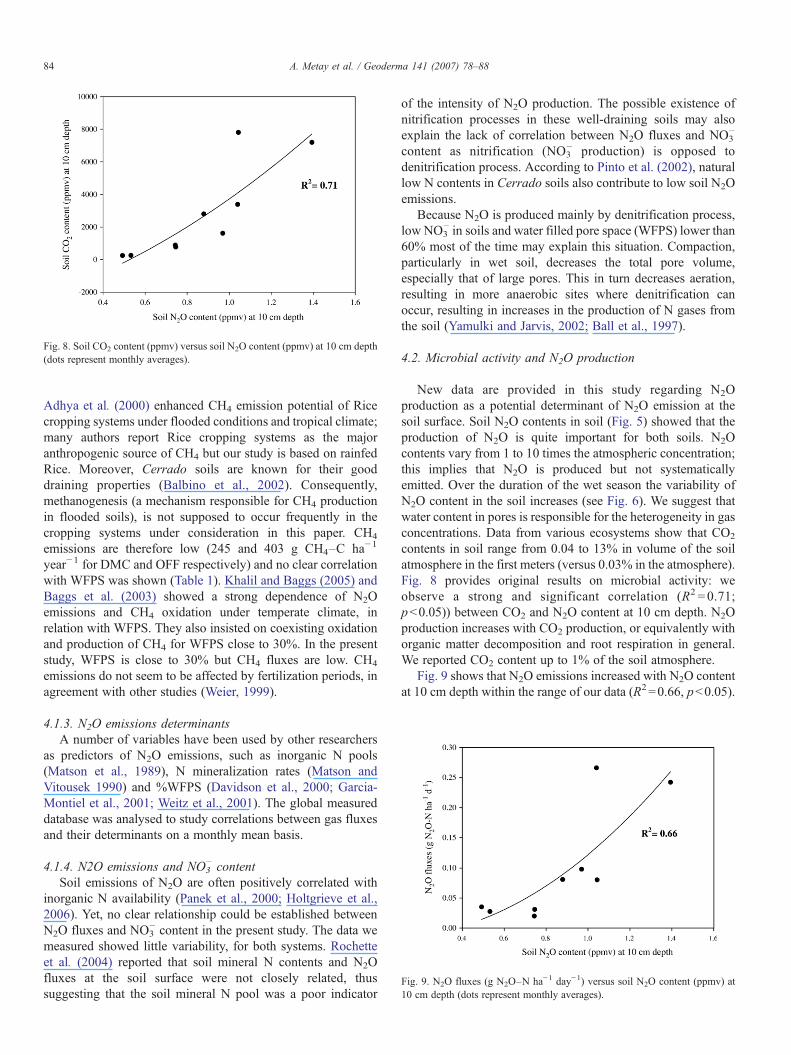
Fig. 8. Soil CO2 content (ppmv) versus soil N2O content (ppmv) at 10 cm depth(dots represent monthly averages).
Fig. 9. N2O fluxes (g N2O–N ha−1 day−1) versus soil N2O content (ppmv) at10 cm depth (dots represent monthly averages).
84 A. Metay et al. / Geoderma 141 (2007) 78–88
Adhya et al. (2000) enhanced CH4 emission potential of Ricecropping systems under flooded conditions and tropical climate;many authors report Rice cropping systems as the majoranthropogenic source of CH4 but our study is based on rainfedRice. Moreover, Cerrado soils are known for their gooddraining properties (Balbino et al., 2002). Consequently,methanogenesis (a mechanism responsible for CH4 productionin flooded soils), is not supposed to occur frequently in thecropping systems under consideration in this paper. CH4
emissions are therefore low (245 and 403 g CH4–C ha−1
year−1 for DMC and OFF respectively) and no clear correlationwith WFPS was shown (Table 1). Khalil and Baggs (2005) andBaggs et al. (2003) showed a strong dependence of N2Oemissions and CH4 oxidation under temperate climate, inrelation with WFPS. They also insisted on coexisting oxidationand production of CH4 for WFPS close to 30%. In the presentstudy, WFPS is close to 30% but CH4 fluxes are low. CH4
emissions do not seem to be affected by fertilization periods, inagreement with other studies (Weier, 1999).
4.1.3. N2O emissions determinantsA number of variables have been used by other researchers
as predictors of N2O emissions, such as inorganic N pools(Matson et al., 1989), N mineralization rates (Matson andVitousek 1990) and %WFPS (Davidson et al., 2000; Garcia-Montiel et al., 2001; Weitz et al., 2001). The global measureddatabase was analysed to study correlations between gas fluxesand their determinants on a monthly mean basis.
4.1.4. N2O emissions and NO3− content
Soil emissions of N2O are often positively correlated withinorganic N availability (Panek et al., 2000; Holtgrieve et al.,2006). Yet, no clear relationship could be established betweenN2O fluxes and NO3
− content in the present study. The data wemeasured showed little variability, for both systems. Rochetteet al. (2004) reported that soil mineral N contents and N2Ofluxes at the soil surface were not closely related, thussuggesting that the soil mineral N pool was a poor indicator
of the intensity of N2O production. The possible existence ofnitrification processes in these well-draining soils may alsoexplain the lack of correlation between N2O fluxes and NO3
−
content as nitrification (NO3− production) is opposed to
denitrification process. According to Pinto et al. (2002), naturallow N contents in Cerrado soils also contribute to low soil N2Oemissions.
Because N2O is produced mainly by denitrification process,low NO3
− in soils and water filled pore space (WFPS) lower than60% most of the time may explain this situation. Compaction,particularly in wet soil, decreases the total pore volume,especially that of large pores. This in turn decreases aeration,resulting in more anaerobic sites where denitrification canoccur, resulting in increases in the production of N gases fromthe soil (Yamulki and Jarvis, 2002; Ball et al., 1997).
4.2. Microbial activity and N2O production
New data are provided in this study regarding N2Oproduction as a potential determinant of N2O emission at thesoil surface. Soil N2O contents in soil (Fig. 5) showed that theproduction of N2O is quite important for both soils. N2Ocontents vary from 1 to 10 times the atmospheric concentration;this implies that N2O is produced but not systematicallyemitted. Over the duration of the wet season the variability ofN2O content in the soil increases (see Fig. 6). We suggest thatwater content in pores is responsible for the heterogeneity in gasconcentrations. Data from various ecosystems show that CO2
contents in soil range from 0.04 to 13% in volume of the soilatmosphere in the first meters (versus 0.03% in the atmosphere).Fig. 8 provides original results on microbial activity: weobserve a strong and significant correlation (R2 =0.71;pb0.05)) between CO2 and N2O content at 10 cm depth. N2Oproduction increases with CO2 production, or equivalently withorganic matter decomposition and root respiration in general.We reported CO2 content up to 1% of the soil atmosphere.
Fig. 9 shows that N2O emissions increased with N2O contentat 10 cm depth within the range of our data (R2 =0.66, pb0.05).

85A. Metay et al. / Geoderma 141 (2007) 78–88
Relationship between N2O fluxes and N2O content ispolynomial of the second order, which suggests that ourdiffusion conditions (depending on WFPS) alter the kinetics ofN2O emission at the soil surface. Organic C can also affect N2Oproduction. Indeed, it is used by denitrifying micro-organismsand by other heterotrophic microbes, as a source of energy; inthis case anaerobic microsites in soils can be producedwhenever the biological oxygen demand exceeds supply. Soilmoisture also controls the diffusion of O2 in soil. Therelationship between increasing moisture levels and higherrates of denitrification is well documented in the laboratory(McGarity, 1961) and in the field (Davidson et al., 2000).
Arah et al. (1991) suggest that low N2O emissions may beexplained by reductions in gas diffusivity leading to N2Oconsumption prior to emissions, or by complete denitrificationleading to N2O reduction and N2 emission. At high soilmoisture, N2 became the major end product.
N2O concentrations vary widely, both between and within,different tillage systems. The availability of labile organic C formicrobial metabolic processes could be an important factorregulating N2O emissions from tropical soils. In our case, thewater soluble fraction is not negligible, which suggests no Climitation on N2O production (Garcia-Monteil et al., 2003).
4.2.1. Water dynamics and WFPSAs N2O is partly produced by denitrification in anaerobic
conditions,WFPSmay be correlated toN2O fluxes. Fig. 10 showsthat N2O emissions (g N2O–N ha−1 day−1) tend to increaseexponentially (R2=0.33) withmonthlymean values ofWFPS (%)in the 0–10 cm layer but the relation stated is not significant.WFPS calculated from OFF system are always higher than thosefrom DMC system but this trend does not correspond to higheremissions from the OFF system. To the contrary, we observe thatemissions fromDMC system tend to be higher on an annual basis,we can suggest that DMC plots have the greatest source of Corganic which simulate N2O emissions. However, Figs. 8, 9 and10 need more data at crucial part of the curve to give betterunderstanding of the determinants for N2O fluxes.
Saggar et al. (2004) reported that N2O emissions increasewith soil moisture due to an increase in anaerobic sites and
Fig. 10. N2O fluxes (g N2O–N ha−1 day−1) versus WFPS (%) for the topsoillayer 0–10 cm (dots represent monthly averages).
denitrification. In climates with distinct wet and dry seasons, thefirst rainfall on dry soil has been shown to create a large butshort-lived, pulse of N2O emissions which can contributesignificantly to the annual total emission. Hence, Dick et al.(2001) showed that a heavy rainfall produced a flush in N2Oemissions up to 480 g N2O–N ha−1 day−1 from tropical soilsunder agroforestry.
Possible explanations for the low WFPS under these cropsinclude evaporation under high temperature (22.5 °C onaverage) and high draining properties of these soils. An increasein soil WFPS and the consequent decrease in O2 diffusion ratewithin the soil, has a similar effect on the system than the oneinduced by a rise of temperature, and thus N2O production andemission increase exponentially with WFPS (Smith et al.,2003).
4.2.2. Cover crops and fertilizationAlthough emissions remain very low in both treatments,
peak emission rates in the tillage and no-tillage treatmentsfollowed fertilizer applications. In general, N2O losses afterfertilization are more variable and N2O fluxes peak whencircumstances combine larger rainfall and fertilization. Weobserved a higher variability in N2O emissions after ureaapplications (till 1.4 g.N2O–N ha−1day−1). These short-termN2O responses to fertilizer additions usually occur in tropicalagricultural and agroforestry systems (Davidson et al., 1996).The short-term nature of N2O pulses following fertilizationsupport the arguments by Mosier (1989) and Veldkamp andKeller (1997) that frequent measurements are important tocapture high N losses by gases emissions in the first weeksfollowing N application. The problem is to define the frequencyof measurements needed to catch a short-term response. In thepresent study, measurements were done manually twice to threetimes at the same hour a week (morning) over 12 replicates pertreatment during the experimental period but we might havemissed the N2O flush., although if there was a flush it was veryshort and hence its significance is questionable.
We have approximately a global annual estimated emissionof nearly 35 g N2O–N ha−1 year−1. The percentage of the Napplied as fertilizer which is lost as N2O is commonly referredto as the N2O–N yield. In the present study, the N2O–N yieldswere the same in both treatments (0.03%) which is very lowcompared to the results documented by Bouwman (1994) andMosier et al. (1996) (average N2O yields of 1.25% generallyestimated from fertilized agricultural areas of the temperatezone). But this is consistent with other data from the tropicalzone. Indeed, the N2O–N yields from fertilized tropical sitesrange from 0.01% to 4.9%, some of them with highly organicvolcanically derived soils, and application rates far greaterthan those of the present study (Matson et al., 1996; Mosierand Delgado 1997; Veldkamp and Keller 1997; Veldkamp etal., 1998; Crill et al., 2000; Weitz et al., 2001; Steudler et al.,2002).
4.2.3. GHG balance for both DMC and OFF treatmentsThe sum of SOC storage (from atmospheric CO2–C) plus
CH4 and N2O balances at the soil surface (expressed on a

Table 2Annual fluxes estimations for DMC and OFF treatments and GHG balancecalculated from the respective GWP (310 for N2O and 21 for CH4) on anequivalent CO2–C basis (mean value and (standard deviation))
Treatment N2O emissions CH4 emissions GHG annual balance (fromN2O and CH4 contributions)⁎
(10–3 kg Nha–1 year−1)
(10–3 kg Cha–1 year–1)
(kg CO2–C)
DMC 30.7 (39.19) 245 (572) 6.0 (9,6)OFF 35.3 (31.46) 403 (683) 7.8 (9.4)
(⁎) 1 g N2O–N is equivalent to 133 g CO2–C and 1 g CH4–C to 7.63 g CO2–Caccording to the respective global warming potential of these gases.
86 A. Metay et al. / Geoderma 141 (2007) 78–88
CO2–C equivalent basis) is considered by Bernoux et al.(2006) as the “soil C sequestration”.
We are able now to make some preliminary estimates of theshort-term “greenhouse gas” balances under two managementsystems: DMC and OFF. It was previously suggested that anincrease in N2O fluxes could occur (Ball et al., 1999; Six et al.,2002) and would be congruent with the stabilization of C and N.Six et al. (2002) collected and synthesized published N2O fluxesdata from CT (Conventional Tillage) and DMC treatments inorder to have an example where management changes C and Nstabilization and might lead to differences in N2O fluxes. Fortemperate soils, N2O fluxes were found to be often greater underDMC than under CT management.
Studies in the temperate zone have found conflicting resultswhen N2O fluxes from conventional tillage treatments and no-tillage treatments were compared. Studies in Canada (Aulakhet al., 1984) and the United Kingdom (Ball et al., 1999) showedan increase in N2O emissions under no-tillage due to increasedsoil water content, bulk density, and larger soil aggregates,which led to increases in anaerobic conditions.
Emissions of N2O drive much of the trend in net GHGannual balance because of its higher GWP, suggesting thatimproved nitrogen management is essential to achieve the fullbenefit from SOC storage in the soil for purposes of globalwarming mitigation.
We showed in a previous paper (Metay et al., 2007) a trend ofincrease of the SOC in the 0–10 cm layer of 350 kgC ha−1 year−1
during 5 years under the present DMC treatment. The presentpaper indicates a slight GHGmitigation by adoption of DMC butthe uncertainty associated to the GHG annual balance remainshigh. Yet we showed that the variations in monthly emissions ofall gases were very high and GHG balance shown in Table 2exhibits a very low level of eq C–CO2 (under 10 kg eq C) for CH4
andN2O for both treatments (6.0 and 7.8 kgC ha−1 year−1 for NTand OFF respectively). As a result, the carbon sequestrationbalance taking into account the CO2, CH4 and N2O on a CO2–Cequivalent basis (Table 2) is in favour of DMC treatment.
5. Conclusions
N2O and CH4 fluxes between the soil and the atmosphere areinfluenced by management practices currently used in agricul-ture. Our experimental device compares N2O andCH4 emissions
under DMC and OFF practices. For both treatments, N2O andCH4 emissions were very low and no significant differencebetween treatments was observed for both gases. Original dataabout N2O content in the soil profile showed that N2O isproduced (concentration ranging from 1 to 30 times theatmospheric concentration) in the first 30 cm of the soil.Monthly means N2O emissions were strongly correlated tomonthly means N2O content at 10 cm depth (R2 =0.66) and seemto increase exponentially with monthly mean WFPS (0–10 cmlayer) (R2 =0.33).
Our research points out the need to explore more preciselythe contribution of crop and waste residues, slow-releasefertilisers, compaction and the effect of their distribution in thesoil to trace gas production and emission. Further measurementson denitrification potential will be led so as to understand betterthe capacity of this soil to produce and emit N2O.
Nowadays, around 20 million hectares are cultivated withno-tillage systèms in Brazil. These systems are agronomicallyefficient under tropical conditions. As a result, the carbonsequestration balance taking into account the CO2, N2O andCH4 fluxes on a C–CO2 equivalent basis is in favour of DMCtreatment (around 320 kg C ha−1 year−1). The ability of DMCto sequester C is another environmental benefit of this system atleast in this region.
Acknowledgments
This work was completed thanks to the grant given to AurélieMetay by the French Ministry of Research and Technologies. Afinancial support was brought by the FFEM (Fonds Françaispour l'Environnement Mondial). Project CZZ1224.02X “Bilancomparé des émissions/ séquestration des gaz à effet de serredans les systèmes de culture agro-écologiques (semis direct souscouverture végétale) et les systèmes de culture traditionnels. Lecas du Brésil” and CIRAD (financial support from the CIRADscientific direction). We also would like to thank the persons thathad helped to complete the laboratory analysis at CENA,CIRAD, and CEFE research centers.
References
Adhya, T.K., Bharati, K., Mohanty, S.R., Ramakrishnan, B., Rao, V.R.,Sethunathan, N., Wassmann, R., 2000. Methane emission from rice fields atCuttack, India. Nutr. Cycl. Agroecosyst. 58, 95–105.
Anderson, J.M., Ingram, J.S.I., 1989. Tropical Soil Biology and Fertility: AHandbook of Methods. CAB International, Oxon, GB. 171 p.
Arah, J.R.M., Smith, K.A., Crichton, I., Li, H.S., 1991. Nitrous oxide productionand denitrification in Scottish arable soils. J. Soil Sci. 42, 351–367.
Arnold, S.L., Parkin, T.B., Doran, J.W., Eghball, B., Mosier, A.R., 2001.Automated gas sampling system for laboratoratory analysis of CH4 andN2O. Commun. Soil Sci. Plant Anal. 32 (17&18), 2795–2807.
Aulakh, M.S., Rennie, D.A., Paul, E.A., 1984. Gaseous nitrogen losses from thesoils under zero-till as compared with conventional-till managementsystems. J. Environ. Qual. 13 (1), 130–136.
Baggs, E.M., Richter, M., Cadisch, G., Hartwig, U.A., 2003. Denitrification ingrass swards is increased under elevated atmospheric CO2. Soil Biol.Biochem. 35, 729–732.
Balbino, L.C., Bruand, A., Brossard, M., Grimaldi, M., Hajnos, M., Guimaraes,M.F., 2002. Changes in porosity and microaggregation in clayey Ferralsols ofthe Brazilian Cerrado on clearing for pasture. Eur. J. Soil Sci. 53, 219–230.

87A. Metay et al. / Geoderma 141 (2007) 78–88
Ball, B.C., Scott, A., Parker, J.P., 1999. Field N2O, CO2 and CH4 fluxes in relationto tillage, compaction and soil quality in Scotland. Soil Till. Res. 53, 29–39.
Ball, B.C., Smith, K.A., Klemedtsson, L., Brumme, R., Sitaula, B.K., Hansen,S., Priemé, A., MacDonald, J., Horgan, G.W., 1997. The influence of soilgas transport properties on methane oxidation in a selection of northernEuropean soils. J. Geophys. Res. 102, 23309.
Bernoux, M., Cerri, C.C., Cerri, C.E.P., Siqueira Neto,M., Metay, A., Perrin, A.S.,Scopel, E., Blavet, D., Piccolo, M.C., Pavei, M., Milne, E., 2006. Croppingsystems, carbon sequestration and erosion in Brazil, a review. Agron. Sustain.Dev. 26, 1–8.
Bouwman, A.F., 1994. Method to estimate direct nitrous oxide emissions fromagricultural soils. National Institute of Public Health and EnvironmentalProtection, Bilthoven, pp. 1–28.
Bowden, R.D., Steudler, P.A., Melillo, J.M., Aber, J.D., 1990. Annual nitrousoxide fluxes from temperate forest soils in the Northeastern. J. Geophys.Res. 95, 13997–14005.
Cardoso, A.N., Saminêz, T.C., Vargas, M.A., 2001. Fluxo de Gases-traço deEfeito Estufa na Interface Solo/ Atmosfera em Solos de Cerrado. Boletim dePesquisa e Desenvolvimento, EMBRAPA. 23 p.
Choudhary, M.A., Akramkhanov, A., Saggar, S., 2002. Nitrous oxide emissionsin New Zealand cropped soils: Tillage effects, spatial and seasonalvariability. Agr. Ecosyst. Environ. 93, 33–43.
Crill, P.M., Keller, M., Weitz, A., Grauel, B., Veldkamp, E., 2000. Intensive fieldmeasurements of nitrous oxide emissions from a tropical agricultural soil.Global Biogeochem. Cycl. 14, 85–95.
Davidson, E.A., Bustamante, M.M.C., de Siqueira Pinto, A., 2001. Emissions ofnitrous oxide from soils of native and exotic ecosystems of the Amazon andCerrado regions of Brazil. In Optimizing Nitrogen Management in Food andEnergy Production and Environmental Protection: Proceedings of the 2ndInternational Nitrogen Conference on Science and Policy. The ScientificWorld, 1(S2), pp. 312–319.
Davidson, E.A., Keller, M., Erickson, H.E., Verchot, L.V., Veldkamp, E., 2000.Testing a conceptual model of soil emissions of nitrous and nitric oxides.BioScience. 50, 667–680.
Davidson, E.A., Matson, P.A., Brooks, P.D., 1996. Nitrous oxide emissioncontrols and inorganic nitrogen dynamics in fertilized tropical agriculturalsoils. Soil Sci. Soc. Am. J. 60, 1145–1152.
Del Grosso, S.J., Parton, W.J., Mosier, A.R., Ojima, D.S., Potter, C.S., Borken,W., Brumme, R., Butterbach-Bahl, K., Crill, P.M., Dobbie, K., Smith, K.A.,2000. General CH4 Oxidation Model and Comparisons of CH4 Oxidation inNatural and Managed Systems. Global Biogeochem. Cycles 14, 999–1019.
Dick, J., Skiba, U., Wilson, J., 2001. The effect on rainfall on NO and N2Oemissions from Ugandan agroforest soils. Phyton. Ann. Rei Bot. 41, 73–80.
Elmi, A.A., Madramootoo, C., Hamel, C., Liu, A., 2003. Denitrification andnitrous oxide to nitrous oxide plus dinitrogen ratios in the soil profile underthree tillage systems. Biol. Fert. Soils 38, 340–348.
Flessa, H., Ruser, R., 2002. N2O and CH4 fluxes in potatoe fields: automatedmeasurement, management effects and temporal variations. Geoderma 105(3–4), 307–325.
Garcia-Montiel, D.C., Steudler, P.A., Piccolo, M.C., Melillo, J.M., Neill, C., Cerri,C.C., 2001. Controls on soil nitrogen oxide emissions from forest and pasturesin the Brazilian Amazon. Global Biogeochem. Cycl. 15, 1021–1031.
Garcia-Montiel, D.C., Melillo, J.M., Steudler, P.A., Cerri, C.C., Piccolo, M.C.,2003. Carbon limitations to nitrous oxide emissions in a humid tropicalforest of the Brazilian Amazon. Biol. Fert. Soils 38, 267–272.
Granli, T., Bockman, O.C., 1995. Nitrous oxide (N2O) emissions from soils inwarm climates. Fert. Res. 42, 159–163.
Holtgrieve, G.W., Jewett, P.K., Matson, P.A., 2006. Variations in soil N cyclingand trace gas emissions in wet tropical forests. Oecologia 146, 584–594.
IPCC 2001. Third Assessment Report: Climate Change: Synthesis Report Watson,R.T. and the Core Writing Team (Eds.) IPCC, Geneva, Switzerland. pp 184.
ISSS Working Group R.B., 1998. World reference base for soil resources:Introduction, In: Deckers, J.A., Nachtergaele, F.O., Spaargaren, O.C. (Eds.),International Society of Soil Science (ISSS), first ed. ISRIC-FAO-ISSS-Acco, Leuven.
Keller, M., Reiners, W.A., 1994. Soil–atmosphere exchange of nitrous oxide,nitric oxide, and methane under secondary succession of pasture to forest inthe Atlantic lowlands of Costa Rica. Global Biogeochem. Cycl. 8, 399–409.
Keller, M., Kaplan, W.A., Wofsy, S.C., 1986. Emissions of N2O, CH4, and CO2
from tropical forest soils. J. Geophys. Res. 91, 11,791–11,802.Keller, M., Mitre, M.E., Stallard, R.F., 1990. Consumption of atmospheric
methane in soils of central Panama: effects of agricultural development.Global Biogeochem. Cycl. 4, 21–27.
Khalil, M.I., Baggs, E.M., 2005. CH4 oxidation and N2O emissions at varied soilwater-filled pore spaces and headspace CH4 concentrations. Soil Biol.Biochem. 37, 1785–1794.
Levine, J.S., Winstead, E.L., Parsons, D.A.B., Scholes, M.C., Scholes, R.J.,Cofer, W.R., Cahoon, D.R., Sebacher, D.I., 1996. Biogenic soil emissionsof nitric oxide (NO) and nitrous oxide (N2O) from savannas in SouthAfrica: the impact of wetting and burning. J. Geophys. Res. 101,23689–23697.
Linn, D.M., Doran, J.W., 1984. Effect of water-filled pore space on carbondioxide and nitrous oxide production in tilled and non-tilled soils. Soil Sci.Soc. Am. J. 48, 1267–1272.
Matson, P., Billow, C., Zachariassen, J., 1996. Fertilization practices and soilvariations control nitrogen oxide emissions from tropical sugar cane.J. Geophys. Res. 101, 18533–18545.
Matson, P.A., Vitousek, P.M., 1990. Ecosystem approach to a global nitrousoxide budget. BioScience 40, 667–672.
Matson, P.A., Naylor, R., Ortz-Monasterio, I., 1998. Integration of environ-mental, agronomic, and economic aspects of fertilizer management. Science280, 112–115.
Matson, P.A., Vitousek, P.M., Schimel, D.S., 1989. Regional extrapolation of tracegas flux based on soils and ecosystems. In: Andreae,M.O., Schimel, D.S. (Eds.),Exchange of Trace Gases Between Terrestrial Ecosystems and the Atmosphere.Wiley, New York, pp. 97–108.
McGarity, J.W., 1961. Denitrification studies on some South Australian soils.Plant Soil 14, 1–21.
Metay, A., 2005. Séquestration de carbone et flux de gaz à effet de serre -Comparaison entre semis direct et système conventionnel dans les Cerradosbrésiliens. Thèse de l’Institut National Agronomique Paris-Grignonsoutenue le 8 novembre 2005. Paris, 231 p.
Metay, A., Bernoux, M., Boyer, T., Douzet, J.M., Feigl, B., Feller, C., Maraux,F., Oliver, R., 2007. Storage and forms of organic carbon in a no-tillageunder cover crops system on clayey Oxisol in dryland rice production(Cerrados, Brazil). Soil Till Res. 94, 122–132 (INA P-G).
Mosier, A., Kroeze, C., Nevison, C., Oenema, O., Seitzinger, S., van Cleemput,O., 1998. Closing the global N2O budget: nitrous oxide emissions throughthe agricultural nitrogen cycle. OECD/IPCC/IEA phase II development ofIPCC guidelines for national greenhouse gas inventory methodology.Nutrient Cycling Agroecosyst. 52, 225–248.
Mosier, A.R., Delgado, J.A., 1997. Methane and nitrous oxide fluxes ingrasslands in western Puerto Rico. Chemosphere 35, 2059–2082.
Mosier, A.R., 1989. Chamber and isotope techniques. In: Andreae, M.O.,Schimel, D.S. (Eds.), Exchange of Trace Gases Between TerrestrialEcosystems and The Atmosphere. Wiley, Chichester, pp. 175–187.
Mosier, A.R., Duxbury, J.M., Freney, J.R., Heinemeyer, O., Minami, K., 1996.Nitrous oxide emissions from agricultural fields: assessment, measurementand mitigation. Plant Soil 181, 95–108.
Mummey, D.L., Smith, L.J., Bluhm, G., 1998. Assessment of alternative soilmanagement practices on N2O emissions from US agriculture. Agr. Ecosys.Environ. 70, 79–87.
A.D. Nobre, 1994. Nitrous oxide emissions from tropical soils. Ph.D.dissertation, University of New Hampshire, New Hampshire.
Panek, J.A., Matson, P.A., Ortíz-Monasterio, I., Brooks, P., 2000. Distinguishingnitrification and denitrification sources of N2O in a Mexican wheat systemusing 15N. Ecol. Appl. 10, 506–514.
Pereira, J., 1982. Nutrient cycling in South American savannas. Plant Soil 67,293–304.
Pinto, A., Bustamante, M., Kisselle, K., Burke, R., Zepp, R., Viana, L., Varella,R., Molina, M., 2002. Soil emissions of N2O, NO, and CO2 in soils ofBrazilian savannas: effects of vegetation type, seasonality and prescribedfires. J. Geophys. Res. 107, 8089. doi: 10.1029/2001JD000342.
Rochette, P., Angers, D.A., Belanger, G., Chantigny, M.H., Prevost, D.,Levesque, G., 2004. Emissions of N2O from alfalfa and soybean crops inEastern Canada. Soil Sci. Soc. Am. J. 68, 493–506.

88 A. Metay et al. / Geoderma 141 (2007) 78–88
Saggar, S., Andrew, R.M., Tate, K.R., Rodda, N.J., Hedley, C.B., Townsend, J.A.,2002. Measurements and modelling of nitrous oxide emissions from dairypastures. In: Currie, L.D., Loganathan, P. (Eds.), ‘Proceedings of the workshopon Dairy Farm Soil Management’. Massey University, Palmerston North, pp.201–214.
Saggar, S., Hedley, C.B., Giltrap, D.L., Tate, K., Lambie, S., Li, C., 2004.Nitrous oxide from grazed pastures. Supersoil 2004: 3rd Australian NewZealand Soils Conferences, 5–9 December 2004. University of Sydney,Australia.
Saminêz, T.C.O., 1999. Efeito do sistema de cultivo, tensão de água, biomassamicrobiana e temperatura do solo nos fluxos de CH4 e N2O em solos deCerrados. MSc. Thesis, Universidade de Brasília, Brasília.
Sanhueza, E., Hao, W., Scharffe, D., Donoso, L., Crutzen, P., 1990. N2O and NOemissions from soils of the northern part of the Guayana Schield, Venezuela.J. Geophys. Res. 95, 22481–22488.
Schweizer, M., 2000. Variability of factors affecting greenhouse gas fluxes(CO2, N2O and CH4) on a dark red latossol cultivated with sugarcane(Brazil, Sao Paulo State). ETH diploma work. Piracicaba, Brazil, ETH: 36.
Six, J., Feller, C., Denef, K., Ogle, S.M., Sa, J.C.M., Albrecht, A., 2002. Soilorganic matter, biota and aggregation in temperate and tropical soils: effectof no-tillage. Agronomie 22, 755–775.
Smith, K.A., Ball, T., Conen, F., Dobbie, K.E., Massheder, J., Rey, A., 2003.Exchange of greenhouse gasesbetween soil and atmosphere: interactions ofsoil physical factors and biological processes. Eur. J. Soil Sci. 54, 779–791.
Steudler, P.A., 1989. Influence of nitrogen-fertilization on methane uptake intemperate forest soils. Nature 341, 314.
Steudler, P.A., Garcia-Montiel, D.C., Piccolo, M.C., Neill, C., Melillo, J.M.,Feigl, B.J., Cerri, C.C., 2002. Trace gas responses of tropical forest andpasture soils to N and P fertilization. Global Biogeochem. Cycl 16 (7), 1–12.DOI 10.1029/2001 GB001394.
Steudler, P.A., Jones, R.D., Castro, M.S., Melillo, J.M., Lewis, D.L., 1996.Microbial controls on methane oxidation in temperate forest andAgricultural Soils. In: Murrell, J.C., Kelly, P. (Eds.), Microbiology ofAtmospheric Trace Gases. . NATO ASI Series, vol. I39. Springer-Verlag,Berlin Heidelberg, pp. 69–84.
Veldkamp, E., Keller, M., 1997. Nitrogen oxide emissions from a bananaplantation in the humid tropics. J. Geophys. Res. 102, 15889–15898.
Veldkamp, E., Keller, M., Nuñez, M., 1998. Effects of pasture management onN2O and NO emissions from soils in the humid tropics of Costa Rica. GlobalBiogeochem. Cycl. 12, 71–79.
Verchot, L.V., Davidson, E.A., Cattânio, J.H., Ackerman, I.L., 2000. Land-usechange and biogeochemical controls of methane fluxes in soils of easternAmazonia. Ecosystems 3, 41–56.
Verchot, L.V., Davidson, E.A., Cattanio, J.H., Ackerman, I.L., Erickson, H.E.,Keller, M., 1999. Land use change and biogeochemical controls of nitrogenoxide emissions from soils in eastern Amazonia. Global Biogeochem Cycl.13, 31–46.
Weier, K.L., 1999. N2O and CH4 emission and CH4 consumption in a sugarcanesoil after variation in nitrogen and water application. Soil Biol. Biochem. 31,1931–1941.
Weitz, A.M., Linder, E., Frolking, S., Crill, P.M., Keller, M., 2001. N2Oemissions from humid tropical agricultural soils: effects of soil moisture,texture and nitrogen availability. Soil Biol. Biochem. 33, 1077–1093.
Yamulki, S., Jarvis, S.C., 2002. Short-term effects of tillage and compaction onnitrous oxide, nitric oxide, nitrogen dioxide, methane and carbon dioxidefluxes from grassland. Biol. Fert. Soils 36, 224–231.