Mzimvubu Summary Report
72
-
Upload
khangminh22 -
Category
Documents
-
view
0 -
download
0
Transcript of Mzimvubu Summary Report


DWA WATER RESOURCE STUDY IN SUPPORT OF THE
ASGISA-EC MZIMVUBU DEVELOPMENT PROJECT
LIST OF STUDY REPORTS
REPORT DWA report number
Summary Report P WMA 12/000/00/3609
Existing water supply infrastructure assessment P WMA 12/000/00/3609 Volume 1 of 5
Agricultural assessment and irrigation water use P WMA 12/000/00/3609 Volume 2 of 5
Groundwater assessment P WMA 12/000/00/3609 Volume 3 of 5
Water resources assessment P WMA 12/000/00/3609 Volume 4 of 5
Assessment of potential for pumped storage and hydropower schemes P WMA 12/000/00/3609 Volume 5 of 5
Rainwater Harvesting P WMA 12/000/00/3609
An assessment of rain-fed crop production potential in South Africa's neighboring countries
P RSA 000/00/12510


DWA WATER RESOURCE STUDY IN SUPPORT OF THE
ASGISA-EC MZIMVUBU DEVELOPMENT PROJECT
SUMMARY REPORT
EXECUTIVE SUMMARY
Introduction
In 2006 the DWA Directorate: National Water Resource Planning appointed BKS to assist in the
provision of water-related support to the Eastern Cape Provincial Government (later AsgiSA-EC
after its establishment). The main component of the task was to direct water resource planning
inputs to specific development projects, for example an irrigation project, that AsgiSA-EC may
identify and want to pursue as a poverty alleviation project. As a secondary component the
DWA undertook to provide some general water resource information which could facilitate the
identification of other potentially viable projects by AsgiSA-EC.
Water Resources Assessment
Rainfall ranges from above 1 000 mm at the coast and against the mountainous Drakensberg,
to between 700 and 800 mm in the upper plateau region. Annual evaporation ranges from
1 150 mm at the coast to 1 400 mm inland. The total streamflow for the Mzimvubu River
catchment as given in the WR2005 report is 2 613 million m3/a.
Maps that were produced as part of the groundwater task are not a quantitive reflection of
actual groundwater potential or availability, but are intended to give an indication of the change
in groundwater potential across the catchment. A generalised conclusion can be made that
groundwater potential, based on allocatable volumes and preliminary Reserve estimates,
increases towards the east of the Mzimvubu River catchment.
Preliminary indications are that none of the quaternary catchments are currently stressed and
allocatable groundwater volumes are significant, resulting in groundwater being a feasible water
source in most of the quaternary catchments in the study area. Based on the preliminary
assessment of available groundwater and the indication that sufficient potential exists, water
supply to thousands of people in the numerous villages and towns occurring throughout the
catchment, will have to consider groundwater development as a sole or supplementary water
supply solution.
Sediment yields in the Mzimvubu River have been estimated according to catchment size and
sediment yield potential based on the latest sediment yield maps. The reduction in storage in
the dams was taken into account when the water availability (yield) from the dams were
calculated.
Summary Report Final
November 2010
ii
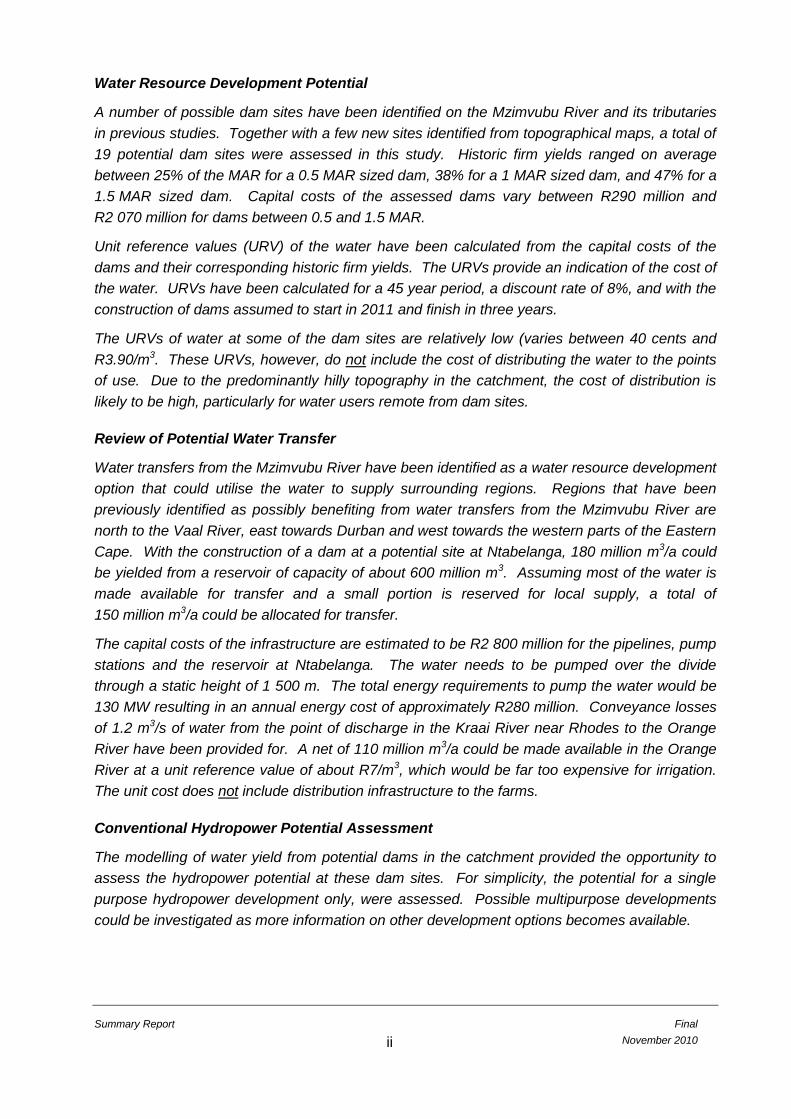
Water Resource Development Potential
A number of possible dam sites have been identified on the Mzimvubu River and its tributaries
in previous studies. Together with a few new sites identified from topographical maps, a total of
19 potential dam sites were assessed in this study. Historic firm yields ranged on average
between 25% of the MAR for a 0.5 MAR sized dam, 38% for a 1 MAR sized dam, and 47% for a
1.5 MAR sized dam. Capital costs of the assessed dams vary between R290 million and
R2 070 million for dams between 0.5 and 1.5 MAR.
Unit reference values (URV) of the water have been calculated from the capital costs of the
dams and their corresponding historic firm yields. The URVs provide an indication of the cost of
the water. URVs have been calculated for a 45 year period, a discount rate of 8%, and with the
construction of dams assumed to start in 2011 and finish in three years.
The URVs of water at some of the dam sites are relatively low (varies between 40 cents and
R3.90/m3. These URVs, however, do not include the cost of distributing the water to the points
of use. Due to the predominantly hilly topography in the catchment, the cost of distribution is
likely to be high, particularly for water users remote from dam sites.
Review of Potential Water Transfer
Water transfers from the Mzimvubu River have been identified as a water resource development
option that could utilise the water to supply surrounding regions. Regions that have been
previously identified as possibly benefiting from water transfers from the Mzimvubu River are
north to the Vaal River, east towards Durban and west towards the western parts of the Eastern
Cape. With the construction of a dam at a potential site at Ntabelanga, 180 million m3/a could
be yielded from a reservoir of capacity of about 600 million m3. Assuming most of the water is
made available for transfer and a small portion is reserved for local supply, a total of
150 million m3/a could be allocated for transfer.
The capital costs of the infrastructure are estimated to be R2 800 million for the pipelines, pump
stations and the reservoir at Ntabelanga. The water needs to be pumped over the divide
through a static height of 1 500 m. The total energy requirements to pump the water would be
130 MW resulting in an annual energy cost of approximately R280 million. Conveyance losses
of 1.2 m3/s of water from the point of discharge in the Kraai River near Rhodes to the Orange
River have been provided for. A net of 110 million m3/a could be made available in the Orange
River at a unit reference value of about R7/m3, which would be far too expensive for irrigation.
The unit cost does not include distribution infrastructure to the farms.
Conventional Hydropower Potential Assessment
The modelling of water yield from potential dams in the catchment provided the opportunity to
assess the hydropower potential at these dam sites. For simplicity, the potential for a single
purpose hydropower development only, were assessed. Possible multipurpose developments
could be investigated as more information on other development options becomes available.

Summary Report Final
November 2010
iii
The generation of hydropower was simulated with the Water Resources Yield Model (WRYM).
The firm hydropower available at a 99.5% assurance of supply for each potential dam site was
determined. The results are average monthly hydropower available and are presented as
mega-watt continuous (MWC), which is analogous to base load-power. This can be converted
for load factor. A load factor of say 10% was assumed to be indicative of peaking power.
Base load power generation is not viable at current electricity tariffs as a single-purpose
development. Peaking power is only marginal as a single-purpose development. Power
generation at a potential dam site may be considered if part of a multipurpose development, and
for local power supply.
Pumped Storage Schemes Assessment
Although both pumped storage and conventional hydropower schemes use water-driven
turbines for the generation of power, there is a fundamental difference between the schemes
with respect to the primary source of energy used. For conventional hydropower, power is
generated from harnessing the energy in the streamflow, which is a source of renewable
energy. Pumped storage schemes in contrast use the excess energy generated by other
sources to pump water to a higher elevation during off-peak periods, from where the water is
released for the generation of power during peak demand periods, much like a huge battery.
Once the initial filling (priming) of the reservoirs of a pumped storage scheme has been
complete, pumped storage schemes are essentially closed systems, apart from replacing
evaporative and seepage losses, and are independent of river flows.
Assessment of the Ecological Water Requirements
The ecological water requirements (EWR) were determined for the Mzimvubu River catchment
to investigate various development options, including several large dams. This was mainly
done on a desktop level and where available with results from previous rapid Reserve studies
using the Desktop Reserve Model and the updated hydrology supplied by the study team. EWR
has a big impact on the available yield from the dams that were assessed. The EWR as a
percentage of the MAR ranges between 13% and 44%, while the percentage reduction in yield
by the EWR ranges between 18% and up to 63% (average 32%) for a 0.5 MAR sized dam,
between 19% and 47% (average 30%) for a 1 MAR sized dam, and between 17% and 40%
(average 26%) for a 1.5 MAR sized dam.
Assessment of Future Irrigation Potential
The climate of all the agro-ecological zones in the catchment is not suitable for large, capital
intensive irrigation schemes. Generally temperatures are too low (frost is common in winter)
and rainfall is too high to justify such developments. Large irrigation schemes are usually found
in frost-free regions with a temperature regime that is suitable for high value perennial crops or
out-of-season winter production of high value annual crops such as vegetables grown on a
commercial scale. Excessive rainfall on an irrigation scheme can be disruptive to production
practices and can adversely affect crop quality, particularly during harvesting time.

Summary Report Final
November 2010
iv
The likely returns from relatively low-value irrigated crops will in most cases be inadequate to
cover the cost of expensive irrigation water and not be able to provide the growers with a
reasonable “take-home” income.
The topography is characterized by steep incised river valleys where irrigable soils are restricted
mainly to “pockets” of alluvial soils along the main rivers where flooding is an ever-present
threat. These “pockets” of alluvial soils have a high irrigation potential from a climatic and soils
perspective, but significant irrigation development will be limited without the river-flow regulating
effect of expensive large dams upstream of these areas. Furthermore most of the irrigable
areas are largely inaccessible and in general infrastructure is limited
Most land in the study area falls under the communal land tenure system in terms of which the
Tribal Authority allocates the right to use or occupy land. A “permission to occupy (PTO)”
certificate is the official “deed of occupation”. Despite this system being widely accepted by
local communities, it is recognised as one of the most significant constraints to agricultural
development in the region. Without freehold title (or at least a long-lease form of land tenure) it
is very difficult for any commercial enterprise, especially with expensive irrigation equipment, to
be established and developed in a sustainable way.
The communal land tenure system poses special challenges to irrigation development. The
issue of who owns the irrigation infrastructure of a scheme and who is responsible for it‟s
maintenance and repair and the inability to offer land as a security for “on-farm” irrigation
infrastructure and operating loans will always be a constraint to irrigation development. This
land-tenure limitation has been shown to be a major contributor to the failure of many small-
holder irrigation schemes and other agricultural development initiatives in South Africa in the
past. Every effort should be made to address this important issue on new development
projects.
Assessment of Potential Future Forestry Development
Forestry has great potential as a development driver in the Eastern Cape, and is potentially one
of the most effective users of water in the Mzimvubu River catchment. The DWA is responsible
for forestry regulation, but at the same time is expected to facilitate an increase in plantation
area by 100 000 hectares in support of the Forestry Sector Transformation Charter. The
“afforestation” task in this study was therefore aimed at assessing the impact that forestry
currently has on the water balance, and at determining what further development potential
should be considered for water use licensing.
The licensing of forestry water use is a complex cooperative governance affair, requiring that
development should not negatively impact on water, biodiversity, or agricultural potential, and
that it should have positive social outcomes. A key issue in the Mzimvubu River catchment was
to reconcile forestry development with its potential impact on the ecological Reserve, with
licence applications for 20 000 ha of plantation requiring decisions.
Biodiversity value was reassessed and found to be of less concern than previously thought, this
in part because so much of the land has already been cultivated at some stage. A close
examination of suitable and available land revealed that the biggest constraint is probably the

Summary Report Final
November 2010
v
potential for conflict with agricultural planning. Forestry targets can be met from a water
resource perspective, but this will require a negotiated land use plan with a mix of cropland and
forestry development.
Rainwater Harvesting
Rainwater harvesting presents an attractive option for households in remote villages or areas
with limited access to water supply infrastructure. The cost of operation and maintenance of a
household rainwater tank is minimal indeed, therefore a once-off capital investment by the state
to install a tank can provide a poor family with a high degree of water security and independent
responsibility. In this context, rainwater harvesting also enables year round production of fruit
and vegetable crops high in micro-nutrients and therefore key in poor households‟ fight against
child malnutrition, which is rife in the study area.
The high and evenly distributed rainfall in the Mzimvubu River produces good rainwater yields,
but the area has some of the lowest water tariffs in the country. The net present value (NPV) of
cost savings on conjunctive rooftop rainwater harvesting for an urban household in Lusikisiki
turns positive at a water tariff of R3.20/kℓ, while the current tariff is R2.49/kℓ and experiencing
strong upward pressure.
The potential for rainwater harvesting as a water resource was assessed through a desktop
study to provide a preliminary indication of the rainwater techniques that can be used to
augment conventional supplies. The potential for improved rainfed agriculture through
increased infiltration of rainwater into the soil profile is currently central to many agricultural
initiatives across the continent. Many of these techniques apply to the topographical, climate
and social characteristics found in the Mzimvubu area.
The characteristics of collection surfaces greatly impact rainwater harvesting potential. Good
quality roofing is beneficial for collection of drinking quality water, while thatch and uneven and
rusted roof sheeting presents a limitation. In the landscape, grass cover is often maintained
year round in parts of the catchment, thanks to the relatively even distribution of rainfall across
seasons, which reduces the surface runoff potential but is an important erosion barrier.
It is recommended that rainwater harvesting for the built environment, cultivated areas and
uncultivated areas in the study area should be analysed as a standard component of water
supply options for all economic development options and municipal water supply requirements.
The area is characterised by widespread poverty and a paucity of infrastructure which
complicates the provision of services and economic opportunities. Therefore the potential
demand is high for independent and low maintenance household solutions to improve water,
food and energy security, which can include suitable rainwater harvesting and renewable
energy solutions.
Rainwater harvesting is currently economically viable for specific situations. Viability of a
greater range of applications, techniques and locations is likely to improve over time as tariffs
for alternative supplies are set to increase, and the cost of construction is expected to decrease
as technology thereof improves.

Summary Report Final
November 2010
vi
In the light of evolving climate change mitigation mechanisms it is worthwhile to seek ways in
which Payment for Ecosystem Services could help pay for implementation, thereby improving
the prospects for more affordable and sustainable job creation programmes in environmental
restoration.
Conclusions
There may be considerable potential for water resource development in the catchment.
Such dams could yield considerable quantities of water in the Mzimvubu River
catchment.
The Eastern Cape region has favourable topography and water availability for potential
pumped storage schemes. The findings of this pumped storage scheme assessment
have been discussed with Eskom, who could take it forward for more detailed analyses.
The preparatory work conducted has not been focused on water supply to specific
locations. This is likely to be a significant factor in the planning of future projects due to
the topography of the catchment and population distribution.
The hydropower availability is in the order of between 0.5 and 25 MW continuous power,
or between 5 and 250 MW peaking power at an indicative load factor of 10%. The unit
costs for peaking power scenarios ranged between R15 million and R300 million per
MW installed.
The intention of potential transfer would be to supply water to irrigators in the western
parts of the Eastern Cape through the Orange-Fish Tunnel from Gariep Dam. At around
R7/m3 this water, however, would most likely be far too expensive for irrigation. This
cost does not include distribution infrastructure to the farms. Adding on the distribution
infrastructure will further increase the cost of the water.
Substantial potential exists in the study area for the development of new agricultural
enterprises under rain-fed conditions and for the improvement of existing agricultural
practices and productivity. The paucity of infrastructure in the area, in particular roads
and power, is a major obstacle to any kind of development.
There is no single major forestry area to be found in the Study Area. Areas of suitable
land tend to be relatively small and scattered. Commercial forestry interests today seek
a minimum of 5 000 to 10 000 ha to make up what would be considered to be a „viable
management unit‟. A core forestry area attracting large-scale international investment
would want in the order of 30 000 to 50 000 ha.
Recommendations
Potential dam sites that have shown to be more favourable in this study may be
considered if suitable development scenarios in the region are identified that can make
sustainable use of the water.
An initial focus on the upgrading of rain-fed cultivation and livestock farming can bring

Summary Report Final
November 2010
vii
great gains at moderate investment. Land tenure and some institutional and social
systems will, however, have to be addressed.
If forestry is to happen seriously, it will need to be an integrated development, requiring a
negotiated settlement with agriculture and with communities. The move might best be
towards mixed cropping, with forestry part of the agricultural mix.
It is recommended that rainwater harvesting for the built environment, as well as
cultivated and uncultivated areas in the Mzimvubu Development Zone, should be
analysed as a standard component of water supply options for all economic
development options and municipal water supply requirements.

Summary Report Final
November 2010
i
DWA WATER RESOURCE STUDY IN SUPPORT OF THE
ASGISA-EC MZIMVUBU DEVELOPMENT PROJECT
SUMMARY REPORT
TABLE OF CONTENTS
Page
1 INTRODUCTION .................................................................................................................... 1
1.1 BACKGROUND ............................................................................................................ 1
1.2 STUDY AREA ............................................................................................................... 1
1.3 PURPOSE OF THIS REPORT ...................................................................................... 2
2 WATER RESOURCES ASSESSMENT ................................................................................. 4
2.1 SURFACE WATER ....................................................................................................... 4
2.1.1 Hydrology ......................................................................................................... 4
2.1.2 Rainfall and evaporation ................................................................................... 4
2.1.3 Streamflow ....................................................................................................... 4
2.2 GROUNDWATER ......................................................................................................... 6
2.3 WATER REQUIREMENTS ......................................................................................... 11
2.3.1 Domestic water requirements ......................................................................... 11
2.3.2 Industrial, mining and livestock and wildlife water requirements ..................... 12
2.3.3 Irrigation water requirements .......................................................................... 12
2.3.4 Afforestation water requirements .................................................................... 13
2.3.5 Invasive alien water requirements .................................................................. 14
2.3.6 Ecological water requirements ........................................................................ 15
2.3.7 Summary of water requirements ..................................................................... 15
3 WATER RESOURCE DEVELOPMENT POTENTIAL .......................................................... 16
3.1 POTENTIAL DAMS ASSESSMENT ........................................................................... 16
3.1.1 Potential dam sites ......................................................................................... 16
3.1.2 Yield assessment ........................................................................................... 16
3.1.3 Cost estimates of water .................................................................................. 20
3.2 REVIEW OF POTENTIAL WATER TRANSFER ......................................................... 22
3.3 CONVENTIONAL HYDROPOWER POTENTIAL ASSESSMENT .............................. 24
3.4 PUMPED STORAGE SCHEMES ASSESSMENT ...................................................... 27
4 ASSESSMENT OF THE ECOLOGICAL WATER REQUIREMENTS ................................... 29
4.1 INTRODUCTION ......................................................................................................... 29

Summary Report Final
November 2010
ii
4.2 APPROACH ............................................................................................................... 29
4.3 RESULTS ................................................................................................................... 29
5 ASSESSMENT OF FUTURE IRRIGATION POTENTIAL ..................................................... 31
5.1 CONSTRAINTS AND CHALLENGES TO IRRIGATION DEVELOPMENT ................. 31
5.1.1 Climate ........................................................................................................... 31
5.1.2 Topography .................................................................................................... 31
5.1.3 Present land use ............................................................................................ 31
5.1.4 Land tenure .................................................................................................... 32
5.1.5 Commercial farming experience ..................................................................... 32
5.1.6 Scheme ownership ......................................................................................... 33
5.1.7 Scheme management .................................................................................... 33
5.1.8 Support services ............................................................................................. 33
5.2 IRRIGATION DEVELOPMENT OPPORTUNITIES ..................................................... 34
5.2.1 Communal areas - small irrigation schemes ................................................... 34
5.2.2 Communal areas - Homestead plot irrigation .................................................. 34
5.2.3 Communal areas - Homestead rainwater harvesting schemes ....................... 35
5.2.4 Port St Johns farms ........................................................................................ 36
5.3 ESTIMATED FUTURE IRRIGATION AREA AND WATER USE................................. 36
5.4 KEY SUCCESS FACTORS REQUIRED FOR SUSTAINABLE IRRIGATION DEVELOPMENT ......................................................................................................... 37
5.4.1 Focus on small community-based schemes ................................................... 37
5.4.2 Voluntary participation only ............................................................................. 37
5.4.3 Involvement of participants in all aspects of planning and development ......... 37
5.4.4 Securing of land tenure .................................................................................. 37
5.4.5 Commercialisation of production ..................................................................... 37
5.4.6 Establishment of community-owned institutional structures (ownership and management of schemes) ........................................................................... 38
5.4.7 Support services in place ................................................................................ 38
5.4.8 Low cost of water............................................................................................ 38
5.4.9 Integrated water use from storage facility ....................................................... 38
5.4.10 Undertake viability assessment ...................................................................... 38
6 ASSESSMENT OF POTENTIAL FUTURE FORESTRY DEVELOPMENT .......................... 39
6.1 SCOPE OF THE TASK ............................................................................................... 40
6.1.1 Assess existing afforestation and calculate water use .................................... 40
6.1.2 Improve afforestation suitability maps ............................................................. 41
6.2 OUTCOMES ............................................................................................................... 41

Summary Report Final
November 2010
iii
6.2.1 Hydrology ....................................................................................................... 41
6.2.2 Reserves ........................................................................................................ 43
6.2.3 Agriculture ...................................................................................................... 46
6.2.4 Biodiversity ..................................................................................................... 46
6.2.5 Planning and mapping .................................................................................... 47
6.2.6 Forestry water use licensing ........................................................................... 47
6.2.7 Catchment restoration .................................................................................... 48
6.3 FINDINGS AND RECOMMENDED ACTIONS FOR AFFORESTATION DEVELOPMENT ......................................................................................................... 48
6.3.1 Findings .......................................................................................................... 49
6.3.2 Answers still required ..................................................................................... 50
6.3.3 Next steps ...................................................................................................... 50
6.4 HANDING OVER RESPONSIBILITIES....................................................................... 51
7 RAINWATER HARVESTING ............................................................................................... 52
7.1 INTRODUCTION ......................................................................................................... 52
7.2 NATURAL RESOURCES FOR RAINWATER HARVESTING .................................... 53
7.3 APPLICABILITY OF RAINWATER HARVESTING IN DIFFERENT SOCIO-ECONOMIC CONTEXTS ............................................................................................ 53
7.4 ECONOMIC VIABILITY OF RAINWATER HARVESTING .......................................... 54
7.5 PRESENT IMPLEMENTATION OF RAINWATER HARVESTING .............................. 54
7.6 DEVELOPMENT POTENTIAL FOR RAINWATER HARVESTING ............................. 55
7.7 CONCLUSIONS .......................................................................................................... 55
8 CROP PRODUCTION POTENTIAL IN SA NEIGHBORING COUNTRIES........................... 56
9 CONCLUSIONS ................................................................................................................... 57
10 RECOMMENDATIONS ........................................................................................................ 58
11 REFERENCES ..................................................................................................................... 59

Summary Report Final
November 2010
1
1 INTRODUCTION
1.1 BACKGROUND
The Mzimvubu River area in the Eastern Cape Province is one of the poorest and least
developed parts of South Africa. Development of the area, with the express purpose of
accelerating the social and economic upliftment of the people in the region, was
therefore identified as one of the priority initiatives of the Eastern Cape Provincial
Government. The Mzimvubu Development Project was consequently identified as a
Presidential Icon Project and has been accepted as such by the National Government.
Harnessing the water resources of the Mzimvubu River, the only major river in the
country which is still largely unutilised, was considered by the Eastern Cape
Government as offering one of the best opportunities in the province to achieve such
development. In 2007, they therefore established a special-purpose vehicle (SPV) in
terms of the Companies Act, the so-called AsgiSA-Eastern Cape (Pty) Ltd (AsgiSA-
EC), to initiate planning and to facilitate and drive the development.
The five pillars on which the EC Provincial Government and AsgiSA-EC proposed to
build the Mzimvubu Development Project are:
Afforestation;
Irrigation;
Hydropower;
Water transfer; and
Tourism.
In 2006 the DWAF Directorate: National Water Resource Planning appointed BKS to
assist in the provision of water-related support to the Eastern Cape Provincial
Government (later AsgiSA-EC after its establishment). The main component of the
task was supposed to be direct water resource planning inputs to specific development
projects, for example an irrigation project, that AsgiSA-EC may identify and want to
pursue as a poverty alleviation project. As a secondary component the DWAF
undertook to provide some general water resource information which could facilitate
the identification of other potentially viable projects by AsgiSA-EC. Work in this regard
commenced in December 2006.
1.2 STUDY AREA
AsgiSA-EC is focused on upliftment in a larger area, the “Mzimvubu Development
Zone”, which covers not only the Mzimvubu River catchment, but also neighbouring
areas such as the Pondoland area to the north-east and parts of the Mthatha River
catchment to the south-west.

Summary Report Final
November 2010
2
Some tasks, such as the irrigation assessment and ecological water requirements,
were conducted for the Mzimvubu Development Zone and included the Pondoland and
parts of the Mthatha River catchment
The Mzimvubu River catchment study area and the Mzimvubu Development Zone are
presented graphically in Figure 1.1, and fall under the OR Tambo, Alfred Nzo, Sisonke
and Ukhahlamba District Municipalities.
1.3 PURPOSE OF THIS REPORT
The purpose of this document is to summarise the work executed for this project. The
main tasks executed include:
Updating and refining the broad assessment of the surface water resources of
the Mzimvubu River;
Groundwater assessment;
Assessment of environmental water requirements;
Broad assessment of the irrigation potential in the Mzimvubu River catchment;
Documentation of existing forestry developments and assistance with the
assessment of further potential, which impact on the catchment hydrology;
A first level assessment of possible dams;
Indicative assessment of conventional hydropower potential;
Identification of sites for possible pumped storage hydropower developments;
Review of the previously identified potential for possible bulk transfer of water
out of the catchment;
Rainwater harvesting; and
Marginal cost of water.
The following stand-alone reports were prepared:
Existing water supply infrastructure assessment;
Agricultural assessment and irrigation water use;
Groundwater assessment;
Water resources assessment;
Assessment of potential for pumped storage and hydropower schemes; and
Rainwater harvesting.
An afforestation task was added at a later stage. The full description is give in
Chapter 6, as no stand-alone report was compiled. The support for this task was
mainly coordination of specialists‟ inputs with support to the DWA Regional Office in
Cradock.

Summary Report Final
November 2010
3
Figure 1.1 Mzimvubu River study area

Summary Report Final
November 2010
4
2 WATER RESOURCES ASSESSMENT
This task is addressed in a stand-alone report (P WMA 12/000/00/3609 Volume 4 of 5)
entitled Water resources assessment, where the full details can be found. A
summary of this is included in the rest of this section.
2.1 SURFACE WATER
2.1.1 Hydrology
The hydrology for the Mzimvubu River system was updated as part of the Water
Resources 2005 Study (WR2005).
2.1.2 Rainfall and evaporation
Rainfall in the catchment is significantly higher than the South African average.
Rainfall ranges from above 1 000 mm at the coast and against the mountainous
Drakensberg, to between 700 and 800 mm in the upper plateau region.
Annual evaporation ranges from 1 150 mm at the coast to 1 400 mm inland.
2.1.3 Streamflow
The natural (virgin) streamflows for the Mzimvubu River and all its tributaries were
updated as part of the hydrology assessment of the WR2005 study. These naturalised
streamflows were assumed to be the best available streamflow data to be used for the
water balance and yield modelling for the Mzimvubu catchment.
The total streamflow for the Mzimvubu River catchment as given in the WR2005 report
is 2 613 million m3/a. This is a decrease of the total naturalised mean annual runoff
(MAR) from the Water Resources 1990 (WR90) study of 219 million m3/a (from
2 832 million m3/a). This decrease is likely due to the extended record period of the
WR2005 study. The rainfall, evaporation and streamflow are presented in Table 2.1.
Table 2.1 Rainfall, evaporation and streamflow: Mzimvubu River catchment
Quaternary catchment MAP (mm) MAE (mm) MAR (million m3/a)
T31A 907 1 350 32.7
T31B 833 1 350 31.3
T31C 830 1 350 31.9
T31D 736 1 350 25.0
T31E 756 1 350 39.9
T31F 713 1 350 37.0
T31G 801 1 300 20.2
T31H 808 1 300 64.8
T31J 807 1 300 52.8
T32A 804 1 300 30.5

Summary Report Final
November 2010
5
Quaternary catchment MAP (mm) MAE (mm) MAR (million m3/a)
T32B 814 1 250 30.8
T32C 781 1 200 35.5
T32D 789 1 250 32.9
T32E 844 1 200 47.6
T32F 924 1 200 48.4
T32G 862 1 200 57.2
T32H 892 1 200 66.0
T33A 757 1 350 97.4
T33B 801 1 400 94.3
T33C 768 1 400 51.5
T33D 736 1 350 61.0
T33E 748 1 350 20.5
T33F 829 1 350 51.9
T33G 835 1 300 60.9
T33H 780 1 250 46.1
T33J 730 1 200 35.6
T33K 856 1 200 22.4
T34A 905 1 400 41.1
T34B 860 1 400 35.9
T34C 807 1 400 33.9
T34D 850 1 350 52.2
T34E 901 1 400 45.2
T34F 875 1 350 39.5
T34G 894 1 350 57.7
T34H 863 1 300 91.3
T34J 771 1 250 27.3
T34K 715 1 200 25.9
T35A 912 1 400 92.4
T35B 915 1 400 78.1
T35C 1 008 1 400 86.8
T35D 818 1 350 52.9
T35E 918 1 350 102.9
T35F 860 1 400 58.2
T35G 759 1 400 64.0
T35H 845 1 350 84.6
T35J 924 1 300 40.3
T35K 783 1 300 86.1
T35L 764 1 250 29.0
T35M 861 1 200 42.3
T36A 930 1 200 65.2
T36B 1 029 1 150 55.2

Summary Report Final
November 2010
6
2.2 GROUNDWATER
Africa Geo-Environmental Services (Pty) Ltd (AGES) was appointed as part of the
project team for geohydrological inputs during the execution of the study. It was stated
at the onset of the project that the investigation of water resources will be restricted to
the Mzimvubu River catchment.
This task is addressed in a stand-alone report (P WMA 12/000/00/3609 Volume 3 of 5)
entitled Groundwater assessment, in Chapter 5, where the full details can be found.
A summary of this is included in the rest of this section.
The following tasks were included in the preliminary groundwater assessment:
Information sourcing;
Data sourcing;
Data processing;
Inception Phase; and
Preliminary groundwater potential assessment:
o Groundwater assessment based on available data; and
o Groundwater assessment based on GRDM outputs.
Outputs generated for the purpose of the preliminary groundwater assessment
approach of the study focussed mainly on the following to get a regional comparative
indication of broad groundwater potential between quaternary catchments in the study
area:
Allocatable groundwater per quaternary catchment;
Reserve as a percentage of recharge; and
Stress Index as defined by the GRDM.
Groundwater potential assessments and aquifer types occurring in the study area must
be viewed in the light of the type of dolerite intrusion, as well as the geological
formation present. This needs to be combined with a future regional water balance and
groundwater Reserve figures before groundwater availability and potential can be
accurately defined.
The following groundwater occurrences can be described for the study area:
Aquifers associated with dolerite intrusion;
Aquifers associated with fracturing unrelated to dolerite intrusion; and
Intergranular aquifers.
Groundwater quality data is insufficient to delineate potential based on expected water
classes. It was stated that the water resources of the Mzimvubu River catchment need
to be considered during the investigation of the various proposed development options
and depending on the impact of the development and the present state of the water
resource. Two borehole information data sets were used to obtain additional desktop
information on the project area and to confirm the findings of the investigation. These

Summary Report Final
November 2010
7
data-sets are known as the National Groundwater Data Base (NGDB) and the DWAF
initiated, Groundwater Resource Information Project (GRIP) data set.
It is crucial to note that the brief was to indicate, on a preliminary assessment basis, the
differences in groundwater potential between the quaternary catchments within the
Mzimvubu River catchment. Maps produced are therefore not a quantitive reflection of
actual groundwater potential or availability, but are intended to give the reader an
indication of the change in groundwater potential across the catchment. A generalised
conclusion can be made from the applicable maps that groundwater potential, based
on allocatable volumes and preliminary Reserve estimates, increases towards the east
of the Mzimvubu River catchment. Taking current abstraction volumes and distribution
into account, it is noted, that some of the catchments have a higher groundwater
dependency which will influence allocatable volumes.
The term “Stress Index” must not be misinterpreted as implicating that any of the
quaternary catchments within the Mzimvubu catchment are currently stressed. It
merely indicates differences between different catchments.
Preliminary indications are that none of the quaternary catchments are currently
stressed and allocatable groundwater volumes are significant, resulting in groundwater
being a feasible water source in most of the quaternary catchments in the study area.
Based on the preliminarily assessment of available groundwater volumes and the
indication that sufficient potential exists, water supply to thousands of people in the
numerous villages and towns occurring throughout the catchment will have to consider
groundwater development as a sole or supplementary water supply solution.
Provisional estimates of the allocatable groundwater per quaternary catchment are
shown on Figure 2.1.

Summary Report Final
November 2010
8
A map was produced indicating the preliminary groundwater potential at each of the
towns located within the Mzimvubu River catchment. This is a preliminary holistic
approach towards expressing groundwater potential at each town, taking note of
hydrogeological setting, existing groundwater use, borehole yield potential, water
quality and groundwater prominence. The potential, however, does not take into
account what the stress index and allocatable groundwater component in the
applicable quaternary catchments are. It is recommended that this be carried out as
part of the detailed groundwater model that is listed as the most important
recommendation for the next phase of the project. Groundwater potential was
preliminarily defined as Very High at the town of Cedarville and as High at the towns of
Matatiele, Qumbu and Tsolo. Of the remaining 14 towns within the catchment, a total
of 8 were defined as having medium or moderate groundwater potential, while the
remaining 6 towns were defined as having low potential to rely on groundwater as a
sustainable water source for municipal water supply. This preliminary estimate will
however have to be verified through more detailed assessments in the next phase of
the project and in the light of regional water balance calculations. A summary of the
provisional assessments of the groundwater potential for the main towns is given in
Table 2.1.

Summary Report Final
November 2010
9
Figure 2.1 Allocatable groundwater per quaternary catchment (figures in million m3/a)

Summary Report Final
November 2010
10
Table 2.1 Preliminary groundwater potential assessment per town located within the Mzimvubu River catchment
Province District Local Aquifer type Town groundwater Existing Reserve Stress index Allocatable groundwater
Municipality Municipality median yield class potential estimate groundwater use % % (million m3/a)
Alfred Nzo Matatiele MatatieleIntergranular & fractured
0.5 - 2.0 l/sHigh Yes 44 - 53 1.5 - 3.0 4 - 8
Alfred Nzo Umzimvubu Mt FrereIntergranular & fractured
0.5 - 2.0 l/sMedium Yes 53 - 75 0.5 - 1.5 4 - 8
Alfred Nzo Matatiele Cedarvilleintergranular & fractured
2.0 - 5.0 l/sVery high Yes 29 - 36 1.5 - 3.0 13 - 22
Alfred Nzo Umzimvubu Mt AyliffIntergranular & fractured
0.5 - 2.0 l/sLow Yes 53 - 75 3.0 - 4.4 4 - 8
OR Tambo Mhlantlo TsoloIntergranular & fractured
0.5 - 2.0 l/sHigh Yes 75 - 98 0.5 - 1.5 0.6 - 4
OR Tambo Mhlantlo QumbuIntergranular & fractured
0.5 - 2.0 l/sHigh Yes 75 - 98 0.5 - 1.5 0.6 - 4
OR Tambo Ntabamkulu TabankuluIntergranular & fractured
0.5 - 2.0 l/sLow Yes 53 - 75 0.5 - 1.5 4 - 8
OR Tambo Port St Johns Port St JohnsFractured
0.5 - 2.0 l/sLow No 29 - 36 0.5 - 1.5 22 - 30
Ukhahlamba Elundini UgieIntergranular & fractured
0.5 - 2.0 l/sMedium No 53 - 75 0.5 - 1.5 4 - 8
Ukhahlamba Elundini MaclearIntergranular & fractured
0.5 - 2.0 l/sMedium No 53 - 75 0.5 - 1.5 4 - 8
Ukhahlamba Elundini Mt FletcherIntergranular & fractured
0.5 - 2.0 l/sMedium Yes 36 - 44 0.5 - 1.5 13 - 22
Ukhahlamba Senqu RodeIntergranular & fractured
0.5 - 2.0 l/sMedium Yes 53 - 75 0.5 - 1.5 4 - 8
Alfred Nzo Matatiele Thaba ChitjaIntergranular & fractured
0.5 - 2.0 l/sLow No 29 - 36 3.0 - 4.4 8 - 13
Alfred Nzo Umzimvubu GugweniIntergranular & fractured
0.5 - 2.0 l/sLow Yes 36 - 44 3.0 - 4.4 13 - 22
Alfred Nzo Umzimvubu LubalekoIntergranular & fractured
0.5 - 2.0 l/sLow Yes 36 - 44 3.0 - 4.4 13 - 22
Ukhahlamba Elundini Halcyon DriftIntergranular & fractured
0.5 - 2.0 l/sMedium Not Known 75 - 98 0.5 - 1.5 0.6 - 4
KZN Greater Kokstad SwartbergIntergranular & fractured
0.5 - 2.0 l/sMedium Not Known 29 - 36 1.5 - 3.0 13 - 22
KZN Greater Kokstad KokstadIntergranular & fractured
0.5 - 2.0 l/sMedium YES 29 - 36 3.0 - 4.4 8 - 13K
ZN
Town survey: Groundwater potential estimates and
preliminary Groundwater Reserve in applicable quaternary catchments
EA
STER
N C
AP
E
Associated quaternary catchment status
Town

Summary Report Final
November 2010
11
A groundwater potential determination without accurate regional water balance and
Reserve determination information is incomplete and cannot be used for final regional
water resource management application and planning. It is therefore crucial for the
reader to realise that this report aims to report only on available information in terms of
existing borehole data, with reference to work carried out in other studies in similar
geohydrological conditions.
It is the main recommendation from this preliminary assessment study that a numerical
groundwater balance and flow model be applied for the Mzimvubu Catchment
Development Area in the next phase of the project. Groundwater potential
assessments and aquifer types occurring in the study area must be viewed in the light
of the type of dolerite intrusion that occurs in different parts of the study area as well as
the geological formation present. This needs to be combined with future regional water
balance and groundwater Reserve figures before groundwater availability and potential
can be accurately determined.
Available GRIP EC data must be incorporated into the Mzimvubu River catchment
study dataset once captured. It is recommended that DWA complete the GRIP hydro-
census in the Mzimvubu River catchment to ensure a complete and comprehensive
dataset for application in the regional groundwater flow balance. Focus must be placed
to obtain groundwater information in commercial farming areas in KZN where little or
no information is currently available, especially in the high groundwater potential areas
near Cedarville and Matatiele.
It is crucial to note that the brief from the client was to indicate, on a preliminary
assessment basis, the differences in groundwater potential between the quaternary
catchments within the Mzimvubu River catchment. Maps shown are therefore not a
quantitative reflection of actual groundwater potential or availability, but aim to give the
reader an indication of the differences in groundwater character across the catchment.
The groundwater Reserve is indicated by the percentage of the recharge that is
required to satisfy the Reserve requirement. The stress index is calculated by dividing
the current abstraction with recharge. The groundwater allocation is calculated in
million m3/a and is the total recharge minus the total Reserve.
2.3 WATER REQUIREMENTS
2.3.1 Domestic water requirements
The population figures for each quaternary catchment were multiplied with the urban
and rural unit consumption rates, respectively 25 and 87 ℓ/c/d, as obtained from the
National Water Resource Strategy. No provision was made for return flows from urban
and rural abstractions as there are only a few waste water treatment works within the
catchment, and where these exist little or no information is available. The total effect of
return flows on the hydrology is also assumed to be negligible. The total urban and
rural domestic water requirements per quaternary catchment for the year 2005 are
presented in Table 2.2.

Summary Report Final
November 2010
12
Table 2.2 Urban and rural domestic water requirements (2005)
Catchment
Urban Rural Total domestic
(urban + rural)
(million m3/a)
Urban
population
Water use
(million m3/a)
Rural
population
Water use
(million m3/a)
T31 1 925 0.06 91 762 0.84 0.90
T32 27 524 0.88 159 713 1.46 2.34
T33 17 763 0.56 340 291 3.11 3.67
T34 14 121 0.45 172 264 1.57 2.02
T35 36 955 1.17 213 363 1.95 3.12
T36 723 0.02 56 201 0.51 0.53
Total 99 011 3.14 1 033 594 9.44 12.58
2.3.2 Industrial, mining and livestock and wildlife water requirements
There are no industries within the study area that are not supplied with water through
the existing municipal water supply systems. There are no significant mining activities
in the Mzimvubu River catchment. The annual livestock and wildlife water requirement
figure was also obtained from the National Water Resources Strategy and is estimated
at only 0.9 million m3.
2.3.3 Irrigation water requirements
Irrigation water requirements are strongly linked to land tenure systems present in the
catchment. On the basis of land tenure, the catchment can be roughly divided into two
sectors. Sector one is the old Natal and Eastern Cape regions of the catchment
outside of the former Transkei borders. Sector two is the former Transkei region of the
catchment.
Sector one is characterised by commercial agricultural and irrigation operations, and
freehold land tenure. Sector two is characterised by state owned land mostly
administered through the tribal land tenure system, and subsistence agriculture.
For the purposes of this study the original agro-ecological units system was modified to
produce seven agro-ecological zones. These zones have been based mainly on the
physiographic characteristics and rainfall patterns of the catchment. Irrigation was
chosen to be presented by agro-ecological zones, as it is the best description of the
regions with similar cropping patterns. A summary of the present irrigation water
requirements by sectors and by agro-ecological zone are presented in Table 2.3.

Summary Report Final
November 2010
13
Table 2.3 Summary of present irrigation water requirements in the Mzimvubu
River catchment
Irrigation area and water use
Water use (million m
3/a)
Sector
Zone*
Production centres
Tertiary catchment
Area Crops
(ha) (% total irrigated
area)
1
(Old Natal and
Eastern Cape
regions)
2a
Cedarville
Kokstad
Franklin
Swartberg
T31 & T32 6 553
Pastures (75%)
Maize (20%)
Vegetables (5%)
35.0
3 Ugie
Maclear T32 & T35 3 418
Pastures (75%)
Potatoes (25%)
Maize (20%)
17.8
2
(Old Transkei
region)
2a, 3, 4
Mount Frere
Matatiele
Thabankulu
Qumbu
T33 & T34 788 Vegetables (50%)
Maize (50%) 2.2
5 Port St Johns T36 100 Fruit trees (60%)
Vegetables (40%) 0.4
Total irrigation 10 859 55.4
* Zones refers to agro-ecological zones which are regions in which common cropping patterns and
climate occur
2.3.4 Afforestation water requirements
Commercial forestry has been declared a streamflow reduction activity and reduces
baseflow in rivers. Existing forestry water use needs to be considered before additional
yields from water resources are determined for potential developments, so as not to
over utilise water resources and impinge on the ecological water requirements (EWR).
Forestry has been identified as a development and poverty alleviation activity in the
region. Water use by potential new forestry therefore needs to be determined so that
new forestry developments themselves do not over utilise the available water
resources and in particular impinge on the EWR.
Commercial forestry covers approximately 485 km2 in the Mzimvubu River catchment
and uses about 43 million m3/a (average of 891 m3/ha/a by commercial forestry). The
majority of the afforestation occurs in the south-western part of the catchment around
the towns of Ugie and Maclear. A summary of the present afforestation per quaternary
catchment and the associated water requirements are presented in Table 2.4.

Summary Report Final
November 2010
14
Table 2.4 Existing afforestation and associated water requirements (2007)
Catchment Area Water use
(km2) (million m
3/a) (m
3/ha/a)
T31 10.6 1.31 1 236
T32 25.0 2.66 1 064
T33 10.4 0.86 827
T34 76.1 5.58 733
T35 361 32.65 904
T36 0.9 0.05 556
TOTAL 484.0 43.11 891
Potential future forestry development in the Mzimvubu River catchment is discussed in
more detail in Chapter 6 of this report.
2.3.5 Invasive alien water requirements
Extensive areas of invasive alien vegetation, particularly in the riparian zones, also
cause a reduction of baseflow in rivers. The areas of invasive alien vegetation in the
Mzimvubu River catchment were obtained from the WR2005 study report.
The areas and associated water use of invasive alien vegetation per quaternary
catchment are included in Table 2.5. Clearing of alien vegetation could provide
substantial quantities of water for other uses such as forestry in more water stressed
areas of the catchment. This could also be a job creation action.
Table 2.5 Invasive alien vegetation and its associated water use (2005)
Catchment Area (km
2)
Water requirement
(million m3/a) (m
3/ha/a)
T31 65.5 5.4 821
T32 74.4 7.3 983
T33 50.9 6.4 1 265
T34 27.3 3.5 1 282
T35 6.0 0.8 1 300
T36 1.5 0.3 2 067
Total 225.6 23.7 Average 1 051

Summary Report Final
November 2010
15
2.3.6 Ecological water requirements
Ecological water requirements (EWR) refer to the estimated streamflow that needs to
be maintained in a river to support ecological ecosystems in the river, as well as basic
human needs. The EWR for input into the Water Resources Yield Model (WRYM)
have been determined at a desktop level for the Mzimvubu River catchment. The EWR
should also be updated at a high level of confidence as part of a separate
environmental Reserve study on the Mzimvubu River.
The EWR takes the current ecological status (category) of the river and the present
water uses into account to determine the flow requirements for a river. The total EWR
requirements for the Mzimvubu River have been estimated at 881 million m3/a, which is
approximately 34% of the total MAR, of which about 530 million m3/a is required as low
flows.
2.3.7 Summary of water requirements
A summary of the total water requirements of the study area is presented in Table 2.6.
The total water abstraction which in the case of the Mzimvubu River catchment is
almost all consumptive water use, is approximately only 5% of the average annual
streamflow of 2 613 million m3/a. The ecological water requirements are provisionally
estimated to require approximately 34% of the total streamflow to remain in the rivers.
Table 2.6 Summary of study area water requirements
User group Volume (year 2005)
(million m3/a)
Urban 3
Rural 9
Industrial 0
Mining 0
Irrigation 55
Afforestation 43
Alien vegetation 24
Consumptive total 134
Ecological water requirements 881
Total (including EWR) 1 015

Summary Report Final
November 2010
16
3 WATER RESOURCE DEVELOPMENT POTENTIAL
3.1 POTENTIAL DAMS ASSESSMENT
This task is addressed in a stand-alone report (P WMA 12/000/00/3609 Volume 4 of 5)
entitled Water resources assessment, in Chapter 5, where the full details can be
found. A summary of this is included in the rest of this section.
3.1.1 Potential dam sites
A number of possible dam sites have been identified on the Mzimvubu River in
previous studies. Together with a few new sites identified from topographical maps, a
total of 19 potential dam sites were assessed in this study. The reservoirs that would
be created by the possible dams will be referred to by the name of the dam site,
derived from the name of the local area or village closest to the site.
Sediment yields in the Mzimvubu River catchment have been estimated according to
catchment size and sediment yield potential based on the latest sediment yield maps.
In the absence of comprehensive measured data, sediment yield maps form the basis
for catchment sediment yield estimation in the Mzimvubu River catchment.
The dam sites that have been considered and included in the water resources yield
assessment are listed in Table 3.1. The location of these dams is presented in
Figure 3.1.
It must be noted that these are not all the potential dam sites in the Mzimvubu
catchment, but have been included to be indicative of the more favourable sites in the
catchment. Other potential sites may exist closer to future identified water users, and a
more complete assessment will need to be made to determine the optimal dam site
choice for each potential development. The best site will depend largely on the volume
of the water required by the future potential developments. Smaller localised water
requirements will most likely be better suited to be supplied from small off-channel
dams, or dams on smaller tributaries.
3.1.2 Yield assessment
The historic firm yields available from the potential dam sites were assessed with the
Water Resources Yield Model (WRYM) to provide an indication of the volume of water
that can be reliably abstracted from the dams. The historic firm yield is defined as the
maximum annual water volume that can be abstracted from a dam without the dam
failing once over the total historical hydrological record. The total hydrological record
period for the Mzimvubu River catchment was from 1920 to 2004. For the purpose of
this study the annual abstraction was distributed evenly over the 12 months.
The historic firm yields of the potential large dams in the Mzimvubu River catchment
were calculated for each dam on its own, representing a single large dam development
scenario. No combinations of potential dams were considered at this stage.

Summary Report Final
November 2010
17
Table 3.1 Potential dam sites with estimated 50-year sedimentation in the
Mzimvubu River catchment
Catchment River Dam name
Mean annual runoff
(million m3)
Wall height for 1 x MAR
capacity (m)
Sedimen-tation 50 yrs
(million m
3)
Dead storage
level from bottom
(m)
T31 Upper Mzimvubu
Dam 2 240 49 47 18
Siqingeni 709 80 113 37
T32 Mzintlava Bokpoort 130 60 24 30
Luzi 198 63 33 26
Dam B 282 93 43 36
T33 Kinira Thabeng 307 53 31 26
Somabadi 324 59 37 27
Ntlabeni 396 65 47 28
T34 Tina Pitseng 55 34 7 10
Hlabakazi 248 57 28 18
Mpindweni 337 56 38 23
Mangwaneni 414 55 48 19
Ku-Mdyobe 424 80 (*) 50 37
T35 Itsitsa Nomhala 206 43 25 14
Ntabelanga 403 53 35 12
Malepelepe 696 42 68 18
Laleni 755 62 (*) 75 26
Gongo 800 100 (*) 81 58
T36 Mzimvubu Mbokazi 2 520 100 (*) 328 65
(*) Wall heights stated for dams of storage capacity less than 1 MAR due to geographical limitations
The results of the historic firm yield analyses are summarised in Table 3.2. The
historic firm yields are presented after making water releases to satisfy the ecological
water requirements (EWRs).

Summary Report Final
November 2010
18
Figure 3.1 Location of dam sites that have been considered and included in
the water resources yield assessment

Summary Report Final
November 2010
19
Table 3.2 Historic firm yields from potential dams in the Mzimvubu River
catchment (after supplying EWRs)
Catchment River Dam name Mean annual
runoff (MAR)
Historic firm yield * (million m³/a)
Dam capacity
0.5 x MAR 1 x MAR 1.5 x MAR
T31 Upper Mzimvubu
Dam 2 240 26 56 73
Siqingeni 709 184 289
T32 Mzintlava Bokpoort 130 24 37 53
Luzi 198 46 72 93
Dam B 282 82 125 135
T33 Kinira Thabeng 307 102 144 174
Somabadi 324 104 150 183
Ntlabeni 396 138 187 227
T34 Tina Pitseng 55 13 20 24
Hlabakazi 248 62 93 108
Mpindweni 337 84 125 149
Mangwaneni 414 91 140 149
Ku-Mdyobe 424 93 140
T35 Itsitsa Nomhala 206 43 76 90
Ntabelanga 403 115 155 183
Malepelepe 696 248 277 316
Laleni 755 205 254
Gongo 800 148
T36 Mzimvubu Mbokazi 2 520 563
* Historic firm yields are presented after releases for provisional EWRs were made
The reduction in firm yield available as a result of making releases to satisfy the EWRs
are summarised in Table 3.3. Again, the EWRs have been provisionally calculated at
a desktop level and will need to be revised for more specific development options.

Summary Report Final
November 2010
20
Table 3.3 Impact of ecological water requirements on historic firm yields
Catch-ment
River Dam name Mean annual
runoff (million m
3)
Total EWR (million m
3)
EWR as % of MAR
Percentage reduction in yield by EWR
Dam capacity (x MAR)
0.5 1.0 1.5
T31 Upper Mzimvubu
Dam 2 240 106 44 63 47 40
Siqingeni 709 154 22 24 25
T32 Mzintlava Bokpoort 130 28 22 38 30 23
Luzi 198 42 21 28 27 23
Dam B 282 59 21 19 20 20
T33 Kinira Thabeng 307 41 13 18 19 17
Somabadi 324 68 21 20 22 19
Ntlabeni 396 85 21 20 21 19
T34 Tina Pitseng 55 0 34 32 29
Hlabakazi 248 60 24 36 31 29
Mpindweni 337 85 25 41 34 30
Mangwaneni 414 133 32 45 38 37
Ku-Mdyobe 424 138 33 45 38
T35 Itsitsa Nomhala 206 54 26 32 32 28
Ntabelanga 403 104 26 28 31 28
Malepelepe 696 177 25 29 30 28
Laleni 755 192 25 26 28
Gongo 800 204 26 34
T36 Mzimvubu
Mbokazi 2 520 860 34 36
3.1.3 Cost estimates of water
Capital costs were determined for the potential dams and unit reference values (URVs)
of water were calculated. The URVs give an indication of the likely cost of water
yielded from the potential dams in the Mzimvubu River catchment, and allows
comparison between the different dam sites.
The capital cost estimates were conducted at a desktop level of detail and based on
1:50 000 maps with 20 m contours. The geological information available at potential
dam sites is not at an equal level of detail and is very limited at many sites. Only
general information gathered using geological maps is available at most dam sites. To
compare all dam sites on an equal basis, earthfill dams were provisionally assumed to
be the most suitable in the Mzimvubu River catchment.
Where the topography at particular dam sites limits spillway chute construction, roller
compacted concrete (RCC) gravity dams were considered and costed. Further
geological investigations will be needed to determine the most feasible dam types for
specific sites. The capital cost estimates of the dams are presented in Table 3.4 and
are based on March 2008 prices.

Summary Report Final
November 2010
21
Table 3.4 Cost estimates of potential dam sites in the Mzimvubu River
catchment
River Dam name
Dam cost estimate (R million)
Dam capacity
0.5 x MAR 1 x MAR 1.5 x MAR
Upper Mzimvubu Dam 2 640 800 980
Siqingeni 1 120 1 470
Mzintlava Bokpoort 630 910 1 110
Luzi 660 880 1 100
Dam B 1 140 1 980 2 310
Kinira Thabeng 490 710 790
Somabadi 520 760 850
Ntlabeni 590 770 1 010
Tina Pitseng 290 380 450
Hlabakazi 380 640 870
Mpindweni 520 640 810
Mangwaneni 1 100 1 490 1 670
Ku-Mdyobe 1 220 1 940
Itsitsa Nomhala 490 620 720
Ntabelanga 350 420 470
Malepelepe 840 1 000 1 120
Laleni 940 1 170
Gongo 2 010
Lower Mzimvubu Mbokazi 2 070
Unit reference values (URV) of the water have been calculated from the capital costs of
the dams and their corresponding historic firm yields. The URVs provide an indication
of the cost of the water. URVs have been calculated for a 45 year period, a discount
rate of 8%, and with the construction of dams assumed to start in 2011 and finish in
three years. The URVs are presented in Table 3.5.
The unit reference values of water at some of the dam sites are relatively low. These
URVs, however, do not include the cost of distributing the water to the points of use.
Due to the predominantly hilly topography in the catchment, the cost of distribution is
likely to be high, particularly for water users remote from dam sites.
The cost of distributing water to potential users must be included if specific
developments are identified, as it is likely to affect the feasibility of the development.

Summary Report Final
November 2010
22
Table 3.5 Unit reference values of cost of water at potential dam sites in the
Mzimvubu River catchment
Catchment River Dam name Mean annual runoff (MAR)
Unit reference values (R/m³)
Dam capacity
0.5 x MAR 1 x MAR 1.5 x MAR
T31 Upper Mzimvubu
Dam 2 240 3.70 2.10 2.00
Siqingeni 709 0.90 0.80 -
T32 Mzintlava Bokpoort 130 3.90 3.70 3.20
Luzi 198 2.20 1.80 1.80
Dam B 282 2.10 2.40 2.60
T33 Kinira Thabeng 307 0.70 0.70 0.70
Somabadi 324 0.80 0.80 0.70
Ntlabeni 396 0.60 0.60 0.70
T34 Tina Pitseng 55 3.40 2.90 2.80
Hlabakazi 248 0.90 1.00 1.20
Mpindweni 337 0.90 0.80 0.80
Mangwaneni 414 1.80 1.60 1.70
Ku-Mdyobe 424 2.00 2.10 -
T35 Itsitsa Nomhala 206 1.70 1.20 1.20
Ntabelanga 403 0.50 0.40 0.40
Malepelepe 696 0.50 0.50 0.50
Laleni 755 0.70 0.70 -
Gongo 800 2.00 - -
T36 Lower Mzimvubu
Mbokazi 2520 0.60 - -
3.2 REVIEW OF POTENTIAL WATER TRANSFER
This task is addressed in a stand-alone report (P WMA 12/000/00/3609 Volume 4 of 5)
entitled Water resources assessment, in Chapter 5.5, where the full details can be
found. A summary of this is included in the rest of this section.
Water transfers from the Mzimvubu River have been identified as a water resource
development option that could utilise the water to supply surrounding regions. Regions
that have been previously identified as possibly benefiting from water transfers from the
Mzimvubu River are north to the Vaal River, east towards Durban and west towards the
western parts of the Eastern Cape.
Water transfers to the Vaal River to augment the growing future requirements can still
be made from catchments closer to the Vaal River such as the Senqu River and the
Tugela River. The high cost of getting water from the Mzimvubu River to the Vaal
River system makes this a less favourable option.
The catchments to the east of the Mzimvubu River, including the Mzimkhulu River,
which are closer to Durban, still have capacity to service the growing water
requirements of Durban and the local areas. Transfers to the east of the Mzimvubu
River are therefore not deemed necessary in the foreseeable future.

Summary Report Final
November 2010
23
Water requirements west of the Mzimvubu River, such as for East London, can also be
met by the local river catchments. Irrigation in the western parts of the Eastern Cape
could be expanded if water was made available at a feasible cost.
For the purpose of this study an option of transferring water from a potential dam in the
western part of the catchment to the headwaters of the Kraai River (tributary of the
Orange River) was assessed. This is possibly the most favourable potential single
dam development transfer scenario, similar to the previous Northern Transfer option.
The chosen dam site at Ntabelanga has the potential to provide some of the cheapest
water available in the Mzimvubu River. The dam site is also located high up in the
catchment near to the western divide. A 90 km long, 2 m diameter steel pipeline would
be required to transfer the water from the dam to the headwaters of the Kraai River. All
other transfer options are likely to be more expensive and less viable.
With the construction of a dam at the potential site at Ntabelanga, 180 million m3/a
could be yielded from a reservoir of capacity of about 600 million m3. Assuming most
of the water is made available for transfer and a small portion is reserved for local
supply, a total of 150 million m3/a could be allocated for transfer.
The capital costs of the infrastructure are estimated to be R2 800 million for the
pipelines, pump stations and the reservoir at Ntabelanga. The water needs to be
pumped over the divide through a static height of 1 500 m. Including friction losses and
the assumption of pumping 20 out of 24 hours, the total energy requirements to pump
the water would be 130 MW. At an assumed total energy tariff of 30 cents per kWh,
the annual energy cost would be approximately R280 million.
Conveyance losses of 1.2 m3/s of water from the point of discharge in the Kraai River
near Rhodes to the Orange River have been provided for. Of the 150 million m3/a
transferred over the divide, a net of 110 million m3/a could be made available in the
Orange River at a unit reference value of about R7/m3.
The intention of the transfer would be to supply water to water users in the western
parts of the Eastern Cape through the Orange-Fish Tunnel from Gariep Dam. At
around R 7/m3 this water, however, would most likely be far too expensive for irrigation.
The unit cost does not include distribution infrastructure to the farms. Adding on the
distribution infrastructure will further increase the cost of the water.
In summary, water transfers from the Mzimvubu River would be too expensive for
agriculture in this region. Water transfers from the Mzimvubu River are also not
foreseeable in the near future as augmentation to Gauteng industrial developments to
the north that could be supplied by far less expensive alternatives for at least the next
50 years.

Summary Report Final
November 2010
24
0
2
4
6
8
10
12
14
16
18
20
Hyd
rop
ow
er
MW
c
Dam
2
Siqinge
ni
Bok
poor
tLu
zi
Dam
B
Thabe
ng
Som
abad
i
Ntla
beni
Pits
eng
Hlaba
kazi
Mpind
wen
i
Man
gwan
eni
Ku-
Mdy
obe
Nom
hala
Nta
belang
a
Malep
elep
e
Laleni
Gon
go
Mbo
kazi
Upper
MzimvubuMzimtlava Kinira Tina Tsitsa
3.3 CONVENTIONAL HYDROPOWER POTENTIAL ASSESSMENT
This task is addressed in a stand-alone report (P WMA 12/000/00/3609 Volume 5 of 5)
entitled Assessment of potential for pumped storage and hydropower schemes,
in Chapter 3, where the full details can be found. A summary of this is included in the
rest of this section.
The modelling of water yield from potential dams in the catchment provided the
opportunity to assess the hydropower potential at these dam sites. For simplicity, the
potential for a single purpose hydropower development only, were assessed. Possible
multipurpose developments could be investigated as more information on other
development options becomes available.
The generation of hydropower was simulated with the WRYM. The firm hydropower
available at a 99.5% assurance of supply for each potential dam site is presented in
Figure 3.3.
Figure 3.3 Firm hydropower available at potential dam sites
The results are average monthly hydropower available and are presented as mega-
watt continuous (MWC), which is analogous to base load-power. This can be converted
for load factor. A load factor of say 10% was assumed to be indicative of peaking
power.
The costs of the power plants were estimated based on generating capacity and head,
and were added to the cost estimates of the dams to determine the total hydropower

Summary Report Final
November 2010
25
scheme costs. The total base load and peaking hydropower scheme costs are
presented in Figure 3.4.
Figure 3.4 Total scheme costs for base-load and peaking hydropower
generation at potential dam sites
The total scheme costs were converted to unit costs per installed generating capacity
for comparative purposes. To compare the hydropower available at the potential dam
sites, a scheme at the Tsitsa Falls, a site previously identified as showing the most
potential in the catchment, was assessed. The Tsitsa Falls scheme incorporates a
dam upstream of the falls and utilises the additional head at the falls to generate
power.
The Tsitsa Falls scheme could produce an estimated 25 MWC base load power at a
unit cost of R100 million per MWC, or 250 MW at a 10% load factor indicative of
peaking power, at R16 million per MW.
A basic financial analysis was conducted to determine whether the capital cost of the
Tsitsa Falls scheme could be off-set by the sales of hydropower. The preliminary
results based on provisionally assumed prices for electricity of R0.30/kWh and R1/kWh
for base-load and peaking power respectively, suggest that the Tsitsa Falls scheme is
approximately double the cost that could be financed by the sales of electricity for base
load. The scheme can only be financed by the sales of electricity at low discount rates
for peaking power. The unit costs of the Tsitsa Falls scheme have been overlaid on
the unit costs of hydropower at potential dam sites for base load in Figure 3.5 and for
peaking power in Figure 3.6 for comparison.
0
500
1,000
1,500
2,000
2,500
3,000C
os
t (R
mil
lio
ns
)
Dam
2
Siqinge
ni
Bok
poor
tLu
zi
Dam
B
Thabe
ng
Som
abad
i
Ntla
beni
Pits
eng
Hla
baka
zi
Mpind
wen
i
Man
gwan
eni
Ku-
Mdy
obe
Nom
hala
Nta
belang
a
Malep
elep
e
Laleni
Gon
go
Mbo
kazi
Base load Peaking
Upper
Mzim-
vubuKinira Tina TsitsaMzimtlava

Summary Report Final
November 2010
26
Figure 3.5 Unit costs of base load hydropower at potential dam sites
compared with Tsitsa Falls and approximate upper threshold of
feasible base-load cost
Figure 3.6 Unit costs of peaking hydropower at potential dam sites compared
with Tsitsa Falls approximate upper threshold of feasible base-load
cost
0
200
400
600
800
1,000
1,200
1,400
1,600
1,800
2,000
Un
it C
os
t (R
mil
lio
ns
/MW
in
sta
lled
)
Dam
2
Siqinge
ni
Bok
poor
tLu
zi
Dam
B
Thabe
ng
Som
abad
i
Ntla
beni
Pits
eng
Hlaba
kazi
Mpind
wen
i
Man
gwan
eni
Ku-
Mdy
obe
Nom
hala
Nta
belang
a
Malep
elep
e
Laleni
Gon
go
Mbo
kazi
0.5 MAR 1.0 MAR 1.5 MAR
Upper
Mzim-
vubuKinira Tina Tsitsa
Lower
Mzim-
vubuMzimtlava
Unit cost of power
at Tsitsa Falls
Approx. upper
threshold
0
20
40
60
80
100
120
140
160
180
200
Un
it C
os
t (R
mil
lio
ns
/MW
in
sta
lled
)
Dam
2
Siqinge
ni
Bok
poor
tLu
zi
Dam
B
Thabe
ng
Som
abad
i
Ntla
beni
Pits
eng
Hlaba
kazi
Mpind
wen
i
Man
gwan
eni
Ku-
Mdy
obe
Nom
hala
Nta
belang
a
Malep
elep
e
Laleni
Gon
go
Mbo
kazi
0.5 MAR 1.0 MAR 1.5 MAR
Upper
Mzim-
vubuKinira Tina Tsitsa
Lower
Mzim-
vubuMzimtlava
Tsitsa Falls
unit cost
approx. upper
threshold

Summary Report Final
November 2010
27
Figure 3.5 and Figure 3.6 suggest that the sales of base-load hydropower cannot
finance any of the hydropower schemes, both at the Tsitsa Falls and the potential dam
sites. Only a few potential dams in the catchment had similar unit costs of peaking
hydropower to the Tsitsa Falls scheme, and could be marginally feasible.
Base load power generation is not viable at current electricity tariffs as a single-
purpose development. Peaking power is only marginal as a single-purpose
development. Power generation at a potential dam site may be considered if part of a
multipurpose development, and for local power supply.
Development of peaking power should be focused on Tsitsa Falls and a few potential
dam sites. If the purpose of the development is primarily for peaking power generation,
Tsitsa Falls and the site near Mbokazi could be considered. If the hydropower
generation is to be part of a multipurpose development then a few potential dam sites,
such as Ntabelanga and Somabadi, could be considered.
If further investigations are conducted, some additional detail should be included:
The confidence in the value of power at different load factors should be
improved.
The specific conditions at each site should be accounted for in the cost of the
hydropower plants.
The costs of the transmission lines.
The effects of releases of water for the generation of hydropower on the
ecological functioning of the river and the estuary need to be considered. This
is particularly important at the Tsitsa Falls.
3.4 PUMPED STORAGE SCHEMES ASSESSMENT
This task is addressed in a stand-alone report (P WMA 12/000/00/3609 Volume 5 of 5)
entitled Assessment of potential for pumped storage and hydropower schemes,
in Chapter 2, where the full details can be found. A summary of this is included in the
rest of this section.
Although both pumped storage and conventional hydropower schemes use water-
driven turbines for the generation of power, there is a fundamental difference between
the schemes with respect to the primary source of energy used. For conventional
hydropower, power is generated from harnessing the energy in the streamflow, which
is a source of renewable energy. Pumped storage schemes in contrast use the excess
energy generated by other sources to pump water to a higher elevation during off-peak
periods, from where the water is released for the generation of power during peak
demand periods, much like a huge battery. Once the initial filling (priming) of the
reservoirs of a pumped storage scheme has been complete, pumped storage schemes
are essentially closed systems, apart from replacing evaporative and seepage losses,
and are independent of river flows.

Summary Report Final
November 2010
28
Due to the topography of the catchment and available water resources, pumped
storage schemes are potential developments in the Mzimvubu Development Zone.
Pumped storage schemes have been included in the assessment of water resource
development due to the possibility that a pumped storage scheme could be linked to a
dam with other purposes such as water supply, as a multi-purpose scheme.
A desktop study was conducted to assess the potential pumped storage schemes in
the Eastern Cape. This included potential sites in the Mzimvubu River and surrounding
catchments that were identified by Eskom, listed in previous studies of the Mzimvubu
River, and identified by the study team close to potential dams.
Using very basic parameters of available head and tunnel length, some of the sites
were eliminated before cost estimates were conducted. The pumped storage sites
were ranked according to a number of factors and the results were discussed with
Eskom. No further work, other than the assessment of pumped storage schemes, was
carried out as part of this study.
It may be to Eskom‟s benefit to do another round of site identification, focussed at off-
channel lower reservoirs, to confirm that the sites identified in this study are the most
favourable.

Summary Report Final
November 2010
29
4 ASSESSMENT OF THE ECOLOGICAL WATER REQUIREMENTS
4.1 INTRODUCTION
The ecological water requirements (EWR) were determined for the Mzimvubu River
catchment to investigate various development options, including several large dams.
This was mainly done on a desktop level and where available, used results from
previous rapid Reserve studies using the Desktop Reserve Model (SPATSIM 2.10) and
the updated hydrology supplied by BKS.
4.2 APPROACH
The approach followed for the desktop EWR determination was:
Sourcing of existing rapid Reserve results;
Desktop eco-classification to determine the present ecological state (PES) and
ecological importance and sensitivity (EIS) per quaternary catchment;
Determination of an integrated importance value per quaternary catchment;
Determination of the level of Reserve determination required per quaternary
catchment for future studies using the importance scores and the existing as
well as future land use information; and
Determination of desktop EWRs for use during the yield modelling to
investigate the various water resource development options.
4.3 RESULTS
The present state of the main stem rivers in most of the upper areas of the Mzimvubu
catchment (T31 and T32) are in a A/B or B category (larely natural to natural) with the
remainder of the quaternary catchments a C category (moderately modified) with the
EIS as moderate to high.
The EWR per quaternary catchment were determined and requires on average 21% –
26% of the natural mean annual runoff (MAR) for a C category. The lower part of the
Mzimvubu River close to the estuary is still in a largely natural state (B category) and
requires as much as 42% of the natural virgin MAR.
The required level of ecological Reserve determination per quaternary catchment has
been determined and a summary per tertiary catchment is as follows:
T31 (main stem Mzimvubu to confluence with Mzintlava River) – mainly rapids
with intermediate in the lower reaches (T31H and T31J);
T32 (Mzintlava River and tributaries) – Intermediate for the upper part above
Franklin Vlei (including the wetland) and rapids in the lower reaches;

Summary Report Final
November 2010
30
T33 (Kinira River and tributaries to confluence with Mzimvubu River) – rapid
and desktop level Reserve determinations are required;
T34 (Tina River and tributaries to confluence with Tsitsa River) – intermediate
determination for the middle reaches of the river (T24D - T34H) with rapids for
the remainder;
T35 (Tsitsa River and tributaries) – rapids for the upper quaternary
catchments with intermediate in the middle reaches to the confluence with the
Tina River; and
T36 (main stem Mzimvubu to estuary) – an intermediate study is required for
this part, including the estuary.

Summary Report Final
November 2010
31
5 ASSESSMENT OF FUTURE IRRIGATION POTENTIAL
This task is addressed in a stand-alone report (P WMA 12/000/00/3609 Volume 2 of 5)
entitled Agricultural assessment and irrigation water use, where the full details can
be found. A summary of this is included in the rest of this section.
There are many socio-political, cultural, technical, managerial and financial constraints
that can mitigate against sustainable irrigation development in the study area. This
does not imply that opportunities do not exist. If approached in the correct way with the
full involvement of beneficiaries and supporting communities and with careful
participatory planning and implementation, significant irrigation development could take
place in the area.
5.1 CONSTRAINTS AND CHALLENGES TO IRRIGATION DEVELOPMENT
5.1.1 Climate
The climate of all the agro-ecological zones in the catchment is not suitable for large,
capital intensive irrigation schemes. Generally temperatures are too low (frost is
common in winter) and rainfall is too high to justify such developments. Large irrigation
schemes are usually found in frost-free regions with a temperature regime that is
suitable for high value perennial crops or out-of-season winter production of high value
annual crops such as vegetables grown on a commercial scale. Excessive rainfall on
an irrigation scheme can be disruptive to production practices and can adversely affect
crop quality, particularly during harvesting time.
The likely returns from relatively low-value irrigated crops will in most cases be
inadequate to cover the cost of expensive irrigation water and not be able to provide
the growers with a reasonable “take-home” income.
5.1.2 Topography
The topography is characterized by steep incised river valleys where irrigable soils are
restricted mainly to “pockets” of alluvial soils along the main rivers where flooding is an
ever-present threat. These “pockets” of alluvial soils have a high irrigation potential
from a climatic and soils perspective, but significant irrigation development will be
limited without the river-flow regulating effect of expensive large dams upstream of
these areas. Furthermore most of the irrigable areas are largely inaccessible and in
general infrastructure is limited.
5.1.3 Present land use
Most irrigable soils in the catchment are already in use for rain-fed subsistence
agriculture with individually “owned” plots seldom exceeding 1 ha. Any irrigation
scheme would therefore have to accommodate all existing land users in some way.
However, small irrigated plots on capital intensive irrigation schemes have proved to be
mostly unviable, particularly with the limited enterprise selection available as
determined by the climatic conditions.

Summary Report Final
November 2010
32
With the reality of relatively high population density spread throughout Sector 2 (former
Transkei area) of the study area, allocation of farms large enough to be commercially
viable and sustainable units is a real challenge.
The only way this can be achieved is if the present land “owners” on the consolidated
agricultural areas (who, in practice struggle to obtain meaningful production from their
lands) are assisted to produce their household food needs by alternative means thus
creating the opportunity for the leasing of these lands for consolidation into viable
commercial units under irrigation (or rain-fed) production.
5.1.4 Land tenure
Most land in the study area falls under the communal land tenure system in terms of
which the Tribal Authority allocates the right to use or occupy land. A “permission to
occupy (PTO)” certificate is the official “deed of occupation”. Despite this system being
widely accepted by local communities, it is recognised as one of the most significant
constraints to agricultural development in the region. Without freehold title (or at least
a long-lease form of land tenure) it is very difficult for any commercial enterprise,
especially with expensive irrigation equipment, to be established and developed in a
sustainable way.
The communal land tenure system poses special challenges to irrigation development.
The issue of who owns the irrigation infrastructure of a scheme and who is responsible
for it‟s maintenance and repair and the inability to offer land as a security for “on-farm”
irrigation infrastructure and operating loans will always be a constraint to irrigation
development.
This land-tenure limitation has been shown to be a major contributor to the failure of
many small-holder irrigation schemes and other agricultural development initiatives in
South Africa in the past. Every effort should be made to address this important issue
on new development projects.
5.1.5 Commercial farming experience
The lack of skilled and experienced (commercially orientated) farmers in this sector of
the catchment is also a major constraint to irrigation development.
Crop production in the area is based on the principle of low cost, low risk, low return,
“subsistence-type” agriculture. The subsistence culture remains a significant constraint
to the commercialization of agriculture.
Crop production under irrigation is a practice which farmers usually only contemplate
after gaining experience with, and having confidence in, rain-fed agriculture on a
commercial scale.

Summary Report Final
November 2010
33
5.1.6 Scheme ownership
There is high risk in developing an irrigation scheme without considering the long-term
ownership arrangements for the project. Government-owned agricultural projects
(anywhere in the world) are doomed to failure. This is mainly due to the reality that
governments are not structured appropriately for commercial management and without
some equity stake in an irrigation project, the farmers will not have adequate incentive
or responsibility for sustained commercial production. It is therefore essential that
appropriate farmer-led institutional structures are developed that will allow for farmer
“ownership” and appropriate management structures to operate. Such structures will
need strong government intervention to ensure capacity building, training and
mentorship for the structures and their personnel.
5.1.7 Scheme management
Any large-scale irrigation scheme will require on-going management support for:
Maintenance and repair of bulk infrastructure such as dams, pumps, canals,
pipelines, power supply, roads and buildings;
Ensuring that markets are found for the crops to be cultivated;
Equitable distribution of irrigation water to participating farmers; and
Facilitation of co-ordinated support services to farmers.
Whether management is provided by an external agent, by a joint-venture partner or by
local community members appointed by the farmers, there will be a considerable
responsibility and cost to the farmers for that management to be effective.
5.1.8 Support services
For commercialisation of agriculture to take root in the area, and particularly on
irrigation schemes, it is imperative that more effective support services be put in place
to facilitate the change from subsistence agriculture. The main components of support
required for agriculture are:
Efficient extension services and related relevant skills and technology transfer;
Input supplies. Access to commercial supplies of agricultural requisites such
as seed, fertilizer, chemicals and equipment;
Mechanisation services. Cultivation of crop lands is difficult without tractors
and agricultural machinery. Some form of reliable contractor service needs to
be put in place to fill this gap;
Credit facilities for input purchases. All commercial agricultural activities make
use of production loans in some form or another. This is still largely
unavailable to communities in tribal areas and ways need to eb found to assist
upcoming farmers with financing;

Summary Report Final
November 2010
34
Management skills and technical “know-how”. A major training and capacity
building initiative is required to bridge the skills gap that exists between
commercial farmers and subsistence farmers;
Joint-venture initiatives in terms of which commercial farmers and
agribusiness entities form joint-venture partnerships with local farmers / land
users, for the development of commercial agricultural projects; and
Effective application of existing legislation relating to natural resource
degradation, particularly with regard to soil erosion and removal of vegetation
from wetland areas and riverine regions.
5.2 IRRIGATION DEVELOPMENT OPPORTUNITIES
The development opportunities outlined below have been divided into two categories.
Firstly the opportunities in the communal areas of the former Transkei area and
secondly the Port St Johns farms where an exercise is presently underway to secure
freehold title for the farms.
5.2.1 Communal areas - small irrigation schemes
As outlined above the catchment is unsuitable for large irrigation schemes, particularly
if designed to accommodate smallholder farmers.
One form of irrigation scheme which may be viable, are small (< 500 ha), low-cost,
community-based projects which are initiated and driven by existing land users.
To minimise capital investment and operating costs of such schemes, they should be
established on irrigable areas close to the villages where the participants live, and
preferably downstream of the water source. This implies that, in most cases, existing
consolidated, rain-fed agricultural lands would have to be converted to irrigation.
The irrigation water should be sourced from multi-purpose small/farm dams which, if
established up-stream of the irrigation area, will allow for low-cost, gravity-fed
reticulation and on-scheme storage.
For such schemes to be viable and sustainable they should operate on a commercial
basis. This implies that farm sizes should be large enough for commercial production
(25 to 50 ha). This, in turn, implies that there will need to be consolidation of existing
rain-fed “permission to occupy” land holdings which, on average, are about 1 ha in
size. Leasing of “permission to occupy” land holdings is feasible provided an
alternative source of food security for the present land users is found. The irrigated
homestead plot concept may provide a solution in this regard.
5.2.2 Communal areas - Homestead plot irrigation
It is evident that the standard and intensity of rain-fed crop production on a fenced
arable plot adjacent to most homesteads is much higher than production on the
consolidated cropping areas situated some way from each village. The main crop
grown on the homestead plots is maize with sorghum occasionally planted. The

Summary Report Final
November 2010
35
reason for the more successful production on these plots is their proximity to the
homestead. Ease of access makes the crop production practices, in terms of planting,
weeding, fertilizing with kraal manure, harvesting and providing security for the crop,
much more manageable and less time-consuming than in the communal cropping
areas.
The main limitation to production however is variable and often inadequate rainfall.
The concept of providing untreated irrigation water to homestead gardens is not a new
one, but it is felt that the concept needs to be thoroughly researched and tested as a
significant contributor to increased food security in the rural areas of the catchment.
The concept is to provide raw water to a tap/hydrant at the edge of a homestead plot
for supplementary irrigation of grain crops and other food crops such as sweet potato,
potato and vegetables.
The size of irrigated area within the homestead plot could be in the order of 0.1 ha
which is sufficient to make a significant contribution to the household food needs and
could also generate a modest cash income especially in the warmer parts of the
catchment where, with irrigation, it is possible to produce two crops per year.
It is recognised that the issue of reticulating water to villages in the former Transkei
area, which are often situated on relatively high ground, is a considerable challenge.
Nevertheless there are a number of options for the sourcing of irrigation water,
including:
(a) the construction of weirs on rivers high enough upstream to allow gravity
reticulation in pipes or modest canals to reservoirs situated at a high point in
the village;
(b) the combination of a micro hydro-power scheme with a small dam which could
generate surplus power to cover the cost of pumping water to village
reservoirs;
(c) the use of low-cost “ram” pumps for elevation of water from a weir or small
dam to lower lying villages;
(d) rainwater harvesting; and
(e) groundwater.
5.2.3 Communal areas - Homestead rainwater harvesting schemes
This topic is the subject of a parallel initiative in the catchment. However, it is important
in this report to endorse the value and sustainability of this form of water use. It is
recommended that the concept of assisting interested and committed households to
establish appropriate rainwater harvesting and storage facilities at their homesteads,
with associated vegetable production, be adopted and implemented in terms of a well-
researched, tested and phased programme throughout the former Transkei area of the
catchment. Refer to Chapter 7 for more detail.

Summary Report Final
November 2010
36
5.2.4 Port St Johns farms
The unique sub-tropical climatic conditions prevailing in coastal region of the catchment
coupled with the availability of the existing 73 Port St Johns farms which are presently
being converted from state-ownership to free-hold tenure, provide an excellent
opportunity for the commercial production of sub-tropical fruit and nut crops, particularly
banana and macadamia. The 73 farms cover a total area of 3 650 ha of which about
5% (185 ha) is irrigable on alluvial flood plains of the Mzimvubu River.
On their own these farms would not constitute a viable entity to justify a banana
ripening plant and a macadamia shelling and packaging plant. However, if linked to the
adjacent Mngazana/Mngazi potential production area, a viable industry could be
established with processing facilities in Mthatha.
5.3 ESTIMATED FUTURE IRRIGATION AREA AND WATER USE
Clearly, from the above discussion on irrigation development opportunities and
recommended approaches, it would be pure speculation to predict the actual irrigation
development in the Mzimvubu catchment over the next 10 to 20 years.
Nevertheless, Table 5.1 summarises an attempt to project a possible irrigation
development scenario which may assist in the medium- to long-term planning of the
water resources of the catchment.
Table 5.1 Estimated future irrigation development and water use in the
Mzimvubu catchment
Sector Present irrigation Future new irrigation Total irrigation
Area
(ha)
Water use
(million m3/a)
Area
(ha)
Water use
(million m3/a)
Area
(ha)
Water use
(million m3/a)
1 9 971 52.8 - - 9 971 52.8
2 888 2.6 - - 962 2.6
20 x 250 ha schemes 5 000 25.6 5 000 25.5
150 villages x 250 plots x 0.1 ha 3 750 19.1 3 750 19.1
Port St Johns farms (80%) 150 0.8 150 0.8
Total 10 859 55.4 8 900 45.5 19 833 100.8
For a catchment with substantial water resources, this projected irrigation water use
may seem inappropriate. However, in view of the many constraints to irrigation
development as outlined in this report, it is considered a reasonable and sustainable
projection for medium- to long-term water resource planning.

Summary Report Final
November 2010
37
In this scenario it is assumed that:
there will be no large irrigation schemes developed in the catchment;
a limited number (say 20) of small community-based schemes with an
average size of 250 ha will be developed;
the irrigated homestead plot concept will be applied in say 150 villages with
250 plots per village and 0,1 ha per plot; and
the development of 80% of the 73 Port St Johns farms which are presently
being converted to freehold title.
5.4 KEY SUCCESS FACTORS REQUIRED FOR SUSTAINABLE IRRIGATION
DEVELOPMENT
5.4.1 Focus on small community-based schemes
The focus of any irrigation development in the study area should be on small,
community based projects which could take the form of:
(a) small (<500 ha) schemes where existing, consolidated, rain-fed production
areas are upgraded to irrigation and where irrigation water can be affordably
and sustainably sourced and applied at low operating cost; and
(b) irrigation water supplied under gravity to traditional household plots in those
villages where water can be affordably and sustainably sourced.
5.4.2 Voluntary participation only
Irrigation development should only be considered where communities and individual
land holders have shown interest in and have requested assistance for such
development.
5.4.3 Involvement of participants in all aspects of planning and development
The decision to go ahead with irrigation development should be followed with
participatory planning and development. From the outset the scheme should “belong”
to the beneficiaries and not to government or some other institution.
5.4.4 Securing of land tenure
To ensure successful irrigation development, adequate security of tenure is essential to
allow investment by individuals in appropriate irrigation infrastructure and equipment.
5.4.5 Commercialisation of production
Commercialisation of production under irrigation is essential in order to ensure
adequate income generation to cover the operating costs of irrigated farming and
provide a worthwhile contribution to household income.

Summary Report Final
November 2010
38
5.4.6 Establishment of community-owned institutional structures (ownership and
management of schemes)
The complexity and sensitivity of sharing infrastructure and water on an irrigation
scheme, no matter how small, requires control and management. It is essential that
appropriate, community-owned, institutional structures are in place to take
responsibility for the control and management of the scheme.
5.4.7 Support services in place
Fundamental to the sustainability of an irrigation scheme is the regular and reliable
supply of the range of agricultural support services essential on an irrigation scheme,
including financing, mechanisation, input supplies, technical support, and marketing
structures.
5.4.8 Low cost of water
The viability of any irrigation scheme is a function of the cost of water and/or the cost of
operating and maintaining the water supply. Any scheme should therefore be designed
to minimise tariffs, and operating and maintenance costs.
A major contributing factor to the cost of pumped water is the pumping head (the height
above the water source to which the water has to be elevated). A head of above 50 m
is unlikely to be viable unless the irrigation water is used for intensive production of
high-value crops.
5.4.9 Integrated water use from storage facility
The cost of building even a small dam or weir on a river in the catchment could not be
justified for irrigation alone. It is recommended that any water storage infrastructure
should be developed with a multi-purpose objective such as domestic, irrigation,
livestock and possibly hydro-power generation.
5.4.10 Undertake viability assessment
Before embarking on any irrigation scheme development a detailed technical, social,
and financial viability assessment should be undertaken which involves all stakeholders
(particularly the participating farmers), in all aspects of the study.

Summary Report Final
November 2010
39
6 ASSESSMENT OF POTENTIAL FUTURE FORESTRY DEVELOPMENT
The Department of Water Affairs is responsible for Water Use Licences for Forestry
and has managed this function since 1998 through the Sub-directorate Streamflow
Reduction (SD: SFR).
Water use licences (for forestry) are dependent on a number of factors including:
the availability of water;
the impact on biodiversity;
the perceived social and economic impacts;
equity and targets to reallocate water;
the agricultural value of the land to be used; and
the threat posed by alien plant invasions.
Whilst a forestry water use licence is signed off by DWA, the decision to issue the
licence is an inter-departmental cooperative governance decision. Records of decision
required to meet own legislative requirements are also required of both the Department
of Agriculture and the Department of Environment Affairs. Other Departments, at
national or provincial level, that have a part in decision-making, include Land Affairs,
Local Government and Housing, and Cultural Affairs. Environmental NGOs and the
Forestry Sector are also given a chance to voice opinions and position. The approach
has always been to try and reach consensus amongst all parties in regional Licence
Assessment Advisory Committees (LAACs), in this case the Eastern Cape LAAC.
The DWA is under constant criticism for its failure to issue licences – when the reality is
that it can be very difficult to muster both a sound application and inputs from all the
roleplayers. Water is only one of the decision-making factors and is not by any means
always the most difficult. In order to try and ease the process of integrated decision-
making in forestry licensing the SD: SFR commenced with a series of Strategic
Environmental Assessments for the Mhlathuze River catchment in 2000, the Usutu-
Mhlathuze WMA in 2002, and in 2005 for the Eastern Cape Zone of Potential
Afforestation. The Eastern Cape SEA found that at least 350 000 ha of land was
biophysically suitable for the planting of trees, but that a target of 100 000 ha was more
realistic. Most of this land is in the Mzimvubu River catchment. This target of 100 000
ha later become “enshrined” in the Forestry Sector Transformation Charter, and is a
goal sought after by the Forestry Sector, the Forestry Branch (now in the Department
of Agriculture, Forestry and Fisheries, DAFF), and the Department of Water Affairs
itself. The DWA has, by virtue of its licensing responsibility, therefore almost
inadvertently become the organisation seeking to support afforestation development.
This is not totally counter to the aims and tasks of the regulator – as the NWA also
requires that water be used to optimal benefit. DWA has therefore adopted the
approach of supporting and even encouraging forestry where this appears to be the
best possible use of available water – using a balance of environmental, economic and
social criteria.

Summary Report Final
November 2010
40
The SD: SFR played this role with the support of Professional Service Providers. The
conclusion of PSP contracts in 2007, and the resignation of core staff in the sub-
directorate in whom the necessary capacity had been built, left the task unsupported.
Forestry has long been viewed as one of the development drivers in the Eastern Cape,
and potentially one of the most effective users of water in the Mzimvubu catchment.
Licensing forestry is a way of allocating water to rural communities living in remote
areas and out of the reach of irrigation infrastructure. The Study Team was therefore
tasked by DWA Directorate: National Water Resource Planning with both assessing
forestry‟s role in the water balance of the Mzimvubu, and continuing the role of “forestry
facilitation” in an attempt to make good the gap in capacity within SD: SFR. It was
recognised that any facilitation and promotional work should really be undertaken by
the Forestry Branch of the then Department of Water Affairs and Forestry (now within
DAFF) and that the involvement of National Water Resource Planning was at best a
temporary measure.
AsgiSA-EC has now taken a lead role in forestry facilitation at strategic level, with
significant support offered by DWA through the Study Team, as will be seen below.
6.1 SCOPE OF THE TASK
The task is a sub-set of the overall project DWA Water Resource Study in Support of
the AsgiSA-EC Mzimvubu Development Project. Fundamentally the task was to
support the process of determining areas suitable for afforestation within quaternary
catchments, given the prospect of certain licensing constraints that could amount to
fatal flaws to forestry ambitions. Typically such constraints would be:
The availability of water;
High biodiversity value; and
Concerns for food security, and the prioritisation of competing agricultural
ambitions.
The study was required to focus on the Mzimvubu River catchment, but necessarily
extended beyond the strict boundaries of the catchment in that forestry is a regional
activity and all forestry development is economically linked. Catchments in the Kei and
the Keiskamma, as well as the Pondoland coastal (T60) catchments, were therefore
also given attention as part of this bigger picture.
6.1.1 Assess existing afforestation and calculate water use
The primary constraint was always taken to be water, and the first task was to assess
exactly how much forestry was already practised within each quaternary, so that an
accurate water use value could be ascribed to the activity, this being an essential part
of the water balance equation in determining how much water was remaining for
extending the activity. These values were derived from existing land cover maps,
satellite images, and from the databases of forestry companies operating in the region.

Summary Report Final
November 2010
41
The only forestry company to be really forthcoming in this regard was PG Bison, which
produced excellent and accurate data.
6.1.2 Improve afforestation suitability maps
The key activity was then to improve the detail in the maps produced by the SEA for
areas where forestry could commercially and viably be practised, and which would also
stand a reasonably good chance of being granted a forestry licence. The key
considerations were:
biophysical suitability (as indicated in the SEA);
water availability;
biodiversity value and whether transformation of the land would be acceptable
from a conservation perspective;
agricultural value - high potential agriculture, or even whether previously
farmed; and
markets and access.
The actions were to explore each and all of these issues and improve on current
understanding of where forestry could be practised.
Most of the work revolved around water availability and prioritising the determination of
ecological Reserves within quaternaries. This required facilitation of a setting of the
standards, and acceptability of Reserve determinations.
The other major constraint has been that of biodiversity. The biodiversity coverages
provided as part of the SEA process rendered almost all land within the target area as
unavailable to forestry. This was clearly both incorrect and unacceptable and came
from the setting of too-strict criteria. The task was therefore to advise and work with
AsgiSA-EC in negotiating with the Department of Environment Affairs in the Eastern
Cape, and SANBI, on acceptable criteria and appointing and managing specialists to
re-evaluate the biodiversity of prioritised catchments within the target area.
An additional task, undertaken at the specific request of AsgiSA-EC, was to develop a
conceptual proposal aimed at catchment restoration where soil erosion is a threat to
river ecology and most particularly results in the siltation of dams. The central concern
was the loss of storage capacity in existing dams, and in any potential new dams that
might be constructed as part of the development of the Mzimvubu River catchment.
6.2 OUTCOMES
6.2.1 Hydrology
The Mzimvubu River catchment has always been perceived as a catchment with a very
large volume of water that could be put to use. Opportunities for development exist
primarily because they have never been taken up before; this because the distance,
remoteness and ruggedness of the terrain make development very difficult. This
project has explored the construction of dams for transfer of water, for irrigation and for

Summary Report Final
November 2010
42
hydropower; opportunities for agriculture and large-scale irrigation schemes and
opportunities for afforestation. Studies have indicated that there are some
opportunities for dam construction, but nothing on a massive scale, that land is simply
not available for large scale irrigation schemes, but that there are opportunities for
smaller developments and that forestry is a very real opportunity. Development of
forestry is significantly constrained by the terrain, biodiversity and potential conflicts
with other plans to use both land and water (agriculture, including biofuels production,
but especially food security).
With regard to water the major constraint proved to be the way in which the concept of
„ecological Reserve‟ was being applied, in that catchments that were categorised as
“pristine” were then also classed as required to stay pristine, which meant that no
reduction in low-flows could be contemplated in many quaternary catchments. Given
that forestry is a water user that cannot switch the tap off, or make compensatory
releases in the low flow (dry) season without mitigation dams, this effectively made it
an “unacceptable” activity. The task became to raise an awareness of this problem
and its implications, to indicate its unreasonableness, and to offer a satisfactory
alternative. Calculations were undertaken in certain critical catchments and it was
demonstrated that a likely failure of low flow ecological Reserve requirements could
only be expected in 1:960 months of flow if a catchment was planted to a full 20%
extent. Such extensive forestry is very unlikely in most catchments given the nature of
the terrain. The directorate: RDM agreed that impacts on low flows were such that a
maximum density of 10% to 20% afforestation could be considered in all catchments
targeted for afforestation development for planning purposes.
The Reserve requirements and the water use by potential areas of afforestation were
then determined through various different agencies, the East London Regional Office of
DWA, and finally also the Cradock Regional Office of DWA. The Cradock Office
provided a set of hydro-calculations for each quaternary, applying a range of criteria,
based on an intimate knowledge of the terrain and of competing uses in assessing
water availability.
This process was based on the first assumption that, before forestry could be
considered, water should first be found to be available in a quaternary catchment. It
was proposed through this project that the thinking should be reversed, or at least that
water availability should not be applied as the first and primary constraint or sieve
through which forestry suitability would have to pass. Rather than force forestry to
come along as a secondary claimant for available water (thus always playing second
fiddle to agriculture, the Reserve, and other users), the approach proposed was to say
“This is the land suitable and available for good commercial forestry and this is the
water requirement. How can we accommodate this forestry into the ecological and
hydrological landscape?”
This has proved to be a very useful approach as forestry has been able to take its
rightful place as an equal potential competing user of water.
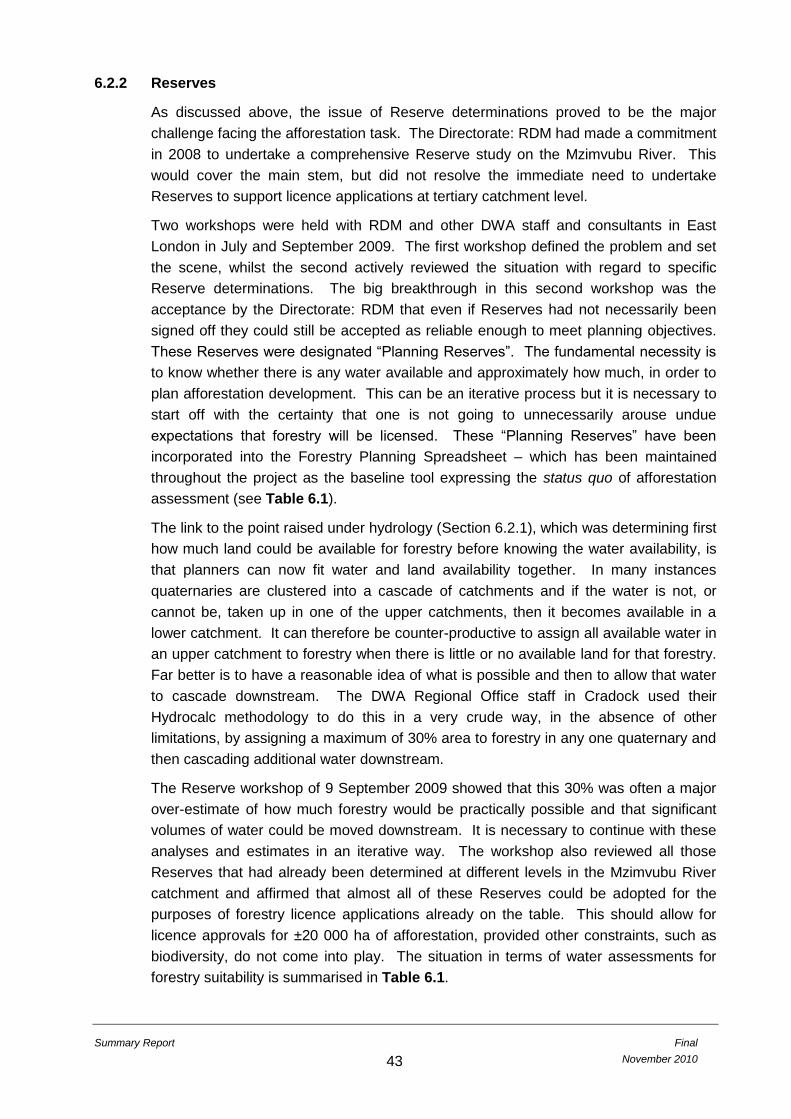
Summary Report Final
November 2010
43
6.2.2 Reserves
As discussed above, the issue of Reserve determinations proved to be the major
challenge facing the afforestation task. The Directorate: RDM had made a commitment
in 2008 to undertake a comprehensive Reserve study on the Mzimvubu River. This
would cover the main stem, but did not resolve the immediate need to undertake
Reserves to support licence applications at tertiary catchment level.
Two workshops were held with RDM and other DWA staff and consultants in East
London in July and September 2009. The first workshop defined the problem and set
the scene, whilst the second actively reviewed the situation with regard to specific
Reserve determinations. The big breakthrough in this second workshop was the
acceptance by the Directorate: RDM that even if Reserves had not necessarily been
signed off they could still be accepted as reliable enough to meet planning objectives.
These Reserves were designated “Planning Reserves”. The fundamental necessity is
to know whether there is any water available and approximately how much, in order to
plan afforestation development. This can be an iterative process but it is necessary to
start off with the certainty that one is not going to unnecessarily arouse undue
expectations that forestry will be licensed. These “Planning Reserves” have been
incorporated into the Forestry Planning Spreadsheet – which has been maintained
throughout the project as the baseline tool expressing the status quo of afforestation
assessment (see Table 6.1).
The link to the point raised under hydrology (Section 6.2.1), which was determining first
how much land could be available for forestry before knowing the water availability, is
that planners can now fit water and land availability together. In many instances
quaternaries are clustered into a cascade of catchments and if the water is not, or
cannot be, taken up in one of the upper catchments, then it becomes available in a
lower catchment. It can therefore be counter-productive to assign all available water in
an upper catchment to forestry when there is little or no available land for that forestry.
Far better is to have a reasonable idea of what is possible and then to allow that water
to cascade downstream. The DWA Regional Office staff in Cradock used their
Hydrocalc methodology to do this in a very crude way, in the absence of other
limitations, by assigning a maximum of 30% area to forestry in any one quaternary and
then cascading additional water downstream.
The Reserve workshop of 9 September 2009 showed that this 30% was often a major
over-estimate of how much forestry would be practically possible and that significant
volumes of water could be moved downstream. It is necessary to continue with these
analyses and estimates in an iterative way. The workshop also reviewed all those
Reserves that had already been determined at different levels in the Mzimvubu River
catchment and affirmed that almost all of these Reserves could be adopted for the
purposes of forestry licence applications already on the table. This should allow for
licence approvals for ±20 000 ha of afforestation, provided other constraints, such as
biodiversity, do not come into play. The situation in terms of water assessments for
forestry suitability is summarised in Table 6.1.

Summary Report Final
November 2010
44
Table 6.1 Forestry Planning Spreadsheet: Eastern Cape Zone of potential afforestation: Water resource and Reserve

Summary Report Final
November 2010
45
Table 6.1 Forestry Planning Spreadsheet: Eastern Cape Zone of potential afforestation: Water resource and Reserve (continued)

6.2.3 Agriculture
Land availability for afforestation is influenced not only by biophysical capability, but
also by ownership, and particularly community desire to engage in forestry. It is further
influenced by competing land uses and the most important of these is agricultural
development. It is a feature of most of the former Transkei, including almost all of the
Mzimvubu River catchment, that very large areas have at some stage been cultivated,
and as such are classified not only as arable land, but as cultivated lands. The
Department of Agriculture notes that South Africa has three million hectares of unused
high potential agricultural land, much of this in the Eastern Cape. This raises the
question of whether all “previously cultivated land” should remain set aside for
agriculture, or whether the addition of forestry plantations to the agricultural mix would
not lead to higher overall productivity and that some “agricultural” land could be
devoted to this purpose.
6.2.4 Biodiversity
The conservation of biodiversity is a necessary consideration in all development
planning, and particularly so in forestry, where large swathes of land are transformed
through conversion to plantation. It is also so that with so much of the South African
landscape, notably the grasslands, already transformed to different land uses, with
agriculture by far the most important of these, the little natural grassland that remains is
often singled out for the fact that it holds the last remaining biodiversity. The less
natural landscape that survives, the more valuable this becomes and the greater the
need for its preservation.
This proved to be a very serious limitation towards further afforestation in the Eastern
Cape and it became necessary to review the situation of biodiversity through a finer
lens. In the first instance land that has already been ploughed up or cultivated has
effectively lost its biodiversity value and there is little purpose in setting it aside for
“biodiversity conservation”. This applies, too, to lands that have been seriously
degraded. A re-assessment of the areas that really should be set aside for biodiversity
conservation has indicated that in fact there are large areas of land that could be used
for afforestation without compromising the biodiversity integrity of the landscape. In
part this is because the vast swathes of biodiversity “pristine” landscapes originally set
aside for protection are not in fact pristine, but also because the scale of re-
assessment has been very much finer and the areas that definitely should be protected
have now been picked out and marked specifically, with areas of lesser value also
identified.
This additional work was undertaken by a team approved by SANBI (South African
National Botanical Institute) under the auspices of AsgiSA-EC. The Mzimvubu
Development Support Project was able to assist in the development of the Terms of
Reference, the briefing of the biodiversity team, the coordination of tasks and the
review of results.

Summary Report Final
November 2010
47
6.2.5 Planning and mapping
As noted above the emphasis has been shifting towards the development of a forestry
land use plan. This is based on the hydrology as influenced by the Reserve,
biodiversity, agriculture and, most importantly, the willingness of communities to utilise
that land for commercial forestry.
The Mzimvubu Project has not produced a map of potential for all afforestation in the
Region. There are, however, now a series of coverages that have identified where the
DWA and AsgiSA-EC personnel involved in this project have identified land that meets
all the criteria for possible development. In this exercise, which to date has covered 19
of the 56 potential forestry catchments, some 16 000 ha of forestry land has been
mapped out in polygons. These detailed coverages are held by Louis de Kock of
Rance Timbers, who provided voluntary support to AsgiSA-EC in the mapping process.
6.2.6 Forestry water use licensing
Achievement in the facilitation of forestry water use licensing can be monitored in a
number of ways:
How much land has been licensed to forestry over the period in question?
How much sustainable forestry has been approved / licensed?
Forestry licence applications received (success being a factor of number and
area)?
Have blockages been removed and are licences now easier to obtain within
designated areas?
Is licensing on target with the Forestry Sector Development Charter?
None of these is an easy measure due to the time lags involved. There has been a
very significant increase in applications for the number of licences and area to be
licensed, with reported applications for 30 000 ha of forestry in the Eastern Cape –
much in the Mzimvubu River catchment. Of these the water resource issues (Reserve
and total water availability) have been cleared on at least 20 000 ha. Clarification on
both water and biodiversity constraints has allowed for definite planning within a large
number of quaternaries.
There are, however still a number of steps to be taken to complete these initiatives:
Biodiversity assessments must be undertaken within all those catchments
omitted on the first prioritisation. AsgiSA-EC (Stephen Keet) has indicated
that it will take this forward.
“Planning” Reserves should be calculated for all non-priority catchments.
This work is to be continued to completion by the Cradock HydroCalc Team.
A further meeting between the Directorate: RDM, Sub-Directorate: SFR and
the Cradock Team will be required to review results. Facilitation of this review
workshop should come from AsgiSA-EC and the Sub-Directorate: SFR.

Summary Report Final
November 2010
48
Rapid, Intermediate and Comprehensive Reserves must be completed as
promised by the Directorate: RDM. The Sub-Directorate: SFR should monitor
this process.
It was a target of the project to gain greater clarity from the Department of
Agriculture with regards to the reservation of so-called agricultural land, and
especially lands that had previously been under the plough. This has not yet
been achieved – but with mapping results in hand indicating the extent and
impact of these exclusions, there is now a suitable discussion platform.
Discussions need to take place at both national and provincial level.
Register of afforestation and water use for continuous licensing assessments.
6.2.7 Catchment restoration
AsgiSA-EC has suggested the establishment of a catchment restoration programme,
with implementation commencing in the Tsitsa River but aimed at the expansion and
implementation of principles and techniques to all of Water Management Area 12
(Mzimvubu to Keiskamma), and over time to the rest of the province. The proposal is
for an integrated development and public works programme aimed at restoring and
protecting catchment stability.
AsgiSA-EC therefore requested, in February 2010, that the Support Team prepare a
concept document towards the design and implementation of a large-scale public-
works programme aimed at catchment restoration and rehabilitation. This request was
made in the light of the very high levels of sedimentation experienced in most of the
Eastern Cape rivers and possible further investigations of a multi-purpose storage dam
at Ntabelanga on the Tsitsa River.
This concept document was prepared, and placed a strong emphasis on:
(i) ensuring research on both historical and current „LandCare‟ type initiatives and
communication with any current activities; and
(ii) the sustainability of the programme so that there should be a strong emphasis
placed on the hand-over of knowledge and expertise, with incentives to make
this a people-based initiative not entirely dependent on public works input.
AsgiSA-EC has used this material in national and provincial presentations. Some seed
funding has been set aside to take the concept forward. The DBSA is in discussions
with AsgiSA-EC regarding the provision of grant funding to pilot this process.
6.3 FINDINGS AND RECOMMENDED ACTIONS FOR AFFORESTATION DEVELOPMENT
The following is extracted from conclusions derived from the afforestation planning
workshop of 9-10 December 2009, supported by AsgiSA-EC and Teba. The workshop
used inputs generated through the DWA Mzimvubu Development Study.

Summary Report Final
November 2010
49
6.3.1 Findings
1. 16 of 59 quaternaries were assessed at this workshop. These catchments yield
only 16 080 ha of clearly demarcated potential forestry land, with some additional
opportunity for wattle jungle conversion - at this stage a total of <20 000 ha of
forestry land. Some of the quaternaries assessed were considered to be „prime
forestry land‟. Whilst an arrangement may be struck with Agriculture to use old
and unproductive agricultural lands, it is clearly not going to be easy to develop
the expected 100 000 ha of new afforestation sought by both the forestry sector
and the Forestry Branch of the Department of Agriculture, Forestry and Fisheries.
By simple linear extrapolation at best 60 000 ha can be found at the moment. It
is an imperative that this exercise be completed and that outputs be discussed
with the Department of Agriculture.
2. Land, and not water, is the defining constraint in many quaternaries, especially in
the T3 (Mzimvubu) catchments. From the Cradock HydroCalcs more than
enough water is available in many Mzimvubu quaternaries (see spreadsheet -
Table 6.1).
3. There is no single MAJOR forestry area to be found. Areas of suitable land tend
to be relatively small and scattered. Commercial forestry interests today seek a
minimum of 5 000 to 10 000 ha to make up what would be considered to be a
„viable management unit‟. A core forestry area attracting large-scale international
investment would want in the order of 30 000 - 50 000 ha.
Mike Howard (Fractal Forests) argues that nowhere have we yet seen enough
forestry potential to serve as a “catalytic” intervention. There are no 5 000 ha
blocks anywhere – and hence nothing truly “commercial”. The best area
identified so far is in the vicinity of Ntsubane (T60H).
4. If forestry is to happen seriously, it will need to be an integrated development,
requiring negotiated settlement with agriculture and with communities. The move
might best be towards mixed cropping, with forestry part of the agricultural mix.
5. It would never be possible for the forestry companies to manage all the
fragmentary bits of possible forestry that are emerging in the different
quaternaries. The pieces are just not big enough. Companies would have to
focus on helping communities, and not trying to control and administer.
Companies like to have full control over their plantation feedstock, and will have
to get used to a new way of working (some have already taken this step).
Proposed new model: The „command and control‟ model for community forestry
long assumed by the controlling companies does not work. The model proposed
is for individual groups doing forestry by themselves with some company support,
without the land being leased or managed by the companies. Ownership must,
at all levels, stay as far as possible within communities. SAPPI has recently
indicated a willingness to move towards this kind of operational model (i.e. far
less controlling than previously contemplated).

Summary Report Final
November 2010
50
6. It may be possible to find more forestry land on the ground. The Ngele Ridge,
Fort Donald and Gun Drift area that Fractal Forest identified during a ground
survey 15 years ago should be re-investigated as a prospect.
7. With land, rather than water, the key constraint, forestry applications on both
privately held and communal land will have to be favourably considered if
afforestation targets (and promises to the forestry sector) are to be met. It can
be noted that the allocation of forestry water use licences to private (often white)
landholders will not impact on the water resource opportunities of previously
disadvantaged community landholders.
6.3.2 Answers still required
1. Land tenure: Is agricultural land under community control, or is there land that
may have been handed to individuals, families, or groups of families to farm on?
2. Has the impact of jungle wattle been factored at all into the water balance? Can
one assume that this impact has been accounted for and that available water is
based on the existence of jungle wattle?
3. Areas of „high‟ but not „very high‟ biodiversity (orange on the biodiversity maps)
tend to be “intact grasslands” and it remains a question whether all must be
conserved, or whether forestry requirements are so low overall that the loss of a
few of these areas will not be serious, given that so little other land is being
transformed.
4. What is the optimal mix of cropland and timber? To get the balance right quite a
bit of cropland should perhaps go under timber in the long-term, just as KZN
midlands farmers have brought forestry into the agricultural mix.
5. 30 000 ha of forestry licence applications have apparently been submitted to the
Eastern Cape LAAC. This is difficult to reconcile with the apparent scarcity of
forestry land – although such licences may, for example, not exclude agricultural
lands. A review of existing licence applications should be undertaken to assess
whether these are based on fact or fiction.
6.3.3 Next steps
1. Complete the mapping exercise for all quaternaries that show some forestry
potential. This will require that the biodiversity assessment be extended to cover
all quaternaries (AsgiSA-EC). The DWA Cradock Team should now calculate
desktop Reserves and do hydrocalcs to those few catchments still outstanding
(see Table 6.1).
2. Hold discussions with the Eastern Cape Department of Agriculture to determine
whether there is scope for a forest/ farm economic mix. It may be necessary to
repeat the forestry polygon mapping exercise together with Agricultural officials,
for Agriculture to point out areas where there is no vision for commercial
agriculture.

Summary Report Final
November 2010
51
3. Take the expected area of prospective afforestation and apply this to the water
availability model – so that water can be more accurately cascaded down
through the quaternaries. This may result in water becoming available in
quaternaries currently considered closed (this is a desktop exercise).
4. Advise DWA of the likely extent of forestry, and thus water use, according to this
planning tool.
5. Inform DTI of the status quo.
6. Advise the Forestry Branch, and the institution now responsible for the
implementation of the Forestry Sector Transformation Charter, of the revised
expectation for potential forestry development in the Eastern Cape.
6.4 HANDING OVER RESPONSIBILITIES
The Directorate: National Water Resource Planning has been very clear that its
involvement in afforestation planning and support in the water use licensing process is
not its responsibility. Neither should this be the responsibility of the Sub-Directorate:
SFR, but should be taken over by the Forestry Branch of what is now the Department
of Agriculture, Forestry and Fisheries.
The Forestry Branch in 2009 did start to take a proactive role in determinations of
forestry potential nationally, commissioning studies in Limpopo, KZN and Mpumalanga,
and the Central Regions (Gauteng, North West, and Free State). This work was not
extended to the Eastern Cape given the recent SEA, mapping inputs by Sub-
Directorate: SFR and this work by the Mzimvubu Support Project.
It is, however, imperative that the Forestry Branch now takes an active hand in
continually improving the identification and promotion of forestry in areas where there
are no apparent constraints. This requires three things:
(i) Completion of the quaternary catchment land suitability and mapping process;
(ii) Continued high level involvement in all of the processes discussed in this
report: ecological Reserve determinations, biodiversity assessments,
discussions with agricultural authorities, equity, and licensing; and
(iii) A presence on the ground of well-trained forestry extension officers who can
take the suitability maps and work with communities to turn these into a
sustainable reality. Particular attention must be given to technology transfer
and, in the event of company: community arrangements, to ensuring that equity
is indeed the outcome.
The Department of Trade and Industry proposed in its Industrial Policy Action Plan
(18 February 2010) that a national Forestry Task Team should be created, with the
express aim of promoting and establishing forestry. It is important that the
understanding of DWA and AsgiSA-EC with regard to opportunities and constraints to
afforestation be brought to this table.
Summary Report Final
November 2010
52
7 RAINWATER HARVESTING
This task is addressed in a stand-alone report (P WMA 12/000/00/3609) entitled
Rainwater harvesting, where the full details can be found. A summary of this is
included in the rest of this section.
7.1 INTRODUCTION
The Mzimvubu River is the catchment which simultaneously has both the most
available water and the greatest poverty in South Africa. Through the ages its
abundant water has cut deep, steep valleys into the landscape, creating inaccessibility
and remoteness, with major challenges for travel, service provision and most land-
based economic activities. Even water, as abundant as it is, is essentially inaccessible.
In such a landscape, rainwater harvesting techniques are valuable for users to capture
water before it slips beyond economic reach into the deeply incised valleys.
The potential for rainwater harvesting as a water resource in the Mzimvubu
Development Zone was assessed through a desktop study to provide a preliminary
indication of the possibilities to harvest and use rainwater to augment conventional
supplies. The study covers possibilities for four different areas of application, namely
for household use, urban contexts, improved agricultural production and environmental
restoration. The detailed results are given in the Rainwater harvesting stand-alone
report.
The main focus of the study was on the potential for rainwater use for drinking and
household food production at rural and urban homes. Rainfall quantity and seasonal
distribution in the study area is highly favourable for household use of rainwater, while
to date the combination of high capital cost and low water tariffs has inhibited
implementation. However, current trends predict changes in favour of rainwater
harvesting. Firstly new technology recently introduced into South Africa from large-
scale rainwater harvesting implementation in other countries could significantly reduce
the cost of construction. Secondly it would seem inevitable that water tariffs will
increase more quickly over time.
In contrast with rapid progress in other parts of the world, South Africa is lagging
behind with the application of rainwater harvesting in urban contexts, both for public
access buildings and for landscaping and drainage associated with roads, parking
areas and urban beautification. As national implementation experience grows,
improved assessments will become possible. In this report, some possibilities are
discussed for urban contexts like those of Kokstad and Lusikisiki.
The potential for improved rainfed agriculture through increased infiltration of rainwater
into the soil profile is currently central to many agricultural initiatives across the
continent. In the study area, progress has been made with field experimentation with a
specific technique developed by the Free State University called infield rainwater
harvesting. A preliminary indication is given for the potential in the study area for
rainwater harvesting for dryland crop production and improved grazing. An

Summary Report Final
November 2010
53
assessment tool, the Rainfall Harvesting Calculator, has been developed and enables
more detailed planning of rainwater harvesting projects at specific locations in future.
Required sizes of rainwater tanks can be determined for a specific location, based on
fifty years of daily rainfall data for the relevant quaternary catchment, available rainfall
collection area, water requirements and the required reliability of supply.
7.2 NATURAL RESOURCES FOR RAINWATER HARVESTING
Rainfall, topography and collection surfaces are important in the assessment of
rainwater harvesting potential. The Mzimvubu development Zone lies in a summer
rainfall area, and average annual rainfall varies from 600 mm to 1 500 mm across the
study area. To its advantage, rainfall in the winter months is more frequent than in
many other parts of the country, meaning that rainwater tanks are replenished more
often, and dry periods are shorter.
The hilly terrain in large parts of the Mzimvubu Development Zone increases runoff
potential compared to very flat areas. While on flatter slopes it is easier to achieve in
situ infiltration to increase dryland crop yields, the steeper slopes produce more water,
e.g. to channel surface water to underground storage tanks. Through thoughtful layout,
success has been achieved with both applications in the mountains inland of Port St
Johns. Steep drops in topography create opportunities for bio-filtering above the
intakes of rainwater storage tanks, thus improving the quality of stored water and
reducing the required frequency of tank cleaning.
The characteristics of collection surfaces greatly impact rainwater harvesting potential.
Good quality roofing is beneficial for collection of drinking quality water, while thatch
and uneven and rusted roof sheeting presents a limitation. In the landscape, grass
cover is often maintained year round in parts of the Mzimvubu Development Zone,
thanks to the relatively even distribution of rainfall across seasons, which reduces the
surface runoff potential but is an important erosion barrier.
Through judicious application of rainwater harvesting, the landscape can be improved
to help fight erosion and achieve other gains in the context of potential payments for
ecosystem services, which may include water and carbon credits, e.g. for avoided
pumping. Climate change benefits of rangeland improvement are considered highly
significant across the continent (FAO, 2010).
The report covers examples of various different situations in the Mzimvubu
Development Zone and their implications for rainwater harvesting potential and
techniques.
7.3 APPLICABILITY OF RAINWATER HARVESTING IN DIFFERENT SOCIO-
ECONOMIC CONTEXTS
Rainwater harvesting presents an attractive option for households in remote villages or
areas with limited access to water supply infrastructure. The cost of operation and
maintenance of a household rainwater tank is minimal, therefore a once-off capital

Summary Report Final
November 2010
54
investment by the state to install a tank can provide a poor family with a high degree of
water security and independent responsibility. In this context, rainwater harvesting also
enables year round production of fruit and vegetable crops high in micro-nutrients and
therefore key in poor households‟ fight against child malnutrition which is rife in the
study area.
Counter-intuitively, the report also shows that rainwater harvesting becomes even more
affordable and beneficial, for both poor and non-poor households and urban buildings,
in situations where a reliable municipal supply is available and can be used in
conjunction with rainwater harvesting. Smaller, cheaper tanks are needed for
conjunctive use and enable households to save on municipal water bills. This results in
reduced demand on mains supply, which can reduce pressure on over-stretched
municipal systems.
Rainwater harvesting for domestic use is a longstanding practice of many generations
on commercial farms in the Mzimvubu Development Zone, and holds potential for
expansion.
7.4 ECONOMIC VIABILITY OF RAINWATER HARVESTING
The economic viability of a specific rainwater harvesting investment depends on:
(i) how much rainwater can be harvested (which depends on rainfall amounts and
frequency);
(ii) how much it costs to construct rainwater storage capacity; and
(iii) the cost of alternative water supplies, namely cost of supply from the
municipality point of view, and water tariff from the household perspective.
The stand-alone report on Rainwater Harvesting shows unit reference values, payback
periods and the net present values of cost savings over the lifespan of the rainwater
system for a few examples in the Mzimvubu Development Zone.
7.5 PRESENT IMPLEMENTATION OF RAINWATER HARVESTING
The report also presents a brief overview of implementation of rainwater harvesting in
the Mzimvubu Development Zone to date. It includes the construction of household
rainwater tanks at Gogela, Qumbu, Port St Johns and Lubala by the Department of
Water Affairs, the implementation of infield rainwater harvesting by the Eastern Cape
Department of Agriculture and some NGO initiatives. Reference is also made to
current planning by OR Tambo District Municipality and rainwater harvesting initiatives
of neighbouring District Municipalities, like Amathole.

Summary Report Final
November 2010
55
7.6 DEVELOPMENT POTENTIAL FOR RAINWATER HARVESTING
An indication of potential for rainwater harvesting in the Coastal Zone, Great River
Valleys, and other localities within the study area, for agriculture, for household water
uses, and for urban applications is also presented in the report.
Rainwater harvesting for improved agriculture is much less constrained by conventional
factors than irrigation development. Many of the difficulties identified in the Agricultural
assessment and irrigation water use report would not present problems for rainwater
harvesting implementation. For instance, rainwater harvesting can be practiced under
current tenure systems. Freehold or other long-term tenure arrangements are not a
prerequisite. In places pockets of good soils where irrigation development would be
too expensive to construct, operate and maintain, may present specific opportunities
for rainwater harvesting to reduce irrigation requirements, thus contributing to a
reduction or even elimination of irrigation investment requirements.
Key success factors for rainwater harvesting development include respect for people‟s
preferences and dedicated popular education to establish a broad awareness of the
possibilities for rainwater harvesting as a neglected but valuable tradition. Today,
many leading local, national and international politicians embrace workable „green
solutions‟ like rainwater harvesting which can contribute to the „triple bottom line‟:
planet, people and profit, where „profit‟ includes both money made and money saved.
7.7 CONCLUSIONS
The natural resource base in the Mzimvubu Development Zone is favourable for the
implementation of a range of rainwater harvesting applications. The area is
characterised by widespread poverty and a paucity of infrastructure which complicates
the provision of services and economic opportunities. Therefore the potential demand
is high for independent and low maintenance household solutions to improve water,
food and energy security, which can include suitable rainwater harvesting and
renewable energy solutions.
Rainwater harvesting is currently economically viable for specific situations. Viability of
a greater range of applications, techniques and locations is likely to improve over time
as tariffs for alternative supplies are set to increase, and the cost of construction is
expected to decrease as technology thereof improves.
In the light of evolving climate change mitigation mechanisms it is worthwhile to seek
ways in which Payment for Ecosystem Services could help pay for implementation,
thereby improving the prospects for more affordable and sustainable job creation
programmes in environmental restoration.

Summary Report Final
November 2010
56
8 CROP PRODUCTION POTENTIAL IN SA NEIGHBORING COUNTRIES
This task is addressed in a stand-alone report (P RSA 000/00/12510) entitled An
assessment of rain-fed crop production potential in South Africa's neighboring
countries, where the full details can be found. A summary of this is included in the
rest of this section.
South Africa uses 60% of its scarce water resources on irrigation, a substantial portion
of which is used to irrigate crops which are regarded internationally as rain-fed crops.
The question is therefore being asked about the extent of alternative production areas
in southern Africa (particularly in selected neighboring countries) for the range of crops
which are presently produced sub-optimally under irrigation in South Africa.
The objective of this study is therefore to provide an answer to this question with
adequate confidence to allow the rational pursuit of this concept which could have far-
reaching mutual benefit for southern African countries.
The countries that were considered are Mozambique, Zimbabwe, Malawi and Zambia.
The assessment was based on a broad (“desk-top”) regional evaluation of soils,
topography and climate, which were, in turn, used to define and demarcate agro-
ecological zones in which a range of crops can be grown commercially under rain-fed
conditions.
The study used two main characterization systems to define the agro-ecological zones,
namely the climate-based Koppen-Geiger Climate System (KGCS), and the US
Department of Agriculture‟s, Natural Resources Conservation Service - Land
Classification System (LCS). The estimation of crop production areas within the agro-
ecological zones was then refined by the exclusion of reserve land, areas of high
population (urban and peri-urban environments) and areas of unsuitable topography for
crop production. These exclusions are referred to as the “principal exclusions”.
A provision was then made for secondary exclusions which include areas committed to
alternative land-use such as rangeland and afforestation and scattered areas of
unsuitable soils such as wetlands, riverine areas and eroded areas.
This broad assessment revealed that the four target countries possess a net area of
about 26,6 million ha of high-potential rain-fed cropping land (referred to as “Premium”
land use potential) with the following breakdown per country:
Zambia 11,1 million ha
Mozambique 8,8 million ha
Zimbabwe 6,3 million ha
Malawi 0,4 million ha
The rain-fed crop production potential includes a wide range of summer field crops
such as maize, soybean, dry bean, groundnuts and sorghum which are adapted to

Summary Report Final
November 2010
57
parts of all four of the target countries and winter rain-fed field crops such as wheat,
barley and dry pea which can be grown extensively in all the countries except
Mozambique.
The selected neighbouring countries therefore display a rich potential for rain-fed crop
production and, in the context of the SADC countries as a whole, provide a highly
significant opportunity for agricultural development in the region and an opportunity to
substitute high-potential rain-fed crop production for expensive and water-inefficient
irrigation of annual field crops in South Africa.
The four countries experience a number of major socio-economic constraints to the
exploitation of this excellent potential. The constraints include land tenure issues (the
majority of the high potential rain-fed cropping area is occupied by subsistence farmers
on communally owned land), population (the high rural population spread presents a
challenge to commercialisation of agriculture), present land use (widespread
subsistence farming), poor or lacking infrastructure and poor agricultural support
services. However, the constraints are not considered insurmountable. With the
appropriate vision, investment and support from the governments of the respective
countries there are significant opportunities for extensive commercial agricultural
development which could involve and benefit local farmers and their communities. The
recent examples of South African farmers operating successfully in Mozambique and
Zambia, with full government backing, have shown that these constraints can be
overcome.
Whilst the principal objective of this study is to identify areas that are suited to rain-fed
crop production, the existence of a considerable network of largely „un-tapped‟ surface
water resources, especially in Zambia and Mozambique, is highlighted. There is
therefore an opportunity for expanded utilisation of the water resources in these
countries for irrigation where there is a higher irrigation potential, in terms of both soils
and climate, than exists for many of the irrigation areas of South Africa.
9 CONCLUSIONS
There may be considerable potential for water resource development in the
catchment through the implementation of dams, subject to the feasibility of
such developments. Such dams could yield considerable quantities of water
in the Mzimvubu River catchment.
The Eastern Cape region has favourable topography and water availability for
potential pumped storage schemes. A desktop study was conducted to
identify and compare such schemes in the region, and to assess whether any
potential exists to couple a pumped storage scheme with a dam development.
The findings of this pumped storage scheme assessment have been
discussed with Eskom, who could take it forward for more detailed analyses.
The preparatory work conducted has not been focused on water supply to
specific locations, and attention has not been given to the distribution of the

Summary Report Final
November 2010
58
water from the potential dam sites. This is likely to be a significant factor in
the planning of future projects due to the topography of the catchment and
population distribution, and could influence the feasibility of potential
developments.
The hydropower availability is in the order of between 0.5 and 25 MW
continuous power, or between 5 and 250 MW peaking power at an indicative
load factor of 10%. Base load hydropower was found to be generally
expensive per unit installed capacity. The unit costs for peaking power
scenarios ranged between R15 million and R300 million per MW installed.
The intention of the transfer would be to supply water to irrigators in the
western parts of the Eastern Cape through the Orange-Fish Tunnel from
Gariep Dam. At around R7/m3 this water, however, would most likely be far
too expensive for irrigation. The unit cost does not include distribution
infrastructure to the farms. Adding on the distribution infrastructure will further
increase the cost of the water.
Substantial potential exists in the study area for the development of new
agricultural enterprises under rain-fed conditions and for the improvement of
existing agricultural practices and productivity. Whilst opportunity exists for
small irrigation scheme developments, there are several limiting factors with
respect to large irrigation schemes.
The paucity of infrastructure in the area, in particular roads and power, is a
major obstacle to any kind of development.
There is no single major forestry area to be found in the Study Area. Areas of
suitable land tend to be relatively small and scattered. Commercial forestry
interests today seek a minimum of 5 000 to 10 000 ha to make up what would
be considered to be a „viable management unit‟. A core forestry area
attracting large-scale international investment would want in the order of
30 000 to 50 000 ha.
10 RECOMMENDATIONS
Potential dam sites that have shown to be more favourable in this study may
be considered if suitable development scenarios in the region are identified
that can make sustainable use of the water.
An initial focus on the upgrading of rain-fed cultivation and livestock farming
can bring great gains at moderate investment. Land tenure and some
institutional and social systems will, however, have to be addressed.
If forestry is to happen seriously, it will need to be an integrated development,
requiring a negotiated settlement with agriculture and with communities. The
move might best be towards mixed cropping, with forestry part of the
agricultural mix.

Summary Report Final
November 2010
59
It is recommended that rainwater harvesting for the built environment, as well
as cultivated and uncultivated areas in the Mzimvubu Development Zone
should be analysed as a standard component of water supply options for all
economic development options and municipal water supply requirements.
11 REFERENCES
[1] Department of Water Affairs and Forestry (South Africa). 1998. Yield
Analysis: Terms and procedures.
DWAF Report Number P0000/001/98. Report by BKS (Pty) Ltd.
[2] Department of Water Affairs and Forestry (South Africa). 2007. Crocodile
(West) River Catchment: Hydrological Assessment.
DWAF Report Number P WMA 03/000/00/2307. Report by BKS and Arcus
Gibb.
[3] Department of Water Affairs and Forestry (South Africa). 2007. Mzimvubu
River Basin: Water Utilization Opportunities.
DWAF Report Number P WMA 12/000/00/0505. Report by ECH Sellick.
[4] Department of Water Affairs and Forestry (South Africa). 2007. National
Water Resource Strategy. First Edition. September 2004.
[5] Hawkins Associates, (1980). The physical and spacial basis for Transkei’s
first five year development plan. Salisbury, Rhodesia