Assessing Governmental Capabilities to Manage European Affairs: The Case of Lithuania
Upload
gamtostyrimaiCategory
view
1download
0
Myxomycetes in a forest affected by great cormorant colony:a case study in Western Lithuania
Gražina Adamonytė & Reda Iršėnaitė &
Jurga Motiejūnaitė & Ričardas Taraškevičius &
Dalytė Matulevičiūtė
Received: 25 June 2012 /Accepted: 31 August 2012 /Published online: 15 September 2012# Mushroom Research Foundation 2012
Abstract Myxomycete distribution patterns were investi-gated in a colony of great cormorants (Phalacrocorax carbosinensis) established in a pine forest in the Curonian Spit,western Lithuania. Ornithogenic impact on the forestresulted both in vegetation changes and altered types andcharacteristics of myxomycete substrata. The lowest myxo-mycete species richness was found in the most active part ofthe colony with the newest and most numerous nests. Themyxomycete assemblages of the active part of the colonyalso showed the biggest differences from the reference zone(oligotrophic pine forest). The general abundance of myx-omycetes in the territory of the colony was higher due to thepresence of the species that are not characteristic of pineforests. The most abundant species in the territory wereBadhamia apiculospora and Perichaena cf. corticalis.Along with other facultative coprophiles, such rare speciesas Comatricha mirabilis and Arcyria leiocarpa were foundsporulating in the colony. The Bray-Curtis ordinationrevealed a tripole gradient of myxomycete distribution inthe colony. It was hypothesized that the first continuum mayreflect myxomycete assemblage transition from hypertro-phic to oligotrophic habitat; the second continuum mayreflect myxomycete assemblage distribution from habitatswith limited diversity of available substrata, extreme levelsof nutrients and high pH to habitats with high diversity of
available substrata, moderate to high levels of nutrients andpH, and the third continuum may reflect myxomycete as-semblage distribution from habitats with lower diversity ofavailable substrata, low levels of nutrients and pH to hab-itats with high diversity of available substrata, moderate tohigh levels of nutrients and pH.
Keywords Bird colony .Hypertrophication .Mycetozoans .
Slime moulds
Introduction
Myxomycetes are heterotrophic eukaryotes characterized bya relatively primitive organization. They feed mainly onbacteria and other microorganisms and can be found invirtually all terrestrial ecosystems (Stephenson 2011).Myxomycetes fall into several ecological groups with dif-ferent environmental requirements. Some of them preferdecaying wood, ground or aerial litter, others can be foundon bark of living trees and can survive even under urbanpollution. A comparatively small group of coprophilousmyxomycetes inhabits dung of herbivorous animals—a sub-strate with high pH values and rich in nutrients. The data oncoprophilous myxomycetes come from various regions ofthe world and are presented as local checklists (e.g. Cox1981; Andrade Bezerra et al. 2008) or scattered in a numberof regional surveys (e.g. Novozhilov et al. 2003; Koshelevaet al. 2008; Novozhilov and Schnittler 2008). Completechecklists on coprophilous myxomycetes at different timeshave been issued by Eliasson and Lundqvist (1979),Eliasson and Keller (1999) and Eliasson (2012) reflectingthe accumulation of knowledge on this group of myxomy-cetes. In other ecological groups, myxomycete existenceand distribution patterns in highly eutrophic environment
G. Adamonytė (*) :R. Iršėnaitė : J. Motiejūnaitė :D. MatulevičiūtėInstitute of Botany, Nature Research Centre,Žaliųjų Ežerų Str. 49,LT-08406 Vilnius, Lithuaniae-mail: [email protected]
R. TaraškevičiusInstitute of Geology and Geography, Nature Research Centre,Ševčenkos Str. 13,LT-03223 Vilnius, Lithuania
Fungal Diversity (2013) 59:131–146DOI 10.1007/s13225-012-0203-8
have never been investigated in detail except for a study onmyxomycetes on Neotropical herb inflorescences rich inphosphorus, potassium and some other elements and havinga basic pH (Schnittler and Stephenson 2002).
It is well documented that by establishing breeding col-onies in forest stands, piscivorous birds act as vectors in thetransfer of material between aquatic and terrestrial ecosys-tems and particularly influencing biogeochemical cycling ofnitrogen and phosphorus that are found in high concentra-tions in guano (Osono et al. 2002). The birds are known todrop amounts of N and P as excreta which may exceed byapprox. 10,000 times and 120,000 times respectively thoseof the ordinary input by precipitation (Kameda et al. 2000).Birds feeding on fish in the aquatic zone deposit their wasteon the terrestrial parts of their habitats thus leading toextraordinary high levels of nutrients in soils and othersubstrates (Garcia et al. 2002; Osono et al. 2006;Breuning-Madsen et al. 2010; Kolb et al. 2010). A cumula-tive effect of ornithogenic disturbances in forests is treedeath due to ammonia poisoning and formation of gladesdensely overgrown by tall herbaceous plants (Laiviņš andČekstere 2008; Garcia et al. 2011). Bird guano increases soilfertility, indirectly affecting plants’ nutrient content and theirprimary productivity, however in the most active parts of thecolony, plant biomass is lower than in the areas abandonedby birds as a result of ammonia poisoning (Kolb et al. 2010).It was shown that a direct result of ornithogenic nutrientinput is the arrival of elders (Sambucus spp.) which rapidlyform dense shrub communities replacing dead forest in thepost-colony areas (Źółkóś and Markowski 2006).
In 1989, a continental subspecies of the great cormorant(Phalacrocorax carbo sinensis) settled down in the CuronianSpit (western Lithuania), and then expanded into what iscurrently the largest breeding colony in Lithuania. Togetherwith a small, stable colony of grey herons (Ardea cinerea), thegreat cormorants occupy an area of coniferous forest morethan 700 m long and 370 m wide, with over 3,300 nests (M.Dagys, pers. com.). The colony is located in an old-growthforest, part of a protected area in KuršiųNerija (Curonian Spit)National Park. Trees there die away fast, affected by theexcrements of the cormorants and the colony expands circu-larly by occupying new trees, thus increasing the area of thedestroyed forest (Žydelis et al. 2002). The rapidly expandingcolony receives strong public attention as an attraction site,but concerns local fishing industry and environmentalistsbecause of its impact on protected forest and fish resourcesin the Curonian Lagoon. This ambiguous reaction prompted aproject aiming to investigate changes in the biotic and abioticcomponents of a forest ecosystem induced by a cormorantcolony and myxomycetes were among the study objects. Thepurpose of the research presented in this paper was to studymyxomycete species distribution patterns under the influenceof hypertrophication.
Materials and methods
Study site
The study was carried out in the Curonian Spit peninsula inwestern Lithuania. The peninsula is an elongated stretch ofsand dunes extending over 98 km into the Baltic Sea with awidth varying from 400 m at its narrowest point to 3.8 km atits widest, and attaining an altitude of 60 m. The Spitformation started in the Middle Holocene, when a hill ridgecomposed of till loam emerged from sea as several islands.Later, due to aeolian processes and sea level oscillations, theintervals between the islands were filled with sand. The finalstructure of the present spit was formed about 3500 BC(Kabailienė et al. 2009). The climate in the Curonian Spitis an intermediate between marine and continental with amean annual precipitation of 725 mm and mean annualair temperatures ranging from 16.6 to 16.8 °C in Juneand August to –2.8 to –2.6 °C in January and February(Galvonaitė et al. 2007). Seventy percent of the Spit landis covered by forests with prevailing conifers (80 %). Smallfragments of old growth Pinus sylvestris forest can be foundon parabolic dunes.
Study plots were established in the great cormorant col-ony that is located throughout an upper part of the duneridge (alt. up to 34 m), down to dune slope terraces and adune hollow (alt. 0–2 m) at 21°06′E 55°31′N. The upperpart of the colony originally was a ca. 110 years old- and onslope terraces a ca. 230 years old pine forest of Empetronigri–Pinetum (Libb. et Siss. 1939 n.n.) Wojt. 1964 associ-ation, growing on nutrient-poor sandy soil. The dune hollowwas formerly occupied by 230 years old pine and spruceforest, developed on temporarily wet mesotrophic soils(Jončys and Paulaitis 1987). On the dune slope P. sylvestristrees are currently dead or dying, in the dune hollow P.sylvestris trees are dead along with rapildy perishing sparseyoung Picea abies trees.
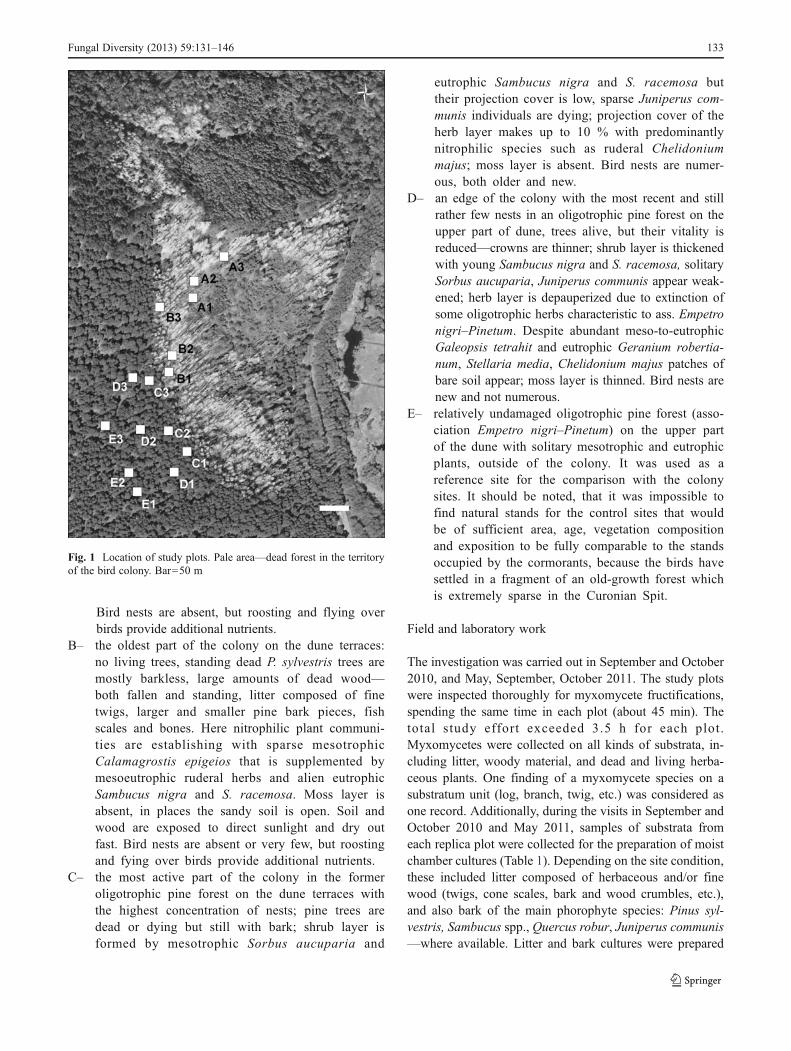
Five zones of investigation were chosen considering for-est and soil type, age and slope exposition, and differentdegrees of activity of the bird colony. Three replica plots(500 m2 each) were established in each of the zones (Fig. 1):
A– the oldest part of the colony in the dune hollow:formerly a pine and spruce forest on mesotrophictemporarily wet soil, coniferous trees are now dead,few young Picea abies, Quercus robur, Betula pubes-cens are still alive but partly dried out, a large part ofthe area is overgrown with tall mesophilic and inplaces hygrophilic mesotrophic and eutrophic herbsas well as Sambucus nigra and S. racemosa shrubs;standing and fallen barkless pine deadwood is abun-dant but in places overshadowed with herbs andbushes which also provide better humidity retention.
132 Fungal Diversity (2013) 59:131–146
Bird nests are absent, but roosting and flying overbirds provide additional nutrients.
B– the oldest part of the colony on the dune terraces:no living trees, standing dead P. sylvestris trees aremostly barkless, large amounts of dead wood—both fallen and standing, litter composed of finetwigs, larger and smaller pine bark pieces, fishscales and bones. Here nitrophilic plant communi-ties are establishing with sparse mesotrophicCalamagrostis epigeios that is supplemented bymesoeutrophic ruderal herbs and alien eutrophicSambucus nigra and S. racemosa. Moss layer isabsent, in places the sandy soil is open. Soil andwood are exposed to direct sunlight and dry outfast. Bird nests are absent or very few, but roostingand fying over birds provide additional nutrients.
C– the most active part of the colony in the formeroligotrophic pine forest on the dune terraces withthe highest concentration of nests; pine trees aredead or dying but still with bark; shrub layer isformed by mesotrophic Sorbus aucuparia and
eutrophic Sambucus nigra and S. racemosa buttheir projection cover is low, sparse Juniperus com-munis individuals are dying; projection cover of theherb layer makes up to 10 % with predominantlynitrophilic species such as ruderal Chelidoniummajus; moss layer is absent. Bird nests are numer-ous, both older and new.
D– an edge of the colony with the most recent and stillrather few nests in an oligotrophic pine forest on theupper part of dune, trees alive, but their vitality isreduced—crowns are thinner; shrub layer is thickenedwith young Sambucus nigra and S. racemosa, solitarySorbus aucuparia, Juniperus communis appear weak-ened; herb layer is depauperized due to extinction ofsome oligotrophic herbs characteristic to ass. Empetronigri–Pinetum. Despite abundant meso-to-eutrophicGaleopsis tetrahit and eutrophic Geranium robertia-num, Stellaria media, Chelidonium majus patches ofbare soil appear; moss layer is thinned. Bird nests arenew and not numerous.
E– relatively undamaged oligotrophic pine forest (asso-ciation Empetro nigri–Pinetum) on the upper partof the dune with solitary mesotrophic and eutrophicplants, outside of the colony. It was used as areference site for the comparison with the colonysites. It should be noted, that it was impossible tofind natural stands for the control sites that wouldbe of sufficient area, age, vegetation compositionand exposition to be fully comparable to the standsoccupied by the cormorants, because the birds havesettled in a fragment of an old-growth forest whichis extremely sparse in the Curonian Spit.
Field and laboratory work
The investigation was carried out in September and October2010, and May, September, October 2011. The study plotswere inspected thoroughly for myxomycete fructifications,spending the same time in each plot (about 45 min). Thetotal study effort exceeded 3.5 h for each plot.Myxomycetes were collected on all kinds of substrata, in-cluding litter, woody material, and dead and living herba-ceous plants. One finding of a myxomycete species on asubstratum unit (log, branch, twig, etc.) was considered asone record. Additionally, during the visits in September andOctober 2010 and May 2011, samples of substrata fromeach replica plot were collected for the preparation of moistchamber cultures (Table 1). Depending on the site condition,these included litter composed of herbaceous and/or finewood (twigs, cone scales, bark and wood crumbles, etc.),and also bark of the main phorophyte species: Pinus syl-vestris, Sambucus spp., Quercus robur, Juniperus communis—where available. Litter and bark cultures were prepared
Fig. 1 Location of study plots. Pale area—dead forest in the territoryof the bird colony. Bar050 m
Fungal Diversity (2013) 59:131–146 133

following Härkönen (1977). Cultures were maintained untilno new species appeared, usually not less than 3 months forbark cultures and 4 months for litter ones. In cases of largeplasmodia, cultures were kept until sporocarps developed ora plasmodium died. The total number of bark cultures was333, and the total number of litter cultures—225. FollowingHärkönen and Uotila (1983), the ocurrence of one species inone culture (one Petri dish) was considered as one record.
Myxomycete taxonomy follows that of Nannenga-Bremekamp (1991), nomenclature follows that of Lado(2005–2012). Abbreviations of the authors of myxomycetenames are cited according to Brummitt and Powell (1992).
Voucher specimens of each myxomycete species weredeposited at the Herbarium of Institute of Botany, NatureResearch Centre (BILAS), Vilnius.
Environmental analysis
Within the scope of the project, contents of 19 elementswere analysed in soil, and 9 elements in Pinus sylvestrisbark and fine wood debris consisting of fragments of deadfallen twigs. Distribution of most of the elements did notshow clear tendencies, therefore they were not employed inan analysis of myxomycete distribution patterns. Total phos-phorus (P), total nitrogen (N) and calcium (Ca) contentswere chosen as the elements playing the key role inecosystems.
For the chemical analysis, topsoil cumulative sampleswere air-dried, mixed and sieved through a 2 mm sieve.From each sample two independent subsamples of 5 g weretaken and ground by MM 400 mill with zirconium oxide
Table 1 Environmental characteristics of different zones of the cormorant colony. Mean values and standard deviation (in brackets) are presented
Environmental characteristics Zones
A B C D E
No of cormorant nests 0 0.3(±0.5) 6.8(±2.4) 5.2(±1.2) 0
Pinus sylvestris bark
pH * 6.62(±0.09) 6.88(±0.06) 6.69(±0.13) 5.40(±0.09)
N, g/kg * 10.19(±0.05) 9.20(±1.19) 8.52(±0.60) 7.34(±0.77)
P, g/kg * 5.17(±0.64) 4.12(±0.11) 2.52(±0.90) 0.75(±0.01)
Ca, g/kg * 44.69(±2.03) 34.36(±3.37) 25.79(±0.90) 18.39(±2.08)
Sambucus spp. bark
pH 7.26(±0.26) 7.22(±0.15) 7.06(±0.17) * *
Juniperus communis bark
pH * * 7.90(±0.10) 7.14(±0.37) 6.55(±0.48)
Quercus robur bark
pH 6.02(±0.48) * * * *
Pinus sylvestris coarse wood
Volume (m3) 2.565(±1.485) 6.165(±0.985) 0.011(±0.009) 0.009(±0.004) 0.196(±0.162)
pH (inner wood, <1 cm deep) 4.22(±0.11) 4.09(±0.49) 4.76(±0.53) 4.12(±0.30) 4.10(±0.21)
pH (surface wood, up to 1 cm thick) 5.00(±1.03) 6.13(±0.61) 6.28(±0.24) 6.09(±0.66) 4.20(±0.30)
Fine wood debris
N, g/kg 5.56(±0.18) 7.51(±0.88) 5.64(±0.52) 5.66(±0.77) 5.33(±0.27)
P, g/kg 10.26(±9.05) 29.20(±11.11) 13.69(±2.17) 4.16(±1.76) 1.26(±0.07)
Ca, g/kg 44.16(±26.73) 95.15(±29.19) 52.16(±7.74) 26.56(±7.39) 8.32(±1.62)
Soil
pH 3.36(±0.28) 4.13(±0.20) 3.47(±0.09) 3.41(±0.02) 3.36(±0.17)
N, g/kg 2.87(±1.56) 1.57(±0.73) 1.60(±0.27) 1.66(±0.27) 1.47(±0.40)
P, g/kg 0.93(±0.61) 0.39(±0.03) 0.35(±0.03) 0.29(±0.01) 0.28(±0.02)
Ca, g/kg 1.28(±1.28) 0.56(±0.09) 0.45(±0.09) 0.55(±0.09) 0.62(±0.14)
Litter
pH 6.98(±0.13) 7.14(±0.08) 7.21(±0.08) 7.03(±0.09) 6.27(±0.23)
* respective woody plant species was absent
134 Fungal Diversity (2013) 59:131–146

grinding jars and grinding balls. The time of grinding was10 min, frequency was 27 Hz. The ground material (4 g)was mixed with 0.9 g of Licowax binder and homogenizedfor 20 h. For analysis, two pellets of 32 mm diameter wereprepared by pressing from each mixture and used for P andCa analysis. Mean value of both measurements was used forfurther calculations. Surface layer of P. sylvestris bark wasair-dried and crushed by hand in agate mortar to pieces assmall as possible. This material was pre-concentrated by dryashing at 240 °C. Surface layer up to 1.5 cm thick of finewood debris was scraped with a ceramic knife and preparedfor further chemical analysis in the same manner as pinebark. Further preparation of both types of substrata for P andCa analysis were carried out following the same protocol asfor topsoil.
Measurement of total amount of P and Ca was performedwith EDXRF equipment SPECTRO XEPOS usingTurboquant method for pressed pellets and calibration proce-dure elaborated by manufacturers (software “X-LabPro 4.5”).Within International Plant-Analytical Exchange programme(organized by Wageningen university, year exchange 2009–2010) standards BCR 060 and BCR 482 were prepared paripassu and used for preparing calibration curves.
Contents of total nitrogen (N) were measured followingKjeldahl method at Labtarna chemical laboratory, Vilnius.The samples were prepared following standard ISO6498:1998, content of total nitrogen was determined follow-ing standard LST EN ISO 5983-1:2005. Tecator 2200 KjeltecAuto Distillator and titrator Schott TitroLine 96 wereemployed for distilling and titration of the sample solutions.
Volume of coarse wood debris (CWD) was evaluated ineach sample plot. All units of dead P. sylvestris wood (fallenbranches and trunks, dead standing trees, snags and stumps)of large-end diameter minimum 5 cm and length minimum50 cm were considered. Only units (or their parts) located inthe sample plot were measured. Diameter of standing deadtrees was measured at breast height (1.3 m) and the heightwas estimated with a hypsometer. Diameter of both ends andlength was measured for branches, logs and small standingtrees. Volume of each unit of wood debris was calculated byusing a formula presented by Eräjää et al. (2010).
Litter and bark pH was measured with IQ–150 pH-meterequipped with Hamilton Flatrode pH Electrode in litter andbark cultures after water was poured out. Coarse wood debris(P. sylvestris logs) pH was measured in the same manner,taking samples of inner and outer wood to the laboratory.
Data analysis
To compare myxomycete assemblages in different zones,several parameters were calculated for each zone, i.e. 1)mean number of species per one plot of the zone, 2)percent of positive moist chamber cultures for bark and
litter components of each zone and for each substrate ineach zone, 3) species number per one culture (one Petridish). The estimated myxomycete species richness ofdifferent zones was calculated using a non-parametricincidence-based Chao 2 estimator of species richnesswhich is considered to be the most suitable for fungaldata (Unterseher et al. 2008). Sampling adequacy wasassessed by dividing a number of species recorded in agiven zone by an expected number of species (Chao 2)and multiplied by 100 to obtain a percentage. To quan-tify myxomycete species diversity in different zones,
Shannon-Wiener diversity index H 0 ¼ �PS
i¼1pi log pi and
evenness E ¼ H 0= ln S were calculated, where H′ isShannon-Wiener diversity index, E–evenness, S–totalnumber of species, pi–the proportion of abundance ofi-th (each) species (Zak and Willig 2004).
To compare myxomycete assemblages between pairs ofdifferent zones Sørensen’s similarity coefficient (Ss) wascalculated using the formula Ss ¼ 2W= Aþ Bð Þ , where Wis the shared abundance and A and B are the sum ofabundances in individual sample units. PC-ORD statisticalsoftware calculated a Sørensen distance (Sd) matrix andvalues of this matrix were converted to a similarity matrixby substracting from one (similarity01–Ss).
To explore relationships of different plots of the surveybased on their myxomycete species similarity and thus toreveal possible most important gradients, Bray-Curtis(Polar) ordination was employed using Sørensen distancesand objectively selecting axis.
To define relationships between myxomycete species andenvironmental variables, Nonmetric MultidimentionalScaling (NMS) was applied. Species with only one occur-ence were excluded from the analysis. NMS was performedwith a random starting configuration and was run usingSørensen distance measure with 500 iterations in each of250 runs of real data. Joint biplots showed the grouping ofsites and environmental variables as vectors that were deter-minated by the Kendell’s tau correlation, where the strengthof the association was relative to vector length. All statisticalanalysis was performed by PC-ORD v. 4.01 (McCune andMefford 1999), except of Chao 2 which was calculatedusing EstimateS (Colwell 2005).
Results
Environmental characteristics of the study site
Three replica plots were established in a nearby oligotrophicpine forest as a control for the study. However, already inthe spring of the second study year (2011), it became clearthat expansion of the cormorant colony was much more
Fungal Diversity (2013) 59:131–146 135
rapid than expected; the zone designated for the control startedto be subjected to casual passages of cormorants.Nevertheless, we found that most myxomycete species char-acteristic to the natural forests of this type were present in thissite and therefore we proceeded to use it as a reference zone.
Examination of pH in the plots showed that the highestvalues of pH of Pinus sylvestris bark, and for both inner andsurface wood of Pinus sylvestris logs, were found in thezone C, while pH of Sambucus spp. bark was highest in thezone A. Litter pH reached the highest values in the zone C.Acid soils are typical of Pinus-dominated forests and theyremained so in all the investigated zones, but in the zone BpH values were slightly higher.
Analysis of the nutrient content in bark and wood showed agradient in the colony, reaching the level peak in the zone B.For soil, however, the peak was reached in the A zone. In thiszone, soils of the former mixed stand were originally richer innutrients and additionally were supplemented by direct birdinfluence and by an increased runoff from the more elevatedparts of the colony. The studied environmental characteristicsof the study site are summarized in the Table 1.
Species composition and distribution patterns
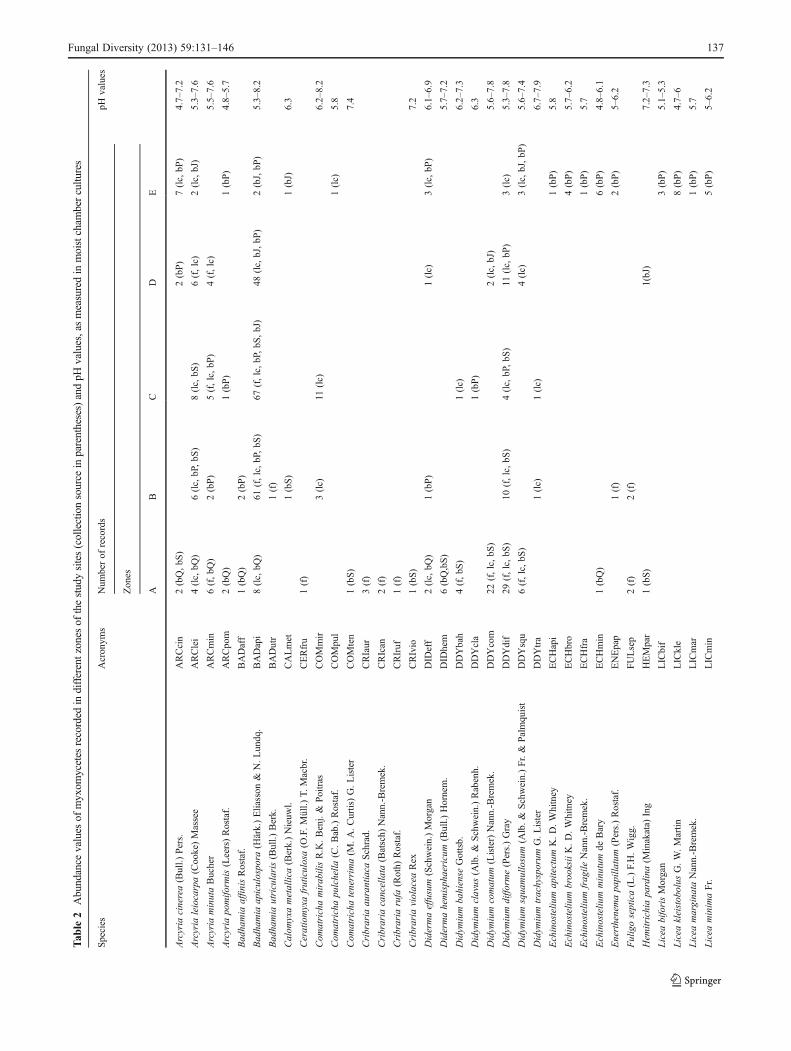
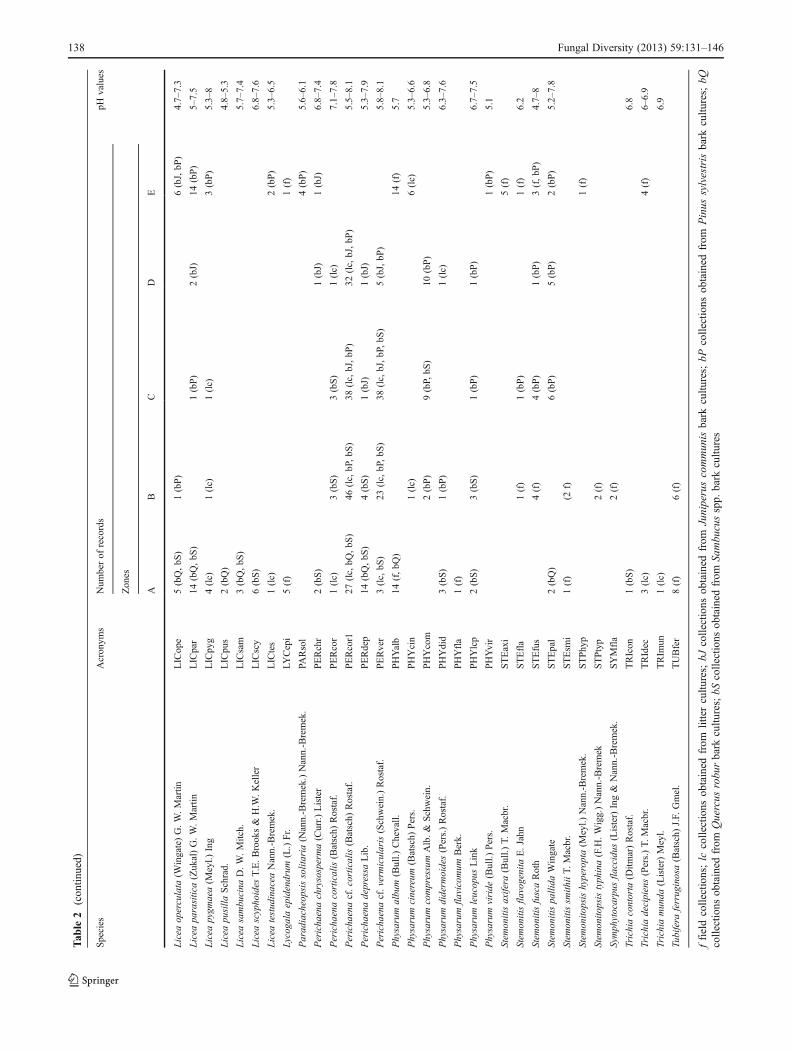
In total, 1,000 records were obtained from the field samplingand laboratory cultivation of the main substrata of myxo-mycetes. These included 105 plasmodia (respectively: incultures from zone A–13 plasmodia, B–25, C–27, D–19,E–21) that failed to develop into identifiable fructificationsdespite supplying them with sterile oat flakes and suspen-sion of Escherichia coli, as well as 11 specimens thatdeveloped in cultures but were represented by too scantymaterial for identification or were devoured by nematodsbefore the full maturity: Echinostelium sp. (1), Licea spp.(3), Paradiacheopsis sp. (1), Physarum spp. (4), Stemonitisspp. (2). Both plasmodia and immature specimens wereexcluded from the further analysis. Eight hundreed eightyfour records (107 field records and 777 culture records)were ascribed to 68 species (Table 2).
Part of the collections were tentatively attributed toPerichaena cf. corticalis and P. cf. vermicularis. The firstgroup ascribed to P. cf. corticalis rarely developed a doubleperidium with a typical thick layer of calcium and refusematerial and a dehiscence line. Usually the peridium wassingle, membranous with little refuse material, sporocarps inloose groups or even scattered, irregular, up to 0.5 mmdiam., capillitium sparse, of short threads composed ofirregularly superimposed “beads”, and spores covered withdense spines. Along with this type, a few records of typicalP. corticalis were obtained. A set of specimens ascribed to P.cf. vermicularis differed from the species descriptions byhaving a single membranous peridium, scanty capillitiumand olive-ochraceous spores with sparse and irregularly
arranged conspicuous warts. Both populations of P. cf.corticalis and P. cf. vermicularis steadily displaying men-tioned characters presumably represented local strains of thespecies.
The most frequent species overall were Badhamia apicu-lospora (186 records), Perichaena cf. corticalis (143),Perichaena cf. vermicularis (69), Didymium difforme (57),Licea parasitica (31), Physarum album (28), Arcyria leio-carpa (26), Didymium comatum (24), Physarum compres-sum (21), Perichaena depressa (20). Arcyria leiocarpa,Badhamia apiculospora, Comatricha mirabilis and Liceascyphoides were found here for the first time in Lithuania.
Myxomycete species richness was highest in the zone A,with an average of 28 species found per one plot and total of44 species in the zone. The lowest richness was in the zonesB and C (12.3 species per plot and 20 species for each of thezones) (Table 3). According to the Chao 2 richness estima-tor, from 24 to 49 species (corresponding to zone C andzone A respectively) could be expected in different zonesand 81 species in all the investigated area. If so, the surveycompleteness reached 84 % for all the area. The highestsampling completeness value was found for the zone A(89.5 %) and the lowest one for zone D (71.4 %).Myxomycete species diversity (H’) decreased from the zoneA (2.92) towards zone C (1.94) and again increased towardszone E (2.80). The same trend was noted for the speciesevenness, although the lowest value of the index was foundfor the zone B. The lowest value of the species similarityindex was found for the zones C and E (0.10), the highestone—for the zones B and C (0.76) (Table 4).
The Bray-Curtis ordination of the plots in the species spacerevealed relationships of myxomycete assemblages in thecormorant colony and showed continuums from zone C tozone E, from C to A, and from E to A (Fig. 2). Examiningcorrelations of individual species with each axis helps toclarify these trends. Some species had higher abundance inB–D plots both on bark and in litter, e.g. Arcyria leiocarpa,Badhamia apiculospora, Comatricha mirabilis, Perichaenacf. vermicularis and others, while in E plots typical barkspecies Licea kleistobolus, L. biforis, Paradiacheopsis solita-ria prevailed and species characteristic to acidic bark, such asEchinostelium brooksii and E. fragile were present. In addi-tion, the continua C–A and E–A reflected a notable increase inabundance of Sambucus bark inhabitants, such as Licea sam-bucina and L. scyphoides, herbaceous litter species Trichiamunda, Comatricha tenella, Didymium spp. and coarse woodinhabitants Cribraria aurantiaca and C. rufa at the A end.
Considering the habitat requirements of species in the polesof the gradients, it was hypothesized that the C–E continuummay reflect a myxomycete assemblage transition from a hy-pertrophic to an oligotrophic habitat and C–A continuum mayreflect myxomycete assemblage distributions from habitatswith limited diversity of available substrata, extreme levels
136 Fungal Diversity (2013) 59:131–146
Tab
le2
Abundance
values
ofmyxom
ycetes
recorded
indifferentzones
ofthestudysites(collectionsource
inparentheses)andpH
values,asmeasuredin
moistcham
bercultu
res
Species
Acronym
sNum
berof
records
pHvalues
Zones
AB
CD
E
Arcyria
cinerea(Bull.)
Pers.
ARCcin
2(bQ,bS
)2(bP)
7(lc,bP
)4.7–
7.2
Arcyria
leiocarpa(Cooke)Massee
ARClei
4(lc,bQ
)6(lc,bP,bS
)8(lc,bS
)6(f,lc)
2(lc,bJ)
5.3–
7.6
Arcyria
minutaBucher
ARCmin
6(f,bQ
)2(bP)
5(f,lc,bP
)4(f,lc)
5.5–
7.6
Arcyria
pomifo
rmis(Leers)Rostaf.
ARCpom
2(bQ)
1(bP)
1(bP)
4.8–
5.7
Badhamia
affin
isRostaf.
BADaff
1(bQ)
2(bP)
Badhamia
apiculospora
(Härk.)Eliasson
&N.Lundq.
BADapi
8(lc,bQ
)61
(f,lc,bP,bS
)67
(f,lc,bP,bS
,bJ)
48(lc,bJ,bP
)2(bJ,bP
)5.3–
8.2
Badhamia
utricularis(Bull.)
Berk.
BADutr
1(f)
Calom
yxametallica(Berk.)Nieuw
l.CALmet
1(bS)
1(bJ)
6.3
Ceratiomyxafruticulosa(O
.F.Müll.)
T.Macbr.
CERfru
1(f)
Com
atrichamirabilisR.K.Benj.&
Poitras
COMmir
3(lc)
11(lc)
6.2–
8.2
Com
atrichapulchella
(C.Bab.)Rostaf.
COMpul
1(lc)
5.8
Com
atrichatenerrima(M
.A.Curtis)G.Lister
COMten
1(bS)
7.4
Cribraria
aurantiaca
Schrad.
CRIaur
3(f)
Cribraria
cancellata
(Batsch)
Nann.-Bremek.
CRIcan
2(f)
Cribraria
rufa
(Roth)
Rostaf.
CRIruf
1(f)
Cribraria
violacea
Rex
CRIvio
1(bS)
7.2
Didermaeffusum
(Schwein.)Morgan
DID
eff
2(lc,bQ
)1(bP)
1(lc)
3(lc,bP
)6.1–
6.9
Didermahemisphaericum
(Bull.)
Hornem.
DID
hem
6(bQ,bS)
5.7–
7.2
Didym
ium
bahiense
Gottsb.
DDYbah
4(f,bS
)1(lc)
6.2–
7.3
Didym
ium
clavus
(Alb.&
Schwein.)Rabenh.
DDYcla
1(bP)
6.3
Didym
ium
comatum
(Lister)Nann.-Bremek.
DDYcom
22(f,lc,bS
)2(lc,bJ)
5.6–
7.8
Didym
ium
diffo
rme(Pers.)Gray
DDYdif
29(f,lc,bS
)10
(f,lc,bS
)4(lc,bP,bS
)11
(lc,bP
)3(lc)
5.3–
7.8
Didym
ium
squamullosum
(Alb.&
Schwein.)Fr.&
Palmquist
DDYsqu
6(f,lc,bS
)4(lc)
3(lc,bJ,bP
)5.6–
7.4
Didym
ium
trachysporum
G.Lister
DDYtra
1(lc)
1(lc)
6.7–
7.9
Echinosteliu
mapitectum
K.D.Whitney
ECHapi
1(bP)
5.8
Echinosteliu
mbrooksiiK.D.Whitney
ECHbro
4(bP)
5.7–
6.2
Echinosteliu
mfragile
Nann.-Bremek.
ECHfra
1(bP)
5.7
Echinosteliu
mminutum
deBary
ECHmin
1(bQ)
6(bP)
4.8–
6.1
Enerthenemapapilla
tum
(Pers.)Rostaf.
ENEpap
1(f)
2(bP)
5–6.2
Fuligoseptica(L.)F.H.Wigg.
FULsep
2(f)
2(f)
Hem
itrichiapardina(M
inakata)
Ing
HEMpar
1(bS)
1(bJ)
7.2–
7.3
Licea
biforisMorgan
LICbif
3(bP)
5.1–
5.3
Licea
kleistobolus
G.W.Martin
LICkle
8(bP)
4.7–
6
Licea
marginata
Nann.-Bremek.
LICmar
1(bP)
5.7
Licea
minimaFr.
LICmin
5(bP)
5–6.2
Fungal Diversity (2013) 59:131–146 137
Tab
le2
(con
tinued)
Species
Acronym
sNum
berof
records
pHvalues
Zones
AB
CD
E
Licea
operculata
(Wingate)G.W.Martin
LICope
5(bQ,bS
)1(bP)
6(bJ,bP
)4.7–
7.3
Licea
parasitica(Zukal)G.W.Martin
LICpar
14(bQ,bS
)1(bP)
2(bJ)
14(bP)
5–7.5
Licea
pygm
aea(M
eyl.)
Ing
LICpyg
4(lc)
1(lc)
1(lc)
3(bP)
5.3–
8
Licea
pusilla
Schrad.
LICpus
2(bQ)
4.8–
5.3
Licea
sambucina
D.W.Mitch.
LICsam
3(bQ,bS
)5.7–
7.4
Licea
scyphoides
T.E.Brooks&
H.W
.Keller
LICscy
6(bS)
6.8–
7.6
Licea
testudinacea
Nann.-Bremek.
LICtes
1(lc)
2(bP)
5.3–
6.5
Lycogala
epidendrum
(L.)Fr.
LYCepi
5(f)
1(f)
Paradiacheopsissolitaria
(Nann.-Bremek.)Nann.-Bremek.
PARsol
4(bP)
5.6–
6.1
Perichaenachrysosperma(Curr.)
Lister
PERchr
2(bS)
1(bJ)
1(bJ)
6.8–
7.4
Perichaenacorticalis(Batsch)
Rostaf.
PERcor
1(lc)
3(bS)
3(bS)
1(lc)
7.1–
7.8
Perichaenacf.corticalis(Batsch)
Rostaf.
PERcor1
27(lc,bQ
,bS
)46
(lc,bP,bS
)38
(lc,bJ,bP
)32
(lc,bJ,bP
)5.5–
8.1
Perichaenadepressa
Lib.
PERdep
14(bQ,bS
)4(bS)
1(bJ)
1(bJ)
5.3–
7.9
Perichaenacf.verm
icularis(Schwein.)Rostaf.
PERver
3(lc,bS
)23
(lc,bP,bS
)38
(lc,bJ,bP,bS
)5(bJ,bP
)5.8–
8.1
Physarum
album
(Bull.)
Chevall.
PHYalb
14(f,bQ
)14
(f)
5.7
Physarum
cinereum
(Batsch)
Pers.
PHYcin
1(lc)
6(lc)
5.3–
6.6
Physarum
compressum
Alb.&
Schwein.
PHYcom
2(bP)
9(bP,bS
)10
(bP)
5.3–
6.8
Physarum
diderm
oides(Pers.)Rostaf.
PHYdid
3(bS)
1(bP)
1(lc)
6.3–
7.6
Physarum
flavicomum
Berk.
PHYfla
1(f)
Physarum
leucopus
Link
PHYlcp
2(bS)
3(bS)
1(bP)
1(bP)
6.7–
7.5
Physarum
viride
(Bull.)
Pers.
PHYvir
1(bP)
5.1
Stem
onitisaxifera
(Bull.)
T.Macbr.
STEaxi
5(f)
Stem
onitisfla
vogenita
E.Jahn
STEfla
1(f)
1(bP)
1(f)
6.2
Stem
onitisfuscaRoth
STEfus
4(f)
4(bP)
1(bP)
3(f,bP
)4.7–
8
Stem
onitispallida
Wingate
STEpal
2(bQ)
6(bP)
5(bP)
2(bP)
5.2–
7.8
Stem
onitissm
ithiiT.
Macbr.
STEsm
i1(f)
(2f)
Stem
onito
psishyperopta(M
eyl.)
Nann.-Bremek.
STPhyp
1(f)
Stem
onito
psistyphina(F.H.Wigg.)Nann.-Bremek
STPtyp
2(f)
Symphytocarpusfla
ccidus
(Lister)Ing&
Nann.-Bremek.
SYMfla
2(f)
Trichiacontorta
(Ditm
ar)Rostaf.
TRIcon
1(bS)
6.8
Trichiadecipiens(Pers.)T.
Macbr.
TRIdec
3(lc)
4(f)
6–6.9
Trichiamunda
(Lister)Meyl.
TRIm
un1(lc)
6.9
Tubifera
ferruginosa(Batsch)
J.F.
Gmel.
TUBfer
8(f)
6(f)
ffieldcollections;lc
collections
obtained
from
littercultu
res;
bJcollections
obtained
from
Juniperuscommun
isbark
cultu
res;
bPcollections
obtained
from
Pinus
sylvestris
bark
cultu
res;
bQcollections
obtained
from
Quercus
robu
rbark
cultu
res;bS
collections
obtained
from
Sambu
cusspp.
bark
cultu
res
138 Fungal Diversity (2013) 59:131–146

Tab
le3
Statistical
data
formyx
omyceteassemblages
ofdifferentzonesof
theinvestigationarea
Param
eter
Zones
AB
CD
E
Total
no.of
records
228
193
202
139
122
no.of
species
4428
2020
34
meanno.of
speciesperstudyplot
28.0
16.7
12.3
12.3
21.3
H’
2.92(±0.16)
2.08(±0.31)
1.94(±0.05)
1.981(±0
.09)
2.80(±0.22)
E0.88(±0.01)
0.75(±0.03)
0.77(±0.02)
0.79(±0.03)
0.92(±0.01)
Chao2
48.7(±3.4)
32.0(±3.3)
24.0(±3.8)
27.5(±6.6)
41.8(±5.6)
Field
collections
no.of
records
5023
34
27
no.of
species
1511
22
7
meanno.of
speciesperstudyplot
9.0
5.7
0.7
1.3
4.0
H’
1.96(±0.22)
1.66(±0.25)
??
1.12(±0.38)
E0.89(±0.03)
0.97(±0.03)
??
0.89(±0.11)
Chao2
17.8(±3.1)
13.0(±2.4)
??
9.0(±2
.9)
Moistcham
bercultu
res
Bark,
total
no.of
cultu
res(total)
6381
7557
57
positiv
ecultu
res,%
68.3
71.6
82.7
84.2
82.5
no.of
records
9182
101
5980
no.of
species
3015
1614
25
meanno.of
speciesperstudyplot
15.7
9.3
9.3
7.3
14.3
H’
2.49(±0.33)
1.85(±0.23)
1.76(±0.17)
1.64(±0.35)
2.39(±0.23)
E0.92(±0.01)
0.83(±0.06)
0.79(±0.04)
0.83(±0.05)
0.91(±0.01)
Chao2
39.1(±6.1)
18.5(±3.7)
19.7(±3.7)
22.0(±7.4)
29.9(±3.9)
Pinus
sylvestrisbark
no.of
cultu
res
*36
4545
45
positiv
ecultu
res,%
–94.4
97.8
75.6
88.9
no.of
records
–43
8044
71
no.of
species
–11
129
22
meanno.of
speciesperplate
–1.2
1.8
11.6
meanno.of
speciesperstudyplot
–6.0
7.7
5.3
12.0
H’
–1.50(±0.29)
1.67(±0.12)
1.37(±0.45)
2.21(±0.34)
E–
0.84(±0.09)
0.82(±0.03)
0.84(±0.05)
0.90(±0.02)
Chao2
–13.5(±2.9)
13.7(±2.2)
12.3(±4.2)
28.3(±5.1)
Sambucusspp.
bark
no.of
cultu
res
4545
27*
*
positiv
ecultu
res,%
57.8
53.3
59.3
––
no.of
records
6039
17–
–
Fungal Diversity (2013) 59:131–146 139

Tab
le3
(con
tinued)
Param
eter
Zones
AB
CD
E
no.of
species
209
6–
–
meanno.of
speciesperplate
1.3
0.9
0.6
meanno.of
speciesperstudyplot
10.3
6.3
3.0
––
H’
1.86(±1.12)
1.68(±0.12)
0.97(±0.31)
––
E0.89(±0.07)
0.91(±0.02)
0.92(±0.03)
––
Chao2
24.6(±3.9)
9.7(±1
.3)
6.5(±1
.0)
––
Juniperuscommunisbark
no.of
cultu
res
**
312
12
positiv
ecultu
res,%
––
66.7
83.3
58.3
no.of
records
––
415
9
no.of
species
––
48
6
meanno.of
speciesperplate
––
1.3
1.3
0.8
meanno.of
speciesperstudyplot
––
2.7
3.3
2.7
H’
––
0.91(±0.42)
1.10(±0.44)
0.91(±0.42)
E–
–0.97(±0.05)
0.98(±0.02)
0.97(±0.05)
Chao2
––
8.0(±4
.7)
11.3(±3.8)
12.7(±6.8)
Quercus
roburbark
no.of
cultu
res
18*
**
*
positiv
ecultu
res,%
94.4
––
––
no.of
records
31–
––
–
no.of
species
17–
––
–
meanno.of
speciesperplate
1.7
meanno.of
speciesperstudyplot
7.7
––
––
H’
1.94(±0.08)
––
––
E0.95(±0.04)
––
––
Chao2
22.2(±4.4)
––
––
Litter
no.of
cultu
res
4545
4545
45
positiv
ecultu
res,%
84.4
86.7
88.9
82.2
33.3
no.of
records
8788
9876
15
no.species
1310
1010
7
meanno.of
speciesperplate
1.9
1.9
2.2
1.7
0.3
meanno.of
speciesperstudyplot
7.7
6.3
6.3
6.3
3.7
H’
1.67(±0.17)
1.38(±0.28)
1.47(±0.27)
1.49(±0.01)
1.14(±0.49)
E0.82(±0.03)
0.76(±0.01)
0.82(±0.04)
0.81(±0.04)
0.96(±0.04)
Chao2
15.0(±2.4)
11.0(±1.6)
11.0(±1.6)
13.3(±4.2)
8.3(±2
.0)
?0data
toscanty
forcalculations;Eevenness;H’0Shann
on-W
ienermeasure
ofdiversity
;Chao20
Chao2speciesrichness
estim
ator
140 Fungal Diversity (2013) 59:131–146
of nutrients and high pH to habitats with high diversity ofavailable substrata, moderate to high levels of nutrients andpH. The E–A continuum may reflect a myxomycete assem-blage distribution from habitats with lower diversity of avail-able substrata, low levels of nutrients and pH to habitats withhigh diversity of available substrata, moderate to high levelsof nutrients and pH. Notably, myxomycete biota of plot A3,the most open of the recovering plots and one experi-encing some effect of aridity, was transitional to thebiotas of the group B–D.
As the colony site represents a highly diverse ecosystemwith variety of different microhabitats and substrata formyxomycetes, in order to get a clearer picture of myxomy-cete species distribution, the field component and bark cul-ture and litter culture components of the study wereanalysed separately.
In the field 107 specimens of 26 myxomycete specieswere collected. The most abundant were Physarum album
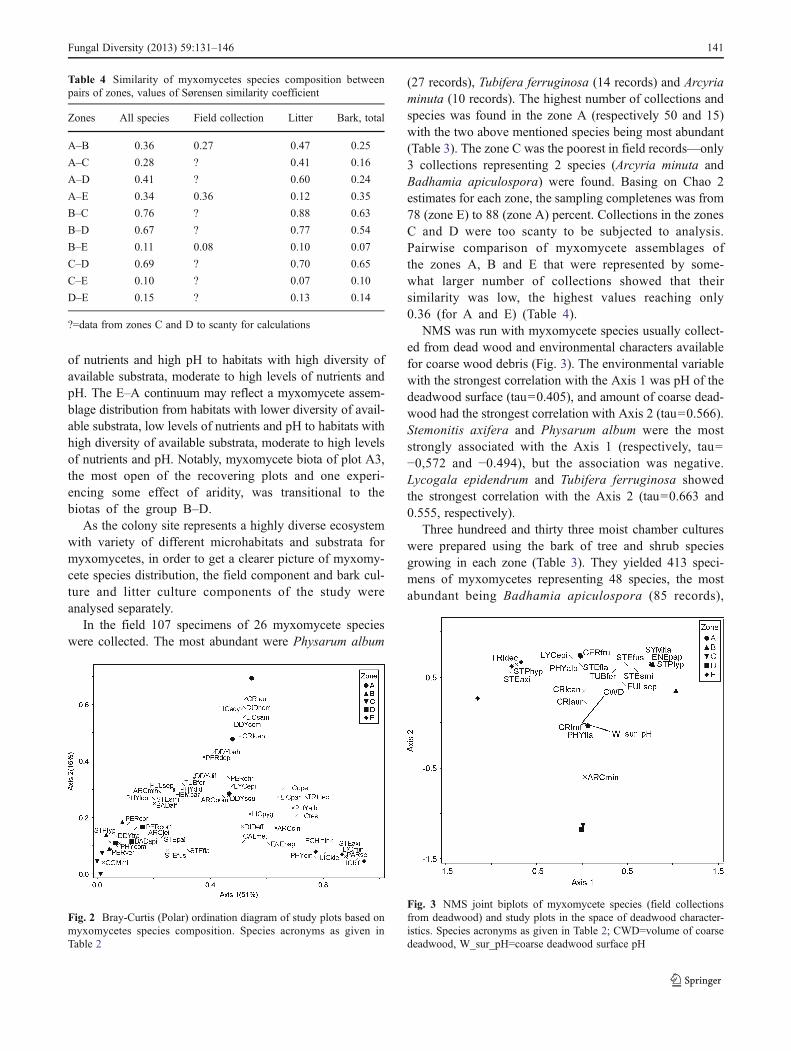
(27 records), Tubifera ferruginosa (14 records) and Arcyriaminuta (10 records). The highest number of collections andspecies was found in the zone A (respectively 50 and 15)with the two above mentioned species being most abundant(Table 3). The zone C was the poorest in field records—only3 collections representing 2 species (Arcyria minuta andBadhamia apiculospora) were found. Basing on Chao 2estimates for each zone, the sampling completenes was from78 (zone E) to 88 (zone A) percent. Collections in the zonesC and D were too scanty to be subjected to analysis.Pairwise comparison of myxomycete assemblages ofthe zones A, B and E that were represented by some-what larger number of collections showed that theirsimilarity was low, the highest values reaching only0.36 (for A and E) (Table 4).
NMS was run with myxomycete species usually collect-ed from dead wood and environmental characters availablefor coarse wood debris (Fig. 3). The environmental variablewith the strongest correlation with the Axis 1 was pH of thedeadwood surface (tau00.405), and amount of coarse dead-wood had the strongest correlation with Axis 2 (tau00.566).Stemonitis axifera and Physarum album were the moststrongly associated with the Axis 1 (respectively, tau0−0,572 and −0.494), but the association was negative.Lycogala epidendrum and Tubifera ferruginosa showedthe strongest correlation with the Axis 2 (tau00.663 and0.555, respectively).
Three hundreed and thirty three moist chamber cultureswere prepared using the bark of tree and shrub speciesgrowing in each zone (Table 3). They yielded 413 speci-mens of myxomycetes representing 48 species, the mostabundant being Badhamia apiculospora (85 records),
Fig. 2 Bray-Curtis (Polar) ordination diagram of study plots based onmyxomycetes species composition. Species acronyms as given inTable 2
Fig. 3 NMS joint biplots of myxomycete species (field collectionsfrom deadwood) and study plots in the space of deadwood character-istics. Species acronyms as given in Table 2; CWD0volume of coarsedeadwood, W_sur_pH0coarse deadwood surface pH
Table 4 Similarity of myxomycetes species composition betweenpairs of zones, values of Sørensen similarity coefficient
Zones All species Field collection Litter Bark, total
A–B 0.36 0.27 0.47 0.25
A–C 0.28 ? 0.41 0.16
A–D 0.41 ? 0.60 0.24
A–E 0.34 0.36 0.12 0.35
B–C 0.76 ? 0.88 0.63
B–D 0.67 ? 0.77 0.54
B–E 0.11 0.08 0.10 0.07
C–D 0.69 ? 0.70 0.65
C–E 0.10 ? 0.07 0.10
D–E 0.15 ? 0.13 0.14
?0data from zones C and D to scanty for calculations
Fungal Diversity (2013) 59:131–146 141
Perichaena cf. vermicularis (57), Licea parasitica (31),Perichaena cf. corticalis (27), Physarum compressum (21)and Perichaena depressa (20). The highest percent of pos-itive cultures that yielded at least one record (includingplasmodia) was from the zone D (84.2 %), the lowest—from the zone A (68.3 %) (Table 3). The highest speciesrichness was obtained from the zone A (30 species) and thelowest—from the zone D (14). The sampling completenessranged from 63.6 % in the zone D to 83.3 % in the zone A.In terms of similarity of assemblages, the closest zones wereB, C and D with the Sørensen’s similarity coefficient rang-ing from 0.54 to 0.65, while similarity of endpoint zones Aand E was 0.35 (Table 4). Similarity of assemblages of thezones B–D and endpoint zones was even lower.
Due to the colony effects, different phorophyte specieswere not present throughout all the investigated area, i. e.Sambucus spp. were absent from the zones D–E, Juniperuscommunis was extinct from the zones A–B. Quercus roburwas present only in the recovering zone A, while Pinussylvestris with bark was available only from the zones B–E. However, one of our primary goals was to evaluate thegeneral species richness of corticolous myxobiota in thecolony and in the reference zone therefore bark was takenfrom all possible woody plant species (Table 3).
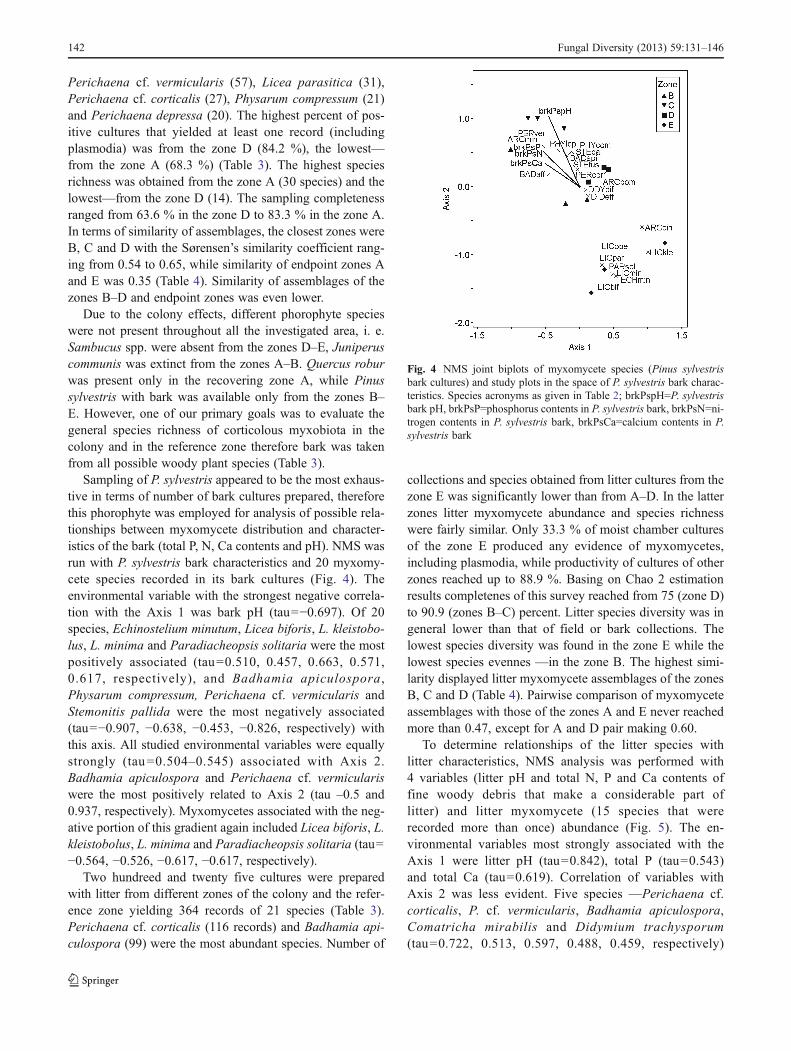
Sampling of P. sylvestris appeared to be the most exhaus-tive in terms of number of bark cultures prepared, thereforethis phorophyte was employed for analysis of possible rela-tionships between myxomycete distribution and character-istics of the bark (total P, N, Ca contents and pH). NMS wasrun with P. sylvestris bark characteristics and 20 myxomy-cete species recorded in its bark cultures (Fig. 4). Theenvironmental variable with the strongest negative correla-tion with the Axis 1 was bark pH (tau0−0.697). Of 20species, Echinostelium minutum, Licea biforis, L. kleistobo-lus, L. minima and Paradiacheopsis solitaria were the mostpositively associated (tau00.510, 0.457, 0.663, 0.571,0.617, respectively), and Badhamia apiculospora,Physarum compressum, Perichaena cf. vermicularis andStemonitis pallida were the most negatively associated(tau0−0.907, −0.638, −0.453, −0.826, respectively) withthis axis. All studied environmental variables were equallystrongly (tau00.504–0.545) associated with Axis 2.Badhamia apiculospora and Perichaena cf. vermiculariswere the most positively related to Axis 2 (tau –0.5 and0.937, respectively). Myxomycetes associated with the neg-ative portion of this gradient again included Licea biforis, L.kleistobolus, L. minima and Paradiacheopsis solitaria (tau0−0.564, −0.526, −0.617, −0.617, respectively).
Two hundreed and twenty five cultures were preparedwith litter from different zones of the colony and the refer-ence zone yielding 364 records of 21 species (Table 3).Perichaena cf. corticalis (116 records) and Badhamia api-culospora (99) were the most abundant species. Number of
collections and species obtained from litter cultures from thezone E was significantly lower than from A–D. In the latterzones litter myxomycete abundance and species richnesswere fairly similar. Only 33.3 % of moist chamber culturesof the zone E produced any evidence of myxomycetes,including plasmodia, while productivity of cultures of otherzones reached up to 88.9 %. Basing on Chao 2 estimationresults completenes of this survey reached from 75 (zone D)to 90.9 (zones B–C) percent. Litter species diversity was ingeneral lower than that of field or bark collections. Thelowest species diversity was found in the zone E while thelowest species evennes —in the zone B. The highest simi-larity displayed litter myxomycete assemblages of the zonesB, C and D (Table 4). Pairwise comparison of myxomyceteassemblages with those of the zones A and E never reachedmore than 0.47, except for A and D pair making 0.60.
To determine relationships of the litter species withlitter characteristics, NMS analysis was performed with4 variables (litter pH and total N, P and Ca contents offine woody debris that make a considerable part oflitter) and litter myxomycete (15 species that wererecorded more than once) abundance (Fig. 5). The en-vironmental variables most strongly associated with theAxis 1 were litter pH (tau00.842), total P (tau00.543)and total Ca (tau00.619). Correlation of variables withAxis 2 was less evident. Five species —Perichaena cf.corticalis, P. cf. vermicularis, Badhamia apiculospora,Comatricha mirabilis and Didymium trachysporum(tau00.722, 0.513, 0.597, 0.488, 0.459, respectively)
Fig. 4 NMS joint biplots of myxomycete species (Pinus sylvestrisbark cultures) and study plots in the space of P. sylvestris bark charac-teristics. Species acronyms as given in Table 2; brkPspH0P. sylvestrisbark pH, brkPsP0phosphorus contents in P. sylvestris bark, brkPsN0ni-trogen contents in P. sylvestris bark, brkPsCa0calcium contents in P.sylvestris bark
142 Fungal Diversity (2013) 59:131–146
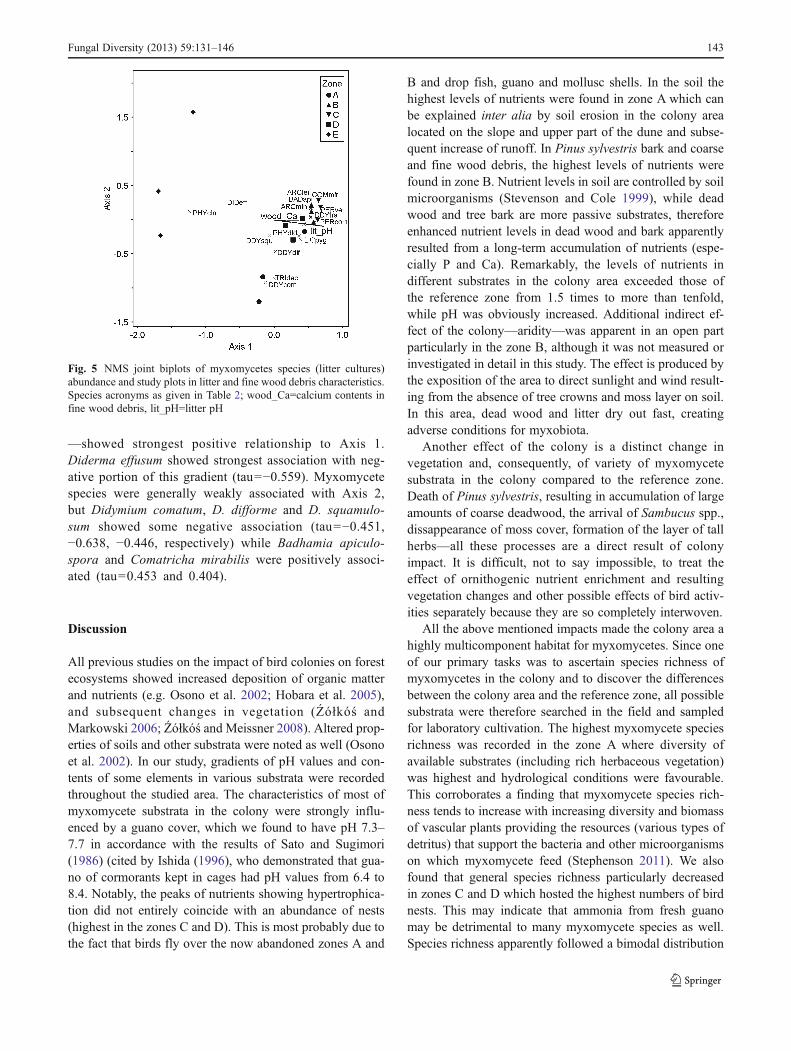
—showed strongest positive relationship to Axis 1.Diderma effusum showed strongest association with neg-ative portion of this gradient (tau0−0.559). Myxomycetespecies were generally weakly associated with Axis 2,but Didymium comatum, D. difforme and D. squamulo-sum showed some negative association (tau0−0.451,−0.638, −0.446, respectively) while Badhamia apiculo-spora and Comatricha mirabilis were positively associ-ated (tau00.453 and 0.404).
Discussion
All previous studies on the impact of bird colonies on forestecosystems showed increased deposition of organic matterand nutrients (e.g. Osono et al. 2002; Hobara et al. 2005),and subsequent changes in vegetation (Źółkóś andMarkowski 2006; Źółkóś and Meissner 2008). Altered prop-erties of soils and other substrata were noted as well (Osonoet al. 2002). In our study, gradients of pH values and con-tents of some elements in various substrata were recordedthroughout the studied area. The characteristics of most ofmyxomycete substrata in the colony were strongly influ-enced by a guano cover, which we found to have pH 7.3–7.7 in accordance with the results of Sato and Sugimori(1986) (cited by Ishida (1996), who demonstrated that gua-no of cormorants kept in cages had pH values from 6.4 to8.4. Notably, the peaks of nutrients showing hypertrophica-tion did not entirely coincide with an abundance of nests(highest in the zones C and D). This is most probably due tothe fact that birds fly over the now abandoned zones A and
B and drop fish, guano and mollusc shells. In the soil thehighest levels of nutrients were found in zone A which canbe explained inter alia by soil erosion in the colony arealocated on the slope and upper part of the dune and subse-quent increase of runoff. In Pinus sylvestris bark and coarseand fine wood debris, the highest levels of nutrients werefound in zone B. Nutrient levels in soil are controlled by soilmicroorganisms (Stevenson and Cole 1999), while deadwood and tree bark are more passive substrates, thereforeenhanced nutrient levels in dead wood and bark apparentlyresulted from a long-term accumulation of nutrients (espe-cially P and Ca). Remarkably, the levels of nutrients indifferent substrates in the colony area exceeded those ofthe reference zone from 1.5 times to more than tenfold,while pH was obviously increased. Additional indirect ef-fect of the colony—aridity—was apparent in an open partparticularly in the zone B, although it was not measured orinvestigated in detail in this study. The effect is produced bythe exposition of the area to direct sunlight and wind result-ing from the absence of tree crowns and moss layer on soil.In this area, dead wood and litter dry out fast, creatingadverse conditions for myxobiota.
Another effect of the colony is a distinct change invegetation and, consequently, of variety of myxomycetesubstrata in the colony compared to the reference zone.Death of Pinus sylvestris, resulting in accumulation of largeamounts of coarse deadwood, the arrival of Sambucus spp.,dissappearance of moss cover, formation of the layer of tallherbs—all these processes are a direct result of colonyimpact. It is difficult, not to say impossible, to treat theeffect of ornithogenic nutrient enrichment and resultingvegetation changes and other possible effects of bird activ-ities separately because they are so completely interwoven.
All the above mentioned impacts made the colony area ahighly multicomponent habitat for myxomycetes. Since oneof our primary tasks was to ascertain species richness ofmyxomycetes in the colony and to discover the differencesbetween the colony area and the reference zone, all possiblesubstrata were therefore searched in the field and sampledfor laboratory cultivation. The highest myxomycete speciesrichness was recorded in the zone A where diversity ofavailable substrates (including rich herbaceous vegetation)was highest and hydrological conditions were favourable.This corroborates a finding that myxomycete species rich-ness tends to increase with increasing diversity and biomassof vascular plants providing the resources (various types ofdetritus) that support the bacteria and other microorganismson which myxomycete feed (Stephenson 2011). We alsofound that general species richness particularly decreasedin zones C and D which hosted the highest numbers of birdnests. This may indicate that ammonia from fresh guanomay be detrimental to many myxomycete species as well.Species richness apparently followed a bimodal distribution
Fig. 5 NMS joint biplots of myxomycetes species (litter cultures)abundance and study plots in litter and fine wood debris characteristics.Species acronyms as given in Table 2; wood_Ca0calcium contents infine wood debris, lit_pH0litter pH
Fungal Diversity (2013) 59:131–146 143

with the highest values at the ends of the range (referencezone E and the recovering part of the colony in the hollow—zone A). Not only was myxomycete species richness lowerin the colony zones B–D, but also species evenness anddiversity. This is in accordance with a generally acceptedidea that more disturbed and less stable environmentsshould have lower species evenness and diversity values.
Much more striking differences were noted when com-paring the structure of myxomycete assemblages. If myxo-mycete biotas of the zones B–D showed a certain mutualsimilarity according to Sørensen’s similarity index values,their difference from the myxobiota of the reference zonewas essential, even if such species as Arcyria leiocarpa andBadhamia apiculospora that are entirely alien for temperatepine forests were sporadically found in the reference zone aswell. Furthermore, Bray-Curtis ordination suggested thepresence of three disctinct sectors in the investigated areabased on the structure of myxomycete assemblages: 1)zones B–D where bird activity is most intense and ariditymost pronounced, 2) the recovering zone A and 3) thereference zone E. We assumed that this tripole distribu-tion of myxomycete assemblages possibly reflects envi-ronmental changes occuring in the different zones of theinvestigated area.
High diversity of substrates and microhabitats coupledwith or resulting from multicomponental ornithogenicchanges complicated evaluation of myxomycete distributionand comparison between the study zones. To get a moreprecise picture, each of the three components: field collec-tions, litter culture collections and bark culture collectionswere analysed separately.
Equal field sampling efforts resulted in different myxo-mycete species richness and abundance values for differentzones of the colony, but field recording of only a fewmyxomycetes in the zones C and D was somewhat surpris-ing. As noted above, these zones hosted the highest numberof nests but due to wash-out, accumulation or other, un-known, effects the levels of most of the nutrients and pHvalues here were lower than peak levels. Low numbers offield collections may be partly explained by guano coveringplants and ground which made it difficult to find smallfructifications of litter species. The presence of some ofthese species was revealed by culturing substrates, thusonce more confirming the importance of moist chambersas a tool for myxomycete diversity studies (e.g.Novozhilov et al. 2000).
Field collection results for xylophilous myxomycetesappeared to be equally confusing. Zones C and D containedvery low amount of coarse deadwood (Table 1), hence veryfew collections on wood. Zone B, however, was richest indeadwood, but both abundance and species richness ofxylophilous myxomycetes were lower than in the zone A.It may be explained by the fact that all wood debris in the
zone B were exposed to direct sunlight and wind and there-fore did not retain sufficient humidity. Meanwhile, in thezone A, recovering layers of woody and herbaceous plantsshaded dead wood and litter and made them more suitablefor quite a number of wood myxomycetes (e.g. Cribrariaaurantiaca, C. cancellata, C. rufa, Tubifera ferruginosa).By comparison, in plots of the reference zone E, coarsewood debris were sparse, represented by single logs ofpine of diameter up to 20 cm, and no characteristicwood species of the genus Cribraria were found. It ispossible, that the comparatively low species richness offield collection of the zone E derived not only from adeficiency of suitable substrata, but also from naturalannual fluctuations such as have been previously notedby the first author for a number of wood- and litter-inhabiting myxomycete species in temperate coniferousforests. Due to the limited time allocated for the project,it is therefore possible a certain underrecording couldhave influenced field collection data.
Myxomycete field collections from different study zonesyielded not only different species richness, but also certaindifferences in species composition. However this differencewas difficult to evaluate due to collection scarsity in somezones (Table 4). Therefore, for comparison of species com-position data from bark and litter cultures were more em-ployable. For bark cultures it is to be noted that due toornithogenic impact there were no tree species that werepresent in all zones of the colony (Table 1). On the onehand, this complicated direct comparison of the results, buton the other, it illustrated well that under the influence ofbirds not only characteristics of a particular substratum butthe very types of substrata can change. It is important to notethat though differences in myxomycete assemblages werefound both in different zones and on different kinds of bark,all woody plant species in the zones B–D hosted suchmyxomycetes as Badhamia apiculospora, Perichaena cf.corticalis and P. cf. vermicularis.
As Pinus sylvestris bark was a substrate available in mostof the investigated zones (Table 1), it was chosen for moredetailed analysis. Differences in bark nutrient contents andpH values throughout the study area were determined.Changes of myxomycete assemblages followed a shift fromacidic with low levels of nutrients (myxomycetes of thegenera Echinostelium, Paradiacheopsis) to nearly neutralwith enhanced levels of nutrients (Badhamia apiculospora,Perichaena cf. vermicularis, Physarum comatum, thatare otherwise alien to pine bark). With pH increasing,Badhamia apiculospora, Perichaena cf. corticalis and P.cf. vermicularis became dominant among the few survivingspecies. Apparently, substrate pH values getting close to8 had decreased or completely terminated sporulation ofmany myxomycete species that otherwise would be com-mon in a temperate pine forest.
144 Fungal Diversity (2013) 59:131–146
Statistical analysis of relationships of myxomycete spe-cies and some P. sylvestris bark characteristics showed anaffinity of Echinostelium minutum, Licea kleistobolus, L.biforis, Paradiacheopsis solitaria to lower pH, andBadhamia apiculospora and Physarum compressum to thehigher pH of pine bark (Fig. 3). Our data thus corroborates afinding by Schnittler and Stephenson (2002) that Physarumcompressum may be a good indicator for very basic micro-habitats. NMS analysis showed the highest positive correla-tion between elevated nutrient content of pine bark and theoccurrence of Perichaena cf. vermicularis, while negativecorrelation was shown for Licea biforis, L. kleistobolus,Paradiacheopsis solitaria. These results imply that distribu-tion of some species might be influenced directly or not bynutrient levels.
Analysis of litter culture component showed first of alldifferences in the productivity of cultures from the colonyand from the reference zone. In the latter, only 33 % ofcultures produced myxomycete fructifications or plasmodiathat died later, whereas the productivity of the colony littercultures was up to 2.5 times higher. This is in accordancewith our previous experience with litter cultures from oli-gotrophic pine forests as not productive in myxomycetespecies, mostly yielding such species as Arcyria cinerea,Comatricha pulchella, Physarum cinereum. These culturesare frequently demolished by larvae of various gnats.
Differences between species compositions of assemb-lages of the colony and the reference zone were also pro-nounced. Relationships of species to the characteristics ofthe litter were rather ambiquous and difficult to interpret themore that pH values and nutrient contents had the samegradient. However it can be noted that such species asBadhamia apiculospora, Comatricha mirabilis, Perichaenacf. corticalis, P. cf. vermicularis were more abundant in thesubstrates with higher pH values and higher nutrient contents,and therefore their affinity to higher trophicity of substrateappears quite credible.
Additionally, Arcyria leiocarpa, Badhamia apiculospora,Comatricha mirabilis, Physarum compressum which wererather abundant in the collony litter cultures are normallynot, or only sporadically, encountered in temperate forestecosystems. Badhamia apiculospora and Comatricha mir-abilis are mostly found in arid regions, where substratesoften show higher pH and mineral contents (Mandeel andBlackwell 2008; Novozhilov and Schnittler 2008), thereforethese species may indicate eutrophication in temperate cli-mate. It can be hypothetized that myxomycetes which arerare or sparse in more or less pristine ecosystems are able tofill the niches that are left unoccupied after extinction ofindigenous myxomycete species in a dramatically changedenvironment. Similar phenomena are observed in, e.g.,pyrophilous fungi in post-fire areas and epiphytic lichensin polluted sites.
The results of our short-term study would imply thatmyxomycete species assemblages change in a hypertofi-cated environment. Though general abundance of myxomy-cetes in hypertrophicated habitats may increase, but this wasmostly due to the presence of the species that are notcharacteristic to the habitats with low nutrient levels.Distribution patterns or the mere presence of a number ofspecies in certain studied habitats remained without expla-nation in this limited study. Apart from pH and, possibly,nutrient levels of the substrata, there still may be a numberof unknown environmental factors driving myxomycetespecies distribution, including changes in populations ofbacteria and other microorganisms on which they feed. Itis known that within bird colonies, the indigenous flora isreplaced by nitrophilous species (described by some authorsas “ruderal” (Grime et al. 1988). Whether this can be appliedto myxomycetes is a question for further studies.
Acknowledgements This research was funded by a grant no. LEK-23/2010 from the Research Council of Lithuania. Prof. Uno Eliasson isthanked for discussions on Perichaena cf. corticalis and Stemonitispallida as well as for valuable suggestions during the course of man-uscript preparation. Meriel Goodwin is cordially thanked for linguistichelp. Dr. Mindaugas Dagys is thanked for providing data on thecormorant colony.
References
Andrade Bezerra MF, Teofilo da Silva WM, Cavalcanti LH (2008)Coprophilous myxomycetes of Brazil: first report. Rev MexMicol 27:29–37
Breuning-Madsen H, Ehlers-Koch C, Gregersen J, Lund Løjtnant C(2010) Influence of perennial colonies of piscivorous birds on soilnutrient contents in a temperate humid climate. GeografiskTidsskrift-Danish J Geogr 110(1):25–35
Brummitt RK, Powell CE (1992) Authors of plant names. RoyalBotanical Gardens, Kew
Colwell RK (2005) EstimateS: statistical estimation of species richnessand shared species from samples. Version 7.5. User’s guide andapplication. http://purl.oclc.org/estimates. Accessed 28 July 2012
Cox JL (1981) Notes on coprophilous myxomycetes from the WesternUnited States. Mycologia 73:741–747
Eliasson U (2012) Coprophilous myxomycetes: recent advances andfuture research directions. Fungal Divers 56 (in press)
Eliasson U, Lundqvist N (1979) Fimicolous myxomycetes. Bot Notiser132:551–568
Eliasson UH, Keller HW (1999) Coprophilous myxomycetes:updated summary, key to species, and taxonomic observa-tions on Trichia brunnea, Arcyria elaterensis, and Arcyriastipata. Karstenia 39:1–10
Eräjää S, Halme P, Kotiaho JS, Markkanen A, Toivanen T (2010) Thevolume and composition of dead wood on traditional and forestfuel harvested clear-cuts. Silva Fenn 44:203–211
Galvonaitė A, Misiūnienė M, Valiukas D, Buitkuvienė MS (2007)Lietuvos klimatas. UAB “ARX Baltica”, Vilnius
Garcia LV, Maranon T, Ojeda F, Clemente L, Redondo R (2002)Seagull influence on soil properties, chenopod shrub distribution,and leaf nutrient status in semi-arid Mediterranean islands. Oikos98:75–86
Fungal Diversity (2013) 59:131–146 145

Garcia LV, Ramo C, Aponte C, Moreno A, Dominguez MT, Gomez-Aparicio L, Redondo R, Maranon T (2011) Protected wading birdspecies threaten relict centenarian cork oaks in a Mediterraneanbiosphere reserve: a conservation management conflict. Biol Con-serv 144:764–771
Grime JP, Hodson JG, Hunt R (1988) Comparative plant ecology. Afunctional approach to common British species. Udwin Hyman,London
Härkönen M (1977) Corticolous myxomycetes in three different hab-itats in southern Finland. Karstenia 17:19–32
Härkönen M, Uotila P (1983) Turkish myxomycetes developed inmoist chamber cultures. Karstenia 23:1–9
Hobara S, Koba K, Osono T, Tokuchi N, Ishida A, Kameda K (2005)Nitrogen and phosphorus enrichment and balance in forests col-onized by cormorants: implications of the influence of soil ad-sorption. Plant Soil 268:89–101
Ishida K (1996) Changes of soil properties in the colonies of the commoncormorant, Phalacrocorax carbo. J Forest Res-JPN 1:31–35
Jončys F, Paulaitis A (1987) Valstybinio Kuršių nerijos miško parkoJuodkrantės girininkijos taksoraštis. Miškotvarka 1987 m. Miškoprojektas, Kaunas
Kabailienė M, Vaikutienė G, Damušytė A, Rudnickaitė E (2009) Post–Glacial stratigraphy and palaeoenvironment of the northern part ofthe Curonian Spit, Western Lithuania. Quat Int 207(1–2):69–79
Kameda K, Koba K, Yoshimizu C, Fujiwara S, Hobara S, Koyama L,Tokuchi N, Takayanagi A (2000) Nutrient flux from aquatic toterrestrial ecosystem mediated by the Great Cormorant. Sylvia36:54–55
Kolb GS, Jerling L, Hambäck PA (2010) The impact of cormorants onplant–arthropod food webs on their nesting islands. Ecosystems13:353–366
Kosheleva AP, Novozhilov YK, Schnittler M (2008) Myxomycetediversity of the state reserve “Stolby” (south-eastern Siberia,Russia). Fungal Divers 31:45–62
Lado C (2005–2012) An on line nomenclatural information system ofEumycetozoa. http://www.nomen.eumycetozoa.com. Accessed20 June 2012
Laiviņš M, Čekstere G (2008) Kolonijās ligzdojošo zivju gārņu (Ardeacinerea) un jūraskraukļu (Phalacrocorax carbo) ietekme uz Latvijasezera salu augu valsti un augsnēm. Mežzinatne 18(51):74–84
Mandeel QA, Blackwell M (2008) Rare or rarely recorded? Comatri-cha mirabilis from the desert of Bahrain. Mycologia 100(5):742–745. doi:10.3852/07-154
McCune B, Mefford J (1999) Multivariate analysis of ecological data,PC-ORD Version 4.01. MjM Software, Gleneden Beach, Oregon
Nannenga-Bremekamp NE (1991) A guide to temperate myxomycetes.Biopress Limited, Bristol
Novozhilov YK, Schnittler M (2008) Myxomycete diversity and ecol-ogy in arid regions of the Great Lake Basin of western Mongolia.Fungal Divers 30:97–119
Novozhilov YK, Schnittler M, Zemlianskaya IV, Fefelov KA (2000)Biodivesrity of plasmodial slime moulds (Myxogastria): measure-ment and interpretation. Protistology 1(4):161–178
Novozhilov YK, Mitchell DW, Schnittler M (2003) Myxomycetebiodiversity of the Colorado Plateau. Mycol Prog 2(4):243–258
Osono T, Hobara S, Fujiwara S, Koba K, Kameda K (2002) Abun-dance, diversity and species composition of fungal communitiesin a temperate forest affected by excreta of the Great CormorantPhalacrocorax carbo. Soil Biol Biochem 34:1537–1547
Osono T, Hobara S, Koba K, Kameda K, Takeda H (2006) Immobili-zation of avian excreta-derived nutrients and reduced lignin de-composition in needle and twig litter in a temperate coniferousforest. Soil Biol Biochem 38:517–525
Sato K, Sugimori H (1986) Research for mutual prosperity ofhuman and wildlife. Report of Toyota Financial Group (85-II-114) (in Japanese)
Schnittler M, Stephenson SL (2002) Inflorescences of Neotropicalherbs as a newly discovered microhabitat for myxomycetes.Mycologia 94(1):6–20
Stephenson SL (2011) From morphological to molecular: studies ofmyxomycetes since the publication of the Martin and Alexopoulos(1969) monograph. Fungal Divers 50:21–34
Stevenson FJ, Cole MA (1999) Cycles of soils: carbon, nitrogen,phosphorus, sulfur, micronutrients. Wiley, New York
Unterseher M, Schnittler M, Dormann C, Sickert A (2008) Applicationof species richness estimators for the assessment of fungal diver-sity. FEMS Microbiol Lett 282:205–213
Zak JC, Willig MR (2004) Analysis and interpretation of fungalbiodiversity patterns. In: Mueller GM, Bills GF, Foster MS (eds)Biodiversity of fungi: inventory and monitoring methods. Elsev-ier, Burlington, pp 59–76
Źółkóś K, Markowski R (2006) Pressure of the Grey Heronbreeding colony (Ardea cinerea) on the phytocoenosis oflowland acidophilous beech forest in the ‘Czapliniec w Wierzysku’reserve (Kaszubskie Lake District). Biodiv Res Conserv 3–4:337–339
Źółkóś K, Meissner W (2008) The effect of Grey Heron (Ardea cinereaL.) colony on the surrounding vegetation and the biometricalfeatures of three undergrowth species. Pol J Ecol 58:65–74
Žydelis R, Gražulevičius G, Zarankaitė J, Mečionis R, Mačiulis M(2002) Expansion of the Cormorant (Phalacrocorax carbosinensis) population in western Lithuania. Acta Zool Lituan-ica 12:283–287
146 Fungal Diversity (2013) 59:131–146
Copyright © 2022 FDOKUMEN