Measurement and Modeling of Propeller Cavitation in Uniform Inflow
Upload
independentCategory
view
0download
0
This article is protected by copyright. All rights reserved
Mycobacterium tuberculosis dysregulates MMP/TIMP balance to drive
rapid cavitation and unrestrained bacterial proliferation
André Kübler1,2, Brian Luna2, Christer Larsson3, Nicole C. Ammerman4, Bruno B. Andrade5,
Marlene Orandle6, Kevin W. Bock6, Ziyue Xu7, Ulas Bagci7, Daniel J. Molura7, John Marshall8,
Jay Burns9, Kathryn Winglee2, Bintou Ahmadou Ahidjo2,12, Laurene S. Cheung2, Mariah
Klunk10, Sanjay K. Jain2,10, Nathella Pavan Kumar13,14, Subash Babu13,15, Alan Sher5, Jon S.
Friedland1, Paul T.G. Elkington1,11, William R. Bishai2,12
1. Infectious Diseases & Immunity, Imperial College London, London, UK
2. Center for Tuberculosis Research, Johns Hopkins University School of Medicine,
Baltimore, MD, USA
3. Department of Molecular Biology, Umeå University, Sweden
4. KwaZulu-Natal Research Institute for Tuberculosis and HIV (K-RITH), Durban, South
Africa
5. Immunobiology Section, Laboratory of Parasitic Diseases, National Institutes of
Allergy and Infectious Diseases, National Institutes of Health, Bethesda, MD, USA
6. Infectious Diseases Pathogenesis Section, Comparative Medicine Branch, National
Institutes of Allergy and Infectious Disease, National Institutes of Health, Bethesda,
MD, USA
This article has been accepted for publication and undergone full peer review but has not been through the copyediting, typesetting, pagination and proofreading process, which may lead to differences between this version and the Version of Record. Please cite this article as doi: 10.1002/path.4432
This article is protected by copyright. All rights reserved
7. Radiology and Imaging Science, National Institutes of Health, Bethesda, MD, USA
8. Johns Hopkins School of Medicine, Baltimore, MD, USA
9. Biomedical Engineering, Johns Hopkins University, Baltimore, MD, USA
10. Center for Infectious Disease and Inflammation Imaging Research (CI3R), Baltimore,
MD, USA
11. Faculty of Medicine, Southampton University, UK
12. Howard Hughes Medical Institute, Chevy Chase, Baltimore, MD, USA
13. National Institutes of Health, International Center for Excellence in Research,
Chennai, India
14. National Institute for Research in Tuberculosis (NIRT), Chennai, India
15. Helminth Immunology Section, Laboratory of Parasitic Diseases, National Institute of
Allergy and Infectious Diseases, National Institutes of Health, Bethesda, Maryland,
United States of America
All authors declare that there are no conflicts of interest.
Corresponding author:
William R. Bishai:
Johns Hopkins Center for TB Research, CRB-2 Room 108, 1550 Orleans St, Baltimore, MD
1287, USA. Phone: 1-410-955-3507, E-mail: [email protected]

This article is protected by copyright. All rights reserved
Abstract
Active tuberculosis (TB) often presents with advanced pulmonary disease, including
irreversible lung damage and cavities. Cavitary pathology contributes to antibiotic failure,
transmission, morbidity and mortality. Matrix metalloproteinases (MMPs), in particular
MMP-1 are implicated in TB pathogenesis. We explored the mechanisms relating
MMP/TIMP imbalance to cavity formation in a modified rabbit model of cavitary TB. Our
model results in consistent progression of consolidation to human-like cavities (100% by day
28) with resultant bacillary burdens (>107 CFU/g) far greater than those found in matched
granulomatous tissue (105 CFU/g). Using a novel, breath-hold computerized tomography
scanning and image analysis protocol. We show that cavities develop rapidly from areas of
densely consolidated tissue. Radiological change correlated with a decrease in functional
lung tissue as estimated by changes in lung density during controlled pulmonary expansion
(R2=0.6356, p<0.0001). We demonstrated that the expression of interstitial collagenase
(MMP-1) is specifically greater in cavitary compared to granulomatous lesions (p<0.01), and
that TIMP-3 significantly decreases at the cavity surface. Our findings demonstrate that an
MMP-1/TIMP imbalance, is associated with the progression of consolidated regions to
cavities containing very high bacterial burdens. Our model provided mechanistic insight,
correlating with human disease at the pathological, microbiological and molecular levels,. It
also provides a strategy to investigate therapeutics in the context of complex TB pathology.
We used these findings to predict a MMP/TIMP balance in active TB; and confirmed this in
human plasma, revealing the potential of MMP/TIMP levels as key components of a
diagnostic matrix aimed at distinguishing active from latent TB (PPV=92.9%; 95%CI 66.1-
99.8%, NPV=85.6%; 95%CI 77.0-91.9%).
Keywords: Tuberculosis, Matrix Metalloproteinase, Computed tomography, Cavity

This article is protected by copyright. All rights reserved
Introduction
Tuberculosis (TB) is a leading cause of death worldwide, costing the global economy 100-
300 billion dollars, and orphaning 10 million children annually [1-3]. The majority of disease
results from M. tuberculosis infection of immunocompetent adults, characterized by
complex destructive immunopathology, including cavity formation [1, 4-6]. Cavities contain
the majority of the bacillary burden in human disease, and play a pivotal role in disease
transmission [7, 8]. Within the cavity, immune responses are impaired and antibiotic
efficacy altered; treatment failure occurs in up to 15.8% of patients with cavities, compared
to just 2.6% of those without [7, 9-11]. Despite this critical role in TB pathogenesis, cavity
formation is poorly understood.
Cavitary TB is associated with delayed-type hypersensitivity (DTH) reactions, which are
functionally assessed with tuberculin skin tests (TST) [12, 13]. DTH contributes to effective
bacterial control and tissue destruction [14]. Differentiating destructive from antibacterial
mechanisms is essential for the development of safe vaccines and immunotherapies. Matrix
metalloproteinases (MMPs) are emerging as central mediators of the tissue destructive
response in TB [15, 16]. MMPs can cleave all extracellular matrix (ECM) components [6]. In
humans MMP-1, which can degrade the most resilient fibrillar components of the ECM (type
I and III collagen), and its activator MMP-3, are more abundant in respiratory secretions of
TB patients than controls [15, 17, 18]. Conversely, their inhibitors, the tissue inhibitors of
metalloproteinases (TIMPs), are not substantially increased [15, 18]. In M. tuberculosis
infected MMP-1 transgenic mice, collagen degradation is greater than in controls, although
these mice do not develop cavities. Possibly because mice have limited functional DTH-
responses as determined by responsiveness to PPD after infection (a maximal 0.3mm

This article is protected by copyright. All rights reserved
swelling occurred after injection of 10,000 tuberculin units [TU])[13-15, 19]. These data
suggests a dual importance of DTH and pulmonary MMP-1 expression. Investigation of the
underlying mechanisms of this relationship are challenging because cavity formation does
not occur in in vitro, mouse, guinea pig or zebrafish models of TB, and is sporadic in other
models [20, 21]. Rabbits and macaques infected with M. tuberculosis develop DTH
responses, and also occasionally develop cavities [20, 22]. Like humans, these animals can
also contain infection [23]. The most consistent cavitary TB model is a post-primary rabbit
model, in which DTH responses are induced via presensitization [24]. This model required
prolonged infection times and disease progression was inconsistent, leading to difficulties in
quantifying outcomes [24, 25].
We developed a reliable model of cavitary disease in rabbits, and confirmed pathological
and molecular correlates of human disease. We designed an in vivo imaging strategy to
observe and quantify the events leading to cavitation. We show that cavities develop rapidly
within areas of dense consolidation. This was associated with an MMP-1/TIMP imbalance
and high intracavitary bacterial burdens. We provide evidence that M. tuberculosis
specifically induces MMP-1/-3 and that MMP/TIMP imbalance is a feature of active TB.

This article is protected by copyright. All rights reserved
Methods
Extended methods are included in Supplementary Information
Mycobacterial Culture: M. tuberculosis H37Rv and M. bovis ravenel were grown as in [24].
Animals: 3-3.5kg female New Zealand rabbits (Covance research products [Princeton, NJ,
USA]) were housed in accordance with protocols [Institutional Animal Care and Use
Committee at Johns Hopkins University, (Baltimore, USA)].
Sensitization and infection: As in [24], except: (i) 108 instead of 107 bacilli were used per
presensitization injection, (ii) a target of inoculum of 103 CFU was utilized, (iii) Intradermal
injection of 0.1ml purified protein derivative (5TU) (Tubersol, Sanofi-Aventis, Bridgewater,
NJ, USA) was used to assess DTH. Briefly, sensitization was achieved using 5 injections of M.
bovis equally spaced over 14 days and infection with M. tuberculosis occurred 21 days later.
Lung sampling: Within 5 minutes of euthanasia [described in [24]], tissue biopsies were
taken. Macroscopically matched samples were dissected by gross appearance and: (i) snap
frozen in liquid nitrogen (ii) transferred to RNAlater (Invitrogen/Life Technologies, Carlsbad,
CA, USA) (iii) fixed in 10% formalin, (iv) 3mm punch biopsies (6 per tissue type per animal)
were weighed, homogenized in PBS prior to CFU enumeration on 7H11 selective media. The
remaining lung lobe (>90% by mass) was weighed homogenized using a Polytron
homogenizer (Kinematica, CH) in 40ml of PBS prior to CFU enumeration by serial dilution on
selective 7H11 media.
Rabbit Imaging: Breathhold image acquisition took place as in supplementary Figure 3.
Image analysis is described in Supplementary Figures 4, 6 and 7. Tissue type rules described
This article is protected by copyright. All rights reserved
in [26]. Calculations of lung mass was performed as described in supplementary figure 5 and
(40).
qPCR: qPCR was performed on 0.5µg/µl RNA samples converted to cDNA using superscript
cDNA synthesis kit (Agilent Technologies) according to manufacturers protocols with an
additional DNAse incubation. Expression was measured utilizing SYBR II (Bio-Rad, Hercules,
CA, USA) and an iQ5 platform (Bio-Rad)(primers: Supplementary Table 2) and and -ΔΔCT and
fold changes calculated.
Zymography: Homogenized, sterile-filtered samples were assessed with casein zymograpy
[27].
Histology: Tissues was processed by Histoserv and imaged on an Olympus BX51 microscope
and photomicrographs were taken using an Olympus DP70 camera.
Ethics: Written informed consent was obtained from all participants, and the study was
performed in accordance with the principles expressed in the Declaration of Helsinki and
approved by the Institutional Review Board (IRB) of the National Institute for Research in
Tuberculosis (NIRT, protocol numbers: NCT01154959 and NCT00342017).
Study population: Cryopreserved heparinized plasma samples were collected from 97
subjects with active pulmonary TB (PTB), 14 with latent TB infection (LTBI) and 20 matched
uninfected healthy controls (HC) described in detail in [28].
Immunoassays: Human MMP-1, MMP-3, MMP-7, MMP-8, MMP-9, TIMP-1, TIMP-2, TIMP-3
and TIMP-4 were measured in plasma samples using a luminex kit from R&D systems (R&D
Systems, Minneapolis, MN). Rabbit MMP-1 was measured using a commercialized ELISA kit
(SEA097Rb; USCN Life Sciences Inc., Hubei, China).
This article is protected by copyright. All rights reserved
In vitro experiments: Performed as in [27], UV-killed M. tuberculosis generated by 90
minutes of UV transillumination (wavelength 365nm, UVP, Upland, CA, USA).
Data analysis: Data analysis was performed as described in the figures using JMP 11 (SAS,
Cary, NC), STATA 10 (StataCrop LP, College Station, TX) and Prism 6.0 (GraphPad Software,
San Diego, CA). (496)
Results
High-dose pre-sensitization causes rabbit skin test positivity and is required for pulmonary
cavity formation
First, we developed a high-dose sensitization regime with heat-killed Mycobacterium bovis,
since we hypothesized that this would generate cavities more reproducibility than previous
studies [24, 29]. This regimen resulted in universal skin-test positivity (Figure 1A and
supplementary Table 1) whereas lower dose sensitization did not (data not shown). Cavity
formation, detected by serial CT scanning, occurred in all rabbits (Figure 1B and C) after
infection with 103 CFU of M. tuberculosis H37Rv (M. tuberculosis). All cavities appeared
between 14 and 28 days (Figure 1D) and were large in volume (Figure 1E). Histologically, the
cavities were similar to human cavities, comprising a fibrotic wall surrounding a necrotic
core (Figures 1F and G). Numerous acid-fast bacilli were present within the necrotic debris
(Figure 1H). Several other histopathologic features typical of human TB also developed.
These included: (i) small paucibacillary cellular granulomas which were observed in the
tissue surrounding the cavity, at sites distal to the cavity, and occasionally in lobes that were

This article is protected by copyright. All rights reserved
not directly infected (Figure 1I and Supplementary Figures 1 and 2), (ii) multinucleated giant
cells at the periphery of cavitary lesions (Figure 1J), and (iii) direct connection of the cavity
to the bronchi (Figure 1B and Supplementary Figure 1).
Cavities contain high bacillary burdens
Next, we investigated the association between radiographic findings, pathology and
bacterial burden. CT appearances were strongly representative of gross pathology (Figure
2A). The majority of the bacterial burden was within the lobe containing the cavity (Figure
2B). We investigated the precise location of the maximal bacterial burden and obtained
multiple biopsies from the cavity wall, the surrounding granulomatous material (in the same
lobe), and from normal-appearing tissue in the lobe which was adjacent to the initially
infected lobe, but in the contralateral lung of each animal (Supplementary Figure 2).
Quantitative culture demonstrated an approximately 100-fold increase of bacterial burden
at the cavity surface when compared to the granulomatous regions (p<0.001) (Figure 2C).
Acid-fast staining of these regions confirmed that bacteria were located within the necrotic
debris at the cavity surface, whereas the remaining lung pathology was paucibacillary, with
very few acid-fast bacilli visualized within granulomas (Supplementary Figure 2).
Tissue destructive MMPs are abundant at the cavity surface
Having demonstrated histological similarity to human disease, we sought to investigate
molecular correlates of tissue destruction. We investigated MMPs implicated in tissue
destruction during human infection (Supplementary Table 2). Multiple MMPs showed
increased transcription in regions of pathological change in pulmonary architecture,
including MMP-1, -3, -7, -12, and -13, (Figures 3A and B). MMP-1 (interstitial collagenase)
This article is protected by copyright. All rights reserved
showed the greatest fold increase in transcription and was the only MMP investigated that
was more highly expressed in cavity walls as compared to granulomatous tissue (p<0.01).
The specific inhibitor TIMP-3 had lower expression in cavity as compared to non-cavity
tissue (p<0.001) (Figure 3C). Because MMP-1 is highly implicated as both a marker of
disease progression and cavitation in man [15], we sought to confirm that its increased
transcription correlated with protein abundance. We demonstrated a nearly 10-fold
increase in MMP-1 protein concentration around the cavity (Figure 3D). Furthermore, MMP-
1 proteolytic activity was detected in infected lung tissue (Figure 3E), which was inhibited by
incubation with the collagenase inhibitor Ro32-3555 (Cipemastat) (Figure 3F).
In vivo imaging demonstrates that cavitation originates from dense consolidation
To investigate the sequence of events that lead to cavity formation, we performed
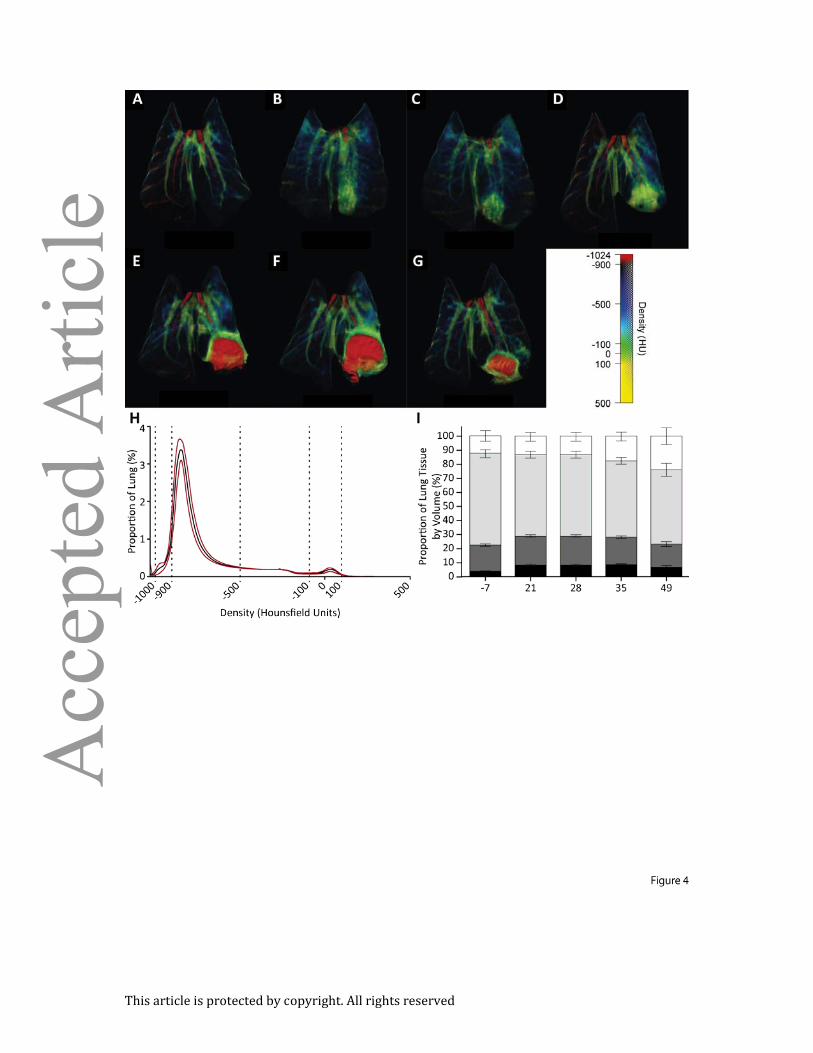
longitudinal image analysis of M. tuberculosis-infected rabbits (Figures 4A-H). Initial
bronchoscopic infection caused localized consolidation (Figure 4B), which became less
diffuse over the following 7 days (Figure 4C). Subsequently, dense consolidation formed,
and then cavitation occurred rapidly within the regions of dense consolidation. In the
majority of cases cavities appeared and reached their maximum size within a 7-day period
(figure 4D and 4E). The first cavities appeared by day 21, and all animals cavitated by day 28.
After formation, cavities remained relatively stable in size (Figures 4E and F), although some
resolution occasionally occurred by day 49 (Figure 4G).
Breath-hold CT scanning permits quantification of dynamic changes in pulmonary
architecture
This article is protected by copyright. All rights reserved
To perform detailed quantitative measurement of lung infiltration, we constructed a bio-
safety level-3 (BSL-3) respiratory support device, and developed a breath-hold scanning
methodology (supplementary figure 3). The system permitted accurate measurement of
overall volumes of tissue within given density ranges. The lower pressure represents an
approximately normal inhalation volume, while the higher pressure causes expansion of the
lung to beyond physiological norms, allowing the identification of poorly inflated regions
that remained consolidated even with this increased expansion (higher-pressures allows for
even greater expansion, but was not used to reduce the effect of barotrauma). Two scans of
each animal were taken before infection and at day 21, 28, and 35, at inflation pressures of
10cmH2O (lower-pressure) and 20cmH2O (higher-pressure).
Higher-pressure expansion (n=54) led to highly consistent distribution of tissue densities
(Figure 4H). We observed an increase in poorly aerated (-100 to 100HU) and hyperexpanded
(-1000 to -900HU) tissue volumes, corresponding to consolidation and cavitary change
respectively, during the course of infection (Figure 4I).
Assessment of lung consolidation facilitates the estimation of functional lung tissue
We then assessed whether lung consolidation after infection could be measured non-
invasively and if the pressure changes permitted measurement of functional tissue. First, we
assessed lung recruitment by comparing lung consolidation between the lower and higher
inflation pressure measurements. Functional lung tissue decreased significantly after
infection and continued to fall until day 35 post-infection (Figure 5B).

This article is protected by copyright. All rights reserved
Low-density pathological change includes both cavitary and hyperexpansive pathology
Next, we analyzed the CT images to differentiate specific pathological changes driven by M.
tuberculosis infection in our model. This was achieved by comparing the proportion of
voxels at all densities before and after infection, in the more consistent high-pressure scans.
A proportion of voxels containing very low-density tissue, (-1022 and -865HU, peak -889HU),
representing cavity formation, and a proportion of voxels containing high-density tissue, (-
719 to 212HU, peak 35.19HU), representing dense consolidation, showed significant
increases (Figure 5C). Conversely, the proportion of tissues (-866 to -712HU, peak -715HU),
within the normal aerated range, was reduced. Although the high-density peak was across a
broad range of HU, 47% of this peak was in the non-aerated range -100 to 100HU, with the
remainder of the peak being evenly distributed from -700 to -100HU.
First, we focused on the low-density peak. Unexpectedly the distribution of voxels was
different between the two inflation pressures, with a bifid peak in this region (-1022 to -
865HU) (Figure 5C), occurring at high-pressure expansion (Supplementary Figure 6A). To
investigate the cause of this phenomenon, we identified a cavity specific region by
comparing scans of animals from day 21 and found a significant change in very low density
regions (-1024 to -924HU) (Supplementary Figure 6B) that was diagnostic of cavity
formation in higher-pressure scans (Supplementary Figure 6C). By further evaluating the
distribution of the remaining portion of the bifid peak in 3D-reconstructions (-924 to -865HU;
Supplementary Figures 6E and 6F), we established that after infection, a diffuse increase in
low-density regions was occurring (Figures 6E and F). This indicates that additional lung
hyperexpansion was occurring after infection when lungs were highly inflated.

This article is protected by copyright. All rights reserved
TB-driven lung inflammation can be quantified accurately
The change in volume of dense tissue was small when expressed as a proportion of total
lung voxels, but represented a significant change from baseline (Figures 4I and 5A). Since
cavities appear to originate in these dense tissues, and these same areas are unlikely to
facilitate gas exchange, we investigated the progression of these regions over time. The
region of unique change in proportional volume between pre- and post-infection was
identified (-84 to 56HU, Supplementary Figure 7A). The change in volume of these high-
density regions was small, but this relatively low volume represents a substantial tissue
mass. We analyzed the mass of high-density tissue pre- and post-infection and identified a
larger zone from -184 to +156HU, which demonstrated consistently increasing volume after
infection (Supplementary Figure 7B). By highlighting this zone in 3D-reconstructions, we
demonstrated that these loci represented areas of new tissue consolidation (Figure 5D).
Both cavitation (p<0.01, Figure 5E) and consolidation signatures (p<0.05, Figure 5F) within
the TB lesions increased progressively during the early stages after infection (days 21-35).
Interestingly, both the mass and volume of the regions of consolidation did not decrease
during the appearance of cavitation, suggesting that while cavitation originates in these
areas, cavities do not lead to a substantial reduction in consolidated tissue. We used the
combined volumes of both cavitary and consolidated tissues to generate a total disease
score. This score changed substantially between day 21 and 35 of infection (p<0.001, Figure
5G) and correlated strongly with the functional decline in tissue (p<0.0001; Supplementary
Figure 8).
This article is protected by copyright. All rights reserved
MMP/TIMP imbalance is a bacterial-driven signature of active TB
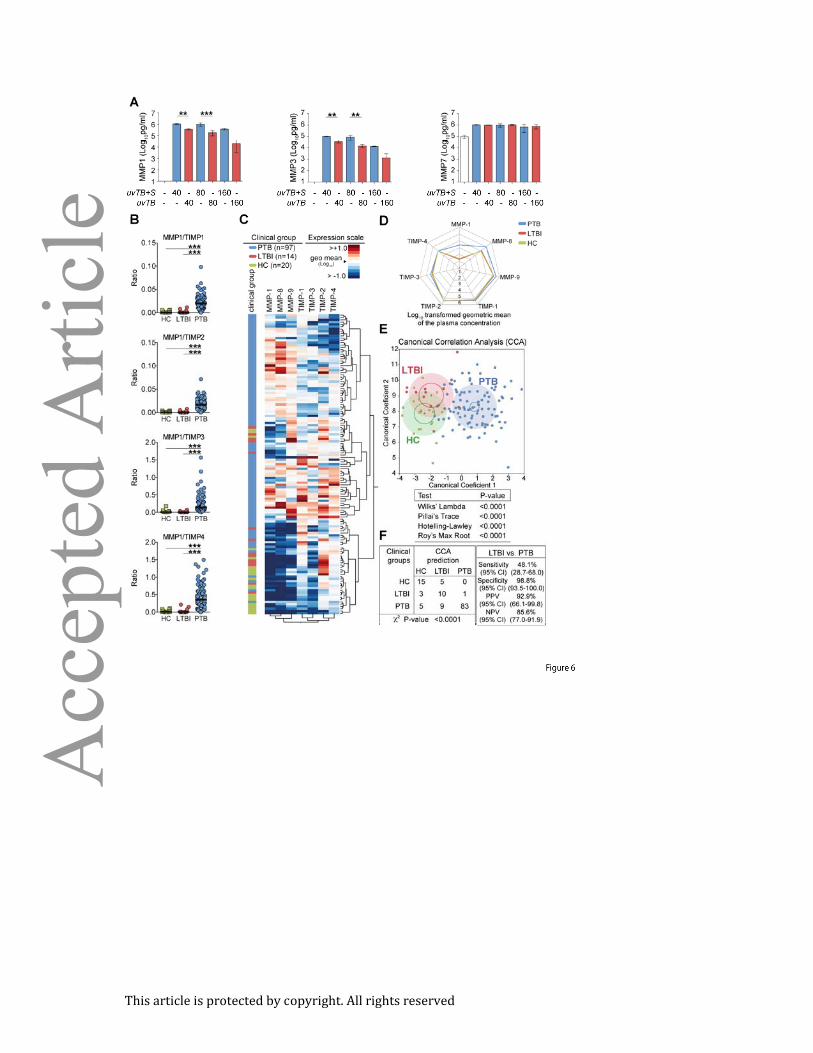
UV-irradiated M. tuberculosis induced substantial level of MMP-1, -3 and -7 expression
(Figure 6A) from human blood-derived monocyte macrophages. The addition M.
tuberculosis culture supernatant significantly enhanced MMP-1 and -3 secretion, but not
MMP-7 (Figure 6A). Finally, we took a hypothesis-driven approach to evaluating MMP/TIMP
imbalances in peripheral blood from a cohort in India including pulmonary TB (PTB), latent
TB (LTBI) and healthy controls (HC) previously used to investigate biomarkers for of active
PTB diagnosis [[28], and Andrade et al. unpublished data]. We showed that MMP-1/TIMP1-
4 ratios were greater in pulmonary TB (PTB) patients than LTBI and healthy controls (Figure
6B). We then utilized hierarchal clustering of tissue degrading MMPs and TIMPs to assess
the associations between MMP/TIMP levels and patients with active TB (Figure 6C). Overall
increases in MMP-1, -8 and -9 were observed (figure 6D) and a Canonical Correlation
Analysis (CCA) model confirmed that peripheral MMP/TIMP imbalance is a prominent
feature of active disease (Figure 6E-F).
Discussion
The majority of the global TB burden occurs in immunocompetent adults, where tissue
destruction and consequent cavity formation is associated with treatment failure, the
emergence of drug resistance, transmission of infection, morbidity, mortality and long-term
respiratory impairment [1, 8, 10, 11, 30, 31]. Despite its clinical significance, pulmonary
cavitation is poorly understood and the effect of therapeutics in cavitary TB is not

This article is protected by copyright. All rights reserved
established in preclinical trials. To address this gap, we have developed a novel rabbit
model of pulmonary cavitation and an imaging strategy that provides objective, quantitative,
real-time measure of disease. We demonstrate that cavities develop rapidly from areas of
dense consolidation facilitating massive bacterial proliferation in the context of a protease-
antiprotease imbalance.
Our model replicates the classical pathology observed in human TB, including cavity and
granuloma formation, in a rapid and reliable manner (Figures 1 and 2). These pathologies
develop in the presence of the characteristic DTH responses of post-primary TB [13, 32, 33].
TST acts as a functional measure of DTH, as its development is dependent not only on CD4+ve
T-cell responses, but also the subsequent recruitment and activation of monocytes, NK Cells
and CD8+ve T cells, as well as IFNγ and Il-12 mediated inflammatory cascades [12]. Pre-
existing DTH to M. tuberculosis is common in endemic regions where 90% of healthy adults
are TST-positive [33]. In low prevalence settings, where population prevalence of TST-
positivity is low, TST-positivity is present in 90% of individuals with active TB [32].
Experimental data from rabbits indicate that DTH, as measured by any induration of TST,
either from pre-sensitization, or through prolonged infection, predicts cavity formation [24,
25, 29, 34]. By recapitulating post-primary DTH, our model rapidly generates cavities which
are highly representative of human pathology: there is a fibrotic layer surrounded by
monocytes, within which lies a layer of epithelioid macrophages which are progressively
more necrotic towards the center of the cavity, that contains high numbers of culturable,
acid-fast bacilli [5, 12, 13]. This model compliments existing mouse, guinea-pig, rabbit and
non-human primate models, adding to their utility in the study of multiple drug regimens,
This article is protected by copyright. All rights reserved
vaccine efficacy, granuloma progression and human-like immune responses respectively,
the possibility of studying cavitary disease preclinically [29, 35-37].
Clinical studies can only provide a snapshot of disease progression and consequently do not
inform us of the precise sequence of events during cavity formation. To address this, we
developed novel methods to accurately quantify tissue destruction in vivo (Figures 4 and 5).
Previously, positron emission tomography (PET) using the glucose analogue 2-deoxy-2-
[18F]fluoro-D-glucose (18F-FDG) has been used in clinical and preclinical trials [38-40]. In
comparison to PET, CT scanning has several key technical benefits: CT gives detailed
structural information, does not require intravenous injections, does not use radioisotopes,
can be acquired in less than 30 seconds, allows for high-resolution (in this case,
0.5×0.5×0.625mm) quantitation, and is more readily available [41, 42]. Previous CT analyses
have primarily focused on pattern recognition, and to date, no technique to quantitatively
assess TB disease severity by CT has been developed [43-46]. Hunter’s exhaustive review of
human specimens and post-mortem studies indicated that cavities emerge from regions of
confluent consolidation, and not from individual granulomas [5]. Our model recapitulates
this process, revealing that cavitation is a very rapid process. Further studies are required to
determine the exact nature of the pre-cavitary lesion.
Pulmonary extracellular matrix (ECM) is highly resilient, and its rapid destruction requires
proteolytic enzymes [47, 48]. Previous studies have identified correlates between active TB
and increased MMP expression in respiratory secretions, but not a direct link between
cavity formation and MMP activity [15, 16, 18]. In this study, we established a unique and
specific relationship between MMP-1 expression and cavitary pathology (Figure 3). Our
finding that in rabbits, MMP-1, -3, -7, -12 and -13 transcriptional levels are increased in
This article is protected by copyright. All rights reserved
granulomatous and cavitary pathologies correlate with the finding that several of these
MMPs are increased in human respiratory secretions and in vivo models [16, 49]. TIMP-1 did
increase in our model, although not substantially, a finding also consistent with human data
[18]. The reduction in TIMP-3 is predicted by in vitro human monocyte infection models, but
has not been observed in tissue [27]. TIMP-3 deficiency in mice is, in isolation sufficient to
lead to lung ECM degradation [50]. This suggests that, in rabbits, MMP-1/TIMP-3 imbalance
is specifically associated with cavity formation.
Previously, we have demonstrated that MMP-1 and -3 expression is greater in macrophage
infected with pathogenic M. tuberculosis than attenuated vaccine strains [27]. We provide
evidence that secreted and cellular components of M. tuberculosis drive the collagen
degrading MMP-1, and its activator MMP-3 but not non-collagenolytic MMPs (Figure 6A).
This evidence from the rabbit and macrophage infection models, as well as previous studies
indicate that MMP/TIMP imbalance is a key feature of cavity disease [18].
Our final evaluation was of the diagnostic potential of MMP/TIMP imbalances in human
plasma. Prior studies used induced sputum or bronchoalveolar lavage samples, which are
not easily attainable diagnostic materials. In this study we utilized plasma, which is easier to
attain and process. We first confirmed that MMP-1/TIMP imbalance was significantly
altered in active disease (Figure 6B), and demonstrate that although MMP/TIMP imbalances
alone are not diagnostic of active disease; they have potential as peripheral markers of
active pulmonary TB (Figure 6E-F).
In summary, our model, in combination with previous studies of both human and rabbit
disease, suggests that DTH reactions as well as MMP/TIMP imbalances are key components
of cavity development [15, 24]. Through direct observation of cavitation, we reveal that

This article is protected by copyright. All rights reserved
dense consolidation erodes to leave a cavity in which bacterial multiplication is unchecked
the airways can be accessed (supplementary figure 1). We provide evidence that a bacterial-
driven host-protease imbalance drives cavity formation. The protease-antiprotease
imbalance distinguishes active from latent disease in man. Although not of diagnostic power,
this may be relevant to screening or diagnostic pathways. We predict that restoration of this
imbalance may be of benefit in TB treatment. Our model provides a strategy for
investigating protease directed (and other) therapies in the context of human-like pathology.
Such studies will provide: (i) mechanistic insight into TB pathogenesis (ii), the function of the
targeted pathways in immunity and (iii), the therapeutic potential of these drugs as
adjunctive TB therapy.

This article is protected by copyright. All rights reserved
Acknowledgements
WRB acknowledges the support of Howard Hughes Medical Institute and NIH grants R01 AI
079590; R01 AI037856, and R01 AI036973. AK and JSF were supported by a grant from
Imperial College London. SKJ was supported by NIH Director’s New Innovator Award DP2-
OD6492 and R01-HL116316.
Author Contributions
AK and BL contributed equally to the work. Senior authors JSF, PTGE and WRB contributed equally to
the work. AK, BL, CL, NCA, JSF, PTGE and WRB designed and performed the experiments. BBA, KWB
and MO performed histopathological analysis. ZX. UB, DJM, MK, SKJ, BL and AK contributed to image
acquisition and analysis. JB and AK designed and manufactured the breath-hold chamber. JM, KW,
BAA, LC, BL, AK, CL and NCA performed rabbit experiments. BBA, NPK, SB and AS acquired human
samples and performed analysis. AK prepared the manuscript.

This article is protected by copyright. All rights reserved
References
1. Global tuberculosis report 2013: World Health Organization; 2013. Report No.:
9789241564656.
2. Laxminarayan R, Klein E, Dye C, et al. Economic benefit of tuberculosis control. 2007.
3. Global tuberculosis report 2010: World Health Organization; 2010. Report No.:
WHO/HTM/TB/2010.7.
4. Hatipoglu ON, Osma E, Manisali M, et al. High resolution computed tomographic
findings in pulmonary tuberculosis. Thorax 1996; 51: 397-402.
5. Hunter RL. Pathology of post primary tuberculosis of the lung: An illustrated critical
review. Tuberculosis 2011; 91: 497-509.
6. Elkington PT, Armiento JM, Friedland JS. Tuberculosis immunopathology: the
neglected role of extracellular matrix destruction. Science Translational Medicine
2011; 3: 71ps76-71ps76.
7. Canetti G. The Tubercle Bacillus in the Pulmonary Lesion of Man. 1955: 226.
8. Golub JE, Bur S, Cronin WA, et al. Delayed tuberculosis diagnosis and tuberculosis
transmission. International Journal of Tuberculosis and Lung Disease 2006; 10: 24-30.
9. Kaplan G, Post FA, Moreira AL, et al. Mycobacterium tuberculosis growth at the
cavity surface: a microenvironment with failed immunity. Infection and Immunity
2003; 71: 7099-7108.
10. Benator D, Bhattacharya M, Bozeman L, et al. Rifapentine and isoniazid once a week
versus rifampicin and isoniazid twice a week for treatment of drug-susceptible
pulmonary tuberculosis in HIV-negative patients: a randomised clinical trial. Lancet
2002; 360: 528-534.
11. Visser ME, Stead MC, Walzl G, et al. Baseline predictors of sputum culture conversion
in pulmonary tuberculosis: Importance of cavities, smoking, time to detection and
W-Beijing genotype. PloS one 2012; 7: e29588.
12. Kumar V, Abbas AK, Fausto N, et al. Robbins and Cotran Pathologic Basis of Disease.
8th ed. Saunders Elsevier: Philadelphia 2010.
13. Hunter RL, Jagannath C, Actor JK. Pathology of postprimary tuberculosis in humans
and mice: Contradiction of long-held beliefs. Tuberculosis 2007; 87: 267-278.
This article is protected by copyright. All rights reserved
14. Dannenberg AM. Pathogenesis of human pulmonary tuberculosis: Insights from the
rabbit model. American Society for Microbiology Press 2006:453.
15. Elkington P, Shiomi T, Breen R, et al. MMP-1 drives immunopathology in human
tuberculosis and transgenic mice. The Journal of clinical investigation 2011; 121:
1827-1833.
16. Walker NF, Clark SO, Oni T, et al. Doxycycline and HIV infection suppress
tuberculosis-induced matrix metalloproteinases. American journal of respiratory and
critical care medicine 2012; 185: 989-997.
17. Seddon J, Kasprowicz V, Walker NF, et al. Procollagen III N-terminal propeptide and
desmosine are released by matrix destruction in pulmonary tuberculosis. Journal of
Infectious Diseases 2013; 208: 1571-1579.
18. Ugarte-Gil CA, Elkington P, Gilman RH, et al. Induced sputum MMP-1, -3 & -8
concentrations during treatment of tuberculosis. PloS one 2013; 8: e61333.
19. Pais TF, Silva RA, Smedegaard B, et al. Analysis of T cells recruited during delayed-
type hypersensitivity to purified protein derivative (PPD) versus challenge with
tuberculosis infection. Immunology 1998; 95: 69-75.
20. Leong FJ, Dartois V, Dick T. A Color Atlas of Comparative Pathology of Pulmonary
Tuberculosis. CRC Press 2010.
21. McMurray DN, Collins FM, Dannenberg AM, Jr., et al. Pathogenesis of Experimental
Tuberculosis in Animal Models. In: Shinnick T, ed. Tuberculosis. Springer Berlin
Heidelberg 1996:157-179.
22. Kjellsson MC, Via LE, Goh A, et al. Pharmacokinetic evaluation of the penetration of
antituberculosis agents in rabbit pulmonary lesions. Antimicrobial Agents and
Chemotherapy 2011; 56: 446-457.
23. Green AM, Mattila JT, Bigbee CL, et al. CD4+ regulatory T cells in a cynomolgus
macaque model of Mycobacterium tuberculosis infection. Journal of Infectious
Diseases 2010; 202: 533-541.
24. Nedeltchev GG, Raghunand TR, Jassal MS, et al. Extrapulmonary dissemination of
Mycobacterium bovis but not Mycobacterium tuberculosis in a bronchoscopic rabbit
model of cavitary tuberculosis. Infection and Immunity 2009; 77: 598-603.
25. Jassal MS, Nedeltchev GG, Osborne J, et al. A modified scoring system to describe
gross pathology in the rabbit model of tuberculosis. BMC microbiology 2011; 11: 49.
This article is protected by copyright. All rights reserved
26. Gattinoni L, Caironi P, Cressoni M, et al. Lung recruitment in patients with the acute
respiratory distress syndrome. New England Journal of Medicine 2006; 354: 1775-
1786.
27. Elkington PTG, Nuttall RK, Boyle JJ, et al. Mycobacterium tuberculosis, but not
vaccine BCG, specifically upregulates matrix metalloproteinase-1. American journal
of respiratory and critical care medicine 2005; 172: 1596-1604.
28. Andrade BB, Pavan Kumar N, Mayer-Barber KD, et al. Plasma heme oxygenase-1
levels distinguish latent or successfully treated human tuberculosis from active
disease. PLoS ONE 2013; 8: e62618.
29. Subbian S, Tsenova L, Yang G, et al. Chronic pulmonary cavitary tuberculosis in
rabbits: a failed host immune response. Open Biology 2011; 1: 110016.
30. Menezes AMB, Hallal PC, Perez-Padilla R, et al. Tuberculosis and airflow obstruction:
evidence from the PLATINO study in Latin America. European Respiratory Journal
2007; 30: 1180-1185.
31. Hnizdo E, Singh T, Churchyard G. Chronic pulmonary function impairment caused by
initial and recurrent pulmonary tuberculosis following treatment. Thorax 2000; 55:
32-38.
32. Huebner RE, Schein MF, Bass JB, Jr. The tuberculin skin test. Clinical Infectious
Diseases 1993; 17: 968-975.
33. Wood R, Liang H, Wu H, et al. Changing prevalence of tuberculosis infection with
increasing age in high-burden townships in South Africa. The International Journal of
Tuberculosis and Lung Disease 2010; 14: 406-412.
34. Converse PJ, Dannenberg Jr AM, Estep JE, et al. Cavitary tuberculosis produced in
rabbits by aerosolized virulent tubercle bacilli. Infection and Immunity 1996; 64:
4776-4787.
35. Lanoix J-P, Betoudji F, Nuermberger E. Novel regimens identified in mice for
treatment of latent tuberculosis infection in contacts of patients with multidrug-
resistant tuberculosis. Antimicrobial Agents and Chemotherapy 2014; 58: 2316-2321.
36. Horwitz MA, Harth G. A new vaccine against tuberculosis affords greater survival
after challenge than the current vaccine in the guinea pig model of pulmonary
tuberculosis. Infection and Immunity 2003; 71: 1672-1679.

This article is protected by copyright. All rights reserved
37. Kunnath-Velayudhan S, Davidow AL, Wang H-Y, et al. Proteome-scale antibody
responses and outcome of Mycobacterium tuberculosis infection in nonhuman
primates and in tuberculosis patients. The Journal of infectious diseases 2012; 206:
697-705.
38. Lee M, Lee J, Carroll MW, et al. Linezolid for treatment of chronic extensively drug-
resistant tuberculosis. New England Journal of Medicine 2012; 367: 1508-1518.
39. Davis SL, Nuermberger EL, Um PK, et al. Noninvasive pulmonary [18F]-2-fluoro-
deoxy-D-glucose positron emission tomography correlates with bactericidal activity
of tuberculosis drug treatment. Antimicrobial Agents and Chemotherapy 2009; 53:
4879-4884.
40. Lin PL, Coleman T, Carney JPJ, et al. Radiologic responses in cynomolgous macaques
for assessing tuberculosis chemotherapy regimens. Antimicrobial Agents and
Chemotherapy 2013.
41. Uchiyama Y, Katsuragawa S, Abe H, et al. Quantitative computerized analysis of
diffuse lung disease in high-resolution computed tomography. Medical Physics 2003;
30: 2440-2454.
42. Xu Z, Bagci U, Kubler A, et al. Computer-aided detection and quantification of
cavitary tuberculosis from CT scans. Medical Physics 2013; 40: 113701.
43. Cha J, Lee HY, Lee KS, et al. Radiological findings of extensively drug-resistant
pulmonary tuberculosis in non-AIDS adults: comparisons with findings of multidrug-
resistant and drug-sensitive tuberculosis. Korean Journal of Radiology 2009; 10: 207-
216.
44. Yeh JJ, Chen SC-C, Teng W-B, et al. Identifying the most infectious lesions in
pulmonary tuberculosis by high-resolution multi-detector computed tomography.
European Radiology 2010; 20: 2135-2145.
45. Genereux GP. Pattern recognition in diffuse lung disease. A review of theory and
practice. Medical radiography and photography 1985; 61: 2-31.
46. Sider L, Gabriel H, Curry DR, et al. Pattern recognition of the pulmonary
manifestations of AIDS on CT scans. Radiographics : a review publication of the
Radiological Society of North America, Inc 1993; 13: 771-784- discussion 785-776.
47. Petersen TH, Calle EA, Zhao L, et al. Tissue-engineered lungs for in vivo implantation.
Science 2010; 329: 538-541.

This article is protected by copyright. All rights reserved
48. Loffek S, Schilling O, Franzke CW. Series "matrix metalloproteinases in lung health
and disease": Biological role of matrix metalloproteinases: a critical balance.
European Respiratory Journal 2011; 38: 191-208.
49. Singh S, Saraiva L, Elkington PT, et al. Regulation of matrix metalloproteinase-1, -3,
and -9 in Mycobacterium tuberculosis-dependent respiratory networks by the
rapamycin-sensitive PI3K/p70(S6K) cascade. FASEB J 2014; 28: 85-93.
50. Leco KJ, Waterhouse P, Sanchez OH, et al. Spontaneous air space enlargement in the
lungs of mice lacking tissue inhibitor of metalloproteinases-3 (TIMP-3). The Journal of
clinical investigation 2001; 108: 817-829.
This article is protected by copyright. All rights reserved
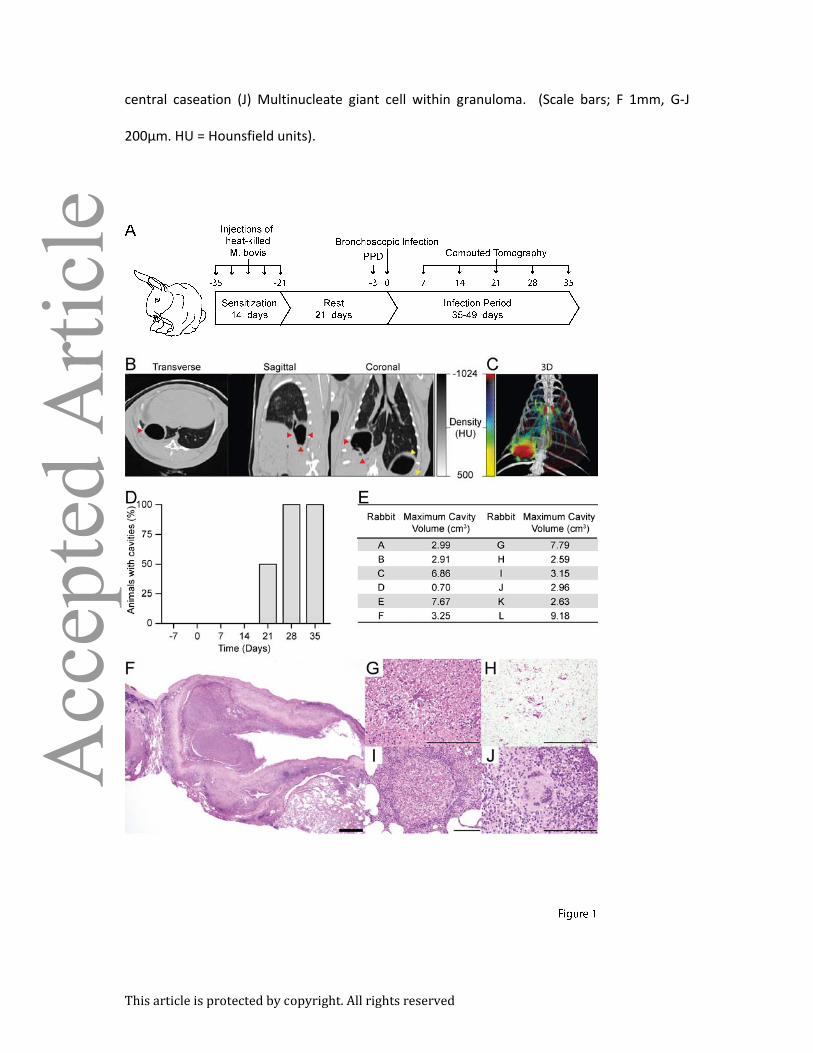
Figure 1. A reproducible model of TB which demonstrates human-like pathology and
cavity formation within 28 days: (A) Sensitization and infection protocol: Rabbits were
sensitized by administering 5 injections over 14 days, each containing 108 heat-killed CFU of
M. bovis strain Ravenel. After 21 days, PPD testing was performed to confirm the
development of delayed-type hypersensitivity to M. tuberculosis complex antigens. Infection
with 103 CFU of M. tuberculosis was then performed 3 days after PPD testing under
bronchoscopic guidance. The animals were monitored by serial CT imaging and then
humanely sacrificed at pre-determined time points. See methods for detailed description. (B)
Representative CT scan of a rabbit with a cavity. Red arrows indicate the cavity, while yellow
arrows indicate gastric air. (C) A 3D-reconstruction of a representative animals scan using a
customized scale in which low density regions (cavities and airways) are represented in red,
and high density regions (blood vessels and consolidation) in a green to yellow scale where
yellow regions are more dense. (D) Proportion of animals with cavities at each time point as
assessed by CT scan (n=12). (E) Cavity size was assessed using an automated cavity
segmentation algorithm [ref. 45]. Maximum cavity sizes for each animal are shown. (F-J)
H+E stained slides of rabbit lung tissue demonstrating all the pathognomic features of
human TB: (F) Low power image of cavity, with air-filled center, necrotic rim and a
peripheral fibrotic cuff. (G) Necrotic debris at cavity surface (H) Ziehl-Neelsen staining
demonstrates numerous bacteria within necrotic debris (I) Small cellular granuloma without
This article is protected by copyright. All rights reserved
central caseation (J) Multinucleate giant cell within granuloma. (Scale bars; F 1mm, G-J
200µm. HU = Hounsfield units).

This article is protected by copyright. All rights reserved
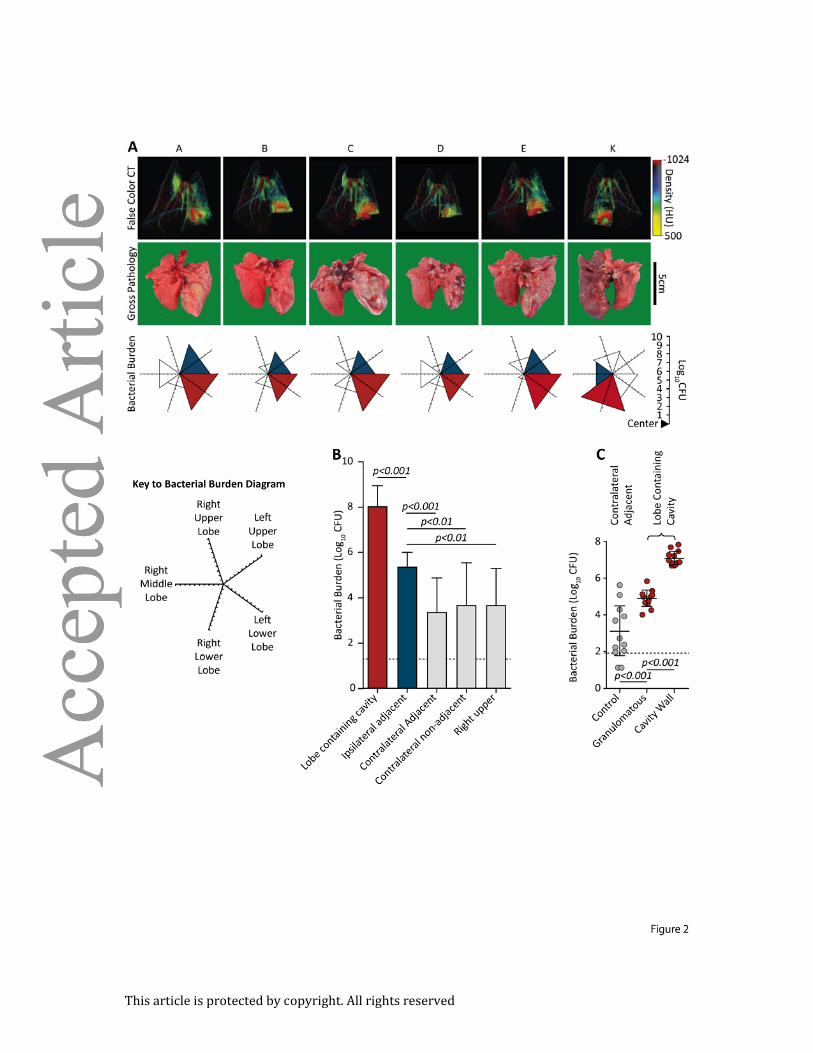
Figure 2. Bacterial burden is 100-fold higher at the cavity surface than in granulomatous
lung tissue: (A) Matched findings from 6 animals (A-E and K), showing correlations between
pre-mortem CT scans, post-mortem gross pathology and M. tuberculosis burden. CT scans
reliably demonstrate the lobe containing the cavity. The bacterial burden is represented on
a 5-directional axis with each axis representing a lobe of the rabbit lung. Bacterial burden is
highest in the lobe with most extensive pathology. (B) The majority of the bacteria are found
within the cavitary lobe (n=12). (Red; lobe containing cavity, blue; ipsilateral adjacent
[relative to cavity] lobe, light gray; non-adjacent [to cavity] lobes, no triangle; no bacilli
cultured). (C) Bacterial burden within the cavitary lobe was assessed by taking 3mm punch
biopsies from the surface of the cavity, non-cavity infected tissue from the same lobe, and
tissue the contralateral lower lobe (6 samples per region per animal, n=11). The bacterial
burden is almost exclusively at the cavity surface, representing 99.9% of bacteria. (Error bars
represent standard deviation, p-values calculated using one-way ANOVA with Tukey post-
comparison test).
This article is protected by copyright. All rights reserved
This article is protected by copyright. All rights reserved
Figure 3. Tissue-destructive MMPs are upregulated in infected lung, in particular within
the cavity wall: (A) Multiple MMPs implicated in human TB immunopathology are
upregulated in infected lung tissue when evaluated by q-RT PCR. (B) Heat chart showing
approximate MMP expression levels as evaluated by average difference in ct-value relative
to beta actin (BACT). (C) TIMP-1 and TIMP-3 expression in cavity wall, granulomatous and
normal tissue. (D) MMP-1 protein concentration analyzed by ELISA demonstrated a
significant increase in cavity wall as compared to normal tissue. (E) MMP-1 activity was
demonstrated by casein zymography, with a band of proteolytic activity at 35kDA in infected
lung tissue similar to active recombinant MMP-1. (F) Ro32-3555 completely inhibits
caseinolytic activity of both M. tuberculosis infected rabbit lung tissue and human
macrophages (mφ) infected with M. tuberculosis. (Error bars represent standard deviation,
ct; cycle threshold, p-values calculated using one-way ANOVA with Tukey post-comparison
test).

This article is protected by copyright. All rights reserved

This article is protected by copyright. All rights reserved
Figure 4. 3-dimensional false-color reconstruction of CT images demonstrates disease
progression over time: (A-G) Serial imaging of a single, representative rabbit over 49 days.
Day 7 and 14 are non-anesthetized, non-breath-hold scans, all others are breath-hold scans
with the lungs inflated to 20cmH2O inflation. (H) Proportional distribution of pulmonary
tissue by density when inflated to 20cmH2O of pressure demonstrates highly reproducible
density spectrum (n=54). Black line represents mean density and red lines represent
standard deviation. (I) Proportional distribution of voxels inflated to 10cmH2O, grouped by
tissue type derived from Hounsfield Units (HU). (Black, not inflated, -100 to 100HU; Dark
Grey, poorly aerated, -101 to -500HU; light grey, normally aerated, -501 to -900HU; white,
hyperexpanded, -901 to -1000HU. Error bars represent standard deviations).
This article is protected by copyright. All rights reserved

This article is protected by copyright. All rights reserved
Figure 5. Disease progression in individual animals can be quantitatively analyzed in vivo:
(A) Distribution of tissue mass in lungs, inclusive of tissue recruited during expansion from
10cmH2O to 20cmH2O scans (Black, not aerated; darkest grey, poorly aerated; middle grey,
potentially recruited; light grey, normally aerated; white, hyperexpanded). (B) Proportional
loss of functional lung tissue by mass during the course of infection. Functional tissue is sum
of normally aerated tissue and potentially aerated tissue. (C) Change in proportional voxel
density distribution after infection (n=42). (D) Visualization of pathological changes using.
Yellow, high density, consolidation, -184 to +156HU; red, low density, cavity, -1024 to -
924HU. (E-G) In vivo quantification of pulmonary pathological change. (E) Proportion of lung
containing a cavity signature to day 35 post infection. (F) Proportion of lung containing a
consolidation signature. (G) Overall diseased lung signature, incorporating both
consolidated and cavitary tissue. (p-values calculated using repeated-measures ANOVA with
Tukey post-comparison test).

This article is protected by copyright. All rights reserved

This article is protected by copyright. All rights reserved
Figure 6. MMP/TIMP imbalance in humans: (A) MMP-1/-3 and -7 levels were measured in
supernatant from human monocyte derived macrophages infected with UV-killed M.
tuberculosis in the presence or absence of released bacterial products. (B) Plasma
concentrations of several MMPs and TIMPs were assessed by ELISA in samples from ATT-
naïve active pulmonary TB patients (PTB, n=97), individuals with latent TB infection (LTBI,
n=14) and age and gender matched healthy controls (HC, n=20). The ratio between levels of
MMP-1 and each one of the TIMPs are shown. (C) An unsupervised two-way clustering
analysis (Ward’s method) was employed using the plasma concentrations of each MMP and
TIMP. Individuals from the PTB, LTBI or HC groups were listed in rows and each biomarker
was placed in a different column. The squares in the heat map represent values below or
above the geometric mean values (log10 transformed) of a given biomarker in the entire
study population (n=131), with dark red indicating an increase in expression and dark blue a
decrease. (D) A representative profile of geometric mean values (log10 transformed) for
MMPs and TIMPs in plasma is shown for each clinical group. (E) The performance of the
combined assessment of plasma concentrations of several MMPs and TIMPs in
distinguishing the different clinical groups was tested using a Canonical Correlation Analysis
(CCA) model. The statistically significance of the CCA model was tested using standardized
tests and P values for each one of them is shown. Small circles represent the 95%
confidence region to contain true mean of each group whereas large shaded ellipses
represent region estimated to contain 50% of the population of each group. (F) The

This article is protected by copyright. All rights reserved
performance of the CCA model in distinguishing the different clinical groups as well as
details of sensitivity, specificity and predictive values of the test distinguishing PTB form LTBI
are shown. In (B), data were analyzed using Kruskal-Wallis test with Dunn’s multiple
comparisons post hoc test. In F, data was analyzed using chi-square (left panel) and the
Fisher’s exact tests (right panel) ***P<0.0001; CI, confidence interval.
This article is protected by copyright. All rights reserved
Copyright © 2022 FDOKUMEN