My Questionnaire is Too Long!
18
‘‘My Questionnaire is Too Long!’’ The assessments of motivational-affective constructs with three-item and single-item measures Katarzyna Gogol a,b,⇑ , Martin Brunner a,c , Thomas Goetz d,e , Romain Martin b , Sonja Ugen b , Ulrich Keller b , Antoine Fischbach b , Franzis Preckel f a Free University of Berlin, Berlin, Germany b University of Luxembourg, Luxembourg, Luxembourg c Berlin-Brandenburg Institute for School Quality, Berlin, Germany d University of Konstanz, Konstanz, Germany e Thurgau University of Teacher Education, Kreuzlingen, Switzerland f University of Trier, Trier, Germany Keywords: Academic self-concept Academic anxiety Short scale Single-item measure Psychological assessment abstract Because testing time in educational research is typically scarce, the use of long scales to assess motivational affective constructs can be problematic. The goal of the present study was to scrutinize the psychometric properties of short scales (with three items) and single item measures for two core motivational affective constructs (i.e., academic anxiety and academic self concept) by conducting sys tematic comparisons with corresponding long scales across school subjects and within different subject domains (i.e., mathematics, German, French). Statistical analyses were based on representative data from 3879 ninth grade students. All short forms possessed satisfactory levels of reliability (range: .75 .89) and substantial correlations with the long scales (range: .88 .97); correlational patterns with educational stu dent characteristics (e.g., achievement, school satisfaction, gender, academic track, and socioeconomic status) were comparable to those obtained with the corresponding long scales (all average differences in correlations below .07). The correlational patterns between all single item measures and the external criteria were similar to those obtained with the corresponding long scales (all average differences in correlations below .08), yet the single item measures demonstrated low to modest score reliabilities (estimated with the model based omega coefficient; range: .22 .72) and correlations with full scales (range: .50 .88). When long scales are not applicable, short forms and perhaps even single item measures may represent psychometrically sound alternatives for assessing academic anxiety and academic self concept for educational research purposes. 1. Introduction Student learning is a complex process that can be understood only by investigating multiple constructs, for example, learning related feelings and motivational factors as vital variables that affect students’ cognition, learning, and performance (Linnenbrink & Pintrich, 2000). To obtain comprehensive insights into students’ learning related affect and motivation, it is necessary to assess multiple motivational affective constructs and to analyze their multivariate relations. However, in educational research, testing time is typically scarce, particularly in large scale assessment studies, in longitudinal studies with a measurement burst design, or in studies that use experience sampling as an ambulatory form of assessment. Although such study designs provide important insights into students’ learning by including representative student populations or by providing information about intraindividual variability in ecologically valid settings, the very nature of such studies renders the assessment of many constructs with measures that include numerous items problematic, and in most cases, even impossible. The purpose of the present study was therefore to scrutinize the practice of using very short scales or even a single item to assess core motivational affective constructs. To this end, we studied the psychometric properties of short scales (consisting of three items) and single item measures for two constructs: academic anxiety and academic self concept. Both constructs rep resent key motivational affective student characteristics that have ⇑ Corresponding author. Free University of Berlin, Department of Education and Psychology, Habelschwerdter Allee 45, 14195 Berlin, Germany. E-mail address: [email protected] (K. Gogol). Konstanzer Online-Publikations-System (KOPS) URL: http://nbn-resolving.de/urn:nbn:de:bsz:352-0-262761 Erschienen in: Contemporary Educational Psychology ; 39 (2014), 3. - S. 188-205
-
Upload
khangminh22 -
Category
Documents
-
view
5 -
download
0
Transcript of My Questionnaire is Too Long!

‘‘My Questionnaire is Too Long!’’ The assessmentsof motivational-affective constructs with three-itemand single-item measures
Katarzyna Gogol a,b,⇑, Martin Brunner a,c, Thomas Goetz d,e, Romain Martin b, Sonja Ugen b, Ulrich Keller b,Antoine Fischbach b, Franzis Preckel f
a Free University of Berlin, Berlin, GermanybUniversity of Luxembourg, Luxembourg, LuxembourgcBerlin-Brandenburg Institute for School Quality, Berlin, GermanydUniversity of Konstanz, Konstanz, Germanye Thurgau University of Teacher Education, Kreuzlingen, SwitzerlandfUniversity of Trier, Trier, Germany
Keywords:Academic self-conceptAcademic anxietyShort scaleSingle-item measurePsychological assessment
a b s t r a c t
Because testing time in educational research is typically scarce, the use of long scales to assessmotivational affective constructs can be problematic. The goal of the present study was to scrutinizethe psychometric properties of short scales (with three items) and single item measures for two coremotivational affective constructs (i.e., academic anxiety and academic self concept) by conducting systematic comparisons with corresponding long scales across school subjects and within different subjectdomains (i.e., mathematics, German, French). Statistical analyses were based on representative data from3879 ninth grade students. All short forms possessed satisfactory levels of reliability (range: .75 .89) andsubstantial correlations with the long scales (range: .88 .97); correlational patterns with educational student characteristics (e.g., achievement, school satisfaction, gender, academic track, and socioeconomicstatus) were comparable to those obtained with the corresponding long scales (all average differencesin correlations below .07). The correlational patterns between all single item measures and the externalcriteria were similar to those obtained with the corresponding long scales (all average differences incorrelations below .08), yet the single item measures demonstrated low to modest score reliabilities(estimated with the model based omega coefficient; range: .22 .72) and correlations with full scales(range: .50 .88). When long scales are not applicable, short forms and perhaps even single itemmeasures may represent psychometrically sound alternatives for assessing academic anxiety andacademic self concept for educational research purposes.
1. Introduction
Student learning is a complex process that can be understoodonly by investigating multiple constructs, for example, learningrelated feelings and motivational factors as vital variables thataffect students’ cognition, learning, and performance (Linnenbrink& Pintrich, 2000). To obtain comprehensive insights into students’learning related affect and motivation, it is necessary to assessmultiple motivational affective constructs and to analyze theirmultivariate relations. However, in educational research, testingtime is typically scarce, particularly in large scale assessment
studies, in longitudinal studies with a measurement burst design,or in studies that use experience sampling as an ambulatory formof assessment. Although such study designs provide importantinsights into students’ learning by including representative studentpopulations or by providing information about intraindividualvariability in ecologically valid settings, the very nature of suchstudies renders the assessment of many constructs with measuresthat include numerous items problematic, and in most cases, evenimpossible. The purpose of the present study was therefore toscrutinize the practice of using very short scales or even a singleitem to assess core motivational affective constructs. To this end,we studied the psychometric properties of short scales (consistingof three items) and single item measures for two constructs:academic anxiety and academic self concept. Both constructs represent key motivational affective student characteristics that have
⇑ Corresponding author. Free University of Berlin, Department of Education andPsychology, Habelschwerdter Allee 45, 14195 Berlin, Germany.
E-mail address: [email protected] (K. Gogol).
Konstanzer Online-Publikations-System (KOPS) URL: http://nbn-resolving.de/urn:nbn:de:bsz:352-0-262761
Erschienen in: Contemporary Educational Psychology ; 39 (2014), 3. - S. 188-205

a long tradition in educational science. Academic anxiety and academic self concept are not only important with respect to students’learning, but are also considered to be vital learning outcomesthemselves (e.g., Goetz, Cronjaeger, Frenzel, Lüdtke, & Hall, 2010;Marsh & O‘Mara, 2008; Marsh, Trautwein, Lüdtke, Koller, &Baumert, 2005; Marsh & Yeung, 1997; Zeidner, 1998).
1.1. Academic anxiety and academic self concept: Definitions andrelations to important student characteristics
1.1.1. Academic anxietyAcademic anxiety refers to feelings of worry, nervousness, and
uneasiness in achievement related situations in the school context.Early research on academic anxiety conceived of it as a single, unidimensional, and domain transcending construct (e.g., Mandler &Sarason, 1952). This proposition has been extended in severalimportant ways: First, two key aspects of anxiety have been furtherdifferentiated: worry and emotionality (Liebert & Morris, 1967;Zeidner, 2007; for an alternative conceptualization of anxiety, seee.g., Scherer, 1984). The worry facet represents a cognitive component that refers to thoughts about one’s performance and theexpected consequences of failure. The emotionality facet represents an affective physiological component that refers to the affective experience of anxiety and perceived physical arousal in relatedsituations (Goetz, Preckel, Zeidner, & Schleyer, 2008; Hembree,1988; Zeidner, 2007). Importantly, although the two facets areempirically distinct (Zeidner, 2007), they are highly correlated,which points to a substantial amount of common variance thatmay be attributed to a general factor representing the general levelof anxiety. For example, Hembree (1988) reported a correlation ofr = .78 between worry and emotionality in his meta analysis. Second, in more recent educational research (dating back across thelast 10 15 years), academic anxiety has been considered to behighly specific to subject domains (Goetz, Frenzel, Pekrun, Hall, &Lüdtke, 2007) or to typical educational settings, such as the experience of anxiety during exams (test anxiety) or lessons at school(class anxiety).
To integrate these different conceptualizations of academicanxiety, it may be best to consider academic anxiety to be hierarchically organized where a general construct operates at the apexof the hierarchy and more specific facets (e.g., worry and emotionality as experienced in various educational settings) constitutelower hierarchical levels (see Pekrun, Goetz, Frenzel, Barchfeld, &Perry, 2011). Further, this hierarchical conceptualization may beapplied to understand students’ experiences of anxiety acrossschool subjects (i.e., academic anxiety is conceived to be adomain general construct) or within a certain school subject. Thedistinction between domain general and domain specific conceptions of academic anxiety is particularly important when it comesto studying the relations between academic anxiety and other student characteristics. More specifically, the specificity matchingprinciple (e.g., Swann, Chang Schneider, & McClarty, 2007; see alsoWittmann, 1988) predicts that general predictor variables (e.g.,domain general academic anxiety) will be most strongly relatedto general outcomes (e.g., general academic achievement), whereasmore specific predictor variables (e.g., mathematics anxiety) willbe more strongly related to (corresponding) specific outcomes(e.g., mathematics achievement). Finally, reports of academic anxiety may refer to the dispositional trait level or to the momentarystate of anxiety (cf. Goetz, Bieg, Lüdtke, Pekrun, & Hall, 2013). Inthe present paper, we focused on the trait level.
A rich body of knowledge is availablewith regard to the relationsbetween academic anxiety and other important student characteristics. There is strong empirical evidence that indicates negativeassociations between academic anxiety and academic performance(Hembree, 1988, 1990; Lee, 2009;Ma, 1999; Zeidner, 1998). Results
from meta analyses and selected studies with representative student samples from large scale assessment studies are presentedin Table 1. Negative relations have also been documented forsocio affective variables such as subjective well being and psychological health (Diener, 2000). With respect to differences related tospecific groups, in his meta analysis, Hembree (1988) found thatgirls reported higher levels of test anxiety than boys in general(similar results are reported for test anxiety in mathematics;Hembree, 1990) and that students with high socioeconomic status(SES) scored consistently lower on test anxiety than students withlow SES (with an average correlation of r = �.13).
1.1.2. Academic self conceptAcademic self concepts are mental representations of one’s
abilities in academic subjects (Brunner et al., 2010) that entailaspects of both self description and self evaluation (Brunner,Keller, Hornung, Reichert, & Martin, 2009; Marsh & Craven,1997). Notably, current models of academic self concept such asthe Marsh/Shavelson Model (Marsh, 1990a) or the nested Marsh/Shavelson model (Brunner et al., 2010) conceive of the academicself concept as a multidimensional construct with separate components for specific school subjects and a domain general academic self concept. Domain specific academic self conceptsreflect an individual’s impression of his or her ability in a specificacademic domain, such as mathematics (‘‘I am good at mathematics’’) or German (‘‘I am good at German’’), whereas the domaingeneral academic self concept reflects an individual’s evaluationof his or her academic abilities across subjects (‘‘I am good at mostschool subjects’’).
Positive academic self concepts are beneficial for many psychological and behavioral outcomes such as academic emotions(Goetz, Frenzel, Hall, & Pekrun, 2008), subsequent academic effort(Trautwein, Lüdtke, Schnyder, & Niggli, 2006), and success(Helmke & van Aken, 1995; Marsh & Yeung, 1997; Trautwein,Lüdtke, Marsh, Köller, & Baumert, 2006; Valentine, DuBois, &Cooper, 2004). The correlations between academic self conceptsand indicators of academic abilities (e.g., grades, standardizedachievement tests) as typically found in empirical studies are presented in Table 1.Moreover, students’ school satisfactionwas foundto be positively associated with their academic self concepts (e.g.,r = .45 in general, r = .39 for mathematics, and r = .31 for reading;Huebner, 1994). Regarding gender differences in academic self concepts, the results have been inconclusive. Many studies have indicated no significant differences in the general academic selfconcept (Brunner et al., 2009; Hergovich, Sirsch, & Felinger, 2004;Marsh, Smith, & Barnes, 1985; Skaalvik & Rankin, 1990), a higherself concept in mathematics for boys, and a higher verbal self concept for girls (Brunner et al., 2009; Hattie, 1992; Hergovich et al.,2004; Jackson, Hodge, & Ingram, 1994; Marsh, Smith et al., 1985;Preckel, Goetz, Pekrun, & Kleine, 2008; Skaalvik & Rankin, 1990).However, other studies have challenged these results by documenting a higher general academic self concept for males (e.g., Chiam,1987; Jackson et al., 1994), a higher general academic self conceptfor females (e.g., Lau, Siu, & Chik, 1998), and no significant genderdifferences in mathematics self concept (e.g., Ma & Kishor, 1997;Marsh, 1989;Marsh&Yeung, 1998). Furthermore, a positive relationhas been found between socioeconomic status and academic selfconcept (Marsh, 1987;Marsh&Parker, 1984), and children in higheracademic tracks have been found to have slightly higher academicself concepts than children who attend lower tracks (Marsh, 1987;Marsh, Kong, & Hau, 2000).
1.2. Measurement of academic anxiety and academic self concept
Academic anxieties and academic self concepts are not directlyobservable but are rather latent constructs. Thus, to assess
189

students’ levels on these constructs, observable (manifest) measures are necessary. Self report questionnaires are by far the mostprevalent method for assessing motivational affective constructssuch as academic anxieties and academic self concepts. Accordingto Zeidner (1998, 2007), self reports are also probably the bestmethod because directly asking a person for a self assessment provides the most direct access to his/her subjective thinking and feeling. When participants’ experiential states and thinking are ofinterest, asking the person may even be the only choice of assessment method (Baumeister, Vohs, & Funder, 2007). Additionally,self reports possess good psychometric properties and are relatively simple to administer (Zeidner, 2007).
In general, text books on measurement recommend using multiple items to represent psychological constructs (e.g., Nunally,1978). For academic anxieties and academic self concepts, thereexist several well established multiple item scales; for example,the anxiety scale from the Achievement Emotions Questionnaire(Pekrun et al., 2011) with a total of 24 items for class and testrelated anxieties and the Academic Self Description QuestionnaireASDQ for school related self concepts (Marsh, 1990a), containingsix items per school domain. However, on many occasions,researchers need more economical measures.
1.3. Advantages and disadvantages of short scales and multiple itemmeasures
The debate about the development of short scales has a longhistory with many criticisms expressed about this approach (e.g.,Levy, 1968; Loo, 2002) or the way this approach has been used(e.g., Smith, McCarthy, & Anderson, 2000). In the following, theadvantages and disadvantages of short scales and multiple itemmeasures will be contrasted with regard to both practical and psychometric issues.
To study the complexities of student learning, questionnaires ineducational research aim to assess not only a single but rathermany constructs. Yet, in doing so, researchers face practical constraints (Donnellan, Oswald, Baird, & Lucas, 2006), involving a limited amount of time allowed for testing, restricted space on a singlepage of the questionnaire (which may be necessary when all construct indicators need to be printed on one page), or financial limitations (to account for the costs of additional pages in a
questionnaire or the costs of translation). From this practical pointof view, short measures seem especially compelling as they reducenot only research costs but also survey length (Hoeppner, Kelly,Urbanoski, & Slaymaker, 2011).
However, short scales and especially single item measures areassumed to have psychometric disadvantages. First, in comparisonto long inventories, short scales and single item measures in particular are presumed to demonstrate poor score reliabilities bybeing more vulnerable to random measurement errors. Referringto a proposition in classical test theory, the proportion of measurement error in the total scale score is supposed to decrease as random measurement errors cancel each other out when they areaveraged across multiple items (Credé, Harms, Niehorster, &Gaye Valentine, 2012). By this logic, longer scales should demonstrate more acceptable levels for estimates of internal consistency.
Second, long scales are thought to have better criterion relatedvalidity than short scales. This claim is based on (a) the argumentthat error variance is reduced on long scales and (b) another classical test theory assumption that states that the correlationbetween a test and another construct cannot exceed the reliabilityof the test (Lord & Novick, 1968).
Third, multiple item measures are considered to be superior tosingle item measures concerning their content validity. Specifically, long scale scores may represent all facets that constitutethe construct, whereas the assessment of a construct with a singleitem makes it impossible to differentiate between subfacets of aconstruct (Jordan & Turner, 2008). For example, the administrationof a single item to assess mathematics anxiety would not allow aresearcher to test distinct effects of the worry and emotionalitycomponents or of the motivational versus cognitive componentsof academic anxiety on academic outcomes (Hembree, 1988).
It should also be noted that short scales have technical limitations concerning latent variable modeling because a minimum ofat least three indicators per factor are needed for a one factormodel to be identified without making very strong assumptionsconcerning the psychometric properties of these indicators(Kline, 2010). Moreover, many statistical procedures require continuous raw data that are normally distributed. However, for singleitems with a limited number of response categories, the assumption of continuous normally distributed data may not be tenable.Notably, even when single items contain only four response
Table 1Mean correlations between student achievement with academic anxiety and academic self-concept as obtained in meta-analyses and large-scale assessment studies withrepresentative student samples.
General academic achievement Mathematics achievement Verbal achievement
AnxietyGeneral academic test anxiety r = �.29 (M; N = 6390)a r = �.22 (M; N = 6534)a r = �.24 (M; N = 10,761)a
r = �.23 (M; N = 28,424)b
Mathematics anxiety r = �.34 (M; N = 5555)c r = �.06 (M; N = 1941)c
r = �.27 (M; N = 18,279)d
Self-conceptGeneral academic self-concept r = .34 (M; N = 46,482)f r = .24 (L; N = 106,680)e r = .28 (L; N = 106,680)e
r = .29 (L; N 106,680)e
Mathematics self-concept r = .21 (L; N 106,680)e r = .20 (M; N = 30,317)f r = .14 (M; N = 125,308)g
r = .43 (M; N = 125,308)g r = .13 (L; N = 106,680)e
r = .26 (L; N = 106,680)e
Verbal self-concept r = .19 (L; N 106,680)e r = .12 (M; N = 125,308)g r = .20 (M; N = 3669)f
r = .10 (L; N = 106,680)e r = .35 (M; N = 125,308)g
r = .24 (L; N = 106,680)e
Note. M = meta-analysis; L = large-scale assessment study. The second number in brackets indicates the sample size on which the correlation estimate was based.a Hembree (1988).b Seipp (1991).c Hembree (1990).d Ma (1999).e Brunner et al. (2009).f Hansford and Hattie (1982).g Möller, Pohlmann, Köller, and Marsh (2009).
190

categories, traditional statistical methods can yield trustworthyand unbiased results (see Rhemtulla, Brosseau Liard, & Savalei,2012). In other circumstances, more sophisticated methods thatbest fit the distributional properties of the measures under investigation should be chosen (see, e.g., the methods discussed byRhemtulla et al. (2012) or Wirth and Edwards (2007)).
On the other hand,multiple itemmeasures often include similarand redundant items, which can be problematic for various reasons.The proposition of the higher reliability of long scales is, for example, valid only under the assumption that errors are random. Common method variance due to similarly worded items or othercompounded systematic errors produced by redundant items(e.g., because of socially desirable responding; Robins, Hendin, &Trzesniewski, 2001) can lead to artificially high reliability estimates(Yang & Green, 2011). Moreover, perceived item redundancy onlong scales can be interpreted as an indicator of low face validityby the respondents (Christophersen & Konradt, 2011) and resultin lower motivation (Nevo, 1985). Thus, monotonous and timeconsuming long scales may have a negative influence on therespondents (Gardner, Cummings, Dunham, & Pierce, 1998). Theymay lead participants to experience boredom, irritation, fatigue,annoyance, frustration, or resentment (Robins et al., 2001;Wanous, Reichers, & Hudy, 1997), and might result in lower cognitive participation (Stanton, Sinar, Balzer, & Smith, 2002). Suchcircumstances can give rise to random and careless responding,which in turn may affect the reliability and the validity of the results(Credé et al., 2012; McCrae, Kurtz, Yamagata, & Terracciano 2011).
Furthermore, people are more likely to participate in a studywhen it demands less time (Konstabel, Lönnqvist, Walkowitz,Konstabel, & Verkasalo, 2012). As the willingness to participatedecreases as the number of items increases (Bean & Roszkowski,1995), long questionnaires may lead respondents to skip questions,refuse to complete a questionnaire, refuse to participate in futurestudies, or to drop out of longitudinal studies (Donnellan et al.,2006). The resulting missing data can potentially threaten the reliability and validity of the measurement (McKnight, McKnight,Sidani, & Figueredo, 2007). Additionally, lower response rates andattrition may be associated with sampling bias (Moore, Halle,Vandivere, & Mariner, 2002) because only the most involved andinterested or least busy participants may be the ones to answerall questions or decide to participate in a study further (Mooreet al., 2002). Such sampling bias undermines the generalizabilityof the results (i.e., external validity; McKnight et al., 2007). Thus,especially when multiple constructs need to be assessed and theabove mentioned problems associated with long scales accumulate, short scales may provide a useful alternative.
There are also advantages specific to single item measures withregard to interpretability. For example, the interpretation ofsummed or averaged scale scores is difficult because after suchtransformations of the item scores, the correspondence to theresponse categories vanishes. Therefore, for communicating theresults of a test to a broad audience (with little expertise in psychometrics), it may be better to use more intuitive measures such assingle items for which the value (e.g., 1) can be assigned to an easily understandable meaning (e.g., ‘‘do not agree’’). Note that previous research has shown that when constructs are unambiguousand clear to the respondents, single items may provide meaningfulinformation (Ainley & Patrick, 2006). Example constructs are moodand pain (e.g., McCormack, Horne, & Sheather, 1988) in medicalresearch or global job satisfaction in the field of industrial andorganizational psychology (e.g., Wanous et al., 1997). When constructs are complex, single items may even be superior to longscales that comprised of different facets (Nagy, 2002; Scarpello &Campbell, 1983; Wanous et al., 1997). Specifically, long scalescan result in misleading assessments as some facets may be evaluated as not relevant by some respondents even though all facets
are equally weighted for all respondents on long scales. Thus, theadvantage of single items is that when individuals respond to ageneral single item, their response may reflect only those facetsthat are important to them individually.
Taken together, shortening the long form of a scale may resultin solving a number of the above mentioned problems that areassociated with the application of multiple items while simultaneously providing the specific advantages of short scales. However,the shorter the scale, the more difficult it becomes to guarantee itspsychometric qualities, with single items having the greatestpotential to be problematic.
1.4. Empirical evidence
Studies that have tested the psychometric qualities of shortforms or single item measures have shown mixed empiricalresults. Despite the shortcomings mentioned above, many studieshave documented that even single items can show sound psychometric properties comparable to those of longer scales and cantherefore provide an acceptable balance between practical needsand psychometric concerns in various areas. Examples are theshort form and single item assessments of job satisfaction (Nagy,2002; Wanous et al., 1997), personality traits (e.g., Gosling,Rentfrow, & Swann, 2003; Rammstedt & John, 2007), well beingand life satisfaction (Diener, 1984; Lucas & Donnellan, 2012),self esteem (Robins et al., 2001), and self efficacy (Hoeppneret al., 2011).
However, there exists relatively little research that has systematically evaluated the psychometric qualities of short forms (and ofsingle item measures in particular) that measure motivationalaffective constructs. Whereas short scales (with three items) andsingle item measures have sometimes been used to assess academic anxieties and academic self concepts (e.g., PISA study2000, German extension to the year 2003 cycle of PISA; Brunneret al., 2010; Goetz, Frenzel, Stoeger, & Hall, 2010; Goetz, Preckel,Pekrun, & Hall, 2007; Gottfried, 1982; Nett, Goetz, & Hall, 2011;Niepel, Brunner, & Preckel, 2014; Preckel and Brüll, 2008; Stipek& Mason, 1987; Trautwein, Lüdtke, Marsh et al., 2006), to the bestof our knowledge, almost no studies have systematically comparedthe reliabilities and different forms of validity estimations of suchshort scales (consisting of three items) and single item measuresto those of corresponding longer scales. An exception is the studyby Marsh, Barnes, and Hocevar (1985), which compared a multiple item measure (SDQ) of self concepts to single summary itemsfor each self concept domain and concluded that the multiple itemscales had better psychometric qualities than the single items.However, Marsh (1986) suggested that it is better to use the singleitems to measure the specific self concept dimensions than not toassess multiple dimensions of this construct at all. For anxiety (andother school related emotions), Goetz (2004) found that singleitem measures show acceptable reliability and validity (see alsoGoetz et al., 2007). Notably, none of these studies investigatedand compared the relations between the single item measuresand other important student characteristics to those same relations obtained with corresponding longer scales that is, no studyhas assessed the nomological network with single item measuresor short scales as compared to the corresponding long scales.
1.5. The present study
Although the conventional wisdom on measurement recommends using long scales, in various research areas in psychology,short scales or even single itemmeasures have been found to showacceptable psychometric properties that were comparable or equalto those of multiple item measures. However, little knowledge hasbeen obtained thus far with regard to the potential to assess moti
191
vational affective constructs by means of short scales and singleitem measures as alternatives to long questionnaires. Therefore,the present study investigated the feasibility of three item scalesand single items using two important constructs from the motivational affective domain as examples: academic anxiety and academic self concept. Specifically, we thoroughly evaluated thepsychometric properties of three item scales and single item measures of domain general and domain specific (i.e., mathematics,German, French) academic anxiety and academic self concept bysystematically comparing them with their corresponding longscales. The analyses were applied to a large and representative student sample. Specifically, the psychometric qualities were evaluated with respect to several vital measurement questions (seeTable 2): (a) How reliable are short scales and single item measures? (b) How well do short scales and single item measuresreproduce the information obtained by long scales? (c) How welldo short scales and single item measures reproduce the relationsin the nomological network obtained by long scales? The nomological network that we investigated in the present study includedstudent characteristics that were measured by methods other thanself reports and/or for which a rich body of knowledge has beenaccumulated on their relations to academic anxieties and academicself concepts, involving student achievement, school satisfaction,gender, socioeconomic status, and academic track.
2. Method
2.1. Sample
The analyses of the present study were based on representativedata from 3879 students (1901 females) who participated in the2011 cycle of the Luxembourg school monitoring program(Martin & Brunner, 2012) at the beginning of the ninth grade(about 59% of all ninth grade students in Luxembourg). The mainaim of this program was to evaluate key educational outcomes(e.g., domain specific achievement and students’ motivationalaffective characteristics). In the Luxembourg school system, afterthe sixth grade, students are assigned to different secondary tracksas a result of achievement based selection. These secondary tracksdiffer in mean achievement levels as well as in the subjects taught.On the administrative level, two main secondary strands can bedistinguished in Luxembourg. In the present study 2546 students(65.6%) attended the lower academic track, and 1333 students(34.4%) attended the upper academic track. Students could choosethe language (German vs. French) for items measuring academicanxieties and academic self concepts. In the present study, weanalyzed data from the students who responded to the academicanxiety and academic self concept scales in German.
2.2. Measures
In the 2011 cycle of the Luxembourg school monitoringprogram, all achievement tests and questionnaires were
computerized. The students’ questionnaires were administratedin a multi matrix design in which six booklets covering differentassessment domains were randomly assigned to the studentsbecause the application of all scales to all students was not possibledue to practical limitations. Table A1 in Appendix A shows how thescales were distributed across the booklets and the numbers of students who responded to each scale. Specifically, one sixth of thestudents responded to the following questionnaires, respectively:domain general academic anxiety, mathematics anxiety, Germananxiety, French anxiety, French self concept, as well as mathematics self concept, German self concept, and the domain general academic self concept. As a consequence of this research design, thepsychometric properties of the respective scales were evaluatedbased on the data from about one sixth of the sample size (seeTable 6).
2.2.1. Academic anxiety and academic self concept scalesThe academic anxiety as well as the academic self concept
instrument administered in the 2011 cycle of the Luxembourgschool monitoring program covered three core school subjects(i.e., mathematics, German, and French) as well as domain generalacademic anxiety and the domain general academic self concept.In line with other large scale assessments (Marsh et al., 2006), students responded to each item on a rating scale with four categories: disagree, disagree somewhat, agree somewhat, and agree. Eachconstruct was assessed with a full scale from which scores of threeitems constituting a three item measure and single items wereextracted. In the following, the three item measures will bereferred to as the short form.
2.2.1.1. Academic anxiety. Full scale (FS). A new 17 item scale wasdeveloped by the authors of the present study. The new scale wasbased on the item contents of the well established 12 item versionof the Hebrew adaptation (Zeidner, Nevo, & Lipschitz, 1988) ofSpielberger’s (1980) Test Anxiety Inventory, as well as the Academic Emotions Questionnaire (AEQ; Pekrun et al., 2011). Thenew scale assessed worry (the cognitive component, 8 items) andemotionality (the affective physiological component, 8 items) fordomain general academic anxiety and for each domain specificanxiety domain (i.e., academic anxiety in mathematics, German,and French). Additionally, the scale focused on two situations inschool in which anxiety may be critical: anxiety during exams (fourworry and four emotionality items per domain general or domainspecific academic anxiety) and anxiety during classes (four worryand four emotionality items per domain general or domain specific or academic anxiety). Parallel item wording for worry andemotionality items was used across the two situations to controlfor item specific variance. In sum, the scale consisted of four itemsfor worry and emotionality in each situation (i.e., exams and theclassroom context) for each domain specific and domain generalacademic anxiety.
Additionally, one general item for each domain (e.g., ‘‘I amafraid of mathematics’’) and domain general academic anxiety (‘‘I
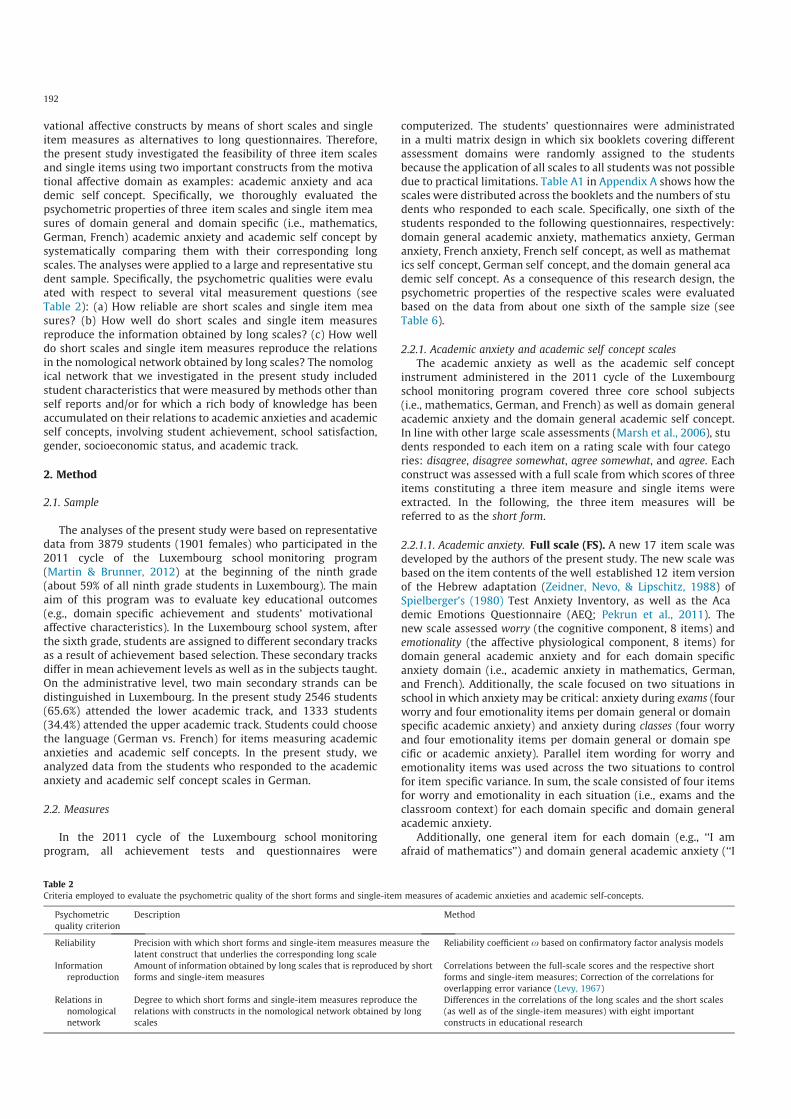
Table 2Criteria employed to evaluate the psychometric quality of the short forms and single-item measures of academic anxieties and academic self-concepts.
Psychometricquality criterion
Description Method
Reliability Precision with which short forms and single-item measures measure thelatent construct that underlies the corresponding long scale
Reliability coefficient x based on confirmatory factor analysis models
Informationreproduction
Amount of information obtained by long scales that is reproduced by shortforms and single-item measures
Correlations between the full-scale scores and the respective shortforms and single-item measures; Correction of the correlations foroverlapping error variance (Levy, 1967)
Relations innomologicalnetwork
Degree to which short forms and single-item measures reproduce therelations with constructs in the nomological network obtained by longscales
Differences in the correlations of the long scales and the short scales(as well as of the single-item measures) with eight importantconstructs in educational research
192

am afraid of most school subjects’’) was constructed, which servedas the single itemmeasure. Please note that the phrase ‘‘I am afraidof’’ refers to the German word ‘‘angst,’’ which is a very commoneveryday language term that reflects a general level of anxietyrather than directly reflecting the worry or emotionality components of the construct. The resulting full 17 item scales are presented in Table A2 of Appendix A.
Short-form measure (SF). The short forms consisted of threeitems from the long scale: (a) one item that represented the underlying construct best in terms of content validity, and (b) two additional items chosen from the full scale (see Table 3 for the wordingof the chosen items; for a discussion of the development of theshort scales, see Section 4.2. of the present paper). The selectionof these two items was based on factor loadings as an item levelindex of internal item quality (Stanton et al., 2002). Specifically,we selected the two additional items for the short form measuresin the following way: First, for each full scale, we ranked the itemsaccording to their standardized factor loadings. Then we averagedthe ranks of each item across the four scales (i.e., one domain general scale and three domain specific scales). Finally, to build theshort scales for each construct, we chose the two items that hadthe highest averaged ranks. In this way, the resulting domain general and domain specific scales resulted in parallel wording (seepage 33 for a discussion of the advantages of this strategy). Thenumber of items was chosen to be three for two reasons: It isthe standard number of items used in large scale assessments suchas PISA, and three indicators is the recommended (minimum)number of items needed to represent a latent factor in structuralequation modeling (Kline, 2010).
Single-item measure (SI). Each item that was used as a singleitem measure (also included in the full scale and short form) wasconstructed with the aim of directly and maximally representingthe essence of the academic anxiety definition (i.e., feelings ofworry, nervousness, and uneasiness) using words that all respondents could understand (Schaeffer & Presser, 2003). Thus, thewording of the items was determined from a content perspectiveby choosing an expression most directly related to the concept ofanxiety (i.e., ‘‘I am afraid of’’) and by integrating it into a sentencein which it was possible to add the different school domains as theobjects of the sentences (e.g., ‘‘I am afraid of German class’’; seeTable 3 for the wording of all single item measures).
2.2.1.2. Academic self concept. Full scale (FS). To assess students’mathematics, German, French, and domain general academicself concepts, six items were employed from the Academic SelfDescription Questionnaire (ASDQ; Marsh, 1990a) or developedaccording to instructions given by Marsh (1990a). The basic structure of ASDQ is patterned after the SDQ, and Byrne (1996a) notedthat it can be assumed that the ASDQ yields the same high qualitydata as the Self Description Questionnaire (SDQ; Marsh, 1988,1990b; Marsh & O’Neill, 1984), which is considered to be one ofthe best self concept instruments available (e.g., Byrne, 1996b).For each domain, one additional item from the SDQ was added tothe scale (e.g., for mathematics: ‘‘I am good at mathematics’’; seeTable 3), which also served as the single item measure in the present study. Thus, the full scale for each domain specific academicself concept or the domain general academic self concept consisted of seven items (full scales of domain general and domainspecific academic self concepts are presented in Table A2 ofAppendix A).
Short-form measure (SF). The short forms were chosen fromthe full scales based on the same rationale as the one describedabove for academic anxiety (see Table 3 for the wording of the chosen items).
Single-item measure (SI). The items that were used as the single item measures (also included in the full scale and short form)
were constructed with the aim of directly and maximally communicating the essence of the academic self concept definition (seeSection 1.1.2.) using words that all respondents could understand(Schaeffer & Presser, 2003). Thus, the wording of the items wasdetermined from a content perspective by choosing an expressionmost directly related to the self concept (i.e., ‘‘I am good at’’) andadding the different school domains as the objects of the sentences(e.g., ‘‘I am good at German’’; see Table 3 for the wording of all single item measures).
2.2.2. Student characteristicsTo investigate the scales’ relations to other important con
structs in education, the following student characteristics wereassessed (apart from available information regarding academictrack and gender):
2.2.2.1. Student achievement. Domain specific achievement scoreswere assessed by comprehensive competency tests in mathematics, German reading comprehension, and French reading comprehension. Competency tests were developed by experts on thebasis of extensive pilot studies. The difficulty of the competencytests was tied to the achievement levels of each academic track.Item scores were scaled by means of a unidimensional Raschmodel with the ConQuest software (Wu, Adams, Wilson, &Haldane, 2007), which allowed us to compare student performanceacross different tracks. The scales showed the following reliabilityestimates: .82, .80, and .80 for mathematics, German, and Frenchachievement, respectively. In addition to domain specific achievements, general academic achievement was calculated as the meansof the scores for mathematics, German, and French achievement inorder to examine domain general and domain specific relations.
2.2.2.2. School satisfaction. School satisfaction was measured withthree items (‘‘I like going to my school,’’ ‘‘If it were possible, Iwould prefer to go to another school’’ [reverse scored in all analyses], ‘‘I feel comfortable at our school’’) with a scale reliability ofCronbach’s a = .67. Students responded to the items on a 4 pointrating scale (1 = disagree, 2 = disagree somewhat, 3 = agree somewhat, and 4 = agree) so that higher values indicated higher schoolsatisfaction.
2.2.2.3. Students’ socioeconomic status (SES). Students’ socioeconomic status (SES) was indicated by the highest InternationalSocio Economic Index of Occupational Status (ISEI; Ganzeboom,de Graaf, Treiman, & de Leeuw, 1992) of the student’s father ormother as derived from student responses regarding parentaloccupation. Higher ISEI values indicated higher SES.
2.3. Statistical analyses
Missing data are unavoidable in any large scale assessment.Valid data for the measures of mathematics, German, and Frenchachievement were available for 3873 students (99.99%). The highest percentage of missing data was obtained for the socioeconomicstatus measure (2778 with valid data; 71.61%). The reason for thismissing data apart from missing responses was that we could notuse all responses from the students because some of the descriptions of parental occupations were too vague or obviously madeup by the students. Complete data for the school satisfaction scalewere available for 3806 students (98.11%). To account for the pattern of missing data as observed in the present study, the full information maximum likelihood procedure (FIML) implemented inMplus was used. Moreover, the ‘‘complex’’ option in Mplus (withclasses as a cluster variable) was used to obtain standard errorsand fit statistics corrected for the nonindependence of observations because the students were not independently sampled but
193

rather nested within classes. Therefore, for the estimation of modelparameters and confidence intervals, the MLR estimator was used.It offers an appropriate and robust to non normality of the datavariant of the maximum likelihood estimator (ML) to be used withthe complex option for data with nonindependence of observations(see Muthén & Muthén, 1998 2010).
The psychometric qualities of the long scale, the short form, andthe single item measure were rigorously examined with respect tothe following criteria (see Table 2).
2.3.1. ReliabilityTo answer the question ‘‘How reliable are short forms and sin
gle item measures?’’, confirmatory factor analysis (CFA) modelswere used to estimate the model based reliability in terms of coefficient x (cf. Brunner, Nagy, & Wilhelm, 2012; McDonald, 1999;Zinbarg, Revelle, Yovel, & Li, 2005; Zinbarg, Yovel, Revelle, &McDonald, 2006) for full scales, short forms, and single item measures of domain general and domain specific academic anxietiesand academic self concepts. Values of x can range from 0 (no reliability) to 1 (perfect reliability). In contrast to the more widelyused Cronbach’s alpha coefficient, x takes the congeneric natureof the respective measurement models into account (Brunneret al., 2012). The model based reliability x of an item (or scale)may be defined as the proportion of variance accounted for by alatent construct (e.g., mathematics self concept) relative toobserved score variance (Brunner et al., 2012). In the case of a single item, the coefficient x can be interpreted as the precision withwhich this item measures the latent construct as obtained from allitems that constitute the long scale. Similarly, the estimated coefficient x of the short forms indicates the precision with which thethree items from each short form measure the correspondinglatent construct that underlies all items from a corresponding fullscale.
To estimatex, a model with a single factor influencing all itemsof a certain total scale was estimated in a first step; thus, we testeda total of eight models. In a second step, we used only those model
parameters obtained in the first step that were relevant for computing x for (a) the full scale, (b) the short form, or (c) the single item measure. In each model (as analyzed in the first step),factor loadings and variances could vary across manifest measures(reflecting the assumption of congeneric measures). Additionally,in the models for the anxiety measures, the residuals were allowedto correlate to account for items with parallel wording (Little,Preacher, Selig, & Card, 2007). Model fit was examined by meansof global fit indices as recommended by Hu and Bentler (1998)and commonly used in studies applying structural equation models: the chi square test of overall model fit, and descriptive fit statistics such as the Standardized Root Mean Square Residual(SRMR), the Comparative Fit Index (CFI), and the Root Mean SquareError of Approximation (RMSEA). SRMR values below .08, RMSEAvalues below .05, and CFI values greater than .95 are consideredto indicate good model fit (Hu & Bentler, 1998). RMSEA valuesbetween .05 and .08 indicate moderate fit (Browne & Cudeck,1993).
2.3.2. Amount of reproduced informationThe second research question was ‘‘How well do short forms
and single item measures reproduce the information obtained bylong scales?’’ To answer this question, we computed Pearson correlations between the full scale scores and the scores on the respective short forms and single item measures. As the scores on theshort forms (SF) and single itemmeasures (SI) were extracted fromthe long scales (LS) in which the corresponding SF and SI wereembedded, the corresponding correlation between the short scalesand long scales were artificially inflated due to measurement errorshared by the part of the scale (SF or SI) and its whole (FS; cf. Girard& Christensen, 2008). Therefore, we applied a statistical correctionfor this overlapping error variance (Levy, 1967). Levy’s correctionprovides a correlation between the short scales and the long scale‘‘as if’’ obtained from separate SF/SI and FS administrations byremoving the covariance due to correlated measurement errorbetween the SF/SI and the FS (Girard & Christensen, 2008).
Table 3Items assessing academic anxiety and academic self-concept as included in the short form and single-item measures.
Construct Item wording
General academic anxiety I am afraid of most school subjects. (�)In classes in most school subjects, I am afraid that everything is much too difficult for meDuring tests in most school subjects, I am afraid that everything is much too difficult for me
Mathematics anxiety I am afraid of mathematics class. (�)In mathematics class, I am afraid that everything is much too difficult for meDuring tests in mathematics, I am afraid that everything is much too difficult for me
German anxiety I am afraid of German class (�)In German class, I am afraid that everything is much too difficult for meDuring tests in German, I am afraid that everything is much too difficult for me
French anxiety I am afraid of French class. (�)In French class, I am afraid that everything is much too difficult for meDuring tests in French, I am afraid that everything is much too difficult for me
General academic self-concept I am good at most school subjects. (�)I get good marks in most school subjectsWork in most school subjects is easy for me
Mathematics self-concept I am good at mathematics. (�)I get good marks in mathematics classWork in mathematic class is easy for me
German self-concept I am good at German. (�)I get good marks in German classWork in German class is easy for me
French self-concept I am good at French. (�)I get good marks in French classWork in French class is easy for me
Note. Items marked with an asterisk represent items used as single-item measures.
194

2.3.3. Nomological networkTo answer the question ‘‘How well do short forms and single
item measures reproduce the relations in the nomological networkobtained by long scales?’’ we examined the relations between thedifferent scale forms and other important constructs in educationalresearch (i.e., student achievement, school satisfaction, gender,academic track, and socioeconomic status). To this end, for eachstudent characteristic, the difference between the Pearson correlation with the full scale and the Pearson correlation with the shortform (as well as the single item Pearson correlation) and the 95%confidence intervals for each difference between the two correlations were calculated according to the formula provided byCheung (2009). In addition, we calculated the averaged differencebetween the correlations across the eight criteria.
2.3.4. Polyserial correlationsWe also compared the Pearson correlations between the single
item measures and the full scales (as described in Section 2.3.2.) aswell as between the single item measures and the external criteria(as described in Section 2.3.3.) with results obtained using polyserial correlations, which perhaps better account for the rating scalenature of single item measures. To this end, based on the underlying normally distributed continuous variable behind the ordinalsingle item measures, polyserial correlations were estimated withMplus. We decided to focus our results on the Pearson correlationsas they enable the results of our study to be compared with themajority of other studies on single item measures that appliedPearson correlations. Therefore, if not otherwise indicated, thereported correlations represent Pearson correlations.
3. Results
3.1. Academic anxiety
3.1.1. ReliabilityConfirmatory factor analyses indicated that the 17 item one
factor model with correlated errors had adequate fit according tothe descriptive fit statistics for the domain general academic anxiety scale and the domain specific anxiety scales: mathematics,German, and French anxiety. The p values for the v2 statistics forall the models were below p < .01 indicating statistically significantdiscrepancies between the hypothesized model and the observeddata. However, it is well known that the v2 statistic is sensitiveto sample size, whereby trivial model misfit may result in significant values with modest sample sizes (Iacobucci, 2010). Giventhe large sample size in the present study, we therefore focusedour evaluation of model fit on the descriptive fit indices. The modelfit results and information on the factor loadings we obtained arepresented in Table A3 of Appendix A. Moreover, Table B1 of Appendix B contains the values of the highest modification indices andtheir locations within each model. Notably, we found no empiricalevidence to justify model modifications on substantive grounds.
The model based reliability in terms of coefficient omega (seeTable 4) was relatively high for all anxiety full scales ranging fromx = .85 for domain general academic anxiety to x = .89 for theFrench anxiety scale. The reliabilities of the short forms wereslightly lower than for the full scale; however, they were still satisfactory, ranging from x = .75 for domain general academic anxiety and French anxiety to x = .78 for mathematics anxiety. Thereliabilities of the items representing the single item measures,however, were relatively low, ranging from x = .22 for Germananxiety to x = .29 for domain general and mathematics anxiety.
3.1.2. Information reproductionAs shown in Table 4, the correlations between the full scales
and the short forms were relatively high, ranging from r = .88 for
domain general academic anxiety to r = .92 for mathematics anxiety. The single item measures showed substantial correlationswith the respective full scales with rs ranging from .50 for Germananxiety to .56 for mathematics anxiety. The correlations that werecorrected for shared error variance (Levy, 1967) were lower, ranging from .83 to .88 for the short forms that assessed domain general and mathematics anxiety, respectively. The correctedcorrelations between the full scales and the single item measuresranged from .46 to .51 for German anxiety and mathematics anxiety, respectively.
The polyserial correlations of the single itemmeasures with therespective full scales are depicted in Table B2 in Appendix B. Notably, the use of polyserial correlations did not change the conclusionof our study: The polyserial correlations even showed somewhatstronger similarities between the single item measure and therespective longer scale with a maximal difference betweenthe Pearson and polyserial correlations of .07 (see Table B2 forthe comparison).
3.1.3. Nomological networkThe correlations of the academic anxiety full scales, short forms,
and single item measures with student characteristics are presented in Table 4 and Fig. 1. In all domains, the short forms showedpatterns that were very similar to the full scales in their correlations with the external criteria. This is reflected by the small meanabsolute differences between correlations obtained for the fullscales and the short forms (.02 for all academic anxiety domains).The respective differences in correlations between long scales andshort forms and their 95% confidence intervals are shown in thebottom panel of Table 4. None of the correlations between theshort forms and the student characteristics differed significantlyfrom the correlations between the respective full scales and theseexternal variables (�.04 <Dr < .03).
The patterns of correlations between the single item measuresand student characteristics diverged slightly more from the patterns for the full scales than the patterns for the short forms did;the mean absolute differences for single items ranged from .04for domain general academic anxiety to .07 for mathematics andGerman academic anxiety. The respective differences in correlations ranged from �.14 to .05 (see Table 4). The patterns of correlations between the three versions of the scales and other studentcharacteristics are displayed in Fig. 1.
The polyserial correlations of the single itemmeasures with thestudent characteristics (see Table B2 in Appendix B) showed resultpatterns that were comparable to those computed with the Pearson correlations (with a maximal absolute difference betweenthe Pearson and polyserial correlations of .04).
3.2. Academic self concept
3.2.1. ReliabilityConfirmatory factor analyses indicated that the seven item one
factor model had a good fit to the data for the German academicself concept scale and French academic self concept scale according to the descriptive fit statistics (see Table A3 in Appendix A).The fits for the domain general and mathematics self conceptswere somewhat worse (see Table A3): SRMR values were in theacceptable range, but the CFI and RMSEA values were on the borderline of the recommended cut off criteria for the domain generalself concept scale, and these values fell outside of the recommended cut off criteria for the mathematics self concept scale.The v2 statistics for all the models were significant (all ps < .01).
When the model fit did not match the required benchmark values (as for domain general academic self concept and mathematics self concept), we placed more emphasis on the SRMR indexbecause this index is based on the average residual correlations
195

Table4
Psyc
hometricch
aracteristicsof
thefullscales
(FS=17
item
s),s
hort
form
s(SF=3item
s),a
ndsing
leitem
s(SI)
tomea
sure
stud
entacad
emic
anxiety.
Gen
eral
acad
emic
anxiety
Mathem
aticsan
xiety
German
anxiety
Fren
chan
xiety
FSSF
SIFS
SFSI
FSSF
SIFS
SFSI
Reliability
xa
.85
.75
.29
.88
.78
.29
.88
.77
.22
.89
.75
.23
Correlationwithfullscale
r�
.88
.55
�.92
.56
�.90
.50
�.90
.51
Corrected
rwithFS
b�
.83
.50
�.88
.51
�.86
.45
�.85
.46
Correlationwithstud
ents’c
haracteristics
Gen
eral
stude
ntachieve
men
t�.
25�.
23�.
26�.
20�.
17�.
08�.
26�.
25�.
15�.
14�.
13�.
10Fren
chachieve
men
t�.
18�.
16�.
17�.
09�.
05.00
�.18
�.16
�.08
�.22
�.20
�.13
German
achieve
men
t�.
19�.
20�.
25�.
14�.
12�.
06�.
29�.
28�.
17�.
09�.
08�.
10Mathem
aticsachieve
men
t�.
26�.
22�.
22�.
26�.
25�.
15�.
18�.
18�.
13�.
05�.
04�.
02Schoo
lsatisfaction
�.18
�.18
�.11
�.08
�.09
�.04
�.15
�.18
�.14
�.14
�.15
�.09
Gen
der(0
=girls;
1=bo
ys)
�.17
�.15
�.04
�.18
�.17
�.06
.00
.03
.05
�.06
�.09
�.05
Socioe
conom
icstatus
�.06
�.06
�.06
�.11
�.12
�.10
�.18
�.16
�.13
�.14
�.15
�.11
Acade
mic
trackc
�.16
�.13
�.16
�.11
�.08
�.01
�.19
�.16
�.11
�.18
�.15
�.07
Differenc
ebe
tweencorrelations
asob
tained
forthefullscalean
dshortform
orsing
leitem
Dr[95%
CI]
Gen
eral
stude
ntachieve
men
t�
�.02
.01
��.
03�.
11�
�.01
�.11
��.
01�.
04[�
.06,.02]
[�.06,.07]
[�.06,.00]
[�.19,�.
04]
[�.04,.02]
[�.18,�.
04]
[�.06,.03]
[�.14,.06]
Fren
chachieve
men
t�
�.02
.00
��.
04�.
09�
�.01
�.09
��.
02�.
08[�
.05,.02]
[�.06,.06]
[�.06,.01]
[�.15,�.
02]
[�.04,.02]
[�.17,�.
02]
[�.06,.02]
[�.17,.01]
German
achieve
men
t�
.00
.05
��.
03�.
08�
�.01
�.12
�.00
.02
[�.04,.04]
[�.02,.13]
[�.06,.00]
[�.16,�.
01]
[�.04,.02]
[�.20,�.
04]
[�.05,.04]
[�.09,.13]
Mathem
aticsachieve
men
t�
�.03
�.04
��.
02�.
12�
.00
�.06
��.
01�.
03[�
.07,.00]
[�.11,.03]
[�.04,.01]
[�.19,�.
05]
[�.03,.03]
[�.13,.01]
[�.05,.03]
[�.12,.06]
Schoo
lsatisfaction
�.00
�.07
�.01
�.03
�.03
�.01
�.00
�.05
[�.04,.04]
[�.14,.00]
[�.02,.05]
[�.11,.04]
[�.01,.07]
[�.10,.08]
[�.04,.04]
[�.14,.04]
Gen
der(0
=girls;
1=bo
ys)
��.
02�.
14�
�.01
�.12
��.
02�.
05�
.03
�.01
[�.06,.02]
[�.21,�.
06]
[ �.04,.02]
[�.19,�.
05]
[�.06,.01]
[�.12,.03]
[�.01,.07]
[�.09,.08]
Socioe
conom
icstatus
�.00
.01
�.00
�.02
��.
02�.
05�
.01
�.04
[�.04,.05]
[�.07,.08]
[�.03,.04]
[�.10,.07]
[�.06,.02]
[�.15,.04]
[�.03,.05]
[�.13,.06]
Acade
mic
trackc
��.
03.00
��.
03�.
10�
�.03
�.08
��.
04�.
12[�
.07,.01]
[�.07,.07]
[�.06,.00]
[�.17,�.
03]
[�.06,.00]
[�.14,�.
01]
[�.07,.01]
[�.21,�.
03]
Ave
rage
correlationdifferen
ce�
.02
.04
�.02
.07
�.02
.07
�.02
.05
aMod
el-based
reliab
ilityco
efficien
tx
(cf.Bru
nner,N
agy,
&W
ilhelm;McD
onald,
1999
).x
canbe
interpretedin
thesameway
asan
yother
reliab
ilityco
efficien
t,withpo
ssible
values
rangingbe
twee
n0(noreliab
ility)
and1
(perfect
reliab
ility).
bCalcu
latedacco
rdingto
Levy
’s(196
7)form
ula,w
hichco
rrects
forov
erlapp
ingerrorva
rian
ce.
cW
ithupp
eracad
emic
trackco
dedas1an
d0indicatinginterm
ediate
andlower
acad
emic
tracks;FS
=fullscale(17item
s);SF
=sh
ortform
(3item
s);SI
=singleitem
;Dr=differen
cebe
twee
naco
rrelationob
tained
forthefull
scalean
dthesh
ortform
/singleitem
;Ave
rage
correlationdifferen
cerepresen
tsthemea
nab
solute
mag
nitude
ofdifferen
cesbe
twee
nco
rrelationsob
tained
forthefullscalean
dthesh
ortform
/singleitem
.
196

and thus provides information about the overall quality of theapproximation (irrespective of the parsimony of the model). Insuch cases, we also carefully examined the modification indices.The largest modification indices and their locations within eachmodel are given in Table B1 in Appendix B. Although the modification indices suggested incorporating the correlations between theresiduals of ‘‘I learn things quickly in mathematics’’/‘‘I learn thingsquickly in most school subjects’’ with ‘‘I am good at mathematics’’/‘‘I am good at most school subjects’’, we found no empirical evidence to justify model modifications on substantive grounds. Ourgoal was to select a model that had substantive meaning andwas more parsimonious than the alternative models.
The model based reliability in terms of coefficient omega (seeTable 5) was high for all self concept full scales with the mathematics and French self concept scales showing the highest reliability (x = .92). The reliabilities of the domain general and theGerman self concept scales were x = .82 and .88, respectively.The reliabilities of the short forms of the French and mathematicsself concept scales were also relatively high (x = .89). The shortforms of the domain general and German self concepts showedsatisfactory reliabilities (x = .75 and .83, respectively). The reliabilities of the single item measures for the mathematics and Frenchself concepts were also satisfactory (x = .72 and .71, respectively).The domain general and German self concept reliabilities of single item measures were lower (x = .44 and .54, respectively).Please note that as omega is based on parameter estimates (i.e.,estimates of factor loadings and factor variances) that are derivedfor a certain CFA model, the proper interpretation of omegarequires that the target model provides a good fit to the empiricaldata (Bentler, 2009; McDonald, 1999; Yang & Green, 2010).Therefore, the omega values obtained for the domain general and
mathematics self concept models should be interpreted with caution because the fits of these models to the data were modest.
3.2.2. Information reproductionAs shown in Table 5, the correlations between the full scales
and the short forms were relatively high, ranging from r = .92 forthe domain general academic self concept to r = .97 for the mathematics self concept. The single item measures showed slightlylower correlations with the respective full scales with the highestcorrelations for the mathematics and French academic self concepts (r = .88 and r = .87, respectively). For the domain generaland German academic self concepts, the correlations were r = .74and .79, respectively. The corrected (Levy, 1967) correlation coefficients between the full scales and the short forms ranged from .80for the domain general self concept to .91 for the mathematics andFrench self concepts. For single items, they were between r = .63and .83 for the domain general academic self concept and mathematics self concept, respectively.
The polyserial correlations between the single item measuresand the respective full scales (see Table B2 in Appendix B) showedeven slightly stronger overlaps in variance between the single itemmeasures and the respective long scales (maximal differencebetween the Pearson and polyserial correlations = .05).
3.2.3. Nomological networkThe correlations of the self concept full scales, short forms, and
single items with student characteristics are presented in Table 5and Fig. 2. The short forms showed patterns of correlations to theexternal criteria that were very similar to the patterns shown bythe full scales in all domains. This is reflected by small mean absolute differences between correlations obtained for the full scales
Fig. 1. Similarities in the correlational patterns of the full scale (17 items), short form (3 items), and single itemwith student achievement, satisfaction with school, and socio-demographic characteristics (gender, socioeconomic status, and academic track) for (a) general academic anxiety, (b) mathematics anxiety, (c) German anxiety, and (d)French anxiety; + indicates significant difference between the single item and the full scale (p < .05; two-sided); � indicates significant difference between the short form andthe full scale (p < .05; two-sided).
197

Table5
Psyc
hometricCh
aracteristicsof
theFu
llScales
(FS=7item
s),S
hort
Form
s(SF=3item
s),a
ndSing
leItem
s(SI)
toMea
sure
Stud
entAcade
mic
Self-C
oncept.
Gen
eral
acad
emic
self-con
cept
Mathem
aticsself-con
cept
German
self-con
cept
Fren
chself-con
cept
FSSF
SIFS
SFSI
FSSF
SIFS
SFSI
Reliability
xa
.82
.75
.44
.92
.89
.72
.88
.83
.54
.92
.89
.71
Correlationwithfullscale
r�
.92
.74
�.97
.88
�.95
.79
�.96
.87
Corrected
rwithFS
b�
.80
.63
�.91
.83
�.87
.70
�.91
.82
Correlationwithstud
ents’c
haracteristics
Gen
eral
stude
ntachieve
men
t.29
.21
.20
.16
.13
.13
.24
.20
.16
.14
.09
.05
Fren
chachieve
men
t.19
.12
.13
.04
.01
.03
.13
.09
.04
.27
.24
.21
German
achieve
men
t.28
.21
.20
.10
.07
.07
.32
.28
.24
.09
.05
.01
Mathem
aticsachieve
men
t.28
.20
.19
.27
.24
.22
.19
.15
.13
�.04
�.07
�.11
Schoo
lsatisfaction
.30
.25
.17
.12
.11
.11
.18
.17
.13
.25
.23
.17
Gen
der(0
=girls;
1=bo
ys)
.06
.05
.05
.24
.22
.20
�.06
�.07
�.03
.00
�.03
�.04
Socioe
conom
icstatus
.09
.06
.08
�.01
.00
.02
.11
.10
.05
.02
.01
�.06
Acade
mic
trackc
.18
.11
.08
.10
.07
.06
.11
.08
.04
.13
.08
.06
Differenc
ebe
tweencorrelations
asob
tained
forthefullscalean
dshortform
orsing
leitem
Dr[95%
CI]
Gen
eral
stude
ntachieve
men
t�
.09
.09
�.03
.03
�.05
.09
�.04
.09
[.06
,.11]
[.04
,.14]
[.01
,.05]
[�.01,.08]
[.02
,.07]
[.04
,.13]
[.02
,.06]
[.04
,.13]
Fren
chachieve
men
t�
.07
.06
�.02
.00
�.04
.09
�.03
.06
[.04
,.10]
[.01
,.11]
[.00
,.04]
[�.04,.04]
[.01
,.06]
[.04
,.13]
[.01
,.05]
[.02
,.10]
German
achieve
men
t�
.07
.08
�.03
.03
�.03
.07
�.04
.08
[.04
,.11]
[.04
,.13]
[.01
,.05]
[�.01,.07]
[.01
,.05]
[.03
,.12]
[.02
,.06]
[.03
,.12]
Mathem
aticsachieve
men
t�
.08
.08
�.03
.05
�.04
.06
�.03
.08
[.05
,.10]
[.04
,.13]
[.01
,.05]
[.02
,.09]
[.02
,.07]
[.02
,.11]
[.01
,.06]
[.03
,.12]
Schoo
lsatisfaction
�.05
.13
�.01
.02
�.01
.05
�.02
.08
[.01
,.08]
[.07
,.19]
[�.01,.03]
[�.03,.06]
[�.01,.04]
[�.01,.10]
[�.01,.04]
[.03
,.13]
Gen
der(0
=girls;
1=bo
ys)
�.01
.01
�.02
.05
�.01
�.03
�.03
.04
[�.02,.04]
[�.05,.06]
[.00
,.04]
[.01
,.08]
[�.02,.03]
[�.08,.02]
[.01
,.05]
[�.01,.08]
Socioe
conom
icstatus
�.03
.02
��.
01�.
03�
.02
.06
�.01
.08
[.00
,.07]
[ �.05,.08]
[�.03,.01]
[�.07,.02]
[�.01,.04]
[.00
,.11]
[�.02,.04]
[.03
,.13]
Acade
mic
trackc
�.07
.10
�.03
.04
�.02
.06
�.05
.07
[.05
,.10]
[.05
,.15]
[.01
,.04]
[.00
,.07]
[.00
,.05]
[.02
,.11]
[.03
,.07]
[.03
,.12]
Ave
rage
correlationdifferen
ce�
.06
.07
�.02
.03
�.03
.06
�.03
.07
aMod
el-based
reliab
ilityco
efficien
tx
(cf.Bru
nner,N
agy,
&W
ilhelm;McD
onald,
1999
).x
canbe
interpretedin
thesameway
asan
yother
reliab
ilityco
efficien
t,withpo
ssible
values
rangingbe
twee
n0(noreliab
ility)
and1
(perfect
reliab
ility).
bCalcu
latedacco
rdingto
Levy
’s(196
7)form
ula,w
hichco
rrects
forov
erlapp
ingerrorva
rian
ce.
cW
ithupp
eracad
emic
trackco
dedas1an
d0indicatinginterm
ediate
andlower
acad
emic
tracks;FS
=fullscale(7
item
s);SF
=sh
ortform
(3item
s);SI
=singleitem
;Dr=differen
cebe
twee
naco
rrelationob
tained
forthefull
scalean
dthesh
ortform
/singleitem
;Ave
rage
correlationdifferen
cerepresen
tsthemea
nab
solute
mag
nitude
ofdifferen
cesbe
twee
nco
rrelationsob
tained
forthefullscalean
dthesh
ortform
/singleitem
.
198

and the short forms (.02 to .03 for all domain specific self concepts; the mean absolute difference was higher for domain generalacademic self concept: .06). The respective differences in correlations and their 95% confidence intervals are shown in Table 5; theyranged between �.01 and .09. The mean absolute differences forsingle items were slightly higher than for short forms, ranging from.03 for mathematics self concept to .07 for domain general andFrench self concepts. The respective differences in correlationsranged between�.03 and .13. The patterns of correlations betweenthe three versions of the scales and other student characteristicsare displayed in Fig. 2.
The polyserial correlations between the single item measuresand the student characteristics (see Table B2 in Appendix B)showed patterns of results that were similar to those obtained withthe Pearson correlations (with a maximal absolute differencebetween the Pearson and polyserial correlations of .03).
4. Discussion
4.1. Short form and single item measures versus full scales
We analyzed three vital questions in measurement to examinethe psychometric characteristics of short forms (three items) andsingle item measures of domain general and domain specific(i.e., mathematics, German, and French) academic anxieties andacademic self concepts (see Table 2):
(1) How reliable are short forms and single item measures? Theshort forms for all constructs showed high reliabilities, butthey were still lower than those of the full scales. Not surprisingly, the reliabilities of all single item measures were
lower than the corresponding short form and full scalereliabilities.
(2) How well do short forms and single item measures reproduce the information obtained by long scales? All short formsshowed substantial correlations with the long scales, evenafter removing the common error variance (Levy, 1967).Whereas single itemmeasures of academic self concept alsoshowed substantial correlations with the full scales, the correlations between single item measures of academic anxieties and the full scales were low or modest at best.
(3) How well do short forms and single item measures reproduce the relations in the nomological network obtained bylong scales? The short forms for measuring academic anxietyand academic self concept demonstrated correlational patterns with important educational student characteristics(i.e., achievement, school satisfaction, gender, SES, and academic track) that were similar to those obtained with thefull scales. Notably, these results were also well aligned withthe results typically found in previous studies (see Table 1).Also, correlations between single item measures and student characteristics were consistent in direction and significance with the corresponding correlations of long scales andresults from previous empirical studies, resulting in essentially the same pattern of correlations as the full scales.However, the correlational patterns between the single itemmeasures and external criteria were slightly more divergentfrom those obtained with the full scales than the corresponding correlations obtained with the short forms.
It has to be noted that the choice of the robust continuous MLmay have introduced negative bias into the estimates of the factor
Fig. 2. Similarities in the correlational patterns of the full scale (7 items), short form (3 items), and single item with student achievement, satisfaction with school, and socio-demographic characteristics (gender, socioeconomic status, and academic track) for (a) general academic anxiety, (b) mathematics anxiety, (c) German anxiety, and (d)French anxiety; + indicates significant difference between the single item and the full scale (p < .05; two-sided); � indicates significant difference between the short form andthe full scale (p < .05; two-sided).
199

loadings and consequently produced lower bound estimates ofreliability (x). Specifically, the study by Rhemtulla et al. (2012)indicates that when variables have fewer than five categories,MLR can lead to underestimations of factor loadings (with strongerbiases for asymmetrical response distributions than for symmetrical distributions). Therefore, given that our measures had four categories and the responses to academic anxiety items are usuallynot symmetrical (see Table B3 in Appendix B for supplementarymaterial showing item category frequency distributions for theacademic anxiety items), we assume that there was a greaterunderestimation of factor loadings and consequently a greaterunderestimation of the reliability estimates for the academic anxiety scales than for the academic self concept scales because theitem responses for the self concept items showed higher degreesof symmetry than the academic anxiety items did (see Table B4in Appendix B for the item category frequency distributions ofthe academic self concept items).
In the following, we discuss these results with regard to thepurposes for which short form and single item measures of academic anxieties and academic self concepts might be particularlyuseful or not.
First, as our results show, despite lower reliabilities, the relations of the short forms and single item measures to other important student characteristics remained similar to those obtainedwith the full scales. These results justify the employment of shortforms and single item measures in research contexts in which themain interest of a study is to gain a general understanding of therelations between multiple constructs, especially in studies inwhich multiple constructs or constructs in multiple domains needto be assessed in a limited amount of time (e.g., longitudinal studies with measurement burst designs or large scale assessmentstudies). Moreover, single itemmeasures can be particularly usefulin studies that use experience sampling for ambulatory assessments or other technologies that focus on state emotions. Here,(a) responding to multiple items may influence the state emotionitself and (b) during the time needed to respond, the state emotionmay change (see Goetz et al., 2007). These problems can be circumvented by the use of single item measures. Of note, the presentpaper addresses the measurement of constructs on the trait level,and although our results are encouraging for using single itemself reports of academic anxiety and self concept, the psychometric properties of these items for assessing constructs at the statelevel should be addressed in further research (cf. Goetz et al.,2013).
Second, with regard to the latent nature of academic anxietiesand academic self concepts, in structural equation modeling, a statistical technique with quickly increasing popularity, valid and reliable single item measures may be particularly useful as referenceindicators to set the metric of latent constructs (see also Eid,Lischetzke, Nussbeck, & Trierweiler, 2003, for a more in depth discussion of the importance of ‘‘gold standard’’ measures).
Third, obviously, given the relatively low reliabilities of singleitem measures and short forms, they cannot be routinely used toreplace establishedmulti item instruments, especially in situationsin which the high reliability of measurement plays an essentialrole. For example, short versions of long scales are not appropriatefor individual diagnostic purposes when high stake decisionsdepend on the assessment outcome. Nevertheless, short formsand perhaps also single item scales can be suitable for screeningpurposes to identify individuals who score above or below certainthresholds. In a second step, more detailed and focused diagnosesusing longer measurement inventories can be applied.
Taken together, our results are in line with the conclusions ofother studies that a short version (Marsh, Ellis, Parada, Richards,& Heubeck, 2005) or even a single itemmeasure of an original longscale may provide suitable alternatives (e.g., Robins et al., 2001). In
particular, single item self reports may be adequate when a construct is concrete, highly schematized for most individuals, unidimensional in content, and when it primarily reflects subjectiveexperience (Robins et al., 2001). The academic self concept fulfillsall of these criteria, and the results from our study support thisconclusion. Interestingly, as our analysis of single item measuresof academic anxieties shows, even when a construct is more complex and consists of multiple components (e.g., worry and emotionality for academic anxiety), a single item may still provide anappropriate measure when there is a strong single common factorunderlying the construct indicators (i.e., when a construct showsessential unidimensionality; Reise, Moore, & Haviland, 2010;Reise, Morizot, & Hays, 2007) and when the researcher is interestedin the global level of the construct. However, if a detailed investigation of the nature or structure of a construct is the focus of astudy, multiple item scales should be used.
4.2. How to develop a short form measure
An important issue that also needs to be discussed is how shortscales can and should be developed. Our results do not imply thatjust any short forms and single item measures can be used toassess academic anxieties and self concepts. A thorough processof scale construction is a necessary prerequisite for creating asound measurement instrument. A common practice is to shortenan existing long scale. However, in some cases, constructing a newshort scale by developing new items may be a better option (e.g.,when the existing items are of poor quality). Moreover, when theoriginal scale items from the existing scales are very specific andeach item assesses a detailed facet of a construct, but the shortscale items should assess the general level of a construct, it maybe recommendable to develop new, more general items (seeFig. 3 for the major steps of both strategies and a comparisonbetween them).
In the present study, we connected the two strategies by enriching existing well validated instruments with items designed toassess the general level of each construct. This strategy has theadvantage that by establishing the measurement model of theextended scale, the model based reliability of the single item measures can be estimated.
Moreover, in our study and in line with Fig. 3, we began ourconstruction of the short scales by adding general items thatdirectly and maximally capture the essence of the academic selfconcept definition to items from well validated long scales. Tochoose the ‘‘best’’ items from this item pool to be used in the shortform, we adhered to the following rationale (for further criteria onitem choice, see Hinkin, 1998; Marsh et al., 2005; Smith et al.,2000, or Stanton et al., 2002): (a) content considerations resultedin choosing the general items as items that prototypically reflectedthe contents of the constructs, and (b) after analyzing the psychometric properties of the items, we chose the two items that had thehighest average factor loadings across different domains. Theresulting short forms measured the constructs in all domains withparallel wording, which allows for comparability and tests ofinvariance across domains (see Marsh et al., 2013). However, whendeveloping scales, if the goal is not to create scales that measuredifferent domains with parallel wording, another possibility wouldbe to choose the items showing the highest factor loadings for eachscale. Such an approach leads to slight increases in the reliabilitiesof the specific scales. Moreover, it may be not advisable or it mayeven be impossible to develop scales with parallel wording acrossdomains if the wording of an item is specific to one domain so thatthe application of the wording of this item to another domainwould result in a strange sounding item or the resulting itemwould not make sense.
200

4.3. Limitations of the present study
First, the generalizability of the results from this study may belimited due to the fact that the data were obtained only from a representative sample of adolescents in Luxembourg. Although theshort forms and single item measures reproduced the nomologicalnetwork of academic anxiety and the academic self concept as wastypically found in previous research, whether the findings are generalizable to students in other countries and to students of other
ages remains an open question. Second, the short forms and thesingle item measures were administrated as part of the corresponding full scales. This procedure may be problematic as therelations between the brief measures and the full scale can beoverestimated because of the correlated measurement error thatis shared by short forms and full scales when the short form isadministrated as part of the parent measure. Although we statistically controlled for shared error with Levy’s correction (1967), further research needs to more accurately assess agreement between
Fig. 3. Major stages in the development of the short(ened) scales; based on Haynes, Richard, & Kubany, 1995; Hinkin, 1998; Marsh et al., 2005; Smith et al., 2000; Stantonet al., 2002.
Table A1Multi-matrix design of the present study: measures and number of students per booklet.
Student characteristic Booklet (number of students)
1 2 3 4 5 6(676) (676) (520) (685) (699)a (540)
Mathematics achievement X X X X X XGerman achievement X X X X X XFrench achievement X X X X X XSchool satisfaction X X X X X XParental occupation questions X X X X X XMathematics anxiety (FS) XGerman anxiety (FS) XFrench anxiety (FS) XGeneral academic anxiety (FS) XMathematics self-concept (FS) XGerman self-concept (FS) XGeneral academic self-concept (FS) XFrench self-concept (FS) X
Note. Numbers in brackets indicate the number of students who completed a certain booklet; X indicates that a measure of a certain student characteristic was included in acertain booklet.FS = Full scale.
a The number of students differed between the specific scales: n = 690 for mathematics self-concept, n = 699 for German self-concept, and n = 693 for domain-general self-concept.
201

long scales and short scales by independently administering allforms to the same sample. Pfeiffer, Hagemann, and Backenstrass(2011) introduced a procedure in which subjects are randomlyassigned to different groups that are administered different combinations of the full scales and the shortened versions. Third, we didnot investigate the factor structures of the short forms and did notrecheck the psychometric properties of the short forms and thesingle item measures using an independent sample as would bean appropriate scale development procedure (see Fig. 3). Fourth,further research is needed to confirm the psychometric propertiesof the one and three item measures when administered by themselves. It can be argued that by administering only short scales, thesubjects’ responses to these items might differ from their answerswhen short scales are administered together will long scales. Specifically, as short scales reduce item redundancy and the resulting
fatigue and irritation of the respondents, the respondents may thusanswer more conscientiously and carefully, thereby resulting inmore appropriate reliability and validity estimates. Fifth, we couldnot estimate the test retest stability of the short forms and singleitems as we did not have longitudinal data. Thus, further researchis needed to determine whether there would be any substantialloss in test stability when using the short scales instead of the fullscales. Sixth, it would also be important to develop and investigatethe psychometric properties of single items for different components of academic anxiety (e.g., worry or emotionality) to be usedfor economic assessment in studies that focus on specific facets ofacademic anxiety (e.g., to investigate the hypothesis that the worrycomponent of academic anxiety will have effects on academic outcomes that are distinct from those of the emotionality component).Finally, further research is needed to answer the question of
Table A2Items of full scales for domain-general and domain-specific academic anxieties and self-concepts.
Construct Item name Item wording
Domain-general academic anxiety AX_g1 I am afraid of most school subjects.In classes in most school subjects, . . .
AX_g2 . . .I feel uneasy.AX_g3 . . .I find myself thinking about performing poorly.AX_g4 . . .I get nervous.AX_g5 . . .it is difficult for me to concentrate.AX_g6 . . .my whole body feels tense.AX_g7 . . .I worry that I will not be able to understand something.AX_g8 . . .I feel sick to my stomach.AX_g9 . . .I am afraid that everything is much too difficult for me.
During tests in most school subjects,. . .AX_g10 . . .I feel uneasy.AX_g11 . . .I find myself thinking about performing poorly.AX_g12 . . .I get nervous.AX_g13 . . .it is difficult for me to concentrate.AX_g14 . . .my whole body feels tense.AX_g15 . . .I worry that I will not be able to understand something.AX_g16 . . .I feel sick to my stomach.AX_g17 . . .I am afraid that everything is much too difficult for me.
Domain-specific academic anxieties AX_[D]1 I am afraid of [DOMAIN] class.In [DOMAIN] class,. . .
AX_[D]2 . . .I feel uneasy.AX_[D]3 . . .I find myself thinking about performing poorly.AX_[D]4 . . .I get nervous.AX_[D]5 . . .it is difficult for me to concentrate.AX_[D]6 . . .my whole body feels tense.AX_[D]7 . . .I worry that I will not be able to understand something.AX_[D]8 . . .I feel sick to my stomach.AX_[D]9 . . .I am afraid that everything is much too difficult for me.
During tests in [DOMAIN],. . .AN_[D]10 . . .I feel uneasy.AX_[D]11 . . .I find myself thinking about performing poorly.AX_[D]12 . . .I get nervous.AX_[D]13 . . .it is difficult for me to concentrate.AX_[D]14 . . .my whole body feels tense.AX_[D]15 . . .I worry that I will not be able to understand something.AX_[D]16 . . .I feel sick to my stomach.AX_[D]17 . . .I am afraid that everything is much too difficult for me.
Domain-general academic self-concept SC_g1 I learn things quickly in most school subjects.SC_g2 I am good at most school subjects.SC_g3 I get good marks in most school subjects.SC_g4 I am hopeless when it comes to most school subjects.SC_g5 Work in most school subjects is easy for me.SC_g6 I have always done well in most school subjects.SC_g7 Compared to others my age I am good at most school subjects.
Domain-specific academic self-concepts SC_[D]1 I learn things quickly in [DOMAIN].SC_[D]2 I am good at [DOMAIN].SC_[D]3 I get good marks in [DOMAIN] class.SC_[D]4 I am hopeless when it comes to [DOMAIN].SC_[D]5 Work in [DOMAIN] class is easy for me.SC_[D]6 I have always done well in [DOMAIN].SC_[D]7 Compared to others my age I am good at [DOMAIN].
Note. To assess domain-specific constructs [DOMAIN] was replaced by mathematics, German, and French, respectively; [D] in item names was replaced by ‘‘M’’ formathematics, ‘‘G’’ for German, and ‘‘F’’ for French.
202

whether the single itemmeasures (and short forms) can be used tomeasure affective motivational constructs other than academicanxieties and academic self concepts.
4.4. Conclusion
Short forms of domain general and domain specific academicanxieties and academic self concepts can be recommended as reasonable alternatives to their corresponding long scales when studydesigns require brief measures. The results of the present studywere also encouraging with regard to the use of single item measures. Thus, when a questionnaire becomes too long or when longscales or short forms are not applicable for substantive reasons,single item measures may be considered as the only or in somecases even the best way to obtain valid empirical data on thetwo core motivational affective student characteristics of academic anxiety and academic self concept.
Appendix A
See Tables A1 A3.
Appendix B. Supplementary material
Supplementary data associated with this article can be found,in the online version, at http://dx.doi.org/10.1016/j.cedpsych.2014.04.002.
References
Ainley, M., & Patrick, L. (2006). Measuring self-regulated learning processes throughtracking patterns of student interaction with achievement activities.Educational Psychology Review, 18(3), 267–286.
Baumeister, R. F., Vohs, K. D., & Funder, D. C. (2007). Psychology as the science ofself-reports and finger movements: Whatever happened to actual behavior?Perspectives in Psychological Science, 2, 396–408.
Bean, A. G., & Roszkowski, M. J. (1995). The long and short of it. Marketing Research,7(1), 20–26.
Bentler, P. M. (2009). Alpha, dimension-free, and model-based internal consistencyreliability. Psychometrika, 74, 137–143.
Browne, M. W., & Cudeck, R. (1993). Alternative ways of assessing model fit. In K.Bollen & J. Long (Eds.), Testing structural equation models (pp. 136–162).Newbury Park, CA: Sage.
Brunner, M., Keller, U., Dierendonck, C., Reichert, M., Ugen, S., Fischbach, A., et al.(2010). The structure of academic self-concepts revisited: The nested Marsh/Shavelson model. Journal of Educational Psychology, 102(4), 964–981. http://dx.doi.org/10.1037/a0019644.
Brunner, M., Keller, U., Hornung, C., Reichert, M., & Martin, R. (2009). The cross-cultural generalizability of a new structural model of academic self-concepts.Learning and Individual Differences, 19, 387–403.
Brunner, M., Nagy, G., & Wilhelm, O. (2012). A tutorial on hierarchically structuredconstructs. Journal of Personality, 80, 796–846. http://dx.doi.org/10.1111/j.1467-6494.2011.00749.x.
Byrne, B. M. (1996b). Measuring self-concept across the life span: Issues andinstrumentation. Washington, DC: American Psychological Association.
Byrne, B. M. (1996a). Academic self-concept: Its structure, measurement, andrelation to academic achievement. In B. A. Bracken (Ed.), Handbook of self-concept (pp. 287–316). New York, NY: Wiley.
Cheung, M. W.-L. (2009). Constructing approximate confidence intervals forparameters with structural equation models. Structural Equation Modeling, 16,267–294.
Chiam, H. (1987). Change in self-concept during adolescence. Adolescence, 22,69–76.
Christophersen, T., & Konradt, U. (2011). Reliability, validity, and sensitivity of asingle-item measure of online store usability. International Journal of Human–Computer Studies, 69(4), 269–280.
Credé, M., Harms, P., Niehorster, S., & Gaye-Valentine, A. (2012). An evaluation ofthe consequences of using short measures of the Big Five personality traits.Journal of Personality and Social Psychology, 102(4), 874–888. http://dx.doi.org/10.1037/a0027403.
Diener, E. (1984). Subjective well-being. Psychological Bulletin, 95(3), 542–575.Diener, E. (2000). Subjective well-being: The science of happiness, and a proposal
for national index. American Psychologist, 55, 34–43.Donnellan, M. B., Oswald, F. L., Baird, B. M., & Lucas, R. E. (2006). The mini-IPIP
scales: Tiny-yet-effective measures of the Big Five factors of personality.Psychological Assessment, 18(2), 192.
Eid, M., Lischetzke, T., Nussbeck, F. W., & Trierweiler, L. I. (2003). Separating traiteffects from trait-specific method effects in multitrait–multimethod models: Amultiple-indicator CT-C(M-1) model. Psychological Methods, 8, 38–60.
Ganzeboom, H. B. G., de Graaf, P. M., Treiman, D. J., & de Leeuw, J. (1992). A standardinternational socio-economic index of occupational status. Social ScienceResearch, 21, 1–56.
Gardner, D. G., Cummings, L. L., Dunham, R. B., & Pierce, J. L. (1998). Single-itemversus multiple-item measurement scales: An empirical comparison.Educational and Psychological Measurement, 58(6), 898–915. http://dx.doi.org/10.1177/0013164498058006003.
Girard, T. A., & Christensen, B. K. (2008). Clarifying problems and offering solutionsfor correlated error when assessing the validity of selected-subtest short forms.Psychological Assessment, 20(1), 76–80.
Goetz, T. (2004). Emotionales Erleben und selbstreguliertes Lernen bei Schulern im FachMathematik [Students’ emotions and selfregulated learning in mathematics].Munich: Utz.
Goetz, T., Bieg, M., Lüdtke, O., Pekrun, R., & Hall, N. C. (2013). Do girls reallyexperience more anxiety in mathematics? Psychological Science, 24(10),2079–2087. http://dx.doi.org/10.1177/0956797613486989.
Goetz, T., Cronjaeger, H., Frenzel, A. C., Lüdtke, O., & Hall, N. C. (2010). Academic self-concept and emotion relations: Domain specificity and age effects.Contemporary Educational Psychology, 35(1), 44–58.
Goetz, T., Frenzel, C. A., Hall, N. C., & Pekrun, R. (2008). Antecedents of academicemotions: Testing the internal/external frame of reference model for academicenjoyment. Contemporary Educational Psychology, 33, 9–33.
Goetz, T., Frenzel, A. C., Pekrun, R., Hall, N. C., & Lüdtke, O. (2007). Between-andwithin-domain relations of students’ academic emotions. Journal of EducationalPsychology, 99(4), 715.
Goetz, T., Frenzel, A. C., Stoeger, H., & Hall, N. C. (2010). Antecedents of everydaypositive emotions: An experience sampling analysis. Motivation and Emotion,34(1), 49–62. http://dx.doi.org/10.1007/s11031-009-9152-2.
Goetz, T., Preckel, F., Pekrun, R., & Hall, N. (2007). Emotional experiences during testtaking: Does cognitive ability make a difference? Learning and IndividualDifferences, 17, 3–16. http://dx.doi.org/10.1016/j.lindif.2006.12.002.
Goetz, T., Preckel, F., Zeidner, M., & Schleyer, E. J. (2008). Anxiety of big fishswimming in big ponds: A multilevel analysis of test anxiety and achievementin special gifted classes. Anxiety, Stress, and Coping, 21, 185–198.
Gosling, S. D., Rentfrow, P. J., & Swann, W. B. (2003). A very brief measure ofthe Big-Five personality domains. Journal of Research in Personality, 37(6),504–528.
Table A3Fit statistics and distributions of standardized factor loadings as obtained for measurement models of motivational-affective student characteristics.
Construct (number of items) v2 df CFI RMSEA SRMR Standardized factor loadings
Min Mdn Max
Academic anxietyGeneral academic anxiety (17) 102.1 55 .99 .04 .02 .46 .70 .84Mathematics anxiety (17) 132.4 55 .99 .05 .02 .54 .76 .87German anxiety (17) 113.5 55 .99 .04 .02 .47 .74 .85French anxiety (17) 140.7 55 .98 .05 .02 .48 .73 .83
Academic self-conceptGeneral academic self-concept (7) 77.7 14 .94 .08 .04 .24 .70 .77Mathematics self-concept (7) 148.3 14 .93 .12 .04 .50 .82 .88German self-concept (7) 41.6 14 .98 .05 .03 .34 .73 .83French self-concept (7) 64.8 14 .97 .08 .02 .63 .83 .86
Note. All v2 goodness-of-fit tests were statistically significant at p < .001; CFI = Comparative Fit Index; RMSEA = Root Mean Square Error of Approximation; SRMR = Stan-dardized Root Mean Square Residual; Min = minimum; Mdn = median; Max = maximum.
203
Gottfried, A. E. (1982). Relationships between academic intrinsic motivation andanxiety in children and young adolescents. Journal of School Psychology, 20,205–315.
Hansford, B. C., & Hattie, J. A. (1982). The relationship between self andachievement/performance measures. Review of Educational Research, 52,123–142.
Hattie, J. A. (1992). Self-concept. Hillsdale, NJ: Erlbaum.Haynes, S. N., Richard, D. C. S., & Kubany, E. S. (1995). Content validity in
psychological assessment: A functional approach to concepts and methods.Psychological Assessment, 7, 238–247.
Helmke, A., & van Aken, M. A. G. (1995). The causal ordering of academicachievement and self-concept of ability during elementary school: Alongitudinal study. Journal of Educational Psychology, 87, 624–637.
Hembree, R. (1988). Correlates, causes, effects, and treatment of test anxiety. Reviewof Educational Research, 58, 47–77.
Hembree, R. (1990). The nature, effects, and relief of mathematics anxiety. Journalfor Research in Mathematics Education, 21(1), 33–46. http://dx.doi.org/10.2307/749455.
Hergovich, A., Sirsch, U., & Felinger, M. (2004). Gender differences in the self-concept of preadolescent children. School Psychology International, 25, 207–222.
Hinkin, T. R. (1998). A brief tutorial on the development of measures for use insurvey questionnaires. Organizational Research Methods, 1(1), 104–121.
Hoeppner, B. B., Kelly, J. F., Urbanoski, K. A., & Slaymaker, V. (2011). Comparativeutility of a single-item versus multiple-item measure of self-efficacy inpredicting relapse among young adults. Journal of Substance Abuse Treatment,41(3), 305–312.
Hu, L.-T., & Bentler, P. M. (1998). Fit indices in covariance structure modeling:Sensitivity to underparameterized model misspecification. PsychologicalMethods, 3, 424–453.
Huebner, E. S. (1994). Conjoint analysis of the students’ life satisfaction scale andthe piers-harris self-concept scale. Psychology in the Schools, 31(4), 273–277.
Iacobucci, D. (2010). Structural equations modeling: Fit Indices, sample size, andadvanced topics. Journal of Consumer Psychology, 20, 90–98.
Jackson, L. A., Hodge, C. N., & Ingram, J. M. (1994). Gender and self-concept: Areexamination of stereotypic differences and the role of gender attitudes. SexRoles, 30, 615–630.
Jordan, J. S., & Turner, B. A. (2008). The feasibility of single-item measures fororganizational justice. Measurement in Physical Education and Exercise Science,12(4), 237–257. http://dx.doi.org/10.1080/10913670802349790.
Kline, R. B. (2010). Principles and practice of structural equation modeling (3rd ed.).New York: Guilford Press.
Konstabel, K., Lönnqvist, J.-E., Walkowitz, G., Konstabel, K., & Verkasalo, M. (2012).The ‘‘Short Five’’ (S5): Measuring personality traits using comprehensive singleitems. European Journal of Personality, 26(1), 13–29. http://dx.doi.org/10.1002/per.813.
Lau, S., Siu, C. K. K., & Chik, M. P. Y. (1998). The self-concept development of Chineseprimary schoolchildren: A longitudinal study. Childhood: A Global Journal ofChild Research, 5, 69–97.
Lee, J. (2009). Universals and specifics of math self-concept, math self-efficacy, andmath anxiety across 41 PISA 2003 participating countries. Learning andIndividual Differences, 19(3), 355–365.
Levy, P. (1967). The correction for spurious correlation in the evaluation of short-form tests. Journal of Clinical Psychology, 23(1), 84–86.
Levy, P. (1968). Short-form tests: A methodological review. Psychological Bulletin,69(6), 410.
Liebert, R. M., & Morris, L. W. (1967). Cognitive and emotional components oftest anxiety: A distinction and some initial data. Psychological Reports, 20,975–978.
Linnenbrink, E., & Pintrich, P. R. (2000). Multiple pathways to learning andachievement: The role of goal orientation in fostering adaptive motivation.Affect and cognition. In C. Sansone & J. Harackiewicz (Eds.), Intrinsic and extrinsicmotivation: The search for optimal motivation and performance (pp. 195–227).San Diego, CA: Academic Press.
Little, T. D., Preacher, K. J., Selig, J. P., & Card, N. A. (2007). New developments inlatent variable panel analyses of longitudinal data. International Journal ofBehavioral Development, 31(4), 357–365. http://dx.doi.org/10.1177/0165025407077757.
Loo, R. (2002). A caveat on using single-item versus multiple-item scales. Journalof Managerial Psychology, 17(1), 68–75. http://dx.doi.org/10.1108/02683940210415933.
Lord, F. I., & Novick, M. R. (1968). Statistical theories of mental test scores. MA:Addison-Wesley.
Lucas, R. E., & Donnellan, B. M. (2012). Estimating the reliability of single-item lifesatisfaction measures: Results from four national panel studies. Social IndicatorsResearch, 105(3), 323–331. http://dx.doi.org/10.1007/s11205-011-9783-z.
Ma, X. (1999). A meta-analysis of the relationship between anxiety towardmathematics and achievement in mathematics. Journal for Research inMathematics Education, 28(1), 26–47.
Ma, X., & Kishor, N. (1997). Assessing the relationship between attitude towardmathematics and achievement in mathematics: A meta-analysis. Journal forResearch in Mathematics Education, 28(1), 27–47.
Mandler, G., & Sarason, S. B. (1952). A study of anxiety and learning. Journal ofAbnormal and Social Psychology, 47, 166–173.
Marsh, H. W. (1986). Global self-esteem: Its relation to specific facets of self-concept and their importance. Journal of Personality and Social Psychology, 51,1224–1236.
Marsh, H. W. (1987). The big-fish-little-pond effect on academic self-concept.Journal of Educational Psychology, 79, 280–295.
Marsh, H. W. (1988). Self Description Questionnaire: A theoretical and empirical basisfor the measurement of multiple dimensions of preadolescent self-concept: A testmanual and a research monograph. San Amonio, TX: Psychological Corporation.
Marsh, H. W. (1989). Age and sex effects in multiple dimensions of self-concept:Preadolescence to early adulthood. Journal of Educational Psychology, 81,417–430.
Marsh, H. W. (1990a). The structure of academic self-concept: The Marsh/Shavelsonmodel. Journal of Educational Psychology, 82, 623–636.
Marsh, H. W. (1990b). Self-Description Questionnaire (SDQ) II: A theoretical andempirical basis for the measurement of multiple dimensions of adolescent self-concept: An interim test manual and a research monograph. Macarthur, NewSouth Wales, Australia: University of Western Sydney.
Marsh, H. W., Abduljabbar, A. S., Abu-Hilal, M. M., Morin, A. J. S., Abdelfattah, F.,Leung, K. C., et al. (2013). Factorial, convergent, and discriminant validity ofTimss math and science motivation measures: A comparison of Arab and Anglo-Saxon countries. Journal of Educational Psychology, 105(1), 108–128.
Marsh, H. W., Barnes, J., & Hocevar, D. (1985). Self–other agreement onmultidimensional self-concept ratings: Factor analysis and multitrait–multimethod analysis. Journal of Personality and Social Psychology, 49(5), 1360.
Marsh, H. W., & Craven, R. (1997). Academic self-concept: Beyond the dustbowl. InG. Phye (Ed.), Handbook of classroom assessment: Learning, achievement, andadjustment (pp. 131–198). Orlando, FL: Academic Press.
Marsh, H. W., Ellis, L. A., Parada, R. H., Richards, G., & Heubeck, B. G. (2005). A shortversion of the Self Description Questionnaire II: Operationalizing criteria forshort-form evaluation with new applications of confirmatory factor analyses.Psychological Assessment, 17(1), 81.
Marsh, H. W., Hau, K. T., Artelt, C., Baumert, J., & Peschar, J. L. (2006). OECD’s briefself-report measure of educational psychology’s most useful affectiveconstructs: Cross-cultural, psychometric comparisons across 25 countries.International Journal of Testing, 6(4), 311–360.
Marsh, H. W., Kong, C. K., & Hau, K. (2000). Longitudinal multilevel models of theBig-Fish-Little-Pond Effect on academic self-concept: Counterbalancingcontrast and reflected glory effects in Hong Kong schools. Journal ofPersonality and Social Psychology, 78, 337–349.
Marsh, H. W., & O‘Mara, A. J. (2008). Reciprocal effects between academic self-concept, self-esteem, achievement and attainment over seven adolescent-adultyears: Unidimensional and multidimensional perspectives of self-concept.Personality and Social Psychology Bulletin, 34, 542–552.
Marsh, H. W., & O’Neill, R. (1984). Self Description Questionnaire III (SDQ III): Theconstruct validity of multidimensional self-concept ratings by late adolescents.Journal of Educational Measurement, 21, 153–174.
Marsh, H. W., & Parker, J. W. (1984). Determinants of student self-concept: Is itbetter to be a relatively large fish in a small pond even if you don’t learn to swimas well? Journal of Personality and Social Psychology, 47, 213–231.
Marsh, H. W., Smith, I. D., & Barnes, J. (1985). Multidimensional self-concepts:Relations with sex and academic achievement. Journal of Educational Psychology,77, 581–596.
Marsh, H. W., Trautwein, U., Lüdtke, O., Koller, O., & Baumert, J. (2005). Academicselfconcept, interest, grades and standardized test scores: Reciprocal effectsmodels of causal ordering. Child Development, 76(2), 397–416.
Marsh, H. W., & Yeung, A. S. (1997). Coursework selection: Relations to academicself-concept and achievement. American Educational Research Journal, 34,691–720.
Marsh, H. W., & Yeung, A. S. (1998). Longitudinal structural equation models ofacademic self-concept and achievement: Gender differences in thedevelopment of math and English constructs. American Educational ResearchJournal, 35, 705–738.
Martin, R., & Brunner, M. (Eds.). (2012). Nationaler Bericht: Épreuves Standardisées(ÉpStan) – Schuljahr 2011/2012. Luxemburg: Universität Luxemburg,Forschungseinheit EMACS.
McCormack, H. M., Horne, D. d. L., & Sheather, S. (1988). Clinical applications ofvisual analogue scales: A critical review. Psychological Medicine, 18, 1007–1019.
McCrae, R. R., Kurtz, J. E., Yamagata, S., & Terracciano, A. (2011). Internalconsistency, retest reliability, and their implications for personality scalevalidity. Personality and Social Psychology Review, 15, 28–50.
McDonald, R. P. (1999). Test theory: A unified treatment. Mahwah, NJ: LawrenceErlbaum Associates.
McKnight, P. E., McKnight, K. M., Sidani, S., & Figueredo, A. J. (2007). Missing data: Agentle introduction. Guilford Press.
Möller, J., Pohlmann, B., Köller, O., & Marsh, H. W. (2009). A meta-analytic pathanalysis of the internal/external frame of reference model of academicachievement and academic self-concept. Review of Educational Research, 79,1129–1167.
Moore, K. A., Halle, T. G., Vandivere, S., & Mariner, C. L. (2002). Scaling backsurvey scales. How short is too short? Sociological Methods & Research, 30(4),530–567.
Muthén, L. K., & Muthén, B. O. (1998–2010).Mplus user’s guide (6th ed.). Los Angeles,CA: Muthén & Muthén.
Nagy, M. S. (2002). Using a single-item approach to measure facet job satisfaction.Journal of Occupational and Organizational Psychology, 75(1), 77–86. http://dx.doi.org/10.1348/096317902167658.
Nett, U. E., Goetz, T., & Hall, N. C. (2011). Coping with boredom in school: Anexperience sampling perspective. Contemporary Educational Psychology, 36(1),49–59.
204

Nevo, B. (1985). Face validity revisited. Journal of Educational Measurement, 22,287–293.
Niepel, C., Brunner, M., & Preckel, F. (2014). The longitudinal interplay of students’academic self-concepts and achievements within and across domains:Replicating and extending the reciprocal internal/external frame of referencemodel. Journal of Educational Psychology. http://dx.doi.org/10.1037/a0036307.
Nunally, J. C., Psychometric theory, 2nd ed., 1978, New York.Pekrun, R., Goetz, T., Frenzel, A. C., Barchfeld, P., & Perry, R. P. (2011). Measuring
emotions in students’ learning and performance: The achievement emotionsquestionnaire (AEQ). Contemporary Educational Psychology, 36(1), 36–48.
Pfeiffer, N., Hagemann, D., & Backenstrass, M. (2011). A new method for estimatingthe variance overlap between the short and the long form of a psychologicaltest. Educational and Psychological Measurement, 71(2), 380–388. http://dx.doi.org/10.1177/0013164410386782.
Preckel, F., & Brüll, M. (2008). Grouping the gifted and talented: Are gifted girls mostlikely to suffer the consequences? Journal for the Education of the Gifted, 32,54–85. http://dx.doi.org/10.4219/jeg-2008-822.
Preckel, F., Goetz, T., Pekrun, R., & Kleine, M. (2008). Gender differences in gifted andaverage-ability students: Comparing girls’ and boys’ achievement, self-concept,interest, and motivation in mathematics. Gifted Child Quarterly, 52, 146–159.http://dx.doi.org/10.1177/0016986208315834.
Rammstedt, B., & John, O. P. (2007). Measuring personality in one minute or less: A10-item short version of the Big Five Inventory in English and German. Journalof Research in Personality, 41(1), 203–212.
Reise, S. P., Moore, T. M., & Haviland, M. G. (2010). Bifactor models and rotations:Exploring the extent to which multidimensional data yield univocal scalescores. Journal of Personality Assessment, 92, 544–559.
Reise, S. P., Morizot, J., & Hays, R. D. (2007). The role of the bifactor model inresolving dimensionality issues in health outcomes measures. Quality of LifeResearch, 16, 19–31.
Rhemtulla, M., Brosseau-Liard, P., & Savalei, V. (2012). When can categoricalvariables be treated as continuous? A comparison of robust continuous andcategorical SEM estimation methods under sub-optimal conditions.Psychological Methods, 17, 354–373.
Robins, R. W., Hendin, H. M., & Trzesniewski, K. H. (2001). Measuring globalself-esteem: Construct validation of a single-item measure and theRosenberg Self-Esteem Scale. Personality and Social Psychology Bulletin,27(2), 151–161.
Scarpello, V., & Campbell, J. P. (1983). Job satisfaction: Are all the parts there?Personnel Psychology, 36, 577–600.
Schaeffer, N. C., & Presser, S. (2003). The science of asking questions. Annual Reviewof Sociology, 29, 65–88.
Scherer, K. R. (1984). On the nature and function of emotion: A component processapproach. In K. R. Scherer & P. Ekman (Eds.), Approaches to emotion(pp. 293–317). Hillsdale, NJ: Erlbaum.
Seipp, B. (1991). Anxiety and academic performance: A meta-analysis of findings.Anxiety Research. An International Journal, 4, 27–41.
Skaalvik, E. M., & Rankin, R. J. (1990). Math, verbal, and general academic self-concept: The internal/external frame of reference model and gender differencesin selfconcept structure. Journal of Educational Psychology, 82, 546–554.
Smith, G. T., McCarthy, D. M., & Anderson, K. G. (2000). On the sins of short-formdevelopment. Psychological Assessment, 12(1), 102.
Spielberger, C. D. (1980). Test anxiety inventory: Preliminary professional manual. PaloAlto, CA: Consulting Psychologists Press.
Stanton, J. M., Sinar, E. F., Balzer, W. K., & Smith, P. C. (2002). Issues and strategies forreducing the length of self-report scales. Personnel Psychology, 55(1), 167–194.
Stipek, D. J., & Mason, T. C. (1987). Attributions, emotions, and behavior in theelementary school classroom. Journal of Classroom Interaction, 22, 1–5.
Swann, W. B., Jr., Chang-Schneider, C., & McClarty, K. (2007). Do our self-viewsmatter? Self-concept and self-esteem in everyday life. American Psychologist, 62,84–94.
Trautwein, U., Lüdtke, O., Marsh, H. W., Köller, O., & Baumert, J. (2006). Tracking,grading, and student motivation: Using group composition and status to predictself-concept and interest in ninth-grade mathematics. Journal of EducationalPsychology, 98(4), 788.
Trautwein, U., Lüdtke, O., Schnyder, I., & Niggli, A. (2006). Predicting homeworkeffort: Support for a domain-specific, multilevel homework model. Journal ofEducational Psychology, 98, 438–456.
Valentine, J. C., DuBois, D. L., & Cooper, H. (2004). The relation between self-beliefsand academic achievement: A meta-analytic review. Educational Psychologist,39(2), 111–133. http://dx.doi.org/10.1207/s15326985ep3902_3.
Wanous, J. P., Reichers, A. E., & Hudy, M. J. (1997). Overall job satisfaction: How goodare single-item measures? Journal of Applied Psychology, 82(2), 247.
Wirth, R. J., & Edwards, M. C. (2007). Item factor analysis: Current approaches andfuture directions. Psychological Methods, 12, 58–79.
Wittmann, W. W. (1988). Multivariate reliability theory: Principles of symmetryand successful validation strategies. In J. R. Nesselroade & R. B. Cattell (Eds.),Handbook of multivariate experimental psychology (2nd ed., pp. 505–560). NewYork: Plenum.
Wu, M. L., Adams, R. J., Wilson, M. R., & Haldane, S. A. (2007). ACER ConQuest Version2: Generalised item response modelling software. Camberwell: Australian Councilfor Educational Research.
Yang, Y., & Green, S. B. (2010). A note on structural equation modeling estimates ofreliability. Structural Equation Modeling, 17, 66–81.
Yang, Y., & Green, S. B. (2011). Coefficient alpha: A reliability coefficient for the 21stCentury? Journal of Psychoeducational Assessment, 29(4), 377–392. http://dx.doi.org/10.1177/0734282911406668.
Zeidner, M. (1998). Test anxiety: The state of the art. New York: Plenum Press.Zeidner, M., Nevo, B., & Lipschitz, H. (1988). The Hebrew version of the test anxiety
inventory. Haifa, Israel: Univ. of Haifa.Zeidner, M. (2007). Test anxiety: Conceptions, findings, conclusions. In P. Schutz &
R. Pekrun (Eds.), Emotion in education (pp. 165–184). San Diego, CA: AcademicPress.
Zinbarg, R. E., Revelle, W., Yovel, I., & Li, W. (2005). Cronbach’s alpha, Revelle’s beta,and McDonald’s omega h: Their relations with each other and two alternativeconceptualizations of reliability. Psychometrika, 70, 123–133.
Zinbarg, R. E., Yovel, I., Revelle, W., & McDonald, R. P. (2006). Estimatinggeneralizability to a latent variable common to all of a scale’s indicators: Acomparison of estimators for xh. Applied Psychological Measurement, 30,121–144.
205