Mutations in the promoter of adenylyl cyclase (AC)-III gene, overexpression of AC-III mRNA, and...
7
498 DIABETES, VOL. 47, MARCH 1998 Rapid Publication Mutations in the Promoter of Adenylyl Cyclase (AC)-III Gene, Overexpression of AC-III mRNA, and Enhanced cAMP Generation in Islets From the Spontaneously Diabetic GK Rat Model of Type 2 Diabetes Samy M. Abdel-Halim, Amel Guenifi, Bing He, Bei Yang, Maha Mustafa, Bo Höjeberg, Jan Hillert, Moiz Bakhiet, and Suad Efendi´ c Glucose-induced insulin release is decreased in the spontaneously diabetic GK rat, a nonobese rodent model of type 2 diabetes. Forskolin restores the impaired insulin release in both the isolated perfused pancreas and isolated islets from these rats (Abdel- Halim et al., Diabetes 45:934–940, 1996). We demon- strate here that the insulinotropic effect of forskolin in the GK rat is due to increased generation of cAMP and that it is associated with overexpression of adeny- lyl cyclase (AC)-III mRNA and gene mutations. The AC-III mRNA overexpression was demonstrated by in situ hybridization using oligonucleotide probes binding to different regions of the rat AC-III mRNA. It was associated with the presence of two point mutations identified at positions –28 bp (A → G) and –358 bp (A → C) of the promoter region of the AC-III gene and was demonstrable in both GK rat islets and peripheral blood cells. Transfection of COS cells with a luciferase reporter gene system revealed up to 25-fold increased promoter activity of GK AC-III promoter when com- pared with normal rat promoter (P < 0.0001). In con- clusion, forskolin restores the impaired insulin release in islets of the GK rat through enhanced cAMP gener- ation. This is linked to overexpression of AC-III mRNA in GK islets due to two functional point mutations in the promoter region of the AC-III gene. Diabetes 47:498–504, 1998 A central defect in type 2 diabetes is an impaired insulin response to glucose stimulation. Such a defect is also found in the GK (Goto-Kakizaki) rat, a lean spontaneous animal model of type 2 diabetes (1,2). The defective insulin release by the islets of the GK rat is due to impaired stimulus-secretion coupling of the glucose signal rather than decreased insulin availability (3) or b-cell density (4). Glucose-induced insulin release is also impaired in these islets when the K ATP channels are inactivated by diazoxide and the membranes depolarized by high K + (5), suggesting that one or more signals directly coupling glucose metabolism to the exocytosis of insulin are impaired. Stimulation of insulin release by forskolin restores the impaired insulin response in isolated islets and perfused pan- creas of the GK rat (5). Additionally, it enhances to a larger extent insulin release at substimulatory concentration of glu- cose in GK rats compared with control rats. Such insulinotropic effects of forskolin in GK rats are elicited through a K ATP channel–independent pathway, suggesting a direct effect on exocytosis of insulin (5). Forskolin is known to induce its effects by strong stimulation of adenylyl cyclase (AC) and cAMP generation. To date, nine AC isoenzymes are classified, of which five are Ca 2+ -regulated (AC-I, AC-III, AC- V, AC-VI, and AC-VIII) (6,7). The AC isoforms expressed in the pancreatic islet are unknown. Of interest in this regard is that AC activity in pancreatic islets was shown to be Ca 2+ dependent (8). Based on this background, the current study was primarily designed to determine the molecular mecha- nisms mediating the enhanced insulinotropic response of forskolin in GK islets. RESEARCH DESIGN AND METHODS Animals. Male GK rats were from our colony at Karolinska Hospital, Stock- holm, Sweden, and control Wistar rats were from a local breeder (B&K Univer- sal, Sollentuna, Sweden). Both groups were ~3 months old and had similar body weights (316 ± 9 [n = 19] for GK rats vs. 309 ± 9 g [n = 19] for control rats). Blood glucose concentration just before pancreas isolation was significantly elevated in GK rats (11.3 ± 1.4 [n = 15] in GK rats vs. 4.4 ± 0.1 mmol/l [n = 15] in control rats, From the Endocrine and Diabetes Unit (S.M.A.-H., A.G., S.E.), Department of Molecular Medicine, Karolinska Hospital; and the Division of Neurology (B.He, B.Y., M.M., B.Hö., J.H., M.B.), Huddinge University Hospital, Karolin- ska Institute, Stockholm, Sweden. Address correspondence and reprint requests to Dr. Samy M. Abdel- Halim, Endocrine and Diabetes Unit, Department of Molecular Medicine, Karolinska Hospital, L1:02, S-171 76 Stockholm, Sweden. E-mail: [email protected]. Received for publication 6 August 1997 and accepted in revised form 17 December 1997. AC, adenylyl cyclase; [Ca 2 + ] i , intracellular calcium concentration; CRE, cAMP response element; PCR, polymerase chain reaction.
Transcript of Mutations in the promoter of adenylyl cyclase (AC)-III gene, overexpression of AC-III mRNA, and...
498 DIABETES, VOL. 47, MARCH 1998
Rapid Publication
Mutations in the Promoter of Adenylyl Cyclase(AC)-III Gene, Overexpression of AC-III mRNA,and Enhanced cAMP Generation in Islets From theSpontaneously Diabetic GK Rat Model of Type 2D i a b e t e sSamy M. Abdel-Halim, Amel Guenifi, Bing He, Bei Yang, Maha Mustafa, Bo Höjeberg, Jan Hillert,
Moiz Bakhiet, and Suad Efendic
Glucose-induced insulin release is decreased in thespontaneously diabetic GK rat, a nonobese rodentmodel of type 2 diabetes. Forskolin restores theimpaired insulin release in both the isolated perfusedpancreas and isolated islets from these rats (Abdel-Halim et al., D i a b e t e s 45:934–940, 1996). We demon-strate here that the insulinotropic effect of forskolinin the GK rat is due to increased generation of cAMPand that it is associated with overexpression of adeny-lyl cyclase (AC)-III mRNA and gene mutations. TheAC-III mRNA overexpression was demonstrated by insitu hybridization using oligonucleotide probes bindingto different regions of the rat AC-III mRNA. It wasassociated with the presence of two point mutationsidentified at positions –28 bp (A → G) and –358 bp (A→ C) of the promoter region of the AC-III gene and wasdemonstrable in both GK rat islets and peripheralblood cells. Transfection of COS cells with a luciferasereporter gene system revealed up to 25-fold increasedpromoter activity of GK AC-III promoter when com-pared with normal rat promoter (P < 0.0001). In con-clusion, forskolin restores the impaired insulin releasein islets of the GK rat through enhanced cAMP gener-ation. This is linked to overexpression of AC-III mRNAin GK islets due to two functional point mutations inthe promoter region of the AC-III gene. D i a b e t e s47:498–504, 1998
Acentral defect in type 2 diabetes is an impairedinsulin response to glucose stimulation. Such adefect is also found in the GK (Goto-Kakizaki)rat, a lean spontaneous animal model of type 2
diabetes (1,2). The defective insulin release by the islets ofthe GK rat is due to impaired stimulus-secretion coupling ofthe glucose signal rather than decreased insulin availability(3) or b-cell density (4). Glucose-induced insulin release isalso impaired in these islets when the KAT P channels areinactivated by diazoxide and the membranes depolarizedby high K+ (5), suggesting that one or more signals directlycoupling glucose metabolism to the exocytosis of insulinare impaired.
Stimulation of insulin release by forskolin restores theimpaired insulin response in isolated islets and perfused pan-creas of the GK rat (5). Additionally, it enhances to a largerextent insulin release at substimulatory concentration of glu-cose in GK rats compared with control rats. Suchinsulinotropic effects of forskolin in GK rats are elicitedthrough a KAT P channel–independent pathway, suggesting adirect effect on exocytosis of insulin (5). Forskolin is knownto induce its effects by strong stimulation of adenylyl cyclase(AC) and cAMP generation. To date, nine AC isoenzymes arec l a s s i fied, of which five are Ca2 +-regulated (AC-I, AC-III, AC-V, AC-VI, and AC-VIII) (6,7). The AC isoforms expressed in thepancreatic islet are unknown. Of interest in this regard isthat AC activity in pancreatic islets was shown to be Ca2 +
dependent (8). Based on this background, the current studywas primarily designed to determine the molecular mecha-nisms mediating the enhanced insulinotropic response offorskolin in GK islets.
RESEARCH DESIGN AND METHODS
Animals. Male GK rats were from our colony at Karolinska Hospital, Stock-holm, Sweden, and control Wistar rats were from a local breeder (B&K Univer-sal, Sollentuna, Sweden). Both groups were ~3 months old and had similar bodyweights (316 ± 9 [n = 19] for GK rats vs. 309 ± 9 g [n = 19] for control rats). Bloodglucose concentration just before pancreas isolation was significantly elevated inGK rats (11.3 ± 1.4 [n = 15] in GK rats vs. 4.4 ± 0.1 mmol/l [n = 15] in control rats,
From the Endocrine and Diabetes Unit (S.M.A.-H., A.G., S.E.), Departmentof Molecular Medicine, Karolinska Hospital; and the Division of Neurology(B.He, B.Y., M.M., B.Hö., J.H., M.B.), Huddinge University Hospital, Karolin-ska Institute, Stockholm, Sweden.
Address correspondence and reprint requests to Dr. Samy M. Abdel-Halim, Endocrine and Diabetes Unit, Department of Molecular Medicine,Karolinska Hospital, L1:02, S-171 76 Stockholm, Sweden. E-mail:s a m y. a b d e l - h a l i m @ m o l m e d . k i . s e .
Received for publication 6 August 1997 and accepted in revised form 17December 1997.
AC, adenylyl cyclase; [Ca2 +]i, intracellular calcium concentration; CRE,cAMP response element; PCR, polymerase chain reaction.
DIABETES, VOL. 47, MARCH 1998 499
S.M. ABDEL-HALIM AND ASSOCIATES
P < 0.0001). All rats were fed ad libitum with free access to water and were keptin rooms with alternating 12-h periods of light and darkness.Isolation of pancreatic islets and insulin release in batch incubation stud-
ies. Islets were isolated from the rats by digestion with collagenase (Boehringer-Mannheim, Mannheim, Germany). The islets were cultured for 48 h in RPMI-1640supplemented with 11 mmol/l glucose and 10% (vol/vol) fetal calf serum. Theislets were then maintained in Krebs-Ringer bicarbonate buffer supplementedwith 20 g/l bovine plasma albumin (Sigma, St. Louis, MO) with 3.3 mmol/l glucosefor 45 min. The batches of 20 islets were incubated with 3.3 or 16.7 mmol/l glucosealone and with 5 µmol/l forskolin (Sigma) at both glucose concentrations for 45min. After that period, 900 µl of the effluent was removed and frozen at –20°C tobe subsequently analyzed for insulin content by radioimmunoassay of insulin (9).cAMP measurements. cAMP was determined in the same batches of 20 islets inwhich insulin release was measured. After removal of 900 µl for determination ofinsulin, the medium was replaced with 300 µl ice-cold acetate buffer contain-ing 0.5 mmol/l isobutylmethylxanthine. The islets were then immersed in boil-ing water for 4 min and left to cool at 4°C. The islets were sedimented by briefcentrifugation, sonicated, and subsequently frozen at –20°C. cAMP contentwas measured using a commercial kit NEK-033 (Du Pont-NEN, Boston, MA).Detection of AC-III mRNA expression by in situ hybridization. After incu-bation of the islets for 45 min with the two concentrations of glucose with andwithout forskolin, the islets were transferred onto restricted areas of micro-scope slides (ProbeOn, Fisher Scientific, Pittsburgh, PA) and dried at 55°C for30 min. In situ hybridization was performed as described before (10). A mix-ture of four oligonucleotide probes, ~48 bases long, binding to differentregions of rat AC-III mRNA were used to increase the sensitivity of the method.In a second series of experiments, a mixture of two probes (probes 1 and 3,Table 1) were performed. The AC-III mRNA sequence (11) was obtained fromGenBank and the oligonucleotide probes were selected by the MacVector sys-tem (Table 1). A probe identical to the AC-III mRNA was used as a control probein parallel slides to assure the specificity of the hybridization signals. After emul-sion autoradiography, islet cells expressing mRNA for AC were examined indark-field microscopy and presented at 3200 magnification. Using senseoligonucleotide as a control probe produced a uniformly weak background sig-nal without revealing any positive cells.Direct polymerase chain reaction sequencing of promoter region of AC-
III gene in isolated islets and peripheral blood. Islets and blood were col-lected from six control and six GK rats. The islets and blood from two GK ratsor Wistar rats were pooled. Additionally, blood was also collected fromanother nondiabetic rat strain, the DA rat. DNA from islets and leukocytes inperipheral blood were extracted by standard methods (12). Polymerase chainreaction (PCR) primers were designed by Oligo 5.0 (NBI, Plymouth, MN)according to the database from GenBank (acc. no. S64908) (13). A forwardprimer corresponding to positions –568 to –549 bp relative to the transcriptionstart site was linked with a 18-bp –21M13 sequence (resulting in primersequence TGTAAAACGACGGCCAGTTC TTGAGCTGCCTCCCAAAG). Thereverse primer corresponded to positions +263 to +282 bp relative to the tran-scription start site (GTTCAGCATCCGTGGTCGCA). PCR was carried out in theGene-AMP 9600 cycler (Perkin-Elmer, Norwalk, CT) for 35 cycles of 96°C for10 s, 60°C for 1 min, and 72°C for 1 min. A dye primer cycle sequencing kit withAmpli Taq FS enzyme (Perkin-Elmer) was applied to sequencing of PCR frag-ments using the labeled standard –21M13 sequencing primer. Sequencing reac-tions were resolved on an ABI-377 DNA automated sequencer. All processesfollowed the manufacturer’s instructions.Transfection of reporter gene with the mutant AC-III promoter. Aluciferase reporter vector, pGL3-enhancer (Promega Biotec, Madison, WI),was used to compare the function of the GK and wild-type AC-III promotersafter transfection to COS cells. The 580-bp sequences of the AC-III promoterregions of GK and Wistar rats were amplified by PCR using primers contain-ing 59 S a c I and H i ndIII restriction sites (forward primer TTTTGAGCTCTCTTGAGCTGCCTCCCAAAG [as described above], reverse primer AAT-TA A G C T T T G G A A A C G C C G A G TAGGTGG [corresponding to positions +12 to–8 relative to the transcription start site]), allowing insertion into the pGL3-enhancer vector. After cloning into Escherichia coli, the cloned inserts werec o n firmed by sequencing. Recombinant vectors were transfected into 5 3 1 05
COS cells (cultured in Dulbecco’s medium containing 1 g/l glucose and 10% fetalbovine serum) using Transfectam Reagent (Promega) parallel with pGL3 con-trol vector and pGL3 enhancer vector without insertion as positive and nega-tive controls. Each transfection was performed in five parallel experiments.Luciferase activity in transfected COS cells was assessed after a 48-h culturein 20 µl COS cells extract mixed with 100 µl luciferase assay reagent using ascintillation counter. As expected, the positive control pGL3 vector used formonitoring transfection efficiency showed the highest promoter activity (2,257± 299 light intensity units), whereas the activity of the pGL3 vector withoutinsert did not differ from background (nontransfected COS cells) activity (6 ±1 and 5 ± 1 light intensity units, respectively).
In another set of experiments, luciferase vectors carrying the mutant or thenormal AC-III promoter fragments were cotransfected with pCAT3 controlvectors (Promega) as the internal control plasmid for normalization of trans-fection efficiency. In these experiments 2 µg luciferase vector and 2 µg pCAT 3control vector mixed with 8 µl Transfectam (Promega) were cotransfected ineach cell preparation (2.5 3 1 05 COS cells in six-well plates). Cotransfectionswere performed in at least three cell preparations. Groups of cotransfected cellswere incubated for 48 h with and without 5 µmol/l forskolin. After 48 h, the cellswere harvested using 200 µl reporter lysis buffer (Promega) and divided intotwo parts for estimation of luciferase and CAT activities. To determine CATa c t i v i t y, the cell extract was heated at 60°C for 10 min and frozen at –70°C untila s s a y. The activity of luciferase was determined as described above. CATassay was performed using 1 4C-labeled chloramphenicol (Du Pont-NE N) andn-butyryl coenzyme A, following the CAT assay kit description (Promega).The background CAT activity (nontransfected COS cells) was 7,407 ± 39 cpm(n = 2), while CAT activity was almost identically increased in all the cellgroups whether being cotransfected with vectors carrying the normal or GKmutant promoter fragment in the absence or the presence of 5 µmol/l forskolin(147,719 ± 1,957 cpm [control promoter, n = 3], 146,520 ± 1,381 cpm [controlpromoter plus forskolin, n = 3], 148,083 ± 1,934 cpm [GK promoter, n = 3], and149,801 ± 388 cpm [GK promoter plus forskolin, n = 3]).Data analysis. All data are expressed as means ± SE. Statistical tests were per-formed with SigmaStat for Windows Version 1.0 (Jandel Scientific Software,Erkrath, Germany). Tests of significance of difference were performed usingthe t test for unpaired data and the Mann-Whitney rank-sum test.
RESULTS
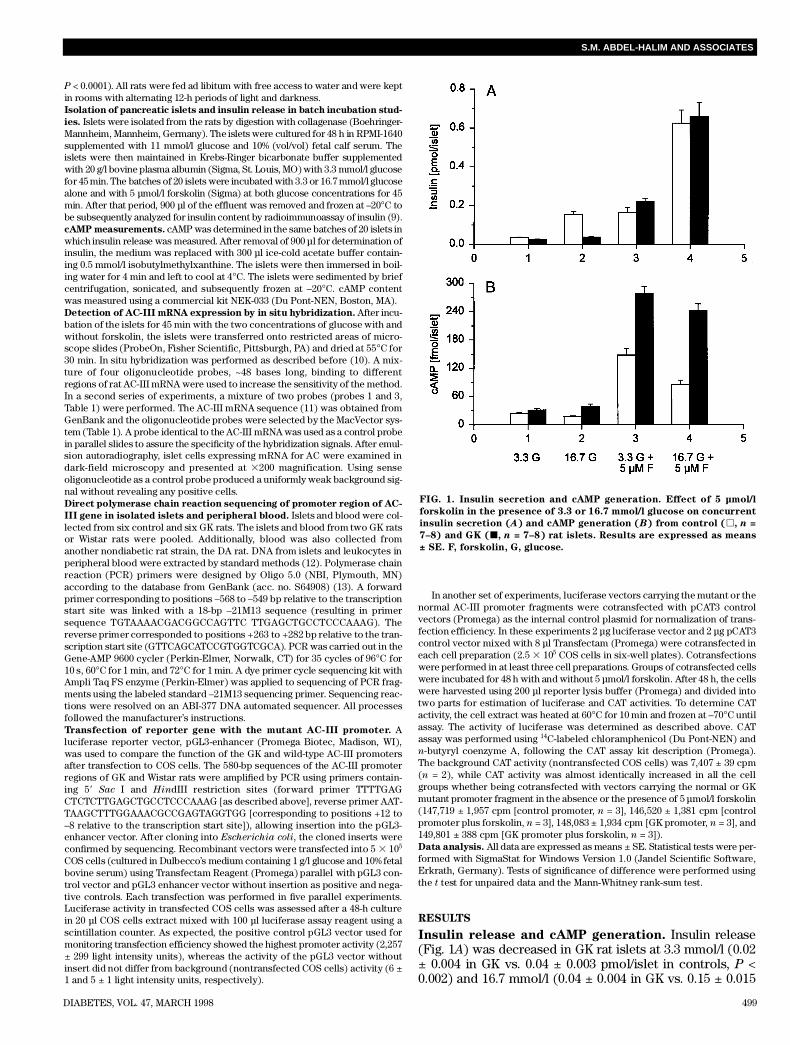
Insulin release and cAMP generation. Insulin release(Fig. 1A) was decreased in GK rat islets at 3.3 mmol/l (0.02± 0.004 in GK vs. 0.04 ± 0.003 pmol/islet in controls, P <0.002) and 16.7 mmol/l (0.04 ± 0.004 in GK vs. 0.15 ± 0.015
FIG. 1. Insulin secretion and cAMP generation. Effect of 5 µmol/l
forskolin in the presence of 3.3 or 16.7 mmol/l glucose on concurrent
insulin secretion (A) and cAMP generation (B) from control (h, n =
7–8) and GK (j, n = 7–8) rat islets. Results are expressed as means
± SE. F, forskolin, G, glucose.
500 DIABETES, VOL. 47, MARCH 1998
AC-III GENE PROMOTER, cAMPLEVELS, AND INSULIN RELEASE IN GK RAT ISLETS
pmol/islet in controls, P < 0.0001) glucose. Stimulation withforskolin increased insulin release by approximately fourfoldin control islets at 3.3 mmol/l (0.04 ± 0.003 without forskolinvs. 0.16 ± 0.026 pmol/islet with forskolin, P < 0.0001) and 16.7mmol/l glucose (0.15 ± 0.015 without forskolin vs. 0.63 ±0.068 pmol/islet with forskolin, P < 0.0001). In confir m a t i o nof our previous findings (5), forskolin induced a strong 9-foldincrease in insulin release in GK islets at 3.3 mmol/l (0.02 ±0.004 without forskolin vs. 0.22 ± 0.017 pmol/islet withforskolin, P < 0.0001) and an 18-fold increase at 16.7 mmol/lglucose (0.04 ± 0.004 without forskolin vs. 0.66 ± 0.073pmol/islet with forskolin, P < 0.0001). Hence, in the presenceof forskolin, insulin responses were similar in control and GKislets at 3.3 and 16.7 mmol/l glucose, but the relativeincrease in response to forskolin was much more pro-nounced in GK islets, similar to our findings with forskolinin the isolated perfused pancreas (5).
cAMP levels (Fig. 1B) in GK islets were similar to thoseof control islets at 3.3 mmol/l glucose (31.2 ± 3.7 in GK vs.24.0 ± 1.6 fmol/islet in controls, NS) and were significantlyhigher at 16.7 mmol/l glucose (38.9 ± 4.8 in GK vs. 18.1 ± 0.8fmol/islet in controls, P < 0.0001). In control islets, forskolininduced a sixfold increase in cAMP levels at 3.3 mmol/l glu-cose (24.0 ± 1.6 without forskolin vs. 147.9 ± 13.8 fmol/isletwith forskolin, P < 0.0001) and an approximately fivefoldincrease in nucleotide level at 16.7 mmol/l glucose (18.1 ±0.8 without forskolin vs. 84.9 ± 9.8 with forskolin, P <0.0001). In GK islets, forskolin induced even higher cAMPlevels at both 3.3 mmol/l glucose (31.2 ± 3.7 withoutforskolin vs. 279.0 ± 14.3 fmol/islet with forskolin, P <0.0001) and 16.7 mmol/l glucose (38.9 ± 4.8 withoutforskolin vs. 242.8 ± 13.9 fmol/islet with forskolin, P <0.0001). Thus, forskolin elicited an enhanced cAMPresponse in GK islets compared with control islets at both3.3 mmol/l (279 ± 14 in GK vs. 148 ± 14 fmol/islet in control,P < 0.0001) and 16.7 mmol/l glucose (243 ± 14 in GK vs. 85± 10 fmol/islet in controls, P < 0.0001).Islet AC-III mRNA expression by in situ hybridization.
mRNA expression of AC-III was determined in islets underthe above conditions in which insulin and cAMP generationwere studied. In a first series of experiments using a mixtureof four probes (Probes 1–4, Table 1) to increase the sensi-tivity, an intense expression of AC-III mRNA already at 3.3
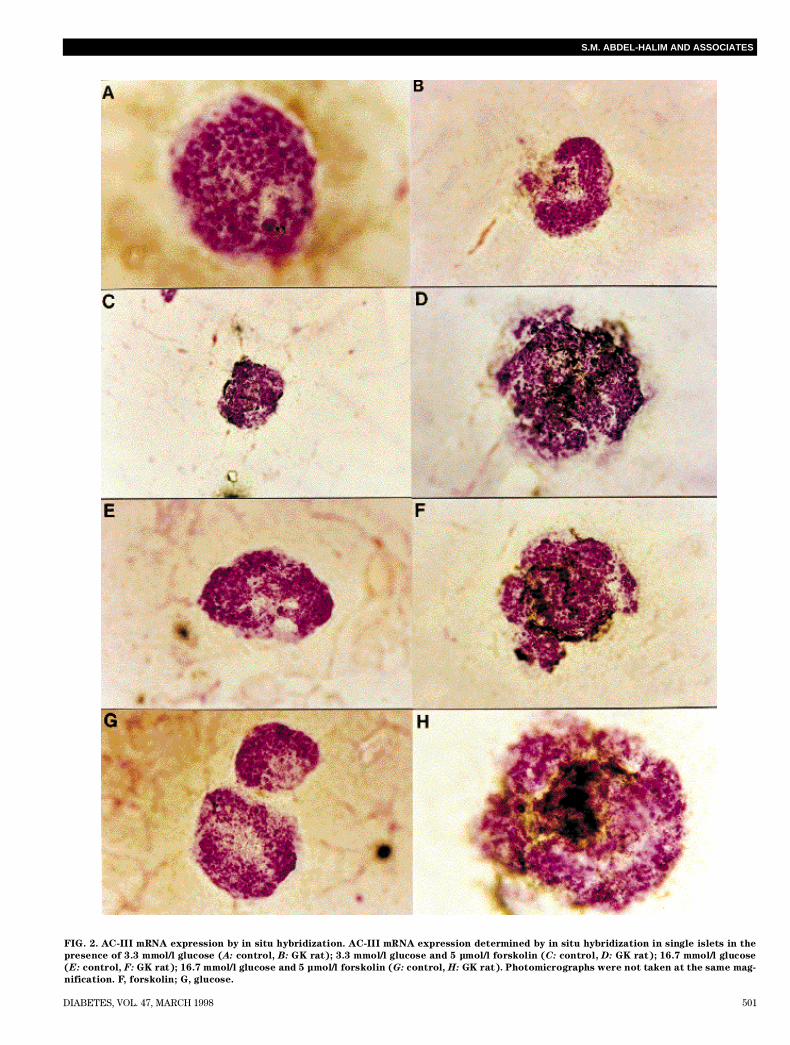
mmol/l glucose was noted in GK islets compared with con-trol islets. A similar picture was noted at 16.7 mmol/l glucose.Forskolin clearly enhanced expression of AC-III mRNA incontrol islets both at 3.3 and 16.7 mmol/l glucose, mirroringthe rises in cAMP and insulin release at similar experimen-tal conditions. Overexpression of AC-III mRNA was, how-ever, already marked in GK islets at 3.3 or 16.7 mmol/l glu-cose, rendering it difficult to discern a further rise inexpression level in response to forskolin at either low or highglucose stimulation. To decrease the enhanced basal mRNAsignals in GK islets to delineate the effects of forskolin, a setof experiments (Fig. 2) in which a mixture of only twoprobes (probes 1 and 3, Table 1) was performed. mRNAexpression was clearly reduced compared with the seriesusing a mixture of four probes. However, the enhanced AC-III mRNA overexpression in GK islets was clearly visible atglucose levels, and the addition of forskolin further inducedmRNA expression severalfold higher in the GK islets com-pared with the control islets (Fig. 2B, D, F, and G).Sequencing of the promoter region of AC-III gene in GK
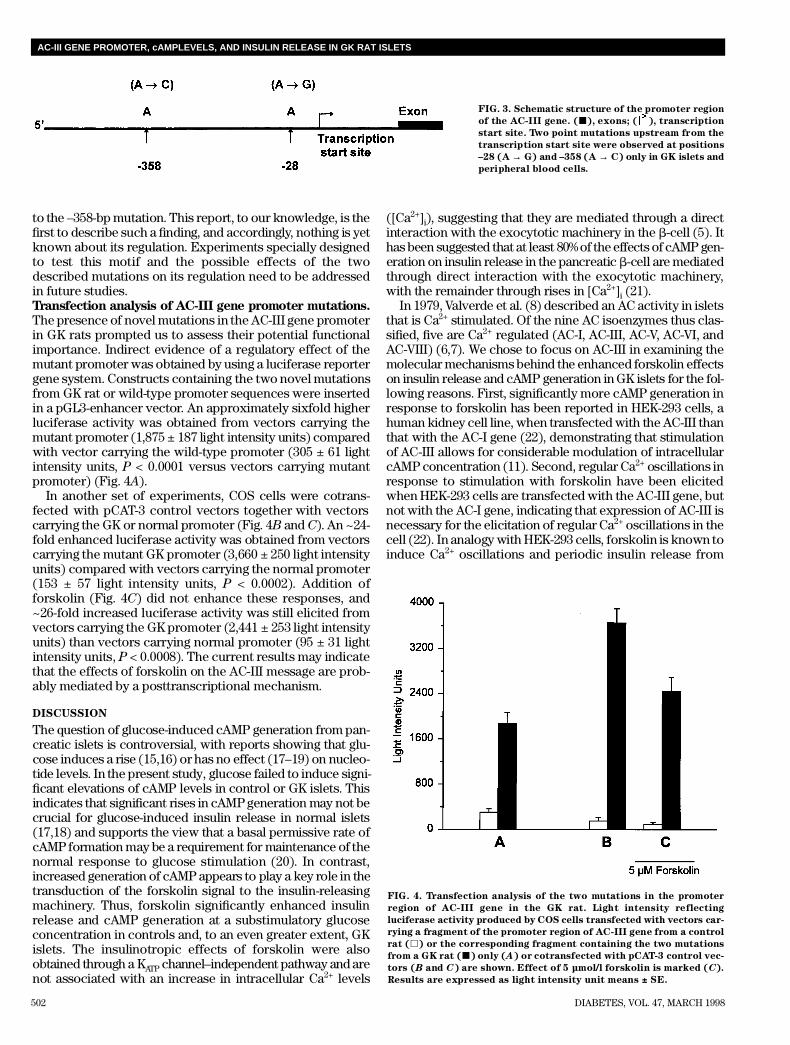
and control rats. The promoter region of the AC-III gene wasselected for mutation screen by DNA sequencing. A genomicDNA fragment of 825 bp was sequenced including 563 bp inthe 59 flanking region. Obtained sequences from GK (n = 6),Wistar (n = 6), and DA (n = 1) rats were identical to the pub-lished sequence (13) except for two point mutations at posi-tions –28 bp (A → G) and –358 bp (A → C) (Fig. 3) relativeto the transcription starting site of the AC-III gene in islets andperipheral blood of GK rats. In the electrophoretogram, clearmonophasic peaks of the two point mutations were obtained,indicating their homozygous character. No base changeswere found in the mRNA transcription sequence from posi-tions 1 to 262.
It is also interesting to consider the possibility of autoreg-ulation by cAMP of AC-III in view of the presence of a cAMPresponse element (CRE) motif in the AC-III promoter. A clas-sical CRE was described to be constituted of the motif 59-T G A C G T C A - 39 or similar composition (14). We confirm thepresence of a motif with the composition 59- T G A C G T C - 39,which more than likely is representing a CRE. The positionof this motif is –244 to –238 bp relative to the transcriptionstart site. Interestingly, this CRE motif lies between the twodescribed mutations in the GK rat AC-III promoter and closer
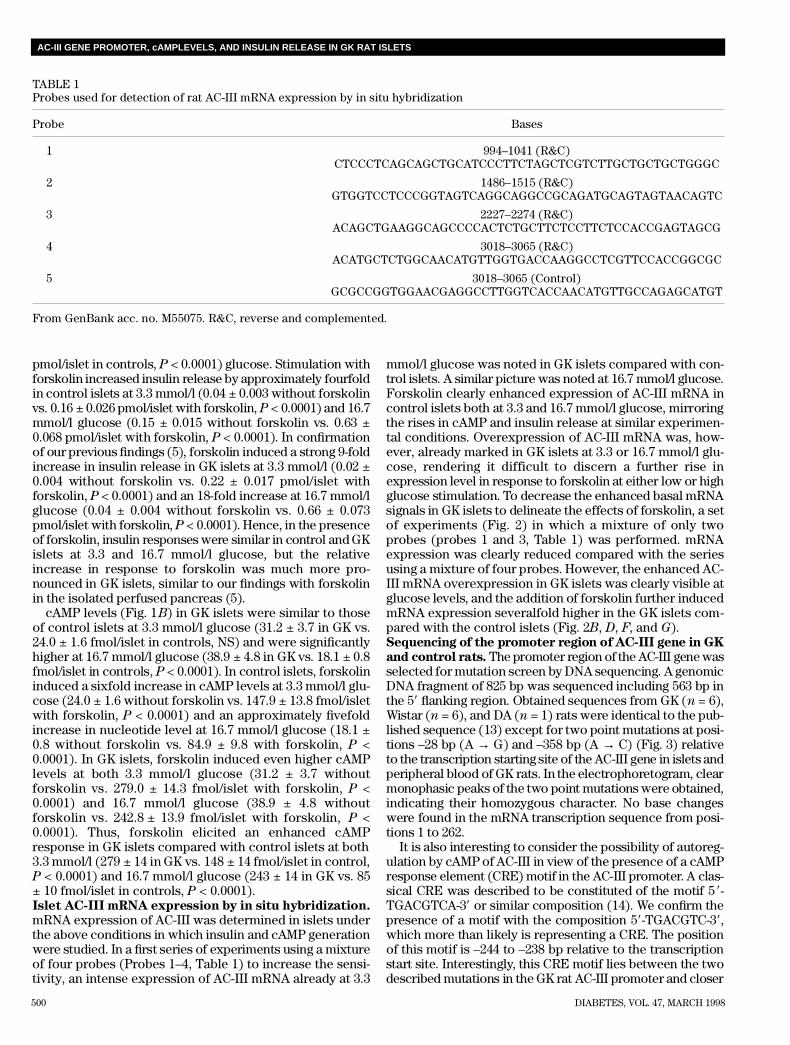
TABLE 1Probes used for detection of rat AC-III mRNA expression by in situ hybridization
P r o b e B a s e s
1 994–1041 (R&C)C T C C C T C A G C A G C T G C AT C C C T T C TA G C T C G T C T T G C T G C T G C T G G G C
2 1486–1515 (R&C)G T G G T C C T C C C G G TA G T C A G G C A G G C C G C A G AT G C A G TA G TA A C A G T C
3 2227–2274 (R&C)A C A G C T G A A G G C A G C C C C A C T C T G C T T C T C C T T C T C C A C C G A G TA G C G
4 3018–3065 (R&C)A C AT G C T C T G G C A A C AT G T T G G T G A C C A A G G C C T C G T T C C A C C G G C G C
5 3018–3065 (Control)G C G C C G G T G G A A C G A G G C C T T G G T C A C C A A C AT G T T G C C A G A G C AT G T
From GenBank acc. no. M55075. R&C, reverse and complemented.
DIABETES, VOL. 47, MARCH 1998 501
S.M. ABDEL-HALIM AND ASSOCIATES
FIG. 2. AC-III mRNA expression by in situ hybridization. AC-III mRNA expression determined by in situ hybridization in single islets in the
presence of 3.3 mmol/l glucose (A: control, B : GK rat); 3.3 mmol/l glucose and 5 µmol/l forskolin (C : control, D : GK rat); 16.7 mmol/l glucose
(E : control, F : GK rat); 16.7 mmol/l glucose and 5 µmol/l forskolin (G : control, H : GK rat). Photomicrographs were not taken at the same mag-
nification. F, forskolin; G, glucose.
502 DIABETES, VOL. 47, MARCH 1998
AC-III GENE PROMOTER, cAMPLEVELS, AND INSULIN RELEASE IN GK RAT ISLETS
to the –358-bp mutation. This report, to our knowledge, is thefirst to describe such a finding, and accordingly, nothing is yetknown about its regulation. Experiments specially designedto test this motif and the possible effects of the twodescribed mutations on its regulation need to be addressedin future studies.Transfection analysis of AC-III gene promoter mutations.
The presence of novel mutations in the AC-III gene promoterin GK rats prompted us to assess their potential functionalimportance. Indirect evidence of a regulatory effect of themutant promoter was obtained by using a luciferase reportergene system. Constructs containing the two novel mutationsfrom GK rat or wild-type promoter sequences were insertedin a pGL3-enhancer vector. An approximately sixfold higherluciferase activity was obtained from vectors carrying themutant promoter (1,875 ± 187 light intensity units) comparedwith vector carrying the wild-type promoter (305 ± 61 lightintensity units, P < 0.0001 versus vectors carrying mutantpromoter) (Fig. 4A) .
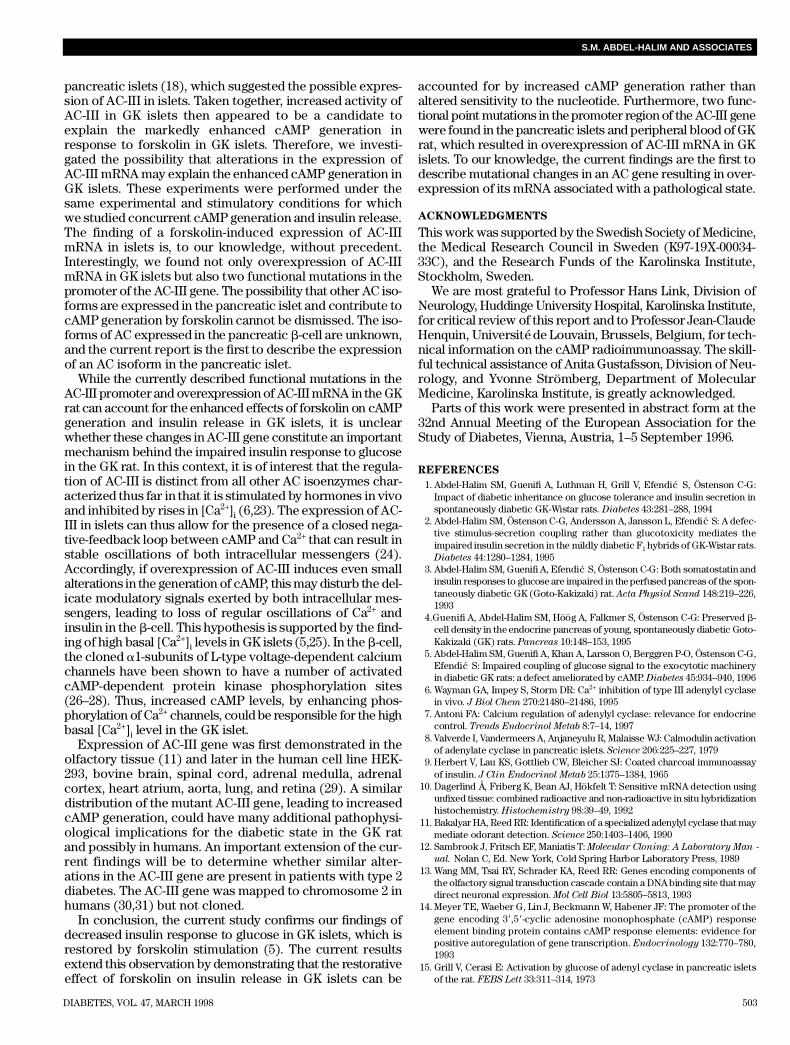
In another set of experiments, COS cells were cotrans-fected with pCAT-3 control vectors together with vectorscarrying the GK or normal promoter (Fig. 4B and C). An ~24-fold enhanced luciferase activity was obtained from vectorscarrying the mutant GK promoter (3,660 ± 250 light intensityunits) compared with vectors carrying the normal promoter(153 ± 57 light intensity units, P < 0.0002). Addition offorskolin (Fig. 4C) did not enhance these responses, and~26-fold increased luciferase activity was still elicited fromvectors carrying the GK promoter (2,441 ± 253 light intensityunits) than vectors carrying normal promoter (95 ± 31 lightintensity units, P < 0.0008). The current results may indicatethat the effects of forskolin on the AC-III message are prob-ably mediated by a posttranscriptional mechanism.
D I S C U S S I O N
T he question of glucose-induced cAMP generation from pan-creatic islets is controversial, with reports showing that glu-cose induces a rise (15,16) or has no effect (17–19) on nucleo-tide levels. In the present study, glucose failed to induce signi-ficant elevations of cAMP levels in control or GK islets. Thisindicates that significant rises in cAMP generation may not becrucial for glucose-induced insulin release in normal islets(17,18) and supports the view that a basal permissive rate ofcAMP formation may be a requirement for maintenance of thenormal response to glucose stimulation (20). In contrast,increased generation of cAMP appears to play a key role in thetransduction of the forskolin signal to the insulin-releasingm a c h i n e r y. Thus, forskolin significantly enhanced insulinrelease and cAMP generation at a substimulatory glucoseconcentration in controls and, to an even greater extent, GKislets. The insulinotropic effects of forskolin were alsoobtained through a KAT P channel–independent pathway and arenot associated with an increase in intracellular Ca2 + l e v e l s
( [ C a2 +]i), suggesting that they are mediated through a directinteraction with the exocytotic machinery in the b-cell (5). Ithas been suggested that at least 80% of the effects of cAMP gen-eration on insulin release in the pancreatic b-cell are mediatedthrough direct interaction with the exocytotic machinery,with the remainder through rises in [Ca2 +]i ( 2 1 ) .
In 1979, Valverde et al. (8) described an AC activity in isletsthat is Ca2 + stimulated. Of the nine AC isoenzymes thus clas-s i fied, five are Ca2 + regulated (AC-I, AC-III, AC-V, AC-VI, andAC-VIII) (6,7). We chose to focus on AC-III in examining themolecular mechanisms behind the enhanced forskolin effectson insulin release and cAMP generation in GK islets for the fol-lowing reasons. First, significantly more cAMP generation inresponse to forskolin has been reported in HEK-293 cells, ahuman kidney cell line, when transfected with the AC-III thanthat with the AC-I gene (22), demonstrating that stimulationof AC-III allows for considerable modulation of intracellularcAMP concentration (11). Second, regular Ca2 + oscillations inresponse to stimulation with forskolin have been elicitedwhen HEK-293 cells are transfected with the AC-III gene, butnot with the AC-I gene, indicating that expression of AC-III isnecessary for the elicitation of regular Ca2 + oscillations in thecell (22). In analogy with HEK-293 cells, forskolin is known toinduce Ca2 + oscillations and periodic insulin release from
FIG. 3. Schematic structure of the promoter region
of the AC-III gene. (j), exons; ( ), transcription
start site. Two point mutations upstream from the
transcription start site were observed at positions
–28 (A → G) and –358 (A → C) only in GK islets and
peripheral blood cells.
FIG. 4. Transfection analysis of the two mutations in the promoter
region of AC-III gene in the GK rat. Light intensity reflecting
luciferase activity produced by COS cells transfected with vectors car-
rying a fragment of the promoter region of AC-III gene from a control
rat (h) or the corresponding fragment containing the two mutations
from a GK rat (j) only (A) or cotransfected with pCAT-3 control vec-
tors (B and C) are shown. Effect of 5 µmol/l forskolin is marked (C) .
Results are expressed as light intensity unit means ± SE.
DIABETES, VOL. 47, MARCH 1998 503
S.M. ABDEL-HALIM AND ASSOCIATES
pancreatic islets (18), which suggested the possible expres-sion of AC-III in islets. Taken together, increased activity ofAC-III in GK islets then appeared to be a candidate toexplain the markedly enhanced cAMP generation inresponse to forskolin in GK islets. Therefore, we investi-gated the possibility that alterations in the expression ofAC-III mRNA may explain the enhanced cAMP generation inGK islets. These experiments were performed under thesame experimental and stimulatory conditions for whichwe studied concurrent cAMP generation and insulin release.The finding of a forskolin-induced expression of AC-IIImRNA in islets is, to our knowledge, without precedent.I n t e r e s t i n g l y, we found not only overexpression of AC-IIImRNA in GK islets but also two functional mutations in thepromoter of the AC-III gene. The possibility that other AC iso-forms are expressed in the pancreatic islet and contribute tocAMP generation by forskolin cannot be dismissed. The iso-forms of AC expressed in the pancreatic b-cell are unknown,and the current report is the first to describe the expressionof an AC isoform in the pancreatic islet.
While the currently described functional mutations in theAC-III promoter and overexpression of AC-III mRNA in the GKrat can account for the enhanced effects of forskolin on cAMPgeneration and insulin release in GK islets, it is unclearwhether these changes in AC-III gene constitute an importan tmechanism behind the impaired insulin response to glucosein the GK rat. In this context, it is of interest that the regula-tion of AC-III is distinct from all other AC isoenzymes char-acterized thus far in that it is stimulated by hormones in vivoand inhibited by rises in [Ca2 +]i (6,23). The expression of AC-III in islets can thus allow for the presence of a closed nega-tive-feedback loop between cAMP and Ca2 + that can result instable oscillations of both intracellular messengers (24).A c c o r d i n g l y, if overexpression of AC-III induces even smallalterations in the generation of cAMP, this may disturb the del-icate modulatory signals exerted by both intracellular mes-sengers, leading to loss of regular oscillations of Ca2 + a n dinsulin in the b-cell. This hypothesis is supported by the fin d-ing of high basal [Ca2 +]i levels in GK islets (5,25). In the b- c e l l ,the cloned a1-subunits of L-type voltage-dependent calciumchannels have been shown to have a number of activatedcAMP-dependent protein kinase phosphorylation sites(26–28). Thus, increased cAMP levels, by enhancing phos-phorylation of Ca2 + channels, could be responsible for the highbasal [Ca2 +]i level in the GK islet.
Expression of AC-III gene was first demonstrated in theolfactory tissue (11) and later in the human cell line HEK-293, bovine brain, spinal cord, adrenal medulla, adrenalcortex, heart atrium, aorta, lung, and retina (29). A similardistribution of the mutant AC-III gene, leading to increasedcAMP generation, could have many additional pathophysi-ological implications for the diabetic state in the GK ratand possibly in humans. An important extension of the cur-rent findings will be to determine whether similar alter-ations in the AC-III gene are present in patients with type 2diabetes. The AC-III gene was mapped to chromosome 2 inhumans (30,31) but not cloned.
In conclusion, the current study confirms our findings ofdecreased insulin response to glucose in GK islets, which isrestored by forskolin stimulation (5). The current resultsextend this observation by demonstrating that the restorativeeffect of forskolin on insulin release in GK islets can be
accounted for by increased cAMP generation rather thanaltered sensitivity to the nucleotide. Furthermore, two func-tional point mutations in the promoter region of the AC-III genewere found in the pancreatic islets and peripheral blood of GKrat, which resulted in overexpression of AC-III mRNA in GKislets. To our knowledge, the current findings are the first todescribe mutational changes in an AC gene resulting in over-expression of its mRNA associated with a pathological state.
A C K N O W L E D G M E N T S
This work was supported by the Swedish Society of Medicine,the Medical Research Council in Sweden (K97-19X-00034-33C), and the Research Funds of the Karolinska Institute,Stockholm, Sweden.
We are most grateful to Professor Hans Link, Division ofN e u r o l o g y, Huddinge University Hospital, Karolinska Institute,for critical review of this report and to Professor Jean-ClaudeHenquin, Université de Louvain, Brussels, Belgium, for tech-nical information on the cAMP radioimmunoassay. The skill-ful technical assistance of Anita Gustafsson, Division of Neu-r o l o g y, and Yvonne Strömberg, Department of MolecularMedicine, Karolinska Institute, is greatly acknowledged.
Parts of this work were presented in abstract form at the32nd Annual Meeting of the European Association for theStudy of Diabetes, Vienna, Austria, 1–5 September 1996.
R E F E R E N C E S
1 . Abdel-Halim SM, Guenifi A, Luthman H, Grill V, Efendic S, Östenson C-G:Impact of diabetic inheritance on glucose tolerance and insulin secretion inspontaneously diabetic GK-Wistar rats. D i a b e t e s 43:281–288, 1994
2 . Abdel-Halim SM, Östenson C-G, Andersson A, Jansson L, Efendic S: A defec-tive stimulus-secretion coupling rather than glucotoxicity mediates theimpaired insulin secretion in the mildly diabetic F1 hybrids of GK-Wistar rats.D i a b e t e s 44:1280–1284, 1995
3 . Abdel-Halim SM, Guenifi A, Efendic S, Östenson C-G: Both somatostatin andinsulin responses to glucose are impaired in the perfused pancreas of the spon-taneously diabetic GK (Goto-Kakizaki) rat. Acta Physiol Scand 1 4 8 : 2 1 9 – 2 2 6 ,1 9 9 3
4 .G u e n i fi A, Abdel-Halim SM, Höög A, Falkmer S, Östenson C-G: Preserved b-cell density in the endocrine pancreas of young, spontaneously diabetic Goto-Kakizaki (GK) rats. P a n c r e a s 10:148–153, 1995
5 . Abdel-Halim SM, Guenifi A, Khan A, Larsson O, Berggren P-O, Östenson C-G,E f e n dic S: Impaired coupling of glucose signal to the exocytotic machineryin diabetic GK rats: a defect ameliorated by cAMP. D i a b e t e s 45:934–940, 1996
6 . Wayman GA, Impey S, Storm DR: Ca2 + inhibition of type III adenylyl cyclasein vivo. J Biol Chem 270:21480–21486, 1995
7 . Antoni FA: Calcium regulation of adenylyl cyclase: relevance for endocrinecontrol. Trends Endocrinol Metab 8:7–14, 1997
8 . Valverde I, Vandermeers A, Anjaneyulu R, Malaisse WJ: Calmodulin activationof adenylate cyclase in pancreatic islets. S c i e n c e 206:225–227, 1979
9 . Herbert V, Lau KS, Gottlieb CW, Bleicher SJ: Coated charcoal immunoassayof insulin. J Clin Endocrinol Metab 25:1375–1384, 1965
1 0 . Dagerlind Å, Friberg K, Bean AJ, Hökfelt T: Sensitive mRNA detection usingu n fixed tissue: combined radioactive and non-radioactive in situ hybridizationh i s t o c h e m i s t r y. H i s t o c h e m i s t r y 98:39–49, 1992
1 1 . Bakalyar HA, Reed RR: Identification of a specialized adenylyl cyclase that maymediate odorant detection. S c i e n c e 250:1403–1406, 1990
1 2 . Sambrook J, Fritsch EF, Maniatis T: Molecular Cloning: A Laboratory Man -
ual. Nolan C, Ed. New York, Cold Spring Harbor Laboratory Press, 19891 3 . Wang MM, Tsai RY, Schrader KA, Reed RR: Genes encoding components of
the olfactory signal transduction cascade contain a DNA binding site that maydirect neuronal expression. Mol Cell Biol 13:5805–5813, 1993
1 4 . Meyer TE, Waeber G, Lin J, Beckmann W, Habener JF: The promoter of thegene encoding 39, 59-cyclic adenosine monophosphate (cAMP) responseelement binding protein contains cAMP response elements: evidence forpositive autoregulation of gene transcription. E n d o c r i n o l o g y 1 3 2 : 7 7 0 – 7 8 0 ,1 9 9 3
1 5 . Grill V, Cerasi E: Activation by glucose of adenyl cyclase in pancreatic isletsof the rat. FEBS Lett 33:311–314, 1973
504 DIABETES, VOL. 47, MARCH 1998
AC-III GENE PROMOTER, cAMPLEVELS, AND INSULIN RELEASE IN GK RAT ISLETS
1 6 . Grill V, Cerasi E: Stimulation by D-glucose of cyclic adenosine 39: 59-monophosphate accumulation and insulin release in isolated pancreatic isletsof the rat. J Biol Chem 249:4196–4201, 1974
1 7 . Sharp GWG: The adenylate cyclase-cyclic AMP system in islets of Langerhansand its role in the control of insulin release. D i a b e t o l o g i a 16:287–296, 1979
1 8 . Henquin J-C, Meissner HP: The ionic, electrical, and secretory effects ofendogenous cyclic adenosine monophosphate in mouse pancreatic B cells:studies with forskolin. E n d o c r i n o l o g y 115:1125–1134, 1984
1 9 . Gembal M, Detimary P, Gilon P, Gao Z-Y, Henquin J-C: Mechanisms by whichglucose can control insulin release independently from its action on adeno-sine triphosphate-sensitive K+ channels in mouse B cells. J Clin Invest
91:871–880, 19932 0 . Malaisse WJ, Malaisse-Lagae F: The role of cyclic AMP in insulin release. E x p e -
r i e n t i a 40:1068–1075, 19842 1 . Ämmälä C, Ashcroft FM, Rorsman P: Calcium-independent potentiation of
insulin release by cyclic AMP in single b-cells. N a t u r e 363:356–358, 19932 2 . Wayman GA, Hinds TR, Storm DR: Hormone stimulation of type III adenylyl
cyclase induces Ca2 + oscillations in HEK-293 cells. J Biol Chem
270:24108–24115, 19952 3 . Wei J, Wayman G, Storm DR: Phosphorylation and inhibition of type III adeny-
lyl cyclase by calmodulin-dependent protein kinase II in vivo. J Biol Chem
271:24231–24235, 19962 4 . Cooper DMF, Mons N, Karpen JW: Adenylyl cyclases and the interaction
between calcium and cAMP signaling. N a t u r e 374:421–424, 19952 5 . Kato S, Ishida H, Tsuura Y, Tsuji K, Nishimura M, Horie M, Taminato T, Ikehara
S, Odaka H, Ikeda H, Okada Y, Seino Y: Alterations in basal and glucose-stim-ulated voltage-dependent Ca2 + channel activities in pancreatic b cells of non-insulin-dependent diabetes mellitus GK rats. J Clin Invest 97:2417–2425, 1996
2 6 . Seino S, Chen L, Seino M, Blondel O, Takeda J, Johnson JH, Bell GI: Cloningof the a1 subunit of a voltage-dependent calcium channel expressed in pan-creatic b cells. Proc Natl Acad Sci USA 89:584–588, 1992
27. Yaney GC, Wheeler MB, Wei X, Perez-Reyes E, Birnbaumer L, Boyd AE III,Moss LG: Cloning of a novel a1-subunit of the voltage-dependent calcium chan-nel from the b-cells. Mol Endocrinol 6:2143–2152, 1992
28. Leiser M, Fleischer N: cAMP-dependent phosphorylation of the cardiac-typea1 subunit of the voltage-dependent Ca2 + channel in a murine pancreatic b-cell line. D i a b e t e s 45:1412–1418, 1996
2 9 . Xia Z, Choi E-J, Wang F, Storm DR: The type III calcium/calmodulin-sensitiveadenylyl cyclase is not specific to olfactory sensory neurons. Neurosci Lett
144:169–173, 19923 0 . Haber N, Stengel D, Defer N, Roeckel N, Mattei MG, Hanoune J: Chromoso-
mal mapping of human adenylyl cyclase genes type III, type V, and type IV.Hum Genet 94:69–73, 1994
3 1 . Gaudin C, Homcy CJ, Ishikawa Y: Mammalian adenylyl cyclase family mem-bers are randomly located on different chromosomes. Hum Genet
94:527–529, 1994