mutasingwa saulo kaimukilwa estimating potential business in ...
110
MUTASINGWA SAULO KAIMUKILWA ESTIMATING POTENTIAL BUSINESS IN TANZANIAN MOBILE SERVICE INDUSTRY Master of Science Thesis Prof. Miia Martinsuo and Dr. Jouni Lyly-Yrjänäinen have been appointed as the examiners at the Council Meeting of the Faculty of Business and Technology Management on May 9th, 2012.
-
Upload
khangminh22 -
Category
Documents
-
view
2 -
download
0
Transcript of mutasingwa saulo kaimukilwa estimating potential business in ...

MUTASINGWA SAULO KAIMUKILWA
ESTIMATING POTENTIAL BUSINESS IN TANZANIAN MOBILE
SERVICE INDUSTRY
Master of Science Thesis
Prof. Miia Martinsuo and Dr. Jouni Lyly-Yrjänäinen have
been appointed as the examiners at the Council Meeting of
the Faculty of Business and Technology Management on
May 9th, 2012.
i
ABSTRACT
TAMPERE UNIVERSITY OF TECHNOLOGY
Master’s Degree Programme in Industrial Engineering and Management
MUTASINGWA SAULO, KAIMUKILWA: Estimating Potential Business in
Tanzanian Mobile Services Industry.
Master of Science Thesis, 110 pages, 4 Appendices (7 pages)
August 2013
Major: Managing Technology-Driven Businesses in Global B2B Markets.
Examiner(s): Professor Miia Martinsuo and Assistant Dr. Jouni Lyly-Yrjänäinen.
Keywords: Mobile Technology, Mobile Service, Potential Business, Business model.
During the last decade, there has been remarkable growth in mobile penetration in most
of developing countries. However, most of the Tanzanian population cannot access real
time services and accurate market information due to limited and underdeveloped
infrastructure. The recent convergence of mobile and communication technologies has
resulted to mobile services and accelerated by high penetration of mobile phones in both
developed and underdeveloped market such as Tanzanian mobile market.
The objective of this research study is developing a conceptual framework that will be
used as a guidance tool for estimating business potential in mobile service industry.
Hence, improving decision making process for managers or entrepreneurs in investing
in prevailing opportunities related to mobile money services business. This research
study has based mostly on literature review and complemented by empirical data.
Literature review helped to develop a conceptual framework for estimating potential
business in mobile services. Meanwhile, samples of six experienced staffs working in
Tanzanian mobile industry were interviewed. A developed conceptual framework is
applied in Tanzanian market by narrowing mobile service scope to mobile money
services.
The main outcome of this thesis is a conceptual framework which is used as a guidance
tool to managers or entrepreneurs who are planning to estimates potential business in
mobile services for either existing markets or expanding in a new market segments. It is
very important to any managers, investors and entrepreneurs to quantify business
opportunities before stepping into any business. The developed conceptual framework
focuses on three critical areas (1) selecting an appropriate target market segment, (2)
identifying a sustainable business model that ensure revenue generation and, (3)
screening potential business in market potential assessment factors such as Market size,
Market consumption rate, Market receptivity, Market growth rate, Economic
infrastructure, Economic freedom, Market intensity and Accessibility.

ii
PREFACE
The idea of writing my master’s thesis on estimating business potential in mobile
services in Tanzania never came up easily. It was after series of work done with my
lecturer Dr. Jouni Lyly-Yrjänäinen during Academic writing I and II courses. My
personal interest on the topic was to explore and expose business opportunities
prevailing in Tanzanian mobile market. Hence, attract more investors meanwhile
strengthening business relationship already existing between Tanzania and Finland
particular in the field of mobile technology. Therefore, developing a conceptual
framework for estimating potential business in mobile money services market was the
main objective of this study. However, achieveing this objective has never been
straightforward. Thus, various people have significantly contributed to the
accomplishment of this research study.
My regards go to my Supervisor Professor Miia Martinsuo and Dr. Jouni Lyly-
Yrjänäinen for your tireless mentoring guidance and flexibility. Special thanks to Dr.
Jouni Lyly-Yrjänäinen for his academic writing tutelage as well as his personal
counseling ability and professional advices throughout my study at Tampere University
of Technology. Again, I would like also to thank Mr. Joel Mtebe (PHD student at
Tampere University) for sharing experiences and challenges related to this topic.
Furthermore, I would like to express my deep appreciation to my family for the moral
and financial support you gave me to pursue master’s studies in Finland. Moreover, I
would like take this opportunity to thank my wife Francesca for supporting me
throughout this process and reminding me the importance of social life every now and
then. Finally, I would like to thank my colleagues and all staffs at the Faculty of
Business and Technology Management for the support during my study period in
Finland.
iii
TABLE OF CONTENTS
ABSTRACT ..................................................................................... i
PREFACE ....................................................................................... ii
TABLE OF CONTENTS ................................................................. iii
ABBREVIATIONS AND NOTATION .............................................. vi
1. INTRODUCTION ....................................................................... 1
1.1. Background .......................................................................................... 1
1.2. Objective of the Research .................................................................... 2
1.3. Research Methodology and Process .................................................... 3
1.4. Structure of the Research ..................................................................... 6
2. MARKETING PROCESS .......................................................... 8
2.1. Market Segmentation ........................................................................... 8
2.1.1. Why Market Segments ............................................................. 8
2.1.2. Basic Principle of Segmentation ............................................... 9
2.1.3. Difference Between B2B and B2C Markets ............................ 10
2.1.4. B2B Market Segmentation ...................................................... 14
2.2. Market Segmentation Frameworks ..................................................... 14
2.3. Market Targeting ................................................................................ 21
2.4. Positioning .......................................................................................... 22
3. MOBILE SERVICES ............................................................... 26
3.1. The S-Curve and Technology Discontinuities ..................................... 26
3.2. Evolution of Mobile Technology .......................................................... 28
iv
3.3. Mobile Services Characteristics .......................................................... 30
3.4. Acceptance of Mobile Services ........................................................... 32
4. ESTIMATING POTENTIAL BUSINESS OF m- SERVICES .... 36
4.1. Estimating Business Potential of Segments ....................................... 36
4.2. Business Models ................................................................................ 40
4.3. Mobile Services Application Segment................................................. 42
4.4. Framework for Estimating Potential in m- Service .............................. 47
5. TANZANIA MOBILE SERVICES MARKET ............................ 53
5.1. Country Profile .................................................................................... 53
5.2. Tanzania Telcom Market .................................................................... 56
5.3. Evolution of Mobile Services ............................................................... 57
5.4. Challenges in Mobile Service Market.................................................. 60
6. ESTIMATING POTENTIAL BUSINESS OF m-SERVICES IN
TANZANIA .................................................................................... 62
6.1. Mobile Services Market Trends .......................................................... 62
6.2. Potential Mobile Service Segments .................................................... 63
6.3. Estimating Potential Business: m-Money Service .............................. 67
6.4. Analysis of Key Findings ..................................................................... 73
7. CONCLUSIONS ...................................................................... 78
7.1. Summary of the Research Study ........................................................ 78
7.2. Managerial Implication and Further Research .................................... 79
BIBLIOGRAPHY ........................................................................... 81
APPENDIX 1- QUESTIONNAIRE ................................................. 95
APPENDIX 2- Tanzania Demographics Indicators .................... 97

v
APPENDIX 3- Mobile market advertisements for different mobile
operators ...................................................................................... 99
APPENDIX 4- Summary of evolution of mobile communication
systems ...................................................................................... 101

vi
ABBREVIATIONS AND NOTATION
B2B Business to Business
B2C Business to Consumer
ICT Information Communication and Technology
PDA Personal Digital Assistant
GPS Global Positioning System
GPRS General Packet Radio Services
GSM Global System for Mobile Communication
SMS Short Messaging Service
MMS Multimedia Messaging Service
WAP Wireless Application Protocol
ROI Returns on Investment
VAS Value Added Services
WLAN Wireless Local Area Network
EDGE Enhanced Data Rates for GSM Evolution
IP Internet Protocol
AMPS Advance Mobile Phone System
ARPU Average Revenue Per User
NMT Nordic Mobile Telephone
1G First Generation
2G Second Generation
3G Third Generation

vii
4G Fourth Generation
M-PESA Mobile Money
OEM Original Equipment Manufacturer
USSD Unstructured Supplementary Services Data
m-Services Mobile Services
1
1. INTRODUCTION
1.1. Background
In developing countries, access to real time and accurate market information can be
limited by poor and underdeveloped infrastructure (Zainudeen et al., 2011). Therefore,
traders, farmers and businesspeople cannot participate actively in the commercial
exchange due to lack of sufficient information which eventually diminish their
bargaining power. On the other side, adoption of mobile technology can ease such
limitation (Jensen, 2007). Recent convergence of mobile and communication
technologies has resulted to mobile services. The fast adoption of the services has been
accelerated by the high penetration of mobile phone both in developed market and
underdeveloped markets.
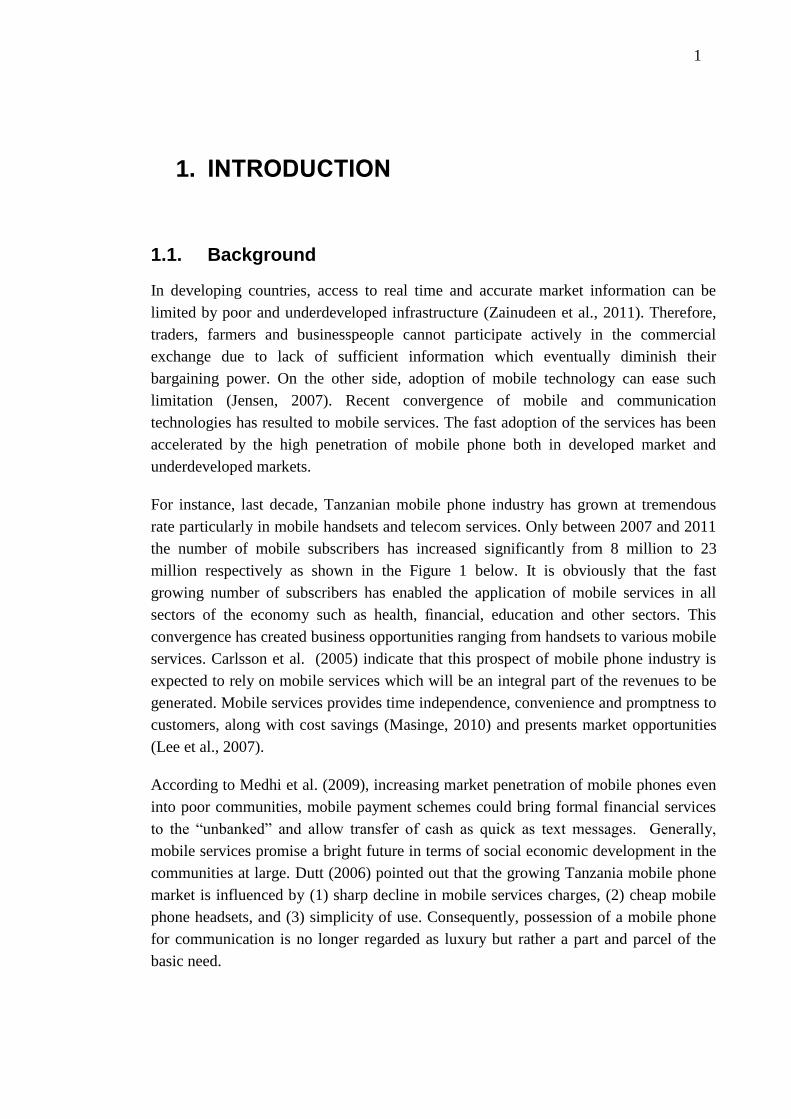
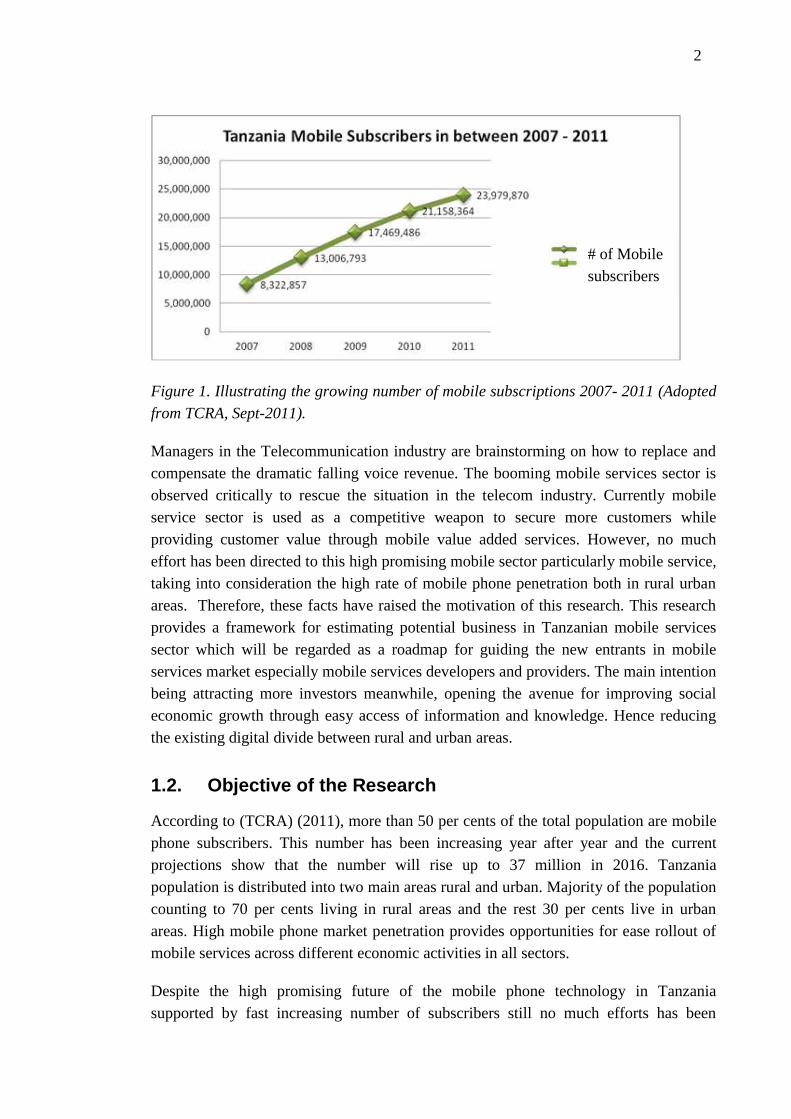
For instance, last decade, Tanzanian mobile phone industry has grown at tremendous
rate particularly in mobile handsets and telecom services. Only between 2007 and 2011
the number of mobile subscribers has increased significantly from 8 million to 23
million respectively as shown in the Figure 1 below. It is obviously that the fast
growing number of subscribers has enabled the application of mobile services in all
sectors of the economy such as health, financial, education and other sectors. This
convergence has created business opportunities ranging from handsets to various mobile
services. Carlsson et al. (2005) indicate that this prospect of mobile phone industry is
expected to rely on mobile services which will be an integral part of the revenues to be
generated. Mobile services provides time independence, convenience and promptness to
customers, along with cost savings (Masinge, 2010) and presents market opportunities
(Lee et al., 2007).
According to Medhi et al. (2009), increasing market penetration of mobile phones even
into poor communities, mobile payment schemes could bring formal financial services
to the “unbanked” and allow transfer of cash as quick as text messages. Generally,
mobile services promise a bright future in terms of social economic development in the
communities at large. Dutt (2006) pointed out that the growing Tanzania mobile phone
market is influenced by (1) sharp decline in mobile services charges, (2) cheap mobile
phone headsets, and (3) simplicity of use. Consequently, possession of a mobile phone
for communication is no longer regarded as luxury but rather a part and parcel of the
basic need.
2
Figure 1. Illustrating the growing number of mobile subscriptions 2007- 2011 (Adopted
from TCRA, Sept-2011).
Managers in the Telecommunication industry are brainstorming on how to replace and
compensate the dramatic falling voice revenue. The booming mobile services sector is
observed critically to rescue the situation in the telecom industry. Currently mobile
service sector is used as a competitive weapon to secure more customers while
providing customer value through mobile value added services. However, no much
effort has been directed to this high promising mobile sector particularly mobile service,
taking into consideration the high rate of mobile phone penetration both in rural urban
areas. Therefore, these facts have raised the motivation of this research. This research
provides a framework for estimating potential business in Tanzanian mobile services
sector which will be regarded as a roadmap for guiding the new entrants in mobile
services market especially mobile services developers and providers. The main intention
being attracting more investors meanwhile, opening the avenue for improving social
economic growth through easy access of information and knowledge. Hence reducing
the existing digital divide between rural and urban areas.
1.2. Objective of the Research
According to (TCRA) (2011), more than 50 per cents of the total population are mobile
phone subscribers. This number has been increasing year after year and the current
projections show that the number will rise up to 37 million in 2016. Tanzania
population is distributed into two main areas rural and urban. Majority of the population
counting to 70 per cents living in rural areas and the rest 30 per cents live in urban
areas. High mobile phone market penetration provides opportunities for ease rollout of
mobile services across different economic activities in all sectors.
Despite the high promising future of the mobile phone technology in Tanzania
supported by fast increasing number of subscribers still no much efforts has been
# of Mobile
subscribers
3
directed toward mobile services sectors especially in identifying the right business cases
and evaluating the potential of the mobile services prevailing. It is for this reason the
current study is initiated: to develop a conceptual framewotk for estimating potential
business in Tanzanian mobile services sector. Therefore, the specific objective of this
study is to.........
.....to estimate business potential of mobile money services in Tanzania to
generate business opportunities and attract investors.
Specific objective of this research study is to be fullfilled by first analyzing the
marketing process and characteristics of mobile services. These streams of literature are
then used to construct a framework for analysing and estimating business potential of
mobile services. In the framework, segmentation of mobile services as well as revenue
generating models and derived demand are emphasized. The framework is then tested in
analysing mobile services with special emphasis on mobile money services.
1.3. Research Methodology and Process
Scientific studies can be done either qualitatively or quantitatively or both depending
on the nature of the problem and the objective of the study. According to Olson
(1995), existing comparison between the two is clouded by two problems: (1) lack of
coherent definitions, and (2) the focus of most discussions on methods instead of on
the basic assumptions of these two stances. Gummesson (1993) believes that
quantitative methods have been overrated as compared to qualitative methods. In
reality the two methods complement each other and therefore, no method is better than
the other. Table 1 below describes the difference between quantitative and qualitative
research.

4
Table 1. Showing the difference between Quantitative and Qualitative research
methods (modified from Tashakkori & Teddlie, 2003).
According to Gummesson (1993), qualitative research comprises of five methods.
Firstly, existing materials refers the secondary data created by someone else’s purpose
and these includes books, research reports articles, archival records, mass media
reports computer database and others (Gummesson, 1993). The challenges associated
with this methods are confidentiality that the owner might not be willing to share with
third party also these data might be expensive to get them for example marketing
research reports and reliability since some of the secondary data are biased based on
the author view. Second, questionnaire survey usually is associated with quantitative
methodology but also is applied in qualitative methods to standardize and formalize the
Quantitative Research Qualitative Research
Scientific method Deductive or “top-down
The researcher tests hypotheses and
theory with data.
Inductive or “bottom-upp”
The researcher generates new
hypotheses and grounded theory
from data collected during
fieldwork.
View of human
behavior
Behavior is regular and predictable. Behavior is dynamic, situational,
social, contextual, and personal
Most common
research
objectives
Description, explanation and
prediction.
Description,exploration,and
discovery.
Focus Narrow-angle lens testing specific
hypotheses.
Examining the breadth and depth
of phenomen to learn more about
them.
Nature of
observation
Attempt to study behavior under
controlled conditions
Study how the behavior occurs
in different context.
Nature of reality Objective. Subjective.
Form of data
collected
Data collection based on precise
measurement using structured and
validated data collection
instruments (e.g. closed-ended
questionnaire, rating scales,
behavioral responses)
Data colection uses in-depth
interviews, participant
observation, field notes and
open-ended questions.
Nature of data variables Words,images
Data analysis Identify statistical relationships Identifies patterns, themes and
holistic feature.
Results Generalizable findings Particularistic findings
Form of final
report
Statistical report (e.g. with
correlations, comparisons of means,
and reporting of statistical
significance of findings)
Narrative report with contextual
description and direct quotations
from research participants.

5
interviews. Third, qualitative interviews are commonly used in empirical data
generation in the case studies. A good example of qualitative interviews is an in-depth
interview which is usually carried out by guide. However, the degree of reliability of
an interview depends on the interviewee’s knowledge on the subject of study and
quality of the discussion. Fourth, observation method comprises of two types of
methods (1) participant and (2) direct observation. Participant observation is one of the
most demanding methods, it requires the researcher to become a participant in the
culture or context being observed while direct observation the participant does not
typically try to become a participant in the context. However, the direct observer
does strive to be as unobtrusive as possible so that to avoid biasness (Trochim,
2006). Fifth, action research is the most demanding method and it includes all
methods. The researcher is involved in the whole process of the data gathering
(Gummesson, 1993). Research approach adopted in any research depends upon the
fundamental research objectives and questions (Denzin & Lincoln, 2000). To address the
objective of this research study, qualitative research methodology paradigm will be
used. This research study comprises two main part: (1) Theoretical part and (2)
Emperical part.
The theoretical part of this research study will be accomplished by comprehensive
literature review on topics related to marketing process that emphasis on market
segementations (i.e. reviewing and comparing different market segmentation
frameworks) and mobile services focusing mainly on mobile services characteristics.
These two types of literature will play great role in constructing a conceptual framework
for estimating potential business in mobile services. Thereafter, the developed
framework is applied in Tanzanian mobile market particularly on estimating business
potential for mobile services. The conceptual framework developed will be tested on the
most potential mobile services segement as it will be identified by the interviewees. The
whole process of literature review will be successfuly achieved by reviewing the
following sources of existing materials. However, the use of existing materials should
be treated with much care so that credibility of the study is not put into question mark!
Therefore, trustworthy sources and high quality existing materials are recommended to
be used in order to have high quality study (Gummesson, 1993). In developing a
conceptual framework, numerous existing materials were used, such as relevant books,
scientific journals, articles, newspapers, magazines, marketing research reports,
TUTCAT databases, firm websites and other internet sources.
On the other hand, the empirical part of this study completements on the extensive
literature discussed. The empirical part takes two approaches which includes in-depth
interviews and action science. In conducting in-depth interview, the author designed a
standard questionnaire (See Appendix 1) to provide good guidance during the
interactions between the interviewer and the respondents. Five intervewees with vast
6
experience in Tanzanian mobile service market were interviewed. The author went far
beyond the guiding questionnaire tool by probing so that to explore the knowledge,
experience of the mobile market from the interviewees. Given the fact that no any
research study have ever been done on estimating potential business in Tanzanian
mobile market. Therefore, to ensure that the whole mobile market is studied well, the
author decided to interview the diverse group of participants ranging from the Mobile
service providers to mobile services aggregator. This diverse group serves a purpose of
exploring the mobile market extensively and sharing the experience across the mobile
market business to business supply chain as well as to get assistance in priotizing the
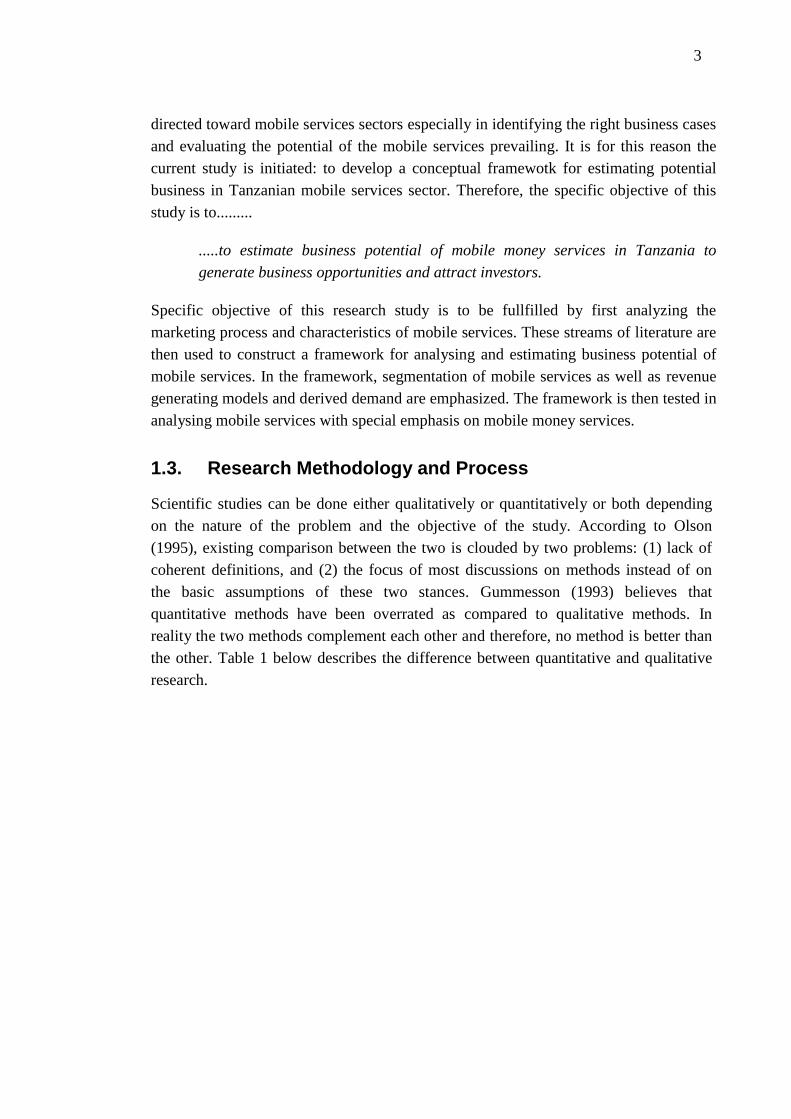
most potential mobile services segment. Table 2 below indicates the participants in the
interviews, field of their operations, date of the interview. The real names of the
participants and names of companies are reserved because of the confidentiality and
sensitivity of the information provided by the interviewees.
Table 2. Interviewees and date of interviews.
Participants
code
Participants Title Field of Operation Date
A Chief Operation
Officer
Mobile Services
Providers
02.12.12
B Business Analyst Mobile Service Operator 04.12.12
C Product Specialist Mobile Service
Aggregator
07.12.12
D Senior Market
Specialist
Mobile service Operator 14.12.12
E Mobile Service
Provider
Mobile Service Provider 27.12.12
F Managing Director Mobile Application
Developer
04.01.13
The key findings of this research study raised interest ranging from mobile services
aggregators to mobile network operators. Therefore, different companies already
working in Tanzanian mobile market welcomed and accepted the questionnaire and
were ready to be interviewed.
1.4. Structure of the Research
This master’s thesis consists of seven Chapters as shown in the Figure 2 below. First
Chapter provides a brief introduction which covers the background of the research topic
and objective of the research study. Thereafter, this Chapter also describes the
methodology and process taken to accomplish this research study as well as the

7
structure of the Master’s thesis. Chapter two discusses literature review on the concept
of marketing process main emphasis being on market segmentation frameworks, market
targeting and postioning. Chapter three also discusses the literature review on mobile
services mainly focusing on mobile services characteristics and how mobile services
have evloved and acceptance features of mobile services in the community. Chapter
four provides a comprehensive analysis on literature discussed in Chapter 2 and
Chapter 3 in developing a conceptual framework for estimating potential business in
mobile services. Figure 2 below illustrates the structure of this research study.
Figure 2. Structure of the research study.
Chapter five introduces Tanzanin mobile service market and discusses how mobile
services have evolved in Tanzania using the concept of technology evolution discussed
in chapter 3 and the chapter ends with a discussion on the challenges in the mobile
services market based on views/options from the interviewees. Chapter six discusses
mobile services market trends and identintification of the most potential mobile services
market segments. In addition Chapter six applies the developed conceptual framework
in Chapter four of this study to Tanzanian mobile services market especially on mobile
money services business. Chapter six concludes with an analysis of the key findings of
the research study. Chapter seven concludes the research study by a summary of the key
findings, recommendations and a proposal for further studies on the topic.
3. MOBILE SERVICES 2. MARKETING PROCESS
4. ESTIMATING BUSINESS POTENTIAL
FOR MOBILE SERVICES
5. TANZANIAN MOBILE SERVICES
MARKET
7. CONCLUSION
1. INTRODUCTION
6. ESTIMATING POTENTIAL BUSINESS
OF MOBILE SERVICES IN TANZANIA
8
2. MARKETING PROCESS
2.1. Market Segmentation
2.1.1. Why Market Segments
More than five decades since its commencement, market segmentation had a wide
coverage usage across all business sectors (Weinstein, 2004). Nowadays market
segmentation has become the heart of marketing theory. Kotler & Keller (2009) state
that marketing idea is all about satisfying the needs and wants of the customer.
Therefore, market segmentation manages diverse customer needs and target resources
(McDonald & Dunbar, 2004). A better customers understanding and identification of
their needs and wants is an acute responsibility for every company (Croft, 1994).
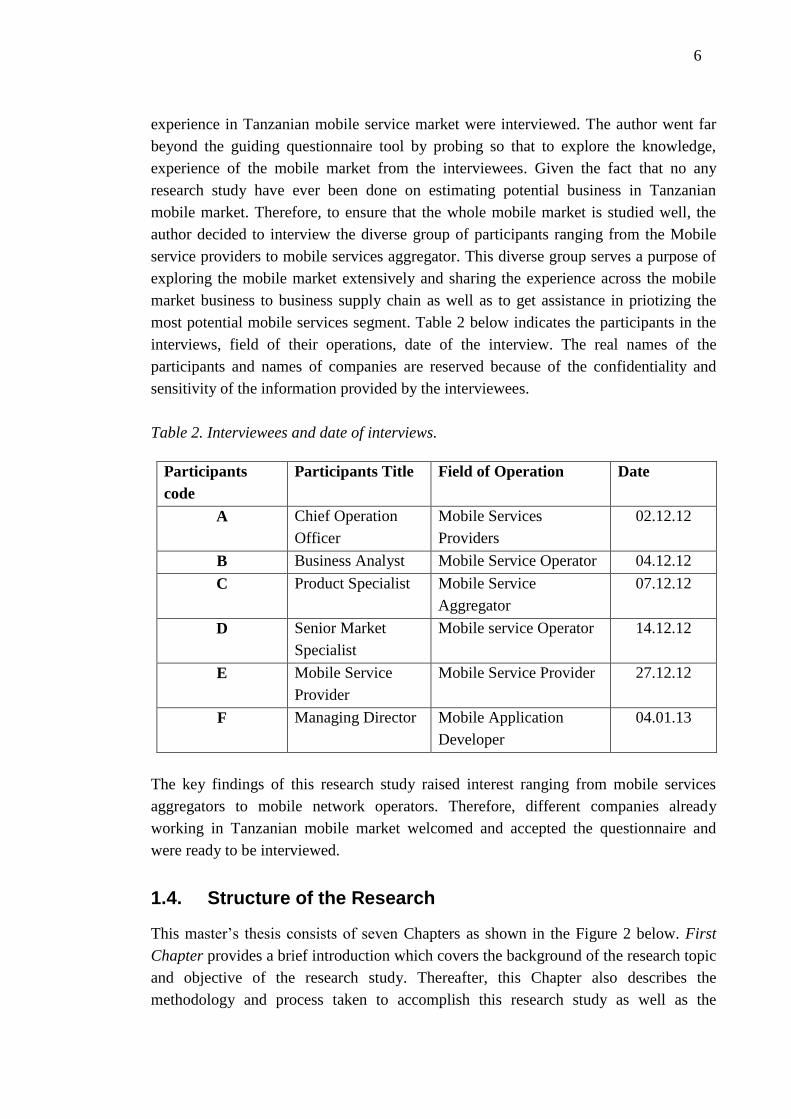
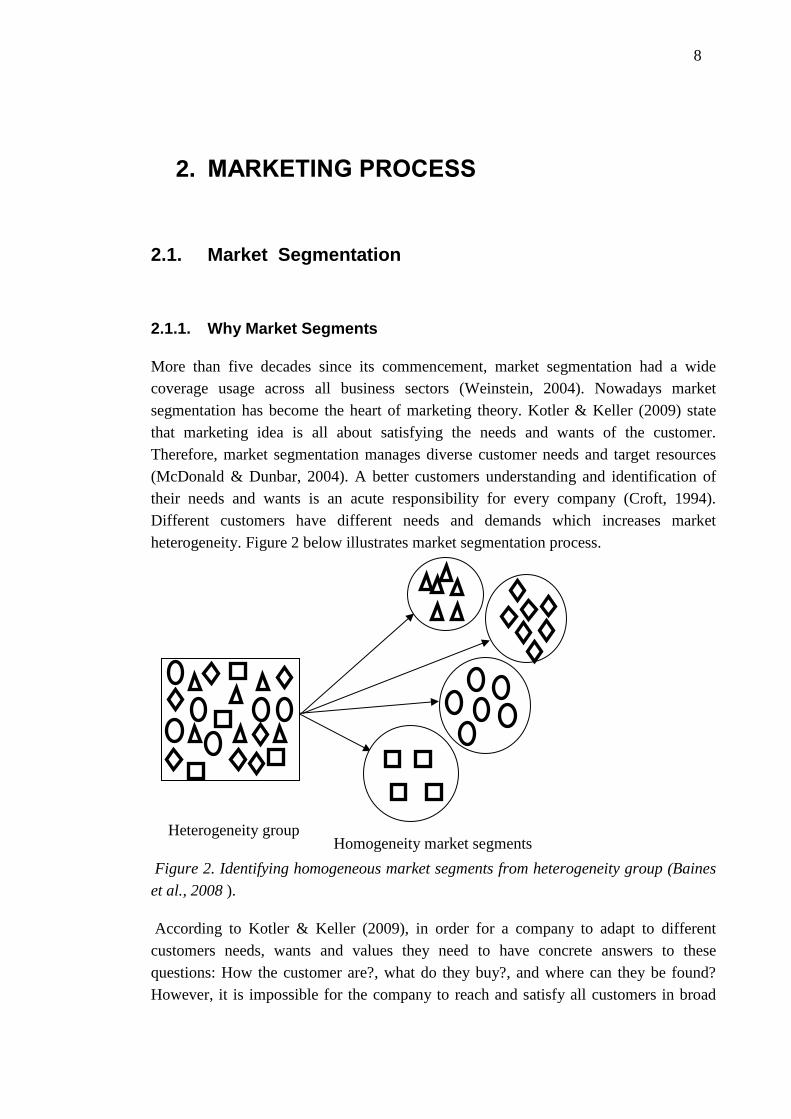
Different customers have different needs and demands which increases market
heterogeneity. Figure 2 below illustrates market segmentation process.
Figure 2. Identifying homogeneous market segments from heterogeneity group (Baines
et al., 2008 ).
According to Kotler & Keller (2009), in order for a company to adapt to different
customers needs, wants and values they need to have concrete answers to these
questions: How the customer are?, what do they buy?, and where can they be found?
However, it is impossible for the company to reach and satisfy all customers in broad
Heterogeneity group Homogeneity market segments
9
and diverse markets, since capabilities and resources do not stretch that far (Hague,
2002; Kotler & Keller, 2009). Therefore, dividing a market into groups which shares
similar characteristics or interests in a certain products or services might be an effective
way for a company to manage diversity, allocating resources and being able to assess
the attractiveness of potential market segments. (Kotler & Keller, 2009)
According to Choffray et al. (1980); Webster (1991), a company is most likely to
achieve a match between their capabilities and diversity customer needs by focusing on
customers with comparatively homogenous requirements. There is sufficient literature
to back up the facts that market segmentation is an inevitable process toward successful
strategic marketing planning. Generally, market segmentation keeps close attention
between businesses and customers and ensures efficient resource allocation and
eventually leads to better marketing programs adapted to customers’ needs (Albert,
2003). In addition, effective use of market segmentation should help to develop a
sustainable competitive edge in competitive rivalry.
2.1.2. Basic Principle of Segmentation
As it was mentioned in the previous section, market segmentation is the most important
tool in marketing activities. It helps managers to compare specifics of segments and use
the knowledge to target customers with right offers meanwhile aiming at reaching the
highest revenue. In order to ensure that a company is utilizing its capabilities and
allocating resources in a right way, several scholars who have contributed in the
development of market segmentation concept discussed basic principles of market
segmentation. For instance, Frank et al. (1972); Kotler & Keller (2009) set basic
principles for a successful marketing segmentation:
Segment should be big enough
Heterogeneous segments
Measurable
Reachable segment
First, every market segment that is cut out from the market should be large enough to
serve profitably and also must ensure return on the investment (ROI). Depending on the
business context and selected criteria, market segment should be largest possible
homogenous group. Second, each segment should be distinguishable from each other.
This helps the marketing people to design different products to different customers in
effective communication. Third, market segment should be measurable so that in the
end it will be easier to evaluate if the segment have been reached or not. In order to
evaluate the effectives of the intervention dedicated in the specific segment clear
10
identifiable segmentation criteria should be put in place. Fourth, for the segment which
is not reachable the entire market segmentation process loses its value. The selected
segment should be accessed easily so that marketers can serve customers efficiently and
conveniently.
On the other hand, McDonald & Dunbar (2004); Baines et al. (2008) suggested another
approach to evaluate market segment attractiveness and successfulness of the market
segmentation process. This approach uses rating for different segment attractiveness
factors which includes: market growth, market profitability, segment size, competitive
intensity and business cyclical situation within the industry. Hudson (2008) came up
with almost similar criteria discussed by Kotler & Keller (2009). Hudson (2008) stated
that to target a better market the following criteria should be used: accessibility,
identifiable, well defined, networking, and homogeneous. According to the studies
conducted by Frank et al. (1972); McDonald & Dunbar (2004); Baines et al. (2008);
Kotler & Keller (2009), the criteria for assessing attractiveness of the target market
segment varies depending on the targeting approach employed by particular
organization. Successful evaluation of market segment attractiveness requires
comprehensive market and customer’s information available.
2.1.3. Difference Between B2B and B2C Markets
In marketing arena, a perception of dichotomy between Business to Business markets
and Business to Consumer markets has always been there. The differences between
them are well documented (Simkin, 2000). According to Coviello & Brodie (2001), the
difference between two market contexts are mostly based on influences, buyer decision
processes, and seller – buyer relationship (Coviello & Brodie, 2001). B2B companies
sells opportunity to make more money through adding customer value to purchased
products and reselling them while B2C companies concentrate on selling experiences
and feelings to end customers. Thus, intention to make profit is the key feature in B2B
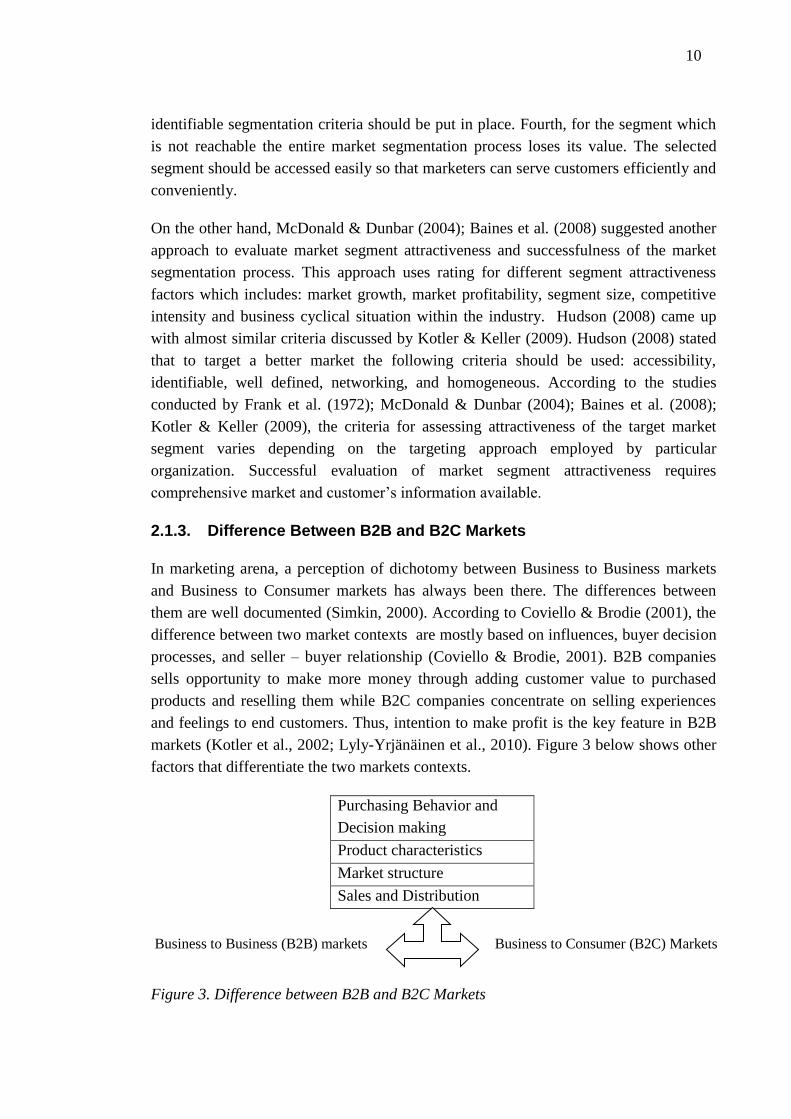
markets (Kotler et al., 2002; Lyly-Yrjänäinen et al., 2010). Figure 3 below shows other
factors that differentiate the two markets contexts.
Purchasing Behavior and
Decision making
Product characteristics
Market structure
Sales and Distribution
Figure 3. Difference between B2B and B2C Markets
Business to Business (B2B) markets
Business to Consumer (B2C) Markets
11
Purchasing Behavior and Decision making
The main difference between Business to Business markets and Business to consumer
markets is that B2B companies buy from other companies while in B2C private
customers buy from companies (Ford et al., 2002). Despite of the differences between
B2B and B2C markets in purchase process both ends in a purchase (Brown & Fern,
1984). Thus, what makes a difference between them is the complexity of the decisions a
purchaser has to go through in business environment. Wilson (2000) questioned that
why should be assumed that different theories are necessary to explain exchange
behaviors adopted by the same person in different contexts? However, people are not
transformed from human being into robot when acting in business situations but human
nature still exists (Pickton & Broderick, 2001). This shows that people should be
affected not only by B2B marketing tools such as direct marketing and personal selling
but also B2C marketing tools like emotional advertising (Blombäck, 2005). The
purchase decisions in B2B takes place within groups and depends on the complexity of
the product or services offering and industrial buyer mostly focus on the company’s
overall brand identity rather than products. Thus, reduce risks and uncertainties
(Mudambi, 2002).
Purchase in B2B market are performed by group of professionals while in B2C markets
purchases are done by family members and customers in consumer markets focuses in
tastes whereas in business markets concentrates on functionality and performance
(Anderson & Naurus, 2004). Relationship between buyer and seller is very important in
B2B market and long term relationship tends to results into close personal relationship
which actually are difficulty for competitors to interfere while in B2C market customer
loyalty is not common (Ford et al., 2002; Lyly-Yrjänäinen, 2010). Furthermore,
transactions in B2B markets take long time since it involves a lot of people and the
supply chain is both long and complex.
Product Characteristics
The disparity in the buying process between B2B markets and B2C markets signifies
the difference characteristics of products sold in both markets. As the decision making
get complex and complex in business purchase market the same applies to products
while in consumer purchase even a complex product like a computer or car tend to be
based on simple criteria.
On the other hand, a simplest product in B2B markets involves many qualified experts
as always it needs to be integrated into other large systems (Hague & Harrison, 2012).
Products in consumer markets are standardized. Thus manufacturers are not focusing on
individual needs but rather target market segments. Conversely, in B2B markets
products are tailored. For example Intel sells customized micro processor chips to
12
different computer manufacturers and mobile devices according to their needs (Lyly-
Yrjänäinen, 2011). For example, needs might include size, speed, performance and
others. This rise the question whether market segmentation is possible and makes
economic logic if every single customer has complex and completely different demands.
However, B2B markets are characterized by few customers but who buy products in
larger quantities or make big deals as compared to consumer markets and mostly
confirm the Pareto principle in customer distribution. Hence small number of customers
dominates the sales revenue (Hague & Harrison, 2012). In addition, products in B2B
market always have long term consumption as compared to consumer markets.
Therefore, the product life cycle for industrial market is not as repetitive as what is
experienced in consumer markets. Furthermore, availability and consistency delivery
time for products are very crucial in B2B markets as compared to consumer markets due
interdependence of B2B value chains (Raisch, 2001). For instance, in car assembly line
only the shortage of nuts and bolts will affects the whole assembly process as no car can
be finalized.
Market Structure
Industrial market structure differs from consumer market in many ways. Although
industrial sellers do not sell directly to end consumer but managers in industrial market
environment carefully observe the economic conditions to anticipate consumer buying
patterns. The essence of assessing the customer of the customer’s changing demand is
due to the fact that demand in business products is based on “derived demand”. Kotler
(2003) states that derived demand separates industrial markets and consumer markets
and described derived demand as the demand that is created and influenced by the
demand of consumer goods. According to Lyly-Yrjänäinen et al. (2010), sales to
consumer can be derived from the sales of that specific customer to its own customers.
This implies that demand of products originates from the primary consumer since if the
consumer does not demand or a small change in demand of products appears the whole
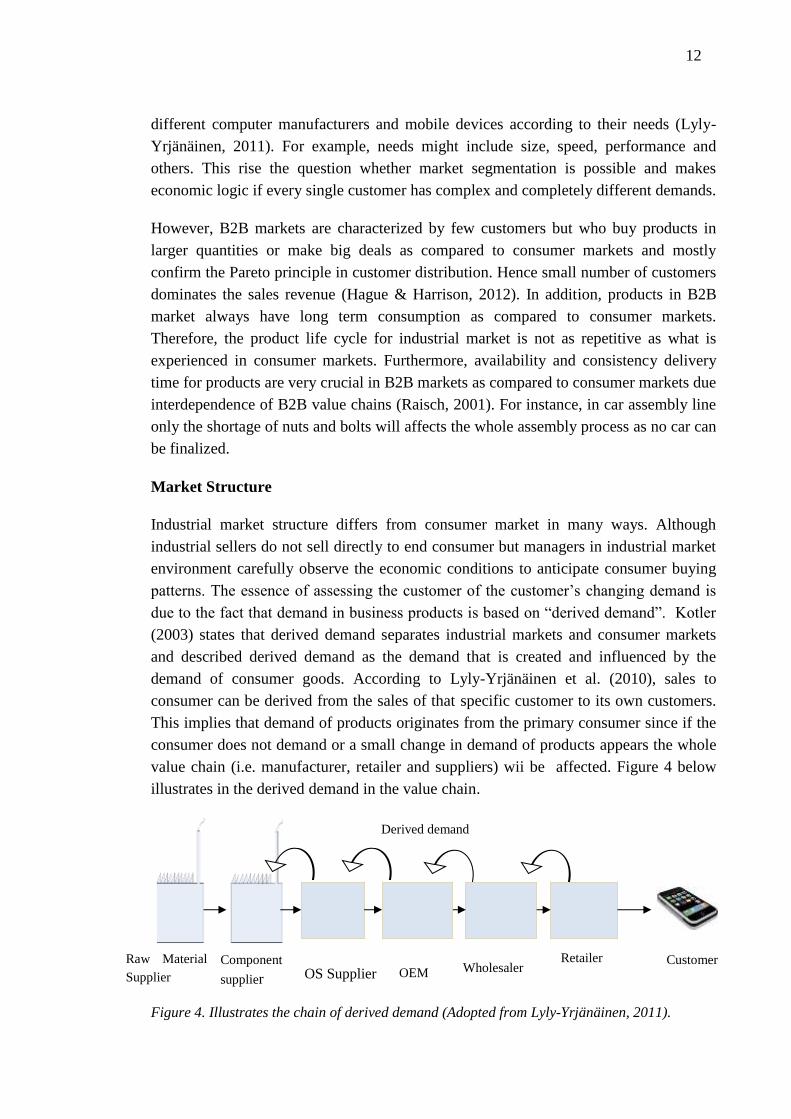
value chain (i.e. manufacturer, retailer and suppliers) wii be affected. Figure 4 below
illustrates in the derived demand in the value chain.
Figure 4. Illustrates the chain of derived demand (Adopted from Lyly-Yrjänäinen, 2011).
Raw Material
Supplier
Component
supplier OS Supplier OEM Wholesaler Retailer Customer
Derived demand
13
Furthermore, Jakobi (2001) added that industrial market prices are driven by derived
demand whereas in consumer market the prices are controlled by elasticity of demand.
However, the prices for industrial products are considered to be inelastic. Therefore, the
rise of prices for a system component might not affect its demand or supply whereas in
consumer market the situation is opposite as only small changes in prices will affect
significantly the demand of the products. For instance the rise of voice call charges will
significantly affect the average revenue per user (ARPU). This shows that there is high
price sensitivity in B2C as compared to B2B markets.
Another characteristic of the market structure that differentiates the two market contexts
is competition. The nature of the B2B market sharps the type of the competition.
According to Lyly-Yrjänäinen et al. (2011), few number of companies in B2B offer
competing products which suits for oligopoly type of competition. Only few companies
dominate the market. For example INTEL and Samsung Electronics are dominating the
semiconductor industry, supply their microprocessor to PC manufacturers. On the other
side, consumer markets is characterized by monopolistic competition in which many
companies produces similar products and try to survive in the market by differentiation.
Sales and Distribution
Product offerings difference existing between industrial market and consumer market
influences the kind of sales and distribution strategies (Rope, 1998). The large number
of customers in consumer market calls for standardized products and long distribution
channels. It would have been so difficult and inefficient to sell and deliver products
directly to customers in consumer market. Therefore, manufacturer of consumer good
uses intermediate channels such as wholesaler or retailers to reach mass end customers
(Lyly-Yrjänäinen et al., 2010).
On the other hand, industrial markets are characterized by tailored products. Therefore,
generally entail shorter and more direct channels of distribution (Dwyer & Tanner,
2006). For instance, system supplier sells the system to the Original Equipment
Manufacturer (OEM) which might only involve two companies in the selling and
distribution process. Consumer marketing aims at reaching as many customers as they
can through mass media while in industrial marketing personal contacts plays an
important role in advertisement. According to Hutt & Speh (2004), industrial market
companies allocate small budget for promotional and advertisement through direct
mails, trade fairs and trade journals. However, personal selling is the most important
way of marketing product in industrial market (Lyly-Yrjänäinen, 2010). In industrial
marketing depend deeply on direct sales and sales people need to work closely together.
A well designed advertisement can create a buyer in consumer market. Whereas in
industrial market plays a different role and because of smaller number of customers in
B2B, word of mouth has greater effect in creating a customer (Ford et al., 2002).

14
However, according to Anderson & Naurus (2004), promotion in B2B focus on
performance and functionality and personal sales are the leading sales tool. Thus,
personal sales communicate marketing messages effectively and allow personal
feedback (Kotler et al. 2002). Generally, in marketing the main difference between
consumer market and industrial market is that consumer market sale is to end consumer
who is most likely influenced by factors such as family or friends although only a single
personal make and pays for a transaction. Meanwhile in industrial market sale is done
between firms or organizations or companies. Taking into account the complexity of the
organization structure, sales in industrial market involves multiple decision makers.
(Kotler & Pfoertsch, 2006)
2.1.4. B2B Market Segmentation
B2B markets concentrates on companies and organizations. Contrary, consumer
markets focus on individual and division to market segments (Hague, 2007). According
to Lyly-Yrjänäinen et al. (2010), the overall number of customers and tailored product
offerings separate market segmentation process in both market contexts. With
increasing consumer needs, demands and changing behavior, it is difficult to find only
one customer type. In B2B market, every customer is treated uniquely and it is
financially and time ineffective to offers tailored services or products to every customer.
Therefore, it is useful to classify customers into market segments (Kotler & Keller,
2009 in Grosova, 2011). However, in B2B environment, market segmentation focuses
on identifying suitable customer for firm’s own competences (Lyly-Yrjänäinen, 2010).
Market segmentation in B2B markets has become an asset for a company and an
essential part of path from company to customers especially in improving customer
loyalty and better understanding of customers. The degree to which market
segmentation is used in business markets depends on the company’s need, type of
activities and the changing environments in which it is operating (Hutt & Speh, 2001).
Theory and practice of market segmentation research in B2B markets lags behind those
of consumer market due to the following reasons: organization heterogeneity which
makes it difficult to develop segmentation methodology that suits all environment
(Freytag & Clarke, 2001), complex of buying decisions and lack of agreement on which
criteria should be used to segment market and which should describe these segments
(Webster, 1991).
2.2. Market Segmentation Frameworks
There are several criteria used in market segmentation as presented in different
literature. However not all criteria discussed in different literature are suitable for B2B
market segmentation (Jain, 1997). Jobber (2003) discussed the B2B segmentation
approach based on criteria category developed in Wind & Cardozo’s theory 1974. In
15
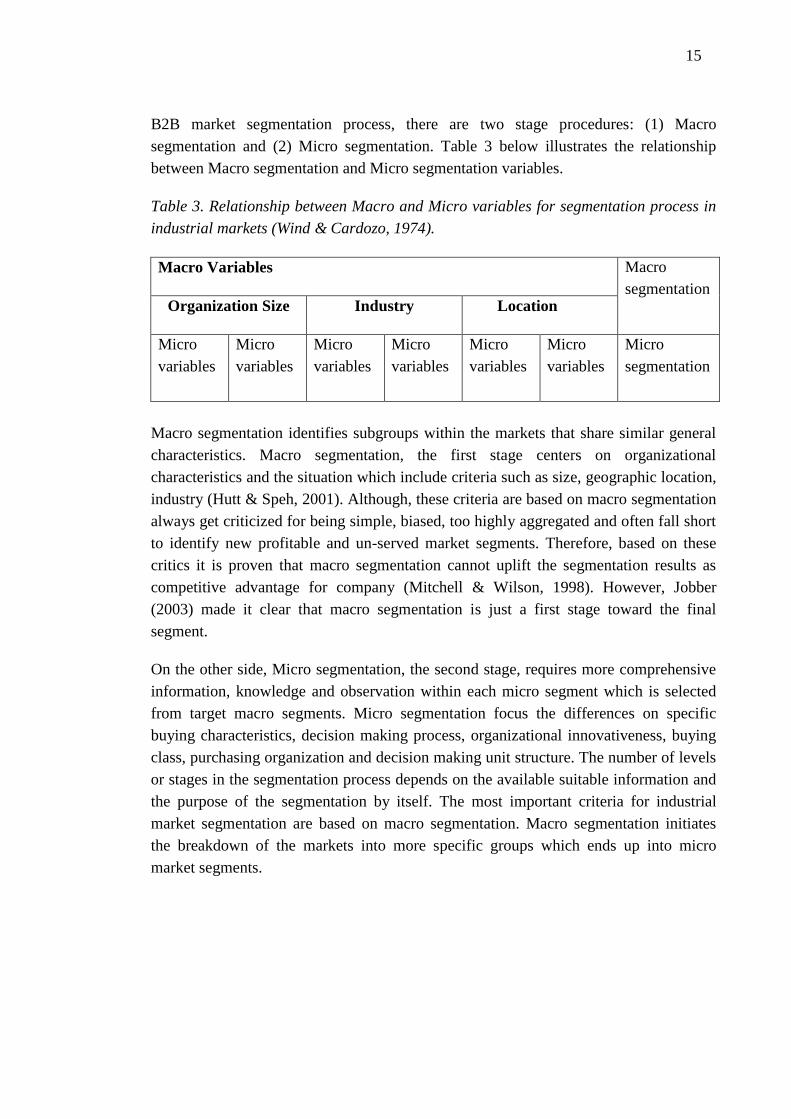
B2B market segmentation process, there are two stage procedures: (1) Macro
segmentation and (2) Micro segmentation. Table 3 below illustrates the relationship
between Macro segmentation and Micro segmentation variables.
Table 3. Relationship between Macro and Micro variables for segmentation process in
industrial markets (Wind & Cardozo, 1974).
Macro Variables Macro
segmentation Organization Size Industry Location
Micro
variables
Micro
variables
Micro
variables
Micro
variables
Micro
variables
Micro
variables
Micro
segmentation
Macro segmentation identifies subgroups within the markets that share similar general
characteristics. Macro segmentation, the first stage centers on organizational
characteristics and the situation which include criteria such as size, geographic location,
industry (Hutt & Speh, 2001). Although, these criteria are based on macro segmentation
always get criticized for being simple, biased, too highly aggregated and often fall short
to identify new profitable and un-served market segments. Therefore, based on these
critics it is proven that macro segmentation cannot uplift the segmentation results as
competitive advantage for company (Mitchell & Wilson, 1998). However, Jobber
(2003) made it clear that macro segmentation is just a first stage toward the final
segment.
On the other side, Micro segmentation, the second stage, requires more comprehensive
information, knowledge and observation within each micro segment which is selected
from target macro segments. Micro segmentation focus the differences on specific
buying characteristics, decision making process, organizational innovativeness, buying
class, purchasing organization and decision making unit structure. The number of levels
or stages in the segmentation process depends on the available suitable information and
the purpose of the segmentation by itself. The most important criteria for industrial
market segmentation are based on macro segmentation. Macro segmentation initiates
the breakdown of the markets into more specific groups which ends up into micro
market segments.

16
Figure 5 below illustrates the categories of B2B market segmentation criteria.
Figure 5. B2B Market Segmentation criteria (modified from Jobber, 2003).
First, geographic location is a general characteristic of the market. However, it can be
used a basis for differentiating market strategies and purchasing power if it happens that
different location possess different purchasing power settings. For instance, in some
places there is less bureaucratic in their purchasing processes as compared to other
places. Thus, makes the criteria very important and calls for marketers and managers in
industrial markets to put more attention on it. Second, always large organizations have
greater potential orders and well developed processes and tailored needs. In many
companies such organizations with great orders are treated as a key account simply
because they buy in bulky. Bulky purchases ensure economies of scales and benefits
from discounts arrangements always associated with huge volume. However, this
requires strong sales forces personnel with strong negotiation skills since bulky
purchase demand more discount from the customer. Therefore, it is very important for
the managers to identify different companies according to their sizes. The size of the
company can be determined by revenue, sales figure, and number of employees, history
and reputation and other factors.
Third, Industry variable plays a big role in the macro segmentation. Some of the
products or services can be applied to different industries depending on the needs.
Therefore, industries differ by the requirements on product or services based on their
needs. For example Healthcare sector can be further segmented into hospitals,
dispensaries, pharmacies, health centers, private and government owned. Each segment
demands different products or services though they all fall under the umbrella of
Seg
men
tati
on
cate
go
ries
Micro segmentation
Macro segmentation
Purchase Organization
Decision making Unit
Decision making process
Choise criteria
Organization innovativeness
Geographic location
Organization size
Industry
17
Healthcare sector. Further division of the industry sector depends on the requirement of
the products or services and the specific need for a given segment.
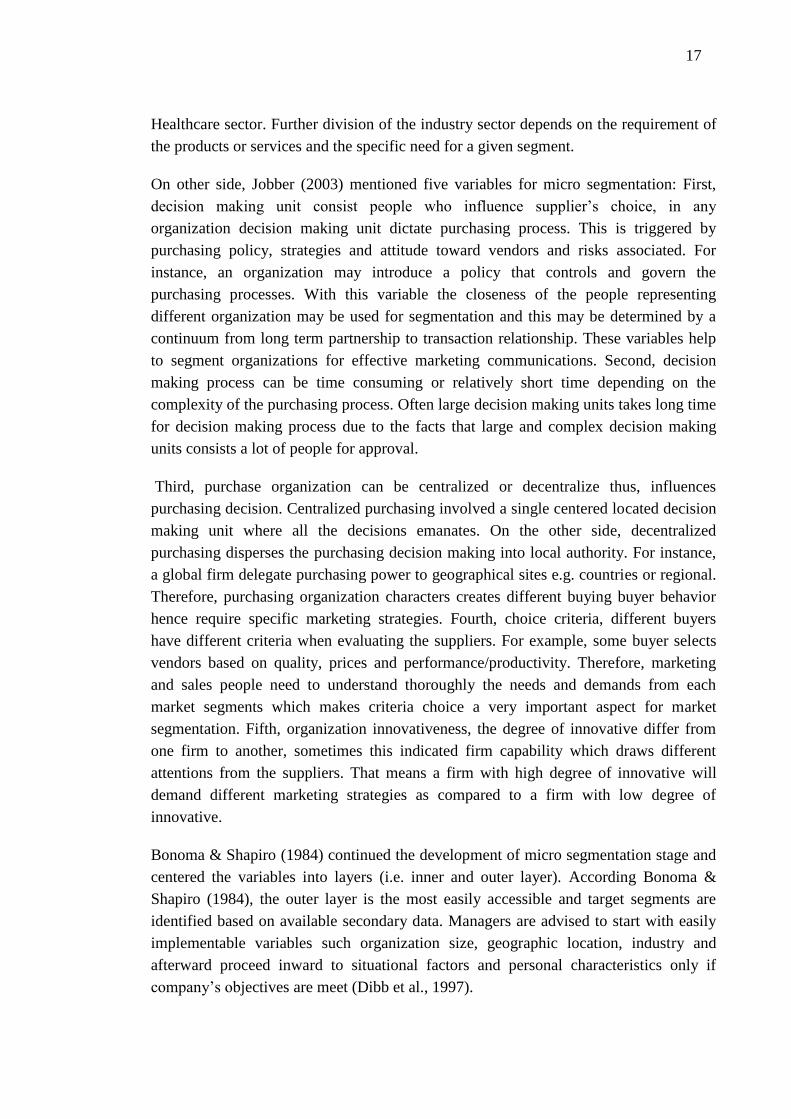
On other side, Jobber (2003) mentioned five variables for micro segmentation: First,
decision making unit consist people who influence supplier’s choice, in any
organization decision making unit dictate purchasing process. This is triggered by
purchasing policy, strategies and attitude toward vendors and risks associated. For
instance, an organization may introduce a policy that controls and govern the
purchasing processes. With this variable the closeness of the people representing
different organization may be used for segmentation and this may be determined by a
continuum from long term partnership to transaction relationship. These variables help
to segment organizations for effective marketing communications. Second, decision
making process can be time consuming or relatively short time depending on the
complexity of the purchasing process. Often large decision making units takes long time
for decision making process due to the facts that large and complex decision making
units consists a lot of people for approval.
Third, purchase organization can be centralized or decentralize thus, influences
purchasing decision. Centralized purchasing involved a single centered located decision
making unit where all the decisions emanates. On the other side, decentralized
purchasing disperses the purchasing decision making into local authority. For instance,
a global firm delegate purchasing power to geographical sites e.g. countries or regional.
Therefore, purchasing organization characters creates different buying buyer behavior
hence require specific marketing strategies. Fourth, choice criteria, different buyers
have different criteria when evaluating the suppliers. For example, some buyer selects
vendors based on quality, prices and performance/productivity. Therefore, marketing
and sales people need to understand thoroughly the needs and demands from each
market segments which makes criteria choice a very important aspect for market
segmentation. Fifth, organization innovativeness, the degree of innovative differ from
one firm to another, sometimes this indicated firm capability which draws different
attentions from the suppliers. That means a firm with high degree of innovative will
demand different marketing strategies as compared to a firm with low degree of
innovative.
Bonoma & Shapiro (1984) continued the development of micro segmentation stage and
centered the variables into layers (i.e. inner and outer layer). According Bonoma &
Shapiro (1984), the outer layer is the most easily accessible and target segments are
identified based on available secondary data. Managers are advised to start with easily
implementable variables such organization size, geographic location, industry and
afterward proceed inward to situational factors and personal characteristics only if
company’s objectives are meet (Dibb et al., 1997).
18
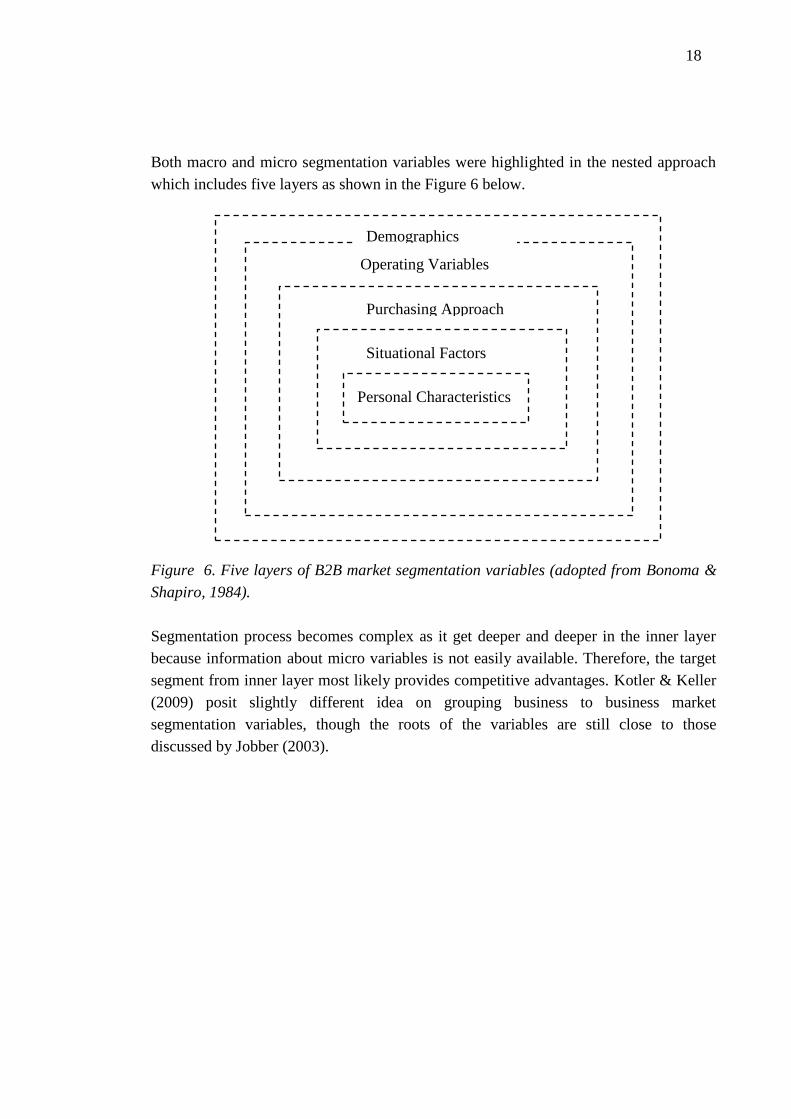
Both macro and micro segmentation variables were highlighted in the nested approach
which includes five layers as shown in the Figure 6 below.
Figure 6. Five layers of B2B market segmentation variables (adopted from Bonoma &
Shapiro, 1984).
Segmentation process becomes complex as it get deeper and deeper in the inner layer
because information about micro variables is not easily available. Therefore, the target
segment from inner layer most likely provides competitive advantages. Kotler & Keller
(2009) posit slightly different idea on grouping business to business market
segmentation variables, though the roots of the variables are still close to those
discussed by Jobber (2003).
Demographics
Operating Variables
Purchasing Approach
Situational Factors
Personal Characteristics

19
According to Kotler & Keller (2009), market segmentation variables are categorized
into the following categories as presented in Figure 7 below.
Figure 7. B2B Market segmentation variables (adopted from Kotler & Keller, 2009).
Although there are limited literature discussing B2B markets as compared to consumer
markets. Available literature have tried to explore different criteria that help in
segmenting industrial markets. Table 4 below combined ideas and criteria discussed by
both Kotler & Keller (2009) and Jobber (2003) and provides examples of variables that
can be used by managers in industrial markets.
Seg
men
tati
on
cate
go
ries
tion c
ateg
ori
es
Demographics
Operating variables
Purchasing Approaches
Situational factors
Personal Characteristics
Industry
Size
Location
Technology
User or Non-user
Customer Capability
Power structure
G. purchase policy
Purchasing criteria
Nature of relationship
Urgency
Specific Application
Size of order
Loyalty
Attitude to Risk
Buyer-Seller similarity
20
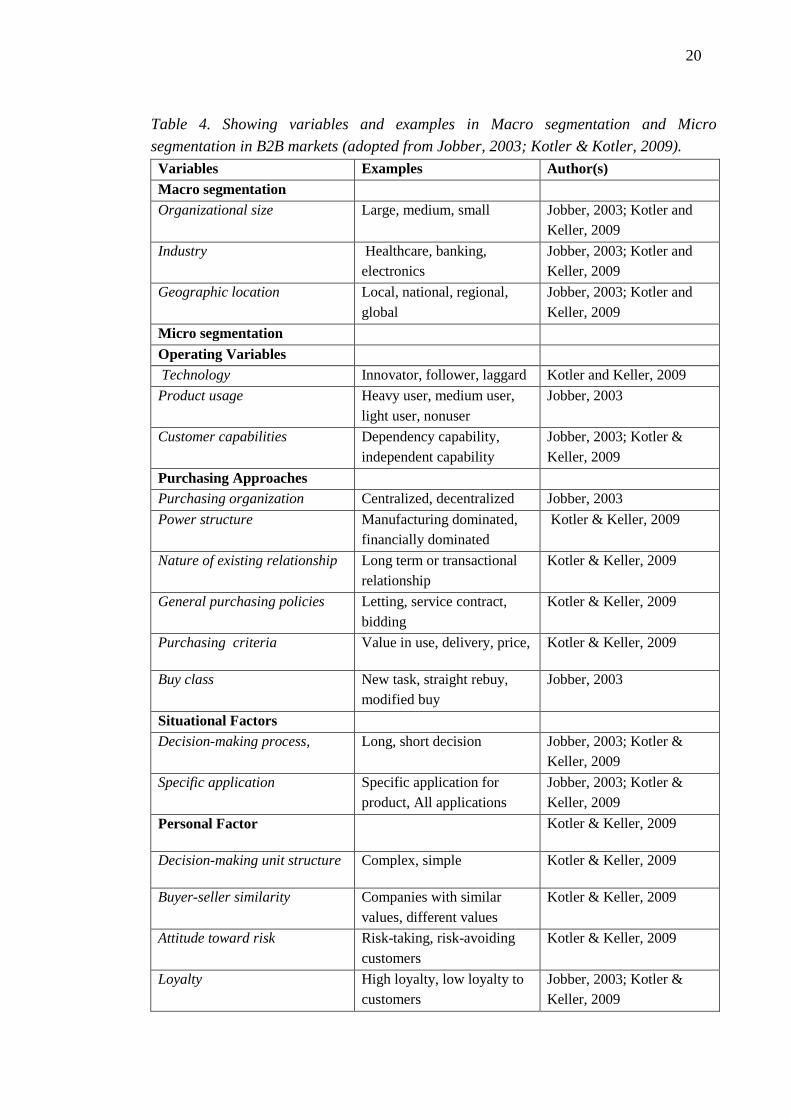
Table 4. Showing variables and examples in Macro segmentation and Micro
segmentation in B2B markets (adopted from Jobber, 2003; Kotler & Kotler, 2009).
Variables Examples Author(s)
Macro segmentation
Organizational size Large, medium, small Jobber, 2003; Kotler and
Keller, 2009
Industry Healthcare, banking,
electronics
Jobber, 2003; Kotler and
Keller, 2009
Geographic location Local, national, regional,
global
Jobber, 2003; Kotler and
Keller, 2009
Micro segmentation
Operating Variables
Technology Innovator, follower, laggard Kotler and Keller, 2009
Product usage Heavy user, medium user,
light user, nonuser
Jobber, 2003
Customer capabilities Dependency capability,
independent capability
Jobber, 2003; Kotler &
Keller, 2009
Purchasing Approaches
Purchasing organization Centralized, decentralized Jobber, 2003
Power structure Manufacturing dominated,
financially dominated
Kotler & Keller, 2009
Nature of existing relationship Long term or transactional
relationship
Kotler & Keller, 2009
General purchasing policies Letting, service contract,
bidding
Kotler & Keller, 2009
Purchasing criteria Value in use, delivery, price, Kotler & Keller, 2009
Buy class New task, straight rebuy,
modified buy
Jobber, 2003
Situational Factors
Decision-making process,
Long, short decision Jobber, 2003; Kotler &
Keller, 2009
Specific application Specific application for
product, All applications
Jobber, 2003; Kotler &
Keller, 2009
Personal Factor Kotler & Keller, 2009
Decision-making unit structure Complex, simple Kotler & Keller, 2009
Buyer-seller similarity Companies with similar
values, different values
Kotler & Keller, 2009
Attitude toward risk Risk-taking, risk-avoiding
customers
Kotler & Keller, 2009
Loyalty High loyalty, low loyalty to
customers
Jobber, 2003; Kotler &
Keller, 2009
21
The list of criteria discussed in Table 4 above helps to identify market homogeneity
from heterogeneity groups. Different segmentation criteria are used to provide more
information about the market. However, the challenge to managers is on how to identify
different market segments that have not been identified by competing companies.
Market segmentation process ends up with several market segments. However, neither
big companies nor small companies have enough resources to explore and exploit
market potential in all the segments. Smart companies select few manageable segments
that align with capabilities and objectives of the company.
2.3. Market Targeting
Market segmentation process has played an important role in marketing activities
particularly on better market targeting and positioning decisions. Because customers are
different has shown in the previous Section, no any organization can have resources and
capabilities to serve all customer segments effectively at once. Therefore, companies
narrow down their segments choices in order to be at a competitive edge (Croft, 1994).
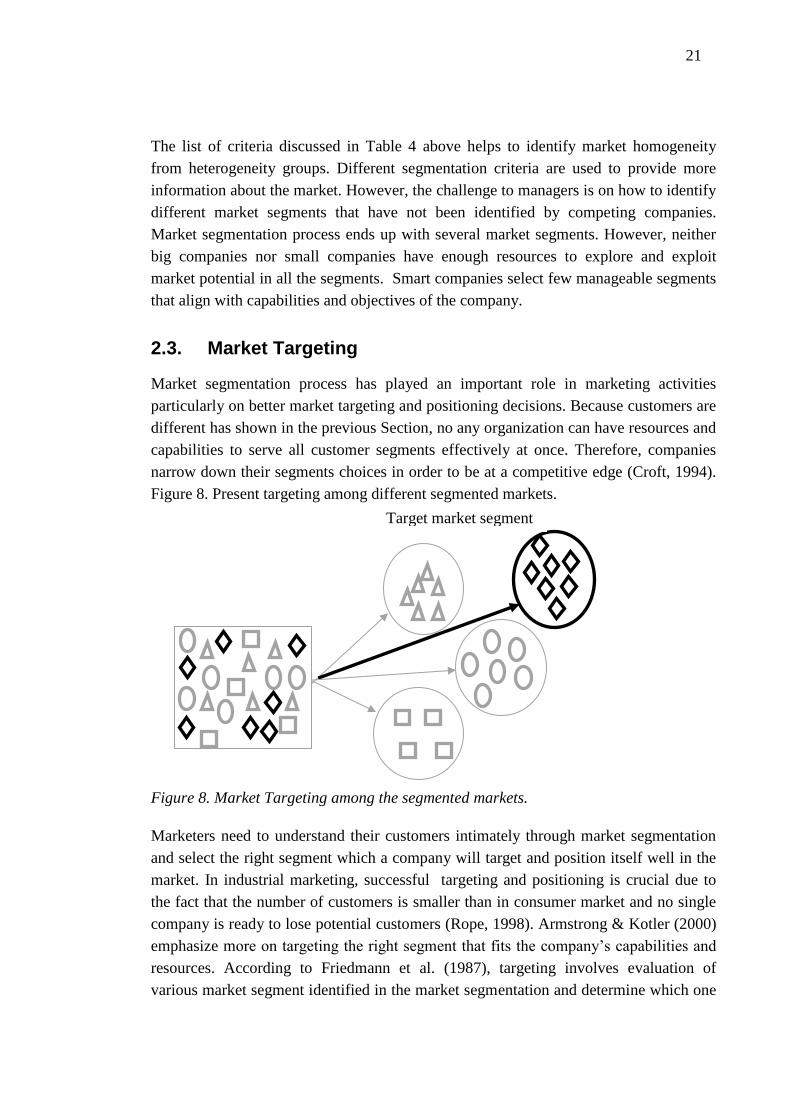
Figure 8. Present targeting among different segmented markets.
Figure 8. Market Targeting among the segmented markets.
Marketers need to understand their customers intimately through market segmentation
and select the right segment which a company will target and position itself well in the
market. In industrial marketing, successful targeting and positioning is crucial due to
the fact that the number of customers is smaller than in consumer market and no single
company is ready to lose potential customers (Rope, 1998). Armstrong & Kotler (2000)
emphasize more on targeting the right segment that fits the company’s capabilities and
resources. According to Friedmann et al. (1987), targeting involves evaluation of
various market segment identified in the market segmentation and determine which one
Target market segment
22
a firm can compete for. Evaluation always is based on economic attractiveness,
resources and capability as well as company’s objective (Kotler, 2003).
In industrial market is it better to do business with firm for a long time instead of falling
into transactional attractive deal. Long term relationship and loyalty most likely turns to
profitability in the future (Hunter, 1997). As it was discussed in Section 2.2 of this
Chapter, the criteria for assessing attractiveness of the target market segment vary
depending on the targeting approach employed by particular organization. Kotler (2003)
proposed five selection patterns that can be used to evaluate different market segments.
The following are the list of five target marketing approaches:
Single segment concentration
Selective specialization
Product specialization
Market specialization
First, in single segment concentration, a firm focuses on serving one specific market
segment. This approach enable a firm to acquire extensive knowledge on segment’s
needs and achieves a strong presence in the chosen market segment. Concentrating on
single market ensures cost savings in different marketing activities such as distribution
and promotions. However, single segment concentration is vulnerable to competition
threats as for new entrant company might erode the market share of the existing
company.
Second, selective specialization put efforts on attractive several segments depending on
the company’s resources and capability. Selective specialization limits the threat of
competition by diversifying and serving several segments which provides a wide range
of switching options in case of stiff competition. Third, in product specialization
companies manufacture products that can be customized to different customer groups
and sell them to several market segments. Thus, there is a possibility to make a strong
brand image. Fourth, in market specialization a firm finds a way of serving different
needs arising from the same customer market segments (Kotler, 2003). Finally, full
market coverage approach tries to serve all customer groups with its product portfolio
(Kotler, 2003).
2.4. Positioning
Positioning has been regarded as one of the most difficulty concept in marketing (Bhat
et al., 1998). In every study on the concept has added contradictions which have
contributed to misunderstandings between scholars and practitioners due to lack of
23
mutual agreement on the exact definition of positioning (Gabriel-Ritter, 1993; Rigger,
1995). Therefore, no single definition has been anniversary accepted taking into
consideration that the clear boundary of the concept is yet to be set (Blankson &
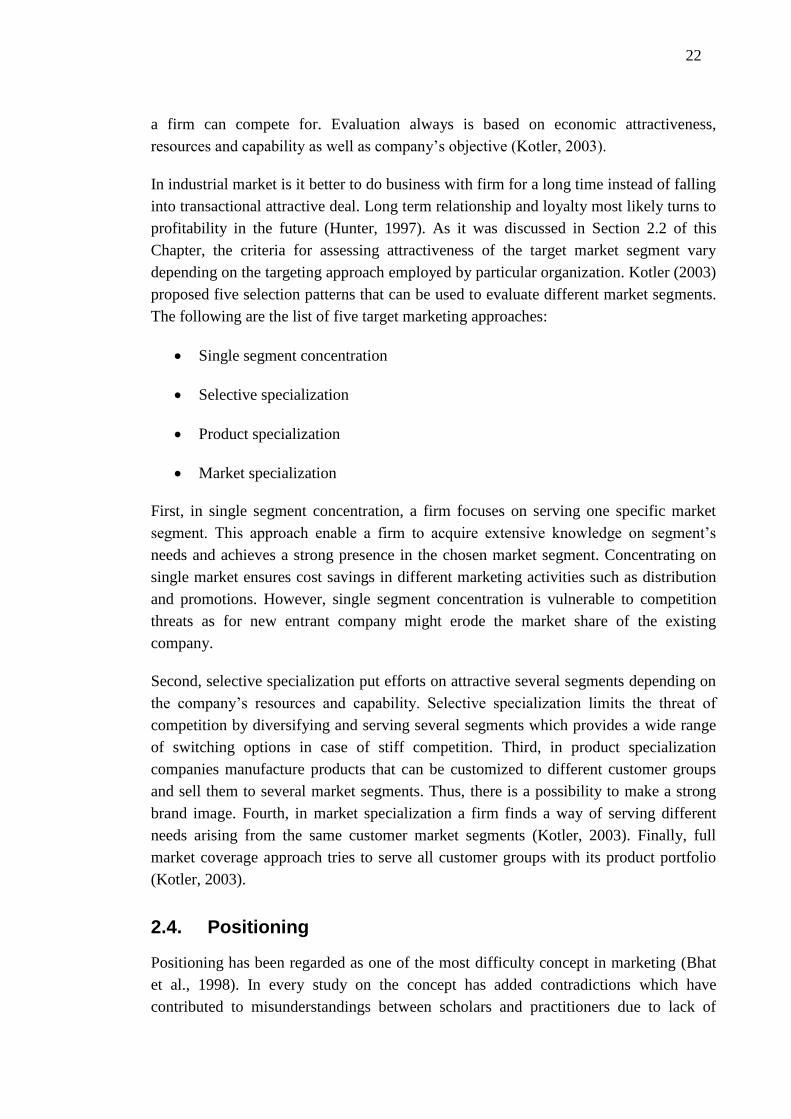
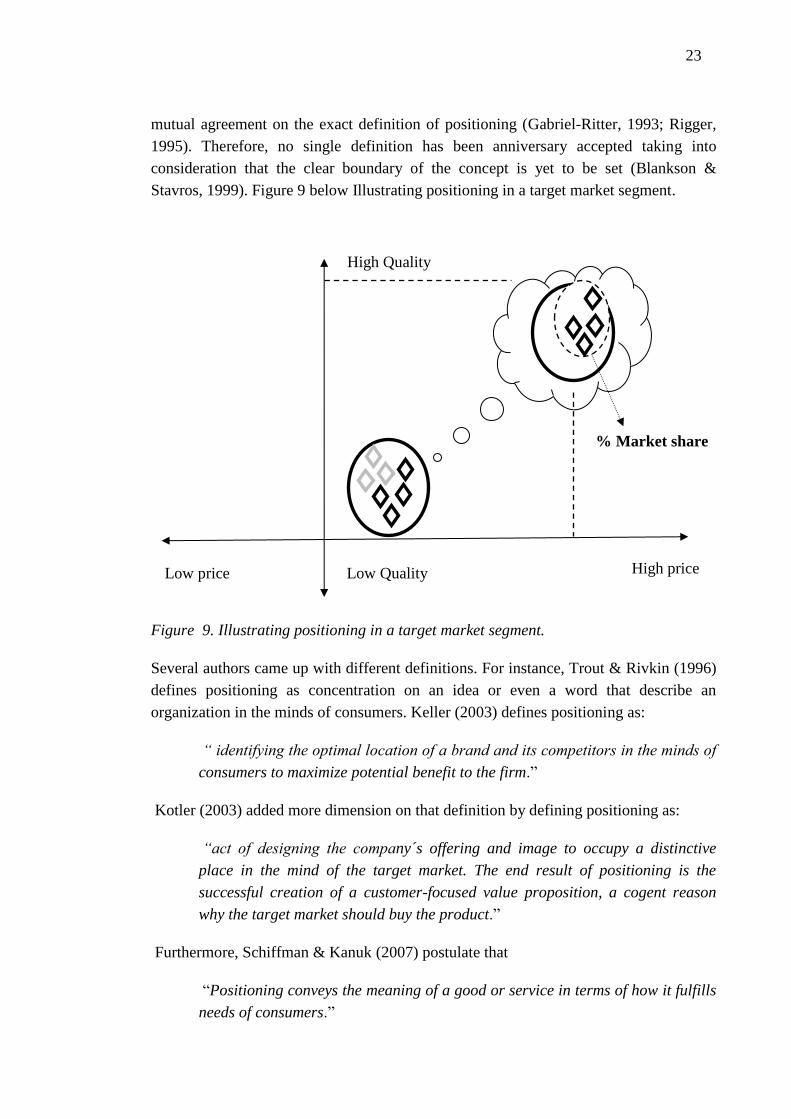
Stavros, 1999). Figure 9 below Illustrating positioning in a target market segment.
Figure 9. Illustrating positioning in a target market segment.
Several authors came up with different definitions. For instance, Trout & Rivkin (1996)
defines positioning as concentration on an idea or even a word that describe an
organization in the minds of consumers. Keller (2003) defines positioning as:
“ identifying the optimal location of a brand and its competitors in the minds of
consumers to maximize potential benefit to the firm.”
Kotler (2003) added more dimension on that definition by defining positioning as:
“act of designing the company´s offering and image to occupy a distinctive
place in the mind of the target market. The end result of positioning is the
successful creation of a customer-focused value proposition, a cogent reason
why the target market should buy the product.”
Furthermore, Schiffman & Kanuk (2007) postulate that
“Positioning conveys the meaning of a good or service in terms of how it fulfills
needs of consumers.”
High price Low price
High Quality
Low Quality
% Market share
24
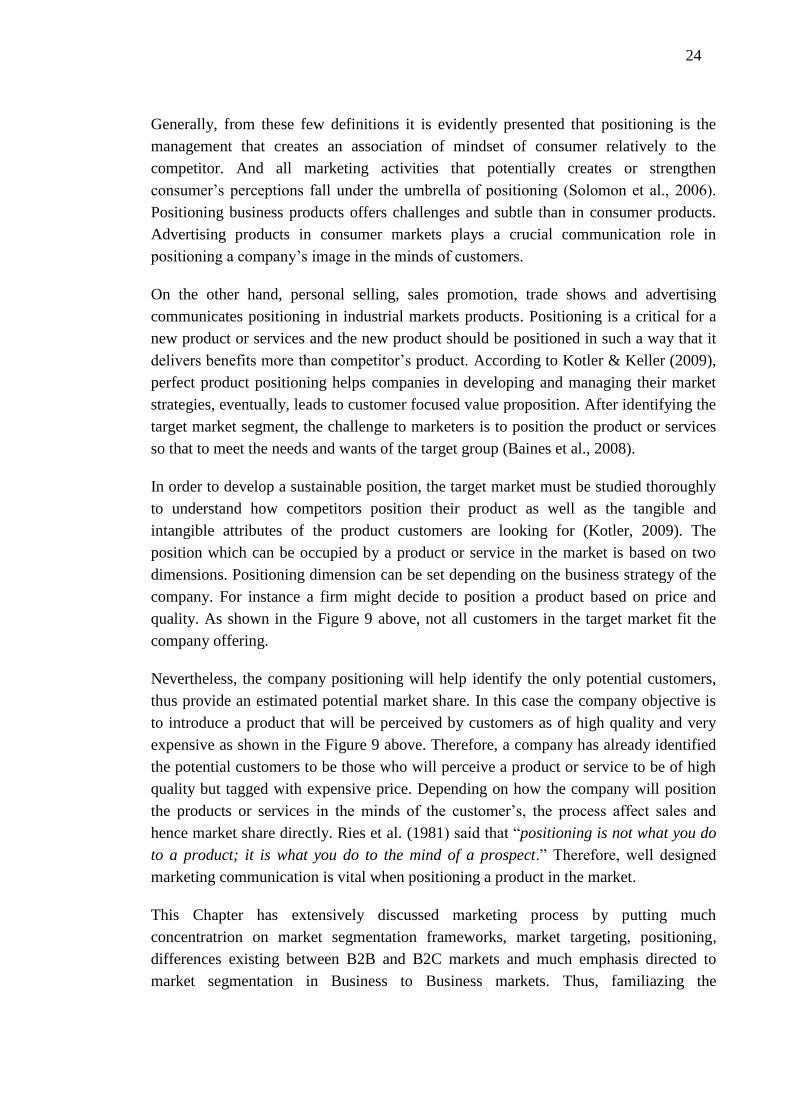
Generally, from these few definitions it is evidently presented that positioning is the
management that creates an association of mindset of consumer relatively to the
competitor. And all marketing activities that potentially creates or strengthen
consumer’s perceptions fall under the umbrella of positioning (Solomon et al., 2006).
Positioning business products offers challenges and subtle than in consumer products.
Advertising products in consumer markets plays a crucial communication role in
positioning a company’s image in the minds of customers.
On the other hand, personal selling, sales promotion, trade shows and advertising
communicates positioning in industrial markets products. Positioning is a critical for a
new product or services and the new product should be positioned in such a way that it
delivers benefits more than competitor’s product. According to Kotler & Keller (2009),
perfect product positioning helps companies in developing and managing their market
strategies, eventually, leads to customer focused value proposition. After identifying the
target market segment, the challenge to marketers is to position the product or services
so that to meet the needs and wants of the target group (Baines et al., 2008).
In order to develop a sustainable position, the target market must be studied thoroughly
to understand how competitors position their product as well as the tangible and
intangible attributes of the product customers are looking for (Kotler, 2009). The
position which can be occupied by a product or service in the market is based on two
dimensions. Positioning dimension can be set depending on the business strategy of the
company. For instance a firm might decide to position a product based on price and
quality. As shown in the Figure 9 above, not all customers in the target market fit the
company offering.
Nevertheless, the company positioning will help identify the only potential customers,
thus provide an estimated potential market share. In this case the company objective is
to introduce a product that will be perceived by customers as of high quality and very
expensive as shown in the Figure 9 above. Therefore, a company has already identified
the potential customers to be those who will perceive a product or service to be of high
quality but tagged with expensive price. Depending on how the company will position
the products or services in the minds of the customer’s, the process affect sales and
hence market share directly. Ries et al. (1981) said that “positioning is not what you do
to a product; it is what you do to the mind of a prospect.” Therefore, well designed
marketing communication is vital when positioning a product in the market.
This Chapter has extensively discussed marketing process by putting much
concentratrion on market segmentation frameworks, market targeting, positioning,
differences existing between B2B and B2C markets and much emphasis directed to
market segmentation in Business to Business markets. Thus, familiazing the

25
managers/entrepreneurs with good business practices of knowing the customer’s needs
wants and demands. The next Chapter discusses Mobile services.
26
3. MOBILE SERVICES
3.1. The S-Curve and Technology Discontinuities
In recent decades, the rapid advancement of technology has created demands for
thorough technological analysis across all the industry. Technology performance
improvement is now regarded as competitive weapon in the market. Therefore, the need
for integrating technological analysis in the strategy designing and planning has been
brought into attention (Nieto et al., 1998). Over many years S-curve has been at a core
of many management science concepts. Technology’s performance is sketched in S-
curve shape in the process of monitoring performance improvement over life time
(Ayres, 1994 in Schilling, 2009). S-curve has been often used by managers to
demonstrate the existing tension between potential growth and saturation effects of the
technology. Thus, S-curve has dominated other technological performance analysis
models in the literature (Nieto et al., 1998).
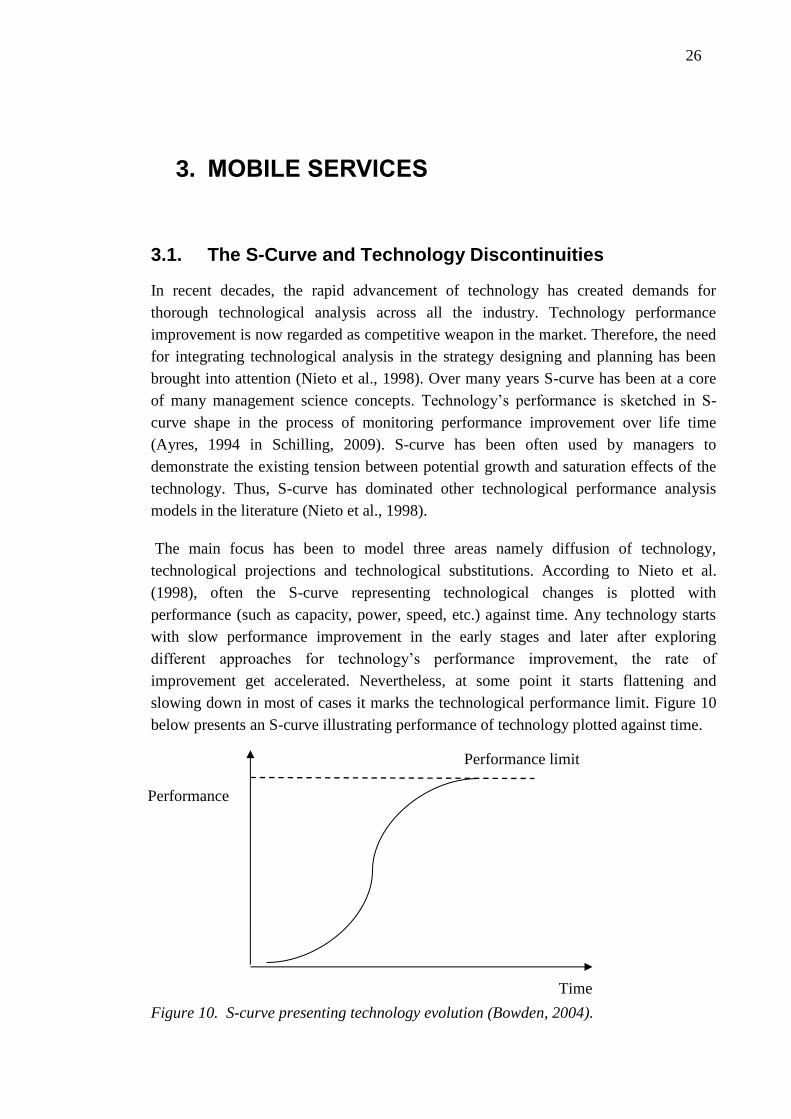
The main focus has been to model three areas namely diffusion of technology,
technological projections and technological substitutions. According to Nieto et al.
(1998), often the S-curve representing technological changes is plotted with
performance (such as capacity, power, speed, etc.) against time. Any technology starts
with slow performance improvement in the early stages and later after exploring
different approaches for technology’s performance improvement, the rate of
improvement get accelerated. Nevertheless, at some point it starts flattening and
slowing down in most of cases it marks the technological performance limit. Figure 10
below presents an S-curve illustrating performance of technology plotted against time.
Figure 10. S-curve presenting technology evolution (Bowden, 2004).
Performance
Time
Performance limit
27
The S-curve has been a descriptive tool for origin and evolution of technologically
discontinuous and radical innovations. This process suggests that technology
performance moves along an S-curve until technology limitations occurs (Rossana,
2001). Technology evolution takes places in different phases and the changes occur
either continuously or discontinuously. According to Dedehayir (2011), although the
two evolution process differs, but they are not mutually exclusive. Therefore, it is most
likely that technology evolves over period of time in a slow and gradual style while
sometimes it evolves radically. Weather a technological change is regarded as
continuous or discontinuous it depends on the time it takes to obsolete the old
technology. Anderson et al. (1990) state that technology which evolves in incremental
changes without breakthrough is regarded as continuously changing technology.
According to Anderson et al. (1991), technological discontinuities can be defined as
“those rare, unpredictable innovations which advance a relevant technological frontier
by an order-of magnitude and which involve fundamentally different product or process
design”.
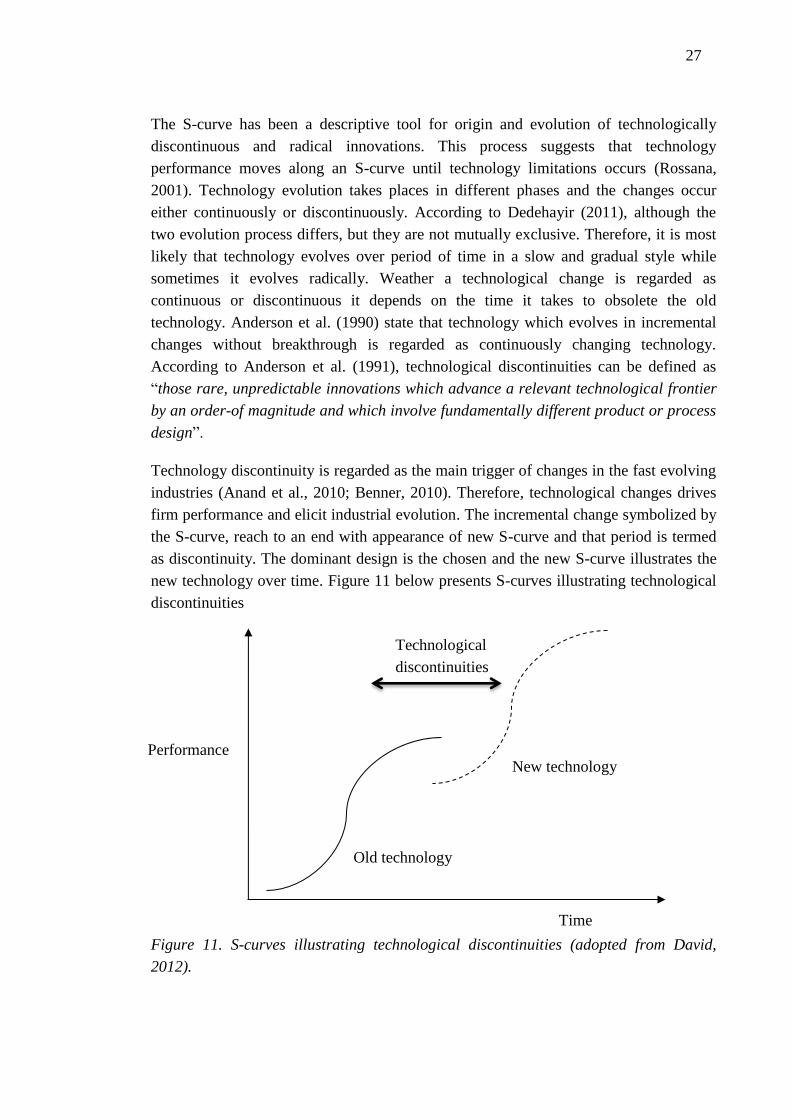
Technology discontinuity is regarded as the main trigger of changes in the fast evolving
industries (Anand et al., 2010; Benner, 2010). Therefore, technological changes drives
firm performance and elicit industrial evolution. The incremental change symbolized by
the S-curve, reach to an end with appearance of new S-curve and that period is termed
as discontinuity. The dominant design is the chosen and the new S-curve illustrates the
new technology over time. Figure 11 below presents S-curves illustrating technological
discontinuities
Figure 11. S-curves illustrating technological discontinuities (adopted from David,
2012).
Performance
Time
Technological
discontinuities
New technology
Old technology
28
Therefore, it is possible to observe a series of S-curves which signifies improvement of
a particular technological performance parameter (Dedehayir, 2011). The path of the
technological life cycle is always unpredictable and it may be prolonged by sustaining
innovations or disrupted by emergence of new technology. Disruptive technology
comes up with a new technology which out-performs the existing technology. Thus,
presents benefits to customers and provides performance improvement rapidly (Dalum
et al., 2002).
3.2. Evolution of Mobile Technology
Evolution of mobile technology has been regarded as the next wave for Information
Technology revolution. Mobile technology includes technological for connectivity
infrastructure and mobile devices. Technological infrastructure such as Wireless
Application Protocol (WAP), Bluetooth, General Package Radio Services (GPRS) and
mobile devices includes mobile phone, PDA, Laptops computer (Nah et al., 2005). By
the convergence of computing and internet into wireless networks, mobile technology
enables users to have information and application access from anytime, anywhere and
conveniently. Thus, provide flexibility in communication and information sharing.
(Davis, 2002; Sheng, 2004). Any technology as it evolves follow technological life
cycle. Over the last decades, development of mobile technologies has evolved and
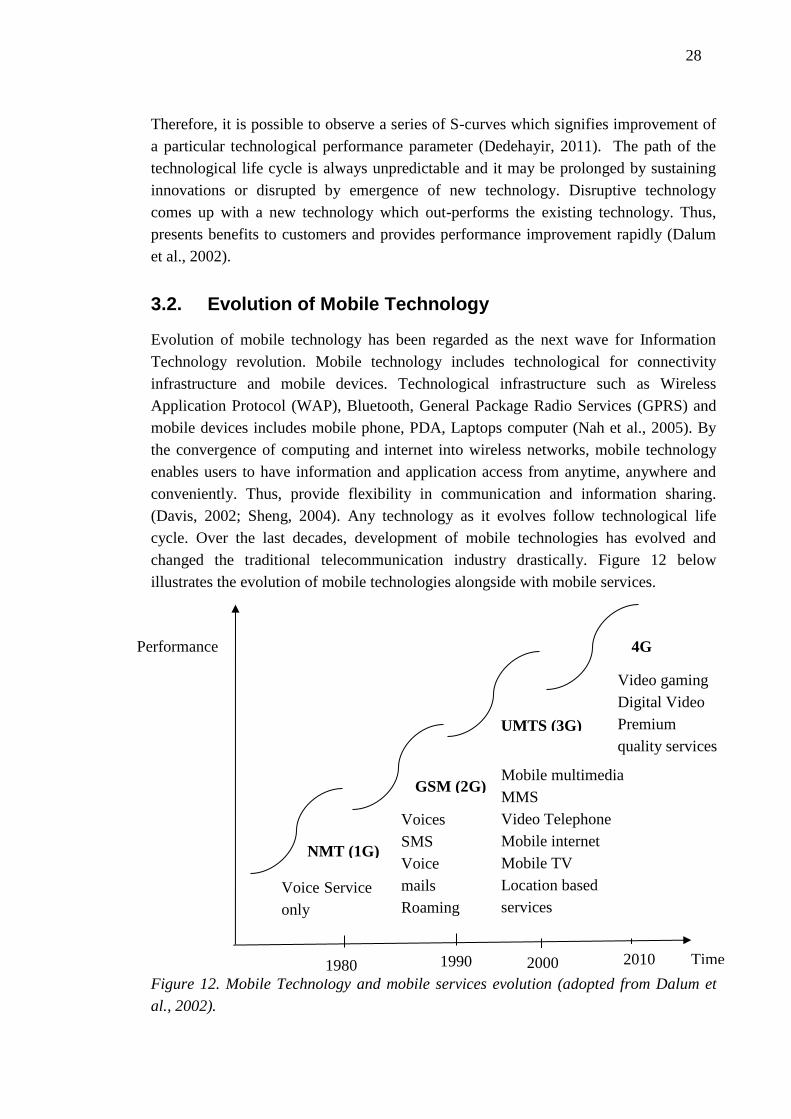
changed the traditional telecommunication industry drastically. Figure 12 below
illustrates the evolution of mobile technologies alongside with mobile services.
Figure 12. Mobile Technology and mobile services evolution (adopted from Dalum et
al., 2002).
Performance
Time
NMT (1G)
GSM (2G)
UMTS (3G)
4G
Voice Service
only
Voices
SMS
Voice
mails
Roaming
Mobile multimedia
MMS
Video Telephone
Mobile internet
Mobile TV
Location based
services
1980 1990 2000 2010
Video gaming
Digital Video
Premium
quality services
29
The rate of diffusion of new technologies has influenced the fast adoption of variety of
mobile services. Consequently, some studies has concentrated on the adoption of
technology and mobile services in the marketplace (Kim et al., 2007) while others
focused on technological progress (Pagani, 2004). Until now there are four generations
of mobile communication networks. The remarkable changes have occurred from the
first generation (1G) to fourth generation (4G) in mobile communication industry. First
generation (1G) consisted analogy systems in which Nordic Mobile Telephone (NMT)
was successful in the market. Wireless telephone technology was analogy cell phone
that was launched in 1980’s. The main services provided in this generation were voice
calls and 1G network had a low traffic capacity, unreliable, poor quality voice and
security uncertainties. This cycle lasted for almost a decade and within this period there
were incremental improvements such as from NMT 450 to NMT 900 MHz (Dalum et
al., 2002). Emergence of GSM technology in 1990 replaced NMT particularly in
Europe.
According to Bower & Christensen (1995), GSM shifted the mobile communication
technology from analog to digital; this technological disruption caused the change of
infrastructure in the whole industry. GSM become a standard technology, eventually
accelerated the mass adoption of mobile phone and fast growth of the industry. Not only
GSM was disrupter to NMT but also the fixed line telephone and satellites telephone
networks as well as telecom services provision. However, Gruber & Verboven (2001)
postulate that “the fixed network is largely viewed as a complement to mobile phones.”
This argument was endorsed by Ahn & Lee (1999) with a conclusion that
“the number of fixed lines per person has a positive influence on the probability of
mobile telephone subscription.”
This can also be supported by the fact that until now the fixed line telephone is still in
use specifically in the offices, although it has lost popularity significantly. GSM
technology engineered the rise of mobile services such as SMS, emails, voice mails and
others. GSM technology life cycle has passed into several incremental improvements.
For instance, in 1996 European Telecommunication Standards Institutes decided to
upgrade 2G to 2G + which already were associated with some features of 3G. These
features include General Packet Radio Services (GPRS) and Enhanced Data Rates for
GSM Evolution (EDGE) (Kaaranen et al. 2001). The data rates in 2G+ are
approximated to be 384kb/s. During evolution of 2G to 3G several wireless systems
such as WLAN, GPRS, and Bluetooth were developed. These systems were designed
independently and purposeful for different data rates and users (Hui & Yeung, 2003).
Third generation 3G was launched in 2000’s and it offers 2 Mb/s data rates depending
on mobility. 3G provides multimedia services such as video communication, Mobile
30
internet, Mobile TV and offers high speed internet access and ensure reliability (Toshio
et al., 2005). The 3G systems support all services such as WAP and GPRS.
There are recent releases of 3G which denotes 3.5G and 3.75G, these incremental
improvements provides mobile broadband and high data rates to Smartphone and
mobile modem to laptop computers. In the fourth generation (4G), the successors of 3G
improve the date rates and solve the problems related to 3G. Fourth generation means
different things to different people. There high expectation from 4G especially on high
capacity data rates and new mobile internetworking and introduction of new wireless
technologies (Gazis et al., 2003). 4G systems provide mobile ultra- broadband internet
access. 4G supports applications such as mobile web access, IP Telephone, gaming
services, video conference and high definition mobile Television. Fourth generation is
expected to broadly integrate wireless solution and support global mobility and
customized personal services (Gazis et al., 2003).
Parallel evolution of mobile terminals, mobile capacity and broadband network has
promised mobile device user internet experience that surpasses home based internet
connection (Kimmel, 2012). As shown in Appendix 2, evolution of mobile
communication indicates that main emphasize is based on integrating most of wireless
solutions and come up with a single standard which support the global mobility. Not
only common standard but also improved data rates transmission which enables
multimedia contents to be shared across different mobile devices. Evolution of mobile
communication technologies has influenced the advancement of other technologies such
mobile services technologies, mobile services as well as mobile devices (i.e. from basic
GSM phone to Smartphone). Advancement of mobile technologies contributes to the
adoption of mobile services.
3.3. Mobile Services Characteristics
The term Service covers a heterogeneous range of intangible products and activities that
are difficult to sum up within a simple definition. However, several scholars have
tagged differently meaning on service depending on the context. Services have been
studied in various fields such as marketing (Lovelock & Gummesson, 2004; Gronroos,
2007) and operation management (Johnson et al., 2008). Recently, service has emerged
as a cross disciplinary field that drive innovation, competition and quality of life
(Vuolle, 2011). According to Lovelock & Wirtz (2007), services refers to economic
activities offered by one party to another, most commonly employing time based
performances to bring about desired results in recipients or other assets for which
purchasers have responsibility. Kotler et al. (2002) added that services are intangible
and does not result to ownership of anything. Teboul (2006) postulates that service is a
front stage in which delivery involves a contract, an interaction between the service
provider and the customer. Therefore, customers are integrated in the service delivery as
31
they are transformed or simply interacting during the transaction. Thus, service can be
seen as a perspective on value creation by the customer especially value in use
(Sandström, 2008). Gronroos (2000); Kotler & Keller (2006); Lovelock & Wirtz (2007)
posit four attributes that characterize the nature of services: inseparability,
heterogeneity, intangibility and perishability.
Mobile data services business is now driving the competitive pressure with the influence
of increasing individualized customer needs and growing customer demands that
enforces changes in competitive environment practically in all business sectors. The
future of mobile communication swings to data services as voice services are edging to
saturation (Soininen, 2005; Calsson & Walden, 2006). According to Hans Vestberg,
Ericsson President and CEO
“This is a significant milestone with some 400 million mobile broadband
subscriptions now generating more data traffic than the voice traffic from the
total 4.6 billion mobile subscriptions around the world." [March 23 2009].
Recent convergence between telecommunication and mobile technologies has put
mobility on services. Yet there is no conceptual agreement on the term “Mobile
Services”. Therefore, the term Mobile services can be defined in different ways
depending on the context (Pihlstrom, 2008). Nordman et al. (2003) defined mobile
service as “Something that content provider can charge the mobile user for taking part
in”. Pihlstrom (2008) defined mobile service as any service that can be retrieved via
mobile device and is delivered through the interaction between organization and
customer. In other words mobile service is any service that end user with a mobile
device receives from a network operator or service provider. In addition, Mobile
services offer real time and on demand access to contents which provides solution to
customer’s problems, needs, add value and create customer satisfaction. (Kleijnen et al.,
2007; Vuolle, 2011)
These definitions draw attentions on the mobility and service characteristics in the
interaction between service provider and the customer aiming at creating customer
value to end user or customer. Mobile services can be data or voice based
communication that provide value added services, content and application accessed by
user through mobile device (Componovo & Pigneur, 2003). In a summary, mobile
services can be defined as any service ranging from private to public service that is
provided via mobile devices which enables a customer to access that service at any
time, at anyplace and conveniently.
As stated earlier in this research study, mobile services business is a young promising
industry which needs to be researched. However, few researchers have invested their
time and resources on studying the nature and characteristics of mobile services.
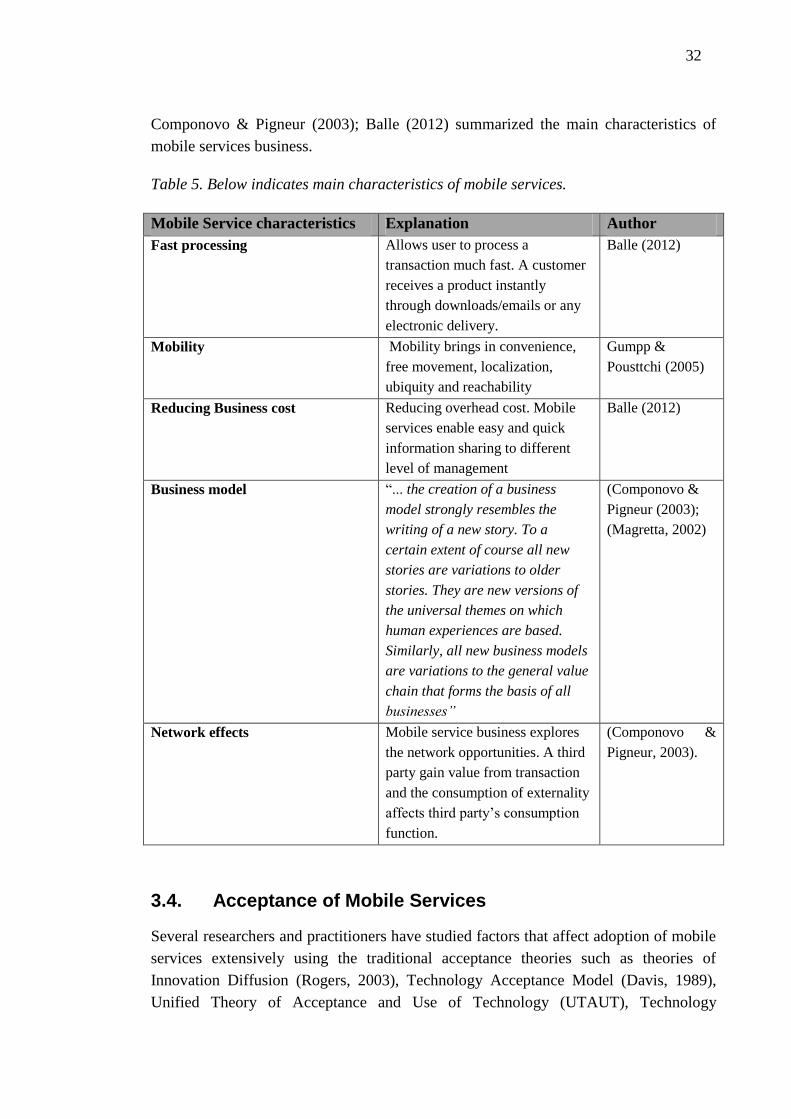
32
Componovo & Pigneur (2003); Balle (2012) summarized the main characteristics of
mobile services business.
Table 5. Below indicates main characteristics of mobile services.
Mobile Service characteristics Explanation Author
Fast processing Allows user to process a
transaction much fast. A customer
receives a product instantly
through downloads/emails or any
electronic delivery.
Balle (2012)
Mobility Mobility brings in convenience,
free movement, localization,
ubiquity and reachability
Gumpp &
Pousttchi (2005)
Reducing Business cost Reducing overhead cost. Mobile
services enable easy and quick
information sharing to different
level of management
Balle (2012)
Business model “... the creation of a business
model strongly resembles the
writing of a new story. To a
certain extent of course all new
stories are variations to older
stories. They are new versions of
the universal themes on which
human experiences are based.
Similarly, all new business models
are variations to the general value
chain that forms the basis of all
businesses”
(Componovo &
Pigneur (2003);
(Magretta, 2002)
Network effects Mobile service business explores
the network opportunities. A third
party gain value from transaction
and the consumption of externality
affects third party’s consumption
function.
(Componovo &
Pigneur, 2003).
3.4. Acceptance of Mobile Services
Several researchers and practitioners have studied factors that affect adoption of mobile
services extensively using the traditional acceptance theories such as theories of
Innovation Diffusion (Rogers, 2003), Technology Acceptance Model (Davis, 1989),
Unified Theory of Acceptance and Use of Technology (UTAUT), Technology
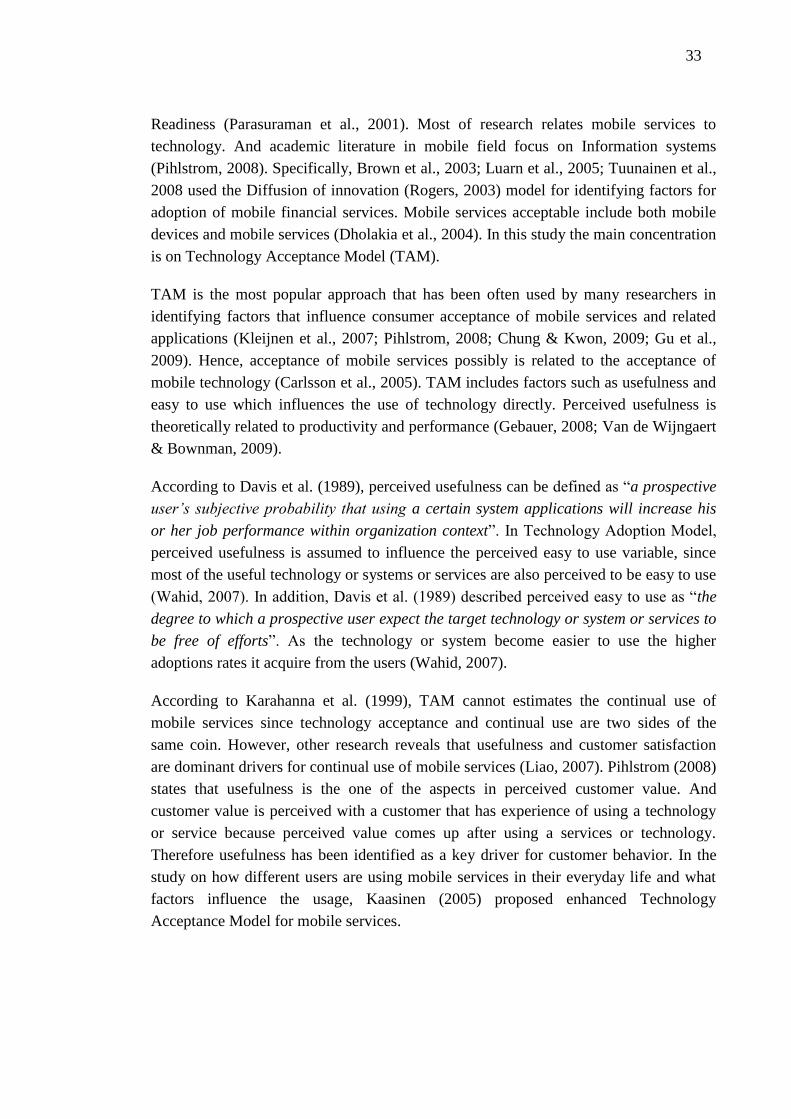
33
Readiness (Parasuraman et al., 2001). Most of research relates mobile services to
technology. And academic literature in mobile field focus on Information systems
(Pihlstrom, 2008). Specifically, Brown et al., 2003; Luarn et al., 2005; Tuunainen et al.,
2008 used the Diffusion of innovation (Rogers, 2003) model for identifying factors for
adoption of mobile financial services. Mobile services acceptable include both mobile
devices and mobile services (Dholakia et al., 2004). In this study the main concentration
is on Technology Acceptance Model (TAM).
TAM is the most popular approach that has been often used by many researchers in
identifying factors that influence consumer acceptance of mobile services and related
applications (Kleijnen et al., 2007; Pihlstrom, 2008; Chung & Kwon, 2009; Gu et al.,
2009). Hence, acceptance of mobile services possibly is related to the acceptance of
mobile technology (Carlsson et al., 2005). TAM includes factors such as usefulness and
easy to use which influences the use of technology directly. Perceived usefulness is
theoretically related to productivity and performance (Gebauer, 2008; Van de Wijngaert
& Bownman, 2009).
According to Davis et al. (1989), perceived usefulness can be defined as “a prospective
user’s subjective probability that using a certain system applications will increase his
or her job performance within organization context”. In Technology Adoption Model,
perceived usefulness is assumed to influence the perceived easy to use variable, since
most of the useful technology or systems or services are also perceived to be easy to use
(Wahid, 2007). In addition, Davis et al. (1989) described perceived easy to use as “the
degree to which a prospective user expect the target technology or system or services to
be free of efforts”. As the technology or system become easier to use the higher
adoptions rates it acquire from the users (Wahid, 2007).
According to Karahanna et al. (1999), TAM cannot estimates the continual use of
mobile services since technology acceptance and continual use are two sides of the
same coin. However, other research reveals that usefulness and customer satisfaction
are dominant drivers for continual use of mobile services (Liao, 2007). Pihlstrom (2008)
states that usefulness is the one of the aspects in perceived customer value. And
customer value is perceived with a customer that has experience of using a technology
or service because perceived value comes up after using a services or technology.
Therefore usefulness has been identified as a key driver for customer behavior. In the
study on how different users are using mobile services in their everyday life and what
factors influence the usage, Kaasinen (2005) proposed enhanced Technology
Acceptance Model for mobile services.
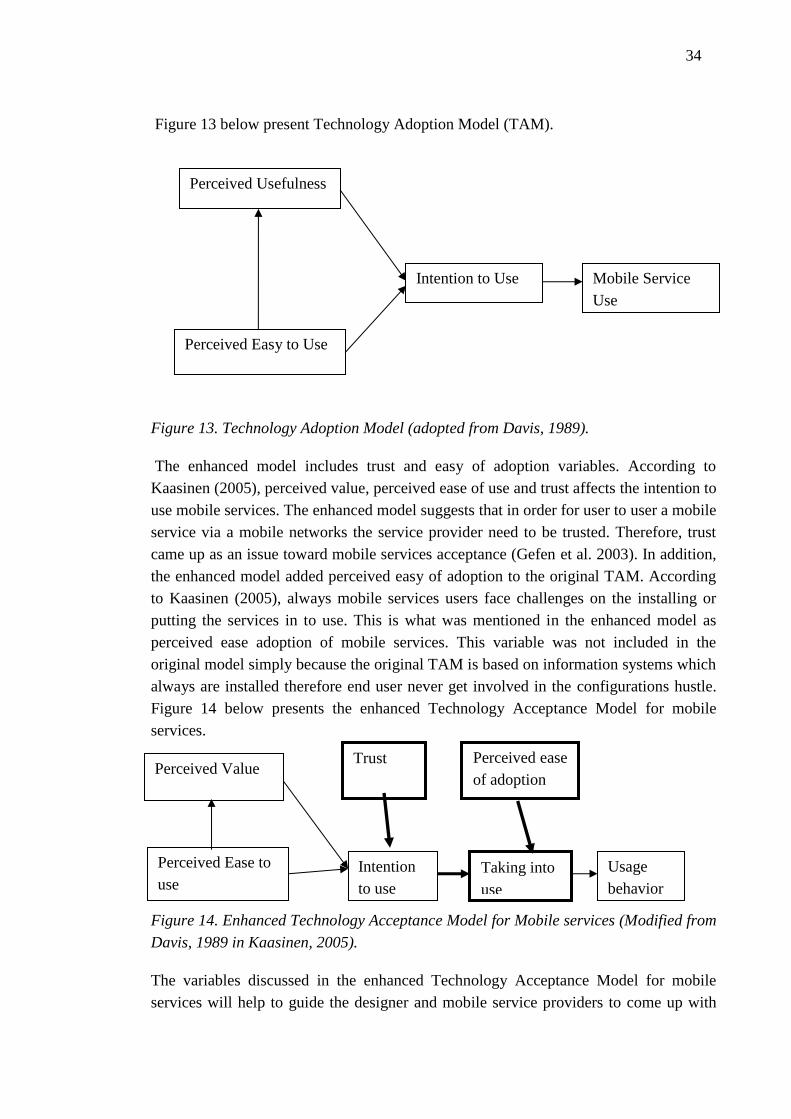
34
Figure 13 below present Technology Adoption Model (TAM).
Figure 13. Technology Adoption Model (adopted from Davis, 1989).
The enhanced model includes trust and easy of adoption variables. According to
Kaasinen (2005), perceived value, perceived ease of use and trust affects the intention to
use mobile services. The enhanced model suggests that in order for user to user a mobile
service via a mobile networks the service provider need to be trusted. Therefore, trust
came up as an issue toward mobile services acceptance (Gefen et al. 2003). In addition,
the enhanced model added perceived easy of adoption to the original TAM. According
to Kaasinen (2005), always mobile services users face challenges on the installing or
putting the services in to use. This is what was mentioned in the enhanced model as
perceived ease adoption of mobile services. This variable was not included in the
original model simply because the original TAM is based on information systems which
always are installed therefore end user never get involved in the configurations hustle.
Figure 14 below presents the enhanced Technology Acceptance Model for mobile
services.
Figure 14. Enhanced Technology Acceptance Model for Mobile services (Modified from
Davis, 1989 in Kaasinen, 2005).
The variables discussed in the enhanced Technology Acceptance Model for mobile
services will help to guide the designer and mobile service providers to come up with
Perceived Usefulness
Perceived Easy to Use
Intention to Use Mobile Service
Use
Perceived Value Trust Perceived ease
of adoption
Perceived Ease to
use Intention
to use
Taking into
use
Usage
behavior
35
services that suit the customer requirement hence improve adoption rate of mobile
services. Eventually, increases market share and revenue as well as positioning a
company at a competitive edge.
This Chapter has extensively discussed the mobile services the main emphasis on
technological change , evolution of mobile technologies,mobile services characteristics
and factors that influence acceptance of mobile services in the community and at the
business level. The next Chapter will analyis both literature discussed in Chapter 2 and
Chapter 3 and then construct a conceptual framework for estimating potential business
based on the literature covered in these chapters.

36
4. ESTIMATING POTENTIAL BUSINESS OF m-
SERVICES
4.1. Estimating Business Potential of Segments
Estimating and analyzing potential business for a specific product or services is the
crucial step toward deciding for establishing a new business or expansion. There is
neither a clear single tool nor guaranteed exact estimates of potential business in a
specific market or industry (McConnon, 2000). Estimating market potential is a
challenging process due to fact that it takes place in data vacuum. For instance, in most
developing countries accessing the secondary data it is a hustle task, either data are not
available or unreliable (Arnold, 2004). However, experienced international researchers
claim that there are still ways of getting closer to the market data required to support
meticulous and comprehensive analysis (Arnold, 2004). Substantiating market potential
and quantifying opportunity in a market can be vital to company’s success. Special
attention should also be given to qualifying the market opportunity (Cavusgil, 1997).
Literature review indicates that few studies that have been done on the topic of
estimating market potential and most of them have dedicated more efforts on market
entry modes. Few studies have cropped up different tools for assessing the market
potential. For example, Arnold & Quelch’s (1998) market demand-driven model,
Hofstede’s (2001) cultural dimensions to measure cultural distance and Porter’s (1990)
competitive analysis of an industrial sector (Sakarya, 2006). Approaches and tools for
estimating market potential varies from qualitative to quantitative (Sakarya, 2006).
In traditional approaches for market potential assessment countries are ranked based on
aggregate market potential and overall attractiveness. For marketers looking to expand
abroad, different studies provides market screening models for evaluating and selecting
potential market (Papadopoulos et al., 1988; Cavusgil et al., 2004). Always market
dynamism and future potential resulting from rapid environmental change pose
challenges to the market potential analyzing tools. Cavusgil (1997) proposed an
indexing approach for estimating market potential in emerging market. Indexing
approach comprises dimensions and measures for estimating market potential as
summarized in the Table 5 below:
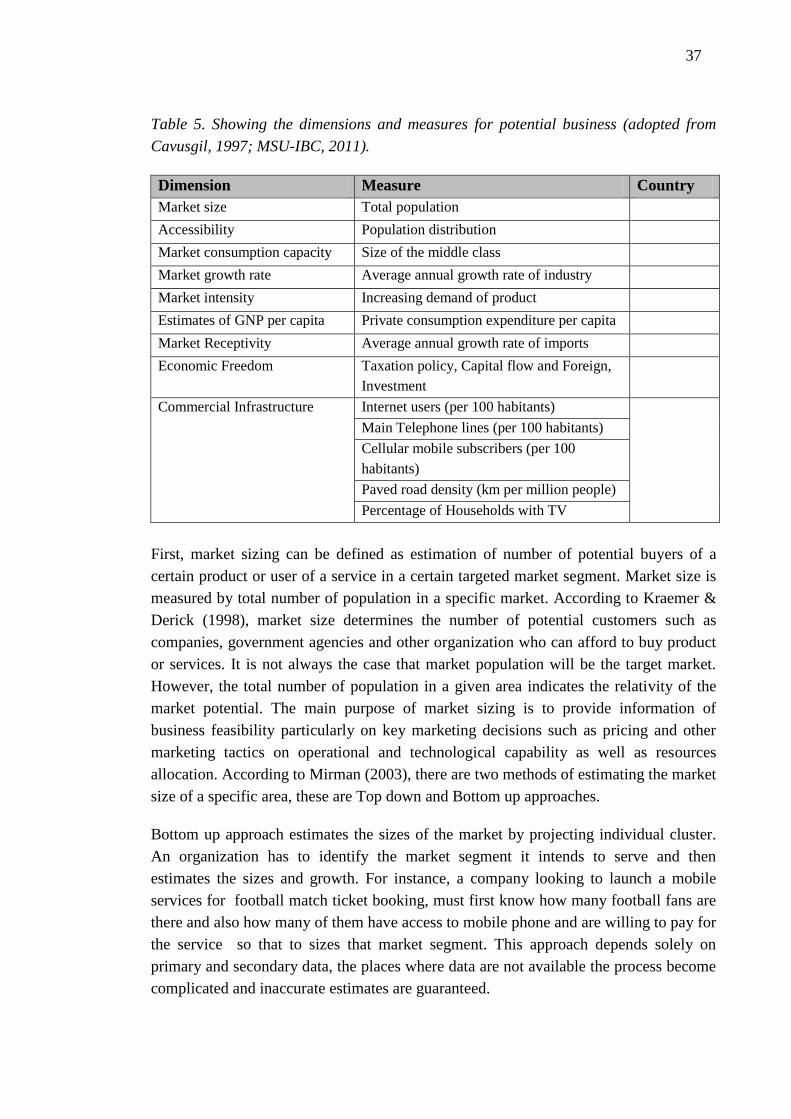
37
Table 5. Showing the dimensions and measures for potential business (adopted from
Cavusgil, 1997; MSU-IBC, 2011).
Dimension Measure Country
Market size Total population
Accessibility Population distribution
Market consumption capacity Size of the middle class
Market growth rate Average annual growth rate of industry
Market intensity Increasing demand of product
Estimates of GNP per capita Private consumption expenditure per capita
Market Receptivity Average annual growth rate of imports
Economic Freedom Taxation policy, Capital flow and Foreign,
Investment
Commercial Infrastructure Internet users (per 100 habitants)
Main Telephone lines (per 100 habitants)
Cellular mobile subscribers (per 100
habitants)
Paved road density (km per million people)
Percentage of Households with TV
First, market sizing can be defined as estimation of number of potential buyers of a
certain product or user of a service in a certain targeted market segment. Market size is
measured by total number of population in a specific market. According to Kraemer &
Derick (1998), market size determines the number of potential customers such as
companies, government agencies and other organization who can afford to buy product
or services. It is not always the case that market population will be the target market.
However, the total number of population in a given area indicates the relativity of the
market potential. The main purpose of market sizing is to provide information of
business feasibility particularly on key marketing decisions such as pricing and other
marketing tactics on operational and technological capability as well as resources
allocation. According to Mirman (2003), there are two methods of estimating the market
size of a specific area, these are Top down and Bottom up approaches.
Bottom up approach estimates the sizes of the market by projecting individual cluster.
An organization has to identify the market segment it intends to serve and then
estimates the sizes and growth. For instance, a company looking to launch a mobile
services for football match ticket booking, must first know how many football fans are
there and also how many of them have access to mobile phone and are willing to pay for
the service so that to sizes that market segment. This approach depends solely on
primary and secondary data, the places where data are not available the process become
complicated and inaccurate estimates are guaranteed.
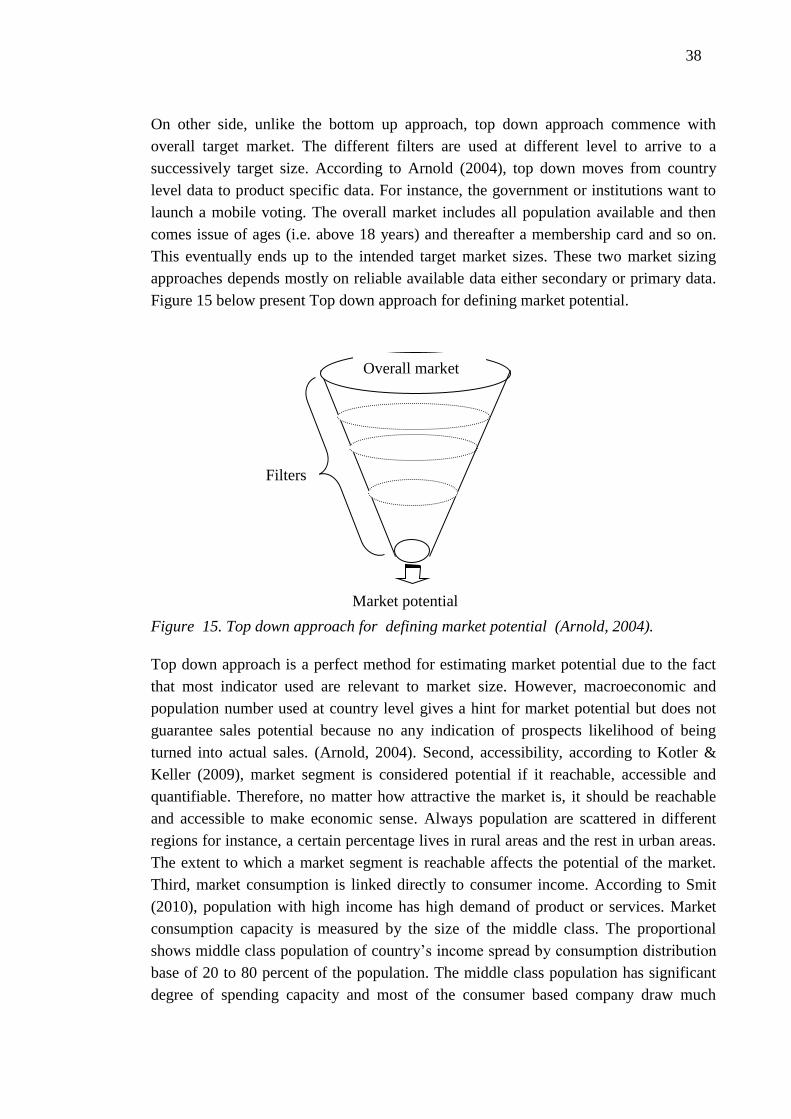
38
On other side, unlike the bottom up approach, top down approach commence with
overall target market. The different filters are used at different level to arrive to a
successively target size. According to Arnold (2004), top down moves from country
level data to product specific data. For instance, the government or institutions want to
launch a mobile voting. The overall market includes all population available and then
comes issue of ages (i.e. above 18 years) and thereafter a membership card and so on.
This eventually ends up to the intended target market sizes. These two market sizing
approaches depends mostly on reliable available data either secondary or primary data.
Figure 15 below present Top down approach for defining market potential.
Figure 15. Top down approach for defining market potential (Arnold, 2004).
Top down approach is a perfect method for estimating market potential due to the fact
that most indicator used are relevant to market size. However, macroeconomic and
population number used at country level gives a hint for market potential but does not
guarantee sales potential because no any indication of prospects likelihood of being
turned into actual sales. (Arnold, 2004). Second, accessibility, according to Kotler &
Keller (2009), market segment is considered potential if it reachable, accessible and
quantifiable. Therefore, no matter how attractive the market is, it should be reachable
and accessible to make economic sense. Always population are scattered in different
regions for instance, a certain percentage lives in rural areas and the rest in urban areas.
The extent to which a market segment is reachable affects the potential of the market.
Third, market consumption is linked directly to consumer income. According to Smit
(2010), population with high income has high demand of product or services. Market
consumption capacity is measured by the size of the middle class. The proportional
shows middle class population of country’s income spread by consumption distribution
base of 20 to 80 percent of the population. The middle class population has significant
degree of spending capacity and most of the consumer based company draw much
Filters
Market potential
Overall market
39
attention of this group (Cavusgil, 1997). Fourth, market intensity presents richness of
the market and is measured by purchasing power parity estimated from GNP per capita
and personal consumption expenditure per capita in US dollar. Purchasing power parity
is measure by several variables such as wages, salaries, employee benefits, corporate
earnings (Cavusgil, 1997).
Fifth, market growth rate can be described as an increase in product sales or population
in a given market annually. Market growth rate is measure by the average growth rate of
the industry in general. Market growth can evaluate the performance of the product of
services in a specific market. Sixth, economic freedom incorporates trade and taxation
policy, government consumption of economic output, monetary and banking policy,
capital flows and foreign investment. Seventh, foreign product and business receptivity
is not considered as one the criteria for market selection. However, market receptivity
plays important role in assessing and sensitizing standards as well as simplifying
accessible commercial risk indicators (Cavusgil, 1997). Market receptivity dimension is
measured by importation from foreign markets. It is represented by per capital imports
and average annual growth of imports from US. (Cavusgil, 1997)
Finally, access to distribution and communication to the market shows how attractive
the market is. Kotler & Keller (2009) postulate that easy reachable and accessible
segments attracts marketer simply because customers can to reached at reasonable
resources and efforts. Therefore, commercial infrastructure cannot be a snubbed
criterion in the market potential estimation process. The discussed factors in this Section
give comprehensive information on the attractiveness and potentiality of the particular
market. According to (Wolfe, 2006), Market potential is an estimate of the amount of
money expected by the suppliers to make from the product or service offerings. The
estimate accuracy will only depend on the information used in the assumptions. Mundy
& Bullen (2006) proposed a formula for estimating potential of the market:
Estimated market potential:
MP = NPC × MS × ASP × AAC
Where
MP = Market Potential
MS = Market share (percent of consumers buying product or services)
NPC = Total number of potential consumers
ASP = Average selling price
AAC = Average Annual consumption
40
The formula above estimates market potential for a specific company based on its
business model. However, in today’s business where no firm operates in isolation
therefore, every company is interested to know how much potential can be grabbed
from the whole market based on the operational position in the value chain.
4.2. Business Models
Every Mobile service has unique business model which covers all the process of
revenue generation. According to Johansson et al. (2012), as the internet and related
technologies have changed the way business is done, interest has grown in business
model among the business practitioners such as managers, researchers and others
Business model has become a buzzword that gets thrown around. However, the word
“Business model” is still surrounded by a lot of confusion especially on what it is and
how can be used. This lack of consensus has been attributed by the range of disciplines
linked to the term (Jansen et al., 2007). A business model concept engulfs the number of
ideas depending on the linked fields. Existence of varieties models of business models
brings in confusions and keeps models mushrooming. Several scholars have defined
business model differently but most of them describe it as revenue generating tool,
organization structure or a way of creating customer value via the internet. Johansson et
al. (2012) identified four key components in the business models as (1) strategic
choices, (2) creating value, (3) capturing value and (4) value network. Thereafter,
Johansson et al. (2012) defined a business Model as “a representation of a venture’s
underlying core Logic and strategic choices for creating and capturing value within a
value network”.
A complete business model definition should address the components and not a specific
model or typologies. On the other side, Morris et al in (Johansson et al., 2012) state a
business model description that considers factors related to the offerings, market
conditions, internal strategy, competitive strategy, economic factors, and investor
factors. In addition, Morris et al. (2005) postulate that the proposed business model
description can be generalized and applied to different industry. However, it is very
important to acknowledge the sector specific and venture specific and features of the
business model. According to (Bouwman et al., 2008), business model can be globally
classified as
Revenue model: This describes a manner in which a firm/network can generate
revenue.
Integrated model: Refers to strategy and configuration of a firm/network to
explore and exploit business opportunities.
This research study concentrates on the revenue business model. According to Amit &
Christoph (2001), revenue business model has become popular for internet based
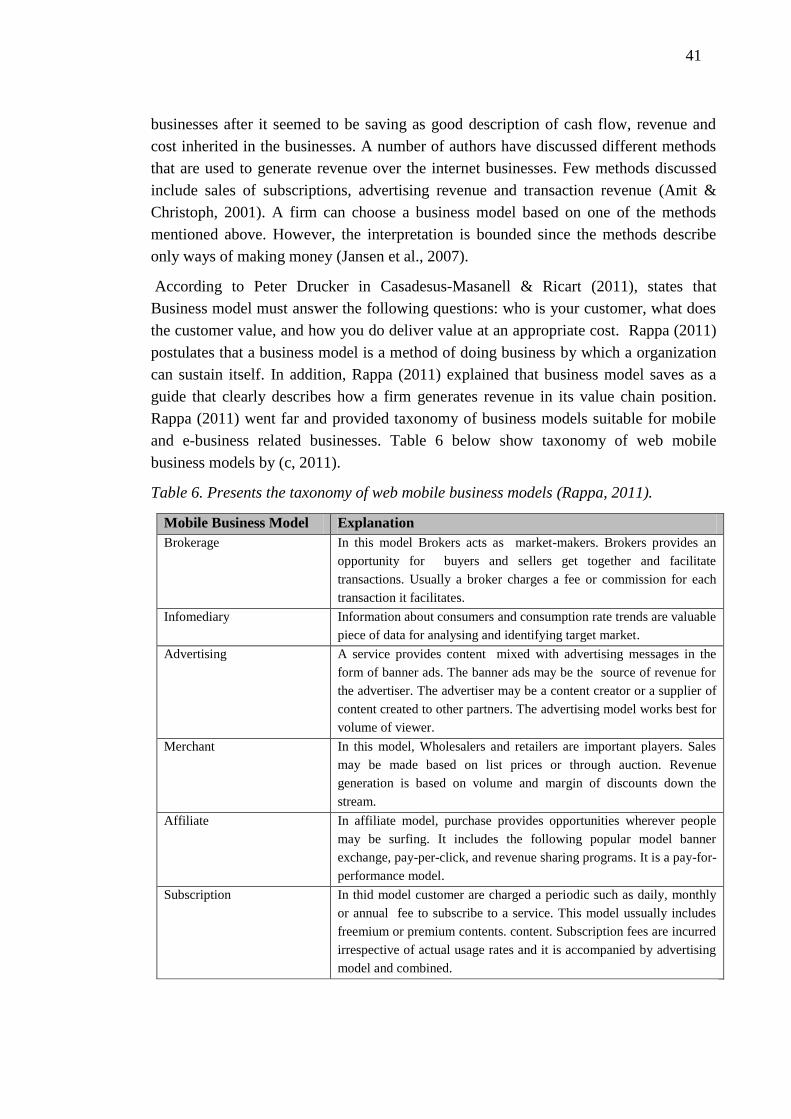
41
businesses after it seemed to be saving as good description of cash flow, revenue and
cost inherited in the businesses. A number of authors have discussed different methods
that are used to generate revenue over the internet businesses. Few methods discussed
include sales of subscriptions, advertising revenue and transaction revenue (Amit &
Christoph, 2001). A firm can choose a business model based on one of the methods
mentioned above. However, the interpretation is bounded since the methods describe
only ways of making money (Jansen et al., 2007).
According to Peter Drucker in Casadesus-Masanell & Ricart (2011), states that
Business model must answer the following questions: who is your customer, what does
the customer value, and how you do deliver value at an appropriate cost. Rappa (2011)
postulates that a business model is a method of doing business by which a organization
can sustain itself. In addition, Rappa (2011) explained that business model saves as a
guide that clearly describes how a firm generates revenue in its value chain position.
Rappa (2011) went far and provided taxonomy of business models suitable for mobile
and e-business related businesses. Table 6 below show taxonomy of web mobile
business models by (c, 2011).
Table 6. Presents the taxonomy of web mobile business models (Rappa, 2011).
Mobile Business Model Explanation
Brokerage In this model Brokers acts as market-makers. Brokers provides an
opportunity for buyers and sellers get together and facilitate
transactions. Usually a broker charges a fee or commission for each
transaction it facilitates.
Infomediary Information about consumers and consumption rate trends are valuable
piece of data for analysing and identifying target market.
Advertising A service provides content mixed with advertising messages in the
form of banner ads. The banner ads may be the source of revenue for
the advertiser. The advertiser may be a content creator or a supplier of
content created to other partners. The advertising model works best for
volume of viewer.
Merchant In this model, Wholesalers and retailers are important players. Sales
may be made based on list prices or through auction. Revenue
generation is based on volume and margin of discounts down the
stream.
Affiliate In affiliate model, purchase provides opportunities wherever people
may be surfing. It includes the following popular model banner
exchange, pay-per-click, and revenue sharing programs. It is a pay-for-
performance model.
Subscription In thid model customer are charged a periodic such as daily, monthly
or annual fee to subscribe to a service. This model ussually includes
freemium or premium contents. content. Subscription fees are incurred
irrespective of actual usage rates and it is accompanied by advertising
model and combined.

42
Selection of right business model lies on usage of mobile applications. According to
Parnot (2001), there are different mobile applications usages which also require
different business model. The following are list of type of mobile applications with
relevance in the sight of business model:
Continuous usage: Mobile applications which provides important information in
periodic on non-periodic time intervals. For example. Email application, News
application, game application
One time usage: Mobile applications that are used within short time intervals.
For example game applications, entertainment applications
Sporadic usage: Mobile applications used only when need, for instance reminder
Thus, it is very important to understand the derived demands and position of the firm in
the value chain and design a business model that will clearly show the revenue flow and
income generated. A company/firm must have a right business model in order to create
revenue particularly from a new technologies or products. Chesbrough (2007) postulate
that business model covers the following functions: (1) communicating value
proposition, (2) identifying target market segment, (3) clearly defining the value chain,
(4) specifying the revenue generation approaches and estimate both cost and profit
potential, (5) describing how the venture company fit in the both downstream and
upstream value chain and, (6) formulate a competitive strategy that will ensure
competitive advantage.
4.3. Mobile Services Application Segment
Global mobile services market is increasingly defined by huge number of mobile
subscriptions. Mobile technology is being regard as one of the technology with highest
market penetration ever surpassing computer technology, Internet and others.
Transformation from voice services business to value added mobile services catalyzes
the mobile market growth. Nowadays, mobile technology is no longer improving the
personal living standards only but also improving business processes performance and
productivity. According to OECD/ITU (2011), mobile technology is significantly
expanding government‘s capacity to deliver benefits and outcomes for government,
businesses and citizens. Thus, impacting national overall economic growth positively.
Mobile Service cuts across different fields which define its applications widely.
Therefore, segmenting mobile service market requires the knowledge of the potential
mobile application fields. Varshney & Vetter (2001); Nickerson (2007) lists different
mobile applications though the list is not exhaustive. The following is the list of mobile
applications:

43
• Mobile messaging
• Mobile navigation
• Mobile TV
• Purchasing location-based contents
• Mobile inventory management for a
company
• Product location and tracking for
individuals
• Mobile banking & financial services
• Mobile games – individual
• Mobile games – group
• Mobile advertisement user – specific
• Mobile advertising – location-specific
• Mobile personal services (mobile dating)
• Mobile distance education – offline
• Mobile distance education – online
• Mobile product recommendation
• Mobile telemedicine and patient
monitoring
• Mobile ticketing
• Mobile healthcare
• Mobile emergency and safety
management
• Mobile habitat and environmental
monitoring
• Mobile social networking
Regardless of the product or industry, the process of market segmentation follows
almost the same route. Jobber (2003); Kotler (2009) proposed the steps to start with
when segmenting the market particularly in B2B markets. As it was discussed in
Chapter 2, it is clear that market segmentation starts with identifying macro
segmentation variables and then dig deeper and deeper to micro-segmentation variables
which in the end provides most specialized and unique market segments that might be
used by firm as a competitive advantage. Figure 16 below illustrates mobile services
application segmentation.
Figure 16. Mobile services application segmentation.
Mob
ile
serv
ice
mark
et
Education Sector
Finance Sector
HealthCare Sector
Government Sector
Entertainment Sector
Government
Business
Citizens
Government
Business
Citizens
Agricultural Sector
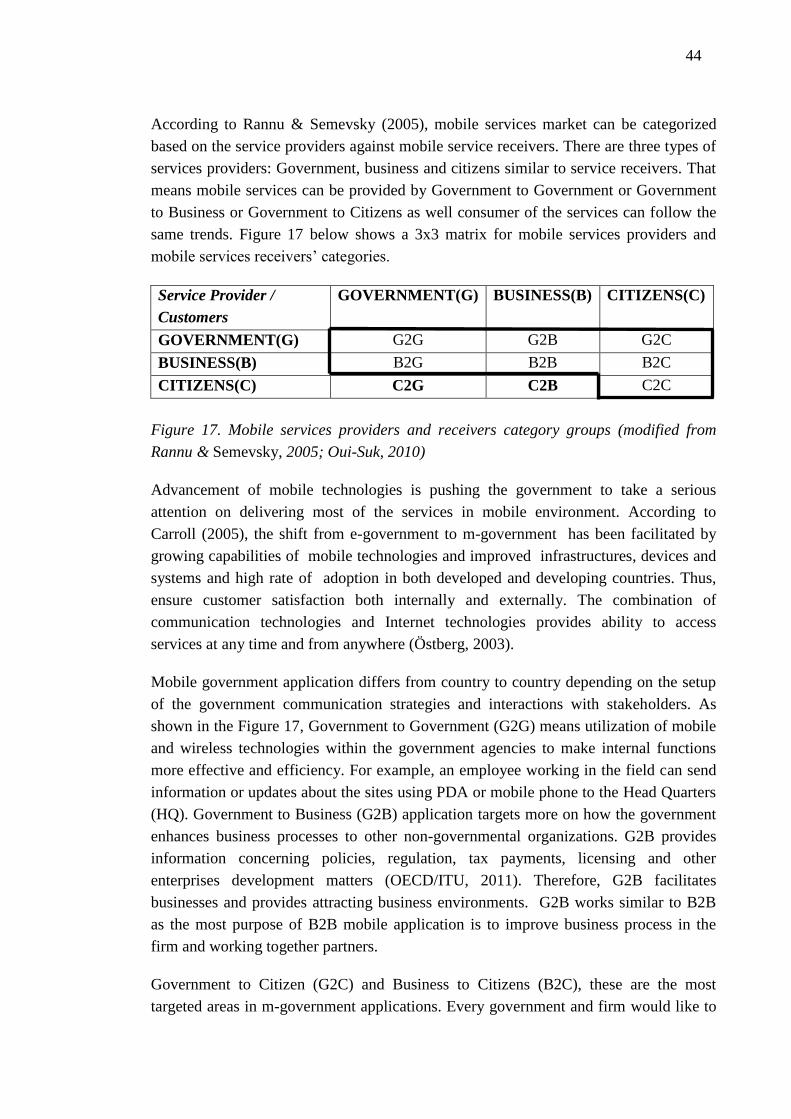
44
According to Rannu & Semevsky (2005), mobile services market can be categorized
based on the service providers against mobile service receivers. There are three types of
services providers: Government, business and citizens similar to service receivers. That
means mobile services can be provided by Government to Government or Government
to Business or Government to Citizens as well consumer of the services can follow the
same trends. Figure 17 below shows a 3x3 matrix for mobile services providers and
mobile services receivers’ categories.
Service Provider /
Customers
GOVERNMENT(G) BUSINESS(B) CITIZENS(C)
GOVERNMENT(G) G2G G2B G2C
BUSINESS(B) B2G B2B B2C
CITIZENS(C) C2G C2B C2C
Figure 17. Mobile services providers and receivers category groups (modified from
Rannu & Semevsky, 2005; Oui-Suk, 2010)
Advancement of mobile technologies is pushing the government to take a serious
attention on delivering most of the services in mobile environment. According to
Carroll (2005), the shift from e-government to m-government has been facilitated by
growing capabilities of mobile technologies and improved infrastructures, devices and
systems and high rate of adoption in both developed and developing countries. Thus,
ensure customer satisfaction both internally and externally. The combination of
communication technologies and Internet technologies provides ability to access
services at any time and from anywhere (Östberg, 2003).
Mobile government application differs from country to country depending on the setup
of the government communication strategies and interactions with stakeholders. As
shown in the Figure 17, Government to Government (G2G) means utilization of mobile
and wireless technologies within the government agencies to make internal functions
more effective and efficiency. For example, an employee working in the field can send
information or updates about the sites using PDA or mobile phone to the Head Quarters
(HQ). Government to Business (G2B) application targets more on how the government
enhances business processes to other non-governmental organizations. G2B provides
information concerning policies, regulation, tax payments, licensing and other
enterprises development matters (OECD/ITU, 2011). Therefore, G2B facilitates
businesses and provides attracting business environments. G2B works similar to B2B
as the most purpose of B2B mobile application is to improve business process in the
firm and working together partners.
Government to Citizen (G2C) and Business to Citizens (B2C), these are the most
targeted areas in m-government applications. Every government and firm would like to
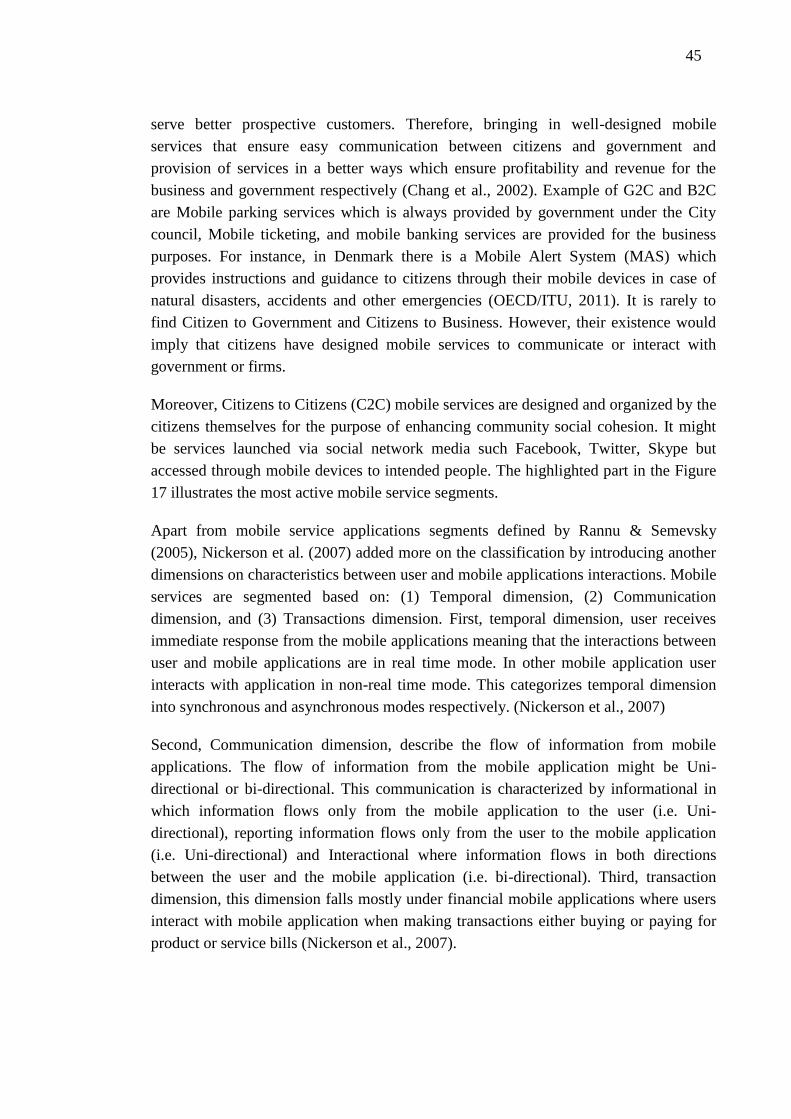
45
serve better prospective customers. Therefore, bringing in well-designed mobile
services that ensure easy communication between citizens and government and
provision of services in a better ways which ensure profitability and revenue for the
business and government respectively (Chang et al., 2002). Example of G2C and B2C
are Mobile parking services which is always provided by government under the City
council, Mobile ticketing, and mobile banking services are provided for the business
purposes. For instance, in Denmark there is a Mobile Alert System (MAS) which
provides instructions and guidance to citizens through their mobile devices in case of
natural disasters, accidents and other emergencies (OECD/ITU, 2011). It is rarely to
find Citizen to Government and Citizens to Business. However, their existence would
imply that citizens have designed mobile services to communicate or interact with
government or firms.
Moreover, Citizens to Citizens (C2C) mobile services are designed and organized by the
citizens themselves for the purpose of enhancing community social cohesion. It might
be services launched via social network media such Facebook, Twitter, Skype but
accessed through mobile devices to intended people. The highlighted part in the Figure
17 illustrates the most active mobile service segments.
Apart from mobile service applications segments defined by Rannu & Semevsky
(2005), Nickerson et al. (2007) added more on the classification by introducing another
dimensions on characteristics between user and mobile applications interactions. Mobile
services are segmented based on: (1) Temporal dimension, (2) Communication
dimension, and (3) Transactions dimension. First, temporal dimension, user receives
immediate response from the mobile applications meaning that the interactions between
user and mobile applications are in real time mode. In other mobile application user
interacts with application in non-real time mode. This categorizes temporal dimension
into synchronous and asynchronous modes respectively. (Nickerson et al., 2007)
Second, Communication dimension, describe the flow of information from mobile
applications. The flow of information from the mobile application might be Uni-
directional or bi-directional. This communication is characterized by informational in
which information flows only from the mobile application to the user (i.e. Uni-
directional), reporting information flows only from the user to the mobile application
(i.e. Uni-directional) and Interactional where information flows in both directions
between the user and the mobile application (i.e. bi-directional). Third, transaction
dimension, this dimension falls mostly under financial mobile applications where users
interact with mobile application when making transactions either buying or paying for
product or service bills (Nickerson et al., 2007).
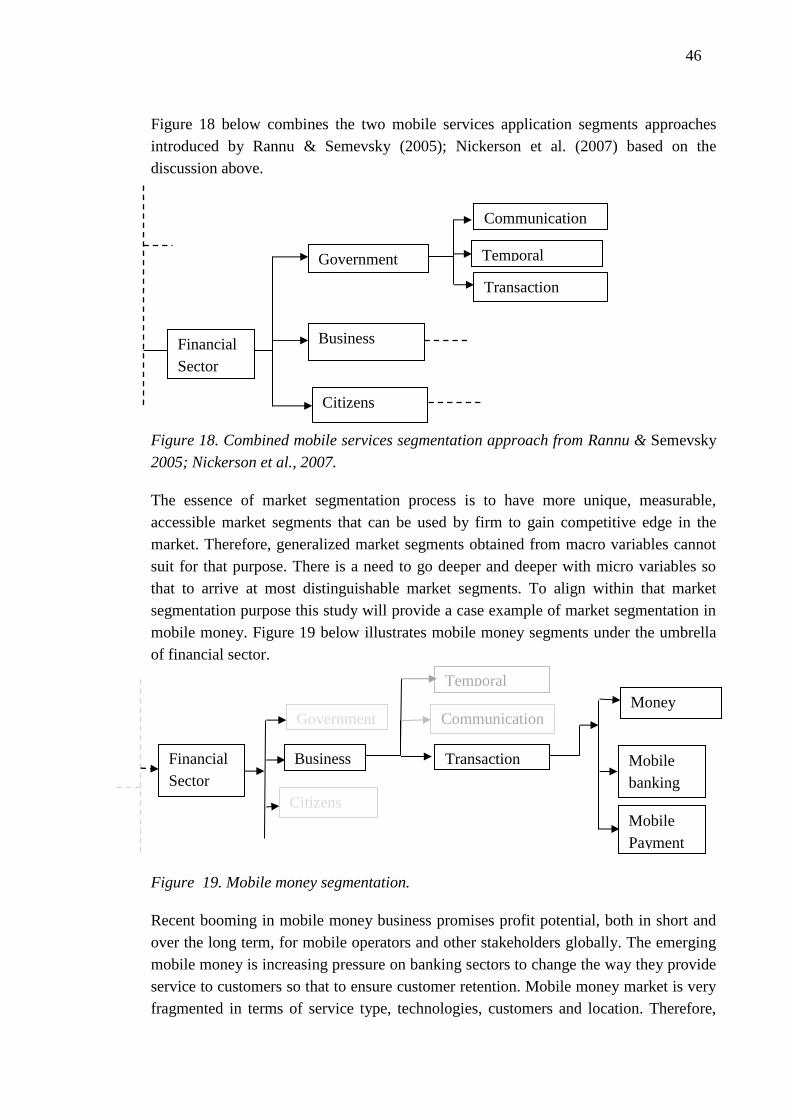
46
Figure 18 below combines the two mobile services application segments approaches
introduced by Rannu & Semevsky (2005); Nickerson et al. (2007) based on the
discussion above.
Figure 18. Combined mobile services segmentation approach from Rannu & Semevsky
2005; Nickerson et al., 2007.
The essence of market segmentation process is to have more unique, measurable,
accessible market segments that can be used by firm to gain competitive edge in the
market. Therefore, generalized market segments obtained from macro variables cannot
suit for that purpose. There is a need to go deeper and deeper with micro variables so
that to arrive at most distinguishable market segments. To align within that market
segmentation purpose this study will provide a case example of market segmentation in
mobile money. Figure 19 below illustrates mobile money segments under the umbrella
of financial sector.
Figure 19. Mobile money segmentation.
Recent booming in mobile money business promises profit potential, both in short and
over the long term, for mobile operators and other stakeholders globally. The emerging
mobile money is increasing pressure on banking sectors to change the way they provide
service to customers so that to ensure customer retention. Mobile money market is very
fragmented in terms of service type, technologies, customers and location. Therefore,
Financial
Sector
Government
Business
Citizens
Mobile
Payment
Money
Transfer
Mobile
banking
Financial
Sector
Government
Business
Citizens
Temporal
Communication
Transaction
Temporal
Communication
Transaction
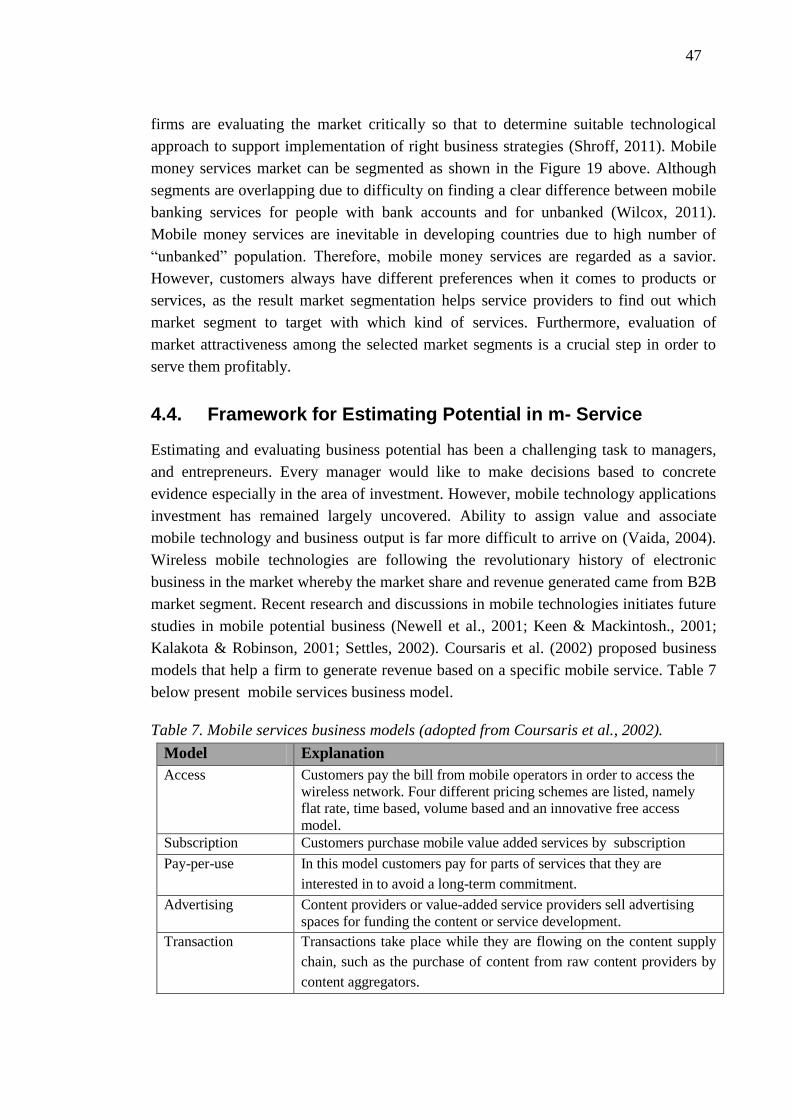
47
firms are evaluating the market critically so that to determine suitable technological
approach to support implementation of right business strategies (Shroff, 2011). Mobile
money services market can be segmented as shown in the Figure 19 above. Although
segments are overlapping due to difficulty on finding a clear difference between mobile
banking services for people with bank accounts and for unbanked (Wilcox, 2011).
Mobile money services are inevitable in developing countries due to high number of
“unbanked” population. Therefore, mobile money services are regarded as a savior.
However, customers always have different preferences when it comes to products or
services, as the result market segmentation helps service providers to find out which
market segment to target with which kind of services. Furthermore, evaluation of
market attractiveness among the selected market segments is a crucial step in order to
serve them profitably.
4.4. Framework for Estimating Potential in m- Service
Estimating and evaluating business potential has been a challenging task to managers,
and entrepreneurs. Every manager would like to make decisions based to concrete
evidence especially in the area of investment. However, mobile technology applications
investment has remained largely uncovered. Ability to assign value and associate
mobile technology and business output is far more difficult to arrive on (Vaida, 2004).
Wireless mobile technologies are following the revolutionary history of electronic
business in the market whereby the market share and revenue generated came from B2B
market segment. Recent research and discussions in mobile technologies initiates future
studies in mobile potential business (Newell et al., 2001; Keen & Mackintosh., 2001;
Kalakota & Robinson, 2001; Settles, 2002). Coursaris et al. (2002) proposed business
models that help a firm to generate revenue based on a specific mobile service. Table 7
below present mobile services business model.
Table 7. Mobile services business models (adopted from Coursaris et al., 2002).
Model Explanation
Access Customers pay the bill from mobile operators in order to access the
wireless network. Four different pricing schemes are listed, namely
flat rate, time based, volume based and an innovative free access
model.
Subscription Customers purchase mobile value added services by subscription
Pay-per-use In this model customers pay for parts of services that they are
interested in to avoid a long-term commitment.
Advertising Content providers or value-added service providers sell advertising
spaces for funding the content or service development.
Transaction Transactions take place while they are flowing on the content supply
chain, such as the purchase of content from raw content providers by
content aggregators.
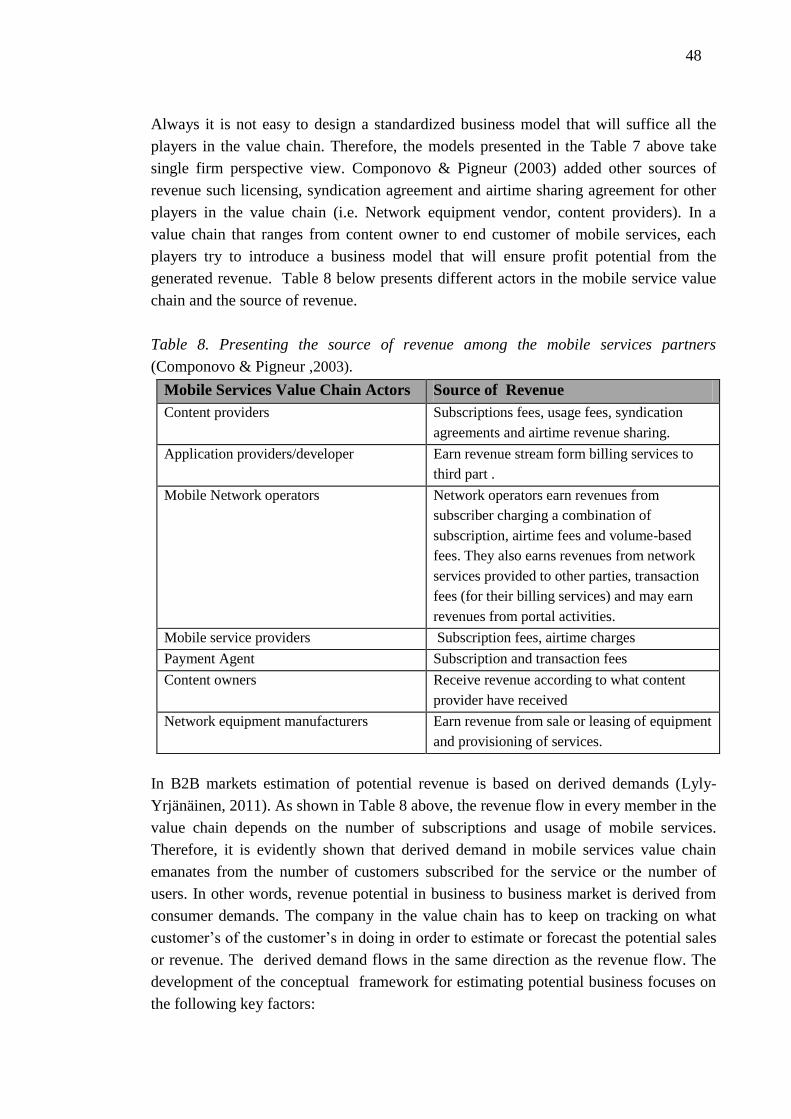
48
Always it is not easy to design a standardized business model that will suffice all the
players in the value chain. Therefore, the models presented in the Table 7 above take
single firm perspective view. Componovo & Pigneur (2003) added other sources of
revenue such licensing, syndication agreement and airtime sharing agreement for other
players in the value chain (i.e. Network equipment vendor, content providers). In a
value chain that ranges from content owner to end customer of mobile services, each
players try to introduce a business model that will ensure profit potential from the
generated revenue. Table 8 below presents different actors in the mobile service value
chain and the source of revenue.
Table 8. Presenting the source of revenue among the mobile services partners
(Componovo & Pigneur ,2003).
Mobile Services Value Chain Actors Source of Revenue
Content providers Subscriptions fees, usage fees, syndication
agreements and airtime revenue sharing.
Application providers/developer Earn revenue stream form billing services to
third part .
Mobile Network operators
Network operators earn revenues from
subscriber charging a combination of
subscription, airtime fees and volume-based
fees. They also earns revenues from network
services provided to other parties, transaction
fees (for their billing services) and may earn
revenues from portal activities.
Mobile service providers Subscription fees, airtime charges
Payment Agent Subscription and transaction fees
Content owners Receive revenue according to what content
provider have received
Network equipment manufacturers Earn revenue from sale or leasing of equipment
and provisioning of services.
In B2B markets estimation of potential revenue is based on derived demands (Lyly-
Yrjänäinen, 2011). As shown in Table 8 above, the revenue flow in every member in the
value chain depends on the number of subscriptions and usage of mobile services.
Therefore, it is evidently shown that derived demand in mobile services value chain
emanates from the number of customers subscribed for the service or the number of
users. In other words, revenue potential in business to business market is derived from
consumer demands. The company in the value chain has to keep on tracking on what
customer’s of the customer’s in doing in order to estimate or forecast the potential sales
or revenue. The derived demand flows in the same direction as the revenue flow. The
development of the conceptual framework for estimating potential business focuses on
the following key factors:
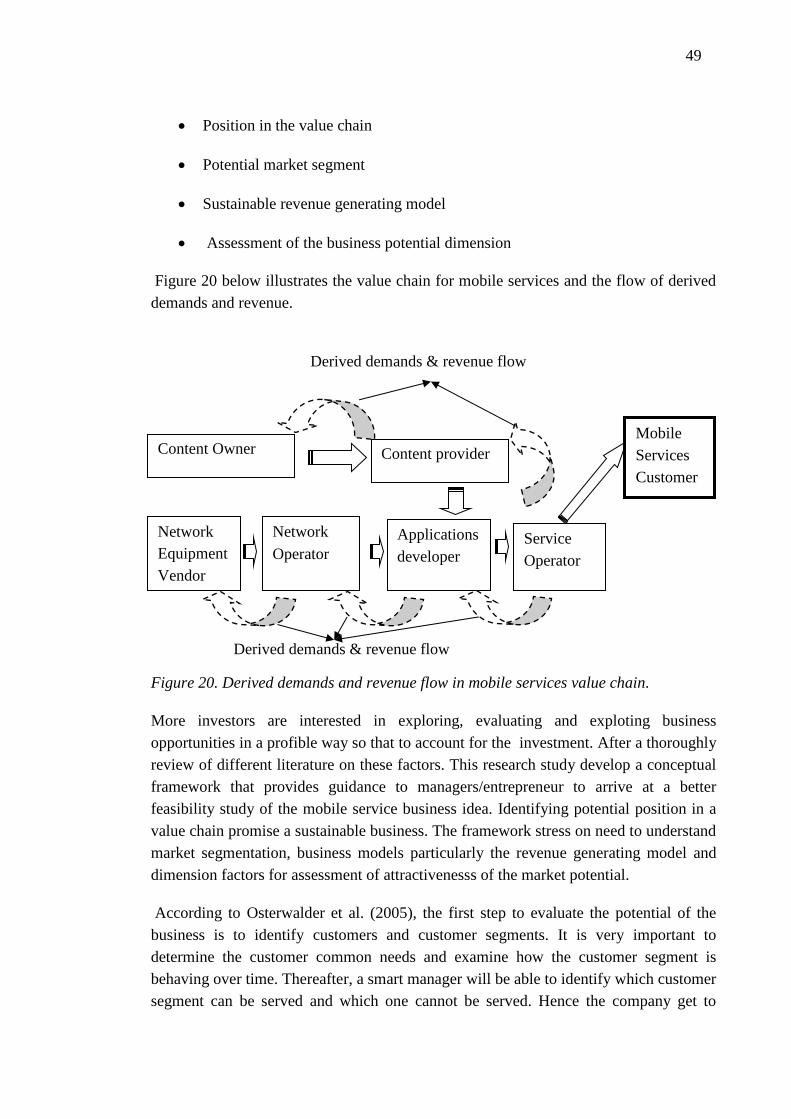
49
Position in the value chain
Potential market segment
Sustainable revenue generating model
Assessment of the business potential dimension
Figure 20 below illustrates the value chain for mobile services and the flow of derived
demands and revenue.
Figure 20. Derived demands and revenue flow in mobile services value chain.
More investors are interested in exploring, evaluating and exploting business
opportunities in a profible way so that to account for the investment. After a thoroughly
review of different literature on these factors. This research study develop a conceptual
framework that provides guidance to managers/entrepreneur to arrive at a better
feasibility study of the mobile service business idea. Identifying potential position in a
value chain promise a sustainable business. The framework stress on need to understand
market segmentation, business models particularly the revenue generating model and
dimension factors for assessment of attractivenesss of the market potential.
According to Osterwalder et al. (2005), the first step to evaluate the potential of the
business is to identify customers and customer segments. It is very important to
determine the customer common needs and examine how the customer segment is
behaving over time. Thereafter, a smart manager will be able to identify which customer
segment can be served and which one cannot be served. Hence the company get to
Content Owner Content provider
Applications
developer
Network
Operator Service
Operator
Network
Equipment
Vendor
Mobile
Services
Customer
s
Derived demands & revenue flow
Derived demands & revenue flow
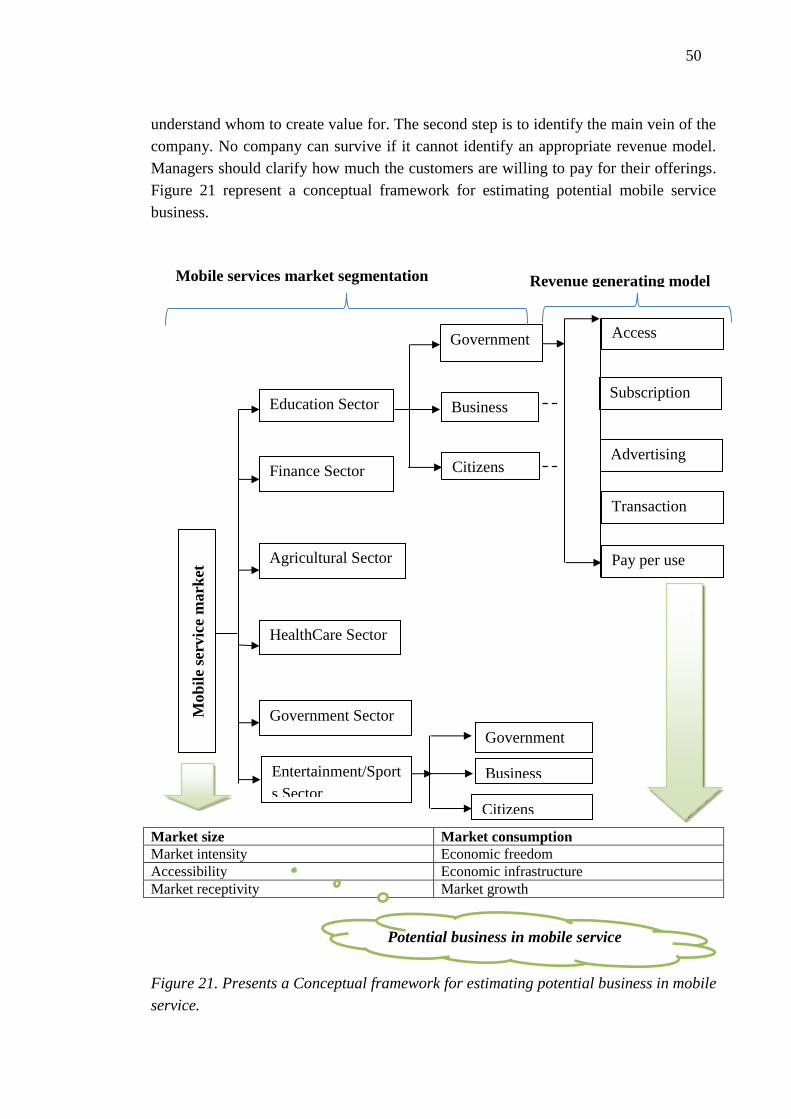
50
understand whom to create value for. The second step is to identify the main vein of the
company. No company can survive if it cannot identify an appropriate revenue model.
Managers should clarify how much the customers are willing to pay for their offerings.
Figure 21 represent a conceptual framework for estimating potential mobile service
business.
Figure 21. Presents a Conceptual framework for estimating potential business in mobile
service.
Market size Market consumption
Market intensity Economic freedom
Accessibility Economic infrastructure
Market receptivity Market growth
Mob
ile
serv
ice
mark
et
Education Sector
Finance Sector
HealthCare Sector
Government Sector
Entertainment/Sport
s Sector
Government
Business
Citizens
Access
Business
Citizens
Agricultural Sector
Subscription
Advertising
Transaction
Pay per use
Government
Mobile services market segmentation Revenue generating model
Potential business in mobile service
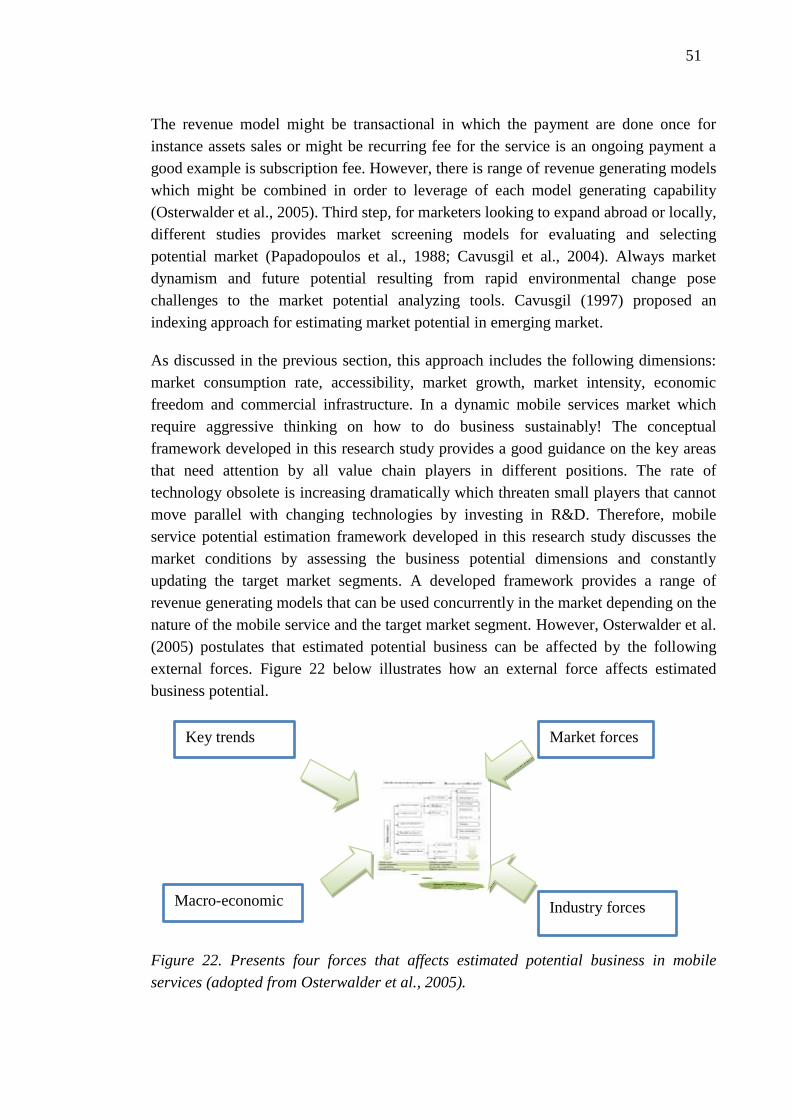
51
The revenue model might be transactional in which the payment are done once for
instance assets sales or might be recurring fee for the service is an ongoing payment a
good example is subscription fee. However, there is range of revenue generating models
which might be combined in order to leverage of each model generating capability
(Osterwalder et al., 2005). Third step, for marketers looking to expand abroad or locally,
different studies provides market screening models for evaluating and selecting
potential market (Papadopoulos et al., 1988; Cavusgil et al., 2004). Always market
dynamism and future potential resulting from rapid environmental change pose
challenges to the market potential analyzing tools. Cavusgil (1997) proposed an
indexing approach for estimating market potential in emerging market.
As discussed in the previous section, this approach includes the following dimensions:
market consumption rate, accessibility, market growth, market intensity, economic
freedom and commercial infrastructure. In a dynamic mobile services market which
require aggressive thinking on how to do business sustainably! The conceptual
framework developed in this research study provides a good guidance on the key areas
that need attention by all value chain players in different positions. The rate of
technology obsolete is increasing dramatically which threaten small players that cannot
move parallel with changing technologies by investing in R&D. Therefore, mobile
service potential estimation framework developed in this research study discusses the
market conditions by assessing the business potential dimensions and constantly
updating the target market segments. A developed framework provides a range of
revenue generating models that can be used concurrently in the market depending on the
nature of the mobile service and the target market segment. However, Osterwalder et al.
(2005) postulates that estimated potential business can be affected by the following
external forces. Figure 22 below illustrates how an external force affects estimated
business potential.
Figure 22. Presents four forces that affects estimated potential business in mobile
services (adopted from Osterwalder et al., 2005).
Key trends Market forces
Macro-economic Industry forces
52
This Chapter has discussed how to estimate potential business in mobile segments. Also
this Chapter has introduced and discussed the concept of business model main emphasis
on mobile services revenue generating models. In addition, this Chapter has covered the
mobile services applications segments. Finally, in combination of literature discussed in
Chapter 2 (i.e. Marketing process) and Chapter 3 (i.e. Mobile services), a conceptual
framework for estimating potential business in mobile services is developed. The
framework developed will be used by managers/ entreprenuers as a guidance tool in the
process of exploring and evaluating business opportunities particularly in mobile
services market. The next Chapter introduces Tanzania mobile services market.
53
5. TANZANIA MOBILE SERVICES MARKET
5.1. Country Profile
United Republic of Tanzania is geographically located in Eastern Africa between
longitude 29o and 41
o East, Latitude 1
o and 12
o South. (The Government of Tanzania,
2010a). Tanzania is bordered by eight countries namely Kenya, Uganda in the northern
part, Rwanda, Burundi and Democratic Republic of Congo in western corridor and
Malawi, Mozambique and Zambia in the southern part while Indian Ocean covers the
eastern part of the country (CIA, 2012). Tanzania is the largest country in East Africa
which comprises Tanzania mainland, Pemba and Zanzibar. Tanganyika gained
independence in 1961 and Zanzibar in 1963. The United Republic of Tanzania was
formed in 1964 in the union of Tanganyika and Zanzibar (The Government of Tanzania
2010a). Thus, summing up to a total land of 947,300 square kilometers. Seven percent
of the total land is covered by water such as Island of Mafia, Pemba, Zanzibar, Lake
Victoria, Lake Tanganyika, lake Nyasa and others. Tanzania is the agricultural country
with 40 million hectares of arable land and the country is gifted with a broad range of
valuable natural resources which includes gold, gemstones, diamonds, coal, phosphate,
natural gas, nickel. (CIA, 2012)
Tanzania harbours Lake Tanganyika the longest and second deepest in the world, Mt.
Kilimanjaro the highest snow capped mountain in Africa and Lake Victoria the second
largest lake in the world. Tanzania provides ports gateway to neighboring landlocked
countries through Dar es Salaam, Tanga and Mtwara ports (Ngasongwa, 2005). Figure
26 below present the map of United Republic of Tanzania
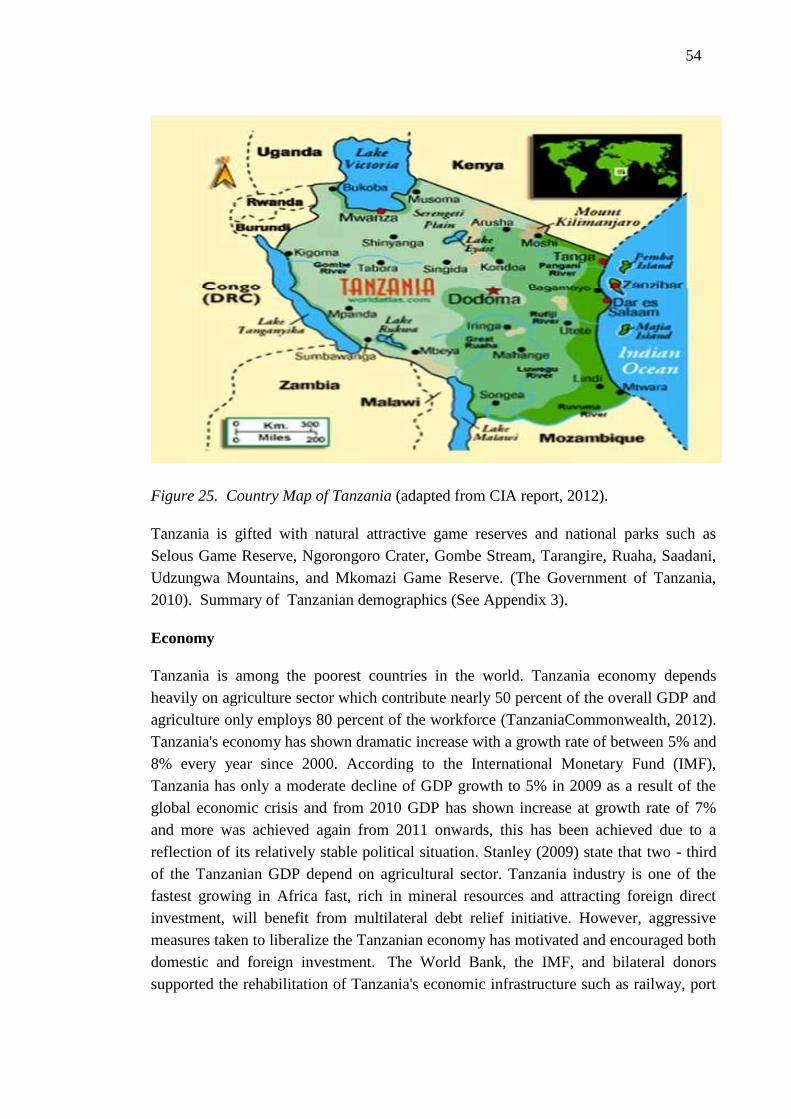
54
Figure 25. Country Map of Tanzania (adapted from CIA report, 2012).
Tanzania is gifted with natural attractive game reserves and national parks such as
Selous Game Reserve, Ngorongoro Crater, Gombe Stream, Tarangire, Ruaha, Saadani,
Udzungwa Mountains, and Mkomazi Game Reserve. (The Government of Tanzania,
2010). Summary of Tanzanian demographics (See Appendix 3).
Economy
Tanzania is among the poorest countries in the world. Tanzania economy depends
heavily on agriculture sector which contribute nearly 50 percent of the overall GDP and
agriculture only employs 80 percent of the workforce (TanzaniaCommonwealth, 2012).
Tanzania's economy has shown dramatic increase with a growth rate of between 5% and
8% every year since 2000. According to the International Monetary Fund (IMF),
Tanzania has only a moderate decline of GDP growth to 5% in 2009 as a result of the
global economic crisis and from 2010 GDP has shown increase at growth rate of 7%
and more was achieved again from 2011 onwards, this has been achieved due to a
reflection of its relatively stable political situation. Stanley (2009) state that two - third
of the Tanzanian GDP depend on agricultural sector. Tanzania industry is one of the
fastest growing in Africa fast, rich in mineral resources and attracting foreign direct
investment, will benefit from multilateral debt relief initiative. However, aggressive
measures taken to liberalize the Tanzanian economy has motivated and encouraged both
domestic and foreign investment. The World Bank, the IMF, and bilateral donors
supported the rehabilitation of Tanzania's economic infrastructure such as railway, port
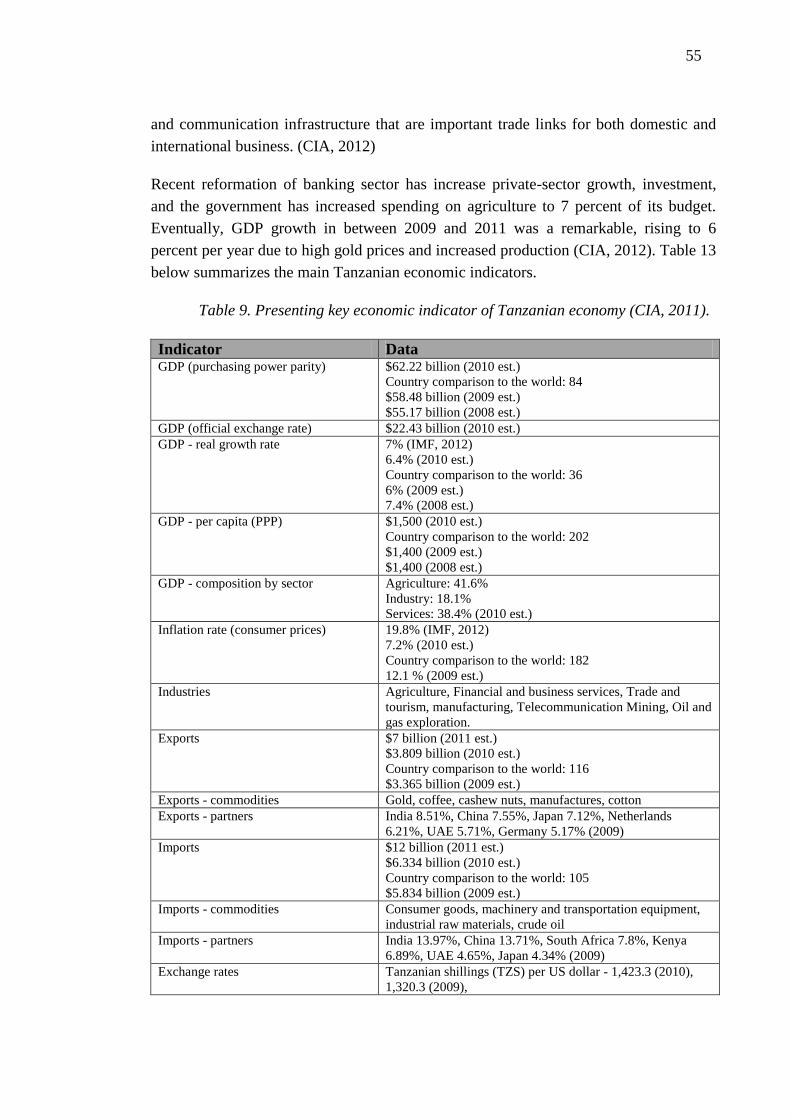
55
and communication infrastructure that are important trade links for both domestic and
international business. (CIA, 2012)
Recent reformation of banking sector has increase private-sector growth, investment,
and the government has increased spending on agriculture to 7 percent of its budget.
Eventually, GDP growth in between 2009 and 2011 was a remarkable, rising to 6
percent per year due to high gold prices and increased production (CIA, 2012). Table 13
below summarizes the main Tanzanian economic indicators.
Table 9. Presenting key economic indicator of Tanzanian economy (CIA, 2011).
Indicator Data GDP (purchasing power parity) $62.22 billion (2010 est.)
Country comparison to the world: 84
$58.48 billion (2009 est.)
$55.17 billion (2008 est.)
GDP (official exchange rate) $22.43 billion (2010 est.)
GDP - real growth rate 7% (IMF, 2012)
6.4% (2010 est.)
Country comparison to the world: 36
6% (2009 est.)
7.4% (2008 est.)
GDP - per capita (PPP) $1,500 (2010 est.)
Country comparison to the world: 202
$1,400 (2009 est.)
$1,400 (2008 est.)
GDP - composition by sector Agriculture: 41.6%
Industry: 18.1%
Services: 38.4% (2010 est.)
Inflation rate (consumer prices) 19.8% (IMF, 2012)
7.2% (2010 est.)
Country comparison to the world: 182
12.1 % (2009 est.)
Industries Agriculture, Financial and business services, Trade and
tourism, manufacturing, Telecommunication Mining, Oil and
gas exploration.
Exports $7 billion (2011 est.)
$3.809 billion (2010 est.)
Country comparison to the world: 116
$3.365 billion (2009 est.)
Exports - commodities Gold, coffee, cashew nuts, manufactures, cotton
Exports - partners India 8.51%, China 7.55%, Japan 7.12%, Netherlands
6.21%, UAE 5.71%, Germany 5.17% (2009)
Imports $12 billion (2011 est.)
$6.334 billion (2010 est.)
Country comparison to the world: 105
$5.834 billion (2009 est.)
Imports - commodities Consumer goods, machinery and transportation equipment,
industrial raw materials, crude oil
Imports - partners India 13.97%, China 13.71%, South Africa 7.8%, Kenya
6.89%, UAE 4.65%, Japan 4.34% (2009)
Exchange rates Tanzanian shillings (TZS) per US dollar - 1,423.3 (2010),
1,320.3 (2009),
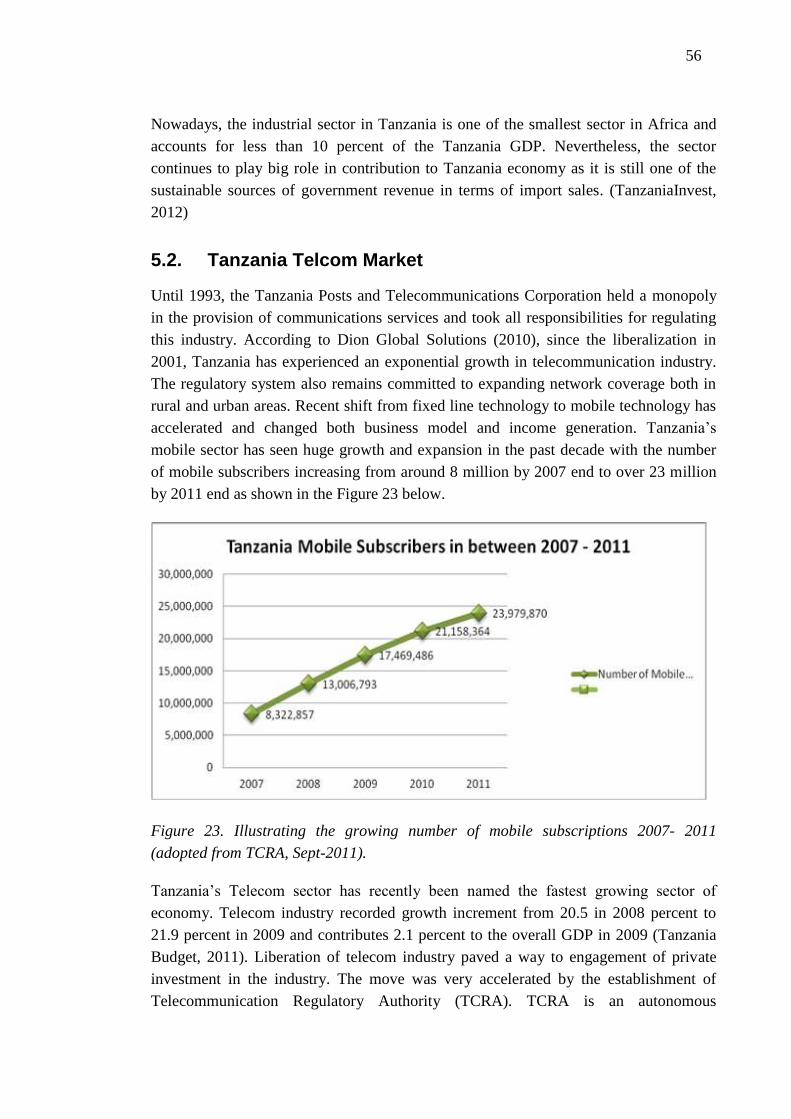
56
Nowadays, the industrial sector in Tanzania is one of the smallest sector in Africa and
accounts for less than 10 percent of the Tanzania GDP. Nevertheless, the sector
continues to play big role in contribution to Tanzania economy as it is still one of the
sustainable sources of government revenue in terms of import sales. (TanzaniaInvest,
2012)
5.2. Tanzania Telcom Market
Until 1993, the Tanzania Posts and Telecommunications Corporation held a monopoly
in the provision of communications services and took all responsibilities for regulating
this industry. According to Dion Global Solutions (2010), since the liberalization in
2001, Tanzania has experienced an exponential growth in telecommunication industry.
The regulatory system also remains committed to expanding network coverage both in
rural and urban areas. Recent shift from fixed line technology to mobile technology has
accelerated and changed both business model and income generation. Tanzania’s
mobile sector has seen huge growth and expansion in the past decade with the number
of mobile subscribers increasing from around 8 million by 2007 end to over 23 million
by 2011 end as shown in the Figure 23 below.
Figure 23. Illustrating the growing number of mobile subscriptions 2007- 2011
(adopted from TCRA, Sept-2011).
Tanzania’s Telecom sector has recently been named the fastest growing sector of
economy. Telecom industry recorded growth increment from 20.5 in 2008 percent to
21.9 percent in 2009 and contributes 2.1 percent to the overall GDP in 2009 (Tanzania
Budget, 2011). Liberation of telecom industry paved a way to engagement of private
investment in the industry. The move was very accelerated by the establishment of
Telecommunication Regulatory Authority (TCRA). TCRA is an autonomous
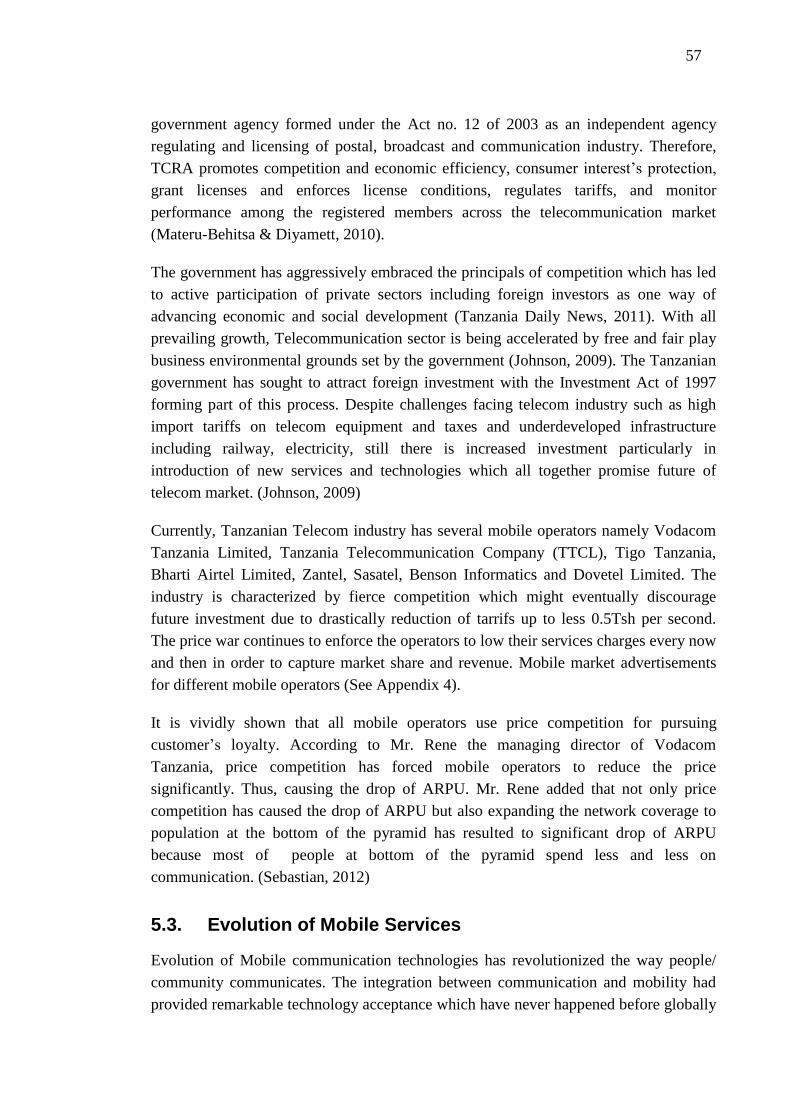
57
government agency formed under the Act no. 12 of 2003 as an independent agency
regulating and licensing of postal, broadcast and communication industry. Therefore,
TCRA promotes competition and economic efficiency, consumer interest’s protection,
grant licenses and enforces license conditions, regulates tariffs, and monitor
performance among the registered members across the telecommunication market
(Materu-Behitsa & Diyamett, 2010).
The government has aggressively embraced the principals of competition which has led
to active participation of private sectors including foreign investors as one way of
advancing economic and social development (Tanzania Daily News, 2011). With all
prevailing growth, Telecommunication sector is being accelerated by free and fair play
business environmental grounds set by the government (Johnson, 2009). The Tanzanian
government has sought to attract foreign investment with the Investment Act of 1997
forming part of this process. Despite challenges facing telecom industry such as high
import tariffs on telecom equipment and taxes and underdeveloped infrastructure
including railway, electricity, still there is increased investment particularly in
introduction of new services and technologies which all together promise future of
telecom market. (Johnson, 2009)
Currently, Tanzanian Telecom industry has several mobile operators namely Vodacom
Tanzania Limited, Tanzania Telecommunication Company (TTCL), Tigo Tanzania,
Bharti Airtel Limited, Zantel, Sasatel, Benson Informatics and Dovetel Limited. The
industry is characterized by fierce competition which might eventually discourage
future investment due to drastically reduction of tarrifs up to less 0.5Tsh per second.
The price war continues to enforce the operators to low their services charges every now
and then in order to capture market share and revenue. Mobile market advertisements
for different mobile operators (See Appendix 4).
It is vividly shown that all mobile operators use price competition for pursuing
customer’s loyalty. According to Mr. Rene the managing director of Vodacom
Tanzania, price competition has forced mobile operators to reduce the price
significantly. Thus, causing the drop of ARPU. Mr. Rene added that not only price
competition has caused the drop of ARPU but also expanding the network coverage to
population at the bottom of the pyramid has resulted to significant drop of ARPU
because most of people at bottom of the pyramid spend less and less on
communication. (Sebastian, 2012)
5.3. Evolution of Mobile Services
Evolution of Mobile communication technologies has revolutionized the way people/
community communicates. The integration between communication and mobility had
provided remarkable technology acceptance which have never happened before globally
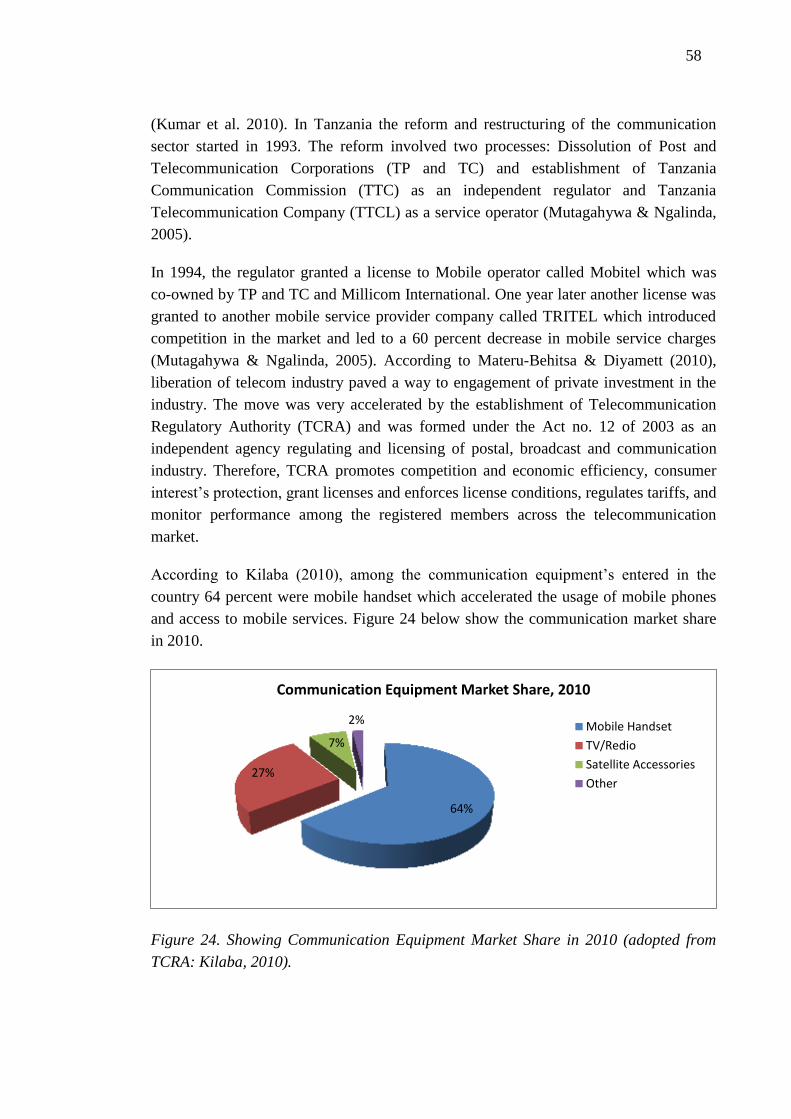
58
(Kumar et al. 2010). In Tanzania the reform and restructuring of the communication
sector started in 1993. The reform involved two processes: Dissolution of Post and
Telecommunication Corporations (TP and TC) and establishment of Tanzania
Communication Commission (TTC) as an independent regulator and Tanzania
Telecommunication Company (TTCL) as a service operator (Mutagahywa & Ngalinda,
2005).
In 1994, the regulator granted a license to Mobile operator called Mobitel which was
co-owned by TP and TC and Millicom International. One year later another license was
granted to another mobile service provider company called TRITEL which introduced
competition in the market and led to a 60 percent decrease in mobile service charges
(Mutagahywa & Ngalinda, 2005). According to Materu-Behitsa & Diyamett (2010),
liberation of telecom industry paved a way to engagement of private investment in the
industry. The move was very accelerated by the establishment of Telecommunication
Regulatory Authority (TCRA) and was formed under the Act no. 12 of 2003 as an
independent agency regulating and licensing of postal, broadcast and communication
industry. Therefore, TCRA promotes competition and economic efficiency, consumer
interest’s protection, grant licenses and enforces license conditions, regulates tariffs, and
monitor performance among the registered members across the telecommunication
market.
According to Kilaba (2010), among the communication equipment’s entered in the
country 64 percent were mobile handset which accelerated the usage of mobile phones
and access to mobile services. Figure 24 below show the communication market share
in 2010.
Figure 24. Showing Communication Equipment Market Share in 2010 (adopted from
TCRA: Kilaba, 2010).
64%
27%
7%
2%
Communication Equipment Market Share, 2010
Mobile Handset
TV/Redio
Satellite Accessories
Other
59
Advancement of mobile communication technology globally has also impacted the
Tanzanian mobile industry. The mushrooming of mobile services especially through the
umbrella of Value Added Services (VAS) has been possible due to the change of mobile
technology. The dominance of GSM technology over the CDMA has contributed to
Telecom operator to adopt a new revenue stream through VAS. Thus, VAS is a
competitive weapon in Tanzanian mobile market. Initially mobile providers only
provided voice based service. After voice business revenue has fallen significantly, all
Mobile Service providers have diversified their service portfolio to data business. Figure
25 below illustrates how mobile services have evolved in Tanzanian mobile market
Figure 26. Mobile services evolution in Tanzania. (adopted from Shams, 2013)
The fast pace in advancement of mobile technology globally has accelerated the
evolution of mobile services in the country. Each technological advance is associated
with increase in capacity, bandwidths speed, integration level and convergence. Thus,
today people have started using their mobile phones for more than making voice calls.
On the other side, handset manufacturers have flooded the market with new mobile
phones with built in advanced features/functions which attract more customers. Most of
new features deployed support many Value Added Services (VAS). Mobile services
Performance
Time
(1G)
GSM (2G)
UMTS (3G)
4G LTE
Voice
Service
only
Voices
SMS
Emails
Voice
mails
Roaming
Mobile multimedia
Teleconference
Mobile internet Mobile TV
Location based services
1999 2005 2008 2011
Video Charting
Video Messaging
TV program streaming
Narrowband
Wideband
Broadband
60
will continue to evolve based on the available enabling and supporting hardware and
mobile communication technology in the market. The next section discusses the
challenges in Tanzanian mobile market.
5.4. Challenges in Mobile Service Market
Tanzanian mobile market account prospect customers of more than 40 million
populations. The current mobile market penetration presents only 40 percent of the
population. This proves that the opportunity for growth in the market is tremendous.
Therefore, mobile operators have heavily invested in the market. For instance, mobile
operators are working hard in expanding coverage, introducing new technologies and
new solutions to address social needs and mobile consumers’ needs prevailing across
voice, data, m-business and internet. (Sebastian, 2012)
The managing director of Vodacom Tanzania said that, “…..mobile market opportunity
in Tanzania is huge. It is a market that is still at an early stage in terms of mobile
penetration and development. There is therefore a massive opportunity for Africa as a
continent to really become a prominent industry in mobile telephony”. (The citizen, Jan,
2012)
Despite the huge mobile market opportunity in Tanzanian mobile industry, the country
does not isolate from the challenges facing other developing countries particular African
nations. The following are the most crucial challenges facing Tanzanian infant mobile
market. From in-depth interview the author conducted on 02.12.2012. Participant A
reveals that, current challenges are on managing new markets to ensure reliable delivery
and maintaining both local and international competitive pricing structures. He added
that, after significant drop of voice revenue giant players in mobile business are shifting
to Value Added Services (VAS) which threatens the power of small players whose core
competence was on Value Added Service (VAS). Mobile operators used to partner with
Mobile operators to provide gateways for different mobile services. But recently the
trend has now changed, value added service market has been invaded by giant mobile
operators and it creates difficult business environment for small players to compete.
Although some of the small players have benefited from acquisition.
The author held an in-depth interview with Participant D on 14.12.2012. Upon probing
Participant D revealed more challenges on the mobile industry. Participant D mentioned
poor infrastructure as the main hindrance for efforts to expand the coverage of mobile
networks to rural areas. Not only rural areas but also the urban areas lack sustainable
and stable power supply which results to higher running cost in maintaining the
coverage. In addition, Participant D stated that high rate of Tax also affects the business.
The facts that the market for voice is saturated and the price have gone down
significantly due stiff price competition arising. Therefore, high government tax cuts
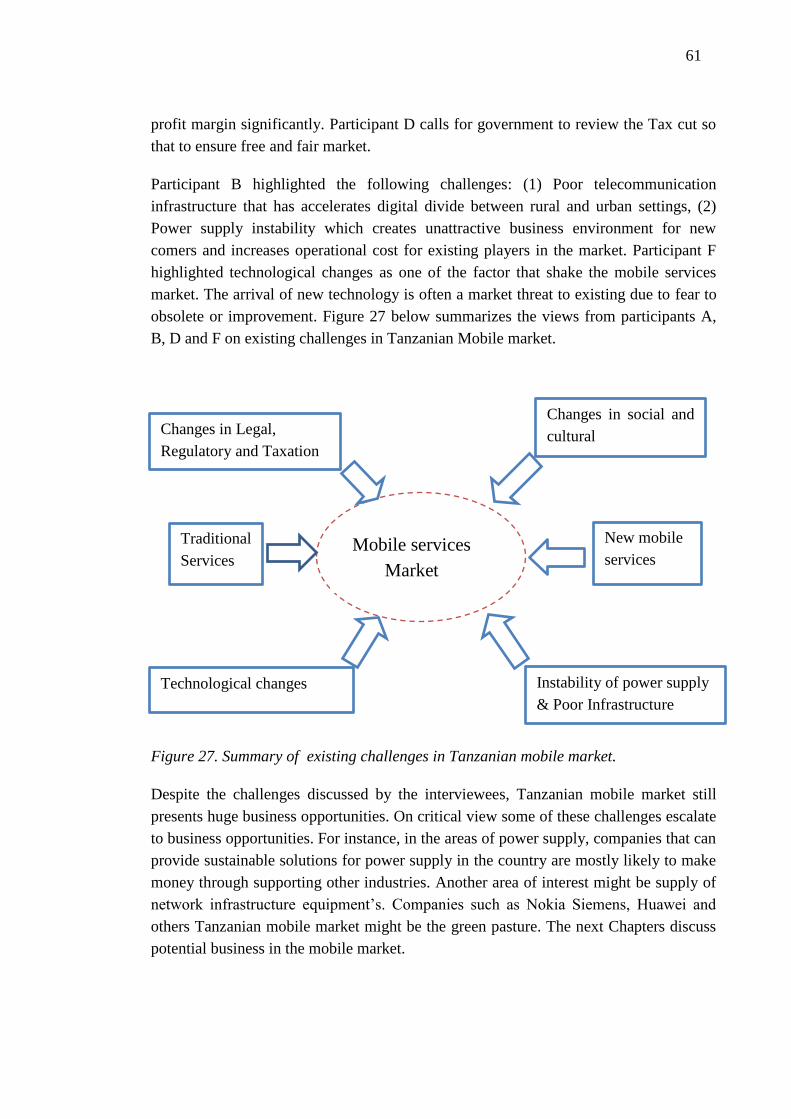
61
profit margin significantly. Participant D calls for government to review the Tax cut so
that to ensure free and fair market.
Participant B highlighted the following challenges: (1) Poor telecommunication
infrastructure that has accelerates digital divide between rural and urban settings, (2)
Power supply instability which creates unattractive business environment for new
comers and increases operational cost for existing players in the market. Participant F
highlighted technological changes as one of the factor that shake the mobile services
market. The arrival of new technology is often a market threat to existing due to fear to
obsolete or improvement. Figure 27 below summarizes the views from participants A,
B, D and F on existing challenges in Tanzanian Mobile market.
Figure 27. Summary of existing challenges in Tanzanian mobile market.
Despite the challenges discussed by the interviewees, Tanzanian mobile market still
presents huge business opportunities. On critical view some of these challenges escalate
to business opportunities. For instance, in the areas of power supply, companies that can
provide sustainable solutions for power supply in the country are mostly likely to make
money through supporting other industries. Another area of interest might be supply of
network infrastructure equipment’s. Companies such as Nokia Siemens, Huawei and
others Tanzanian mobile market might be the green pasture. The next Chapters discuss
potential business in the mobile market.
Changes in Legal,
Regulatory and Taxation
Changes in social and
cultural
Technological changes Instability of power supply
& Poor Infrastructure
Mobile services
Market
Traditional
Services
New mobile
services
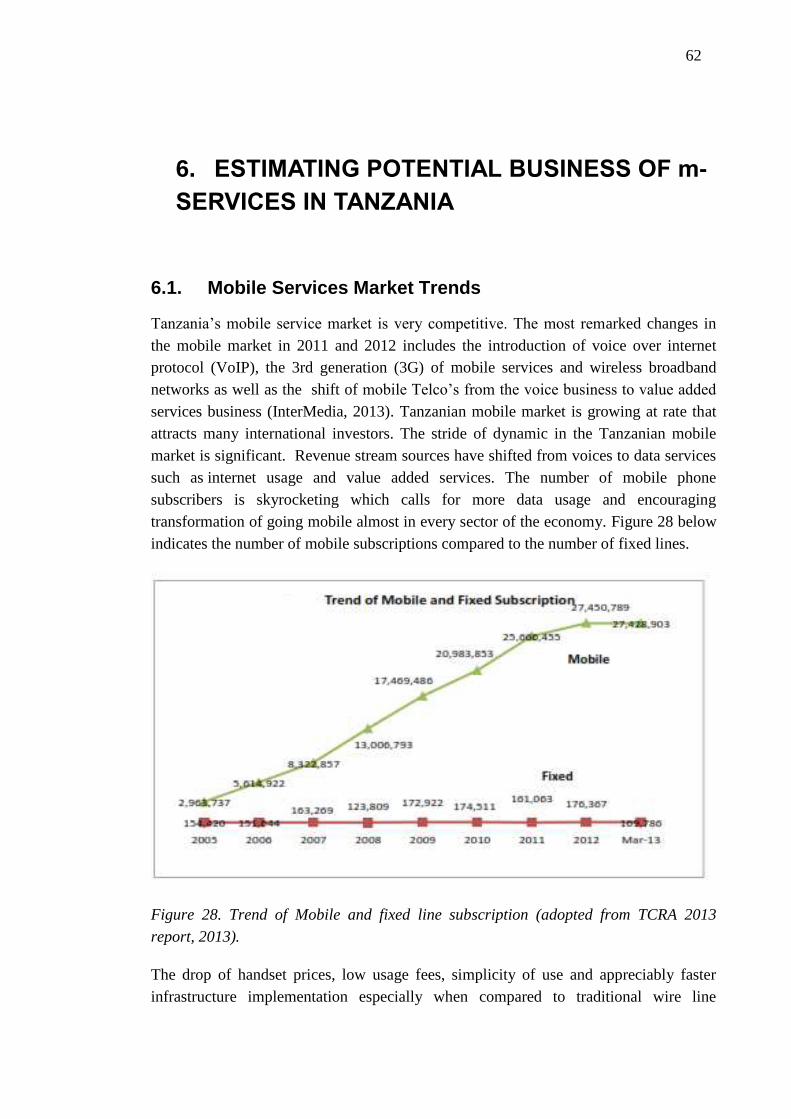
62
6. ESTIMATING POTENTIAL BUSINESS OF m-
SERVICES IN TANZANIA
6.1. Mobile Services Market Trends
Tanzania’s mobile service market is very competitive. The most remarked changes in
the mobile market in 2011 and 2012 includes the introduction of voice over internet
protocol (VoIP), the 3rd generation (3G) of mobile services and wireless broadband
networks as well as the shift of mobile Telco’s from the voice business to value added
services business (InterMedia, 2013). Tanzanian mobile market is growing at rate that
attracts many international investors. The stride of dynamic in the Tanzanian mobile
market is significant. Revenue stream sources have shifted from voices to data services
such as internet usage and value added services. The number of mobile phone
subscribers is skyrocketing which calls for more data usage and encouraging
transformation of going mobile almost in every sector of the economy. Figure 28 below
indicates the number of mobile subscriptions compared to the number of fixed lines.
Figure 28. Trend of Mobile and fixed line subscription (adopted from TCRA 2013
report, 2013).
The drop of handset prices, low usage fees, simplicity of use and appreciably faster
infrastructure implementation especially when compared to traditional wire line
63
telephony, speed scaling up in remote areas (Dutt, 2006). Also arrival of smartphones in
minority promises for future mobile services usage.
Participant B said ”....... recently our mobile market have been invaded by fancy mobile
phones and these phones are enabled to do more on data usage, more functionalities,
features and internet surfing”. Therefore, the community have to adapt quickly on use
of smartphones in order to explores numerous mobile services.
Participant A and F beliefs that the future of mobile market will depend on the
following factors: (i) Data services business (ii) Technology innovation (iii) Sustainable
business model. On probing Participant A explicit added that the shift of revenue stream
from voice to data services will continues to rise the pace for growth of mobile market.
Also Participant A state that significant network technologies enhancements will led to
faster data networks and service innovation will improve the customer experience.
In an interview participant D mentioned that ”.........mobile services delivery channels
such USSD, SMS messaging and Web based access provides limitations to part of the
population”. For instance, rural population suits for USSD and SMS messaging due to
low market penetration of smartphones or web enabled phones or GPRS enabled
phones. In addition, Participant D said that ”...the rapid growth of smartphones market
penetration to disadvantaged community will increase the demand for more and more
mobile services in Tanzania”. Thus, accelerates efforts for scalling up the usage of
mobile service across all the areas of economic developement such Agriculture,
Education, Healthcare and Financial sectors.
6.2. Potential Mobile Service Segments
Potential of Mobile services cuts across all economic sectors. However, the potentiality
differ from one mobile market segemnt to another. Based the interviews conducted by
the author, interviewees identified and selected the most potential mobile market
segemnts. Table 11 summarizes the results on question of identifying the most potential
mobile services segment in Tanzania.
In an interview Participant F said that ”......... mobile service escalating in healthcare
services provides positive potential for m-health projects. However, before scaling up
to large population there must be a rigorous evaluation to understand community
problem and the level of impacts of such investment”. In other words, mobile services in
Healthcare service should address a community technological need in order to get a
popular acceptance either at the community level or at the managerial level.
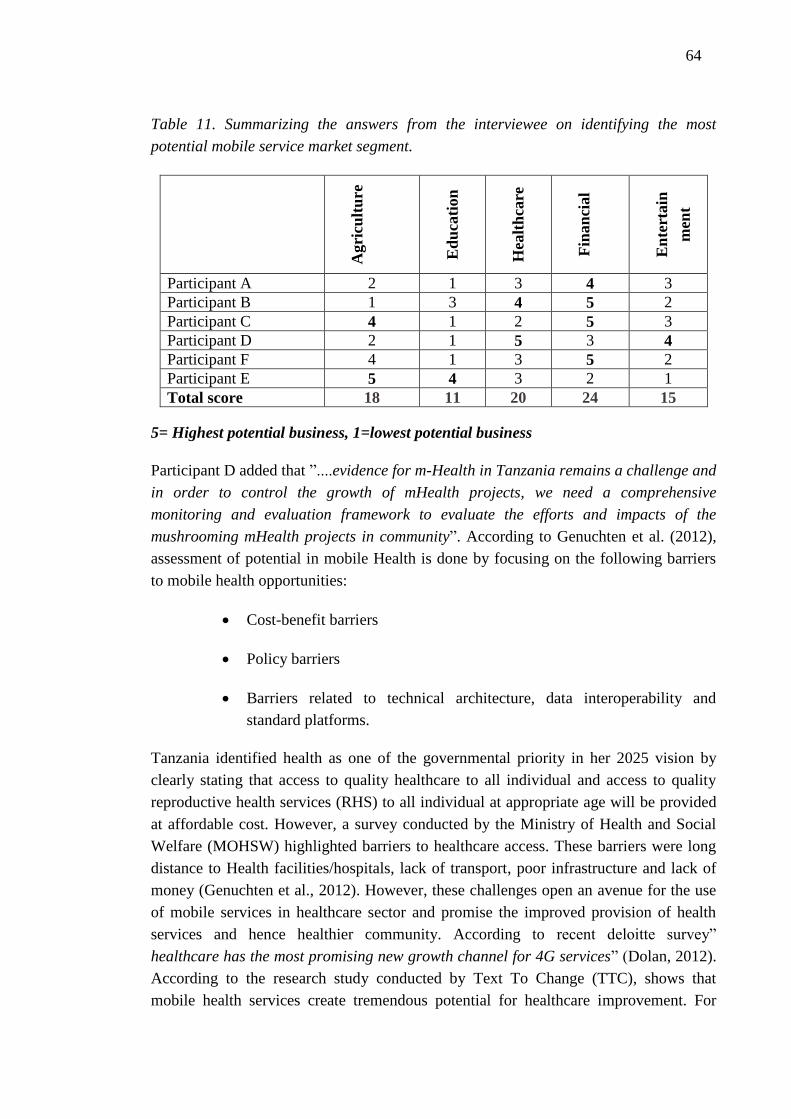
64
Table 11. Summarizing the answers from the interviewee on identifying the most
potential mobile service market segment.
Agri
cult
ure
Ed
uca
tion
Hea
lth
care
Fin
an
cial
En
tert
ain
men
t
Participant A 2 1 3 4 3
Participant B 1 3 4 5 2
Participant C 4 1 2 5 3
Participant D 2 1 5 3 4
Participant F 4 1 3 5 2
Participant E 5 4 3 2 1
Total score 18 11 20 24 15
5= Highest potential business, 1=lowest potential business
Participant D added that ”....evidence for m-Health in Tanzania remains a challenge and
in order to control the growth of mHealth projects, we need a comprehensive
monitoring and evaluation framework to evaluate the efforts and impacts of the
mushrooming mHealth projects in community”. According to Genuchten et al. (2012),
assessment of potential in mobile Health is done by focusing on the following barriers
to mobile health opportunities:
Cost-benefit barriers
Policy barriers
Barriers related to technical architecture, data interoperability and
standard platforms.
Tanzania identified health as one of the governmental priority in her 2025 vision by
clearly stating that access to quality healthcare to all individual and access to quality
reproductive health services (RHS) to all individual at appropriate age will be provided
at affordable cost. However, a survey conducted by the Ministry of Health and Social
Welfare (MOHSW) highlighted barriers to healthcare access. These barriers were long
distance to Health facilities/hospitals, lack of transport, poor infrastructure and lack of
money (Genuchten et al., 2012). However, these challenges open an avenue for the use
of mobile services in healthcare sector and promise the improved provision of health
services and hence healthier community. According to recent deloitte survey”
healthcare has the most promising new growth channel for 4G services” (Dolan, 2012).
According to the research study conducted by Text To Change (TTC), shows that
mobile health services create tremendous potential for healthcare improvement. For
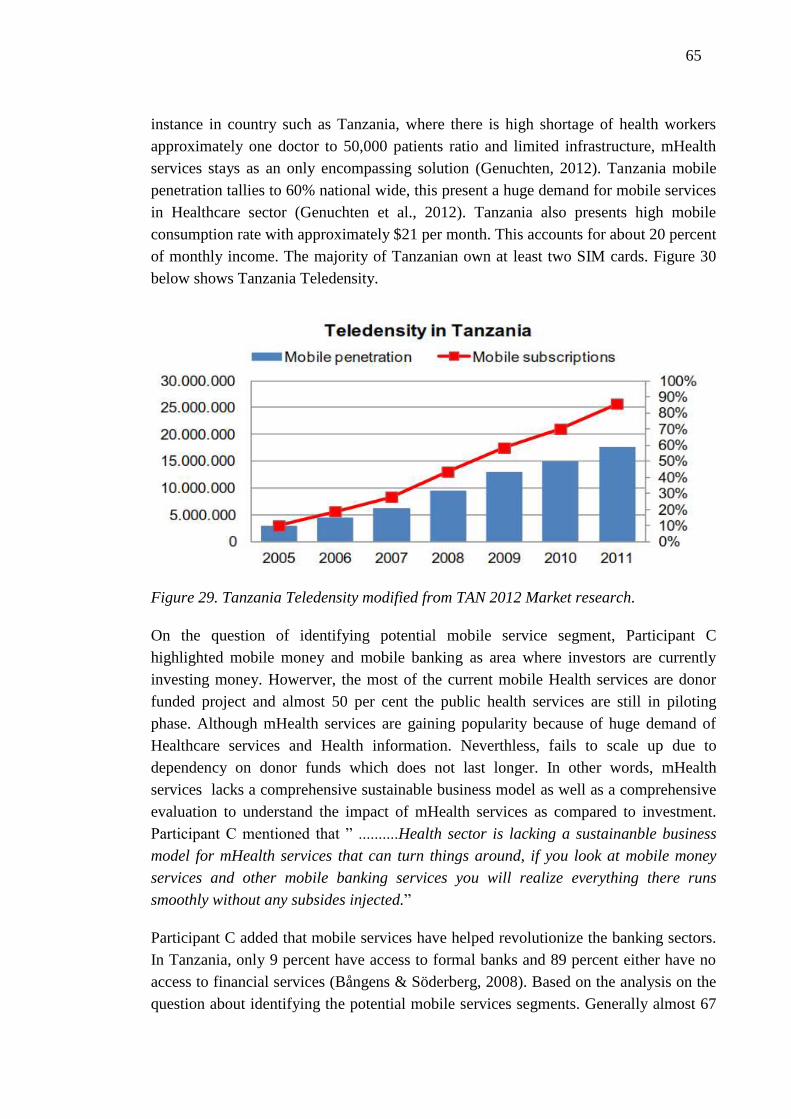
65
instance in country such as Tanzania, where there is high shortage of health workers
approximately one doctor to 50,000 patients ratio and limited infrastructure, mHealth
services stays as an only encompassing solution (Genuchten, 2012). Tanzania mobile
penetration tallies to 60% national wide, this present a huge demand for mobile services
in Healthcare sector (Genuchten et al., 2012). Tanzania also presents high mobile
consumption rate with approximately $21 per month. This accounts for about 20 percent
of monthly income. The majority of Tanzanian own at least two SIM cards. Figure 30
below shows Tanzania Teledensity.
Figure 29. Tanzania Teledensity modified from TAN 2012 Market research.
On the question of identifying potential mobile service segment, Participant C
highlighted mobile money and mobile banking as area where investors are currently
investing money. Howerver, the most of the current mobile Health services are donor
funded project and almost 50 per cent the public health services are still in piloting
phase. Although mHealth services are gaining popularity because of huge demand of
Healthcare services and Health information. Neverthless, fails to scale up due to
dependency on donor funds which does not last longer. In other words, mHealth
services lacks a comprehensive sustainable business model as well as a comprehensive
evaluation to understand the impact of mHealth services as compared to investment.
Participant C mentioned that ” ..........Health sector is lacking a sustainanble business
model for mHealth services that can turn things around, if you look at mobile money
services and other mobile banking services you will realize everything there runs
smoothly without any subsides injected.”
Participant C added that mobile services have helped revolutionize the banking sectors.
In Tanzania, only 9 percent have access to formal banks and 89 percent either have no
access to financial services (Bångens & Söderberg, 2008). Based on the analysis on the
question about identifying the potential mobile services segments. Generally almost 67
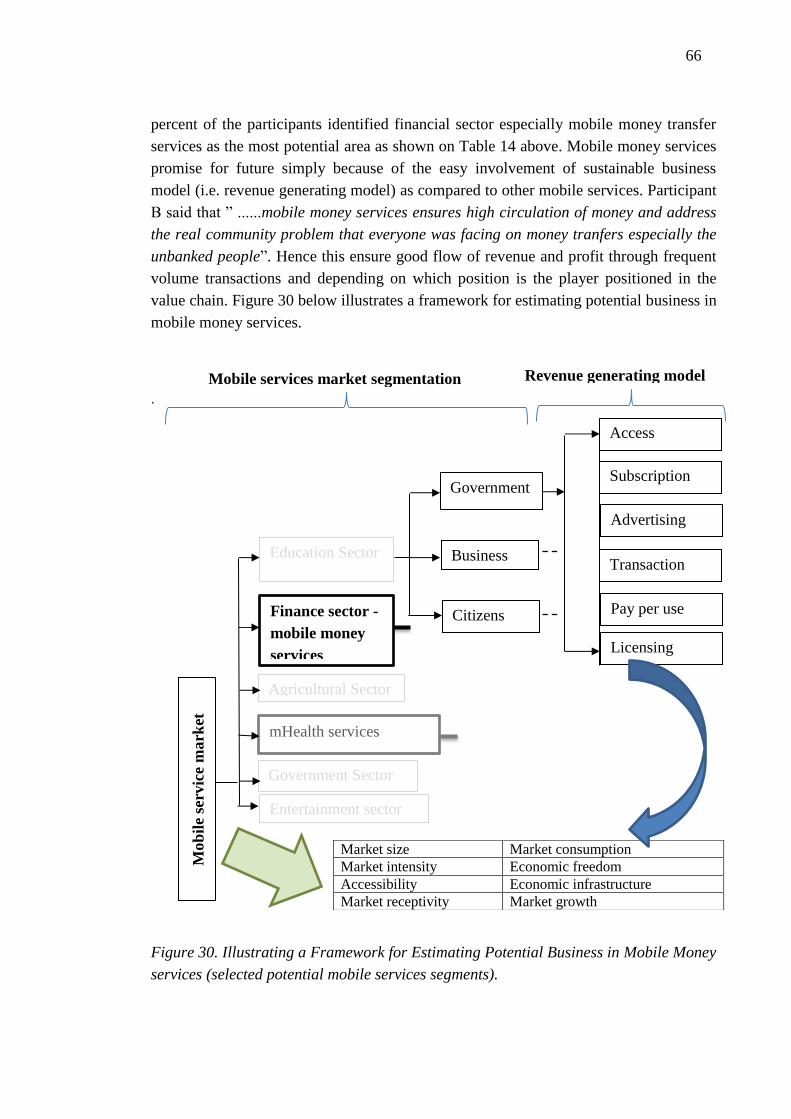
66
percent of the participants identified financial sector especially mobile money transfer
services as the most potential area as shown on Table 14 above. Mobile money services
promise for future simply because of the easy involvement of sustainable business
model (i.e. revenue generating model) as compared to other mobile services. Participant
B said that ” ......mobile money services ensures high circulation of money and address
the real community problem that everyone was facing on money tranfers especially the
unbanked people”. Hence this ensure good flow of revenue and profit through frequent
volume transactions and depending on which position is the player positioned in the
value chain. Figure 30 below illustrates a framework for estimating potential business in
mobile money services.
.
Figure 30. Illustrating a Framework for Estimating Potential Business in Mobile Money
services (selected potential mobile services segments).
Market size Market consumption
Market intensity Economic freedom
Accessibility Economic infrastructure
Market receptivity Market growth
Mob
ile
serv
ice
mark
et
Education Sector
Finance sector -
mobile money
services
mHealth services
Government Sector
Entertainment sector
Government
Business
Citizens
Access
Agricultural Sector
Subscription
Advertising
Transaction
Pay per use
Licensing
model
Mobile services market segmentation Revenue generating model
67
This Section has discussed potential mobile services segment based on the interviews.
According to participants mobile money service segment is the most promising mobile
segment now in Tanzania followed by mobile Health. In real sense the other mobile
market segments namely agriculture, education and entertainment will soon be the green
pasture when Mobile money and mobile Health will reach at saturated stage. Thus,
present the future opportunities if the designed mobile solutions in these sectors will be
addressing the real community problems that help to develop a sustainable business
model. The next Subchapter discusses in more details the mobile money services in
Tanzania as well as estimating potential business associated using a developed
framework.
6.3. Estimating Potential Business: m-Money Service
Mobile money transfer services in Africa particular Tanzania is linked with too much
hype. Mobile payment has shown early success in Kenya, Nigeria and South Africa. It
is believed that 80 per cent of African population is unbanked. However, the dramatic
adoption of the mobile phones across Tanzania and other African countries speed up
motives for investment initiatives in mobile payment operation around the continent.
According to Nilsson (2012), a significant percentage of the population in the
developing world particularly Tanzania have mobile phones but have no bank accounts.
Thus, there are more people who have access to mobile phone than those who have
bank account. Therefore, cashless transactions through mobile money are indeed a great
alternative. Although differentiated approach is needed and not only “cut and paste”
approach in order to overcome unique country challenges. (Businessday, 2013)
Mobile money business in Tanzania has come as savior to unbanked population
specifically people living in remote areas. According to Intermedia survey conducted in
2013, 63 per cent of the household covered have access to mobile phones and 55 per
cent of the households at least own one active SIM card. Furthermore, 35 percent of
households in Tanzania have at least mobile money user and 33 percent of the
households have registered for mobile money user (Intermedia, 2013). Being able to
send and receive money is of major importance for any community especially in
developing world. Thus support for the immense uptake of Mobile Money transfer
services in the community at large (Bångens & Söderberg, 2008). According to Bångens
& Söderberg (2008), the main money flows are known to be from urban to rural areas
where a relatively well-off person to disadvantaged people lives.
According to recent Intermedia survey Tanzania has several mobile money transfer
services providers namely M-Pesa, Tigo Pesa, Airtel money, Max malipo and Ezy pesa.
Figure 31 below illustrates the market share of the of mobile money services per mobile
operators.
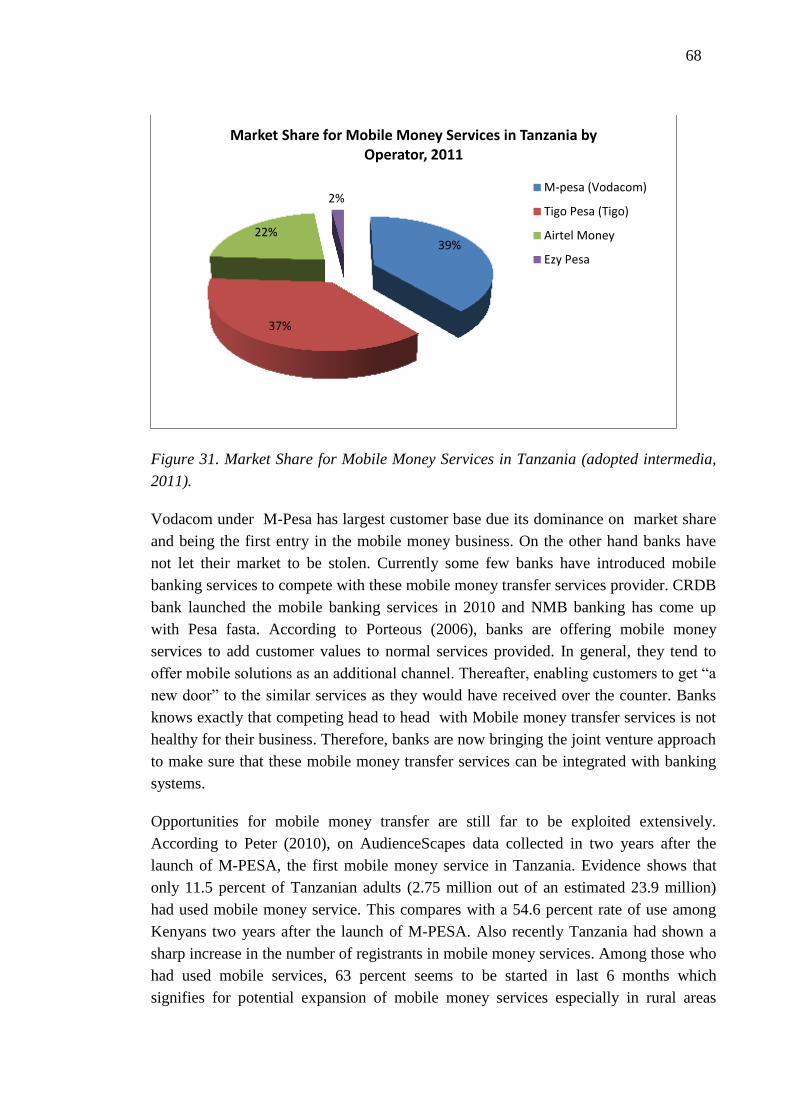
68
Figure 31. Market Share for Mobile Money Services in Tanzania (adopted intermedia,
2011).
Vodacom under M-Pesa has largest customer base due its dominance on market share
and being the first entry in the mobile money business. On the other hand banks have
not let their market to be stolen. Currently some few banks have introduced mobile
banking services to compete with these mobile money transfer services provider. CRDB
bank launched the mobile banking services in 2010 and NMB banking has come up
with Pesa fasta. According to Porteous (2006), banks are offering mobile money
services to add customer values to normal services provided. In general, they tend to
offer mobile solutions as an additional channel. Thereafter, enabling customers to get “a
new door” to the similar services as they would have received over the counter. Banks
knows exactly that competing head to head with Mobile money transfer services is not
healthy for their business. Therefore, banks are now bringing the joint venture approach
to make sure that these mobile money transfer services can be integrated with banking
systems.
Opportunities for mobile money transfer are still far to be exploited extensively.
According to Peter (2010), on AudienceScapes data collected in two years after the
launch of M-PESA, the first mobile money service in Tanzania. Evidence shows that
only 11.5 percent of Tanzanian adults (2.75 million out of an estimated 23.9 million)
had used mobile money service. This compares with a 54.6 percent rate of use among
Kenyans two years after the launch of M-PESA. Also recently Tanzania had shown a
sharp increase in the number of registrants in mobile money services. Among those who
had used mobile services, 63 percent seems to be started in last 6 months which
signifies for potential expansion of mobile money services especially in rural areas
39%
37%
22%
2%
Market Share for Mobile Money Services in Tanzania by Operator, 2011
M-pesa (Vodacom)
Tigo Pesa (Tigo)
Airtel Money
Ezy Pesa

69
where the mobile network operators have started focusing especialy on improving
coverage and supplying cheap phones. Figure 32 below show mobile phone ownership
and access at the household level and the mobile money usage.
Figure 32. General Mobile Phone Access and Use Among Adults (Adopted from Africa
Development Research Brief by Peter, 2010).
There is still huge demand of mobile money services almost across all the economic
sectors in the country. According to International Finance Corporation (2010), high
payments have contributed significantly in enabling informal economic activity. Early
uptake of mobile money transfer services has high demand in rural areas. Thus,
strengthen the rural-urban cash flow. Nevertheless, Kenya where 70% of remittances
flow from urban to rural areas, Tanzania does not demonstrate a clear dominant
remittance pattern. According to Bångens & Söderberg (2008), mobile money transfer
services not only bring in convenience and simplifies the process of sending and
receiving money at personal to personal transactions but also provides tremendous
benefits to micro and small-sized enterprises (SME’s) in Tanzania. According to
Swisscontact 2010 household survey conducted in five regions in 2010, it is suggested
that there are about 2,685,404 SMEs in Tanzania. Mobile money transfer services have
brought the following benefits:
Help SMEs to reduce liquidity and solidity by paying the suppliers on time
MSEs engaging in mobile money transfer services show certain characteristics
For instance, long-term business relationships that build trust
Saves time and improve the logistic activities
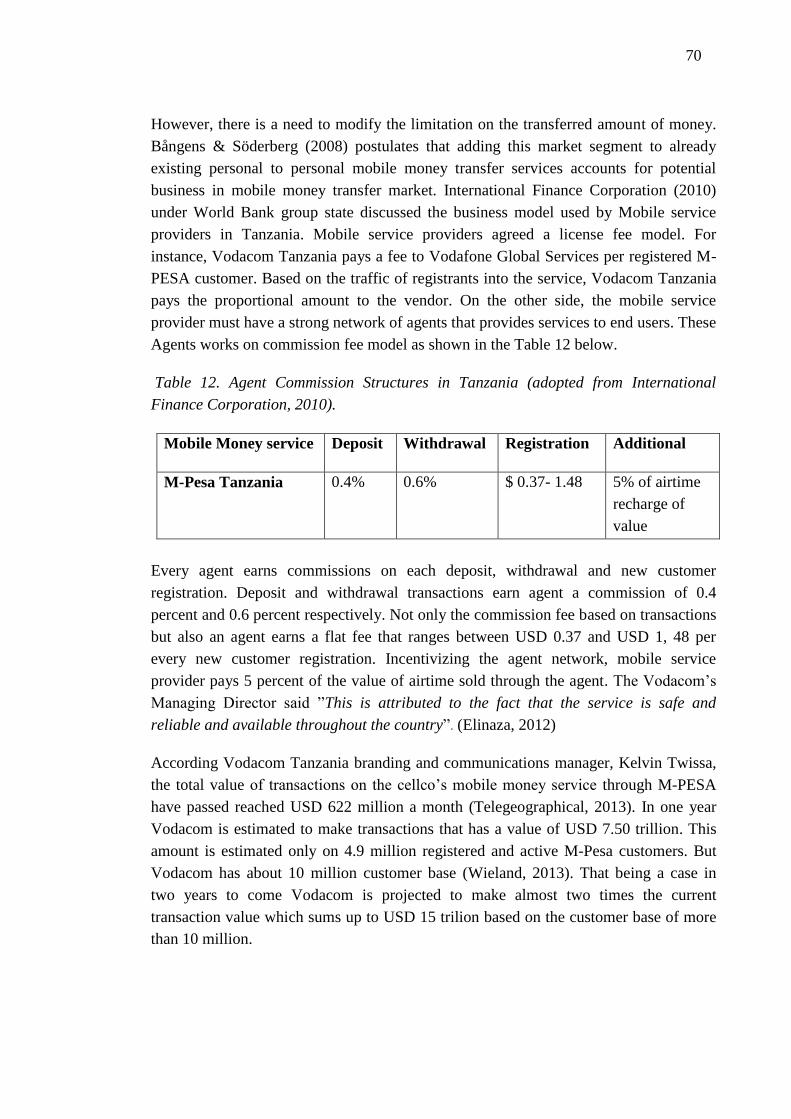
70
However, there is a need to modify the limitation on the transferred amount of money.
Bångens & Söderberg (2008) postulates that adding this market segment to already
existing personal to personal mobile money transfer services accounts for potential
business in mobile money transfer market. International Finance Corporation (2010)
under World Bank group state discussed the business model used by Mobile service
providers in Tanzania. Mobile service providers agreed a license fee model. For
instance, Vodacom Tanzania pays a fee to Vodafone Global Services per registered M-
PESA customer. Based on the traffic of registrants into the service, Vodacom Tanzania
pays the proportional amount to the vendor. On the other side, the mobile service
provider must have a strong network of agents that provides services to end users. These
Agents works on commission fee model as shown in the Table 12 below.
Table 12. Agent Commission Structures in Tanzania (adopted from International
Finance Corporation, 2010).
Mobile Money service Deposit Withdrawal Registration Additional
M-Pesa Tanzania 0.4% 0.6% $ 0.37- 1.48 5% of airtime
recharge of
value
Every agent earns commissions on each deposit, withdrawal and new customer
registration. Deposit and withdrawal transactions earn agent a commission of 0.4
percent and 0.6 percent respectively. Not only the commission fee based on transactions
but also an agent earns a flat fee that ranges between USD 0.37 and USD 1, 48 per
every new customer registration. Incentivizing the agent network, mobile service
provider pays 5 percent of the value of airtime sold through the agent. The Vodacom’s
Managing Director said ”This is attributed to the fact that the service is safe and
reliable and available throughout the country”. (Elinaza, 2012)
According Vodacom Tanzania branding and communications manager, Kelvin Twissa,
the total value of transactions on the cellco’s mobile money service through M-PESA
have passed reached USD 622 million a month (Telegeographical, 2013). In one year
Vodacom is estimated to make transactions that has a value of USD 7.50 trillion. This
amount is estimated only on 4.9 million registered and active M-Pesa customers. But
Vodacom has about 10 million customer base (Wieland, 2013). That being a case in
two years to come Vodacom is projected to make almost two times the current
transaction value which sums up to USD 15 trilion based on the customer base of more
than 10 million.

71
Business Potential Estimates
(1) Vodacom made value transactions of USD 622 million in a month end
March 2013. (Telegeographical, 2013)
(2) Vodacom made value transactions of USD 7.5 trillion (622*12) in a year.
(Telegeographical, 2013)
(3) Estimated registered customers mobile money--- 4.9 million (Wieland,
2013).
(4) Consumption rate (ARPU) ---------------------------1.50 USD (Wieland,
2013)
(5) Estimated Vodacom mobile subscribers (Market size) ---10 million
(Intermedia, 2011).
Transactions value for MPESA for calculated and estimated to be USD 7.5 trillion
two years to come assumption that Vodacom will reach out to all 10 million customer
base with Mpesa service. However, from the Figure 32 which show the market share of
mobile money services in Tanzanian mobile market. Mpesa under vodacom leads the
market with a share of 39 per cent followed closely by Tigo pesa 37 percent, Airtel
money 22 percent and Ezypesa is 2 percent.
Therefore,
In two years with assumption that the market shares hold as it is 39 percent is projected
to account for USD 7.5 trillion. That means,,
By a simple math ratio:
USD 7.5 trillion------------------39 (Mpesa) percent
USD ? million---------------------37 (Tigopesa) percent
In this equation: Tigo pesa in two year will be having a transaction value of USD 7.12
trillion, Airtel money will be having a transaction value of USD 4.23 trillion and Ezy
pesa transactions value will be tallying to USD 0.4 trillion. In general the total
transaction value in Tanzanian mobile money services market will tallying to an
estimated transactions value of USD 19.23 trillion in 2016. This presents the estimated
business potential in mobile money services.
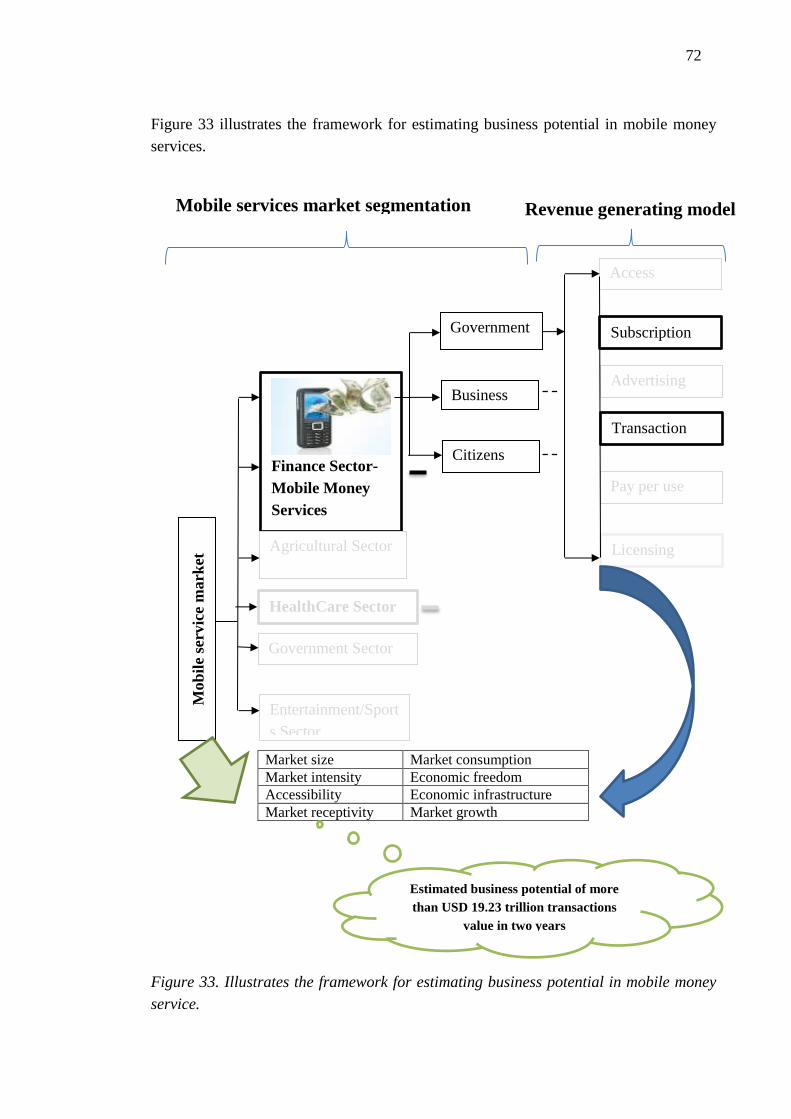
72
Figure 33 illustrates the framework for estimating business potential in mobile money
services.
Figure 33. Illustrates the framework for estimating business potential in mobile money
service.
Market size Market consumption
Market intensity Economic freedom
Accessibility Economic infrastructure
Market receptivity Market growth
Mob
ile
serv
ice
mark
et
Education Sector
Finance Sector-
Mobile Money
Services
HealthCare Sector
Government Sector
Entertainment/Sport
s Sector
Government
Business
Citizens
Access
Agricultural Sector
Subscription
Advertising
Transaction
Pay per use
Licensing
Mobile services market segmentation Revenue generating model
Estimated business potential of more
than USD 19.23 trillion transactions
value in two years
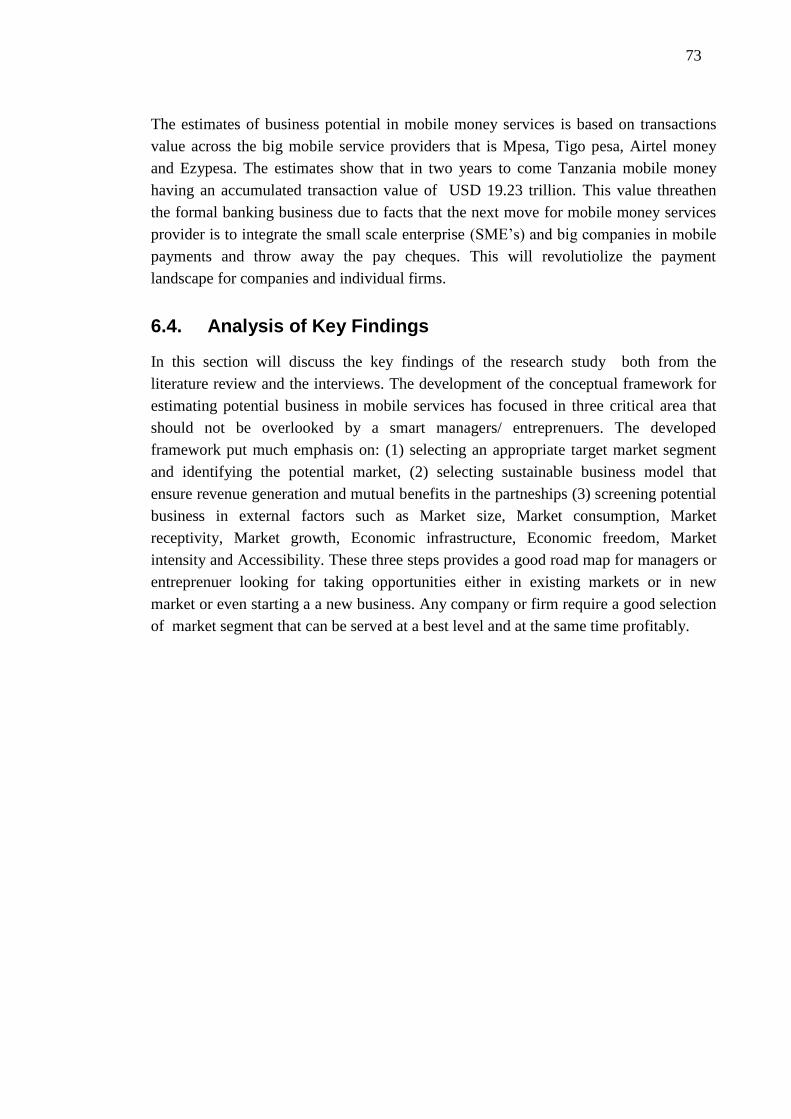
73
The estimates of business potential in mobile money services is based on transactions
value across the big mobile service providers that is Mpesa, Tigo pesa, Airtel money
and Ezypesa. The estimates show that in two years to come Tanzania mobile money
having an accumulated transaction value of USD 19.23 trillion. This value threathen
the formal banking business due to facts that the next move for mobile money services
provider is to integrate the small scale enterprise (SME’s) and big companies in mobile
payments and throw away the pay cheques. This will revolutiolize the payment
landscape for companies and individual firms.
6.4. Analysis of Key Findings
In this section will discuss the key findings of the research study both from the
literature review and the interviews. The development of the conceptual framework for
estimating potential business in mobile services has focused in three critical area that
should not be overlooked by a smart managers/ entreprenuers. The developed
framework put much emphasis on: (1) selecting an appropriate target market segment
and identifying the potential market, (2) selecting sustainable business model that
ensure revenue generation and mutual benefits in the partneships (3) screening potential
business in external factors such as Market size, Market consumption, Market
receptivity, Market growth, Economic infrastructure, Economic freedom, Market
intensity and Accessibility. These three steps provides a good road map for managers or
entreprenuer looking for taking opportunities either in existing markets or in new
market or even starting a a new business. Any company or firm require a good selection
of market segment that can be served at a best level and at the same time profitably.
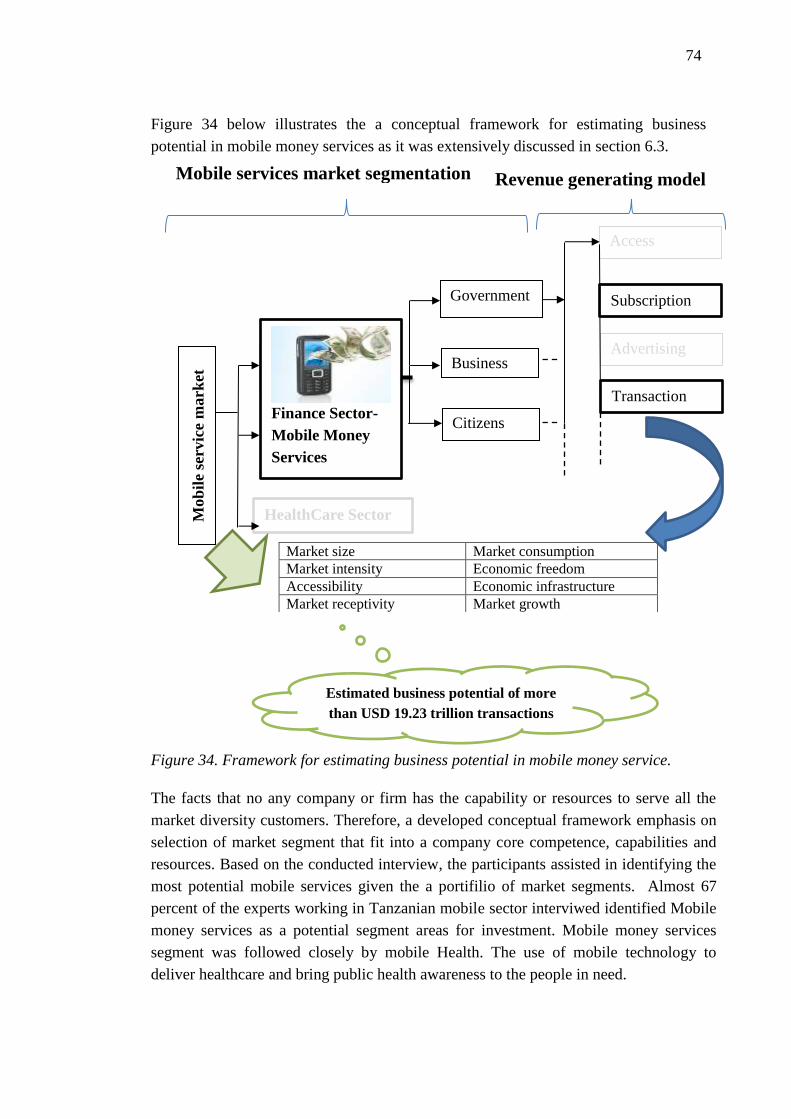
74
Figure 34 below illustrates the a conceptual framework for estimating business
potential in mobile money services as it was extensively discussed in section 6.3.
Figure 34. Framework for estimating business potential in mobile money service.
The facts that no any company or firm has the capability or resources to serve all the
market diversity customers. Therefore, a developed conceptual framework emphasis on
selection of market segment that fit into a company core competence, capabilities and
resources. Based on the conducted interview, the participants assisted in identifying the
most potential mobile services given the a portifilio of market segments. Almost 67
percent of the experts working in Tanzanian mobile sector interviwed identified Mobile
money services as a potential segment areas for investment. Mobile money services
segment was followed closely by mobile Health. The use of mobile technology to
deliver healthcare and bring public health awareness to the people in need.
Market size Market consumption
Market intensity Economic freedom
Accessibility Economic infrastructure
Market receptivity Market growth
Mob
ile
serv
ice
mark
et Education Sector
Finance Sector-
Mobile Money
Services
HealthCare Sector
Government
Business
Citizens
Access
Subscription
Advertising
Transaction
Mobile services market segmentation Revenue generating model
Estimated business potential of more
than USD 19.23 trillion transactions
value in two years
75
For instance, Participant F said that ”Mobile money services are saviour to poor people
living in remote areas in which receiving money from a friend or relatives living in town
who require 50 to 100 kilometer trip to the nearby bank to queue for some hours but
now it is through the phone and the money is on his/her finger tips”. Participant D
added that ” emergence of mobile money services in the market has forced Banking
sector to improve on customer care and to adopt technology quickly to respond to
competitive forces in the market”.
Both mobile money and mHealth were ranked highly by the participants. However,
mobile money services business is a bit far from the mobile Health services due the fact
that there is already well functioning business infrastructure such as legal procedure,
security policy, revenue sharing systems in the financial sector as compared to
Healthcare sector. Therefore, it vividly easier to involve interseted partners in a mutual
benefits partneship and establish a comprehensive business sustainable model for the
services. Participants D mentioned that ”challenges facing Healthcare sector
particularly in deploying mobile services is that almost more 90 percent of mHealth
services are strongly supported by donors funds”.
This implies the lack of a business sustainable model that show how clearly a private
sector can mutually benefits from the services. In long run when donor funds ends the
services dies a natural death. However, in responding to competitive rivaly private
sectors have started looking for partnership and inniatives for including health content
as value added services to the community. Recently, mobile money services through
only one mobile service provider Vodacom under M-Pesa makes transactions that tally
to a total of TZS 65 bilion a year according to Vodacom Managing director. According
to the Bank of Tanzania governor mentioned that mobile transactions value have
exploded from TZS 1.8 bilion to TZS 1.7 trillion from 2010 (Telegeographical, 2013).
The governor added that
”.........millions of Tanzanians without bank accounts were still able to use mobile
payment service to make payments, send remittances and store funds for short periods.
Also the institutions have reduced risks of carrying cash, cost savings on travel
expenses while M-banking and M-payments has virtually obliterated physical distances
in terms of effecting payment of bills among others”. (Communication Africa, 2012)
Therefore, mobile money services market segments presents potential business and
attracts more investors in Tanzania.
After identification of the most potential mobile segment, the manager has to select a
sustainable business model that will ensure revenue generation in the value chain. The
sustainable revenue generating model is driven by derived demands. In Business to
Business market it is impossible to estimate business potential without throwing an
acute eye to see what is the customers of the customers are doing. In a framework
76
developed, revenue generating models are discussed as the most critical factors in
estimating business of mobile services. Based the characteristics of mobile services each
mobile service can be identified by the revenue generating models. In mobile money
services a combination of revenue generating models are applied in order to adhere to
mutual benefit partnership in the value chain. In estimating business potential in mobile
money services two revenue generating model were applied. The potential of mobile
money service is estimated based on the transactions value a the providers perform in a
period of time. In this case each transaction has a fee to be completed and meanwhile
the agents and other players in the value chain has an agreed percentage deduction that
given the profit margin at the end of the business. Another revenue generating model
involved in the mobile money service it the subscription, this model generates revenue
in two approaches. First is when a customer join a service and pay a single fee for
joining. Second revenue model is based on subscribing for time and package. For
instance, in mobile money services each subscription an agents get a percentage of
income. Thus, generates revenue across the partners in the value chain.
The other important part where the framework has explored is the market assesement
factors. In estimating the potential business of mobile services assessment factors
plays an a crucial role in ensuring the market is attractive to investors. A developed
conceptual framework covers nine dimensions which intends to screen the market and
measure the potential of the market. First, the market size measures the total
population in the market segment. The market segment that was identified by the
interviwees account for a total of more than 20 million mobile subscribers in Tanzania
in 2013. Therefore, the number indicates the target market for mobile money services.
According to (TCRA) (2011), the number of mobile subscribers is expected to explode
up to 37 million in 2016. Second, accessibility, according to Kotler & Keller (2009),
market segment is considered potential if it is reachable, accessible and quantifiable.
Therefore, no matter how attractive the market is, it should be reachable and
accessible to make economic sense. Tanzanian mobile money services target segment
is distributed into locations: rural covers approximately 80 percent and urban 20
percent of the total population.
Third, market growth, telecommunication industry in Tanzania is skyrocketing as the
number of mobile subscribers is increasing drastically and more and more demands
for services is increasing. Fouth, market consumption rate, the middle class population
accounts for 40 percent of the population and the recent ARPU average revenue per
user is $1.50 (Wieland, 2013). Fifth, market intensity measures increasing demand of
products According to (TCRA) (2011), the demands for mobile services growth
increase by 15% per annually. Sixth, economic freedom measure for taxation policy
and capital flow and investment. Tanzanian mobile service market has shown the
high potential of growth despite the facts that the country has poor infrastructure
77
especially in rural areas. Also, the Government has enforced economic freedom
through reduction of taxes especially on ICT equipment imported in the country to
set fair ground for competition in the industry. Seventh, According to Bank of
Tanzania (BOT) in 2011, Tanzania accrued annual average imports of USD 5834.1
million and with a GDP per capital of USD 600 which is subjected to growth rate
of 7% per year. These data indicates market receptivity and intensity in Tanzania.
Eighth, Tanzanian mobile services market has proven to be potential, according to
World Bank ranking, Tanzania is seventh country in Africa to attract Telecoms
investors. The statistics shows that in between 1998 and 2008, $1.4 trillion
(TZS 2,240 trillion) was injected in mobile service market (Special report, 2011). A
developed conceptual framework covers all these factors to ensure that the estimated
business in mobile money services is screened and presents attractive market for
investors.
This Chapter has discussed in details the market trends that are prevailing in
Tanzanian mobile services market and complemented by opinions from interviews
conducted by the author. Also this Chapter identifies the potential mobile services
market segments. In addition, this Chapter apply the developed conceptual framework
in Tanzanian mobile money segment to estimated potential business in mobile money
services business. Finally, this Chapter provides the analysis of key findings. The next
Chapter concludes the long journey of this research study by a summary of the
research study and discussing managerial implications of this key findings as well as
proposing a further research study.
78
7. CONCLUSIONS
7.1. Summary of the Research Study
Recent convergence of mobile and communication technologies has resulted to mobile
services. The fast adoption of the mobile services has been accelerated by the high market
penetration of mobile phones both in developed market and underdeveloped market.
Mobile services business has not gained popularity for nothing but rather mobile services
have significant benefits both in B2B and B2C markets by enhancing mobility,
accessibility and efficiency in business processes. Mobile industry in Tanzania is
currently regarded as the fast growing sector after overtaking other sectors such as
Mining and Agriculture in contribution to the national economy. Deregulation, good
communication and versatile regulatory policy have attracted many global
Telecommunication companies to invest in this fast growing market. However, poverty,
poor infrastructure and power instability leads to digital divide between people living in
urban and those at the bottom of the pyramid. These challenges present great business
opportunities for global or foreign companies that are ready to conduct thorough research
to explore, evaluate and exploit prevailing potential business.
The objective of this research study was to develop a conceptual framework for
estimating potential business in mobile services in Tanzanian to generate business
opportunities and attracts investors. Literature review has supported the construction of
the framework and the empirical part have played a role in testing the framework in
Tanzanian mobile money services business to estimate business potential. The mobile
money business potential have been estimated based on the transactions value being
made in year and extrapolated to two years to come. The estimated value of a total of
USD 19.23 trillion is projected for two years depending on the dramatic growth of
mobile money services users and potential areas of diversification such as small scale
enterprises and big companies. The conceptual framework emphasis more on three
critical areas: (1) selecting an appropriate target market segment, (2) a sustainable
business model that ensure revenue generation and, (3) screening potential business in
external factors such as Market size, Market consumption, Market receptivity, Market
growth, Economic infrastructure, Economic freedom, Market intensity and
Accessibility. The conceptual framework developed is for managers and entrepreneurs
and will be used as a guidance tool in estimating potential business in mobile service
market.
79
7.2. Managerial Implication and Further Research
Exploring and estimating potential business are crucial activities for managers and
enterprenuers looking to excel in dynamic and uncertain business environment.
Estimating business potential is an old concepts although no much scientific studies
have been done. Therefore, a major challenge faced in this reseach study was on
scantiness of literature. However, a developed conceptual framework for estimating
business potential adds a new dimensions on evaluating business potential in mobile
services market. The framework will be used as guidance tool for managers to assess
and evaluate the business. The framework touch base on the important areas for a
manager to foucs on when estimating business potential in mobile services. First,
idenfying a potential target market. Second, selecting an appropriate sustainable
business model that will show crearly how a firm is generating revenue at the same time
ensuring the model fits well in a mutual benefit partnership. It is evident that in today’s
business environment no any company can work on isolation. Therefore, a well
thoughtoff business model is very important to keep the value chain active and
motivated. Third, market potential assessment factors namely: Market size, Market
consumption, Market receptivity, Market growth, Economic infrastructure, Economic
freedom, Market intensity and Accessibility. These factors are essential in ensuring the
market potential is assessed and provides a sense of attractiveness to investors.
Despite the a good roadmap the developed framework provides to managers still
estimation of business potential in high-tech industry is very challenging. Mobile
industry is characterised by fast technological change and products obsolete is
unvoidable. Also timely responses to price changes has become a competitive weapon.
Therefore, manager working in this industry should have skills and capability to
monitor the changes of technology as well as price changes due to competitive rivaly.
This conceptual framework provides a best practices for managers to follow in
estimating business potential expecially in mobile business and complements a body of
knowledge to managers, businessman and entrepreneurs as well as academicians.
This research study has provided a conceptual framework that will help managers to
estimate potential business for mobile services business especially for the new entrants
in the market or for business expansion. However, sometimes high business potential
business does not always mean profitable business unless opportunities are explored,
evaluated and exploited effectively. Therefore, for managers there is much to be done to
make green account books. This reserach study have been conducted in a limited
literature especially the literature on business potential estimation. There is a need for
reseachers to explore and build a strong base for a body of knowledge on business
estimation theories. Specifically further research study should be conducted to clearly
understand the impact of mobile services both at the community level and managerial
level in order to account for large investment. Separate studies one focusing on

80
community and the other at the managerial or business to business level in order to
comprehensively evaluate weather the value of impact relates to the value of resources
and funds invested particularly to mobile health programs.
81
BIBLIOGRAPHY
Ahn, H., Lee, H. 1999. An Econometric Analysis of the Demand for Access to Mobile
Telephone Networks. Information Economics and Policy, Vol. 11, pp. 297-305.
Al-Debei, M.M., Avison, D. 2008. Business Model Requirements and Challenges in the
Mobile Telecommunication Sector. School of Information Systems, Computing
and Mathematics Brunel University, London, UK, pp. 1-24.
Albert, T.C. 2003. Need-Based Segmentation and Customized Communication
Strategies in a Complex-Commodity Industry: A Supply Chain Study. Industrial
Marketing Management, Vol. 32, No.4, pp. 281-290.
Amit, R., Christoph Z. 2001. Value Creation in e-Business. Strategic Management
Journal, Vol. 22, pp. 493-520.
Anand J., Oriani, R., Vassolo, R.S. 2010. Alliance Activity as a Dynamic Capability in
the Face of a Discontinuous Technological Change. Organization Science
Forthcoming.
Anderson, J., C., Naurus, J., A. 2004. Business Market Management: Understanding,
Creating, and Delivering Value. 2nd ed. New Jersey: Pearson Education Inc.,
Upper Saddle River.
Anderson, P., Tushman, M. 1990. Technological Discontinuous and Dominant Designs:
A cyclical model of technology change. Administrative Science Quarterly, Vol.
35, No. 4, pp. 604-633.
Anderson, P., Tushman, M. 1991. Managing Through Cycles of Technological Change.
Research and Technology Management. pp. 26-31.
Armstrong, G., Kotler, P. 2000. Marketing. Paper presented at the 5th
ed., Prentice-Hall,
Englewood Cliffs, pp. 153-160.
Arnold, D. J., Quelch, J. A. 1998. New Strategies in Emerging Markets. Sloan
Management Review, Vol. 40, pp. 7-20.
Arnold, D. 2004. Mirage of Global Markets: How Globalizing Companies Can Succeed
as Markets Localize. Pearson Education, Inc Upper Saddle River, New Jersey.
Arsalan, M. 2010. Telecom Industry Challenges and Solutions. State of Telecom
Industry.
Ayres, R. U. 1994. Toward a non-linear dynamics of technological progress. Journal of
Economic Behavior and Organization, Vol. 24, pp. 35–69.
Baines, P., Fill, C., Kelly, P. 2008. Marketing. Principle of Marketing Management
Oxford University press, 2nd
ed, pp. 214-260.
Balle, L. 2012. Characteristics of Mobile Commerce, Demand Media
http://smallbusiness.chron.com/characteristics-mobile-commerce-2197.html
[accessed on 12.11.12]
82
Bångens, L., Söderberg, B. 2008. Mobile Money Transfers and usage among micro- and
small businesses in Tanzania, Implications for policy and practice, SPIDER-
Swedish Program for ICTs in Developing Regions, pp. 1-29.
Benner M.J. 2010. Securities Analysts and Incumbent Response to Radical
Technological Change: Evidence from Digital Photography and Internet
Telephony. Organization Science, Vol. 21, No. 1, pp. 42-62.
Bhat, S., Srinivas, K. Reddy. 1998. Symbolic and Functional Positioning of Brands.
Journal of Consumer Marketing, Vol.15, No.1, pp. 32-43.
Blankson, C., Stavros P. K. 1999. Issues and Challenges in the Positioning of Service
brands. A Review Journal of Product & Brand Management, Vol. 8, No. 2, pp.
106–118.
Blombäck, A. 2005. Supplier Brand Image a Catalyst for Choice. Expanding the B2B
brand discourse by studying the role corporate brand image plays in the
selection of subcontractors. JIBS Dissertation Series No.028. Jönköping
International Business School, pp.10-90.
Bonoma, T. V., Shapiro, B. P. 1984. Evaluating market segmentation approaches.
Industrial Marketing Management, 13rd
(ed), pp. 257-268.
Bouwman. H., Haakerr, T. 2008. Mobile Service Innovation and Business Models.
Delft University of Technology, Springer Berlin Heidelberg, pp. 9-30.
Bowden, M, J. 2004. Moore’s Law and the Technology S-Curve, Current Issues in
Technology Management, Vol. 8, pp. 1-4.
Bower, J. L., Christensen, C. M. 1995. Disruptive Technologies: Catching the wave.
Harvard Business Review.
Brown, I., Cajee, Z., Davies, D., Stroebel, S. 2003. Cell phone banking: predictors of
adoption in South Africa - An exploratory study. International Journal of
Information Management, Vol. 23, pp. 381-394.
Brown, J., R., Fern, E., F. 1984. The Industrial/Consumer Marketing Dichotomy: A
Case of Insufficient Justification. Journal of Marketing, Vol.48, No.2, pp. 68-77.
Businessday 2013: Mobile Money Struggles despite N1.1trn Market Potential.
http://businessdaynigeria.com/re-mobile-money-struggles-despite-n11trn-
market-potential.
Calsson, C., Walden., P., Bouwman H. 2006. Adoption of 3G+ Services in Finland.
International Journal of Mobile communication, Vol. 4, pp. 369-386.
Carroll, J. 2005. Risky Business: Will Citizens Accept M-government in the Long
Term? EURO mGOV 2005, Brighton, UK, pp. 77-87.
Carlsson, C., Hyvönen, K., Repo, P., Walden, P. 2005. Adoption of Mobile Services
across Different Technologies. 18th Bled eConference eIntegration in Action
Bled, Slovenia, pp. 1-13.
Casadesus-Masanell R., Ricart J. E. 2011. From Strategy to Business Models onto
Tactics. Long Range Planning. IESE Business School-University of Navarra,
Spain Madrid, pp. 20-35.

83
Cavusgil, S.T. 1997. Measuring the Potential of Emerging Markets: An Indexing
Approach, Business Horizons, Vol. 40, pp. 87-91.
Cavusgil, S.T., Kiyak, T., Yeniyurt, S. 2004. Complementary Approaches to
Preliminary Foreign Market Opportunity Assessment: Country Clustering and
Country Ranking. Industrial Marketing Management, Vol. 33, pp. 607-17.
CGAP. 2006. Mobile Phone Banking and Low-Income Customers Evidence from South
Africa. Retrieved from:http://www.globalproblems-globalsolutions-
files.org/unf_website/PDF/mobile_phone_bank_low_income_customers.pdf
[accessed on 01.12.2013]
CGAP/GSMA. 2009. CGAP/GSMA Mobile Money Market Sizing Study. As presented
in GSMA in 2009. Mobile Money for the Unbanked: Annual Report 2009.
http://www.ifc.org/ifcext/gfm.nsf/AttachmentsByTitle/Tool4.3.CGAPTool-
MNOMobileMoneyMarketSizing/$FILE/Tool+4.3.+CGAP+Tool+-
+MNO+Mobile+Money+Market+Sizing+(CONFIDENTIAL).pdf[accessed on
18.09.2012]
Chang, A.M., Kannan, P.K. 2002. Preparing for Wireless and Mobile Technologies in
Government. E-Government series, Information Resources Management
College, National Defense University, pp. 8-25.
http://www.businessofgovernment.org/sites/default/files/WirelessTechnologyin
Gov.pdf
Chesbrough, H. 2007. Business Model Innovation: It’s Not Just about Technology
Anymore, Strategy & Leadership, Vol. 35, No. 6, pp. 12-17.
Choffray, J. M., Lilien, G. L. 1980. Marketing Planning for New Industrial Products. J.
Wiley, New York, NY.
Chung, N., Kwon, S. J. 2009. The effect of customers' Mobile experience and technical
support on the Intention to use Mobile Banking. CyberPsychology and
Behavior, Vol.12, No.5, pp. 539-543.
CIA World Factbook for Tanzania, 2012
http://cia-world-fact-book.findthedata.org/l/1001/Tanzania [accessed on
8.09.12
Communication Africa News 2012. Tanzania mobile money transactions worth US$654
million over past two years.
http://www.communicationsafrica.com/mobile/tanzania-sees-mobile-money-
transactions-worth-us-654-million-in-two-years[accessed 4.July.2013].
Componovo, G., Pigneur, Y. 2003. Business model analysis applied to mobile business,
Proceedings of the 5th
International Conference on Enterprise Information
Systems (ICEIS), Austria, pp 1-10.
Coursaris, C., Hassanein, K., Head, M. 2002. Understanding m-Commerce: A
Consumer Centric Model,” Quarterly Journal of Electronic Commerce. Vol. 3,
No. 3, pp. 2-10.

84
Coviello, N. E., Brodie, R. J. 2001. Contemporary Marketing Practices of Consumer
and Business-to-business firms: How different are they? Journal of Business &
Industrial Marketing, Vol.16, No.5, pp. 382-400.
Croft, M. J. 1994. Market segmentation. A step-by-step guide to profitable new
business. Routledge.
Davis, F., Bagozi, R., Warshaw, P. 1989. User Acceptance of Computer Technology: A
comparison of two Theoretical Models, Management Science, Vol. 35, No. 8,
pp. 982-1003.
David J. S. 2012. Technological discontinuities, outsiders and social capital: A case
study from Formula 1. European Journal of Innovation Management, Vol. 15,
pp. 332 – 350.
Dalum, B., Christian, R., Pedersen, G. V. 2002. Technological Life Cycles: Regional
Clusters Facing Disruption. Department of Business Studies, Danish Research
Unit for Industrial Dynamics, Aalborg University, pp. 1-23.
Dedehayir, O. 2011. Technology management. Faculty of Business and Technology
Management. Tampere University of Technology, pp. 1-35
Denzin, N. K., Lincoln, Y. S. 2000. Handbook of Qualitative Research. Thousand
Oaks, CA: Sage Publications.
Dholakia, R. R., Dholakia, N. 2004. Mobility and Markets: Emerging Outlines of M-
commerce. Journal of Business Research, Vol. 57, No. 12, pp. 1391 -1396.
Dibb, S., Simkin, L. 1997. A Program for Implementing Market Segmentation. Journal
of Business and Industrial Marketing, Vol.1, No.12, pp. 51-65.
Dion Global Solutions Limited. 2010. Emerging Opportunities in African Mobile
Market Focus on Tanzania.
http://www.marketresearch.com/Dion-Global-Solutions-Limited-
v3783/Emerging-Opportunities-African-Mobile-Focus-2879635/ [accessed on
4.11.2012].
Dolan, B. 2012. Mobile Views Healthcare as a biggest opportunity, Deloitte survey,
Wound right, Mobile wound care, MobiHealthnews
http://mobihealthnews.com/16689/deloitte-mobile-views-healthcare-as-biggest-
opportunity [accessed on 4.4.2013].
Dutt, P. 2006. The Impact of Mobile Telephone in Tanzania. Economics and
Management in Developing Countries.
Dwyer, F. R., Tanner, J. F. 2006. Business Marketing: Connecting Strategy,
Relationships, and Learning, 3rd Edition, McGraw-Hill/Irwin.
Elinaza, A. 2012. Mobile Phone Money Transfers Grow Fast in Tanzania, Mobile
Money Africa, Tanzania Daily News.
http://mobilemoneyafrica.com/details.php?post_id=678 [accessed 11.11.2012].
Schilling, A., Esmundo, M. 2009. Technology S-curves in renewable energy
alternatives. Analysis and Implications for Industry and Government. Stern
School of Business, New York University, New York, USA, pp. 1-15.
85
Ford, D., Berthon, P., Brown. S.J., Gadde. L., Håkansson. H., Naude. P., Ritter. T.,
Snehota. I. 2002. The Business Marketing Course: Managing in Complex
Networks. Chichester: John Wiley & Sons.
Frank, R.E., Massy, W.F., Wind, Y., 1972. Market Segmentation, Prentice Hall Inc.,
Englewood Cliffs.
Freytag, P.V., Clarke, A.H. 2001. Business to Business Segmentation. Industrial
Marketing Management, Vol. 30, No. 6, pp. 473-486.
Friedmann, R., Parker, V., Lessig. 1987. Psychological Meaning of Products and
Product Positioning. Journal of Product Innovation Management, Vol. 4, No. 4,
pp. 265-73.
Gabriel-Ritter, A., Hans, M., Dreher, A. 1993. MIPS–Managing Industrial Positioning
Strategies. Industrial Marketing Management, Vol. 23, pp. 287-297.
Gazis, V., Housos, N., Alonistiot, A., Merakos, L. 2003. Generic System Architecture
for 4G Mobile Communications. Communication Networks Laboratory,
University of Athens, pp. 2-5.
Gebauer, H. 2008. User Requirement of Mobile Technology: A summary of Research
Results, Information Knowledge System Management, Vol. 7, pp. 101-119.
Gefen, D., Karahanna, E. and Straub, D. W. 2003. Inexperience and experience with
online stores: The importance of TAM and Trust. IEEE Transactions on
Engineering Management, Vol. 50, No. 3, pp. 307.321.
Genuchten, R., Haring, W., Kassel, D., Yakubi, K. 2012. Mobile Phone use in Tanzania,
Text to Change and Vrije University Amsterdam, pp. 1-15.
.http://www.texttochange.org/sites/files/newsfiles/TTC%20%20Tanzania.pdf
Gronroos, C. 2000. Service Management: A Management Focus for Service
Competition. International Journal of Service Industry Management, Vol.1,
No.1 , pp. 6-14.
Gronroos, C. 2007. Service Management & Marketing: Customer Management in
Service Competition 3rd
ed, Wiley, Chicherster.
Grosova, S. 2011. B2B Segmentation as tool for Marketing and Logistics Strategy
Formulation. Institute of Chemical Technology Prague. Vol. 9, No. 1, pp. 54-64.
Gruber, H. 1999. An Investment View of Mobile Telecommunications in the European
Union. Telecommunications Policy, Vol. 23, pp. 521-538.
Gruber, H. 2001. Competition and Innovation: The Diffusion of Mobile
Telecommunications Services in Central and Eastern Europe. Information
Economics and Policy, Vol. 13, pp. 19-34.
Gruber, H., Verboven, F. 2001. The Diffusion of Mobile Telecommunications Services
in the European Union. European Economic Review, Vol. 45, pp. 577-588.
Gruber, H., Verboven. F. 2001. The Evolution of Markets under Entry Standards and
Regulation: The case of global mobile telecommunications. International
Journal of Industrial Organization, Vol.19, pp.1189-1212.
86
Gu, J. C., Lee, S. C., Suh, Y. H. 2009. Determinants of Behavioral Intention to Mobile
Banking. Expert Systems with Applications, Vol. 36, pp. 605-616.
Gummesson, E. 1993. Case Study Research in Management. Stockholm University.
Gumpp, A., Pousttchi, K. 2005. The Mobility M-Framework for Applications of mobile
Technology in Business Processes. University of Augsburg. MPRA Paper, pp.
523-528.
Hague, P. 2002. Market Segmentation in B2B Markets. Available from:
http://www.b2binternational.com/whitepapers3.htm [Accessed 21 April 2012]
Hague, P. 2007. Market Segmentation in B2B markets. B2B International.
http://www.b2binternational.com/library/whitepapers/whitepapers03.php
[Accessed 21 April 2012].
Hague, P., Harrison, M. 2012. Segmentation in B2B Markets. Market Research with
Intelligence, B2B International, White paper, pp. 1-10
http://www.b2binternational.com/assets/whitepapers/pdf/segmentation_in_b2b_
markets.pdf
Hofstede, G. 2001. Culture’s Consequences, Sage, Thousand Oaks, CA.
Hudson, S. 2008. Tourism and Hospitality Marketing: A Global Perspective, Sage,
London, UK.
Hui, S. Y., Yeung, K. H. 2003. Challenges in the Migration to 4G Mobile Systems.
IEEE Communications Magazine, December 2003, City University of Hong
Kong.
Hutt, M. D., Speh, T.W. 2001. Business Marketing Management. A Strategic View of
Industrial and Organizational Markets. 7th edition. Harcourt College Publishers.
Hutt, M. D., Speh, T. W. 2004. Business Marketing Management: A Strategic View of
Industrial and Organizational Markets, 8th Edition, Thomson/South-Western.
Hunter, V.1997. Business-to-Business Marketing: Creating a Community of Customers.
Lincolnwood: NTC/Contemporary Publishing Company.
International Telecommunication Union (ITU), World Telecommunication Indicators
Database, 6th
ed, June 2002.
InterMedia: Mobile Money in Tanzania Use, barriers and opportunities, The Financial
inclusion Tracker surveys Project, InterMedia February, 2013
http://www.intermedia.org/wp-
content/uploads/FITS_Tanzania_FullReport_final.pdf [access on 20.04.2013]
Intermedia. 2011. Mobile Money in Tanzania FiTS Panel ManagemenT Update
http://www.intermedia.org/wp-content/uploads/FITS-Tanzania-MiniSurvey-
3.pdf[acceessed 03.July. 2013].
ITU, 2012. ICT Statistics Newslog- Mobile Money Transactions Top TZS1.7TN, BOT
Reports.http://www.itu.int/ITUD/ict/newslog/Mobile+Money+Transactions+To
p+TZS17tn+Bank+Of+Tanzania+Reports.aspx [accessed on 1.7.2013].
Jain, S.C. 1997. Marketing, Planning & Strategy. Cincinnati, OH: South -Western
College Publishing. 5th
ed.
87
Jakobi, P. 2001. Marketing and Sales in the Chemical Industry. Weinheim: Wiley –vch
Verlag, pp. 1-20.
Jansen, W., Steenbakkers, W., Jäegers, H. 2007. “What is a Business Model” in New
business models for the knowledge economy, Hampshire, England Gower
Publishing, pp. 15-30.
Jensen, R. 2007. The digital provide: Information Technology, Market Performance,
and Welfare in the South Indian Sheries Sector. Quarterly Journal of
Economics, pp. 879 –924.
Jobber, D. 2003. Principles and Practice of Marketing. University of Bradford, Mcgraw-
hill, 6th ed.
Johansson, J., Malmström, M., Chroneer, D., Engström, A., Bergvall-Kåreborn, B.
2012. Business Models at Work in the Mobile Service Sector. Scientific
Research iBusiness, Luleå University of Technology, Luleå, Sweden, Vol. 4, pp.
1-9.
Johnson, D. 2009. Investment Strategies in Emerging Markets, Transnational
Corporations, Book Review Printers (Pvt) Ltd, Economic and Social Research
Foundation, Tanzania, Vol. 14, No. 2, p. 179.
Johnson, R., Clark, G. 2008. Service Operation Management: Improving Service
Delivery 3ed. Pearson Education Limited.
Kaaranen, H., Ahtiainen, A., Laitinen, L., Nanghian, S., Niemi, V. 2001. UTMS
Networks: Mobility and Services. John Wiley & Sons.
Kaasinen, E. 2005. User Acceptance of Mobile Services –Value, Ease of use, Trust and
Easy of adoption in VTT Technology (Ed.). Publication -566, VTT Information
Technology. Doctoral Dissertation, pp. 9-25.
Kalakota, R., Robinson, M. 2001. Mobile Business: The Race to Mobility. McGraw-
Hill, New York, USA.
Karahanna, E., Straub, D., Chervany, N. 1999. Information Technology Adoption
Across Time: A Cross Sectional Comparison of Pre-adoption and Post Adoption
Beliefs. MIS Quarterly, Vol. 23, No. 2, pp. 183-213.
Keen P., Mackintosh, R. 2001. The freedom economy: Gaining the M-commerce edge
in the era of the Wireless Internet, Osborne/ McGraw-Hill, Berkeley; CA, USA.
Kilaba, J., M. 2010. Maintaining Equipment Standards for Better Quality of Service:
Country Experience - Tanzania, Tanzania Communications Regulatory
Authority (TCRA), pp. 1-24.
Kim, B., Choi, M., Han, I. 2009. User Behaviors toward Mobile Data Services: The
role of perceived fee and prior experience. Expert Systems with Application,
Vol. 36, No. 4, pp. 8528–8536.
Kim, H.W., Chan, H.C., Gupta, S. 2007. Value-based Adoption of Mobile Internet: An
Empirical Investigation. Decision Support Systems, Vol. 43, No. 1, pp. 110-126.
Kimmel, J., 2012. Overview of Mobile Displays. Handbook of Visual displays
Technology. Springer – SBM Heidderg, pp. 1983-1992.
88
Kleijnen, M., De Ruyter, K., Wetzels, M. 2007. Consumer Acceptance of Wireless
Finance. Journal of Financial Services Marketing, Vol. 8, No.3, pp. 206-217.
Kotler, P. 2003. A Framework for Marketing Management, 2nd
ed. Pearson Education
Incorporated.
Kotler, P., Armstrong, G. 2003. Principles of Marketing. 10th edn. Prentice Hall.
Kotler, P., Keller, K, L. 2009. Marketing Management, Upper Saddle River, NJ,
Prentice Hall.
Kotler, P. 2003. Marketing Management. 11th ed. New Jersey: Prentice Hall.
Kotler, P., Keller, L. 2006. Marketing Management, 13th
Ed., Pearson Education, Inc.,
New Jersey, USA. pp. 140.
Kotler, P., Wong, V., Saunders, J., Armstrong, G. 2002. Principles of Marketing (3th
European Ed). Essex: Pearson Education Limited/Prentice Hall Europe.
Kotler, P., Pfoertsch, W. 2006. Business to Business Brand Management, Springer
Berlin, p. 21.
Kraemer, K.L., Derick, J. 1998. Methodology for Estimating the Market Potential for
Computer and Other Information Technologies, Center for Research on
Information Technology and Organizations, University of California, Irvine.
Kumar, L. S., Jamatia, B., Aggarwal, A. 2010. Mobile Phones as effective learner
support devices: A case study. Proceedings of the 4th International Conference
on Distance Learning and Education,. October 3rd-5th; San Juan, Puerto Rico,
pp. 211-213.
Lee, K. S., Lee, H. S., Kim, S. Y. 2007. Factors influencing the adoption behavior of
mobile banking: a South Korean perspective. Internet Banking and Commerce,
Vol.12, No.2, pp. 1-7.
Liao, C., Chen, J., Yen, D. 2007. Theory of Planning Behavior and Customer
Satisfaction in the Continued Use of e-service: An Integrated Model, Computer
Human Behavior, Vol. 23, pp. 2804- 2823.
Lovelock, C., Gummesson, E. 2004. Whither Services Marketing. Journal of Marketing.
Vol 47, No 3, pp. 12-17.
Lovelock, C. H., Wirtz, J. 2007. Services Marketing: People, Technology and Strategy
(6ed.) Upper Saddle River, New Jersey: Prentice Hall, pp. 90-110.
Luarn, P., Lin, H. H. 2005. Towards an understanding of the behavioral intention to use
mobile banking. Computers in Human Behavior, Vol. 21, pp. 873-891.
Lyly-Yrjänäinen, J., Suomala, P., Manninen. 2011. Management Accounting (Know your
numbers!). Tampere University of Technology. Faculty of Business and
Technology Management.
Lyly-Yrjänäinen, J., Velasquez, S., Suomala, P., Uusitalo, O. 2010. Introduction to
industrial management. Know your numbers! Tampereen Yliopistopaino Oy.
pp. 1-382.
Masinge, K. 2010. Factors influencing the adoption of mobile banking services at the
Bottom of the Pyramid in South Africa. Master of Business Administration,
89
University of Pretoria. http://upetd.up.ac.za/thesis/available/etd-05152011-
103542/unrestricted/dissertation.pdf [accessed on 10.03.2012].
Materu-Behitsa, M., Diyamett, D.B. 2010. Tanzania ICT Sector Performance Review
2009/2010. Towards Evidence-based ICT Policy and Regulation, Policy Paper
11, Vol. 2, pp. 1-37.
McDonald, M., Dunbar, I. 2004. Market Segmentation: How to Do it, How to Profit
from it, Oxford: Elsevier.
Mc Connon., J. 2000. Market Potential: For Retail Business in Maine, University of
Maine, and Orono, US.
http://www.umext.maine.edu/onlinepubs/PDFpubs/3006.pdf [Access May 4
2012].
Medhi, I., Gautama. N., Toyama, K. 2009. A comparison of mobile money-transfer UIs
for non-literate and semi-literate users. Microsoft Research India. Working
paper, pp.1-9.
Mirman, L. J., Klaus, R. S. 2003. Financial Markets and Stochastic Growth. Review of
International Economics, Vol. 11, No. 2, pp. 219–236.
Mitchell, V. W., Wilson, D. F. 1998. Balancing Theory and Practice: A Reappraisal of
Business to Business Segmentation. Industrial Marketing Management, Vol. 27,
No. 5, pp. 429-445.
Morris, M., Venkatesh, V., Davis, F., Davis, G. 2005. User Acceptance of Information
Technology. Toward a Unified View, Vol.27, No. 3, pp. 425-478.
Mudambi, S. 2002. Branding Importance in Business to Business markets Three Buyers
Clusters. Industrial Marketing Management Vol. 26, pp. 433-446.
Mundy, K., Bullen, S.G. 2006. Estimating Market Potential: Is There a Market? The
Business Development, Department of Agricultural and Applied Economics,
Virginia Tech.
Mutagahywa, B., Ngalinda, I. 2005. Toward an African e-Index: ICT access and usage,
University of Dar es salaam and Institute of Finance and Management, pp. 154-
160.
Nah, F., Siau, K., Sheng, H. 2005. The value of mobile applications: a study on a public
utility company. Communications of the ACM, Vol. 2, No.48, pp. 85-90.
Newell, F., K.N. Lemon. 2001. Wireless Rules: New Marketing Strategies for Customer
Relationship Management Anytime, Anywhere. McGraw-Hill, New York, USA
Ngasongwa, J. 2005. SADC Trade, Industry and Investment Review 9th
ed. Ministers of
Trade and Industry Conference, Arusha, Tanzania.
Nickerson, R. C., Varshney, U., Muntermann, J., Isaac, H. 2007. Towards a Taxonomy
of Mobile Applications. Proceedings of the Thirteenth Americas Conference on
Information Systems. Colorado, USA, pp. 1-11.
Nieto, M., Lopez, F., Cruz, F. 1998. Performance analysis of technology using the S-
curve model: the case of digital signal processing (DSP) Technologies,
Technovation, Madrid, Spain. Vol. 18 No. 6, pp. 439–457.

90
Nilsson, J. L. 2012. The Trend for Mobile Money in Developing Markets
http://jacoblangvad.com/2012/06/the-trend-for-mobile-money-in-developing-
markets/ [accessed on 03.1.2013]
Nordman, J., Liljander, V. 2003. Mobile Service Quality: A Study of Contributing
Factors. Swedish School of Economics and Business Administration, Vol. 488,
pp. 1-64.
OECD/International Telecommunication Union (2011), M-Government: Mobile
Technologies for Responsive Governments and Connected Societies, OECD
Publishing. http://dx.doi.org/10.1787/9789264118706-en [accessed 07.06.2012]
Olkkonen, R. 2001. Case Study: The network approach to international sport
sponsorship arrangement. The Journal of Business and Industrial
Marketing. Vol. 16, No. 4, pp. 309 – 329.
Olson, H. 1995. Quantitative “Versus" Qualitative Research: The Wrong Question.
School of Library and Information Studies. Rutherford South University of
Alberta. http://www.ualberta.ca/dept/slis/cais/olson.htm[accessed on
18.04.2012].
Oui-Suk, U. 2010. Introduction of M.Government and IT Convergence Technology.
KAIST Institute for IT Convergence.
Osterwalder, A., Pigneur, Y., Tucci, C. L. 2005. Clarifying Business Models: Origins,
Present, and Future of the concept, Communications of the Association for
Information Systems, Vol. 16, No. 1, pp. 1-25.
Östberg, O. 2003. A Swedish View on Mobile Government, International Symposium
on E & M-Government, Seoul, Korea.
http://www.statskontoret.se/upload/Publikationer/2003/2003128.pdf [accessed on
8.06.2012].
Pagani, M. 2004. Determinants of adoption of third generation mobile multimedia
services. Journal of Interactive Marketing, Vol.3, No. 18, pp. 46–59.
Papadopoulos, N., Denis, J. E. 1988. Inventory, Taxonomy and Assessment of Methods
for International Market Selection. International Marketing Review, Vol. 47,
pp. 38-51.
Parasuraman, A., Colby, C.L. 2001. Techno-Ready Marketing: How and Why your
Customers Adopt Technology. The Free Press New York, NY.
Park, Y., Adachi, F. 2007. Enhanced Radio Access Technologies for Next Generation
Mobile Communication. Technology & Engineering. Springer, pp. 1–37.
Peter, G. 2010. Mobile Money for the Unbanked: Lessons from Tanzania- Africa
Development Research Brief, AudienceScapes, pp. 1-10.
http://www.audiencescapes.org/sites/default/files/AudienceScapes_Mobile%20Money%
20for%20the%20Unbanked_Lessons%20from%20Tanzania_December%20201
0.pdf.[accessed on 4.4.2013].
Pickens, M, Microfinance Analyst, CGAP Technology Program. 2009. “Mobile Money
by the Numbers.”
91
http://technology.cgap.org/2009/06/04/mobile-money-bythe-numbers/ [accessed
June 8, 2012].
Pickton, D., Broderick, A. 2001. Integrated Marketing Communications. London:
Financial Times/Prentice Hall.
Pihlstrom, M. 2008. Perceived Value of Mobile Services Use and Its Consequences.
Swedish School of Economics and Business Administration. Doctoral
Dissertation, pp. 9-25.
Porter, M.E. 1990. The Competitive Advantage of Nations, The Free Press, New York,
NY.
Porter, M.E. 1998. On Competition. Boston (MA), Harvard Business School Press, p.
485.
Poolton, J., Barclay. I. 1998. New Product Development from Past Research to Future
Applications. Industrial Marketing Management, Vol. 27, No. 3, pp. 197–212.
Porteous, D. 2006. The enabling environment for mobile banking in Africa. Report
commissioned for the Department for International Development (DFID).
Raisch, W. 2001. The e-Marketplace: Strategies for Success in B2B e-Commerce,
McGraw-Hill, New York.
Rannu, R., Semevsky, V. 2005. Mobile Services in Tartu Existing services, best
practices, methodology and suggestions for future development Mobi Solutions
Ltd Tartu, Estonia.
http://www.tartu.ee/data/Mobile%20services%20in%20Tartu.pdf[accessed on
24.04.2012]
Rappa, M. 2011. Managing the Digital Enterprise: Business Models on the Web,
http://digitalenterprise.org/models/models.html [accessed on 12.04.2012].
Rigger, W. 1995. Positioning in Theory and Practice: Towards a Research Agenda, 24th
EMAC Conference Proceedings, Essec, France, Vol. 1, pp. 991-1009.
Ries, A., Trout, J. 1981. Positioning: The battle for your mind, Warner Books -
McGraw-Hill Inc., New York.
Rosanna, G., Roger, C. 2001. Critical look at Technological Innovation Typology and
innovativeness Terminology. Department of Marketing & Supply Chain
Management, Michigan State University, East Lansing, MI, USA, pp. 1-23.
Rope, T. 1998. Business to Business-Markkinointi. Helsinki: WSOY.
Sakarya, S., Eckman, M., Hyllegard, K. H. 2006. Market Selection for International
Expansion. Assessing Opportunities in Emerging Markets. International
Marketing Review, Vol. 24, No. 2, pp. 208-238.
http://dx.doi.org/10.1108/02651330710741820 [accessed on 07.05.2012]
Sandström, S., Edvardsson, B., Magnusson, P. 2008. Value in use through service
experience. Managing Service Quality, Vol.18, pp. 112-126.
Sebastian, C. 2012. Tanzania 2012: Special Report - Profitability, Not Room, is the
Issue in Telecoms Industry, The Guardian.
http://allafrica.com/stories/201201231492.html [accessed on 7.12.2012].
92
Settles, C. 2002. Wireless, Inc. American Management Association, New York.
Schiffman, L., Leslie, G., Kanuk, L. 2007. Consumer Behavior, New Jersey: Prentice
Hall.
Shams, A. 2013. Analysis of Mobile Data Services and Internet in Switzerland, India
and Tanzania. Master’s Thesis, University of Neuchatel, pp. 1-90.
Sheng, H., Nah, F., Siau, K. 2004. Strategic Implications of Mobile Technology: A
Case Study Using Value-Focused Thinking. Department of Management,
University of Nebraska-Lincoln.
Shroff, P. 2011. Mobile-Money Creates New Revenue Streams; Major Roles Await
Operators in the Mobile-Money Market, Tellabs Mobile Solutions Research.
Naperville, USA, pp. 1-3.
http://www.tellabs.com/resources/papers/tlab_mobilemoney_wp.pdf
Simkin, L. 2000. Marketing is Marketing – Maybe!. Marketing Intelligence & Planning,
Vol. 18, pp. 154-8.
Smit, A. J. 2010. The Competitive Advantage of Nations: Is Porter’s Diamond
Framework a new theory that explains the international competitiveness of
countries? Southern African Business Review, Vol. 14, No. 1, pp. 106-120.
Smith, F. 2010. Conducting Your Pharmacy Practice Research Project, A step-by-step
guide School of Pharmacy, University of London, 2nd
ed.
Soininen, M. 2005. Segments of the Mobile Internet Industry - Examples from Finland
and Japan: Proceedings of the International Conference on Mobile Business
(ICMB, 11st - 13
rd, July, 2005), Sydney, Australia. IEEE Computer Society.
Solomon, M. R., Marshall, G. W., Elnora. W. 2006. Marketing: Real People, Real
Choices, 4th ed., New Jersey: Pearson Education.
Special report 2011: Tanzania takes seventh place in African telecoms.
http://www.thecitizen.co.tz/sunday-citizen/40-sunday-citizen-news/16181-
special-reporttanzania-takes-seventh-place-in-african-telecoms-report-
reveals.html [Accessed on 7. 12. 2012].
Stanley St Labs. 2009. Economy Watch 2009. Tanzania Economy 2009. Internet
document. http://www.economywatch.com/world_economy/tanzania/[accessed
12.12.2012].
Tanzania Budget 2011.
http://www.mof.go.tz/mofdocs/budget/Citizens%20Budget/CITIZEN_ENGLIS
H_2011_12_FINAL.pdf [accessed on 14.12.2012].
Tanzania Commomwealth Yearbook, 2012
http://www.commonwealthofnations.org/wpcontent/uploads/2012/10/tanzania_country_
profile.pdf
Tanzania Invest , Tanzania Economy 2012.
http://www.tanzaniainvest.com/tanzania-economy/ [accessed on 12.01.2013]
Tanzania: Telecoms Market Overview & Statistics. Tanzania Daily News 7, Dec, 2011
http://allafrica.com/stories/201112081054.html [08.12.2012]
93
Tashakkori, A., Teddlie, C. 2003. Handbook of Mixed Methods in Social
& Behavioral Research. Thousand Oaks: Sage.
(TCRA), T. C. R. A. (2011). Quarterly Telecom Statistics.
http://tcra.go.tz/publications/telecomStatsDec11.pdf [accessed on 15.02.2013].
Teboul, J. 2006. Service is Front Stage: Positioning Services for Value Advantage.
Basingstoke: Palgrave Macmillan, pp. 110-115.
TeleGeographical Authoritative Telecom data. 2013. Vodacom M-PESA take-up tops
4.5m subs, transactions hit USD622m.
http://www.telegeography.com/products/commsupdate/articles/2013/02/07/voda
com-m-pesa-take-up-tops-4-5m-subs-transactions-hit-usd622m/[accessed on
7.7. 2013].
The Economist, “The Power of Mobile Money”.
http://www.economist.com/opinion/displaystory.cfm?story_id=14505519,[accesed
June 3, 2012].
The Citizens, ” Growth of mobile data in Tanzania” Jan 20, 2012.
http://www.thecitizen.co.tz/Business/-/1840414/1840414/-/iyefns/-/index.html
The Government of Tanzania 2010a. The United Republic of Tanzania: National
Website 2010. Front page 2010. http://www.tanzania.go.tz/ [Accessed on 7.7.
2012].
Toshio, M., Ohya, T., Yoshino, H., Umeda, N. 2005. The Overview of the 4th
Generation Mobile Communication System. NTT DoCoMo Inc., Wireless Labs.
http://www.icics.org/2005/download/p0842.pdf [accessed on 13.05.2012].
Trochim, M.K. 2006. Knowledge base: Qualitative Research Methods. Social
ResearchMethods. http://www.socialresearchmethods.net/kb/qualmeth.php[
Access Jun 3 2012].
Trout, J., Rivkin, K. 1996. The New Positioning. New York: McGraw-Hill.
Tuunainen, V., Mallat, N., Rossi, M. 2008. An expirical investivation of mobile
ticketing service adoption in public transportation. Pers Ubiquit Comput,
Vol.12, pp. 57-65.
Vaida, K. 2004. Uncovering The Potential Benefits of mobile Technology in a Business
Relationship Context, Åbo Akademi University, Turku Centre for Computer
Science, IAMSR.
Van de Wijngaert, l., Bouwman, H. 2009. Coppers Context and Conjoins: A
Reassessment of TAM. Journal of Information Technology, Vol. 24, No.2, pp.
186-201.
Varshney, U., Vetter, R. 2001. A Framework for emerging Mobile Commerce
Applications. Proceedings of the 34th
Annual Hawaii International Conference.
Vuolle, M. 2011. Measuring Performance Impact of Mobile Business Services from the
Customers Perspectives. Doctoral Dissertation. Tampere University of
Technology. Julkaisu 1013, pp. 10-95.
94
Wahid, F. 2007. Using The TAM to Analyze Internet Adoption and Use Among Men
and Women in Indonesia, Department of Informatics, Islamic University of
Indonesia, EJISDC, Vol. 32. No. 6, pp. 1-8.
Webster, F. E. 1991. Industrial Marketing Strategy, John Wiley & Sons, New York,
NY.
Weinstein, A. 2004. Handbook of Market Segmentation, New York: The Haworth
Press. http://uc-ciee.org/downloads/MarketSegementationWhitePaper.pdf
[Accessed on 05.06. 2012].
Wieland, K. 2013. Vodacom reports M-Pesa surge in Tanzania.
http://www.mobileworldlive.com/vodacom-reports-m-pesa-surge-in-
tanzania.[accessed on 7. July, 2013].
Wilcox, H. 2011. Mobile Money Transfer and Remittances Market, Forecast and
Vendor Strategies 2011-2015, You have got Money! Transfer on the Mobile,
Juniper Research Limited, Basingstone, Hampshire, pp. 1-6.
Wilson, D. F. 2000. Why divide Consumer and Organizational Buyer Behaviour?
European Journal of Marketing, Vol. 34 No. 7, pp. 780-796.
Wind, Y., Cardozo, R. N. 1974. Industrial Marketing Segmentation. Industrial
Marketing Management, Vol. 3, pp. 153-165.
Wolfe, K. 2006. Estimating Market Potential Check-List. Center Report 06-08. Athens,
Ga.: Center for Agribusiness and Economic Development, The University of
Georgia. http://www.caed.uga.edu/publications/2006/pdf/CR-06-08.pdf
[accessed on 27.06.12].
Zainudeen, A., Samarajiva, R., Sivapragasam, N. 2011. Enabling Mobile Commerce in
Bangladesh. Research Journal, Vol. 7, pp. 1-16.

95
APPENDIX 1- QUESTIONNAIRE
TAMPERE UNIVERSITY OF TECHNOLOGY
Department of Industrial Management
QUESTIONNAIRE
Name: Mr. Mutasingwa Saulo Kaimukilwa
Program of Study: Business and Technology
Subject: Master Thesis
Title: Estimating Potential Business in Tanzanian Mobile Services Industry
I’m a student pursuing Master’s of Science in Business and Technology at the Faculty
of Business and Technology Management, Tampere University of Technology,
Tampere, Finland. I’m currently conducting a research study on mobile services
business in Tanzania particularly estimating potential business in Tanzanian mobile
service industry.
This research study is the fulfillment of my master’s studies. Therefore, I’m assuring
you this research study is purely academic work.
It is my expectations that the key findings of this research study will be useful for
academicians and Tanzanian mobile service industry stakeholders.
I’m kindly requesting your cooperation in this interview in order to achieve this
objective.
QUESTIONS
1. How long have you been in mobile service industry?
2. Do you see any significant changes since you joined the industry?
3. What are the challenges facing Tanzanian mobile market?
4. What are the current mobile market trends?
5. Where do you see the mobile service market in 5 to 15 years to come?
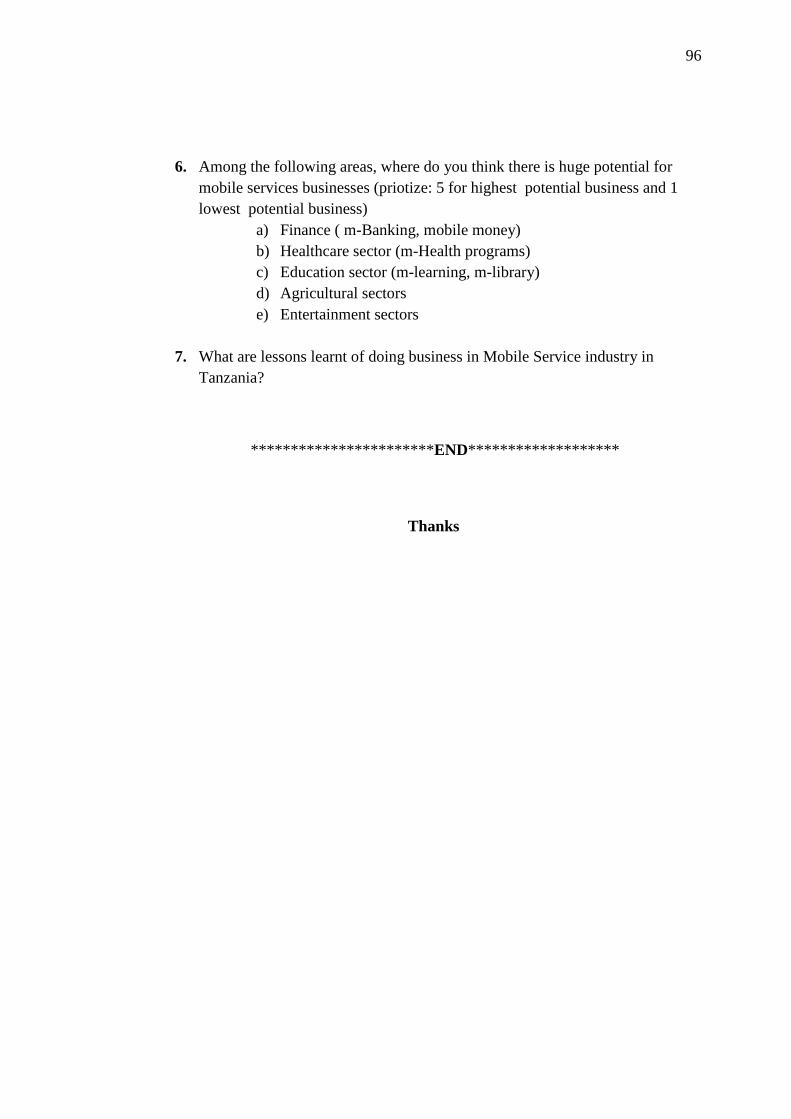
96
6. Among the following areas, where do you think there is huge potential for
mobile services businesses (priotize: 5 for highest potential business and 1
lowest potential business)
a) Finance ( m-Banking, mobile money)
b) Healthcare sector (m-Health programs)
c) Education sector (m-learning, m-library)
d) Agricultural sectors
e) Entertainment sectors
7. What are lessons learnt of doing business in Mobile Service industry in
Tanzania?
***********************END*******************
Thanks
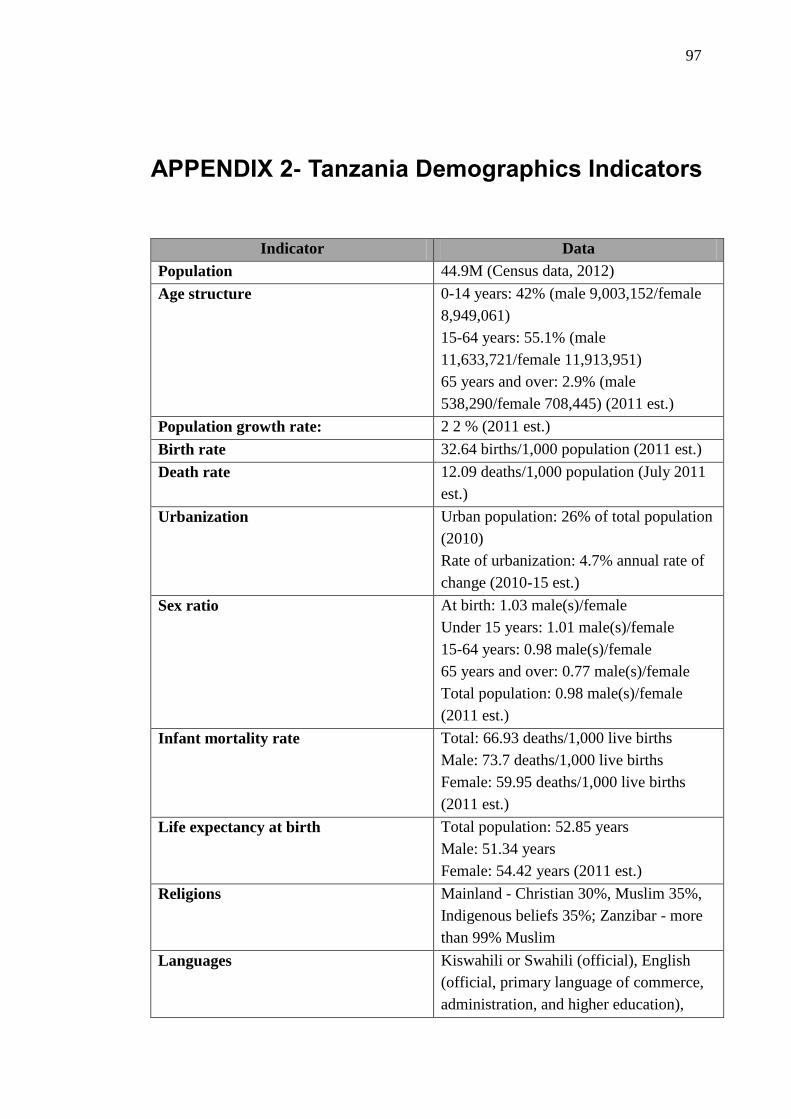
97
APPENDIX 2- Tanzania Demographics Indicators
Indicator Data
Population 44.9M (Census data, 2012)
Age structure 0-14 years: 42% (male 9,003,152/female
8,949,061)
15-64 years: 55.1% (male
11,633,721/female 11,913,951)
65 years and over: 2.9% (male
538,290/female 708,445) (2011 est.)
Population growth rate: 2 2 % (2011 est.)
Birth rate 32.64 births/1,000 population (2011 est.)
Death rate 12.09 deaths/1,000 population (July 2011
est.)
Urbanization Urban population: 26% of total population
(2010)
Rate of urbanization: 4.7% annual rate of
change (2010-15 est.)
Sex ratio At birth: 1.03 male(s)/female
Under 15 years: 1.01 male(s)/female
15-64 years: 0.98 male(s)/female
65 years and over: 0.77 male(s)/female
Total population: 0.98 male(s)/female
(2011 est.)
Infant mortality rate Total: 66.93 deaths/1,000 live births
Male: 73.7 deaths/1,000 live births
Female: 59.95 deaths/1,000 live births
(2011 est.)
Life expectancy at birth Total population: 52.85 years
Male: 51.34 years
Female: 54.42 years (2011 est.)
Religions Mainland - Christian 30%, Muslim 35%,
Indigenous beliefs 35%; Zanzibar - more
than 99% Muslim
Languages Kiswahili or Swahili (official), English
(official, primary language of commerce,
administration, and higher education),

98
Arabic (widely spoken in Zanzibar), many
local languages
Literacy Definition: age 15 and over can read and
write Kiswahili (Swahili), English, or
Arabic
Total population: 69.4%
Male: 77.5%
Female: 62.2% (2002 census)
(CIA, 2011)
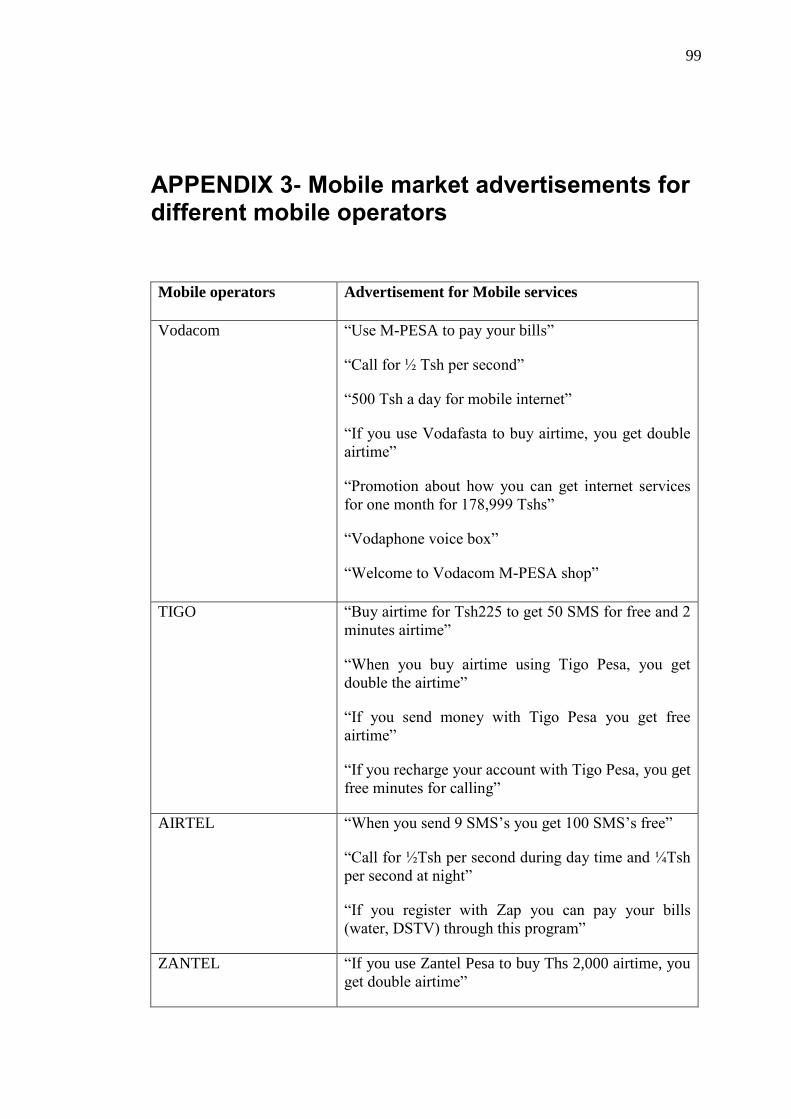
99
APPENDIX 3- Mobile market advertisements for different mobile operators
Mobile operators Advertisement for Mobile services
Vodacom “Use M-PESA to pay your bills”
“Call for ½ Tsh per second”
“500 Tsh a day for mobile internet”
“If you use Vodafasta to buy airtime, you get double
airtime”
“Promotion about how you can get internet services
for one month for 178,999 Tshs”
“Vodaphone voice box”
“Welcome to Vodacom M-PESA shop”
TIGO “Buy airtime for Tsh225 to get 50 SMS for free and 2
minutes airtime”
“When you buy airtime using Tigo Pesa, you get
double the airtime”
“If you send money with Tigo Pesa you get free
airtime”
“If you recharge your account with Tigo Pesa, you get
free minutes for calling”
AIRTEL “When you send 9 SMS’s you get 100 SMS’s free”
“Call for ½Tsh per second during day time and ¼Tsh
per second at night”
“If you register with Zap you can pay your bills
(water, DSTV) through this program”
ZANTEL “If you use Zantel Pesa to buy Ths 2,000 airtime, you
get double airtime”
100
“If you buy a modem from Zantel, you get interesting
internet rates”
“Zantel can offer you a Zantel line/number with the
same last 6 digits as your other lines”
“EpicNation Promotion” – Sim-up with the coolest
crew in town – free entry to a club
and buy one get one free offer from a retailer”
(Tanzania tracking study, 2011)
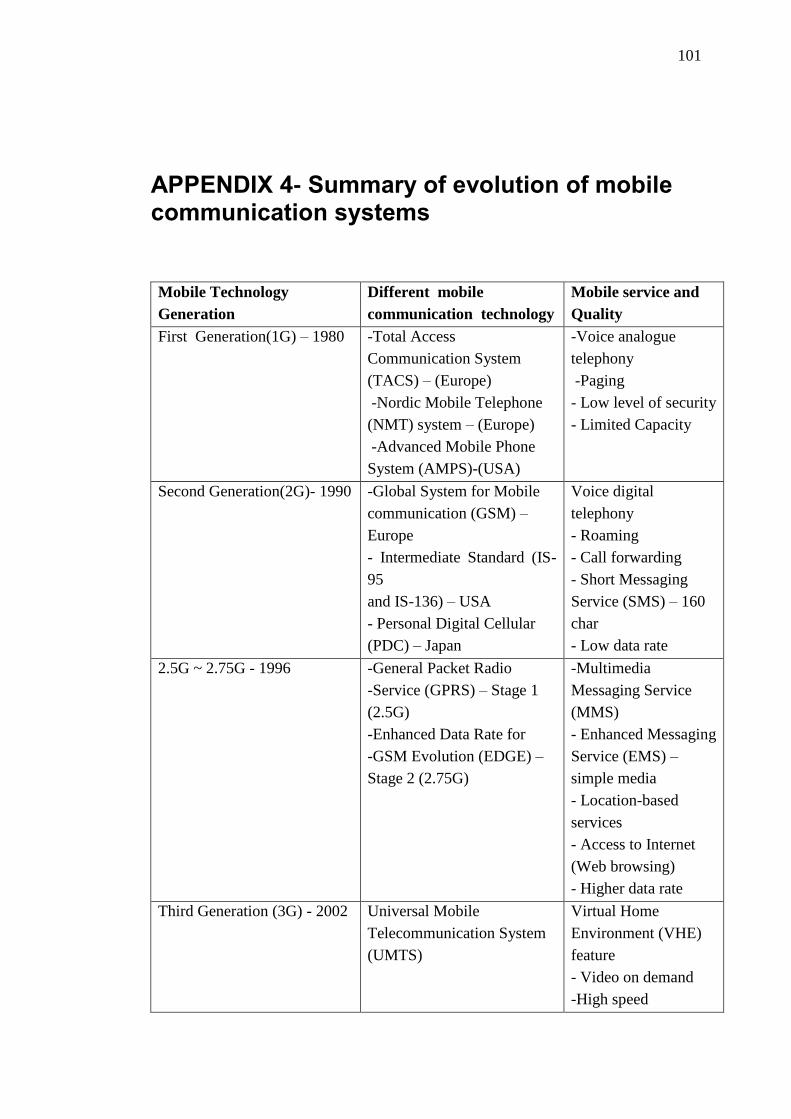
101
APPENDIX 4- Summary of evolution of mobile communication systems
Mobile Technology
Generation
Different mobile
communication technology
Mobile service and
Quality
First Generation(1G) – 1980 -Total Access
Communication System
(TACS) – (Europe)
-Nordic Mobile Telephone
(NMT) system – (Europe)
-Advanced Mobile Phone
System (AMPS)-(USA)
-Voice analogue
telephony
-Paging
- Low level of security
- Limited Capacity
Second Generation(2G)- 1990 -Global System for Mobile
communication (GSM) –
Europe
- Intermediate Standard (IS-
95
and IS-136) – USA
- Personal Digital Cellular
(PDC) – Japan
Voice digital
telephony
- Roaming
- Call forwarding
- Short Messaging
Service (SMS) – 160
char
- Low data rate
2.5G ~ 2.75G - 1996 -General Packet Radio
-Service (GPRS) – Stage 1
(2.5G)
-Enhanced Data Rate for
-GSM Evolution (EDGE) –
Stage 2 (2.75G)
-Multimedia
Messaging Service
(MMS)
- Enhanced Messaging
Service (EMS) –
simple media
- Location-based
services
- Access to Internet
(Web browsing)
- Higher data rate
Third Generation (3G) - 2002 Universal Mobile
Telecommunication System
(UMTS)
Virtual Home
Environment (VHE)
feature
- Video on demand
-High speed
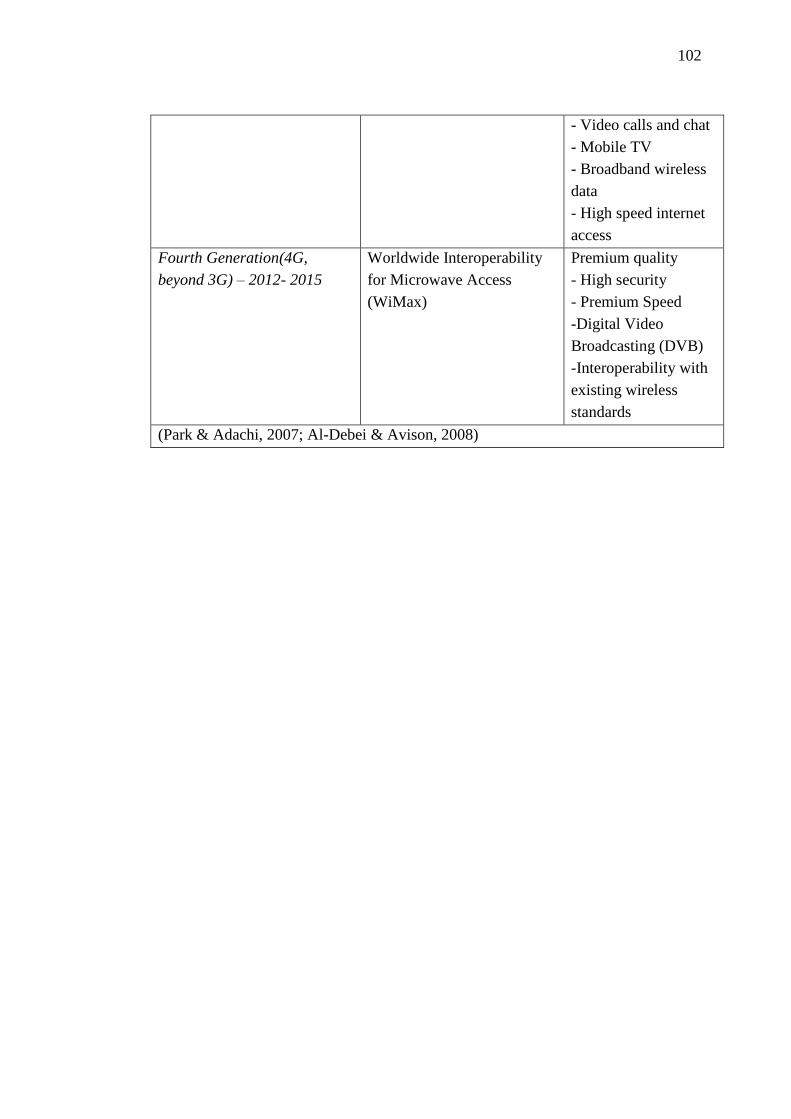
102
- Video calls and chat
- Mobile TV
- Broadband wireless
data
- High speed internet
access
Fourth Generation(4G,
beyond 3G) – 2012- 2015
Worldwide Interoperability
for Microwave Access
(WiMax)
Premium quality
- High security
- Premium Speed
-Digital Video
Broadcasting (DVB)
-Interoperability with
existing wireless
standards
(Park & Adachi, 2007; Al-Debei & Avison, 2008)