Estimating the Price Elasticity of Demand for Water with Quasi ...
Upload
khangminh22Category
view
0download
0
Koulayev, Sergei
Working Paper
Estimating demand in search markets: The case ofonline hotel bookings
Working Papers, No. 09-16
Provided in Cooperation with:Federal Reserve Bank of Boston
Suggested Citation: Koulayev, Sergei (2009) : Estimating demand in search markets: The caseof online hotel bookings, Working Papers, No. 09-16, Federal Reserve Bank of Boston, Boston,MA
This Version is available at:http://hdl.handle.net/10419/55600
Standard-Nutzungsbedingungen:
Die Dokumente auf EconStor dürfen zu eigenen wissenschaftlichenZwecken und zum Privatgebrauch gespeichert und kopiert werden.
Sie dürfen die Dokumente nicht für öffentliche oder kommerzielleZwecke vervielfältigen, öffentlich ausstellen, öffentlich zugänglichmachen, vertreiben oder anderweitig nutzen.
Sofern die Verfasser die Dokumente unter Open-Content-Lizenzen(insbesondere CC-Lizenzen) zur Verfügung gestellt haben sollten,gelten abweichend von diesen Nutzungsbedingungen die in der dortgenannten Lizenz gewährten Nutzungsrechte.
Terms of use:
Documents in EconStor may be saved and copied for yourpersonal and scholarly purposes.
You are not to copy documents for public or commercialpurposes, to exhibit the documents publicly, to make thempublicly available on the internet, or to distribute or otherwiseuse the documents in public.
If the documents have been made available under an OpenContent Licence (especially Creative Commons Licences), youmay exercise further usage rights as specified in the indicatedlicence.
1
No. 09-16
Estimating Demand in Search Markets: The Case of Online Hotel Bookings
Sergei Koulayev
Abstract: In this paper, we emphasize that choice sets generated by a search process have two properties: first, they are limited; second, they are endogenous to preferences. Both factors lead to biased estimates in a static demand framework that takes choice sets as given. To correct for this bias, we estimate a structural model of search for differentiated products, using a unique dataset of consumer online search for hotels. Within a nested logit utility model, we show that the mean utility function and the search cost distribution of a representative consumer are non-parametrically identified, given our data. Using our model’s estimates, we quantify both sources of bias: they lead to overestimation of price elasticity by a factor of five and four, respectively. The median search cost is about 38 dollars per 15 hotels; we also present some evidence on multi-modality of search cost distribution. JEL Classifications: C14, D43, D83, L13 Sergei Koulayev is an economist in the Consumer Payments Research Center of the Federal Reserve Bank of Boston. His e-mail address is [email protected]. This paper, which may be revised, is available on the web site of the Federal Reserve Bank of Boston at http://www.bos.frb.org/economic/wp/index.htm. This paper is part of my dissertation at Columbia University. I am indebted to my advisors, Michael Riordan, Bernard Salanié, and Kate Ho for their continual advice and encouragement. I am grateful to participants in the Applied Micro Theory colloquium, the Industrial Organization colloquium, and the Friday talks, all at Columbia University, for their helpful suggestions. Special thanks to Ting Wu for his support at early stages of this research. Financial support from the Program of Economic Research at Columbia University, from the NET Institute (www.netinst.org), and from the Kauffman Foundation is gratefully acknowledged. The views and opinions expressed in this paper are those of the author and do not necessarily represent the views of the Federal Reserve Bank of Boston or the Federal Reserve System.
This version: December 14, 2009

1 Introduction
In markets with multiple sellers and frequently changing prices, consumers often have to
engage in costly search in order to collect information necessary for making a purchase. A
rational consumer in such a situation would make a sequence of search e¤orts, stopping at a
point where the expected bene�t from another attempt falls short of the search cost. When
the search is over, the consumer makes a purchase from the set of goods discovered during
the process,1 that is, the choice set. Generated in this way,2 choice sets have two distinct
properties. First, since search is costly, they are usually small compared with the full set of
available products: according to comScore data,3 only a third of all consumers visit more than
one store while shopping online. Second, choice sets are endogenous to preferences. This is
because the decision to stop searching is dictated in part by the expected bene�ts of search,
which itself is a function of preferences.
These properties complicate the inference about consumer demand for di¤erentiated goods
in search markets. The standard approach, made popular by Berry (1994) and Berry, Levin-
sohn, and Pakes (1995), is to recover preferences from the joint variation of market shares of
goods and their attributes, including price. Implicitly, this method assumes that consumers
possess full information about all goods available on the market. Therefore, the variation
of choice sets across consumers comes from the availability of goods across markets, which
is arguably exogenous to preferences. In search markets, where the variation of choice sets
comes through individual search e¤orts, these assumptions do not hold and the application of
this method leads to biased estimates of demand. The purpose of this paper is twofold. First,
we propose an alternative estimation method that corrects for this bias. Second, using this
method, we evaluate both the overall magnitude of the bias and the individual contributions
of its two sources � the limited nature and the endogeneity of choice sets due to search.
We �nd that both properties of choice sets have signi�cant impact on estimates of the price
elasticity of demand, an important input in many applications, including pricing decisions,
welfare analysis of mergers, and bene�ts from the introduction of new products.
Our emphasis on separating the two sources of bias is motivated by the fact that their cor-
rection requires rather di¤erent approaches, both in nature and in the cost of implementation.
Correcting for the limited nature of choice sets can be achieved either by using information
on actual choice sets (as we do here), or by employing simulation methods developed in the
1 In the language of the search literature, we are assuming a search with recall: the consumer remembers allgoods found during search and can costlessly return to them. On the internet, where our application belongs,such an assumption is reasonable, since it is easy to return to the results previously found. In the o¤-lineworld, this may not be the case.
2Although in our application we focus on the sequential nature of the search process, these properties ofchoice sets clearly hold also for non-sequential searches.
3As reported by de los Santos (2008), the number is 27 percent in 2002 and 33 percent in 2004. In our data,too, only a third of searchers look at more than one page of hotel options resulting from the search request.See also Johnson et al. (2004) for additional evidence on search intensity on the web.
2

literature, reviewed below. To correct for the endogeneity bias, we suggest estimating prefer-
ences within a model that includes both observed search decisions and purchases as outcome
variables. Indeed, search decisions are precisely the channel through which preferences af-
fect the distribution of choice sets, leading to the endogeneity problem. However, as pointed
out by Sorensen (2001), and Hortacsu and Syverson (2004), explaining search decisions in
the context of di¤erentiated goods contains an identi�cation problem. A person may stop
searching either because she has a high idiosyncratic valuation for goods already found (her
status quo), or because she has a high search cost. Therefore, an observed measure of search
intensity (such as the distribution of search durations), can be explained either by variability
in utilities across goods or by moments of the search cost distribution. To separate the e¤ects
of search costs and preferences on search decisions, one may use exogenous shifters of search
costs. Alternatively, as we propose in this paper, one can use conditional search decisions:
a search action together with the observable part of the search history preceding the action.
In this way, we obtain a source of exogenous variation in the status quo across consumers,
allowing us to separate the e¤ects of search costs from the e¤ects of preferences on search
decisions.
We implement these ideas by estimating a structural model of sequential search, using a
unique dataset of search histories by consumers who were looking for hotels in Chicago, on a
popular website. Although this website o¤ers a variety of search tools, we focus on a subset of
consumers who employed a simple yet common strategy: start the search by sorting hotels by
increasing price and then �ip through pages.4 The advantage of this dataset is that it o¤ers
detailed information on search histories: search actions, observed hotels, and clicks.5 With
these data, we show that consumer preferences, in the form of nested logit, and the search
cost distribution are non-parametrically identi�ed.
By comparing price elasticities from the search model with those from the nested logit
model with full information, we �nd the latter overestimates it by as much as �ve times.
One explanation is that choice sets of these searchers include mostly cheaper brands, located
farther from the city center. As a result, consumers choose lower-quality hotels not only
because they are price sensitive (as the full-information model predicts), but also because the
higher-quality ones are often not observed. Although intuitive, this argument appeals only
to the limited nature of choice sets, while both properties of choice sets are responsible for
the bias. To correct for the limited choice sets, we drop the assumption of full information
and re-estimate the logit model using data on actual choice sets. We �nd that the extent of
overestimation of price elasticity remains large� about a factor of four. This is a consequence
4Clearly, the choice of the search strategy itself contains a great deal of information about consumer pref-erences. Currently, we are working on such a model. By contrast, in this paper we focus on the informationcontent of the sequential search decisions made within a given strategy.
5Since this website is a search aggregator, it does not sell hotel bookings itself. Rather, a click redirectsthe user to another website where the booking can be made. Therefore, we interpret a click as a revealedpreference action (see below).
3
of the endogeneity of choice sets. For example, if we see someone willing to incur a cost
in order to �nd more expensive, but potentially better-quality hotels, we ought to conclude
that she is less price sensitive than the static model would predict. In our data, we observe
su¢ cient search activity so that the search model predicts much lower price sensitivity than
the static one.6
Essentially, the observed conditional search decisions themselves convey information about
consumer preferences, which the static model cannot take into account. From our estimates,
we conclude that the amount of such information can be signi�cant. Therefore, both choice
and search decisions may be required for a correct inference about consumer demand in a
search environment similar to the one we study in this paper. To be sure, an exercise of this
kind puts high requirements on the data, but since the technology necessary for its collection
is already in place,7 we believe such data will become increasingly available in the near future.
The median search cost is around 38 dollars for a collection of 15 hotels, or 2.5 dollars per
hotel; there is also signi�cant heterogeneity of search costs among the population. Although
this estimate is generally in line with the �ndings of the existing empirical papers on search,
its magnitude is still large. This suggests that there is room for improvement in our modeling
of search decisions; we would account better for individual heterogeneity, were data on this
available. Another potential explanation of large search costs is that, because of data limita-
tions, we do not account for future searches by the same person, although these may serve as
a substitute for current search actions. We also present some evidence suggesting that search
costs have a bimodal distribution. There are two groups of consumers: those with almost
zero search costs (about 20 percent of the population) and those with median cost of $80 per
15 hotels (about 80 percent of the population).
This paper is organized as follows. In the next section, we situate our study in the
existing literature. Section 3 describes the data; in section 4 we present our search model,
and in section 5 we discuss its identi�cation. Results are discussed in section 6 and in section
7 we compute and compare price elasticities of demand. Section 8 concludes. The appendix
contains all the tables and �gures.
6A similar argument can be made when the sorting is by attributes other than price. For example, manyusers sort hotels by distance to the city center. Their choice sets are accordingly limited and skewed relativeto the full set of hotels, and their search actions demonstrate their preference of being close to the city centerversus other characteristics (such as price or access to parking). In fact, almost all search within a givenplatform is done by either sorting or �ltering the search results by a particular attribute.
7Basically, what is required is a simple server script that records all actions and displays shown to the user.Although the data collection on a particular search platform is straightforward, linking the search activityacross di¤erent platforms is a much harder task. Currently, the comScore web-behavior panel records suchdata using plug-ins installed on the browsers of respondents.
4

2 Related literature
In the growing literature on consumer search, we know of two other studies that estimate
search for di¤erentiated goods. Aside from di¤erences in the modeling approach and data,
our contributions relative to these papers are: �rst, a novel identi�cation strategy, together
with a formal result supporting it; second, a decomposition of the search-induced bias in
demand estimates, both conceptual and empirical. Mehta, Rajiv, and Srinivasan (2003)
estimate a non-sequential model of search for laundry detergents and �nd that the predicted
price elasticities are higher than those in the model with full information. They explain this
�nding by the limited nature of choice sets, in an argument similar to the one above: contrary
to the search model, the full information model assumes that consumers are aware of all price
promotions and therefore must be price insensitive to show a low response. Although they
discuss the relationship between price elasticity and length of search, they do not recognize
the endogeneity of choice sets as a reason for the obtained discrepancy in price elasticities. In
a concurrent study, Kim, Albuquerque, and Bronnenberg (2009) also exploit the identi�cation
power of search decisions, in a rather striking way: they estimate preferences and search costs
using only view-rank data from Amazon, and no purchase data at all.
Existing papers on the identi�cation of the search model consider either the case of homo-
geneous goods, for example, search for the best price (Hong and Shum (2003) for sequential
search and de los Santos (2008) for non-sequential search) or the case of pure vertical di¤eren-
tiation (Hortacsu and Syverson (2004)). We add to these results by considering a nested logit
utility model� a speci�cation that allows for both horizontal and vertical di¤erentiation. A
limitation of our result is that we identify a common mean utility function, while the distrib-
ution of heterogeneity remains �xed. Extending this result to the model with random tastes
remains a subject of future research.
This paper is also related to an emerging literature on consumer choice with limited avail-
ability, which, contrary to our case, is largely exogenous to preferences.8 These papers study
the impact of limited choice sets on estimates of demand and propose various methods to
correct for the bias. For example, Conlon and Mortimer (2009) estimate the impact of under-
stocking on the demand for snacks, using real-time data from vending machines, and propose
an E-M algorithm to account for periods when the availability is unobserved. Bruno and Vil-
cassim (2008) propose a novel simulation method to account for store-level availability, based
on aggregate data. Mariuzzo, Walsh, and Whelan (2009) use store-level data on availability
of soft drinks in Ireland and estimate demand in an equilibrium framework. Similar to our
study, these papers conclude that short-run variation in choice sets may have a signi�cant
impact on the estimates of consumer preferences.
8The exogeneity assumption sets these papers apart from a large literature on consideration set formation,for example, Bronnenberg and Vanhonacker (1996) or Mehta et al. (2003), where choice sets are limited, butalso endogeneous to preferences.
5

3 Data
A consumer is searching for a hotel in Chicago on kayak.com. To begin the search, she
submits a search request, which includes the city (Chicago), dates of stay, number of guests,
and number of rooms. On average, a search request results in more than 140 available hotels,
which makes it a non-trivial search problem. To navigate among search results, users can
simply �ip through pages or employ various sorting and �ltering tools, such as sorting by
price or �ltering by neighborhood. Each search action (�ipping, sorting, �ltering) results in a
display of at most 15 hotel options. As soon as the user �nds a preferred hotel, she can click
on it: this website does not sell hotel bookings itself, so the click redirects the user to another
website9 where a booking can be made. About half of the searchers who click do it only once,
in which case this is the end of the search session. If more than one click is made, we take
the last one for the analysis. Alternatively, the user can end the search just by leaving the
website, without clicking. In total, there are 24,321 unique search histories, by consumers
who searched on this website during May 2007.
For every search history we observe: (1) parameters of the initial request (date of search,
dates of stay, number of people, number of rooms), (2) sequence of search actions, (3) contents
of the page following every action (hotel options with prices and other characteristics), and
(4) identities and prices of clicked hotels. Thus, this dataset o¤ers a very detailed picture
of the search history, which sets it apart from other available datasets on consumer search
behavior. At the same time, it has two main limitations. First, since the booking is made on
other websites (usually, Expedia or the hotel�s own), we do not observe the actual bookings,
only clicks, as a noisy measure of the bookings. See Section 4.5 for a discussion of this issue.
Second, these data come from anonymous users. That is, as soon as the user leaves the
website, the cookie that identi�es the search session is destroyed and we cannot tell whether
two sessions were made by the same person or not. Therefore, we are going to consider every
search history as if made by a separate individual. Since this is the model of search without
learning, the past searches are unlikely to a¤ect the current behavior of a consumer. Instead,
the possibility of future search can serve as a substitute for the current search e¤ort, and, to
that extent, our estimates of search costs are exaggerated.
Because of the availability of various sorting and �ltering tools, the strategy space that this
website o¤ers to a searcher is extremely rich. Modeling the search process in a rational and
comprehensive way in this environment seems unfeasible. Therefore, we focus on a subset of
the population who employed a particular search strategy, both simple and popular: start the
search by sorting by price, and then decide whether to see the next page of results, with more
expensive but potentially better-quality hotels. In total, these criteria give us 1081 unique
search histories that we use in the estimation. Of these 1081 searchers, 814 never turned a
9We do observe the destination of the click, but we are not currently using this information in our estimation.
6

page, and 267 turned one page. This represents only 4.4 percent of the general population
(that is, we observed 24,321 unique searches), and 79.5 percent of searchers who employed a
�sort by price and �ip�strategy (1360 in total). Despite its low share in the total number of
searches, price sorting remains the most popular �active�search strategy: more than half of
visitors do not search at all, or just �ip through unsorted pages. An additional factor limiting
the sample is that we do not include searches where the subjects continue searching using
other strategies, such as sorting by distance or by �ltering by neighborhood.
Our dataset is a selected sample, probably consisting of more price-sensitive consumers,
since they have chosen price sorting as the best search strategy. Therefore, estimation re-
sults should be interpreted as being conditional on the choice of this search strategy. We
would like to elaborate on a few rationales behind our choice. Although the computational
cost is certainly one of them, there are others as well. First, price sorting is a ubiquitous
method of search� not only on this particular website, but across the internet: most of the
other search platforms o¤er price sorting as a navigational tool, and some focus exclusively
on price comparison. Therefore, understanding how people behave within this particular en-
vironment is an empirically important issue. Second, because of the lack of consumer-level
observables� demographics, income, education, etc.� we are limited in our ability to model
heterogeneous preferences. For example, heterogeneity in income may a¤ect both price elas-
ticity and search costs. By focusing on a group of consumers who employed the same search
strategy� essentially, those who decided to look at the same set of hotels� we expect to obtain
a relatively homogeneous sample, in terms of their tastes, price sensitivity, and travel intent.
Next, we describe the available data �elds in more detail, comparing the estimation sample
with the general population along the way.
3.1 Chicago hotels
A search request for Chicago hotels typically returns 130�140 hotel options, depending on
availability. During May 2007, the maximal number10 of returned hotels was 148; these are
Chicago hotels with online pricing. Figure 1 demonstrates a wide variation in the geographical
position of hotels. These are hotels located in the city of Chicago itself, in satellite towns
(Evanston, Skokie, etc.), as well as in close proximity to airports (O�Hare, Midway). For each
hotel, we observe: name, including brand, if any, price, star rating, neighborhood, distance to
the city center. In a separate dataset, we have more detailed data on these establishments;
however, we use only the ones named above, as these are shown to the searcher and hence most
likely to a¤ect her decisions. Table 2 shows these variables. Hotels in neighborhoods labeled
as "Gold Coast," "Loop," and "West side" are all within two miles of the city center, so we
10 If one includes hotels without online pricing (that is, those who advertise themselves on the internet butgive price quotes only by phone), their number rises to around 220. However, by default the website showsonly hotels with online pricing, and we use only these for estimation.
7
group them under a common category, "Center." Hotels in "SW" (Southwest) and "Midway"
are relatively far from the center; we grouped them under the "South" category. Hotels to
the north side are labeled "North," and there is a special category, "O�Hare," after the major
airport in the area. On Figure 2 we have the distribution of hotels by their distance to the
city center. There are two well-de�ned clusters: hotels located within �ve miles of the city
center, and those far from the city, between 10 and 20 miles away. These clusters are largely
accounted for by neighborhood groups.
Since we do not observe the total availability for each request, we assume that all N=148
hotels are available at the time of request. This assumption is needed only for speci�cation
of the consumer�s beliefs, and it a¤ects our results only in this way. In May 2008, we checked
the availability of various types of requests at random dates. Most of the time, most of hotels
were shown as available; in other words, we found little variation in availability.
3.2 Request types
To start a search, the user has to enter a search request. Its parameters include: date of
search, dates of stay, number of people, and number of rooms. From the dates of search and
stay, we can derive advance purchase, length of stay, and whether Saturday night is included.
Table 3 summarizes these parameters. On average, consumers in our sample search 16 days
in advance (versus 19 days among the general population), and 56 percent of them stay over
a weekend (versus 59 percent in the total sample). Another notable feature is that they often
travel in groups: the average number of guests is 1.84. In our analysis, we aggregate various
combinations of parameters of request into a number of "types" based on whether the search
is made more than a week in advance, whether a weekend stay is included, and whether the
person is traveling alone or in a group. We conjecture that these types may re�ect underlying
characteristics of the consumer, such as price sensitivity, or the value of the outside option.
For example, one could argue that people who stay over the weekend are more likely to be
leisure travelers; the same may be true of those who search well in advance.
3.3 Searching and clicking activity
In our sample, a searcher can turn at most one page, after sorting results by price. As a
result, the average length of search in the estimation sample is relatively low, 1.25 pages.
Among the general population, search intensity is much higher: 3.90 pages (with a standard
deviation of 3.36). We �nd that most of the di¤erence is not the result of our restriction on
the number of �ipped pages; rather, it is due to limitations of price sorting itself: people who
search for three or more pages employ several strategies. If we consider only searchers who
limited themselves to price sorting, the mean search length is 1.74 pages.
In terms of raw click rates, we do not �nd any statistical di¤erence between the estimation
8
sample and the population: on average, the click rate is 0.36�0.38, with a standard deviation
of 0.48. However, if we break click rates across di¤erent consumers with di¤erent parameter
requests, then some di¤erences appear, as shown in Table 4.Contrary to that of the general
population, the click rate of people who use only price sorting is: (a) positively and signi�cantly
a¤ected by length of stay, (b) not a¤ected by weekend stay, and (c) not a¤ected by advance
purchase. In all groups an increase in the number of travelers has a strong e¤ect on the click
rate. This is preliminary evidence that the parameter of request may be relevant for consumer
type; to test this idea more formally, we include request variables in the value of the outside
option (see the next section).
Combining clicking and turning activity, one can distinguish between various types of
demand. Demand for hotels on the �rst page may be "fresh" demand (from those people who
did not go to the second page) or "returning" demand (from those who went to the second
page and returned); demand for hotels on the second page is "residual" demand. The joint
distribution of clicking and turning is:
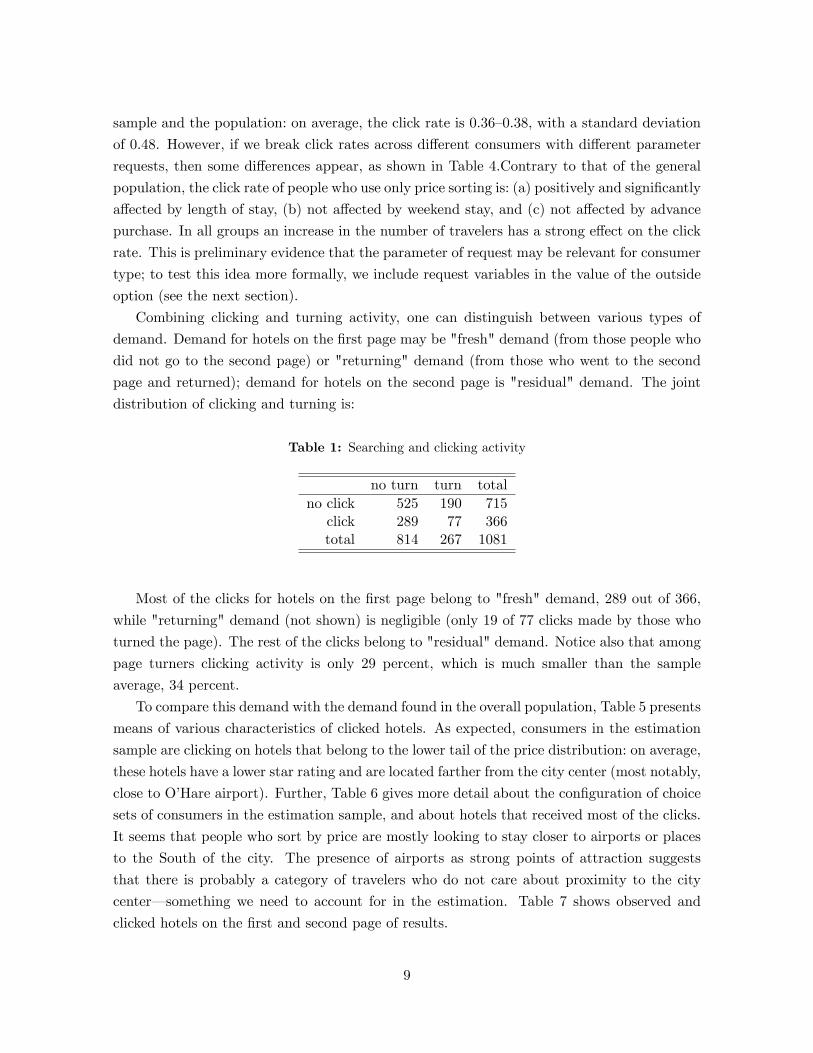
Table 1: Searching and clicking activity
no turn turn totalno click 525 190 715click 289 77 366total 814 267 1081
Most of the clicks for hotels on the �rst page belong to "fresh" demand, 289 out of 366,
while "returning" demand (not shown) is negligible (only 19 of 77 clicks made by those who
turned the page). The rest of the clicks belong to "residual" demand. Notice also that among
page turners clicking activity is only 29 percent, which is much smaller than the sample
average, 34 percent.
To compare this demand with the demand found in the overall population, Table 5 presents
means of various characteristics of clicked hotels. As expected, consumers in the estimation
sample are clicking on hotels that belong to the lower tail of the price distribution: on average,
these hotels have a lower star rating and are located farther from the city center (most notably,
close to O�Hare airport). Further, Table 6 gives more detail about the con�guration of choice
sets of consumers in the estimation sample, and about hotels that received most of the clicks.
It seems that people who sort by price are mostly looking to stay closer to airports or places
to the South of the city. The presence of airports as strong points of attraction suggests
that there is probably a category of travelers who do not care about proximity to the city
center� something we need to account for in the estimation. Table 7 shows observed and
clicked hotels on the �rst and second page of results.
9

3.4 First-page variation
It is important for the identi�cation of the model to have su¢ cient variation in the prices of
hotels observed by searchers on the �rst page (that is, prior to making the search decision),
as we will see in Section 5. Luckily for us, the hotel market is characterized by �uctuating
demand and price-discrimination strategies (otherwise called revenue management) employed
by hotels. This produces an ample variation of prices of hotels observed on the �rst page:
they range from 32 to 567 dollars, with mean of 97 dollars. To o¤er some evidence of price
variation at the hotel level, on Figure 3 we plot 10 percent and 90 percent quantiles of the price
distribution (from the �rst page data), for each hotel separately. Although not all hotels (118
out of 148) were observed on the �rst page, most of the observed hotels displayed signi�cant
price variation.
An additional role is played by maximal prices on the �rst page. According to the search
model, these prices serve as truncation points for the distribution of prices on the second
page. This source of variation in posterior beliefs adds to variation in the expected bene�t
of search among consumers. As common intuition suggests, consumers who observed high
maximal prices on the �rst page should turn less frequently, expecting even higher prices
on the second page. Table 8 presents summary statistics of maximal prices, separately for
turners and non-turners. The expected di¤erence in behavior appears only for very high
truncation prices� those in the 90 percent and 95 percent quantiles and for the four highest
price observations.
Finally, looking beyond variation in prices, do people see �rst pages that are structurally
di¤erent? On Figure 4, for every hotel we plot the share of �rst pages on which this hotel
has appeared. Most hotels appear on the �rst page only from time to time (in fewer than
40 percent of cases), and only 15 hotels are displayed at least every second time. These are
mainly two-star hotels and a couple of cheap one-star hotels. In other words, we do observe
some diversity in the structure of the �rst pages, although it is not as substantial as the price
variation.
4 Model
In this search environment, every consumer starts by observing a page of 15 hotel options,
sorted by increasing price. At this point, she has three alternatives: (a) leave the website
without clicking, (b) click on a hotel on the �rst page, or (c) go to the next page of results,
which will reveal another 15 hotels, higher priced but of potentially better quality. We can
merge options (a) and (b) by including the outside option as the "null" hotel, which is implic-
itly present on every page. Search is costly: every consumer is endowed with a non-zero search
cost, which we interpret as a cognitive cost of processing information about 15 hotel options.
Also, we assume search with recall: when on the second page, the consumer remembers the
10

best option found on the �rst page and can costlessly return to it if so desired. To summarize,
the consumer in our model faces a two-step decision problem: �rst, decide whether or not to
search, by comparing the expected bene�t of search to the search cost; second, decide which
hotel to click on, by comparing valuations of hotels in the choice set. To complete the model,
we need to specify three basic ingredients: �rst, a utility model that determines the value
of a hotel as a function of its observed and unobserved characteristics; second, a model of
consumer beliefs about the bene�ts of turning the page; third, a distribution of search costs
among the population. We start with the model of utility.
4.1 Utility
The information about every hotel that is displayed to the consumer includes the name of
the hotel, brand, price, geographical location, star rating, and amenities. Since the consumer
observes the hotel�s identity, we assume that she can infer her idiosyncratic taste about this
hotel, or "match value" in the parlance of the search literature.11 The vector of observed
hotel characteristics plus the match value determine the dimensionality of the space where the
search is going on. A useful feature of the utility model, besides its ability to explain people�s
choices, is that it allows one to translate the search problem from the multi-dimensional space
of characteristics into the single-dimensional space of utilities. Therefore, we can extend some
of the intuition developed in theoretical models of search for the best price into the situation
of search for di¤erentiated products. Such notions as status quo, expected bene�t of search,
and reservation value continue to hold and be useful.
The mean utility from a particular hotel is a linear function of price, star rating, and
geographical position of a hotel (distance to the city center, neighborhood). After trying
various speci�cations, we settled on the following model of utility:
u(pj ; qj ; "ij) = �dodojI(nj = Ohare) + �ddjI(nj 6= Ohare) (1)
+�ssj +�!� n�!n j +�!� b
�!b j + �
ipPj + "ij
�ip = �p + �pwdWi
where Pj is the displayed price of hotel j (in hundreds of dollars); qj =�doj ; dj ; sj ;
�!n j ;�!b j
�is
a vector of non-price characteristics of hotel j: distance to O�Hare airport, distance to the city
center, star rating, and a set of neighborhood and chain dummies. We take dj = log(1 +Dj)
� the logarithm of distance (in miles)� in order to smooth the outliers (see Figure 2). Hotels
in the neighborhood of O�Hare airport are located quite far from the city center, more than
10 miles. Therefore, we conjecture that searchers who want to stay close to the airport care
11Learning the match value can be costly. This cost can be modeled explicitly, as in Kim, Albuquerque andBronnenberg (2009), or implicitly, as in this paper, where it constitutes a part of the search cost, for example,the total cost of processing information about 15 hotel options.
11

only about distance to it, and searchers who want to stay closer to the city center care about
distance to the center, not the airport. We attempted a speci�cation where we included
both distances independently and found that the coe¢ cients were poorly identi�ed (note that
the O�Hare dummy is already present independently, among the �!n j variables). To capturepossible heterogeneity between business and leisure travelers, we allow the price sensitivity to
depend on Wi� a dummy variable that is equal to one if a person stays over a weekend, and
zero if not.
There is also an additive term, a "taste shock" or "match value," that determines the
idiosyncratic taste of a given consumer for a given hotel. It is observable to the consumer
but not to the econometrician, and it follows a Type 1 extreme value distribution (EV).
Importantly,
Assumption 1 Match values, or taste shocks, are distributed independently of a hotel�s char-acteristics.
This is a restrictive assumption, in particular because we rule out possible correlation
between price and taste shock, which includes unobserved hotel quality. We adopt this as-
sumption for two reasons. First, it is hard to �nd reasonable instruments for hotel price.12
Second, in our model error terms enter non-linearly into the moments, which prevents the
straightforward application of existing results on IV estimation (although the control function
approach may be a solution). At the same time, we allow consumer tastes for hotels within
the same neighborhood to be correlated, as the consumer may have a particular preference
for the neighborhood as a whole. Parameter � stands for the measure of correlation and is
estimated together with other parameters. Taken together, these assumptions on the error
term lead to a nested logit model.
To capture di¤erences of quality standards among di¤erent hotel chains, we include a set
of brand dummies. A large number of hotel brands are present in the Chicago market, but
for most of them the estimation sample has very little or no data on clicks. Therefore, we
include only the �ve most frequently occurring hotel brands: "Null," Rodeway Inns, Econo
Lodge, Days Inn, and Best Western� together, they attract 28 percent of impressions and 56
percent of clicks. The "Null" brand stands for hotels that do not belong to any chain; all
other hotels are grouped under a default category.
Leaving the website without any click constitutes a choice of the outside option, whose
utility is:
ui0 = �out +�!� o�!R i + "i0 (2)
12Some popular choices, such as characteristics of other hotels (as in Berry, Levinsohn, and Pakes (1995)) donot work, because of lack of variation. Hausman-type instruments, such as prices of hotels in other markets,are probably not exogenous because of correlation of geographic demand shocks. Various shifters of marginalcost, such as wages in the area, can explain very little of price variation, which is mainly driven by demand�uctuations.
12
where�!R i is a vector of dummy variables, constructed from the request parameters by con-
sumer i, indicating whether the search is made more than a week in advance, whether there is
more than one traveler, and whether a weekend stay is included. By including these consumer-
speci�c variables in the value of the outside option, we attempt to control for various reasons
for leaving the website. For example, the user may decide to call the hotel directly, or to
search later, or to give up on the idea. While we do not observe all these reasons, we may
conjecture that users who search further in advance have more opportunities for searching
later and hence are less likely to settle at the moment. Note that the utility speci�cation
(1) does not include a constant term. This exclusion restriction is necessary to identify �out;
alternatively, we could identify a constant term in (1) and normalize �out to zero.
4.2 Search decision
A model of rational search implies that when making a search decision, the consumer takes
into account the information she has collected so far. In our case, the relevant information
set consists of 15 hotel options observed on the �rst page of results. Since prices are sorted
in increasing order, these are the 15 lowest priced hotels among those available. Let uir =
u(pir; qir; "ir)� the utility of a hotel ranked r, for consumer i; also, let r = 0 correspond to the
outside option. From the �rst page of results, the consumer receives the current best utility,
U�1i = maxfuirg15r=0, and the information set, 1i = fpir; qir; "irg15r=1.Going to the next page will reveal the next 15 hotels, which will be more expensive, but po-
tentially of better quality. These hotels can be summarized by U�2 = maxfu(pr; qr; "r)g30r=16�the best utility from the second page. At the point of decision making, the consumer faces
uncertainty about the possible realization of results from the search. Let Fu(U�2 j1i) be con-sumer i0s belief about the distribution of U�2 , conditional on her information set, 1i. Then,
a rational consumer will turn the page if and only if the expected bene�t of doing so exceeds
the search cost: Z +1
U�1i
(U�2 � U�1i (1i)) dFu(U�2 j1i) > ci (3)
where ci is a search cost of consumer i. A crucial assumption is the following.
Assumption 2 The distribution of search costs is independent of the distribution of the con-tents of the �rst page across consumers.
With this assumption, we can analyze the search decision of every consumer as being
conditional on her information set. In this way, we obtain exogenous variation in the expected
bene�t of search� the left side of the inequality� which can be used for identi�cation (see
below). In our basic speci�cation, we assume a log-normal distribution of search costs, from
which every consumer receives an i.i.d draw. Parameters of this distribution are estimated
together with other unknowns. We also attempt a number of alternative speci�cations of the
13

search cost distribution, as reported later. Note that the lower limit of integration is U�1i,
since we assume search with recall, that is, the consumer can costlessly go back to the �rst
page. We now discuss the construction of the consumer�s beliefs in more detail.
4.3 Beliefs
To determine the expected bene�t of a search, the consumer formulates a belief, denoted by
Fu(U�2 j1i), about the distribution of U�2� the best utility on the second page of results�
conditional on her information set, 1i. We adopt a structural approach to constructing this
belief. First, we specify the consumer�s beliefs about the primitives that determine U�2 : price,
quality, and match values of hotels on the second page. Second, we use the utility model
to translate this belief from the multi-dimensional space of product characteristics into the
single dimension of utilities. While such an approach is computationally much more costly
(relative to, say, imposing parametric assumptions on Fu itself), it has the bene�t of explicitly
accounting for the role of preferences in the search decision. Certain features of this search
environment distinguish this search problem from the stylized models studied in theoretical
papers and have to be taken into account: the search space is multi-dimensional, a search
attempt reveals multiple hotels at a time, results are sorted by price so that the distribution
of prices on the second page is truncated, and the consumer should not expect to see the same
hotels again (memory).
We start with # (pj ; qj ; "ij), the consumer�s belief about the joint distribution of attributes
of a random hotel, prior to search (before observing the �rst page of results). Together
with other empirical studies on consumer search, we assume that # (pj ; qj ; "ij) re�ects the
actual distribution of the data (in this case, prices and qualities of Chicago hotels), and
crucially, that the consumer knows it prior to search. This is in contrast to the search from
an unknown distribution, where consumers are uncertain about actual #(:) and learn about
it while searching (see Koulayev (2009), Koulayev and Wu (2009), de los Santos, Hortacsu,
and Wildenbeest (2009) for estimation of such models).
Using the chain rule and Assumption (1) (independence of taste shocks), we can rewrite
# (pj ; qj ; "ij) as a product of conditionals:
# (pj ; qj ; "ij ja) = fp(pj jqj)H(qj)f"("ij) (4)
where the distribution of match values, f"("ij), is Type 1 EV. Note that both the consumer
and the econometrician are uncertain about the match values of hotels that may appear on
the second page: the motivation is that consumer i learns about "ij only when she observes
hotel j. In fact, the above equation does not follow immediately from Assumption (1), but
rather is motivated by it: indeed, this is a statement about consumer beliefs, not preferences.
We also assume that consumer knows the empirical distribution of non-price characteristics
14

of existing hotels X = fqjgNj=1:
H(qj) =1
N
Xqj2X
I(qj = q) (5)
where the equality qj = q is satis�ed if all components of vector qj are equal to the corre-
sponding components of a vector q. Note that we do not assume that the consumer knows
the identities of all Chicago hotels� otherwise she would know all "ij , contrary to the above.
Instead, she knows H(q), the distribution of observable qualities of Chicago hotels� those 148
hotels that had online pricing in May 2007� and perceives hotels on the second page as a
random draw from it.
The belief about price distribution is log-normal:
fp(pj) = �(�pj ; �2j ) (6)
pj = ln(Pj)
where the hotel-speci�c mean and standard deviation (�pj ; �2j ) are estimated on a large dataset
of hotel prices. Various tests of normality of residuals do not reject the null hypothesis of
normality. After the consumer has seen the �rst page, she has to make two transformations
to her belief # (pj ; qj ; "ij), to condition it on the observed information, 1i. First, she takes
into account the fact that second-page prices are truncated from below by the maximal price
on the �rst page:
fp(pj jpj > pi15) =�(�pj ; �
2j )
1� �(pi15; �2j )(7)
Second, we allow for "memory" e¤ects, in the sense that the consumer should not expect to
see the same hotel as on the �rst page:
H(qj1i) =1
N � 15X
qj2X=1i
I(qj = q) (8)
Both the price truncation and the exclusion of already observed hotels constitute the particular
ways in which the consumer in our model updates her beliefs from the available information.
This is why, even when there is no Bayesian learning, we have conditioning of posterior beliefs
Fu(U�2 j1i) in (3).Finally, using the utility model (1), we transform the belief from the multi-dimensional
space of hotel attributes into the space of scalar utilities, to obtain Fu(U�2 j1i). In practice,the integration in (3) is done by simulations, so we do not attempt derive analytical density
here.
15
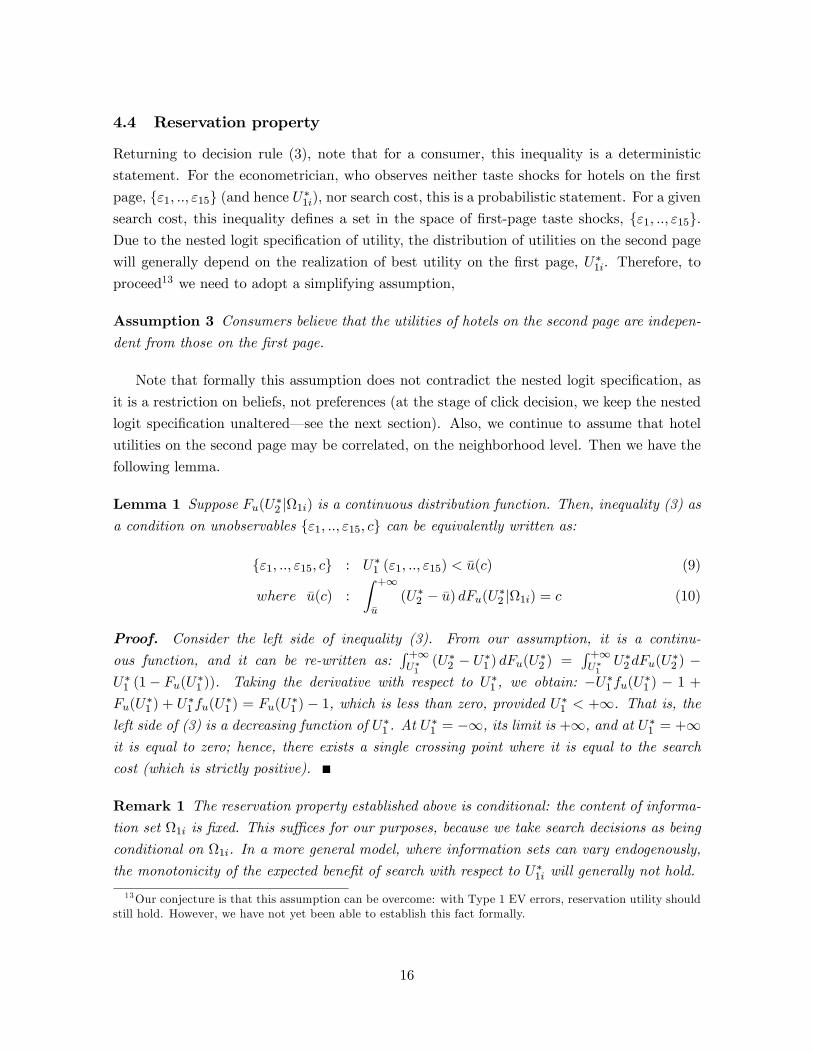
4.4 Reservation property
Returning to decision rule (3), note that for a consumer, this inequality is a deterministic
statement. For the econometrician, who observes neither taste shocks for hotels on the �rst
page, f"1; ::; "15g (and hence U�1i), nor search cost, this is a probabilistic statement. For a givensearch cost, this inequality de�nes a set in the space of �rst-page taste shocks, f"1; ::; "15g.Due to the nested logit speci�cation of utility, the distribution of utilities on the second page
will generally depend on the realization of best utility on the �rst page, U�1i. Therefore, to
proceed13 we need to adopt a simplifying assumption,
Assumption 3 Consumers believe that the utilities of hotels on the second page are indepen-dent from those on the �rst page.
Note that formally this assumption does not contradict the nested logit speci�cation, as
it is a restriction on beliefs, not preferences (at the stage of click decision, we keep the nested
logit speci�cation unaltered� see the next section). Also, we continue to assume that hotel
utilities on the second page may be correlated, on the neighborhood level. Then we have the
following lemma.
Lemma 1 Suppose Fu(U�2 j1i) is a continuous distribution function. Then, inequality (3) asa condition on unobservables f"1; ::; "15; cg can be equivalently written as:
f"1; ::; "15; cg : U�1 ("1; ::; "15) < �u(c) (9)
where �u(c) :
Z +1
�u(U�2 � �u) dFu(U�2 j1i) = c (10)
Proof. Consider the left side of inequality (3). From our assumption, it is a continu-
ous function, and it can be re-written as:R +1U�1
(U�2 � U�1 ) dFu(U�2 ) =R +1U�1
U�2dFu(U�2 ) �
U�1 (1� Fu(U�1 )). Taking the derivative with respect to U�1 , we obtain: �U�1 fu(U�1 ) � 1 +Fu(U
�1 ) + U
�1 fu(U
�1 ) = Fu(U
�1 ) � 1, which is less than zero, provided U�1 < +1. That is, the
left side of (3) is a decreasing function of U�1 . At U�1 = �1, its limit is +1, and at U�1 = +1
it is equal to zero; hence, there exists a single crossing point where it is equal to the search
cost (which is strictly positive).
Remark 1 The reservation property established above is conditional: the content of informa-tion set 1i is �xed. This su¢ ces for our purposes, because we take search decisions as being
conditional on 1i. In a more general model, where information sets can vary endogenously,
the monotonicity of the expected bene�t of search with respect to U�1i will generally not hold.
13Our conjecture is that this assumption can be overcome: with Type 1 EV errors, reservation utility shouldstill hold. However, we have not yet been able to establish this fact formally.
16
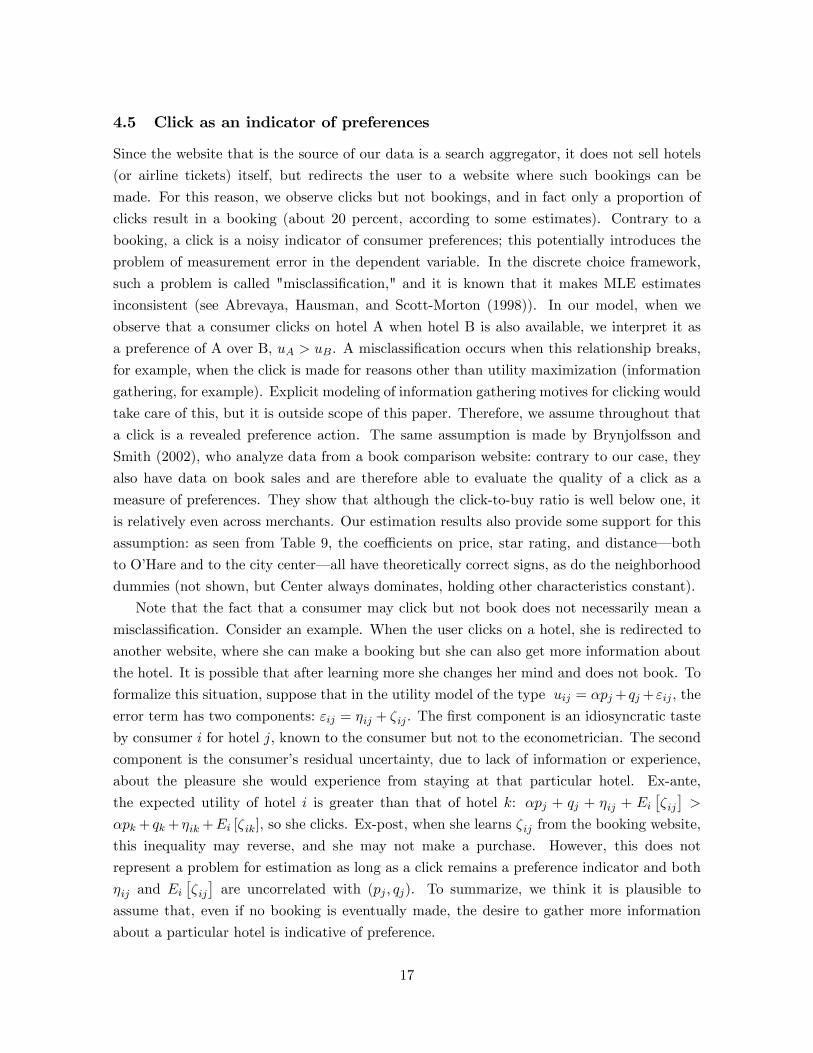
4.5 Click as an indicator of preferences
Since the website that is the source of our data is a search aggregator, it does not sell hotels
(or airline tickets) itself, but redirects the user to a website where such bookings can be
made. For this reason, we observe clicks but not bookings, and in fact only a proportion of
clicks result in a booking (about 20 percent, according to some estimates). Contrary to a
booking, a click is a noisy indicator of consumer preferences; this potentially introduces the
problem of measurement error in the dependent variable. In the discrete choice framework,
such a problem is called "misclassi�cation," and it is known that it makes MLE estimates
inconsistent (see Abrevaya, Hausman, and Scott-Morton (1998)). In our model, when we
observe that a consumer clicks on hotel A when hotel B is also available, we interpret it as
a preference of A over B, uA > uB. A misclassi�cation occurs when this relationship breaks,
for example, when the click is made for reasons other than utility maximization (information
gathering, for example). Explicit modeling of information gathering motives for clicking would
take care of this, but it is outside scope of this paper. Therefore, we assume throughout that
a click is a revealed preference action. The same assumption is made by Brynjolfsson and
Smith (2002), who analyze data from a book comparison website: contrary to our case, they
also have data on book sales and are therefore able to evaluate the quality of a click as a
measure of preferences. They show that although the click-to-buy ratio is well below one, it
is relatively even across merchants. Our estimation results also provide some support for this
assumption: as seen from Table 9, the coe¢ cients on price, star rating, and distance� both
to O�Hare and to the city center� all have theoretically correct signs, as do the neighborhood
dummies (not shown, but Center always dominates, holding other characteristics constant).
Note that the fact that a consumer may click but not book does not necessarily mean a
misclassi�cation. Consider an example. When the user clicks on a hotel, she is redirected to
another website, where she can make a booking but she can also get more information about
the hotel. It is possible that after learning more she changes her mind and does not book. To
formalize this situation, suppose that in the utility model of the type uij = �pj+qj+"ij , the
error term has two components: "ij = �ij + �ij . The �rst component is an idiosyncratic taste
by consumer i for hotel j, known to the consumer but not to the econometrician. The second
component is the consumer�s residual uncertainty, due to lack of information or experience,
about the pleasure she would experience from staying at that particular hotel. Ex-ante,
the expected utility of hotel i is greater than that of hotel k: �pj + qj + �ij + Ei��ij�>
�pk+ qk+ �ik+Ei [�ik], so she clicks. Ex-post, when she learns �ij from the booking website,
this inequality may reverse, and she may not make a purchase. However, this does not
represent a problem for estimation as long as a click remains a preference indicator and both
�ij and Ei��ij�are uncorrelated with (pj ; qj). To summarize, we think it is plausible to
assume that, even if no booking is eventually made, the desire to gather more information
about a particular hotel is indicative of preference.
17

Further, the �no click�action also represents a certain ambiguity. Indeed, there may be
a number of possibilities, some of which may be correlated with options observed before. For
example, the consumer may decide to call the desired hotel directly, continue searching at
another time, or abandon the idea about the trip. In an attempt to control for di¤erent
reasons for "no click," we include the parameters of request in the mean value of the outside
option. Otherwise, we assume that the unobserved component in the value of the outside
option is independent of taste shocks in the hotel�s utility.
4.6 Likelihood of clicking and turning decisions
For every consumer, we observe two kinds of decisions: �rst, whether or not she turned the
page; second, which hotel was clicked on. As we discussed in the previous section, here we
interpret a click as a revealed preference action, in other words, every click corresponds to a
set of inequalities in utilities. For example, if we observe a consumer who has turned the page
and clicked on a hotel r, then in terms of unobservables this implies two kinds of inequalities:
U�1i < �u(ci)
�ir + "ir � �ij + "ij ; j = 0; ::; 30
where �ij is the mean utility of the j-th hotel among the 30 observed by consumer i, with j = 0
corresponding to the outside option. Integrating these inequalities with respect to variables
unobserved by the econometrician gives us the joint probability of clicking and searching
decisions. These variables are match values (or taste shocks), associated with every observed
hotel and the search cost parameter. At this point, our assumption about the Type 1 EV
distribution of taste shocks becomes very helpful: for a given search cost, the integral over
unobserved taste shocks can be computed analytically.
Before presenting the likelihood function, let us summarize what is observed on the con-
sumer level. The exogenous variables are 1;i = fpir; qirg15r=0; these are the characteristics ofobserved hotels on the �rst page. Here, r represents the position of a hotel on that page (where
r = 0 stands for the outside option, which is one of "hotels" on the �rst page). Also, de�ne
2;i = fpir; qirg30r=16, the contents of the second page. Some of these data are missing, becausewe do not observe 2;i for consumers who did not turn the page; however, this information is
irrelevant for explaining their joint decisions.14 The choice set is de�ned as CSi = 1;i [2;ifor turners, and CSi = 1;i for non-turners. Finally, our consumer-level characteristics in-
clude Ri; these are parameters of request, which include dates of search, dates of stay, number
of people, and other variables derived from these data. The endogenous variables are (Ti; Ci),
where Ti = 0; 1, represents the page-turning decision and Ci = 0; 1; ::;#CSi represents the
14This is not the case if we only had to explain the clicking decisions, where we have to integrate over pageturning decisions.
18
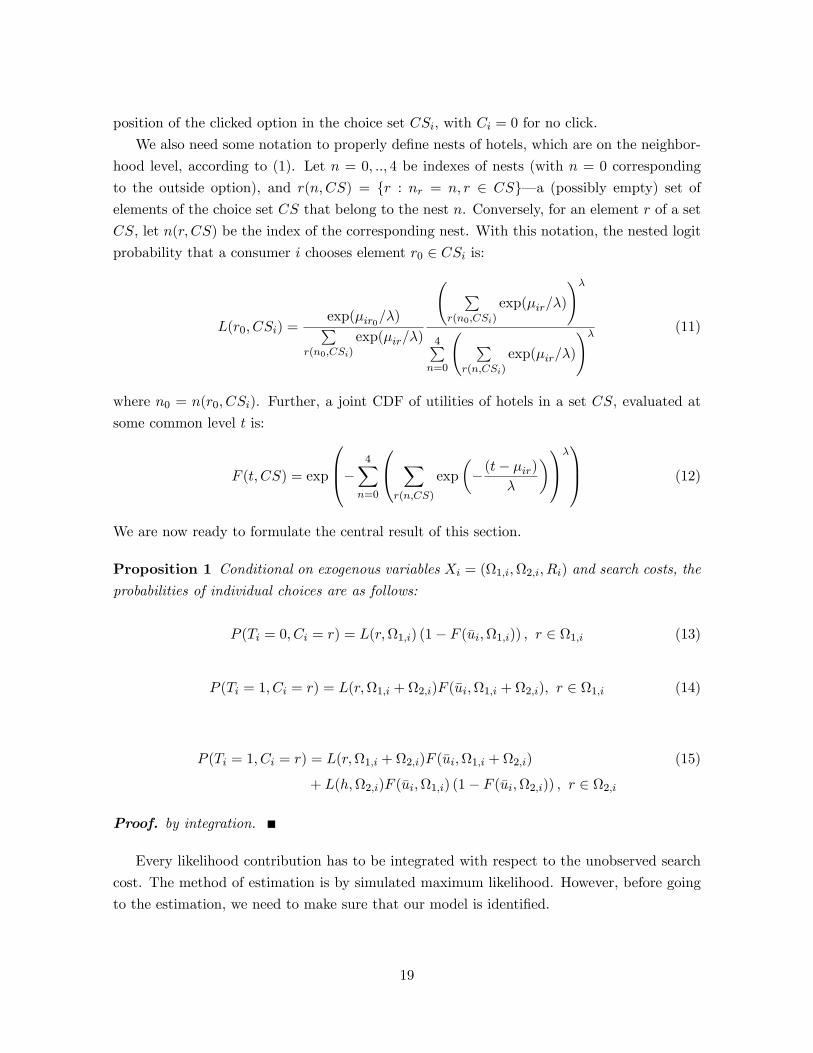
position of the clicked option in the choice set CSi, with Ci = 0 for no click.
We also need some notation to properly de�ne nests of hotels, which are on the neighbor-
hood level, according to (1). Let n = 0; ::; 4 be indexes of nests (with n = 0 corresponding
to the outside option), and r(n;CS) = fr : nr = n; r 2 CSg� a (possibly empty) set ofelements of the choice set CS that belong to the nest n. Conversely, for an element r of a set
CS, let n(r; CS) be the index of the corresponding nest. With this notation, the nested logit
probability that a consumer i chooses element r0 2 CSi is:
L(r0; CSi) =exp(�ir0=�)P
r(n0;CSi)
exp(�ir=�)
Pr(n0;CSi)
exp(�ir=�)
!�4Pn=0
Pr(n;CSi)
exp(�ir=�)
!� (11)
where n0 = n(r0; CSi). Further, a joint CDF of utilities of hotels in a set CS, evaluated at
some common level t is:
F (t; CS) = exp
0B@� 4Xn=0
0@ Xr(n;CS)
exp
��(t� �ir)
�
�1A�1CA (12)
We are now ready to formulate the central result of this section.
Proposition 1 Conditional on exogenous variables Xi = (1;i;2;i; Ri) and search costs, theprobabilities of individual choices are as follows:
P (Ti = 0; Ci = r) = L(r;1;i) (1� F (�ui;1;i)) ; r 2 1;i (13)
P (Ti = 1; Ci = r) = L(r;1;i +2;i)F (�ui;1;i +2;i); r 2 1;i (14)
P (Ti = 1; Ci = r) = L(r;1;i +2;i)F (�ui;1;i +2;i) (15)
+ L(h;2;i)F (�ui;1;i) (1� F (�ui;2;i)) ; r 2 2;i
Proof. by integration.
Every likelihood contribution has to be integrated with respect to the unobserved search
cost. The method of estimation is by simulated maximum likelihood. However, before going
to the estimation, we need to make sure that our model is identi�ed.
19
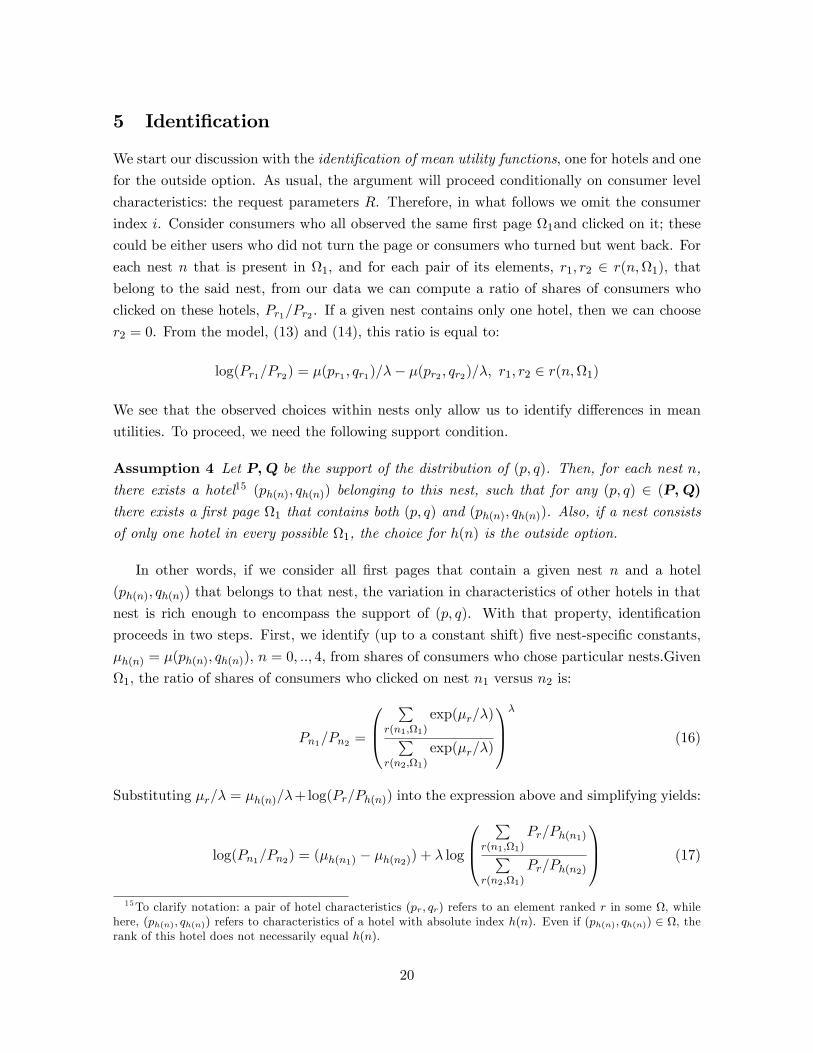
5 Identi�cation
We start our discussion with the identi�cation of mean utility functions, one for hotels and one
for the outside option. As usual, the argument will proceed conditionally on consumer level
characteristics: the request parameters R. Therefore, in what follows we omit the consumer
index i. Consider consumers who all observed the same �rst page 1and clicked on it; these
could be either users who did not turn the page or consumers who turned but went back. For
each nest n that is present in 1, and for each pair of its elements, r1; r2 2 r(n;1), thatbelong to the said nest, from our data we can compute a ratio of shares of consumers who
clicked on these hotels, Pr1=Pr2 . If a given nest contains only one hotel, then we can choose
r2 = 0. From the model, (13) and (14), this ratio is equal to:
log(Pr1=Pr2) = �(pr1 ; qr1)=�� �(pr2 ; qr2)=�; r1; r2 2 r(n;1)
We see that the observed choices within nests only allow us to identify di¤erences in mean
utilities. To proceed, we need the following support condition.
Assumption 4 Let P;Q be the support of the distribution of (p; q). Then, for each nest n,
there exists a hotel15 (ph(n); qh(n)) belonging to this nest, such that for any (p; q) 2 (P;Q)there exists a �rst page 1 that contains both (p; q) and (ph(n); qh(n)). Also, if a nest consists
of only one hotel in every possible 1, the choice for h(n) is the outside option.
In other words, if we consider all �rst pages that contain a given nest n and a hotel
(ph(n); qh(n)) that belongs to that nest, the variation in characteristics of other hotels in that
nest is rich enough to encompass the support of (p; q). With that property, identi�cation
proceeds in two steps. First, we identify (up to a constant shift) �ve nest-speci�c constants,
�h(n) = �(ph(n); qh(n)), n = 0; ::; 4, from shares of consumers who chose particular nests.Given
1, the ratio of shares of consumers who clicked on nest n1 versus n2 is:
Pn1=Pn2 =
0B@P
r(n1;1)
exp(�r=�)Pr(n2;1)
exp(�r=�)
1CA�
(16)
Substituting �r=� = �h(n)=�+log(Pr=Ph(n)) into the expression above and simplifying yields:
log(Pn1=Pn2) = (�h(n1) � �h(n2)) + � log
0B@P
r(n1;1)
Pr=Ph(n1)Pr(n2;1)
Pr=Ph(n2)
1CA (17)
15To clarify notation: a pair of hotel characteristics (pr; qr) refers to an element ranked r in some , whilehere, (ph(n); qh(n)) refers to characteristics of a hotel with absolute index h(n). Even if (ph(n); qh(n)) 2 , therank of this hotel does not necessarily equal h(n).
20

Repeating this equation for pairs (n1; n2) we get a system of equations that identi�es dif-
ferences (�h(n1) � �h(n2)) and a constant �. Second, nest-speci�c mean utility functions areidenti�ed as �(p; qjn) = �h(n) + � log(Pr=Ph(n)).
Note that we did not use observations for consumers who clicked on the second page, be-
cause their likelihood contributions, (15), do not have the necessary multiplicative forms. Only
(13) and (14), which correspond to consumers who clicked on the �rst page, have this form.
In fact, this property is a necessary and su¢ cient condition of the EV family of distributions,
as shown by Costinot and Komunjer (2007).
The results of this proposition provide some insight as to why static demand estimates
are inconsistent if choice sets are generated by search. Such estimation includes both types
of consumers, those who clicked on the �rst page, and those who clicked on the second. As
a result, the likelihood function is misspeci�ed for part of the observations. The reason lies
in the di¤erent modes of truncation of error terms in utility. In the case of (13), the utility
of the chosen hotel is truncated from below by the reservation value: U�1i > �u(ci). Utilities of
competing hotels also must exceed that threshold in order to have a positive chance of being
the �rst best. Similarly, in the case of (14), all utilities in the choice set, including that of the
chosen hotel, exceed the reservation utility. In contrast, in the case of (15), part of the choice
set (�rst-page utilities) is truncated from above, while another part (second-page, together
with the chosen hotel) is not truncated. This mixture leads to two components in (15): one
that corresponds to the case when the second page exceeds �u(ci), in which case the �rst-page
hotels o¤er no competition (do not enter the logit form), and another component where both
�rst- and second-page utilities are below �u(ci) and thus compete with each other.
Turning to the identi�cation of search cost distribution, from our data we can compute
the share of page turners among those who observed a given 1. The model predicts that:
P (T = 1j1) =+1Z0
F (�u (1; c) ;1)f(c)dc (18)
Equation (10) de�nes the reservation utility �u(1; c) as a function of exogenous variables and
the search cost, c. With known mean utilities, this function is also known. As discussed in
Section 4.3 above, the posterior belief Fu(U�2 j1), and hence the reservation utility, depend on1 in two ways. First, it is the maximal price on the �rst page that truncates the distribution
of second-page hotel prices from below. Second, these are identities of hotels (for example,
all their non-price characteristics) that appeared on the �rst page and are not expected to
appear on the second. In what follows, we analyze the identi�cation of (18) conditional on
these elements. In this way, what remains of 1, are the prices of the other 14 hotels on that
21

page: P14 = fprg14r=1. Equation (18) becomes:
P (T = 1jP14) =+1Z0
F (�u (c) ; P14)f(c)dc (19)
With respect to the unknown density function f(c), the relationship of the type seen in (19)
becomes a Fredholm type 1 integral equation. Existence and uniqueness of solutions to this
equation is guaranteed only for a number of special cases, and below we aim to show that our
model delivers one of them. Using the de�nition of extreme value distribution, and simplifying
notation somewhat, this can be written as:
F (�u; P14) = exp
0B@� 4Xn=0
0@ Xr(n;1)
exp
��(�u� �r)
�
�1A�1CA (20)
= exp
0B@� exp(��u) 4Xn=0
0@ Xr(n;1)
exp (�r=�)
1A�1CA
Now, let S(P14) =4Xn=0
0@ Xr(n;1)
exp (�r=�)
1A� be the known function of the data and parame-ters. Equation (19) becomes:
P (T = 1jP14) =+1Z0
exp (� exp (��u(c))S(P14)) f(c)dc (21)
Since �u(c) is a monotonic function, we can introduce a change of variables, t = exp (��u(c)).Note also, that according to the model, P (T = 1jP14) depends on its argument (which ismulti-dimensional) only through a single-dimensional index S(P14). Therefore, we can write,
P (S) =
+1Z0
exp (�tS) g(t)dt (22)
where g(t) = f(c�1(t))=t0(c). Assuming that g(t) belongs to a class of piece-wise continuousfunctions, exponentially restricted from above, it can be uniquely recovered from the above
equation (inverse Laplace transform theorem). The density of the search cost distribution is
then readily computed from g(t).
22

6 Estimation results
In this section we report estimation results from a succession of models, adding more structural
elements at each step.
We start with static logit demand models. Results are shown in Table 9. These are
models of multinomial choice that try to explain observed clicking decisions, taking choice
sets as given (see equation (11)). In D1, the choice set includes all available hotels, that is,
as if the consumer possessed full information; these are estimates one would obtain in a more
common situation when the actual choice set is unobserved,16 or when the number of goods is
not large. Model D2 brings in variation in the actual choice sets to help identify parameters of
utility. For each model, we estimate versions with and without correlation of the error terms
within nests (that is, nested and non-nested logits). For D2, we also try various speci�cations
of the model, illustrating the importance of including such variables as brand, neighborhood
dummies, consumer-speci�c variables (parameters of request), and distance to O�Hare airport.
The search model takes another step and tries to explain the formation of choice sets
through a search process. In that model, consumers are assumed to know the true distribution
of prices: hotel-speci�c means and standard deviations are estimated on a large dataset of
prices. This approach follows the tradition of the preceding literature on product search, where
the beliefs structure was �xed at some data-driven level. In this way, we ask a question: given
that consumers are extremely rational (for example, they know the true equilibrium), what
can we say about their preferences and search costs?
Table 10 presents estimation results for the search model, as given by Proposition (1),
together with standard errors, computed numerically. We estimate various speci�cations of
this model, both nested and non-nested, as well as various search cost distributions: S1, the
log-normal; S2, the discrete support (from 0 to 1, with a step 0.05); S3, a mixture of two
lognormals (with standard deviation �xed at 0.5). Model S1n is our default speci�cation in
the discussion below.
Quality of �t. To assess quality of �t, in particular with respect to predicting search de-cisions, we compute average deviances of page-turning decisions, �2 log(p(TijXi)), separatelyfor page-turners and non-turners, for our main speci�cation, S1n. For turners, we �nd the
deviance (DEV)=2.8269; for non-turners DEV=0.5662. On the one hand, it seems that the
search model does a much better job at explaining why people do not turn the page than
at explaining why they do. This is quite expected, because non-turners represent about 75
percent of the sample. On the other hand, if we take a model-free estimate of the page-turning
probability, p = 0:25, which is the average in our sample, then the average deviance for turners
is DEV=2.7968, and for non-turners DEV=0.5674. Therefore, if we use the sample average
16Since we observe only actual choice sets, prices of other hotels are imputed based on observations by otherconsumers, with similar dates of search and parameters of request.
23
as a benchmark, the model is only slightly useful for predicting non-turning (�DEV=0.0012),
and, in a relative sense, does a better job at explaining turning decisions (�DEV=0.0301).
Nevertheless, in both cases the absolute improvement over the model-free estimate is quite
small, so the ability of the model to capture di¤erential motives to search is rather poor. One
reason might be that the search model is very restrictive about the mechanism through which
existing information (the content of the �rst page) a¤ects search decisions; it uses current best
utility, a single scalar parameter. This �nding raises a question: is it worth the e¤ort? The
answer depends on the goals of the modeler. If we already know consumer preferences from
a separate study and our goal is only to predict search actions, then a sample average will do
just as well. If, on the other hand, we would like to predict search generated demand� search
actions and consequent purchase decisions� then, as we argue below, a fully speci�ed search
model is necessary to obtain consistent estimates of preferences, and, ultimately, to predict
demand.
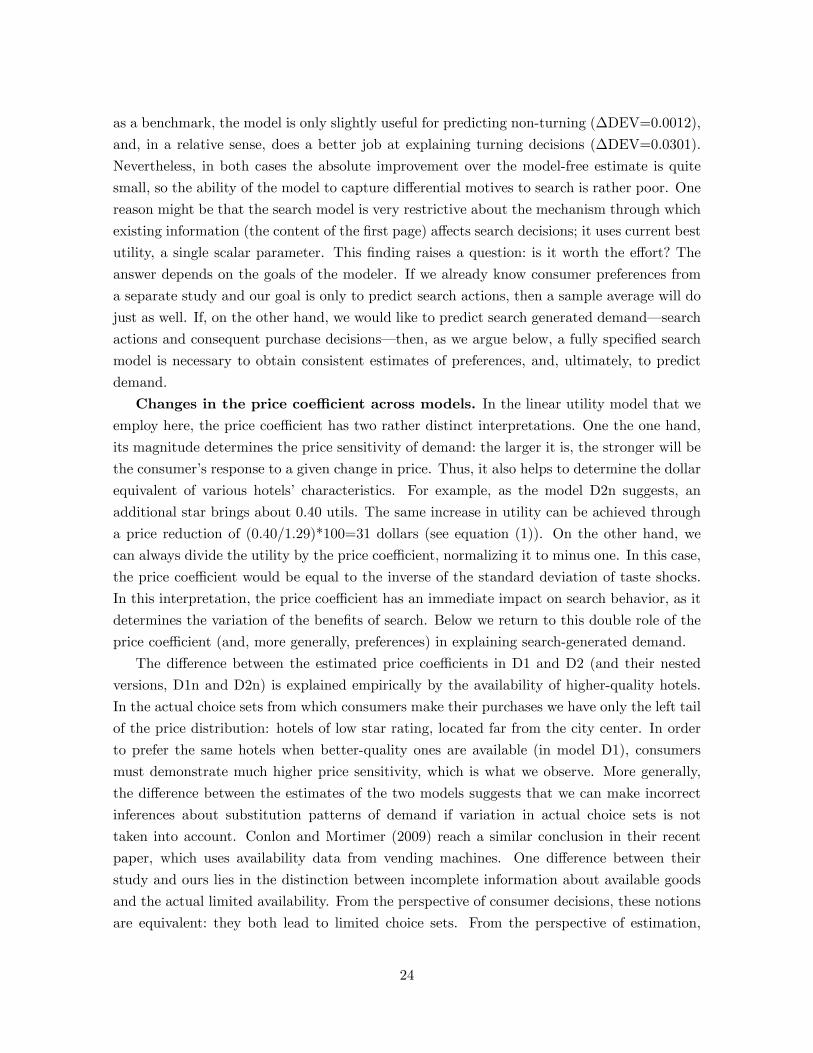
Changes in the price coe¢ cient across models. In the linear utility model that weemploy here, the price coe¢ cient has two rather distinct interpretations. One the one hand,
its magnitude determines the price sensitivity of demand: the larger it is, the stronger will be
the consumer�s response to a given change in price. Thus, it also helps to determine the dollar
equivalent of various hotels� characteristics. For example, as the model D2n suggests, an
additional star brings about 0.40 utils. The same increase in utility can be achieved through
a price reduction of (0.40/1.29)*100=31 dollars (see equation (1)). On the other hand, we
can always divide the utility by the price coe¢ cient, normalizing it to minus one. In this case,
the price coe¢ cient would be equal to the inverse of the standard deviation of taste shocks.
In this interpretation, the price coe¢ cient has an immediate impact on search behavior, as it
determines the variation of the bene�ts of search. Below we return to this double role of the
price coe¢ cient (and, more generally, preferences) in explaining search-generated demand.
The di¤erence between the estimated price coe¢ cients in D1 and D2 (and their nested
versions, D1n and D2n) is explained empirically by the availability of higher-quality hotels.
In the actual choice sets from which consumers make their purchases we have only the left tail
of the price distribution: hotels of low star rating, located far from the city center. In order
to prefer the same hotels when better-quality ones are available (in model D1), consumers
must demonstrate much higher price sensitivity, which is what we observe. More generally,
the di¤erence between the estimates of the two models suggests that we can make incorrect
inferences about substitution patterns of demand if variation in actual choice sets is not
taken into account. Conlon and Mortimer (2009) reach a similar conclusion in their recent
paper, which uses availability data from vending machines. One di¤erence between their
study and ours lies in the distinction between incomplete information about available goods
and the actual limited availability. From the perspective of consumer decisions, these notions
are equivalent: they both lead to limited choice sets. From the perspective of estimation,
24

however, there is an important di¤erence: while it may be argued that incomplete availability
is exogenously given to a particular consumer, the incomplete information is not, as long as
it is an outcome of decision making. Therefore, even though D2 performs better than D1
by incorporating information on actual choice sets, it ignores their endogeneity and therefore
produces biased results.
Comparing nested and non-nested versions of D2 (and D1), from Table 9 we see signi�cant
di¤erences in both the price coe¢ cient and the model�s �t. The parameter of correlation
within nests is � = 0:44 for D2 and � = 0:59 for D1; these are meaningful magnitudes (even
though the standard errors are large). This suggests that allowing for correlation between
the utilities of hotels in the same neighborhood is a desirable feature of the model. Estimates
from search models S1�S3, from Table 10, also show that this feature has a signi�cant impact
on the parameters and model�s �t.
Comparing D2n (our benchmark static model) with S1n, we again observe a signi�cant
drop (in magnitude) of the price coe¢ cient. In a search model, the role of the price coe¢ cient
becomes more involved, because together with search costs it serves to match page-turning
decisions.17 Holding everything else constant, a smaller (in magnitude) price coe¢ cient pro-
duces two opposite e¤ects on the probability of searching. For one, it increases utility from
the best hotel on the �rst page, making the consumer more satis�ed and thus less willing to
search. At the same time, it makes second-page hotels more attractive, thus increasing the
bene�t of search. As mentioned above, the second e¤ect can also be seen through the variance
of taste shocks: the smaller is the price coe¢ cient, the larger is the variance of outcome of
search, which makes the e¤ort more attractive. In an environment where prices are sorted
in increasing order, one would expect the second e¤ect to dominate: second-page prices are
higher, which means changes in the price coe¢ cient are applied to a larger base, which even-
tually leads to a relatively larger increase in utilities. And since the magnitude of the price
coe¢ cient in the search model is indeed smaller, we conclude that it must be the case that
static model estimates fail to predict enough search activity.
To verify this conclusion, we substituted D2n�s estimates into S1n and, after converging
with search cost parameters, re-computed the deviance measures: for turners, DEV=2.9801,
and for non-turners, DEV = 0.564. As expected, DEV for turners in the S1n(D2n) model is
larger than in the original S1n, and DEV for non-turners is smaller. Table 1 provides some
evidence to explain this �nding. First, 814 out of 1081 consumers do not turn the page, so
D2n�s estimates are driven primarily by �rst-page choice sets. Despite the fact that these
are mostly cheap hotels, only 289 of these 814 consumers actually chose them. Second, from
267 consumers who turned the page, only 77 did so successfully, that is, the search e¤ort
resulted in a click on the second page with higher-quality but more expensive hotels. From
17Of course, all other coe¢ cients of utility play a role. However, the role of the price coe¢ cient is mostpronounced, by a wide margin.
25

the perspective of a static demand model, these facts can be explained by concluding that
consumers are quite price sensitive. From the point of view of the search model, clicking
decisions should be explained conditionally on page turning: the mere fact that someone
decided to go to the next page, which contains more expensive hotels, is an indicator that
she must be relatively less price sensitive, and vice versa. Therefore, explanations of the fact
that people rarely click on the second page have to put less weight on price sensitivity, and
more on other factors, such as taste for quality. This additional information about consumer
preference that is contained in search actions is completely overlooked by the static demand
model and therefore its conclusions are biased. Can we predict the sign of the bias? Probably,
not. For example, if it were the case that many consumers went to the second page and
clicked there, we would see D2n delivering very low price sensitivity, which is not consistent
with the low search activity we observe. In that case, we would expect a correction to go in
the opposite direction.
Search costs. In the model with lognormal search costs, S1n, the median search costis cost_med = 37.58 dollars; the mean value is even larger, cost_mean = 42.70 dollars.
These quantities are obtained by �rst computing the median of the search cost distribution,
measured in utils, and multiplying by 100/pcoef, where pcoef is price coe¢ cient in utility,
and the 100 factor re�ects our measuring of prices in hundreds of dollars. The result is
the dollar value of search cost, which we interpet as a cost of processing information on a
page of results. Alternatively, one may view this as the (maximum) amount of expected
savings that the median search is willing to forgo in order to avoid studying one more page of
results. Arguably, these are large numbers; while we believe the e¤ort of comparing prices and
characteristics of 15 hotels is hardly negligible, that alone cannot explain this magnitude. To
that end, it is instructive to think of search cost as a re�ection of bene�ts of search predicted
by the model. A high search cost is only a way to reconcile low search activity (25 percent) in
a model that predicts large bene�ts. In turn, the bene�ts of search are positively related to the
variance of search results. Quantitatively, there are two main sources of variance of results:
�rst, the sampling of multiple goods at the same time; second, our assumption regarding the
distribution of the error term. A small example may help explain the last point. Suppose there
is one hotel on the �rst page, u1 = �+�"1, and one on the second, u2 = �+�"2, where "i are
independent, Type 1 EV. Now, if we want this consumer to turn the page with a 25 percent
probability, what does it imply about her search cost? First, we �nd her reservation utility,
�u, from the equation: FEV (�u��� ) = 0:25, to be �u = � � 0:33�; second, we substitute it into
(10) to �nd c = 1:02�. This result is quite intuitive: the value of an option to turn the page is
positively related to the variance of search results. In our model, where � = �2=6 = 1:65, this
implies a cuto¤ value of search cost as c = 1:68 utils, or 1.68*100/0.8=275 dollars. Although
the dollar value of the search cost will depend on the price coe¢ cient, this example shows
26
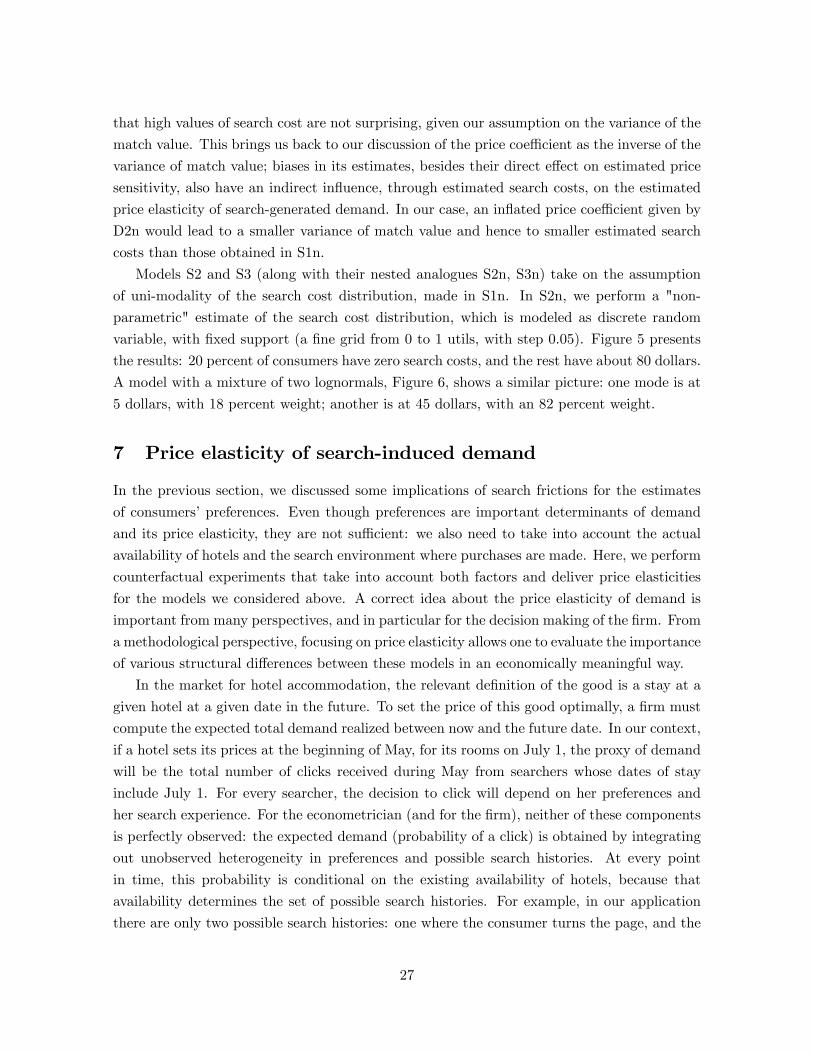
that high values of search cost are not surprising, given our assumption on the variance of the
match value. This brings us back to our discussion of the price coe¢ cient as the inverse of the
variance of match value; biases in its estimates, besides their direct e¤ect on estimated price
sensitivity, also have an indirect in�uence, through estimated search costs, on the estimated
price elasticity of search-generated demand. In our case, an in�ated price coe¢ cient given by
D2n would lead to a smaller variance of match value and hence to smaller estimated search
costs than those obtained in S1n.
Models S2 and S3 (along with their nested analogues S2n, S3n) take on the assumption
of uni-modality of the search cost distribution, made in S1n. In S2n, we perform a "non-
parametric" estimate of the search cost distribution, which is modeled as discrete random
variable, with �xed support (a �ne grid from 0 to 1 utils, with step 0.05). Figure 5 presents
the results: 20 percent of consumers have zero search costs, and the rest have about 80 dollars.
A model with a mixture of two lognormals, Figure 6, shows a similar picture: one mode is at
5 dollars, with 18 percent weight; another is at 45 dollars, with an 82 percent weight.
7 Price elasticity of search-induced demand
In the previous section, we discussed some implications of search frictions for the estimates
of consumers�preferences. Even though preferences are important determinants of demand
and its price elasticity, they are not su¢ cient: we also need to take into account the actual
availability of hotels and the search environment where purchases are made. Here, we perform
counterfactual experiments that take into account both factors and deliver price elasticities
for the models we considered above. A correct idea about the price elasticity of demand is
important from many perspectives, and in particular for the decision making of the �rm. From
a methodological perspective, focusing on price elasticity allows one to evaluate the importance
of various structural di¤erences between these models in an economically meaningful way.
In the market for hotel accommodation, the relevant de�nition of the good is a stay at a
given hotel at a given date in the future. To set the price of this good optimally, a �rm must
compute the expected total demand realized between now and the future date. In our context,
if a hotel sets its prices at the beginning of May, for its rooms on July 1, the proxy of demand
will be the total number of clicks received during May from searchers whose dates of stay
include July 1. For every searcher, the decision to click will depend on her preferences and
her search experience. For the econometrician (and for the �rm), neither of these components
is perfectly observed: the expected demand (probability of a click) is obtained by integrating
out unobserved heterogeneity in preferences and possible search histories. At every point
in time, this probability is conditional on the existing availability of hotels, because that
availability determines the set of possible search histories. For example, in our application
there are only two possible search histories: one where the consumer turns the page, and the
27

other where she does not. The content of these pages is determined by the current availability
of hotels on the future date and their relative prices: if the hotel price is too high, its choice
probability is zero, even though it may be available.
To compute the price elasticity of search-induced demand in our sample, we perform a
counterfactual experiment. For this purpose, we chose a "Super 8 motel," two stars, thirteen
miles from the city center, six miles from O�Hare� an inexpensive hotel that often appears
on the �rst page of results. We then make it available every day during May, for any future
date requested by consumers in our sample, at a price of 90 dollars a night. At this price,
it appears on the �rst page for 686 of 1081 consumers, and on the second page for the rest.
By summing up click probabilities for all consumers in our sample, we obtain a measure of
expected demand for this hotel, for all future dates requested by consumers in our sample.
The price elasticity is obtained by increasing the price of this hotel by 1 percent and comparing
the sum of choice probabilities before and after the disturbance. Note that whenever the hotel
appears on the �rst page, the change in its price a¤ects the decision to search, and, ultimately,
the size of the choice set against which this hotel will be compared. This must be taken into
account when computing price elasticity. Results for various search models are presented on
the row "PE" in Table 10 and on the same row in Table 9 for logit models. We can see that,
analogously to price coe¢ cients, the di¤erences are rather large.
Comparing non-nested logits D1 and D2, we can see that ignoring actual choice sets
and assuming full information leads to overestimation of the price elasticity by more than 80
percent. Di¤erences between nested logit variants D1n and D2n are much smaller, 30 percent.
While most of the di¤erence comes from the di¤erences in the estimated price coe¢ cient,
another factor is the limited nature of choice sets in D2 relative to D1. It is straightforward
to show that, with logit demand, more alternatives make consumers more price elastic, holding
taste parameters constant. Indeed, the own price elasticity is found as (assuming �p = �1):
dqidpi
piqi= �pi
Pj 6=i exp(�j)Pnj=1 exp(�j)
which is increasing in absolute value with n. As the number of �rms increases, this has two
e¤ects on elasticity. On the one hand, there is a "price-sensitivity e¤ect," when the demand
curve qi(pi) becomes steeper because more alternatives are available; on the other hand, there
is a "market share e¤ect" due to a lower quantity of sales per �rm. With a Type 1 EV
distribution of error terms, the second e¤ect dominates; however, this may not be true in
other cases, as discussed in Chen and Riordan (2008).
By comparing D2 (or D2n) to search models, we can evaluate the consequences of ignoring
endogeneity of choice sets. These are even more striking: for the nested version, the degree of
overestimation varies from 175 percent (D2n vs S3n) to 400 percent (D2n vs S1n), depending
on the speci�cation of the search model.
28
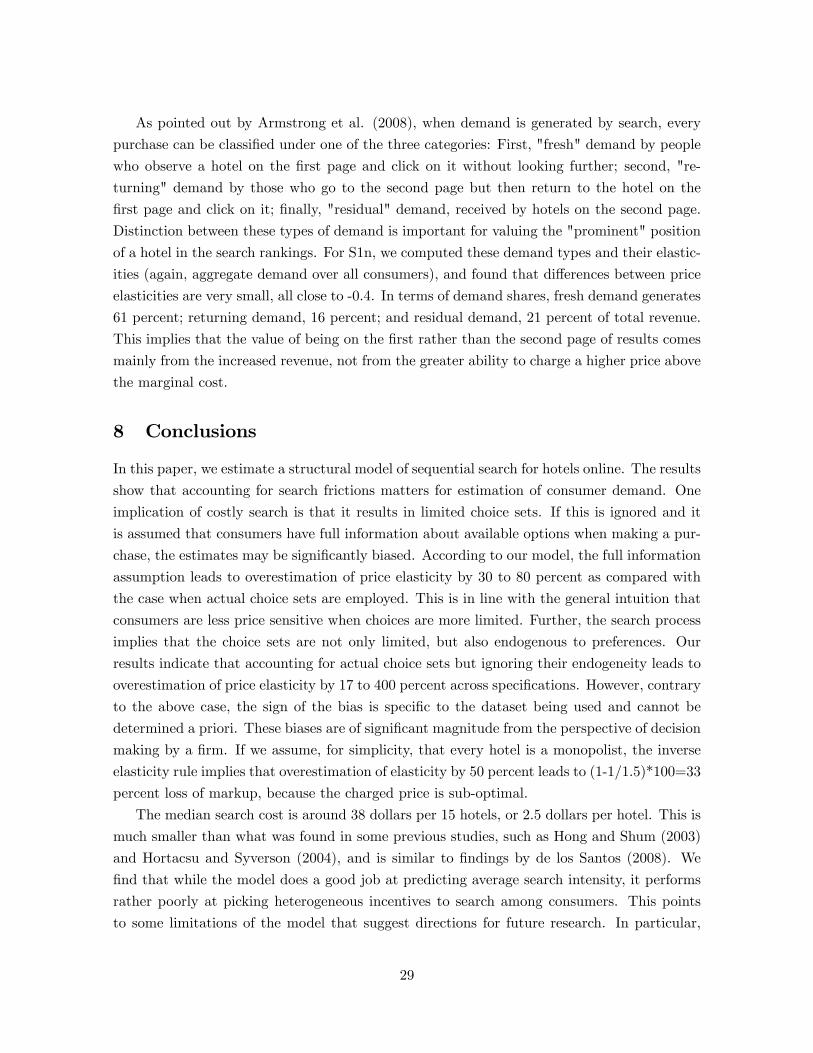
As pointed out by Armstrong et al. (2008), when demand is generated by search, every
purchase can be classi�ed under one of the three categories: First, "fresh" demand by people
who observe a hotel on the �rst page and click on it without looking further; second, "re-
turning" demand by those who go to the second page but then return to the hotel on the
�rst page and click on it; �nally, "residual" demand, received by hotels on the second page.
Distinction between these types of demand is important for valuing the "prominent" position
of a hotel in the search rankings. For S1n, we computed these demand types and their elastic-
ities (again, aggregate demand over all consumers), and found that di¤erences between price
elasticities are very small, all close to -0.4. In terms of demand shares, fresh demand generates
61 percent; returning demand, 16 percent; and residual demand, 21 percent of total revenue.
This implies that the value of being on the �rst rather than the second page of results comes
mainly from the increased revenue, not from the greater ability to charge a higher price above
the marginal cost.
8 Conclusions
In this paper, we estimate a structural model of sequential search for hotels online. The results
show that accounting for search frictions matters for estimation of consumer demand. One
implication of costly search is that it results in limited choice sets. If this is ignored and it
is assumed that consumers have full information about available options when making a pur-
chase, the estimates may be signi�cantly biased. According to our model, the full information
assumption leads to overestimation of price elasticity by 30 to 80 percent as compared with
the case when actual choice sets are employed. This is in line with the general intuition that
consumers are less price sensitive when choices are more limited. Further, the search process
implies that the choice sets are not only limited, but also endogenous to preferences. Our
results indicate that accounting for actual choice sets but ignoring their endogeneity leads to
overestimation of price elasticity by 17 to 400 percent across speci�cations. However, contrary
to the above case, the sign of the bias is speci�c to the dataset being used and cannot be
determined a priori. These biases are of signi�cant magnitude from the perspective of decision
making by a �rm. If we assume, for simplicity, that every hotel is a monopolist, the inverse
elasticity rule implies that overestimation of elasticity by 50 percent leads to (1-1/1.5)*100=33
percent loss of markup, because the charged price is sub-optimal.
The median search cost is around 38 dollars per 15 hotels, or 2.5 dollars per hotel. This is
much smaller than what was found in some previous studies, such as Hong and Shum (2003)
and Hortacsu and Syverson (2004), and is similar to �ndings by de los Santos (2008). We
�nd that while the model does a good job at predicting average search intensity, it performs
rather poorly at picking heterogeneous incentives to search among consumers. This points
to some limitations of the model that suggest directions for future research. In particular,
29

it is desirable to relax the assumptions of common prior and search cost distributions by
introducing consumer heterogeneity. Also, our estimates are obtained for a rather select
group of the population, that is, consumers who search by price sorting. To generalize these
results, it is important to increase the space of search strategies, by adding more pages and
other sorting and �ltering tools.
To summarize, this paper takes another step towards more realistic modeling of the search
process, in terms of both the speci�cs of the actual search environment and the complexity
of goods searched for. Clearly, greater realism comes at an increased cost of implementation
and computation, which can limit the scope of search behavior that we can model in a fully
structural way. Nevertheless, we believe this is a fruitful direction of research, for at least two
reasons. First, we can look more closely at the implications of search frictions for demand for
heterogeneous goods. Second, a comprehensive search model allows one to evaluate di¤erent
ways of organizing the display, an important problem in online markets, such as those for
hotel accommodations or airline tickets.
30

References
[1] Abrevaya Jason, Jerry Hausman, and Fiona Scott-Morton (1998). "Misclassi�cation of
the dependent variable in a discrete-response setting." Journal of Econometrics 87 .
[2] Armstrong Mark, John Vickers, and Jidong Zhou (2008). "Prominence and Consumer
Search." Economics Series Working Papers 379, University of Oxford, Department of
Economics.
[3] Berry, Steven (1994). "Estimating discrete-choice models of product di¤erentiation." The
RAND Journal of Economics 25(2).
[4] Berry, Steve, Jim Levinsohn, and Ariel Pakes (1995). "Automobile prices in market
equilibrium." Econometrica 63 (4).
[5] Bronnenberg, Bart and Wilfried Vanhonacker (1996). "Limited choice sets, local price
response and implied measure of price competition." Journal of Marketing Research 33
(2).
[6] Bruno, Hernan and Naufel Vilcassim (2008), "Structural demand estimation with varying
product availability." Marketing Science 27 (6).
[7] Brynjolfsson, Erik and Michael Smith (2002). "Consumer decision-making at an Internet
shopbot." MIT Sloan School of Management Working Paper No. 4206-01.
[8] Chen, Yongmin and Michael Riordan (2008). "Price-increasing competition." Discussion
paper 0506�26, Columbia University.
[9] Conlon, Christopher and Julie Mortimer (2009). "Demand estimation under incomplete
product availability." Working paper, Harvard University.
[10] Costinot, Arnaud and Ivana Komunjer (2007). "What goods do countries trade? New
Ricardian predictions." NBER working paper 13691.
[11] de los Santos, Babur (2008). "Consumer search on the internet." PhD dissertation, Uni-
versity of Chicago.
[12] de los Santos, Babur, Ali Hortacsu, and Matthijs Wildenbeest (2009). "Testing models of
consumer search using data on web browsing and purchasing behavior." Working paper.
[13] Hong, Han and Matthew Shum (2003). "Can search cost rationalize equilibrium price
dispersion in online markets?" Rand Journal of Economics 37 (2): 258�276 (Summer
2006).
31

[14] Hortacsu, Ali and Chad Syverson (2004). "Product di¤erentiation, search costs, and com-
petition in the mutual fund industry: A case study of S&P 500 index funds." Quarterly
Journal of Economics 119: 403�456 (May).
[15] Johnson, Eric, Wendy W. Moe, Peter S. Fader, Steven Bellman, and Gerald L. Lohse
(2004). "On the depth and dynamics of on-line search behavior." Management Science
50 (3): 299�308 (2004).
[16] Kim, Jun, Paulo Albuquerque, and Bart Bronnenberg (2009). "Online demand under
limited information search." Working paper.
[17] Koulayev, Sergei (2009). "Estimating search with learning," NET institute working paper
08�29.
[18] Koulayev, Sergei and Ting Wu (2008). "Search with Dirichlet priors: an alternative
characterization." Working paper.
[19] Mariuzzo, Franco, Patrick Walsh, and Ciara Whelan (2009). "Coverage of retail stores
and discrete choice models of demand: Estimating price elasticities and welfare e¤ects."
Working paper, University of Dublin.
[20] Mehta, Nitin, Surendra Rajiv, and Kannan Srinivasan (2003). "Price uncertainty and
consumer search: a structural model of consideration set formation." Marketing Science
22(1).
32
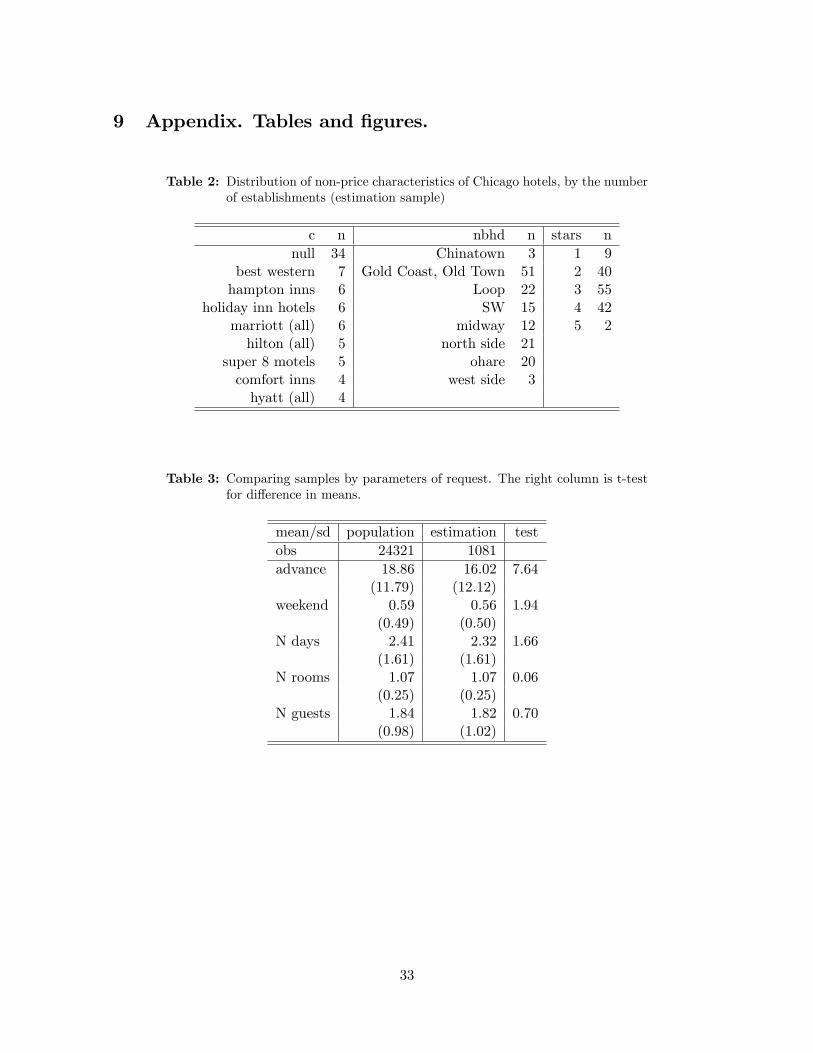
9 Appendix. Tables and �gures.
Table 2: Distribution of non-price characteristics of Chicago hotels, by the numberof establishments (estimation sample)
c n nbhd n stars nnull 34 Chinatown 3 1 9
best western 7 Gold Coast, Old Town 51 2 40hampton inns 6 Loop 22 3 55
holiday inn hotels 6 SW 15 4 42marriott (all) 6 midway 12 5 2hilton (all) 5 north side 21
super 8 motels 5 ohare 20comfort inns 4 west side 3hyatt (all) 4
Table 3: Comparing samples by parameters of request. The right column is t-testfor di¤erence in means.
mean/sd population estimation testobs 24321 1081advance 18.86 16.02 7.64
(11.79) (12.12)weekend 0.59 0.56 1.94
(0.49) (0.50)N days 2.41 2.32 1.66
(1.61) (1.61)N rooms 1.07 1.07 0.06
(0.25) (0.25)N guests 1.84 1.82 0.70
(0.98) (1.02)
33

Table 4: Logit estimates of click rates, depending on type of request.
coef / t population estimationadvance 0.0066 -0.0079
4.73 -1.43N days -0.00 0.12
-0.67 2.87weekend -0.08 -0.12
-2.33 -0.90N rooms -0.08 -0.19
-1.22 -0.67N guests 0.12 0.15
7.04 2.30N pages 0.03 -0.11
6.41 -0.89const -0.87 -0.63
-11.17 -1.87
Table 5: Characteristics of clicked hotels in the population and in the estimationsample.
mean / sd population estimationstars 3.07 2.45
(0.88) (0.80)dist 5.00 10.95
(6.12) (5.29)Chinatown 4.02 3.00Gold Coast 35.58 8.25Loop 22.99 8.25SW 7.57 27.75midway 5.28 3.25north 6.02 7.75ohare 17.21 41.75west side 1.33 0.00
34

Table 6: Observed and clicked hotels in the choice sets, % of total.
stars obs click nbhd obs click dist obs click0 0.00 0.00 Chinatown 2.02 3.00 0-5 10.09 20.251 10.85 4.50 Gold Coast 4.97 8.25 6-10 2.04 2.502 48.91 61.50 Loop 2.44 8.25 10-15 79.23 73.503 27.56 19.00 SW 20.59 27.75 16+ 8.65 3.754 12.65 15.00 midway 10.56 3.255 0.02 0.00 north side 16.10 7.75
ohare 43.16 41.75west side 36.00 0.00
Table 7: Observed and clicked hotels on the �rst and the second page of results.
page1 page2stars obs click obs click
1 13.29 5.61 0.55 0.002 53.78 69.47 28.35 30.653 22.66 13.40 48.29 50.004 10.28 11.53 22.80 19.35
nbhdChinatown 1.8 2.8 2.97 1.61Gold Coast 3.41 4.67 11.55 19.35
Loop 1.51 2.18 6.38 27.42SW 19.69 32.71 24.4 9.68
midway 9.05 1.87 16.94 11.29north side 16.54 7.17 14.19 12.9
ohare 47.96 48.6 22.81 17.74west side 0.04 0 0.76 0
dist0-5 6.95 9.66 23.32 56.466-10 0.77 0.62 7.43 9.6811-20 92.27 89.72 69.24 33.87
35

Table 8: Summary statistics of maximal prices on the �rst page, observed by turn-ers and non-turners.
percentiles max 4 prices% non-turn turn non-turn turn1 90 90 469 3965 92 92 479 41910 95 95 529 42125 98 98 567 42950 103 10475 125 13090 199 17995 265 20999 409 419
Mean 127.34 124.69Std. Dev. 62.7 50.82Skewness 3.24 3.41Kurtosis 15.31 17.75
Obs 814 267
36
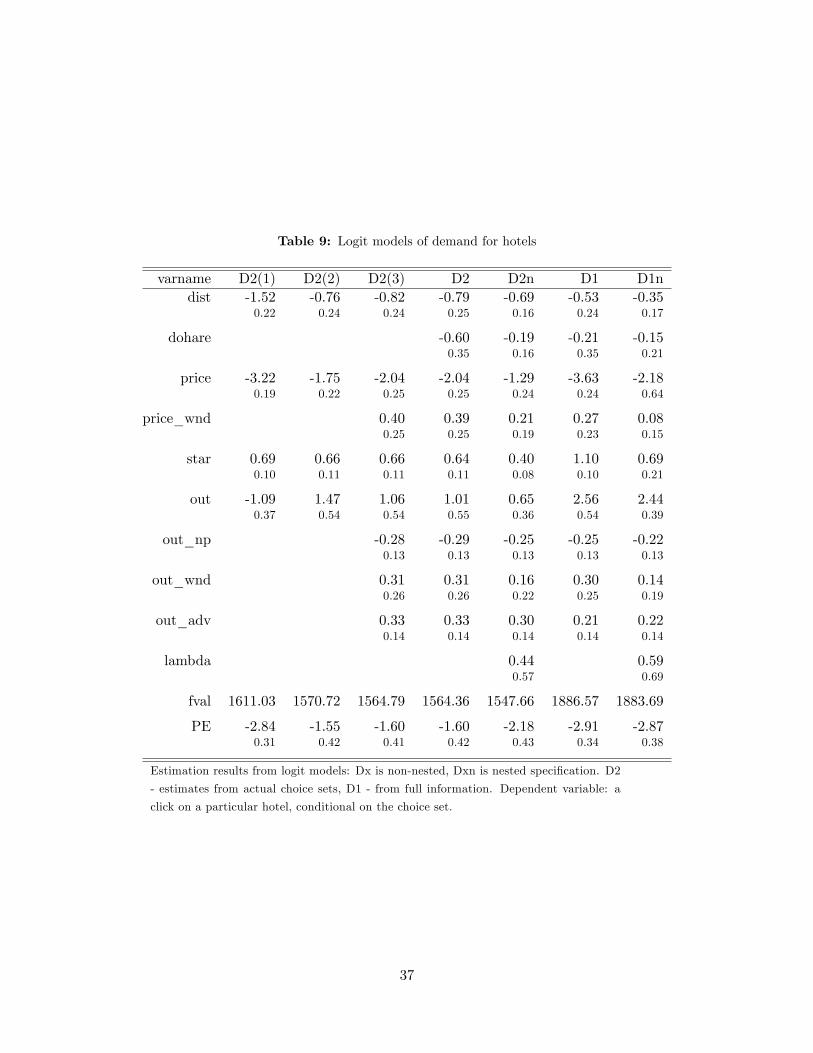
Table 9: Logit models of demand for hotels
varname D2(1) D2(2) D2(3) D2 D2n D1 D1ndist -1.52 -0.76 -0.82 -0.79 -0.69 -0.53 -0.35
0.22 0.24 0.24 0.25 0.16 0.24 0.17
dohare -0.60 -0.19 -0.21 -0.150.35 0.16 0.35 0.21
price -3.22 -1.75 -2.04 -2.04 -1.29 -3.63 -2.180.19 0.22 0.25 0.25 0.24 0.24 0.64
price_wnd 0.40 0.39 0.21 0.27 0.080.25 0.25 0.19 0.23 0.15
star 0.69 0.66 0.66 0.64 0.40 1.10 0.690.10 0.11 0.11 0.11 0.08 0.10 0.21
out -1.09 1.47 1.06 1.01 0.65 2.56 2.440.37 0.54 0.54 0.55 0.36 0.54 0.39
out_np -0.28 -0.29 -0.25 -0.25 -0.220.13 0.13 0.13 0.13 0.13
out_wnd 0.31 0.31 0.16 0.30 0.140.26 0.26 0.22 0.25 0.19
out_adv 0.33 0.33 0.30 0.21 0.220.14 0.14 0.14 0.14 0.14
lambda 0.44 0.590.57 0.69
fval 1611.03 1570.72 1564.79 1564.36 1547.66 1886.57 1883.69
PE -2.84 -1.55 -1.60 -1.60 -2.18 -2.91 -2.870.31 0.42 0.41 0.42 0.43 0.34 0.38
Estimation results from logit models: Dx is non-nested, Dxn is nested speci�cation. D2
- estimates from actual choice sets, D1 - from full information. Dependent variable: a
click on a particular hotel, conditional on the choice set.
37

Table 10: Search models
varname S1 S1n S2 S2n S3 S3ndist -0.40 -0.55 -0.47 -0.63 -0.50 -0.75
0.06 0.07 0.03 0.07 0.10 0.07
dohare -0.43 -0.50 -0.38 -0.50 -0.61 -0.530.21 0.23 0.09 0.07 0.14 0.08
price -0.80 -0.61 -0.83 -0.59 -0.59 -0.790.10 0.11 0.15 0.18 0.11 0.15
price_wnd 0.13 0.29 0.17 0.24 0.29 0.040.12 0.14 0.15 0.17 0.14 0.17
star 0.29 0.34 0.27 0.26 -0.04 0.260.05 0.06 0.03 0.06 0.06 0.06
out 2.75 2.75 2.76 2.68 1.86 1.910.23 0.25 0.22 0.27 0.28 0.27
out_np -0.08 -0.02 -0.08 -0.26 0.14 -0.090.11 0.11 0.09 0.10 0.11 0.12
out_wnd 0.37 0.32 0.42 0.32 0.27 0.040.19 0.20 0.19 0.22 0.21 0.23
out_adv 0.15 0.14 0.16 0.00 0.24 0.130.11 0.11 0.12 0.10 0.12 0.12
lambda 0.88 0.88 0.840.58 0.59 0.60
fval 2230.11 2210.49 2204.96 2192.20 2215.73 2185.19
cost_med 30.04 37.58 35.96 76.34 55.96 30.89
PE -0.65 -0.44 -0.66 -0.45 -0.37 -0.790.10 0.12 0.21 0.22 0.28 0.27
Estimation results from search models: Sx is a model with non-nested utilities, Sxn is the
same speci�cation with nested logit. S1 - lognormal search costs, S2 - discrete support,
S3 - mixture of two lognormals
38
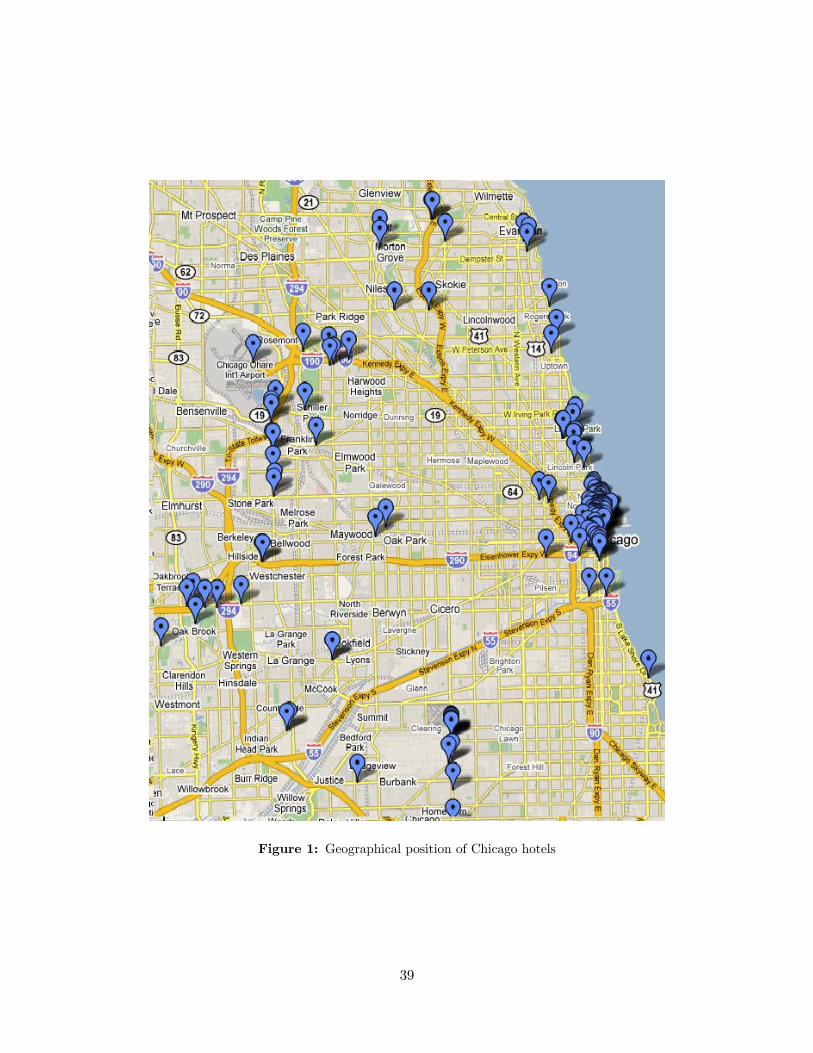
Figure 1: Geographical position of Chicago hotels
39

Figure 2: Distribution of distances to the city center (in miles) of Chicago hotels(estimation sample)
40
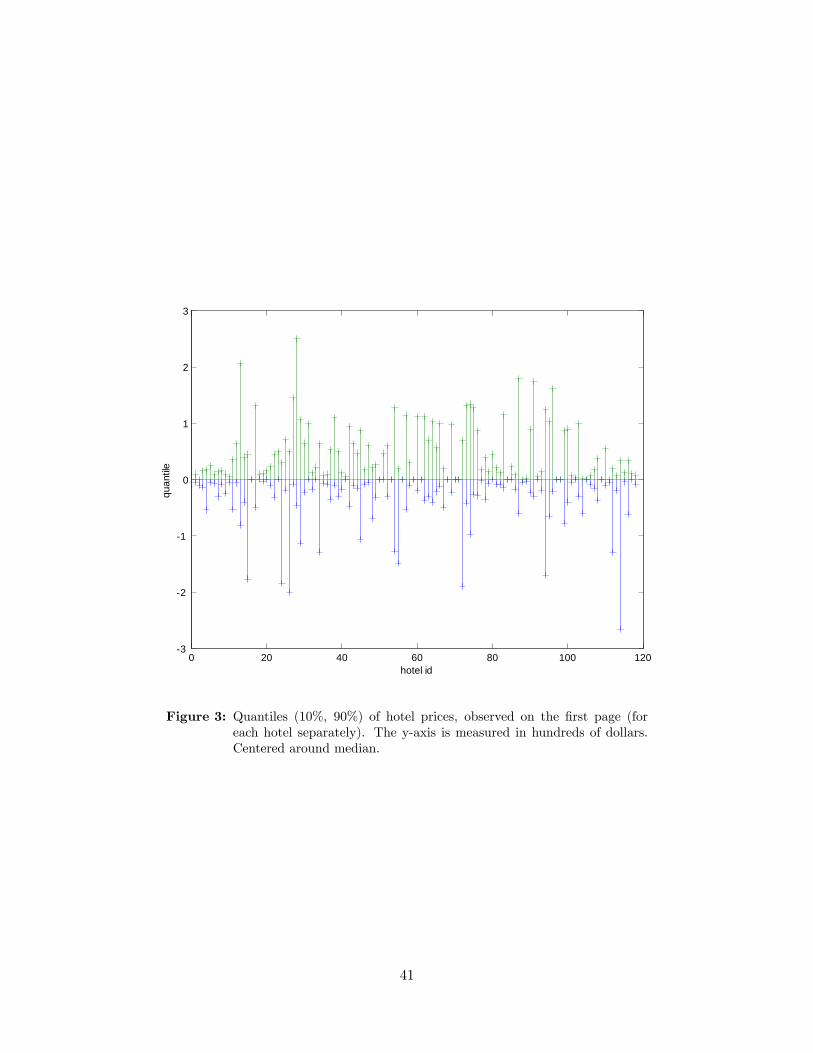
0 20 40 60 80 100 1203
2
1
0
1
2
3
hotel id
quan
tile
Figure 3: Quantiles (10%, 90%) of hotel prices, observed on the �rst page (foreach hotel separately). The y-axis is measured in hundreds of dollars.Centered around median.
41
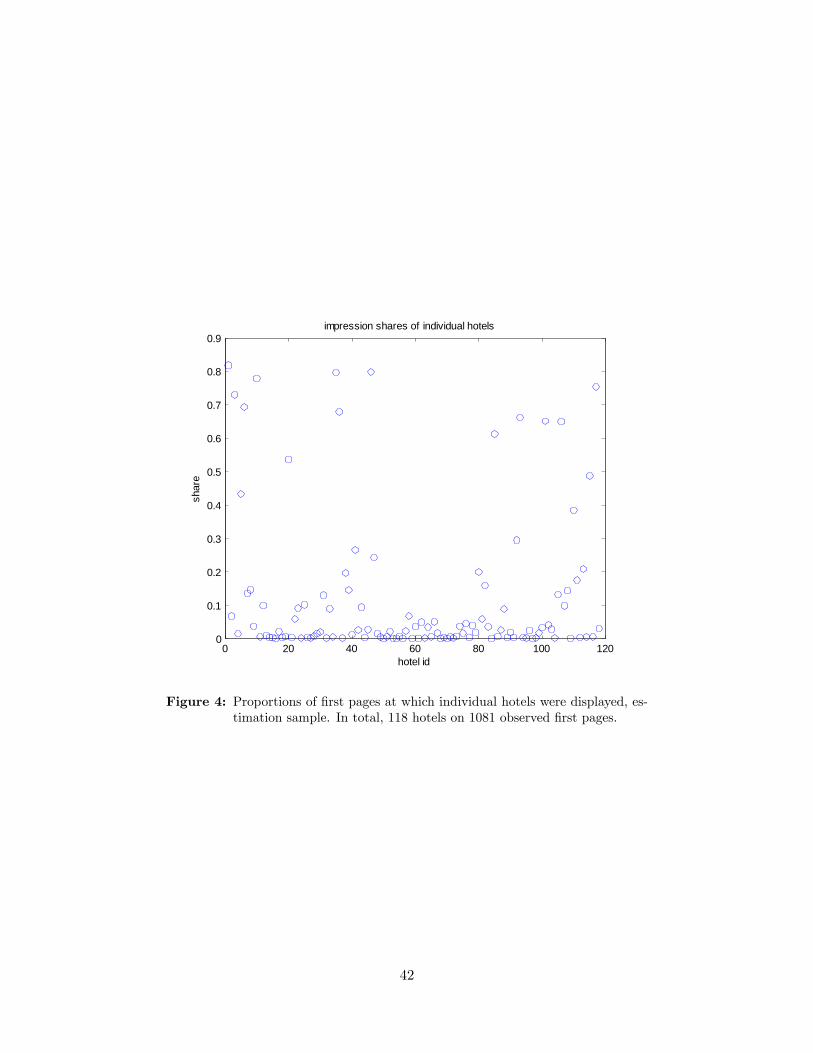
0 20 40 60 80 100 1200
0.1
0.2
0.3
0.4
0.5
0.6
0.7
0.8
0.9impression shares of individual hotels
hotel id
shar
e
Figure 4: Proportions of �rst pages at which individual hotels were displayed, es-timation sample. In total, 118 hotels on 1081 observed �rst pages.
42

0 20 40 60 80 100 120 140 1600
0.1
0.2
0.3
0.4
0.5
0.6
0.7Estimated discrete search cost distribution in S2n
dollar value
Figure 5: Estimates of discrete search cost distribution in S2n.
43
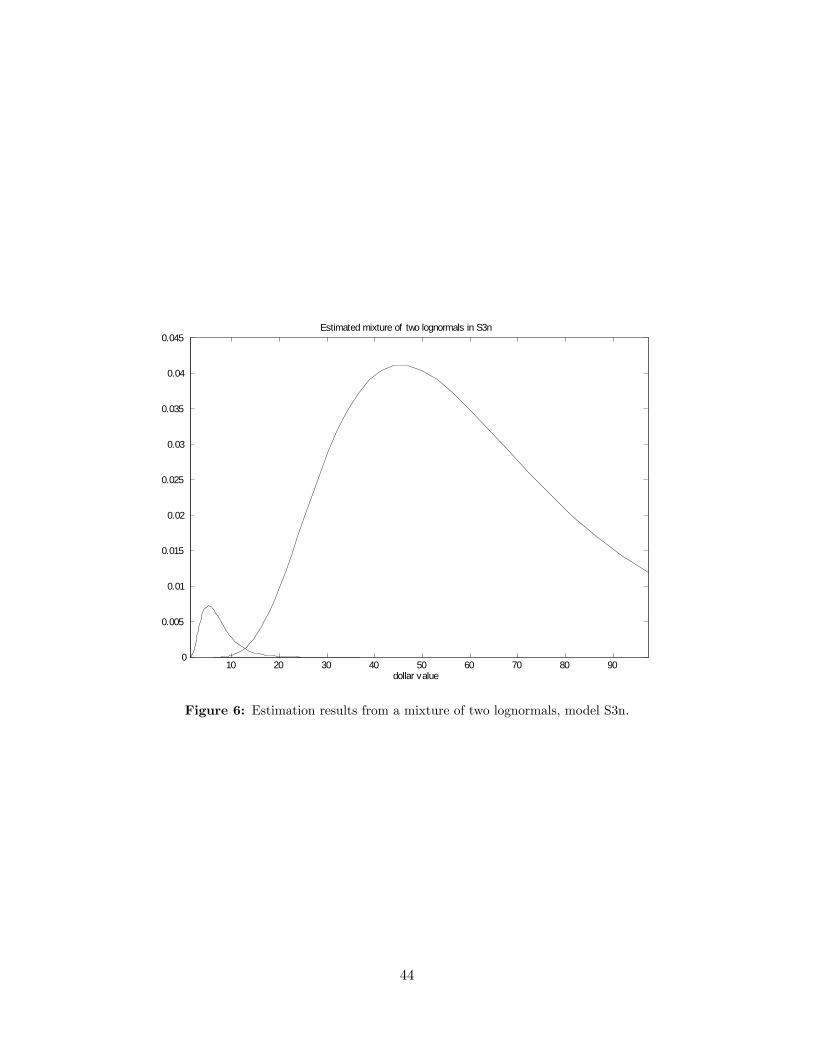
10 20 30 40 50 60 70 80 900
0.005
0.01
0.015
0.02
0.025
0.03
0.035
0.04
0.045Estimated mixture of two lognormals in S3n
dollar value
Figure 6: Estimation results from a mixture of two lognormals, model S3n.
44
Copyright © 2022 FDOKUMEN