Music or Hi-Tech Lovers? An Empirical Analysis of the Digital Music Market in Italy
44
Music or hi-tech lovers? An empirical analysis of the digital music market in Italy Francesco Balducci QUADERNI DI RICERCA n. 324 Luglio 2008
-
Upload
independent -
Category
Documents
-
view
6 -
download
0
Transcript of Music or Hi-Tech Lovers? An Empirical Analysis of the Digital Music Market in Italy
Music or hi-tech lovers?
An empirical analysis of the digital
music market in Italy
Francesco Balducci
QUADERNI DI RICERCA n. 324
Luglio 2008
Comitato scientifico:
Renato BalducciMarco CrivelliniMarco GallegatiAlberto NiccoliAlberto ZazzaroCollana curata da:Massimo Tamberi

Abstract
Using survey data on cultural consumption by about 650 university students,this article proposes a market segmentation and some rule-of-thumb policyimplications for the music industry. Consumption behaviors, listening habitsand musical preferences are explained by a large number of variables. Never-theless it is possible to reduce this overload of information into two commonfactors (using factor analysis). Cluster analysis is accordingly used to groupthe students-consumers: the digital music lovers cluster is the most profi-table for the music industry, whilst those of uninterested subjects and purehi-tech lovers are the least. The analysis shows that the new digital tech-nologies (for example file sharing) may be harmful for the music industryonly within one specific group of consumers. New technologies can insteadpromote music consumption (especially of live music) by the other catego-ries. By investing in music knowledge and enjoyment, it is possible to makeconsumers buy digital music legally from authorized sites.
JEL Class.: L82, O33, Z11Keywords: music, media, market segmentation, technological
change
Indirizzo: Francesco Balducci, Dipartimento di Economia, Uni-versita Politecnica delle Marche, Piazzale Martelli 8,60121 Ancona, Italy ([email protected]).

Music or hi-tech lovers? An empiricalanalysis of the digital music market in Italy
Francesco Balducci
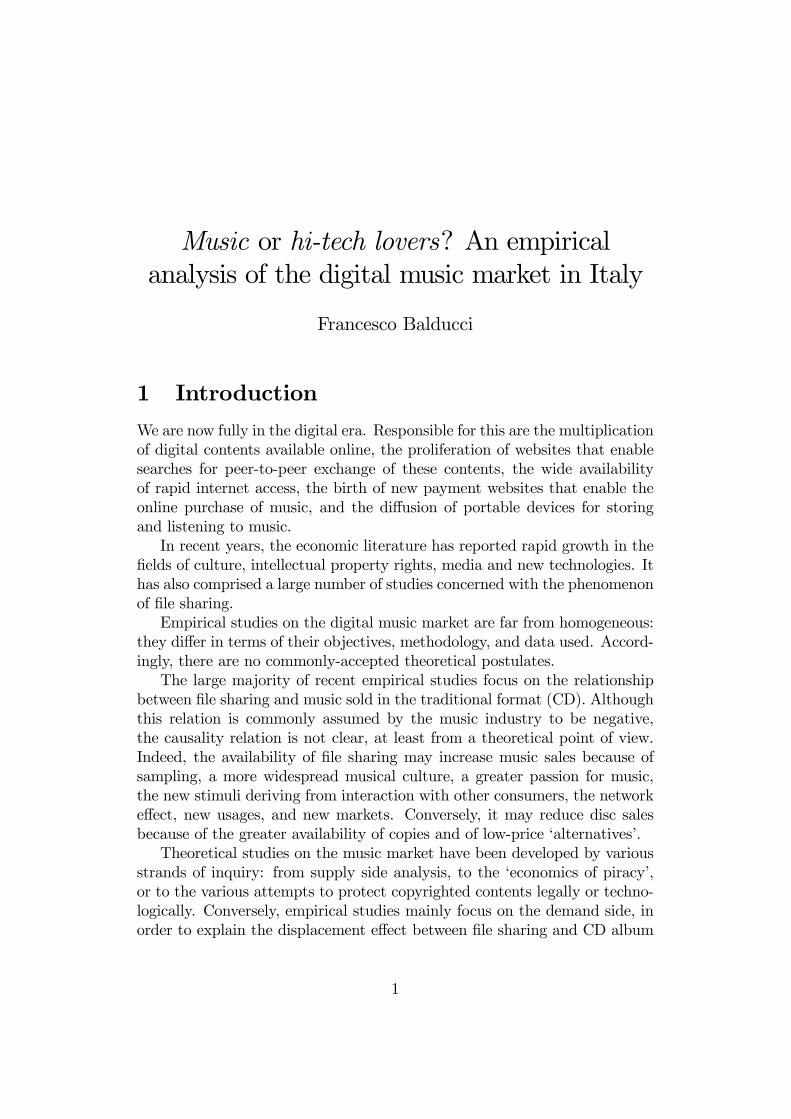
1 Introduction
We are now fully in the digital era. Responsible for this are the multiplicationof digital contents available online, the proliferation of websites that enablesearches for peer-to-peer exchange of these contents, the wide availabilityof rapid internet access, the birth of new payment websites that enable theonline purchase of music, and the di¤usion of portable devices for storingand listening to music.In recent years, the economic literature has reported rapid growth in the
�elds of culture, intellectual property rights, media and new technologies. Ithas also comprised a large number of studies concerned with the phenomenonof �le sharing.Empirical studies on the digital music market are far from homogeneous:
they di¤er in terms of their objectives, methodology, and data used. Accord-ingly, there are no commonly-accepted theoretical postulates.The large majority of recent empirical studies focus on the relationship
between �le sharing and music sold in the traditional format (CD). Althoughthis relation is commonly assumed by the music industry to be negative,the causality relation is not clear, at least from a theoretical point of view.Indeed, the availability of �le sharing may increase music sales because ofsampling, a more widespread musical culture, a greater passion for music,the new stimuli deriving from interaction with other consumers, the networke¤ect, new usages, and new markets. Conversely, it may reduce disc salesbecause of the greater availability of copies and of low-price �alternatives�.Theoretical studies on the music market have been developed by various
strands of inquiry: from supply side analysis, to the �economics of piracy�,or to the various attempts to protect copyrighted contents legally or techno-logically. Conversely, empirical studies mainly focus on the demand side, inorder to explain the displacement e¤ect between �le sharing and CD album
1
sales1.Among empirical studies, Oberholzer and Strumpf (2007) have found no
direct evidence of such a displacement e¤ect. Liebowitz (2003) argues thatthe downturn in sales can be explained by the phenomenon of substitutionbetween formats (the shift from LPs to MCs in the early 1980s, from MCsto CDs in the 1990s and the current shift from CDs to MP3s) rather thanby piracy. Hui and Png (2003) show that although piracy contributes to areduction in sales, it does so less than predicted by the music industry. Zent-ner (2006) provides evidence that the greater availability of musical contentsmade possible by the Internet has a negative impact on music sales. Thisreduction is greater for the musical genres most frequently shared amongpeer-to-peer users.According to Rob and Waldfogel (2006), each downloaded album reduces
traditional format sales by 0.2 of an album. The authors also show, on thebasis of a sample of students, that �le sharing increases per-capita consumersurplus.Stevans and Sessions (2006) use an econometric time series approach to
demonstrate that, after 2000, music downloading produced a strong negativee¤ect on consumer spending on CDs. The decreasing prices of substitutegoods (such as DVDs) is another major cause for the loss of pro�ts in thetraditional music market.Favaro and Frateschi (2005) use a multinomial logit analysis to investig-
ate the determinants of music demand in Italy. Speci�cally, they attemptto classify music consumers according to their listening habits, separating�omnivorous consumers�(people who listen to all kinds of music) from �snobconsumers�(who focus on classical music). However, they are not particularlyinterested in verifying the existence of a potential displacement e¤ect.One of the most detailed studies on the demand side based on direct
answers (or micro-data) is that by Andersen and Frenz (2007), who takeaccount of a �music quality perception index�in their analysis.Di¤erent approaches have been taken by Bhattacharjee (2005) and Regner
and Barria (2005). The former studies a music album�s survival in the charts�survival which has diminished in the digital era �whilst Regner and Barriashed light on the complex �eld of voluntary contributions for music2.
1Data used in regressions are heterogeneous and quite often do not derive from quali�edsources. Only recently has the music industry begun to pay attention to the digital musicmarket. Today, music charts (such as Billboard) include the number of downloads as well.
2Consider rock band Radiohead�s decision to allow the free downloading of its lastalbum in exchange for a voluntary payment. Even though downloaders were allowed toselect a price equal to zero, many of them chose to pay a positive price to acquire theCD. Radiohead�s �marketing strategy�proved successful in both the digital and traditional
2

The foregoing review of empirical studies highlights the complexity ofthe music market. Similarly, in such a rami�ed �digital world�, made upof �le sharing, legal online purchases (iTunes) and iPods, it is not easy tounderstand the workings of the music market and the behavior of agents. Noris the structure of consumer preferences easily intelligible either. Hence, froma demand pull perspective, the strategic choices of �rms are consequentlya¤ected as well.About ten years ago, only 1.8% of Italians used personal computers for
the purpose of listening to music (ISTAT, 1995). Today, the �gures on theconsumption of digital music are astronomical: about 800 million tracksdownloaded and more than 120 million MP3 players sold during 2006 (IFPI,2007). One should therefore inquire into the reasons for this change. That a�technological break�is happening is obvious, and it is similar to those thatcame about in the past with the shift from vinyl to the cassette, and thenfrom the cassette to the compact disc.A question arises in regard to buying choices and listening habits: what
is the main cause of the current change in consumer preferences? The avail-ability of music everywhere and at any time? A better knowledge of musicand an increased interest in it? The desire to keep abreast of every advancein hi-tech digital equipment? Or the network e¤ect (i.e. imitation amongfriends, students or young people)?This long paper can be divided into three parts which are almost inde-
pendents one another. The �rst part is a descriptive analysis of consumptionbehavior of students. The main �nding of that section is the relevant di¤usionof internet and new technologies as means of music acquisition and to listento music. The respondents also show a strong preference for the new digitalformat (MP3) for many reasons: they like the music �le for its intrinsic char-acteristics, and not only because of its low price. The second part proposesa market segmentation and draws some policy (or managerial) implicationsfor the music industry. By using factor and cluster analysis it proposes an�identikit�of a student interested in music consumption. I �nd that the twomost important factors - in explaining the demand for music - are the lovefor music and the love for hi-tech. The objective is to understand that, be-fore investigating the demand for music, a market segmentation is necessary.This is true because di¤erent e¤ects can work for di¤erent clusters. Thedisplacement e¤ect, for example, can occur only within a particular cluster.Finally, in part III inferential statistics were used to investigate the relation-ships between variables and to understand the determinants of the demand
markets. The di¤usion on the Internet of Radiohead�s music, in fact, has stimulated salesof the band�s original CD albums.
3
for recorded music and live shows. By means of econometric analysis it alsoidenti�es a relationship between the market for live concerts and the marketfor recorded music. This analysis also serves to clarify whether this relation-ship is one of complementarity or of substitutability. The same investigationis conducted on the record market, and with regard to preference for MP3�les or traditional CDs.Obviously, the sample of students used cannot be considered as represent-
ative of the entire population. Nevertheless, it is very useful for representingthose positioned above the digital divide: young and well-educated people fa-miliar with computer use and interested in listening to music (ISTAT, 1999).The results are therefore likely to be di¤erent from the average results forthe population as a whole.
2 Data description
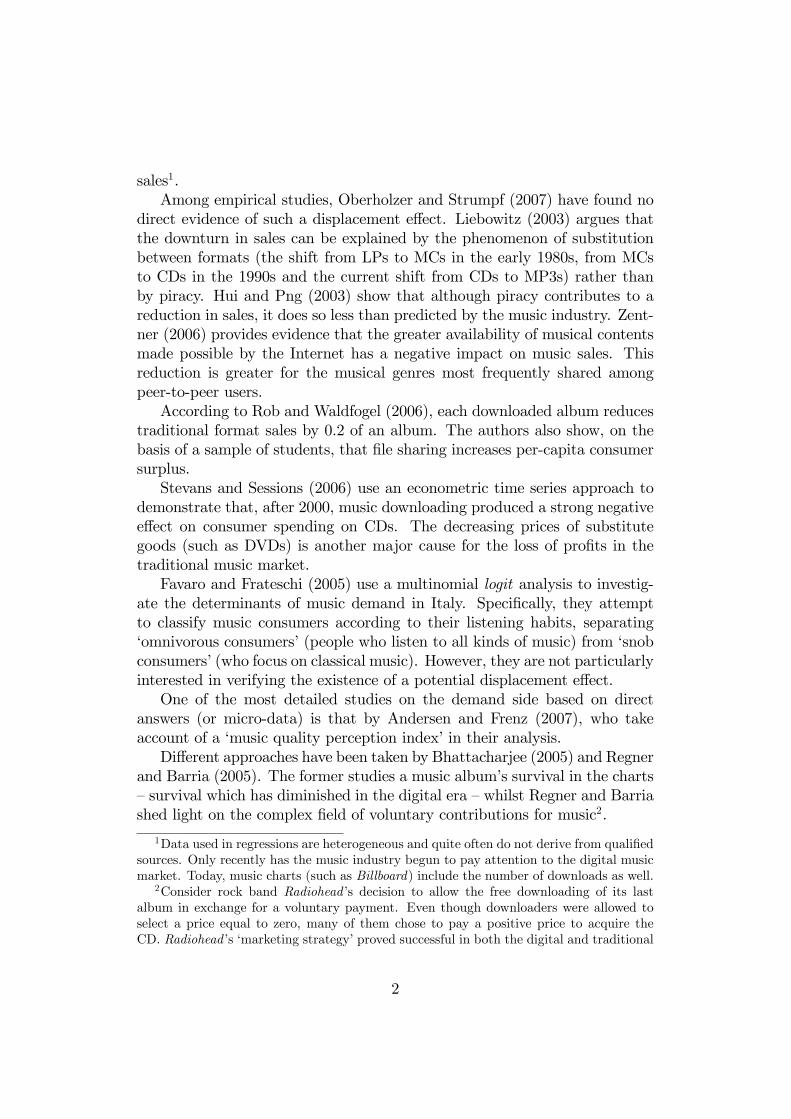
The dataset was derived from a survey administered to a sample of 634university students at the Università Politecnica delle Marche and the Riminicampus of the Università di Bologna during April and May 2007. Anconaand Rimini are towns comparable in terms of population size. They are alsosituated in the same geographical area (central Italy)3. The mean age was20.4 (with a median age of 20); 73% of the students were 19 or 20 years old,9.7% were 21, and 4.4% were aged over 23. The demographic characteristicsof the respondents are shown in Figure 1.The questions on music4 were grouped into various strands. Music con-
sumption �rst of all: attendance at live concerts, number of CDs purchased,MP3s downloaded. The respondents were also asked about the number ofCDs or MP3 albums in their collections.The respondents were then asked to state5 how often they listened to mu-
sic, which media they used (Hi-�, TV, Radio, PC etc.) and how often theydid so. They were also asked to indicate their source of information aboutmusic and from where they obtained music (music shops, supermarkets, in-ternet etc.).
3The Ancona students were �rst-year only - with the exception of a few outliers �whilethe Rimini students were also second- or third-year. However, 51% of the Rimini studentswere attending the �rst year (and about 80% the �rst or second year).
4A section of the survey collected information about reading behaviour. It is notanalysed here.
5By indicating the class they belonged to: �Everyday�, �Once a week�, �Once a fort-night�, �Less frequently�, �Never/I don�t have one�. The survey was deliberately madesimilar to the �Indagine Multiscopo ISTAT�on leisure and consumption of Italians.
4

A subsection of the survey compared between the �new digital format�(music �les: MP3, WMA, AAC or others) and the �physical digital support�(CD). The respondents were asked to state if they use peer-to-peer more thanlegal websites, and why.The last part of the survey dealt with the willingness to pay for a speci�c
CD or MP3 album6.
Figure 1: Respondent characteristicsAncona Rimini Total
Observations 403 231 634Age 19.8 21.7 20.4Males (%) 41.6 43.2 42.1Stud. from other towns (%) 57.8 57.5 57.8No internet (%) 7.2 11.2 8.6Dialup (%) 15.7 14.5 15.3Broad band (%) 77.1 74.2 76.1
3 Empirical evidence (part I)
The �rst subsection below reports the media used by the respondents tolisten to music and their sources of information about music. The internetwas the prime source of music acquisition. Downloaders are asked about thesoftware that they used (illegal peer-to-peer, or legal sites), and why, thepurpose being to understand the reasons for their choice.The second subsection describes the �endogenous�variables: the number
of CDs purchased and MP3 albums downloaded, the number of live concertsattended, and the willingness to pay. These will be used in the �nal sectionas dependent variables for the econometric analysis.
3.1 Media and music format
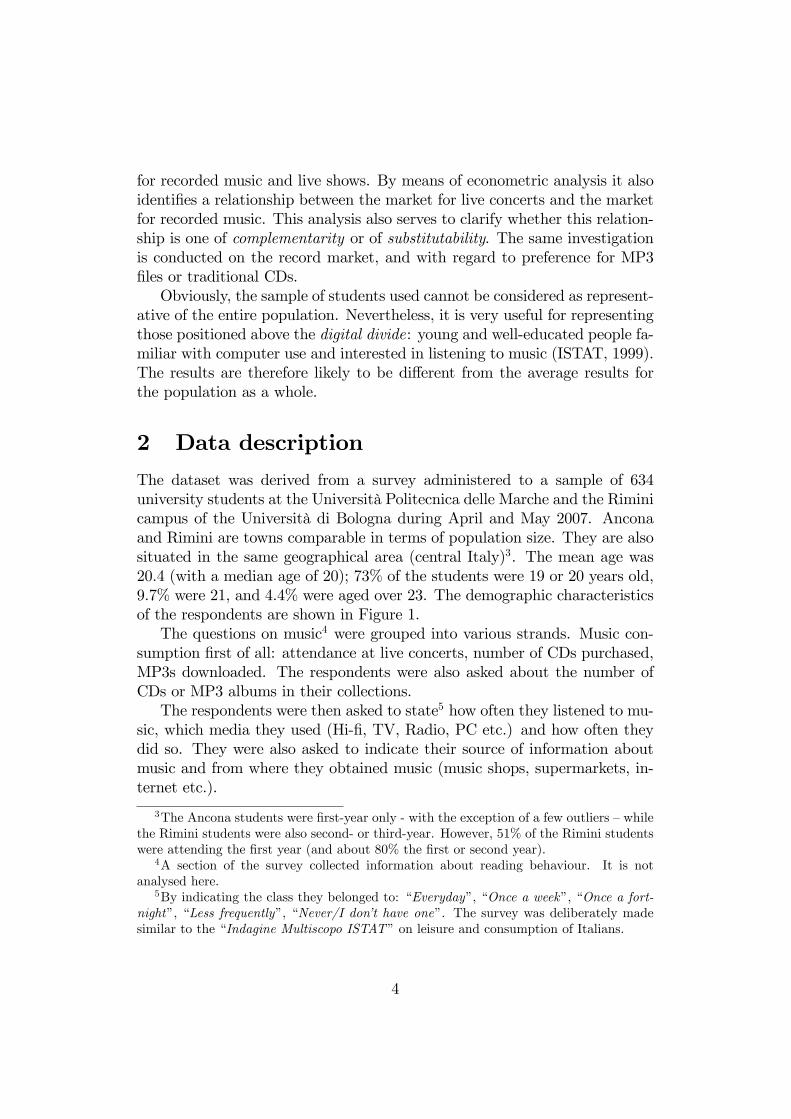
The preference for new media is clear (�gure 2): the PC is the most fre-quently used medium (about 78% of respondents used it every day or once
6The students were asked to say how much they would be willing to pay for an album bytheir favourite artist, on the hypothesis that it would be impossible to acquire that speci�calbum in any other way (no copying, no downloading, etc.) (see Rob and Waldfogel, 2006).A indirect question then asked the respondents to attach a value (ranging from zero to ten)to a self-made compilation of downloaded tracks, with �ve being the value of an originalCD album.
5

Figure 2: Media for music listening
How often do you listen to music using the following media? (%)
Never Less than once afortnight
Once afortnight Once a week Every
day
Hifi 6.8 23.9 7.4 20.7 41.2Males 9.4 28.1 8.9 17.9 35.7
Females 5.2 21.3 6.7 22.6 44.2PC 3.5 13.4 5.5 24.1 53.6
Males 0.4 6.4 1.7 20.8 70.8Females 5.5 17.9 8.8 26.4 41.5
iPod 23.3 13.7 6.4 18.7 38.0Mobile Phone 41.9 34.2 6.0 9.7 8.2Walkman 42.6 39.7 6.2 6.2 5.4Radio 31.8 30.8 6.3 11.8 19.2Car radio 10.7 7.2 4.7 17.0 60.5
a week for the purpose of listening to music, while only 3.5% never usedit). The most frequent �traditional�form of music fruition was the car radio(77.5%), although 10.67% of the students did not use it at all. 41.2% of thesample used hi-� equipment every day.The large-scale use of portable MP3 players evidences the students�pref-
erence for the new digital format. MP3 players (such as Apple iPod) werefrequently used, much more so than the �old�walkman or discman: only37% the respondents never used MP3 players (or used them rarely), while82% never (or rarely) used traditional portable devices. Moreover, 38% ofMP3-player owners used them frequently (every day or once a week).The use of �smart phones�(with UMTS or GPRS technologies) was still
not very pervasive, according to the sample: a result in contrast with theItalian music industry�s expectations. Considering the large amount of cellphones in Italy, the music industry places strong faith in the mobile telephonymarket as a way to promote music purchases.A large percentage of the students did not listen to music on the radio
(63%). However, those who used the radio to listen to music did so quiteoften. There thus emerges a bimodal distribution, with a marked separationbetween heavy users and non-users.Females were more tied to traditional media: they used hi-� equipment
more than men, and PCs less. For example, 23% of the female respondentsnever used a computer to listen to music (or used one rarely), whilst only 7%of men reported this behaviour.
6

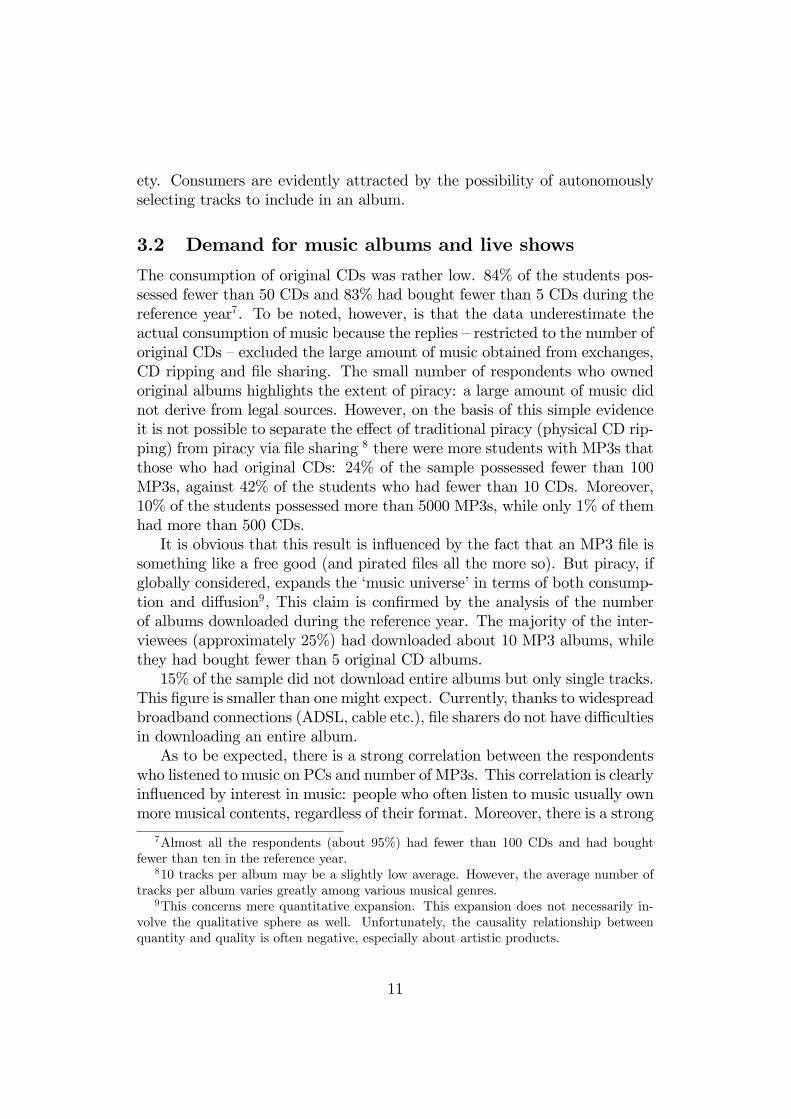
Figure 3: Information about music
How often do you use the following means of information (about music)? (%)
Radio TV Internet Sampling Magazines Stores Word ofmouth
Never 10.6 6.7 24.2 72.1 75.7 70.5 6.1Once or more thanonce a month 28.4 19.7 29.5 15.7 18.8 24.7 32.9
One or more thanonce a week 61.0 73.6 46.3 12.1 5.5 4.8 60.9
The preference for new media was less evident in regard to channelsof music information (�gure 3). The traditional sources of information,such as word of mouth, TV or radio musical programmes, were still widelyused. About 94% of the respondents referred to friends and acquaintances(word of mouth), 93% watched TV, and 89% listened to the radio to obtaininformation about music. The role of the radio is evident: it is often usedto collect information and to listen to a variety of programmes, but it is notused to listen to music with the same intensity.At �rst glance, it may seem odd that the internet is used less to obtain
information about music than the traditional sources (76%). A possibleexplanation is that information on the internet is often unreliable, and noteasily obtainable by all (or less so than via word of mouth, or TV, or radio).Services for music lovers, such as specialized music shops and magazines,
were rarely used (only 30% of the students visited music shops and 24%bought magazines).The impact of sampling (that is, �le sharing in order to have a preview
of a track before buying an original album) was not signi�cant: 72% of thesample did not sample music via �le sharing.
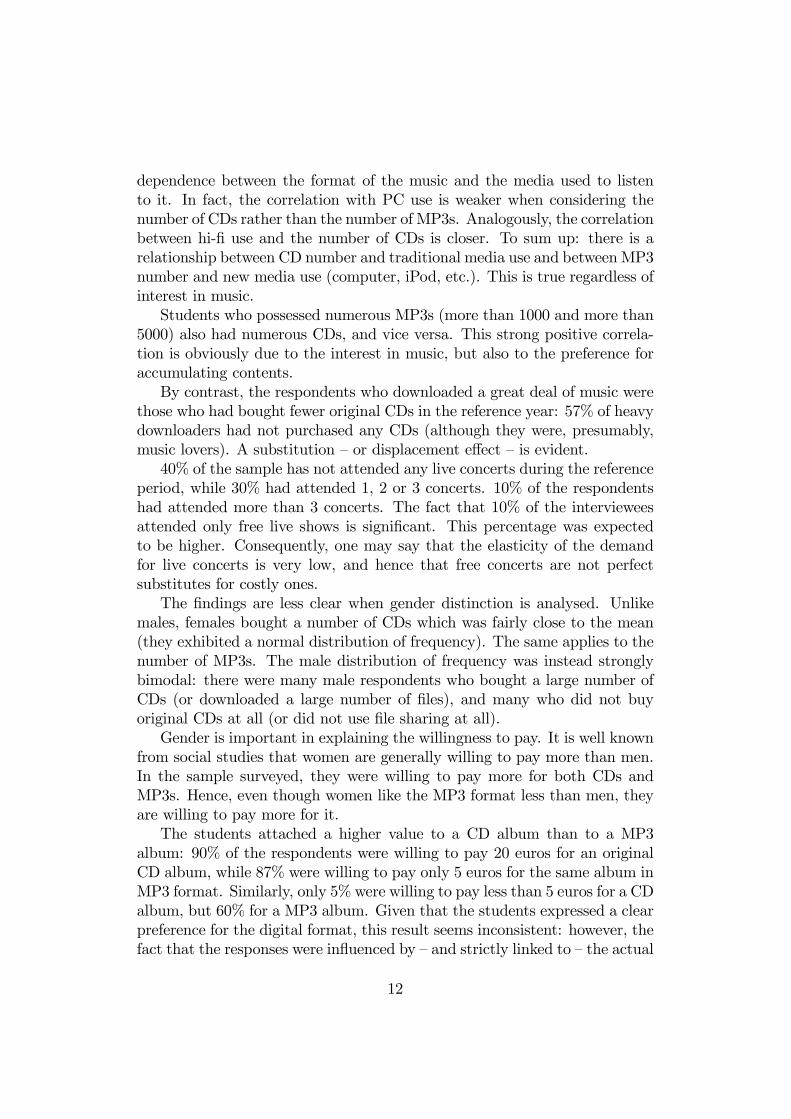
Analysis of the sources of music acquisition (�gure 4) showed the rel-evance of piracy. 83% of the respondents listened to music downloaded fromthe internet, mostly without paying for it. �Traditional� piracy by meansof CD-ripping was reported by the high percentage of students (28%) whodeclared that they received music on loan from friends. Some 26% of therespondents received music as a gift; 20% bought music at specialized stores,10% at both supermarkets and chain stores. Hence sales split fairly evenlybetween large-scale retail outlets and traditional music shops. In the geo-graphic area of reference, supermarkets had not supplanted the traditionalstores.
The majority of the students (75%) used �le sharing or peer-to-peer
7

Figure 4: Means of music acquisition
Means of music acquisition
83.1%
28.4% 26.1%20.4%
10.3% 10.2% 8.5% 6.1% 4.6% 2.8% 2.8% 1.8%
Inte
rnet
Frie
nds
Gift
Spec
ializ
edst
ores
Supe
rmar
kets
Cha
in s
tore
s
New
spap
ers
stor
es
Con
certs
Flea
mar
ket
Seco
ndh
and
shop
s
Mob
ile p
hone
Mul
tisto
re
Figure 5: File sharing or legal websites? (%)
Legal websites
Afraid ofbeing
legallypursued,
2.4%
Safe, 14%
Don't w antto infringlaw , 7%
Other,1.6%
0.0
10.0
20.0
30.0
40.0
50.0
60.0
70.0
80.0
File sharing
Cheap;32%
Musicvariety;
19%
P2P is notillegal,22%
Other; 2%
0.0
10.0
20.0
30.0
40.0
50.0
60.0
70.0
80.0
8

rather than legal websites (e.g. iTunes, Napster 2.0 etc). However, legalsites were chosen by about 25% of the respondents (Figure 5). This resultis of particular signi�cance for Italy, given that legal websites have appearedbelatedly with respect to other countries, and their use has been less boosted.Students who chose legal websites did so mainly for reasons of security
(14%): authorized software programs have reliable and high quality contents,and they are free of worms and viruses.As to be expected, respondents chose �le sharing because it was cheaper:
32% of the them shared �les for this reason, regardless of legality or security.To be noted is that more than 22% of the sample did not perceive �le
sharing as illegal: those consumers obviously had no moral qualms aboutdownloading.Yet the fact that legal sites were more frequently used than free online
radio stations (16%) reveals a preference for the accumulation and possessionof digital contents. One can nevertheless expect this attitude to change as aresult of the widespread di¤usion of digital streaming. High-quality streaming�one of the new frontiers of the net �may render the downloading processpointless.Female respondents showed a clear preference for safe and legal contents:
the majority of them perceived �le sharing as an extremely unlawful activity.
The digital music �le was the most popular format. Three main reasonswere cited: the versatility of the MP3 �le, its cheapness, and the fact thatit was easily and quickly obtainable. 38% of the students preferred the MP3format because they could thus listen to music �les on small, e¢ cient andattractive portable devices; 37% because MP3s were cheaper than CDs; and36% because they could rapidly obtain the music they wanted. Moreover,MP3 �les did not occupy physical space (21%) at home. Furthermore, somerespondents enjoyed the download activity itself (18%). Those who preferredtraditional CDs did so because they could easily listen to a CD on hi-�equipment or the car radio (20%); they enjoyed collecting albums and discs(15%); or because they wanted better audio quality (11%).Finally, price was not the only relevant variable: many of the students
chose a format because they had a strong preference for that particular sup-port.The preference for the new format was con�rmed by the question which
asked respondents to assign a value to a self-made compilation of downloadedtracks. The value ranged from zero to ten, with ��ve�being the value of anoriginal CD album. 76% of the sample assigned a high value (above �ve) tothe self-made compilation. This result also re�ects the preference for vari-
9

Figure 6: Music format (%)
CD format, why?
1.8%
10.3%
11.6%
14.5%
20.1%
I’m not able todownload
Booklet
Audio quality
Hifilistenable
MP3 format, why?
15.4%
18.3%
21.4%
36.4%
37.0%
38.7%
Shareable with friends
I love to download
No physical space
Easily obtainable
Cheap
iPodlistenable
I love to collect discs
10
ety. Consumers are evidently attracted by the possibility of autonomouslyselecting tracks to include in an album.
3.2 Demand for music albums and live shows
The consumption of original CDs was rather low. 84% of the students pos-sessed fewer than 50 CDs and 83% had bought fewer than 5 CDs during thereference year7. To be noted, however, is that the data underestimate theactual consumption of music because the replies �restricted to the number oforiginal CDs �excluded the large amount of music obtained from exchanges,CD ripping and �le sharing. The small number of respondents who ownedoriginal albums highlights the extent of piracy: a large amount of music didnot derive from legal sources. However, on the basis of this simple evidenceit is not possible to separate the e¤ect of traditional piracy (physical CD rip-ping) from piracy via �le sharing 8 there were more students with MP3s thatthose who had original CDs: 24% of the sample possessed fewer than 100MP3s, against 42% of the students who had fewer than 10 CDs. Moreover,10% of the students possessed more than 5000 MP3s, while only 1% of themhad more than 500 CDs.It is obvious that this result is in�uenced by the fact that an MP3 �le is
something like a free good (and pirated �les all the more so). But piracy, ifglobally considered, expands the �music universe�in terms of both consump-tion and di¤usion9, This claim is con�rmed by the analysis of the numberof albums downloaded during the reference year. The majority of the inter-viewees (approximately 25%) had downloaded about 10 MP3 albums, whilethey had bought fewer than 5 original CD albums.15% of the sample did not download entire albums but only single tracks.
This �gure is smaller than one might expect. Currently, thanks to widespreadbroadband connections (ADSL, cable etc.), �le sharers do not have di¢ cultiesin downloading an entire album.As to be expected, there is a strong correlation between the respondents
who listened to music on PCs and number of MP3s. This correlation is clearlyin�uenced by interest in music: people who often listen to music usually ownmore musical contents, regardless of their format. Moreover, there is a strong
7Almost all the respondents (about 95%) had fewer than 100 CDs and had boughtfewer than ten in the reference year.
810 tracks per album may be a slightly low average. However, the average number oftracks per album varies greatly among various musical genres.
9This concerns mere quantitative expansion. This expansion does not necessarily in-volve the qualitative sphere as well. Unfortunately, the causality relationship betweenquantity and quality is often negative, especially about artistic products.
11
dependence between the format of the music and the media used to listento it. In fact, the correlation with PC use is weaker when considering thenumber of CDs rather than the number of MP3s. Analogously, the correlationbetween hi-� use and the number of CDs is closer. To sum up: there is arelationship between CD number and traditional media use and betweenMP3number and new media use (computer, iPod, etc.). This is true regardless ofinterest in music.Students who possessed numerous MP3s (more than 1000 and more than
5000) also had numerous CDs, and vice versa. This strong positive correla-tion is obviously due to the interest in music, but also to the preference foraccumulating contents.By contrast, the respondents who downloaded a great deal of music were
those who had bought fewer original CDs in the reference year: 57% of heavydownloaders had not purchased any CDs (although they were, presumably,music lovers). A substitution �or displacement e¤ect �is evident.40% of the sample has not attended any live concerts during the reference
period, while 30% had attended 1, 2 or 3 concerts. 10% of the respondentshad attended more than 3 concerts. The fact that 10% of the intervieweesattended only free live shows is signi�cant. This percentage was expectedto be higher. Consequently, one may say that the elasticity of the demandfor live concerts is very low, and hence that free concerts are not perfectsubstitutes for costly ones.The �ndings are less clear when gender distinction is analysed. Unlike
males, females bought a number of CDs which was fairly close to the mean(they exhibited a normal distribution of frequency). The same applies to thenumber of MP3s. The male distribution of frequency was instead stronglybimodal: there were many male respondents who bought a large number ofCDs (or downloaded a large number of �les), and many who did not buyoriginal CDs at all (or did not use �le sharing at all).Gender is important in explaining the willingness to pay. It is well known
from social studies that women are generally willing to pay more than men.In the sample surveyed, they were willing to pay more for both CDs andMP3s. Hence, even though women like the MP3 format less than men, theyare willing to pay more for it.The students attached a higher value to a CD album than to a MP3
album: 90% of the respondents were willing to pay 20 euros for an originalCD album, while 87% were willing to pay only 5 euros for the same album inMP3 format. Similarly, only 5% were willing to pay less than 5 euros for a CDalbum, but 60% for a MP3 album. Given that the students expressed a clearpreference for the digital format, this result seems inconsistent: however, thefact that the responses were in�uenced by �and strictly linked to �the actual
12

Figure 7: Number of CD and MP3 albumsMales Females Total
Original CD albums (% of students)None 7 4 5n < 10 35 39 37From 10 to 50 40 44 43From 51 to 100 11 9 10From 101 to 200 3 2 3From 201 to 300 1 1 1From 301 to 500 1 1 1n > 500 2 1 1
CD albums purchased in the reference year(% of students)
None 40 47 44n < 5 40 40 40From 6 to 10 13 10 11From 11 to 15 3 3 3From 16 to 20 0 1 1n > 20 3 0 1
MP3 files stored in HD (% of students)n < 100 16 31 25From 100 to 500 23 36 31From 500 to 1000 19 19 19From 1000 to 5000 23 11 16n > 5000 19 3 10
MP3 albums downloaded in the reference year(% of students)
None 15 25 21From 1 to 4 21 26 24From 5 to 10 23 23 23n > 10 24 12 17No entire album 16 14 15
market price of CDs may be an explanation for it10.
In conclusion, the respondents liked the MP3 format because it is inex-pensive, rapidly available and ready to use, but they did not greatly value it. In a sense, an MP3 �le resembles an abundant free good. Not by chance,there was a negative correlation between the willingness to pay (for both CDsand MP3s) and the number of MP3s stored in the respondent�s PC. Studentswho downloaded a great deal of music were less willing to pay than thosewho did not download at all. Hence, di¤erently from heavy downloaders, thenon-downloaders viewed music products as valuable and costly goods.
10Even though the question asked the respondent to imagine a hypothetical situation inwhich it was impossible to acquire the album elsewhere.
13
4 Consumers classi�cation (part II)
Factor analysis was used to explain the students�preferences regarding musicconsumption and new technologies. The technique was employed to extractsome common factors from the data, the purpose being to reduce the numberof explanatory variables, as described in the previous section. It was thenpossible to classify the students into a few fundamental groups (or clusters).Factor analysis makes it possible to obtain a simpler but still informativestructure yielded by the correlations between variables11. More speci�cally,the variability of the data is decomposed into two parts: a common varianceand a speci�c one (uniqueness).The analysis now described was conducted using STATA 9 software; the
analytic procedure was the one included in that statistical package12.
4.1 Factor extraction
The analysis was performed within two frameworks: a reduced one whichcontained fewer variables, and a second extended framework. Although theextended framework was statistically less signi�cant, it is mentioned any-way because of the interesting features of some variables only included in it.Moreover, the reduced framework was constructed by omitting some variablesfrom the extended framework. This was done after noticing that there wereonly two fundamental common factors accounting for much of the variabilityof the data.The choice of variables was statistically adequate according to the Kaiser-
Meyer-Olkin (KMO) criterion: the average level of the index was 0.76, anacceptable value 13. Figure 11 shows the characteristics of the variables used
11Even though there is an unavoidable distorsion in �compressing�the dimension of thedataset from n-variables to just two variables.12Put brie�y, the observed variables were modeled as linear combinations of the factors,
plus �error�terms. This produces a x vector of p observed variables:
x = f�0 + e
Where f (1 � q) is a vector of common factors, � is a (p � q) matrix of factor loadingsand e (1 � p) is a vector of statistical errors. The correlation matrix � is decomposedinto a product matrix of common factors plus a matrix of speci�c factors ( matrix ofuniqueness):
� = ��0 +
The estimation procedure is the principal factors method, by default in STATA. Di¤er-ent procedures (iterative, maximum likelihood etc.) do not signi�cantly alter the results(STATA, 2003; Fabbris, 1997).13The STATA classi�cation of the index is .0.00 to 0.49: unacceptable; 0.50 to 0.59
14

Figure 8: Factors extractionReduced framework
Factor Eigenvalue Difference Proportion CumulativeFactor1 2.158 0.446 0.603 0.603Factor2 1.712 1.315 0.478 1.081Factor3 0.398 0.164 0.111 1.192Factor4 0.234 0.057 0.065 1.257Factor5 0.176 0.042 0.049 1.306Factor6 0.134 0.063 0.038 1.344
Extended frameworkFactor Eigenvalue Difference Proportion CumulativeFactor1 2.830 0.602 0.364 0.364Factor2 2.227 1.068 0.287 0.651Factor3 1.159 0.307 0.149 0.800Factor4 0.852 0.171 0.110 0.910Factor5 0.681 0.119 0.088 0.998Factor6 0.562 0.105 0.072 1.070
in both frameworks.It was deemed appropriate to extract two common factors among the data
in the reduced framework 14. This decision was motivated by several selectioncriteria: the �eigenvalue�criterion, the �explained variance�criterion (�gure8), and by observing the screeplot (�gure 9) (Fabbris 1997)15. In order togive a meaning to the factor loadings, it is very useful - often necessary - torotate them. I used an orthogonal VARIMAX rotation. 16. However, thefactor loadings rotation did not substantially alter the results, as can be seenfrom �gure 10 17.The more relevant factor loadings are highlighted in �gure 10. The mean-
miserable; 0.60 to 0.69 mediocre; 0.70 to 0.79 middling; 0.80 to0.89 meritorious; 0.90 to1.00 marvellous.14The selection of the number of factors to be retained is more complex in the extended
framework. Following the selection criteria one should extract three common factors. Thethird factor, even if not easily understandable, can be considered a �demographic� oneincluding gender and high-school grade variables.15In brief, according to the statistical literature, one should retain the factors which
have eigenvalues larger than one and which, consequently, are positioned higher on thescreeplot . It is also desirable that the retained factors should explain a large part ofthe cumulative variance. In my analysis all these criteria were veri�ed and the choice ofretaining two factors was straightforward.16Other kinds of oblique rotations (i.e. PROMAX) do not produce di¤erent results.17The uniqueness column contains a list of non-common (unique) coe¢ cients pertaining
to each single variable.
15

Figure 9: Screeplot (reduced framework)
.50
.51
1.5
2E
igen
valu
es
0 5 10 15 20Number
Scree plot of eigenvalues after factor
Figure 10: Factor loadings (VARIMAX rotation)
Variables Factor1 Factor2 Factor1 Factor2 Uniquenessfrom_shops 0.491 0.253 0.413 0.367 0.695from_live 0.364 0.037 0.362 0.055 0.866from_internet 0.195 0.535 0.056 0.566 0.676cd_collezione 0.361 0.084 0.329 0.171 0.862cd_nodownl 0.006 0.210 0.046 0.205 0.956mp3_lovedownl 0.183 0.222 0.122 0.260 0.918adsl2 0.133 0.344 0.044 0.367 0.864cult_concerti 0.506 0.151 0.528 0.021 0.721time_shops 0.666 0.107 0.671 0.062 0.545copy 0.175 0.055 0.156 0.097 0.966gender 0.034 0.343 0.118 0.324 0.881lis_ipod 0.169 0.415 0.266 0.360 0.799lis_pc 0.103 0.656 0.263 0.610 0.559lis_hifi 0.329 0.127 0.288 0.205 0.875inf_internet 0.161 0.603 0.305 0.545 0.610inf_riv 0.507 0.177 0.535 0.046 0.712inf_shop 0.614 0.014 0.598 0.139 0.623
Rotated Unrotated
16
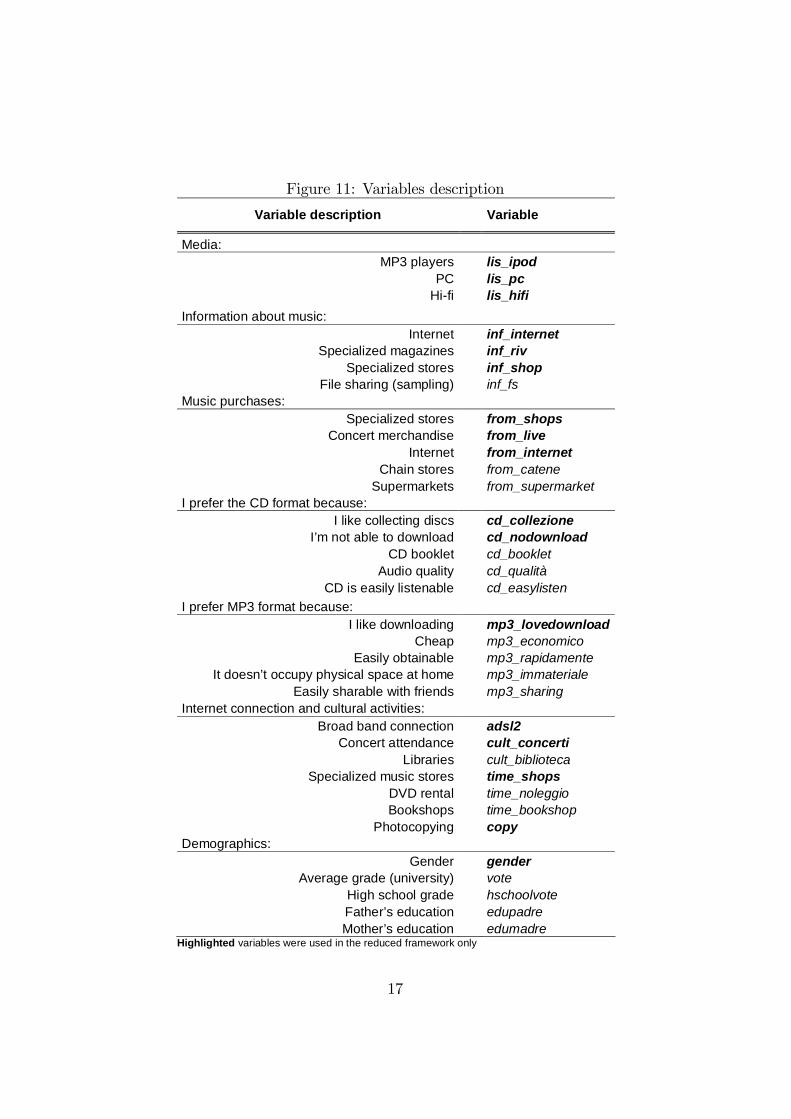
Figure 11: Variables description
Variable description Variable
Media:MP3 players lis_ipod
PC lis_pcHifi lis_hifi
Information about music:Internet inf_internet
Specialized magazines inf_rivSpecialized stores inf_shop
File sharing (sampling) inf_fsMusic purchases:
Specialized stores from_shopsConcert merchandise from_live
Internet from_internetChain stores from_catene
Supermarkets from_supermarketI prefer the CD format because:
I like collecting discs cd_collezioneI’m not able to download cd_nodownload
CD booklet cd_bookletAudio quality cd_qualità
CD is easily listenable cd_easylistenI prefer MP3 format because:
I like downloading mp3_lovedownloadCheap mp3_economico
Easily obtainable mp3_rapidamenteIt doesn’t occupy physical space at home mp3_immateriale
Easily sharable with friends mp3_sharingInternet connection and cultural activities:
Broad band connection adsl2Concert attendance cult_concerti
Libraries cult_bibliotecaSpecialized music stores time_shops
DVD rental time_noleggioBookshops time_bookshop
Photocopying copyDemographics:
Gender genderAverage grade (university) vote
High school grade hschoolvoteFather’s education edupadreMother’s education edumadre
Highlighted variables were used in the reduced framework only
17
ing of the two common factors can be deduced by looking at the variablescorresponding to higher coe¢ cients (heavier loadings): the �rst factor sum-marizes the respondents�interest in music, and the second their interest inhi-tech and new technologies. Hence Factor 1 (music factor) is distinctive ofrespondents who:
1. bought recorded music at specialized stores and as merchandise at liveconcerts
2. obtained information about music by reading specialized magazines andconstantly going to specialized shops
3. enjoyed collecting CDs and vinyl discs
4. listened to music mostly on hi-� equipment
5. attended numerous live concerts
Those identi�ed by the �rst factor preferred the traditional format be-cause of the CD booklet and because of their enjoyment of collecting things(such as music albums). Their preference for a physical (non-digital) supportis evident. Conversely, they did not like MP3 �les because they were unableto download (or disliked doing so) digital contents.The second factor (hi-tech factor) identi�es respondents who:
1. were male
2. had a broad band internet connection
3. listened to music on the internet
4. listened to music using MP3 players and PCs
5. obtained news and information about music by sur�ng websites and bysampling music via �le sharing
Moreover, the respondents identi�ed by the second factor were more at-tentive to legality: they copied fewer contents. The coe¢ cient of the copyvariable (measuring the tendency to photocopy books and papers) is in factpositive for that group of students. Those pertaining to Factor 2, moreover,did not buy music at specialized stores or in supermarkets, and they did notlisten to music on hi-� equipment.
18
4.2 Market segmentation
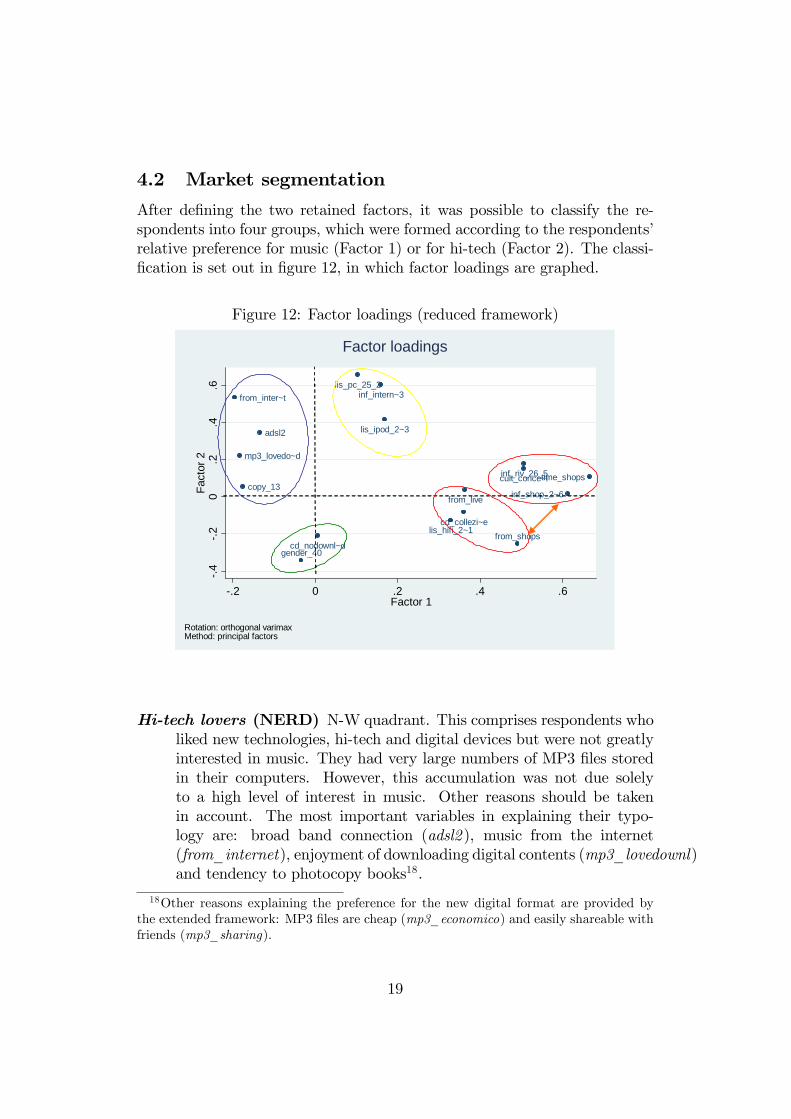
After de�ning the two retained factors, it was possible to classify the re-spondents into four groups, which were formed according to the respondents�relative preference for music (Factor 1) or for hi-tech (Factor 2). The classi-�cation is set out in �gure 12, in which factor loadings are graphed.
Figure 12: Factor loadings (reduced framework)
from_shops
from_live
from_inter~t
cd_collezi~e
cd_nodownl~d
mp3_lovedo~d
adsl2
cult_conce~itime_shopscopy_13
gender_40
lis_ipod_2~3
lis_pc_25_2
lis_hifi_2~1
inf_intern~3
inf_riv_26_5
inf_shop_2~6
.4.2
0.2
.4.6
Fact
or 2
.2 0 .2 .4 .6Factor 1
Rotation: orthogonal varimaxMethod: principal factors
Factor loadings
Hi-tech lovers (NERD) N-W quadrant. This comprises respondents wholiked new technologies, hi-tech and digital devices but were not greatlyinterested in music. They had very large numbers of MP3 �les storedin their computers. However, this accumulation was not due solelyto a high level of interest in music. Other reasons should be takenin account. The most important variables in explaining their typo-logy are: broad band connection (adsl2 ), music from the internet(from_internet), enjoyment of downloading digital contents (mp3_lovedownl)and tendency to photocopy books18.
18Other reasons explaining the preference for the new digital format are provided bythe extended framework: MP3 �les are cheap (mp3_economico) and easily shareable withfriends (mp3_sharing).
19
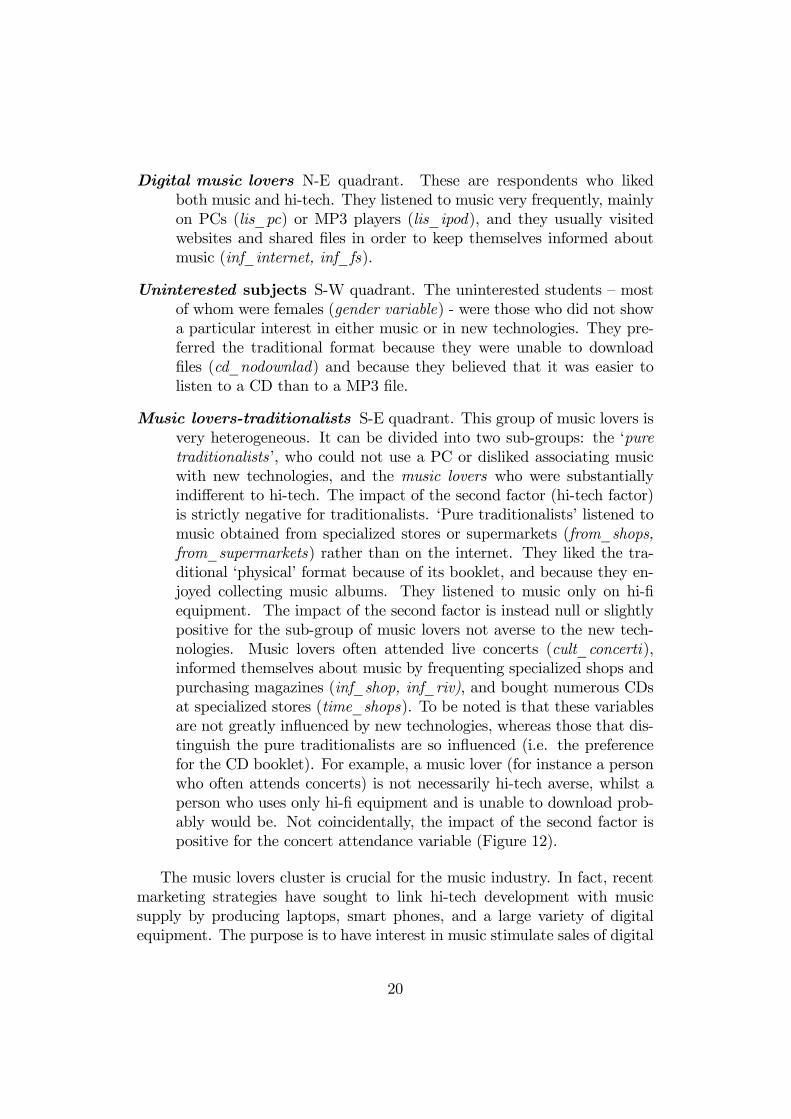
Digital music lovers N-E quadrant. These are respondents who likedboth music and hi-tech. They listened to music very frequently, mainlyon PCs (lis_pc) or MP3 players (lis_ipod), and they usually visitedwebsites and shared �les in order to keep themselves informed aboutmusic (inf_internet, inf_fs).
Uninterested subjects S-W quadrant. The uninterested students �mostof whom were females (gender variable) - were those who did not showa particular interest in either music or in new technologies. They pre-ferred the traditional format because they were unable to download�les (cd_nodownlad) and because they believed that it was easier tolisten to a CD than to a MP3 �le.
Music lovers-traditionalists S-E quadrant. This group of music lovers isvery heterogeneous. It can be divided into two sub-groups: the �puretraditionalists�, who could not use a PC or disliked associating musicwith new technologies, and the music lovers who were substantiallyindi¤erent to hi-tech. The impact of the second factor (hi-tech factor)is strictly negative for traditionalists. �Pure traditionalists�listened tomusic obtained from specialized stores or supermarkets (from_shops,from_supermarkets) rather than on the internet. They liked the tra-ditional �physical�format because of its booklet, and because they en-joyed collecting music albums. They listened to music only on hi-�equipment. The impact of the second factor is instead null or slightlypositive for the sub-group of music lovers not averse to the new tech-nologies. Music lovers often attended live concerts (cult_concerti),informed themselves about music by frequenting specialized shops andpurchasing magazines (inf_shop, inf_riv), and bought numerous CDsat specialized stores (time_shops). To be noted is that these variablesare not greatly in�uenced by new technologies, whereas those that dis-tinguish the pure traditionalists are so in�uenced (i.e. the preferencefor the CD booklet). For example, a music lover (for instance a personwho often attends concerts) is not necessarily hi-tech averse, whilst aperson who uses only hi-� equipment and is unable to download prob-ably would be. Not coincidentally, the impact of the second factor ispositive for the concert attendance variable (Figure 12).
The music lovers cluster is crucial for the music industry. In fact, recentmarketing strategies have sought to link hi-tech development with musicsupply by producing laptops, smart phones, and a large variety of digitalequipment. The purpose is to have interest in music stimulate sales of digital
20
devices and vice versa, in order to recoup the loss of pro�ts on the traditionalmarket.By contrast, the categories most harmful to the music industry are the
hi-tech lovers and, of course, uninterested users.
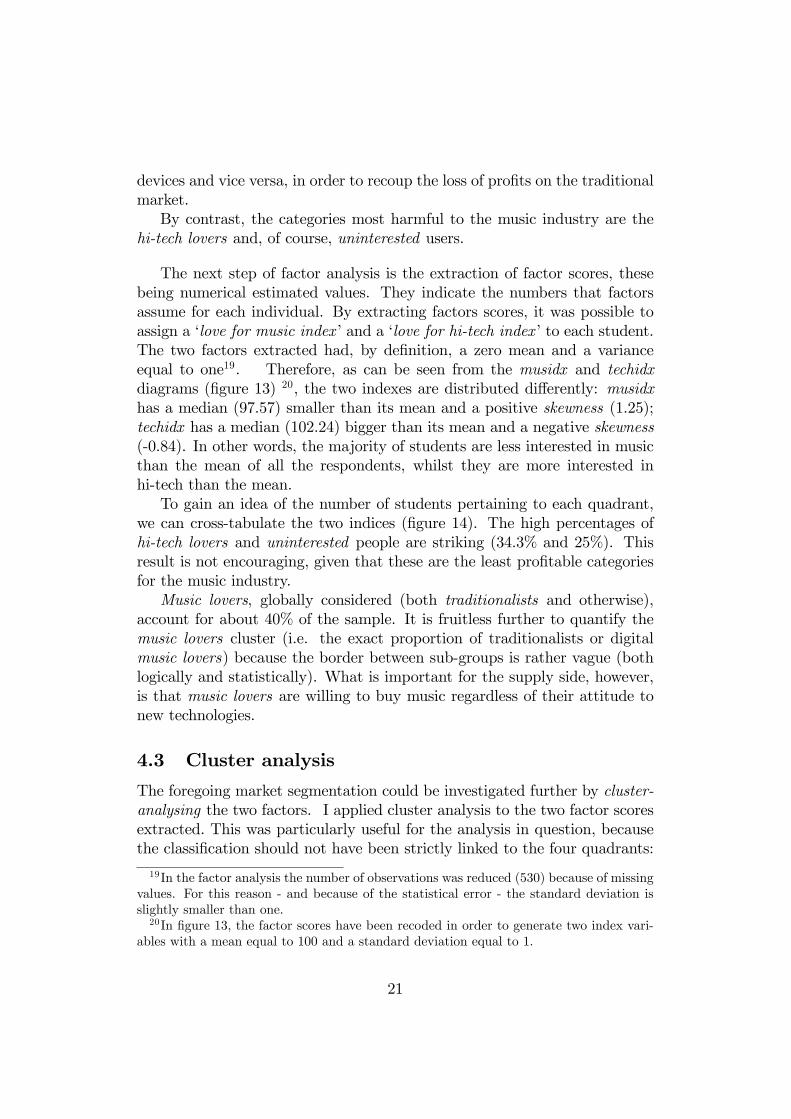
The next step of factor analysis is the extraction of factor scores, thesebeing numerical estimated values. They indicate the numbers that factorsassume for each individual. By extracting factors scores, it was possible toassign a �love for music index�and a �love for hi-tech index�to each student.The two factors extracted had, by de�nition, a zero mean and a varianceequal to one19. Therefore, as can be seen from the musidx and techidxdiagrams (�gure 13) 20, the two indexes are distributed di¤erently: musidxhas a median (97.57) smaller than its mean and a positive skewness (1.25);techidx has a median (102.24) bigger than its mean and a negative skewness(-0.84). In other words, the majority of students are less interested in musicthan the mean of all the respondents, whilst they are more interested inhi-tech than the mean.To gain an idea of the number of students pertaining to each quadrant,
we can cross-tabulate the two indices (�gure 14). The high percentages ofhi-tech lovers and uninterested people are striking (34.3% and 25%). Thisresult is not encouraging, given that these are the least pro�table categoriesfor the music industry.Music lovers, globally considered (both traditionalists and otherwise),
account for about 40% of the sample. It is fruitless further to quantify themusic lovers cluster (i.e. the exact proportion of traditionalists or digitalmusic lovers) because the border between sub-groups is rather vague (bothlogically and statistically). What is important for the supply side, however,is that music lovers are willing to buy music regardless of their attitude tonew technologies.
4.3 Cluster analysis
The foregoing market segmentation could be investigated further by cluster-analysing the two factors. I applied cluster analysis to the two factor scoresextracted. This was particularly useful for the analysis in question, becausethe classi�cation should not have been strictly linked to the four quadrants:
19In the factor analysis the number of observations was reduced (530) because of missingvalues. For this reason - and because of the statistical error - the standard deviation isslightly smaller than one.20In �gure 13, the factor scores have been recoded in order to generate two index vari-
ables with a mean equal to 100 and a standard deviation equal to 1.
21
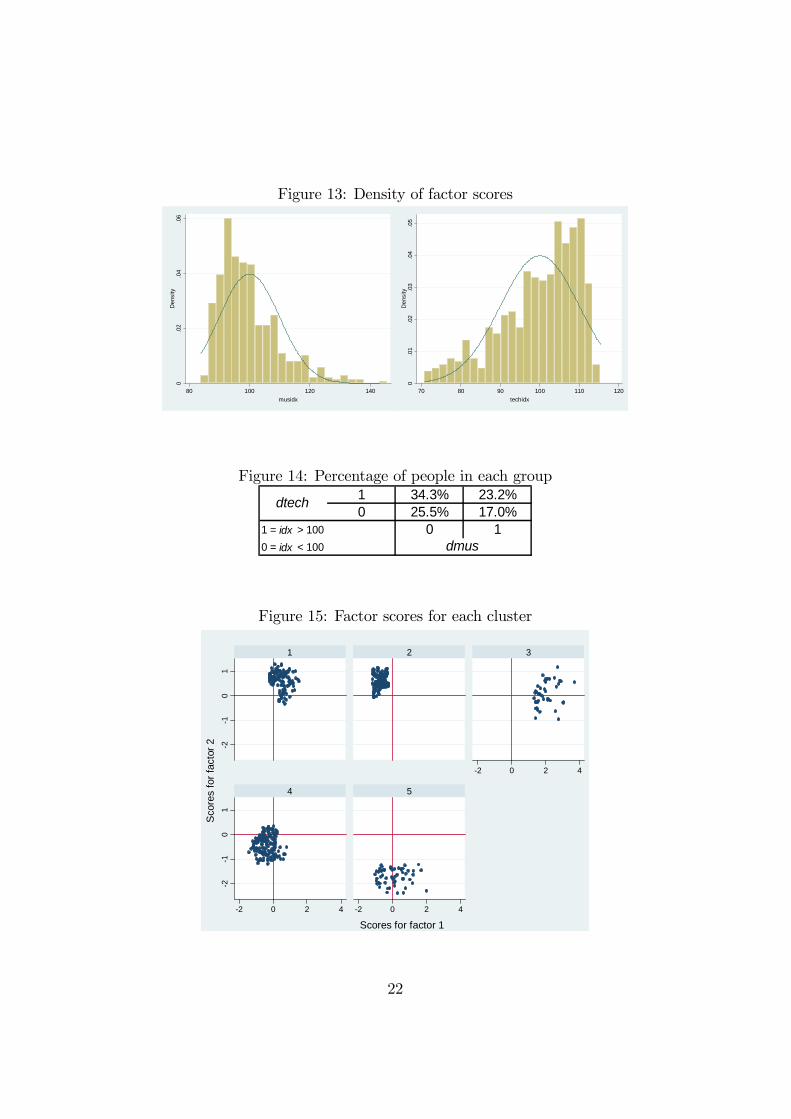
Figure 13: Density of factor scores0
.02
.04
.06
Den
sity
80 100 120 140musidx
0.0
1.0
2.0
3.0
4.0
5D
ensi
ty
70 80 90 100 110 120techidx
Figure 14: Percentage of people in each group1 34.3% 23.2%0 25.5% 17.0%
0 1
dtech
dmus1 = idx > 1000 = idx < 100
Figure 15: Factor scores for each cluster
21
01
21
01
2 0 2 4
2 0 2 4 2 0 2 4
1 2 3
4 5
Sco
res
for f
acto
r 2
Scores for factor 1Graphs by cl1
22

21
01
2S
core
s fo
r fac
tor 2
2 0 2 4Scores for factor 1
i.e. music lovers, as already said, were dispersed between the N-E and the S-E quadrants, across the borderline. On using cluster analysis it is possible togroup subjects according to their relative proximity (in terms of Euclideandistance or smaller variability), without being restricted to the Cartesianquadrants.There are several clustering techniques in statistics based on di¤erent
functions of distance (or similarity) among observations21. The analysisseemed to be robust: the same result was obtained using three hierarchicalclustering methods (Ward�s method, simple linkage method and centroidmethod). Unlike the other measures, Ward�s method is not based on Euc-lidean distances. Following Ward�s criterion one should cluster the observa-tions according to the minimum variance within groups and the maximumvariance between groups22. In regard to the wardslinkage dendrogram, it was
21Clustering techniques can be divided into two basic types: hierarchical and partitional.Within each type there are many subtypes and di¤erent algorithms for clustering obser-vations. Hierarchical clustering proceeds successively by either merging smaller clustersinto larger ones or splitting larger clusters. Partitional clustering, on the other hand, at-tempts to decompose the dataset directly into a set of predetermined clusters. Typically,the global criteria involve minimizing some measure of dissimilarity in the samples withineach cluster, while maximizing the dissimilarity of di¤erent clusters.22The single linkage method de�nes the distance between any two clusters as the min-
imum distance between them, i.e. the distance between the two closest points betweentwo clusters. Centroid linkage uses the Euclidean distance between the centroids (centralpoints of a cluster which minimizes the distance between the observations) of the two
23

Figure 16: Dendrogram of cluster analysis
010
020
030
040
050
0L2
squa
red
diss
imila
rity
mea
sure
G1 G2 G3 G4 G5 G6 G7 G8 G9 G10G11G12G13G14G15G16G17G18G19G20
Dendrogram for _cl_1 cluster analysis
appropriate to select �ve clusters characterized by strong similarity amongobservations within each cluster (�gure 16). The soundness of this choicewas proved by the Calisnsky/Harabasz selection rule, a default procedure inSTATA software23.The selection of �ve distinct clusters con�rmed the hypothesis about the
music lovers group: this cluster should be divided in two sub-groups (�gure15). The clusters for digital music lovers (graph 1), hi-tech lovers (graph 2),and uninterested people (graph 4) are evident in the diagram. The musiclovers cluster is instead more dispersed. Two distinct sub-clusters are visiblein the representation (graphs 3 and 5). This evidence demonstrates thatthere exists a sub-group of music lovers who are substantially indi¤erent tonew technologies. In fact, a bunch of observations are dispersed around theX-axis (which means a null impact of the hi-tech factor, graph 3).Music lovers averse to new technologies (hi-tech haters) and less inter-
ested in music form a distinct cluster (graph 5). The music lovers group ishighly heterogeneous and cannot be considered an autonomous cluster.In conclusion, on using Ward�s cluster analysis, the music lovers cluster
clusters. Ward�s method is distinct from other methods in that it uses an analysis of vari-ance approach to evaluate the distances between clusters. In short, this method attemptsto minimize the Sum of Squares of any two clusters that can be formed at each step.This requires de�ning an objective function which decomposes the total variance (T ) inthe between variance and the within variance: T = W + B. Next, the observations thatminimize the increase in the W variance and maximize the B variance are clustered.23Following this rule, the number of clusters corresponding to the largest value for the
pseudo-F index has to be chosen. This condition was veri�ed for �ve clusters (number ofclusters - pseudo-F : 2 - 235; 3 - 319; 4 - 335; 5 - 415; 6 - 389; 7 - 382; 8 - 386).
24
splits into one sub-group of music lovers (indi¤erent to new technologies)and one of hi-tech haters (indi¤erent to music consumption).
5 Econometrics and results (part III)
Descriptive statistics are useful to gain an idea of the relationships betweenvariables. To this end, I computed the correlation matrix (�gure 16). Somevariables could be considered as endogenous: the number of MP3 albums,CDs or live concerts, the willingness to pay. Other variables were Musicuseand mp3value. The former concerned the choice of downloading music frompeer-to-peer rather than from legal sites. The latter indicated the valueattributed to a self-made compilation of MP3 tracks compared to a originalCD album.The following econometric estimates cannot be considered as part of a
structural econometric model. Nevertheless, they are very useful for un-derstanding the students/consumers�behaviour and the determinants of thedemand for music. Although such estimates cannot prove causalities betweenvariables, it is evident that the explanatory variables chosen logically �pre-cede�the dependent ones24.Some stylized facts are worth noting. Firstly, as to be expected, the music
index is positively correlated with the number of CDs purchased and pos-sessed. Instead, its correlation with the number of MP3s is not signi�cant(while coe¢ cients signs are even negative, see �gure 16). The contrary is thecase when techidx is considered. This second index is strongly positively cor-related with the number of MP3s in the respondent�s collection. This �ndingsuggests that music lovers are not willing to substitute the MP3 format withthe traditional one. music lovers are not stimulated to download a largeamount of music �les (or, being a music lover is not the main explanationfor music downloading). Conversely, hi-tech lovers download the most, evenif they are not very interested in music.Some useful considerations arise from analysis of the willingness to pay
(WTP), both for CDs and MP3s. Both WTP coe¢ cients are negative fortechidx : hence being very interested in new technologies thwarts music pur-chases in either traditional or new digital formats. hi-tech lovers - or, moregenerally, everyday users of PCs and the internet �probably consider MP3to be a cheap format, for which it is not even necessary to pay.music lovers are instead more willing to pay for CD albums. The MP3
WTP coe¢ cient is not signi�cant (or statistically equal to zero) for music
24It is obviously likely that gender or family education have an impact on music con-sumption, rather than the contrary.
25

Figure 17: Correlation matrixVariable Description musidx techidx
live_num Live Concerts 0.505 0.183cd_num CD al. possessed 0.405 0.038cd_year CD al. purchased 0.477 0.041mp3_num MP3 files possessed 0.003 0.524mp3_year MP3 al. downloaded 0.041 0.482cdwtp CD WTP 0.207 0.130mp3wtp MP3 WTP 0.012 0.093mp3value MP3 compilation value 0.169 0.149musicuse P2P use 0.200 0.235
Highlighted var. = signif. 5%
lovers.The MP3 value coe¢ cients �negative for musidx and positive for techidx
�highlight the music lovers�propensity for the traditional format and the hi-tech lovers�propensity for the new digital format. Moreover, this latter groupshows a tendency to engage in piracy, as the musicuse coe¢ cient (use of P2P)demonstrates. music lovers usually buy music from legal websites, while hi-tech lovers share digital contents. They can do so with little e¤ort and theyare relatively unconcerned about PC worms, spywares and corrupted �les.The coe¢ cients of musidx and techidx are both positive and signi�cant
if evaluated for the live concerts variable. Obviously, concert attendance ispositively correlated with a high interest in music. Less obvious is that itis positively in�uenced by techidx as well. Yet this result is in line witha well-known theoretical hypothesis: even though a substitution betweenformats (CD and MP3) exists, the widespread di¤usion of music and the largeavailability of digital contents may generate a complementarity e¤ect, to theadvantage of some other branches of the music industry. This is apparentlytrue for the concerts market, which has been constantly developing in recentyears.In fact, the spread of an artist�s work through the Internet may increase
his/her popularity. Thereafter, consumers may be stimulated to go to a liveconcert by that artist. This possibility �of entering the market for live shows- should be exploited more by the music industry in order to recoup its lossof pro�ts in the records market.Finally considered is the musicuse variable related to the use of illegal
�le sharing. The two factors are both signi�cant, but their coe¢ cients haveopposite signs. The coe¢ cient of the hi-tech factor is positive, so that it
26
stimulates the illegal downloading of music, whilst the musidx sign is negat-ive. This means that a high interest in music is not the main cause of thewidespread phenomenon of P2P, which is instead probably due to the loveof hi-tech.A clear prescription for the music industry is that if it is to continue to
earn pro�ts in a digital-piracy reality, it must focus on music lovers. Thehi-tech lovers class should instead be treated with caution: the di¤usionand promotion of new digital technologies should be accompanied with ap-propriate cultural policies which induce consumers to buy music legally, byassociating their interest in music with hi-tech devices. Otherwise there is arisk of favouring a group whose only interest is piracy and computer hacking.
The �ndings based on the correlation matrix can be deepened in light ofthose obtained from an econometric inferential analysis.There were several ordered dependent variables in the dataset. Hence,
in such a case of categorical �and ordered �outcomes, the data could beappropriately �tted with a ordered probit (or logit) model 25.In the �rst model only the dependent variable was binary (and not cat-
egorical), so that a standard probit technique was used.In the ordered probit (which represent a generalization of the binary probit
model) an unobservable latent variable y�i is imaginable as a function of a setof independent variables Xi with i = 1; 2; :::; N .
y�i = X0i� + "i
yi = j if kj�1 < y�i � kj
The probability that the observable variable yi will assume a certain valuej is determined by the probability that the latent variable is comprised withintwo threshold values k26.25The main di¤erence between ordered probit and logit models resides in the error term
distribution. This distribution is normal for probit models (0 mean and variance equalto 1) while it is a logistic distribution function for logit models (0 and variance equal to3=2�). Given the close similarity between normal and logistic distribution functions, thedi¤erences in results are often minimal. This was the case of the analysis reported here.For this reason and for a better comparability between tables, the probit model was usedfor the analysis reported in the rest of the paper.26Dependent variables outcomes range from three to �ve, so J = 3; 4; 5. For J = 2
the ordered probit model collapses into a standard probit. For example, given a three-outcomes dependent variable (0; 1; 2) we have:
yi = 0 if y�i � k1yi = 1 if k1 < y
�i � k2
yi = 2 if y�i > k2
27
These cut points k are estimated along with coe¢ cients27. Followingnormality distribution assumptions for the error terms ("i i.i.d.), it is possibleto estimate � coe¢ cients and cut points with maximum likelihood method28.As is well known, probit (or logit) estimated coe¢ cients, unlike in the OLSmodel, do not measure the actual impact of a regressor on the dependentvariable. It is therefore necessary to compute marginal e¤ects to evaluatethe contribution of each explanatory variable to the dependent one29
The marginal e¤ects of an ordered probit model are more complex thantheir binomial counterparts because an in�nitesimal change in a explanat-ory variable will change not only the probability within the current cell butalso the probability that the individual crosses the threshold into the adja-cent category. Moreover, J marginal e¤ects vectors must be computed incorrespondence to the Jcategories of the dependent variable.In all the estimates now reported, the two factors �music factor and
hi-tech factor �were used as explanatory variables because, as said, theysummarized many underlying causes of the demand for music. Moreover,CDs, MP3s and the number of live shows were considered in order to de-termine whether a complementarity or substitutability e¤ect existed.The demographic features of the respondents are unavoidable when in-
vestigating a demand function. 30, Personal (high school grade variable) andparents�education were considered. Gender and age were not used directlyas explanatory variables because they were already included in the two re-tained factors. The age variable, moreover, was not statistically signi�cantbecause the majority of the respondents were of the same age. It is thereforeomitted from all the following speci�cations.The use of two distinct willingness-to-pay variables, for a CD album or
The probabilities are respectively:
Pr(yi = 0) = Pr(X0
i� + "i � k1)Pr(yi = 1) = Pr(k1 < X
0
i� + "i � k2)Pr(yi = 1) = Pr(X
0
i� + "i > k2)
27To save space, cut points are not shown in the tables. Moreover, they have a merelystatistical - and not explanatory - role.28An implicit assumption for the ordered probit or logit models is the parallel regressions
assumption. The consistency of this hypothesis was tested in an ordered logit frameworkby using the brant test in STATA software. According to this test (results are not shown),the assumption of parallel regressions in all the estimates was accepted.29Marginal e¤ects are computed at mean, as by default in STATA software.30The price of goods was not considered in the analysis. This choice is in line with
the current empirical literature (Andersen and Frenz, 2007; Liebowitz, 2004). Price iscommonly not signi�cant in explaining the demand for music, which is substantially un-elastic.
28

a MP3 album, is useful for capturing two concurrent e¤ects: �rst an incomee¤ect (the more a uent an individual is, the more s/he is willing to pay);second a speci�c e¤ect measuring the respondents�relative preference for oneformat or another. Hence they are very useful in understanding consumerbehaviour with regard to downloading.More speci�c information about format is provided by the MP3 value
variable, which accounted for the value that subjects attached to a self-madeMP3 compilation. The higher that value (which ranges from zero to ten), thegreater the preference for a self-made compilation with respect to a originalCD album.
5.1 P2P use
Figure 18: P2P use (probit)
Variabile MFX Coeff. Signif. Std. Err.
musidx 0.083 0.342 *** 0.118techidx 0.109 0.448 *** 0.128MP3 num 0.042 0.173 ** 0.079CD year 0.046 0.190 * 0.101live num 0.015 0.063 0.086MP3 WTP 0.009 0.037 0.121CD WTP 0.026 0.106 0.114MP3 value 0.050 0.207 0.126fatheredu 0.010 0.043 0.096motheredu 0.001 0.003 0.099hschoolvote 0.002 0.009 0.007_cons 0.001 0.695Log lik. = 158.97Pseudo Rsq. = 0.144
Signif.: 1%; 5% e 10%.
Dep. Var: P2P use (P2P use = 1: file sharing; P2P use = 0: legalwebsites)
The �rst estimation model concerned the respondents� choice betweenusing peer-to-peer and buying music legally on the internet. The dependentvariable was a direct reply to the following question: �Where does the musicyou obtain from the internet mostly come from?�. The dependent variablewas binary; where value 1 meant ��le sharing�, and value 0 meant �legalonline purchase� (iTunes, Napster 2.0 etc.). On comparing �gure 17 withthe correlation matrix (�gure 16), the �rst thing one notices is that the signs
29
of musidx and techidx coe¢ cients are analogous, and both are statisticallysigni�cant (�gure 17). The �technological factor�has a positive sign (witha 11% marginal e¤ect), meaning that it induces the downloading of musicthrough P2P. The impact of the music factor is instead negative, meaningthat a greater interest in music actually stimulates the legal purchase ofmusic - by increasing the probability that the dependent variable will be zero,with a marginal e¤ect of 8.3%. Hence the e¤ect of the music factor almosto¤sets? the negative impact of the hi-tech factor. This causes a reductionof losses for the music industry. As to be expected, P2P use is positivelyin�uenced by the possession of a large amount of MP3 music �les, and it isnegatively linked with the number of CDs bought in the reference period.CD year coe¢ cient partly re�ects also the e¤ect of a greater willingness topay (i.e. those who buy more CDs are those who are more willing to payfor them). This �disposable income e¤ect�is in fact not directly captured byWTP variables.Analogously, the demographic factor, summarized by parents�education
and high school grade, is not statistically signi�cant.It is remarkable that the largest part of the total variability depends on
the two generated factors (musidx and techidx), which represent the mostimportant variables in explaining P2P use.
5.2 Demand for live shows
In order to investigate the demand for live concerts, the two indices (mu-sidx and techidx) were again were as explanatory variables. Also consideredwere substitute goods, such as CDs bought and MP3s downloaded in thereference period. The dependent variable was categorical and ordered (liveconcert attendance: �no concerts�, �one�, �two or three�, �more than threeconcerts�), so that a ordered probit technique was used. There were fourvectors of marginal e¤ects coe¢ cients, corresponding to the four outcomes ofthe dependent variable. The most interesting of these vectors was indubit-ably the one corresponding to the �no concerts�outcome (MFX 0), becauseit indicated the probability of not having gone to any live concert during thereference year. This therefore yields insights into why people decide not toattend live concerts.The Music factor and the hi-tech factor are again signi�cant and their
signs are both positive (�gure 18). The positive sign of musidx is straightfor-ward. The fact that also the technological factor impacts positively is insteadmore surprising. This important result means that the market for live showsis not a substitute but a complement for that of records. The greater avail-ability of music (legal or otherwise) made possible by the internet actually
30
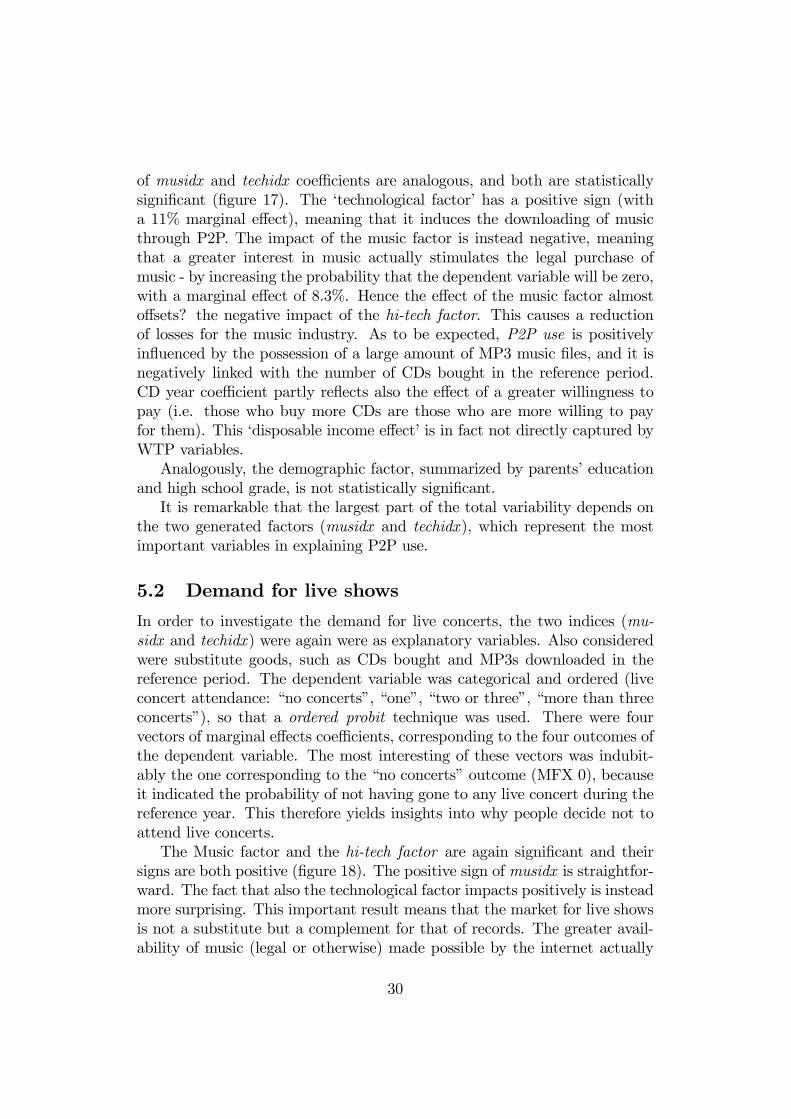
Figure 19: Live concerts attendance (ordered probit)Variabile MFX 0 MFX 1 MFX 2 MFX 3 Coeff. Signif. Std. Err.
musidx 0.313 0.041 0.184 0.088 0.803 *** 0.091techidx 0.079 0.010 0.046 0.022 0.201 ** 0.093MP3 WTP 0.011 0.001 0.006 0.003 0.028 0.093CD WTP 0.020 0.003 0.012 0.006 0.052 0.083MP3 value 0.041 0.005 0.024 0.012 0.106 0.089MP3 num 0.051 0.007 0.030 0.014 0.130 ** 0.058MP3 year 0.054 0.007 0.031 0.015 0.137 ** 0.061CD num 0.061 0.008 0.036 0.017 0.155 ** 0.075CD year 0.064 0.008 0.038 0.018 0.165 * 0.088fatheredu 0.058 0.008 0.034 0.016 0.148 ** 0.067motheredu 0.011 0.001 0.006 0.003 0.028 0.068hschoolvote 0.008 0.001 0.005 0.002 0.020 *** 0.005Log lik. = 395.767Pseudo Rsq. = 0.172
Signif.= 1%, 5% e 10%
MFX 0, 1, 2, 3 = Marginal Effects for the following outcomes: "No concerts", "1 concert", "2 or 3 concerts", "Morethan 3 concerts"
Dep. Var.: Live concerts attended in the reference year (paylive )
stimulates live concert attendance. For this reason, the live music market isnow the most pro�table one. Not coincidentally, CD num and MP3 num arepositively correlated with the dependent variable: the larger the amount ofmusic that people own, the more live concerts they attend.Interestingly, the CD year coe¢ cient (measuring the number of CDs
bought in the reference period) is instead negative. This means that thecomplementarity e¤ect does not operate in this case, and that a substitu-tion e¤ect prevails. In fact, given that people set aside a predetermined partof their income for music consumption, those who buy more CDs can a¤ordfewer tickets for live concerts. In other words, they must respect their budgetconstraint, their interest in music remaining equal?.However, this does not occur in the case of MP3 year. MP3 �les are an
inexpensive way to listen to music, and they do not signi�cantly in�uencethe disposable income of individuals. Hence they can increase live concertattendance (through the promotional e¤ect) without reducing disposable in-come to a major extent. The fact that the dependent variable was limitedto the number of concerts which are not free (paylive) makes this result evenmore robust.Accordingly, the WTP MP3 sign is positive, whilst the WTP CD sign is
negative, although neither is statistically signi�cant.The demographic characteristics of the respondents are important in ex-
31
plaining live concert attendance. The educations of both the students andtheir parents - as measures of cultural level - are positive. This is in line withthe well-known �nding that younger and well educated individuals are mostinterested in music. Father education can also be considered a proxy for astudent�s disposable income.Going into further details (�gure 18), a higher music index reduces the
probability of not attending concerts at all (MFX 0) by 30%, and increasesthe probability of going to two or three concerts (MFX2) by 18.4%. techidxhas lower MFX coe¢ cients of the same signs (it reduces the former probab-ility by 7.9%, while it increases the latter by 4.6%).
5.3 Willingness to pay
Willingness to pay for a CD album is strongly correlated with the willingnessto pay for a MP3 album. This is to be expected because MP3 WTP, as anexplanatory variable, partly accounts for a greater willingness to pay (ordisposable income) independently of the music support. In fact, MP3 WTPwould be negatively correlated with CD WTP only if there were a decidedpreference for a speci�c format; otherwise, a �disposable income e¤ect�wouldprevail, justifying the positive relationship between the two WTPs. TheMP3 WTP coe¢ cient is strongly signi�cant. This is due to the fact that itprobably includes the e¤ect of the demographic factor as well. Surprisingly,demographics are not signi�cant.The numbers of CDs purchased and possessed are obviously positively
correlated with CD WTP.The two factors are both signi�cant. As expected, the sign of musidx is
positive: a greater interest in music makes people more willing to pay fora CD album. The hi-tech factor sign is instead negative: hi-tech lovers areless willing to pay for a CD album. This result is stronger if one looks at thecorrelation matrix (�gure 16). In that �gure the sign of techidx is negativefor MP3 WTP as well. Hence hi-tech lovers are less willing to pay for musicin general, regardless of its format. Contributing to this are the variablesincluded within the hi-tech factor, such as the tendency to photocopy, orgender31.The dependent variable was recoded to gain better understanding of the
meaning of the marginal e¤ects vectors: �less than 10 euros�, �from 10 to20 euros�, �more than 20 euros�. This produced three outcomes which areeasily comparable with the market price for albums. Given that the average
31Hi-tech lovers were mostly males; whilst females showed a higher willingness to pay.
32

Figure 20: Willingness to pay for a CD album (ordered probit)Variable MFX 1 MFX 2 MFX 3 Coeff. Signif. Std. Err.
musidx 0.065 0.043 0.022 0.162 * 0.095techidx 0.075 0.050 0.025 0.188 ** 0.081MP3 WTP 0.227 0.151 0.076 0.570 *** 0.089MP3 value 0.001 0.000 0.000 0.001 0.027paylive 0.008 0.006 0.003 0.021 0.072CD num 0.053 0.035 0.018 0.133 * 0.075CD year 0.078 0.052 0.026 0.196 ** 0.087fatheredu 0.019 0.012 0.006 0.047 0.069motheredu 0.026 0.017 0.009 0.066 0.071hschoolvote 0.002 0.001 0.001 0.004 0.005studtype 0.028 0.019 0.010 0.071 0.076Log lik. = 316.219Pseudo Rsq. = 0.119Dep. Var.: Willingness to pay for an original CD album (CD WTP )MFX 1, 2, 3 = Marginal Effects for the following outcomes: "Less than 10 euros", "From 10 to 20euros", "More than 20 euros"Signif.= 1%, 5% e 10%
price of a musical album ranges from 10 to 20 euros32, one can read the �rstoutcome (MFX 1) as the willingness to pay a price which is lower than theactual market price, and the third outcome (MFX 3) as the willingness topay a higher price. The signs of MFX 1 vector are clearly opposite to those ofthe coe¢ cients vector (�gure 19): a high level of interest in hi-tech increasesby 7.5% the probability of being willing to pay a price lower than the marketprice (almost o¤set by the opposite 6.5% e¤ect of musidx). A higher genericwillingness to pay (summarized by MP3 WTP) reduces this probability by22%. MFX 3 signs are obviously reversed and their magnitudes are lower.For example, an high level of interest in music increases the probability ofbeing willing to pay more than the market price by 2.2%.
5.4 Demand for music albums
The last set of estimates concerned the number of original CD albums boughtand the number of MP3 albums downloaded in the reference period.The estimates were carried out using the usual ordered probit technique in
order to take account of the dependent variable categorization (�No album�,
32Today�s market price may be lower due to continuous discount campaigns by the musicindustry.
33
�from 1 to 5 albums�, �from 5 to 10 albums�, �more than 10 albums�)33.The set of explanatory variables was the same for the two equations. To be
noted is that, for the demand for CD albums, musidx is positive while techidxis not signi�cant. The reverse is the case when considering the demand forMP3 albums (techidx is positive, musidx not signi�cant). This is in line withthe foregoing analysis: people who download a large amount of MP3 �les doso because of their interest in hi-tech rather than in music. The willingness-to-pay variable (which is not signi�cant) is another explanation not relevantto music downloading. The opposite is the case when considering the demandfor CD albums, in which love for music and willingness to pay are important.As obvious, the propensity to share illegal contents (P2P use) increases
the probability of downloading, while it reduces the probability of buyingoriginal CD albums.�Stock variables�, such as the number of CDs or MP3s that people have
in their collections, are signi�cant in explaining ��ow variables�(such as thenumber of new CDs or MP3s acquired), with a strong positive correlation.The e¤ect of paylive variable is in line with previous results. Once again it
is positively correlated with the demand for MP3 albums (complementarity)and negatively with the demand for CDs (substitutability).The demographic factor is signi�cant in explaining the demand for MP3s,
but not the demand for CDs. High school grade and father�s education bothdiscourage the downloading of MP3 �les because they are proxies for a highercultural level. A higher cultural level can be linked with a lower tendencyto engage in unlawful actions and with a higher income level. These two
33The foregoing analysis was conducted for the two demand equations separately, al-though consumer decision-making processes in regard to the purchase of CD or MP3albums may take place simultaneously. Hence, in this framework, a bivariate probit tech-nique was used on the assumption that two latent variables, whose statistical errors arecorrelated, exist jointly.In bivariate probit two latent variables are analysed together:
y�1 = X0
1�1 + "1y�2 = X
0
2�2 + "2
The statistical errors "1 and "2 (i.i.d.) are normally distributed, and they have a correlation� 6= 0. If � = 0, one returns to two separate and independent probit equations.No di¤erent results were obtained using this technique. So results are not shown. This
was due to a weak correlation between the two equations. In fact, the correlation index wasstatistically equal to zero: when the chi-squared test was performed, the null hypothesishad to be accepted. This result meant that it was possible to estimate the two equationsseparately because they were not signi�cantly linked to each other. In other words, theirstatistical errors were uncorrelated. In the reverse situation, in which the correlationcoe¢ cient is close to one, a bivariate probit technique is necessary.
34
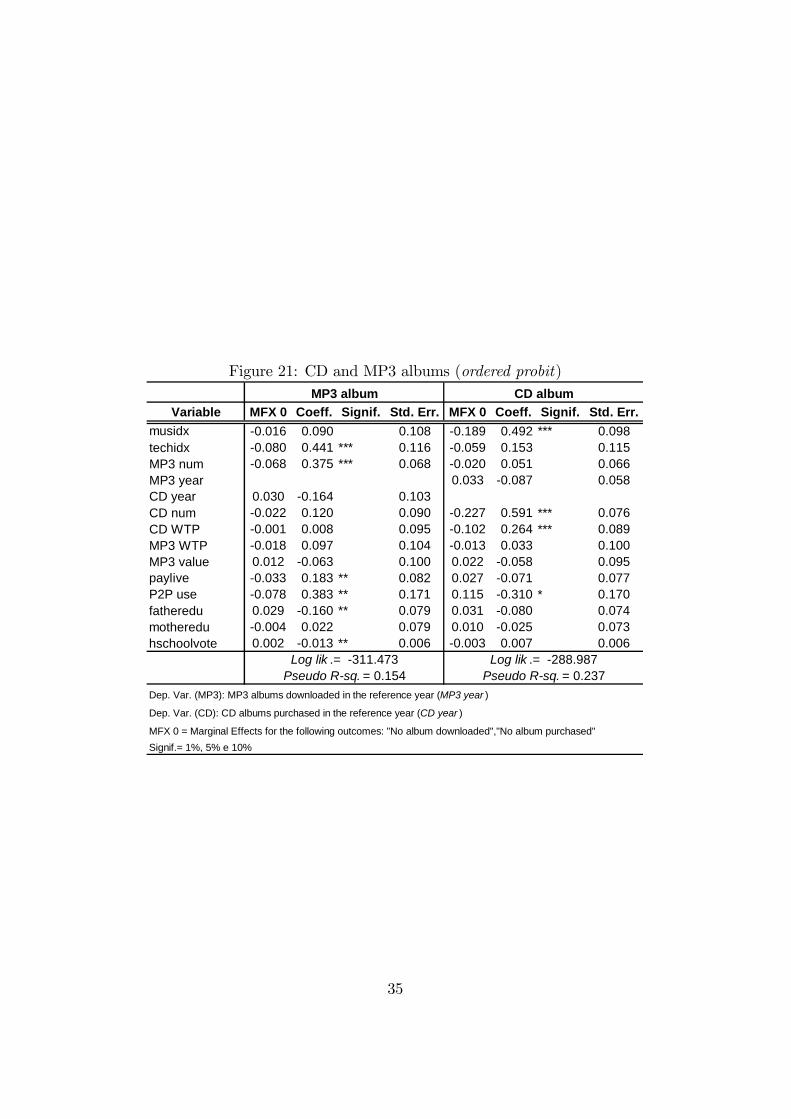
Figure 21: CD and MP3 albums (ordered probit)
Variable MFX 0 Coeff. Signif. Std. Err. MFX 0 Coeff. Signif. Std. Err.musidx 0.016 0.090 0.108 0.189 0.492 *** 0.098techidx 0.080 0.441 *** 0.116 0.059 0.153 0.115MP3 num 0.068 0.375 *** 0.068 0.020 0.051 0.066MP3 year 0.033 0.087 0.058CD year 0.030 0.164 0.103CD num 0.022 0.120 0.090 0.227 0.591 *** 0.076CD WTP 0.001 0.008 0.095 0.102 0.264 *** 0.089MP3 WTP 0.018 0.097 0.104 0.013 0.033 0.100MP3 value 0.012 0.063 0.100 0.022 0.058 0.095paylive 0.033 0.183 ** 0.082 0.027 0.071 0.077P2P use 0.078 0.383 ** 0.171 0.115 0.310 * 0.170fatheredu 0.029 0.160 ** 0.079 0.031 0.080 0.074motheredu 0.004 0.022 0.079 0.010 0.025 0.073hschoolvote 0.002 0.013 ** 0.006 0.003 0.007 0.006
Signif.= 1%, 5% e 10%
Log lik .= 288.987
MP3 album CD album
Dep. Var. (MP3): MP3 albums downloaded in the reference year (MP3 year )
MFX 0 = Marginal Effects for the following outcomes: "No album downloaded","No album purchased"
Pseudo Rsq. = 0.237Log lik .= 311.473
Pseudo Rsq. = 0.154
Dep. Var. (CD): CD albums purchased in the reference year (CD year )
35
characteristics may discourage illegal �le sharing in favour of legal purchases.This result is only evident in the demand for MP3.
6 Conclusions
Some interesting results emerge from the analysis. Firstly, the preferenceof the students for the new digital format and new technologies is evident.In this regard, the sample used is biased: it is only to be expected thatyoung students will be interested (more than the mean of entire population)in both music and hi-tech. It is not easy to understand the reasons for theconsumption of digital music owing to the interaction among many concur-rent variables. The analysis has shed light on this articulated context bysummarizing the large number of variables into two common factors. Thesetwo most important factors are the love for music and the love for hi-tech34. By intersecting these two factors it was possible to divide the studentsinto four groups. As is well known, market segmentation is very useful forthe supply side, for marketing strategies, promotion, and so on.After the students had been clustered, inferential statistics were used to
investigate the relationships between variables and to understand the de-terminants of the demand for recorded music and live shows. A fundamentalresult is that the two factors are always signi�cant in explaining endogenousvariables. Hence the attitude of consumers attitude to music and hi-techmatters more than demographics, disposable income or displacement e¤ects.Some clear managerial implications arise from the analysis. Not all of the
following are directly tested in the analysis, but they come out deductivelyfrom the discussion. However, given that the latter was essentially descript-ive, such implications must be treated with caution as simple rules-of-thumb.Nevertheless, they shed useful light on the complex reality of the digital musicmarket.
1. It is possible to cluster students into four categories on the basis oftheir attitudes to music and new technologies.
2. Digital music lovers constitute the most pro�table cluster for the musicindustry. hi-tech lovers and disinterested people are the most harmful.
34The demographic factor was not particularly relevant in the sample. Firstly becauseof age, which was almost the same for all the respondents. Secondly because income is nota reliable predictor of the demand for music �as is known from the economic literature �because the share of income that people devote to music consumption is rather low. Hencedi¤erences in income are not re�ected in the demand for music.
36

3. New technology di¤usion may have a promotional e¤ect within the mu-sic market (globally considered) by increasing live concert attendance.
4. New technologies may make some consumers �shift�from the uninter-ested users cluster to the hi-tech lovers or digital music lovers ones,indirectly bringing them closer to music consumption.
5. The music industry should cultivate music lovers-traditionalists bymaintaining a high quality market segment and not abandoning tra-ditional formats (hi-�s, vinyl discs etc.)
6. A high level of interest in music induces consumers to buy music legally,whilst an interest in hi-tech (if not accompanied with an interest in mu-sic) may induce them to share copyrighted contents and to accumulatea large amount of MP3 �les.
7. Investing in people�s interest in music (and fostering their enjoymentof it) may induce them to buy music legally.
8. There is no evidence in the recorded music market of a strong dis-placement e¤ect between CDs and MP3s. The extraordinary di¤usionof musical contents, independently of their format, has a promotionale¤ect on live concert attendance (complementarity).
New digital technologies may be harmful for the music industry withinonly one speci�c group of people: hi-tech lovers who are not particularlyinterested in music. These tend to download a great deal, especially byillegally sharing �les, and to accumulate numerous MP3 �les. hi-tech loversare also less willing to pay for musical contents, independently of their format.These results do not hold for �pure�music lovers, who are more willing to
pay than other categories. Moreover, new technologies have a promotionale¤ect for music lovers.New technologies may have the same promotional e¤ect for hi-tech lovers
as well, by increasing their attendance at live concerts. This result is ex-tremely important, given that, in the absence of musical digital technologies,many hi-tech lovers would probably be uninterested users. One should there-fore look at digital technologies from a �dynamic�point of view: people whoare now hi-tech lovers were probably uninterested yesterday. And probablymany hi-tech lovers of today will be digital music lovers tomorrow. Indeed,thanks to the �addiction e¤ect�- generated by the di¤usion of musical con-tents on the internet - some of them may �shift�to the pro�table digital musiclovers cluster. In this way the music industry should extract value from newtechnologies.
37

Further empirical and theoretical inquiry should take account of the mar-ket segmentation proposed here, because the feared displacement e¤ect �ifit exists �can occur only within the digital music lovers cluster. New tech-nologies, in fact, impact neither on uninterested users nor on traditionalists.The former do not buy music anyway, while the latter like to possess originalalbums, regardless of the availability of copies. It should be borne in mind,however, that the market segmentation proposed is only valid if there are norelevant network e¤ects, or communication between groups is scarce. Other-wise, if people can move easily from one class to another, the segmentationbecomes tenuous, and so do the policy implications that derive from it. 35.This consideration partly proves the e¤ectiveness of current Italian copyrightlaw, which does not punish the private use (fair use) of a copyrighted content.Whilst focusing on new technologies �which can be exploited in order to
drive music sales �the music industry should not forget music lovers. Thisgroup of users shows a strong preference for high quality legal music. musiclovers-traditionalists are not a¤ected by the availability of copies: they areevidently non-pirates. Traditional media, specialized stores and magazinesare still requested by music lovers. Hence, even if the new technologies arepro�table, the music industry should take care not to forget the traditionalmodes of producing and distributing music. Otherwise the risk is that ofgenerating many �uninterested hi-tech lovers�whose only interest is computerhacking.
35Consider a digital music lover with a hi-tech lover friend. It may happen that theformer listens to the music that his friend has downloaded without paying for it. Thisbehaviour is extremely ine¢ cient for the music industry.
38

References
[1] ANDERSEN B., FRENZ M. (2007), �The Impact of Music Downloadand P2P File-Sharing on the Purchase of Music: A Study for IndustryCanada�Birbeck, University of London Working Paper, April
[2] BHATTACHARJEE et al. (2005) �The E¤ect of P2P File Sharing onMusic Markets: A Survival Analysis of Albums on Ranking Charts�NETInstitue Working Paper, No 05-26
[3] FABBRIS L. (1997), Statistica multivariata. Analisi esplorativa dei dati- Milano : Mcgraw-hill italia.
[4] FAVARO D., FRATESCHI C. (2005), A Discrete Choice Model of Con-sumption of Cultural Goods in Italy: the Case of Music, Marco Fannoworking paper, n.10.
[5] HUI K.L., PNG I.P.L. (2003), �Piracy and the demand for legitimate re-corded music�, Contributions to Economic Policy and Analysis. Volume2(1)
[6] IFPI (2007), Digital Music Report
[7] ISTAT (1999), La Musica in Italia, Il Mulino, Bologna
[8] LIEBOWITZ S.J. (2003), �Will MP3 downloads Annihilate the Re-cord Industry? The Evidence so Far�in: G. Libecap (ed.), Advancesin the Study of Entrepreneurship, Innovation, and Economic Growth,JAI Press.42
[9] LIEBOWITZ S.J. (2004), �Pitfalls in Measuring the Impact of File shar-ing�CESifo Working Paper, vol. 51, 23, 439-477
[10] OBERHOLZER F., STRUMPF K. (2007), �The E¤ect of File sharingon Record Sales: an Empirical Analysis�, Journal of Political Economy,2007 - UChicago Press
[11] PEITZ M., WAELBROECK P. (2006), �Piracy of Digital Products: ACritical Review of the Theoretical Literature�, Working paper 42/2006(International University in Germany, School of Business Administra-tion)
[12] REGNER, T. and BARRIA, J. A.(2005), �Magnatune -Variable Pricing for Music� (March). Available at SSRN:http://ssrn.com/abstract=721596
39
[13] ROB R., WALDFOGEL J. (2006), Piracy on the high C�s: Music down-loading, sales displacement, and social welfare in a sample of collegestudents, Journal of Law and Economics, vol. XLIX.
[14] STATA Manual (2003) - College Station (TX): Stata Corporation.
[15] STEVANS L., SESSIONS D. (2006), An Empirical Investigation into theE¤ect of Music Downloading on the Consumer Expenditure of RecordedMusic: A Time Series Approach working paper.
[16] ZENTNER A., (2006), �Measuring the E¤ect of Music Downloads onMusic Purchases�, Journal of Law and Economics, vol. XLIX
40