Virginia Is For Lovers, Not Missing White Voters
100
The Myth of the Missing White Voters: Virginia Is For Lovers, Not Missing White Voters February 3, 2014 By Steven M. Kamp 1 Did Mitt Romney lose because white voters stayed home? Not in Virginia, even though the rightwing psepho- commentariat thinks so now that Real Clear Politics Senior Elections Analyst Sean Trende has created The Missing White Voter Theory 2 . The Theory has spawned a debate that even became a cover story in The Week. 3 Trouble is, the Theory is 1 Sacramento attorney Steven M. Kamp, a graduate of Yale Law School (1981) and the University of California at Los Angeles (1978), and a veteran of Democratic campaigns in multiple states back to 1972, is nearing completion of The New Democratic Majority, a book analyzing American voting patterns between 1788 and 2012 for President, Congress, Governors, state downballot offices, state legislatures and ballot propositions. Mr. Kamp can be reached at [email protected] Mr. Kamp has written the California election law manual for the California Democratic Party since 1988 and similar manuals for Nevada and Kentucky in 2008-2012. The author thanks Jack Young, Patrick Reddy, Scott Rafferty, Harold Kwalwasser, and James Shoch for their editorial assistance. Maps and election return data used with permission of David Leip and the U.S. Election Atlas website, "Dave Leip's Atlas of U.S. Presidential Elections" http://uselectionatlas.org 2 Mr. Trende was sent an essentially identical version of this article by read-receipt electronic mail message on October 1, 2013, but as of December 6, 2013, has not responded. 3 July 26, 2013, page 16, “Talking Points -- Immigration: Can the GOP win as the White Party?”, and front cover. 1
-
Upload
independent -
Category
Documents
-
view
3 -
download
0
Transcript of Virginia Is For Lovers, Not Missing White Voters

The Myth of the Missing White Voters:
Virginia Is For Lovers, Not Missing White Voters
February 3, 2014
By Steven M. Kamp1
Did Mitt Romney lose because white voters stayed home?
Not in Virginia, even though the rightwing psepho-
commentariat thinks so now that Real Clear Politics Senior
Elections Analyst Sean Trende has created The Missing White
Voter Theory2. The Theory has spawned a debate that even
became a cover story in The Week.3 Trouble is, the Theory is
1 Sacramento attorney Steven M. Kamp, a graduate of Yale Law School (1981) and the University of California at Los Angeles (1978), and a veteran of Democratic campaigns in multiple states back to 1972, is nearing completion of The New Democratic Majority, a book analyzing American voting patterns between 1788 and 2012 for President, Congress, Governors, state downballot offices, state legislatures and ballot propositions. Mr. Kamp can be reached at [email protected]
Mr. Kamp has written the California election law manual for the California Democratic Party since 1988 and similar manuals for Nevada and Kentucky in 2008-2012.
The author thanks Jack Young, Patrick Reddy, Scott Rafferty, Harold Kwalwasser, and James Shoch for their editorial assistance.
Maps and election return data used with permission of David Leip and theU.S. Election Atlas website, "Dave Leip's Atlas of U.S. Presidential Elections"http://uselectionatlas.org
2 Mr. Trende was sent an essentially identical version of this article by read-receipt electronic mail message on October 1, 2013, but as of December 6, 2013, has not responded. 3 July 26, 2013, page 16, “Talking Points -- Immigration: Can the GOP win as the White Party?”, and front cover.
1

not based on actual registered voters and actual voting, but
rather on a Census estimate that has both overestimated and
underestimated actual registration and voting, both
nationally and in both Ohio and Virginia, two 2004-2012
swing states essential to Republican White House hopes in
2016 and 2020. This author has already explained why the
Missing White Voter Theory will not flip the static-
population state of Ohio into the Republican column.4 This
article will now explain why the Missing White Voter Theory
will not flip the Dynamic Dominion5 of Virginia, no matter
how large a percentage gain the Republicans achieve in the
21 Coal Country jurisdictions of southwestern Virginia. One
reason: the 55 percent turnout rate used by Sean Trende for
registered nonvoters adds only 217,625 new actual voters in
Rural Virginia -- the 2016 Republican nominee would need a
100 percent turnout netting 68 percent of them to trump the
Obama 2012 margin of 149,298, by all of 1,062 raw votes, and
would fall short of the 2008 Obama margin of 234,527 even if
the Republican won 100 percent.
Another reason: commonwealth-wide, between 2004 and
2012 the Democratic Presidential raw vote number in Virginia
4 “The Myth of the Missing White Voters: In Ohio, Not Registered and Not Voting –While Columbus Rocks for the Democrats.”
5 Frank Atkinson, The Dynamic Dominion (George Mason University Press, Fairfax, Virginia, 1992), an excellent analysis of Virginia politics between 1945 and 1990, explaining how the once-dominant rural DemocraticHarry Byrd Machine crumbled under the simultaneous thrusts from suburbanRepublicans and liberal Democrats.
2

increased by more than five times the Republican increase,
517,078 for the Democrats versus 105,563 for the
Republicans. As a result, the margin flipped from Bush
262,217 to candidate Obama 234,527 to President Obama
149,298, an eight-year Democratic margin shift of 411,515
that exceeds any “missing white voter” number from Rural
Virginia. If these trends hold up in 2016 and 2020,
Democrats will hold the 13 electoral votes from Virginia and
add them to the 246 from the 2004 John Kerry states6 plus 6
from Iowa and 5 from New Mexico (two states that between
1992 and 2012 went Republican only in 2004, and only
barely), giving Democrats the winning 270 once the polls
close at 1900 hours Eastern Standard Time in the
commonwealth – regardless of the outcome in Florida, Ohio,
Colorado or Nevada. Thus, because The Missing White Voter
Theory does not work in Virginia, it does not matter in 2016
or 2020 unless it flips a Blue Wall state such as
Pennsylvania.7
6
? New Hampshire (4), the other ten Eastern states and D.C. (108), Michigan (16), Illinois (20), Wisconsin (10), Minnesota (10), and the four non-Alaska Pacific states (78).
7 In the next articles in this “Electoral College Junket” series, the author will analyze Pennsylvania, followed by New Hampshire, Iowa, Wisconsin, Minnesota, Michigan, New Mexico, Nevada, Colorado and Florida, then North Carolina, Georgia, Arizona, Missouri and Montana.
3

The Missing White Voter: It Started With Non-Final Ohio Returns That Did
Not Include Provisional Ballots
Two days after Election Night, Real Clear Politics Senior
Elections Analyst Sean Trende, extrapolating from non-final
Ohio numbers8, opined that Romney lost the national popular
vote because (nationwide) 6.5 million Caucasian Republican
eligible voters “stayed home,” including allegedly enough
rural 2004 or 2008 Republican voters to give Ohio to Obama.9
The Trende theory began in Ohio, and likely ends in
Virginia. Caucasian turnout may have been down, but not in
the magnitude Trende claims – and not by enough to alter the
Virginia result, and with Virginia went any Republican hopes
for the Electoral College. The “Missing White Voter” route
has become the proverbial yellow- or red-bricked road for
the rightwing commentariat and blogosphere. However, The
Missing White Voter Theory is more of a long dead end road
rather than a through street to victory for the Republicans,
because:
8 That did not include the 173,765 ultimately counted provisional ballots. Under Ohio law, absentees are counted first, followed by the machine ballots, but the counting of the provisionals does not begin until ten days after Election Day.
9 Sean Trende, Real Clear Politics, November 8, 2012, “The Case of the Missing White Voters.”
4

It is not based on actual registered voters or actual
voting, but on a post-election Census survey that in
2004, 2008 and 2012, did not come close to matching the
actual registered or voting population, nationally or
in the swing states of Ohio or Virginia.
In Virginia – a state Republicans must win in order to
regain the White House -- even using the Trende
linchpin Census survey estimates of the unregistered
and registered nonvoters, Republican cannot win except
with 100 percent turnout and a Republican percentage of
85 percent throughout the commonwealth.
In the 2004, 2008 and 2012 Presidential year elections,
between 1.2 and 1.5 million registered Virginia voters
stayed home, and it is highly unlikely that Caucasian
solidarity appeals will stimulate a sufficiently large
Republican turnout from this constituency that has
regularly registered and failed to vote.
The number of actual registered 2012 nonvoters in the 76
Rural Virginia jurisdictions is 395,683, and if
Republicans rely exclusively on this constituency,
Republicans can flip Virginia only if 100 percent turn
out and vote 68 or 80 percent Republican.
Applying the 55 percent nonvoter turnout rate used by
Trende to the 395,683 registered 2012 nonvoters in the
76 Rural Virginia jurisdictions results in a number
(217,625) that facially underperforms the Obama 2008
5

margin of 234,527, and overperforms the Obama 2012
margin of 149,298 only at a Republican percentage of 85
percent.
Of the 395,683 registered 2012 nonvoters in the 76
Rural Virginia jurisdictions, 354,458 did not vote in
the 2004 Bush election, meaning that between 2004 and 2012,
the registered nonvoter population in Rural Virginia
increased by only 41,225, less than one third of the
2012 Obama margin. In other words, 89.58 percent of the “missing”
registered nonvoters in 2012 were missing in 2004 as well.
Between 2004 and 2012, the number of registered
nonvoters in the entire commonwealth of Virginia rose
by only 237,163, which is only 2,636 above the Obama
2008 margin and trumps the 2012 margin only at 100
percent turnout that breaks 81 percent Republican. At
the 55 percent turnout rate used by Trende, only
130,439 new voters are turned out, a number that falls
short of both Obama Virginia margins.
If the reach of The Theory is expanded to the
unregistered population, the Census estimates show that
the commonwealth-wide gap between the 2012 Census-
estimated citizen-eligible population and the actual
2012 total registration is only 216,000, which cannot
defeat the 2008 Obama margin and defeats 2012 only at
100 percent turnout that breaks 85 percent Republican.
At the 55 percent turnout rate used by Trende, only
6

118,800 new voters are turned out, which falls short of
both the 2012 and 2008 Obama margins. In addition,
they have to be registered first, if they even exist
The total number of actual net lost Republican votes
between 2004 and 2012 in the 76 Rural Virginia
jurisdictions is 12,372, less than ten percent of the
2012 Obama margin of 149,298. As for the Missing White
Voters, the registered nonvoter increase in the
Southside between 2004 and 2012 was all of 176 (this is
not a misprint), 27,271 in the Shenandoah Valley, 2,014
in the Eastern Rural counties, 8,298 in Appomattox, and
3,466 in Coal Country -- adding these 41,225 simply
gives the virtual Republican 2016 ticket 53,597
“missing voters” from Rural Virginia, which leaves the
Obama 2012 margin ahead by 95,701.
Between 2004 and 2012 in Rural Virginia, Democrats
actually gained more net votes than the Republicans --
49,984 to 36,365.
The number of registered nonvoters in the 58
Metropolitan Virginia jurisdictions is much larger
(1,134,334) and in these dynamic and diverse population
areas (the University of Virginia, Northern Virginia,
Greater Richmond, and Hampton Roads), Democrats between
2004 and 2012 gained 465,334 votes, whereas Republicans
gained only a net 31,940; not surprisingly, only six of
7

58 jurisdictions have a Romney percentage of 60 percent
or higher.
Before diving deep into actual Virginia registration
and voting statistics, let’s discuss The Missing White Voter
Theory. The Missing White Voter Theory has been grasped by
Republicans to avoid facing the implications of what
actually happened in 2008 and 2012: back-to-back popular
vote and Electoral College majorities by a Democrat from a
national total vote that was 6.921 million larger than the
total vote in the 2004 reelection of President Bush the
Younger, and that flipped a net seven states and 115
electoral votes between 2004 and 2012. Moreover, the
Democratic President was reelected amid the worst Democratic
incumbent economic environment since Jimmy Carter in 1980,
the outgoing Woodrow Wilson administration in 1920, and the
second Grover Cleveland administration in 1896, with numbers
that caused two economic determinist modelers to predict
only 46 or 49 percent for Obama10, an economic determinist
electoral vote modeler to predict Romney with 33011, Almanac
10 The Professor Ray C. Fair Model in Fair, Predicting Presidential Elections (Stanford University Press, 2002), and available for 2004-2008-2012 at www.fairmodel.yale.edu, and the Professor Douglas Hibbs Bread and Peace Model, available at www.douglas-hibbs.com 11 Two University of Colorado professors who shall remain nameless, and who looked only at state-level economic data and ignored electoral history and everything else. The predicted Romney 330 included Minnesota.
8

of American Politics founder Michael Barone to intone Romney 315
because of “fundamentals” -- and don’t forget Peggy Noonan
and her vibrating Northwest D.C. yard signs. Horror of
horrors, 2008 may have been a realigning election, and 2012
a confirming election . . . for the Democrats.
President Obama’s reelection triggered a rampage of
rage on the Republican right, but the one rational response
came from Almanac of American Politics 2014 co-author Sean Trende,
whose review of non-final Ohio returns two days after the
election started him on the road to a 2013 conclusion that
6.5 million eligible Caucasian voters skipped the election.
The Missing White Voter Theory is based on the contrast
between Census estimates of eligible Non-Hispanic White
registration and turnout for 2008 and 2012 and the Census
estimate of the actual 2012 vote – based on the Census estimates
and using a 55 percent turnout rate for nonvoting eligibles.
Sean Trende did not distinguish between unregistered and
registered nonvoters; instead, he conflated and continues to
conflate the two categories.12 12 In contrast, The Emerging Republican Majority author Kevin Phillips in 1972 debunked the McGovern “youth vote” theory with a three-step sequential analysis of registration, turnout and percentage breakdown:
“Some 70 to 80 percent of the 18-24 year-olds will register. Of these, 70 to 80 per cent will actually vote. Thus, 49 per cent to 64 percent of those eligible will actually make it to the polls. Assume 60 percent (the national average) – or 15 million votes. Of these, McGovern will get 55 to 65 percent (8.25 to 9.75 million) and Richard Nixon will get 35-45 percent (5.25 to 6.75 million). By these calculations, then, the McGovern youth lead will range from 1.5 million to a very improbable 4.5 million” which Phillips predicted (correctly) would be swamped by George
9

. Mr. Trende concluded that 6.5 million eligible
Caucasian voters did not vote in 2012, and Republican
opponents of immigration reform and minority outreach13
seized upon The Theory as justification for doubling down on
the Republican obstructionism displayed in the 2013 Fiscal
Cliff and 2011 Debt Ceiling debacles. The Trende series was
(according to Trende) purposely vague on policy, but
appeared to urge Republican “libertarian populist” appeals
to downscale Caucasian voters turned off by the Bain Capital
persona and reality of Mitt Romney, although in this
author’s opinion, any actual proposals will amount to little
more than faux-populist flapdoodle. The electoral role model
for The Missing White Voter Theory appears to be Minnesota
Governor Tim Pawlenty, who before becoming a financial
services lobbyist was twice elected Governor of Minnesota –
but with percentages of 44.37 and 46.69 in three-way
engagements where the Jesse Ventura Independence Party
achieved 16.18 and 6.43 percentage points -- but where the
Democrats were held to 36.46 and 45.73.
Wallace voters and 1968 Humphrey voters switching to Nixon.
New York Times Magazine, August 6, 1972, “Why Nixon Will Win” (Kevin Phillips), pages 33-34.
13 Note that Sean Trende does not oppose either immigration reform or Republican minority outreach; see his June 21, 2013 and subsequent Real Clear Politics articles.
10
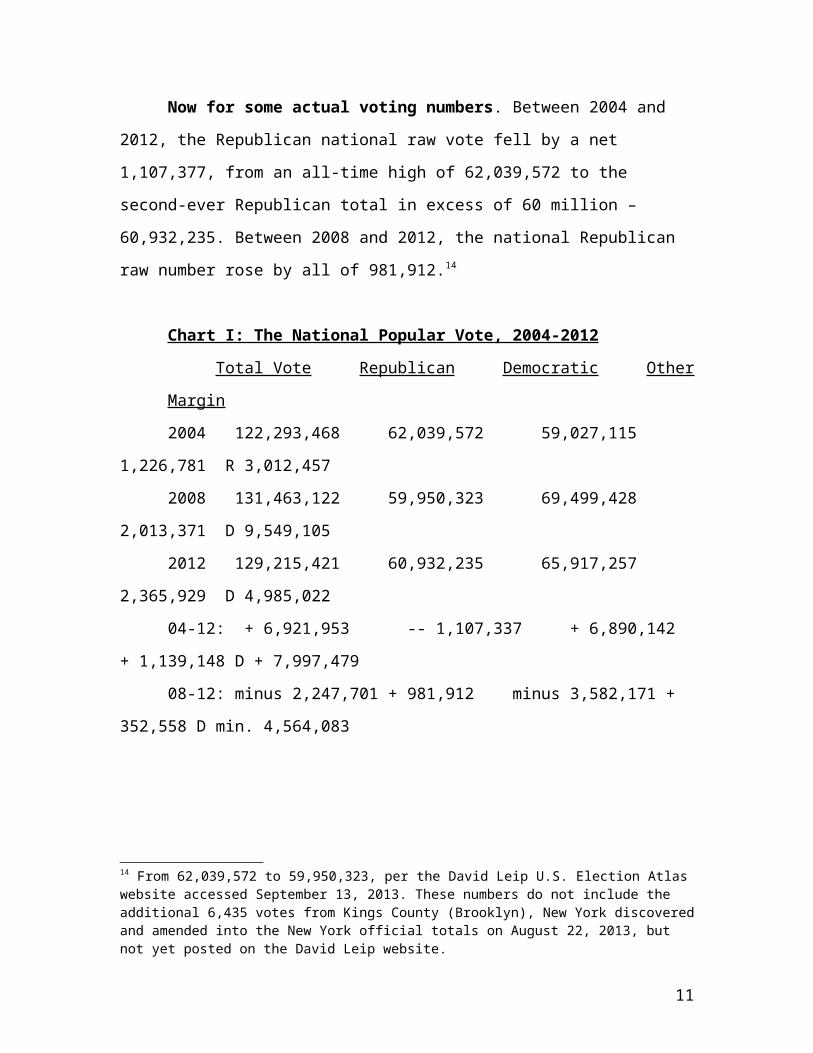
Now for some actual voting numbers. Between 2004 and
2012, the Republican national raw vote fell by a net
1,107,377, from an all-time high of 62,039,572 to the
second-ever Republican total in excess of 60 million –
60,932,235. Between 2008 and 2012, the national Republican
raw number rose by all of 981,912.14
Chart I: The National Popular Vote, 2004-2012
Total Vote Republican Democratic Other
Margin
2004 122,293,468 62,039,572 59,027,115
1,226,781 R 3,012,457
2008 131,463,122 59,950,323 69,499,428
2,013,371 D 9,549,105
2012 129,215,421 60,932,235 65,917,257
2,365,929 D 4,985,022
04-12: + 6,921,953 -- 1,107,337 + 6,890,142
+ 1,139,148 D + 7,997,479
08-12: minus 2,247,701 + 981,912 minus 3,582,171 +
352,558 D min. 4,564,083
14 From 62,039,572 to 59,950,323, per the David Leip U.S. Election Atlaswebsite accessed September 13, 2013. These numbers do not include the additional 6,435 votes from Kings County (Brooklyn), New York discoveredand amended into the New York official totals on August 22, 2013, but not yet posted on the David Leip website.
11
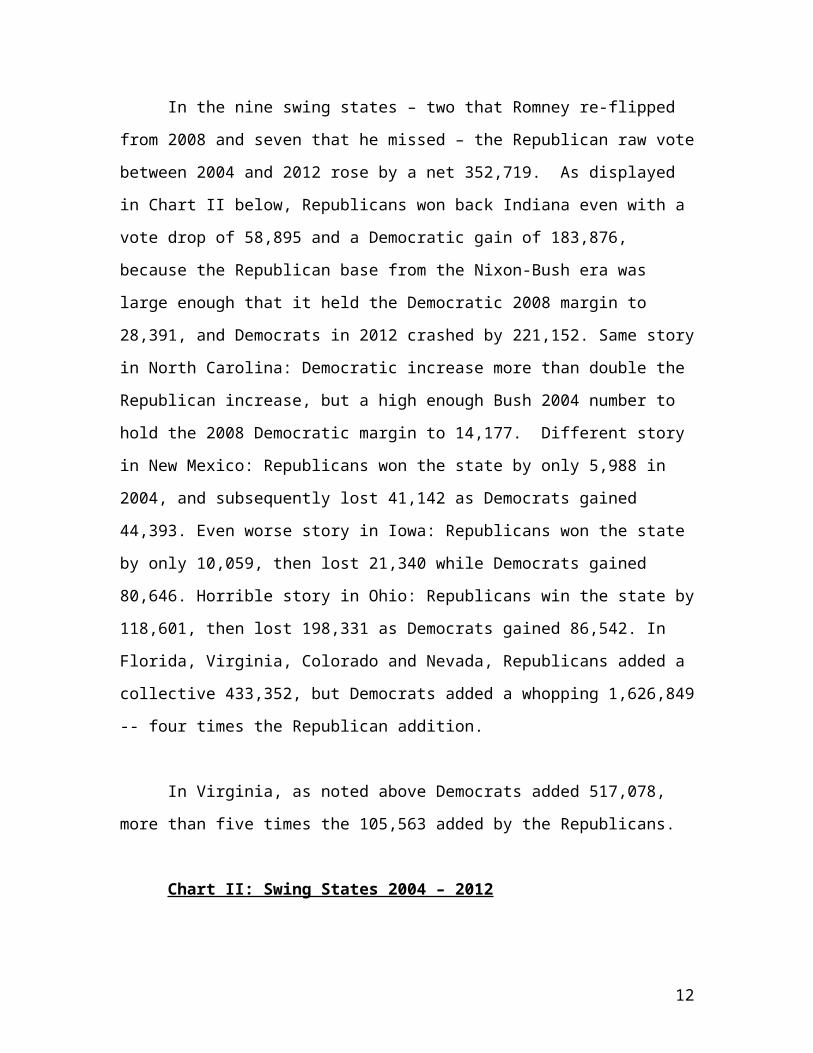
In the nine swing states – two that Romney re-flipped
from 2008 and seven that he missed – the Republican raw vote
between 2004 and 2012 rose by a net 352,719. As displayed
in Chart II below, Republicans won back Indiana even with a
vote drop of 58,895 and a Democratic gain of 183,876,
because the Republican base from the Nixon-Bush era was
large enough that it held the Democratic 2008 margin to
28,391, and Democrats in 2012 crashed by 221,152. Same story
in North Carolina: Democratic increase more than double the
Republican increase, but a high enough Bush 2004 number to
hold the 2008 Democratic margin to 14,177. Different story
in New Mexico: Republicans won the state by only 5,988 in
2004, and subsequently lost 41,142 as Democrats gained
44,393. Even worse story in Iowa: Republicans won the state
by only 10,059, then lost 21,340 while Democrats gained
80,646. Horrible story in Ohio: Republicans win the state by
118,601, then lost 198,331 as Democrats gained 86,542. In
Florida, Virginia, Colorado and Nevada, Republicans added a
collective 433,352, but Democrats added a whopping 1,626,849
-- four times the Republican addition.
In Virginia, as noted above Democrats added 517,078,
more than five times the 105,563 added by the Republicans.
Chart II: Swing States 2004 – 2012
12

State, R 2004 R. 2004-2012 Dem. 2004-2012
2012 Result
N.C. 435,317 + 309,229 + 652,542
Repub. Margin 92,004
Ind. 510,427 Minus 58,895 +
183,876 Repub. 267,656
N.M 5,988 Minus 41,142 + 44,393
Dem.. 79,547
Nev. 21,500 + 44,877 +
134,183 Dem. 67,806
Colo. 99,531 + 83,987 +
321,376 Dem. 137,858
Va. 262,217 + 105,563 +
517,078 Dem. 149,298
Fla. 380,978 + 198,925 + 654,212
Dem. 74,309
Ohio 118,601 Minus 198,331 + 86,542
Dem. 166,272
Iowa 10,059 Minus 21,340 + 80,646
Dem. 91,927
Republicans have to carry at least six of these nine states
to win the White House in 2016 or 2020. The Republicans
must hold Indiana and North Carolina, and flip Florida (29
electoral votes) plus three states with another 35 electoral
votes: Ohio 18, Virginia 13, and either Iowa (6), Colorado
13
(9), Nevada (6), or New Mexico (5). Alternatively,
Republicans must dislodge the equivalent from the Blue Wall
Kerry-Obama states15 that have 246 current electoral votes;
Republicans will talk about flipping New Hampshire (4),
Pennsylvania (20), Wisconsin (10), Michigan (16), New Jersey
(14) and even Minnesota (10), even though the last year in
which any of these states gave a majority to a non-incumbent
Republican was 1988 New Hampshire, Pennsylvania, Michigan
and New Jersey; 1960 Wisconsin, and 1952 Minnesota.
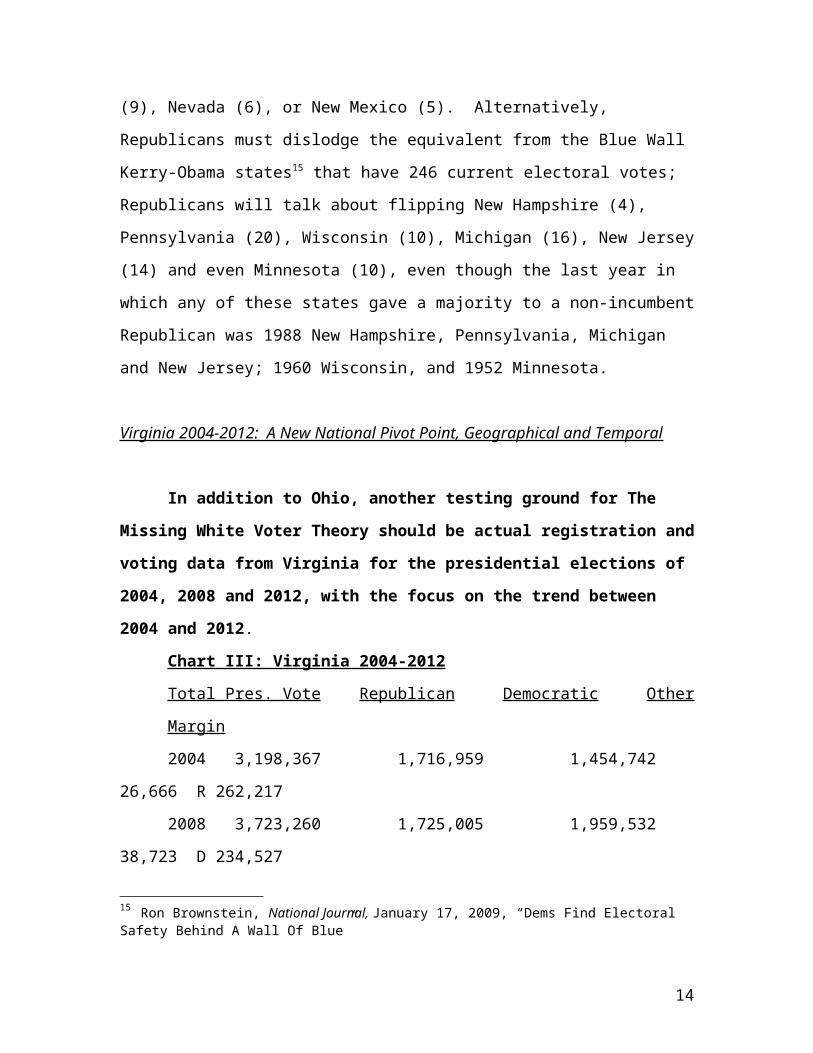
Virginia 2004-2012: A New National Pivot Point, Geographical and Temporal
In addition to Ohio, another testing ground for The
Missing White Voter Theory should be actual registration and
voting data from Virginia for the presidential elections of
2004, 2008 and 2012, with the focus on the trend between
2004 and 2012.
Chart III: Virginia 2004-2012
Total Pres. Vote Republican Democratic Other
Margin
2004 3,198,367 1,716,959 1,454,742
26,666 R 262,217
2008 3,723,260 1,725,005 1,959,532
38,723 D 234,527
15 Ron Brownstein, National Journal, January 17, 2009, “Dems Find Electoral Safety Behind A Wall Of Blue”
14

2012 3,854,489 1,822,522 1,971,820
60,147 D 149,298
04-12: + 656,122 + 105,563 + 517,078
+ 33,481 D + 411,515
08-12: + 131,229 + 97,517 + 12,288
+ 21,424 D min. 85,229
Why Virginia? Because a Democratic win of Virginia’s 13
electoral votes added to the 257 Blue Wall electoral votes
equals the 270 needed to win. The last time a Republican won
the White House while losing Virginia was 1924, the Roaring
Twenties Slumber Party year when America kept cool with
Calvin Coolidge except in Robert Lafollette’s Wisconsin,
Oklahoma and the eleven Old Confederacy states, which
included Virginia, where Democrat John W. Davis, Esq.
achieved 62.48%, 33.66 percentage points ahead of his
national percentage. In the years when Republicans carried
two or more Southern states (192816, 1952, 1956, 1960, 1964,
1968, 1972, 1980, 1984, 1988, 1992, 1996, 2000 and 2004),
Virginia was in the Republican column except in the 1964 LBJ
landslide; note that these Republican wins of Virginia
included the GOP national loss years of 1960, 1992 and 1996.
In 1976, Virginia was the one Southern state carried by
16 Republicans cracked the Solid South in 1920 when Warren Harding carried Tennessee. However, Tennessee and the rest of the South went Democratic in 1924. In 1928, Republicans carried Texas, Tennessee, Virginia, North Carolina and Florida.
15

President Ford. In 2008 and 2012, the final Virginia all-
vote Democratic percentages of 52.63% and 51.16% came within
minus 0.14 and plus 0.15 percentage points of the national
ones, making the Dynamic Dominion the national bellwether
for the Twenty Teens.17
For Republicans to move up from 206 to 270 in the 2012-
2020 Electoral College, they must add 64 electoral votes.
Since it is highly unlikely the Republicans will flip the 67
from California (55) and Washington (12), Republicans are
likely to target the three closest Romney loss states
(Florida with 29, Ohio 18 and Virginia 13), but still need
one other state with at least four electoral votes (Colorado
(9), New Hampshire (4) or Iowa (6)). The only way the
Republicans can make up for a Virginia loss is through the
two Scranton-Oshkosh strategies of flipping Pennsylvania,
Iowa, Wisconsin (10), Minnesota (10) and Ohio, or nominating
New Jersey Governor Chris Christie and hope the home-state
appeal adds 14 New Jersey electoral votes to Pennsylvania
(20), Michigan (16)18 and Ohio.19
Virginia does not have a sufficiently large pool of
“missing white voters” to flip the commonwealth. According
to the 2012 exit polls in 31 states, the Virginia electorate17 The Ohio Democratic percentages vis-à-vis national are minus 0.43 in 2012 and minus 1.49 in 2008.18
? Or Wisconsin (10) and Minnesota (10).
19 Alternatively, New Jersey (14), Pennsylvania (20), Ohio (18), Iowa (6) and Wisconsin (10).
16

Caucasian percentage was 70 percent. According to the 2010
Census website, the total Virginia population of 8,001,031
is 64.1% Non Hispanic White, 19.7% African-American, 8.4%
Hispanic, and 6.0% Asian/Pacific Islander American. Unlike
in Ohio – where it also fails -- in Virginia The Missing
White Voter Theory must coexist with a population that is
34.1 percent minority and an electorate that is only 5.9
exit poll percentage points behind this number.
Why compare 2004 and 2012? Because 2004 represents the
all-time high Republican raw number in the United States
(62,039,572), although in Virginia, the 2012 number
(1,822,522) is the state all-time Republican high, but is
ahead of 2008 by only 97,517, which outpaced 2004 only by a
laughably low 8,046. As for 2012, it represents a Democratic
comedown from the all-time raw number high achieved in the
2008 United States (69,499,428), but not in Virginia, where
the 2012 President Obama number of 1,971,820 is a current
all-time high that outpaced the 2008 Obama number by 12,228,
and the 2004 John Kerry number by 517,078. Nationally,
Barack Obama between 2008 and 2012 lost 3,582,171 raw votes,
but because Mitt Romney added only a net 981,912, Obama won
the national popular vote by 4,985,022, a comedown from the
2008 margin of 9,549,105.20 20 Obama lost 33 electoral votes: 11 from Indiana, 15 from North Carolina, 1 from the Nebraska-2 U.S. House district, and 6 from Census net electoral vote losses in the double-Obama states.
17

Virginia 2012: Republicans Are Behind The Democrats By A Five-to-One
Margin in New Votes Since 2004
The Republicans have added only 105,563 Virginia votes
since 2004, whereas the Democrats have added 517,078. When
the Virginia polls closed on Election Night 2012 at 1900
hours Eastern Standard Time the Electoral College outcome
was all over but the counting – Romney overperformed the
McCain raw number by only 97,517, so Barack Obama could see
his raw vote number go up by only 12,228 and still carry
Virginia by 149,298. When Barack Obama won Virginia in
2008, he became the first non-incumbent Democrat since
Franklin D. Roosevelt in 1932 to achieve a Virginia
majority.21 When he won a second majority in 2012, he
became the first Democrat to win two consecutive Virginia
majorities since FDR in 1940 and 1944. Between 2004 and
2012, the commonwealth margin moved by 411,515, from Bush by
262,217 to Obama by a reduced but still-winning 149,298.22
The Missing White Voter Theory says Rural Virginia
stayed home. In his initial November 8, 2012, article, Mr.
21 From 1876 through 1924, Virginia voted continuously Democratic. In 1928, Herbert Hoover won the state, but Virginia followed by voting fourtimes for FDR and for Harry Truman. Between 1952 and 2004, Virginia voted Democratic only in 1964. 22 The final certified Virginia 2012 returns showed a commonwealth-wide Romney number of 1,822,522, which was 97,517 above the McCain 2008 number of 1,725,005.
18
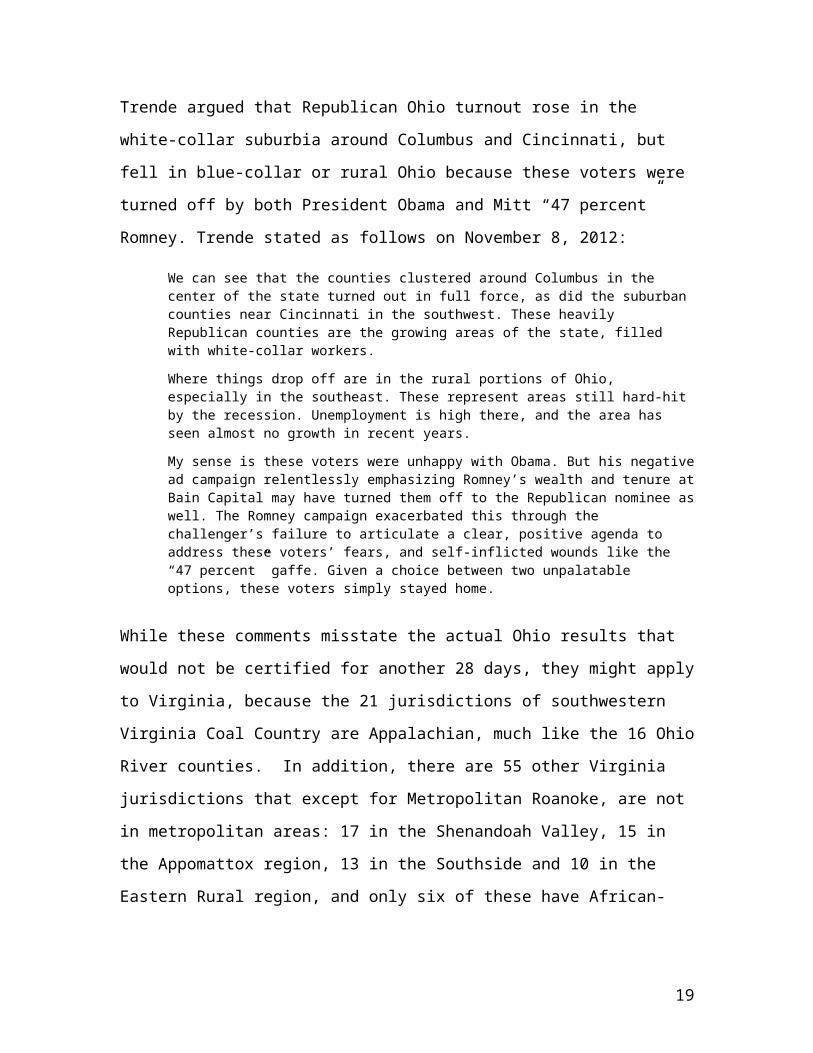
Trende argued that Republican Ohio turnout rose in the
white-collar suburbia around Columbus and Cincinnati, but
fell in blue-collar or rural Ohio because these voters were
turned off by both President Obama and Mitt “47 percent”
Romney. Trende stated as follows on November 8, 2012:
We can see that the counties clustered around Columbus in the center of the state turned out in full force, as did the suburban counties near Cincinnati in the southwest. These heavily Republican counties are the growing areas of the state, filled with white-collar workers.
Where things drop off are in the rural portions of Ohio, especially in the southeast. These represent areas still hard-hit by the recession. Unemployment is high there, and the area has seen almost no growth in recent years.
My sense is these voters were unhappy with Obama. But his negativead campaign relentlessly emphasizing Romney’s wealth and tenure atBain Capital may have turned them off to the Republican nominee aswell. The Romney campaign exacerbated this through the challenger’s failure to articulate a clear, positive agenda to address these voters’ fears, and self-inflicted wounds like the “47 percent” gaffe. Given a choice between two unpalatable options, these voters simply stayed home.
While these comments misstate the actual Ohio results that
would not be certified for another 28 days, they might apply
to Virginia, because the 21 jurisdictions of southwestern
Virginia Coal Country are Appalachian, much like the 16 Ohio
River counties. In addition, there are 55 other Virginia
jurisdictions that except for Metropolitan Roanoke, are not
in metropolitan areas: 17 in the Shenandoah Valley, 15 in
the Appomattox region, 13 in the Southside and 10 in the
Eastern Rural region, and only six of these have African-
19

American populations in excess of 30 percent.23 This
article and accompanying Charts VII through XI divide the
134 Virginia jurisdictions as 76 in Rural Virginia (broken
down as the Coal Country 21, the Shenandoah Valley 17, the
Appomattox 15, the Southside 13, and the Eastern Rural 10)
and 58 in Metropolitan Virginia (broken down as the
University of Virginia [Charlottesville City and Albemarle
County)], the Northern Virginia 11 Double-Obama, the
Northern Virginia 11 Double-Republican, the Greater Richmond
19, and the Hampton Roads 15).
The Missing White Voter Theory Is Missing Actual Registrations and Actual
Voters
The Missing White Voter Theory has no actual voters.
Even though the final certified Ohio 2012 returns turned out
to be at variance with his November 8, 2012 article, Mr.
Trende in a subsequent four-part Real Clear Politics series24,
expanded his argument nationwide, arguing that “[t]he most
23 Essex County (50%-plus); in the 40% band Brunswick County and Danville City; and in the 30% band Greensville County, Emporia City and Franklin City.
24 Real Clear Politics, June 21, 2013, “The Case of the Missing White Voters, Revisited”; June 25, 2013, “Does GOP Have to Pass Immigration Reform”; June 28, 2013, “The GOP and Hispanics: What the Future Holds”; July 2, 2013, “Demographics and the GOP, Part IV.” The July 2 article is a replyto critics Karl Rove, Jonathan Chait, and the concerned multitudes who expressed concern that GOP emphasis on running up Caucasian percentages would lead to unhealthy racial polarization.
20

salient demographic change from 2008 to 2012 was the drop in
white voters” and claiming that a national 6.5 million
Caucasian eligible voters stayed home in 2012. Mr. Trende
stated in his 2013 articles that even if the missing 6.5
million broke 70-30 for Romney, by itself this group it
would not have won the 2012 election for the Republicans,
but in 2016 and in future elections Republican appeals that
turn them out, combined with reduced African-American
turnout, would carry the day for the GOP – because according
to Trende, it is fine that the Nineteenth Century anti-
slavery party has become the Twenty-first Century equivalent
of the 1868 Democratic “White Man’s Party”25 since “from a
purely electoral perspective, that’s not a terrible thing to
be.”26 By author Kamp’s calculations, since the Obama 2012
national popular vote margin was 4,985,022, if Romney won 90
percent of the “missing” 6.500 million, he would have won
the rounded national popular vote by 345,000 -- 66.782
25 Statement of the 1868 Democratic nominee, New York Governor Horatio Seymour, quoted by Ed Kilgore, “Doubling Down on the White Man’s Party”,June 26, 2013, The Washington Monthly Political Animal blog, www.washingtonmonthly.com26 Trende stated as follows in his June 25, 2013 article: “Democrats liked to mock the GOP as the “Party of White People” after the 2012 elections. But from a purely electoral perspective, that’s not a terrible thing to be.”
21
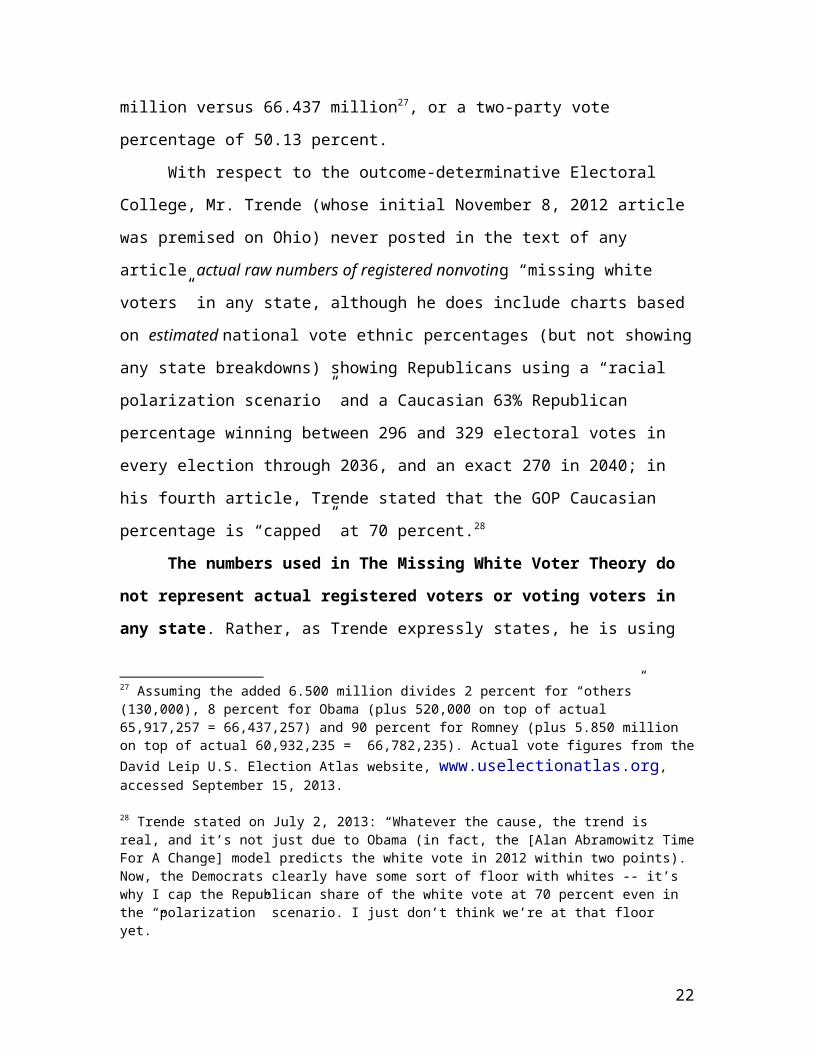
million versus 66.437 million27, or a two-party vote
percentage of 50.13 percent.
With respect to the outcome-determinative Electoral
College, Mr. Trende (whose initial November 8, 2012 article
was premised on Ohio) never posted in the text of any
article actual raw numbers of registered nonvoting “missing white
voters” in any state, although he does include charts based
on estimated national vote ethnic percentages (but not showing
any state breakdowns) showing Republicans using a “racial
polarization scenario” and a Caucasian 63% Republican
percentage winning between 296 and 329 electoral votes in
every election through 2036, and an exact 270 in 2040; in
his fourth article, Trende stated that the GOP Caucasian
percentage is “capped” at 70 percent.28
The numbers used in The Missing White Voter Theory do
not represent actual registered voters or voting voters in
any state. Rather, as Trende expressly states, he is using
27 Assuming the added 6.500 million divides 2 percent for “others” (130,000), 8 percent for Obama (plus 520,000 on top of actual 65,917,257 = 66,437,257) and 90 percent for Romney (plus 5.850 million on top of actual 60,932,235 = 66,782,235). Actual vote figures from theDavid Leip U.S. Election Atlas website, www.uselectionatlas.org, accessed September 15, 2013. 28 Trende stated on July 2, 2013: “Whatever the cause, the trend is real, and it’s not just due to Obama (in fact, the [Alan Abramowitz TimeFor A Change] model predicts the white vote in 2012 within two points). Now, the Democrats clearly have some sort of floor with whites -- it’s why I cap the Republican share of the white vote at 70 percent even in the “polarization” scenario. I just don’t think we’re at that floor yet.”
22

only Census estimates of 2008 and 2012 turnout to which Trende adds
2008 exit poll ethnic percentages29:
Using the most commonly accepted exit-poll numbers about the 2008 electorate*, we can roughly calculate the number of voters of eachracial group who cast ballots that year. Using census estimates, we can also conclude that all of these categories should have increased naturally from 2008 to 2012, due to population growth.
From mid-2008 to mid-2012, the census estimates that the number ofwhites of voting age increased by 3 million. If we assume that these “new” voters would vote at a 55 percent rate, we calculate that the total number of white votes cast should have increased byabout 1.6 million between 2008 and 2012.
***
Now, the raw exit-poll data haven’t come out yet, so we can’t calculate the 2012 data to tenths: The white vote for 2012 could have been anywhere between 71.5 percent of the vote or 72.4 percent (with 26,000 respondents, analysis to tenths is very meaningful). So the final answer is that there were 6.1 million fewer white voters in 2012 than we’d have expected, give or take amillion.**
The Current Population Survey data roughly confirm this. As I noted earlier, if you correct the CPS data to account for over-response bias, it shows there were likely 5 million fewer whites in 2012 than in 2008. When you account for expected growth, we’d find 6.5 million fewer whites than a population projection would anticipate.
The Census Current Population Survey Is Not The Best Evidence -- It
Overstated the 2012 National Popular Vote by 3.7 Million, and Understated
Virginia Actual Registration and Voting in 2004, 2008, and 2012
29 In 2012, exit polls were conducted in only 31 states. The quoted language comes from the Trende June 21, 2013 article under Point 1.
23

The Census Survey used for the Missing White Voter
Theory produces numbers too far from the actual results to
be useful. The Trende series inspired a cacophony of calumny
(and some informed commentary), but one salient point never
emerged: the Census survey data is not the equivalent of
state or county-level numbers of actual 2012 registered voters who
“stayed home” rather than voting for Romney.30 These
numbers cannot be found in the Census data, because the
Census states that its’ eligibility, registration and voting
numbers are derived from self-reporting by a sample of
roughly 50,000 respondents to the Current Population Survey
(CPS) as to their citizen 18-plus status, voter
registration31, and whether they voted. This is a
commendably large sample, but in 2012 it overstated the
national total vote as 132.948 million, when the actual
total vote for President was 129,215,421.
In Virginia, the CPS for 2012 reports 5.645 million
citizen-eligible, 4.210 million registered, and 3.778
million voting. The Census CPS has a Virginia monopoly on
the “citizen-eligible” number, because the Virginia State
30 Ohio starting in 2006 joined California and other states that offer no-excuses mail ballot voting, so in 2008 and 2012 (but not in 2004) onecan “stay home” and still vote.
31 Not required in the Nineteenth Century, but now a requirement in every state except North Dakota.
24
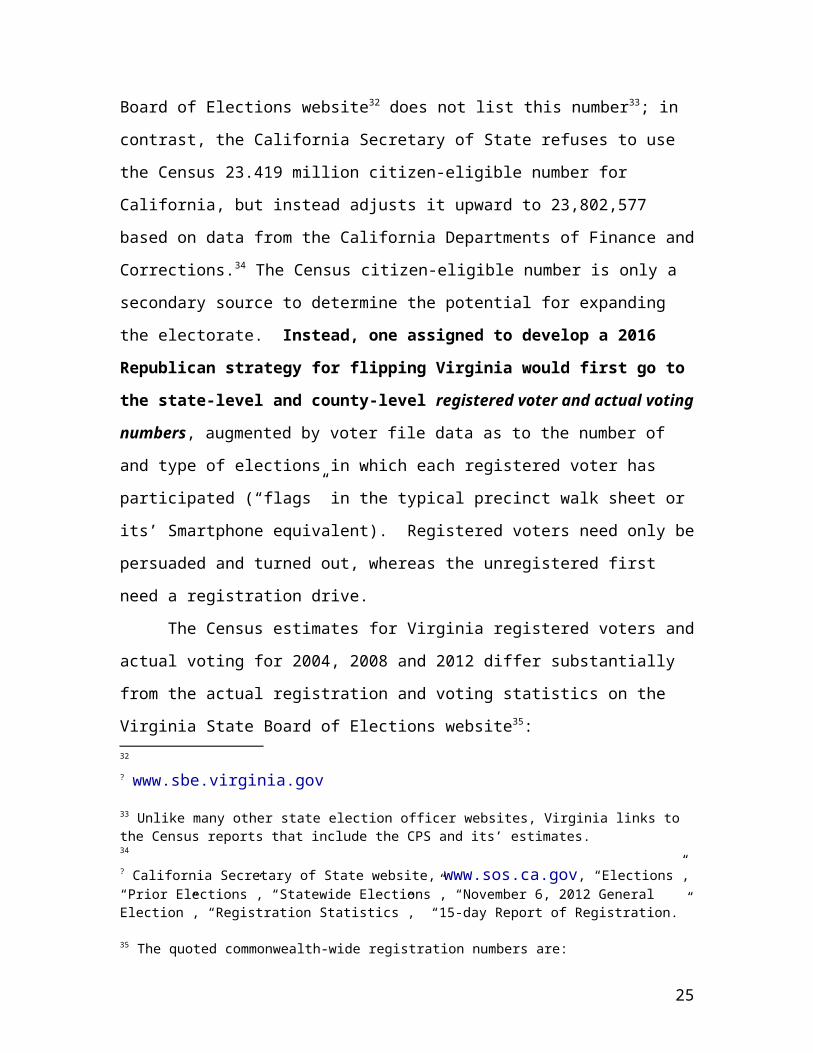
Board of Elections website32 does not list this number33; in
contrast, the California Secretary of State refuses to use
the Census 23.419 million citizen-eligible number for
California, but instead adjusts it upward to 23,802,577
based on data from the California Departments of Finance and
Corrections.34 The Census citizen-eligible number is only a
secondary source to determine the potential for expanding
the electorate. Instead, one assigned to develop a 2016
Republican strategy for flipping Virginia would first go to
the state-level and county-level registered voter and actual voting
numbers, augmented by voter file data as to the number of
and type of elections in which each registered voter has
participated (“flags” in the typical precinct walk sheet or
its’ Smartphone equivalent). Registered voters need only be
persuaded and turned out, whereas the unregistered first
need a registration drive.
The Census estimates for Virginia registered voters and
actual voting for 2004, 2008 and 2012 differ substantially
from the actual registration and voting statistics on the
Virginia State Board of Elections website35: 32
? www.sbe.virginia.gov33 Unlike many other state election officer websites, Virginia links to the Census reports that include the CPS and its’ estimates.34
? California Secretary of State website, www.sos.ca.gov, “Elections”,“Prior Elections”, “Statewide Elections”, “November 6, 2012 General Election”, “Registration Statistics”, “15-day Report of Registration.”
35 The quoted commonwealth-wide registration numbers are:
25

For 2004, the Census estimates rounded 3.441
million registered and 3.134 million voting, but
the actual numbers are 4,517,980 registered and
3,223,156 voting;
For 2008, the Census estimates 3.950 million
registered and 3.650 million voting, but the
actual numbers are 5,034,660 registered and
3,752,858 voting;
And for 2012, the Census estimates 4.210 million
registered and 3.778 million voting, but the
actual numbers are 5,428,833 total registered and
3,896,846 voting; note that the latter is 42,357
The 2004 “registered voters” number (as opposed to “qualified voters”, which is 449 fewer).
The 2008 and 2012 “total registered” numbers, as opposed to the smaller “active registered” numbers, which according to September 6, 2013 and September 26, 2013 electronic mail messages from the Virginia State Board of Elections, is a subset of “registered voters” that consists of registered voters who have actually voted in “past elections.” The “active registered” category was not used in 2004.
In 2008, the “active registered” number was 4,912,971, which is 121,689 fewer than the total registered number. In 2012, the “active registered” number was 4,848,597, which is 580,236 fewer.
This article uses the “total registered” number because this is the onlyone available in both 2004 and 2012, and because it models the largest possible pool of registered nonvoters.
The quoted commonwealth-wide voting numbers are the total number of voters who voted absentee (mail) or in-person, including counted provisional ballots. They differ from the David Leip U.S. Election Atlas website presidential numbers because the Leip website total vote number is the total vote for the particular office (President, U.S. Senate, Governor, downballot offices) rather than the election.
26

above the 3,854,489 total vote for President – if
Romney had won all of these, he would have cut
Obama’s Virginia margin to 106,941.
Every state except no-registration North Dakota reports per-
election voter registration on its’ election officer
website, and every state reports the total vote; Virginia
charts both back to 1976, has election results back to 1995,
and links to a University of Virginia Institute for Politics
database with non-Presidential data back to 1788. Other
sources provide county-level data back to 1788 in some
states.36 The David Leip U.S. Election Atlas website in a
single screen charts Virginia state-level total vote and
partisan numbers all the way back to 1856, county-level
numbers back to 1932, and has per-election screen state-
level data back to the first Virginia election with complete
returns (1800). These sources provide actual registration and voting data,
36 The David Leip U.S. Election Atlas website has actual votes down to the county level for elections back to 1900 or even farther back in manylocales; the late Richard Scammon’s America at the Polls and America Votes has them back to 1920; Walter Dean Burnham’s Presidential Ballots has county-level returns between 1836 and 1892, Edgar Eugene Robinson’s The Presidential Vote has them from 1896 through 1932 and for 1932-1944 in They Voted for Roosevelt, and Michael Dubin has collected all available pre-1860 returns back to 1788 in United States Presidential Elections 1788-1860.
For Virginia, the David Leip U.S. Election Atlas has a single chart withstate-level percentages and raw numbers from 2012 back to 1856. The chart links to county-level returns for 1912, 1924, and all elections between 1932 and 2012.
27

not estimates, and should be looked to first in the search for the actual 6.5
million missing white voters.
The Missing White Voter Theory Census Estimate Predicate Appears To
Assume a Highly Improbable 100 Percent Turnout of 216,000 Unregistered At 85
Percent Republican – Which Still Cannot Beat the 2008 Obama Margin
If the unregistered are the target group, Republicans
will need 100 percent turnout, not the 55 percent used in
The Missing White Voter Theory article series. The only
reason to look at the Census estimates: they provide the
only statistics available for the citizen-eligible
population and ethnic/gender breakdowns of the CPS
respondents.37 The citizen-eligible population includes
unregistered eligibles, registered nonvoters, and registered
actual voters. The gap between the Census 5.645 million
“citizen-eligible” survey response estimate and actual total
registration for 2012 Virginia (rounded 5.429 million) is a
rounded 216,000. If these 216,000 exist, and:
if the 2016 Republican nominee found, registered,
persuaded and delivered 100 percent of all of
these 216,000 unregistered 2012 nonvoters at 85%
Republican, 13% Democratic and 2% Other38; 37 Another source for ethnic/racial breakdowns is the American National Election Study (ANES), as analyzed by Alan Abramowitz and Ruy Teixera onJuly 30, 2013, “The Missing White Voters: Round Two of the Debate.”
38 The 2012 Virginia “other” percentage was 1.56%. In post-1928 years other than 1948 (Strom Thurmond), 1968 (George Wallace), 1980 (John
28

and assuming no other changes anywhere else
(highly unlikely);
the Republican column amount goes up by 155,520,
thus topping by 6,222 the augmented 2012 Obama
Virginia margin of 149,298, but not the 2008
margin of 234,527.39
However, if the turnout is the 55 percent used in the Missing White Voter
articles40, only 118,800 are added, which falls short of both the Obama 2012 and
2008 Virginia margins, meaning The Missing White Voter Theory mathematically
cannot flip Virginia. Democrats if they hold Ohio or Florida41
could still hold the White House without Virginia, but
because The Missing White Voter Theory cannot flip Virginia,
Democrats will likely not enjoy the irony of Republicans
trying to win the election among the unregistered and
alienated whom Republican Governors and legislatures across
the country in 2013 have been trying to keep from voting,
even if the 2016 Republican nominee runs a registration
drive trumpeting “White People Wake Up” – the 1950 election
Anderson), 1992-1996 (Ross Perot) and 2000 (Ralph Nader), the non-major collective percentage in Virginia has never exceeded 2.75% (1976).
39 The calculation assumes the 216,000 break Republican 85% = 183,600 new Republicans, offset by Democratic 13% = 28,080 = net Republican gainof 155,520, which defeats the Obama 2012 margin (149,298) but not Obama 2008 (234,527)
40 In his June 21, 2013 article, Trende stated under point 1: “If we assume that these “new” voters would vote at a 55 percent rate . . .”
41 The 246 electoral votes from the 2004 Kerry states plus Iowa (6) and New Mexico (5), plus either Florida (29) or Ohio (18), or Colorado (9) and Nevada (6).
29

eve segregationist slogan in the 1950 North Carolina U.S.
Senate Democratic primary.42
When reading the Missing White Voter Theory analysis,
keep in mind that the “missing white voter” group in
Virginia necessarily includes an estimated 216,000 who did not even bother
to register to vote, as do the 2012 Census CPS estimates of
Virginia Non-Hispanic White (NHW) populations of 4.114
million eligible, 3.118 million registered and 3.778 million
voting – all three are estimates, and the full-population
Virginia Secretary of State numbers for actual registered and
actual voting are so far removed from the CPS estimates for
Virginia as to render the latter useless for evaluating the
universe of registered “missing voters.” In any event, the
Republican task will be easier if the Republican Virginia
House of Delegates and the 20-20 Virginia State Senate move
the registration deadline from Election Day minus 22 to
Election Day minus 1543 or even to the Election Day
Registration used in Idaho, Iowa,
Maine, Minnesota, Montana, New
Hampshire, Wisconsin, Wyoming, and D.C.
Another Census Estimate Element of the Missing White Voter Theory Adds
Only 134,000 New Voters, Less Than The Obama 2012 and 2008 Margins
42 Samuel Lubell, The Future of American Politics (3d. ed. 1965), pages 106-113 (“Who Beat Frank Graham?”). 43 California law between 2000 and 2012. Election Day registration may take effect in 2014.
30

Another estimate relied upon by The Missing White Voter
Theory is the gap between Census Non-Hispanic White (NHW)
estimated registered versus the estimated NHW voting, but in
Virginia this gap at 134,000 underperforms both the Obama
2012 and 2008 margins. The Missing White Voter Theory is
premised on a 2008-2012 growth in the national eligible NHW
population offset against a national decline in NHW
registration and voting. Although the CPS has state-level
estimates, the Missing White Voter Theory articles do not
mention any of them. Here are the CPS estimates for
Virginia:
Chart IV: Census CPS Estimated NHW Registering and
Voting in Virginia
2004 2008 2012 04-12
08-12
Eligible 3.741 M 3.912 M 4.114
M + 373 T + 202 T
Registered 2.731 M 2.945 M 3.118 M
+ 387 T + 173 T
Voting 2.525 M 2.716 M 2.778 M
+ 253 T + 62 T
As displayed:
31

NHW eligibles in Virginia increased by 373,000 between
2004 and 2012;
registered NHW increased by 387,000;
and voting NHW increased by 253,000.
These estimates are worthless in the context of the actual
numbers, but they “show” that in Virginia, there is no gap
between the 2004-2012 growth in NHW eligibles and the growth
in NHW registered – indeed, the increase in NHW registered
exceeds the increase in NHW eligibles by 14,000. These
estimates do show a gap in the growth of NHW registered and
NHW voting – of 134,000, which is less than the Obama 2012
margin of 149,298, not to mention the 2008 Obama margin of
234,527. In other words, Republicans could turn out and win
100 percent of the “gap” between Census-reported NHW
registered and NHW voting, but would still fall short of
both the Obama 2012 and 2008 margins.
Actual Voter Registration and Voting In Virginia
To find out if enough “missing white voters” actually
exist in Virginia, the best sources are the state-level and
county-level registration, total vote, and partisan vote
changes between 2004 and 2012. Since Virginia voters do not
register by party, one cannot use the partisan registration
statistics common in other states such as California and
32

Pennsylvania. Registration in Virginia closes 22 days before
Election Day and felons can register only if their rights
have been restored (much more restrictive than in
California, where the ex-felon can re-register once the
prison term or parole ends). Voters must re-register if
they change their address anywhere, and can do so online, or
can download a paper form to change their address manually.
They can also vote in their old precinct for up to one
general election and two federal elections after the move,
provided they do not change their registration address
beforehand.44
Virginia’s 134 Jurisdictions: 76Rural, 58Metropolitan
Virginia in 2004, 2008 and 2012 had 134 jurisdictions
that report votes – 95 counties and 39 independent cities.45
This article and accompanying Charts VI through X divide
them as 76 in Rural Virginia (broken down as the Coal
Country 21, the Shenandoah Valley 17, the Appomattox 15, the
Southside 13, and the Eastern Rural 10) and 58 in
44 Virginia State Board of Elections website, www.sbe.virginia.gov, “Voter Registration.”
45 Over the more than two centuries of voting in Virginia, some of the cities have merged, gone out of existence, or changed their names. However, there were no changes between 2004 and 2012. In July 2013, Bedford City merged back into Bedford County, meaning the number of jurisdictions drops to 133 in 2013 et seq. In previous years, Clifton Forge and South Boston were independent cities, but they abandoned this status in 2001 and 1995 and merged back into their surrounding counties.
33
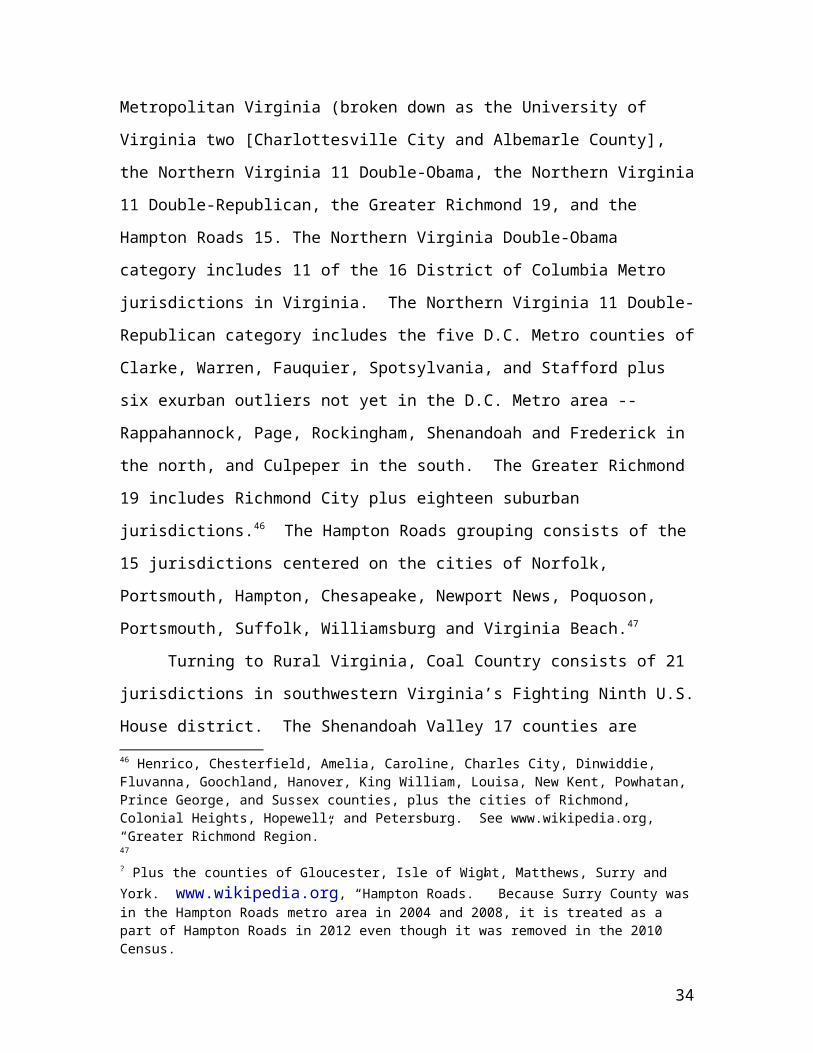
Metropolitan Virginia (broken down as the University of
Virginia two [Charlottesville City and Albemarle County],
the Northern Virginia 11 Double-Obama, the Northern Virginia
11 Double-Republican, the Greater Richmond 19, and the
Hampton Roads 15. The Northern Virginia Double-Obama
category includes 11 of the 16 District of Columbia Metro
jurisdictions in Virginia. The Northern Virginia 11 Double-
Republican category includes the five D.C. Metro counties of
Clarke, Warren, Fauquier, Spotsylvania, and Stafford plus
six exurban outliers not yet in the D.C. Metro area --
Rappahannock, Page, Rockingham, Shenandoah and Frederick in
the north, and Culpeper in the south. The Greater Richmond
19 includes Richmond City plus eighteen suburban
jurisdictions.46 The Hampton Roads grouping consists of the
15 jurisdictions centered on the cities of Norfolk,
Portsmouth, Hampton, Chesapeake, Newport News, Poquoson,
Portsmouth, Suffolk, Williamsburg and Virginia Beach.47
Turning to Rural Virginia, Coal Country consists of 21
jurisdictions in southwestern Virginia’s Fighting Ninth U.S.
House district. The Shenandoah Valley 17 counties are 46 Henrico, Chesterfield, Amelia, Caroline, Charles City, Dinwiddie, Fluvanna, Goochland, Hanover, King William, Louisa, New Kent, Powhatan, Prince George, and Sussex counties, plus the cities of Richmond, Colonial Heights, Hopewell, and Petersburg. See www.wikipedia.org, “Greater Richmond Region.”47
? Plus the counties of Gloucester, Isle of Wight, Matthews, Surry and York. www.wikipedia.org, “Hampton Roads.” Because Surry County wasin the Hampton Roads metro area in 2004 and 2008, it is treated as a part of Hampton Roads in 2012 even though it was removed in the 2010 Census.
34

strung out on Interstate 81 between Roanoke and
Harrisonburg.48 Appomattox consists of 15 rural counties in
the Appomattox Court House area where Lee surrendered to
Grant to end the military Civil War. The Southside consists
of 13 counties and cities on the North Carolina border,
including Danville and Pittsylvania. The Eastern Rural
region consists of 10 counties in the Northern Neck, Middle
Peninsula and Delmarva Peninsula.
Map of Virginia’s Political Regions, 2004-2012
2012
2008
48
? The Shenandoah Valley 17 category includes all of the Roanoke Metropolitan Area jurisdictions: Roanoke City, Roanoke County, Salem City, and the counties of Botetourt, Craig and Franklin. Barack Obama carried Roanoke City in 2008 and 2012, but all of the other jurisdictions are double-Republican.
35

2004
36

Virginia’s 134 Jurisdictions: _35 are 90 Percent Or More Caucasian
The 2010 Census numbers show that 35 of the 134
Virginia jurisdictions have Caucasian populations of 90
percent or higher.49 As can be seen, these 35 are all in
Coal Country or the Shenandoah Valley except for Page,
Rappahannock and Shenandoah in the exurban D.C. 11 Double-
Republican counties.
Chart V: Virginia Jurisdictions Ranked by Caucasian
Percentage in 2010 Census
90% Alleghany Augusta Bath Bedford Bland Botetourt Buchanan
Carroll (98.1) Craig (98.5) Dickenson (98.8) Floyd Frederick
Giles Grayson Highland (99.0) Lee Page Patrick Pulaski
49 www.census.gov, “2010 Census Interactive Population Search” for Virginia and each of its’ 134 counties (the 39 independent cities are alpha-listed after the 95 counties).
37

Rappahannock Rockbridge Rockingham Russell (98.0) Scott
(98.2) Shenandoah Smyth Tazewell Warren Washington Wise
Wythe Bristol City Buena Vista City Galax City Poquoson City
80% Albemarle Campbell Fauquier Fluvanna Franklin
Gloucester Greene Hanover James City Madison Matthews
Montgomery Nelson New Kent Orange Powhatan Roanoke County
Colonial Hgts City (81.9) Covington Vity Falls Church City
Harrisonburg City Lexington City Norton City Radford City
(86.8) Salem City (88.9) Staunton City Waynesboro City
Winchester City
70% Amelia Amherst Appomattox Arlington Chesterfield
Clarke Culpeper Goochland Henry Isle of Wight King George
King William Lancaster Loudoun Louisa Middlesex
Northumberland Pittsylvania Spotsylvania Stafford York
Bedford City Charlottesville City Fairfax City Manassas City
Manassas Park City Williamsburg City
60% Accomack Buckingham Caroline Charlotte Dinwiddie
Fairfax Halifax Henrico (60.2) King and Queen Lunenberg
Mecklenburg Northampton Prince Edward Roanoke City
Prince George Prince William Richmond County Southampton
Westmoreland Fredericksburg city Alexandria City Chesapeake
City Lynchburg City Virginia Bch City
38

50% Essex Nottoway Surry Hopewell City Martinsville City
Newport News City Suffolk City
40% Brunswick Charles City County Sussex Danville City
Hampton City Norfolk City Portsmouth City Richmond City
30% Greensville Emporia City Franklin City
20% (none)
10% Petersburg City (17.7)
1992 and 1996 Ross Perot: Weak in Virginia
The Missing White Voter Theory says Rural Virginia
counties where Ross Perot performed best in 1992 are the
most likely missing voter pool, but Perot underperformed in
Virginia. According to the 2013 Sean Trende articles, the
best statistical correlations for the “missing white voter”
is a county-level Ross Perot 1992 percentage above the
national Perot 18.91%. Of course, this three-way election
took place 20 years ago, but in any event in 1992 Virginia
Ross Perot achieved 13.63%, 5.18 percentage points below his
national percentage. Perot finished third in every
jurisdiction, and finished above his national 18.91% in only
three jurisdictions: Manassas Park City (20.70%),
39

Gloucester (19.78%) and Matthews (19.54%). Perot’s worst
jurisdiction was Petersburg City, the least Caucasian
jurisdiction in Virginia (17.7 percent), and he scored
below-national in all the major population center
jurisdictions. In the 1996 Perot encore run50, Perot
achieved a national 8.40 percent and a Virginia 6.62
percent, and performed above 7 percent in 88 of the 135
jurisdictions. The two-decades-past nature of the Perot runs
is highly relevant today, because Virginia of 2012 is
fundamentally different from Virginia of 1992-2000, when
Virginia was not targeted by the Clinton or Gore campaigns.
Actual Virginia Registration Data Show That Voter Registration ROSE by
900,000 Between 2004 and 2012, And By 394,173 Between 2008 and 2012
More than 900,000 Virginians were added to the
registration rolls between 2004 and 2012, and thus if they
went “missing”, it was only by their own choice. Perusal of
the Voter Turnout Reports for 2004, 2008 and 2012 on the
Virginia State Board of Elections website51 shows the
following actual voter movements:
50 Not discussed in any of the Trende articles.
51 www.sbe.virginia.gov, “Results and Reports”, “Election Results”, “Voter Turnout Report.”
40

Between 2004 and 2012, total Virginia voter
registration rose from 4,517,980 to 5,428,833, an
increase of 910,853.
In this eight-year span, registration from 2004 to 2008
rose by 516,680, and between 2008 and 2012, rose by
another 394,173.
Unlike Ohio, Virginia is a growing state52, and 82 percent of
the registration and voting growth took place in the 58
metropolitan jurisdictions, not in the Coal Country,
Appomattox, Southside, the Shenandoahs or the Eastern Rural
counties. Of the 910,853 commonwealth-wide registration
increase between 2004 and 2012, only 156,513 occurred in the
76 Rural Virginia jurisdictions. Of the 673,690 growth in
the total vote for any office, only 115,288 occurred in
Rural Virginia. In terms of registered non-voters, between
2004 and 2012 this category grew by 237,163 in the entire
commonwealth, but only by 41,225 in Rural Virginia.
Virginia Voting 2004 To 2012: Total Vote Up, Democrats Ahead Five-to-One
Between 2004 and 2012, the Virginia total Presidential
vote rose by 656,122, but only 105,563 went to the
Republicans and 517,078 went to the Democrats. On the actual
voting front, between 2004 and 2012:
52 Between the 2000 Census and 2010 Census, Virginia added 922,509, whereas Ohio added only 183,364.
41

The total Virginia vote for any office rose by 673,690.
The total vote for President rose by 656,122, from
3,198,367 to the 2012 and all-time high number of
3,854,489 – three successive all-time highs.
In between, the total vote for any office rose from
3,223,156 in 2004 to 3,752,858 in 2008 to 3,896,846 in
2012 – three successive all-time highs.
Virginia is still in the 19-state minority that has neither
early voting nor no-excuses absentee or mail ballot voting.
The Absentee Ballot Application on the Virginia State Board
of Elections website requires voters to list a specific
reason, although one of the eligible reasons is a vacation
on Election Day (but the voter must list the destination).
In 2012, the counted absentee ballot number was 447,907,
which was 11.49 percent of the total vote. Provisional
ballots in 2012 were only 10,151 or 26 one hundredths of a
percent of the commonwealth total vote.
On the partisan vote for President front:
The Republican raw vote between 2004 and 2008 rose
by only 8,046, whereas the Democratic number rose
by 504,790 – a 62-to-1 ratio.
Between 2008 and 2012, the Republican raw vote
went up by 97,517, the seventh-largest Romney
state-level gain in the United States and 9.93
42

percent of the Romney national net over-McCain
gain of 981,912.
Between 2004 and 2008, the Democratic raw vote for
President rose by 504,790, 63 times more than the
Republican increase.
Between 2008 and 2012, the Democratic raw vote for
President increased by only 12,288, but the
Democratic 2008 margin was 234,527, meaning
President Obama won by 149,298.
The total vote for “other” Presidential candidates
rose from 26,666 in 2004 (when Ralph Nader was
only a write-in, and 21,193 went to the
Libertarian or Constitution tickets) to 38,723 in
2008 (Nader on-ballot 11,483) and then almost
doubled to 60,147 in 2012, but only 13,058 went to
Virginia-5 ex-Congressman Virgil Goode, and 31,216
went to the Libertarian ticket.
The number of voters who cast ballots but who
skipped the Presidential elector line: 24,759 in
2004, 29,598 in 2008, and 42,357 in 2012.
Thus, in Virginia between 2004 and 2012:
Total registration increased by 910,853,
starting with a 516,680 gain in 2008, followed
by another 394,173 in 2012.
The total vote for any office rose by 673,690.
43

The total Presidential vote rose by 656,122.
The Democratic raw vote for President rose five
times more than the Republican raw vote, with
the bulk of the increase in 2008.
The number of persons who skipped the
Presidential option but otherwise voted fell
from rose from 24,759 to 42,357 -- the 2012
number is 28.37% of the President Obama margin.
The Republican commonwealth-wide gained vote
number of 105,563 is barely one-eighth of the
registration increase between 2004 and 2012.
If in 2016 the 2012 Democratic number remains static,
Republicans need another 150,000 votes to win Virginia by a
post-1860 record close margin of a raw 702. To avoid facing
America’s best statewide Democratic election protection and
recount operation (the one led by Jack Young), Republicans
would be advised to aim for 160,000 to 200,000. This could
come from flipping 100,000 Democratic votes, or under The
Missing White Voter Theory, from a Rural Virginia electorate
of 200,000 that “stayed home” in 2012 rather than choose
between Mitt “47 percent” Romney and President Obama.
In Every Presidential Year, Over One Million Registered Virginia Voters Do
Not Vote
44
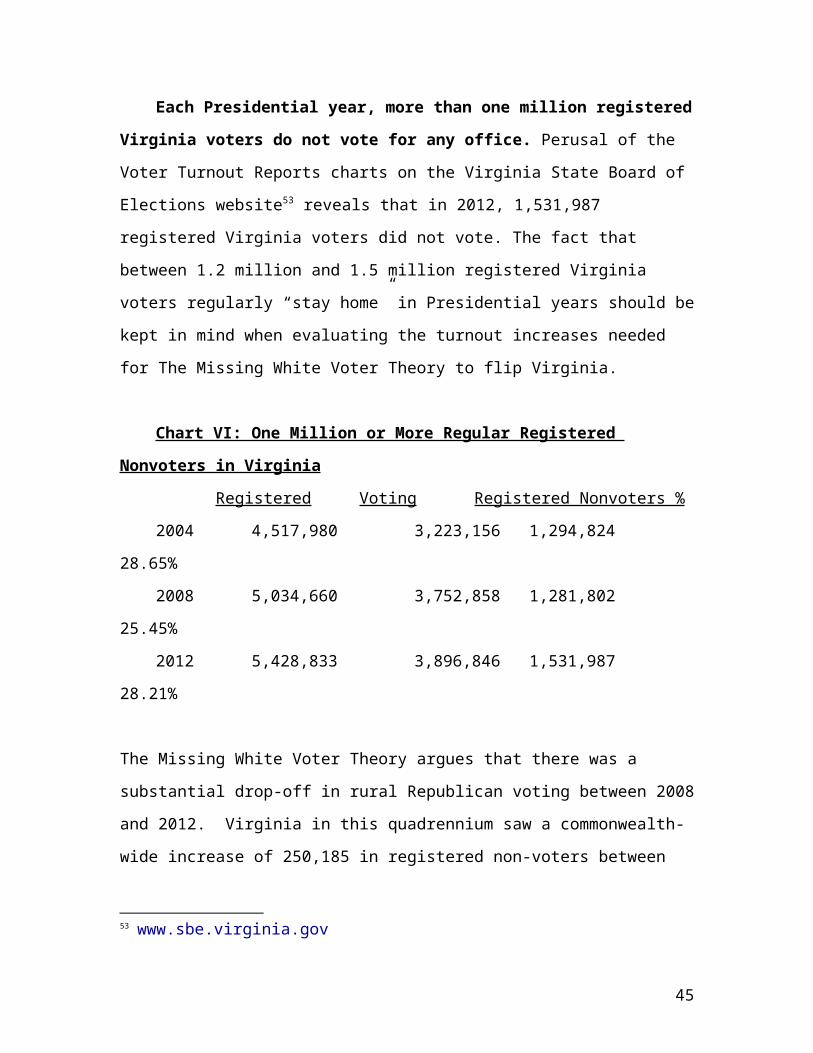
Each Presidential year, more than one million registered
Virginia voters do not vote for any office. Perusal of the
Voter Turnout Reports charts on the Virginia State Board of
Elections website53 reveals that in 2012, 1,531,987
registered Virginia voters did not vote. The fact that
between 1.2 million and 1.5 million registered Virginia
voters regularly “stay home” in Presidential years should be
kept in mind when evaluating the turnout increases needed
for The Missing White Voter Theory to flip Virginia.
Chart VI: One Million or More Regular Registered
Nonvoters in Virginia
Registered Voting Registered Nonvoters %
2004 4,517,980 3,223,156 1,294,824
28.65%
2008 5,034,660 3,752,858 1,281,802
25.45%
2012 5,428,833 3,896,846 1,531,987
28.21%
The Missing White Voter Theory argues that there was a
substantial drop-off in rural Republican voting between 2008
and 2012. Virginia in this quadrennium saw a commonwealth-
wide increase of 250,185 in registered non-voters between
53 www.sbe.virginia.gov
45

2008 and 201254. If 100 percent of these 250,185 magically
reappear in 2016 and vote 97 percent Republican, the Obama
2008 margin is trumped by all of 513 votes55; if they vote
80 percent Republican, 18 percent Democratic and 2 percent
Others, the 2012 Obama margin of 149,298 is trumped by 5,817
from a net 155,115 Republican increase.56
However, Mr. Trende in his articles uses a 55 percent
turnout rate, which results in only 137,601 new voters, a
number that falls short of both the 2012 and 2008 Obama
margins.
At a still-improbable 70% turnout rate (175,129 new
voters), Republicans need 92 percent (plus 161,118, offset
by Democratic 6% or 10,507) to trump the 2012 Obama margin
by all of 1,312 votes. At even more improbable turnout
rates of 75 to 95 percent, Republicans still need between 89
and 81 percent to trump the 2012 Obama margin:
At 75% = 187,638 = 89% = R 166,997 minus D 9% = 16,887 =
150,109
At 80% = 200,148 = 87% = R 174,128 minus D 11% = 22,016 =
152,111
54 The 2004 – 2012 increase is 237,163. 55
? 250,185 times Republican 97 percent (plus 242,679) offset by 2 percentDemocratic (5,003) and 1 percent Others (2,501) = Republican net plus 237,676.
56 250,185 times Republican 80 percent (plus 200,148) offset by 18 percent Democratic (45,033) and 2 percent Others (5,003) equals Republican net plus 155,115.
46

At 85% = 212,657 = 85% = R 180,758 minus D 13% = 27,645 =
153,112
At 90% = 225,166 = 83% = R 186,887 minus D 15% = 33,774 =
153,112
At 95% = 237,675 = 81% = R 192,516 minus D 17% = 40,404 =
152,111
If one compares 2004 and 2012, one finds that there was
an increase of only 41,225 registered non-voters in the 76
Rural Virginia jurisdictions, contrasted by the 195,938
increase in the 58 Metropolitan Virginia jurisdictions. The
55 percent turnout rate used by Trende applied to the growth
in registered non-voters between 2004 and 2012 adds only 22,673 new
Rural Virginia voters and 107,765 new Metropolitan Virginia
voters – even combined, these numbers fall short of the 2012
Obama margin, not to mention 2008.
47

Rural Virginia: ____395,683 Registered 2012 Nonvoters – Republicans Need
100 Percent Turnout and a 68 or 80 Percent Performance, and Higher If the
Turnout Is Less than 100 Percent
In 2008 and 2012, candidate or President Barack Obama
carried 11 Northern Virginia jurisdictions, both University
of Virginia jurisdictions, 6 Greater Richmond jurisdictions,
8 Hampton Roads jurisdictions, 5 Southside jurisdictions, 4
Eastern Rural jurisdictions, 4 Appomattox jurisdictions, 5
Shenandoah Valley jurisdictions, and only one Coal Country
jurisdiction (Radford City). In 2008 and 2012, McCain or
Romney carried the 11 Northern Virginia exurban
jurisdictions, 13 Greater Richmond jurisdictions, 6 Hampton
Roads jurisdictions, 11 Appomattox jurisdictions, 8
Southside jurisdictions, 6 Eastern Rural jurisdictions, 11
Shenandoah Valley jurisdictions, and 20 Coal Country
jurisdictions. Between 2008 and 2012, only two
jurisdictions flipped, both from Obama to Romney: the
Eastern Rural county of King and Queen, and the Shenandoah
Valley county of Montgomery.
The 395,683 registered 2012 nonvoters in Rural Virginia
flip the commonwealth only with respect to the 2012 Obama
margin and only at an improbable 100 percent turnout that
breaks 68 percent Republican, 30 percent Democratic57, and 257 395,683 times 68 percent Republican (plus 269,064) offset by Democratic 30 percent (118,704) and 2 percent Others (7,913) = net Republican gain of 150,360, beating the 2012 Obama margin by a raw 1,062votes.
48

percent Others; to beat 2008, the turnout must be 100
percent and the Republican percentage 80 percent58.
However, Mr. Trende in his articles uses a 55 percent
turnout rate, which adds only 217,625 new voters, a number
that facially underperforms the 2008 Obama margin and trumps
the 2012 Obama margin only at 84 percent Republican.59 The
highest percentage Romney 2012 Virginia jurisdiction is
Tazewell County in Coal Country at 78.07%. There are nine
others at 70 percent or above, and another five at 68 or 69
percent; in these Top Fifteen Romney counties, the numbered
of registered voters who did not vote for President is
106,899, less than the Obama 2012 margin.60 Of these
fifteen, twelve are in the 76 Rural Virginia jurisdictions,
and three are Metropolitan – Colonial Heights and Powhatan
in Greater Richmond, and Poquoson in Hampton Roads.
58 395,683 times 80 percent Republican (plus 316,546) offset by Democratic 20 percent (79,136) and 2 percent Others (7,913) = net Republican gain of 237,410, beating the 2008 Obama margin by a raw 2,883.59
? 217,625 times Republican 84 percent (plus 182,805), offset by Democratic 14 percent (30,467) and Others 2 percent (4,352) = net Republican gain of 152,338.
60 From the David Leip U.S. Election Atlas website:
PlaceCountyTotal VotesRankRomney1Tazewell17,732113,843 78.07%2Poquoson7,10615,312 74.75%3Scott9,99217,439 74.45%4Wise15,018111,076 73.75%5Bland2,94812,144 72.73%6Powhatan15,525111,200 72.14%7Lee9,59816,847 71.34%8Bedford37,425126,679 71.29%9Washington25,632118,141 70.77%10Augus
ta33,672123,624 70.16%11Rockingham34,866124,186 69.37%12Colonial
Heights8,62415,941 68.89%13Campbell25,696117,695 68.86%14Botetourt18,241112,479 68.41%15Patrick8,25915,622 68.07%
49

If The 395,683 Registered 2012 Rural Virginia Nonvoters Turn Out At Less
Than 38 Percent, Republicans Mathematically Cannot Win
Republicans mathematically cannot win if registered
nonvoter turnout is less than 38 percent. If Republicans
cannot turn out 100 percent of the Rural Virginia registered
nonvoter 395,683, the target Republican percentage rises
proportionally to even more improbable levels. If turnout is
below 59 percent, Republicans mathematically cannot top the
2008 Obama margin. If turnout is below 38 percent,
Republicans mathematically cannot top the 2012 Obama margin:
90 percent turnout (356,114) – 82 percent
Republican to beat 2008, 70 percent to beat
2012.61
80 percent turnout (316,546) – 87 percent
Republican to beat 2008, 73 percent to beat
2012.62
61 356,114 x .82 = 292,013 new Republican, offset by Democratic 16 percent (56,978) = R net + 235,034 beating Obama 2008 by a raw 507.
356,114 x .70 = 249,279 new Republican, offset by Democratic 28 percent (99,711) = R net + 149,567, beating Obama 2012 by a raw 269.
62 316,546 x .87 = 275,395 new Republican, offset by Democratic 11 percent (34,820) = R net + 240,575, beating Obama 2008 by a raw 6,048.
316,546 x .73 = 231,078 new Republican, offset by Democratic 25 percent (79,136) = R net + 151,941, beating Obama 2012 by a raw 2,643.
50

70 percent turnout (276,978) – 92 percent
Republican to beat 2008, 76 percent to beat
2012.63
65 percent turnout (257,193) – 95 percent
Republican to beat 2008, 79 percent to beat
201264.
60 percent turnout (237,409) – can beat 2008 Obama
margin by one raw vote only at 99 percent
Republican and 1 percent Democratic; 81 percent to
beat 2012.65
Note that the Missing White Voter Theory national estimates
assume a 55 percent turnout66, but in Virginia, this cannot 63
? 276,968 x .92 = 254,819 new Republican, offset by Democratic 6 percent(16,618) = R net + 238,200, beating Obama 2008 by a raw 3,673.
276,968 x .76 = 210,495 new Republican, offset by Democratic 22 percent (60,932) = R net + 149,562, beating Obama 2012 by a raw 264. 64 257,193 x .95 = 244,333 new Republican, offset by Democratic 3 percent (7,715) = R net + 236,617, beating Obama 2008 by a raw 2,090.
257,193 x .79 = 203,182 new Republican, offset by Democratic 19 percent (48,866) = R net + 154,316, beating Obama 2012 by a raw 5,018.
65 237,409 x .99 = 235,034 new Republican, offset by no more than Democratic 506 (0.0000042, zero to Others) = R net + 234,528 – one raw vote ahead of the 2008 Obama margin.
237,409 x .81 = 192,301 new Republican, offset by Democratic 17 percent (40,359) = R net + 151,941, beating the 2012 Obama margin by a raw 2,643. 66 In his June 21, 2013 article, Trende stated under point 1: “If we assume that these “new” voters would vote at a 55 percent rate . . .”
51

top Obama 2008 and defeats Obama 2012 only at 85 percent
Republican:
55 percent turnout (217,625) – can top 2012 only
at 84 percent Republican.67
50 percent turnout (197,841) – can barely top 2012
at 87 percent Republican.68
45 percent turnout (178,057) – can barely top 2012
at 91 percent Republican.69
40 percent turnout (158,273) – can barely top 2012
at 97 percent Republican and zero Democratic.70
38 percent turnout (150,359) – can barely top 2012
by a raw 345 only at 99.5 percent Republican and
zero Democratic.71
37 percent turnout (146,402) – mathematically
cannot top the 2012 Obama margin of 149,298.
67 217,625 x .84 = 182,805 new Republican, offset by Democratic 14 percent (30,467) = R net + 152,338, beating the 2012 Obama margin by a raw 3,040. 68 197,841 x .87 = 172,121 new Republican, offset by Democratic 11 percent (21,762) = R net + 150,358, beating Obama 2012 by a raw 1,060.
69 178,057 x .91 = 162,031 new Republican, offset by Democratic 7 percent (12,463) = R net + 149,568, beating Obama 2012 by a raw 270. 70
? 158,273 x .97 = 153,524 new Republican, offset by Democratic 1 percent(1,582) = R net + 151,941, beating Obama 2012 by a raw 643.71
? 150,339 x .995 = 149,643, offset by no more than a Democratic raw 344 to beat Obama 2012 by one raw vote.
52
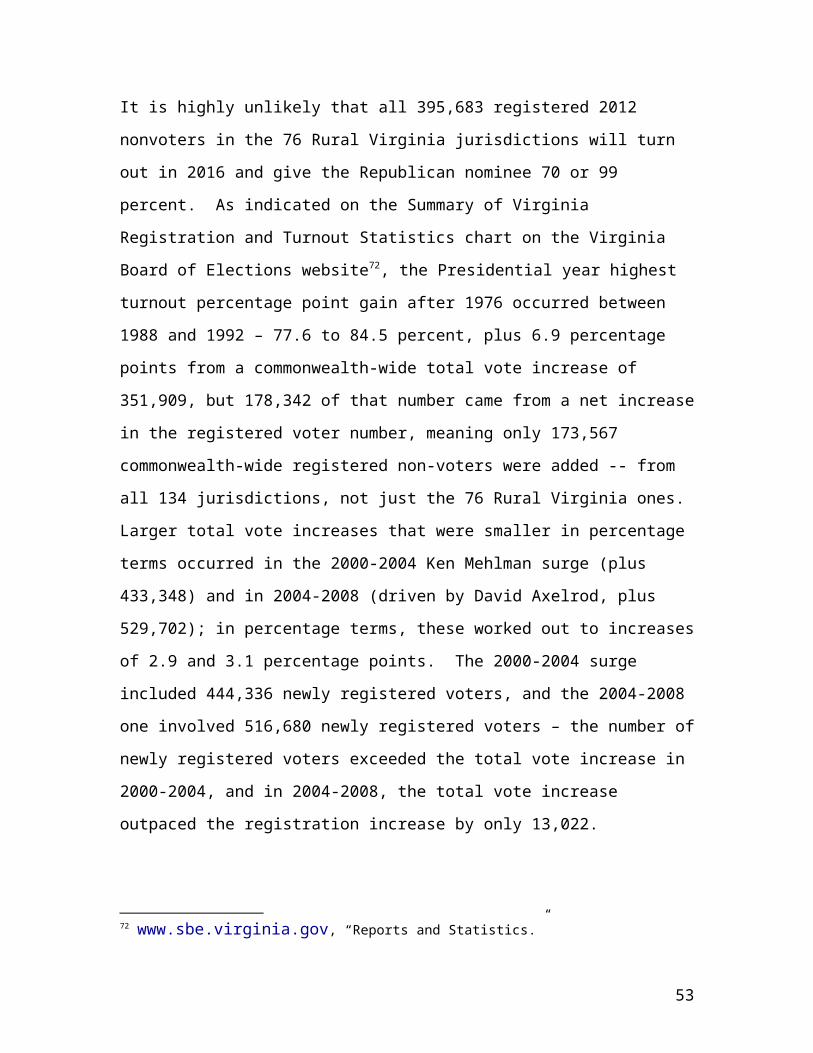
It is highly unlikely that all 395,683 registered 2012
nonvoters in the 76 Rural Virginia jurisdictions will turn
out in 2016 and give the Republican nominee 70 or 99
percent. As indicated on the Summary of Virginia
Registration and Turnout Statistics chart on the Virginia
Board of Elections website72, the Presidential year highest
turnout percentage point gain after 1976 occurred between
1988 and 1992 – 77.6 to 84.5 percent, plus 6.9 percentage
points from a commonwealth-wide total vote increase of
351,909, but 178,342 of that number came from a net increase
in the registered voter number, meaning only 173,567
commonwealth-wide registered non-voters were added -- from
all 134 jurisdictions, not just the 76 Rural Virginia ones.
Larger total vote increases that were smaller in percentage
terms occurred in the 2000-2004 Ken Mehlman surge (plus
433,348) and in 2004-2008 (driven by David Axelrod, plus
529,702); in percentage terms, these worked out to increases
of 2.9 and 3.1 percentage points. The 2000-2004 surge
included 444,336 newly registered voters, and the 2004-2008
one involved 516,680 newly registered voters – the number of
newly registered voters exceeded the total vote increase in
2000-2004, and in 2004-2008, the total vote increase
outpaced the registration increase by only 13,022.
72 www.sbe.virginia.gov, “Reports and Statistics.”
53

The Actual Republican Lost Votes in Rural Virginia Are Less Than One
Tenth of the Obama 2012 Margin in Virginia
The 2012 Obama margin in Virginia was 149,298. In the
76 Rural Virginia regions between 2004 and 2012, Republicans
between 2004 and 2012 lost 2,600 votes in the Southside, and
another 10,672 in the Shenandoah Valley counties – a total
of 13,272, which is less than ten percent of the 2012 Obama
margin. As charted in Chart VII below, the registered
nonvoter increase between 2004 and 2012 in the Southside was
all of 176 (this is not a misprint); 27,271 in the
Shenandoah Valley; 3,466 in Coal Country; 8,298 in
Appomattox; and 2,014 in the Eastern Rural counties – adding
these 41,225 simply gives the virtual Republican 2016 ticket
54,497 “missing voters” from Rural Virginia, which still
leaves the Obama 2012 margin ahead by 94,801.
Democrats Gained More Votes Than The Republicans in Rural Virginia Between
2004 and 2012
Coal Country was the only Virginia region -- rural or
metropolitan -- where the Democrats lost votes between 2004
and 2012 – all 12,433 of them. In the 21 Coal Country
jurisdictions Democrats lost a net 12,433 and the
Republicans gained a net 18,468. The registered nonvoter
increase in Coal Country was all of 3,466. Everywhere else,
54

Democrats gained – in Rural Virginia, a total of 62,417 from
the Shenandoah Valley (up 27,318), Appomattox (up 13,069),
Southside (up 12,914) and Eastern Rural (up 9,016). The
Rural Virginia raw gain of 62,417 was 12.07 percent of the
2004-2012 Democratic commonwealth gain of 517,078; the Rural
Virginia net gain of 49,984 was 9.66 percent. In contrast,
the Republican net gain of 36,365 was 34.44 percent of the
Republican commonwealth gain of 105,563, but was outpaced by
the net Democratic gain. What Republicans gained in Coal
Country (net plus 30,901), was ditched by almost half in the
Confederate Republican Southside (down 2,600) and in the
ancestrally Republican Shenandoah Valley (down 10,672).
Republicans gained the most in Appomattox (plus 27,603), but
only 3,566 in the Eastern Rural counties. When the dust
settled, Democrats outpaced the Republicans in Rural
Virginia net gained votes, 49,984 to 36,365.
In Metropolitan Virginia, There Are 1.136 Million Registered Nonvoters In
58 Jurisdictions That Added A Net 412,051 Democratic Votes Between 2004 and
2012
The Metropolitan Virginia registered nonvoter
population is much higher (1,136,304), but these Virginians
live in Northern Virginia (NoVa), Greater Richmond and
Hampton Roads, regions where Democrats gained 465,634 votes
between 2004 and 2012, whereas Republicans lost 8,569 in
55

Hampton Roads and gained only a combined 62,152 in Richmond
and NoVa.
Is there an undiscovered missing Caucasian Republican
electorate in the 58 Metropolitan Virginia jurisdictions?
Not according to the Missing White Voter Theory -- which
predicts these voters exist in Rural Virginia, not
Metropolitan Virginia. However, it deserves review, because
as charted below in Chart IX (Metropolitan Virginia
registration and voting), the total number of 2012
registered nonvoters in Metropolitan Virginia is 1,136,304,
which superficially seems like a large pool where only 21
percent (238,623) need to be found, persuaded and turned out
– at an improbable 100 percent Republican share. If 100
percent of the 1,136,304 remain on the rolls in 2016, turn
out, and break 60 percent Republican, 38 percent Democratic,
2 percent Others, here is what happens:
2016 New Voters
Dem. 2008: 234,527 Dem. Margin + 431,795 new D =
666,322
Dem.2012: 149,298 + 431,795 new
D = 581,093
Republican New Voters: + 681,782 = R 15,460 or R
100,689
As can be seen, the Republican missing voters trump either
Obama margin, – 15,460 against the 2008 margin, and 100,689
56

against the 2012 margin, but only after creating a Virginia
total vote increased by 1,136,304 to 4,859,564 or 4,990,793,
percentage increases above 2008 or 2012 numbers of 30.51 or
29.48, four times the highest percentage gain between 1976 and
2012 – the 1988 Bush-Clinton surge of 351,090, which was a
6.9 point gain over 1988. It would be more than double the
largest Presidential total vote surge in Virginia history,
the 524,893 increase between 2004 and 2008. Thus, there is
no Virginia historical precedent for the turnout surge
required by the Missing White Voter Theory – not even in The
Missing White Voter Theory articles, which use a 55 percent
turnout rate for the “missing voters.” Fifty-five percent of
1,136,304 is 624,967, and to defeat the 2008 Obama margin,
the 2016 Republican ticket will need 68 percent; to top only
the 2012 margin, it will need 61 percent.73 Trouble is, of
the 58 Metropolitan Virginia jurisdictions, only six gave
Mitt Romney percentages in excess of 60 percent: the Greater
Richmond jurisdictions of Colonial Heights City, Powhatan
County, Hanover County, King William County, and New Kent
73 For 2012:
624,967 x 61 percent (Republican plus 381,229) offset by Democratic 37 percent (231,237) = Republican net gain of 149,991, topping the Obama 2012 margin by a raw 693.
For 2008:
624,967 x 68 percent (Republican plus 424,977) offset by Democratic 30 percent (187,490) = Republican net gain of 237,486, topping the Obama 2008 margin by a raw 2,959.
57

County, and in the Hampton Roads area, Poquoson City. The
total number of 2012 registered voters in these
jurisdictions is 137,048, and the total vote for any office
was 110,865, leaving only 26,183 “missing potential
Republican voters.” In other words, the linchpin of The
Theory is registered non-voter turnout or total vote
increases that has never occurred in the history of
Virginia.
Democratic Vote Gains and Republican Vote Losses in Metropolitan
Virginia, 2004-2012
A close analysis of actual registration and actual
voting in the 58 Metropolitan Virginia jurisdictions between
2004 and 2012 shows that Democrats are gaining enough new
votes in Metropolitan Virginia to the point that a 100
percent registered nonvoter turnout in the 76 Rural Virginia
jurisdictions would not matter, because for Democrats:
Richmond rocks – registration in Richmond City and
the 18 suburban jurisdictions rose 154,007, the total
vote rose 136,280, the Democratic Presidential raw
vote rose 107,360, and the Republican Presidential
raw vote rose by only 20,910 – resulting in a
Democratic net gain of 86,450.
58

The nineteen-county Greater Richmond net Democratic
gain of 86,450 add up to 57.90 percent of the 2012
Virginia Obama margin, and 21 percent of the 411,515
commonwealth margin shift between 2004 and 2012.
Hampton Roads is hyper -- in these 15 jurisdictions,
registration rose by a net 174,912, the total vote
rose by a 122,423, but the Republican raw vote fell
by a net 8,569 – and the Democratic raw vote rose by
a net 124,447. This net Democratic gain of 133,016 is
89.09 percent of the Obama 2012 Virginia margin, and
32.32 percent of. the commonwealth margin shift.
Northern Virginia has become the Super-NoVa in the
commonwealth -- in the 24 NoVa jurisdictions
(including the 2 University of Virginia and 11
Double-Republican exurban jurisdictions),
registration rose by 417,190, the total vote rose by
293,338, and the Democratic Presidential raw vote
rose by 233,827, whereas the Republican vote rose by
only 41,242. In the two University of Virginia and
the 11 Double-Obama jurisdictions in Northern
Virginia, the Democratic raw vote rose by 199,043 and
the Republican rose by only 21,643. Even in the 11
exurban Double-Republican jurisdictions, Democrats
gained 34,744, whereas Republicans gained only
19,599. The Republican vote is static, and Democrats
are moving in and up. The Democratic margin of
59
192,385 from these 24 jurisdictions is the
commonwealth-wide 2012 margin plus 43,087.
The Northern Virginia 11 Double-Obama jurisdiction net Democratic gain of 167,089 was recognized by the 2011 tri-Republican redistricters of the Virginia U.S. House districts, who dumped as many Democrats as possible into theJim Moran district 8 and the Gerald Connolly district 11, and kept enough Republicans in the Frank Wolf district 10 that Wolf was reelected and Mitt Romney carried the districtby a raw 4,218. The 2012 NoVA and UVa results are the Virginia version of the Sean Trende March 18, 2011 Real Clear
Politics article: “Obama Should Use "Colorado Strategy" to WinOhio”, in which Trende urged Democrats to focus on white-collar voters with college degrees, who are even more prominent in Northern Virginia than in Columbus, Ohio.
The Missing White Voter Theory Registered Nonvoter Turnout Has Never
Occurred in Virginia, And Republican Caucasian Solidarity Appeals Will Turn Off
Voters in Metropolitan Virginia
Virginia electoral history will be made if enough of
the current registered nonvoters (or unregistered eligibles)
will both turn out in 2016 and break Republican at the
60

percentage levels needed to flip the commonwealth. Most
studies of nonvoters conclude that they are similar to the
voting population, or are more liberal on economic issues
(and perhaps conservative on social issues). If the
Republican nominee in 2016 relies on white resentment
appeals to this “hidden” nonvoting (or even nonregistered)
electorate, he or (not likely) she runs the risk of
alienating existing Republican voters in Metropolitan
Virginia – as Sean Trende stated at the end of in his July
2, 2013 article, “every action in politics tends to create an
opposite one.” Trende has repeatedly noted in his The Lost
Majority and elsewhere, that adding a new element to a
coalition frequently induces existing loyalists to “head for
the exits” (this happened to the Democratic Party in fits
and starts between the 1934 election of the first African-
American Democratic Congressmember in Illinois-1 and the
post-1964 departure of most Deep Southern Caucasians).
Thus, Trende’s own coalition analysis militates against the
idea that the Missing White Voters can flip any state. In
1964, Republican Deep South appeals to registered and
unregistered segregationists flipped the 1960 Kennedy states
of Georgia, Alabama, Louisiana, and South Carolina, plus
Mississippi, but cost the Republicans everything else.
Within 1960 Nixon states of Virginia, Florida, and
Tennessee, Republicans flipped 1960 Democratic counties full
of segregationists, but suffered decisive counterflips of
61
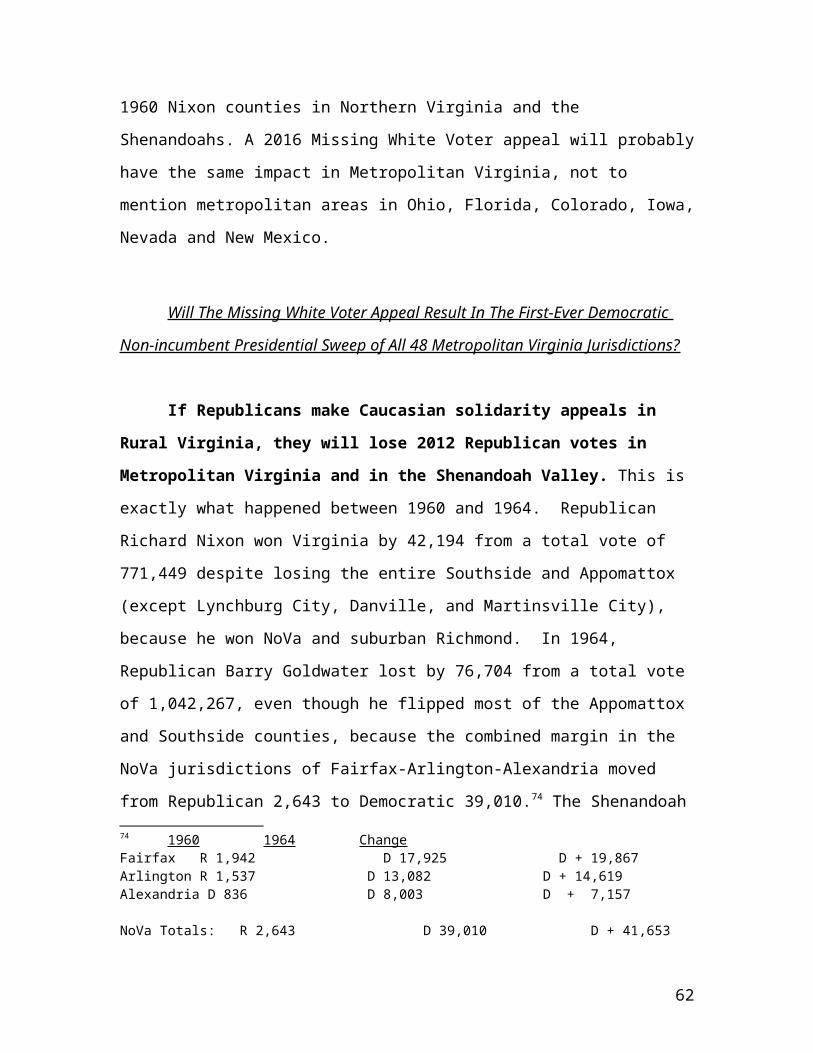
1960 Nixon counties in Northern Virginia and the
Shenandoahs. A 2016 Missing White Voter appeal will probably
have the same impact in Metropolitan Virginia, not to
mention metropolitan areas in Ohio, Florida, Colorado, Iowa,
Nevada and New Mexico.
Will The Missing White Voter Appeal Result In The First-Ever Democratic
Non-incumbent Presidential Sweep of All 48 Metropolitan Virginia Jurisdictions?
If Republicans make Caucasian solidarity appeals in
Rural Virginia, they will lose 2012 Republican votes in
Metropolitan Virginia and in the Shenandoah Valley. This is
exactly what happened between 1960 and 1964. Republican
Richard Nixon won Virginia by 42,194 from a total vote of
771,449 despite losing the entire Southside and Appomattox
(except Lynchburg City, Danville, and Martinsville City),
because he won NoVa and suburban Richmond. In 1964,
Republican Barry Goldwater lost by 76,704 from a total vote
of 1,042,267, even though he flipped most of the Appomattox
and Southside counties, because the combined margin in the
NoVa jurisdictions of Fairfax-Arlington-Alexandria moved
from Republican 2,643 to Democratic 39,010.74 The Shenandoah74 1960 1964 ChangeFairfax R 1,942 D 17,925 D + 19,867Arlington R 1,537 D 13,082 D + 14,619Alexandria D 836 D 8,003 D + 7,157
NoVa Totals: R 2,643 D 39,010 D + 41,653
62

Valley also flipped – in 1960, Richard Nixon carried every
county on future Interstate 81 between Alleghany and
Frederick, whereas in 1964, Barry Goldwater lost every
county except Shenandoah, Page, Augusta and Highland, and in
these four counties his winning percentages were no higher
than the 55.54% in Shenandoah, which was an 11.31 percentage
point decline from 1960. Of course, in 1960 and 1964
Democrats won Coal Country, the one Virginia region where
Republicans gained votes between 2004 and 2012.
Virginia 1964 and 1960: Flipping Coalitions
1964
1960
Commonwealth: R 42,194 D 76,704 D + 118,898
63

By Every Metric Inside and Outside The Theory, The Theory Cannot Flip
Virginia
As can be seen, the 55 percent turnout rate expressly
used in the Trende articles can be applied to the Census-
estimated commonwealth-wide NHW unregistered eligible, Census-
commonwealth-wide estimated gap between NHW registered and NHW
voting, and both the actual registered nonvoters in 2012
Rural Virginia and the growth in Rural Virginia registered
nonvoters between 2004 and 2012, The Theory simply does not
generate enough new voters even at 100 percent Republican to
flip either the 2012 or the 2008 Obama margins of 149,298 or
234,527 except when applied to the actual 2012 registered
nonvoter number in Rural Virginia, 89 percent of whom did
not vote in 2004 either.
Chart XI: The 55 Percent Turnout Rate Applied To Nonvoting
Populations in Rural Virginia
Census estimated NHW unregistered eligible,
commonwealth-wide: 216,000 x .55 = 118,800
Census estimated gap NHW registered and voting,
commonwealth-wide: 134,000 x . 55 = 73,700
Actual Rural Virginia 2012 registered nonvoters:
395,683 x.55 = 217,625 – can defeat 2012 Obama margin only
at 85 percent Republican, 13 percent Democratic.
64

Growth in Rural Virginia registered nonvoters between
2004 and 2012: 41,225 x . 55 = 22,673
If The Theory using its own estimates and real world
registration and voting numbers cannot generate enough new
voters to defeat the 2008 Obama margin, and defeats the 2012
Obama margin only at 85 percent Republican, it cannot flip
Virginia. If The Theory cannot flip Virginia, it is
irrelevant to the Electoral College outcome unless it flips
Iowa, New Mexico, or one of the 2004 John Kerry states such
as Pennsylvania.
Strategy for Republicans: Eliminate the Gender and Nonwhite Gaps
Instead of chasing unregistered or registered nonvoting
Missing White Voters, Republicans would be better off trying
to win back Greater Richmond, the Hampton Roads area, and of
course Northern Virginia by eliminating the gender gap,
increasing the Republican African-American percentage to 25
percent, increasing the Republican Asian-American percentage
to 50 percent, and aiming for a 50 percent Republican
Hispanic percentage.
65

In The Emerging Republican Majority, Kevin Phillips noted the
largely unnoticed Republican appeal to Asian and Hispanic
nonwhites in 1968:“. . . far from being opposed by all non-whites, Richard Nixon wasstrongly supported by one non-white group – the Chinese. San Francisco’s Chinese electorate was more Republican in 1968 than the city’s white population.”75
and that“[In New York] Richard Nixon averaged 20 per cent to 25 per cent in the Puerto Rican precincts of East Harlem compared with his 5 per cent levels in the nearby solidly Negro election districts of central Harlem . . . As for the city’s prosperous Chinese and Japanese population, they tend to be conservative and Republican. Chinatown, located in lower Manhattan, is the strongest Republicanenclave in the area. Many other orientals – both Chinese and Japanese – live along Manhattan’s Upper West Side, where once again they are more generally Republican than most of their neighbors . . . Richard Nixon carried New York’s Chinatown, just as he won the much larger Chinatown in San Francisco. Racial politics in the Northeast is more complex than a simple polarization of whites and non-whites.”76
In 2012, it appears Republicans have reverted to the stance
of the ill-informed Kevin Phillips critics of 1969. The
Asian-American vote that exit polled evenly split between
President Bush the Elder and Bill Clinton in 1992 in 2012
was 70 percent Democratic, as was the Hispanic vote.
In the largest total vote jurisdiction in Virginia
(Fairfax County77), Asian-Americans are 17% of the
75 Kevin Phillips, The Emerging Republican Majority, page 471. 76 Kevin Phillips, The Emerging Republican Majority, pages 110-111.
77 2012 Presidential 529,287. Its’ nearest competitor is Virginia BeachCity with 196,941.
66

population and Hispanics are 16% -- if Republicans
eliminated the lopsided Democratic 70-30 margins among 33
percent of the Fairfax County population, they might
eliminate the Fairfax County 2012 Democratic margin of
108,500, and the Arlington County margin of 46,795, not to
mention the Loudoun County margin of 12,787 and the Prince
William County margin of 28,873 – in these counties, Asian-
Americans are 9.9 percent, 16.0 percent and 8.1 percent of
the 2010 Census population, and the Hispanic percentages are
15.4, 12.9 and 20.8. If the Republicans accomplished these
goals, they would eliminate 196,955 from the Democratic
column – and blow past the 2012 Obama margin in Virginia.
With another 50,000, Republicans could nose past the 2008
Obama margin in Virginia -- and with cloned suburban appeals
elsewhere, blow past the Obama margins in enough other
states to win the Electoral College.
However, Republicans are no longer able to generate big
margins from high-vote jurisdictions in Virginia. The only
2012 jurisdictions with 100,000 or more total Presidential
votes carried by Mitt Romney are Virginia Beach City (total
vote 196,641) and the Richmond suburb of Chesterfield County
(170,988) – and in these locales, the Romney margins were
4,992 and 13,240 -- even combined, less than one fifth of
the Democratic margin in Fairfax County (108,500). Moreover,
in 2004, the Republican margin in Virginia Beach City was
33,086, and in Chesterfield County was 34,399, meaning from
67

these two still-Republican locales Republicans have lost
49,253 in margin – more than the 18,468 gained (and
Democratic 12,433 loss) in Coal Country, but don’t discount
the 3,466 Coal Country registered nonvoters waiting in the
hollows for the Republican 2016 equivalent of the Byrd
Machine’s Black Satchel Brigade.78 If Republican
strategists wish to double down on the unregistered,
nonvoting angry white male population, be my guest as
Democrats on January 20, 2017 celebrate a third consecutive
White House inauguration (the first since 1949) -- just
don’t bet on the Missing White Voter Theory to obtain any
inaugural tickets.
Chart VII: 2012, 2004 TURNOUT In The 76 Rural Virginia Jurisdictions
County Registered Voting Difference 04 Reg 04 Vot
04 Diff
21 Coal Country
78
? Frank Atkinson, The Dynamic Dominion, page 14.
68

One Double-Obama
Radford City 8,331 5,421
minus 2,910 7,247 4,900 – 2,347
20 Double-Republican
Bland 4,692 3,082
minus 1,610 4,380 2,911 – 1,469
Carroll 18,977 13,083
minus 5,894 17,311 12,162 – 5,149
Galax City 3,831 2,400
minus 1,431 3,807 2,349 – 1,458
Giles 11,522 8,046
minus 3,476 10,774 7,588 – 3,186
Scott 16,233 10,124
minus 6,109 16,184 10,232 – 5,952
Tazewell 29,062 18,673
minus 10,359 28,051 17,663 –10,388
Smyth 19,772 12,908
minus 6,864 18,689 12,484 – 6,205
Lee 16,559 9,727
minus 6,832 15,801 9,979 -- 5,823
Wise 24,280 15,204
minus 9,076 24,066 14,496 – 9,070
Dickenson 11,405 7,067
minus 4,338 11,895 7,526 – 4,369
Buchanan 16,569 9,830
minus 6,739 17,023 10,040 – 6,983
69

Russell 19,598 12,348
minus 7,250 18,833 11,662 – 7,171
Washington 36,730 25,827 minus
10,903 32,778 22,978 – 9,800
Bristol City 12,384 7,437
minus 4,947 11,166 6,905 – 4,261
Wythe 19,062 13,017
minus 6,045 17,277 11,782 – 5,495
Craig 3,855 2,719
minus 1,136 3,611 2,642 -- 969
Floyd 10,478 7,744
minus 2,734 9,408 6,943 – 2,465
Pulaski 21,772 14,753
minus 7,019 20,633 14,338 –6,295
Norton City 2,594 1,580 minus
1,014 2,507 1,527 -- 980
Grayson 10,606 7,245 minus
3,361 10,573 7,206 – 3,367
SUBTOTALS: 309,981 202,814 minus 107,167
302,014 198,313 minus 103,701
Registration: up 7,967
Voting: up 4,501
Registered nonvoters: 107,167 in 2012, 103,701 in 2004 (up
3,466)
70

17 Shenandoah Valley
5 Double Obama
Lexington City 4,135 2,787 minus 1,348
3,454 2,377 -- 1,077
Roanoke City 64,566 40,751 minus 23,815
56,540 36,145 – 20,395
Staunton City 15,791 11,280 minus 4,511
13,410 9,674 -- 3,736
Harrisonburg City 24,551 15,721 minus 8,830
16,704 11,072 – 5,632
Covington City 3,839 2,437 minus 1,402
3,741 2,359 -- 1,382
Obama 2008, Romney 2012
Montgomery 61,937 41,307 minus 20,630
45,079 31,708 – 13,371
11 Double Republican
Alleghany 10,645 7,584 minus 3,061
10,581 7,348 – 3,233
Augusta 45,721 35,001 minus 10,720
38,663 29,785 – 8,778
Bath 3,366 2,340 minus
1,066 3,359 2,323 -- 1,037
Botetourt 23,697 18,388 minus 5,309
21,152 16,024 – 5,128
71

Highland 1,778 1,456 minus 322
1,989 1,555 -- 434
Roanoke County 68,836 51,622 minus 17,214
61,888 47,315 – 14,573
Rockbridge 14,349 10,607 minus 3,742
12,607 9,461 – 3,146
Lynchburg City 54,434 36,716 minus 17,718
38,857 26,883 – 11,974
Buena Vista City 4,200 2,575 minus 1,625
3,578 2,402 -- 1,176
Salem City 17,196 12,398 minus 4,798
15,652 11,535 – 4,117
Waynesboro City 12,713 8,844 minus 3,869
11,423 8,042 -- 3,381
SUBTOTALS: 431,754 301,814 minus 129,940
358,677 256,008 –102,669
Registration: up 73,077
Voting: up 45,806
Registered nonvoters: 129,940 in 2012, 102,669 in 2004 (up
27,271)
15 Appomattox
4 Double-Obama
Nelson 10,985 8,289 minus 2,696
9,747 7,195 – 2,552
72

Buckingham 10,316 7,611 minus 2,705
8,784 6,082 – 2,702
Prince Edward 14,404 9,752 minus 4,652
11,270 7,468 – 3,802
Martinsville City 9,204 6,314 minus 2,890
8,596 5,677 – 2,919
11 Double-Republican
Appomattox 10,663 8,078 minus 2,585 9,228
6,727 – 2,501
Amherst 20,398 15,541 minus 4,857 17,791
12,924 – 4,867
Campbell 36,320 26,775 minus 9,545 30,698
23,098 – 7,600
Cumberland 6,932 5,097 minus 1,835 6,114
4,207 – 1,907
Franklin County 35,825 26,855 minus 8,970 29,683
22,352 – 7,131
Nottoway 9,368 6,908 minus 2,460
8,598 6,063 – 2,535
Orange 22,795 16,543 minus 6,252
18,362 13,145 – 5,217
Bedford City 4,027 2,850 minus 1,177
3,660 2,557 – 1,103
Bedford County 49,351 37,602 minus 11,749 41,463
31,561 – 9,902
73

Madison 9,067 6,822 minus 2,245
7,798 5,852 – 1,946
Greene 12,382 9,066 minus 3,316
9,739 6,987 – 2,752
SUBTOTALS: 262,037 194,103 minus 67,934 221,531
161,895 – 59,636
Registration: up 40,506
Voting: up 32,208
Registered nonvoters: 2012 – 67,934; 2004 -- 59,636 (up
8,298)
13 Southside
5 Double-Obama
Danville 29,480 21,138 minus 8,342
28,419 19,298 minus 9,121
Greensville 6,821 4,963 minus 1,858
6,310 4,284 minus 3,026
Emporia City 3,921 2,731 minus 1,190
3,464 2,234 minus 1,230
Brunswick 11,266 8,195 minus 3,071
10,421 7,066 minus 3,355
74
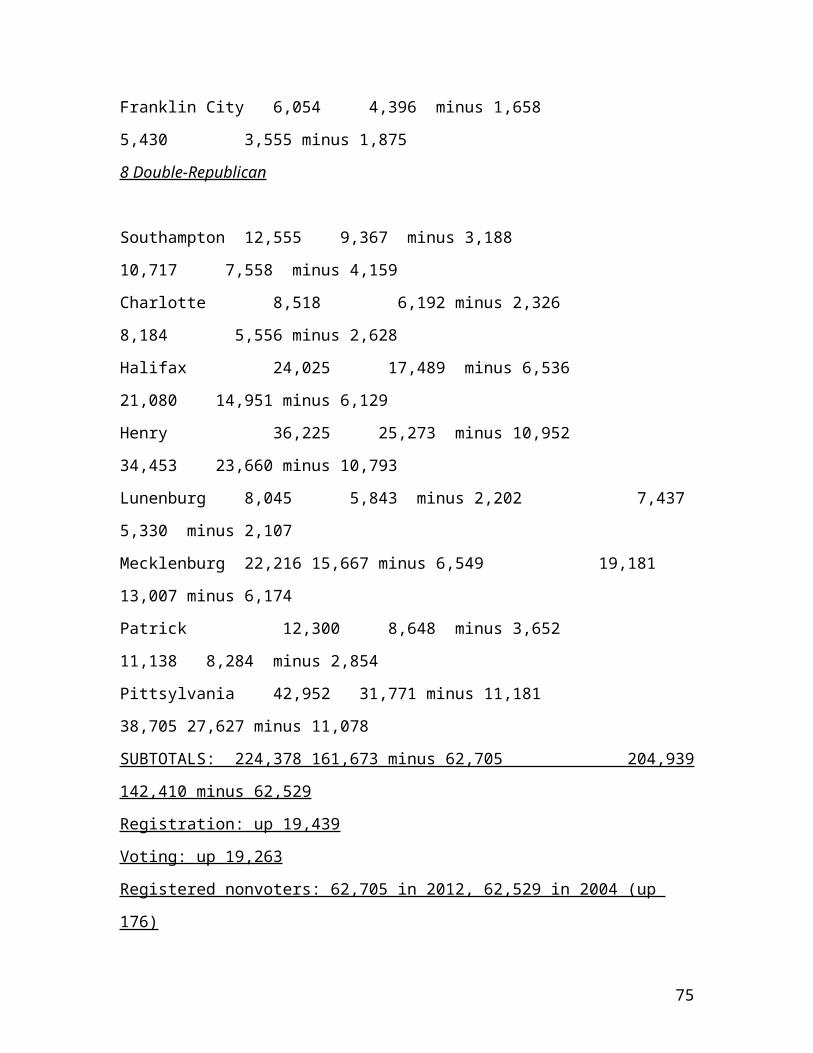
Franklin City 6,054 4,396 minus 1,658
5,430 3,555 minus 1,875
8 Double-Republican
Southampton 12,555 9,367 minus 3,188
10,717 7,558 minus 4,159
Charlotte 8,518 6,192 minus 2,326
8,184 5,556 minus 2,628
Halifax 24,025 17,489 minus 6,536
21,080 14,951 minus 6,129
Henry 36,225 25,273 minus 10,952
34,453 23,660 minus 10,793
Lunenburg 8,045 5,843 minus 2,202 7,437
5,330 minus 2,107
Mecklenburg 22,216 15,667 minus 6,549 19,181
13,007 minus 6,174
Patrick 12,300 8,648 minus 3,652
11,138 8,284 minus 2,854
Pittsylvania 42,952 31,771 minus 11,181
38,705 27,627 minus 11,078
SUBTOTALS: 224,378 161,673 minus 62,705 204,939
142,410 minus 62,529
Registration: up 19,439
Voting: up 19,263
Registered nonvoters: 62,705 in 2012, 62,529 in 2004 (up
176)
75

10 Eastern Rural
3 Double-Obama
Northampton 9,175 6,513 minus 2,662
8,575 5,577 – minus 2,998
Essex 7,591 5,717 minus 1,874
6,300 4,363 – minus 1,937
Westmoreland 11,969 8,473 minus 3,496
10,143 6,953 – minus 3,190
Obama 2008, Romney 2012
King and Queen 4,986 3,813 minus 1,173
4,495 3,269 – minus 1,226
6 Double-Republican
Accomack 23,767 16,217 minus 7,550
20,671 13,633 – minus 7,038
King George 15,249 11,420 minus 3,829
10,488 7,990 – minus 2,498
Lancaster 8,842 7,011 minus 1,831
8,245 6,333 – minus 1,912
Middlesex 7,916 6,172 minus 1,744
7,036 5,403 – minus 1,633
Northumberland 9,534 7,667 minus 1,867
8,579 6,454 – minus 2,125
Richmond County 5,768 3,857 minus 1,911
4,741 3,375 – minus 1,366
76

SUBTOTALS: 104,797 76,860 minus 27,937 89,273
63,350 – minus 25,923
Registration: up 15,524
Voting: up 13,510
Registered nonvoters: 27,937 in 2012, 25,923 in 2004 (up
2,014)
Rural Virginia Totals: 2012 -- 1,332,947 registered, 937,264 voting
2004 – 1,176,434 registered, 821,976 voting
Registered plus 156,513, voting plus 115,288
Registered nonvoters: 395,683 in 2012, 354,458 in 2004
(100% turnout of 395,683, 68% R, 30% D, 2% Other = D + 118,704, R +
269,064, Other + 7,913 = net R gain 150,360 beats 2012 by 1,062 raw but not
2008; to beat 2008, need 80% R, 18% D = 71,222, R = 316,546, Other 7,913 =
net R gain 245,324
At 55 percent turnout, = 217,625 new voters – cannot top 2008, top 2012 only at
D 14%, R 84% = D 30,467 R = 182,805 = net R gain 152,338
Caucasian only – remove 50% or less Caucasian (close to majority African
American)
Remove
50% Essex
40% Brunswick Danville City
30% Greensville Emporia City Franklin City
20%
77

10%
Majority Minority Rural
Essex 7,076 5,717 minus 1,359
6,300 4,363 – minus 1,937
Danville 26,339 21,138 minus 5,201
28,419 19,298 minus 9,121
Greensville 6,300 4,963 minus 1,337
6,310 4,284 minus 3,026
Emporia City 3,675 2,731 minus 944
3,464 2,234 minus 1,230
Brunswick 10,528 8,195 minus 2,333
10,421 7,066 minus 3,355
Franklin City 5,364 4,396 minus 968
5,430 3,555 minus 1,875
78

SUBTOTALS: 59,282 47,140 ,minus 12,142 54,034 40,800 minus 13,234Registration up 5,248, voting up 6,340, registered nonvotersdown 1,092
Chart VIII: TWO-PARTY RAW VOTE In The 76 Rural Virginia Jurisdictions
County R 2012, 2004 D 2012, 2004 Difference
21 Coal Country
One Double-Obama
Radford City 2,520 – 2,564 2,732 – 2,244
R minus 44, D + 488
20 Double-Republican
Bland 2,144 – 1,962 735 –
846 R + 182, D minus 111
Carroll 8,736 – 8,173 3,685 –
3,888 R + 563, D minus 203
Galax City 1,332 – 1,336 900 – 987
R minus 4, D minus 87
79

Giles 4,660 – 4,320 2,730
– 3,047 R + 340, D minus 317
Scott 7,439 – 6,479 2,395
– 3,324 R + 960, D minus 929
Tazewell 13,843 - 10,039 3,661 –
7,184 R + 3,804, D minus 3,523
Smyth 8,379 – 7,906 4,171 –
4,143 R + 473, D minus 28
Lee 6,847 – 5,664 2,583
– 4,005 R + 1,183, D minus 1,422
Wise 11,076 – 8,330 3,760 –
5,802 R + 2,746, D minus 2,042
Dickenson 4,274 – 4,569 2,473 –
3,591 R minus 295, D minus 1,118
Buchanan 6,436 – 5,275 3,094 –
4,507 R + 1,161, D minus 1,413
Russell 8,180 – 6,077 3,718
– 5,167 R + 2,103 , D minus 1,449
Washington 18,141 – 14,749 7,076 –
7,339 R + 3,392, D minus 263
Bristol City 4,780 – 4,275 2,492 –
2,400 R + 505, D + 92
Wythe 8,324 -- 7,911 3,783 –
3,581 R + 413, D + 202
Craig 1,757 – 1,706 830
– 901 R + 51, D minus 71
80

Floyd 4,673 – 4,162 2,732
– 2,488 R + 509, D + 244
Pulaski 8,920 – 8,769 5,292 –
5,310 R + 151, D minus 18
Norton City 895 – 768 566 – 725
R + 127, D minus 159
Grayson 4,801 – 4,655 2,068 –
2,430 R + 146, D minus 362
SUBTOTALS: R 138,157 -- 119,689 D 61,476 – 73,909 R +
18,468, D minus 12,433
Commonwealth: R plus 105,563, D plus 517,078
Between 2004 and 2012, the Virginia total Presidential vote
rose by 656,122, but only 105,563 went to the Republicans
and 517,078 went to the Democrats.
17 Shenandoah Valley
5 Double Obama
Lexington City 1,146 – 982 1,486 – 1,340 R +
168, D + 146
Roanoke City 14,991 – 16,661 24,134 – 18,862 R minus
1,670, D + 5,272
Staunton City 5,272 – 5,805 5,728 – 5,805 R minus
533, D minus 77
Harrisonburg City 6,565 – 6,165 8,654 – 4,726 R + 400, D
+ 1,928
81

Covington City 975 – 1,104 1,319 – 1,179 R minus
129, D + 140
Obama 2008, Romney 2012
Montgomery 20,006 – 17,070 19,903 – 14,128 R +
2,936, D + 5,775
11 Double Republican
Alleghany 3,595 – 3,962 3,403 – 3,203
R minus 367, D + 200
Augusta 23,624 – 22,100 9,451 – 7,019
R + 1,524, D + 2,432
Bath 1,274 – 1,432 894 – 828
R minus 158, D + 66
Botetourt 12,479 – 10,865 5,452 – 4,801
R + 1,614, D + 651
Highland 924 – 982 459 – 522
R minus 58, D minus 63
Roanoke County 31,624 – 30,596 18,711 – 16,082 R +
1,028, D + 2,629
Rockbridge 5,898 – 5,412 4,088 – 3,627
R + 476, D + 461
Lynchburg City 19,806 – 14,400 15,948 – 11,727 R +
5,406, D + 4,221
Buena Vista City 1,564 – 1,417 919 – 936
R + 147, D minus 17
82

Salem City 7,299 – 7,115 4,760 – 4,254
R + 184, D + 506
Waynesboro City 4,790 – 5,092 3,840 – 2,792 R
minus 302, D + 1,048
SUBTOTALS: R 161,832 -- 151,160 D 129,149 – 101,831 R
minus 10,672, D + 27,318
Commonwealth: R _ 105,563, D + 517,078
Between 2004 and 2012, the Virginia total Presidential vote
rose by 656,122, but only 105,563 went to the Republicans
and 517,078 went to the Democrats.
15 Appomattox
4 Double-Obama
Nelson 3,947 – 3,539 4,171 – 3,543
R + 408, D + 628
Buckingham 3,569 – 3,185 3,750 – 2,789
R + 384, D + 961
Prince Edward 3,952 – 3,632 5,132 – 3,632
R + 320, D + 1,500
Martinsville City 2,312 – 2,538 3,855 – 3,036
R minus 216, D + 819
11 Double-Republican
Appomattox 5,340 – 4,366 2,453 – 2,191
R + 974, D + 262
83

Amherst 8,876 -- 7,758 5,900 – 4,866
R + 1,118, D + 1,034
Campbell 17,695- 15,891 7,595 – 6,862
R + 1,804, D + 733
Cumberland 2,538 – 2,377 2,422 – 1,721
R + 161, D + 701
Franklin County 16,718 -- 14,048 9,090 – 8,022
R + 2,670, D + 1,068
Nottoway 3,409 – 3,303 3,344 – 2,635
R + 106, D + 709
Orange 9,244 – 7,749 6,870 –
5,015 R + 1,495, D + 1,855
Bedford City 1,527 – 1,472 1,225 – 1,042
R + 55, D + 183
Bedford County 26,679 – 21,125 10,209 – 9,102
R + 5,574, D + 1,107
Madison 3,869 -- 3,556 2,639 –
2,176 R + 343, D + 463
Greene 5,569 – 4,570 3,290 –
2,244 R + 999, D + 1,046
SUBTOTALS: R 126,712 -- 99,109 D 71,945 – 58,876 R +
27,603, D + 13,069
Commonwealth: R + 105,563, D + 517,078
Between 2004 and 2012, the Virginia total Presidential vote
rose by 656,122, but only 105,563 went to the Republicans
and 517,078 went to the Democrats.
84

13 Southside
5 Double-Obama
Danville 7,763 – 9,399 12,218 -- 9,436
R minus 1,636, D + 2,782
Greensville 1,766 – 1,732 3,135 – 2,514
R + 34, D + 621
Emporia City 886 – 970 1,793 – 1,247
R minus 84, D + 546
Brunswick 2,968 – 2,852 4,994 – 4,062 R
+ 116, D + 932
Franklin City 1,496 – 1,613 2,833 – 1,910 R
minus 117, D + 923
8 Double-Republican
Southampton 4,733 – 4,018 4,437 – 4,018 R +
715, D + 419
Charlotte 3,311 – 3,166 3,503 – 2,223
R + 145, D + 1,380
Halifax 8,694 -- 8,363 7,766 – 6,220
R + 331, D + 1,546
Henry 13,984 – 13,358 10,317 – 9,851
R + 626, D + 466
Lunenburg 2,969 -- 2,858 2,684 – 2,362
R + 111, D + 522
85

Mecklenburg 7,973 – 7,319 6,921 – 5,293 R
+ 654, D + 1,628
Patrick 5,622 – 5,507 2,417 – 2,552
R + 115, D minus 138
Pittsylvania 19,263 – 17,673 10,858 -- 9,274
R + 1,590, D + 1,584
SUBTOTALS: 81,428 – 78,828 73,876 – 60,962 R minus
2,600, D + 12,914
Commonwealth: R + 105,563, D + 517,078
Between 2004 and 2012, the Virginia total Presidential vote
rose by 656,122, but only 105,563 went to the Republicans
and 517,078 went to the Democrats.
Eastern Rural 10
3 Double-Obama
Northampton 2,676 – 2,669 3,741 – 2,775 R
+ 7, D + 966
Essex 2,602 – 2,304 3,016 – 2,007
R + 298, D + 1,009
Westmoreland 3,731 – 3,433 4,295 – 3,370 R
+ 298, D + 925
Obama 2008, Romney 2012
King and Queen 1,865 – 1,737 1,745 – 1,506 R +
128, D + 239
6 Double-Republican
86

Accomack 8,213 – 7,726 7,655 – 5,518
R + 487, D + 1,137
King George 6,604 – 5,124 4,477 – 2,739 R
+ 1,480, D + 1,738
Lancaster 3,753 – 3,724 3,149 – 2,477
R + 29, D + 672
Middlesex 3,619 – 3,336 2,370 – 1,914
R + 283, D + 456
Northumberland 4,310 – 3,832 3,191 – 2,548 R +
478, D + 643
Richmond County 2,160 – 2,082 1,574 – 1,243 R +
78, D + 331
SUBTOTALS: R 39,533 -- 35,967 D 35,213 – 26,097 R +
3,566, D + 9,116
Commonwealth:
Between 2004 and 2012, the Virginia total Presidential vote
rose by 656,122, but only 105,563 went to the Republicans
and 517,078 went to the Democrats.
Rural Virginia Totals: R net + 36,365, D net + 49,984
R gain in Coal Country, Appomattox, Eastern Rural, but lose
votes in Shenandoah Valley, Southside. R Coal Country gain
18,468, Appomattox 27,603, East Rural 3,566, lose 2,600
Southside, 10,672 in Shenandoah Valley
D lose 12,433 in Coal Country, gain 62,417 in other regions
combined
87

Chart IX: 2012, 2004 TURNOUT In The 58 Metropolitan Virginia
Jurisdictions
County Registered Voting Difference 2004 Reg 2004
Vote 2004 Dif
University of Virginia (2) Double-Obama
Charlottesville City 33,140 21,902 11,238
23,373 15,634 7,739
Albemarle 74,610 54,430 20,180
58,479 43,884 14,595
Subtotals: 107,750 76,332 31,418
81,852 59,518 22,334
Registration: up 25,898
Voting: up 16,814
Registered nonvoters: up 9,084
Northern Virginia (11 Double-Obama)
Fairfax 738,051 532,187 205,864
633,034 462,126 170,938
Fairfax City 15,795 11,751 4,044
14,478 10,651 3,827
Alexandria City 107,435 74,010 33,425
91,634 62,179 29,455
88

Arlington 168,779 118,718 50,061
130,521 95,219 35,302
Falls Church 9,402 7,327 2,075
7,544 6,117 1,427
Fredericksburg City 16,466 11,592 4,874
11,598 7,600 3,998
Loudoun County 210,452 160,698 49,754
140,293 108,727 31,566
Manassas City 22,121 15,272
6,849 19,011 12,985 6,026
Manassas Park City 7,164 4,695 2,469
5,391 3,351 2,040
Prince William 254,644 181,044 73,600
190,274 132,877 57,397
Winchester City 15,500 10,350 5,150
14,081 9,384 4,697
Subtotals: 1,565,809 1,127,644 438,165
1,257,859 911,216 346,643
Registration: up 307,950
Voting: up 216,428
Registered nonvoters: up 91,522
Northern Virginia Exurbia-Shenandoahs (11)
89

Culpeper 29,752 20,926 8,826
22,985 15,790 7,195
Fauquier 47,228 35,707 11,521
38,885 30,046 8,839
Stafford 83,444 61,395 22,049
65,606 46,344 19,262
Spotsylvania 82,201 58,875 23,326
64,449 45,445 19,004
Clarke 10,258 7,797 2,461
8,368 6,514 1,854
Warren 24,715 16,855 7,860
20,299 14,121 6,178
Rappahannock 5,776 4,373 1,403
5,255 4,067 1,188
Page 15,607 10,334 5,273
14,131 9,670 4,461
Rockingham 46,450 35,016 11,424
38,561 29,352 9,209
Shenandoah 27,450 19,515 7,935
23,125 17,238 5,887
Frederick 51,881 36,569 15,312
39,856 28,679 11,177
Subtotals: 424,762 307,362 117,400
341,520 247,266 94,254
Registration: up 83,242
Voting: up 60,096
90
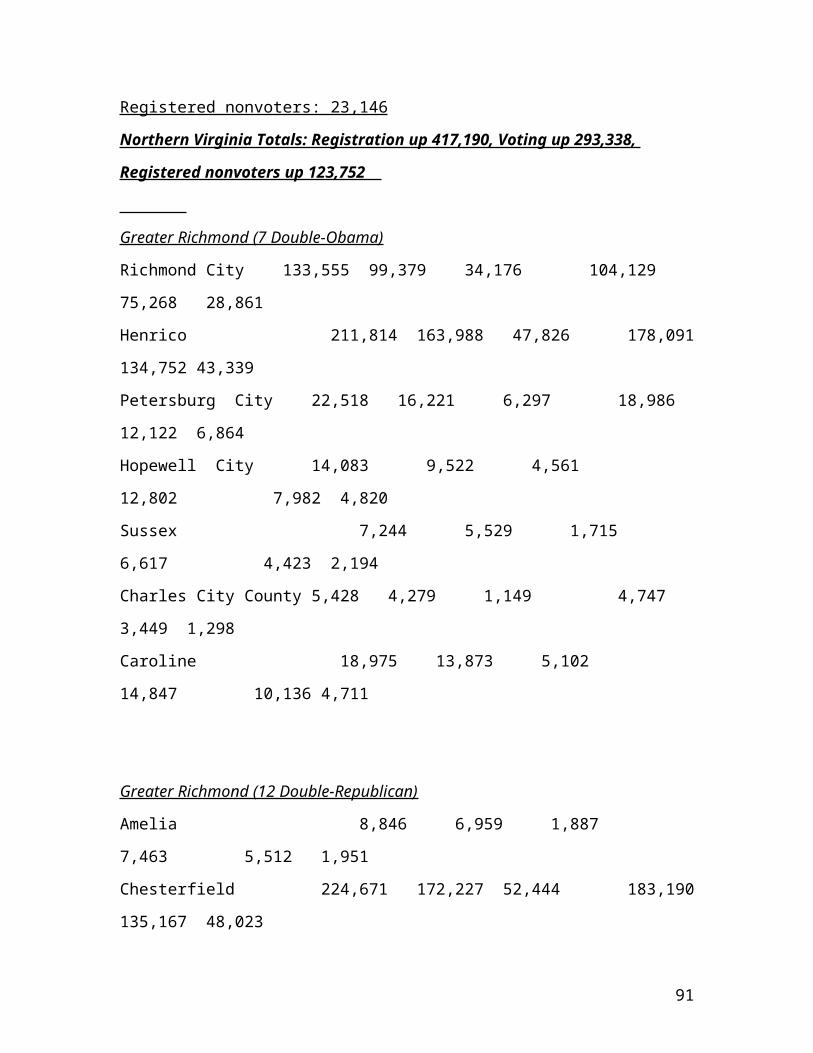
Registered nonvoters: 23,146
Northern Virginia Totals: Registration up 417,190, Voting up 293,338,
Registered nonvoters up 123,752
Greater Richmond (7 Double-Obama)
Richmond City 133,555 99,379 34,176 104,129
75,268 28,861
Henrico 211,814 163,988 47,826 178,091
134,752 43,339
Petersburg City 22,518 16,221 6,297 18,986
12,122 6,864
Hopewell City 14,083 9,522 4,561
12,802 7,982 4,820
Sussex 7,244 5,529 1,715
6,617 4,423 2,194
Charles City County 5,428 4,279 1,149 4,747
3,449 1,298
Caroline 18,975 13,873 5,102
14,847 10,136 4,711
Greater Richmond (12 Double-Republican)
Amelia 8,846 6,959 1,887
7,463 5,512 1,951
Chesterfield 224,671 172,227 52,444 183,190
135,167 48,023
91

Colonial Hgts. 12,388 8,683 3,705
11,588 8,307 3,281
Dinwiddie 18,660 13,673 4,987
15,298 10,869 4,429
Fluvanna 17,453 12,975 4,478
14,828 10,956 3,872
Goochland 16,107 13,444 2,663
12,916 10,492 4,524
Hanover 71,832 59,391 12,441
61,936 49,966 11,970
Powhatan 19,112 15,633 3,479
15,301 12,283 3,018
Louisa 21,946 16,561 5,385
17,039 12,271 4,768
Prince George 22,150 16,101 6,049 18,578
13,304 5,274
King William 11,227 9,023 2,214 9,022
6,937 2,085
New Kent 13,459 11,005 2,454 10,083
7,990 2,093
Subtotals: 871,468 668,466 203,002 717,461
532,186 185,275
Registration: up 154,007
Voting: up 136,280
Registered nonvoters: up 17,727
92

Hampton Roads (8 Double-Obama)
Norfolk City 130,298 87,652 42,646 110,219
71,433 38,786
Portsmouth City 64,947 46,678 18,269 59,338
40,047 19,291
Hampton City 97,334 66,956 30,378 80,954
56,027 24,927
Newport News City 122,016 79,721 42,295 104,138
68,235 35,903
Surry 5,533 3,348 2,185
4,829 3,580 1,249
Chesapeake City 154,168 111,054 43,014 127,119
92,132 34,987
Williamsburg City 11,278 7,770 3,508 6,215
4,350 1,865
Suffolk City 58,742 43,711 15,031 46,521
32,443 14,078
Hampton Roads (7 Double-Republican)
Isle of Wight 27,187 20,946 6,241 21,594
15,986 5,608
93

Gloucester 26,292 19,534 6,758
21,900 16,475 5,425
Matthews 7,030 5,398 1,632
6,709 5,162 1,547
Virginia Beach City 303,791 197,961 105,830 264,622
177,234 87,388
James City County 53,263 41,394 11,869 40,327
31,427 8,900
Poquoson City 9,030 7,130 1,900
8,376 6,500 1,876
York 46,857 34,164 12,693
39,993 29,963 10,030
Subtotals: 1,117,766 773,417 344,349
942,854 650,994 291,860
Registration: up 174,912
Voting: up 122,423
Registered nonvoters: up 52,489
Metropolitan Virginia:
Totals: registration up 746,109 – NoVa 417,190, Richmond 154,007, Hampton
Rds 174,912
Voting up: 552,041 NoVa 293,338 Richmond 136,280, Hampton rds 122,423
Registered nonvoters up: 193,968 – NoVa 123,752, Richmond 17,727,
Hampton rds 52,489
94

Chart X: 2012, 2004 TWO-PARTY RAW VOTE In The 58 Metropolitan
Virginia Jurisdictions
County R 2012, 2004 D 2012, 2004 Difference
University of Virginia (2)
Charlottesville 4,844 – 4,172 16,510 – 11,088
R + 672, D + 5,422
Albemarle 23,297 – 21,189 29,757 – 22,088
R + 2,108, D + 7,669
Subtotal: R 28,141 – 25,361 D 46,267 – 33,176
R + 2,780, D + 13,091
Northern Virginia Double-Obama (11)
Fairfax 206,773 – 211,980 315,273 – 245,671
R minus 5,207, D + 69,602
Fairfax City 4,775 – 5,045 6,651 - 5,395
R minus 270, D + 1,256
Alexandria City 20,249 – 19,844 52,119 – 41,116
R + 406, D + 11,003
Arlington 34,474 -- 29,635 81,269 – 63,987
R + 4,839, D + 17,282
Falls Church 2,147 – 2,074 5,015 – 3,944
R + 73, D + 1,071
95

Fredericksburg City 4,060 – 3,390 7,131 -- 4,085
R + 670, D + 3,046
Loudoun County 75,292 – 60,382 82,479 – 47,271 R
+ 14,910, D + 35,208
Manassas City 6,463 – 7,257 8,478 – 5,562
R minus 794, D + 2,916
Manassas Park City 1,699 – 1,807 2,879 – 1,498
R minus 108, D + 1,381
Prince William 74,458 – 69,776 103,331 – 61,271
R + 4,682, D + 42,060
Winchester City 4,946 – 5,283 5,094 – 3,967
R minus 337, D + 1,127
Subtotal: R 435,336 – 416,473 D 669,719 –
483,767 R + 18,863, D + 185,952
Northern Virginia Exurbia-Shenandoahs (11)
Culpeper 11,580 – 10,026 8,285 – 5,476
R + 1,554, D + 2,809
Fauquier 21,034 – 19,011 13,965 –
10,712 R + 2,023, D + 3,253
Stafford 32,480 – 28,500 27,182 –
17,208 R + 3,980, D + 9,974
Spotsylvania 31,844 – 28,527 25,165 –
16,623 R + 3,317, D + 8,542
Clarke 4,296 – 3,741 3,239
– 2,699 R + 555, D + 540
96

Warren 9,869 – 8,600 6,452 –
5,241 R + 1,269, D + 1,211
Rappahannock 2,311 – 2,172 1,980 – 1,837
R + 139, D + 143
Page 6,344 – 6,221 3,724 –
3,324 R + 123, D + 400
Rockingham 24,186 – 21,737 10,065 – 7,273
R + 2,449, D + 2,792
Shenandoah 12,538 – 11,820 6,469 – 5,186
R + 718, D + 1,283
Frederick 22,858 – 19,386 12,690 –
8,853 R + 3,472, D + 3,837
Subtotal: R 179,340 – 159,741 D 119,216 –
84,432 R + 19,599, D + 34,784
Northern Virginia Subtotals: R 642,817 – 601,575, D 835,202 – 601,375 R +
41,242, D + 233,827
Greater Richmond (7 Double-Obama)
Richmond City 20,050 – 21,637 75,921 – 52,167
R minus 587, D + 23,754
Henrico 70,449 – 71,809 89,594 –
60,864 R minus 1,360, D + 28,730
Petersburg City 1,527 – 2,238 14,283 –
9,682 R minus 711, D + 4,601
Hopewell City 3,739 – 3,573 5,179 –
4,251 R + 166, D + 928
97
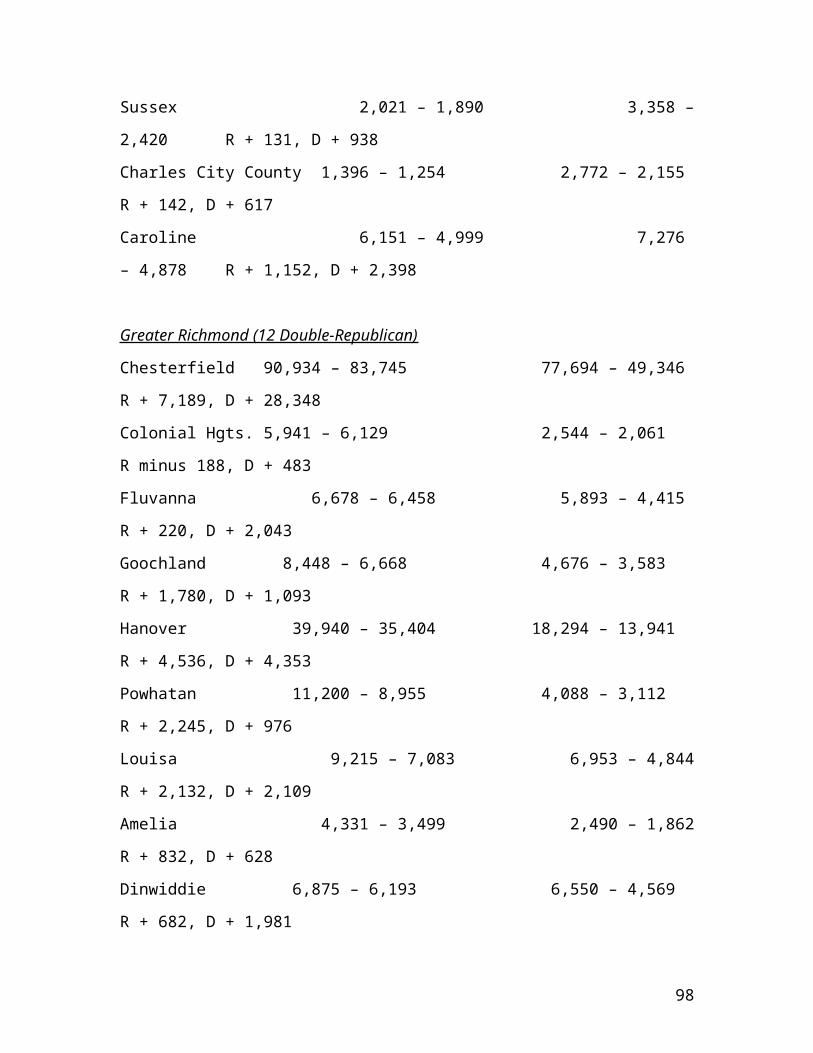
Sussex 2,021 – 1,890 3,358 –
2,420 R + 131, D + 938
Charles City County 1,396 – 1,254 2,772 – 2,155
R + 142, D + 617
Caroline 6,151 – 4,999 7,276
– 4,878 R + 1,152, D + 2,398
Greater Richmond (12 Double-Republican)
Chesterfield 90,934 – 83,745 77,694 – 49,346
R + 7,189, D + 28,348
Colonial Hgts. 5,941 – 6,129 2,544 – 2,061
R minus 188, D + 483
Fluvanna 6,678 – 6,458 5,893 – 4,415
R + 220, D + 2,043
Goochland 8,448 – 6,668 4,676 – 3,583
R + 1,780, D + 1,093
Hanover 39,940 – 35,404 18,294 – 13,941
R + 4,536, D + 4,353
Powhatan 11,200 – 8,955 4,088 – 3,112
R + 2,245, D + 976
Louisa 9,215 – 7,083 6,953 – 4,844
R + 2,132, D + 2,109
Amelia 4,331 – 3,499 2,490 – 1,862
R + 832, D + 628
Dinwiddie 6,875 – 6,193 6,550 – 4,569
R + 682, D + 1,981
98

Prince George 8,879 – 8,131 6,991 – 5,066
R + 748, D + 1,925
King William 5,466 – 4,397 3,344 – 2,436
R + 1,069, D + 908
New Kent 7,246 – 5,414 3,555 – 2,443
R + 1,832, D + 1,112
Subtotal: R 310,486 – 289,576 D 341,455 – 234,095 R
+ 20,910, D + 107,360
Hampton Roads (8 Double-Obama)
Norfolk City 23,147 – 26,401 62,687 – 43,518
R minus 3,254, D + 19,169
Portsmouth City 12,858 – 15,212 32,501 – 24,112 R
minus 2,354, D + 8,389
Hampton City 18,640 – 23,399 46,966 – 32,016 R
minus 4,759, D + 14,950
Newport News City 27,230 – 32,208 51,100 – 35,319 R
minus 4,978, D + 15,781
Surry 1,671 -- 1,543 2,576 –
1,954 R minus 128, D + 622
Chesapeake City 53,900 – 52,283 55,052 – 38,744 R
minus 1,617, D + 16,308
Williamsburg City 2,682 – 2,064 4,903 – 2,216
R minus 618, D + 2,687
Suffolk City 17,820 – 16,873 24,267 –
15,233 R + 947, D + 9,034
99

Hampton Roads (7 Double-Republican)
Isle of Wight 11,802 – 9,929 8,761 – 5,871
R + 1,873, D + 2,890
Gloucester 12,137 – 11,084 6,764 – 5,105
R + 1,053, D + 1,659
Virginia Beach City 99,291 – 103,752 94,299 – 70,666 R
minus 4,461, D + 23,633
James City County 22,843 – 18,949 17,879 – 11,934 R
+ 3,894, D + 5,945
Poquoson City 5,312 – 5,004 1,679 –
1,424 R + 308, D + 255
York 20,204 – 19,396 13,183 –
10,276 R + 808, D + 2,907
Matthews 3,488 – 3,497 1,807 –
1,589 R minus 9, D + 218
Subtotal: R 333,025 -- 341,594 D 424,424 –
299,977 R minus 8,569, D + 124,447
100