MUNICIPAL PROFILE 2017
80
MUNICIPAL PROFILE 2017 MUNICIPALITY OF MINA ii TABLE OF CONTENTS Page History of Mina 1 Natural and Physical Features Geographical Characteristics (location and area) 1 Access and Road Networks 2 Land Use 2 Climatological Characteristics 3 Geological Characteristics 1 Local Administration 4 Demography Population Trend 6 Population Density 6 Age-Sex Population Distribution 7 Labor Force 9 Marital Status 10 Households 10 Dialect Spoken 11 Religion 12 Household Size 13 Social Services Education 14 Health 15 Health Status 16 Sanitation 17 Cemetery 18 Social Welfare Services 20 Protective Services 20 Fire Protection 21 Agriculture 22 Livestock and Poultry 22 FIGURES: Figure 1 Location Map 2 TABLES: Table 1 Existing and Proposed Land Use 2 Table 2 Slope Classification 3 Table 3 Soil Classification 4 Table 4 Offices and Head of Office 4 Table 5 Name of Barangay, Area in Has., Distance and Name of Brgy. Captain 5 Table 6 Historical Growth of Population 6 Table 7 Previous, Current and Projected Population Per Barangay (2000 - 2020) 7 Table 8 Current Population by Age-Group, Sex 8 Table 9 Projected Population by Age-Group and Sex 8 Table 10 Labor Force Population by Sex and Employment Status 9 Table 11 Labor Force Participation 9 Table 12 Marital Status by Age Group 10
-
Upload
khangminh22 -
Category
Documents
-
view
1 -
download
0
Transcript of MUNICIPAL PROFILE 2017

MUNICIPAL PROFILE 2017 MUNICIPALITY OF MINA
ii
TABLE OF CONTENTS Page
History of Mina 1
Natural and Physical Features
Geographical Characteristics (location and area) 1
Access and Road Networks 2
Land Use 2
Climatological Characteristics 3
Geological Characteristics 1
Local Administration 4
Demography
Population Trend 6
Population Density 6
Age-Sex Population Distribution 7
Labor Force 9
Marital Status 10
Households 10
Dialect Spoken 11
Religion 12
Household Size 13
Social Services
Education 14
Health 15
Health Status 16
Sanitation 17
Cemetery 18
Social Welfare Services 20
Protective Services 20
Fire Protection 21
Agriculture 22
Livestock and Poultry 22
FIGURES:
Figure 1 Location Map 2
TABLES:
Table 1 Existing and Proposed Land Use 2
Table 2 Slope Classification 3
Table 3 Soil Classification 4
Table 4 Offices and Head of Office 4
Table 5 Name of Barangay, Area in Has., Distance and Name of
Brgy. Captain 5
Table 6 Historical Growth of Population 6
Table 7 Previous, Current and Projected Population Per
Barangay (2000 - 2020) 7
Table 8 Current Population by Age-Group, Sex 8
Table 9 Projected Population by Age-Group and Sex 8
Table 10 Labor Force Population by Sex and Employment Status 9
Table 11 Labor Force Participation 9
Table 12 Marital Status by Age Group 10

MUNICIPAL PROFILE 2017 MUNICIPALITY OF MINA
iii
Table 13 Previous, Current and Projected Households by
Barangay 10
Table 14 Dialect Spoken 11
Table 15 Religious Group in the Municipality 12
Table 16 Urbanization Level for the Past 20 Years 13
Table 17 Household Population by Urban and Rural Barangay and
Average Household Size 13
Table 18 Household Population 5 Years Old and Over by Highest
Educational Attainment 14
Table 19 Literacy Rate of Population 5 Years Old and 15
Table 20 Medical Health Facilities and Personnel 15
Table 21 General Health Situation for the Last Five Years 16
Table 22 Ten Leading Causes of Mortality for the Last Three
Years 16
Table 23 Malnourished Children for the Last Three Years 17
Table 24 Number of Households in Occupied Housing Units by Use
of Toilet Facilities 17
Table 25 Solid Waste Generation by Source 18
Table 26 Existing Cemeteries and Memorial Parks 18
Table 27 Inventory of Residential Subdivisions 18
Table 28 Housing Facilities and Utilities Situation 19
Table 29 Owner Households in Occupied Housing Units by Tenure
of Housing Units and Lots 20
Table 30 Historical Number of Population Served by Type of
Clientele System 20
Table 31 Current Police Personnel 21
Table 32 Fire Station Personnel 21
Table 33 Comparative Agricultural Crop, Area and production 22
Table 34 Existing Livestock and Poultry Farms 22
Table 35 Poultry and Livestock by Farm Type 23

MUNICIPAL PROFILE 2017 MUNICIPALITY OF MINA
1
HISTORY OF MINA
These briefs of the History of Mina were taken from the compilation
of records from the national Archive of the Philippines (NAP). This was
done for the purpose of launching a book about the history of this town as
per records from the said archive. All previous files (until the earlier
part of American Colonization) were handwritten in Spanish. Thorough
researches were made by Madam Lydia E. Grabato and Ms. Dory Emelo (see
footnotes below) and translation into English was done by Madam Maria
Luisa Garcia.
It is our desire to provide our future generations of the facts in
the establishment f this town based on the official records available at
NAP for reference for writing history. Some records were taken from other
reliable sources indicated below.
Tales of Montogawe
Prior to 1870, Mina was a then Barrio under the jurisdiction of
Pototan, formerly named Barrio Montogawe. The name was coined from the
word Montongawe. Monton (masculine noun, (colloquial) (large amount)) is a
Castilian word meaning mountain, hill, heap or file and gawe is a
vernacular word meaning face of a man. Through word of mouth passed from
the native tongue, Montongawe is like a tongue twister for most people
hence it became Montogawe instead. This area is actually located on a hill
that straddles Suague River. Viewed from a certain distance, people claim
the hill resembles a man’s face. According to common belief among
residents of the area, the hill is enchanted even as far back in early
Spanish occupation. During heavy floods, while the rest of the barrio was
under water, due to the rising water levels, the hill remained unscathed
and appeared like it was just floating. Another tale involved is a
beautiful woman with a golden goat who would be seen roaming the hill in
the still of the night but only during a full moon.
Spanish Occupation 1521-1898
Beforehand the principales and residents initiated a movement that
Barrio Mantugaui will be elevated into a town. On June 20, 1864 the league
of leading citizens and the inhabitants officially pleaded to His
Excellency the Quartermaster General of the Visayas to elevate this barrio
into a new town independent of its matrix of Pototan to be named “Pueblo
de Molto”. (A Spanish word meaning, much) In the mid-1860’s, though no
decree yet was issued for its elevation, into town, they already
referred Mantugaui as Molto.
The reasons why there was a petition to elevate said barrio into
a pueblo, were due to: (1.) great distance between the town and the
barrio; (2) during those times, residents of the said barrio had
difficulty travelling to Pototan when they want to hear mass on required
days; (3) when some barrio folks fell ill due to pestilence and eventually
died without receiving the final sacrament. For a predominantly Catholic
barrio, receiving and getting blessed with the sacraments as taught by the
church, are important. (4) Another case in point was those women who
suffered complications and died during childbirth had no chance of
receiving the final sacrament, and (5) their infants often died without
being baptized. It was for these reasons, among others, that the leaders

MUNICIPAL PROFILE 2017 MUNICIPALITY OF MINA
2
sought the approval of His Excellency praying that their request would be
granted.
On July 30, 1864 the Parish Priest and the Principales of Pototan
endorsed to the Political-Military Government of Iloilo the required
sketch and lists, etc. informing the need of elevating Barrio Mantugaui
into a town.
Renaming of Town
In the records of the National Archives of the Philippines (NAP),
some documents referred to this barrio as “Montegaui”, “Montogaui”.
“Mantugaui”, “Mantugani” during that time, when the leading citizens
and inhabitants of barrio Mantugaui pleaded to His Excellency the
Quartermaster General of the Visayas, to elevate this barrio into a new
town, to become independent with the matrix of Pototan they proposed
that it be named “ Pueblo de Molto”. From 1860 until 1870, there were so
many disputes that had happened in the creation of this town. Arguments as
to the other barrios to be included as part of Molto, as well as the
boundaries and the “tributos” taxpayers, have become the major contention.
Barrio Paranginanetmaya was merged to Talaracan, (sometimes written
as Tulurucan, TalacoranTuluracan or Tularacan) now Tolarucan, to become
part of Molto. A dispute between the Municipalities of Pototan and Janiuay
over the jurisdiction of Tularacan resulted to the delay of elevating this
barrio into a town. On January 20, 1868, a decree ordered by then the
Gobernador Politico Militar de Visayas, it contains an assignment which
was delegated to the Captain of the Polcie Force in this District
D.Evaristo Fernandez who will conduct the survey of the boundaries
concerned. Upon completion of the survey, the recommendation regarding the
boundary between Mantugaui and Janiuay was objected by Fr. Miguel Claro of
JaniuayParish, hence the delay occurred for its approval. Bishop of Jaro
appointed Don Juan Manzano y Vasques, the lawyer in this Province to form
a committee together with the Reverend Parish Priests of Pototan and
Janiuay and with the chiefs of the barrio of Mantugaui to handle the case
filed regarding said objection. The main task of this committee is also to
establish the site where the new town of Molto and the barrios which
should be the part of it should be situated and indicate as well the land
for public buildings.
On July 1, 1870, a decree issued by the Superior Government of
General Carlos Ma.De la Torre to establish the demarcation and markings of
the new town and name it into “Pueblo de Mina” instead of “Pueblo de
Molto”. On October 27, 1870, the Bill was completely legalized in the
required form. In this process, all the adjacent villages and barrios
were presented by its respective parish priest, gobernadorcillos, and
leading citizens- past and present, and none of them expressed the
slightest objection and complaint, the superior government approved the
said document on the demarcation of the town Mina.
No parish priest yet was assigned at that time because some of the
requirements for the creation of a new parish like the construction of the
Church, Parish House for the priest, Convent School, Court, Municipio,
were not fully complied yet. On July 30, 1873, when all these terms and
conditions were accomplished, a decree making Mina as a full- pledge
parish was issued by General Olivado. The parish was created and the
Bishop of Jaro appointed an Augustinian Priest, Father TiburcioCasbresana,

MUNICIPAL PROFILE 2017 MUNICIPALITY OF MINA
3
a Spaniard, to become the first parish priest in the new town of Mina. The
Parish of Mina was given an official title of “Our Lady of the Pillar”.
` (In the archive of the National Archives of the Philippines (NAP), a
documenter occasionally referred Montogawe as Montegaui, Mantugaui, or
Mantugani. However, there was no definite meaning or translation of
those names and no record about its origin. It cannot be ascertained why
it was written that way. During that period the documents in (NAP) are
handwritten in the Spanish language. The changes are attributed to the
handwriting of the documenter and also on how the names were relayed to
him during that time).
Mina during American Colonization (1898-1946) - Law of United States-
Philippine Commission - Act No. 719 April 4, 1903
` After the defeat in the Philippines by Spain against the Americans,
the Americans changed the structure of government in this country. Among
others in the Province of Iloilo, the town of Dingle and Mina, together
with other neighboring barrios, were placed under the jurisdiction of the
Town of Pototan. Mina became an “arrabal” of Pototan, then, considered as
the biggest “arrabal” because it has a parish of its own. But the
townsfolk of Mina continued to celebrate the feast day of Our Lady of the
Pillar.
(Summary) Record from period 1862-1890, Provincia de Iloilo Y
Conception has 38 towns and two cities namely: Dumangas, Anilao,
Banate, Barotac Nuevo, Barotac Viejo, Dueñas, Dingle, Lambunao, Pototan,
Janiuay, Mina, Passi, Calinog, Oton, Arevalo, Molo, Jaro City, Pavia,
Leganes, Santa Barbara, Cabatuan, Maasin, Iloilo City, Mandurriao,
Tigbaun, Guimbal, Miag-ao, Igbaras, San Joaquin, Tubungan, Alimodian, San
Miguel, Leon, Ajuy, Conception, San Dionisio, Sara, Estancia, Balasan,
Carles.
Years later, in the book entitled Monografias de los Pueblos de la
Isla de Pan-ay of 1899 by Spanish historian Fray Juan Fernandez,
OSA, indicates that there were already 49 municipalities in Iloilo which
eventually was reduced to 43 but when the Americans organized the Civil
Government of Iloilo on 11 April 1901 there were already 50
municipalities.
ThesewereAjuy, Alimodian, Anilao, Balasan, Banate, Barotac Nuevo,
Barotac Viejo, Batad, Buenavista, Cabatuan, Calinog, Carles, Concepcion,
Cordoba, Dingle, Dueñas, Dumangas, Estancia, Guimbal, Igbaras, Iloilo,
Janiuay, Jaro, La Paz, Lambunao, Leganes, Lemery, Leon, Lucena, Maasin,
Mandurriao, Miagao, Mina, Molo, Navalas, Nagaba, Nueva Valencia, Oton,
Passi, Pavia, Pototan, San Dionisio, San Enrique, San Joaquin, San Miguel,
Santa Barbara, Sara, Tigbauan, Tubungan and Zarraga.
On 4 April 1903, however, these 50 towns were reduced to 17 with the
passage of Act No. 719, the title of which read “AN ACT REDUCING THE
FIFTY-ONE MUNICIPALITIES OF THE PROVINCE OF ILOILO TO SEVENTEEN.”
While there were only 50 towns in Iloilo then, a comma was placed
between “Barotac” and “Viejo” in Section 1, sub-paragraph 14 of the law
that made them all 51. Had there been no comma there, then was count would
have been only 50.
` In effect, some of the smaller and poorer towns became suburbs
(arrabal) of larger and richer municipalities. Only Arevalo and Oton were
not given arrabals.

MUNICIPAL PROFILE 2017 MUNICIPALITY OF MINA
4
The 15 other towns with suburbs were Balasan (Batad, Estancia, and
Carles), Banate (Barotac, Viejo and Anilao), Buenavista (Navalas, Nagaba,
and Nueva Valencia), Cabatuan (Maasin), Dumangas (Barotac Nuevo), Guimbal
(Igbaras and Tubungan), Iloilo (La Paz, Mandurriao, Molo, and Jaro),
Janiuay (Lambunao), Leon (San Miguel and Alimodian), Miagao (San Joaquin),
Passi (Dueñas, San Enrique, and Calinog), Pototan (Mina and Dingle), Santa
Barbara (Pavia, Leganes, Zarraga, and Lucena), Sara (Ajuy, Lemery,
Concepcion and San Dionisio), and Tigbauan (Cordoba).
` A few years later, in the conformity of the America’s rule, the
Civil Government, The Philippine Commission, the Commonwealth Government,
etc , and after undergoing the legal process, towns that were merged as a
suburb of “big towns” eventually were allowed to return to its previous
1903 independent status. San Joaquin, for example, became an independent
town again in 1910, Maasin in 1916 and Ajuy in 1917. Nagaba separated from
Buenavista in 1918 and was renamed Jordan, Igbaras separated from Guimbal
in 1919, and Concepcion separated from Sara in 1921.
Pavia and Leganes were annexed to Iloilo in 1904. In 1908, Jaro
became a municipality again and both Pavia and Leganes became its suburbs.
Pavia, for its part, became a full-fledged municipality in 1921. Jaro,
which then included Leganes, became a district of Iloilo City in 1937. It
was only in 1940 that Leganes became a municipality again.
The other towns that were restored include Tubungan (1938), Anilao
(1939), Zarraga (1940), Lucena (1947, the word “New” was prefixed only in
1955), San Enrique (1957), Mina (1969) and Lemery (1984), among others.
The town of Cordoba remains a barangay of Tigbauan until today. The same
happened to the town of Navalas, still a barangay in Buenavista, Guimaras.
The towns of Badiangan (1967), San Rafael (1969) and Bingawan (1970),
which were formerly barrios of Janiuay, Barotac Viejo, and Calinog,
had also regained their independence respectively.
Mina During And After World War II
During the World War II, the presence of Japanese occupation was
also felt within Mina, hence, for three years, the Chapel in Brgy. Abat,
Mina became the official parish of Mina, where the feast day of Our Lady
of the Pillar was celebrated with a mass each year. Immediately after the
liberation the Parish went back to its original location. In 1947, Father
Manuel Garin, then Parish Priest, having observed that the economic life
of the people in the parish was pitifully difficult, he transferred
the celebration to December 30 from October 12. The purpose of the
change was to afford the parishioners the chance to have a decent and
festive celebration. For two years, the religious activities were
celebrated on December 30 after which the feast day was moved back to its
original date, October 12 simultaneous with the celebration of Spain where
the feast of the Lady of the Pillar was originated.
After the war, Mina remained as an arrabal of Pototan. A group of
local leaders residing in Mina made a petition to separate Mina, as an
independent town from Pototan. On October 1, 1964, then President
DiosdadoMacapagal signed Executive Order No. 106 creating the Municipality
of Mina. Mina’s status as a municipality became controversial. A complaint
filed by then Senator Emmanuel Pelaez reached the Supreme Court. It had to
do with the official acts of President DiosdadoMacapagal issuing Executive
Order for the creation of the Municipality of Mina, which Senator Pelaez

MUNICIPAL PROFILE 2017 MUNICIPALITY OF MINA
5
found to be unconstitutional. The creation of a Municipality should be
through a Bill passed in Congress. The legality of President Macapagal
issuance of Executive Order No. 106 was questioned. In the end, the
Supreme Court ruled in favor of the complainant, Senator Pelaez, and
ordered Mina to revert back to its status as an arrabal of Pototan. Its
existence as an again independent Municipality was short-lived, only 14
months, from 1 January 1965 to 18 February 1966.
Official Creation Of The Municipality Of Mina
It was then Congressman Ricardo Y. Ladrido of the Fourth District of
the Province of Iloilo, who authored and sponsored House Bill No. 16661
creating the Municipality of Mina in 1968. On 9 September 1968, R.A. No.
5442 was passed, declaring Mina as a municipality of the Province of
Iloilo.

MUNICIPAL PROFILE 2017 MUNICIPALITY OF MINA
6
NATURAL AND PHYSICAL FEATURES
Geographical Characteristic (location and area) Mina is 37 kilometers away from Iloilo City, of one travels
by road either by passing through the municipality of Pototan or
a short cut may across Barangay Agmanaphao and Badiangan, both of
the municipality. It can also be reached by passing through the
municipality of Janiuay. Mina is an hour travel or more from
Iloilo City by PUJ.
Mina can be located approximately at 122 ْ35’ East and 11 ْ
5’ North. It is bounded by 5 Municipalities – Pototan in the
East, Janiuay in the West, Badiangan in the North, New Lucena in
the South and Cabatuan in the southwest. It is practically
located in the central part of Iloilo province (as shown in
Figure 2).
Mina has a total land area of 4,340 hectares, of which,
130.93 hectares are urban and 4,209.09 hectares are rural.
- Access and Road Networks Road Networks:
National Roads - 9.851 km.
Provincial Roads - 11.565 km.
Municipal Roads - 3.185 km.
Barangay Roads - 91.463 km.
Figure 1.
Location Map
Province of Iloilo

MUNICIPAL PROFILE 2017 MUNICIPALITY OF MINA
7
- Political Subdivision
Municipality of Mina comprises of 22 barangay’s wherein two
(2) barangay’s of Mina East and Mina West are located in the
Poblacion. Table 1 shows the area, distance from the poblacion
and barangay captains of each barangay for the period 2013-2016.
Table 1. NAME OF BARANGAY, DISTANCE, AND AREA IN HAS.
AND NAME OF BARANGAY CAPTAIN
BARANGAY AREA (Has.) DISTANCE From
POBLACION BARANGAY CAPTAIN
A. URBAN
1. Mina East 100.5942 - Roger P. Cordero
2. Mina West 30.3433 - Rene P. Abillera
B. RURAL
3. Abat 200.6268 3 kms. Felix H. Alfaras
4. Agmanaphao 422.9784 3 kms. Ciriaco L. Perocho, Sr.
5. Amiroy 506.4051 1 km. Gloria T. Alegado
6. Badiangan 539.2654 3 kms. Marissa L. Alabado
7. Bangac 128.4701 1 km. Gemma P. Perdosa
8. Cabalabaguan 225.2673 1 km. Marlene P. Pelaez
9. Capul-an 163.0339 4 kms. Nelson P. Gil
10. Dala 146.6137 2 kms. Ma. Marites P. Gerola
11. Guibuangan 33.6079 4 kms. Rolando P. Marquez
12. Janipa-an East 289.3227 4 kms. Ceferino B. Tono
Figure 2. Location Map – Boundaries of Mina

MUNICIPAL PROFILE 2017 MUNICIPALITY OF MINA
8
Source: MPDC
- Land Use Basically Mina is an agricultural town with an area of
4,340 hectares. A total of 3, 648.33 hectares or 84.06% of its
land area are devoted to agriculture. Rice farming is the main
source of income of the populace which occupies about 2,597.66
13. Janipa-an West 268.8109 2.5 kms. Jose Almar Tabares
14. Nasirum 100.5722 5 kms. Juvic Q. Patosa
15. Naumuan 124.3696 3 kms. Arnold C. Nanit
16. Singay 59.7538 1.5 kms. Benjamin D. Salanio
17. Talibong Grande 134.8868 2 kms. Rogelio H. Pastolero
18. Talibong Pequeño 145.2741 3.5 kms. Antonio S. Peremne, Sr.
19. Tipolo 104.1961 3 kms. Joseph S. Pendioday
20. Tolarucan 291.1995 1 km. Alex B. Acana
21. Tumay 147.0541 2 kms. Romulo S. Cartera
22. Yugot 177.3541 5 kms. Roldan P. Besagre
TOTAL 4,340.00
Figure 3. Location Map – Political Subdivision of Mina
MUNICIPAL PROFILE 2017 MUNICIPALITY OF MINA
9
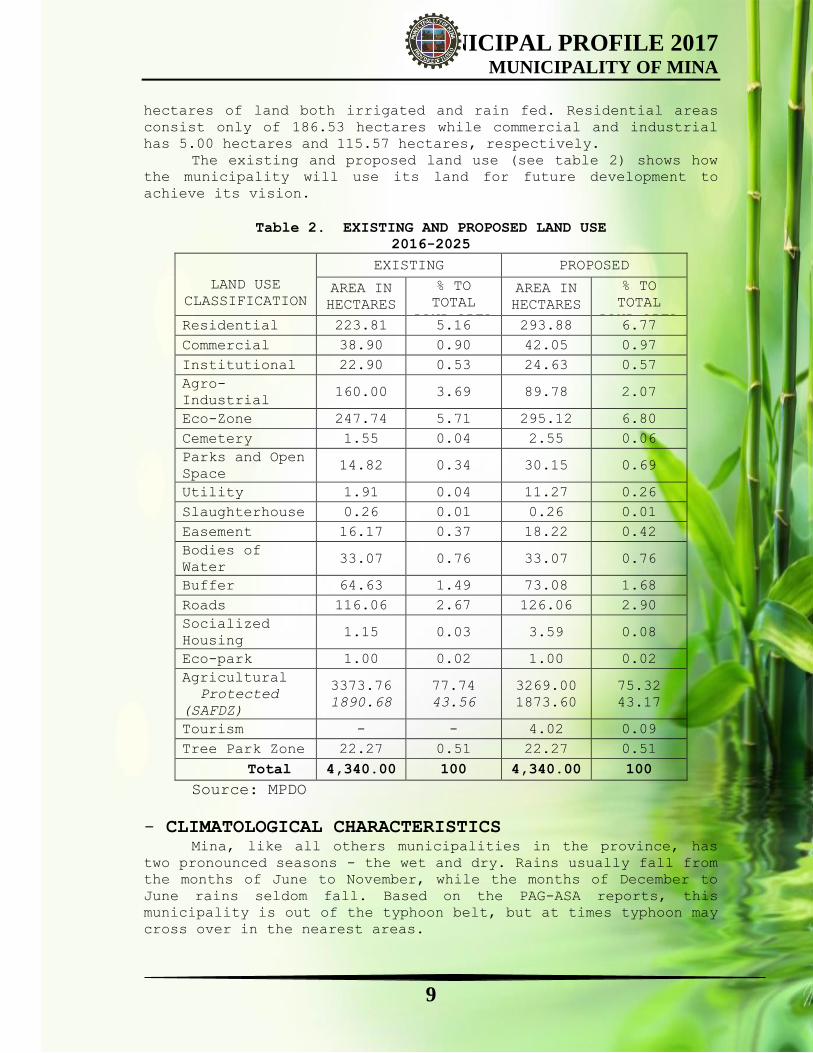
hectares of land both irrigated and rain fed. Residential areas
consist only of 186.53 hectares while commercial and industrial
has 5.00 hectares and 115.57 hectares, respectively.
The existing and proposed land use (see table 2) shows how
the municipality will use its land for future development to
achieve its vision.
Table 2. EXISTING AND PROPOSED LAND USE
2016-2025
LAND USE
CLASSIFICATION
EXISTING PROPOSED
AREA IN
HECTARES
% TO
TOTAL
LAND AREA
AREA IN
HECTARES
% TO
TOTAL
LAND AREA Residential 223.81 5.16 293.88 6.77
Commercial 38.90 0.90 42.05 0.97
Institutional 22.90 0.53 24.63 0.57
Agro-
Industrial 160.00 3.69 89.78 2.07
Eco-Zone 247.74 5.71 295.12 6.80
Cemetery 1.55 0.04 2.55 0.06
Parks and Open
Space 14.82 0.34 30.15 0.69
Utility 1.91 0.04 11.27 0.26
Slaughterhouse 0.26 0.01 0.26 0.01
Easement 16.17 0.37 18.22 0.42
Bodies of
Water 33.07 0.76 33.07 0.76
Buffer 64.63 1.49 73.08 1.68
Roads 116.06 2.67 126.06 2.90
Socialized
Housing 1.15 0.03 3.59 0.08
Eco-park 1.00 0.02 1.00 0.02
Agricultural
Protected
(SAFDZ)
3373.76
1890.68
77.74
43.56
3269.00
1873.60
75.32
43.17
Tourism - - 4.02 0.09
Tree Park Zone 22.27 0.51 22.27 0.51
Total 4,340.00 100 4,340.00 100
Source: MPDO
- CLIMATOLOGICAL CHARACTERISTICS Mina, like all others municipalities in the province, has
two pronounced seasons - the wet and dry. Rains usually fall from
the months of June to November, while the months of December to
June rains seldom fall. Based on the PAG-ASA reports, this
municipality is out of the typhoon belt, but at times typhoon may
cross over in the nearest areas.

MUNICIPAL PROFILE 2017 MUNICIPALITY OF MINA
10
- GEOLOGICAL CHARACTERISTICS - Topography
The municipality of Mina is generally plain with the
exception of some barangays, like Abat, Naumuan, Tipolo, Yugot,
Nasirum, Janipa-an West and Capul-an. Land elevation, however, in
said areas are not significantly high. It is estimated at about
10 to 20 feet above sea level.
The hilly portion and the rolling parts of the land are
abounding with trees and bamboos. Crops grown in these areas are
mostly sugar cane, coconut, coffee, and banana and fruit trees.
- Slope
Mina has a total land area of 4,340 ha wherein 3,108.75 ha
belong to slope grouping category A (0-3%), 1,011.74 ha. belong
to slope grouping category B (3-8%), and 101.59 ha. belong to
slope grouping category C (8-18%) as shown in Table 3 below.
Table 3. Land Area Distribution of Different Slope Classes
in Mina, Iloilo
Source:MPDO
-Type of Soil
There are four types of soil that can be found in the
Municipality of Mina. There are Sta. Rita Clay, Alimodian Clay
Loam, Umingan Fine Sandy Loam and Alimodian Silt. Of these four
types of soil, Sta Rita Clay is the most dominant. It covers
approximately 3,130 hectares or 72.14% of the total land area.
The most suitable crop planted to this type of soil is rice, and
is common in the barangay Yugot, Tipolo, Talibong Grande,
Guibuangan, Tumay, Cabalabaguan, Tolarucan, Poblacion, Dala,
Amiroy, Singay, Badiangan, Janipa-an East, and Agmanaphao.
Another type of soil prevalent in this municipality is the
Alimodian Clay Loam which occupies an area of 160.15 hectares or
3.69% of the total land area. This type of soil is most common in
areas along river banks. Alimodians Silt comprises of 73.78
hectares or 1.07% of the total land area can be found at the
Southern portion of Janipa-an East.
Slope Category Land Area
(ha.)
% TOTAL Land Area
0-3% 3,108.75 71.63
3-8% 1,011.74 23.31
8-18% 101.59 2.34
Water Body 117.92 2.72
Total 4,340.00 100.00

MUNICIPAL PROFILE 2017 MUNICIPALITY OF MINA
11
Table 4. Land Area Distribution of Different Soil Types in Mina,
Iloilo
Soil Type Land Area (ha) Percent of Total Land
Area
Sta. Rita Clay 3,130.90 72.14
Alimodian Clay Loam 1,002.42 23.10
Umingan Fine Sandy
Loam
160.19 3.69
Alimodian Silt 46.47 1.07
Total 4,340.00 100.00
Source: Mina Municipal Planning and Development Office

MUNICIPAL PROFILE 2017 MUNICIPALITY OF MINA
12
DEMOGRAPHY
- Population Trend and Growth Rate As per national census, Mina has a total population of
4,280 in 1903. The population then rose to 5,134 in 1918; 6,623
in 1939; 7,298 in 1948; 8,441 in 1960; 9,649 in 1970; 18, 096 in
2000; 19,809 in 2007; 21,785 in 2010 and 23,546 in 2015 (see
table 5).
Table 5. HISTORICAL GROWTH OF POPULATION
Year Populati
on
Increase or
Decrease
Growth Rate for the
Locality
1903 4,280 - -
1918 5,134 854 1.25
1939 6,623 1,498 1.32
1948 7,298 675 1.02
1960 8,441 1,143 1.20
1970 9,649 1,208 1.30
1975 11,641 1,992 3.44
1980 12,290 649 0.93
1990 15,807 3,517 2.60
1995 16,419 612 0.65
2000 18,096 1,677 1.70
2007 19,809 1,713 1.18
2010 21,785 1,976 2.49
2015 23, 546 1,761 1.35
Source: Census of Population,NSO
`
Annual growth rate (AGR) is computed at 1.35% using the
HLURB standard with CY 2010 and 2015 census years as the basis.
The said annual growth rate was used in projection of the
population as shown in Table 6.
Table 6. PREVIOUS, CURRENT AND PROJECTED POPULATION PER
BARANGAY
(2000-2020)
NAME OF
BARANGAY 2000 2007
2010
5-1-
12
2015 2016 2017 2018 2019 2020
URBAN
1 Mina East 1,142 1,078 1,362 1,380 1, 399 1,418 1,437 1,456 1,476
2 Mina West 1,374 1,375 1,388 1,249 1,266 1,283 1,300 1,318 1,336
Sub - Total 2,516 2,453 2,750 2,629 2,665 2,701 2,737 2,774 2,812
RURAL
1 Abat 595 719 799 850 861 873 885 897 909
2 Agmanaphao 1,340 1,341 1,412 1,535 1556 1577 1598 1620 1641
3 Amiroy 1,347 1,497 1,621 1,723 1746 1770 1794 1818 1842
4 Badiangan 1,527 1,560 1,764 1,816 1841 1865 1891 1916 1942
5 Bangac 854 1,134 1,295 1,503 1523 1544 1565 1586 1607

MUNICIPAL PROFILE 2017 MUNICIPALITY OF MINA
13
6 Cabalabaguan 1,422 1,629 1,883 2,062 2090 2118 2147 2176 2205
7 Capul-an 486 557 591 653 662 671 680 689 698
8 Dala 753 791 988 1,203 1219 1236 1252 1269 1286
9 Guibuangan 231 256 277 293 297 301 305 309 313
10 Janipa-an
East 963 1,077 1,207 949 962 975 988 1001 1015
11 Janipa-an
West 610 743 775 1,284 1301 1319 1337 1355 1373
12 Nasirum 216 241 276 300 304 308 312 317 321
13 Naumuan 353 391 393 439 445 451 457 463 469
14 Singay 531 603 624 709 719 728 738 748 758
15 Tal. Grande 423 540 603 637 646 654 663 672 681
16 Tal. Pequeño 353 427 475 531 538 545 553 560 568
17 Tipolo 543 579 625 677 686 695 705 714 724
18 Tolarucan 1,523 1,656 1,707 1,902 1928 1954 1980 2007 2034
19 Tumay 915 965 1,046 1,101 1116 1131 1146 1162 1177
20 Yugot 595 650 674 750 760 770 781 791 802
Sub - Total 15,580 17,356 19,035 20,917 21,199 21,486 21,776 22,070 22,368
TOTAL 18,096 19,809 21,785 23,546 23,864 24,187 24,513 24,844 25,180
Source:MPDO
- Urban-Rural Population Mina is still considered a rural municipality with 88.83%
or 20,917 of its population residing in the rural barangay’s in
year 2015. About 11.17% or 2,629 residents were in the poblacion.
This is due to the fact that the municipality is basically an
agricultural community, and that majority of residents derived
their source of living from agricultural and other related
occupations.
- Age-Sex Population Distribution - Age Distribution
In the 2016 BSPO Survey, ages 5-9 had the most number of
population with 2,622 (both sexes) and ages 75-79 had the least
number with only 3517 (table 7). Moreover, if we classify the
present age distribution, it would reveal that the large portion
of the current population of Mina belongs to the child and youth
age group (below 1 year old – 24 years old) with a total of
11,780 or 46% of the total population.
Table 7. CURRENT POPULATION BY AGE-GROUP, SEX
2016
Age Group Male Female Both Sexes
All Ages 13,069 12,539 25,608 0 – 4 1184 1072 2256
5 – 9 1385 1242 2627
10 – 14 1273 1147 2420
15 – 19 1131 1082 2213
20 – 24 1230 1099 2329
25 – 29 1199 1130 2329

MUNICIPAL PROFILE 2017 MUNICIPALITY OF MINA
14
30 – 34 1096 930 2026
35 – 39 922 809 1731
40 – 44 779 766 1545
45 – 49 641 645 1286
50 – 54 619 595 1214
55 – 59 499 524 1023
60 – 64 392 424 816
65 – 69 265 340 605
70 – 74 194 254 448
75 – 79 122 195 317
80 and over 138 285 423
Source: BSPO Survey 2016
- Sex Distribution
Based on the 2010 census of population of the municipality
which is 21,785, the projected population for calendar year 2015
is 23,900 distributed by age group and sex (table 6 & Figure 6).
Males outnumbered females by 418, that is 12,159 males over
11,741 females or there are 101 males in every 100 females. BSPO
actual survey for 2015 come-up with a higher population of 25,321
compared to the projected one.
Table 8. PROJECTED POPULATION BY AGE-GROUP, SEX
2015
Projected Population
based on 2010 NSO Survey BSPO Survey for 2015
Age Group Male Female Both
Sexes Male Female
Both
Sexes
All Ages 12,15
9 11,741 23,900 12, 884 12,437 25,321
0 - 4 1363 1263 2625 1222 1109 2331
5 - 9 1265 1206 2471 1370 1252 2622
10 - 14 1223 1108 2331 1209 1144 2353
15 - 19 1205 1123 2328 1167 1048 2215
20 - 24 1183 1100 2283 1199 1122 2321
25 - 29 1062 906 1968 1226 1134 2360
30 - 34 859 780 1639 1055 926 1981
35 - 39 757 714 1471 889 787 1676
40 - 44 688 644 1332 728 752 1480
45 - 49 622 625 1247 662 616 1278
50 - 54 516 524 1040 558 592 1150
55 - 59 434 444 879 511 526 1037
60 - 64 313 388 701 363 393 756
65 - 69 238 264 502 267 328 595
70 - 74 197 244 441 187 231 418
75 - 79 113 177 290 142 214 356
80 and
Above
122 229 351 129 263 392

MUNICIPAL PROFILE 2017 MUNICIPALITY OF MINA
15
POPULATION
PROJECTED (2015)
Figure 4. AGE-SEX DISTRIBUTION OF POPULATION
1,2
00
FEMALE - 12,437MALE - 12,884
70 - 74
65 - 69
60 - 64
50 - 54
45 - 49
40 - 44
25 - 29
30 - 34
35 - 39
15 - 19
20 - 24
10 - 14
5 - 9
0 - 4 1263
906
1100
1123
1108
1206
264
388
444
524
625
644
714
780
229
177
1363
1265
1223
1205
688
757
859
1062
1183
113
238
313
434
516
622
1221,0
00
800
600
40
0
20
0
0
10
0
200
1,2
00
1,0
00
800
600
400
55 - 59
300
50
0
70
0
90
0
1,1
00
900
1,1
00
1,3
00
100
300
500
700
80 & Over
197 244
75 - 79

MUNICIPAL PROFILE 2017 MUNICIPALITY OF MINA
16
- Labor Force The BSPO survey on 2016 (table 9) shows that the municipality of
Mina has a potential labor force of 15,880, the total population ages 15
years and over. Out of these, 11,101 is in the labor force wherein 6,844
are males and 4,257 are females. 7,944 or 71.56 % of the total 11,101 are
employed while the other 3,157 or 28.44% are not employed. However, 4,779
or 30.09% of the total population 15 years and over are not in the labor
force. The Poverty Incidence of Mina as of Calendar Year 2012 is at 24.3%
as surveyed by the National Statistics Census Board. Figure 5 shows the
pie graph of labor force employment status and Table 8 shows the
participation ratio of labor force of the municipality.
Table 9. LABOR FORCE POPULATION BY SEX AND EMPLOYMENT STATUS 2016
Pop’n. 15
yrs. &
Over
Labor Force Not in the
Labor Force
% %
Male 13,069 8,508 33% 4,561 18%
Female 12,539 8,004 31% 4,535 18%
TOTAL 25,608 16,512 64% 9,096 36%
16,512 64%
9,096 36%
Figure 5. LABOR FORCE EMPLOYMENT STATUS
LABOR FORCE
Not in the labor Force

MUNICIPAL PROFILE 2017 MUNICIPALITY OF MINA
17
- Marital Status Year 2010 census of population indicates that majority of the youth
still enjoy being single and prefer 25-29 as an ideal marrying age. See
table (table 10).
Table 10. MARITAL STATUS BY AGE GROUP
Age Group
Sex
Household
Population
10 Years
Old and
Over
M A R I T A L S T A T U S
Single Married Widowed
Divorc
ed/Sep
arated
Comm
on-
law/
Live
-in
Unknow
n
Total 21785 12697 7767 959 103 244 15
Below 20 8892 8806 51 - 2 25 8
20-24 2081 1566 442 2 6 64 1
25-29 1794 903 826 3 9 53 -
30-34 1494 457 990 11 10 26 -
35-39 1341 259 1027 16 11 28 -
40-44 1214 179 959 42 18 13 3
45-49 1137 149 906 50 13 18 1
50-54 948 100 730 98 15 4 1
55-59 801 73 617 96 11 4 -
60-64 639 76 461 92 6 3 1
65-69 458 37 297 121 - 3 -
70-74 402 41 235 123 1 2 -
75-79 264 21 130 111 1 1 -
80 and Over 320 30 96 194 - - -
Source: 2010 Census of Population and Housing
NSO
- Households In the 2000 census year, populations of Mina were distributed in
3,426 households. The 2010 Census (table 10) come-up with 4,557
households an increase of 1,131 households for the span of ten (10)
years, averaging 113 households per year. The projected number of
households is 5407 for 2016 and 6,059 in year 2020 with an annual growth
rate (AGR) of 1.87%. BSPO actual survey of household is 5128 for year
2015.
Table 11. PREVIOUS, CURRENT AND PROJECTED HOUSEHOLDS BY BARANGAY
(2000-2020)
BARANGAYS 2000 2010 2013 2014 2015 2016 2020
A. URBAN
1. Mina East 215 266 290 298 299 316 354
2. Mina West 252 289 315 324 269 343 384
Sub-Total 467 555 605 622 568 659 738

MUNICIPAL PROFILE 2017 MUNICIPALITY OF MINA
18
B. RURAL
1. Abat 131 176 192 197 204 209 234
2. Agmanaphao 236 297 324 333 341 352 395
3. Amiroy 259 336 366 376 385 398 447
4. Badiangan 292 369 402 414 411 438 491
5. Bangac 154 253 275 283 304 300 336
6. Cabalabaguan 268 417 454 467 439 495 554
7. Capul-an 93 124 135 139 131 147 165
8. Dala 137 214 233 240 239 254 285
9. Guibuangan 48 62 67 70 67 74 82
10. Janipa-an East 181 243 265 272 270 288 323
11. Janipa-an West 124 157 171 176 202 187 209
12. Nasirum 48 59 64 66 75 70 78
13. Naumuan 70 85 93 96 93 101 113
14. Singay 88 126 137 141 148 149 167
15. Talibong Grande 81 116 127 130 134 138 155
16. Talibong Pequeño 75 95 103 106 116 112 126
17. Tipolo 93 127 138 143 147 151 169
18. Tolarucan 298 365 398 409 440 433 485
19. Tumay 181 235 256 264 251 279 313
20. Yugot 106 146 159 163
163 173 194
Sub-Total 2,959 4,002 4,359 4,485 4560 4748 5,321
TOTAL 3,426 4,557 4,964 5,107 5128 5407 6,059
- Overseas Workers Table 12 shows that the number of Overseas Filipino Workers (OFW) is
increasing every year. In 2011, there were a total of 771 people who are
working abroad and are increasing annually. Thus in year 2015, it rose to
1112 OFWs. In the table shows that most of the OFWs were female. This is
an indication that people from the municipality preferred to work abroad
for better job opportunities and better earnings than remain in the
locality where job opportunities were few.
Table 12. Overseas Workers for the Past Five Years Year No. of Overseas
Workers
Increase/Decrease in
No.
Increase/Decrease in Percent
(%)
Total Male Female Total Male Female Total Male Female
2011 771 318 453 - - - - - -
2012 857 360 498 87 42 45 11.28 13.21 9.93
2013 949 408 541 91 48 43 10.62 13.33 8.64
2014 1046 463 584 98 55 43 10.33 13.48 7.95
2015 1112 486 626 108 66 42 10.33 14.26 7.19
Source: Population Office
-Population Density Based on the 2015 census of population of 23,546 and land area of
4,340 Hectare, the Municipality of Mina has a population density of 5.43
persons per hectare (table 13). Because Mina being an agricultural town,
rice fields almost comprises the land area.

MUNICIPAL PROFILE 2017 MUNICIPALITY OF MINA
19
Table 13. POPULATION DENSITY PER BARANGAY
BARANGAY Area
(has.) Population
Population
Density
A. URBAN
1.Mina East 100.5942 1,380 13.72
2.Mina West 30.3433 1,249 41.16
Sub Total 130.9375 2,629 20.08
B. RURAL
1.Abat 200.6268 850 4.24
2.Agmanaphao 422.9784 1,535 3.63
3.Amiroy 506.4051 1,723 3.40
4.Badiangan 539.2654 1,816 3.37
5.Bangac 128.4701 1,503 11.70
6.Cabalabaguan 225.2673 2,062 9.15
7.Capul-an 163.0339 653 4.01
8.Dala 146.6137 1,203 8.21
9.Guibuangan 33.6079 293 8.72
10.Janipa-an East 289.3227 949 3.28
11.Janipa-an West 268.8109 1,284 4.78
12.Nasirum 100.5722 300 2.98
13.Naumuan 124.3696 439 3.53
14.Singay 59.7538 709 11.87
15.Talibong Grande 134.8868 637 4.72
16.Talibong Pequeño 145.2741 531 3.66
17.Tipolo 104.1961 677 6.50
18.Tolarucan 291.1995 1,902 6.53
19.Tumay 147.0541 1,101 7.49
20.Yugot 177.3541 750 4.23
Sub Total 4,209.0625 20,917 4.97
Total 4,340.00 23,546 5.43
Source:NSO,2015
- Dialect Spoken The Hiligaynon Ilonggo dialect is spoken in 99.14% of all homes in
the municipality base on the 2010 census. Some speak other dialects like
Cebuano, Tagalog, Ilocano, and Bicol as shown in table 14. A sprinkling
of other dialects like ati, badjao, masbateño, capizeño and others may be
heard spoken by few. These show that immigration is one aspect of our
population growth.
Table 14. DIALECT SPOKEN
MOTHER TONGUE HH
POPULATION
% to
TOTAL Hiligaynon Ilonggo 21,597 99.14
Cebuano 42 0.19
Tagalog 35 0.160
Ilocano 16 0.073
Bikol/Bicol 14 0.064

MUNICIPAL PROFILE 2017 MUNICIPALITY OF MINA
20
Ati 9 0.040
Badjao 8 0.037
Masbateño/Masbatenon 8 0.037
Capizeño 7 0.032
Waray 7 0.032
Akeanon 6 0.027
Ibatan 5 0.023
Other Foreign
Ethnicity
5 0.023
Aromanen-manobo
Aromanen-Ma
3 0.014
Hanunuo 3 0.014
Karay-a 3 0.014
Boholano 2 0.009
Gubatnon 2 0.009
Ibaloi/Ibaloy 2 0.009
Ifugao 2 0.009
American/English 2 0.009
Agta-Cimaron 1 0.005
0 Bisaya/Binisaya 1 0.005
Davao-Chavacano 1 0.005
Maranao 1 0.005
Palawan/Palawan-o 1 0.005
Romblomanon 1 0.005
Tau-buid 1 0.005
TOTAL 21,785 100.00
Source: 2010 Census of Population and
Housing,National Statistics Office
- Religion Roman Catholicism is the dominant religion being practiced by 97.74%
of the entire population in 2010 census. Other religion or sect also
exist but of very minimal percentage. To mention, they are Bible Baptist
Church, Iglesia ni Kristo, Evangelicals, Seventh Day Adventist, Church of
Christ, Jehova's Witness and other’s., see table 15 below.
Table 15. RELIGIOUS GROUP IN THE MUNICIPALITY
RELIGION NUMBER % to TOTAL
Roman Catholic including Catholic
Charismatic
21,293 97.74
Bible Baptist Church 113 0.519
Iglesia ni Cristo
cristo
107 0.491
Evangelicals (Philippine Council of
Evangelical Churches)
79 0.362
Sevent Day Adventist 42 0.193
Church of Christ 40 0.184
Jehovahs Witness 32 0.147
Other Religious Affiliations 20 0.092
Aglipay 13 0.060
Jesus is Lord Church 13 0.060
Association of Fundamental Baptist
Churches in the Philippines
12 0.055
Islam 6 0.027
Bread of Life Ministries 5 0.023
MUNICIPAL PROFILE 2017 MUNICIPALITY OF MINA
21
Buddhist 5 0.023
Tribal Religions 2 0.009
Iglesias a Dios Espiritu Santo
Incorporated
1 0.005
Philippine Grace Gospel 1 0.005
Other Protestants 1 0.005
TOTAL 21,785 100.00
Source: 2010 Census of Population
and Housing
National Statistics
Office
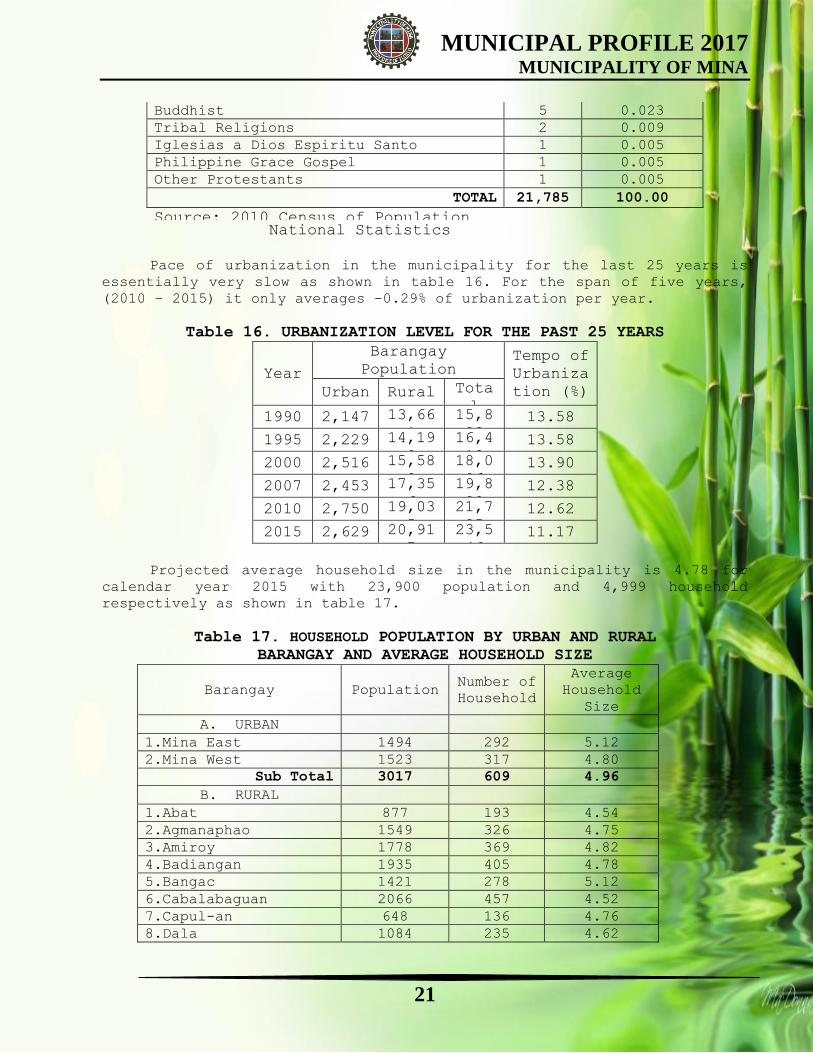
Pace of urbanization in the municipality for the last 25 years is
essentially very slow as shown in table 16. For the span of five years,
(2010 – 2015) it only averages -0.29% of urbanization per year.
Table 16. URBANIZATION LEVEL FOR THE PAST 25 YEARS
Year
Barangay
Population Tempo of
Urbaniza
tion (%) Urban Rural Tota
l 1990 2,147 13,66
1
15,8
08 13.58
1995 2,229 14,19
0
16,4
19 13.58
2000 2,516 15,58
0
18,0
96 13.90
2007 2,453 17,35
6
19,8
09 12.38
2010 2,750 19,03
5
21,7
85 12.62
2015 2,629 20,91
7
23,5
46 11.17
Projected average household size in the municipality is 4.78 for
calendar year 2015 with 23,900 population and 4,999 household
respectively as shown in table 17.
Table 17. HOUSEHOLD POPULATION BY URBAN AND RURAL
BARANGAY AND AVERAGE HOUSEHOLD SIZE
Barangay Population Number of
Household
Average
Household
Size
A. URBAN
1.Mina East 1494 292 5.12
2.Mina West 1523 317 4.80
Sub Total 3017 609 4.96
B. RURAL
1.Abat 877 193 4.54
2.Agmanaphao 1549 326 4.75
3.Amiroy 1778 369 4.82
4.Badiangan 1935 405 4.78
5.Bangac 1421 278 5.12
6.Cabalabaguan 2066 457 4.52
7.Capul-an 648 136 4.76
8.Dala 1084 235 4.62

MUNICIPAL PROFILE 2017 MUNICIPALITY OF MINA
22
9.Guibuangan 304 68 4.47
10.Janipa-an - East 1324 267 4.97
11.Janipa-an West 850 172 4.94
12.Nasirum 303 65 4.68
13.Naumuan 431 93 4.62
14.Singay 685 138 4.96
15.Talibong Grande 662 127 5.20
16.Talibong Pequeño 521 104 5.00
17.Tipolo 686 139 4.92
18.Tolarucan 1873 400 4.68
19.Tumay 1148 258 4.45
20.Yugot 739 160 4.61
Sub Total 20883 4390 4.76
TOTAL 23900 4999 4.78

MUNICIPAL PROFILE 2017 MUNICIPALITY OF MINA
23
SOCIAL SERVICES
- EDUCATION
- ELEMENTARY EDUCATION
The municipality of Mina has a total of 11 public elementary schools
and 1 private school. All of the schools were equipped with the necessary
facilities. The facilities and its condition of all public and private
schools are best shown in Table 18 below. The schools found in the
municipality were almost low susceptible to flood and landslides. When it
comes to earthquake, the schools were moderately susceptible. The rest of
the data is presented in the table stated.
Table 18 Schools by Level, Type, Facilities and Condition SY 2015-2016,
Mina, Iloilo
School Location
(Brgy.)
Lot
Area(Ha.)
Type Facilities and
Conditions
Pub Pri La S Li Cl Cr P
1. Mina Central
School
Mina East 2.4206 / N P P G G P
2. Abat ES Abat 1.0356 / N N P P P G
3. Agmanaphao ES Agmanaphao 1.0126 / N N P P G G
4. Amiroy ES Amiroy 1.0000 / N N P P P G
5. Badiangan ES Badiangan 1.0064 / N P P N G P
6. Cabalabaguan ES Cabalabagu
an
0.9967 / N N P P P G
7. Nasirum ES Tal.
Pequeño
1.0280 N N N N G P
8. Tipolo ES Tipolo 1.0000 / N N C N G P
9. Armada-Pelaez
ES
Tolarucan 0.5000 / N N N N G P
10. Dala-Singay ES Singay 0.3000 / N N N N G P
11. Janipa-an ES Janipa-an
East
1.5412 / N N N N G G
12. OLPCS Poblacion 0.2500 / N N N N G G
Secondary
1. Mina NHS
Bangac-
Talibong
Grande
5.000 / G G P N G P
Source: DepEd District Office, Primary Survey/MPDO
N = none, P = poor, G = good, C = critical
The whole district of Mina has a total of elementary school
enrolment of 3082 which is composed of 1659 males anf 1423 females. All
in the entire whole district has a total of 105 classrooms and same
number of teachers. The student –teacher ratio is 29:1 and the same with
the student classroom ratio, in general. For further data, Table 19 is
hereby presented.

MUNICIPAL PROFILE 2017 MUNICIPALITY OF MINA
24
Table 19. Student-Teacher and Student-Classroom Ratio by Level, SY 2015-
2016, Mina, Iloilo
Type/Level No. of Enrollees No. of
Teachers
No. of
Classrooms
Student-
Teacher
Ratio
Student-
Classroom
Ratio Male Female Total
Private
Elementary 62 58 120 6 6 20:1 20:1
Public
Elementary 1659 1423 3082 105 105 29:1 29:1
Abat ES 157 106 263 8 8 33:1 33:1
Agmanaphao ES 97 77 174 7 7 25:1 25:1
Amiroy ES 109 93 202 7 7 29:1 29:1
Armada-Pelaez
ES
89 62 151 6 6 25:1 25:1
Badiangan ES 127 119 246 7 7 35:1 35:1
Cabalabaguan
ES
173 142 315 9 9 35:1 35:1
Dala-Singay
ES
89 105 194 6 6 32:1 32:1
Janipa-an ES 66 68 134 6 6 22:1 22:1
Mina CS 561 500 1061 36 36 29:1 29:1
Nasirum ES 78 70 148 7 5 21:1 30:1
Tipolo ES 113 81 194 6 7 32:1 28:1
Source: DepEd District Office, Primary Survey
The entire elementary schools in the municipality have a
participation rate of 100%, survival rate of 92%, completion rate of 96%,
graduation rate of 100% and drop-out rate of 0% as of SY 2015-2016. The
distribution of every school is best shown in Table 20.
Table 20. Historical Drop-out, Completion, Survival, Graduation and
Participation Rates in Elementary Level for the Last Five School Years
Abat ES
Agmanaph
ao ES
Amiroy
ES
Armada-
Pelaez
ES
Badianga
n ES
Cabalaba
guan ES
Dala-
Singay
ES
Janipa-
an ES
Mina CS
Nasirum
ES
Tipolo
ES
TOTAL
Participation Rate, %
2011-2012 100 83 90 100 100 86.05 97.9
2
83.
75
93.11 87.50 83.56 91
2012-2013 100 99 92 100 100 54.88 100 100 99.18 93 100 93
2013-2014 100 100 100 100 100 100 100 100 99.74 100 100 100
2014-2015 100 100 100 100 100 100 100 100 99.26 100 100 100
2015-2016 100 100 96 100 100 100 100 100 99.40 100 100 100
Survival Rate, %
2011-2012 94 77 87 100 52 96.55 94.7
4
89.
47
78.76 79 75.86 84
2012-2013 93 75 93 100 47 86.66 89.4
7
94.
74
94.12 81 80 85
2013-2014 95 76 78 100 85 47.69 89.4
7
100 88.75 84.2 86.66 85
2014-2015 89 70.
96
73 93.3
3
83 79.16 84.8
5
100 97.44 93 74.29 85

MUNICIPAL PROFILE 2017 MUNICIPALITY OF MINA
25
2015-2016 91 80 78 93.3
3
94 100 100 100 98.97 100 79.30 92
Drop-out Rate, %
2011-2012 0 0 3 0 0 0.50 0 0 4.62 2 0 1
2012-2013 0 0 0 0 0 0 0 0 0.09 2 0 0
2013-2014 0 0 0 0 0 0 0 0 0 0 0 0
2014-2015 0 0 0 0 0 0 0 0 0.73 0 0 0
2015-2016 1.1
4
0 0 0 0 0 .052 0 0.22 0 0 0
Completion rate, %
2011-2012 100 77 81 100 74 94.82 94.2
1
100 86.98 75 75.86 87
2012-2013 100 70 94 100 51 85 89.4
7
100 88.24 85 80 86
2013-2014 100 76 75 100 89 47.69 89.4
7
100 95.71 89 86.66 86
2014-2015 100 100 71 100 83 79.16 84.8
5
100 89.89 93 74.29 89
2015-2016 99.
43
100 76 100 94 100 100 100 98.48 100 89.65 96
Graduation Rate, %
2011-2012 100 100 93 100 95 100 100 100 98 95 100 98
2012-2013 100 93 97 100 96 98.07 100 100 100 94 100 98
2013-2014 100 95 100 100 100 98.38 100 100 100 94.10 84.62 97
2014-2015 100 100 100 100 100 100 100 100 99.34 93 100 99
2015-2016 100 100 96 100 100 100 100 100 98.97 100 100 100
Source: Mina, District Office
The Distribution of the historical enrolment in all of the public
elementary schools is best shown in Table 21 below.
Table 21. Historical Enrolment by Level for the Last Three Years
Level SY 2015-
2016
SY 2014-2015 SY 2013-2014 2012-2013
Number Number Inc./Dec. Number Inc./Dec. Number -
Primary - - - - - - -
Elementary
Abat ES 263 263 264 263
Agmanaphao ES 174 184 176 186
Amiroy ES 202 208 221 187
Armada-Pelaez
ES
151 150 123 102
Badiangan ES 246 246 232 226
Cabalabaguan
ES
315 312 355 348
Dala-Singay
ES
194 191 187 124
Janipa-an ES 134 132 118 106
Mina CS 1061 1047 1050 1071
Nasirum ES 148 140 141 139
Tipolo ES 194 193 162 172
Total 3082 3066 3029 2924
Source: Deped, District Office

MUNICIPAL PROFILE 2017 MUNICIPALITY OF MINA
26
- SECONDARY EDUCATION
The municipality has one existing secondary school, the Mina
National High School. It is situated at Brgy. Bangac- Talibong Grande,
Mina with the total lot area of 5 hectares as represented in Table 3.1.1.
It is equipped with 39 classrooms having 1:42 student-classroom ratio.
The MNHS has the total of 60 teachers having 1:27 student and teacher
ratio. As of SY 2015-2016, the MNHS has a total enrolment of 1637
students consists of 860 males and 777 females as shown in Table 22.
Table 22. Student-Teacher and Student-Classroom Ratio by Level, SY 2015-
2016
Type/Level No. of Enrollees No. of
Teachers
No. of
Classrooms
Student-
Teacher
Ratio
Student-
Classroom
Ratio Male Female Total
Private
Secondary
- - - - - - -
Public
Secondary
860 777 1637 60 39 1:27 1:42
Source: DepEd, Mina National High School
The enrolment of MNHS in the last three school years from 2015-2016
baselines is shown in the Table 23 wherein from SY 2012-2013 (1545
students) it increases its enrolment by 1.17% in 2013-2014 and 3.20% in
SY 2014-2015.
Table 23. Historical Enrolment by Level for the Last Three Years
Level SY
2015-
2016
SY 2014-2015 SY 2013-2014 SY 2012-
2013
Number Number Increase/decrease Number Increase/decrease Number -
Secondary 1637 1613 3.20% 1563 1.17% 1545 -
Total 1637 1613 1563 1545 -
Source:Mina National High School
The Mina National High School has its highest enrolment
participation rate by SY 2015-2016 and 2013-2014 with the rate of 99.32%.
it reaches its highest drop-out rate of 2.41% in SY 2012-2013 and
attained 0% drop-out rate in SY2014-2015. In SY 2014-2015, MNHS has the
Completion and Survival Rate of 99.75% which is the highest attainment of
the said school in the past school years. It attains it 100% graduation
rate in the three consecutive school years from SY2013-2014 up to 2015-
2016. For further explanation see table 24.
Table 24. Historical Drop-out, Completion, Survival, Graduation and
Participation Rates in Secondary Level for the Last Five School Years
School
Year
Secondary Level
Enrolment
Participation
Rate, %
Drop-out
Rate, %
Completion
Rate, %
Survival
Rate, %
Graduation
Rate, %
2011-
2012
90.07 2.33 88.76 90.07 99

MUNICIPAL PROFILE 2017 MUNICIPALITY OF MINA
27
2012-
2013
99.14 2.41 97.42 97.99 95.77
2013-
2014
99.32 0.32 94.10 94.10 100
2014-
2015
99.28 0.00 99.75 99.75 100
2015-
2016
99.32 0.49 90.82 99.32 100
Source: Mina National High School
- TECHNICAL/ VOCATIONAL EDUCATION
The municipality of Mina has one technical-vocational school that
exists, the Mina Skills Training Center (MSTC). It is situated at the
Poblacion wherein it offers skills trainings and technical-vocational
courses like housekeeping, masonry, carpentry, welding and electrical
installation. It is a government owned school with an area of 0.3908
hectares and having an enrolment of 269 enrollees consists of different
courses it offers as reflected in Table 25.
Table 25. Vocational/Technical School, 2015 Mina, Iloilo
Name of school Location
(Brgy.)
Area
(Ha.)
Type Total
Enrolment Publ
ic
Priva
te
Vocational/Technical
1. Mina Skills
Training Center
Mina
East
0.3908 / 269
Source: CHED,MSTC
The MSTC had most number of enrollees in the year 2014 which is
consists of 134 for SMAW NCI, 119 in Carpentry NCII, 77 in EIM NCII, 66
in Masonry NCII and 38 enrollees for the housekeeping. The least among
the history of enrolment at the MSTC was in 2011 with a total of 210
enrollees only. The enrollees who could graduate and passed the
assessment is secured with the competencies that made him qualified to go
abroad to earn a living. The MSTC was made possible in order to cater the
needs of those who wanted to attain higher education yet unlucky enough
to support his educational needs.
The said school could mitigate the problem in poverty and
unemployment in the locality. The growth of the enrolment of the MSTC for
the past five years is best shown in Table 26 below.
Table 26. Historical Enrolment by Level for the Last Five Years
Level 2011 2012 2013 2014 2015
Voc./Technical
SMAW NC I 35 45 21 134 46
SMAW NC II - - 30 - -
HOUSEKEEPING NC II 28 35 81 38 114
MASONRY 50 - - - -
MASONRY NC II - 45 30 66 -
EIM NC II - - - 77 62
CARPENTRY NC II 97 88 55 119 47

MUNICIPAL PROFILE 2017 MUNICIPALITY OF MINA
28
Total 210 213 217 434 269
Source: MSTC
The municipality of Mina through MCEC conducts a computer workshop
every summer. It is the program the children in the locality are engaged
in the computer lessons and workshop which can uplift there intelligence
and knowledge with regards to computer. The computer-literacy matrix is
shown in Table 27. The Table shows that the trainees increase in number
every year until it reaches 801 trainees in 2015. Most of the trainees
were female having 2:1 in ratio with the male trainees. All in all, in
the past five years there were already a total of 2352 trainees who
undergone computer literacy training, 1,579 were consists of males and
773 were males.
Table 27. HISTORICAL ENROLMENT of COMPUTER LITERACY TRAINING
Year No. of Trainees
Male Female Total
2011 66 129 195
2012 20 188 208
2013 153 223 376
2014 294 478 772
2015 240 561 801
Grand Total 773 1579 2352
Source:MCeC
- SPECIAL EDUCATION (SPED) and ALTERNATIVE LEARNING SYSTEM (ALS) In order to address the needs of the special children or children
with disabilities, the development of the Special Education Class in the
District of Mina was materialized. The said class will offer activities
and lessons that are given only to the persons of the special needs. This
program has given an opportunity for the special individuals to show and
have access with the general education like that of the normal persons.
The enrolment of the SPED class is presented in Table 28.
The municipality had also opened a program that addresses the needs
also of the individuals who were hopeless to attain and have a basic
education due to poverty. The primary clients of the said program were
the OSY or the out of school youth who were old enough to enter school.
The classes were during weekends wherein the teachers itself went to the
barangays to teach. At the end of the classes in the school year, the
students were given a qualifying exam that will determine whether they
will graduate or not. The number of enrollees for the ALS is presented in
Table 29.
Table 28. Report of Enrolment of SPED Class, SY 2012-2013
EXCEPTIONALITY
No. of Pupils
Male Female Total
Fast Learners/ Gifted and Talented 43 64 107
Learning Disability (LD) 4 9 13
Hearing Impaired 8 8 16
Visual Impairment – (Blindness) 2 6 8
Multiple Disability w/ Visual 3 1 4
MUNICIPAL PROFILE 2017 MUNICIPALITY OF MINA
29
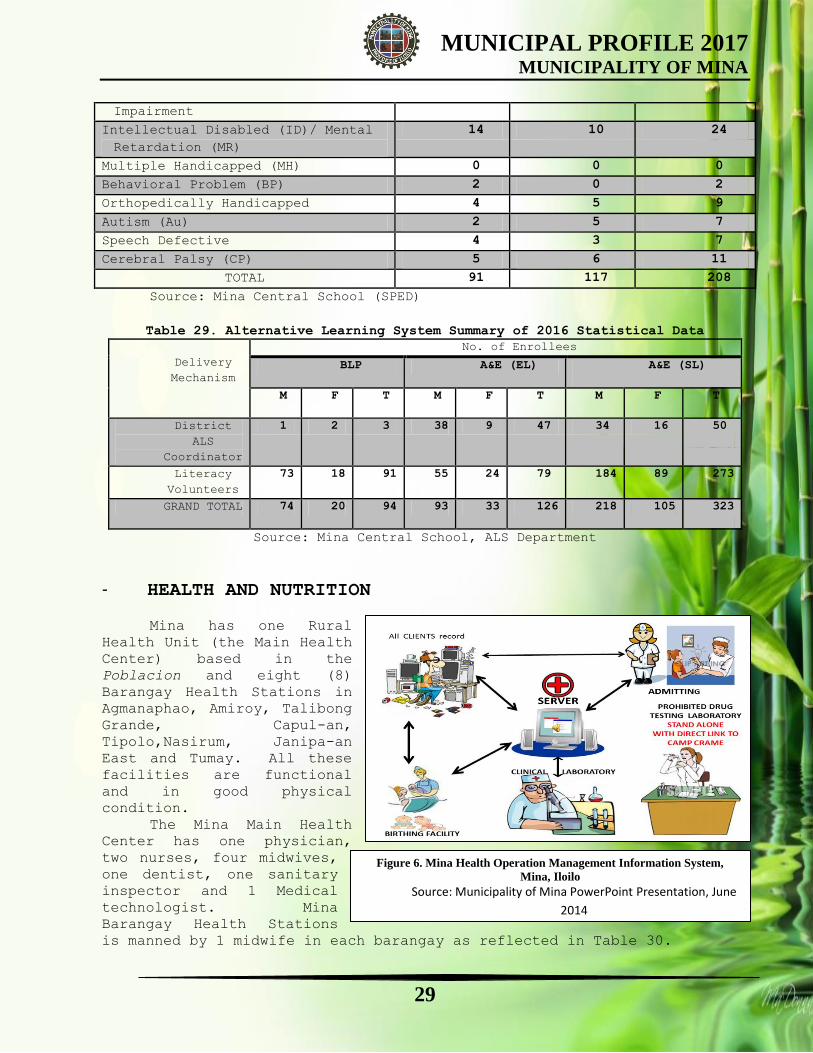
Figure 6. Mina Health Operation Management Information System,
Mina, Iloilo
Source: Municipality of Mina PowerPoint Presentation, June
2014
Impairment
Intellectual Disabled (ID)/ Mental
Retardation (MR)
14 10 24
Multiple Handicapped (MH) 0 0 0
Behavioral Problem (BP) 2 0 2
Orthopedically Handicapped 4 5 9
Autism (Au) 2 5 7
Speech Defective 4 3 7
Cerebral Palsy (CP) 5 6 11
TOTAL 91 117 208
Source: Mina Central School (SPED)
Table 29. Alternative Learning System Summary of 2016 Statistical Data
Delivery
Mechanism
No. of Enrollees
BLP A&E (EL) A&E (SL)
M F T M F T M F T
District
ALS
Coordinator
1 2 3 38 9 47 34 16 50
Literacy
Volunteers
73 18 91 55 24 79 184 89 273
GRAND TOTAL 74 20 94 93 33 126 218 105 323
Source: Mina Central School, ALS Department
- HEALTH AND NUTRITION
Mina has one Rural
Health Unit (the Main Health
Center) based in the
Poblacion and eight (8)
Barangay Health Stations in
Agmanaphao, Amiroy, Talibong
Grande, Capul-an,
Tipolo,Nasirum, Janipa-an
East and Tumay. All these
facilities are functional
and in good physical
condition.
The Mina Main Health
Center has one physician,
two nurses, four midwives,
one dentist, one sanitary
inspector and 1 Medical
technologist. Mina
Barangay Health Stations
is manned by 1 midwife in each barangay as reflected in Table 30.

MUNICIPAL PROFILE 2017 MUNICIPALITY OF MINA
30
The Main Health Center provides the following services: maternal and
child health, promotion and education program, minor surgery, and water
and sanitation improvement program. The center also provides laboratory
services with complete blood chemistry and x-ray services.
While there is no hospital in Mina, cases are referred to three
hospitals in nearby municipalities: Iloilo Provincial Hospital in
Pototan, Cabatuan District Hospital and Janiuay District Hospital.
For the past five years, the crude birth rate in the municipality is
gradually decreasing from 44 in 2012 and 12 in 2015. The municipality has
the highest crude death rate of 11 in 2013 and the least crude death rate
of 4 in 2011. In general, there is no case of maternal death in the
municipality and the RHU achieved its highest consultative rate of 24.72
in 2013 as it shown in Table 31.
Table 30. General Health Situation for the Past Five Years
Health Indicator Municipal
2011 2012 2013 2014 2015
No. % No. % No. % No. % No. %
Fertility
Crude Birth Rates (CBR) 20 44 22 14 12
Total Fertility Rate (TFR) - - - - -
Morbidity
General Medical 716 117
8
5287 5243 5512
Consultative Rate 3.4
2
5.5
7
24.7
2
22.3
1
23.0
4
Hospitalization Rate - - - - -
Mortality
Crude Death Rate (CDR) 4 7 11 10 7
Proportioned Mortality Rate
(PMR)
- - - - -
Infant Mortality Rate (IMR) 0 0 8.6 0 0
Young Child Mortality Rate
(YCMR)
- - - - -
Maternal Mortality Rate
(MMR)
0 0 0 0 0
Source:MHO
Table 31. Medical Health Facilities and Personnel, Mina, Iloilo, 2016
Facility Personnel
Barangay Type of
Health
Facility
No.
of
Beds
Physica
l
Conditi
on
Doct
or
Nurs
e
Midwif
e
Denti
st
Sanita
ry
Insp
Med
tech
Poblacion RHU 5 Good 1 2 4 1 1 1
Agmanaphao BHS 1 Good - - 1 - - -
Amiroy BHS 1 Good - - 1 - - -
Tipolo BHS 1 Good - - 1 - - -
Capul-an BHS 1 Good - - 1 - - -
Talibong
Grande
BHS 1 Good - - 1 - - -
Nasirum BHS 1 Good - - 1 - - -
Tumay BHS 1 Good - - 1 - - -
Janipa-an East BHS 1 Good - - 1 - - -
Source: Municipal Health Office, Mina, Iloilo

MUNICIPAL PROFILE 2017 MUNICIPALITY OF MINA
31
A. Health Status
- Ten Leading Causes of Morbidity and Mortality in the Municipality
The RHU records for the past five years showed that the number one
cause of morbidity in the municipality is pneumonia, followed by the URTI
(Upper Respiratory Tract Infection) and UTI (Urinary Tract Infection)
which are consistently having cases in the past five years. The health
office had listed eighteen causes rather than ten since the causes of the
morbidity in the municipality varies every year. In the five-year record,
in 2013 has the most number of deaths which reaches to more or less 1,700
deaths. By 2015, the number of deaths was 974 numbers of deaths as shown
in Table 32.
Table 32. Ten Leading Causes of Morbidity for the Past Five Years
CAUSES
No. of Deaths
2011 2012 2013 2014 2015
1. Pneumonia 571 510 675 440 361
2. URTI (Upper Respiratory Tract
Infection)
517 384 317 208 144
3. UTI (Urinary Tract Infection) 156 115 221 96 124
4. Acute Gastroenteritis 73 52 53 47 41
5. Rhinitis 27 7 - - -
6. Bronchial Asthma 26 31 - 5 -
7. Kochs Disease 21 30 - - -
8. Iron Deficiency Anemia 9 - - - -
9. Bronchitis 10 - 44 - -
10. Tonsillo-pharyngitis 7 - - - -
11. Systemic Viral Infection - 121 238 75 75
12. Acute Respiratory Infection - 46 61 143 91
13. HPN - 39 68 48 34
14. Pulmonary Tuberculosis - - 46 79 38
15. Otitis Media - - 14 - -
16. Wound - - - 74 -
17. UACS (Upper Acute Cough
Syndrome)
- - - - 53
18. Foot Hand and Mouth Disease - - - - 13
TOTAL 1,417 1,335 1,737 1,215 974
Source: Mina MHO
In the municipality, the main cause of mortality in the past five
years is pneumonia. It was followed by cancer of all forms. The least
among the causes of the mortality is the bronchial asthma. The
municipality has the highest mortality percentage in 2014 with a total of
70.8 % or 80 cases of mortality. Most of the victims were male. The rest
of the cases is reflected at the Table 33.

MUNICIPAL PROFILE 2017 MUNICIPALITY OF MINA
32
Table 33. Ten Leading Causes of Mortality for the Past Five Years
Causes
MUNICIPAL
2011 2012 2013 2014 2015
%
Total
M F %
Total
M F %
Total
M F %
Total
M F %
Total
M F
Pneumonia 21.
7
2
2
9 1
3
18.
2
1
7
2 1
5
13.
5
1
7
1
5
2 29.
4
3
3
1
8
1
5
25.
5
23 18 5
Cancer all
forms
7.9 8 3 5 16.
1
1
5
1
0
5 7.6 9 7 2 7.1 8 4 4 11.
1
10 4 6
Cardio vascular
disease
6.9 7 2 5 11.
8
1
1
6 5 7.6 9 5 4 7.1 8 4 4 6.6 6 3 3
Cardio
Pulmonary
Arrest
5.9 6 4 2 7.5 7 4 3 3.3 4 3 1 5.3 6 2 4 5.5 5 3 2
DM type II 3.9 4 2 2 3.2 3 1 2 3.3 4 2 2 5.3 6 4 2 4.4 4 4 0
Acute
Hemorrhagic
Pancreatitis
1.9 2 2 0 3.2 3 0 3 3.3 4 3 1 5.3 6 4 2 4.4 4 3 1
Cerebrovascular
Disease
1.9 2 1 1 3.2 3 0 3 2.5 3 2 1 3.5 4 2 2 3.3 3 2 1
Pulmonary
Tuberculosis
1.9 2 1 1 3.2 3 1 2 1.6 2 1 1 3.5 4 2 2 3.3 3 2 1
Cardio Vascular
Accident
0.9 1 1 0 2.1 2 1 1 0.8 1 1 0 2.6 3 1 2 2.2 2 0 2
Bronchial
Asthma
0.9 1 0 1 1.0 1 0 1 0.8 1 1 0 1.7 2 2 0 1.1 1 1 0
TOTAL 53.
8
5
5
2
5
3
0
69.
5
6
5
2
5
4
0
44.
3
5
4
4
0
1
4
70.
8
8
0
4
3
3
7
67.
4
61 40 21
Source: Mina MHO/ Hospital Records/Local Civil Registrar
Table 34. CRUDE BIRTH RATE (CBR) AND CRUDE DEATH RATE (CDR) FOR THE LAST
FIVE YEARS (2011-2015)
Period CBR
% Increase/
Decrease from
Previous Year
CDR
% Increase/
Decrease from
Previous Year
2011 20 - 4 -
2012 44 120% 7 75%
2013 22 -50% 11 57.14%
2014 14 -36.36% 10 -9.09%
2015 12 -14.29 % 7 -30.00%
Source: RHU
The degree of malnutrition in the municipality reaches its highest
percentage in 2015 having 100.30 % or a total 3239 malnourished children.
The total of 3036 or 94.02% of the malnourished children in 2015 is
having the 1st degree of malnutrition, 138 for the 2
nd degree and 65
children in the 3rd degree. The data on the malnourished children in the
past five years is best shown in Table 35.

MUNICIPAL PROFILE 2017 MUNICIPALITY OF MINA
33
Table 35. Malnourished Children for the Past Five Years (2011-2015)
DEGREE OF
MALNUTRITION
Municipal
2011 2012 2013 2014 2015
No. % No. % No. % No. % No. %
1ST 336
6
92 322
2
87 307
5
88.7
7
3400 89.3
3
3036 94.02
2ND 213 5.8
2
275 7.43 267 7.70 282 7.40 138 4.27
3RD 20 0.5
4
18 0.48 33 0.95 28 0.73 65 2.01
TOTAL 359
9
98.
40
351
5
94.9
9
337
5
97.4
2
3710 97.4
6
3239 100.3
0
Source: Mina MHO
B. Sanitation By 2015, the municipality of Mina has a total of 4635
households have sanitary toilets in the entire municipality. The total of
4371 has their own flush toilets and 264 households have shared flush
sanitary toilet. There is no household having an unsanitary toilet in the
municipality. The municipality had able to provide almost all of the
households with a sanitary toilet as shown in Table 38.
Table 36. Number of Households in Occupied Housing Units by Type of Toilet
Facilities, Year 2016
Barangay
Type of Toilet Facility
Sanitary Unsanitary
Own
Flush
Shared
Flush
Closed
Pit
Latrine
TOTAL Open
Pit
Latrine
Drop/
Overhang
No
Facility/
Field
TOTAL
Abat 169 35 - 204 - - - -
Agmanaphao 202 18 - 220 - - - -
Amiroy 342 18 - 360 - - - -
Badiangan 355 15 - 370 - - - -
Bangac 284 12 - 296 - - - -
Cabalabaguan 415 2 - 417 - - - -
Capul-an 129 0 - 129 - - - -
Dala 163 23 - 186 - - - -
Guibuangan 51 14 - 65 - - - -
Janipa-an
East
247 17 - 264 - - - -
Janipa-an
West
168 28 - 196 - - - -
Mina East 267 10 - 277 - - - -
Mina West 216 3 - 219 - - - -
Nasirum 70 3 - 73 - - - -
Naumuan 79 11 - 90 - - - -
Singay 129 19 - 148 - - - -
Talibong
Grande
117 9 - 126 - - - -
Talibong
Pequeño
81 4 - 85 - - - -
Tipolo 132 3 - 135 - - - -
Tolarucan 399 11 - 410 - - - -
Tumay 242 7 - 249 - - - -
Yugot 114 2 - 116 - - - -
TOTAL 4,371 264 - 4,635 - - - -
Source: Mina MHO
MUNICIPAL PROFILE 2017 MUNICIPALITY OF MINA
34
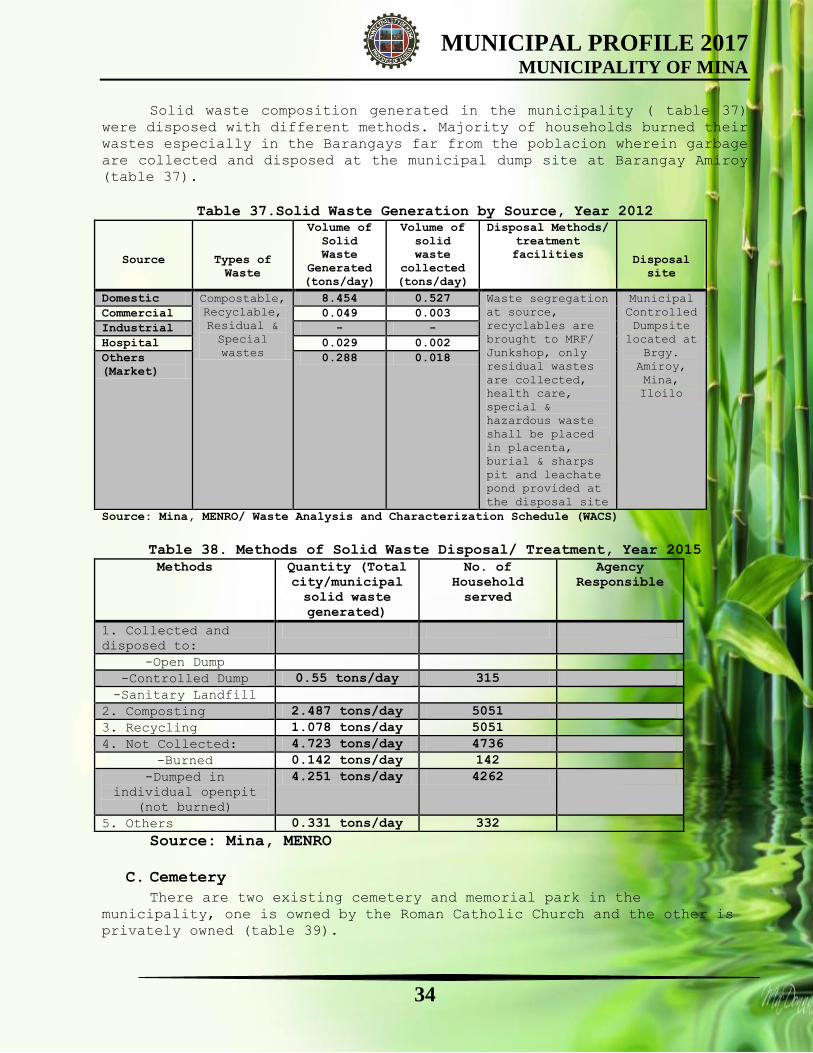
Solid waste composition generated in the municipality ( table 37)
were disposed with different methods. Majority of households burned their
wastes especially in the Barangays far from the poblacion wherein garbage
are collected and disposed at the municipal dump site at Barangay Amiroy
(table 37).
Table 37.Solid Waste Generation by Source, Year 2012
Source
Types of
Waste
Volume of
Solid
Waste
Generated
(tons/day)
Volume of
solid
waste
collected
(tons/day)
Disposal Methods/
treatment
facilities
Disposal
site
Domestic Compostable,
Recyclable,
Residual &
Special
wastes
8.454 0.527 Waste segregation
at source,
recyclables are
brought to MRF/
Junkshop, only
residual wastes
are collected,
health care,
special &
hazardous waste
shall be placed
in placenta,
burial & sharps
pit and leachate
pond provided at
the disposal site
Municipal
Controlled
Dumpsite
located at
Brgy.
Amiroy,
Mina,
Iloilo
Commercial 0.049 0.003
Industrial - -
Hospital 0.029 0.002
Others
(Market)
0.288 0.018
Source: Mina, MENRO/ Waste Analysis and Characterization Schedule (WACS)
Table 38. Methods of Solid Waste Disposal/ Treatment, Year 2015
Methods Quantity (Total
city/municipal
solid waste
generated)
No. of
Household
served
Agency
Responsible
1. Collected and
disposed to:
-Open Dump
-Controlled Dump 0.55 tons/day 315
-Sanitary Landfill
2. Composting 2.487 tons/day 5051
3. Recycling 1.078 tons/day 5051
4. Not Collected: 4.723 tons/day 4736
-Burned 0.142 tons/day 142
-Dumped in
individual openpit
(not burned)
4.251 tons/day 4262
5. Others 0.331 tons/day 332
Source: Mina, MENRO
C. Cemetery
There are two existing cemetery and memorial park in the
municipality, one is owned by the Roman Catholic Church and the other is
privately owned (table 39).

MUNICIPAL PROFILE 2017 MUNICIPALITY OF MINA
35
Table 39. EXISTING CEMETERIES AND MEMORIAL PARKS
Name of Cemetery/
Memorial Parks Barangay
Ownersh
ip
(Public
Or
Private
)
Area
(Ha.) Capacity Remarks
Mina Roman Catholic
Cemetery
Cabalabagu
an Public
0.733
2
Fully
Utilized Congested
RL. Haven Memorial
Park
Cabalabagu
an Private
0.820
2
35 burial
plots, 127
inches
- Housing The last three censual years shows that as the population increases
housing units also increased. Table 40 shows that every household have
their own housing unit and the average household size for censual year
2010 is slightly lower than in the year 2000.
Table 40. Housing Situation for the Last Three Censual Years, Mina,
Iloilo, 2000, 2007 and 2010
2000
2007 2010
Number %
inc/de
c
Number %
inc/dec
Household (HH) 3,426 4,015 17.
19
4,55
7
13.50
Household Population 18,096 19,809 9.47 21,785 9.98
Housing Units (HU) 3,405 4,004 4,672 Occupied HU 3,405 4,004 17.59 4,563 13.96
Vacant HU - - 109 Ratio of HH to Occupied HU 1:1.01 1:1. 1:0.98 Ratio of HH Population to
Occupied HU
5.31:1 4.95:1 4.66:1
Source: NSO CPH 2010, 2007
Table 41 shows that the lot of 50% or 2,336 housing units occupied
were owned /amortized by the household, 39.47% or 1,844 housing units
were situated on lots for free of rent with consent of the lot owner.
Table 41. HOUSEHOLDS IN OCCUPIED HOUSING UNITS BY TENURE STATUS OF
HOUSING UNITS AND LOTS (2010)
Tenure Status of the Lot Housing Unit
No. %
Owned/Amortized 2,336 50.00
Rented 309 6.61
Rent Free with Consent
of Owner
1,844 39.47
Rent Free without
Consent of Owner
57 1.22
Not Applicable 11 0.24
Not Reported 115 2.46
TOTAL 4,672 100.0
0 Source: 2010 census of Population and Housing, NSO

MUNICIPAL PROFILE 2017 MUNICIPALITY OF MINA
36
Majority of the housing units (2,399 units) were constructed with
bamboo/sawali/cogon/nipa as their outerwalls even the roofs were
constructed with galvanized iron or cogon/nipa. 1,418 units have walls
made of concrete/brick or stone, some still having half concrete half
wood as their outer walls but there are still using makeship/salvage or
improvised materials as their outerwalls (Table 42).
Table 42. HOUSING UNITS BY CONSTRUCTION MATERIALSOF THE ROOF AND OUTER
WALLS
Construction
Materials of the
Outer Walls
Total
No.
of
Housi
ng
Units
Construction Materials of the Roof
Galvan
ized
Iron/A
luminu
m
Tile
Concre
te/Cla
y Tile
Hlaf
Galvaniz
ed Iron
and Half
Concrete
Wood
Cogon/
Nipa/
Anahaw
Asbes
tos
Makeshift
/Salvaged
/Improvis
ed
Materials
Other
s
Total 4672 3900 14 42 10 685 2 1 18
Concrete/Brick/St
one 1418 1390 13 8 1 3 2 1 -
Wood 32 28 1 - - 3 - - -
Half Concrete /
Bricks / Stone
and
Half Wood
774 729 - 24 5 16 - - -
Galvanized
Iron/Aluminum 14 14 - - - - - - -
Bamboo/Sawali/Cog
on/Nipa 2399 1709 - 10 4 659 - - 17
Asbestos 3 3 - - - - - - -
Glass - - - - - - - - -
Makeshift/Salvage
d/Improvised
Materials
11 9 - - - 2 - - 1
Others 18 15 - - - 2 - - 1
No Walls - - - - - - - - -
Not Reported 3 3 - - - - - - -
Source: 2010 census of Population and Housing, NSO
The housing backlog in 2007 of 124 housing units was substantially
reduced to 19 housing units in 2010 with 109 vacant units in the
municipality in 2010.
Table 43. Housing Backlog, 2007 and 2010
2007 2010
Backlog No. %
inc/dec
No. % inc/dec
Doubled-up Households 11 inc -115 Dec
Unacceptable Housing Units 110 inc 123 Inc
Makeshift/Salvage/Improvised
Housing Units
3 inc 11 Inc
Total Backlog 124 19 Source: NSO CPH 2007 and 2010

MUNICIPAL PROFILE 2017 MUNICIPALITY OF MINA
37
Table 44. INVENTORY OF RESIDENTIAL SUBDIVISIONS
OWNER Classifica
tion Barangay Area (Has)
No. of
Lots
Abillera, Gil Simple Mina West 0.6551 5
Abillera, Gil Simple Mina West 0.1138 2
Alova, Nora G. Simple Cabalabaguan 1.3029 6
Angelo, Epifania P. Simple Mina East 0.2344 5
Armada, Josefina P. Simple Mina West 0.0422 2
Baleria, Elizabeth Simple Cabalabaguan 0.5296 2
Baleria, Elizabeth Simple Cabalabaguan 0.2166 2
Baleria, Elizabeth Simple Cabalabaguan 2.4465 3
Cerrada, Santiago Complex Bangac 65.63100 33
Corneja, Sixto Simple Tolarucan 0.5778 4
Defensor, Vicente Simple Tumay 1.2435 9
Fernandez, Rhoda Simple Capul-an 1.8836 2
Fontanilla, Lucilo S. Simple Cabalabaguan 1.0000 9
Garboso, Crispolo Simple Tolarucan 0.7510 8
Gonzales, Ruperto Simple Cabalabaguan 0.3328 4
Gonzales, Ruperto Simple Cabalabaguan 0.3528 5
Grabato, Ernesto Simple Mina West 0.6131 7
Grabato, Rey P. Simple Cabalabaguan 1.8610 7
Grabato, Rey P. Complex Cabalabaguan 2.4196 102
Ko, Virginia Simple Mina East 0.0337 3
Labrador, Avelino Simple Tolarucan 2.3750 13
Loreno, Glenda G. Simple Tumay 2.1106 2
Magos, Higinio Simple Mina West 0.1450 3
Magos-Bangud, Rosine Simple Mina West 0.1450 4
Mana-ay, Aquilino Simple Cabalabaguan .03899 3
Mana-ay, Dolores Simple Badiangan 1.2745 11
Maravilla, Aurelia Complex Mina East 1,1441 15
Maravilla, Aurelia Complex Mina East 1.1441 14
Maravilla, Luzviminda Complex Mina West 1.6344 32
Padilla, Ivan Simple Mina East 0.3078 10
Pagay, Lydia Simple Badiangan 0.2482 3
Palacios, Norman Simple Mina West 0.0862 2
Palacios-Pesca, Lolita Simple Cabalabaguan 0.8961 8
Patingo, Felixberto Simple Mina West 0.6856 5
Patingo, Felixberto Simple Mina West 0.3400 6
Patpat, Pedro Simple Cabalabaguan 0.6569 3
Pecina, Clarita Simple Tolarucan 0.1504 3
Pelaez, Marieta Simple Mina West 1.0560 3
Pelaez, Pedro Simple Mina West 0.2192 6

MUNICIPAL PROFILE 2017 MUNICIPALITY OF MINA
38
Poral, Percival Simple Tumay 0.9840 9
Priscion, Nelia Simple Tumay 0.1596 2
Pueyo, Bonifacio Simple Bangac 6.8168 3
Sola, Encarnita Simple Cabalabaguan 2.8184 3
Solidarios, Rodrigo Simple Cabalabaguan 3.0868 6
Sudario, Placido Jr. Simple Mina West 0.4114 9
Sudario, Placido Jr. Simple Mina West 0.0646 2
Sudario, Placido Jr. Simple Mina West 2.7534 2
Sutacio, Precila S. Simple Badiangan 0.6257 6
Vasquez, Helen Simple Tumay 0.0600 3
As for housing utilities/facilities and services provided by the
municipality, municipal garbage collection has the lowest number of
household served (6%). Majority of the households prefer burning their
garbage (66%) or dumping it in a pit in their backyards (16%). Only six
percent practice garbage composting.
Municipal drinking water supply service is also low at 28 percent.
Majority of the households get their drinking water supply through a
tube/piped deep well (53%) either shared or household-owned while six
percent buy bottled drinking water.
Eighty-five percent of the households in the municipality use water-
sealed toilets (shared or individual household-owned), giving a positive
effect on the hygiene and health of the communities. There are some that
still use closed or open pit latrines (12%) and a few (0.29%) with no
toilets and these needs to be addressed by the municipality for the
communities’ overall well-being.
Service provision of electricity for lighting is high at 87 percent,
the rest of the households use kerosene (13%) for lighting. The latter
pose a fire hazard since majority of the structures in the municipality
are made of light materials.
Table 45. Housing Facilities and Utilities Situation, Municipality of
Mina, Iloilo, 2010
Facilities/Utilities/S
ervices
No. of Households
Served % Unserved %
1. Drinking Water
Supply
1,275 28 3,282 72
2. Electricity-
Lighting
3,986 87 571 13
3. Water-Sealed
Toilets
3,878 85 679 15
4. Garbage Collection
System
269 6 4288 94
Source: NSO CPH 2010
Informal settlements in the municipality are mainly found along
easements of waterways considered danger zones (flood- and landslide-
prone areas) and needs to be relocated to safer locations. Resettlement

MUNICIPAL PROFILE 2017 MUNICIPALITY OF MINA
39
sites for both the disaster-affected and informal settler families are
being eyed at the following Barangays: Janipa-an West, Cabalabaguan,
Talibong Grande and Tipolo.
Table 46. Inventory of Informal Settlers, Municipality of Mina, Iloilo
Barangay Danger Areas along
Rivers and Creeks
Private
Land
GovernmentLand
No. % No. % No. % Total
1. Abat 15 6.52 - - - - 15
2. Bangac 45 19.56 - - - - 58
3. Cabalabaguan
40 17.40 60 24.20 - - 120
4. Guibuangan
10 4.35 - - - - 10
5. Mina East 22 9.56 70 28.23 10 33.33 102
6. Mina West 28 12.17 68 27.42 20 66.67 116
7. Nasirum 10 4.35 - - - - 10
8. Tolarucan 27 11.74 - - - - 44
9. Tumay 33 14.35 - - - - 33
10. Amiroy 50 20.16 - - 50
Total 230 248 30 508
Source: Mina Municipality Local Shelter Plan 2013-2020
A temporary relocation site in Barangay Cabalabaguan was developed
for 26 families from Barangay Mina West a few years ago. Initial land
tenure agreement was only for temporary stay and the families will be
transferred to a permanent resettlement site within the municipality. At
present, negotiations are ongoing for the purchase of the site. The
landowner signified willingness to sell the land to the
relocatees/occupants.
The current and future housing needs of the municipality is
justified in the table below wherein in 2020 there is 863 housing needs
which consists of 763 for upgrading and the 100 is for the formulation of
new households due to population growth. There is no need of the housing
backlog.
Table 47. Current and Projected Housing Need
Present
Needs
Future Housing Needs
Housing Needs 201
3
201
4
201
5
201
6
201
7
2018 2019 2020
A. Backlog 393 343 294 245 196 147 98 49 0
B. Household Formation
due to Increase in
Population
755 89 90 92 93 95 97 99 100
C. Upgrading 763 763 763 763 763 763 763 763
TOTAL 1148 119
5
114
7
110
0
105
2
100
5
958 911 863
Source: Computations based on LSP 2013-2020 and NSO CPH 2010 data

MUNICIPAL PROFILE 2017 MUNICIPALITY OF MINA
40
- SOCIAL WELFARE SERVICES
Figure 7. Social Services Transaction Flow, Mina, Iloilo
Source: Municipality of Mina PowerPoint Presentation, June 2014
Mina has 22 day care centers, one in each barangay, generally in
good physical condition, with a few calendared for improvement and
upgrading. Day care service and supplemental feeding is supervised by a
day care worker and supported by the Parents Committee. In 2015, 4305 3-4
year old children attended the day care centers. The day care centers are
manned by 22 day care workers as represented in Table 48.
The Municipality has the Senior Citizen in the Poblacion which is
in good physical condition. The center is manned by staff from the
MSWDO.
About 2,157 clients aged 60 years old and above benefitted from the
programs and services of the Senior Citizen Center. There is an existing
crisis center for the children in conflict with the law and women who
were victims of abuses. By 2015, the Balay Paglaum is able to cater a
total of 95 cases of children in conflict with the law and 40 cases of
women who were victims of domestic violence as shown in the mentioned
table. .
The MSWDO offers the following services:
1. Family Life Education and Counseling
2. Family Planning Assistance
3. Day Care Services, Supplemental Feeding
4. Medical Care
5. Relief/Rehabilitation

MUNICIPAL PROFILE 2017 MUNICIPALITY OF MINA
41
Table 48. Presence of Social Welfare Facilities and Services Offered,
Year 2015 Facility Brgy. Area of
Coverage
Services Offered Type of
Clientele
No. of
Client
ele
Owner
ship
Staff Physic
al
Condit
ion
Senior
Citizen
Center
Poblaci
on West
156.87
sq.m
Medical, burial,
Health assistance,
Socialization/liveli
hood/ Capability
building enhancement
60 years
old up
2,157 PUBLI
C
3 Good
Daycare
Center
22
Brgys.
63 sq.m
(each
daycare
center)
Spiritual, Arts &
crafts, Human
relations, Physical
development,feeding,
Conitive, referrals
3 &4
yearsold
4,305 PUBLI
C
22
DCWs
Good
Feeding
Center
22
Brgys.
63 sq.m
(each
daycare
center)
Supplementary
Feeding/ Supervised
Neighborhood Play
2 yrs. old 2,524 PUBLI
C
22DCW
s
Good
Balay
Paglaum
(Crisis
Center
for
Women
and
Children
)
22
Brgys.
of LGU
& other
referri
ng LGU
319.68
sq.m
Social service Home
Life
Medical/Psychologica
l Capability Bldg.
Educational Rescue
Operation Moral and
spiritual Referrals
CICL,
Domestic
Violence
against
women
&children,
Child at
Risk,
Neglected
&
Abandoned
-95
-40
PUBLI
C
7 Good
Source: MSWDO
The MSWD caters the needs of the different clients like disadvantage
families, PWDs, Children, Senior Citizens and a lot more. As shown in the
Table 49, as of 2015 a total of 8,092 clients consists of 567
disadvantage families, 1,460 disadvantage women, 758 children, 3534
youths, 265 PWDs and 2075 Senior Citizens. The same table shows that the
most severed clients were the youths, followed by the senior citizens and
the disadvantaged women ages 18-59 years old.
Table 49. Historical Number of Population Served by Type of Clientele System
Type of Clientele
Previous Years Current Year
(2015)
2012 2013 2014 No. %
Disadvantage Families 614 538 567 567
Disadvantaged women (18-59 years
old)
1077 1163 1460 1460
Children (0-12 Years old) 860 807 758 758
Youth (13-24 years old) 3387 3350 3534 3534
Persons with Disabilities (PWD’s) 226 257 265 265
Senior Citizens (older Persons) 1178 1199 2075 2075
TOTAL 6,728 6,776 8,092 8,092
Source: Mina, MSWDO
The MSWD has a lot of projects which were approved for
implementation. The said projects will cater the needs of the listed

MUNICIPAL PROFILE 2017 MUNICIPALITY OF MINA
42
clienteles of the said office. There is the projects under the KALAHI-
CIDDS wherein the beneficiaries were all the barangays in the
municipality which were given the freedom to which project that they will
implement using the appropriated fund. There is also the 4Ps wherein a
cash transfer is given to the indigent members of the community. Another
project was the ESA and the housing assistance wherein families who were
affected by the typhoon were given cash assistance and housing materials.
The rest of the projects were listed in the Table 50.
Table 50. Social Welfare Related Projects, Approved Funded for
Implementation
Name/ Location Location Type Proponent
(Government,
Private, Other)
KALAHI –CIDSS Projects
Brgy. Abat
Construction of DCC Government
Riprap w/ Railings -do-
Brgy.
Cabalabaguan
Solar Streetlight -do-
Brgy. Tal.
Pequeño
Drainage System -do-
Brgy. Yugot Construction of 1 CL -do-
Brgy. Janipa-an
East
Drainage System -do-
Brgy. Janipa-an
West
Road Concreting -do-
Brgy. Tal. Grande Road Concreting -do-
Brgy. Naumuan Road Re-gravelling -do-
Brgy. Dala Road Concreting -do-
Brgy. Amiroy Drainage System and
Box culvert
-do-
Brgy. Badiangan Road Re-gravelling,
Rip rapping of road
shoulder and
canalization
-do-
Brgy. Capul-an Repair of Brgy. Hall,
solar streetlight &
riprap
-do-
Brgy. Tipolo Repair of School stage
and drainage system
-do-
Brgy. Tolarucan Construction of 1 CL -do-
Brgy. Agmanaphao Riprap with Railings -do-
Brgy. Singay Box Culvert & sidewalk -do-
Brgy. Mina East Sidewalk -do-
Brgy. Mina West Sidewalk & drainage
system
-do-
Brgy. Nasirum Hanging Bridge & stone
masonry
-do-
4P’s (Pantawid
pamilyang Pilipino
Program)
22 Barangays
Conditional Cash
Transfer
-do-
ESA (Emergency Shelter
Assistance)
22 Barangays Cash Housing
Assistance
-do-
Housing Assistance 22 Barangays Housing Materials -do-
CBLA (Cash Building
Livelihood Assets)
22 Barangays Cash for work -do-
Upgrading/
Rehabilitation of Day
Care Centers
13 Brgys. (Capul-
an, Tumay,
Nasirum,
Badiangan, Tal.
Renovation, repair &
-do-

MUNICIPAL PROFILE 2017 MUNICIPALITY OF MINA
43
Grande, Tal.
Pequeño, Yugot,
Badiangan, Mina
East, Singay,
Agmanaphao,
Guibuangan,
Cabalabaguan)
repainting
Support Elderly,
PWD’s, Children, CICL
& Domestic Violence
22 Barangays
Financial Assistance
and Protective Custody
-do-
Capability Building &
skills training of
DCW’s & other sectoral
groups
22 Barangays
Enhancement of
knowledge and skills
-do-
Supplemental Feeding/
Day Care Service
22 Barangays
Provision of food
supplementation/
Education
-do-
SLP (Sustainable
Livelihood Program)
Onsite training on
Baking for a
sustainable livelihood
Poblacion, Mina
Skills training on
baking
-do-
Enterprise Capital
Assistance for
Community Cooperative
store
Brgy. Tipolo &
Yugot
Cooperative Store
-do-
Source: Mina,MSWDO
- PROTECTIVE SERVICES
The Mina Municipal Police Station which is located at the back of
the Municipal Town Hall is manned by 32 Police Force composed of 1 Police
Commissioned Officer, 28 Non-Police Commissioned Officers and 3 Non-
Uniformed Officers. As of 2015, the POPCOM current population survey is
25,321 with Police to Population Ratio of 1:873. Barangay Tanods of the

MUNICIPAL PROFILE 2017 MUNICIPALITY OF MINA
44
22 barangays are utilized to augment the PNP strength to maintain peace
and order in the locality, which is at present, generally peaceful.
The Municipal Peace and Order Council (MPOC) is established in order
to address the goal of the PNP to maintain the peace and order in the
entire municipality. The cases of drug addiction spread in the entire
Philippines which includes the municipality, in order answer the problem
with drugs in the locality; the establishment of Barangay Anti-Drug Abuse
Council (BADAC) in every barangay was initialized.
There is Community Police Assistance Centers (COMPAC) in Badiangan,
Janipa-an East, Tolarucan, Yugot, and Cabalabaguan manned by barangay
tanods. In the entire municipality, there are a total of 261 security
force / volunteers which includes 191 in peace and order and 70 in
disaster as shown in Table 3.6.1.
There is no jail in Mina, only a lock up cell found in the Municipal
Station in the Poblacion. In order to address good service and responses
to crimes and untoward incidents, the Mina PNP is equipped with 1 one
multi-cab and I patrol jeep. There are 6 computer sets with internet
connection, 2 landlines and 3 Handheld Radios found in the MPS
headquarters as equipment. All of the mentioned facilities and equipments
are serviceable as reflected at Table 52.
Table 51. CURRENT POLICE PERSONNEL
RANK NAME DESIGNATION
1 P/Insp Maria Theresa Lero Chief of Police
2 SPO4 Felice S. Dioso Deputy COP/MESPO
3 SPO2 Jonathan O. Miranda Chief Investigator
4 PO3 Felipe Ermita COMPAC In-Charge
5 PO3 John C. Brillo Patrol Member
6 PO3 Aaron G. Gaton Investigator/ Intel Operative PNCO
7 PO3 Ramy A. Palorma Admin/ HRDD PNCO
8 PO3 Rommel J. Tabujara Operation PNCO
9 PO2 Rodolfo R. Barranco
Jr.
Blotter Clerk PNCO/ Patrol Member/
Driver 10 PO2 Rowel A. Bartolome Patrol Member/ PCR PNCO
11 PO2
Carnel
Carnel Q. Bolivar Investigator/ Driver
12 PO2 Fred Richard R.
Daquita
Desk Officer/ Jail Guard/ patrol
Member PNCO 13 PO2 Andy B. Datiles Intel Operative PNCO/ Patrol
Member 14 PO2 Ricky L. Leal CPO/ Asst. Intel PNCO
15 PO2 Franklin John C.
Luzarita
Intel Operative
16 PO2
O2
Christine Ann B.
Padios
WCPD PNCO
17 PO2 Jhudan B. Pastrana Investigator/ Patrol Member
18 PO2 Ronnie R. Pradas
Jr.
Investigator/ Crime Registrar
19 PO2 Elmer M. Sudario Patrol Member/ E-Rouges/ Asst. CPO
20 PO2 Bonnie C. Valle Patrol Member/ Radio Operator
21 PO1 Ferdinand P. Armada Patrol Member/ Intel Operative
PNCO 22 PO1 Dennis C. Brillo Desk Officer/ Jail Guard/ Acting
Supply PNCO 23 PO1 Sharon Rose C.
Demasis
Patrol Member/ Asst Admin/ HRDD/
WCPD PNCO 24 PO1 Recie S. Marquez Patrol Member/ Asst. PCR PNCO
25 PO1 Bernard C. Masisado Patrol Member/ Asst. Opn/ Driver
26 PO1 Tituis P. Ortega Patrol Member/ Radio Operator
27 PO1 Glenn D. Pimentel Finance PNCO/ Patrol Member/
Official Driver

MUNICIPAL PROFILE 2017 MUNICIPALITY OF MINA
45
28 PO1 Ben G. Resol Patrol Member
29
PO1 Anthony C. Yap Patrol Member/ Operation PNCO
30 NUP Dioby Joy B.
Perania
Crime Registrar
31 NUP Rolyn B. Tolentino Chief Crime Registrar
32 NUP Lemuel H. Toreno Crime Registrar
Source: PNP, Mina
Table 52. Mina Municipal Police Station Facilities and Equipment, Mina,
Iloilo, 2015
Type of Services Location Area
(sq.m)
No. of
Personnel
Personne
l to
Pop’n.
Ratio
Facilities/ Equipment Condition
Vehicle Others
Police
Headquarters Parcon St.
Mina,
Iloilo
400 29 (1
PCO, 28
NPCO)
3 NUPs
1:873 1
Multicab
1 patrol
jeep
6 computers
2
landlines
2 base
radio
Serviceable
Sub Station
Outpost/
Community Police
Assistance Center
Badiangan,
Janipa-an
East,
Tolarucan
,Yugot and
Cabalabagua
n
- -4 with
tanod
members
-2 PNP
personn
el
- - - -
Traffic - - - - - - -
Jail Management
District Jail - - - - - - -
Mun. Jail - - - - - - -
Lock-up Cell Mina MPS - - - - - -
Source: Mina PNP, BJMP
Table 53. Barangay Tanod by Type of Service, Mina, Iloilo, 2015
Type of
Service
No. of
Volunteers/
Staff
Facilities/Equipment Condition of
Facilities/
Equipment
Traffic - - -
Peace and
Order
191 - -
Disaster 70 - -
Auxiliary
Services
- - -
Source: Mina PNP
The crimes or even simple violation of the existing laws is
inhibitable in every locality. Based on the table (Table Soc-3)
representing the crime incident in past five years, the municipality is
peaceful in general. In the past five years the records shows that year
2015 has the most number of crimes that happened- 28 index crimes and 50
non-index crimes. Out the 28 index crimes, 24 of which is against the

MUNICIPAL PROFILE 2017 MUNICIPALITY OF MINA
46
person and 4 is against the property. Above all the crime cases are 95 %
of them were solved. Among all the index crimes, the cases of physical
injury are the most dominant and it was followed by the cases of theft.
There is no heinous crime like murder that had happened in the
municipality in the past five years. The table indicates that crime cases
increases annually yet it was solved. Most of the offenders of the crimes
were men.
The crime cases in the municipality were not only committed by the
adult or mature individuals, there are also crimes committed by the young
individuals which made them classified as Child in Conflict with the law.
The table below shows the crimes did by the young individuals. The record
shows that 2013 has the most number of crime incidents happened- 12 index
crimes and 4 non-index crimes. Physical Injury cases have the dominance
among all the index crimes and followed by theft. Most of the crime
incidents are having men as offenders. All of the stated cases were
solved.
The current and projected police and jail personnel is reflected in
table 54 which is computed using the 1.87 annual growth rate and the BSPO
survey population of the municipality as of 2015 as the base year. The
table shows that by 2025 the municipality will need 39 personnel as
manpower in order maintain the peace and order in the entire
municipality.
Table 54. Current and Projected Requirement for Police and Jail Personnel
TYPE
Existin
g No.
(2015)
Projected Population and Required No. of Personnel
2016
2017
2018
2019
2020
2021
2022
2023
2024
2025
Populatio
n
25,321 25,79
5
26,27
7
26,76
8
27,26
9
27,77
9
28,29
8
28,82
7
29,36
6
29,91
5
30,47
4
Police
Force
29 30 31 32 33 34 35 36 37 38 39
Jail
Personnel
- - - - - - - - - - -
Source: MPDO
Table 55. Crime Incidence for Adult for the Past Five Years Type of
Crime
2011 2012 2013 2014 2015
Tot
al
Case
s
Solv
ed
Offende
r
Tot
al
Case
s
Solv
ed
Offende
r
Tot
al
Case
s
Solv
ed
Offende
r
Tot
al
Case
s
Solv
ed
Offender Tot
al
Case
s
Solv
ed
Offender
M F M F M F M F M F
Index Crime 1 1 - 1 1 1 1 - 6 0 3 1 10 10 10 - 28 28 30 3
Crimes
Against
Person
- - - - 1 1 1 - 4 0 2 1 10 10 10 - 24 24 27 3
a.Murder - - - - - - - - - - - - - - - - - - - -
b.Homicide - - - - 1 1 1 - - - - - - - - - - - - -
c.Physical
Injury
- - - - - - - - 4 0 2 1 10 10 10 - 24 24 27 3
d.Rape - - - - - - - - - - - - - - - - - - - -
Crimes
Against
Property
1 1 - 1 - - - - 2 0 1 - - - - - 4 4 3 -
a.Robbery - - - - - - - - - - - - - - - - - - - -
b.Theft 1 1 - 1 - - - - 2 0 1 - - - - - 4 4 3 -
Non-Index
Crime
6 6 1
3
- 2 2 2 1 11 5 1
2
- 29 29 24 4 50 50 64 1
Source: Mina PNP

MUNICIPAL PROFILE 2017 MUNICIPALITY OF MINA
47
Table 56. Crime Incidence for Children (below 18 years old) in conflict with the Law for the Past
Five Years Type of
Crime
2011 2012 2013 2014 2015
Total Cases
Solved
Offender Total Cases
Solved
Offender Total Cases
Solved
Offender Total Cases
Solved
Offender Total Cases
Solved
Offender
M F M F M F M F M F
Index
Crime
5 5 5 - 2 2 5 - 12 12 12 - 3 3 6 - 5 5 5 1
Crimes
Against
Person
4 4 4 - - - - - 10 10 10 - 1 1 4 - 2 2 2 -
a.Murder - - - - - - - - - - - - - - - - - - - -
b.Homicide - - - - - - - - - - - - 1 1 4 - - - - -
c.Physical
Injury
4 4 4 - - - - - 9 9 9 - - - - - 2 2 2 -
d.Rape - - - - - - - - 1 1 1 - - - - - - - - -
Crimes
Against
Property
1 1 1 - 2 2 5 - 2 2 2 - 2 2 2 - 3 3 3 1
a.Robbery 1 1 1 - - - - - - - - - 1 1 1 - 2 2 2 -
b.Theft - - - - 2 2 5 - 2 2 2 - 1 1 1 - 1 1 1 1
Non-Index
Crime
2 2 2 - 3 3 5 2 4 4 4 - 3 3 3 - 1 1 2 1
Source: Mina PNP

MUNICIPAL PROFILE 2017 MUNICIPALITY OF MINA
48
-FIRE PROTECTION
Fire Station at the back of Mina Public Market, Barangay Cabalabaguan
Mina has one fire station which is located in Cabalabaguan at the
back of the Mina Public Market manned by nine (9) firemen. The fireman-
population ratio is 1:2,813, which fall below the BFP standard ratio of
1:2,000 (see table 57). It was computed using the annual growth rate of
1.87 and BSPO survey population of 5,321.
The fire station has two fire trucks and three sets of firefighting
gear. The Municipal Fire Station conducts information disseminations
through fire drills and in school information dissemination in regards to
fire safety.
Table 57. Mina Municipal Fire Station by Facilities and Equipment, Mina,
Iloilo, 2016
Type of
Services
Location Area
(sq.m)
No. of
Personnel
Personnel
to Pop’n.
Ratio
Facilities/
Equipment Condition
Vehicle Others
Fire Protection
Headquarters Cabalabag
uan
500 9 organic
firemen
1:2813 2 Fire
Trucks
3 Sets
- Fire
Coats
3 Pairs
-Safety
Shoes
3 Pcs.
- Head
Gear
Good
Sub Station - - - - - - -
Source: BFP

MUNICIPAL PROFILE 2017 MUNICIPALITY OF MINA
49
Table 58. FIRE STATION PERSONNEL 2015
RANK NAME DESIGNATION
1 SF01 JOHN P. BRILLO OIC, MUN. FIRE MARSHALL
2 FO2 RICSON G. FLORES C, IIS, FSI, FTO, AI, PIS
3 FO1 JOSEPH N. TRONCOSO C, OPN, C, FSES, FTO, AI
4 FO1 RHODORA G. AGUIRRE C, ADMIN, BMWS, FINANCE
NCO,PROPERTY CUSTUDIAN
PROPPPRO
5 FO1 RAY P. JABAO CA, FSI, AI
6 FO1 NORBERTO F. JAVA JR. FSI, LM/NM
7 FO1 PETER JOHN T. GAVINO ASST. FTO, EMS, CRO
8 FO1 MICHAEL M. DEFACTO FSI/ LM/ NM
9 FO1 KENNETH S. SALCEDO LM/ NM
Source: Fire, Mina
LEGEND:
C,FSES- Chief, Fire Safety Enforcement Section
FTO - Fire Truck Operator
FSI - Fire Safety Inspector
LM - Lineman
AI - Arson Investigator
NM - Nozzleman
BMWS - Benefit, Morale, Welfare Section
CA - Collecting Agent
Fire incidence in the municipality for the last 5 years is generally
minimal as we can see below (table 59). Effective and immediate response
of our fire department prevented the spread-out of fire and saved lives.
Table 59. FIRE INCIDENTS FOR THE LAST FIVE YEARS
2011-2015
Barangay Origin/Cause Frequency of Occurrence
2011 2012 2013 2014 2015
Mina East Accidental
1
Mina West Accidental
1 1
Abat Agmanaphao Accidental
1 1
Agmanaphao
Amiroy Accidental
2 1
Badiangan
Bangac Accidental 1
Cabalabaguan Accidental
1 1 1
Capul-an Accidental
1
Dala
Guibuangan
Janipa-an East Accidental
1
Janipa- an West Accidental
1
Nasirum
Naumuan
Singay
Talibong Grande

MUNICIPAL PROFILE 2017 MUNICIPALITY OF MINA
50
Talibong Pequeno Accidental
1
Tipolo Accidental
1
Tolarucan Accidental
1 4
Tumay Accidental 1 1
Yugot Accidental
1 3
TOTAL 2 1 5 8 12 Source: Fire, Mina
The current and projected fire personnel is reflected in table 60
which is computed using the 1.87 annual growth rate and the BSPO survey
population of the municipality as of 2015 as the base year. The table
shows that by 2025 the municipality will need 12 personnel as manpower in
order respond to the fire incidents in the entire municipality.
Table 60. Current and Projected Requirement for Fire Personnel TYPE Existin
g No.
(2015)
Projected Population and Required No. of Personnel
2016
2017
2018
2019
2020
2021
2022
2023
2024
2025
Populatio
n
25,321 25,79
5
26,27
7
26,76
8
27,26
9
27,77
9
28,29
8
28,82
7
29,36
6
29,91
5
30,47
4
Fire
Force
9 9 9 10 10 10 11 11 11 12 12
Source: MPDO
- SPORTS AND RECREATION Every barangay have basketball court for youths to have sports and
recreation but sometimes these areas also serve as solar drier for palay
and other crops.
Table 61. EXISTING AND POTENTIAL RECREATIONAL AREAS
LOCATION TYPE OF AREA AREA
EXISTING POTENTIAL (sq.m)
1. Abat Basketball Court / Drier 450
2. Agmanaphao Basketball Court / Drier 450
3. Amiroy Basketball Court / Drier 450
4. Badiangan Basketball Court / Drier 450
5. Bangac Basketball Court / Drier Basketball
Court 900
6. Cabalabaguan Basketball Court / Drier 450
7. Capul-an Basketball Court / Drier 450
8. Dala Basketball Court / Drier 450
9. Guibuangan Basketball Court / Drier 450
10. Janipa-an East Basketball Court / Drier 450
11. Janipa-an West Basketball Court / Drier 450
12. Mina East Basketball Court / Drier 450
13. Mina West Basketball Court / Drier Sports
Center 3,000
14. Nasirum Basketball Court / Drier 450
15. Naumuan Basketball Court / Drier 450

MUNICIPAL PROFILE 2017 MUNICIPALITY OF MINA
51
16. Singay Basketball Court / Drier 450
17. Talibong Grande Basketball Court / Drier 450
18. Talibong Pequeño Basketball Court / Drier 450
19. Tipolo Basketball Court / Drier 450
20. Tolarucan Basketball Court / Drier 450
21. Tumay Basketball Court / Drier 450
22. Yugot Basketball Court / Drier 450
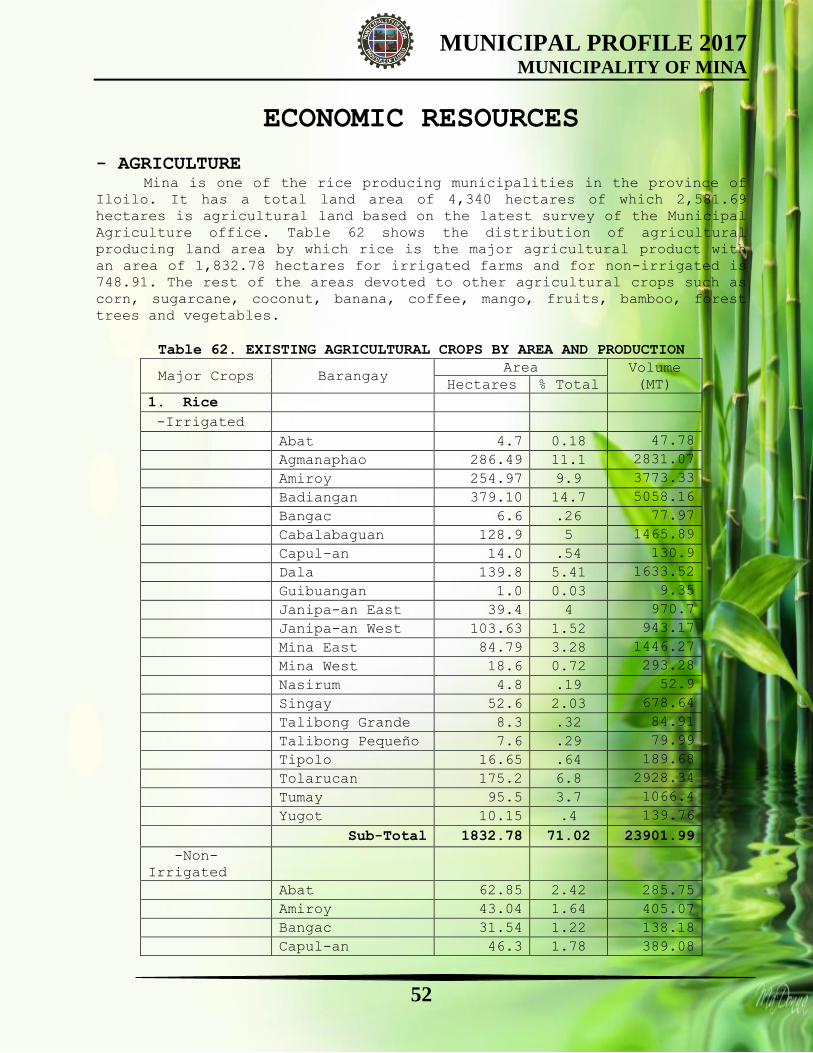
MUNICIPAL PROFILE 2017 MUNICIPALITY OF MINA
52
ECONOMIC RESOURCES
- AGRICULTURE Mina is one of the rice producing municipalities in the province of
Iloilo. It has a total land area of 4,340 hectares of which 2,581.69
hectares is agricultural land based on the latest survey of the Municipal
Agriculture office. Table 62 shows the distribution of agricultural
producing land area by which rice is the major agricultural product with
an area of 1,832.78 hectares for irrigated farms and for non-irrigated is
748.91. The rest of the areas devoted to other agricultural crops such as
corn, sugarcane, coconut, banana, coffee, mango, fruits, bamboo, forest
trees and vegetables.
Table 62. EXISTING AGRICULTURAL CROPS BY AREA AND PRODUCTION
Major Crops Barangay Area Volume
(MT) Hectares % Total
1. Rice
-Irrigated
Abat 4.7 0.18 47.78
Agmanaphao 286.49 11.1 2831.07
Amiroy 254.97 9.9 3773.33
Badiangan 379.10 14.7 5058.16
Bangac 6.6 .26 77.97
Cabalabaguan 128.9 5 1465.89
Capul-an 14.0 .54 130.9
Dala 139.8 5.41 1633.52
Guibuangan 1.0 0.03 9.35
Janipa-an East 39.4 4 970.7
Janipa-an West 103.63 1.52 943.17
Mina East 84.79 3.28 1446.27
Mina West 18.6 0.72 293.28
Nasirum 4.8 .19 52.9
Singay 52.6 2.03 678.64
Talibong Grande 8.3 .32 84.91
Talibong Pequeño 7.6 .29 79.99
Tipolo 16.65 .64 189.68
Tolarucan 175.2 6.8 2928.34
Tumay 95.5 3.7 1066.4
Yugot 10.15 .4 139.76
Sub-Total 1832.78 71.02 23901.99
-Non-
Irrigated
Abat 62.85 2.42 285.75
Amiroy 43.04 1.64 405.07
Bangac 31.54 1.22 138.18
Capul-an 46.3 1.78 389.08

MUNICIPAL PROFILE 2017 MUNICIPALITY OF MINA
53
Guibuangan 14.3 .55 88.50
Janipa-an East 135 5.21 1188.29
Janipa-an West 115.7 4.5 1004.98
Nasirum 28 1.1 224.11
Naumuan 54.1 2.1 400.96
Talibong Grande 52.8 2.04 377.15
Talibong Pequeno 52.6 2.03 372.74
Tipolo 25.48 .99 161.21
Yugot 87.20 3.4 447.32
Sub-Total 748.91 28.98 5483.34
3. Others Areas with slope
8-15%
TOTAL 2581.69 100 29385.33
Source: Municipal Agriculture Office
Table 63. COMPARATIVE AGRICULTURAL CROP, AREA AND PRODUCTION
Major
Crops
Area (Hectares) Volume of Production (MT)
2014 2015
Increa
se/
Decrea
se
2014 2015
Increa
se/Dec
rease
Rice 5711.90 6241.76 9.28 27020.54 29385.33 8.75
Corn 48.9 49.7 1.64 91.1 114.3 25.47
Banana 109 109 - 43.6 45.93 4.66
Coconut 44.5 45.95 3.26 1246 1470.4 18.01
Mongo 109 13.25 -95.75 43.6 0.93 -42.67
Watermelon 44.5 45.95 1.45 1246 1470.4 224.4
Source: Municipal Agriculture Office
- LIVESTOCK AND POULTRY Table 64 shows the existing livestock & poultry farm present in the
municipality. Roch-Acla farm in barangay Nasirum at present is the only
one able to put up a large scale livestock farm. All poultry farm in the
municipality are contract growers.
Table 64. EXISTING LIVESTOCK AND POULTRY FARMS
NAME OF OWNER BARANGAY TYPE POPULATION
1 MELANIE ACLA ROCHS Nasirum Hog (Sow) 100
2 ALFONSO CATILO Cabalabaguan Hog (Sow) 22
3 DIEGO PASUQUIN Cabalabaguan Poultry
(Broiler) 30,000
4 KAREN JUNE
VENTILACION Cabalabaguan
Poultry
(Broiler) 7,000
5 KAREN JUNE Amiroy Poultry 31,300
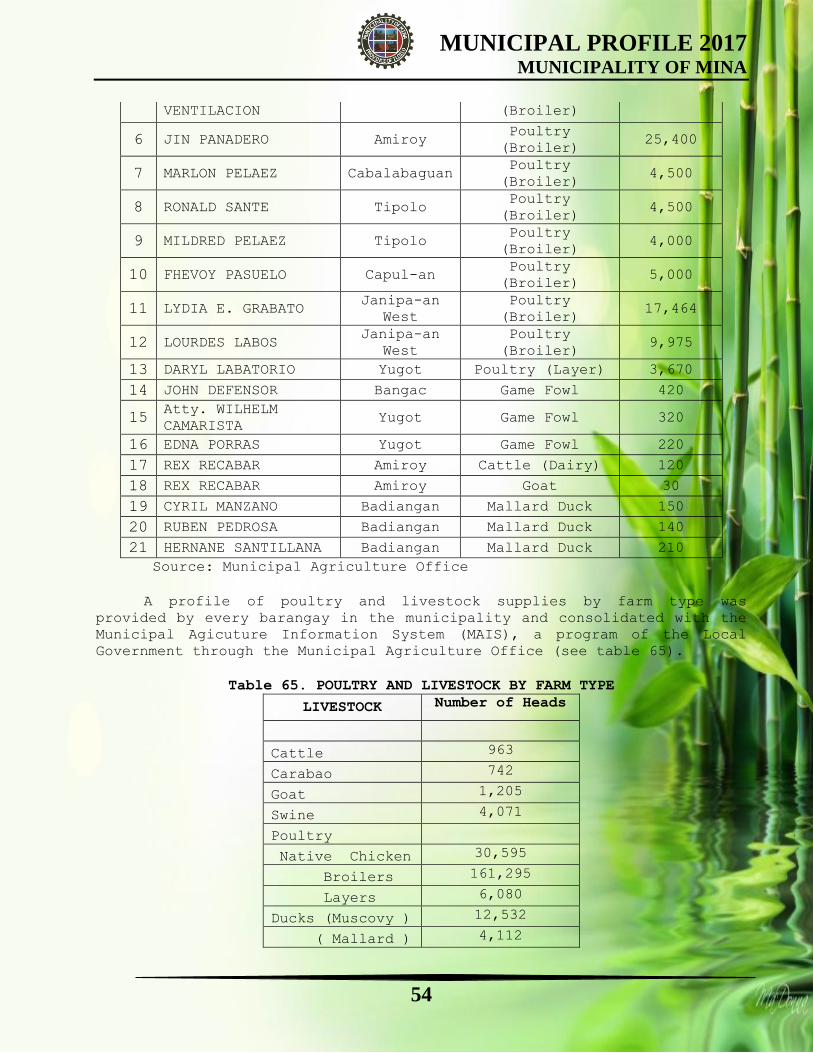
MUNICIPAL PROFILE 2017 MUNICIPALITY OF MINA
54
VENTILACION (Broiler)
6 JIN PANADERO Amiroy Poultry
(Broiler) 25,400
7 MARLON PELAEZ Cabalabaguan Poultry
(Broiler) 4,500
8 RONALD SANTE Tipolo Poultry
(Broiler) 4,500
9 MILDRED PELAEZ Tipolo Poultry
(Broiler) 4,000
10 FHEVOY PASUELO Capul-an Poultry
(Broiler) 5,000
11 LYDIA E. GRABATO Janipa-an
West
Poultry
(Broiler) 17,464
12 LOURDES LABOS Janipa-an
West
Poultry
(Broiler) 9,975
13 DARYL LABATORIO Yugot Poultry (Layer) 3,670
14 JOHN DEFENSOR Bangac Game Fowl 420
15 Atty. WILHELM
CAMARISTA Yugot Game Fowl 320
16 EDNA PORRAS Yugot Game Fowl 220
17 REX RECABAR Amiroy Cattle (Dairy) 120
18 REX RECABAR Amiroy Goat 30
19 CYRIL MANZANO Badiangan Mallard Duck 150
20 RUBEN PEDROSA Badiangan Mallard Duck 140
21 HERNANE SANTILLANA Badiangan Mallard Duck 210
Source: Municipal Agriculture Office
A profile of poultry and livestock supplies by farm type was
provided by every barangay in the municipality and consolidated with the
Municipal Agicuture Information System (MAIS), a program of the Local
Government through the Municipal Agriculture Office (see table 65).
Table 65. POULTRY AND LIVESTOCK BY FARM TYPE
LIVESTOCK Number of Heads
Cattle 963
Carabao 742
Goat 1,205
Swine 4,071
Poultry
Native Chicken 30,595
Broilers 161,295
Layers 6,080
Ducks (Muscovy ) 12,532
( Mallard ) 4,112

MUNICIPAL PROFILE 2017 MUNICIPALITY OF MINA
55
Mina has no forest reserve since it has an equally flat terrain
having a slope of 0.8%. Some hilly portion of the town is planted with
sugarcane, corn and forest trees such as mahogany & gemelina. There are 10
ten hectares of land planted by fruit trees located in Barangay Amiroy,
Talibong Pequeño and Capul-an as shown in Table 66.
Table 66. AREA AND LOCATION OF FORESTLANDS BY SUB-CATEGORY AND PRIMARY USE
Category Location Area
(has.) %
A. PRODUCTION FORESTS
1. Timber Production
(natural)
2. Timber Production
(plantation)
Amiroy, Talibong Pequeno,
Capul-an 10
3. Agro-forests
4. Pasture/ Grazing
Land
5.Mineral Areas
6.Watereshed Areas
7.Community-Based
Forest
Management Area
8. Other Special Uses
(tourism,
fish farms/ponds,
etc.)
Janipa-East, Yugot,
Amiroy, Bangac, Nasirum,
Agmanaphao, Badiangan,
Tal. Pequeno, Singay,
Cabalabaguan
1.82
Sub Total 11.82
B. PROTECTION FORESTS
1.NIPAS Areas NA - -
2.Non-NIPAS Areas NA - -
Sub Total - -
TOTAL 11.82
Source: Community Environment and Natural Resources Officer/PENRO
Table 67. Areas under CARP, Mina, Iloilo, 2015
Areas under CARP Location Area (has.) No. of Farmer-
Beneficiaries
1.Covered by CARP
Abat 7.07 5
Agmanaphao 69.15 30
Amiroy 76.27 34
Badiangan 140.66 45
Bangac 20.58 13
Cabalabaguan 36.27 -
Capul-an 6.34 4
Dala 26.13 14
Janipa-an East 35.45 20

MUNICIPAL PROFILE 2017 MUNICIPALITY OF MINA
56
Janipa-an West 47.90 36
Mina East 27.65 15
Singay 7.59 5
Talibong Grande 40.09 14
Talibong Pequeño 11.95 8
Tipolo 21.63 10
Tolarucan 29.08 13
Tumay 26.31 18
Yugot 6.27 6
Sub-Total 636.40
2. CARPable Lands
Abat 4.74 1
Agmanaphao 24.86 7
Amiroy 13.87 9
Badiangan 17.20 19
Bangac 0.29 2
Capul-an 1.39 1
Dala 10.34 5
Janipa-an East 16.13 10
Janipa-an West 7.57 8
Mina East 0.82 1
Mina West 2.22 1
Naumuan 2.22 1
Talibong Grande 31.86 14
Talibong Pequeño 5.00 2
Tipolo 8.76 5
Tolarucan 4.75 2
Yugot 3.47 1
Sub-Total 155.48
All Lands 791.88 379
Source: DARMO Mina
Table 68. CARP Implementation Status in the Municipality of Mina,
2015
Program Type Scope Accomplishment Balance
Area FBs Area FBs Area FBs
Land Tenure Improvement Land
Acquisition & Distribution
Operation Land Transfer
(OLT)
521.2319 347 472.9027 315 48.3292 32
Voluntary Offer to Sell
(VOS)
32.4945 21 25.3352 16 7.1593 5

MUNICIPAL PROFILE 2017 MUNICIPALITY OF MINA
57
Compulsory Acquisition (CA) 125.5044 83 25.1692 17 100.3352 66
Voluntary Land Transfer
(VLT)
118.4655 78 58.6120 39 59.8535 39
Government Foreclosed
Institution (GFI)
0.2056 1 0.2056 1
Total 797.9019 530 582.2247 388 215.6772 142
Non-Land Acquisition &
Distribution (LAD)
Leasehold Operation 91.0392 55
Total 797.9019 530 673.2629 443 215.6772 142
Source: DARMO Mina
The Municipality also
developed a computerized
management information
system called the Mina
Municipal Agricultural
Information System (Mina
MAIS). It is a computer-
based decision-making tool
that contains up-to-date
inventory on all home-grown
agricultural communities
such as rice, high value
crops, poultry and
livestock. It contains
information on the demand of
a specific agricultural
commodity as well as the
production data from the farmers in the Municipality.
The Municipality, through its leadership, has indicated strong
linkages with officials from both the national and the local government
levels. For instance, its meager financial resources have been augmented
through the help of national government elected officials. The
Municipality was able to secure financial assistance from then
Representative Arthur D. Defensor Sr. (now the Governor of Iloilo) to
renovate the vacated site of the Mina National High School to serve as a
training venue for welding courses. This training venue has been provided
with appropriate equipment manned by accredited trainers from TESDA-Region
VI.
The local government likewise has strong relations with its
counterpart local government units in the Province of Iloilo. It serves as
a field/site visit destination for best practices especially in terms of
the use of management information systems in local governance. The
Municipality is also among the pioneers of the Integrated Central Iloilo
Alliance for Economic Development (ICIA-ED) composed of the municipalities
of Cabatuan, Maasin, Mina, Pototan, Badiangan, Bingawan, Lambunao,

MUNICIPAL PROFILE 2017 MUNICIPALITY OF MINA
58
Janiuay, and Calino. The ICIA-ED aims to poster collaboration between and
among the nine LGUs in the 3rd district of the Province of Iloilo towards
economic development. The Municipality’s former Mayor, Lydia E. Grabato,
was the prime mover of this collaboration in 2011 and became the founding
Vice President of the ICIA-ED. The collaboration envisions the 3rd
District of Iloilo as the trade and economic investment hub of the
Province.
The Municipal Agriculture Information System (MAIS), which was
developed by the Municipality of Mina, is now being adopted as a computer-
based information system linking all the local government units in the
ICIA-ED and providing agricultural data in terms of needs and demands of
the market as well as real-time production inventory of agricultural
commodity in the 3rd District.
- COMMERCE & TRADE
Table 69. INVENTORY OF COMMERCIAL AREAS
Type of
Commercial Areas Location
Area (in
sq. m)
Market Catered
Loca
l
Outside
(Export)
Public Market Cabalabaguan 10,000 / -
Commercial Strips Cabalabaguan 2,000 / -
Commercial Strips Mina West 2,000 / -
Source: Treasurer’s Office/Market Administrator/ Primary Survey
The municipality issued permits for different kinds of business
and most common is Sari-sari store wherein you can start one even with
only a small amount for capitalization. Table 70 shows the different types
of businesses issued with permits for the last five years.
Table 70. List of Business Permits Issued by Type
2011-2015
Type of Business Permits Issued 2011 2012 2013 2014 2015
Agricultural Products & Agro-Chemicals 6 4 3 4 4
Bakery 3 7 5 6 7
Beauty Parlor/ Barber Shop 6 4 4 3 4
Cemetery - - 1 1 1
Charitable Institution - - - - -
Cipher 3 - - - -
Cockpit - 1 1 1 1
Computer Center & Computer Games 9 10 7 9 11
Contractor 3 1 1 - -
Cooperative 3 2 2 2 3
Dance Studio 1 1 - - -
Dry Goods/ RTWs 9 8 7 7 3
Elec. Repair Shop & Cellphone
Accessories & Repair Shop/ Welding
Shop
5 10 2 4 4

MUNICIPAL PROFILE 2017 MUNICIPALITY OF MINA
59
Enterprises 3 3 2 4 4
Feeds/ Poultry Supplies & Contract
Grower
1 16 7 21 21
Fish Ball/ Ice Cream/ Popcorn/ Halo-
halo Stand
6 1 - 1 1
Food Handler 5 3 - - -
Frozen Goods/ Butcher 1 1 2 2 2
Fruits & Vegetables 7 9 7 7 7
Funeral Parlor 1 1 1 1 1
Furniture Shop & Display Center - 6 4 3 3
Gasoline Station & LPG outlet 5 5 5 4 5
Hollow Blocks Factory 2 2 3 2 3
Ice Retailing & Water Refilling
Station
4 4 5 6 5
Lechon Manok & Barbeque Stand 3 3 4 3 3
Lotto Outlet - 1 1 1 1
Lumber/ Hardware/ Construction &
Electrical Supplies
4 7 5 4 4
Meat/ Pork Stand & Fish peddling/
Retailing
10 4 4 4 5
Merchandised/ Mini Mart 10 13 11 13 12
Miller & Junkshop/ Chainsaw/ Bokbokan 7 4 2 2 3
Motor/ Cycle Parts 1 - 4 4 4
Palay Buying 10 17 13 14 13
Pawnshop 2 2 2 2 3
Pharmacy & Dental/ Medical Clinic 7 7 3 2 3
Photoshop - 2 1 1 1
Plastic Wares 2 3 3 3 2
Power generation - 1 1 1 1
Restaurant/ Refreshments/ Small Eatery
& Catering
15 32 24 22 23
Rice Retailing/ Rice Mill - 10 10 8 7
Rural Bank & Lending Reality
Corporation
11 1 1 1 1
Sari-sari Store 217 266 282 271 285
Softdrink Distributor/ Wholesaler 1 2 2 2 1
Sound System & Mini Theater 2 2 2 3 2
Sugar Cane Mill - 1 1 1 1
Tailoring 3 2 2 2 2
Training Center & Gym (Billiard) 3 5 4 3 2
Travelling Rice Mill 8 11 9 8 6
VCD Rentals & Xerox Copier 4 - 2 - -
Videoke Bar - - - - -

MUNICIPAL PROFILE 2017 MUNICIPALITY OF MINA
60
Vulcanizing Shop 4 4 2 3 3
TOTAL 407 499 464 468 478
Source: Business Permits & Licensing Office
Based on permits issued by the Licensing Office, Inventory of
Commercial Establishment were ascertain in the municipality. (see Table
71).
Table 71. INVENTORY OF COMMERCIAL ESTABLISHMENT
Economic Activities 2011 2012 2013 2014 2015
Number of Establishments
Wholesale/ retail Trade 339 431 434 434 444
Banking and Financing 13 3 3 3 3
Insurance 0 0 0 0 0
Real Estate 2 0 1 1 1
Services:
Business Services 0 0 0 0 0
Recreational Services 15 19 11 12 13
Personal Services 38 46 18 18 17
TOTAL 407 499 464 468 478
Source: Business Permits & Licensing Office
- INDUSTRY Table 72. INVENTORY OF EXISTING INDUSTRIAL
ESTABLISHMENTS BY INTENSITY AND CAPITALIZATION
Barangay
Name of
Industrial
Establishme
nt
Land
Area
(hectar
es)
Intensity
Classification
Capitalizat
ion Employment
Talibong
Pequeño MOFAWA 7
Non-Pollutive/
Non Hazardous P500,000.00 20
Tolarucan RPG 2,4196 Non –Pollutive/
Non Hazardous 10M 100
Table 73. INVENTORY OF EXISTING INDUSTRIAL ESTABLISHMENTS BY
MANUFACTURING/INDUSTRIAL PROCESS AND MARKETS:
Name of
Industria
l
Establish
ment
Manufac
turing
Industr
ial
Process
Raw Material Production Product
Market
Materia
l Source Product Volume Value
Loca
l
Export
(other
)
MOFAWA Sugar
Milling
Sugar
Cane
Locally
Produced Sugar 20T
P660.000.
00 / /
RPG Palay
Milling Palay
Locally
Produced Palay 120T 20M / -
- TOURISM
The municipality of Mina celebrates its annual fiesta every 12th day
of October in honor of their patron saint Nuestra Señora Del Pillar. In
the opening of the town fiesta, all of the sectors found in the
municipality come as one in the town plaza and performs their hidden
talents thru the field demonstration. Before the year ends, the
municipality also celebrates the Paskwa Halad sa Banwa which showcases the

MUNICIPAL PROFILE 2017 MUNICIPALITY OF MINA
61
hidden talents of the Minanhons in terms of craftsmanship. The event
showcases the beauty of lights in celebration of the Christmas season. The
Paskwa Halad sa Banwa was held every December 16-23 of the year.
The municipality also has the Montogawe Ecopark which serves as the
tree park of the municipality. There is also the Halkyon Eco-tourism which
is located at the Janipa-an West which features the beautiful orchard and
abundant poultry and fishpond. The said spot is owned privately.
The municipality will be having its public library and museum which
will features the ancient artifacts that are found in the municipality.
the building will narrate the ancient history of the municipality thru the
image of the artifacts that are being displayed.
The following are the tourism establishments in the municipality of
Mina and their accessibility.
Table 74. Inventory of Tourism Establishments, Mina, Iloilo, 2016
Location
(Barangay)
Name of
Tourism
Establishme
nt
Area
(Hecta
res)
Type of
Attraction
Facilities Ownership
Janipa-an
West
Halkyon
Eco-Tourism
10 has Man-made Fishpond,
poultry, orchard
Private
Sector
Poblacion Festival
Event
NA Religious Covered gym/
cultural stage/
public plaza/
grandstand
LGU/NGA
Poblacion Paskwa
Halad sa
Banwa
NA Cultural; -do- -do-
Bangac Montogawe
Ecopark
5 has Tree Park Training center/
Oval grandstand
LGU
Source: Mina Municipal Planning and Development Office (MPDO), 2015
Table 75. Accessibility of Existing Tourism Establishment and Tourist
Attractions, Mina, Iloilo, 2016
Name of
Tourism
Establishment
Means of
Transporta
tion
Available
Distance
from
Nearest
Airport
(km)
Distance
from Nearest
Seaport (km)
Distance
from
National
Highway (km)
Access Road Accessibi
lity Pavemen
t
Conditi
on
Halkyon Eco-
Farm
Land 20 km 8 km 3 km Gravel Good 1
Inland Resort Land 20 km 8 km 3 km Gravel Good 1
Festival
Event
Land 20 km 8 km 0 Asphalt
/
cement
Good 1
Paskwa Halad
sa Banwa
Land 20 km 8 km 0 Asphalt
/
cement
Good 1
Montogawe
Landmark
Land 1 km 7 km 1 km Asphalt
/
cement
Good 1
Source: Mina MPDO (2016)

MUNICIPAL PROFILE 2017 MUNICIPALITY OF MINA
62
INFRASTRUCTURE
- TRANSPORTATION
The road network of Mina Municipality provides the channels for
external accessibility and internal circulation. The network within the
geographic territory of Mina has a total length of 116.064 kms. This total
length can be broken down into:
Of these roads, 9.851 km (or 8.50%) are classified as national road,
which is an access in going out to the city and other parts of the
municipality, 11.565 km (or 9.96%) are provincial roads, 3.185 km (or
2.74%) are municipal roads, and 91.463 km (or 78.80%) are barangay roads.
There are three existing bridges located in 3 barangays and one box
culvert in one barangay as shown in Table 75. They are made of concrete
with load capacity from 5 to 10 tons, all are serviceable. Other related
structures are concrete box culvert and reinforced concrete pipes (RCP)
situated in 22 barangays of the municipality.
Table 75. Inventory of Roads by System Classification and Type of
Pavement, Mina, Iloilo
Source: MEO/MPDO
Table 76. Inventory of Bridges by Location, Type, Capacity and Condition,
Mina, Iloilo
Bridge Name Location
(Barangay)
Type Road Capacity
(tons)
Physical
Condition
Suague RCGD Cabalabaguan RCGB 10 Good
Amiroy Bridge Janipa-an East Bailey 5 Good
Talibong
Grande Bridge
Talibong Grande Steel
Beam
10 Good
Tipolo
Culvert
Tipolo Box
Culvert
5 Good
Source: MEO/MPDO, Mina
Based on the record, the total numbers of vehicles registered are
jeepney – 75, tricycles – 115, and trisicad – 117. Route destinations of
these vehicles are from the Barangay to City/Municipal Center except
trisicad whose route is within the Municipal vicinity.
Roads by
Sytem
Classificatio
n
Right of
Way
(ROW)
(m)
Total
Length
(km)
Road Surface Type
Concrete Asphalt Gravel Earth
km % C km % C km % C km % C
National 20 9.851 9.85
1
100 Good - - - - - - - - -
Provincial 15 11.565 - - - - - - 11.56
5
100 Good - - -
Municipal 10 & 6 3.185 1.95
3
61.3
2
Good - - - 1.232 38.6
8
Good - - -
Barangay Road 6 & 4 84.583 0.2 0.24 Good - - - 84.38
3
99.7
6
Good - - -

MUNICIPAL PROFILE 2017 MUNICIPALITY OF MINA
63
Table 77. Inventory of Public Land Transport Vehicles by Type and Service
Routes, Mina, Iloilo, 2015
Source: MEO/MPDO
There are two (2) public utility jeepney routes to and from Mina:
Janiuay – Mina – Pototan Route
Mina – Iloilo Route
Table 78 shows that land transportation terminals are situated in
Barangay Cabalabaguan in the Public Market, both for tricycles and
jeepneys occupying an area of 600 sq.m. more or less.
Table 78. Land Transportation Terminals by Location and Condition, Mina,
Iloilo, 2015
Name Location
(Barangay)
Land Area
Occupied
(sqm.)
Type of Public
Utility Vehicles
Using the Terminal
Terminal
Facilities
Physical
Condition
MTODA Cabalabaguan 600 Tricycles Public
Market
Good
MJODA Cabalabaguan Jeepneys Public
Market
Good
Source:Market
Table 79. ROAD ACCIDENTS BY DAMAGE AND FREQUENCY FOR THE PAST THREE YEARS
Nature 2010 2011 2012 2013
Reckless Imprudence resulting to:
Physical Injuries 3 6 5 4
Damages to Property 12 2 1 1
Physical Injuries & Damage to
Property 1
Homicide 8 1
TOTAL 23 9 7 4
Type of
Public
Utility
Vehicle
Registered in the City/Municipality Municipality
Total
No.
Route/Destination Total No. Route/
Destinatio
n
Within
Baranga
y
Barangay to
Barangay
Barangay to City/
Municipal Center
City/
Municipal
Center
Buses - - - - - -
Jeepney 75 - - - 75 -
Taxi/FX - - - - - -
Tricycl
es
115 - - 115 - -
Bicycle
s
- - - - - -
Trisika
d
117 - - - 117 -

MUNICIPAL PROFILE 2017 MUNICIPALITY OF MINA
64
- POWER The Iloilo Electric II Cooperative Inc. (ILECO II) serves the
Municipality of Mina, which is one of three local power utilities serving
the province. Founded in 1975, this current service provider of Mina was
eventually split in 1986, and retained service for fifteen (15)
municipalities. It was classified Category A Coop among small
cooperatives in 1990 and after a series of upgrades achieved Extra Large
Coop in 2001 and has consistently attained Category A+EC from the National
Electrification Administration.
The ILECO II has a generating capacity of 20MVA, 32% of which is
being made available to the Municipality per information gathered in the
Mina CLUP. About 70% of its consumption is attributable to domestic
usage, with the balance of usage divided among other sectors, as shown in
the following 2015 table. Updates to these figures were not available at
the time of the writing of this report.
As of 2015, there are a total of 3289 domestic connections of the
locality, 3 for industrial, 100 for commercial, 26 for public buildings
and 9 streetlights. The average consumption in one month of the
municipality is around 334, 434.70 KWh. The distribution of further data
is shown in Table 80.
Table 80. Distribution of ILECO II Services, 2015
Type of
Connection
Number of
Connection
Average Consumption
(KWH/MO.)
Domestic 3289 238,697.90
Industrial 3 37,315.60
Commercial 100 32,544.00
Public Building 26 24,638.70
Street Lights 9 1238.50
Others - -
Total 3427 334,434.70
Source: ILECO II
Table 81. PROJECTED POWER REQUIREMENTS
BY TYPE OF CONNECTIONS (KWH)
Connection
/User
Projected Power Requirement
2011 2012 2013 2014 2015
1. Domestic 204,263.04 209,810.76 215,492.16 221,374.08 227,456.52
2. Industrial 40,693.45 41,835.15 42,895.30 44,118.55 45,341.80
3. Commercial 23,934.95 24,592.96 25,258.80 25,948.14 26,653.14
4. Institutional 17,497.36 17,978.39 18,469.44 18,970.51 19,481.60
5. Agricultural N/A N/A N/A N/A N/A
6. Streetlights
(Public) 1,359.39 1,395.71 1,434.44 1,473.18 1,513.13
TOTAL 290,262.62 298,269.23 306,275.84 314,650.57 323,209.36
- WATER The Municipality is currently out of reach of the Metro Iloilo Water
District, which is the largest water service provider in the province.
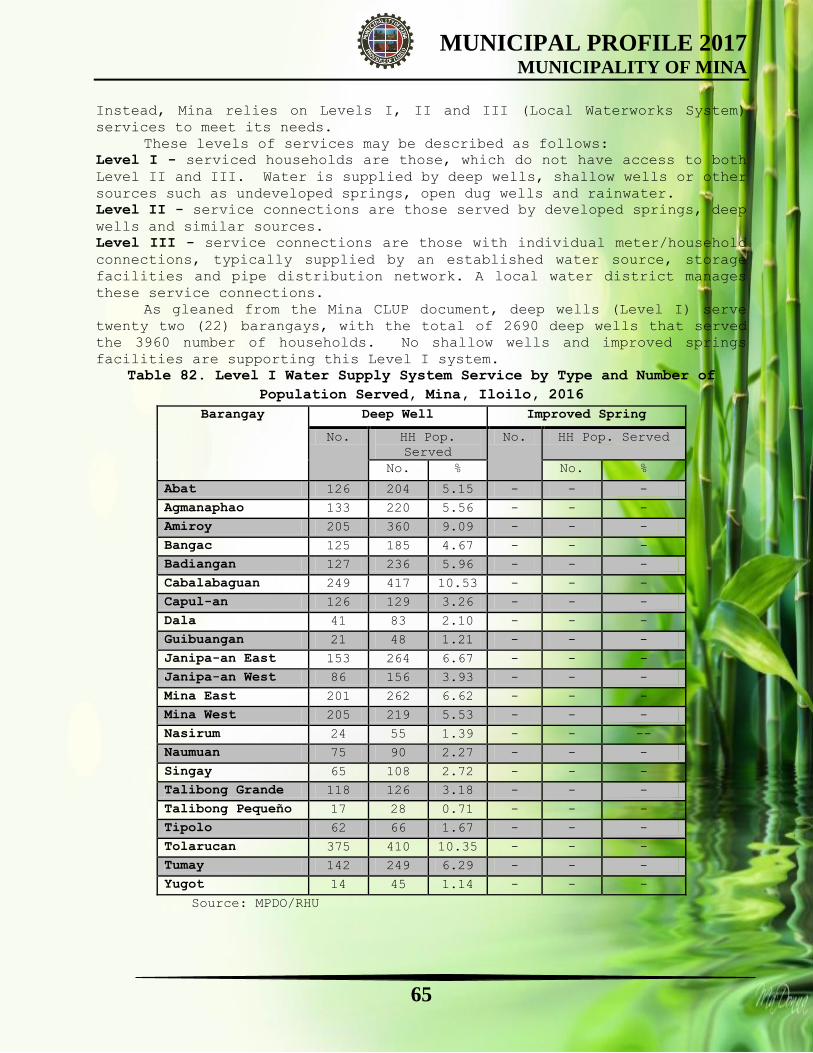
MUNICIPAL PROFILE 2017 MUNICIPALITY OF MINA
65
Instead, Mina relies on Levels I, II and III (Local Waterworks System)
services to meet its needs.
These levels of services may be described as follows:
Level I - serviced households are those, which do not have access to both
Level II and III. Water is supplied by deep wells, shallow wells or other
sources such as undeveloped springs, open dug wells and rainwater.
Level II - service connections are those served by developed springs, deep
wells and similar sources.
Level III - service connections are those with individual meter/household
connections, typically supplied by an established water source, storage
facilities and pipe distribution network. A local water district manages
these service connections.
As gleaned from the Mina CLUP document, deep wells (Level I) serve
twenty two (22) barangays, with the total of 2690 deep wells that served
the 3960 number of households. No shallow wells and improved springs
facilities are supporting this Level I system.
Table 82. Level I Water Supply System Service by Type and Number of
Population Served, Mina, Iloilo, 2016
Barangay Deep Well Improved Spring
No. HH Pop.
Served
No. HH Pop. Served
No. % No. %
Abat 126 204 5.15 - - -
Agmanaphao 133 220 5.56 - - -
Amiroy 205 360 9.09 - - -
Bangac 125 185 4.67 - - -
Badiangan 127 236 5.96 - - -
Cabalabaguan 249 417 10.53 - - -
Capul-an 126 129 3.26 - - -
Dala 41 83 2.10 - - -
Guibuangan 21 48 1.21 - - -
Janipa-an East 153 264 6.67 - - -
Janipa-an West 86 156 3.93 - - -
Mina East 201 262 6.62 - - -
Mina West 205 219 5.53 - - -
Nasirum 24 55 1.39 - - --
Naumuan 75 90 2.27 - - -
Singay 65 108 2.72 - - -
Talibong Grande 118 126 3.18 - - -
Talibong Pequeño 17 28 0.71 - - -
Tipolo 62 66 1.67 - - -
Tolarucan 375 410 10.35 - - -
Tumay 142 249 6.29 - - -
Yugot 14 45 1.14 - - -
Source: MPDO/RHU
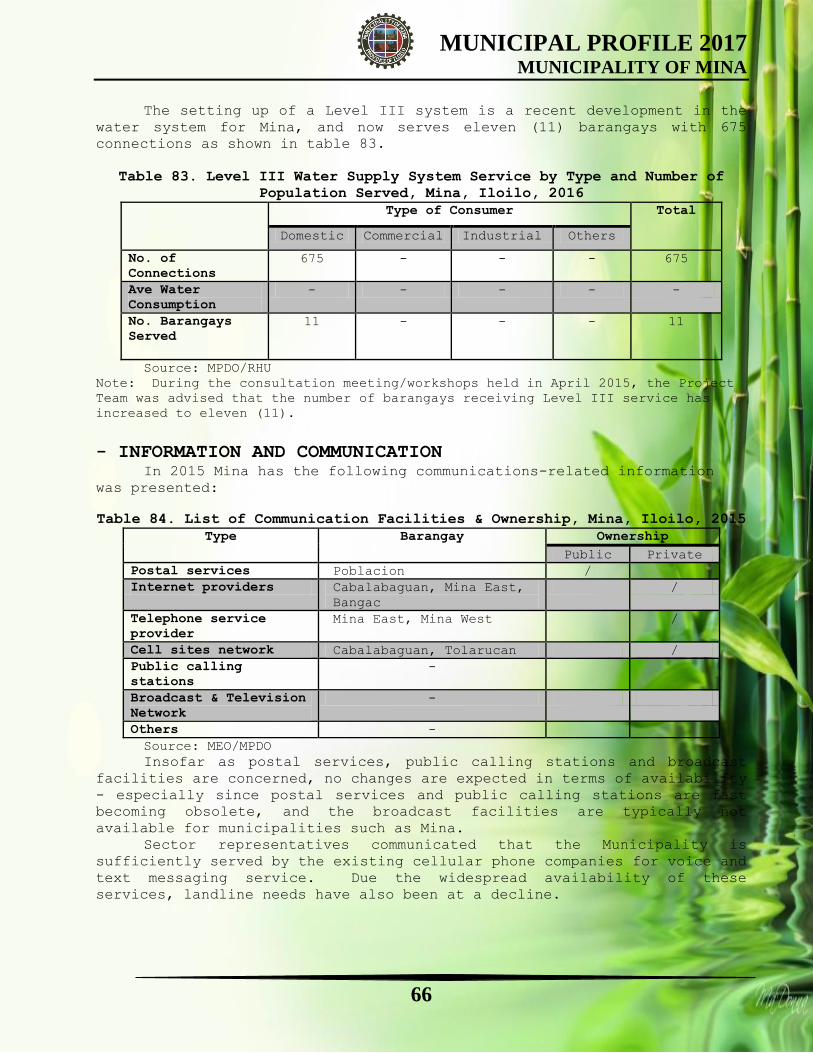
MUNICIPAL PROFILE 2017 MUNICIPALITY OF MINA
66
The setting up of a Level III system is a recent development in the
water system for Mina, and now serves eleven (11) barangays with 675
connections as shown in table 83.
Table 83. Level III Water Supply System Service by Type and Number of
Population Served, Mina, Iloilo, 2016
Type of Consumer Total
Domestic Commercial Industrial Others
No. of
Connections
675 - - - 675
Ave Water
Consumption
- - - - -
No. Barangays
Served
11 - - - 11
Source: MPDO/RHU Note: During the consultation meeting/workshops held in April 2015, the Project
Team was advised that the number of barangays receiving Level III service has
increased to eleven (11).
- INFORMATION AND COMMUNICATION In 2015 Mina has the following communications-related information
was presented:
Table 84. List of Communication Facilities & Ownership, Mina, Iloilo, 2015
Type Barangay Ownership
Public Private
Postal services Poblacion /
Internet providers Cabalabaguan, Mina East,
Bangac
/
Telephone service
provider
Mina East, Mina West /
Cell sites network Cabalabaguan, Tolarucan /
Public calling
stations
-
Broadcast & Television
Network
-
Others -
Source: MEO/MPDO
Insofar as postal services, public calling stations and broadcast
facilities are concerned, no changes are expected in terms of availability
- especially since postal services and public calling stations are fast
becoming obsolete, and the broadcast facilities are typically not
available for municipalities such as Mina.
Sector representatives communicated that the Municipality is
sufficiently served by the existing cellular phone companies for voice and
text messaging service. Due the widespread availability of these
services, landline needs have also been at a decline.

MUNICIPAL PROFILE 2017 MUNICIPALITY OF MINA
67
DISASTER RISK REDUCTION AND MANAGEMENT &
CLIMATE CHANGE ADAPTATION
- Preparedness Issues The municipality of Mina set up programs, projects and actions to
answer the problem on preparedness issues like the conduct of seminars and
trainings to the responders and volunteers during the calamities. The
information dissemination drive is materialized to inform the residents
the impacts and things to do during the disasters. The equipments and
supplies needed during the calamities are procured. Every barangay has it
BDRRMC that will address any concerns in their area. Additional
infrastructure projects and evacuation area are being undertaken.
- Prevention and Mitigation issues The information drive is undertaken in order to address the said
issues. The municipality had installed equipments that will monitor the
water level in the locality during the disasters. There is the presence of
the rain gauge that will measure the amount of rainfall. The BDRRMC will
coordinate with the MDRRMC for further information and concerns needs to
be solved.
- Response Issues The municipality conducts relief and recovery program which involves
the LGU, BFP, PNP and MDRRMC to the people affected by the disaster.
Financial support is extended to the affected individuals during the
incidents of the disasters.
Hazard is defined as any dangerous phenomenon, substance, human
activity or condition that may cause loss of life, injury or other health
impacts, property damage, loss of livelihoods and services, social and
economic disruption, or environmental change (CLUP Resource Book, 2013).
From the Hyogo Framework for Action, hazards of concern to disaster
risk reduction are those of natural origin (geological, hydro-
meteorological, and biological) and of human-induced processes
(environmental degradation and technological hazards). Hazard sources may
be climatological, geo-physical and man-made. Climate change, including
climate variability and extremes, increases the vulnerability of a
community to the impacts of hazards.
Risk is a product of hazard and vulnerability. It quantifies the
probability of a certain hazardous event happening and accounts for its
impact to the exposed groups. Vulnerability considers the exposure,
sensitivity and the adaptive capacity of the community. Several
vulnerability indicators (physical, economic and social) were considered
in quantifying the residual risks of the hazards. This section presents
the risk assessment on various hazards and their potential impacts to the
Municipality of Mina.

MUNICIPAL PROFILE 2017 MUNICIPALITY OF MINA
68
- CLIMATOLOGICAL HAZARDS
A. Flood and Flashfloods
Flooding in Mina is often caused by prolonged rain. As such,
majority of the flood occurrences are associated with tropical cyclones or
monsoon rains. Around 20 typhoons enter the Philippine area of
responsibility (PAR) every year, usually from June to December; of these,
only 8 to 9 actually make landfall. For the Municipality of Mina, at least
one tropical cyclone passes by the area every two years. A typhoon can
bring extensive wind and rain hazards such as floods and flashfloods. In
addition to this, anthropogenic activities, such as accumulation of
improperly disposed solid wastes, poor flood dynamics in public facilities
and infrastructures, and inadequate preparedness for natural calamities
may also cause, or even worse, flooding events.
In Mina, areas prone to flooding are those subjected to recurring
inundation when the water level of the Suague River rises and overflows
the natural and artificial confines due to heavy and continuous rainfall.
Most areas with elevations greater than 20 meters are not prone to
flooding. Flashfloods are of short duration with relatively high peak
discharge over a relatively small catchment area. Potential flashflood
exit points are areas where flash flooding is expected to occur.
The flood susceptibility or flood hazard map for the Municipality of
Mina is shown in Table 85 lists the barangays with high susceptibility to
flooding. Flood hazard maps are based on geomorphological analysis of Mina
through photo interpretation techniques using aerial photographs and
satellite imageries together with the latest topographic maps leading.
Geomorphological mapping is often conducted in the field together with
interviews from residents as a means of verification.
Table 85. Barangays Susceptible to Flood, Mina, Iloilo Flood Susceptibility Potential Impact Areas
Very High Susceptibility
Flood waters of more than 2.0 meters. These are
areas that are immediately flooded during heavy
rains of several hours. These are also prone to
flash floods.
Portions of Bangac,Tolarucan, Guibuangan,
High Susceptibility
Flood waters up 1.0 to 2.0 meters. These are areas
that are immediately flooded during heavy rains of
several hours; include landforms of topographic
lows such as river channels, abandoned river
channels, and areas along riverbanks. These are
also prone to flash floods.
Portion of Agmanaphao, Cabalabaguan,
Guibuangan, Janipa-an East, Mina East, Mina
West, Nasirum, Naumuan, Singay, Talibong
Grande, Talibong Pequeño, Tipolo,
Tumay,Dala
Moderate Susceptibility
Flood waters between 0.5 to 1.0m meters. These are
areas that are immediately flooded during heavy
rains of several hours.
Portion of Singay, Badiangan, Agmanaphao,
Tolarucan, Amiroy, Janipa-an East, Janipa-
an West, Talibong Grande, Naumuan,
Cabalabaguan, Yugot, Dala, Capul-an, Mina
East, Mina West
Low Susceptibility
Flood waters 0.5m and below.
Portion of Singay, Badiangan, Agmanaphao,
Tolarucan, Amiroy, Janipa-an East, Janipa-
an West, Talibong Grande, Naumuan,
Cabalabaguan, Yugot
Source:MGB Based on the Map

MUNICIPAL PROFILE 2017 MUNICIPALITY OF MINA
69
In the incident of flood in the municipality in the year 2012, there
are a total of 1,483 households affected by the said hazard. The most
numbered of households affected by flood is Brgy. Cabalabaguan with a
total of 389 households and it is followed by Bangac with the total of 310
households. The said two barangays are very high and high susceptibility
to the flood. The rest of the affected household data is presented in
Table 86.
Table 86. Household and Population Affected by Flood Hazard, Year 2012
Barangay
Flood Number of
Household
s
Affected
Population Affected
Very
High
High Moderat
e
Low Male Femal
e
Total
Abat 3 5 7 12
Agmanaphao / 0 0 0 0
Amiroy / 0 0 0 0
Badiangan / 5 8 12 20
Bangac / 36 144 166 310
Cabalabaguan / 38 188 201 389
Capul-an / 1 3 2 5
Dala / 2 7 4 11
Guibuangan / 6 12 18 30
Janipa-an East / 0 0 0 0
Janipa-an West 0 0 0 0
Mina East / 16 48 65 113
Mina West / 18 108 72 180
Nasirum / 1 2 4 6
Naumuan / 0 0 0 0
Singay / 0 0 0 0
Talibong
Grande
/ 0 0 0 0
Talibong
Pequeño
/ 0 0 0 0
Tipolo / 0 0 0 0
Tolarucan / 8 56 39 95
Tumay / 21 144 168 312
Yugot / 0 0 0 0
TOTAL 2 5 0 137 725 758 1,483
Source: Mina MDRRMO
B. Typhoon
The municipality of mina is also affected by the damage brought
about by the typhoons that enters the Philippine area of responsibility
every year. The latest event of typhoon in the municipality is during
typhoon Quinta in 2013 wherein a total of 446 households were affected and
total of 3872 affected population. The most affected barangay is the
barangay Cabalabaguan with 42 affected households. The rest of the data is
presented in the table 87.

MUNICIPAL PROFILE 2017 MUNICIPALITY OF MINA
70
Table 87. Household and Population Affected by Typhoon Hazard, Year 2013
Barangay Number of Households
Affected
Population Affected
Male Female Total
Abat 12 15 48 63
Agmanaphao 31 124 93 214
Amiroy 25 100 90 190
Badiangan 31 155 186 341
Bangac 37 185 223 408
Cabalabaguan 42 210 252 462
Capul-an 15 60 55 115
Dala 10 40 65 105
Guibuangan 10 20 25 45
Janipa-an East 15 45 60 105
Janipa-an West 12 60 72 132
Mina East 25 150 125 275
Mina West 26 156 182 338
Nasirum 4 16 20 36
Naumuan 6 36 34 70
Singay 8 64 54 118
Talibong Grande 11 22 28 50
Talibong Pequeño 9 18 27 45
Tipolo 28 112 84 196
Tolarucan 34 136 170 306
Tumay 32 96 64 160
Yugot 23 46 49 95
TOTAL 446 1,866 2,006 3,872
Source: Mina MDRRMO
C. Rain-Induced Landslides
Areas with low susceptibility rating for rain-induced landslides
have low to gentle slopes and no tension cracks.
Table 88 shows the areas in Mina that are susceptible to landslides
during heavy rains.
Table 88. Barangays Susceptible to Landslides caused by Heavy Rainfall,
Mina, Iloilo
Landslides Susceptibility Potential Impact Areas
Low Susceptibility
Areas with low to gentle slopes and
no tension cracks.
Portions of Badiangan, Amiroy, Janipa-
an East, Janipa-an West,
Moderate Susceptibility
Areas with moderate to gentle
slopes.
Portions of Abat
Source:MGB
D. Drought Hazard
Drought is a deficiency in precipitation that leads to deficits in
water supply relative to the needs of a certain area. Drought in the
Philippines is usually associated with the El Nino phenomenon, which is
characterized by an unusual increase in ocean surface temperatures in the
center and eastern equatorial Pacific Ocean. This phenomenon may occur

MUNICIPAL PROFILE 2017 MUNICIPALITY OF MINA
71
every 2 to 7 years and can bring either heavy rains or drought. Drought
is usually defined when rainfall amount falls below normal in 3
consecutive months (Climate Monitoring and Prediction Section, PAGASA).
The impact of drought to Mina is the same throughout the entire
municipality but is heavily seen on the agricultural sector, water supply,
and perhaps later on the power sector as the Jalaur project starts to
generate hydroelectric power. The onset of the hazard is slow and early
warning can prepare Mina in mitigating the hazards associated to
drought. Those mostly affected are agricultural areas, which depend on
natural rainfall for irrigation
E. Climate-Change Induced Hazards
According to PAGASA projection, the whole of Region 6 would
experience higher temperatures during summer seasons, and increased
rainfall during the rainy season, by year 2020 and 2050. Higher
temperatures will results in water shortages, and increased rainfall may
induce flooding. For the Philippines, a downscaled regional climate model
called “Providing Regional Climate for Impact Studies (PRECIS)” was
developed by the Hadley Center in the UK. The Philippine Atmospheric,
Geophysical, and Astronomical Services Administration (PAGASA) used this
regional model to provide climate impact projections for the Philippines
for the periods 2020 and 2050. Generally, there will be marked increase in
temperature in the different regions in the Philippines.
a. Increasing Temperatures
Various mathematical models on climate change predict the increasing
average temperature. It is predicted that all areas of the Philippines
will get warmer particularly during summer months. There is a projected
rise on the country’s mean annual temperatures by about 0.9 to 1.1oC for
2020. By year 2050, it is projected that there is an increase by 1.8 to
2.2oC. Specifically, dry season from March to May will become drier. The
seasonal average temperature prediction for the Province of Iloilo is
shown in Figure 5.1. For 2020, Iloilo will have a mean temperature
increase of 1.0 to 1.3oC, while in 2050 the projected mean annual
temperature increase is 1.9 to 2.4oC. Such warmer temperature can
initiate drought, which could affect water supply and the irrigation for
the agricultural areas in Mina.
The monthly minimum and maximum temperatures for the past five years
is represented in Table 6.1.5 wherein it shows that the highest maximum
temperature is 33.7 in the month of May last 2015 and the lowest minimum
temperature of 23.0 happens last march of the same year. For further
explanation see the table stipulated.
Table 89. Monthly Minimum and Maximum Temperature Data for the Year 2011-
2015
Month 2011 2012 2013 2014 2015
Max.
Temp.
Min.
Temp.
Max.
Temp.
Min.
Temp.
Max.
Temp.
Min.
Temp.
Max.
Temp.
Min.
Temp.
Max.
Temp.
Min.
Temp.
January 28.8 23.4 30.3 24.7 29.4 24.5 26.9 22.5 28.6 24.0
February 30.1 24.1 30.4 24.7 30.2 24.8 28.2 23.2 28.7 23.4
March 30.1 25.7 30.5 25.0 31.5 25.5 29.6 24.5 30.9 23.0

MUNICIPAL PROFILE 2017 MUNICIPALITY OF MINA
72
April 30.8 25.8 32.4 26.2 33.0 27.0 29.8 25.2 31.0 24.7
May 31.4 27.1 32.7 23.3 32.6 26.4 32.1 27.2 33.7 25.0
June 31.2 27.5 30.9 25.6 31.3 26.0 31.6 26.3 33.0 25.3
July 30.1 26.7 30.4 25.4 30.6 25.1 29.9 25.2 30.8 25.2
August 30.1 27.1 31.2 28.8 30.1 25.2 30.5 26.3 31.5 25.1
September 30.9 26.9 30.4 25.4 31.3 25.6 29.7 25.1 31.7 25.2
October 31.1 26.9 30.7 25.4 31.1 25.2 29.8 25.2 31.8 25.0
November 31.0 26.9 31.6 25.9 30.9 25.5 30.1 25.7 32.8 25.0
December 30.0 26.3 30.6 25.2 30.7 25.6 29.2 24.9 32.1 24.6
Source: PAG-ASA, Dumangas
b. Increase in Rainfall Intensity
Decrease in the rainfall in most parts of Iloilo is predicted
during the summer season particularly in the months of March, April and
May. However, rainfall will likely increase during the northeast monsoon
(December, January, February). It is projected that the rainfall variation
for 2020 is from -8.6% to 11.5% and for 2050, the rainfall variation will
be -13.3% to 20.4%.
The monthly rainfall data in the past five years is shown in Table
6.1.6 wherein the highest rainfall intensity is last August 2011 with an
amount of 448.8 mm. and the least incidence of rainfall is last February
2014 with an amount of 11.2 mm. For further data of analysis, see the
mentioned table 90.
Table 90. Rainfall Data for the Year 2011-2015
Month 2011 2012 2013 2014 2015
January 171.2 mm. 91.4 mm. 62.2 mm. 154.2 mm. 57.4mm.
February 64.2 mm. 142.0 mm. 108.0 mm. 11.2 mm. 39.6 mm.
March 185.0 mm. 286.4 mm. 13.4 mm. 79.6 mm. 24.2 mm.
April 65.6 mm. 59.6 mm. 101.8 mm. 104 mm. 10.8 mm.
May 189.8 mm. 182.8 mm. 177.2 mm. 66.2 mm. 33.0 mm.
June 350.0 mm. 228.6 mm. 170.4 mm. 59.4 mm. 142.8 mm.
July 434.6 mm. 474.2 mm. 374.4 mm. 408.2 mm. 333.4 mm.
August 448.8 mm. 443.6 mm. 340.8 mm. 183.4 mm. 341.4 mm.
September 128.4 mm. 241.4 mm. 208.6 mm. 205.8 mm. 264.8 mm.
October 208.8 mm. 276.0 mm. 172.0 mm. 336.8 mm. 128.8 mm.
November 225.2 mm. 76.2 mm. 396.7 mm. 59.4 mm. 77.0 mm.
December 242.6 mm. 227.2 mm. 79.8 mm. 174.0 mm. 92.4 mm.
Source: PAG-ASA, Dumangas
c. Extreme Events
Maximum temperatures exceeding 35oC are expected to be more frequent
in 2020 and 2050. Table 6.1.7 presents the projected frequencies of
extreme events for the Province of Iloilo.
Table 91. Frequency of Extreme Events in 2020 and 2050 under Medium-range
Emission Scenario in Iloilo Province
Observed
Baseline
(1971-2000)
Year 2020
(2006-2035)
Year 2050 (2036-
2065)

MUNICIPAL PROFILE 2017 MUNICIPALITY OF MINA
73
No. of days with max.
temp. >35°C
460 1,431 3,076
No. of dry days 7,839 5,227 5,226
No. of days with
rainfall >300mm
0 3 0
Note: Values against total number of days per 29-year study/projection
period, which is 10, 585.
Source: DOST – PAGASA, 2011
- GEO-PHYSICAL HAZARDS
A. Ground Shaking due to Earthquake
Based on the distribution map of active faults and trenches in the
Philippines produced by PHIVOLCS, Mina is in close proximity to a major
earthquake generator in Western Visayas. This is the West Panay Fault that
runs from Aklan through Capiz and ends in the town of San Joaquin, Iloilo.
The groundshaking hazard map shown in Map 2.6 reveals that all
barangays in the municipality have ground shaking potential for Intensity
VIII earthquakes, which are described under the PHIVOLCS Earthquake
Intensity Scale (PEIS) as “very destructive”.
The ground shaking hazard map is a composite map of estimates of
maximum intensities for various earthquake scenarios that may affect Mina.
Intensities were determined using deterministic method. Fault parameters
and maximum credible magnitude used for different earthquake scenarios
were based on instrumental seismicity, historical seismicity and mapped
active earthquake generators in the area. The attenuation of ground
shaking with distance was corrected for the type of underlying materials
based on surface geology. The ground shaking hazard maps do not restrict
construction of any structure or land development in the area with
expected high intensities as along as provisions on structural design of
the building code are followed.
B. Liquefaction due to Earthquake
The typical soil susceptible to liquefaction is loose sand located
near the surface and with shallow groundwater table. During an earthquake,
ground shaking causes loosely-consolidated sand deposits to contract
resulting to increase in pore water pressure and reduced grain to grain
effective stress (Seed, 1970). This causes loss of soil bearing capacity
and makes the soil behave like fluid. In the process, there is an upward
flow of water to the ground surface where it emerges in the form of mud
spouts or sand boils. Liquefaction is usually accompanied by differential
settlement and lateral spreading because of withdrawal of materials
beneath the ground surface.
Areas where liquefaction is likely to occur include riverbeds, old
or abandoned riverbeds and meanders, swamps and back swamps. Alluvial
plains, pyroclastic plains and coastal plains with shallow groundwater and
with silty to sandy soils are also possible sites for liquefaction.
The liquefaction hazard map for Mina shown in Map 2.7 was based on
the geology, presence of active faults, historical accounts of
liquefaction, geomorphology and hydrology of the area, and preliminary

MUNICIPAL PROFILE 2017 MUNICIPALITY OF MINA
74
micro-tremor survey data utilized to validate type of underlying
materials. The map is semi-detailed and often used for land use and
emergency planning and cannot be used for site-specific evaluation. It
does not restrict construction of any structures and development in the
areas as long as proper engineering considerations are applied. Table 92
lists the potential areas, which are susceptible to liquefaction during
earthquake.
Table 92. Barangays Susceptible to Liquefaction caused by Earthquake,
Mina, Iloilo
Susceptibility to
Liquefaction
Potential Impact Areas
Low Susceptibility
Agmanaphao, Badiangan, Dala, Mina East,
Mina West, Singay,
Portions of Abat, Amiroy, Bangac,
Cabalabaguan, Janipa-an East, Janipa-an
West, Tolarucan, Tumay
Source: MGB
- HAZARD IMPACTS
Based on the available hazard maps, Table 6.3.1 presents the summary
of hazards that have potential impacts to the Municipality of Mina.
Table 93. Summary of Hazards in Mina, Iloilo
Hazard Potential Impact Mitigating Measure
Earthquakes Loss/damage to
properties and
equipment
Injuries and
fatalities of
people
Incorporate seismic hazards in the detailed
engineering designs particularly on the buildings
and other structures.
Implement standard design and procedures during
construction as stated in the Building Code.
Remove loose materials during site development.
Implement regular monitoring and documentation of
structural weakness.
Install seismometer.
Acquire fault certification from PHIVOLCS.
Liquefaction Loss of soil
strength
Possible damage
to structures and
equipment
Conduct soil test and investigations to check
stability of soil.
Incorporate soil investigations results in the
detailed engineering design for building and
other structures.
Structures must be constructed in low
liquefaction areas.
Drought Loss of
production in
agricultural
areas
Possible lowering
of water supply
Source potential alternative water sources (i.e.,
Jalaur High dam project).
Planting of crops, which require less water for
irrigation.
Watershed management
Rain-induced
Landslides
Loss/damage to
properties and
Incorporate seismic hazards in the detailed
engineering design.

MUNICIPAL PROFILE 2017 MUNICIPALITY OF MINA
75
equipment
Injuries and
fatalities of
people
Construct protection structures (i.e.,
embankments, barrier walls).
Strengthen foundations on structures.
Flooding Loss/damage to
properties and
equipment
Injuries and
fatalities of
people
Incorporate adequate drainage systems for the
project site.
Implement greening of open spaces and buffer
zones.
Conduct regular monitoring of flood forecast
especially during typhoons
Designate evacuation areas.
Conduct flood modeling of the area.
Source:MGB

MUNICIPAL PROFILE 2017 MUNICIPALITY OF MINA
76
LOCAL ADMINISTRATION
-DEPARTMENTS AND OFFICES The Local Government Unit of Mina with different offices who are
manned by competent personnel to render services to the populace are shown
if Table 74.
Table 94. OFFICES AND HEAD OF OFFICE
OFFICE HEAD OF OFFICE
Office of the Mayor REY P. GRABATO
Municipal Mayor
a. HRMO FELNE P. NOVO
HRMO II
b. Licensing EMILYN P. FONTANILLA
Licensing Officer II
c. MSTC JOSIE C. PAPARON
Registrar II
Office of the Sangguniang Bayan BERNARDINO P. CHICHIRITA
Vice Mayor Municipal Planning and
Development Office
ENGR. LUISA A. ALFIN
OIC Mun. Planning &
Development Coordinator Municipal Budget Office
MA. CECILIA B. CAALIM
Municipal Budget Officer
Municipal Treasurer’s Office ROMEO F. TABARNILLA
OIC-Municipal Treasurer
Office of the Market Authority ELEANOR P. PASUQUIN
Market Supervisor
Municipal Assessor’s Office DORY P. EMELO
Municipal Assessor
Municipal Accountant’s Office MARIA C. TOMO
ICO-Municipal Accountant Municipal Civil Registrar’s
Office
MARIA C. TOMO-
OIC-Municipal Civil Registrar
Municipal Engineer’s Office LICERIO C. PATINGO
ICO-Municipal Engineer / GSO-
Designate Municipal Social Welfare And
Development Office
PERLA P. PARREÑO
Municipal Social Welfare &
Development Officer Municipal Health Office
JANEATTE A. SOBREVEGA
Rural Health Physician
Municipal Agriculture Office XYKSTER C. PELAEZ
Municipal Agriculturist Source: HRMO

MUNICIPAL PROFILE 2017 MUNICIPALITY OF MINA
77
- Number of Employees and Personnel by Office (2016)
The different offices in the municipality and personnel ready to
serve and attend to your needs. (see table 95)
Table 95. OFFICES AND NUMBER OF PERSONNEL
Name of Office Number of
Personnel
Office of the Mayor 1
Office of the Sangguniang Bayan 11
Office of the Secretary to the
Sanggunian 3
Office of the Municipal
Administrator 6
Municipal Planning and Development
Office 3
Municipal Budget Office 2
Office of the GSO 7
Municipal Treasurer’s Office 8
Municipal Accountant’s Office 5
Municipal Assessor’s Office 2
Municipal Civil Registrar’s Office 1
Municipal Engineer’s Office 8
Municipal Social Welfare And
Development Office 6
Municipal Health Office 5
Municipal Agriculture’s Office 5
Municipal Economic Enterprise:
Administrative Section 3
Operation of MRC, Bldg., Etc. 6
Operation of Lying-in
Maternity Clinic & Laboratory 10
Operation of MSTC 3
Operation of Market and
Slaughterhouse 7
TOTAL 102
Source: HRMO

MUNICIPAL PROFILE 2017 MUNICIPALITY OF MINA
78
- National Agencies: Different National Agencies with their officer who are
rendering their expertise to the municipality are as follows:
Table 96. NATIONAL AGENCIES AND HEAD OF OFFICE
OFFICE HEAD OF OFFICE
Office Department of Agrarian
Reform
ELMER LORENO MARO
PHILPOST ELSIE E. MONDIDO
Acting Postmaster
Office of the Interior and
Local Government
MA. SOCORRO JOY B. GARCIA
MLGOO
Bureau of Internal Revenue MA. DONNA C. PABON
Revenue Collection Agent
PNP (Mina) MA. THERESA G. LERO
Police Inspector, PNP
COMELEC DOMINGO S. SELOTERIO, JR.
Municipal COMELEC Registrar
POPCOM JERA MAE L. ALOJADO
Population Program Officer I
DepEd District Supervisor
(Elem.)
EDWIN L. LABORDO
District Supervisor
DepEd High School GIL P. ABILLERA
Principal
DepEd Elementary ENRICO S. MATAPUEGO
Principal