Multivariate extension of the continuous variation and mole-ratio methods for the study of the...
10
Analytica Chimica Acta 424 (2000) 105–114 Multivariate extension of the continuous variation and mole-ratio methods for the study of the interaction of intercalators with polynucleotides M. Vives, R. Gargallo, R. Tauler * Dept. Qu´ ımica Anal´ ıtica, Universitat de Barcelona, Diagonal 647, E-08028 Barcelona, Spain Received 14 January 2000; received in revised form 22 May 2000; accepted 13 June 2000 Abstract A recently proposed approach for the study of the intercalation equilibria of drugs and polynucleotides is applied to ethidium bromide and poly(inosinic)–poly(cytidylic) acid. The procedure consists of the extension of the continuous variation and mole-ratio methods by recording all the UV–VIS absorption, fluorescence and circular dichroism spectra for a set of solutions containing a range of polynucleotide:dye concentration ratios. The whole set of spectroscopic data matrices was simultaneously analyzed by a multivariate curve resolution method based on alternating least squares. This procedure allowed the detection of the intercalation complex, the recovery of the concentration profiles and pure spectra for each species and the calculation of the polynucleotide:dye ratio in the complex and the apparent equilibrium constant. The intercalation sites occur every three base pairs and the value for the logarithm of the apparent equilibrium constant at 37 ◦ C in 0.26 M NaCl was 4.6±0.1 M -1 . © 2000 Elsevier Science B.V. All rights reserved. Keywords: Multivariate curve resolution; Factor analysis; Self-modeling; Intercalation; Polynucleotides; Ethidium bromide 1. Introduction The intercalation of drugs or dyes with polynu- cleotides in solution is studied by using spectroscopic techniques. Hence, UV–VIS absorption, molecular fluorescence or circular dichroism spectra are usually recorded for the free polynucleotide, for the free dye and for the mixture at different experimental condi- tions of pH, temperature or ionic strength. From this qualitative analysis of the whole spectra, the presence of an intercalation complex can be deduced. How- ever, in most such studies only the changes at a single wavelength are usually measured for the calculation * Corresponding author. Fax: +34-3-402-12-33 E-mail address: [email protected] (R. Tauler). of equilibrium constants (K eq ) or for the determination of the polynucleotide:dye ratio. Hence, quantitative studies using the continuous variation or Job’s method [1,2] or the mole-ratio method [3] usually monitor the changes at a single wavelength because there is no way to analyze the changes in the whole spectrum [4–6]. This implies that this wavelength must be as se- lective as possible, i.e. only the complex must absorb at it. This disadvantage can be solved by recording the full spectrum and by analyzing the whole data set with an appropriate mathematical method. Several approaches have been proposed for the analysis of multivariate data, i.e. data recorded at more than one wavelength, in biophysical and ana- lytical studies. Most of these approaches are based on the postulation of a chemical model [7,8], i.e. 0003-2670/00/$ – see front matter © 2000 Elsevier Science B.V. All rights reserved. PII:S0003-2670(00)01029-1
Transcript of Multivariate extension of the continuous variation and mole-ratio methods for the study of the...

Analytica Chimica Acta 424 (2000) 105–114
Multivariate extension of the continuous variation andmole-ratio methods for the study of the interaction of
intercalators with polynucleotides
M. Vives, R. Gargallo, R. Tauler∗Dept. Quımica Analıtica, Universitat de Barcelona, Diagonal 647, E-08028 Barcelona, Spain
Received 14 January 2000; received in revised form 22 May 2000; accepted 13 June 2000
Abstract
A recently proposed approach for the study of the intercalation equilibria of drugs and polynucleotides is applied toethidium bromide and poly(inosinic)–poly(cytidylic) acid. The procedure consists of the extension of the continuous variationand mole-ratio methods by recording all the UV–VIS absorption, fluorescence and circular dichroism spectra for a set ofsolutions containing a range of polynucleotide:dye concentration ratios. The whole set of spectroscopic data matrices wassimultaneously analyzed by a multivariate curve resolution method based on alternating least squares. This procedure allowedthe detection of the intercalation complex, the recovery of the concentration profiles and pure spectra for each species and thecalculation of the polynucleotide:dye ratio in the complex and the apparent equilibrium constant.
The intercalation sites occur every three base pairs and the value for the logarithm of the apparent equilibrium constant at37◦C in 0.26 M NaCl was 4.6±0.1 M−1. © 2000 Elsevier Science B.V. All rights reserved.
Keywords:Multivariate curve resolution; Factor analysis; Self-modeling; Intercalation; Polynucleotides; Ethidium bromide
1. Introduction
The intercalation of drugs or dyes with polynu-cleotides in solution is studied by using spectroscopictechniques. Hence, UV–VIS absorption, molecularfluorescence or circular dichroism spectra are usuallyrecorded for the free polynucleotide, for the free dyeand for the mixture at different experimental condi-tions of pH, temperature or ionic strength. From thisqualitative analysis of the whole spectra, the presenceof an intercalation complex can be deduced. How-ever, in most such studies only the changes at a singlewavelength are usually measured for the calculation
∗ Corresponding author. Fax:+34-3-402-12-33E-mail address:[email protected] (R. Tauler).
of equilibrium constants (Keq) or for the determinationof the polynucleotide:dye ratio. Hence, quantitativestudies using the continuous variation or Job’s method[1,2] or the mole-ratio method [3] usually monitorthe changes at a single wavelength because there isno way to analyze the changes in the whole spectrum[4–6]. This implies that this wavelength must be as se-lective as possible, i.e. only the complex must absorbat it. This disadvantage can be solved by recordingthe full spectrum and by analyzing the whole data setwith an appropriate mathematical method.
Several approaches have been proposed for theanalysis of multivariate data, i.e. data recorded atmore than one wavelength, in biophysical and ana-lytical studies. Most of these approaches are basedon the postulation of a chemical model [7,8], i.e.
0003-2670/00/$ – see front matter © 2000 Elsevier Science B.V. All rights reserved.PII: S0003-2670(00)01029-1

106 M. Vives et al. / Analytica Chimica Acta 424 (2000) 105–114
they analyze the experimental data by assuming pre-vious knowledge of the system, like the number ofcomplexes formed during an experiment in interca-lation studies. On the other hand, methods based onfactor analysis do not postulate a chemical model.Instead, they attempt to build the chemical modelfrom experimental data. In a recent study, Ren et al.showed the application of singular value decomposi-tion (SVD) to determine the number of steps in theunfolding of DNA [9]. However, some methods notonly determine the number of species in an exper-iment but also recover both concentration profilesand pure spectra for each of the species involved[10–16]. Multivariate curve resolution based on analternating least squares optimization (MCR-ALS)is based on factor analysis and can be used to an-alyze spectroscopic data on biomolecule equilibriain solution ([17] and references therein). In contrastto SVD and related methods [9–13], MCR-ALS al-lows the mathematical analysis of more than onedata matrix simultaneously, which greatly reducesthe number of solutions inherent to factor analysis.Extension of the traditional univariate melting stud-ies to multivariate data by means of MCR-ALS hasbeen also proposed as a means to recover both quali-tative and quantitative information [18,19]. Recently,we have proposed the application of MCR-ALS forthe study of the interaction equilibria of dyes anddrugs in biomolecules. First, the intercalation equi-libria of ethidium bromide (EtBr) in the syntheticpolynucleotide poly(adenylic)–poly(uridylic) acid(poly(A)–poly(U)) were studied [20]. Job’s and themole-ratio methods were used to study of interactionbetween the polynucleotide and the intercalator usingmultivariate data from UV–VIS absorption, molecularfluorescence and circular dichroism spectroscopies.
Here, the intercalation equilibria between thepolynucleotide poly(inosinic)–poly(cytidylic) (poly(I)–poly(C)) and EtBr are studied as a previous stepbefore later studies of intercalation in natural nu-cleic acids. The stoichiometry, i.e. the number ofapparent binding sites of dye per base pair, ofpoly(I)–poly(C)–EtBr is controversial. Authors pro-pose that the intercalation sites occur every maximumof five base pairs [21], every three base pairs [22] orevery six base pairs [23]. Therefore, it is of interestto study this system and to show it as an example ofthe applicability of the multivariate extension of the
continuous variations and mole-ratio methods to thestudy of the intercalation equilibria of natural nucleicacids. To our knowledge, this is the first application ofa factor-analysis based method which takes advantageof the simultaneous analysis of several matrices for thestudy of intercalation processes in poly(I)–poly(C).
2. Materials and methods
2.1. Reagents and solutions
Poly(I)–poly(C) (sodium salt) and EtBr were pur-chased from Sigma (USA). Solutions were preparedin phosphate buffer, pH 6.8 (0.021 M potassiummonohydrogenphosphate (Carlo Erba, a.r., Italy),0.029 sodium dihydrogenphosphate (Panreac, a.r.,Spain) and 0.15 M sodium chloride (Merck, a.r.,Germany)). The concentration of the polynucleotidesolutions is referred to the concentration of the cyclicmonophosphate nucleotides cIMP and cCMP, whichare the monomeric units in the polynucleotide chains.EtBr and polynucleotide concentrations were ver-ified by UV spectroscopy using molar extinctioncoefficients of ε480=5420 M−1 cm−1 for EtBr, andε266=7420 M−1 cm−1 for poly(I)–poly(C). Thesecoefficients were determined from calibration exper-iments and agreed with the published values [22].Table 1 summarizes the experimental conditions.
2.2. Apparatus
UV–VIS absorption spectra were recorded on aPerkin-Elmer lambda-19 spectrophotometer. Fluores-cence spectra were recorded on an Aminco–Bowmanseries 2 spectrofluorimeter (λex=520 nm, slits: 4/4).Circular dichroism (CD) spectra were recorded on aJasco J-720 spectropolarimeter. Instrumental control,data acquisition and spectra pre-processing were car-ried out using personal computers. pH measurementswere performed with an Orion model 701A pHmeter(with a precision of±0.1 mV) and a combined RosspH electrode (Orion 81-02).
2.3. Procedure
Three separate experiments were carried out at37◦C in the phosphate buffer (Table 1). Experiment

M. Vives et al. / Analytica Chimica Acta 424 (2000) 105–114 107
Table 1Experimental conditions of the experiments performed at 37◦C, neutral pH, KH2PO4 0.021 M, Na2HPO4 0.029 M, and NaCl 0.15 Ma
Experiment Method CEtBr (M) Cpoly (M) pH Number of spectra (Nr)
1 Continuous variation 2.03×10⁻⁵–0 0–2.03×10⁻⁵ 6.88 212 Mole-ratio (constantCEt) 1.52×10⁻⁵ 0–1.62×10⁻⁴ 6.85 213 Mole-ratio (constantCpoly) 0–1.49×10⁻⁵ 2.94×10⁻⁵ 6.80 20
a For each experiment, UV–VIS (220–600 nm, NlUV–VIS=381 wavelengths), molecular fluorescence (530–850 nm, Nlfluor=321 wave-lengths) and CD (210–600 nm, NlDC=391 wavelengths) spectra were recorded;Itotal=0.26 M.
1 was based on the traditional continuous variationsor Job’s method [1], which consists of recordingthe absorbance of a set of solutions with differentpolynucleotide:dye ratios (rpoly:Et), ranging fromχpoly (molar fraction) equal to 0 toχpoly equal to 1.Solutions to measure were prepared from stock so-lutions of poly(I)–poly(C) (4.88×10⁻⁵ M) and EtBr(2.03×10⁻⁵ M). Experiments 2 and 3 were basedon the mole-ratio method, which has been used inthe study of the metal ion–ligand interactions [3].This method is based on monitoring the absorbancechanges of a metal ion solution upon the addition ofa ligand stock solution. In addition, the spectrophoto-metric changes of a EtBr solution upon the additionof known amounts of poly(I)–poly(C) stock solution(experiment 2) or the spectrophotometric changesof a poly(I)–poly(C) solution upon the addition ofknown amounts of EtBr stock solution (experiment 3)were monitored. Concentration of stock solutions forpoly(I)–poly(C) were 1.71×10⁻⁴ and 1.47×10⁻⁴ M,for experiment 2 and 3, respectively. Concentrationof stock solutions for EtBr were 2.03×10⁻⁵ and1.71×10−4 M, for experiment 2 and 3, respectively.The stock solutions were prepared in the phosphatebuffer immediately prior to use. For all the experi-ments, aliquots of these stock solutions were mixedand diluted in the phosphate buffer into 10 ml vol-umetric flasks. Following each addition of EtBr orpolynucleotide, samples were allowed to equilibratein the dark for a minimum of 30 min and then the dif-ferent spectra were obtained. For all the solutions pre-pared in experiments 1–3, all the whole set of UV–VIS(220–600 nm), molecular fluorescence (530–850 nm)and CD (210–600 nm) spectra were recorded.
2.4. Data treatment
UV–VIS, fluorescence and CD data were ana-lyzed with MCR-ALS optimization step, as described
elsewhere [16–20]; only the basic steps are given here(Fig. 1).
2.4.1. Data arrangementThe data from each experiment are collected in a
matrix DDD (Nr×Nl) (see Fig. 2a), whose Nr rows arethe recorded spectra of the different solutions (eachprepared at one polynucleotide:dye ratio according to aprevious experimental design) and Nl is the number ofwavelengths. As there were three types of experimentand three types of spectroscopy, a total of nine datamatrices were obtained.
2.4.2. Determination of number of species (Ns)The second step is the determination of the number
of chemical species (i.e. free polynucleotide, free dyeand/or intercalation complex or complexes) presentin an experiment. The number of species, Ns, is
Fig. 1. Scheme of the MCR-ALS procedure for the analysis ofspectroscopic data. Numbers on the right denote the main steps,as described in Section 2. For more details, see [16–20].

108 M. Vives et al. / Analytica Chimica Acta 424 (2000) 105–114
Fig. 2. Data matrices arrangement: (a) analysis of a single spectroscopic data matrix; (b) simultaneous analysis of several spectroscopicdata matrices corresponding to different spectroscopic techniques and different experiments.
directly related with the number of main componentsor factors in matrixDDD. This number is estimated byrank analysis, using SVD or some related techniquesbased on factor analysis, such as evolving factor anal-ysis (EFA [24]) or pure-variable detection methodslike SIMPLISMA [15]. The rank of the matrix calcu-lated by any of these methods is assumed to be thenumber of chemical species in the system. Sometimes,the estimate of Ns is difficult, especially when theexperimental spectra are similar or the concentrationof components is low.
2.4.3. Initial estimate of the concentration profiles orpurest spectra
Once the number of different species, Ns, is de-termined, an initial estimate of their concentrationprofiles is obtained from EFA plots [24]. An initialestimate of the purest spectra (i.e. the spectrum ofeach species) can also be obtained by application ofSIMPLISMA [15]. Depending on the data structure[25], it is easier to obtain more reliable estimates ofeither concentration profiles or pure spectra.
2.4.4. Alternating least squares constrainedoptimization
In this step, the generalized Beer’s law in ma-trix form is solved iteratively by an alternating leastsquares-based algorithm to obtain the matrix of purespectraSSST (molar absorption coefficients for each
species) and the matrix of species distributionCCC whichbest fit the experimental data matrix,DDD. During theoptimization, some constraints (concentration closure,non-negativity for UV–VIS absorption and fluores-cence data and unimodality) are applied to ensure thatthe final solution is chemically meaningful [17,20]. Inmatrix form, this model can be written as (see Fig. 2a)
DDD = CSCSCST + EEE (1)
whereEEE is the matrix including data not explainedby the chemical species inCCC andSSST, and should beclose to the experimental error. Convergence is usu-ally achieved in few iterations of the ALS regressionprocedure.
2.4.4.1. Analysis of several data matrices simultane-ously with MCR-ALS. The concentration profiles andpure spectra of each species obtained in the analysisof individual data matrices by the MCR-ALS methodcan be different from the theoretical because of pos-sible unresolved underlying factor analysis ambigui-ties [16,20]. This difference depends on data selectiv-ity (i.e. on the presence ofrpoly:Et regions where onlyone species predominates or on the presence of wave-lengths where mostly only one species absorbs) andon local rank conditions (i.e. the degree of overlap ofthe regions where the different species coexist or aresimultaneously absorbing [25]).

M. Vives et al. / Analytica Chimica Acta 424 (2000) 105–114 109
When different data matrices are simultaneously an-alyzed by the MCR-ALS method, the number of pos-sible solutions of Eq. (1) is substantially reduced and,hopefully, converge to a unique solution [16,20,25].The spectrum of the common species in the differentexperiments are expected to be the same. If a par-ticular species does not have response for one spec-troscopy, the corresponding species spectrum shouldbe zero. Beer’s law (bilinear model) is assumed to holdfor the three spectroscopies, UV–VIS absorption, flu-orescence and CD. Here, resolution conditions may beachieved in the simultaneous analysis of the differentspectral data matrices due to the absence of signal insome spectroscopies for some species and because ofthe inherent selectivity for some of the species in thecontinuous variation and mole-ratio methods. Hence,for example, EtBr hardly shows any CD signal, and thesame behavior is observed for the fluorescence signalof poly(I)–poly(C).
The data arrangement used for the final MCR-ALSanalysis is described by Eq. (2) (see Fig. 2b):
DDDvarUV–VIS DDDvar
fluor DDDvarCD
DDDEtUV–VIS DDDEt
fluor DDDEtCD
DDDpolyUV–VIS DDD
polyfluor DDD
polyCD
=
CCCvar
CCCEt
CCCpoly
× [SSST
UV–VIS SSSTfluor SSST
CD
]
+
EvarUV–VIS Evar
fluor EvarCD
EEtUV–VIS EEt
fluor EEtCD
EpolyUV–VIS E
polyfluor E
polyCD
(2)
where the superscript var refers to experiment 1 (con-tinuous variation), superscript Et refers to experiment2 (mole-ratio method at Et concentration constant)and superscript poly refers to experiment 3 (mole-ratiomethod at polynucleotide concentration constant).
The first term is the augmented experimental datamatrix, which contains all the data from the threedifferent experiments and spectroscopies. [CCCvar; CCCEt;CCCpoly] is the data matrix containing the recoveredMCR-ALS concentration profiles for the three ex-periments and [SSSUV–VIS, SSSfluor, SSSCD]T is the datamatrix containing the recovered pure spectra for eachspecies. The last term includes the residual vari-ance. A number of nine individual data matrices aresimultaneously analyzed using Eq. (2). The dimen-
sions of this augmented matrix are (Nrvar+NrEt+Nrpoly)×(NlUV–VIS+Nlfluor+NlDC).
Experimental data obtained in different spectro-scopies were scaled to have similar maximum valueswhen analyzed simultaneously. This data scalinghelps to give similar weight to each spectroscopic set.
The other possible arrays of data matrices are dis-cussed in more detail elsewhere [20].
2.5. Interpretation of MCR-ALS results
The stoichiometry of the polynucleotide:dye com-plex was determined from the MCR-ALS estimatedconcentration profile of the intercalation complex.For the continuous variation method, the stoichiom-etry, rpoly:Et was estimated from the abscissa of themaximum of the concentration profile (χpoly max),calculated by drawing tangents to the initial and fi-nal parts of the profile [1,2]. From the MCR-ALSestimated concentration profiles, it is also possible tocalculate a value of the apparent formation constant(Kapp, Eq. (3)) of the intercalation complex
Kapp = [EtBr–poly complex]
[poly][EtBr](3)
considering the equilibrium
EtBr + poly ↔ EtBr–poly complex
where [EtBr–poly complex], [poly] and [EtBr] are theestimated concentrations for the intercalation com-plex, free poly(I)–poly(C) and free EtBr, respectively,at each point of the concentration profiles. The valuesof logKapp obtained are the mean value of logKapp atthe points where the three species coexist. From thefinally resolved pure spectra, qualitative informationabout the nature of the intercalation complex can alsobe obtained.
3. Results and discussion
Fig. 3 shows the spectroscopic data obtained in theexperiments included in Table 1. Fig. 3a–c show theUV–VIS absorption, fluorescence and CD spectra col-lected from the continuous variation method. Fig. 3d–finclude the UV–VIS, fluorescence and CD spectraobtained from the mole-ratio method keepingCCCEtBr

110 M. Vives et al. / Analytica Chimica Acta 424 (2000) 105–114
Fig. 3. Experimental data matrices. Experiment 1: (a) UV–VIS (data matrixDDDvarUV–VIS); (b) fluorescence (DDDvar
fluor); (c) CD (DDDvarCD). Experiment
2: (d) UV–VIS (DDDEtUV–VIS); (e) fluorescence (DDDEt
fluor); (f) CD (DDDEtCD). Experiment 3: (g) UV–VIS (DDDpoly
UV–VIS); (h) fluorescence (DDDpolyfluor); (i)
CD (DDDpolyCD ).
constant. Finally, Fig. 3g–i show the spectra obtainedfrom the mole-ratio method keepingCCCpoly constant.
UV–VIS absorption spectrum of poly(I)–poly(C) isthe bottom spectrum in Fig. 3a, which shows peaks at245 and 266 nm. UV–VIS spectrum of EtBr (top spec-trum) shows several peaks at 285 and 480 nm. Fromthe UV region of Fig. 3a, it is difficult to deduce theformation of an intercalation complex because of thehigh spectral overlap. The intercalation process is de-tected by changes in the VIS region and in the fluores-cence and CD spectra. First, there is a small shift ofthe VIS band from 480 nm for free EtBr to 485 nm forbound EtBr. The most dramatic change is observed inthe fluorescence spectrum. The intercalation is shown
by an increase in the fluorescence intensity and by ashift of the maximum from 610 nm for free EtBr to600 nm for bound EtBr. In contrast, the CD spectrumof poly(I)–poly(C) hardly is affected by the presenceof EtBr. Only small variations of the signals at 320 and500 nm are observed, as described by other authors[26]. This trend for CD spectra is better observed inFig. 3i, corresponding to the experiment whereCCCpolywas kept constant whileCCCEtBr was increased.
The first step of the procedure was the building upof the data matrix by joining the individual data matri-ces in the way shown in Eq. (2), which is also similarto their graphical arrangement in Fig. 3. According tothe flowchart shown in Fig. 1, the next step was the

M. Vives et al. / Analytica Chimica Acta 424 (2000) 105–114 111
Fig. 4. Evolving factor analysis plot for the UV–VIS, fluorescence and CD data obtained in experiment 1 (continuous variation method).
determination of the number of factors which couldbe related to chemical species. SVD of the augmenteddata matrix reflected that only three main factors wereneeded to explain the whole data matrix. EFA was alsoapplied to each one of the experiments. Fig. 4 showsthe evolution of factors for the UV–VIS, fluorescenceand CD data of experiment 1, showing clearly the pres-ence of only three main factors. These three factorswere related to free poly(I)–poly(C), free EtBr and tothe intercalation complex.
MCR-ALS was then started with an initial esti-mate of the purest spectra for the three species pos-tulated. The initial estimate of the spectrum for freepoly(I)–poly(C) was obtained from the first point ofthe experiment 1, which corresponded to UV–VIS,fluorescence and CD spectra of pure poly(I)–poly(C).Similarly, the initial estimate of the spectrum for freeEtBr was obtained from the last point of experiment1, which corresponded to UV–VIS, fluorescence andCD spectra of pure EtBr. Finally, the initial estimate ofthe spectrum for the intercalation complex was moredifficult to obtain because there was no point in anyexperiment at which the complex was the only species
present in solution. However, data analysis done withSIMPLSIMA showed that the spectrum collected atχpoly∼0.5 in experiment 1 differed most from thespectra of pure EtBr and pure poly(I)–poly(C). Hence,the UV–VIS, fluorescence and CD spectra collected atthat point were taken as the initial estimate of the cor-responding pure spectra of the intercalation complex.
The fourth step shown in Fig. 1 is the ALS con-strained optimization of the initial estimate of thepurest spectra corresponding to free poly(I)–poly(C),free EtBr and the intercalation complex. The concen-trations profiles calculated in that optimization wereconstrained to be positive or zero and to give unimodalprofiles [17]. Moreover, as the total concentration ofpoly(I)–poly(C) and/or EtBr were known in the exper-iments, this information was also included as a closureconstraint for the concentrations profiles.
The concentration profiles recovered with MCR-ALS by the continuous variation method, for themole-ratio method keepingCCCEtBr constant and for themole-ratio method keepingCCCpoly constant are shownin Fig. 5a–c. These three plots correspond to datamatricesCCCvar, CCCEt andCCCpoly, respectively, shown in
112 M. Vives et al. / Analytica Chimica Acta 424 (2000) 105–114
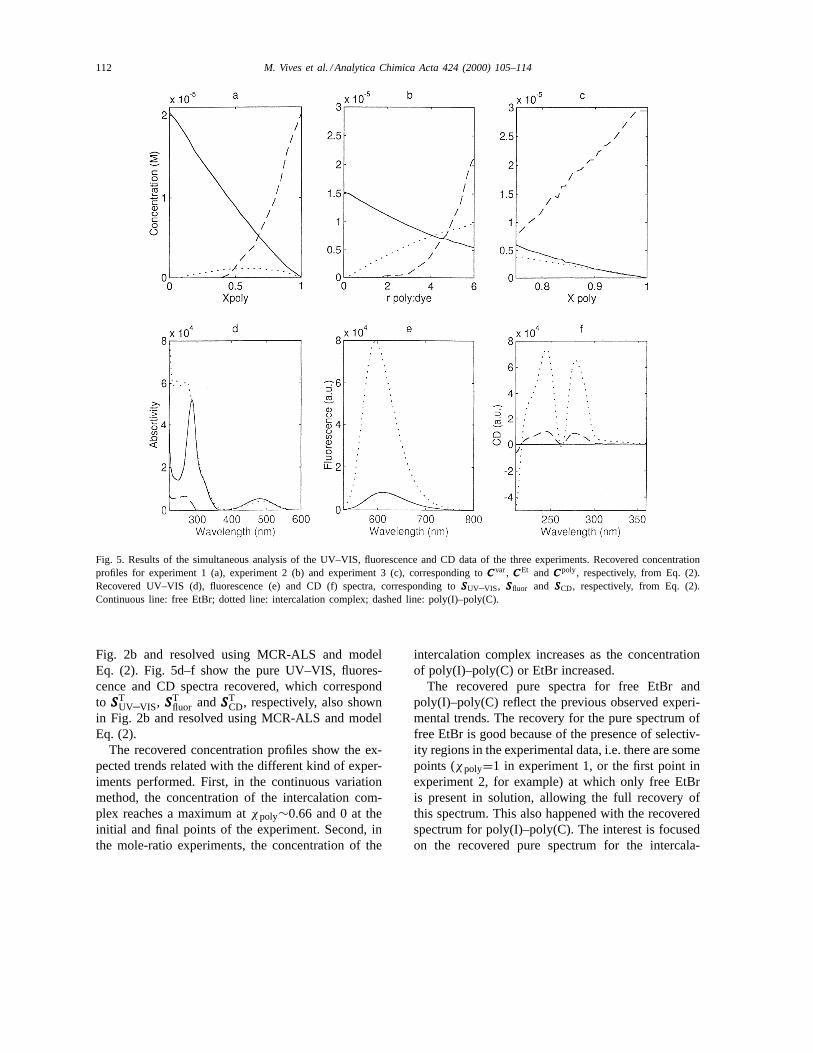
Fig. 5. Results of the simultaneous analysis of the UV–VIS, fluorescence and CD data of the three experiments. Recovered concentrationprofiles for experiment 1 (a), experiment 2 (b) and experiment 3 (c), corresponding toCCCvar, CCCEt and CCCpoly, respectively, from Eq. (2).Recovered UV–VIS (d), fluorescence (e) and CD (f) spectra, corresponding toSSSUV–VIS, SSSfluor and SSSCD, respectively, from Eq. (2).Continuous line: free EtBr; dotted line: intercalation complex; dashed line: poly(I)–poly(C).
Fig. 2b and resolved using MCR-ALS and modelEq. (2). Fig. 5d–f show the pure UV–VIS, fluores-cence and CD spectra recovered, which correspondto SSST
UV–VIS, SSSTfluor andSSST
CD, respectively, also shownin Fig. 2b and resolved using MCR-ALS and modelEq. (2).
The recovered concentration profiles show the ex-pected trends related with the different kind of exper-iments performed. First, in the continuous variationmethod, the concentration of the intercalation com-plex reaches a maximum atχpoly∼0.66 and 0 at theinitial and final points of the experiment. Second, inthe mole-ratio experiments, the concentration of the
intercalation complex increases as the concentrationof poly(I)–poly(C) or EtBr increased.
The recovered pure spectra for free EtBr andpoly(I)–poly(C) reflect the previous observed experi-mental trends. The recovery for the pure spectrum offree EtBr is good because of the presence of selectiv-ity regions in the experimental data, i.e. there are somepoints (χpoly=1 in experiment 1, or the first point inexperiment 2, for example) at which only free EtBris present in solution, allowing the full recovery ofthis spectrum. This also happened with the recoveredspectrum for poly(I)–poly(C). The interest is focusedon the recovered pure spectrum for the intercala-

M. Vives et al. / Analytica Chimica Acta 424 (2000) 105–114 113
tion complex. The UV region of this pure spectrumshould be considered critically because of the highoverlap of the spectra of the three species. In contrast,the VIS region shows a clear shift of the maximumcorresponding to free EtBr from 480 to 490 nm andalso an isosbestic point at 516 nm. There was also adramatic change in the fluorescence spectrum of freeEtBr when poly(I)–poly(C) was added and a shift ofits maximum from 612 to 595 nm. Finally, the CDspectrum of the intercalation complex was very simi-lar to that obtained for the free polynucleotide, exceptfor a higher intensity.
From the recovered concentration profiles a valuefor the logKapp=4.6±0.1 (average and standard de-viation of 20 values) was calculated according toEq. (3). Bresloff and Crothers obtained logKapp be-tween 2.8 and 3.3, depending on the analysis used,at 19◦C in 1 M NaNO3 [22]. This discrepancy canbe due to the different anion used (NO3
− instead ofCl−), which produced a value ofKapp lower. Helft-gott et al. obtained a value for logKapp=4.9 at 20◦C,
Fig. 6. Recovered concentration profile for the intercalation complex in experiment 1 corresponding to Job’s method.
0.1 M NaCl and pH 7, which is similar to the valuereported here [23].
The recovered concentration profile for the inter-calation complex in experiment 1 is shown in Fig. 6.From this plot, the stoichiometry of the complex canbe calculated from the intersection of the two tan-gent lines, which were calculated by least-squaresregression using the first 11 and last six intermediateconcentration values (see Fig. 6). According to thisprocedure,rpoly:Et∼2, i.e. the value for the number ofapparent binding sites of dye per base pair is aboutone in two. This stoichiometry has to be consideredcritically since the concentration of the complex islow. According to Huang et al., in order to estimatea reliable value of the stoichiometry of the com-plex its apparent formation constant should be largerthan 105 [2].
Similarly, a value forrpoly:Et∼3 was obtained fromthe intersection of the two tangent lines to the concen-tration profile of the intercalation complex in experi-ment 2 (Fig. 5b). The final value ofrpoly:Et∼3 agrees

114 M. Vives et al. / Analytica Chimica Acta 424 (2000) 105–114
with the value reported by Bresloff and Crothers [22]at different experimental conditions (one binding siteper three base pairs) and with the results obtained byBabayan et al. [21] who postulated one binding siteper a maximum of five base pairs (0.1 M NaCl, 0.01 MTris, pH 7.5, 25◦C).
The results obtained here are also compared withthose obtained previously for the study of poly(A)–poly(U)–EtBr intercalation equilibria [20]. In thatstudy, spectral changes due to the intercalation processwere stronger than those here observed. First, the max-imum of the VIS spectrum for the poly(A)–poly(U)–Etintercalation complex was located at 510 nm, insteadof 490 nm in the case of poly(I)–poly(C)–Et complex.The shift of the maximum of the fluorescence spec-trum is similar for poly(A)–poly(U)–Et (595 nm) andfor poly(I)–poly(C)–Et (592 nm). Finally, CD spec-tra for both complexes have a similar shape to thatof the CD spectra of the respective polynucleotides,and only small shifts of the peaks and valleys wereobserved. The main difference is the appearanceof a new band at 310 nm in the CD spectrum ofpoly(A)–poly(U)–Et, which is hardly observed in thecase of poly(I)–poly(C)–Et.
On the other hand, the calculated apparent bindingconstant was stronger for poly(A)–poly(U) (logKapp=6.2) than for poly(I)–poly(C) (logKapp=4.6). Finally,the value ofrpoly:Et is also different in both cases(rpoly:Et∼2 for poly(I)–poly(C)–EtBr andrpoly:Et∼4for poly(A)–poly(U)–EtBr). Moreover, the determi-nation of stoichiometry for the poly(A)–poly(U)–Etcomplex was more accurately determined than forpoly(I)–poly(C)–Et complex since its concentrationwas larger.
Acknowledgements
This study was supported by the Ministerio deEducación y Cultura (Grant DGICYT PB96-0377
and UE96-040). M. Vives is grateful to University ofBarcelona for a Ph.D. grant.
References
[1] P. Job, Ann. Chim. 9 (1928) 113.[2] C.Y. Huang, Meth. Enzymol. 87 (1982) 509.[3] J.H. Yoe, A.L. Jones, Anal. Chem. 16 (1944) 111.[4] C.E. Bostock-Smith, M.S. Searle, Nucleic Acids Res. 27
(1999) 1619.[5] M.D. Dutton, R.J. Varhol, D.G. Dixon, Anal. Biochem. 230
(1995) 353.[6] B. Gaugain, J. Barbet, N. Capelle, B.P. Roques, J.B. Le Pecq,
Biochemistry 17 (1978) 5078.[7] A.K. Dioumaev, Biophys. Chem. 67 (1997) 1.[8] D. Toptygin, L. Brand, Anal. Biochem. 224 (1995) 330.[9] J. Ren, X. Qu, J.B. Chaires, J.P. Trempe, S.S. Dignam, J.D.
Dignam, Nucleic Acids Res. 27 (1999) 1985.[10] E.R. Henry, Biophys. J. 72 (1997) 652.[11] D.B. Kim-Shapiro, S.B. King, C.L. Bonifant, C.P. Kolibash,
S.K. Ballas, Biochim. Biophys. Acta 1380 (1998) 64.[12] L. Zimanyi, A. Kulcsar, J.K. Lanyi, D.F. Sears Jr., J. Saltiel,
Proc. Natl. Acad. Sci. USA 96 (1999) 4408.[13] T. Konno, Protein Sci. 7 (1998) 975.[14] D.L. Massart, B.G.M. Vandeginste, L.M.C. Buydens, S. de
Jong, P.J. Lewi, J. Smeyers-Verbeke, 1997. Handbook ofChemometrics and Qualimetrics, Elsevier, Amsterdam.
[15] W. Windig, J. Guilment, Anal. Chem. 63 (1991) 1425.[16] R. Tauler, Chemom. Intel. Lab. Syst. 30 (1995) 133.[17] A. de Juan, A. Izquierdo-Ridorsa, R. Tauler, G. Fonrodona,
E. Casassas, Biophys. J. 73 (1997) 2937.[18] R. Gargallo, R. Tauler, A. Izquierdo-Ridorsa, Anal. Chem.
69 (1997) 1785.[19] R. Gargallo, R. Tauler, A. Izquierdo-Ridorsa, Biopolymers
42 (1997) 271.[20] M. Vives, R. Gargallo, R. Tauler, Anal. Chem. 71 (1999)
4328.[21] Y.S. Babayan, G. Manzini, L.E. Xodo, F. Quadrifoglio, Mol.
Biol. 22 (1987) 898.[22] J.L. Bresloff, M.D. Crothers, Biochemistry 20 (1981)
3547.[23] D.C. Helfgott, N.R. Kallenbach, Nucl. Acids Res. 4 (1979)
1011.[24] M. Maeder, Anal. Chem. 59 (1987) 527.[25] R. Manne, Chemom. Intel. Lab. Syst. 27 (1995) 89.[26] S. Aktipis, W.W. Martz, Biochemistry 13 (1974) 112.