Incremental construction of classifier and discriminant ensembles
Upload
independentCategory
view
0download
0
- 1 -
Multispectral classification of grass weeds and wheat (Triticum durum) crop using 1
linear and nonparametric functional discriminant analysis, and neural networks 2
F. López-Granados*, J. M. Peña-Barragán, M. Jurado-Expósito, M. Francisco-3
Fernández1, R. Cao1, A. Alonso-Betanzos2, O. Fontenla-Romero2 4
Department of Crop Protection, Institute for Sustainable Agriculture, CSIC, P.O. Box 5
4084, 14080-Córdoba, Spain. 6
1 Department of Mathematics, Campus de Elviña, Nº 5, La Coruña, 15071, La Coruña, 7
Spain. 8
2 Department of Computer Science, Campus de Elviña, Nº 5, La Coruña, 15071, La 9
Coruña, Spain. 10
* Corresponding author. 11
Abstract 12
Field research was conducted to determine the potential of multispectral 13
classification of late-season grass weeds in wheat. Several classification techniques 14
have been used to discriminate differences in reflectance between wheat, and wild oat, 15
canarygrass, ryegrass and rabbit foot in the 400-900 nm spectrum, and to evaluate the 16
accuracy performance for a spectral signature classification into the plant species or 17
group to which it belongs. Fisher linear discriminant analysis, nonparametric functional 18
discriminant analysis and several neural networks have been applied, either with a 19
preliminary principal component analysis or not and in different scenarios. Fisher linear 20
discriminant analysis, feedforward neural netwroks and one-layer neural network, aal of 21
them with a principal component analysis, showed classification percentages of between 22
90% and 100%. Generally, a preliminary computation of the most relevant principal 23
components considerably improves the correct classification percentage. These results 24
are promising because wild oat and ryegrass, two of the most problematic, clearly 25
Manuscript
- 2 -
patchy and expensive to control weeds in wheat, could be successfully discriminated 1
from wheat in the 400-900 nm range. Our results suggest that mapping grass weed 2
patches in wheat is feasible with high-resolution satellite imagery acquired in mid-May 3
under our conditions. 4
Keywords: wild oat (Avena sterilis L.), canarygrass (Phalaris brachystachis Link), 5
ryegrass, (Lolium rigidum Gaudin), wheat (Triticum durum L. cultivar Mexicali), rabbit 6
foot (Polypogon monspeliensis L. Desf.). 7
1. Introduction 8
Wheat is the most important winter cereal crop in Spain, with over 5 M ha 9
grown annually (Anonymous, 2004). Wild oat (Avena sterilis L.), canarygrass (Phalaris 10
brachystachis Link) and ryegrass (Lolium rigidum Gaudin) are the most common grass 11
weeds in cereal crops and have been found in 65%, 34% and 32% of the arable fields in 12
southern Spain, respectively (Saavedra et al., 1989). Recently, the spreading of rabbit 13
foot (Polypogon monspeliensis L. Desf.) in wheat is increasing due to it being a grass 14
weed usually associated with rice and this is being included in crop rotation in southern 15
Spain. The patchy distribution of wild oat and ryegrass in winter cereals has already 16
been demonstrated (Barroso et al., 2004b; Blanco-Moreno et al., 2006a, 2006b). One of 17
the main implications of a spatially aggregated pattern is to reduce the herbicide 18
application only to the patches with a weed density which is higher than the economic 19
threshold (Jurado-Expósito et al., 2003b; Francisco-Fernández et al., 2006), which is 20
one of the main principles of site-specific weed management (SSWM). The economic 21
benefits of the patch spraying of broad-leaved and grass weeds in winter cereals 22
(Timmermann et al., 2003), and of wild oat in winter barley (Barroso et al., 2004a; Ruiz 23
et al., 2006) have supported the feasibility of using SSWM to control worldwide weeds. 24
A key component of SSWM is that accurate, appropriate and timely weed maps are 25

- 3 -
required to take full advantage of site-specific herbicide applications. Rew and Cousens 1
(2001) reviewed discrete and continuous sampling and concluded that mapping weed 2
patches based on ground survey techniques (discrete sampling) is time consuming and 3
expensive on a large scale. They also argued that continuous sampling, such as remote 4
sensing, is more appropriate and cost-effective for SSWM. Remote sensing data can 5
come from ground-based sensors mounted on field equipment, aerial or satellite 6
platforms. The importance of remote sensing in SSWM has been reviewed by 7
Andreasen et al. (1997), Brown and Noble (2005), Felton et al. (2002), Radhakrishnan 8
et al. (2002), Thorp and Tian (2004), Yang et al. (2000). Detection of late-season weed 9
infestation with aerial remote sensing has tremendous possibilities when spectral 10
differences between crops and weeds prevail, and before crop and weeds are turning 11
yellow in colour at the same time (Koger et al., 2003; López-Granados et al., 2006). 12
Taking into account that wild oat (Barroso et al ., 2004b) and other weed infestations 13
can be relatively stable from year to year (Jurado-Expósito et al., 2004; Wilson and 14
Brain, 1991), late-season weed detection maps can be used to design site-specific 15
control methods in the coming years. 16
Girma et al. (2005) studied optical spectral signatures of cheat (Bromus 17
secalinus L.) and ryegrass under greenhouse conditions; however, it would be necessary 18
to explore whether spectral identification is robust under field conditions. López-19
Granados et al. (2006) studied multispectral bands and aerial photographs for 20
discriminating wheat and wild oat, canarygrass and ryegrass, showing significant 21
differences through the visible and near-infrared wavebands at late-season. However, 22
one of the keys to establishing SSWM is, not only to detect significant differences, but 23
also to develop an algorithm that can successfully classify crops and weeds, i.e., to 24
classify a spectrum into the specific group or species to which it belongs. Analysis of 25
- 4 -
variance has been used for spectral discrimination of corn caraway (Ridolfia segetum 1
Moris.) and other weeds in sunflower, and several multivariate methods and artificial 2
neural networks (ANNs) have also been investigated for image recognition or spectral 3
classification of crop and different weed species (Borregaard et al., 2000; Goel et al., 4
2003; Jurado-Expósito et al., 2003a; Kavdir, 2004; Peña-Barragán et al., 2006; Yang et 5
al., 2000; 2002). However, some works support the idea that SSWM does not require 6
differentiation between weed species, but rather between crops and monocot and dicot 7
weeds for reducing nontarget spraying (Gibson et al., 2004; Thorp and Tian, 2004). No 8
information has been found about applications of ANN and other multivariate analyses 9
for classifying grass weeds in winter wheat under field conditions. 10
If we consider that wild oat can be controlled with specific and expensive 11
herbicides, and ryegrass has been reported as one of the weed species to have evolved 12
resistance to several herbicides (Wakelin and Preston, 2006; Broster and Pratley, 2006), 13
this could justify the interest in discriminating these most problematic grass weed 14
species to reduce herbicide use and cost, or to plan a specific application for herbicide 15
resistant ryegrass. Thus, it is crucial to explore the potential for identifying variations in 16
the spectral signatures of the plant species studied, indicating the wavelengths suitable 17
for species discrimination and classification. 18
The objectives of this research were: 1) to evaluate the potential of classic 19
methods of discriminant analysis, as well as more recent algorithms for the 20
classification of wheat, wild oat, canarygrass, ryegrass, rabbit foot and soil on the basis 21
of multispectral data in the visible and near-infrared domain, and 2) to compare the 22
accuracy performance for a spectrum classification into the plant species or group to 23
which it belongs. Six methods were applied: Fisher Linear Discriminant analysis 24
without (FLDA) and with (FLDA-PCA) principal components analysis, Nonparametric 25

- 5 -
Functional Discriminant Analysis (NPFDA), Feedforward Neural Networks without 1
(FFNN) and with (FFNN-PCA) principal components analysis, and one-Layer Neural 2
Network with principal components analysis (1LNN-PCA). 3
2. Material and methods 4
2.1. Study site and spectral readings 5
The study was conducted in Andalusia, southern Spain, in Santa Cruz (25.6 ha, 6
UTM coordinates 361,076 E, 4,185,313 N) and in Los Palacios (12.3 ha, UTM 7
coordinates 241,290 E, 4,124,063 N). Winter wheat crop was planted mid-November, 8
harvested at the beginning of June. Consistent natural weed infestations were made up 9
of wild oat, canarygrass, ryegrass and rabbit foot in both locations. In mid-May, wheat 10
plants were at an advanced senescent stage, and yellowing, whereas wild oat, 11
canarygrass, ryegrass and rabbit foot were at an advanced seed maturation stage, and 12
still partly green. 13
The spectral signatures of weed-free wheat, grass weed species patches and soil 14
were taken on May 16, 2004 in Santa Cruz and on May 13, 2005 in Los Palacios. Each 15
weed species patch had about 20-25 spikes/ panicles per m2. Twenty measurements 16
were collected for each plant species and soil, respectively, using an ASD HandHeld 17
FieldSpec Spectroradiometer (Analytical Spectral Devices, Inc., 5335 Sterling Drive, 18
Boulder, CO 80301, USA) placed at 60-80 cm above each plant species canopy. The 19
spectral data were converted into reflectance, which is the ratio of energy reflected off 20
the target to the energy incident on the target, with reference to a standard reflectance 21
panel (Spectralon) before and immediately after each measurement. Spectroradiometer 22
readings were taken under sunny conditions between 12 and 14 h (Salisbury, 1999), 23
using a 25º field-of-view optic, measuring an area of about 0.15 to 0.20 m2. Spectral 24
measurements were collected between 325 and 1075 nm with a bandwidth of 1.5 nm, 25

- 6 -
although the reflectance spectra were very noisy at the extremes of the spectral range 1
and only the measurements between 400 and 900 nm were analyzed. 2
The spectral measurements of wheat, weeds and soil were averaged to express 100-3
nm-wide measurements between 400 and 900 nm to represent similar multispectral 4
broad wavebands (blue, B: 400-500 nm; green, G: 501-600 nm; red, R: 601-700 nm; 5
and near-infrared, NIR: 701-900 nm) available on commercial satellites with high 6
spatial resolution. 7
2.2. Classification techniques 8
A classic discriminant analysis (Anderson, 2003), nonparametric functional 9
discriminant analysis (Ferraty and Vieu, 2006) and neural networks (Bishop, 1995) 10
were applied to construct a classification rule to discriminate between crop, grass weed 11
species or group of weeds, and soil, based on a sample of 120 spectral curves. Four 12
scenarios or classification sets were considered: 1) crop; wild oat; canarygrass; ryegrass; 13
rabbit foot; and soil, 2) crop; grass weeds; and soil, 3) crop; wild oat; the remaining 14
grass weeds; and soil, and 4) crop; wild oat-canarygrass-rabbit foot; ryegrass; and soil. 15
Thus, a spectrum was classified as belonging to the species or group to which it 16
achieved the highest subsequent probability. 17
Fisher linear discrimination analysis was used either without (FLDA) or with 18
PCA (FLDA-PCA) using SPSS software (SPSS 11.0, Inc 2002, Microsoft©). Different 19
numbers of principal components were tried, and the best results were obtained with the 20
first 31. With PCA, the covariance matrix was used to concentrate the variables onto 21
fewer orthogonal latent variables principal components (Borregaard et al. 2000). The 22
NPFDA rule was performed using a functional Nadaraya-Watson estimator with a 23
quartic kernel. The smoothing parameter was selected according to the cross-validation 24

- 7 -
method (Naya et al. 2004). After a careful examination of the spectral curves in Figure 1
1, the following seminorm was considered for standardizing the data: 2
( ) ( )( )2
( , ) ,b
ad f g f x g x dx= −∫ 3
where a and b were the intervals of wavebands (nm) considered in each classification, 4
these being [400-900], [400-500], [501-600], [601-700], [701-900] and [400-700], 5
and where 6
( ) ( ) ,f x f xα β= + 7
with 8
( ) ( )21b b
a a
b a
f t f s ds dtb a
α −= − − ∫ ∫
9
and 10
( )
( ) ( )2
11
b
a
b b
a a
f t dt
b a f t f s ds dtb a
β = − − − −
∫
∫ ∫ 11
This location-scale transformation is performed in order for the “mean” and the 12
“variance” of the transformed spectral curves to be equal to one, that is, 13
( )11
b
af t dt
b a=
− ∫ and ( ) ( )21 1
1b b
a af t f s ds dt
b a b a − = − − ∫ ∫ . The integrals appearing 14
in the previous discrepancy measures have been approximated numerically over the 25 15
nm equidistant waveband grid. 16
In addition, two neural network approaches were implemented. The first was a 17
feedforward neural network (Bishop, 1995), which was applied with (FFNN-PCA) and 18
without (FFNN) a principal component analysis pre-processing stage. A FFNN is a 19
general framework for representing nonlinear functional mappings between a set of 20

- 8 -
input and a set of output variables. This is achieved by representing the nonlinear 1
function of many variables in terms of a set of neurons, arranged in a topology 2
composed of several layers, which contain nonlinear functions of a single variable 3
called activation functions. Specifically, in this work, a two-layer neural network was 4
used, containing one hidden and one output layer. More hidden layers could be included 5
in the network, but this was not necessary because several authors demonstrated that 6
that kind of system, with a unique hidden layer and a sufficient number of neurons, can 7
approximate any continuous-differentiable function (Cybenko, 1989; Hornik, 1991). In 8
this research, one hidden layer of 7 neurons and one output layer, containing as many 9
neurons as classes to be detected, were used. The activation function employed was the 10
logistic function for all the neurons in the network. In addition, a Bayesian framework 11
(McKay, 1992) was used as the supervised learning method to train both neural 12
networks. In order to obtain optimum weights, the UCMINF method (Nielsen, 2000), 13
which is based on a Quasi-Newton optimization algorithm with a soft line search and a 14
BFGS (Broyden, Feltcher, Goldfarb, Shanno) updating of the inverse Hessian, was 15
employed, since it performs well in classification problems like the one described in this 16
article. Both, FFNN and FFNN-PCA were subjected to 100 training cycles. 17
The second neural network approach consisted of 1LNN, which is a FFNN with 18
no hidden layers and trained using a linear equation system proposed in Castillo et al. 19
(2002). An important advantage of this second implementation is that it obtains the 20
global optimal solution of the network in only one step, instead of using an iterative 21
learning process. Thus, another achievement is that, consequently, the computational 22
time required was drastically reduced. This last approach was also implemented with a 23
PCA pre-processing stage (1LNN-PCA). Each method was validated through cross-24
validation, which is the technique widely used for the validation of an empirical model. 25

- 9 -
It works by leaving out one spectrum; then a model is trained with the remaining spectra 1
and, finally, the developed model is used for the classification of the left out spectrum. 2
This is repeated until all the spectra have been left out once (Borregaard et al., 2000). 3
As the data set available contained 120 samples, 119 samples were used for training and 4
1 sample for testing. This process was repeated 120 times, and the percentage of correct 5
classification was calculated. The MATLAB software, developed by The MathWorks 6
(MathWorks, 2007), was used to implement all the algorithms described above. 7
The algorithm called NPFDA-grass weeds implementing the NPFDA method is 8
available at http://www.udc.es/dep/mate/Dpto_Matematicas/Investigacion/ie/ie_eng.htm. 9
The neural network algorithms are available at 10
http://www.dc.fi.udc.es/lidia/downloads/LLM/. 11
3. Results 12
The overall shape of reflectance curves for canarygrass, rabbit foot and ryegrass 13
were similar and exhibited the characteristics peak at 550 nm (G) and the highest 14
reflectance in the range 750 to 900 nm (NIR) of the green vegetation (Figure 2). This 15
demonstrated that three grass species still were in an active living phase. Wild oat 16
showed a spectral signature similar to those of canary grass, rabbit foot and ryegrass in 17
NIR regions, but with reflectance values of 20%, indicating that wild oat was in an 18
intermediate stage of desiccation between and the other three grass weeds. Wheat 19
reflectance curve steadily increased as wavelength increased without the green peak for 20
photosynthetically active vegetation near 550 nm and in NIR spectral window, 21
indicating that wheat plants were at a more advanced desiccation stage. Soil presented 22
its characteristics spectral signature and reflectance increased as wavelengths increased. 23
The correct classification percentage was 100% for FLDA-PCA, FFNN-PCA 24
and 1LNN-PCA, when individual species and soil were included in the classification set 25

- 10 -
for the interval [400-900 nm] (Table 1a). This was the most difficult, but also 1
challenging approach (Coussans, 1995). Models with no principal component analysis, 2
i.e., FLDA, NPFDA and FFNN did not perform well, showing success rates from 3
77.78% to 86.11%, FLDA being the worst, mis-classifying 42.59% of spectra (57.41% 4
success rate) in the green waveband. Only in 16 of the total classifications there was a 5
correct performance higher than 90%. Generally, the percentage of discriminating wheat 6
from weeds and soil performed better than that for individual species, showing a 7
success percentage of over 75.93% (Table 2a). Thus, in 27 of the total classifications, 8
the classification percentage was higher than 90%; although a 100% classification was 9
only achieved applying FFNN-PCA. According to Yang et al. (2002), this higher 10
classification percentage when the classification set was reduced to three groups, may 11
be due to the fact that, with four weed species grouped in one class, there are many 12
more weed spectra than wheat spectra in the training process. Discrimination between 13
crop, weeds and soil into three groups was also useful, assuming that all these grass 14
weeds were present in the field and could be controlled by a given herbicide treatment 15
(Borregaard et al., 2000). 16
Table 3a shows the classification percentages between wheat, wild oat, the rest 17
of grass weeds and soil, this being of interest in cases in which the precise recognition 18
of wild oat from the rest of grass weeds is important, such as when a selective herbicide 19
only against wild oat has to be applied. Again, FFNN-PCA, and in this case together 20
with FLDA-PCA, exhibited a 100% classification in the interval [400-900 nm].Table 4a 21
shows the successful classification percentage in four groups, i.e., between wheat, wild 22
oat-canarygrass-rabbit foot, ryegrass and soil, of use where the correct recognition of 23
ryegrass from the rest of grass weeds was necessary, so that a selective herbicide against 24
ryegrass, or against herbicide-resistant-ryegrass had to be applied. Highest performance 25

- 11 -
(higher than 98%) was achieved for FLDA-PCA, FFNN-PCA and 1LNN-PCA 1
methods. 2
The classification matrices for cross-validation corresponding to every 3
classification set with classification percentages lower than 100% in the whole interval 4
[400-900 nm] are shown in Tables 1b, 2b, 3b and 4b. The values in the tables provide 5
the percentage of both correctly classified and misclassified classes for each 6
classification set into the nearest category. Generally speaking, wild oat was usually 7
misclassified as wheat crop, canarygrass as ryegrass, and rabbit foot as wild oat or 8
canarygrass (Table 1b). Soil was correctly classified in any method except for FLDA 9
and FFNN, where soil spectra were classified as grass weeds in Table 2b and 4b, 10
respectively. 11
4. Discussion 12
The classification percentages were higher when the visible and near-infrared 13
wavelengths (400-900 nm) were considered than when only the visible spectral window 14
(400-700 nm) was studied. Smith and Blackshawn (2003) suggested that, regardless of 15
the input samples, wavelengths in the NIR domain are always selected as being 16
important for plant species discrimination. The results of the four classification sets 17
showed that highest correct performance was achieved with a pre-processing stage with 18
a principal components analysis. This is due to the PCA reducing the data set 19
dimensionality to an optimal level, and thus introducing a new set of meaningful 20
variables (Johnson, 1998). The classic FLDA-PCA method gave the best classification 21
in any of the assumptions, followed closely by 1LNN-PCA. Both of them exhibited 22
correct classification percentages in the range of 90%-100% for the different scenarios. 23
The correct classification was typically higher with linear classification techniques 24
(FLDA-PCA and 1LNN-PCA) than with nonparametric ones (NPFDA, FFNN, FFNN-25
- 12 -
PCA). The main explanation is that the high dimensionality of the data set (each 1
spectral curve was considered as a 101-dimensional vector) implies a poor performance 2
of nonparametric methods (course of dimensionality) and benefits from the dimension 3
reduction. Another factor affecting this performance is the reduced number of samples 4
available on the data set. If more samples or spectra become available in the future, the 5
performance of non-linear methods would probably improve (Bishop, 1995). 6
Our research can not clarify why one method performed better than the other as 7
they are based on different principles. Karimi et al. (2005) tested three classification 8
models for distinguishing weeds at different growth stages and nitrogen treatments, and 9
found that a classic discriminant analysis performed better than ANNs for the earlier 10
phenological stages. They concluded that it was clear that different classification 11
methods should be tried out for a given situation to determine the most accurate method. 12
In our case, it was important to consider both, i.e. that the FLDA-PCA and 1LNN-PCA 13
models showed a nearly similar and high classification performance, and that the 14
additional computational requirements for 1LNN-PCA were not much higher because 15
no iterative learning process was applied. Thus, the criteria for the selection of FLDA-16
PCA or 1LNN-PCA models as the best classification methods compared with the others 17
should be based on the improvement achieved in performance accuracy and decreasing 18
their computational requirements and complexity. 19
Once FLDA-PCA, FFNN-PCA and 1LNN-PCA have shown themselves to 20
successfully classify wheat, wild oat, canarygrass, ryegrass, rabbit foot and soil spectra, 21
the next investigation could address to explore the potential of QuickBird satellite 22
imagery for mapping grass weed patches in large areas (of at least over 64 km²). 23
Barroso et al. (2004a) and Blanco et al. (2006b), applying geostatistical techniques, 24
demonstrated that the extension of wild oat patches and ryegrass in wheat was around 25

- 13 -
50 m and 20 m, respectively. According to these results, the spectral classification 1
herein presented, and taking into account that QuickBird provides four channels (B, G, 2
R and NIR) of multispectral wavebands with 2.4 m of spatial resolution, it would 3
apparently be possible to successfully map this weed on a large surface. QuickBird has 4
already been seen to be a useful data source which accurately determines ecological, 5
agronomic and forest variables such as salt-marsh vegetation (Belluco et al., 2006), 6
invasive plant species (Tsai et al., 2006), sorghum yield (Yang et al., 2006), rangeland 7
resources (Everitt et al., 2006) or insect attack damage in pine (Coops et al., 2006) . 8
Recent interest in weed remote sensing has increased the need to use 9
documented weed spectral libraries, whose information can provide inputs to canopy 10
radiation models (Verhoef, 1984) and can help to determine which sensors are able to 11
detect a given weed species by maximizing the detection cost according to the spatial 12
and spectral resolutions of each sensor (Hunt et al., 2004). Our study could be a guide 13
for creating a spectral library of wheat and the most important weeds associated with 14
this crop at a late growth stage. The usefulness of the multi-species classification 15
obtained is amply justified because this is usually the real aim of field infestation in 16
many of the cereal crops under our conditions, and because wild oat, canarygrass and 17
ryegrass could require a completely different control action. This strategy would prevent 18
any further spread, especially for hard-to-control herbicide-resistant-ryegrass, and 19
would allow an herbicide selection based on spectral characterization. This would 20
finally improve the decision-making process, which is the ultimate goal of SSWM. 21
5. Conclusions 22
Our results demonstrated that FLDA-PCA, FFNN-PCA and 1LNN-PCA can 23
successfully classify wheat crop, several grass weeds and soil. In addition, classify a 24
spectrum into the specific group or species to which it belongs using spectra sampled 25

- 14 -
under field conditions in mid-May. Both methods exhibited correct classification 1
percentages in the 90%-100% range for the different classification sets. The 2
classification percentage was higher for linear classification techniques (FLDA-PCA 3
and 1LNN-PCA) than for non-parametric ones (NPFDA, FNN, FFNN-PCA) in any of 4
the scenarios tested. In general, preliminary computation of the most relevant principal 5
components considerably improves the correct classification percentage in all methods. 6
Acknowledgements 7
This research was partially funded by the Spanish Ministry of Education and 8
Science through the projects MTM2005-00429 and AGL2005-06180-CO3-02, and by 9
the Xunta de Galicia by the project PGIDT05TIC10502PR. The research of Dr. M. 10
Jurado-Expósito was supported by the Ramón y Cajal Spanish Program. 11
References 12
Anderson, T.W., 2003. An Introduction to Multivariate Statistical Analysis. 3rd ed. 13
John Wiley & Sons, New York. 14
Anonymous, 2004. Spanish Ministry of Agriculture, Fisheries and Food, 15
www.mapya.es/es/estadistica 16
Andreasen, C., Rudemo, M., Sevestre, S., 1997. Assessment of weed density at an early 17
stage by use of image processing. Weed Res. 37, 5-18. 18
Barroso, J., Fernández-Quintanilla, C., Ruiz, D., Hernaiz, P., Rew, L., 2004a. Spatial 19
stability of Avena sterilis ssp. ludoviciana under annual applications of low rates 20
of imazamethabenz. Weed Res. 44, 178-186. 21
Barroso, J., Fernández-Quintanilla, C., Maxwell, B.D., Rew, L., 2004b. Simulating the 22
effects of spatial weed pattern and resolution of mapping and spraying on 23
economics of site-specific management. Weed Res. 44, 460-468. 24

- 15 -
Belluco, E., Camuffo, M., Ferrari, S., Modenese, L., Silvestre, S., Marani, A., Marani, 1
M., 2006. Mapping salt-marsh vegetation by multispectral and hyperspectral 2
remote sensing. Rem Sens Environ. 105, 54-67. 3
Bishop, C. M., 1995. Neural Networks for Pattern Recognition. 12th ed. Oxford 4
University Press. New York. 5
Blanco-Moreno, J.M., Chamorro, L., Masalles, R.M., Recasens, J., 2006a. Spatial 6
distribution of Lolium rigidum seedlings following seed dispersal by combine 7
harvesters. Weed Res. 44, 375-387. 8
Blanco-Moreno, J.M., Chamorro, L., Sans, X., 2006b. Spatial and temporal patterns of 9
Lolium rigidum-Avena sterilis mixed populations in a cereal field. Weed Res. 10
46, 207-218. 11
Borregaard, T., Nielsen, H., Nørgaards, L., Have, H., 2000. Crop-weed discrimination 12
by line imaging spectroscopy. Journal Agr Eng Res. 75, 389-400. 13
Broster, J.C., Pratley, J.E., 2006. A decade of monitoring herbicide resistance in Lolium 14
rigidum in Australia. Australian J Exp Agr. 46, 1151-1160. 15
Brown, R.B., Noble, S.D., 2005. Site-specific weed management: sensing requirements 16
- what do we need to see?. Weed Sci. 53, 252-258. 17
Castillo, E., Fontenla-Romero, O., Guijarro-Berdiñas, B., Alonso-Betanzos, A., 2002. A 18
global optimum approach for one-layer neural networks. Neural Comput. 19
14,1429-1449. 20
Coops, N.C., Johnson, M., Wulder, M.A., White, J.C., 2006. Assessment of QuickBird 21
high spectial resolution imagery to detect red attack damage due to mountain 22
pine beetle infestation. Rem Sens Environ. 103, 67-80. 23
Coussans, G., 1995. Machine vision for weed identification. Informal Weed Detection 24
Workshop, Silsoe Research Institute, Bedford, UK. 25
- 16 -
Cybenko, G., 1989. Aproximation by Superposition of a Sigmoidal Function. 1
Mathematics of Control, Signals, Systems. 2, 303-314. 2
Everitt, J.H. Yang, C., Fletcher, R.S., Drawe, D.L., 2006. Evaluation of high-resolution 3
satellite imagery for assessing rangeland resources in South Texas. Rangeland 4
Ecol Manag. 59, 30-37. 5
Felton, W.L., Alston, C.L., Haigh, C.B.M., Nash, P.G., Wicks, G.A., Hanson, G.E., 6
2002. Using reflectance sensors in agronomy and weed science. Weed Technol. 7
16, 520-527. 8
Ferraty, F., Vieu, P., 2006. Nonparametric Functional Data Analysis. Theory and 9
Practice. Springer-Verlag. New York. 10
Francisco-Fernández, M., Jurado-Expósito, M., Opsomer, J.D., López-Granados, F., 11
2006. A nonparametric analysis of the spatial distribution of Convolvulus 12
arvensis in wheat-sunflower rotations. Environmetrics 17, 1-12. 13
Gibson, K.D., Dirks, R., Medlin, C.R., Johnston, L., 2004. Detection of weed species in 14
soybean using multispectral digital images. Weed Technol. 18, 742-749. 15
Girma, K.J., Mosali, J., Raun, W.R., Freeman, K.W., Martin, K.L., Solie, J.B., Stone, 16
M.L., 2005. Identification of optical spectral signatures for detecting cheat and 17
ryegrass in winter wheat. Crop Sci. 45: 477-485. 18
Goel, P.K., Prasher, S.O., Patel, R.M., Landry, J.A., Bonnel, R.B., Viau, A.A., 2003. 19
Classification of hyperspectral data by decision trees and artificial neural 20
networks to identify weed stress and nitrogen status of corn. Comput Electron 21
Agr. 39, 67-93. 22
Hornik, K. 1991. Approximation Capabilities of Multilayer Feedforward Networks. 23
Neural Networks. 4, 251-257. 24

- 17 -
Hunt, E.R., Mcmurtrey, J.E., Parker Williams A.E., Corp, L.A., 2004. Spectral 1
characteristic of leafy spurge (Euphorbia esula) leaves and flower bracts. Weed 2
Sci. 51, 492-497. 3
Johnson, D.E., 1998. Applied multivariate methods for data analysis. Pacific Grove, 4
Cal.: Brooks/Cole Publishing. 5
Jurado-Expósito, M., López-Granados, F., Atenciano, S., García-Torres, L., González-6
Andújar, J.L., 2003a. Discrimination of weed seedlings, wheat (Triticum 7
aestivum) stubble and sunflower (Helianthus annnuus) by near-infrared 8
reflectance spectroscopy (NIRS). Crop Prot. 22, 1177-1180. 9
Jurado-Expósito, M., López-Granados, F., García-Torres, L., García-Ferrer, A., Sánchez 10
de la Orden, M., Atenciano, S., 2003b. Multi-species weed spatial variability and 11
site-specific management maps in cultivated sunflower. Weed Sci. 51, 319-328. 12
Jurado-Expósito, M., López-Granados, F., González-Andujar, J.L., García-Torres, L., 13
2004. Characterizing population growth rate of Convolvulus arvensis in wheat-14
sunflower no-tillage systems. Crop Sci. 45, 2106-2112. 15
Karimi, Y., Prasher, S.O., McNaim, H., Bonnell, R.B., Dutilleul, P., Goel, P.K., 2005. 16
Classification accuracy of discriminant analysis, neural networks and decision 17
trees for weed and nitrogen stress detection in corn. T. of the ASAE. 48, 1261-18
1268. 19
Kavdir, I., 2004. Discrimination of sunflower, weed and soil by artificial neural 20
network. Comput Electron Agr. 44, 153-160. 21
Koger, H.K., Shaw, D.R., Watson, C.E., Reddy, K.N., 2003. Detecting late-season weed 22
infestations in soybean (Glycine max). Weed Technol. 17, 696-704. 23

- 18 -
López-Granados, F., Jurado-Expósito, M., Peña-Barragán, J.M., García-Torres, L., 1
2006. Using remote sensing for identification of late season grass weed patches 2
in wheat. Weed Sci. 54, 346-353. 3
McKay, D.J.C., 1992. A practical bayesian framework for backprop networks. Neural 4
Comput 4, 448-472. 5
MathWorks, 2007. The MathWorks – MATLAB and Simulink for Technical 6
Computing. www.mathworks.com. Last access: 02/02/2007. 7
Naya, S., Cao, R., Artiaga, R., 2004. Nonparametric regression with functional data for 8
polymer classification. In: Antoch, Jaromir (Ed.), Compstat 2004-Proceedings in 9
Computational Statistics, August 23-27, Prague (Czech Republic). 1569-1576. 10
Physica-Verlag. 11
Nielsen, H., 2000. UCMINF-An algorithm to unconstrained nonlinear optimization. 12
Technical Report IMM-Rep-2000-0019. Department of Mathematical 13
Modelling. Technical University of Denmark. 14
Peña-Barragán, J.M., López-Granados, F., Jurado-Expósito, M., García-Torres, L., 15
2006. Spectral discrimination of Ridolfia segetum and sunflower as affected by 16
phenological stages. Weed Res. 46, 10-21. 17
Radhakrishnan, J,S., Liang, J., Teasdale, R., Shuey, C.J., 2002. Remote sensing of weed 18
canopies. In: R.S., Muttiah (Ed.), From laboratory spectroscopy to remotely 19
sensed spectra of terrestrial ecosystems, Kluwer Academic Publishers, The 20
Netherlands, pp. 175-202. 21
Rew, L.J., Cousens, R.D., 2001. Spatial distribution of weeds in arable crops: are 22
current samplings and analytical methods appropriate?. Weed Res. 41, 1-18. 23

- 19 -
Ruiz, D., Escribano, C., Fernández-Quintanilla, C., 2006. Assessing the opportunuity 1
for site-spceific management of Avena sterilis in winter barley fields in Spain. 2
Weed Res. 46, 379-387. 3
Saavedra, M., Cuevas, J., Mesa-García, J., García-Torres, L., 1989. Grassy weeds in 4
winter cereals in southern Spain. Crop Prot. 8, 181-187 5
Salisbury, J.W., 1999. Spectral measurements field guide. Published by Defense 6
Technology Information Center as Report No. ADA362372. 7
Smith, A.M., Blackshawn, R.E., 2003. Weed-crop discrimination using remote sensing: 8
a detached leaf experiment. Weed Technol. 17, 811-820. 9
Timmermann, C., Gerhards, R., Kuehbauch, W., 2003. The economic impact of the site 10
specific weed control. Precision Agric. 4, 241-252. 11
Thorp, K.R., Tian, L.F., 2004. A review of remote sensing of weeds in agriculture. 12
Precision Agric. 5, 477-508. 13
Tsai, F., Chou, M.J., 2006. Texture augmented analysis of high resolution satellite 14
imagery in detecting invasive plant species. J. Chinese Institute of Eng. 29, 581-15
592. 16
Verhoef, W., 1984. Light scattering by leaf layers with application to canopy reflectance 17
modelling: the SAIL model. Rem Sens Environ. 16, 125-141. 18
Wakelin, A.M., Preston, C., 2006. A target-site mutation is present in a glyphosate-19
resistant Lolium rigidum population. Weed Res. 46, 432-440. 20
Wilson, B.J., Brain, P., 1991. Long-term stability of distribution of Alopecurus 21
myosuroides Huds. within cereal fields. Weed Res. 31, 367-373. 22
Yang, C., Everitt, J.H., Bradford, J.M., 2006. Comparison of QuickBird satellite 23
imagery and airborne imagery for mapping grain sorghum yield patterns. 24
Precision Agric. 7, 33-44. 25
- 20 -
Yang, C.C., Prasher, S.O., Landry, J., Ramaswamy, H.S., 2002. Development of Neural 1
Netwrok for weed recognition in corn fields. T. of the ASAE. 45, 859-864. 2
Yang, C.C., Prasher, S.O., Landry, J.A., Ramaswamy, H.S., Ditommaso, A., 2000. 3
Application of artificial neural networks in image recognition and classification 4
of crop and weeds. Can Agr Eng. 42, 147-152. 5
6
7
8
9
10
11
12
13

Table 1a. Percentage of correct classification for Fisher Linear Discriminant Analysis -1
without (FLDA) and with a previous PCA (FLDA-PCA)-, Nonparametric Functional 2
Discriminant Analysis (NPFDA), Feedforward Neural Networks -without (FFNN) and 3
with a previous PCA (FFNN-PCA)-, and One-Layer Neural network with PCA (1LNN-4
PCA) when classifying crop; wild oat; canarygrass; rabbit foot; ryegrass; and soil. 5
6
Methods Wavelengths (nm)
[400-900] [401-500] [501-600] [601-700] [701-900] [400-700]
(visible and NIR) (blue) (green) (red) (NIR) (visible)
FLDA 92.59 80.56 57.41 64.81 70.37 91.67
FLDA-PCA 100 94.44 90.74 92.59 92.59 91.44
NPFDA 77.78 67.59 67.59 64.81 64.81 72.22
FFNN 86.11 88.89 76.85 74.07 74.07 80.56
FFNN-PCA 100 87.96 90.74 91.67 91.67 92.59
1LNN-PCA 100 92.59 89.81 89.81 89.81 92.59
7
8
9
10
11
12
13
14
15
16
Table

Table 1b. Classification matrix (%) obtained for cross-validation using the interval 1
[400-900 nm] for classifying the spectra of crop; wild oat; canarygrass; ryegrass; rabbit 2
foot; and soil. 3
Methods Spectra Predicted Actual Crop Wild
oat Canarygrass Ryegrass Rabbit
foot Soil
FLDA* Crop Wild oat Canarygrass Ryegrass Rabbit foot Soil
90.0 5.6 0.0 4.7 0.0 0.0
10.0 94.4 0.0 4.7 0.0 0.0
0.0 0.0
100.0 14.3 0.0 0.0
0.0 0.0 0.0 76.2 0.0 0.0
0.0 0.0 0.0 0.0
100.0 0.0
0.0 0.0 0.0 0.0 0.0 100.0
NPFDA Crop Wild oat Canarygrass Ryegrass Rabbit foot Soil
85.0 11.1 0.0 0.0 10.5 0.0
15.0 72.2 0.0 4.8 10.5 0.0
0.0 0.0 80.0 28.6 0.0 0.0
0.0 11.1 20.0 66.6 5.3 0.0
0.0 5.6 0.0 0.0 73.7 0.0
0.0 0.0 0.0 0.0 0.0 100.0
FFNN Crop Wild oat Canarygrass Ryegrass Rabbit foot Soil
90.0 16.6 0.0 0.0 5.3 0.0
10.0 77.7 0.0 0.0 0.0 0.0
0.0 0.0 90.0 23.8 0.0 0.0
0.0 0.0 0.0 76.2 5.3 0.0
0.0 5.5
10.0 0.0 89.5 0.0
0.0 0.0 0.0 0.0 0.0 100.0
*See legend in Table 1a 4
5
6
7
8
9
10
11
12

Table 2a. Percentage of correct classification for Fisher Linear Discriminant Analysis -1
without (FLDA) and with a previous PCA (FLDA-PCA)-, Nonparametric Functional 2
Discriminant Analysis (NPFDA), Feedforward Neural Networks -without (FFNN) and 3
with a previous PCA (FFNN-PCA)- and One-Layer Neural network with PCA (1LNN-4
PCA) when classifying crop; grass weeds (wild oat-canarygrass-rabbit foot, ryegrass); 5
and soil. 6
7
Methods Wavelengths (nm)
[400-900] [401-500] [501-600] [601-700] [701-900] [400-700]
(visible and NIR) (blue) (green) (red) (NIR) (visible)
FLDA 94.44 83.33 75.93 79.63 89.81 94.44
FLDA-PCA 97.22 94.44 89.81 91.67 94.44 95.37
NPFDA 96.30 90.74 96.30 92.59 92.59 95.37
FFNN 95.37 93.52 96.30 91.67 93.52 92.59
FFNN-PCA 100 89.81 88.89 89.81 98.15 94.44
1LNN-PCA 98.15 95.37 89.81 92.59 93.52 95.37
8
9
10
11
12
13
14
15
16
17
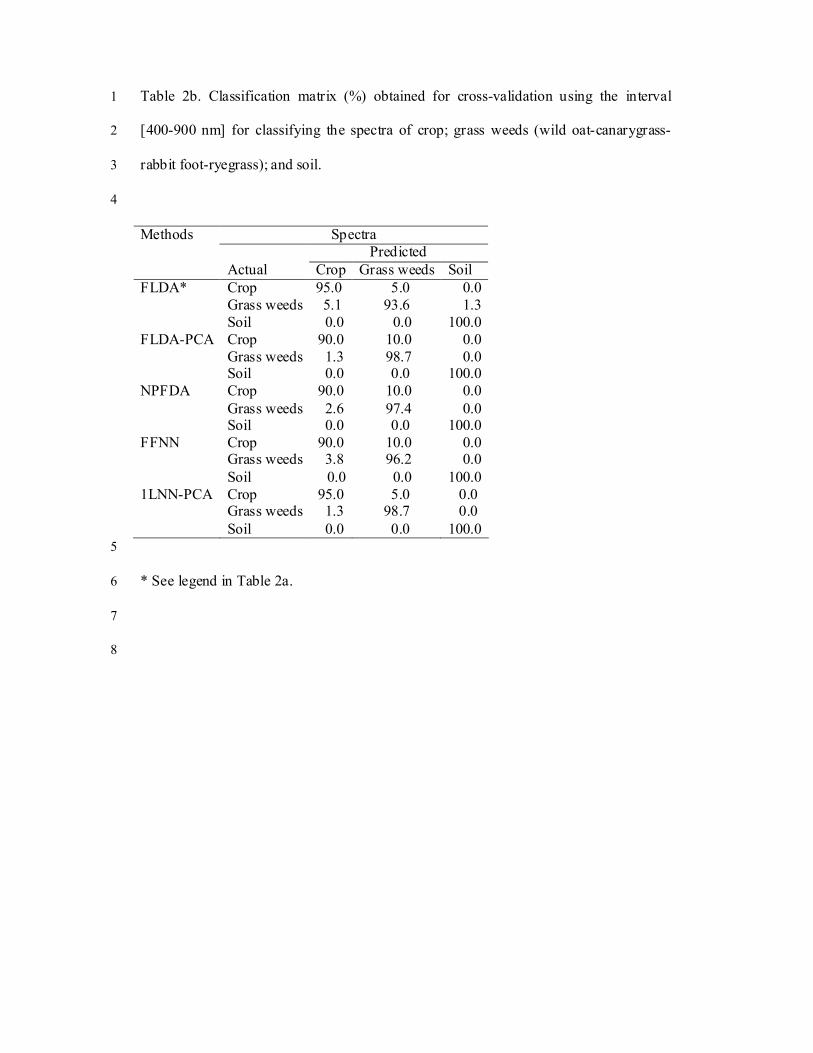
Table 2b. Classification matrix (%) obtained for cross-validation using the interval 1
[400-900 nm] for classifying the spectra of crop; grass weeds (wild oat-canarygrass-2
rabbit foot-ryegrass); and soil. 3
4
Methods Spectra Predicted Actual Crop Grass weeds Soil FLDA* Crop
Grass weeds Soil
95.0 5.1 0.0
5.0 93.6 0.0
0.0 1.3 100.0
FLDA-PCA Crop Grass weeds Soil
90.0 1.3 0.0
10.0 98.7 0.0
0.0 0.0 100.0
NPFDA Crop Grass weeds Soil
90.0 2.6 0.0
10.0 97.4 0.0
0.0 0.0 100.0
FFNN Crop Grass weeds Soil
90.0 3.8 0.0
10.0 96.2 0.0
0.0 0.0 100.0
1LNN-PCA Crop Grass weeds Soil
95.0 1.3 0.0
5.0 98.7 0.0
0.0 0.0 100.0
5
* See legend in Table 2a. 6
7
8

Table 3a. Percentage of correct classification for Fisher Linear Discriminant Analysis -1
without (FLDA) and with a previous PCA (FLDA-PCA)-, Nonparametric Functional 2
Discriminant Analysis (NPFDA), Feedforward Neural Networks -without (FFNN) and 3
with a previous PCA (FFNN-PCA)- and One-Layer Neural network with PCA (1LNN-4
PCA) when classifying among crop; wild oat; remaining grass weeds (canarygrass- 5
rabbit foot- ryegrass); and soil. 6
7
Methods Wavelengths (nm)
[400-900] [401-500] [501-600] [601-700] [701-900] [400-700]
(visible and NIR) (blue) (green) (red) (NIR) (visible)
FLDA 91.67 90.74 75.00 71.30 87.96 91.67
FLDA-PCA 100 93.52 92.59 94.44 95.37 94.44
NPFDA 88.89 86.11 86.11 87.96 79.63 88.89
FFNN 93.52 90.74 91.67 91.67 93.52 88.89
FFNN-PCA 100 90.74 91.67 91.67 96.30 91.67
1LNN-PCA 99.07 92.59 93.52 91.67 97.22 92.59
8
9
10
11
12
13
14
15
16
17

Table 3b. Classification matrix (%) obtained for cross-validation using the interval 1
[400-900 nm] for classifying the spectra of crop; wild oat; remaining grass weeds 2
(canarygrass-rabbit foot- ryegrass); and soil. 3
Methods Spectra Predicted Actual Crop Wild oat Remaining
grass weeds Soil
FLDA* Crop Wild oat Remaining grass weeds Soil
85.0 11.1 3.3 0.0
15.0 88.9 3.3 0.0
0.0 0.0 93.3 0.0
0.0 0.0 0.0 100.0
NPFDA Crop Wild oat Remaining grass weeds Soil
85.0 11.1 3.3 0.0
15.0 72.2 3.3 0.0
0.0 16.7 93.3 0.0
0.0 0.0 0.0 100.0
FFNN Crop Wild oat Remaining grass weeds Soil
90.0 16.7 0.0 0.0
10.0 77.8 1.7 0.0
0.0 5.5 98.3 0.0
0.0 0.0 0.0 100.0
1LNN-PCA Crop Wild oat Remaining grass weeds Soil
100.0 0.0 1.7 0.0
0.0 100.0 0.0 0.0
0.0 0.0 98.3 0.0
0.0 0.0 0.0 100.0
4
5
*See legend in Table 3a. 6
7
8
9
10
11
12
13
14

Table 4a. Percentage of correct classification for Fisher Linear Discriminant Analysis -1
without (FLDA) and with a previous PCA (FLDA-PCA)-, Nonparametric Functional 2
Discriminant Analysis (NPFDA), Feedforward Neural Networks -without (FFNN) and 3
with a previous PCA (FFNN-PCA)- and One-Layer Neural network with PCA (1LNN-4
PCA) when classifying among crop; wild oat-canarygrass-rabbit foot; ryegrass; and soil. 5
6
Methods Wavelengths (nm)
[400-900] [401-500] [501-600] [601-700] [701-900] [400-700]
(visible and NIR) (blue) (green) (red) (NIR) (visible)
FLDA 82.41 77.78 66.67 68.52 70.37 78.70
FLDA-PCA 98.15 93.52 86.11 90.74 91.67 95.37
NPFDA 81.48 78.70 76.85 75.93 75.93 81.48
FFNN 85.19 76.85 75.93 70.37 73.15 82.41
FFNN-PCA 99.07 90.74 87.04 87.96 89.81 93.52
1LNN-PCA 98.15 94.44 84.26 87.96 88.89 94.44
7
8
9
10
11
12
13
14
15
16

Table 4b. Classification matrix (%) obtained for cross-validation using the interval 1
[400-900 nm] for classifying the spectra of crop; wild oat-canarygrass- rabbit foot; 2
ryegrass; and soil. 3
Methods Spectra Predicted Actual Crop Remaining grass
weeds Ryegrass Soil
FLDA* Crop Remaining grass weeds Ryegrass Soil
65.0 5.3 19.0 0.0
30.0 91.2 14.3 0.0
5.0 3.5 66.7 0.0
0.0 0.0 0.0 100.0
FLDA-PCA Crop Remaining grass weeds Ryegrass Soil
90.0 0.0 0.0 0.0
10.0 100.0 0.0 0.0
0.0 0.0
100.0 0.0
0.0 0.0 0.0 100.0
NPFDA Crop Remaining grass weeds Ryegrass Soil
90.0 7.0 0.0 0.0
10.0 84.2 42.9 0.0
0.0 8.8 57.1 0.0
0.0 0.0 0.0 100.0
FFNN Crop Remaining grass weeds Ryegrass Soil
90.0 7.0 0.0 10.0
10.0 86.0 23.8 0.0
0.0 5.3 76.2 0.0
0.0 1.7 0.0 90.0
FFNN-PCA Crop Remaining grass weeds Ryegrass Soil
100.0 1.8 0.0 0.0
0.0 98.2 0.0 0.0
0.0 0.0
100.0 0.0
0.0 0.0 0.0 100.0
1LNN-PCA Crop Remaining grass weeds Ryegrass Soil
95.0 1.8 0.0 0.0
5.0 98.2 0.0 0.0
0.0 0.0 100.0 0.0
0.0 0.0 0.0 100.0
4
5 6 *See legend in Table 4a. 7 8
9
10

1
Figure 1. Original spectral curves for wheat crop, wild oat, canarygrass, ryegrass, rabbit 2
foot, and soil. 3
4
5
6
7
8
FigureClick here to download Figure: grass weed fig 1 EJA 15 feb 07 Lopez Granados et al.doc

- 1 -
Figure 2: Mean reflectance curves of wheat crop, wild oat, canarygrass, rabbit foot, 1
ryegrass, and soil. 2
3
4
0%
10%
20%
30%
40%
50%
60%
400 450 500 550 600 650 700 750 800 850 900
Wavelength (nm)
Ref
lect
ance
(%)
wheat crop
wild oat
canary grass
rabbit foot
ryegrass
soil
5
6
7
8
9
FigureClick here to download Figure: grass weed fig 2 EJA 15 feb 07 Lopez Granados et al.doc
Copyright © 2022 FDOKUMEN