Multiple dimensions of global environmental change - CiteSeerX
334
Multiple dimensions of global environmental change Edited by Sangeeta Sonak The Energy and Resources Institute
-
Upload
khangminh22 -
Category
Documents
-
view
3 -
download
0
Transcript of Multiple dimensions of global environmental change - CiteSeerX
Multiple dimensions ofglobal environmental change
Edited by
Sangeeta Sonak
The Energy and Resources Institute
© The Energy and Resources Institute, 2006
ISBN 81–7993–091–2
All rights reserved. No part of this publication may be reproduced in any form orby any means without prior permission of The Energy and Resources Institute
Published byTER I PressThe Energy and Resources InstituteDarbari Seth Block Tel. 2468 2100 or 2468 2111IHC Complex Fax 2468 2144 or 2468 2145Lodhi Road India +91 • Delhi (0) 11New Delhi – 110 003 E-mail [email protected] Web www.teriin.org
Printed in India by Multiplexus (India), New Delhi
Contents
Foreword vii
Acknowledgment ix
Global Environmental Change: an overview 1Sangeeta Sonak
Section I Land-use and land-cover change
1 Change of coastal land use, its impact, and management options 23Arvind G Untawale
2 Factors affecting land-use and land-cover changes in coastal 44wetlands of GoaSangeeta Sonak, Saltanat Kazi, Mahesh Sonak, Mary Abraham
3 Bridging local and global concerns: a study on globalized tourism 62and its implications on land-use and land-coverSaltanat Kazi and Alito Siqueira
4 Remote sensing and application of GIS in natural resources 83management with reference to land-use/land-cover in the stateof GoaMohan Girap
5 Impact of sand mining on local ecology 101Sangeeta Sonak, Prajwala Pangam, Mahesh Sonak, Deepak Mayekar
6 Fifty years of forest management in Nepal: a review of institutional 122transformationB Acharya and S Pokharel
Section II Changes in biodiversity
7 Biodiversity management and monitoring in protected areas: 143state-of-the-art and current trendsSusanne Stoll-Kleemann and Monika Bertzky
8 Biodiversity loss and its impacts on rural health/alternate systems 170of medicineB F Rodrigues
9 Sacred yet scientific: eco-theological basis of biodiversity 182conservation in GoaManoj R Borkar
10 Sacred groves: indigenous institutions of biodiversity conservation 195Rajendra P Kerkar
11 A perspective of marine bioinvasion 203A C Anil
12 World trade and protection of native biodiversity from alien 214organisms: New Zealand case studyMairi Jay
13 A new methodology for measuring environmental changes 231K Aruna Rao and Jubin Antony
14 On inference concerning biodiversity 240K Aruna Rao, Jubin Antony, and Subrahmanya Nairy
Section III Unsustainable fisheries
15 Marine overexploitation: a syndrome of global change 257J P Kropp, K Eisenack, and J Scheffran
16 Overexploitation of fishery resources,` with particular reference to Goa 285Z A Ansari, C T Achuthankutty, and S G Dalal
17 Conflicting interests and institutional pluralism: a case of fishing 300ban in GoaSangeeta Sonak, Janet A Rubinoff, and Mahesh Sonak
18 Potential health effects on reproductive-aged women and their 322offsprings after exposure to polychlorinated biphenylsfrom consumption of the US Great Lakes fishAnnette E Ashizawa, Heraline E Hicks, and Christopher T De Rosa
Section IV Marine and coastal pollution
19 Identifying indicators to manage coastal ecosystems in India 351Sangeeta Sonak, Mary Abraham and Saltanat Kazi
20 Demonstration of waste load allocation and waste assimilative 371capacity: case study of Ennore estuaryRajat Roy Chaudhury, Prince Prakash Jebakumar, B K Jena,Vijaya Ravichandran, Asokan S Sundarrajan
21 An urban hypertrophic coastal system: Rodrigo de freitas lagoon, 399Rio de Janeiro, BrazilMargarida Cardoso da Silva
22 Harmful algal blooms 419S R Bhat, Prabha Devi, Lisette D’Souza, X N Verlecar, C G Naik
iv Contents
23 Butyltin compounds in biofilm and marine organisms from the 432Dona Paula Bay, west coast of IndiaNarayan B Bhosle
24 Effects of tributyltin pollution on oyster industry: the Arcachon 444Bay caseClaude Alzieu
25 Sources, consumer exposure, and risk of organotin contamination 459in seafoodFrank Willemsen, Jan-Willem Wegener, Paolo Massanisso,Roberto Morabito
26 Impact of tributyltin ban on shipping industry 482A Mukherjee and U S Ramesh
27 A review of antifouling strategies: alternatives to TBT 502Asha Giriyan and Prajwala Pangam
Section V Climate change
28 Community-based climate change adaptation in Vietnam: 521inter-linkages of environment, disaster, and human securityRajib Shaw
29 Global environmental change and food security 548Rajal Shinkre
30 Rubber in Sri Lanka: a prospective plantation crop to combat 557adverse impacts of climate changeLalani Samarappuli and Wasana Wijesuriya
31 Tools and approaches for studies on global environmental change: 578a case study on quantifying causal maps using Bayesian networksto identify reasons for abandoning rubber cultivations in Sri LankaWasana Wijesuriya, R O Thattil, and Keminda Herath
32 Vulnerability of the North Western Province to climate-induced 590incidences of vector (mosquito)-borne diseasesA K S B De Alwis, M D S Rajamanthrie, R S I M Senanayake,M R S S Bandara, M D B Perera, E L C K Edirisinghe, D A R Premasiri,W Abeywickrama
Section VI Fresh water depletion
33 Seawater intrusion mapping using modified GALDIT indicator 607modelA G Chachadi
34 Status of groundwater availability and recharge in the mining 623watersheds of North GoaB S Choudri and A G Chachadi
Contents v
35 Depletion of fresh water in the mining regions of Goa, India: 650gendered impacts and responsesShirin Cooper, Yogita Mehra and Anuradha Joshi
36 Institutional transformation in canal irrigation: what role for the 674 irrigation bureaucracy?Vishal Narain
37 Kaleidoscopic view of global environmental change 692Sangeeta Sonak
Contributors 723
vi Contents
Foreword
APN, the Asia-Pacific Network for Global Change Research, is an inter-govern-mental network created to foster global change research in the Asia-Pacificregion, increase developing country participation in that research, andstrengthen interactions between the science community and policy-makers. TheAPN promotes, encourages, and supports research activities on long-term glo-bal changes in climate, ocean, and terrestrial systems, and on related physical,chemical, biological, and socio-economic processes. With a membership of over20 countries, the APN is playing a significant role in supporting global changeresearch in the region. It now has a successful 10-year record of promoting co-operation and enhancing scientific research capacity, particularly in developingcountries. For the next five years till 2010, the APN will continue to build onthese foundations, particularly through its ARCP (Annual Regional Call forProposals) and its Capacity Building Programme (CAPaBLE).
The APN’s Science Agenda has four general themes: (1) climate; (2) eco-systems, biodiversity, and land use; (3) changes in the atmospheric, terrestrial,and marine domains; and (4) use of resources and pathways for sustainabledevelopment. Under its Policy Agenda, the APN is paying particular attentionto promoting interactions between science and policy processes—admittedly, achallenge that also faces many science-based bodies around the world. The APNwill aim to identify and develop effective methodologies and procedures in theareas under its Science Agenda and transfer this knowledge and information tothe decision-making and scientific communities that the APN serves. Under itsInstitutional Agenda, the APN is making greater efforts to strengthen itself as aninter-governmental network. It is encouraging more active involvement ofmember governments, especially those of the developing member states. TheAPN is also forging stronger strategic partnerships in the ‘Global ChangeCommunity’. Through its activities, the APN is focusing on achieving itsmission and goals in the most effective and efficient way. It is with this focus inmind that the APN acknowledges the work of Dr Sangeeta Sonak as one of theoutputs of Dr Sonak’s APN-funded project 2005-02-CMY entitled ‘Role ofInstitutions in Global Environmental Change’. The present book will be avery useful resource in attempting to understand and assess the diverse natureof global environmental change and its impacts in South Asia.
Dr Linda Anne StevensonProgramme Manager for Scientific Affairs
APN Secretariat

Acknowledgement
I express my sincere thanks to one and all, who have made the preparationof this volume possible and enjoyable. In particular, I would like to expressgratitude to Dr R K Pachauri, Director-General, TERI, for his constant encour-agement, support, and repose of confidence in me when it was so much needed.I must acknowledge the support received from Ms Preety Bhandary, Director,Policy Analysis Division, TER I.
I also gratefully acknowledge the APN (Asia Pacific Network) for extend-ing us financial support. I extend special thanks to Dr Linda Stevenson,Programme Manager for Scientific Affairs, APN, for her liberal support duringthe course of the project. Without her generous support, the publication of thisvolume may have remained but a dream.
I thank START (International SysTem for Analysis, Research and Training)Secretariat for their help in managing the funds. I am particularly grateful toProf. Roland Fuchs, Director, START; Prof. Oran Young, Chair, IDGEC (Institu-tional Dimensions of Global Environmental Change); and Dr Heike Schroeder,Executive Officer, IDGEC, for their support, feedback, and valuable inputs.
I deeply acknowledge reviewers’ comments that enriched the contentsand made this volume productive. Particular mention is due of Dr Rajib Shaw,Associate Professor, Kyoto University, who kindly reviewed a number ofchapters in the book and provided excellent feedback.
It goes without saying that the publication of this volume has beenpossible on account of the valuable contributions by various authors. Thiscontribution has been in the form of sharing their intellect, time, enthusiasm,support, and hard work.
I thank the staff of TERI Press: Mr K P Eashwar for editorial coordination,Ms Richa Sharma and Pritika Kalra for copy-editing, Mr R K Joshi for graphics,Mr T Radhakrishnan and Mr A Chakraborty for production coordination,Mr S Gopalakrishnan for design and layout of the book, and Ms Archana Singhfor the cover design. I am particularly grateful to Ms Richa Sharma for herpatience and cooperation. I also thank Ms Shabana Kazi for her attentionand skill in helping me produce this book. I thank my colleagues at the WesternRegional Centre for the cooperation rendered to me during the past two years.
My family has always been supportive of my work. Without the necessityof any request, my parents and mother-in-law shouldered the responsibilities atthe home front. In retrospect, I acknowledge that the critical comments of my

husband, Mahesh, were indeed a source of support. But for his unstinting coop-eration, working at the volume would not be so pleasurable. Finally, I must saythat contribution of my four-year-old son Eeshan has been immense. As if on aclue, he would play and draw by himself while editing this volume became myhomework, always ready however, to take me into a different world wheneverrequired by me.
In conclusion, therefore, I once again thank one and all for not just givingme this wonderful opportunity but further for equipping me with immensemeans and support for making the most of this opportunity.
Sangeeta Sonak
x Acknowledgement
Global environmental change:an overview
Sangeeta Sonak
GEC (global environmental change) is among the most severe challenges facingthe mankind today. The unprecedented change in our global environment iscurrently a major concern to scientists and environment managers. Over the re-cent decades, changes in the earth system due to population pressure as well asgrowth in per capita resource exploitation have been alarming. These growingimpacts of human activities on the earth and atmosphere at all scales encourageCrutzen and Stoermer (2000) to assign a term ‘anthropocene’ and suggest theadvent of a new geological epoch.
In general, land resources are being used unsustainably and land-use andland-cover changes cause cascading effects on the local as well as global ecol-ogy. Food production has increased mainly through intensification of resources.Increased load of nitrogen from fertilizers is ultimately discharged to the waterresources. Exceeding its capacity to absorb nutrients, the coastal water supportsthe growth of algae, which very often are harmful and cause serious concerns tohuman health. Coastal fisheries are under threat from pollution, overfishing,and habitat degradation. Two major concerns associated with biodiversity – lossof species and the introduction of alien species, particularly pests and pathogens– have created serious concerns. Carbon emissions have increased to an extentthat has overloaded sink capacity of terrestrial and aquatic ecosystems. Fresh-water pollution and shortages are experienced in most parts of the world.
Human population and the global economy have been growing rapidly.These two factors have increased resource consumption significantly. Whilemuch of the environmental degradation in the developing countries is on ac-count of poverty and population pressures, that in the developed world is dueto increase in per capita resource consumption. However, many studies pointout that although much of the accelerating economic activity and energy con-sumption have occurred in the developed countries, the developing world isbeginning to play a larger role in the global economy and hence is having in-creasing impacts on resources and environment.
2 S Sonak
Scientists warn that our planet is under threat due to excessive resourceconsumption, which may exceed the threshold level of the earth system, ifhuman population and activities continue to rise at the current pace. Beyond aparticular threshold, earth’s buffer capacity will give way and the earth systemwill move to another state that may be irreversible. The palaeo-record showsthat in the earth system, abrupt changes and surprises are a common feature(Steffen, Sanderson, Tyson, et al. 2004). Such abrupt changes can give rise tocatastrophic failures.
Two approaches
Current GEC studies follow either of the two approaches, cumulative orsystemic. Turner, Kasperson, Meyer, et al. (1990) have described these twoapproaches in detail. According to them, in the systemic approach, ‘global’refers to the spatial scale of operation or functioning of a system. A physicalsystem is ‘global’ if its attributes at any locale can potentially affect its attributesanywhere else, or even alter the global state of the system. On the other hand, inthe cumulative approach, ‘global’ refers to the area or substantive accumulationof localized change. A change is ‘global’ if it occurs on a worldwide scale, orrepresents a significant fraction of the total environmental phenomenon or glo-bal resource. This implies that it replicates itself in different parts of the worldand accumulation of such changes in the different parts of the world becomes aglobal phenomenon.
Turner, Kasperson, Meyer, et al. (1990) state that the systemic approachdominates much of the discourse on GEC to date. They further point out thatplace-specific studies allow for a more complete understanding of the way inwhich global forces are played out in specific places and cultures. This is par-ticularly the case where some components such as fresh water or land resourcesare concerned.
Global–local interplay
GEC occur at multiple scales and involve complex dynamics at different scales.Cash and Moser (2000) point out that GEC is a cross-scale phenomenon that re-quires assessment at all scales and integration across scales. The fact that theissues have different implications at different scales further complicates the sys-tem. Research shows that cascading effects of human activities interact witheach other and with local- and regional-scale changes in multidimensionalways.
The importance of scales and cross-scale dynamics in understanding andaddressing GEC is receiving increasing recognition. Challenges involved in inte-grating research into policy necessitate a thorough understanding of thedynamics between the human actions at different scales, their outputs at these

Global environmental change: an overview 3
scales, and their implication at different scales. Very often these three events oc-cur at different scales (Figure 1), posing challenges for integration of theinformation flows into policy. Some actions such as intensification of agricul-tural products for subsistence may occur and have implications at the local levelonly. Similarly, intensive fishing in global marine waters may, generally, haveimplications at the global level. Nevertheless, most actions that are linked toGEC present cross-scale dynamics. For example, tourism is a global phenom-enon and beneficiaries are international tourists, but the impacts, such asland-use and land-cover changes, biodiversity loss, etc., are normally borne bylocal communities. Similarly, while human actions, such as shrimp production,may occur at local level, the output may be exported to the international market(global level) and the impacts are very often borne by the local communities.
Cash and Moser (2000) identify three broad categories of challenges relatedto scales: (1) matching the scales of the biogeophysical system and the manage-ment system: an institutional fit problem; (2) matching the scales of theassessment and the management system: a scale discordance problem; and(3) understanding the linkages between scales, and how they affect decision-making, information flows, and the integration of information into thedecision-making process: a cross-scale dynamics problem. Further, Harrington
Figure 1 Global–local interplay: cross-scale dynamics
4 S Sonak
and Lu (2002) believe that to build an understanding of global sustainability, po-tential local responses to various aspects of global change need to beconsidered. While analysing the effect of the local feedlot operations on green-house gas emissions, they argue that national-scale approaches can misssignificant local variations.
Most of the studies on GEC address environmental problems that exist atglobal scale and ignore local concerns. Accumulated consequences of severalenvironmental concerns occurring at local levels pose serious threats at the glo-bal level. The effort in the present volume is to generate a wider consensus ofthe issues connected with the GEC using local case studies with cumulativeapproach. Such assessments at the local level will deepen our understanding ofthe GEC.
Climate change and beyond
Global environment includes physical, chemical, and biological processes thatare necessary for life-supporting services on the earth. Research on GEC till datefocuses on climate change. While climate refers to the aggregation of all compo-nents of weather, environment is made up of the complex interactions betweenthe physical, chemical, and biological systems. The climate system interactswith other components of the earth’s environment to bring about GEC. No stud-ies on a single environmental component will be meaningful for GEC, if viewedin isolation. It is the feedback between various components that assumes greaterimportance for GEC and, hence, the term GEC involves changes in various com-ponents of the environment. Steffen, Sanderson, Tyson, et al. (2004) firmly assertthat global change should not be confused with climate change. In order to havea meaningful understanding of GEC, other environmental components, such asland-use and land-cover, biodiversity, fisheries, coastal and marine ecosystems,fresh water, etc., and the cascading effects generated due to the changes in thesecomponents merit attention along with climate change.
However, current GEC research overlooks environmental issues other thanclimate change, global warming, and sea-level rise. Even a few research papersthat address other issues follow the systemic approach, thus establishing linkswith the climate change. Nevertheless, several studies underscore the need forinclusion of such components of environment in GEC research. Significantchanges that have taken place in our environment at various scales include thefollowing. Land-use and land-cover changes Changes in biodiversity Unsustainable fisheries Pollution of coastal and marine environment Climate change Fresh water scarcity
Global environmental change: an overview 5
Using a cumulative approach, this volume presents some case studies oneach of these components. The general structure of the volume is such that anoverview of a particular component and the issues involved are discussed in thefirst chapter and the following chapters describe factors causing the change, itsimpacts on society and/or human health, methods for studying the change, andinstitutional responses to this change. The volume is a collaborative effort of amultidisciplinary team and uses an interdisciplinary lens to present a kaleido-scopic view of the multiple dimensions of GEC. These dimensions areecological, social, economic, biomedical, institutional, gender, and methodologi-cal. The quest for a greater understanding of the GEC issues and theirinterconnections is the central objective of the volume.
Section I: Land-use/land-cover change
One of the most alarming manifestations of human activity has been conversionof natural landscapes and agricultural lands. Lambin, Turner, Geist, et al. (2001)point out that land-use and land-cover changes are so pervasive that, when ag-gregated globally, they significantly affect the key aspects of the functioning ofthe earth system. Land-use and land-cover change is not a recent phenomenon,though it has received much attention in the recent years. Land cover is the bio-physical state of the earth’s surface and immediate subsurface, whereas landuse involves both the manner in which the biophysical attributes of the land aremanipulated and the intent underlying that manipulation, that is, the purposefor which the land is used (Turner, Skole, Sanderson, et al. 1995: 20). Land useaffects land cover with wide implications. Land-cover changes act as sources orsinks of bio-geochemical flows, the feedback from which may affect the use–cover relationship (Turner, Skole, Sanderson, et al. 1995: 20).
Land-use/land-cover change plays a very important role in GEC. It con-tributes significantly to changes in the biogeochemical cycles and biodiversityloss and has implications to the livelihood issues at societal level. Forest is at thecentre of the GEC research. It is both the source and the sink for carbon emis-sions. The loss of carbon to the atmosphere through the burning of slash is amajor source of carbon. Similarly, forests play a vital role in carbon sequestra-tion. Increasing loss of agricultural lands has impacts on food security, and foodscarcity has now become an issue of global concern. Food scarcity is expected togive rise to increased food prices, which, in turn, is likely to create political andsocial instability (López, Aide, and Thomlinson 2001).
International research on GEC requires a thorough understanding of land-use and land-cover changes. Linking land-use and land-cover changes withanthropogenic activities will help in improving our understanding of the sub-ject. Human actions serve as proximate sources of change. World populationgrowth coupled with economic development and continuous need for im-proved infrastructure gives rise to increasing demands for land-based resources.
6 S Sonak
Increasing human population has undoubtedly driven global changes in land-cover. However, land-cover change attains global significance through thecumulative addition of locally specific changes (Ramankutty, Foley, andOlejniczak 2002).
Further, Turner, Skole, Sanderson, et al. (1995: 48) suggest that land-use/land-cover classification should involve at least three dimensions: manipulationof land characteristics, land users’ purposes or objectives, and the broader bio-physical and socio-economic circumstances or underlying conditions. In theiropinion, the purpose is important to distinguish such critical attributes as sub-sistence versus market orientations that usually respond differently to changingconditions. An understanding of social, political, and economic factors that in-fluence land use is necessary to understand the complex dynamics of GEC.
In Section I, Untawale presents an overview of the coastal landforms in In-dia, current status, impacts of climate change on coastal land, and strategies forprotection of coastal land in the first chapter. In Chapter 2, factors affectingland-use changes in the coastal wetlands of Goa have been analysed with par-ticular emphasis on institutional factors. In Chapter 3, on the other hand, Kaziand Siqueira discuss tourism-induced land-use and land-cover changes with fo-cus on the consequences of these changes to Goan society. In order to betterinform the wider target audience of the book, Girap presents the methodologymost commonly used for interpreting LUCC (land use and cover changes) in thefollowing chapter (Chapter 4). A chapter on sand mining and its impact on localecology including LUCC has been presented by Sonak, Pangam, Sonak, et al.,with an aim of introducing consequences of ‘sand mining’ to the research com-munity (Chapter 5). The literature is otherwise deficient in papers on sandmining. A review of institutions and history of forest management has been car-ried out by Acharya and Pokharel in the last chapter of this part (Chapter 6).
Section II: Changes in biodiversity
Biodiversity is defined as ‘the variety and variability among living organismsand the ecological complexes in which they occur.’ Biodiversity changes canhave numerous far-reaching consequences to earth’s life-support system. Eco-logical services, such as nutrient cycling, food production, medicines, carbonsequestration, etc., can be seriously impaired due to the changes in biodiversity.Two major challenges concerning biodiversity today are loss of species and in-troduction of alien species.
Paleo-studies show that the average life of a species is 5–10 million years.With 5–10 million living species, the extinction rate should be one per year. Thecurrent rate appears to be well in excess of the normal. Over the last 400 years,there were 611 documented extinctions, but this record excluded many creaturesincluding most invertebrates that account for 95% of all animals. Today, thereare over 5000 threatened species listed, but only a very small proportion of rec-ognized species has been evaluated (Atlas 2001: 345).
Global environmental change: an overview 7
Introduction of alien species poses serious threats, particularly if the spe-cies are pathogenic and/or highly competitive. Invasion of pests and pathogensis either an intended or unintended consequence of human decisions involvingthe use of exotic species in production and consumption; conversion and frag-mentation of habitats; or the movement of goods and people. Human activitiessuch as marine trade related ship fouling, ballast water exchange, and culture ofexotic aquatic/terrestrial species are the prime causes of the introduction of al-ien species.
The first chapter in Section II (Chapter 7) deals with an overview of issuesrelated to biodiversity monitoring and management. Various approaches tobiodiversity management have been described, and a need for integrated ap-proaches has been emphasized by Stoll-Kleemann and Bertzky in this chapter.Differential impacts of global change on different countries and population havebeen well documented. Rural population of the developing countries dependson the forest resources for traditional health remedies. In Chapter 8, Rodriguesdraws our attention to the impacts of biodiversity loss – more specifically, theloss of medicinal plants – on the health of the rural population of India. Thelinks between people and nature are made more explicit in Chapter 9 by Borkar.Further, the concept of protected areas is well accepted in modern biodiversitymanagement approaches. Kerkar (Chapter 10) documents forest areas in Goaprotected by traditional societies under the label of sacred groves. While theabove chapters focus on the loss of biodiversity, Anil in Chapter 11 and Jay inChapter 12 discuss the recent threat to biodiversity, that is, bioinvasion. Anilprovides an overview of the factors that influence alien species and Jay presentsinstitutional mechanisms relating to biosecurity. A new methodology to statisti-cally measure biodiversity changes has been proposed by Rao and Antony inChapter 13 and further developed by Rao, Antony, and Nairy in Chapter 14.
Section III: Unsustainable fisheries
Global marine fish production has increased in the past few decades. However,the capacity of the aquatic ecosystems to produce fish is reduced on account ofincrease in fishing efforts, increase in fishing intensity, and unsustainable prac-tices and loss of nursing grounds. Overfishing was formally recognized as aproblem in the early 1900s (World Resources 2000: 76). Seventy-five per cent ofall fish stocks for which information is available are in urgent need of bettermanagement (Burke, Kura, Kassem, et al. 2001: 7). Of these, 28% are already de-pleted or in the danger of depletion, and 47% are being fished at their biologicallimit and therefore are vulnerable to depletion (Burke, Kura, Kassem, et al. 2001:7). Pauly et al. (1998) have noticed ‘fishing down the web’, which implies that ashighly priced fish on the higher level of food web are depleted, fish catch isdominated by other species, which are normally on the lower level on the foodweb.
8 S Sonak
Fisheries form a crucial part of most national government agendas, at least,of developing countries. Traditionally, fish has served as a source of income aswell as food for the poor and low-income group people. Fishing provides liveli-hood opportunities and nutrition to the traditional coastal communities.However, globalization has placed new pressures on this sector. Access to distantmarket and growing international demand have encouraged the entry of the cor-porate sector with mechanized crafts into the fishing industry. This gives riseto conflicts between traditional fishers and industrial fishers. Small-scalemarginalized fishers are generally at a disadvantage compared to industrial fish-ers. In addition to overharvesting, fish resources also face challenges from coastaland marine pollution. Pollutants from toxins released by algal blooms, TBTs(tributyltins), and PCBs (polychlorinated biphenyls) can accumulate in fish. Amore serious concern, from strictly anthropocentric perspective, is the problem ofbiomagnification and risk to human health from consumption of polluted fish.
In this section, an overview of marine exploitation has been presented byKropp, Eisenack, and Scheffran. They develop a model that could help predictfuture development in fisheries (Chapter 15). Ansari, Achuthankutty, and Dalalfocus on overexploitation of fisheries in Goa in Chapter 16. Sonak, Rubinoff,and Sonak, using a case study of fishing ban in Goa, present conflicts betweendifferent institutions in fisheries management and those between traditional andindustrial fishers (Chapter 17). Potential effects on human health from con-sumption of fish exposed to marine pollution have been presented byAshiazawa, Hicks, and De Rosa in Chapter 18.
Section IV: Coastal and marine pollution
Pollution from land-based activities
Land-based activities are the major source of coastal pollution. Human activi-ties, such as intensification of agriculture, aquaculture, domestic sewage ofcoastal population, waterfront location of industries and power plants, tourism,use of marine water for trade, etc., are primarily responsible for coastal and ma-rine pollution. Large amounts of nitrogen compounds discharged by humans,largely as fertilizers, cannot be assimilated easily by soil micro-flora. Significantamounts of nitrogen accumulate in vegetation, soils, and groundwater, some ofit being released into the coastal zone and to the atmosphere. Unable to metabo-lize excess nitrogen, the coastal waters show signs of eutrophication, giving riseto algal blooms, some of them harmful, thus causing serious concerns to humanhealth. These concerns are likely to be overwhelmed by the growingpopulations as well as increase in economic activities and coastal megacities. Ofthe 20 megacities in the world, 17 are located along the coast.
Identification of drivers behind changes in coastal and marine areas andindicators using a PSR (pressure, state, response) framework has been in focus
Global environmental change: an overview 9
of Chapter 19. Conceptual frameworks connecting human activities to thecoastal ecosystems have been presented in this chapter. Estimation of waste as-similative capacity of Ennore estuary in the north Chennai region has beenpresented by Chaudhury, Jebakumar, Jena, et al. in Chapter 20, whereas,eutrophication of coastal waters in the Rodrigo de Freitas lagoon in Brazil hasbeen studied by Cardoso da Silva in the following chapter (Chapter 21). Coastaleutrophication gives rise to harmful algal blooms. Algal blooms and their conse-quences to society, particularly to human health, have been discussed by Bhat,Prabha Devi, and D’Souza, et al. in Chapter 22.
Tributyltin in marine environment
TBT marine environment has been a serious concern since past few years due tothe persistent and bioaccumulative nature of TBT compounds. TBT, after its re-lease into the aquatic environment, shows a great tendency to be accumulatedonto particulate matters, sediments being the final sink. The high toxicity of TBTtogether with its tendency to be accumulated in marine organisms can produceheavy damage in marine organisms, particularly in molluscs and gastropods.The bioaccumulation of TBT in several marine organisms has been largely docu-mented (Hong, Takahashi, Min, et al. 2002). The first evidence of environmentaldamage by TBT released by antifouling paints appeared in aquaculture farms inArcachon (France) where, from 1975 to 1982, oyster production was severely re-duced due to a lack of reproduction and the appearance of shell calcificationanomalies in adult oysters leading to high economic losses (Alzieu, Sanjuan,Deltreil, et al. 1986). Decline in gastropod population has been registered world-wide as a consequence of the induction of the imposex effect by TBT, whichessentially is the superimposition of male sexual characteristics on female or-ganisms. High occurrence of imposex has been evidenced in the North Sea, theAtlantic Ocean, and the Mediterranean Sea in Europe as well as along the coastsof the USA, Japan, India, Australia, Chile, etc. Some recent studies documentingthese impacts have been conducted by Birchenough, Barnesa, Evans, et al.(2002); Chiavarini, Massanisso, Nicolai, et al. (2003); De Metrio, Corriero,Desantis, et al. (2003); Evans and Nicholson (2000); Ramon and Amor (2001);and Rees, Brady, and Fabris (2001). The problem of environmental impacts ofTBT was brought to the notice of the MEPC (Marine Environment ProtectionCommittee) of IMO (International Marine Organization) in 1988. In 1996, theMEPC approved of resolution, which includes complete prohibition oforganotin compounds in anti-fouling systems by 2008. Signature of about 25 na-tions, whose combined flagged fleet equals 25% of the world fleet, is necessaryfor the convention to come into force. However, concerns have been raised thatthe hostility towards the use of TBT appears to be based on a biased assessmentof its environmental impact and a need for cost–benefit analysis is suggested(Abbott, Abel, Arnold, et al. 2000). It is suggested that the environmental
10 S Sonak
impacts of not using TBT, such as acceleration of greenhouse gases, introductionof alien species through fouling of ship hull, reduced safety to humans throughincreased corrosion and fouling, and unforeseen environmental impacts of alter-natives, have not been given adequate consideration. Little thought has beengiven to a technical solution to control TBT inputs to the environment. Long-term biocidal properties of the existing alternatives are largely untested as alsotheir environmental impacts (Evans 1999). There is no safe alternative that hasglobal approval. There is concern that organic booster biocides in the antifoulingpaints, which will replace TBT-based coatings, could cause serious environmen-tal damage (Evans, Birchenough, and Brancato 2000). It is argued that the banon TBT-based antifoulants is desirable but, in view of these uncertainties, itshould be delayed until alternatives that have been proved to be less harmful tothe environment are available (Evans, Birchenough, and Brancato 2000). A saferand efficient antifouling alternative and a reliable monitoring/inspection sys-tem appear to be an urgent need. Given the environmental impacts of TBTcoupled with the fact that no alternative with global approval is available andthat reliable inspection system is yet to be developed, research need to be fo-cused on these aspects.
With the above background, this volume presents a set of papers that illus-trate several issues concerning TBT in antifouling paint. Bhosle documents theaccumulation of butyltin compounds in biofilm and marine organisms along theWest Coast of India in Chapter 23. Effect of TBT on oyster industry has beendemonstrated by Alzieu (Chapter 24). Willemsen, Wegener, Massanisso, et al. inthe following chapter (Chapter 25) evaluate the risk of organotin compounds tothe seafood consumers. Mukherjee and Ramesh, on the other hand, point outthe implications of the ban on TBT on the shipping industry (Chapter 26).Giriyan and Pangam present a review of antifouling strategies that exist as alter-natives to TBT in Chapter 27.
Section V: Climate change
There is no doubt that the global carbon system is out of balance. A majorsource of carbon in the earth system is combustion of fossil fuels. In the last fewdecades, mankind has used vast quantities of fossil fuels that take millions ofyears to build. Changes in the land cover significantly modify the concentrationof atmospheric constituents. The climate system responds to the human-drivenland-cover change by changing the amounts of absorbed and reflected solar ra-diation owing to changes in the reflectance of the earth’s surface (Steffen,Sanderson, Tyson, et al. 2004). Such effects are known to be important for cli-mate locally and regionally and may be significant globally.
Intergovernmental Panel on Climate Change (IPCC 2001b) report describesthe following changes that have occurred and are likely to occur in the climatesystem.
Global environmental change: an overview 11
The global average surface temperature has increased over the 20th centuryby about 0.6 ºC.
Temperatures have risen during the past four decades in the lowest 8 kilome-tres of the atmosphere.
Global average sea level has risen and ocean heat content has increased. Changes have also occurred in other important aspects of climate, such as
changes in precipitation and rainfall. However, the IPCC (2001b) report alsonotes that some important aspects of climate, such as the Antarctic sea iceextent, the frequency of tornadoes, thunder days, or hail events appear not tohave changed.
Differential impacts of climate change and food security have attractedmuch attention over the past few decades. Developing countries with highpopulation and a higher rate of population increase are likely to suffer substan-tially from the changing climate in terms of food security and livelihood. Poorpeople in the developing countries are likely to be more affected due to their de-pendency on climate-sensitive sectors such as agriculture, forestry, and fisheries.They are also more vulnerable to disasters and extreme events arising on ac-count of climate change. Tropical cyclones coupled with the sea-level rise willcreate devastating impacts in terms of loss of life and property in low-lyingcoastal areas.
In Chapter 28, Shaw describes the basic concept of human security andexemplifies linkages between environment, disaster and development, andcommunity-level adaptations. Food security concerns in developing countries,such as India, have been discussed by Shinkre in the following chapter (Chapter29). Samarappuli and Wijesuriya attempt to assess the prospects of growing rub-ber to combat adverse impacts of climate change in Chapter 30. In Chapter 31,Wijesuriya, Thattil, and Herath apply Bayesian theory to quantify causal mapsand present results of participatory studies to identify causes for abandoningrubber cultivation. Climate change impacts on mosquito-borne diseases havebeen well studied and documented in Chapter 32 by De Alwis, Rajamanthrie,Senanayake, et al.
Section VI: Fresh water depletion
Hydrological poverty is a grave concern to most parts of the world today. It ispredicted that the number of people (currently 2.2 billion) living under moder-ate or severe water stress will rise to 4.0 billion by 2025 (Steffen, Sanderson,Tyson, et al. 2004). Climate change may decrease water availability in some wa-ter-stressed regions and increase it in others. In Africa, Asia, and South America,climate change is predicted to exacerbate water stress significantly.
Climate change is unlikely to impact municipal and industrial demandsbut may substantially affect irrigation withdrawals (IPCC 2001a). About 70% ofthe world’s current freshwater resource is used for agriculture, but that number
12 S Sonak
approaches 90% in China and India, with extensive irrigation (Steffen, Sander-son, Tyson, et al. 2004). In southern and eastern Asia, agriculture is monsoonbased, and on account of lack of financial and technological resources, there islittle scope to adjust farming practices should monsoon cycles change. ForIndian experts, monsoon variability, therefore, stands in the centre of their con-cern and research (Biermann 2001).
Non-climatic changes may have a greater impact on water resources. An-thropogenic impacts on fresh water are typically confined within individualbasins and aquifers, but widespread shortages caused by excessive withdrawalor pollution may lead to a globally critical situation (Turner, Kasperson, Meyer,et al. 1990). Depletion and degradation of water resources are two major threatsto freshwater systems. Climate-related stresses in coastal areas include loss andsalinization of agricultural land as a result of change in sea level and changingfrequency and intensity of tropical cyclones (IPCC 2001a). Coastal aquifers aremore vulnerable to seawater intrusion.
Mapping of seawater intrusion using modified GALDIT indicator modelhas been presented by Chachadi in Chapter 33. In Chapter 34, Choudri andChachadi present a case study of Goa to link water withdrawal with human ac-tivities, such as mining. Further, several issues related to water shortage due tomining activities in Goa and its differential impacts on women have been dis-cussed by Cooper, Mehra, and Joshi in the following chapter (Chapter 35).Institutional dimensions of water use and water scarcity are presented byNarain in the last chapter (Chapter 36).
Global environmental change: complex dynamics of theinterrelated systems
While some studies are being conducted worldwide on various components ofGEC, the need of the hour is an understanding of the earth system as a whole.GEC studies need both multidisciplinary and interdisciplinary approaches.Multidisciplinary refers to benefiting from two or more branches of learningand interdisciplinary refers to a more active involvement of several separateacademic disciplines. The terms trans-disciplinary and cross-disciplinary alsoare often used to describe collaborative efforts between different disciplines.Steffen, Sanderson, Tyson, et al. (2004) emphasize that the biggest challenge is todevelop a substantive science of integration, which transcends disciplinaryboundaries across the natural and social sciences, as earth system science is ulti-mately concerned with issues that lie well beyond any single field of study(Steffen, Sanderson, Tyson, et al. 2004). Turner, Kasperson, Meyer, et al. (1990)suggest that the ‘geocentric’ focus of natural scientists should be supplementedby an ‘anthropocentric’ perspective that evaluates physical changes primarily interms of their importance to society. According to them, the anthropocentric per-spective gives importance to any worldwide change of significance to society,
Global environmental change: an overview 13
which are normally cumulative ones. Turner, Kasperson, Meyer, et al. (1990) fur-ther observe that a holistic perspective that integrates the geocentric andanthropocentric perspectives may prove to be most valuable for global changestudies.
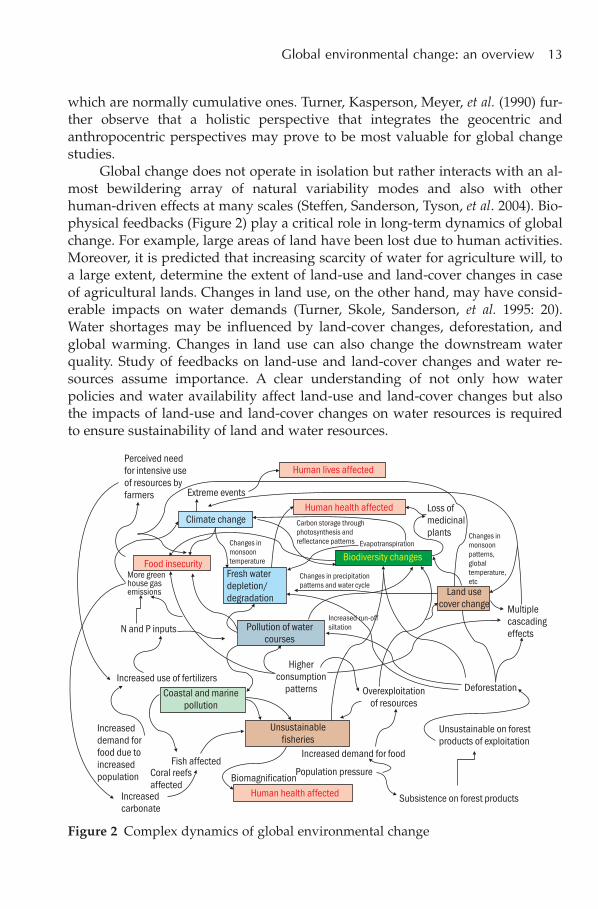
Global change does not operate in isolation but rather interacts with an al-most bewildering array of natural variability modes and also with otherhuman-driven effects at many scales (Steffen, Sanderson, Tyson, et al. 2004). Bio-physical feedbacks (Figure 2) play a critical role in long-term dynamics of globalchange. For example, large areas of land have been lost due to human activities.Moreover, it is predicted that increasing scarcity of water for agriculture will, toa large extent, determine the extent of land-use and land-cover changes in caseof agricultural lands. Changes in land use, on the other hand, may have consid-erable impacts on water demands (Turner, Skole, Sanderson, et al. 1995: 20).Water shortages may be influenced by land-cover changes, deforestation, andglobal warming. Changes in land use can also change the downstream waterquality. Study of feedbacks on land-use and land-cover changes and water re-sources assume importance. A clear understanding of not only how waterpolicies and water availability affect land-use and land-cover changes but alsothe impacts of land-use and land-cover changes on water resources is requiredto ensure sustainability of land and water resources.
Figure 2 Complex dynamics of global environmental change
14 S Sonak
Land-use and land-cover changes may also have significant impacts onbiodiversity, nutrient recycling, soil biology, including micro-flora, climate, andpollution of water resources, particularly in coastal areas. Alternatively,biodiversity or the biota is an important component in the functioning of the earthsystem. For example, the type of vegetation present on the land surface influencesthe amount of water transpired back to the atmosphere and the absorption orreflection of the sun’s radiation. The vegetation’s rooting patterns and activity arealso important controllers of both carbon and water storage and of fluxes betweenthe land and the atmosphere (Steffen, Sanderson, Tyson, et al. 2004).
Land and oceans act as sinks for the waste CO2 (carbon dioxide) emittedby humans. The world’s oceans absorb CO2 equivalent to about 35% of the emis-sions from fossil fuel combustion (Barrett and Scott 2003). Plants absorb CO2
during photosynthesis and store it in their tissues. This helps to reduce the accu-mulation of CO2 in the atmosphere and mitigate climate change. Phytoplanktonsfrom water also absorb CO2 through photosynthesis. The nature of thephytoplankton species involved in the carbon fixing may hold a key to the rateof, and potential for, carbon storage (Steffen, Sanderson, Tyson, et al. 2004). Theterrestrial biota plays a vital role in maintaining carbon concentration. However,the build-up of CO2 in the earth system has been so rapid that the sink capacityof the oceans as well as land has reduced and is inadequate to accommodatefurther emission. Forest, as source and sink for carbon, has been very much atthe centre of the discourse on global change. Feedbacks on deforestation as wellas land-use and land-cover change and climate change have received attentionfor the past several decades.
Changes in marine ecosystems as a result of human activities are no lesssignificant. Land-use changes affect water courses through soil erosion, run-off,and siltation. Land-based activities are primarily responsible for coastal and ma-rine pollution. This may affect marine and coastal biodiversity creatingcascading effects. Eutrophication resulting from coastal and marine pollutionposes threats to fisheries and further serious concerns to human health throughbiomagnification effects. Further, apart from being a major protein source forhumans, fish generate a number of ecosystem services that are important forhuman welfare. With the current trend of fisheries exploitation, a number ofecosystem services generated by fish populations are at risk, with consequencesfor biodiversity, ecosystem functioning, and ultimately human welfare(Holmlund and Hammer 1999). Climate change and global warming are expectedto affect marine biodiversity significantly. Furthermore, increasing atmosphericCO2 is changing the carbonate chemistry in the surface waters of the ocean,making it more difficult for the reef organisms to form their hard shells.
Precipitation recycling or the water cycle is yet another important connec-tion between the climate change and land-use and land-cover changes. Changesin the precipitation patterns and evapotranspiration are two major effects ofclimate change. Sea-level rise and salinity intrusion are projected to have
Global environmental change: an overview 15
considerable impacts on fresh water, particularly groundwater. GIWA (GlobalInternational Water Assessment) focuses on five major threats in relation to wa-ter: shortage of fresh water, overfishing, pollution, habitat destruction, andglobal climate change (Hempel and Daler 2004).
Integrated information
There is little doubt now that global change is a reality and that it will affect life-supporting systems of the earth. Food security (land), water resources, air, andbiota are the most important systems that will be affected. These threats coupledwith the complex dynamics of GEC warrant a need for integrated assessment.However, despite the recognition of the need for an integrated approach and ofimportance of including other components of the environment, a few such stud-ies exist in reality. Parry (2004), after analysing the content of the GEC journal,observes that about half of the research papers during the period 1990–93 wereon global warming and, despite the efforts to reduce this proportion, theamount has actually increased. This implies that many topics are not getting theexposure that they deserve. Parry (2004) further notes that species extinction,land-use change, land degradation, water supply and quality, and new technol-ogy hazards were not being addressed in GEC, and these are stillunderrepresented. Hence, this volume attempts to bring together case studiesthat address other aspects of GEC. These case studies reflect concerns regardingenvironmental threats that may not be mere consequences of climate change,but stem from various other causes, most often, of local origin. Nevertheless,they are focus of study of several international programmes.
Effective environmental policies can be crafted only if integrated informa-tion from various perspectives is available. The approach in the present volumehas been to integrate such perspectives. The ultimate goal is to contribute to thedevelopment of an integrated, broader scientific perspective that will fosterinter/multidisciplinary research and promote studies on various environmentalissues occurring at local level. This volume is expected to cultivate interest onlocal case studies among the international community working on GEC issuesand to further the understanding regarding the necessity for integration of re-search on local case studies into global issues. It is hoped that concerns aboutother components of environment and issues occurring at the local level willemerge in the research agenda on GEC.
In sum, the main objectives of this volume are threefold.1 Local-level case studies that cumulatively make significant impacts at global
level2 Concerns related to various components of GEC beyond climate change3 Integrated efforts that transcend disciplinary boundaries and underscore the
need to study ‘Multiple dimensions of global environmental change’.
16 S Sonak
References
Abbott A, Abel P D, Arnold D W, Milne A. 2000Cost–benefit analysis of the use of TBT: the case for a treatment approachScience of the Total Environment 258: 5–19
Alzieu J, Sanjuan J, Deltreil J P, Borel M. 1986Tin contamination in Arcachon Bay: effects on oyster shell anomaliesMarine Pollution Bulletin 17: 494
Atlas. 2001Cassell’s Atlas of EvolutionLondon: Casell & Co., Wellington House. 368 pp.
Barrett J and Scott A. 2003The application of the ecological footprint: a case of passenger transport inMerseysideLocal Environment 8 (2): 167–183
Biermann. 2001Big science, small impacts in the South? The influence of global environmentalassessments on expert communities in IndiaGlobal Environmental Change 11: 297–309
Birchenough A C, Barnesa N, Evans S M, Hinz H, Krönke I, Moss C. 2002A review and assessment of tributyltin contamination in the North Sea, basedon surveys of butyltin tissue burdens and imposex/ intersex in four species ofneogastropodsMarine Pollution Bulletin 44 (6): 534–543
Burke L, Kura Y, Kassem K, Revenga C, Spalding M, McAllister D. 2001Pilot Analysis of Global Ecosystems: coastal ecosystemsWashington, DC: World Resources Institute
Cash D W and Moser S C. 2000Linking global and local scales: designing dynamic assessment andmanagement processesGlobal Environmental Change 10: 109–120
Chiavarini S, Massanisso P, Nicolai P, Nobili C, Morabito R. 2003Butyltin concentration levels and imposex occurrence in snails from the Siciliancoasts (Italy)Chemosphere 50: 311–319
Crutzen P and Stoermer E. 2000The anthropoceneIGBP Global Change Newsletter 41: 17–18
Global environmental change: an overview 17
De Metrio G, Corriero A, Desantis S, Zubani D, Cirillo F, Deflorio M, Bridges C R,Eicker J, de la Serna J M, Megalofonou P, Kime D E. 2003Evidence of a high percentage of intersex in the Mediterranean swordfish(Xiphias gladius L.)Marine Pollution Bulletin 46 (3): 358–361
Evans S M. 1999TBT or not TBT? That is the questionBiofouling 14 (2): 117–129
Evans S M and Nicholson J. 2000The use of imposex to assess tributyltin contamination in coastal waters andopen seasThe Science of the Total Environment 258: 73–80
Evans S M, Birchenough A C, and Brancato M S. 2000The TBT ban: out of the frying pan into the fire?Marine Pollution Bulletin 40 (3): 204–211
Harrington L M B and Lu M. 2002Beef feedlots in southwestern Kansas: local change, perceptions, and the globalchange contextGlobal Environmental Change 12: 273–282
Hempel G and Daler D. 2004Why a GIWA?Ambio 33 (1–2): 2–6
Holmlund C M and Hammer M. 1999Ecosystem services generated by fish populationsEcological Economics 29: 253–268
Hong H, Takahashi S, Min B, Tanabe S. 2002Butyltin residues in blue mussels (Mytilus edulis) and arkshells (Scapharcabroughtonii) collected from Korean coastal watersEnvironmental Pollution 117 (3): 475–486
IPCC (Intergovernmental Panel on Climate Change). 2001aClimate change 2001: impacts, adaptation, and vulnerability technical summary[A Report of Working Group II of the IPCC]
IPCC (Intergovernmental Panel on Climate Change). 2001bClimate change 2001: summary for policymakers[A Report of Working Group I of the IPCC]
18 S Sonak
Lambin E F, Turner B L, Geist H J, Agbola S B, Angelsen A, Bruce J W, Coomes O T,Dirzo R, Fischer G, Folke C, George P S, Homewood K, Imbernon J, Leemans R, LiX, Moran E F, Mortimore M, Ramakrishnan P S, Richards J F, Skånes H, Steffen W,Stone G D, Svedin U, Veldkamp T A, Vogel C, and Xu J. 2001The causes of land-use and land-cover change: moving beyond the mythsGlobal Environmental Change 11: 261–269
López T del Mar, Aide T M, and Thomlinson J R. 2001Urban expansion and the loss of prime agricultural lands in Puerto RicoAmbio 30 (1): 49–54
Parry M. 2004Global environmental change since 1993Global Environmental Change 14: 195
Pauly et al. 1998Fishing down marine food websScience 279: 860–863
Ramankutty N, Foley J A, and Olejniczak N J. 2002People on the land: changes in global population and croplands during the 20thcenturyAmbio 31 (3): 251–257
Ramon M and Amor M J. 2001Increasing imposex in populations of Bolinus brandaris (Gastropoda: Muricidae)in the north-western MediterraneanMarine Environmental Research 52: 463–475
Rees C M, Brady B A, and Fabris G J. 2001Incidence of imposex in Thais orbita from Port Phillip Bay (Victoria, Australia),following 10 years of regulation on use of TBTMarine Pollution Bulletin 42 (10): 873–878
Steffen W, Sanderson A, Tyson P D, Jäger J, Matson P A, Moore III B, Oldfield F,Richardson K, Schellnhuber H J. Turner II B L, Wasson R J. 2004Global Change and the Earth System: a planet under pressure[Executive Summary]Sweden: IGBP Secretariat
Turner II B L, Kasperson R E, Meyer W B, Dow K M, Golding D, Kasperson J X,Mitchell R C, Ratick S J. 1990Two types of global environmental change: definitional and spatial-scale issuesin their human dimensionsGlobal Environmental Change: 14–22
Global environmental change: an overview 19
Turner II B L, Skole D, Sanderson S, Fisher G, Fresco L, Leemans R. 1995Land-use and Land-cover Change Science/Research Plan[IGBP Report no 35 and HDP report no 7]Stockholm and Geneva: IGBP and HDP. 132 pp.
World Resources. 2000World Resources 2000–2001: people and ecosystems: the fraying web of lifeWashington DC: World Resources Institute. 389 pp.
Bibliography
Darwin R and Kennedy D. 2000Economic effects of CO2 fertilization of crops: transforming changes in yield intochanges in supplyEnvironmental Modeling and Assessment 5 (3): 157–168
Reilly J, Tubiello F N, McCarl B, Melillo J. 2001Impacts of climate change and variability on agricultureIn US National Assessment Foundation Document[National Assessment Synthesis Team]Washington, DC: US Global Change Research Programme
Uusivuori J, Lehto E, and Palo M. 2002Population, income and ecological conditions as determinants of forest areavariation in the tropicsGlobal Environmental Change 12: 313–323
Wilkie D, Morelli G, Rotberg F, Shaw E. 1999Wetter isn’t better: global warming and food security in the Congo BasinGlobal Environmental Change 9: 323–328

Land-use andland-cover change
Section 1

Change of coastal land use, its impact,and management options
Arvind G Untawale
In the recent past, coastal zone is increasingly being used in an unplanned way,which has resulted in its degradation. There are unique living ecosystems alongthe coasts, such as mangroves, sand dune vegetation, corals, seaweeds, benthos,and fisheries. The coastal communities directly and also indirectly dependupon these ecosystems for their livelihood. These are some of the most pro-ductive natural systems and are ecologically and economically very significant.
However, due to monitory benefits, vested interests as also lack of infor-mation and awareness, the natural as well as designated coastal land use hasbeen changed at several places along the Indian coast. Deforestation, reclama-tion, and pollution have become routine practices in spite of legislativeprotection like Coastal Regulatory Zone, Wildlife Protection Act (1972), etc.,being in place.
There have been efforts towards preservation and conservation of thecoastline in the form of biosphere reserves, wildlife sanctuaries, marine parks,germplasm preservation centres, and protected areas.
It is concluded that for sustainable development and utilization of thenatural coastal living and non-living resources, there is a need for more aware-ness. Efforts to understand the natural processes and man-made changes areessential for proper coastal land-use plan.
Introduction
Indian coast enjoys the typical tropical climatic pattern mainly influenced by themonsoonal effect. The Indian peninsula is flanked by the Arabian Sea on thewest and Bay of Bengal on the east, which are the arms of ‘closed’ Indian Ocean.There are two unique offshore, oceanic island systems of Andaman and NicobarIslands, and Lakshadweep atolls. Apart from major and minor estuaries, thereare gulfs and undulated coastline with varying types of geology andgeomorphology.
1
24 A G Untawale
From estuarine regime to the coastal region as well as the subtidal,offshore, and deep oceans, there are unique marine living ecosystems withspecial structures, functions, and biodiversity. These range from unicellularplanktonic organisms to higher flora and fauna (Adams and Wall 2000;Dwivedi 1990). Marine living ecosystems observed along the Indian coastsare sand dune vegetation, mangroves, seagrasses, corals, marine algae,planktons, and fisheries (Bakus 1994; Falkowski 2002). The coastal zone isknown for its rich biodiversity and productivity. However, man-made changeshave influenced this zone, affecting its biota. Now, the ongoing climate changeis threatening the coastal ecosystems (Kjerfve, Michener, and Goudener 1994;Pernetta and Elder 1993; Shukla, Sharma, and Ramana 2002; Walter, Post,Convey, et al. 2002).
The ecological impacts of recent climate change on the tropical marine eco-systems have been proved scientifically. The responses of flora and fauna spanan array of ecosystems and organizational hierarchies from the species to thecommunity level. Although we are only at an early stage in the projected trendsof global warming, ecological responses to the recent climate change are alreadyclearly visible (Beardall, Beer, and Raven 1998; Bhattathiri 1992; Falkowski 2002;Untawale 1980; Untawale and Jagtap 1991; Walter, Post, Convey, et al. 2002).
These living ecosystems are conspicuously associated with the microbialflora acting at various levels of productivity, and are responsible for several im-portant biological processes. Marine ecosystems are perhaps the richest in theirbiodiversity and can range from unicellular organisms like bacteria andplanktons to multicellular giant animals like whales (Adams and Wall 2000;Bakus 1994; Banerjee, Rao, Sastry, et al. 2002; Untawale, Kathiresan, andDeshmukh, et al. 2000).
Coastal ecosystems stand to be drastically impacted as a result of changein land-use plan. The coastal environment is migrating landward and bringingabout shifts in marginal vegetation and fauna. In each instance, the coastal eco-system changes are more pronounced because of the local development alongthe landward merging, which hinders the stress and local impact (Kjerfve,Michener, and Goudener 1994).
Sand dune ecosystem
Coastal dunes are made of sand that is piled high by the wind. Sand is the by-product of weathered rocks from inland regions. These inland rock formationshave been eroded by rain and wind and washed into the rivers that eventuallyflow into the ocean. Once in sea, the sand is shifted up the coast by currents andwave action. Sand on the continental shelf gets shifted around continuouslybetween the sea-floor, beach, and dunes. Wave action deposits the sand contain-ing heavy minerals onto the beach and thereafter, sand is blown into the dunesby the prevailing onshore winds. Shells, corals, and other skeletal fragments
Change of coastal land use, its impact, and management options 25
provide sediments to some beaches, especially to those in the tropics (Banerjee,Rao, Sastry, et al. 2002; Desai and Untawale 2002; Rao and Sastry 1972; Turner,Stella, Carr, et al. 1962; Untawale 1980).
Dune formation
Coastal features are both natural and man made. Dunes are built of sand, whichis blown inland from the high water and piles up on the existing strata. Untilthey are vegetated, dunes are constantly growing and shifting. Normal soil-forming processes do not affect sand dunes very much, and at the outset theyare virtually devoid of nutrients.
Vegetation plays a dominant role in determining the size, shape, and sta-bility of the fore dunes. Aerial parts of the vegetation obstruct the wind andabsorb wind energy. Wind velocity near vegetation is thus reduced and, hence,sand deposits around the vegetation. A characteristic of dune vegetation, par-ticularly the grasses growing under these conditions, is its ability to produceupright stems and new roots in response to sand covering. If plants do not con-tinue to grow more rapidly than the rate of deposition, the arresting action ofthe plant ceases. Successive stages of plant growth and sand deposition result inan increase in width and height of the dunes (Desai and Untawale 2002).
Dune vegetation is highly adapted to the salt-laden winds of the coast, andmaintains the fore dunes by holding the sand already in the dunes, trappingsand blown up from the beach, and aiding in the repair of damage inflicted onthe dunes either by natural phenomena or by human impact. A combination ofdune height, dune shape, and intact vegetation creates a protective system thatdirects winds upwards and over the dune crest. As a result, salt-sensitivevegetation communities, including littoral rainforests, can establish in closeproximity to the beach (Untawale 1980).
Classification of sand dune vegetation
Coastal sand dunes along with the vegetation are variously classified by differ-ent scientists throughout the world. One of the oldest classifications is given byTurner, Stella, Carr, et al. (1962). They described five well-defined zones of veg-etation.
Zone I—Embryonic dune This zone is nearest to the sea and is un-vegetated. It is in the initial stages of formation.
Zone II—Fore dune It runs parallel to the first beach ridge and has sand-binding grasses like Spinifex littoreus growing on it. Some herbs and shrubs thatare not actually sand binders from the nearby salt marshes and from the nextzone are also included in this region.
Zone III—Dune scrub This is close to the fore dune. It is higher than thefore dunes and forms the main part of the dune. Different types of shrubs growhere.
26 A G Untawale
Zone IV—Shrub woodland It is a long and narrow sandy ridge runningparallel and separated by sand flats.
Zone V—Dune woodland This is made up of the stable sand dunes withvegetation community similar to that found in the neighboring coastal region ofthe main land.
Untawale (1980) classifies the sand dune vegetation forming a natural tri-angle with the herbaceous pioneer zone at the base, and back shore zonecovered with trees at the apex. This vegetational profile diverts the wind flowupwards, controlling erosion. On the pioneer zone, herbs with creeping stolongrow. In the mid-shore zone, herbs and shrubs with comparatively deeper rootsystem are seen to be growing naturally. And further on the backshore, dunetrees are found. This natural vegetation has to be maintained as it successfullyutilizes groundwater. Any change in the growth pattern will interfere with thedynamics of sand dunes.
Mangrove ecosystem
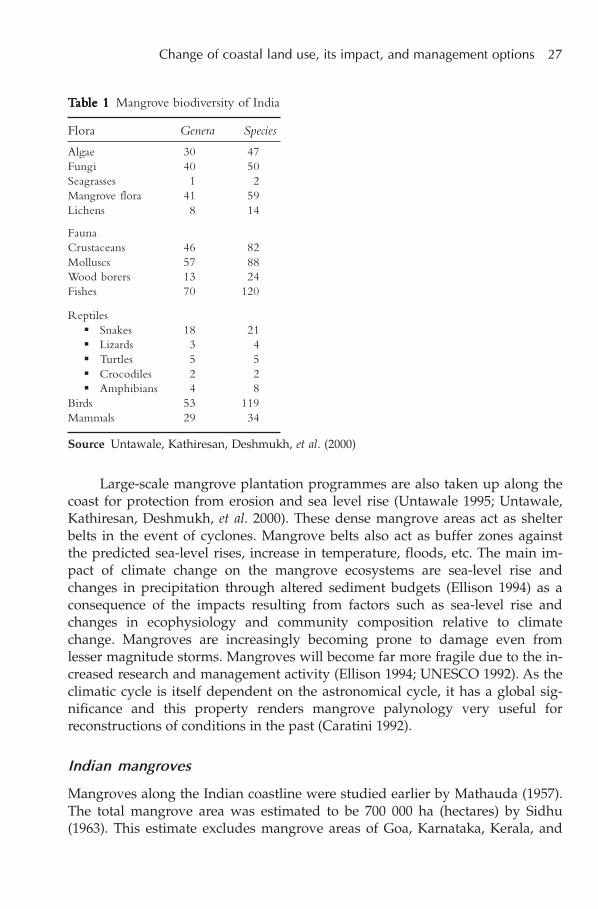
Mangroves are a very unique tropical intertidal ecosystem (Blasco 1975). Theseare a group of different angiosperm plants that can tolerate salinity and tidal in-undation. These trees favour soft silty clay soil. Because of their dense rootsystem and the seedling growth, mangroves are known to prevent erosion andincrease accretion or sedimentation due to the ‘flocculation’ effect (Untawaleand Jagtap 1991; Vaidyanadhan 1991). For their growth, these trees need con-tinuous fresh water and sediment flow from the upstream region along withnutrients. This open ecosystem can recycle nutrients, through the process ofdecomposition (Untawale 1985). The mangrove biodiversity is considered to bevery high as compared to other ecosystems as shown in Table 1 (Banerjee, Rao,Sastry, et al. 2002; Naskar and Mandal 1999; Untawale, Kathiresan, Deshmukh,et al. 2000)
Due to various reasons, vast tracts of mangroves have been deforested andreclaimed during the past several centuries. The process is still continuing inspite the Coastal Zone Regulations (1991), Forest Conservation Act (1980), andWildlife Protection Act (1972).
Mangrove swamps are also considered to be the breeding, feeding, andnursery grounds with very high biodiversity. These areas are also scientificallyconsidered the ‘sinks’ for methane. Mangrove forests also use a huge quantity ofCO2 (carbon dioxide) produced due to various man-made activities. It is, there-fore, essential to protect and manage this important mangrove ecosystem,which is a connecting link between land and sea.
Several luxuriant mangrove areas have been declared as biosphere reserves,wildlife sanctuary, mangrove parks, or protected areas. ‘Mangrove GermplasmPreservation Centers’ at Kalibhanjdia in Orissa is one such example.
Change of coastal land use, its impact, and management options 27
Large-scale mangrove plantation programmes are also taken up along thecoast for protection from erosion and sea level rise (Untawale 1995; Untawale,Kathiresan, Deshmukh, et al. 2000). These dense mangrove areas act as shelterbelts in the event of cyclones. Mangrove belts also act as buffer zones againstthe predicted sea-level rises, increase in temperature, floods, etc. The main im-pact of climate change on the mangrove ecosystems are sea-level rise andchanges in precipitation through altered sediment budgets (Ellison 1994) as aconsequence of the impacts resulting from factors such as sea-level rise andchanges in ecophysiology and community composition relative to climatechange. Mangroves are increasingly becoming prone to damage even fromlesser magnitude storms. Mangroves will become far more fragile due to the in-creased research and management activity (Ellison 1994; UNESCO 1992). As theclimatic cycle is itself dependent on the astronomical cycle, it has a global sig-nificance and this property renders mangrove palynology very useful forreconstructions of conditions in the past (Caratini 1992).
Indian mangroves
Mangroves along the Indian coastline were studied earlier by Mathauda (1957).The total mangrove area was estimated to be 700 000 ha (hectares) by Sidhu(1963). This estimate excludes mangrove areas of Goa, Karnataka, Kerala, and
TTTTTababababable 1le 1le 1le 1le 1 Mangrove biodiversity of India
Flora Genera Species
Algae 30 47Fungi 40 50Seagrasses 1 2Mangrove flora 41 59Lichens 8 14
FaunaCrustaceans 46 82Molluscs 57 88Wood borers 13 24Fishes 70 120
Reptiles Snakes 18 21 Lizards 3 4 Turtles 5 5 Crocodiles 2 2 Amphibians 4 8
Birds 53 119Mammals 29 34
Source Untawale, Kathiresan, Deshmukh, et al. (2000)
28 A G Untawale
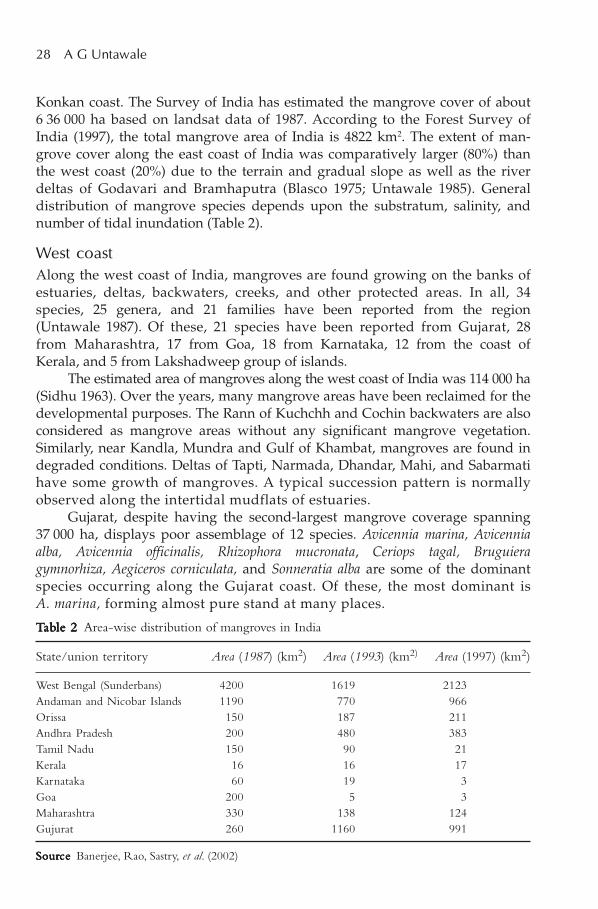
Konkan coast. The Survey of India has estimated the mangrove cover of about6 36 000 ha based on landsat data of 1987. According to the Forest Survey ofIndia (1997), the total mangrove area of India is 4822 km2. The extent of man-grove cover along the east coast of India was comparatively larger (80%) thanthe west coast (20%) due to the terrain and gradual slope as well as the riverdeltas of Godavari and Bramhaputra (Blasco 1975; Untawale 1985). Generaldistribution of mangrove species depends upon the substratum, salinity, andnumber of tidal inundation (Table 2).
West coast
Along the west coast of India, mangroves are found growing on the banks ofestuaries, deltas, backwaters, creeks, and other protected areas. In all, 34species, 25 genera, and 21 families have been reported from the region(Untawale 1987). Of these, 21 species have been reported from Gujarat, 28from Maharashtra, 17 from Goa, 18 from Karnataka, 12 from the coast ofKerala, and 5 from Lakshadweep group of islands.
The estimated area of mangroves along the west coast of India was 114 000 ha(Sidhu 1963). Over the years, many mangrove areas have been reclaimed for thedevelopmental purposes. The Rann of Kuchchh and Cochin backwaters are alsoconsidered as mangrove areas without any significant mangrove vegetation.Similarly, near Kandla, Mundra and Gulf of Khambat, mangroves are found indegraded conditions. Deltas of Tapti, Narmada, Dhandar, Mahi, and Sabarmatihave some growth of mangroves. A typical succession pattern is normallyobserved along the intertidal mudflats of estuaries.
Gujarat, despite having the second-largest mangrove coverage spanning37 000 ha, displays poor assemblage of 12 species. Avicennia marina, Avicenniaalba, Avicennia officinalis, Rhizophora mucronata, Ceriops tagal, Bruguieragymnorhiza, Aegiceros corniculata, and Sonneratia alba are some of the dominantspecies occurring along the Gujarat coast. Of these, the most dominant isA. marina, forming almost pure stand at many places.
TTTTTababababable 2le 2le 2le 2le 2 Area-wise distribution of mangroves in India
State/union territory Area (1987) (km2) Area (1993) (km2) Area (1997) (km2)
West Bengal (Sunderbans) 4200 1619 2123Andaman and Nicobar Islands 1190 770 966Orissa 150 187 211Andhra Pradesh 200 480 383Tamil Nadu 150 90 21Kerala 16 16 17Karnataka 60 19 3Goa 200 5 3Maharashtra 330 138 124Gujurat 260 1160 991
SourSourSourSourSourcecececece Banerjee, Rao, Sastry, et al. (2002)
Change of coastal land use, its impact, and management options 29
The status of mangroves in the Gulf of Kuchchh is generally degradingexcept at the mouth of the Kori Creek, along the north-west coast, where one ofthe largest patches of mangroves along the west coast of India thrives. Thispatch is naturally protected. Down south, the Maharashtra coast has compara-tively better mangrove formations; however, the pressure is continuouslyincreasing on mangroves in and around Mumbai coast because of the develop-mental pressures. Goa state has well preserved a small area of mangroves.Towards south, Karnataka has a few pockets of mangroves here and there (Raoand Sastry 1972). Down south, along the Kerala coast, very good mangroveswere reported (Chand Basha 1992). Mangrove area is fast dwindling and urgentefforts are needed for large-scale mangrove plantation.
East coast
About 80% of the total mangroves along the Indian coast are situated along theeast coast. In all, 48 mangrove species have been recorded from the east coast.The deltaic system of Ganga, Godavari, Mahanadi, Cauvery, and Krishna hasluxuriant mangrove forests. Species of Avicennia and Aegiceras form the domi-nant vegetation of Godavari, Krishna, and Cauvery deltaic systems, whileCeriops decandra and Sonneratia apetala form the dominant mangrove of theMahanadi delta. The Gangetic Sunderbans have thick mangrove forest with atotal area of approximately 420 000 ha. About 33 species of mangroves havebeen reported from this area: examples are Heritiera fomes, C. decandra,Xylocarpus spp., Lumnitzera sp., S. alba, Kandelia candel, Nypa fruticans, andPheonix paludosa. The dense mangroves of Bengal are dominated by Excoecariaagallocha, C. decandra, S. apetala, Avicennia sp., B. gymnorhiza, Xylocarpus granatum,Xylocarpus moluccensis, Aegiceras corniculatum and R. mucronata. The species ofR. mucronata, Rhizophora apiculata, C tagal, C. decandra, B. gymnorhiza, Lumnitzeraracemosa, S. apetala, Acanthus ilicifolius, A officinalis, A. marina, E. agallocha, andAcrostichum aureum have a uniform distribution along the east and west coast ofIndia.
In the shallow areas under constant influence of tide and freshwater influx,mangrove species such as Nypa fruticans, A. routindifolia, and Phoenix paludosashowed luxuriant growth.
The other deltaic area with luxuriant mangrove forests is 21 458 ha ofMahanadi estuary. The flora of the Mahanadi delta was represented by domi-nant species of S. apetala, H. fomes, Aegialites spp., P. paludosa, A. aureum,Xylocarpus sp., R. mucronata, Bruguiera gymnorhiza, B. caryophylloides, E. agallocha,etc. Although, there is a high floral diversity, the growth was found to bestunted due to indiscriminate destruction, loss of soil cover, land erosion, degreeof greater salt water penetration, and diminishing fresh water.
Bhitarkanika Wildlife Sanctuary is situated in the north of Mahanadi delta.This site has the largest number of mangrove species with variation in genusXylocarpus representing species like Xylocarpus moluccensis, Xylocarpus
30 A G Untawale
mekongensis, and Xylocarpus sp. This site is the primary centre of biodiversity forHeritiera kanikensis and H. fomes and is being maintained as wildlife sanctuaryand reserve forest for a variety of bird and endangered animal species.
Godavari and Krishna estuarine complex have a total mangrove area of20 000 ha and provide thick mangrove cover. The dominant mangrove speciespresent are Rhizophora mucronata, Rhizophora conjugata, C. roxburchiana,B. gymnorhiza, L. racemosa, E. agallocha, A. marina, A. officinalis, etc. The Godavariestuary is dominated by mangrove species such as A. marina, A. officinalis, andSonnaratia apetala. In all, 22 mangroves and associated species are found in thisforest. The Coringa Wildlife Sanctuary is located in this region.
The Tamil Nadu coast is bestowed upon by two major mangrove forma-tions: Pichavaram mangrove with an approximate area of 11 000 ha and theCauvery delta with approximately 2450 ha under mangroves. About 20 speciesof mangroves and their associates occur at these sites. Three Rhizophora speciesreported from these sites are R. apiculata, R. mucronata, and the putative hybridspecies of R. roxburghiana. A genetic garden has been established at Pichavaramfor conservation of mangrove genetic resources. Several conservation measuresare being taken to restore this mangrove area by Annamalai University andState Forest Department.
Other areas such as Point Calimer, Rameshwaram, and Gulf of Mannarshowed degraded patchy mangrove formations fringing the scattered islands.About 20 mangrove species have been recorded from these areas with A. marinaas the dominant species. Some pure formations of mangroves like E. agallocha,and C. tagal have also been recorded from the Rameshwaram and Gulf ofMannar islands (Blasco 1975).
The Andaman Group of Islands consists of 204 islands covering an area of6400 km2, out of which about 1150 km2 is covered by mangroves. The Nicobargroup comprises 22 islands covering an area of 1600 km2 of which 35 km2 is cov-ered with mangroves (Blasco 1975). Mangrove species recorded from thesegroups of islands were R. apiculata, R. mucronata, and Sonneratia caseolaris in theproximal zone; S. caseolaris, B. gymnorhiza, A. officinalis, and Ceriops tagal in themiddle zone and Heritiera littoralis as well as Pandanus sp. in the distal zone.
Other ecosystems
Flora
There ia a limited data to come to conclusions. However, on the basis of avail-able information, it is possible to make predictions about the impacts ofincreased CO2 concentrations, temperature, and UV-B fluxes. With the increasein CO2, seagrasses will show enhanced photosynthetic rates and growth whileintertidal macro-algae may not show enhanced growth. Interactions betweentemperature range and photoperiod can be responsible for excluding species
Change of coastal land use, its impact, and management options 31
from particular regions of the world’s oceans. Climate change may well haveother effects on the efficiency with which marine plants use other resources,such as nitrogen, iron, or zinc (Beardall, Beer, and Raven 1998).
Algae and sea grasses
The coastal ecosystem provides a good shelter for marine algal growth anddiversified seaweed flora is often observed. Some of the algae, though in minorscale, are responsible for reef building. There are certain algae that have calciumcarbonate deposition and are known as coralline algae. The role of calcareousalgae is, however, less significant in the Indian Ocean than in the Pacific Ocean.Jagtap (1987) reported 20-m-wide algal ridge on the seaward side of Kavarattiand Agathi Islands of Lakshadweep.
The maximum marine algal biodiversity – of more than 180 species and 99genera – is reported from Gulf of Mannar and Palk Bay (Rao 1972). Halimedaopuntia contributed to 20% of the total sampling. Altogether, 82 marine algalspecies are recorded from the Lakshadweep lagoons with an estimated annualyield of 3645–7598 million tonnes of fresh weight per year (Subbaramaiah,Ramarao, and Nair 1979). Rhodophycean species were maximum in number (39)followed by 33 green and 10 brown algal species. From Andaman and NicobarIslands, 64 species and 40 genera were reported, including 27rhodophycean, 21 chlorophycean, and 15 Phacophycean species (Untawale,Dhargalkar, and Deshmukhe 2000).
Palk Bay and the Gulf of Mannar have extensive seagrass beds. Jagtap(1996) reported 12 species and seven genera of seagrasses from this area. Fivespecies of seagrasses were reported from the Minicoy lagoon by Untawale andJagtap (1984). The common genera were Thallasia, Halophila, and Cymodocea.Kavaratti lagoon has luxuriant seagrass growth of Thalassia and Cymodocea.
Phytoplankton
Phytoplankton populations are parts of the marine food chain. As these speciesare capable of floating on the surface water and sometimes also migrating verti-cally, sea level rise will have very little impact on them. However, due toincrease in sea surface temperature and the resultant increase in nutrient con-centration, there is a possibility of ‘eutrophication’ in certain areas. Due to theavailability of essential environmental conditions and nutrients, the planktonicspecies show the phenomenon of ‘eutrophication’. The best example of this isobserved along the west coast during pre-monsoon blooms of Trichodesmiumerythraeum: a blue green alga. The euphotic zone of the 200 m (metres) watercolumn shows the presence of several phytoplanktonic species that are unicel-lular in nature.
There is sufficient information available on the productivity ofphytoplankton in the Arabian Sea (Radhakrishna, Bhattathiri, and Devasi 1978;Qasim 1982; Bhattathiri 1992). Goes, Gomes, Govea, et al. (1992) studied the
32 A G Untawale
distribution and production of phytoplanktons by using satellite imageries forchlorophyll images along the west coast of India. Intense cooling in the Gulf ofKuchchh that has high phytoplankton biomass, is an interesting phenomenon.
There is no systematic list of phytoplankton species available and most ofthe work carried out is site specific. It is necessary to document all availablephytoplankton species systematically, along with the important environmentalparameters.
Impact on marine ecosystems
Extensive review of the available literature on the marine ecosystems alongthe Indian coast prior to 1990 reveals that maximum work on the estuarine,nearshore, coastal, and offshore ecosystems is available on some aspects ofbiology, ecology, biochemistry, reproductive biology, qualitative and quantita-tive distribution as well as taxonomy.
The concept of climate change is of recent origin. However, a few geologi-cal publications have significantly contributed to the climate change and itsimpact on the Indian coast (Vaidyanadhan 1991). Several scientific papers havebeen published on the impact of sea-level rise on the coastal environments in abook edited by Rajamanickam (1990). Untawale and Jagtap (1991) havereported the formation of mudbanks, deltaic islands, and the growth of man-groves, and ‘climatic climax’ to stabilize the systems in major deltas likeSunderbans. The recent publication on Climate Change in India (Shukla, Sharma,and Ramana 2002; Sukumar, Saxena and Untawale 2003; Untawale 2003) dealsin greater details with the Indian scenario related to various aspects like pastand present circumstances, model projections, mitigations, forests, food securi-ties, sustainable developments, and future strategies.
There are numerous publications on the marine biology of Indian coasts.However, very few directly relate to the climate change or its resultant impact.These contributions, however, could be used for estimating the impact and alsoto identify gaps in information for deciding future line of action. Recently, moreemphasis has been placed on ‘biodiversity’ studies (Untawale, Kathiresan,Deshmukh, et al. 2000).
Communities of plants in the coastal areas are adapted not only to themean sea level but also to the regular short-term changes or variability in sealevel associated with the tidal cycle and recurring seasonal changes. It is, there-fore, necessary to study the impact of climate change like sea-level rise andincrease in temperature on marine ecosystems, keeping in view their structuresand functions.
It has been argued that even in case of infrequent episodic events, the com-munities concerned are adapted to disturbance and that disturbance, indeed,may be necessary to maintain the biodiversity of some mangrove communities.Such policies should be designed to address the present problems in coastal
Change of coastal land use, its impact, and management options 33
zones with a view to strengthen the natural capacity of coastal systems to re-spond to changes.
At present, scientific consensus seems to suggest that global mean surfacetemperature has risen by around 0.6 ± 0.2 ºC over the past century and that itwill rise further by about 2.5 ºC by 2050, perhaps reaching 4 ºC by 2100. It is tobe expected, therefore, that direct effects on productivity of coastal biologicalcommunities will occur with some changes in species distribution and composi-tion (Ellison 1994; Pernetta and Elder 1993).
There is a need for a coordinated and multi-disciplinary approach toimpact assessment rather than a narrow sectoral approach. Potential impactsmay be directly related to temperature and other components of climate. Sec-ondary impacts in coastal areas resulting from the rise in global meantemperature will include changes in relative humidity; run-off and river flowrates; coastal soils and soil fertility; salinity and coastal water chemistry; the dis-tribution, intensity, and possibly also the frequency of storms and coastalflooding along with habitat changes.
Such changes will affect coastal vegetation distribution and abundance,which, in turn, will, alter the animal distribution as well as abundance and theoverall productivity of natural and agricultural systems on land. Such changeswill also affect human drinking water supplies and require changes in freshwater management practices. In addition, these changes will alter coastal watersalinity and mixing, which will change coastal marine ecosystems. All of thiswill have varying social and economic impacts in different areas.
Coastal land-use plan
Land-use pattern has been studied in coastal regions by several scientists fromdifferent parts of the world. Coastal ecosystems have been economically usedand ecologically misused in many countries. In India also, pristine mangrovesof Sunderbans were deforested and reclaimed by the East India Company fortheir economic benefits. Vast mangrove areas were cleared for housing, indus-tries, agriculture, and aquaculture, and the trend still continues even afterIndependence. Similarly, during 1670 there were seven islands of Mumbai. OnceBritish rulers realized the commercial importance of Mumbai, they graduallydeforested fringing mangroves along these islands and reclaimed the area thatis today known as Greater Mumbai. The trend still continues in Mumbai, wherevast mangrove areas are being deforested and reclaimed in Versava, Bandra,Malad, and several creeks of Mumbai. As a result of this change in land use pat-tern, there was a deluge in Mumbai.
Major factors responsible for change in land-use pattern of Indian man-groves are conversions to fish farming, salt works, ports and harbours,industries, housing, slums, etc. Apart from this, vast coastal areas have beendegraded due to overexploitation.
34 A G Untawale
There are two major aspects of mangrove ecosystem, which are affected inthe land-use pattern, These are the mangrove forest and the brackish watersystem that inundates the forest area. Several foresters and researchers havesurveyed these areas and quoted the figures. These figures are continuouslychanging due to the survey techniques and continuous change in land use. Themangrove forest area has drastically reduced from 700 000 ha (Sidhu 1963) torecent figures of 484 400 ha. Untawale (1980) back-calculated the probable man-grove cover (forest and water) to be 1 400 000 ha, using published reports onconversions of estuarine and mangrove areas (Figure 1).
This included mangrove areas, brackish-water fish farm, salt-producingareas, degraded mangrove areas, reclaimed areas, and estuarine areas. With thecomplete understanding of the significance of mangrove ecosystems in thecoastal zone management, ecology, economy, and sociology, there is an urgentneed to reverse the trend of mangrove deforestation and management of man-groves along the Indian coast.
Impact of cover change
The widespread conversion of coastal zones to other uses, such as mariculture,agriculture, industries, housing, etc., has seriously reduced coastal protectionagainst storms, waves, and erosion and the rate of sediment accretion in coastalareas. Kerala has reclaimed several coastal lands for paddy and coconut planta-tion. In such areas, soils have become acid sulphate and yield has reduced.Moreover, these areas have become more prone to inundation. Kharland Deve-lopment Board of Konkan (Maharashtra) has constructed several bunds acrosscreeks thus killing mangroves and causing floods.
Continued protection is the only available alternative to such areas of lowlevels in the country. Ultimately, economic costs of raising protective structuresand pumping of water may outweigh economic benefits, which can be derivedfrom continued use of the land concerned.
Some coastal states are particularly vulnerable. For example, between8 and 10 million people live within 1 m above the sea level in each of the unpro-tected deltas and coastal areas like the Sunderbans and Orissa. It is a well-known fact that every year, the Bay of Bengal experiences number of cyclonesand floods in major rivers. Mangrove forests in good condition protect humanlife and properties from cyclones and floods. The impact of super-cyclone ofOrissa on mangrove and non-mangrove regions have once again proved the sig-nificance of mangroves as a shelter belt (Untawale 2001).
Economic costs of coastal protection and water regulation may be a prohibi-tive factor for India. Alternative strategies that maximize the protection of nature,afforded by ecosystems such as mangrove forests, and enhance the natural rate ofsediment deposition may be the only possible mechanisms for mitigating thepotential impacts of the rising sea level (Mahtab 1991; Untawale 1992).
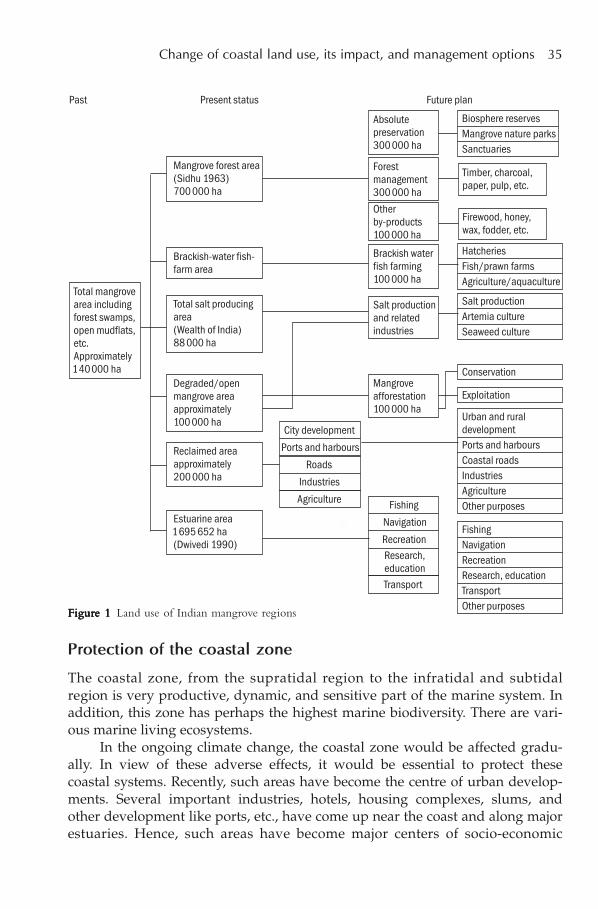
Change of coastal land use, its impact, and management options 35
Protection of the coastal zone
The coastal zone, from the supratidal region to the infratidal and subtidalregion is very productive, dynamic, and sensitive part of the marine system. Inaddition, this zone has perhaps the highest marine biodiversity. There are vari-ous marine living ecosystems.
In the ongoing climate change, the coastal zone would be affected gradu-ally. In view of these adverse effects, it would be essential to protect thesecoastal systems. Recently, such areas have become the centre of urban develop-ments. Several important industries, hotels, housing complexes, slums, andother development like ports, etc., have come up near the coast and along majorestuaries. Hence, such areas have become major centers of socio-economic
FigurFigurFigurFigurFigure 1e 1e 1e 1e 1 Land use of Indian mangrove regions
36 A G Untawale
development at the cost of billions of rupees. Keeping in view these environ-mental, ecological, social, and economical changes, the GoI (Government ofIndia) has taken several measures for sustainable development, conservation,and management of the coastal zone and its sensitive ecosystems.
Protected marine areas
There are several areas, with luxuriant marine flora and fauna along the Indiancoasts, which have been declared as protected under the following differentcategories. Marine biosphere reserves Marine wildlife sanctuaries Marine parks Protected areas Genetic resource centres
In addition to these protective measures, the Ministry of Environment andForests, GoI, considered future climate changes followed by sea-level rise aswell as a growing coastal population and declared a stretch of 500 m belt allalong the Indian coast as a coastal regulation zone.
The inter-tidal region (area between the lowest low tide to highest HTL(high tide line) and 500 m beyond the HTL is considered the coastal regulationzone (1991). The first 200 m from the HTL, is considered ‘no development zone;while the next 300 m may be considered for restricted developments.
There are, however, various categories under the coastal zone for protec-tion which are discussed as follows.
Coastal regulation zone
The area between HTL and 500 m beyond is considered as the CRZ (coastalregulation zone), 1991. The first 200 m from the HTL is considered as a ‘nodevelopment zone’, while the next 300 m may be considered for restricteddevelopment. There are, however, various categories under the coastal zone forprotection that are described subsequently.
Coastal regulation zone – I
This is an important category of the coastal zone and strictly protects all sensi-tive coastal/marine living ecosystems like sand dune vegetation, mangrovesand corals. These ecosystems naturally protect the coastal zone from storms,surges, waves, wind; etc., therefore, all these marine ecosystems along the coastof India (along with the two major groups of islands) are fully protected.
Change of coastal land use, its impact, and management options 37
Other coastal regulation zones
Categories II and III are related to the partially developed or relatively undis-turbed coastal areas, while category IV protects the major and minor islandgroups along the coasts or in the offshore regions.
The Ministry of Environment and Forests, GoI, is a nodal agency for imple-menting the CRZ rules. There are coastal zone management authorities in eachcoastal state and also at the centre.
In addition to the conservation and management of the sensitive coastalzone, the Ministry of Environment and Forests, GoI, also spends a sizableamount on implementation of MAPS (management action plans).
Conservation policies
Policies should be designed to address problems in the coastal zones with aview to strengthen the natural capacity of coastal ecosystems in response tochanges. In simple terms, a dead coral reef cannot grow while a healthy reef hasthe potential to grow and provide continued protection against rising sea levels.Policies designed to halt reef degradations or restore damaged reef ecosystemsmaximize potential for reefs to respond to climate change and sea-level rise.In addition, such policies provide for sustainable use of the renewable livingresources of reef ecosystems and, hence, even in absence of climate change,such policies would provide benefit to future generations (Pernetta andElder 1992, 1993).
Conclusion
The coastal living ecosystems grow at some definite rate under given opti-mum environmental conditions.
Climate change is likely to influence the atmosphere and sea temperature;cyclones; precipitation; floods; coastal erosion and accretion; sea-level rise;and changes in the marine environmental conditions.
At the same time, man-made changes in the upstream and the coastal areassuch as deforestation, reclamation, pollution, extensive human habitation inthe coastal region and its alteration have already created some unwantedenvironmental imbalance, which have started showing their effects and infuture scenarios of further change in the climate, it will have cumulativeimpact.
There are different scenarios one can imagine as a result of land-use change.These may be of extreme, medium, or low impact because there are severalfactors and complicated interactions, which may or may not be visualized asof today.
The existing levels of sea in coastal and estuarine areas are likely to shiftgradually towards the land, particularly in low-lying areas, during the sea
38 A G Untawale
level rise, giving enough time for biological organisms to prepare new habi-tats for their survival, hence, minimum or no loss of biodiversity is predicted.
Due to change in the land-use pattern leading to deforestation and reclama-tion, there will be a definite degradation of the coastal biodiversity.
Considering the worst scenario of extreme impact on the coastal area, it isstrongly recommended that the present CRZ rules of preserving 500 m regionas no development zone (particularly the low-lying area) should be adheredto strictly. Otherwise, in due course it would be a great socio-economic loss tothe country.
All marine ecosystems in coastal areas should be given top priority and pre-served for posterity. Shelter belt areas should be developed on sand dunesand mangrove regions with appropriate density and width, supported byagro-forestry belt of enough dimensions as a buffer zone.
Large-scale afforestation programmes should be taken up on war footing inall catchment areas or watershed regions to minimize erosion, which wouldotherwise increase siltation of estuaries and minimize the water-carryingcapacity.
Acknowledgement
I am grateful to all those who have inspired me to focus my attention on thephenomenon of climate change and its impact on marine living ecosystems andthe human habitation.
References
Adams G A and Wall D H. 2000Biodiversity above and below the surface of soils and sediments: linkages andapplications for global changeBioscience 50 (12): 1043–1048
Blasco F. 1975The mangroves of India[French Institute, Pondicherry]Trav. Sec. Sci. Tech. 14: 1–175
Bakus G E. 1994Coral reef ecosystemsNew Delhi: Oxford and IBH Publishing Co. Pvt. Ltd. 232 pp.
Banerjee L K, Rao T A, Sastry A R K, Ghosh D. 2002Diversity of Coastal Plant Communities in India, ENVIS–EMCBTAPKolkata: Botanical Survey of India, Ministry of Environment and Forests
Change of coastal land use, its impact, and management options 39
Beardall J, Beer S, and Raven J A. 1998Biodiversity of marine plants in an era of climatic change: some predictionsbased on physiological performanceBotanica Marina 41 (1): 113–123
Bhattathiri P M A. 1992Primary production of tropical marine ecosystemsIn Ecology and Management, pp. 269–276, edited by K P Singh and J P SinghNew Delhi: Wiley Eastern
Caratini C. 1992Mangrove pollen in marine quaternary sediments: marker of regional climateevolution and global eustatic sea level changesIn Tropical Ecosystems: ecology and management, pp. 349–357, edited by K P Singh andJ S SinghNew Delhi: Wiley Eastern
Chand Basha S. 1992Mangroves of Kerala: a fast disappearing assetIndian Forester: 175–189
Desai K N and Untawale A G. 2002Sand dune vegetation of Goa: conservation and management, pp. 1–101Panaji: Botanical Society of Goa/Department of Science, Technology andEnvironment of Goa
Dwivedi S N. 1990Biological investigations to understand and mitigate the effects of globalwarming and sea level riseIn Sea Level Variation and its Impact on Coastal Environment, pp. 31–51edited by Rajamanickam
Ellison J C. 1994Climatic change and sea level rise impacts on mangrove ecosystemsIn Impacts of Climatic Change on Ecosystems and Species, Marine and CoastalEcosystems, pp. 11–30Gland (Switzerland): World Wide Fund for NatureWashington, DC: Environmental Protection Authority
Falkowski P G. 2002The ocean’s invisible forestScientific American 287 (2): 54–61
Goes J I, Gomes H do R A, Gouveia A, Devassy V P, Parulekar A H, Rao L V G. 1992Satellite and ship studies of phytoplankton along the west coast of IndiaIn Oceanography of the Indian Ocean, pp. 67–80, edited by B N DesaiDona Paula: Oxford and IBH Publications
40 A G Untawale
Jagtap T G. 1987Distribution of algae, seagrasses and coral communities from LakshadweepIslands, Eastern Arabian SeaIndian Journal of Marine Sciences 16: 256–460
Jagtap T G. 1996Some quantitative aspects of structural components of seagrass meadows fromSoutheast coast of IndiaBotanica Marina 39: 39–45
Kjerfve B, Michener W K, and Goudener L R. 1994Impacts of climate change in estuary and delta environmentsIn Impacts of Climate Change on Ecosystems and Species: marine and coastal ecosystems,pp. 31–44Washington, DC: World Wide Fund for Nature, Environmental ProtectionAuthorityStockholm: Swedish International Development Authority
Mahtab F U. 1991Implications of global changes for BangladeshIn Environmental Implications of Global Change, pp. 69–92Gland: International Union for the Conservation of Nature
Mathauda G S. 1957The mangroves of IndiaIn Proceedings of the Mangrove Symposium, pp. 66–87Calcutta: Ministry of Food and Agriculture, Government of India
Naskar K and Mandal R. 1999Ecology and Biodiversity of India Mangroves, Part I: Global Status Part II:Morpho Anatomy of MangrovesNew Delhi: Daya Publishing House
Pernetta J C and Elder D L. 1992Climate, sea level rise and coastal zone: management and planning for globalchangesOceans and Coastal Managements 18: 113–160
Pernetta J C and Elder D L. 1993Cross sectoral, integrated coastal area planning: guidelines and principles forcoastal area developmentsIn A Marine Conservation and Development ReportGland: International Union for the Conservation of Nature and World Wide Fundfor Nature. 63 pp.
Change of coastal land use, its impact, and management options 41
Qasim S Z. 1982Oceanography of the northern Arabian SeaDeep Sea Research 29: 1041–1068
Radhakrishna K, Bhattathiri P M A, and Devassy V P. 1978Primary productivity of the Bay of Bengal during August–September, 1976Indian Journal of Marine Sciences 7: 94–98
Rajamanickam G V (ed.). 1990Sea Level Variations and its Impact on Coastal EnvironmentThanjavur: Tamil University. 443 pp.
Rao M U. 1972Ecological observations on some intertidal algae of Mandapam coastProceedings of Indian National Science Academy 38B: 298–307
Rao T A and Sastry A R K. 1972An ecological approach towards classification of coastal vegetation of India,I—strand vegetationIndian Forester 98 (10): 594–607
Shukla P R, Sharma S K, and Ramana P V (eds). 2002Climate Change and India: issues, concerns and opportunitiesNew Delhi: Tata McGraw Hill. 317 pp.
Sidhu S S. 1963Studies on mangroves of India, East Godavari regionIndian Forester 89: 337–351
Subbaramaiah K, Ramarao K, and Nair M R P. 1979Marine algal resources of LakshadweepIn International Symposium on Marine Algae of Indian Ocean Region, edited by P S RaoBhavnagar: Central Salt and Marine Chemicals Research Institute
Sukumar R, Saxena K G, and Untawale A. 2003Climate change impacts on natural ecosystemsIn Climate Change and India: vulnerability assessment and adaptations, vol. 8: 240–266 pp.edited by P R Shukla, S K Sharma, N H Ravindranath, A Garg, and S BhattacharyaHyderabad: Universities Press. 453 pp.
Turner J S, Stella G M, Carr D J, Bird E C F. 1962The dune succession at corner Inlet, VictoriaProceedings of Royal Society of Victoria 75 (I): 7–33
UNESCO (United Nations Educations Scientific and Cultural Organization). 1992Impacts of expected climate change on mangroves(UNESCO: United Nations Environment Programme Task Team Report of the firstmeeting, Rio de Janeiro)Report on Marine Sciences 61: 25
42 A G Untawale
Untawale A G. 1980Sand dune vegetation of IndiaIn Protection and Control of Coastal Erosion in India, pp. 120–134, edited by P Braunand B U Nayak[special publication]Dona Paula: National Institute of Oceanography
Untawale A G. 1985Status of mangroves in India: a country reportIn Proceedings of Asian Symposium on Mangrove Environment: research andmanagement, pp. 57–74The Philippines: United Nations Development Programme—United NationsEducation, Scientific and Cultural Organization. 538 pp.
Untawale A G. 1987Conservation of Indian mangroves—a national perspectiveIn Contribution in Marine Sciences, pp. 85–104, edited by T S S Rao, R Natarajan,B N Desai, G Narayanaswamy, S R Bhat[A special collection of papers to felicitate Dr S Z Qasim on his 60th birthanniversary]
Untawale A G. 1992Rehabilitation of coastal wetlands of IndiaIn Ecosystem Rehabilitation, Vol 2, Ecosystem Analysis and Synthesis, pp. 333–348edited by M WaliThe Hague Academic Publishing
Untawale A G. 1995Restoration of mangroves along the central west coast of IndiaIn Restoration of Mangrove Ecosystems, pp. 111–125, edited by C FieldJapan: International Tropical Timber Organization/International Society forMangrove Ecosystems. 250 pp.
Untawale A G. 2001A Study on the Current Status and Potential of Coastal Shelter Belts in theWestern RegionMumbai: Agriculture Finance Corporation (National Agriculture and EnvironmentDevelopment Board). 128 pp.
Untawale A G. 2003Impact of climate change on marine ecosystems of IndiaIn Proceedings of the Workshop on Vulnerability Assessment and Adaptation due toClimate Change on Indian Agriculture, Forestry and Natural Ecosystems, pp. 194–197,edited by N H Ravindranath, S K Sharma, A Garg, S Bhattacharya, and I K MurthyNew Delhi: Ministry of Environment and Forests, Government of India. 197 pp.
Change of coastal land use, its impact, and management options 43
Untawale A G and Jagtap T G. 1984Marine macrophytes of Minicoy (Lakshadweep) coral atoll of the Arabian SeaAquatic Botany 19: 97–103
Untawale A G and Jagtap T G. 1991Floristic composition of the deltaic regions of IndiaIn Quaternary Deltas of India, edited by R VaidyanadhanMemoirs of Geological Society of India 22: 243–263
Untawale A G, Dhargalkar V K, and Deshmukhe G V. 2000Prioritization of potential sites of marine biodiversity conservation in IndiaIn Setting Biodiversity Conservation Priorities for India, pp. 104–130, vol 1, edited bySingh, Sastry, Mehta, and UppalNew Delhi: World Wide Fund for Nature
Untawale A G, Kathiresan K, Deshmukh S, Singh H S. 2000Status and Proposed Guidelines for Mangrove Plantation, Conservation andManagement Along the East and West Coast of India, pp. 1–67New Delhi: National Mangrove and Coral Reef Committee, Ministry ofEnvironment and Forests, Government of India. 67 pp.
Vaidyanadhan R V. 1991Quaternary Deltas of IndiaVisakhapatnam: Geological Society of India. 291 pp.
Walter G R, Post E, Convey P, Menzel A, Permesa C, Beebee T J C, Fromentin J M,Hoegh-Guldnerg O, Bairlein F. 2002Ecological responses to recent climate changeNature 416 (6879): 389–395

44 S Sonak, S Kazi, M Sonak, M Abraham
Factors affecting land-use and land-coverchanges in the coastal wetlands of Goa
Sangeeta Sonak, Saltanat Kazi, Mahesh Sonak,Mary Abraham
This paper identifies factors affecting land-use and land-cover changes in thecoastal wetlands of Goa in India. It presents a case study of community re-source management in khazan ecosystem of India. The khazans aretraditionally community-managed rice and fish (integrated agriculture–aquaculture) ecosystems found in Goa. Local people developed them by usingtheir traditional knowledge. Using this case study as an example, the paperhighlights the role of institutions in the management of natural resources, par-ticularly land resources. It refers to the CPR (common property resource)management system prevalent in local communities of many developing coun-tries such as India. It provides insights into the indigenous knowledge onecosystem management and the importance of CPR management institutionsin conservation of agriculture resources. Through participatory research, thecausal factors for the degradation of khazans are studied.
Introduction
LUCC (Land-use and cover changes) have become an increasingly importantissue in developing countries such as India. LUCC are caused by anthropogenicas well as ecological processes. Land-cover change refers to biophysical at-tributes of the earth’s surface and land-use is the human purpose or intentapplied to these attributes (Turner, Skole, Sanderson, et al. 1995). Land-usechange is affected strongly by socio-economic factors such as land policies,property rights, institutions, population migration, urbanization, other eco-nomic activities, and market for agricultural products. Thus, research in thefield of LUCC requires an interdisciplinary approach and commends a holisticview. An understanding of factors responsible for land-use changes or land-cover changes is essential for any research concerning LUCC.
2
Factors affecting land-use and land-cover changes 45
Global environmental change studies normally follow systemic approach.Most studies focus either on loss of agricultural lands or their productivity dueto climate change or on deforestation and its impacts. The other approach, thatis cumulative approach, implies that the change replicates itself in differentparts of the world and accumulation of such changes in different parts of theworld is a global phenomenon. Changes in land cover and land use are amongthe most important aspects of global environmental change (Lambin, Baulies,Bockstael, et al. 1999; Turner, Clark, Kates, et al. 1990). Lambin, Turner, Geist,et al. (2001) point out that land-use and land-cover changes are so pervasive thatwhen aggregated globally, they significantly affect key aspects of the function-ing of the earth system. This paper follows cumulative approach and presents acase study of coastal wetlands in Goa, India. Such location-specific studies in-form us that site and situation create a multitude of ways by which earth issustained, altered, or transformed, allowing for a more complete understandingof the way in which global forces are played out in specific places and cultures(Turner, Kasperson, Meyer, et al. 1990).
Further, several studies document that a number of factors such as popula-tion, poverty, higher economic gains, etc. are responsible for degradation of anyagricultural land. Lambin, Turner, Geist, et al. (2001) observe that neither popu-lation nor poverty alone constitutes the sole and major underlying causes ofland-cover change worldwide. They further argue that people’s responses toeconomic opportunities, as mediated by institutional factors, drive land-coverchanges. Property rights, most often, determine the efficiency of resource use.The changes embedded in the property rights and land tenure largely affect theecosystem management. Traditionally, human communities have managed landresources (properties) collectively. They have framed laws to co-ordinate indi-vidual and collective actions for controlling and managing common resources.Common property institutions face a number of challenges. It is important tounderstand how institutions and changes therein affect people’s interactionwith their environment. Therefore, the aims of this paper are as follows.
Examine the causal factors that affect land-use /land-cover changes Describe the institutions involved in the management of coastal
wetlands Investigate the impacts that changes in institutional set-up can have on
land use/land cover
This paper uses a case study of khazan ecosystem in Divar island of Goa(14º 53’ 57’’ to 15º 47’ 59” North and 73º 40’ 54” to 74º 20’ 11” East) to explain thecausal factors for land-use and land-cover changes in the coastal wetlands ofGoa. A brief background of the ecosystem and traditional technology as well ascollective management by the community is provided in this paper.
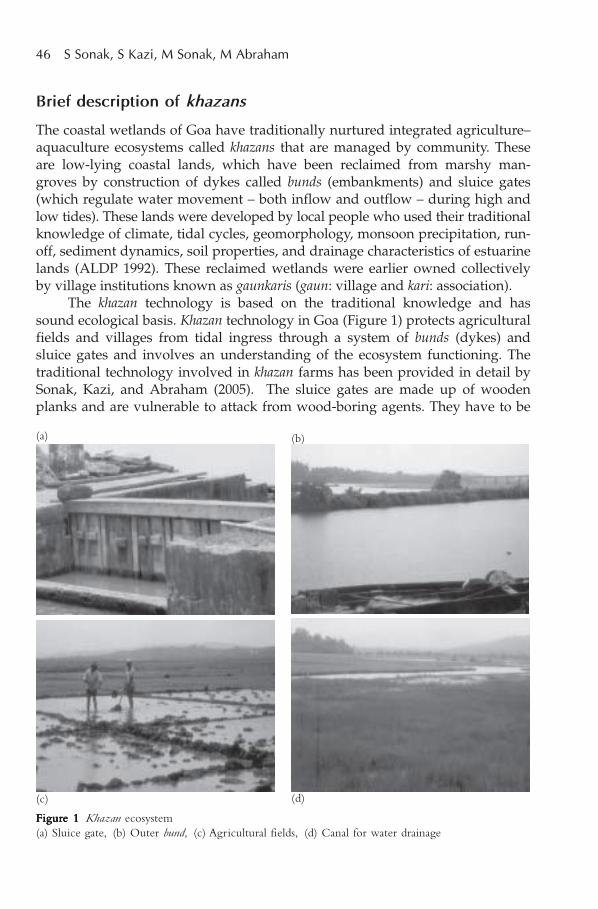
46 S Sonak, S Kazi, M Sonak, M Abraham
Brief description of khazans
The coastal wetlands of Goa have traditionally nurtured integrated agriculture–aquaculture ecosystems called khazans that are managed by community. Theseare low-lying coastal lands, which have been reclaimed from marshy man-groves by construction of dykes called bunds (embankments) and sluice gates(which regulate water movement – both inflow and outflow – during high andlow tides). These lands were developed by local people who used their traditionalknowledge of climate, tidal cycles, geomorphology, monsoon precipitation, run-off, sediment dynamics, soil properties, and drainage characteristics of estuarinelands (ALDP 1992). These reclaimed wetlands were earlier owned collectivelyby village institutions known as gaunkaris (gaun: village and kari: association).
The khazan technology is based on the traditional knowledge and hassound ecological basis. Khazan technology in Goa (Figure 1) protects agriculturalfields and villages from tidal ingress through a system of bunds (dykes) andsluice gates and involves an understanding of the ecosystem functioning. Thetraditional technology involved in khazan farms has been provided in detail bySonak, Kazi, and Abraham (2005). The sluice gates are made up of woodenplanks and are vulnerable to attack from wood-boring agents. They have to be
FigurFigurFigurFigurFigure 1e 1e 1e 1e 1 Khazan ecosystem(a) Sluice gate, (b) Outer bund, (c) Agricultural fields, (d) Canal for water drainage
(a) (b)
(c) (d)
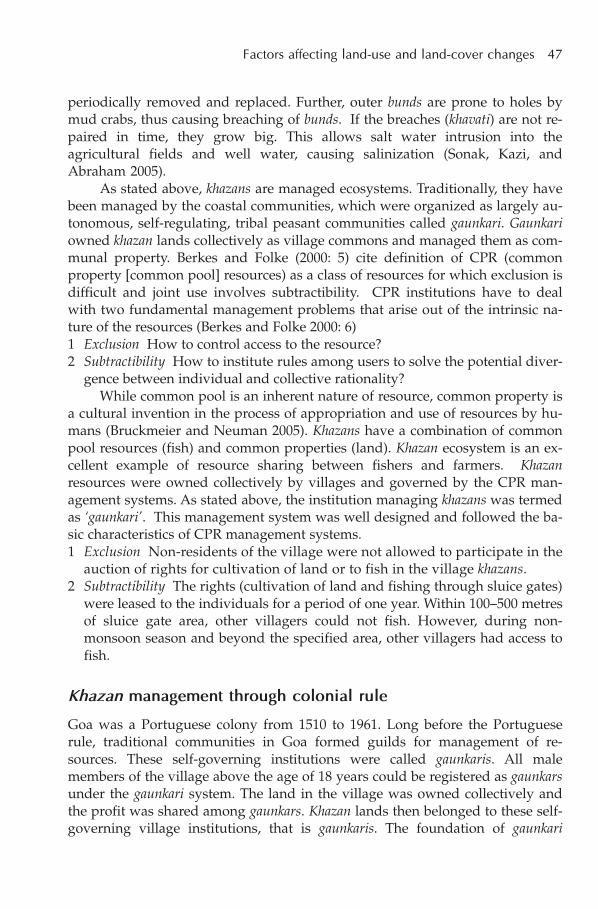
Factors affecting land-use and land-cover changes 47
periodically removed and replaced. Further, outer bunds are prone to holes bymud crabs, thus causing breaching of bunds. If the breaches (khavati) are not re-paired in time, they grow big. This allows salt water intrusion into theagricultural fields and well water, causing salinization (Sonak, Kazi, andAbraham 2005).
As stated above, khazans are managed ecosystems. Traditionally, they havebeen managed by the coastal communities, which were organized as largely au-tonomous, self-regulating, tribal peasant communities called gaunkari. Gaunkariowned khazan lands collectively as village commons and managed them as com-munal property. Berkes and Folke (2000: 5) cite definition of CPR (commonproperty [common pool] resources) as a class of resources for which exclusion isdifficult and joint use involves subtractibility. CPR institutions have to dealwith two fundamental management problems that arise out of the intrinsic na-ture of the resources (Berkes and Folke 2000: 6)1 Exclusion How to control access to the resource?2 Subtractibility How to institute rules among users to solve the potential diver-
gence between individual and collective rationality?While common pool is an inherent nature of resource, common property is
a cultural invention in the process of appropriation and use of resources by hu-mans (Bruckmeier and Neuman 2005). Khazans have a combination of commonpool resources (fish) and common properties (land). Khazan ecosystem is an ex-cellent example of resource sharing between fishers and farmers. Khazanresources were owned collectively by villages and governed by the CPR man-agement systems. As stated above, the institution managing khazans was termedas ‘gaunkari’. This management system was well designed and followed the ba-sic characteristics of CPR management systems.1 Exclusion Non-residents of the village were not allowed to participate in the
auction of rights for cultivation of land or to fish in the village khazans.2 Subtractibility The rights (cultivation of land and fishing through sluice gates)
were leased to the individuals for a period of one year. Within 100–500 metresof sluice gate area, other villagers could not fish. However, during non-monsoon season and beyond the specified area, other villagers had access tofish.
Khazan management through colonial rule
Goa was a Portuguese colony from 1510 to 1961. Long before the Portugueserule, traditional communities in Goa formed guilds for management of re-sources. These self-governing institutions were called gaunkaris. All malemembers of the village above the age of 18 years could be registered as gaunkarsunder the gaunkari system. The land in the village was owned collectively andthe profit was shared among gaunkars. Khazan lands then belonged to these self-governing village institutions, that is gaunkaris. The foundation of gaunkari
48 S Sonak, S Kazi, M Sonak, M Abraham
institution was based on the collective management of property and resources.This institution, which was evolved through collective use of valuableresources, efficiently implemented rules to exclude potential individual usersand maintain collective ownership as well as ecological sustainability.
During Portuguese regime in Goa (1510–1961), they were renamed ascomunidades. Through Code of Comunidad, the institution was formalized andachieved formal legitimacy.
Khazans were owned by comunidades, the functioning of which was gov-erned by the Code of Comunidades. Comunidad became a legal entity that ownedall land in a village that was not privately owned. As in gaunkari system,comunidad also maintained the khazan ecosystem through bhaus system (associa-tion of farmers). The gaunkar (supervisor) supervised the work of the bhaus; thekulkarni (accountant) maintained the accounts; and the paini (guard) guardedthe bunds. According to the Code of Comunidades, any breach in the bunds had tobe repaired within 24 hours by the bhaus. The expenses incurred were recoveredfrom its members. The comunidad raised money by auctioning rights of cultiva-tion to farmers and those of fisheries to fishers.
After the merger of Goa with the Indian Union in 1961, as a measure ofagrarian reform, legislations like the Agricultural Tenancy Act 1964 was en-acted. These legislations provided for security of tenure to agricultural tenantsand formation of tenants’ associations. With the advent of the joint responsibi-lity of Tenants Rules 1975, responsibility for management of khazans came to bestatutorily imposed upon the tenants’ associations. This weakened the control ofgaunkars, particularly as the state control over the functioning of the comunidadesincreased gradually. In the recent years, the khazans began experiencing rapidchanges in the land use and land cover.
Factors affecting khazan ecosystem
A number of factors affect the khazan ecosystem and bring about land-use andland-cover changes in these coastal wetlands of Goa. The causal factors that ex-plain the degradation of khazan lands are broadly discussed below.
Ecological factors
Salinization of land
Khazans are reclaimed mangrove areas. If the khazan lands are subjected to in-creased salinity, they revert to their original mangrove ecosystem. Though thisincreases the ecological value of the region, the economic value of the ecosystemis reduced. In India, mangroves are considered ecologically sensitive areas andare protected under the CRZ (Coastal Regulation Zone) Notification, 1991.Khazan lands add to economic value of the ecosystem while preserving its
Factors affecting land-use and land-cover changes 49
ecological importance. They contribute to human well-being by providing liveli-hood. Reversion of khazans to mangrove reduces livelihood options for the localcommunity.
Non-cultivation of land
Agricultural products have no market, as they cannot compete with subsidizedproducts from developed countries. Hence, agriculture is not a financially remu-nerative activity and very often, the land is not cultivated. As the agriculturalland remains fallow, it is covered by weeds called tath. Growth of weeds is com-monly observed in non-cultivated fields. It is very difficult to weed out tathfrom the fields. This leads to lack of interest in cultivation, as the weeding proc-ess is very expensive due to the labour involved. Even after weeding, weedsgrow again in a short time and it is difficult to completely uproot them. Hence,this becomes a cause for degradation of khazan lands. Uncultivated fields havelower organic biomass and have lower yields of fish.
Effects of intensive agriculture
Over the years, khazan farmers have been successful in cultivating salt-tolerantrice varieties. But the productivity of these traditional varieties is comparativelylow. Hence, there is a shift from these traditional varieties of paddy to high-yielding varieties. High-yielding varieties require inorganic fertilizers andpesticides. Land run-off from these fields, which carries these contaminants, canaffect the fish yield. This was a matter of concern to the locals.
Socio-economic factors
Effect of mining activity
Mining activity causes deterioration of external bunds. River Mandovi is usedas waterway for barge traffic carrying ore from loading point in the miningareas to Mormugao harbour. As pointed out in the ALDP report (1992), thebow-shock waves caused by barges is the main reason of increase in wave en-ergy, which is a function of cruising speed and load of the barges. Silting ofpoiem has been connected with the mining activity. It is reported that silt frommining activities is deposited on the land as well as in poiem, which used to beregularly desilted earlier. The depressions have become shallow in recentyears due to silt accumulation mainly from mining barges and run-off fromactive mining sites.
Conversion to built lands
Tourism and urbanization have catalysed changes in khazan lands and areresponsible for conversion of khazan lands outside Divar in other parts of Goa.Infrastructure development projects target newer areas. Globalization andincreased population place additional pressures on coastal areas. As tourism in
50 S Sonak, S Kazi, M Sonak, M Abraham
coastal areas normally sell sun and sand, hotels try to acquire coastal lands, thushastening land conversions.
Effects of migration
A number of people from Divar have migrated out of the country in order topursue better opportunities and higher income, which, in turn, has created alack of interest in the cultivation and maintenance. This is both the result and acause for land degradation. Due to higher benefits from other sources/liveli-hood opportunities, people moved out of the agricultural sector. Land was notcultivated for a number of years, leading to land degradation. Non-availabilityof labour for agriculture increased the demand for labour and wages. Agricul-ture became an increasingly expensive activity. This is a trend similar to the oneobserved in other parts of India.
While a number of people migrated from Divar, migration to Divar hasalso been observed. It is observed that the migrants in Divar have a lower socialstatus, lower income levels, low level of education compared to the earlier set-tlers. This heterogeneity often gives rise to social conflicts and affects collectivedecisions.
Erosion of traditional values
Numerous papers describe erosion of traditional values on account of changesin the traditional communities to modern societies. With the weakening of cul-tural and religious institutions, the emotional bonding, that is interactionbetween the environment and societies, has changed. Previously important rela-tionships between populations and local ecosystems are losing their significanceand local lifestyles are becoming less adapted to the existing context, for exam-ple, the specific soil, climate, and culture. Individual profits have takenprecedence over guarding of collective resources. As fishing rights are leased toan individual for a period of one year only, improper methods of fishing areused to harvest and exploit maximum fish. Intentional breaching of bunds, thatis fishing by using explosives, etc., damage khazan lands. Such methods havebeen reported in the participatory approaches. Intentional breaching of bundsbrings in more volumes of water, and hence more fish. The enforcement of de-cisions for collective use is a challenge under this rapidly changing scenario.
Other demographic changes
Higher literacy rates and income levels encouraged people towards an occupa-tional shift from primary to tertiary sector. Increased level of education createdincreased aspirations regarding income and social status. In India, cultivationdid not form a part of higher social status, nor did it bring good financial remu-neration. People lost interest in cultivation. Agricultural land that was leftuncultivated showed signs of degradation. With the growth of the marketeconomy, fishing efforts multiplied. An increased demand for cultured prawns
Factors affecting land-use and land-cover changes 51
in the international market as well as local tourist market encouraged land-usechange. Industrial aquaculture brought increased income in the coastal area.Ecological degradation of khazans was accelerated due to environmentalimpacts of industrial aquaculture.
Institutional factors
Changes in the traditional institutional set-up were the prime reason for LUCCin the coastal wetlands of Goa. The changes in the traditional gaunkari(comunidad) had several manifestations, prime being LUCC. Mukhopadhyay(2002) discusses transition of comunidades leading to incentive loss among indi-vidual asset owners resulting from destruction of social capital, which hascreated an ecological crisis. The institutional factors affecting LUCC have beendescribed below.
Changes in property rights
In 1961, Goa was liberated from the Portuguese colonial yoke and became a partof India. The constitution of India had resolved to adopt a socialistic form ofgovernment and consistent therewith, a number of legislative measures toachieve social equity and distributive justice came to be enacted. A number ofagrarian reforms were legislatively introduced. This included laws to providefor land ceiling, abolition of holdings of big landlords (zamindars), lands to thetiller etc. Agricultural income was exempt from income tax. After Goa became apart of the Indian Union from 1961, number of such laws were enacted. Particu-lar reference is required to be made to the Goa Agricultural Tenancy Act 1964and the rules made there under. Initially, this legislation provided a security oftenure to agricultural tenants and formation of the tenants’ associations. In theyear 1976, this legislation was amended so as to vest the agricultural lands inthe tenant actually cultivating the same (land to the tiller amendment). Jointresponsibility of Tenants Rules 1975 came to be enacted, which conferredresponsibility upon tenants in the matter of management of khazans. All thesechanges resulted in rendering the gaunkari/comunidad system irrelevant to agreat extent. The tenants of comunidad became deemed purchasers of the agri-cultural lands/khazans. The control erstwhile exercised by the gaunkaris vide theCode of Comunidades considerably reduced lands that were collectively ownedduring gaunkari/comunidad system to individually owned ones, though jointlymanaged. These significant changes in property rights coupled with low marketfor agricultural produce resulted in negative incentives for cultivation.
Changes in functionaries
Traditional gaunkari system, which later acquired legitimacy as comunidad, washighly effective in sustainable management of khazan ecosystem. Abolition ofbhaus system in 1960 by the Portuguese regime was the main reason that was
52 S Sonak, S Kazi, M Sonak, M Abraham
pointed out by locals as the cause for improper maintenance by tenants’ associa-tion. Bhaus system in comunidad/guankari had paid employees, who wereassigned certain responsibilities. For example, the paini (watchman) guarded thebunds and reported any breach in the bunds to the bhaus. As mentioned earlier,according to the Code of Comunidades, any breach in the bunds had to berepaired within 24 hours by the bhaus.
Contrary to this, tenants’ association has no paid employees to monitorand manage the land. Persons holding honorary positions do not dedicate suffi-cient time for management. Further, even the strength of membership has beenreduced, thus reducing the manpower. This reflects in the khazan land(mis)management and degradation.
Changes in basic rules of traditional CPR institutions
Gaunkari institution did not allow non-residents of a village access to land orfish resources that were owned collectively by the village. Non-residents wereexcluded from certain rights. With the changes in the institutional set-up, non-residents were allowed rights to fishing, while land tenure was allowed to thepersons cultivating it for a specified number of years. Loss of social cohesionfollowed entry of non-residents. Unsustainable fishing practices were intro-duced, resulting in conflicts between local farmers and non-resident fishers.This erosion of social capital led to erosion of the traditionally evolved CPRmanagement institutions.
Reduced income
Income to comunidad for maintenance of khazan lands decreased on account ofreduced sources of income and reduced strength of membership. The funds re-ceived by the tenants’ association are no longer sufficient for maintenance ofkhazan lands. Hence, the tenants’ association has to depend on state subsidiesfor repairs or any other maintenance work. This dependency, coupled with de-lays in state bureaucratic procedures to sanction subsidies, affects bund repairs,thus enhancing salinization of the khazan lands.
Intervention by the state
The state government offers 50%–90% subsidy for maintenance of protectivebunds and sluice gate, which are notified in the government gazette. However,estimates for repairs/replacement need to be obtained from the soil conserva-tion department, and the valuation certificates provided on completion of workrequire the approval of the mamlatdar. The estimate sanctioned and the funds re-ceived are insufficient for proper repair of the bunds. The rates for labour arefixed by the central government and are uniform throughout the country. How-ever, actual labour rates in Goa are much higher. Further, the governmentprocedures are very tardy (Figure 2). Delay in these procedures amplifies thedamage caused to the bunds. This affects khazan ecosystem, as any damage tobunds causes salt water intrusion and salinization of land and water.
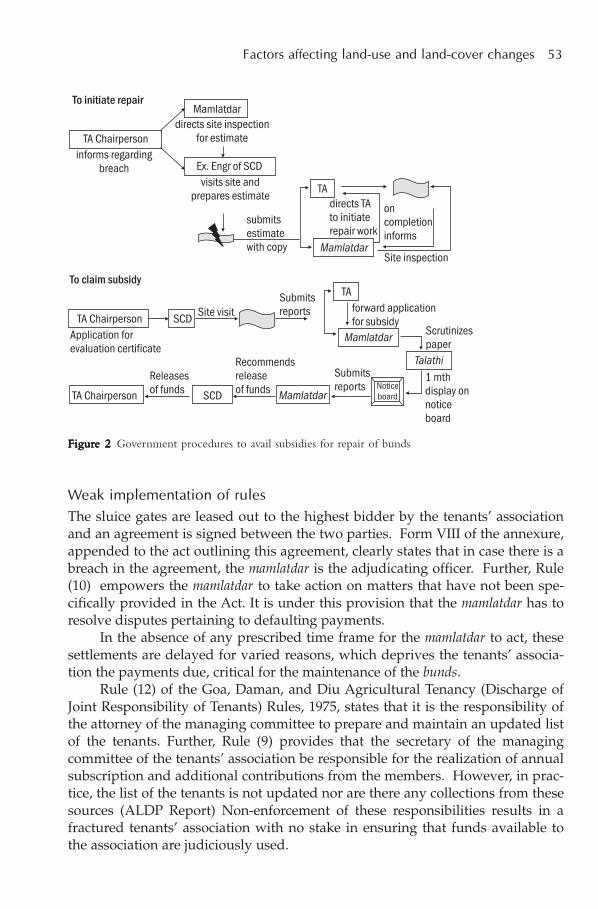
Factors affecting land-use and land-cover changes 53
Weak implementation of rules
The sluice gates are leased out to the highest bidder by the tenants’ associationand an agreement is signed between the two parties. Form VIII of the annexure,appended to the act outlining this agreement, clearly states that in case there is abreach in the agreement, the mamlatdar is the adjudicating officer. Further, Rule(10) empowers the mamlatdar to take action on matters that have not been spe-cifically provided in the Act. It is under this provision that the mamlatdar has toresolve disputes pertaining to defaulting payments.
In the absence of any prescribed time frame for the mamlatdar to act, thesesettlements are delayed for varied reasons, which deprives the tenants’ associa-tion the payments due, critical for the maintenance of the bunds.
Rule (12) of the Goa, Daman, and Diu Agricultural Tenancy (Discharge ofJoint Responsibility of Tenants) Rules, 1975, states that it is the responsibility ofthe attorney of the managing committee to prepare and maintain an updated listof the tenants. Further, Rule (9) provides that the secretary of the managingcommittee of the tenants’ association be responsible for the realization of annualsubscription and additional contributions from the members. However, in prac-tice, the list of the tenants is not updated nor are there any collections from thesesources (ALDP Report) Non-enforcement of these responsibilities results in afractured tenants’ association with no stake in ensuring that funds available tothe association are judiciously used.
FigurFigurFigurFigurFigure 2e 2e 2e 2e 2 Government procedures to avail subsidies for repair of bunds
54 S Sonak, S Kazi, M Sonak, M Abraham
Section 36 (chapter V) of the Goa, Daman, and Diu Agricultural TenancyAct, 1964, provides that the government through a manager can assume the man-agement of the land that was left fallow for two years prior to the enforcementof the Act. Section 15 of the Act details the manner of making enquiry and issu-ing of notices prior to assuming the responsibility of the land.
The Goa Land Use (Regulation) Act, 1991, prohibits conversion of agricul-tural lands vested in tenants. There are central legislations that mandatethe provision of a buffer zone as a pre-condition to commencing aquacultureactivities in coastal lands. The CRZ Notification, 1991, places restrictions onconstruction and development in coastal areas.
There is no dearth of legislations, rules, and regulations, but the real prob-lem is non-implementation or the non-enforcement thereof. In case of ‘IndianCouncil for Enviro-Legal Action versus Union of India’ 1996 (5) SCC: 281, theSupreme Court of India was constrained to observe the following.
‘Enactment of a law, but tolerating its infringement is worse than not en-acting law at all. The continued infringement of law, over a period of time,is made possible by adoption of such means, which are best known to theviolators of law. Continued tolerance of such violations of law not onlyrenders legal provisions nugatory but such tolerance by the EnforcementAuthorities encourages lawlessness and adoption of means which cannot,or ought not to, be tolerated in any civilized society. When a law is enactedcontaining some provisions, which prohibit certain types of activities, then,it is of utmost importance that such legal provisions are effectively en-forced. If a law is enacted but is not being voluntarily obeyed, then, it hasto be enforced. Otherwise infringement of law, which is actively or pas-sively condoned for personal gain, will be encouraged which will, in turn,lead to a lawless society. Violation of anti-pollution laws not only ad-versely affects the existing quality of life but the non-enforcement of thelegal provisions often results in ecological imbalance and degradation ofenvironment, the adverse effect of which will have to be borne by the fu-ture generations.’
Discussion
There is emerging evidence that changes in climate will affect a diverse set ofearth systems, both physical and biological. Climate-sensitive primary resourceindustries include agriculture, forestry, and fisheries. Communities with little di-versification dependent on these resources are more vulnerable than morediversified communities. Adaptation to climate change presents variety of chal-lenges. Proactive micro adaptation is the focus of increasing attention. In astable social context, adaptive strategies develop their own response to copewith socio-economic difficulties (Dubroeucq and Livenais 2004). In the presentcontext, khazan farmers belonging to traditional societies had found strategies to
Factors affecting land-use and land-cover changes 55
use low-lying coastal land productively. However, in the recent years, a numberof factors have affected management of khazan lands in Goa, leading to land-useand land-cover changes.
There is ample evidence that changing economic opportunities changehuman–nature relationship. There is wider agreement that as local economiesget integrated with global markets, harvesting levels of resources are likely toincrease and resource exploitation may become unsustainable (Agrawal 2001).Processes of globalization amplify or attenuate the driving forces of land-usechange (Lambin, Turner, Geist, et al. 2001). They connect remote places and peo-ple and disconnect human interactions with their immediate environment.Global forces increasingly replace or re-arrange the local factors determiningland uses, building new, global cause–connection patterns in their place. In thepresent context, khazan lands have also experienced such pressures arising outof distant markets. Economic activities such as tourism, mining, industrialaquaculture, etc. have affected land-use and land-cover directly or indirectly.Urbanization and infrastructure development are the products of emergingeconomic opportunities.
It is often pointed out that the tragedy of commons results not from aninherent failure associated with a common pool resource, but from institu-tional failure to control access to the resources and to make and enforceinternal decisions for collective long-term use (Berkes and Folke 2000; Curranand Agardy 2002). Khazans were traditionally managed by CPR managementsystems called Gaunkaris, comunidades, and later tenants’ associations. Disrup-tion of the traditional resource management system is the prime cause ofecological unsustainability of khazans. Traditional property rights systems pro-vided a structure for resource protection and extraction. These traditionaltenure systems played a highly significant role in ecological sustainability ofkhazans. Control to access was defined by the traditional resource manage-ment system. Change in fishing regulations, such as providing access tonon-residents of village, has disrupted the CPR management system. Litera-ture suggests that legal recognition of the communal resource rights is key tosuccess. Clearly defined and legally supported user rights for relatively smalland homogeneous groups appear to be a necessary condition for the develop-ment of effective common property institutions (Holland and Ginter 2001).Problems of exclusion become especially important in an increasingly inter-connected world in which local resources and local resource rights are underpressure (Lobe and Berkes 2004).
Further, social stability was on decline after the entry of non-residents inDivar. Unsustainable fishing practices giving rise to conflicts between farmersand fishers were on rise. Curran and Agardy (2002) argue that in migration dis-rupts the social bonds of reciprocity and trust that are required for collectiveaction. Khazan lands have witnessed disruption of social bonds through entry ofnon-gaunkars (non-residents) and their access to fishing. As Katz (2000) points
56 S Sonak, S Kazi, M Sonak, M Abraham
out, such communities – that is communities in which social bonds have beendisrupted – are less likely to take collective action for long-term natural capitalenhancement. Further, earlier literature has pointed out that though CPR institu-tions are possible in highly heterogeneous communities, they are less likely towork in such communities (Campbell, Mandondo, Nemarundwe, et al. 2001).
Group size and homogeneity are often cited as critical factors for the sur-vival and success of common property institutions (Holland and Ginter 2001).Further, Maskey, Gebremedhin, and Dalton (2006), in the context of manage-ment of community forest, argue that equal participation is necessary to createeffective and equitable management for collective decision-making, which en-sures uniform benefits for all user groups. Homogenous communities are morelikely to have equal participation than the communities characterized by differ-ent socio-economic memberships.
In-migration of people in traditionally well-settled communities of Divargave rise to a different suite of relationships within the community, whichaffected collective management of resources.
Property rights and land tenure appear to be important factors determin-ing land-use and land-cover changes. Changes in the institutional set-up mayinfluence changes in land tenure and property rights, resulting in land-use and/or land-cover change. Luers, Naylor, Matson (In press) suggest that a series ofprivatization and liberalization reforms promulgated in 1990s have influencedthe shifts in land tenure and land use along the coastal zone of southern Sonorain Mexico. Alcorn and Toledo (2000) warn that these changes have great poten-tial to undermine the community-based sector and expand the rights of privateindividual property. They further state that the new agrarian law framed in1992, revising article 27 of the constitution to change the tenurial shells of com-munities, recognizes large illegal landholdings, and the changes brought aboutby this law lead to the expansion of inefficient and ecologically damaging landuse. Contrary to this, agriculture reforms in India were aimed at equal and fairdistribution of land. In British and pre-British India, a tradition of landlords andtenants existed. Post-independence land reform acts recognized peasants’ rightsand expropriated private landholdings to landless tenants. However, in Goa, alot of agricultural land was owned and managed collectively. This important as-pect was lost sight of, whilst introducing similar legislations in Goa.Privatization of the common property in Goa resulting in failure of ecologicalsustainability has been discussed in detail by Mukhopadhyay (2002). Balandand Platteau (1996) argue that privatization of CPR or their appropriation andregulation by central authorities tends to eliminate the implicit entitlements andpersonalized relationships that are characteristics of communal property ar-rangements and are likely to impair efficiency. They further argue thatprivatization is a disadvantage for traditional users.
Inadequate law enforcement and corruption giving rise to forest area log-ging and related environmental impacts have been described by Lambin,

Factors affecting land-use and land-cover changes 57
Turner, Geist, et al. (2001). Robbins (2000) defines corruption as a special case ofextra-legal resource management institutions and explores the challenge corrup-tion poses for sustainable use of natural systems. Lopez and Mitra (2000) focuson how corruption may affect development and enforcement of environmentalregulations. They firmly state that there is evidence to suggest that corruptionand lobbying by vested interests are important sources of environmental degra-dation in developing countries. That there is evidence to suggest that corruptionis one of the major causes of environmental degradation in developing countrieshas been reiterated by Wilson and Damania (2005). They observe that it has longbeen recognized that corruption may occur at different levels of governmentand cite Rose-Ackerman (1978) who identifies two major types of corruption.The first exists in the relationship between citizens and elected officials andtypically results in policy distortions. The second involves corruption in the bu-reaucracy where bribes can dilute the intended effects of policy. Ascher (1999)focuses on the first type while Desai (1998) describes the second. Ascher (1999)argues that policies can be influenced through the payment of political contribu-tions to policy-makers. Further, environmental regulations can be evaded bypaying bribes to lower-level bureaucrats who are responsible for administeringpolicies (Desai 1998). Though the literature is otherwise deficient in the connec-tions between corruption and environment, corruption is the root cause ofenvironmental degradation in many developing countries, which are less regu-lated. Delays in rule enforcement are often intentional, aimed at obligingbeneficiaries for a sum.
There is a wide literature available on CPR management systems. Agrawal(2001) has synthesized the extensive work carried out over the past two dec-ades. He has provided a table with a set of facilitating conditions identified byWade (1988), Ostrom (1990), and Baland and Platteau (1996). These includeresource system characteristics, group characteristics, institutional arrange-ments, and external environment. He has also pointed out lacunae in theliterature. For example, resource characteristics such as stationarity (whether re-source is mobile) and storage (the extent to which the resource can be collectedand held) have not been paid adequate attention in this literature. Moreover,even the external social, institutional, and physical environment has been paidonly limited attention (Agrawal 2001). This paper identifies following factors asdeterminants/pre-requisites for efficient management of khazan ecosystem.
Property rights/land tenure arrangements Social cohesion and homogeneity Manpower in terms of paid functionaries Restrictions on rights to harvest including exclusion Perception of equity and fair allocation of resources Sufficient revenue for management Rule enforcement Supportive state institutions
58 S Sonak, S Kazi, M Sonak, M Abraham
Most of these can be further characterized into multiple factors. This paperhas not thoroughly analysed the wider literature on factors contributing toefficient management of CPR. It has only tried to identify factors in the contextof khazan ecosystem. Institutional factors play a vital role in land-use and land-cover changes in coastal wetlands of Goa. However, these are not the solecauses. Other demographic factors and globalization play significant role in theland-use and land-cover changes.
In sum, disruption of the traditional resource management system is theprime cause of ecological unsustainability of khazans. Traditional property rightssystems provided a structure for resource protection and extraction. Control toaccess was defined by the traditional resource management system. Change infishing regulations, such as providing access to non-residents of village, has dis-rupted the CPR management system. These traditional tenure systems played ahighly significant role in ecological sustainability of khazans. Erosion of ecologi-cal responsibility follows changes in the property rights system from collectiveuse of resources to the individual tenure. Interventions and control by state, onlocally based resource management systems, have created a loss of protectiveborder around the ecosystems. The impact of these changes in the propertyrights arrangement is much more far-reaching than was anticipated or is appre-ciated. An in-depth understanding of evolution and dynamics of the localinstitutions is necessary for the management of the coastal wetlands and pro-motion of supportive policies that will arrest or even reverse land-use andland-cover change. However, institutional factors should not be seen in isola-tion, but in connection with the physical, socio-economic, and culturalconditions.
Acknowledgement
This paper is a part of the projects titled ‘Interactions between the environment,society, and technology’ (Contract no. ICA4-CT-2001-10046) and ‘Role of institu-tions in global environmental change’ (APN 2005-02-CMY). Financial supportprovided by the European Commission and the Asia Pacific Network respec-tively, is gratefully acknowledged. Authors wish to acknowledge all partners ofthe projects for their feedback during the course of the projects.
References
Agrawal A. 2001Common property institutions and sustainable governance of resourcesWorld Development 29 (10): 1649–1672
Factors affecting land-use and land-cover changes 59
Alcorn J B and Toledo V M. 2000Resilient resource management in Mexico’s forest ecosystems: the contributionof property rightsIn Linking Social and Ecological Systems: management practices and social mechanismsfor building resilience, pp. 216–249, edited by F Berkes and C FolkeCambridge: Cambridge University Press. 459 pp.
ALDP (Agricultural Land Development Panel) report. 1992Report submitted to Government of Goa by Agricultural Land Development Panel[Unpublished]
Ascher W. 1999Why Governments Waste Natural Resources: policy failures in developingcountriesBaltimore: Johns Hopkins University Press
Baland J M and Platteau J P. 1996Halting Degradation of Natural Resources: is there a role for rural communities?Oxford: Clarendon Press
Berkes F and Folke C (eds). 2000Linking Social and Ecological Systems: management practices and socialmechanisms for building resilienceCambridge: Cambridge University Press. 459 pp.
Bruckmeier K and Neuman E. 2005Local fisheries management at the Swedish coast: biological and socialpreconditionsAmbio 34 (2): 91–100
Campbell B, Mandondo A, Nemarundwe N, Sithole B. 2001Challenges to proponents of common property resource systems: despairingvoices from the social forests of ZimbabweWorld Development 29 (4): 589–600
Curran S R and Agardy T. 2002Common property systems, migration, and coastal ecosystemsAmbio 31 (4): 303–305
Desai U. 1998Ecological Policy and Politics in Developing Countries: economic growth,democracy and environmentAlbany: State University of New York Press

60 S Sonak, S Kazi, M Sonak, M Abraham
Dubroeucq D and Livenais P. 2004Land cover and land use changes in relation to social evolution: a case studyfrom Northern ChileJournal of Arid Environments 56: 193–211
Holland D S and Ginter J J C. 2001Common property institutions in the Alaskan ground fish fisheriesMarine Policy 25: 33–42
Katz E. 2000Social capital and natural capital: a comparative analysis of land tenure andnatural resource management in GuatemalaLand Economics 76: 114–132
Lambin E F, Baulies X, Bockstael N, Fischer G, Krug T, Leemans R, Moran E F,Rindfuss R R, Sato Y, Skole D, Turner II B L, Vogel C. 1999Land-Use and Land-Cover Change (LUCC): implementation strategy[IGBP Report No. 48, IHDP Report No. 10]Stockholm, Sweden and Bonn, Germany
Lambin E F, Turner B L, Geist H J, Agbola S B, Angelsen A, Bruce J W, Coomes O T,Dirzo R, Fischer G, Folke C, George P S, Homewood K, Imbernon J, Leemans R,Li Xiubin, Moran E F, Mortimore M, Ramakrishnan P S, Richards J F, Skånes H,Steffen W, Stone G D, Svedin U, Veldkamp T A, Vogel C, Xu J. 2001The causes of land-use and land-cover change: moving beyond the mythsGlobal Environmental Change 11 (4): 261–269
Lobe K and Berkes F. 2004The padu system of community-based fisheries management: change and localinstitutional innovation in south IndiaMarine Policy 28: 271–281
Lopez R and Mitra S. 2000Corruption, pollution, and the Kuznets environment curveJournal of Environmental Economics and Management 40: 137–150
Luers A L, Naylor R L, Matson P A. In pressA case study of land reform and coastal land transformation in southern Sonora,MexicoLand Use Policy
Maskey V, Gebremedhin T G, and Dalton T J. 2006Social and cultural determinants of collective management of community forestin NepalJournal of Forest Economics 11 (4): 261–274
Factors affecting land-use and land-cover changes 61
Mukhopadhyay. 2002Now that your land is my land. . .does it matter: a case study in western IndiaDetails available at <http://www.beijer.kva.se/teaching/pranab.pdf>, lastaccessed on 29 November 2005
Ostrom E. 1990Governing the Commons: the evolution of institutions for collective actionCambridge: Cambridge University Press
Rose-Ackerman S. 1978Corruption: a study in political economyNew York: Academic Press, Inc.
Robbins P. 2000The rotten institution: corruption in natural resource managementPolitical Geography 19 (4): 423–443
Sonak S, Kazi S, and Abraham M. 2005Khazans in Troubled WatersNew Delhi: The Energy and Resources Institute. 54 pp.
Turner II B L, Clark W C, Kates R W, Richards J F, Mathews J T, Meyer W B (eds).1990The Earth as Transformed by Human Action: global and regional changes in thebiosphere over the past 300 yearsCambridge: Cambridge University Press
Turner II B L, Kasperson R E, Meyer W B, Dow K M, Golding D, Kasperson J X,Mitchell R C, Ratick S J. 1990Two types of global environmental change: definitional and spatial-scale issuesin their human dimensionsGlobal Environmental Change 1990: 14–22
Turner II B L, Skole D, Sanderson S, Fischer G, Fresco L and Leemans R(with contributions from others). 1995Land-Use and Land-Cover Change: science/research plan[IGBP Report No. 35 and HDP Report No. 7]Stockholm: Sweden
Wade R. 1988Village Republics: economic conditions for collective action in South IndiaOakland: ICS Press
Wilson J K and Damania R. 2005Corruption, political competition and environmental policyJournal of Environmental Economics and Management 49: 516–535

62 S Kazi and A Siqueira
Bridging local and global concerns:a study on globalized tourism and itsimplications on land-use and land-cover
Saltanat Kazi and Alito Siqueira
This paper discusses the consequences of tourism-induced land-use and land-cover changes based on a study carried out in a well-known tourist destinationGoa, India. One of the findings that emerged from this study is that it is notdemand per se on account of tourism which causes change in land use andland cover but it is the local dynamics (which may not be tourism related butcould be a result of land-holding patterns in terms of size and location orland/tenural rights) operating at the destination, which alter the relationshipbetween people and environment. In this altered conditions, it is easier forpeople to disassociate themselves from land and put it to alternative tourism-related use, as there is a demand for the same. Tourism-related land-use andland-cover changes trigger a domino effect not only on the physical environ-ment but also on the society. A detailed understanding of the societal responseto these impacts will provide an understanding of the issue with all its com-plexities, which, in turn, can help develop better strategies to cope with thisissue locally. This issue has a great relevance at the global scale, as tourism is aworldwide phenomenon that is expanding at a rapid pace, and cumulatively itsimpacts can aggregate at a global scale.
Introduction
Global environmental change is an outcome of the interplay between variousspheres of the earth (that is, atmosphere, hydrosphere, lithosphere, pedosphere,cryosphere, and biosphere). Within biosphere, anthropogenic factors havegained momentum in altering the environment. One finite and fragile resourcethat makes up the environment is land resource comprising only one-third of
For correspondence: [email protected]; [email protected]
3
Bridging local and global concerns 63
the earth’s surface. Increasing population, economic and social development, andthe dynamism in property rights and power structures that influence access to orcontrol over land resources (Turner, Moss, and Skole, et al. 1993) are being recog-nized as key drivers of environmental change. Some of the issues that contributeto global environmental change are land-cover and land-use changes, sea levelrise, biodiversity loss, introduction of exotic species, climate change, deforesta-tion, eutrophication/pollution, and POPs (persistent organic pollutants).
Land-use and land-cover changes at local, national, and regional levels areincreasingly contributing cumulatively at the global scale (Turner, Kasperson,Meyer, et al. 1990). Land use ‘is the way in which, and purpose for which, hu-man beings employ the land and its resources’ (Meyer 1995) and is classified asfarming, mining, or lumbering. Land cover describes ‘the physical state of theland’ and includes aspects of the natural environment as well as human struc-tures. Thus, land cover can be categorized into wetland, forestland, cropland,water, built-up surface, etc. (Meyer 1995). Amongst various components of glo-bal environmental change discussed earlier, the component on land use andland cover is gaining importance as it is a significant agent of change that influ-ences other components such as climate change, biodiversity loss, and thesustainability of human environment interactions, and is also affected by them(IGBP 1999). Thus, the relationship between land-use and land-cover changewith global environmental transformation is cyclic. For example, destruction offorest cover can cause variation in climate and rainfall pattern and the reverse istrue for change in forest cover. Hence, land-use and land-cover changes havebecome an important component in the current strategies for managing naturalresources and monitoring changes.
Growing human population and its increasing needs (food, clothing, andshelter) and wants (luxury items, social prestige, pleasure) have been reportedto be the major cause of change in land cover (Mayer 1995). The major determi-nants of land use are demographic factors, such as population size and density;technology; level of affluence; political structures; economic factors, such as sys-tems of exchange or ownership; and attitudes and values. Human-inducedland-use and land-cover changes have transformed 30%–50% of the earth’s ice-free surface (Vitousek et al. 1997 cited in Gössling 2002). UNEP (2002) estimatesthat in the next 30 years, 70% of the earth’s land surface could be affected by theimpacts of roads, mining, cities and other infrastructural development. Land-use and land-cover changes are crucial environmental changes as these arelinked to other global changes, such as deforestation, loss of biodiversity, andintroduction of exotic species, some of which can cause climate change and risein sea level.
Tourism, like all other development drivers, initiates environmentalchange, which can be felt at global level. Some of the aspects of global environ-mental change that tourism can affect are with regard to changes in land coverand land use, and allied changes such as deforestation, biodiversity loss, and
64 S Kazi and A Siqueira
introduction of exotic species. Most of these tourism-initiated changes occur lo-cally or individually, but have a cumulative global impact (Gössling 2002).Increased air travel on account of tourism can systemically contribute to globalenvironmental change. Besides contributing to global environmental change,tourism can be a potential victim of the impacts of global environmental change.Maddison (2001); Viner and Agnew (1999); Wall (1998); and WWF (2001) havedocumented the effects of climate change on the tourism industry.
Gössling (2002) investigated the alterations caused by tourism in five ma-jor areas: changes in land cover and land use; use of energy and its impacts;exchange of biota on geographical barriers and the extinction of wild species;exchange and dispersion of diseases; and finally psychological consequence oftravel, changes in the perception, and understanding of environment initiatedby travel. This paper, through the prism of tourism, supports the study byLambin, Turner, Geist et al. (2001), which highlights that the underlying causesof land-use and land-cover changes worldwide are on account of people’s re-sponse to economic opportunity mediated by institutional factors. However, notmany studies have dealt with the social consequences of tourism-related globalenvironmental change.
In the global economy, tourism is a major player as international tourismalone generated over 623 billion dollars in 20041 (WTO 2005) and has beentipped to be the largest industry in the 21st century (Papson 1979 cited in Wall1998). Tourism is a global phenomenon in terms of both intensity (number oftravellers) and extent (number of holidaying destination). It is one of the mostpreferred options in the developing world as it generates much needed foreigncurrency and correspondingly alleviates the balance of payment constraint(Sinclair 1998). In addition, it allows speedy returns, which can be rolled backinto the economy by investing in other sectors (Mathieson and Wall 1982). An-other economic advantage of tourism is that it has a very high ratio of labour tocapital needed for investment. Hence, it is seen as an agent of economic devel-opment,2 encouraging many other ancillary (economic) activities. It also has amultiplier effect in terms of employment and income.
In South Asia, tourism boomed in the 1960s and 1970s, and the regionis one of the fastest growing tourist destinations in the world (Wong 1998). Indiais also a favourite tourist destination. Tourist arrival recorded in India over1997/98 was 2 358 629, showing a decline of 0.7% over the previous year’sfigures.3 India was ranked 15th in terms of contributions from the travel and
1 There has been an increase in the earnings from 524 dollars in 2004, registering a growth of18.8% at current prices and 15.7% at constant prices.2 In an input–output study conducted in Mexico, it was noted that 41 jobs were created withan investment of 80 000 dollars in tourism, which was 25 times more than that in a petro-leum industry and 26 times more than that in a metal industry (Mathieson and Wall 1982).3 Relations with Pakistan and Bangladesh were strained and travel from these countries hasreduced immensely; however, if tourists from these countries are excluded, then tourismregisters a growth of 0.1%.
Bridging local and global concerns 65
tourism industry to GDP (gross domestic product) in 2001 (Government of India2002). India’s share in the world tourism receipts varied between 0.6% and 0.7%between 1990 and 2003 (Government of India 2002a). Estimated foreignexchange earnings to the country have been increasing over the years. In 2003,the foreign exchange earning for India was 164 290 million rupees, registering a15.7% growth over the previous year (Government of India 2002b).
Environmental impacts of tourism
Tourism activity involves a temporary movement of the population to a destina-tion for various purposes (such as recreation, education, business, leisure,adventure, pilgrimage, etc.) and the destination’s response to cater to the pur-pose of travel. Democratization of travel due to higher disposable incomes, paidholidays and the enhanced mobility, proliferation of accommodation, growth ofinclusive tours, and other forms of cheap vacation travel has extended the op-portunity to travel. Thus, today it is not just a prerogative of the few but a partof the lifestyle of a large and growing number of people. According to WTO(World Tourism Organization), there were about 763 million international tour-ist arrivals worldwide in 2004, registering a high growth of almost 11% over2003. To these international tourist figures, domestic figures, ranging betweenfour and ten times the international tourist figures, also need to be accounted(Wall 1998). In addition, there is another movement of population in terms ofworkforce to service the tourism industry that contributes to the largest move-ment of human population.
As a result of the temporary movement of the population (in terms of tour-ists and workforce to service the tourism industry) to the destination, coupledwith the existing resident population, a tremendous demand is exerted on theenvironment and the society. Tourism often leads to demonstration effect.4
Changes in the lifestyles of the locals on account of tourism can cause additionaldemand on natural resources or may alter the existing linkages between the so-ciety and the environment. The impacts of tourism on the environment can bebroadly discussed as those on air, water, and land. Air travel is a major contribu-tor to the greenhouse effect and in the absence of effective measures to reduce/control emission levels, the growth in air travel is a concern.5 Tourism approxi-mately accounts for almost 60% of air travel and according to Tourism Concern,scientists envisage that by 2015 half of the annual destruction of the ozone layerwould be caused by air travel (UNEP 2002a). Local ambient air conditions canbe stressed due to increased vehicular movements on account of tourism.
4 Demonstration effect is an economic term, which in the tourism context is used to explainhow tourist culture is aped by the locals.5 The WTO (World Tourism Organization) estimates that of the 1.6 billion travellers in 2020,1.18 billion will be interregional and 3.77 million will be long-haul travellers (WTO 2005).
66 S Kazi and A Siqueira
The impact on water is felt in terms of availability and quality of ground,surface, and coastal waters. Consumption of water for tourism is high. A studycarried out in India (Kazi and Nairy 2003) estimated the water consumptionpattern across various types of hotels which ranges between 573 597 604 and1335 litres per room per day for low-, middle-, high-, and luxury-budget hotels.Excess pumping of groundwater in coastal areas can lead to salinization of thecoastal aquifers and release of sewage and garbage into water bodies can affectthe quality of water. Activities, such as boating, fishing, snorkeling, diving,release of sewage, and dumping of garbage can have an adverse impact on themarine biodiversity.
Demand on land resources is for the consumption of ‘space’ in terms of in-frastructure, supplies, and ‘sights’ (TERI 2000). Some of the tourisminfrastructural needs would involve setting up of facilities catering to accommo-dation, food and beverages, transportation, communication, and recreation.Tourism development in pockets of tourist activities, especially in coastal areas,can cause fragmentation of the surrounding areas (Gössling 2002). This is acause of concern in eco-tourism, which often opens some parts of the forest fortourism and can have implications on the total forest area. Indirectly, tourismimpacts land use and land cover in terms of demand for supplies such as food,energy, and infrastructure and can occur in areas both with, and devoid of, tour-ism activity (Gössling 2002). Hence, it is difficult to calculate the utilization ofland for tourism at a global scale although Gössling (2002) in his article on glo-bal environmental consequences of tourism has made some attempt towardsthis end. In addition, tourism consumption of space for ‘sights’ involves aes-thetic consumption of space by developing or conserving the natural beauty inorder to attract tourists.
One major player in the tourism business in India is the tiny state of Goa,6
a tourist destination well-known for its coconut palm fringed sandy beaches.Coastal or beach tourism has been a major tourist attraction. Tourism is nowdiversifying into hinterland, business, and heritage tourism.
Goa case study
Goa caters to both domestic and international tourists. Since the late 1970s, thestate has witnessed a buoyant trend in the growth of tourism; more so, in thepast decade during which the rate of growth of international tourists has beenhigher than domestic tourists. This trend coincides with the depreciation ofrupee against dollar and hence could be one of the factors that contributed tothe mass tourism boom in Goa.
6 This state is located on the west coast of the Indian peninsular, supporting a population of1.3 million (Government of Goa 2001) spread across 3702 square kilometres.
Bridging local and global concerns 67
Goa is host to low-, middle-, and high-end domestic and internationaltourists who cluster in their distinct areas spread along the coast. Typically, acoastal phenomenon, tourism in Goa is related to the availability of beaches andthe sea. The use of beaches and the sea depends on climatic conditions andhence the tourist season coincides with the non-monsoon and non-summer sea-sons, which extend from October to March. One of the fallouts of seasonaltourism is the intensity of pressure exerted on the coastal resources to supporthuge tourist arrivals in limited space and time and extract maximum economicgain from the activity to sustain in the non-tourist season.
This case study reports some of the findings of an earlier project (TERI2000), which assessed the land-use and land-cover changes on account of tour-ism-induced population movements on three coastal ecosystems across fivelocations. Five coastal villages were selected to represent different types of tour-ism: low-budget tourism or backpack travel in Anjuna, middle-budget or masstourism in Calangute, high-budget tourism in Varca and Cavelossim, and a non-tourist village Poinguinium. The villages in North Goa, that is, Calangute andAnjuna were the matured tourist destinations, supporting tourism activity sincethe 1970s as compared to Varca and Cavelossim, which opened up to tourism inthe late 1980s and early 1990s. These villages were selected to examine the rela-tionship, if any, between maturity of a tourist destination and type of tourism itsupports, played out differently on land use and land cover of the three distinctcoastal ecosystems.
In this study, a survey of households was carried out to obtain people’sperceptions on different ecosystems in terms of use and threats to these ecosys-tems, to gauge their stake in tourism and profile their socio-economic status.Additionally, a survey of tourism-related infrastructure (hotels, restaurants,handicraft and garment shops, and stalls) was carried out to assess demand onthe land. A survey of workers servicing these infrastructures was also con-ducted to assess the share and trends in migration. Land cover and ecosystemchanges across two time points (1966 and 1999) using satellite imagery were as-sessed. The two time points characterized the condition of land cover inpre-tourism and current tourism period across the study area.
Population movement
Population movement was estimated for the above-mentioned villages. Themovement was of two types: tourist and workforce movement to service thetourism industry. The tourist movement can be further classified as domesticand international tourists and their arrivals in season was estimated to be thehighest in Calangute, ranging between 50 000 and 57 000 tourists, followed byAnjuna, with about 22 000–28 000 tourists. Cavelossim closely followed withabout 21 000–24 000 tourists, and in Varca, tourist arrivals ranged between15 000 and 18 000.
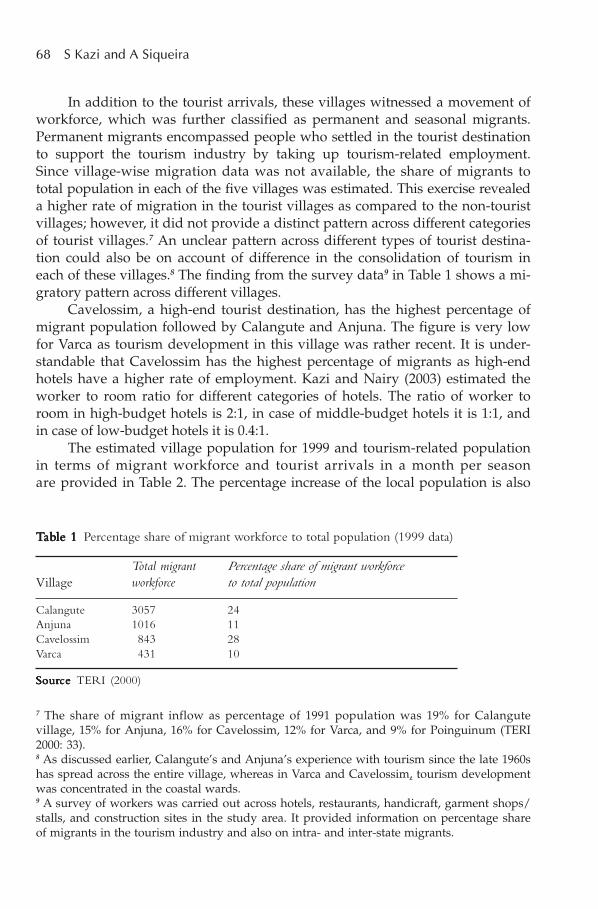
68 S Kazi and A Siqueira
In addition to the tourist arrivals, these villages witnessed a movement ofworkforce, which was further classified as permanent and seasonal migrants.Permanent migrants encompassed people who settled in the tourist destinationto support the tourism industry by taking up tourism-related employment.Since village-wise migration data was not available, the share of migrants tototal population in each of the five villages was estimated. This exercise revealeda higher rate of migration in the tourist villages as compared to the non-touristvillages; however, it did not provide a distinct pattern across different categoriesof tourist villages.7 An unclear pattern across different types of tourist destina-tion could also be on account of difference in the consolidation of tourism ineach of these villages.8 The finding from the survey data9 in Table 1 shows a mi-gratory pattern across different villages.
Cavelossim, a high-end tourist destination, has the highest percentage ofmigrant population followed by Calangute and Anjuna. The figure is very lowfor Varca as tourism development in this village was rather recent. It is under-standable that Cavelossim has the highest percentage of migrants as high-endhotels have a higher rate of employment. Kazi and Nairy (2003) estimated theworker to room ratio for different categories of hotels. The ratio of worker toroom in high-budget hotels is 2:1, in case of middle-budget hotels it is 1:1, andin case of low-budget hotels it is 0.4:1.
The estimated village population for 1999 and tourism-related populationin terms of migrant workforce and tourist arrivals in a month per seasonare provided in Table 2. The percentage increase of the local population is also
7 The share of migrant inflow as percentage of 1991 population was 19% for Calangutevillage, 15% for Anjuna, 16% for Cavelossim, 12% for Varca, and 9% for Poinguinum (TERI2000: 33).8 As discussed earlier, Calangute’s and Anjuna’s experience with tourism since the late 1960shas spread across the entire village, whereas in Varca and Cavelossim, tourism developmentwas concentrated in the coastal wards.9 A survey of workers was carried out across hotels, restaurants, handicraft, garment shops/stalls, and construction sites in the study area. It provided information on percentage shareof migrants in the tourism industry and also on intra- and inter-state migrants.
TTTTTababababable 1le 1le 1le 1le 1 Percentage share of migrant workforce to total population (1999 data)
Total migrant Percentage share of migrant workforceVillage workforce to total population
Calangute 3057 24Anjuna 1016 11Cavelossim 843 28Varca 431 10
SourSourSourSourSourcecececece TERI (2000)
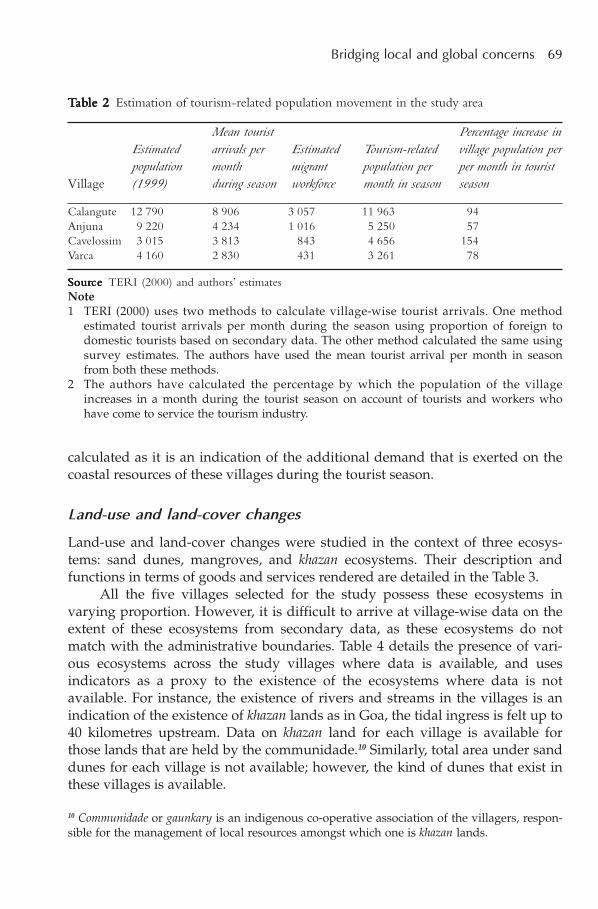
Bridging local and global concerns 69
calculated as it is an indication of the additional demand that is exerted on thecoastal resources of these villages during the tourist season.
Land-use and land-cover changes
Land-use and land-cover changes were studied in the context of three ecosys-tems: sand dunes, mangroves, and khazan ecosystems. Their description andfunctions in terms of goods and services rendered are detailed in the Table 3.
All the five villages selected for the study possess these ecosystems invarying proportion. However, it is difficult to arrive at village-wise data on theextent of these ecosystems from secondary data, as these ecosystems do notmatch with the administrative boundaries. Table 4 details the presence of vari-ous ecosystems across the study villages where data is available, and usesindicators as a proxy to the existence of the ecosystems where data is notavailable. For instance, the existence of rivers and streams in the villages is anindication of the existence of khazan lands as in Goa, the tidal ingress is felt up to40 kilometres upstream. Data on khazan land for each village is available forthose lands that are held by the communidade.10 Similarly, total area under sanddunes for each village is not available; however, the kind of dunes that exist inthese villages is available.
TTTTTababababable 2le 2le 2le 2le 2 Estimation of tourism-related population movement in the study area
Mean tourist Percentage increase inEstimated arrivals per Estimated Tourism-related village population perpopulation month migrant population per per month in tourist
Village (1999) during season workforce month in season season
Calangute 12 790 8 906 3 057 11 963 94Anjuna 9 220 4 234 1 016 5 250 57Cavelossim 3 015 3 813 843 4 656 154Varca 4 160 2 830 431 3 261 78
SourSourSourSourSourcecececece TERI (2000) and authors’ estimatesNote1 TERI (2000) uses two methods to calculate village-wise tourist arrivals. One method
estimated tourist arrivals per month during the season using proportion of foreign todomestic tourists based on secondary data. The other method calculated the same usingsurvey estimates. The authors have used the mean tourist arrival per month in seasonfrom both these methods.
2 The authors have calculated the percentage by which the population of the villageincreases in a month during the tourist season on account of tourists and workers whohave come to service the tourism industry.
10 Communidade or gaunkary is an indigenous co-operative association of the villagers, respon-sible for the management of local resources amongst which one is khazan lands.
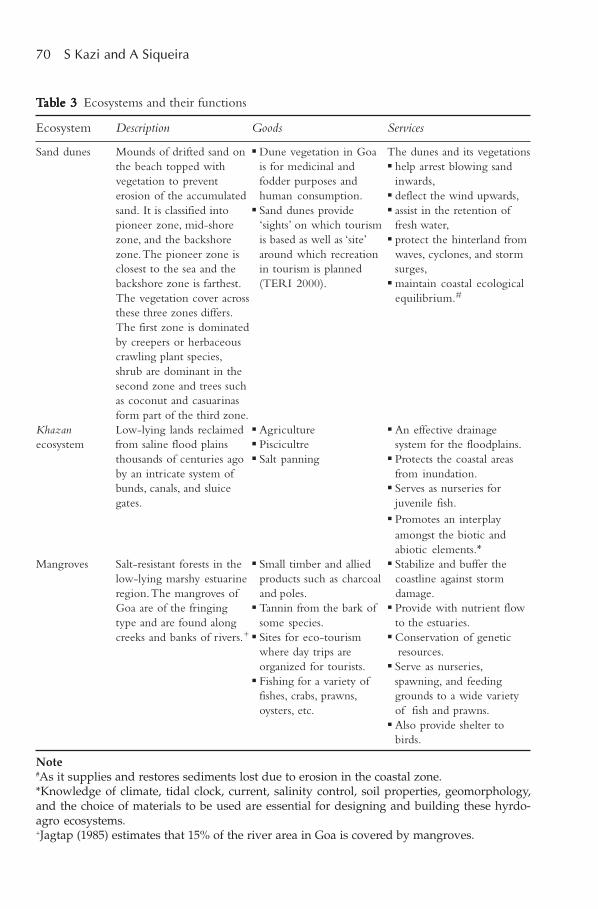
70 S Kazi and A Siqueira
TTTTTababababable 3le 3le 3le 3le 3 Ecosystems and their functions
Ecosystem Description Goods Services
Sand dunes Mounds of drifted sand on Dune vegetation in Goa The dunes and its vegetationsthe beach topped with is for medicinal and help arrest blowing sandvegetation to prevent fodder purposes and inwards,erosion of the accumulated human consumption. deflect the wind upwards,sand. It is classified into Sand dunes provide assist in the retention ofpioneer zone, mid-shore ‘sights’ on which tourism fresh water,zone, and the backshore is based as well as ‘site’ protect the hinterland fromzone. The pioneer zone is around which recreation waves, cyclones, and stormclosest to the sea and the in tourism is planned surges,backshore zone is farthest. (TERI 2000). maintain coastal ecologicalThe vegetation cover across equilibrium.#
these three zones differs.The first zone is dominatedby creepers or herbaceouscrawling plant species,shrub are dominant in thesecond zone and trees suchas coconut and casuarinasform part of the third zone.
Khazan Low-lying lands reclaimed Agriculture An effective drainageecosystem from saline flood plains Piscicultre system for the floodplains.
thousands of centuries ago Salt panning Protects the coastal areasby an intricate system of from inundation.bunds, canals, and sluice Serves as nurseries forgates. juvenile fish.
Promotes an interplayamongst the biotic andabiotic elements.*
Mangroves Salt-resistant forests in the Small timber and allied Stabilize and buffer thelow-lying marshy estuarine products such as charcoal coastline against stormregion. The mangroves of and poles. damage.Goa are of the fringing Tannin from the bark of Provide with nutrient flowtype and are found along some species. to the estuaries.creeks and banks of rivers.+ Sites for eco-tourism Conservation of genetic
where day trips are resources.organized for tourists. Serve as nurseries,
Fishing for a variety of spawning, and feedingfishes, crabs, prawns, grounds to a wide varietyoysters, etc. of fish and prawns.
Also provide shelter tobirds.
Note#As it supplies and restores sediments lost due to erosion in the coastal zone.*Knowledge of climate, tidal clock, current, salinity control, soil properties, geomorphology,and the choice of materials to be used are essential for designing and building these hyrdo-agro ecosystems.+Jagtap (1985) estimates that 15% of the river area in Goa is covered by mangroves.
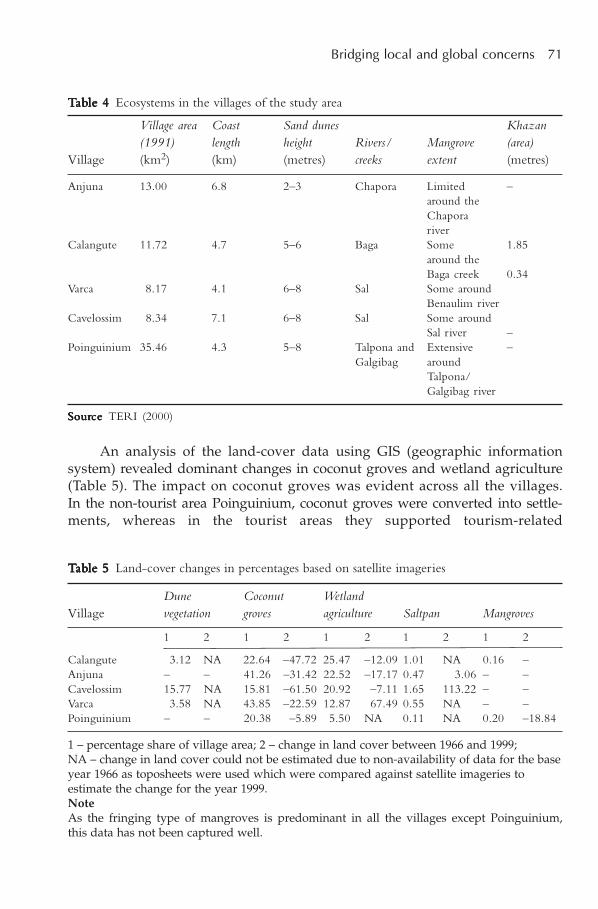
Bridging local and global concerns 71
An analysis of the land-cover data using GIS (geographic informationsystem) revealed dominant changes in coconut groves and wetland agriculture(Table 5). The impact on coconut groves was evident across all the villages.In the non-tourist area Poinguinium, coconut groves were converted into settle-ments, whereas in the tourist areas they supported tourism-related
TTTTTababababable 4le 4le 4le 4le 4 Ecosystems in the villages of the study area
Village area Coast Sand dunes Khazan(1991) length height Rivers/ Mangrove (area)
Village (km2) (km) (metres) creeks extent (metres)
Anjuna 13.00 6.8 2–3 Chapora Limited –around theChaporariver
Calangute 11.72 4.7 5–6 Baga Some 1.85around theBaga creek 0.34
Varca 8.17 4.1 6–8 Sal Some aroundBenaulim river
Cavelossim 8.34 7.1 6–8 Sal Some aroundSal river –
Poinguinium 35.46 4.3 5–8 Talpona and Extensive –Galgibag around
Talpona/Galgibag river
SourSourSourSourSourcecececece TERI (2000)
TTTTTababababable 5le 5le 5le 5le 5 Land-cover changes in percentages based on satellite imageries
Dune Coconut WetlandVillage vegetation groves agriculture Saltpan Mangroves
1 2 1 2 1 2 1 2 1 2
Calangute 3.12 NA 22.64 –47.72 25.47 –12.09 1.01 NA 0.16 –Anjuna – – 41.26 –31.42 22.52 –17.17 0.47 3.06 – –Cavelossim 15.77 NA 15.81 –61.50 20.92 –7.11 1.65 113.22 – –Varca 3.58 NA 43.85 –22.59 12.87 67.49 0.55 NA – –Poinguinium – – 20.38 –5.89 5.50 NA 0.11 NA 0.20 –18.84
1 – percentage share of village area; 2 – change in land cover between 1966 and 1999;NA – change in land cover could not be estimated due to non-availability of data for the baseyear 1966 as toposheets were used which were compared against satellite imageries toestimate the change for the year 1999.NoteAs the fringing type of mangroves is predominant in all the villages except Poinguinium,this data has not been captured well.
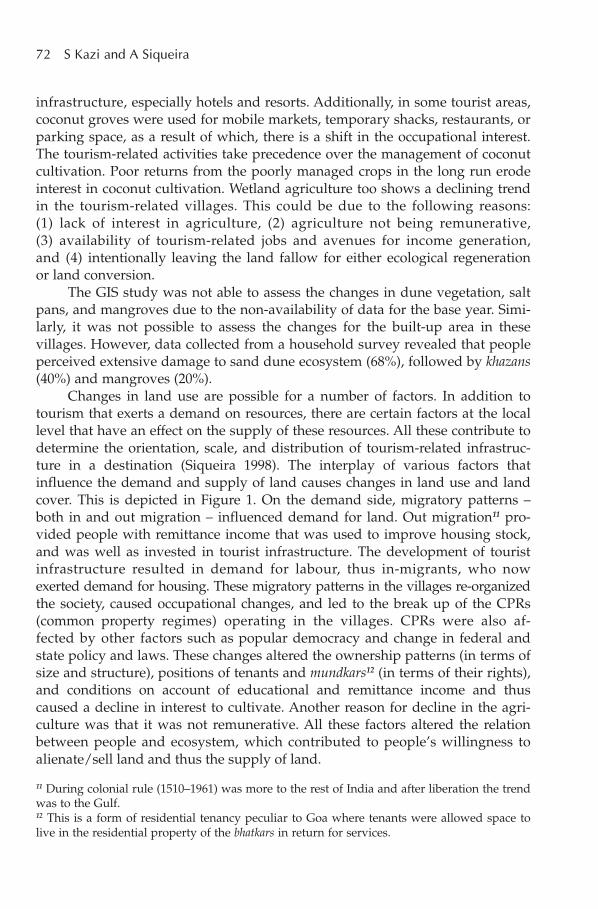
72 S Kazi and A Siqueira
infrastructure, especially hotels and resorts. Additionally, in some tourist areas,coconut groves were used for mobile markets, temporary shacks, restaurants, orparking space, as a result of which, there is a shift in the occupational interest.The tourism-related activities take precedence over the management of coconutcultivation. Poor returns from the poorly managed crops in the long run erodeinterest in coconut cultivation. Wetland agriculture too shows a declining trendin the tourism-related villages. This could be due to the following reasons:(1) lack of interest in agriculture, (2) agriculture not being remunerative,(3) availability of tourism-related jobs and avenues for income generation,and (4) intentionally leaving the land fallow for either ecological regenerationor land conversion.
The GIS study was not able to assess the changes in dune vegetation, saltpans, and mangroves due to the non-availability of data for the base year. Simi-larly, it was not possible to assess the changes for the built-up area in thesevillages. However, data collected from a household survey revealed that peopleperceived extensive damage to sand dune ecosystem (68%), followed by khazans(40%) and mangroves (20%).
Changes in land use are possible for a number of factors. In addition totourism that exerts a demand on resources, there are certain factors at the locallevel that have an effect on the supply of these resources. All these contribute todetermine the orientation, scale, and distribution of tourism-related infrastruc-ture in a destination (Siqueira 1998). The interplay of various factors thatinfluence the demand and supply of land causes changes in land use and landcover. This is depicted in Figure 1. On the demand side, migratory patterns –both in and out migration – influenced demand for land. Out migration11 pro-vided people with remittance income that was used to improve housing stock,and was well as invested in tourist infrastructure. The development of touristinfrastructure resulted in demand for labour, thus in-migrants, who nowexerted demand for housing. These migratory patterns in the villages re-organizedthe society, caused occupational changes, and led to the break up of the CPRs(common property regimes) operating in the villages. CPRs were also af-fected by other factors such as popular democracy and change in federal andstate policy and laws. These changes altered the ownership patterns (in terms ofsize and structure), positions of tenants and mundkars12 (in terms of their rights),and conditions on account of educational and remittance income and thuscaused a decline in interest to cultivate. Another reason for decline in the agri-culture was that it was not remunerative. All these factors altered the relationbetween people and ecosystem, which contributed to people’s willingness toalienate/sell land and thus the supply of land.
11 During colonial rule (1510–1961) was more to the rest of India and after liberation the trendwas to the Gulf.12 This is a form of residential tenancy peculiar to Goa where tenants were allowed space tolive in the residential property of the bhatkars in return for services.
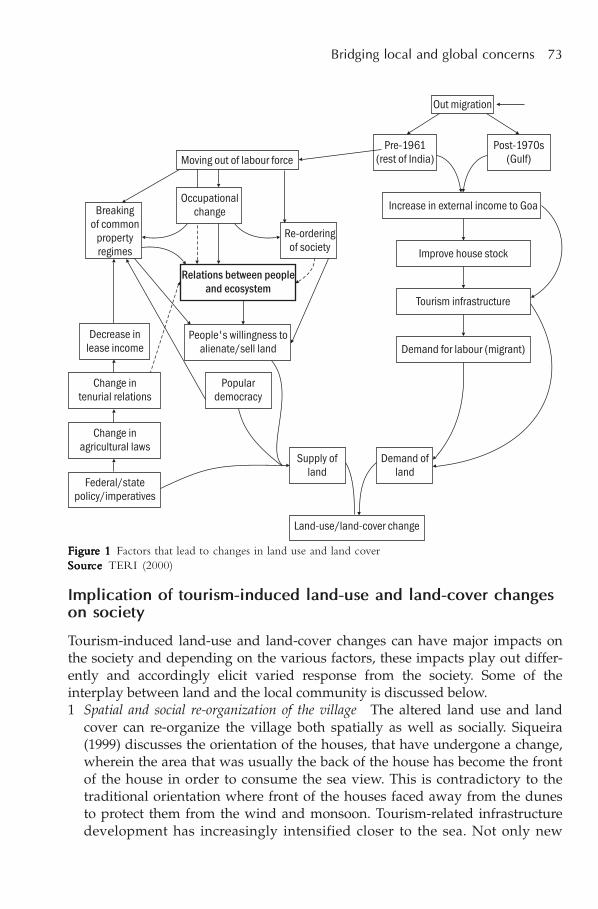
Bridging local and global concerns 73
Implication of tourism-induced land-use and land-cover changeson society
Tourism-induced land-use and land-cover changes can have major impacts onthe society and depending on the various factors, these impacts play out differ-ently and accordingly elicit varied response from the society. Some of theinterplay between land and the local community is discussed below.1 Spatial and social re-organization of the village The altered land use and land
cover can re-organize the village both spatially as well as socially. Siqueira(1999) discusses the orientation of the houses, that have undergone a change,wherein the area that was usually the back of the house has become the frontof the house in order to consume the sea view. This is contradictory to thetraditional orientation where front of the houses faced away from the dunesto protect them from the wind and monsoon. Tourism-related infrastructuredevelopment has increasingly intensified closer to the sea. Not only new
FigurFigurFigurFigurFigure 1e 1e 1e 1e 1 Factors that lead to changes in land use and land coverSourSourSourSourSourcecececece TERI (2000)
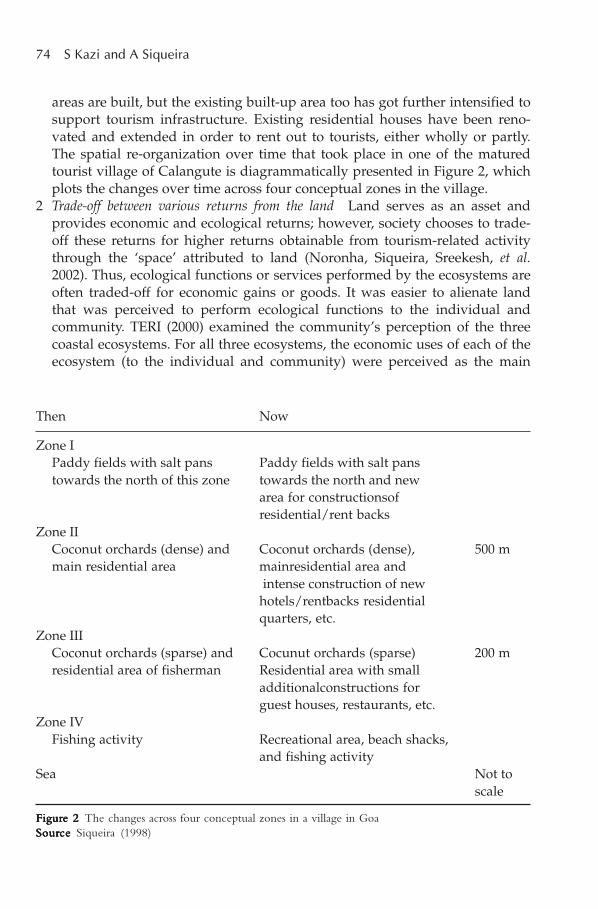
74 S Kazi and A Siqueira
areas are built, but the existing built-up area too has got further intensified tosupport tourism infrastructure. Existing residential houses have been reno-vated and extended in order to rent out to tourists, either wholly or partly.The spatial re-organization over time that took place in one of the maturedtourist village of Calangute is diagrammatically presented in Figure 2, whichplots the changes over time across four conceptual zones in the village.
2 Trade-off between various returns from the land Land serves as an asset andprovides economic and ecological returns; however, society chooses to trade-off these returns for higher returns obtainable from tourism-related activitythrough the ‘space’ attributed to land (Noronha, Siqueira, Sreekesh, et al.2002). Thus, ecological functions or services performed by the ecosystems areoften traded-off for economic gains or goods. It was easier to alienate landthat was perceived to perform ecological functions to the individual andcommunity. TERI (2000) examined the community’s perception of the threecoastal ecosystems. For all three ecosystems, the economic uses of each of theecosystem (to the individual and community) were perceived as the main
Then Now
Zone IPaddy fields with salt pans Paddy fields with salt panstowards the north of this zone towards the north and new
area for constructionsofresidential/rent backs
Zone IICoconut orchards (dense) and Coconut orchards (dense), 500 mmain residential area mainresidential area and
intense construction of newhotels/rentbacks residentialquarters, etc.
Zone IIICoconut orchards (sparse) and Cocunut orchards (sparse) 200 mresidential area of fisherman Residential area with small
additionalconstructions forguest houses, restaurants, etc.
Zone IVFishing activity Recreational area, beach shacks,
and fishing activitySea Not to
scale
FigurFigurFigurFigurFigure 2e 2e 2e 2e 2 The changes across four conceptual zones in a village in GoaSourSourSourSourSourcecececece Siqueira (1998)

Bridging local and global concerns 75
uses. It is interesting to note that sand dunes were reported to be used forbuilding purpose, as these are open or public spaces that are encroachedupon, for they are the prime tourism location.13 Some of the ecological serv-ices reported by the community were for sand dune and mangroveecosystem as these ecological functions benefited the entire community. Incase of sand dunes, the service was to reduce the salt-water ingress into thevillages, and in case of mangroves, it was to prevent erosion and protect thebunds of the khazans. Khazans were perceived useful for economic purposessuch as salt panning (khazan lands were used to produce salt, which, besidesdomestic consumption, is used as manure for coconut plants), paddy cultiva-tion, and prawn farming. Tourism was the main cause for the degradation incase of sand dune ecosystem, whereas for khazan ecosystem, the dominantcause of the degradation was lack of interest in paddy cultivation and in caseof mangroves, degradation was not associated with tourism.
3 New entrants from outside the destination Every tourism destination in itscourse of development goes through different stages.14 The developmentstage of the destination life cycle witnesses entry of players from outside thedestination. They determine local tourism development in void, as they are of-ten ignorant of the local dynamics at play between people and theenvironment. Large hotels, which have come up on the basis of large invest-ments, have resulted in more pronounced changes as they support extensivetourism, that is, less number of tourists over larger areas (Noronha, Siqueira,Sreekesh, et al. 2002). ‘Space’ is valued and marketed in terms of ‘sights’where sand dunes are denuded of their vegetation and altered to support agolf course along the coast or may be completely razed to provide unhin-dered sea view.
4 Political re-organization of society Politically, too, the society got re-organizedas new pressure groups and lobbies emerged to play an important role in in-fluencing decisions in their favour. The influence of these groups is notconfined to the local level but percolates upwards to state and central level of
13 Siqueira (1999) reports on how sand dunes were razed or cleared to extend fields and hasdocumented a series of court cases that were filed for violation of coastal regulation zone.14 The destination life cycle is made up of six stages. The first stage, the exploratory stage, ischaracterized by a few tourists who discover the destination. In case of Goa, it was the hippeswho contributed in putting Goa on the international tourist map. The next stage is the stageof involvement where locals take initiative to cater to the needs of the tourists. There is amarked tourist season, area, and an increase in the number of tourists. The organization oftourism takes place in the next stage of development where the control of infrastructuremoves out of local hands. In the consolidation stage, there is no great increase in the numberof tourists and the destination becomes a well-established tourist destination. In the stagna-tion stage, the destination has peaked in terms of number of visitors and requires a soundpolicy to deal with environmental, social, and economic problems. Based on the manage-ment system adopted, the destination can either move into a stage of decline or rejuvenation.

76 S Kazi and A Siqueira
the government. Tourism opened the doors for international players who in-fluence outcomes at the local level. These lobbies and pressure groupsinfluence the government in terms of policies framed or in the manner inwhich the government discharges its duty. In addition to yielding to pressure,government machinery is rewarded for non-enforcement of rules or misinter-pretation of rules until it is pointed out otherwise. There has been a violationof coastal regulation zone on account of changes in the zoning and fixing ofhigh tide line, HTL (Alvares 2002). Hotels and other tourism-related infra-structure have come up along the coast, destructing sand dunes and itsvegetation, violating building height regulation, releasing untreated sewagein the coastal waters, and extracting groundwater within 200 metres from theHTL.
5 New entrants emerging from destination Across these villages, a process ofhomogenization was seen, whereby land used for coconuts, salt panning, andpaddy production was being converted to built-up area to support touristinfrastructure (TERI 2000). This had implications on the social structure,which was re-ordered with the advent of a new class of people who hadmoved out of primary occupation to tertiary sector. The latter was not onlymore rewarding but it enabled people to move up the social ladder as therewas a social stigma associated with menial work. Tourism opened alterna-tive avenues to fishermen, toddy-tappers, and farmers who rented out roomsto tourists or migrants who came to service the tourism industry, or put upshacks or let out rooms for shops selling curios and souvenirs to the tourists.Thus, tourism provided an opportunity for locals to alienate land profitablyas well as to attain new social status. Earlier few ‘batcars’ – that is a land-owner – enjoyed the reverence of the villages. With the advent of tourism,and coupled with the democratic principles post-liberation,15 this reverenceshifted to new aspirants in the village.
6 The lure of tourism The success from tourism business bewitches those with-out any stake in tourism to participate in this business. As a result of this,over time, supply of tourism goods and services surpasses the demand. Un-der such circumstances, often there is an undercutting of prices due to intensecompetition and need to at least break even. Thus, additional demand oncoastal resources is exerted on account of more players using the coastal re-sources. As the profits are claimed to be low, very little or nothing is investedin the maintenance of the social and physical environment.
7 Seasonality The seasonality aspect of coastal tourism aggravates the abovecondition further. Since coastal tourism is a seasonal activity, players wantto extract the maximum benefits from seasonal tourism to sustain in the
15 Goa had the longest colonial rule in India, until 1961. Subsequent to the Portugueserule, Goa became a part of Indian union and was conferred with a democratic form ofgovernment.
Bridging local and global concerns 77
non-tourist season. Thus, economic gains take precedence over environment.Further, the nature of coastal tourism, which is confined to limited space andtime, creates development of concrete jungles that remain under-utilized (asthese are not used in the non-tourist season) at the cost of permanent land-use and land-cover changes along the coast. Coastal resources are put undertremendous pressure, as they need to support the tourist inflows in additionto the local population and migrant workers. An estimation of the ratio oftourists to total population in Goa was 94 tourists for every 100 residents.16
8 Conflicting interest Spatial re-ordering of the society by tourism canmarginalize traditional access to resources due to either conflicting demandson that resource or conflicts to access a greater share of that resource. Beachesin India are public property and everyone wants to extract maximum benefitsfrom this public good. Kazi and Siqueira (2001) discuss how shacks – thesmall tourism players – compete with bigger players such as hotels and res-taurants and reflect the conflict between traditional users and newtourism-related users.
Conflict for greater share in the tourism pie
The main source of revenue for hotels is their restaurants. Most of the hotels aretied up with charter tourists as a result of which they sell the rooms at a lowerrate for bulk bookings. When guests patronize the shacks, this income is lost tothe hotel. Hotels that have access to the beach put up structures, organize beachparties close to the beach, and may even discourage their guests from visitingshacks.17 Shacks, on the other hand, come up close to the beachfront hotels. Thecloser a shack is to the hotel, the more is its business potential. Hence, shackshave got clustered more at the beach access points, close to the hotels. This con-flict has often polarized the village into groups and shack owners have come toplay an important role in local politics. However, the state licensing mechanismclearly reflects the influence of the hotel lobby to try and safeguard their inter-ests and the politicians are often playing the balancing act as they are caughtbetween the two groups.
Conflicting demand over resources
There is a competition between tourism players such as beachfront hotels, res-taurants, shacks, beach chair and umbrella owners, and the traditional users of
16 This is estimated based on the population and tourist arrival data for Goa (Government ofGoa 2001).17 One hotel had a signboard that read, ‘The hotel does not guarantee the quality of the foodavailable on the beach.’ and ‘A doctor is available in residence at the hotel for the guests’.
78 S Kazi and A Siqueira
the beach, the fishermen. The latter are increasingly being marginalized as thereis very little beach space available for them to park their boats, fishing gear, andcarry out allied activities such as mending their nets and drying of fish on thebeach, as it is in direct conflict with the interest of tourism (Nairy, Kazi,Abraham, et al. 2003). Further, fishing and tourism seasons are the non-monsoon seasons and both being seasonal activities, there is great stress on thefishermen to sustain in the off-season.
Thus, tourist locations have become sites of intense contestation betweentourists and locals, old residents and new migrants, big and small players, or-ganized and non-organized sectors, and traditional and tourist use of resources.
Conclusion
Anthropogenic factors are the main drivers of land-use and land-cover changes.In recent times, tourism is regarded as a powerful global development driver,which impacts land use and land cover. Land-use and land-cover changes in-duced by tourism, which although are local-level impacts, have a cumulativeimpact at a global level. An examination of the case study on tourism-inducedland-use and land-cover changes highlighted that it is not tourism demand perse that impacts land-use and land-cover changes but rather tourism, whichalong with local dynamics influences the supply of land and determines the ex-tent and intensity of change. In addition to these physical impacts onenvironment, societal impacts of these changes evoke different response to thesechanges. A detailed understanding of the pathways through which tourism im-pacts the environment and the societal response to these impacts and vice versawill provide an understanding of the issue with all its complexities, which, inturn, can help develop better strategies to cope with this issue. The strategiesshould be developed by involving all the stakeholders to arrive at a multi-stakeholder sensitive policy. In addition to policy interventions, enablingconditions to implement these policies should be promoted. These strategies,which evolve at the local level, will cumulatively address the issue at a globallevel. This issue has a great relevance at a global scale, as tourism is a world-wide phenomenon that is expanding at a rapid pace and cumulatively itsimpacts can aggregate at a global scale.
Acknowledgement
The paper is a part of the project titled ‘Population Consumption and Environ-ment: a tourist spot scenario’. Financial support for this project was provided byJhon D and Catherine T MacArthur Foundation, Chicago, USA.
Bridging local and global concerns 79
References
Alvares C (ed.). 2002Fish Curry and Rice: a source book on Goa, its ecology and life-styleGoa: Other India Press. 376 pp.
Gössling S. 2002Global environmental consequences of tourismGlobal Environmental Change 12: 283–302
Government of Goa. 2001Statistical Hand book of GoaGoa: Government Printing Press. 263 pp.
Government of India. 2002Annual Report 2001–2002, India TourismDetails available at <http://www.indiastat.com/india/ShowData.asp?secid=29079&ptid=106&level =3>, last accessed on 27 April 2005
Government of India. 2002aIndia tourism statisticsDetails available at <http://www.indiastat.com/india/ShowData.asp?secid=4506&ptid=106&level=3>, last accessed on 27 April 2005
Government of India. 2002bIndia tourism statisticsDetails available at <http://www.indiastat.com/india/ShowData.asp?secid=28057&ptid=106&level=3>, last accessed on 27 April 2005
IGBP (International Geosphere–Biosphere Programme). 1999Land-Use and Land-Cover Change: Implementation Strategy[IGBP Report No.48/IHDP Report No. 10]Sockholm: The Royal Swedish Academy of Sciences
Jagtap T G. 1985Ecological studies in Relation to Mangrove Environment along the Goa coast,IndiaKolhapur: Shivaji University [Doctoral thesis]
Kazi S and Nairy S. 2003Resource use patterns in the tourism accommodation sectorIn Coastal Tourism, Environment and Sustainable Local Development, pp. 95-120,edited by L Noronha, N Lourenço, J P Lobo-Ferreira, A Lleopart, E Feoli, K Sawkar,A G ChachadiNew Delhi: The Energy and Resources Institute. 464 pp.
80 S Kazi and A Siqueira
Kazi S and Siqueira A. 2001Beach shacks: conflicts over tourists and resourcesCoastin 5: 7–9
Lambin E F, Turner B L, Geist H J, Agbola S B, Angelsen A, Bruce J W, Coomes O T,Dirzo R, Fischer G, Folke C, George P S, Homewood K, Imbernon J, Leemans R,Li X, Moran E F, Mortimore M, Ramakrishnan P S, Richards J F, Skanes H,Steffen W, Stone G D, Svedin U, Veldkamp T A, Vogel C and Xu J. 2001The causes of land use and land cover change: moving beyond the mythsGlobal Environmental Change 11: 261–269
Maddison D. 2001In search of warmer climates? The impact of climate change on flows of BritishtouristsClimate Change 49: 193–208
Mathieson A and Wall G. 1982Tourism: economic, physical and social impactsUK: Longman Group Ltd
Meyer B W. 1995Past and present land use and land cover in the USAConsequences: 1 (1)Details available at <http://www.gcrio.org/CONSEQUENCES/spring95/Land.html>, last accessed on 5 January 2005
Nairy K S, Kazi S, Abraham M, Jorge R. 2003The Baga-Nerul watersheds: tourism, local stakes and transformationsIn Coastal Tourism, Environment and Sustainable Local Development, pp. 61–94, editedby L Noronha, N Lourenço, J P Lobo-Ferreira, A Lleopart, E Feoli, K Sawkar, andA G ChachadiNew Delhi: The Energy and Resources Institute. 464 pp.
Noronha L, Siqueira A, Sreekesh S, Qureshy L, Kazi S. 2002Goa: tourism, migrations, and ecosystem transformationsAmbio 31 (41): 295–302
Sinclair M T. 1998Tourism and economic developmentThe Journal of Development Studies 34 (5): 1–51
Siqueira A. 1998The Ganv: some aspects of transformation[Part of report number 97/EM/50]New Delhi: Tata Energy Research Institute
Bridging local and global concerns 81
Siqueira A. 1999Global Consumption and Local Processes, Goa[Part of report number 97/EM/50]New Delhi: Tata Energy Research Institute
TERI (Tata Energy Research Institute). 2000Population, Consumption and Environment Inter-relations: a tourist spot scenario[TERI Project Report No. 97EM50]New Delhi: TERI. 215 pp.
Turner B L, Moss R H, and Skole D L (eds). 1993Relating land use and global land cover: a proposal for an IGBP–HDP coreprojectReport from the IGBP–HDP Working Group on Land-Use/Land-cover Change[Joint publication of the International Geosphere-Biosphere Programme (ReportNo.24) and the Human Dimensions of Global Environmental Change Programme(Report No.5)]Stockholm: Royal Swedish Academy of SciencesDetails available at <http://www.ciesin.org/docs/002-105/002-105b.html>, lastaccessed on 13 January 2005
Turner II B L, Kasperson, Meyer W B, Dow K M, Golding D, Kasperson J X,Mitchell R C, Ratick S J. 1990Two types of global environmental change: definitional and spatial scale issuein their human dimensionsGlobal Environmental Change: 14–22
UNEP (United Nations Environmental Programme). 2002Global Environment Outlook-3 (GEO –3): past, present and future perspectivesLondon: Earthscan PublishersDetails available at < http://www.unep.org/geo/geo3/english/pdf.htm>,last accessed on 13 January 2006
UNEP (United Nations Environmental Programme). 2002aEnvironmental impacts of tourism at the global levelDetails available at <http://www.uneptie.org/pc/tourism/sust-tourism/env-global.htm>, last accessed on 4 January 2005
Viner D and Agnew M. 1999Climate change and its impacts on tourism. A report prepared for WWF-UKDetails available at <http://www.wwf-uk.org/filelibrary/pdf/tourism_andccfullpaper>, last accessed on 10 September 2005
Wall G. 1998Implications of global climate change for tourism and recreation in wetlandareasClimate Change 40: 371–389
82 S Kazi and A Siqueira
Wong P P. 1998Coastal tourism development in Southeast Asia: relevance and lessons forcoastal zone managementOcean and Coastal Management 38: 89–109
WTO (World Trade Organization). 2005Tourism highlightsDetails available at <http://www.world-tourism.org/facts/menu.html>, lastaccessed on 5 January 2006.
WWF (World Wide Fund for Nature). 2001Tourism and Climate Change: a WWF tourism issue paperWWF International
Bibliography
Association of American Geographers. 1996The developing active learning modules on the human dimensions of globalchange ‘Human driving forces and their impacts on land use/land cover’Details available at <http://resweb.llu.edu/rford/docs/VGD/LUCC/background1.html>, last accessed on 1 January 2005
Noronha L, Lourenço N, Lobo-Ferreira J P, Lleopart A, Feoli E, Sawkar K,Chachadi A G (eds). 2003Coastal Tourism, Environment, and Sustainable Local DevelopmentNew Delhi: The Energy and Resources Institute. 464 pp.
USGCRP (US Global Change Research Program). 2003Strategic plan for climate change science programeDetails available at <http://www.usgcrp.gov/>, last accessed on 5 January 2005
WWF (World Wide Fund for Nature). 1999Tourism: facing the challenge of climate changeDetails available at <http://www.wwf.org.uk/filelibrary/pdf/tourism3.pdf>, lastaccessed on 10 January 2006
Remote sensing and application of GIS innatural resources management withreference to land-use/land-cover in thestate of Goa
Mohan Girap
In recent years, tremendous advancements in the field of space technologyhave triggered the use of scientific and technical expertise/utility in exploringthe possibilities of remote sensing and its application as a tool towards attainingan optimum sustainable management of the available natural resources. Keep-ing this view in mind, an attempt has been made to reveal the hidden treasureand to understand the utility of the remotely sensed data to interpret the statusof ‘land-use/land-cover’ of Goa as well as its geographic information systemcapabilities. While doing so spatial database has been integrated with the non-spatial database through a, SDSS (Spatial Decision Support System) tounderstand the site-specific action plan. The present study does not involve atime series component (that is, interpretation of remotely sensed data and itsanalysis pertaining to two different seasons) to comment on seasonal or spatialvariation in land-use/land-cover classes.
Introduction
Remarkable advances in the field of remote sensing technology and its applica-tions during the past two decades have firmly established the immense potentialfor monitoring, management, and conservation of natural resources. The abilityof space-based remote sensing for obtaining synoptic, accurate, and repetitivecoverage of an area makes it a unique and powerful tool for analysing the basicproblems related to management of natural resources. Availability of multi-spatial, multispectral, and multitemporal remote sensing data from spaceplatform for the given area of interest has revolutionized the mapping
4
84 M Girap
monitoring and management of basic natural resources, such as agriculture,forests, water, soils, minerals, ocean wealth, etc. Further, it aids in characterizingthe agricultural zones and identifying constraints/ecological problems at themicro level.
Further, when this technology is suitably merged with collateral socio-economic and meteorological data through GIS (geographic informationsystems) it enables formation of locale-specific prescriptions to achieve sustain-able development of the natural resources of any region of interest.
Objectives
Generation of land-use/land-cover map on 1:50 000 scale. Generation of socio-economic database at district/taluka/village levels. Integration of thematic information with the socio-economic data of the state
to draw action plans. Understand the capabilities of the GIS and the SDSS (spatial decision support
system) application software. Assess the utility of remotely sensed data for natural resources mapping.
Study area
Goa is located on the west coast of India between the coordinates 14º 53’ 57’’North to 15º 47’ 59’’ North latitude and 73º 40’ 54” East to 74º 20’ 11” East longi-tude, with a geographical area of 3702 km2 (square kilometres). It is bounded bythe districts of Sindhudurga (Maharashtra) in the north, Belgaum and Dharwad(Karnataka) along the east, north Kanara (Karnataka) in the south, and ArabianSea in the west.
The Western Ghats region runs along the eastern length of the state andconsists of a wide belt of rich forests with abundant biodiversity of flora andfauna. The intermediate region that lies between the high Western Ghats regionand the coastal plains is called the midland region, with distinct geographicaland ecological characteristics.
For administrative purpose, Goa is divided into two districts, 11 talukas,189 village panchayats, and 14 municipalities. Sixty per cent of its population of1.2 million is concentrated in coastal talukas, with the hilly region having a lowdensity of population. The male (83.64%) and female (67.09%) literacy rates ofthe state are high compared to the national average.
Topographically, Goa can be divided into three distinct subregions, namelythe coastal plains, the intermediate or transitional submountainous region withundulating uplands, and interior hilly regions consisting of Western Ghats. Thecoastal plain comprises the talukas of Bardez, Tiswadi, Mormugao, and Salcete,which cover about 22% of the total geographical area. The intermediate or tran-sitional submountainous region comprising the talukas of Pernem, Bicholim,
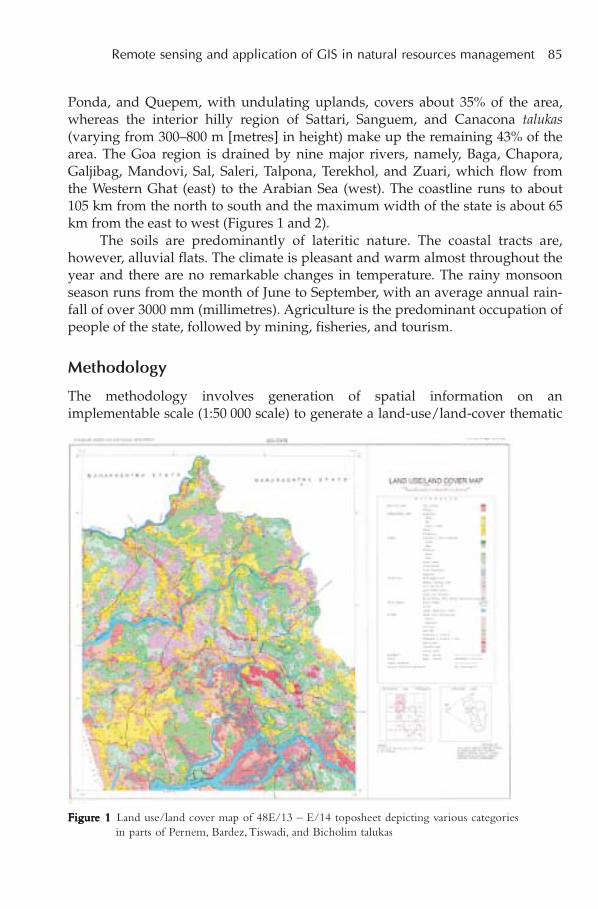
Remote sensing and application of GIS in natural resources management 85
Ponda, and Quepem, with undulating uplands, covers about 35% of the area,whereas the interior hilly region of Sattari, Sanguem, and Canacona talukas(varying from 300–800 m [metres] in height) make up the remaining 43% of thearea. The Goa region is drained by nine major rivers, namely, Baga, Chapora,Galjibag, Mandovi, Sal, Saleri, Talpona, Terekhol, and Zuari, which flow fromthe Western Ghat (east) to the Arabian Sea (west). The coastline runs to about105 km from the north to south and the maximum width of the state is about 65km from the east to west (Figures 1 and 2).
The soils are predominantly of lateritic nature. The coastal tracts are,however, alluvial flats. The climate is pleasant and warm almost throughout theyear and there are no remarkable changes in temperature. The rainy monsoonseason runs from the month of June to September, with an average annual rain-fall of over 3000 mm (millimetres). Agriculture is the predominant occupation ofpeople of the state, followed by mining, fisheries, and tourism.
Methodology
The methodology involves generation of spatial information on animplementable scale (1:50 000 scale) to generate a land-use/land-cover thematic
FigurFigurFigurFigurFigure 1e 1e 1e 1e 1 Land use/land cover map of 48E/13 – E/14 toposheet depicting various categoriesin parts of Pernem, Bardez, Tiswadi, and Bicholim talukas
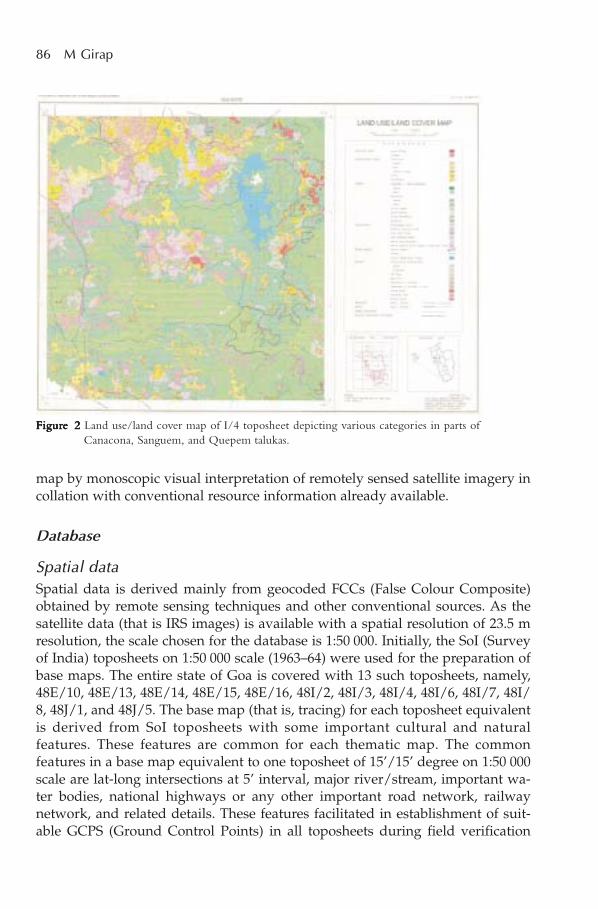
86 M Girap
map by monoscopic visual interpretation of remotely sensed satellite imagery incollation with conventional resource information already available.
Database
Spatial data
Spatial data is derived mainly from geocoded FCCs (False Colour Composite)obtained by remote sensing techniques and other conventional sources. As thesatellite data (that is IRS images) is available with a spatial resolution of 23.5 mresolution, the scale chosen for the database is 1:50 000. Initially, the SoI (Surveyof India) toposheets on 1:50 000 scale (1963–64) were used for the preparation ofbase maps. The entire state of Goa is covered with 13 such toposheets, namely,48E/10, 48E/13, 48E/14, 48E/15, 48E/16, 48I/2, 48I/3, 48I/4, 48I/6, 48I/7, 48I/8, 48J/1, and 48J/5. The base map (that is, tracing) for each toposheet equivalentis derived from SoI toposheets with some important cultural and naturalfeatures. These features are common for each thematic map. The commonfeatures in a base map equivalent to one toposheet of 15’/15’ degree on 1:50 000scale are lat-long intersections at 5’ interval, major river/stream, important wa-ter bodies, national highways or any other important road network, railwaynetwork, and related details. These features facilitated in establishment of suit-able GCPS (Ground Control Points) in all toposheets during field verification
FigurFigurFigurFigurFigureeeee 22222 Land use/land cover map of I/4 toposheet depicting various categories in parts ofCanacona, Sanguem, and Quepem talukas.
Remote sensing and application of GIS in natural resources management 87
(that is, ground truthing). Thematic information derived by analysing remotesensing data and other conventional data is finally transferred to the base map.Thus, each thematic map equivalent to a particular SoI toposheet has the samebase map details that are useful as controls in overlaying at the time of datageneration.
Non-spatial data
Non-spatial database mainly comprises demographic and infrastructural detailsreflecting the socio-economic conditions of the region. The main source ofdemographic and socio-economic data is the District Census Handbook of theDirectorate of Census Operations, Goa.
Data source
Reliability of the primary data source (spatial and non-spatial) is extremelyimportant as most of the analysis and final results are dependent on the primarydata. Data acquired from the FCCs is quite accurate and the methodology ofinterpretation/analysis is well established. The primary source of thematicinformation concerning various natural resources is derived from remotesensing data acquired from IRS 1A/1B (LISS II) and 1C (LISS III) satellites. Thefollowing primary data products were used in generating various thematicmaps. Geocoded FCCs generated by IRS 1A, IRS 1B (1992–93) and IRS 1C (1996)
satellites and corresponding to respective SOI toposheets on 1:50 000 scale SOI toposheets on 1:50 000 scale. District Census Handbook Meteorological data
Many other relevant spatial data pertaining to the state is obtained fromvarious central and State departments.
Interpretation technique
Visual interpretation of the FCCs using the basic interpretation keys (tone,texture, colour, size, association, shape, logical analysis, etc.) was carried outwith limited ground truth verification.
The interpretation progressed through monoscopic interpretation tech-niques using three basic parameters: local knowledge of the area, interpretationexperience, and standard interpretation keys. The interpretation keys are eitherselective (most likelihood choice) or eliminative (that is, through successiveprocess of eliminating known unlikely choices), which provide step-by-stepmethods to organize information for correct identification of unknown objects.
Adopting the above methodology, the following thematic maps wereprepared.
Transport network, settlement location, and village boundary map
88 M Girap
Surface waterbody/drainage/watershed map Slope, aspect, and altitude map Soil map Hydrogeomorphology map Land-use/land-cover map Infrastructure map Socio-economic and population density map
Further, on integration of these thematic maps by the technique of visualGIS and formulation of site-specific prescriptions, the following action planmaps were prepared: (a) action plan for land resources development and(b) action plan for water resources development. However, this paper describes‘land-use/land-cover theme’ in detail to give an insight into the capabilities ofsuch a widely accepted technique of remote sensing interpretation.
Results and discussions: land-use/land-cover map
The term ‘land-use’ refers to the cultural use of land while the term ‘land-cover’describes the actual features present on the surface of the earth. Land-use/land-cover map shows the spatial distribution of various land-use/land-cover classesin the region. The land-use/land-cover classes have been classified into threebroad categories, that is, Level I, Level II, and Level III. The Level I classificationscheme encompasses built-up land, agricultural land, forest, wasteland, waterbodies, and others.
A detailed classification of the land-use/land-cover classes is indicated inTable 1. Due to its unique physiographical set-up, the state has varied land-use/land-cover classes and as such, some of the categories have been amalgamated/modified into separate land-use categories.
All 11 talukas in the state have most or all of the land-use/land-coverclasses. The quantitative distribution of the above categories is presented inTable 2. However, despite sincere efforts in accurate delineation and estimationof various land classes, some cases of inaccuracy and hence inappropriate inter-pretations are unavoidable in such studies. The entire interpretation andexercise, nevertheless, has been undertaken with a 90% confidence limit.
Built-up land
Built-up lands are further categorized into towns/cities and villages. The state,in general, has a high degree of urbanization with a reverse relation to the to-pography. It is noted that the plain coastal regions are more urbanized ascompared to the undulating hinterlands. Moreover, most old settlements areconcentrated along the coastal belts and riversides due to availability of trans-portation facilities through the waterways, convenience, and logistics. Most
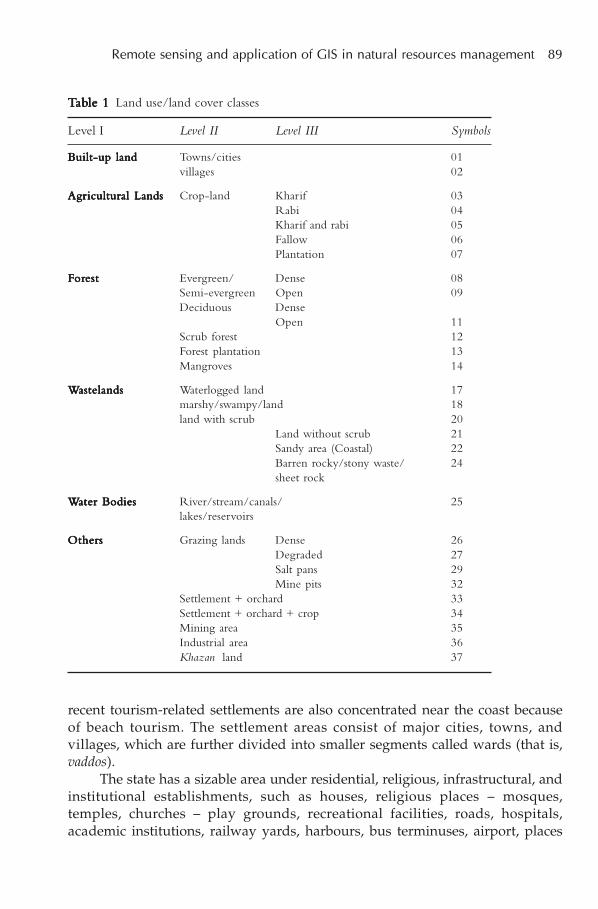
Remote sensing and application of GIS in natural resources management 89
TTTTTababababable 1le 1le 1le 1le 1 Land use/land cover classes
Level I Level II Level III Symbols
Built-up landBuilt-up landBuilt-up landBuilt-up landBuilt-up land Towns/cities 01villages 02
AgAgAgAgAgrrrrricultural Landsicultural Landsicultural Landsicultural Landsicultural Lands Crop-land Kharif 03Rabi 04Kharif and rabi 05Fallow 06Plantation 07
FFFFForororororestestestestest Evergreen/ Dense 08Semi-evergreen Open 09Deciduous Dense
Open 11Scrub forest 12Forest plantation 13Mangroves 14
WWWWWastelandsastelandsastelandsastelandsastelands Waterlogged land 17marshy/swampy/land 18land with scrub 20
Land without scrub 21Sandy area (Coastal) 22Barren rocky/stony waste/ 24sheet rock
WWWWWater Bodiesater Bodiesater Bodiesater Bodiesater Bodies River/stream/canals/ 25lakes/reservoirs
OtherOtherOtherOtherOthersssss Grazing lands Dense 26Degraded 27Salt pans 29Mine pits 32
Settlement + orchard 33Settlement + orchard + crop 34Mining area 35Industrial area 36Khazan land 37
recent tourism-related settlements are also concentrated near the coast becauseof beach tourism. The settlement areas consist of major cities, towns, andvillages, which are further divided into smaller segments called wards (that is,vaddos).
The state has a sizable area under residential, religious, infrastructural, andinstitutional establishments, such as houses, religious places – mosques,temples, churches – play grounds, recreational facilities, roads, hospitals,academic institutions, railway yards, harbours, bus terminuses, airport, places
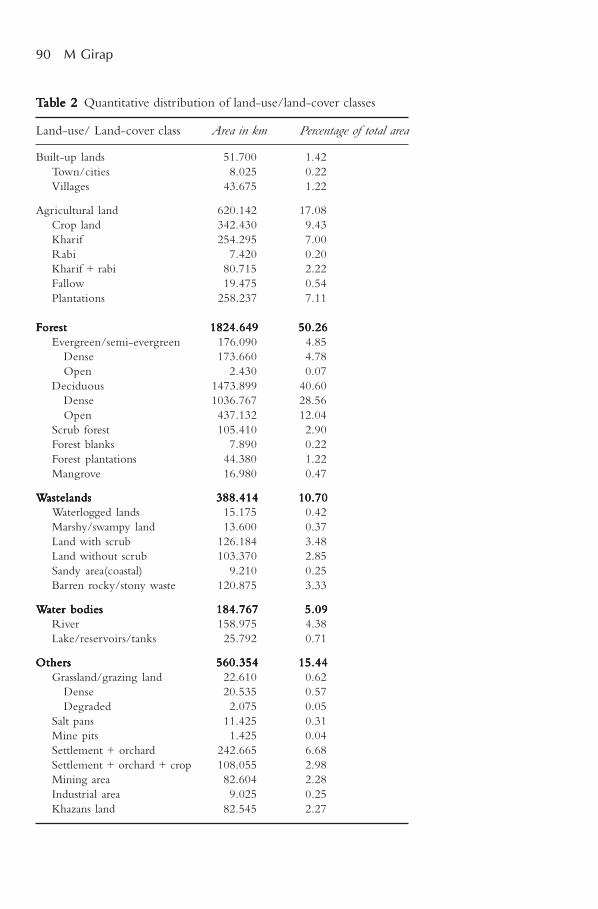
90 M Girap
TTTTTababababable 2le 2le 2le 2le 2 Quantitative distribution of land-use/land-cover classes
Land-use/ Land-cover class Area in km Percentage of total area
Built-up lands 51.700 1.42Town/cities 8.025 0.22Villages 43.675 1.22
Agricultural land 620.142 17.08Crop land 342.430 9.43Kharif 254.295 7.00Rabi 7.420 0.20Kharif + rabi 80.715 2.22Fallow 19.475 0.54Plantations 258.237 7.11
FFFFForororororestestestestest 1824.6491824.6491824.6491824.6491824.649 50.2650.2650.2650.2650.26Evergreen/semi-evergreen 176.090 4.85
Dense 173.660 4.78Open 2.430 0.07
Deciduous 1473.899 40.60Dense 1036.767 28.56Open 437.132 12.04
Scrub forest 105.410 2.90Forest blanks 7.890 0.22Forest plantations 44.380 1.22Mangrove 16.980 0.47
WWWWWastelandsastelandsastelandsastelandsastelands 388.414388.414388.414388.414388.414 10.7010.7010.7010.7010.70Waterlogged lands 15.175 0.42Marshy/swampy land 13.600 0.37Land with scrub 126.184 3.48Land without scrub 103.370 2.85Sandy area(coastal) 9.210 0.25Barren rocky/stony waste 120.875 3.33
WWWWWater bodiesater bodiesater bodiesater bodiesater bodies 184.767184.767184.767184.767184.767 5.095.095.095.095.09River 158.975 4.38Lake/reservoirs/tanks 25.792 0.71
OtherOtherOtherOtherOthersssss 560.354560.354560.354560.354560.354 15.4415.4415.4415.4415.44Grassland/grazing land 22.610 0.62
Dense 20.535 0.57Degraded 2.075 0.05
Salt pans 11.425 0.31Mine pits 1.425 0.04Settlement + orchard 242.665 6.68Settlement + orchard + crop 108.055 2.98Mining area 82.604 2.28Industrial area 9.025 0.25Khazans land 82.545 2.27
Remote sensing and application of GIS in natural resources management 91
of historical and archaeological importance, etc. All talukas in the state have arural as also urban settlement pattern. Most of the built-up lands in the regionare intermingled/camouflaged with forest/agriculture cover, and as such, aseparate classification scheme that is, settlement + orchard and settlement +orchard + crop has been introduced in the legend and described separatelyunder the category ‘others’.
Agricultural land
Agricultural land in the state is categorized into cropland, fallow lands, andplantations. Croplands are further categorized into kharif, rabi and kharif + rabi(on seasonal basis). However, based on traditional practices adopted due tophysiographic setting and local needs, the cropland has been colloquially desig-nated as Ker, Morod, and Khazan lands. The Ker lands (coastal plains andinland low-lying areas) largely support Kharif crop as also Rabi (whereverirrigation facilities are available). On the other hand, the Morod lands (locatedon hill slopes and plateau tops) by and large supports kharif crop. Thekhazan land are located in the low-lying areas influenced by tidal influx and isgenerally prone to salt water inundation. Such lands are also described underthe category ‘others’.
Cropland
Kharif crops In Goa, the seasonal kharif crop is mainly paddy followed bysmall areas of finger millet and vegetables. Continuous stretches of Kharif cropare observed in the coastal talukas as compared to the midlands and uplands.
However, recently due to the increasing demand of land for settlements,vis-à-vis scarcity of land, the agricultural land is being converted to built-upareas. Further, various infrastructural development activities, such as construc-tion, of reservoirs, Konkan Railway, national/state highways by-pass roads, etc.have also brought pressure on agricultural/plantation land.
Also, the non-availability and increase in cost of agricultural labour due toshifts in profession (from unskilled to skilled) have also been major factors inleaving some of these lands fallow. The Tenancy Act has also contributed tosome extent, to the setback in agriculture as the owners feel insecure while culti-vating or improving their land as they are not sure, either about the returns duefrom tenants or of ownership of such land.
Rabi crops The crop associated with rabi season is predominantly rice followedby small areas of groundnut and vegetables (chilli, brinjal, beans, amaranth,lady’s finger, etc.). The rabi crop is irrigated either by using water from local re-sources (wells, tankers) or else from the nearby irrigation canals. Pulses andvegetables are cultivated mostly in coastal areas due to the availability of
92 M Girap
groundwater and good soils. In the midland region, located within the commandarea of Selaulim project, rice cultivation has increased because of availability ofirrigation facility.
Double crop In command areas of Selaulim, Anjuna, Mhaisal, and Chapoli irri-gation projects, two crops per year are cultivated. Similarly, coastal areas arealso double cropped due to availability of tank irrigation.
Fallow land
Cultivable areas, which are kept uncultivated for more than one or more years,are classified under this category. Such lands are generally found on hill slopes.Fallow land also includes certain patches of paddy field along the coastal plainareas, which are not cultivated for one or other reasons, rendering themunutilized/under irrigated.
Plantations
Summer season satellite data was compared with that of other seasons to delin-eate agricultural plantation. Also, most of the old plantation is confined tovalleys and thrives due to the perennial source of water available there. Treesand plants normally associated with agricultural plantation are coconut, arecanut, mango, cashew, jackfruit, rubber, spices, etc. However, cash crops of sugarcane, which is a long duration crop and grows in the command area, is alsoclassified under ‘plantations’.
Forest
As the state is located at the foot of the Western Ghat region, it has a good forestcover. Forests in the region are classified as under. Evergreen/semi-evergreen forest: further grouped into dense and open Deciduous forests: further grouped into dense and open Scrub forests Forest blanks Forest plantations Mangroves
Ownership of the forestland in Goa is government as well as private. Forarriving at the statistical figures on forest area and different forest classes, theresults/observations were supplemented with the data obtained from GoaForest Department (Working Plan Division). Similarly, boundaries of the wild-life sanctuaries were also demarcated utilizing the records available with theWorking Plan Division.
Remote sensing and application of GIS in natural resources management 93
Evergreen/semi-evergreen forests
The forest tree species, which retain their foliage throughout the year and whichare mostly confined to the periphery of water sources, are classified under thiscategory. Considerable area under moist evergreen forest type lies along theriver course in the Western Ghat region. The dense forest is mainly confined tothe eastern side of the state of Goa and is interspersed with open type of forestshaving a crown density of less than 40%.
Evergreen/semi-evergreen (dense): Forest with a crown density of more than40% is classified as dense forest. The dense forest covers an area of about173.66 km2.
Evergreen/semi-evergreen (open): Forest with a crown density of less than 40%is included under these categories. This type of forest covers an area of2.43 km2.
Deciduous forest
The deciduous forest cover is characterized by leaf shedding in the months ofNovember–December. This category of forest is more prevalent along the foot-hills of the Western Ghats, in the midland region, as well as along the coastalareas. Deciduous (dense): Dense deciduous forests are found along the eastern
side of the state at the foothills of the Western Ghats and cover an area of1036.76 km2.
Deciduous (open): This category covers an area of 437.132 km in the state.
Scrub forests
This category of forests is mainly associated with plateau tops or where the soildepth is very shallow. These are characterized by sparse and bushy vegetationinterspersed with some tree and cover an area of 105.41 km2.
Forest plantations
Forest plantations comprise of mono species plantations located in governmentlands earmarked for forest areas as well as plantations under social forestry. Thecommon tree species generally associated with forest plantations are eucalyp-tus, acacia, casuarina and cashew. As cashew is grown as a mixed crop withforest tree species, the same is included under this category. The state has about44.38 km2 of forest plantations.
94 M Girap
Forest blanks
These represent open and barren pockets within evergreen or deciduousforested areas, which may represent a rock outcrop or loss of tree cover in theregion. Such blanks cover an area of approximately, 7.89 km2.
Mangroves
The mangroves are associated with estuarine areas where the tidal effect isprevalent in the upstream direction. A considerable area under mangroves isconfined mainly to Mandovi and Zuari estuaries. In addition to these majorrivers, most minor rivers and the Cumbarjua Canal connecting theMandovi and the Zuari rivers have a fairly large area under mangroves.Mangroves cover an area of 16.98 km2 in the state.
Wasteland
Wasteland consists of various categories, such as water-logged, marshy/swampy, land with scrub, land without scrub, coastal sandy area, and barrenrocky or stony waste.
Waterlogged land
Waterlogged areas are those where water is at/or near the surface and it standsfor most of the year. These areas are permanently or periodically inundated bywater either because of tidal influence or their proximity to river, and are char-acterized by vegetation that includes grass and weeds. Thus, these landscovering about 15.17 km2 area are located along the banks of the rivers/estuar-ies and as such are saline.
Marshy/swampy land
These are areas, which, though not under permanent inundation, are filled withweeds and grasses associated with marsh. Soils of such swamps have a satura-tion level and are located along the river courses and backwaters. Marshy/swampy lands generally are not cultivated and cover an area of 13.6 km2.
Land with scrub
This class includes land mostly on the slopes or plateau tops, which has a verysparse and stunted vegetation, including grass species. These lands are prone toerosion. The plant species mostly associated with this type of land are thorny orwith very little biomass. Such land covers an area of 126.18 km2.
Remote sensing and application of GIS in natural resources management 95
Land without scrub
Land under this category does not have any vegetation and is mostly coveredwith rocky outcrops and boulders. Such land does not support any vegetationmainly due to the edaphic factors and is also susceptible to erosion. An area ofabout 103.37 km2 is covered under this category.
Sandy area / beaches (coastal)
Goa is known for its scenic beauty, proximity to the sea, sandy beaches, headlands,promontories, rivers, and backwaters. Sandy stretch covers an area of 9.21 km2.
Barren rocky / stony waste/sheet rock
This class covers a sizeable chunk of landmass and is dominantly associatedwith the plateau tops. It occurs as a contiguous portion and is covered withgrass during monsoon and post-monsoon season. Settlement or industries aretypically located in such areas. It covers an area of 120.87 km2.
Water bodies
Water bodies comprise rivers, streams, backwaters, and lakes as well as man-made features such as fresh water reservoirs, tanks, canals, and brackish waterponds fitted with sluice gates. Water bodies show varied surface area cover-age due to depth perception, which is attributable to evaporation losses, tidalinfluence, seasonality, and consumptive use (for potable waters). These cover atotal area of 184.76 km2.
Others
Grasslands/grazing lands
These lands are generally found on the gentle hill slopes located in the midlandand upland regions having sparse vegetation dominated by grass throughoutthe major part of the year. Such areas are maintained in their natural conditionfor use of local herds. Grazing lands with good grass cover are categorized asdense and others with patches of eroded land are termed as degraded.
Dense grazing lands cover an area of 20.53 km2 while degraded landscover an area of 2.08 km2.
Salt pans
Salt pans are located along the backwater areas of the estuarine region in thecoastal talukas of Pernem, Tiswadi, Bardez, Salcete, and Canacona. After the salt
96 M Girap
is harvested, some of these areas are used for traditional fish-farming activities.An area of 11.43 km2 is under salt pans.
Mine pits
These are located within the mining belt of Goa and have formed due to theextraction of ore. Most such pits are abandoned wherever the mining activ-ity has ceased and some are actively mined. An area of 1.425 km2 is coveredunder mining pits. The present study has revealed that most of the mining pitsare located in Sanguem taluka.
Settlement + orchard
In Goa, the settlements are largely associated with orchards and plantationsconsisting mainly of coconut trees and other household orchards. The greencover of such plantations camouflages the settlements area and as a result, thesettlements cannot be deciphered in isolation of orchards/plantation. Thus, aseparate category, namely ‘settlements + orchard’ has been designated, whichconsists of an area of 242.665 km2.
Settlement + orchard + crop
This is another unique settlement pattern of Goa. Here, the settlements are asso-ciated with plantations/orchards and agricultural field crops, mainlyconstituting rice fields. The individual components of this category also cannotbe deciphered independently due to scale limitations, and hence, the category‘settlement+orchard+crops’ has been designated, covering an area of 108.05km2.
Mining area
Goa is known for its rich iron and manganese ore deposits. These deposits areextracted using open-cast type of mining methods. Mines are privately operatedthrough the leased areas and are stretched from south to north Goa and have asignificant trend in NNW–SSE direction, which is confined to the midlandregion. While extracting these ores, a large amount of mining rejects (that isoverburden) are generated and dumped within the leased areas. Miningregion covers an area of 82.604 km2, which includes broken excavated areas;mining workshops; and its entities like quarters, recreational sites beneficiationplants, tailing ponds, dead dumps, active dumps, and abandoned and opera-tional mines.
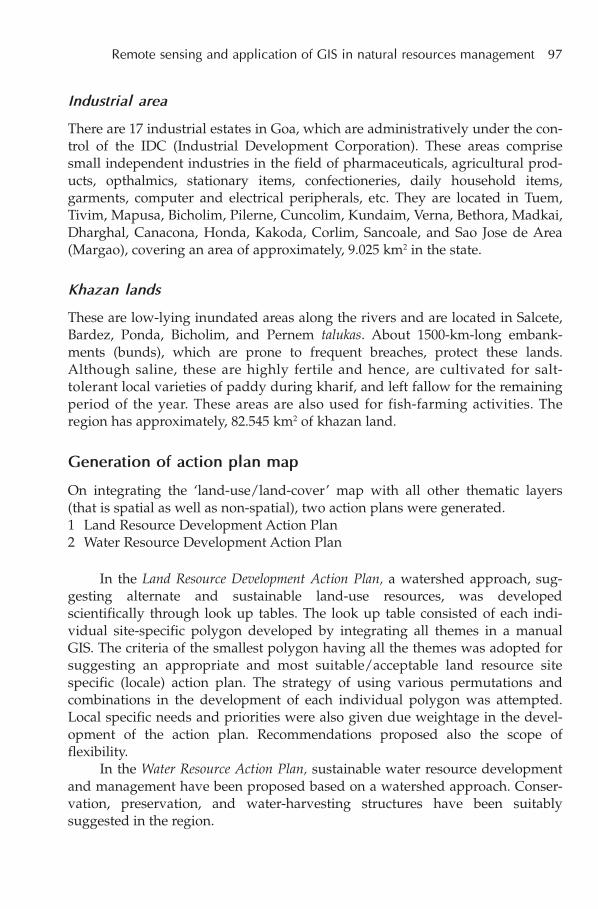
Remote sensing and application of GIS in natural resources management 97
Industrial area
There are 17 industrial estates in Goa, which are administratively under the con-trol of the IDC (Industrial Development Corporation). These areas comprisesmall independent industries in the field of pharmaceuticals, agricultural prod-ucts, opthalmics, stationary items, confectioneries, daily household items,garments, computer and electrical peripherals, etc. They are located in Tuem,Tivim, Mapusa, Bicholim, Pilerne, Cuncolim, Kundaim, Verna, Bethora, Madkai,Dharghal, Canacona, Honda, Kakoda, Corlim, Sancoale, and Sao Jose de Area(Margao), covering an area of approximately, 9.025 km2 in the state.
Khazan lands
These are low-lying inundated areas along the rivers and are located in Salcete,Bardez, Ponda, Bicholim, and Pernem talukas. About 1500-km-long embank-ments (bunds), which are prone to frequent breaches, protect these lands.Although saline, these are highly fertile and hence, are cultivated for salt-tolerant local varieties of paddy during kharif, and left fallow for the remainingperiod of the year. These areas are also used for fish-farming activities. Theregion has approximately, 82.545 km2 of khazan land.
Generation of action plan map
On integrating the ‘land-use/land-cover’ map with all other thematic layers(that is spatial as well as non-spatial), two action plans were generated.1 Land Resource Development Action Plan2 Water Resource Development Action Plan
In the Land Resource Development Action Plan, a watershed approach, sug-gesting alternate and sustainable land-use resources, was developedscientifically through look up tables. The look up table consisted of each indi-vidual site-specific polygon developed by integrating all themes in a manualGIS. The criteria of the smallest polygon having all the themes was adopted forsuggesting an appropriate and most suitable/acceptable land resource sitespecific (locale) action plan. The strategy of using various permutations andcombinations in the development of each individual polygon was attempted.Local specific needs and priorities were also given due weightage in the devel-opment of the action plan. Recommendations proposed also the scope offlexibility.
In the Water Resource Action Plan, sustainable water resource developmentand management have been proposed based on a watershed approach. Conser-vation, preservation, and water-harvesting structures have been suitablysuggested in the region.
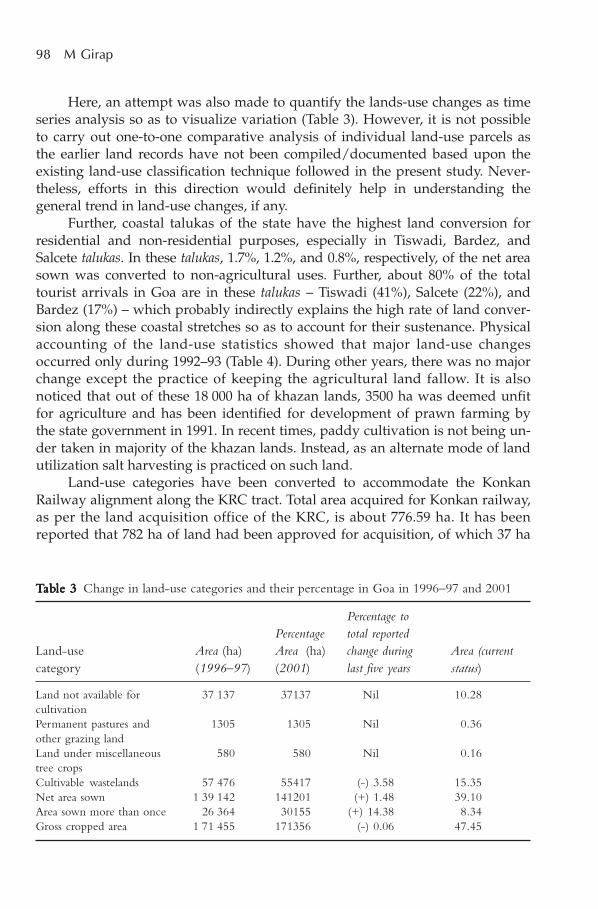
98 M Girap
Here, an attempt was also made to quantify the lands-use changes as timeseries analysis so as to visualize variation (Table 3). However, it is not possibleto carry out one-to-one comparative analysis of individual land-use parcels asthe earlier land records have not been compiled/documented based upon theexisting land-use classification technique followed in the present study. Never-theless, efforts in this direction would definitely help in understanding thegeneral trend in land-use changes, if any.
Further, coastal talukas of the state have the highest land conversion forresidential and non-residential purposes, especially in Tiswadi, Bardez, andSalcete talukas. In these talukas, 1.7%, 1.2%, and 0.8%, respectively, of the net areasown was converted to non-agricultural uses. Further, about 80% of the totaltourist arrivals in Goa are in these talukas – Tiswadi (41%), Salcete (22%), andBardez (17%) – which probably indirectly explains the high rate of land conver-sion along these coastal stretches so as to account for their sustenance. Physicalaccounting of the land-use statistics showed that major land-use changesoccurred only during 1992–93 (Table 4). During other years, there was no majorchange except the practice of keeping the agricultural land fallow. It is alsonoticed that out of these 18 000 ha of khazan lands, 3500 ha was deemed unfitfor agriculture and has been identified for development of prawn farming bythe state government in 1991. In recent times, paddy cultivation is not being un-der taken in majority of the khazan lands. Instead, as an alternate mode of landutilization salt harvesting is practiced on such land.
Land-use categories have been converted to accommodate the KonkanRailway alignment along the KRC tract. Total area acquired for Konkan railway,as per the land acquisition office of the KRC, is about 776.59 ha. It has beenreported that 782 ha of land had been approved for acquisition, of which 37 ha
TTTTTababababable 3le 3le 3le 3le 3 Change in land-use categories and their percentage in Goa in 1996–97 and 2001
Percentage toPercentage total reported
Land-use Area (ha) Area (ha) change during Area (currentcategory (1996–97) (2001) last five years status)
Land not available for 37 137 37137 Nil 10.28cultivationPermanent pastures and 1305 1305 Nil 0.36other grazing landLand under miscellaneous 580 580 Nil 0.16tree cropsCultivable wastelands 57 476 55417 (-) 3.58 15.35Net area sown 1 39 142 141201 (+) 1.48 39.10Area sown more than once 26 364 30155 (+) 14.38 8.34Gross cropped area 1 71 455 171356 (-) 0.06 47.45
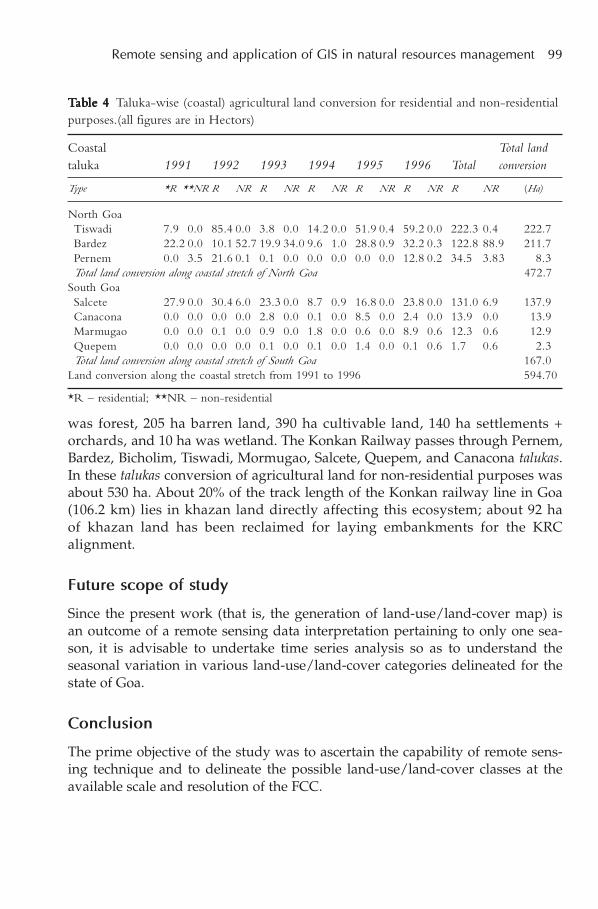
Remote sensing and application of GIS in natural resources management 99
was forest, 205 ha barren land, 390 ha cultivable land, 140 ha settlements +orchards, and 10 ha was wetland. The Konkan Railway passes through Pernem,Bardez, Bicholim, Tiswadi, Mormugao, Salcete, Quepem, and Canacona talukas.In these talukas conversion of agricultural land for non-residential purposes wasabout 530 ha. About 20% of the track length of the Konkan railway line in Goa(106.2 km) lies in khazan land directly affecting this ecosystem; about 92 haof khazan land has been reclaimed for laying embankments for the KRCalignment.
Future scope of study
Since the present work (that is, the generation of land-use/land-cover map) isan outcome of a remote sensing data interpretation pertaining to only one sea-son, it is advisable to undertake time series analysis so as to understand theseasonal variation in various land-use/land-cover categories delineated for thestate of Goa.
Conclusion
The prime objective of the study was to ascertain the capability of remote sens-ing technique and to delineate the possible land-use/land-cover classes at theavailable scale and resolution of the FCC.
TTTTTababababable 4le 4le 4le 4le 4 Taluka-wise (coastal) agricultural land conversion for residential and non-residentialpurposes.(all figures are in Hectors)
Coastal Total landtaluka 1991 1992 1993 1994 1995 1996 Total conversion
Type *R **NR R NR R NR R NR R NR R NR R NR (Ha)
North GoaTiswadi 7.9 0.0 85.4 0.0 3.8 0.0 14.2 0.0 51.9 0.4 59.2 0.0 222.3 0.4 222.7Bardez 22.2 0.0 10.1 52.7 19.9 34.0 9.6 1.0 28.8 0.9 32.2 0.3 122.8 88.9 211.7Pernem 0.0 3.5 21.6 0.1 0.1 0.0 0.0 0.0 0.0 0.0 12.8 0.2 34.5 3.83 8.3Total land conversion along coastal stretch of North Goa 472.7
South GoaSalcete 27.9 0.0 30.4 6.0 23.3 0.0 8.7 0.9 16.8 0.0 23.8 0.0 131.0 6.9 137.9Canacona 0.0 0.0 0.0 0.0 2.8 0.0 0.1 0.0 8.5 0.0 2.4 0.0 13.9 0.0 13.9Marmugao 0.0 0.0 0.1 0.0 0.9 0.0 1.8 0.0 0.6 0.0 8.9 0.6 12.3 0.6 12.9Quepem 0.0 0.0 0.0 0.0 0.1 0.0 0.1 0.0 1.4 0.0 0.1 0.6 1.7 0.6 2.3Total land conversion along coastal stretch of South Goa 167.0
Land conversion along the coastal stretch from 1991 to 1996 594.70
*R – residential; **NR – non-residential

100 M Girap
Acknowledgement
The present study forms a part of a national-level project NRIS (National[Natural] Resources Information System) sponsored by the SAC (Space Applica-tion Centre), Ahmedabad; DoS (Department of Space), Government of India;and is being executed by the GSRSC (Goa State Remote Sensing Center). Theauthor is very thankful to the DoS as well as Dr N P S Varde, Director, GSRSC,for providing all necessary assistance during the project work. Technicalexpertise provided by the scientific and technical staff of the RRSSC (RegionalRemote Sensing Service Centre), Bangalore, is also highly acknowledged. Theauthor is highly indebted to the scientific, technical as well as administrativestaff of the GSRSC/GSCST in completing the said assignment well in time.
Impact of sand mining on local ecology
Sangeeta Sonak, Prajwala Pangam, Mahesh Sonak,Deepak Mayekar
GEC (global environmental change) studies normally focus on the impact ofclimate change on several aspects of environmental changes occurring globally.However, there are several other factors affecting and causing these environ-mental changes, which deserve attention. LUCC (land use and cover change)is an issue, which merits immediate attention in the GEC studies. Several stud-ies have documented impacts of climate change on LUCC, particularly onagricultural land degradation. Apart from the impacts of climate change onland use, a number of factors significantly contribute to LUCC and call for anindependent space on GEC agenda for LUCC. Sand mining is one such activ-ity, which affects local ecology directly, but nevertheless has wide implicationsfor GEC. This paper presents a review of sand mining activity, rules and regu-lations, and the resulting environmental issues related to sand mining primarilyaffecting coastal erosion, river bank, land-use change, water, and biodiversity.
Introduction
LUCC (land use and cover change) is an issue that merits immediate attentionin the GEC (global environmental change) studies. Several studies have docu-mented impacts of climate change on LUCC, particularly on agricultural landdegradation. Apart from the impacts of climate change on land use, a number offactors significantly contribute to LUCC and call for an independent space onGEC agenda for LUCC. One of these factors is mining.
It is well accepted that mining causes destruction of local ecology. Itinduces land degradation as well as LUCC, deforestation, raises biodiversityconcerns, impairs water systems, affects livelihood, etc. The environmentalimpacts of mining have been well studied and well documented. However, few
For correspondence: ssonak@ teri.res.in; [email protected]
5
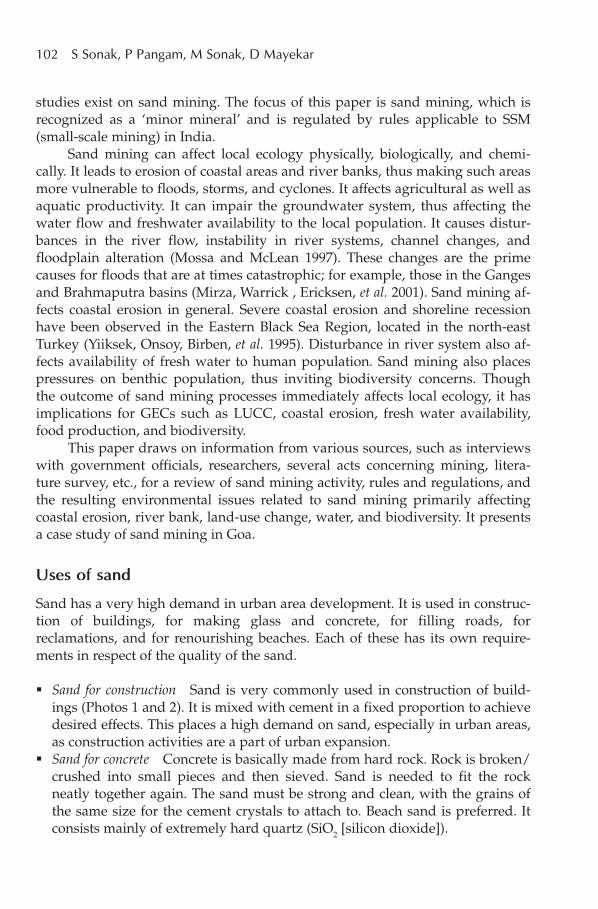
102 S Sonak, P Pangam, M Sonak, D Mayekar
studies exist on sand mining. The focus of this paper is sand mining, which isrecognized as a ‘minor mineral’ and is regulated by rules applicable to SSM(small-scale mining) in India.
Sand mining can affect local ecology physically, biologically, and chemi-cally. It leads to erosion of coastal areas and river banks, thus making such areasmore vulnerable to floods, storms, and cyclones. It affects agricultural as well asaquatic productivity. It can impair the groundwater system, thus affecting thewater flow and freshwater availability to the local population. It causes distur-bances in the river flow, instability in river systems, channel changes, andfloodplain alteration (Mossa and McLean 1997). These changes are the primecauses for floods that are at times catastrophic; for example, those in the Gangesand Brahmaputra basins (Mirza, Warrick , Ericksen, et al. 2001). Sand mining af-fects coastal erosion in general. Severe coastal erosion and shoreline recessionhave been observed in the Eastern Black Sea Region, located in the north-eastTurkey (Yiiksek, Onsoy, Birben, et al. 1995). Disturbance in river system also af-fects availability of fresh water to human population. Sand mining also placespressures on benthic population, thus inviting biodiversity concerns. Thoughthe outcome of sand mining processes immediately affects local ecology, it hasimplications for GECs such as LUCC, coastal erosion, fresh water availability,food production, and biodiversity.
This paper draws on information from various sources, such as interviewswith government officials, researchers, several acts concerning mining, litera-ture survey, etc., for a review of sand mining activity, rules and regulations, andthe resulting environmental issues related to sand mining primarily affectingcoastal erosion, river bank, land-use change, water, and biodiversity. It presentsa case study of sand mining in Goa.
Uses of sand
Sand has a very high demand in urban area development. It is used in construc-tion of buildings, for making glass and concrete, for filling roads, forreclamations, and for renourishing beaches. Each of these has its own require-ments in respect of the quality of the sand.
Sand for construction Sand is very commonly used in construction of build-ings (Photos 1 and 2). It is mixed with cement in a fixed proportion to achievedesired effects. This places a high demand on sand, especially in urban areas,as construction activities are a part of urban expansion.
Sand for concrete Concrete is basically made from hard rock. Rock is broken/crushed into small pieces and then sieved. Sand is needed to fit the rockneatly together again. The sand must be strong and clean, with the grains ofthe same size for the cement crystals to attach to. Beach sand is preferred. Itconsists mainly of extremely hard quartz (SiO2 [silicon dioxide]).
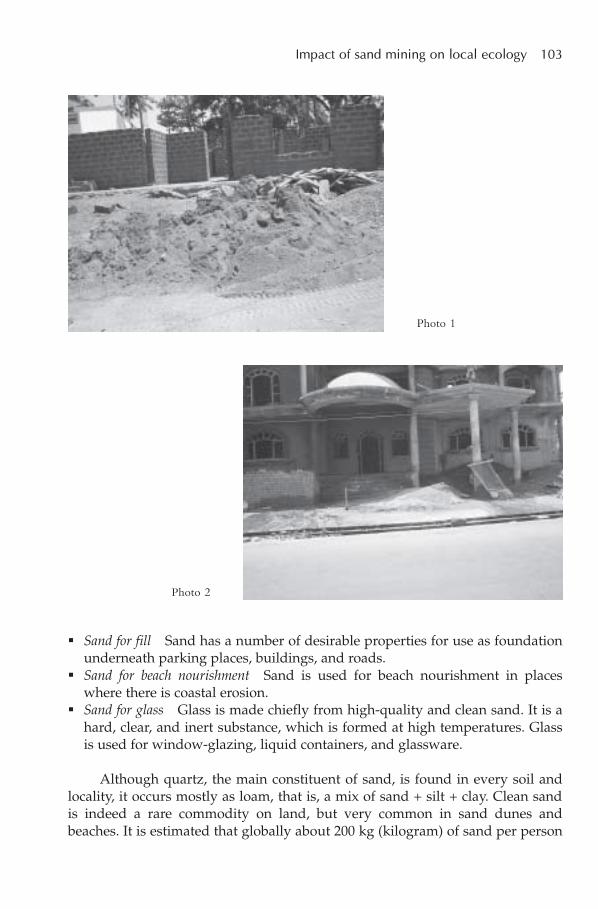
Impact of sand mining on local ecology 103
Sand for fill Sand has a number of desirable properties for use as foundationunderneath parking places, buildings, and roads.
Sand for beach nourishment Sand is used for beach nourishment in placeswhere there is coastal erosion.
Sand for glass Glass is made chiefly from high-quality and clean sand. It is ahard, clear, and inert substance, which is formed at high temperatures. Glassis used for window-glazing, liquid containers, and glassware.
Although quartz, the main constituent of sand, is found in every soil andlocality, it occurs mostly as loam, that is, a mix of sand + silt + clay. Clean sandis indeed a rare commodity on land, but very common in sand dunes andbeaches. It is estimated that globally about 200 kg (kilogram) of sand per person
Photo 1
Photo 2
104 S Sonak, P Pangam, M Sonak, D Mayekar
per year is used. This sand is taken from what are essentially non-renewableresources.1
Sand mining in the world: a brief review
Heavy mineral sands, which contain titanium-bearing minerals such as rutile,leucoxene, and ilmenite, in addition to zircon and monazite, have been minedon the coasts of southern Queensland and northern New South Wales since the1930s and in coastal areas to the north and south of Perth in western Australia.These mining activities have led to many land-use conflicts (Bell 2001).
Relationship between gravel and sand mining and channel change alongthe Amite River in south-eastern Louisiana, USA, has been examined by Mossaand McLean (1997). They conclude that the sand and gravel mining is the primecause for the disturbed floodplain and channel instability, where combined sandand gravel extraction has exceeded 10 million tonnes per year. Changes in veg-etation structure and fuel loads over time in rehabilitated mineral sand mines atTomago near Newcastle, Australia, have been studied by Chaffey and Grant(2000). Sand mining in New Zealand is summarized in various studies.2
A review of sand mining regulations from other countries such as France,UK, Japan, Malaysia, The Netherlands, and USA, indicates that sand mining inthose countries is restricted to depths greater than 10 m (metres), at a minimumdistance from shore of 600 m.3 In France, dredging must take place beyond 5.5km offshore of the beaches and in depths greater than 20 m. In UK, dredging isprohibited landward of the 19–22 m isobath and within 600 m of the coast. InJapan, dredging is prohibited within 1 km of the coast. All operations occur inwater depths greater than 20 m. In Malaysia, Coastal Engineering TechnicalCentre criteria is that the mining be permitted seaward of the 10 m isobath, or2 km offshore for the east coast of Peninsula Malaysia. In The Netherlands,mining is permitted seaward of the 20 m isobath. New York mining area isseaward of the 18 m isobath.
In India, sand is categorized as a minor mineral and the mining activity isconsidered as SSM and is under the control of state governments. SSM is an or-ganized mining carried on with acquired mining rights under some statutorycontrol, although unlicensed or informal activities are not uncommon on manyoccasions; for example, straying into unlicensed areas from existing mines andworking in disputed territory. However, there is no clear statistical picture onSSM (Chakravorty 2001).
1 <http://www.seafriends.org.nz/oceano/seasand.htm>2 <http://www.seafriends.org.nz/oceano/seasand.htm>3 <http://www.seafriends.org.nz/oceano/seasand.htm>
Impact of sand mining on local ecology 105
Regulations governing mining in India
As per Article 1 of the Constitution, India is a union of states. There is a divisionor demarcation of powers between the union legislature and the state legisla-tures, which is spelt out in Article 246 of the Constitution, to be read along withthe three lists contained in the Seventh Schedule. List 1 of the Union List in-cludes subjects over which the Union shall have the exclusive powers oflegislation; List 2 includes subjects over which the states shall have the exclusivepowers of legislation. List 3 or the Concurrent List comprises entries over whichboth the Union and the State Legislatures shall have the powers of legislation. Incase of overlapping, predominance has been given to the Union Legislature. Incase of repugnancy between a State Law and the Union Law, in the concurrentsphere the latter Law will prevail, the exception being where a State Law wasreserved for and has received the assent of the President of India. The residualpowers have been vested in the Union Legislature.
Entry 54 of List 1 or the Union List to the VIIth Schedule to the Constitu-tion of India, reads as: ‘54 (List 1): regulation of mines and mineral developmentto the extent to which such regulation and development under the control ofUnion is declared by the Parliament by Law to be expedient in “public interest”’.
Entry 23 of List 2 of the State List to the VIIth Schedule to the Constitutionof India, reads as: ‘regulation of mines and mineral development subject to theprovisions of List 1 with respect to the regulation and development under thecontrol of the Union’.
Rivers, forests, minerals, and other such sources constitute a nation’s natu-ral wealth. These resources are not to be frittered away and exhausted by anyone generation. Every generation owes a duty to succeeding generation to de-velop and conserve the natural resources of the nation in the best possible way.The Parliament, therefore, has declared that it is expedient in ‘public interest’that the Union should take under its control the regulation of mines and deve-lopment of minerals. This was done by enacting the Mines and Minerals(Development and Regulation) Act, 1957, which is a ‘Law’ as contemplated byEntry 54 of List 1 to the VIIth Schedule to the Constitution of India. The Acttakes over the control of regulation of mines and development of minerals to theUnion, of course, to the extent provided. In respect of minor minerals, the pow-ers have been conferred upon the state government to make rules for regulatingthe grant of prospecting licences, mining leases and the purposes connectedtherewith. Now that the Parliament, by its Law, has declared that the regulationand development of mines should, in ‘public interest’, be under the control ofthe Union, to the extent of such declaration, the jurisdiction of the state legisla-ture is excluded.
There are a number of legislations, rules, and regulations governing themining in India. The most prominent being the Mines and Minerals (Develop-ment and Regulation) Act, 1957 and Mines Act, 1952; the Mineral Concession
106 S Sonak, P Pangam, M Sonak, D Mayekar
Rules, 1960; and Mineral Concessions and Development Rules, 1998.The Mines Act, 1952; the Mines Creche Rules, 1966; the Mines Rescue
Rules, 1985; and the Payment of Wages (Mines) Rules, 1956 are the legislationsdealing with the mines safety and labour welfare. The aspect of coal mining inIndia has been dealt with independently by enacting number of coal mineslegislations, which include the Coal Bearing Areas (Acquisition and Develop-ment) Act, 1957; the Coal Mines (Nationalisation) Act, 1973; the Coal Mines(Conservation and Development) Act, 1974, etc. Similarly, the aspect of AtomicEnergy Petroleum and Oil Mines Legislations have also been dealt with inde-pendently. Reference in this regard is required to be made to the legislations likeAtomic Energy Act, 1962; the Petroleum Concession Rules, 1969; and the OilMines Regulations, 1984. Various Union Legislations governing mining in Indiaare given below.
Mining legislations in India
The Mines and Minerals (Development and Regulation) Act, 1957 The Mineral Concession Rules, 1960 Granite Conservation and Development Rules, 1999 The Mineral Conservation and Development Rules, 1988 Notifications The Forest (Conservation) Act, 1980 The Forest (Conservation) Rules, 1981 The Mines Act, 1952 Mines Rules, 1955 Mines (Posting up of Abstracts) Rules, 1954 Mines Creche Rules, 1966 Metalliferous Mines Regulations, 1961 Mines Rescue Rules, 1985 The Mining Leases (Modification of Terms) Rules, 1956 Mines Vocational Training Rules, 1966 Payment of Wages (Mines) Rules, 1956 The Payment of Undisbursed Wages (Mines) Rules, 1989 The Marble Development and Conservation Rules, 2002
Coal mines legislations
The Coal-Bearing Areas (Acquisition and Development) Act, 1957 The Coking Coal Mines (Nationalisation) Act, 1972 The Coal Mines (Nationalisation) Act, 1973 The Coal Mines (Conservation and Development) Act, 1974 Coal Mines Regulations, 1957 The Coking Coal Mines (Emergency Provisions) Act, 1971
Impact of sand mining on local ecology 107
The Coal Mines (Taking over of Management) Act, 1973 The Coal Mines Pithead Bath Rules, 1959 Coal Mines Advisory Board Rules, 1973 Coal Mines (Intimation Regarding Mortgage, Charges, Lien or Other
Interests) Rules, 1974 Coking Coal Mines (Intimation Regarding Mortgage, Charge, Lien or Other
Interests) Rules, 1973 Coking Coal Mines (Nationalisation) (Removal of Difficulties) Order, 1974
Atomic energy, petroleum, and oil mines legislations
The Atomic Energy Act, 1962 Atomic Energy (Working of the Mines, Minerals and Handling of Prescribed
Substance) Rules, 1984 The Petroleum Concession Rules, 1940 The Oilfields (Regulation and Development Act, 1948 The Oil Mines Regulations, 1984
The National Mineral Policy, 1993, in its Preamble, acknowledges that min-erals are valuable natural resources that are finite and non-renewable. Themanagement of mineral resources is, therefore, to be closely integrated with theoverall strategy of development, and exploitation of minerals is to be guided bylong-term national goals and perspectives. The policy also emphasizes certainnew aspects such as given below. Mineral exploitation in sea belt Proper linkage between exploitation of minerals Development of mineral industry Preference to the members of scheduled tribes for development of small de-
posits in scheduled areas Protection of forests, environment, and ecology from adverse effect of mining Adoption of proper methods Optimum utilization of minerals Recycling of metallic scrap and mineral waste.
The National Mineral Policy, 1993, however, makes reference to ‘smalldeposits’ in the following terms.
‘Small and isolated deposits of minerals are scattered all over thecountry. These often lend themselves to economic exploitationthrough small-scale mining. With modest demand on capital expendi-ture and short lead time, they also provide employment opportunitiesfor the local population. Efforts will be made to promote small scalemining of small deposits in a scientific and efficient manner whilesafeguarding vital environmental and ecological imperatives. In grant
108 S Sonak, P Pangam, M Sonak, D Mayekar
of mineral concessions for small deposits in scheduled areas, prefer-ence shall be given to the scheduled tribes’.
The Mines and Minerals (Regulation and Development) Act, 1957, laysdown the legal framework for the regulation of mines and development of allminerals other than petroleum and natural gas. The central government hasframed the Mineral Concession Rules, 1960, for regulating grant of prospectinglicences and mining leases with respect to all minerals other than atomic miner-als and minor minerals. The state governments have framed the rules in regardto minor minerals. The central government has also framed the Mineral Conser-vation and Development Rules, 1988, for conservation and systematicdevelopment of minerals. These are applicable to all minerals except coal,atomic minerals, and minor minerals. It is mandatory to obtain licence from thedesignated competent authority in the Department of Atomic Energy for work-ing of any mines from which atomic minerals known as ‘prescribed substances’can be obtained. Licence should also be obtained for acquisition, production,possession, use, disposal, export, or import of prescribed substances.
However, In India, no separate policy decisions or legislative provisionshave so far been made specifically for SSM, which is an important part of theoverall mining activities. SSM still remains a neglected sector. Hence, SSMcomes under the general mining umbrella without a separate identity. The In-dian Mines Act, 1952, concerned with safety and labour welfare, excludescertain categories of mines from the point of view of control for safety but itdoes not differentiate between minerals as major or minor. The IBM (Indian Bu-reau of Mines) working under the Mines and Minerals (Regulation andDevelopment) Act, 1957, do not maintain statistical records of ‘minor minerals’,which are the responsibilities of the concerned state governments.
India has large reserves of beach sand minerals in the coastal stretchesaround the country. Some of the minerals have been classified as ‘prescribedsubstance’ under the Atomic Energy Act, 1962. In accordance with the provi-sions of the said Act and the Rules/Notification/Orders there under, it ismandatory to obtain licence from the designated competent authority in the De-partment of Atomic Energy for mining of any mineral from which prescribedsubstances can be obtained. Further, under the Industrial Policy Statement of1991, the mining and production of minerals classified as ‘prescribed sub-stances’ is reserved for the public sector, though selective entry of the privatesector is allowed.
Mining of sand for use in the construction work is, however, regulated bythe state government. The following section of the paper presents a case studyof mining in Goa.
Impact of sand mining on local ecology 109
Sand mining in Goa
Goa is located on the west coast of the Arabian Sea in India between the co-ordi-nates 14° 53’ 57’’ to 15° 47’59” north and 73° 40’ 54” to 74° 20’ 11” east. In Goa,sand extraction is being carried out for a long time. Traditionally, sand has beenmined from the coastal beaches and sand dunes. The cleanest and, thus, themost valuable sand is found in foredunes, beach, and near-shore. But this is alsothe most sensitive band. Mining sand from this area will inevitably result inbeach erosion.
Earlier in Goa, sand extraction from coastal sand dunes was possible onlywith the permission of a Mamlatdar (that is, administrator). In the recent years,large amount of sand is extracted from the river. The main reasons for thechange of source for sand mining are listed below. Though sand near the seacoast is good for construction purposes, the salinity
(NaCl content) induces corrosion of metals used in construction, and henceriverside sand, which is normally estuarine and less saline, is preferred.
Sea sand needs to be washed to remove its salt, thus leading to increase incost of operation.
The seacoast is also protected by CRZ (Coastal Regulation Zone) laws andillegal operations here attract more attention.
River system in Goa
Goa is divided into the mountainous region of Sahyadri in the east, middle levelof plateau in the centre, and low-level river basin with coastal plain. This physi-cal division plays a significant role in maintaining the ecological equilibrium inthe ecosystem. Rivers play a vital role in the growth and development of Goa asthey not only provide irrigation but are also a means of local transport.
In Goa, there are nine rivers with 42 tributaries. The rivers are Colvale,Madovi, Zuari, Sal, Talpona, Saleri, Cacona Tiracol, and Galgibag. These riversand their tributaries criss-cross entire state of Goa. Most of these rivers originatein Maharashtra or Karnataka. A detailed account of river system in Goa hasbeen presented by Alvares (2002). Major rivers from where sand is extracted areTiracol, Chapora, Guleli, etc.
Prior to 1993, a large quantity of sand was extracted from Jua–Tonc. In theyear 1993, roughly about 20–23 crafts were in operation compared to five to sixbig crafts in 2000. These crafts were around 10–11 m in length and 2 m inbreadth and had a capacity of 5 m³ (cubic metres). The sand mining operationon the Jua Island was profitable as transportation expenses were less. Anothermajor reason was collapse of the Mandovi Bridge, making the transport fromPanaji to many areas of North Goa difficult. Thus mining on the side of Panajiitself was more profitable to the builders near Panaji and South Goa. But after1993, a decline in the sand mining operation in Jua Island was witnessed. This
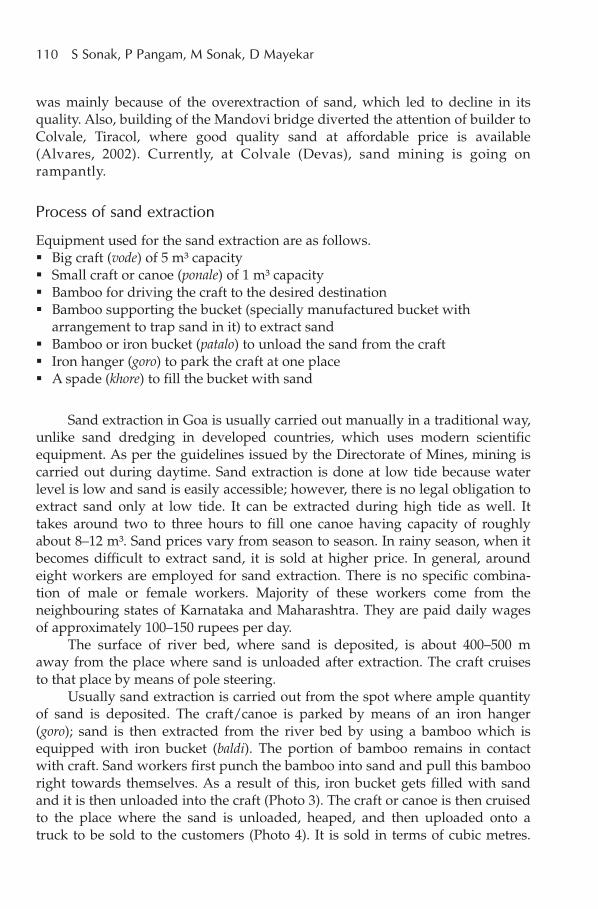
110 S Sonak, P Pangam, M Sonak, D Mayekar
was mainly because of the overextraction of sand, which led to decline in itsquality. Also, building of the Mandovi bridge diverted the attention of builder toColvale, Tiracol, where good quality sand at affordable price is available(Alvares, 2002). Currently, at Colvale (Devas), sand mining is going onrampantly.
Process of sand extraction
Equipment used for the sand extraction are as follows. Big craft (vode) of 5 m³ capacity Small craft or canoe (ponale) of 1 m³ capacity Bamboo for driving the craft to the desired destination Bamboo supporting the bucket (specially manufactured bucket with
arrangement to trap sand in it) to extract sand Bamboo or iron bucket (patalo) to unload the sand from the craft Iron hanger (goro) to park the craft at one place A spade (khore) to fill the bucket with sand
Sand extraction in Goa is usually carried out manually in a traditional way,unlike sand dredging in developed countries, which uses modern scientificequipment. As per the guidelines issued by the Directorate of Mines, mining iscarried out during daytime. Sand extraction is done at low tide because waterlevel is low and sand is easily accessible; however, there is no legal obligation toextract sand only at low tide. It can be extracted during high tide as well. Ittakes around two to three hours to fill one canoe having capacity of roughlyabout 8–12 m³. Sand prices vary from season to season. In rainy season, when itbecomes difficult to extract sand, it is sold at higher price. In general, aroundeight workers are employed for sand extraction. There is no specific combina-tion of male or female workers. Majority of these workers come from theneighbouring states of Karnataka and Maharashtra. They are paid daily wagesof approximately 100–150 rupees per day.
The surface of river bed, where sand is deposited, is about 400–500 maway from the place where sand is unloaded after extraction. The craft cruisesto that place by means of pole steering.
Usually sand extraction is carried out from the spot where ample quantityof sand is deposited. The craft/canoe is parked by means of an iron hanger(goro); sand is then extracted from the river bed by using a bamboo which isequipped with iron bucket (baldi). The portion of bamboo remains in contactwith craft. Sand workers first punch the bamboo into sand and pull this bambooright towards themselves. As a result of this, iron bucket gets filled with sandand it is then unloaded into the craft (Photo 3). The craft or canoe is then cruisedto the place where the sand is unloaded, heaped, and then uploaded onto atruck to be sold to the customers (Photo 4). It is sold in terms of cubic metres.
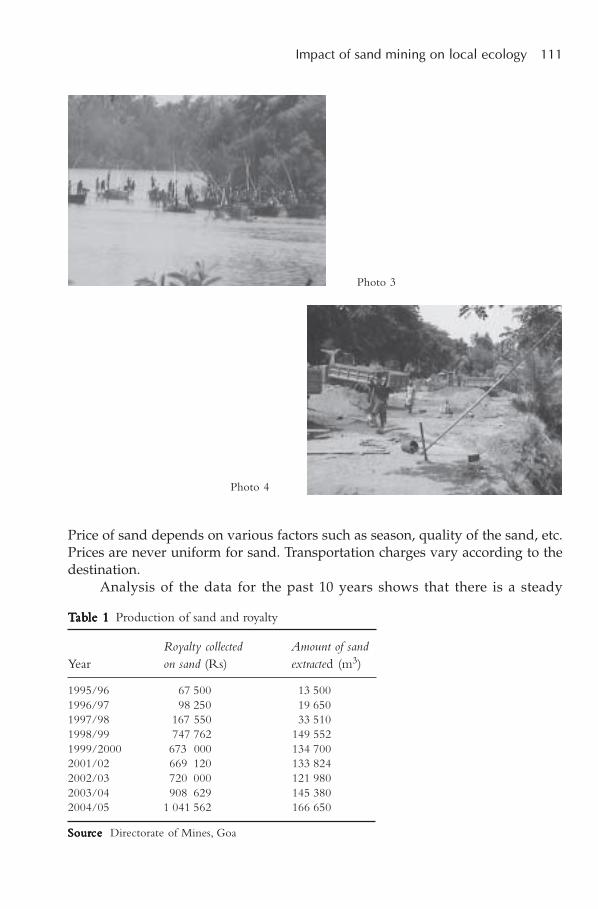
Impact of sand mining on local ecology 111
Price of sand depends on various factors such as season, quality of the sand, etc.Prices are never uniform for sand. Transportation charges vary according to thedestination.
Analysis of the data for the past 10 years shows that there is a steady
Photo 3
Photo 4
TTTTTababababable 1le 1le 1le 1le 1 Production of sand and royalty
Royalty collected Amount of sandYear on sand (Rs) extracted (m3)
1995/96 67 500 13 5001996/97 98 250 19 6501997/98 167 550 33 5101998/99 747 762 149 5521999/2000 673 000 134 7002001/02 669 120 133 8242002/03 720 000 121 9802003/04 908 629 145 3802004/05 1 041 562 166 650
SourSourSourSourSourcecececece Directorate of Mines, Goa
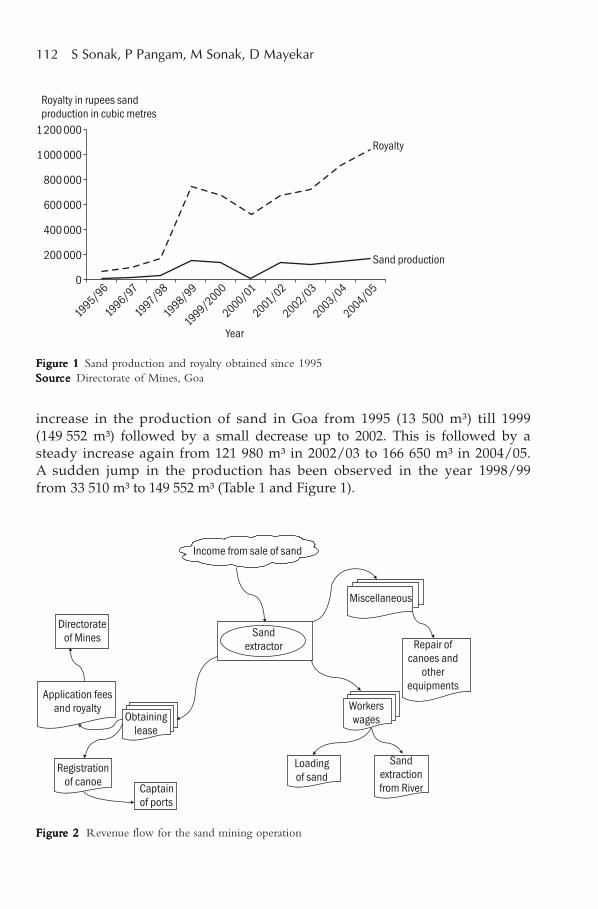
112 S Sonak, P Pangam, M Sonak, D Mayekar
FigurFigurFigurFigurFigure 2e 2e 2e 2e 2 Revenue flow for the sand mining operation
increase in the production of sand in Goa from 1995 (13 500 m³) till 1999(149 552 m³) followed by a small decrease up to 2002. This is followed by asteady increase again from 121 980 m³ in 2002/03 to 166 650 m³ in 2004/05.A sudden jump in the production has been observed in the year 1998/99from 33 510 m³ to 149 552 m³ (Table 1 and Figure 1).
FigurFigurFigurFigurFigure 1e 1e 1e 1e 1 Sand production and royalty obtained since 1995SourSourSourSourSourcecececece Directorate of Mines, Goa
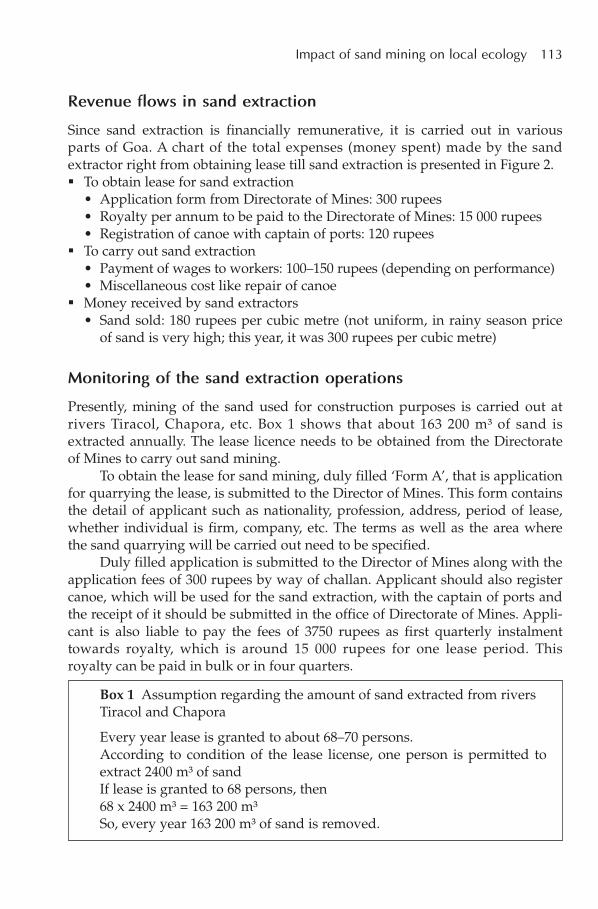
Impact of sand mining on local ecology 113
Revenue flows in sand extraction
Since sand extraction is financially remunerative, it is carried out in variousparts of Goa. A chart of the total expenses (money spent) made by the sandextractor right from obtaining lease till sand extraction is presented in Figure 2. To obtain lease for sand extraction
• Application form from Directorate of Mines: 300 rupees• Royalty per annum to be paid to the Directorate of Mines: 15 000 rupees• Registration of canoe with captain of ports: 120 rupees
To carry out sand extraction• Payment of wages to workers: 100–150 rupees (depending on performance)• Miscellaneous cost like repair of canoe
Money received by sand extractors• Sand sold: 180 rupees per cubic metre (not uniform, in rainy season price
of sand is very high; this year, it was 300 rupees per cubic metre)
Monitoring of the sand extraction operations
Presently, mining of the sand used for construction purposes is carried out atrivers Tiracol, Chapora, etc. Box 1 shows that about 163 200 m³ of sand isextracted annually. The lease licence needs to be obtained from the Directorateof Mines to carry out sand mining.
To obtain the lease for sand mining, duly filled ‘Form A’, that is applicationfor quarrying the lease, is submitted to the Director of Mines. This form containsthe detail of applicant such as nationality, profession, address, period of lease,whether individual is firm, company, etc. The terms as well as the area wherethe sand quarrying will be carried out need to be specified.
Duly filled application is submitted to the Director of Mines along with theapplication fees of 300 rupees by way of challan. Applicant should also registercanoe, which will be used for the sand extraction, with the captain of ports andthe receipt of it should be submitted in the office of Directorate of Mines. Appli-cant is also liable to pay the fees of 3750 rupees as first quarterly instalmenttowards royalty, which is around 15 000 rupees for one lease period. Thisroyalty can be paid in bulk or in four quarters.
Box 1 Assumption regarding the amount of sand extracted from riversTiracol and Chapora
Every year lease is granted to about 68–70 persons.According to condition of the lease license, one person is permitted toextract 2400 m³ of sandIf lease is granted to 68 persons, then68 x 2400 m³ = 163 200 m³So, every year 163 200 m³ of sand is removed.
114 S Sonak, P Pangam, M Sonak, D Mayekar
After obtaining the order, applicant is bound to keep this order (that ispassed by the Directorate of Mines) in the canoe /craft at the time of extractionof the sand and the same should be produced before the Inspecting Officer ofDirectorate of Mines, if required.
After the lease is obtained, Director of Mines issues written order and abook of 100 passes which cost 3500 rupees. Each truck should carry one pass(3500/100 = 35 rupees). Sand-carrying truck without pass is fined by the offi-cials of the Directorate of Mines.
The officials of the Directorate of Mines monitor the sand mining opera-tions. If any truck is found without pass, penalty in the form of challan, whichvaries between 12 500 and 35 000 rupees, is imposed.
After obtaining permission, lessee is bound by certain rules and regulation.In case of violation of any of these conditions, Directorate of Mines has full rightto impose penalty on lessee. Permission for the extraction of sand can be re-voked and lessee has no right to claim for any compensation.
The Directorate of Mines imposes the following conditions on lessee. While extracting or removing the sand, he should not cause damage to any
highway, agricultural land, public utility, private property, or public property.If any damage is caused to the property, lessee is liable to pay compensation.
It is the duty of the lessee to see that the truck carrying the sand from the siteof extraction is not overloaded.
It is the duty of the lessee to ensure that extraction of sand will not affect theenvironment and he shall also comply with the direction of the Directorate ofMines as well as the Department of Science and Technology and Environ-ment.
Extraction of sand shall be carried out during the daylight and shall not becarried out in the navigable channel. Lessee is not permitted to use dredger,shovel, or crane. Sand extraction should be carried out between the centrecline of the river and lower line of the river.
Lessee cannot extract the sand from an area prohibited by captain of ports, aswell as within 300 m from the bridge or public structure and within 25 mfrom the bank of river.
It is mandatory for the truck driver to keep the duly-filled permit while carry-ing the sand, failing which the inspecting authority has full right to imposepenalty.
Lessee should pay minimum royalty on 2400 m3 of sand per annum. Lessee can employ only two canoes, which are registered with the captain of
ports, and canoe number should be written boldly on both the side. If the royalty is on the upper side, the lessee shall pay the difference for the
proportional period. After a period of one year, that is after the expiry of lease period, if lessee
wishes to continue with the lease he can do so by applying for the renewal. In
Impact of sand mining on local ecology 115
case lessee wants to discontinue the lease, he should inform the Directorate ofMines in writing and should also give reason for the discontinuance.
In addition to this, according to the circular no. 51/1/80, mines/Directorateof Mines has made it mandatory to indicate the registration number of thecanoe at the time of filling the application for the renewal along with the cer-tificate issued by concerned port authority.
Working conditions
Employment in sand mining is of mobile and seasonal nature. In Goa, it is sea-sonal as no sand mining operations are possible during monsoons. Hot weatherconditions in the state make it very difficult for labourers in summer, especiallynear estuarine coast. Moreover, the employment is based on daily wages. Thereis no livelihood security. As sand is a natural resource, which is in restrictedsupply, the industry cannot have permanent location and the livelihood is ofmobile nature.
Royalty collected and regulation of royalty
As stated above, every lessee is bound to pay royalty to the Directorate ofMines, which is 15 000 rupees per annum. It can be paid either in four quarters,that is 3750 rupees for each quarter or in bulk. This royalty can be increased af-ter five years only by obtaining approval from state government.
Lease is granted only for one year, from April to March, for the Chaporaand Tiracol rivers. It has to be renewed every year if lessee wants to continuewith sand extraction. Same procedure is prescribed for renewal. As mentionedabove, if any lessee wants to discontinue with the lease, then he should informthe same to the Directorate of Mines in writing.
Every year, about 65–70 leases are granted by the Directorate of Mines forextracting sand from the rivers Chapora and Tiracol. Not much extraction isreported in the official statistics at other places. In Guleli (in Sattari) andSanguem, two to three leases are granted every year. Here, procedure forobtaining lease is slightly different. Lessee is required to sign a lease agreementand he is permitted to extract sand for two years.
Royalty is regulated on the basis of sand extraction carried out, that is15 000 rupees per annum, and the lessee is permitted to extract 2400 m3 of sand.If any lessee wishes to obtain the lease for sand extraction from the Mandoviand Zuari rivers, he is required to obtain NOC (no objection certificate)from captain of ports. Normally, because of the barge movement, sand extrac-tion is not carried out here. In addition, water is not stable in this river, posingdifficulties to extract sand.
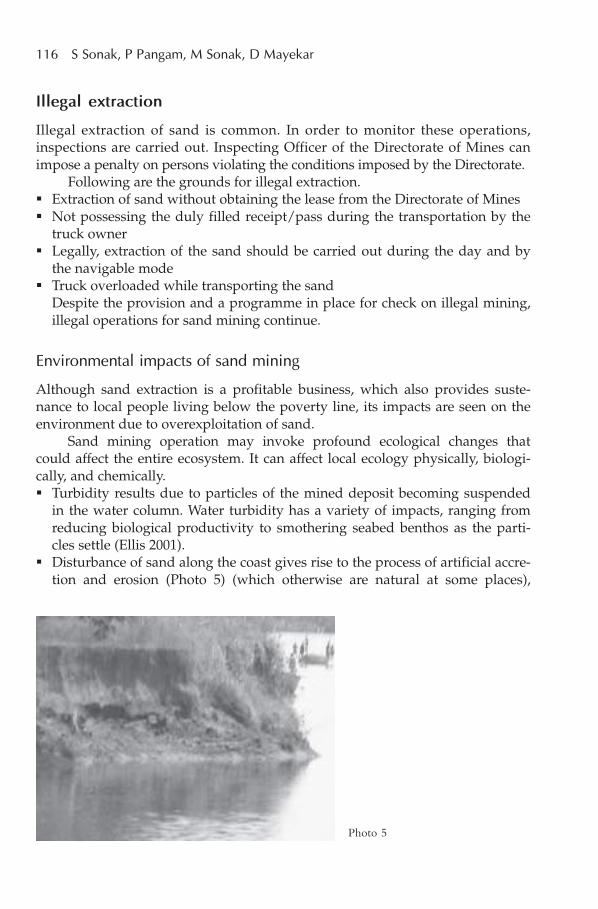
116 S Sonak, P Pangam, M Sonak, D Mayekar
Illegal extraction
Illegal extraction of sand is common. In order to monitor these operations,inspections are carried out. Inspecting Officer of the Directorate of Mines canimpose a penalty on persons violating the conditions imposed by the Directorate.
Following are the grounds for illegal extraction. Extraction of sand without obtaining the lease from the Directorate of Mines Not possessing the duly filled receipt/pass during the transportation by the
truck owner Legally, extraction of the sand should be carried out during the day and by
the navigable mode Truck overloaded while transporting the sand
Despite the provision and a programme in place for check on illegal mining,illegal operations for sand mining continue.
Environmental impacts of sand mining
Although sand extraction is a profitable business, which also provides suste-nance to local people living below the poverty line, its impacts are seen on theenvironment due to overexploitation of sand.
Sand mining operation may invoke profound ecological changes thatcould affect the entire ecosystem. It can affect local ecology physically, biologi-cally, and chemically. Turbidity results due to particles of the mined deposit becoming suspended
in the water column. Water turbidity has a variety of impacts, ranging fromreducing biological productivity to smothering seabed benthos as the parti-cles settle (Ellis 2001).
Disturbance of sand along the coast gives rise to the process of artificial accre-tion and erosion (Photo 5) (which otherwise are natural at some places),
Photo 5
Impact of sand mining on local ecology 117
causing several harmful effects to coastal and marine flora as well as coastalpopulation. Damage to coastal properties due to floods increases. Traditionalusers of the coast suffer.
Benthic population is at greatest disadvantage. It is immobile and henceenvironmental impacts at local level are most harmful to this population.
During the process of mining, the functional ecosystem, whether natural ordisturbed, is destroyed. Sand dune vegetation gets severely affected. Reha-bilitation of coastal dunes following mining has been recommended byLubke, Avis, and Moll (1996). They further suggest that rehabilitation afterdune mining results in bare and shifting sand that requires stabilization andmanagement.
Coastal sand can be used for construction purposes. Mining is done to adepth of up to 6 m within 10 m from the high tide line. These operations havethe potential to cause severe sea erosion.
The disappearance of sand dunes owing to indiscriminate mining makescoastal land vulnerable to storms and cyclones.
These operations and the resultant coastal erosion may have an adverseimpact on the fishing communities on the coast. The encroachment by minersdeprive fisherfolk of the space they have used traditionally to land their catchand keep the fishing equipment.
In several places, sea water intrusion has resulted in the salinization of wellwater and depletion of groundwater resources.
The exposure of the river bed to solar radiation following deep mining hasresulted in its drying up. Water availability may, therefore, considerably falland even the available water may turn saline in several places. Sand miningcauses changes in river channel capacity and obstruction in water flow;impairs drainage system; and affects groundwater flow.
It is reported that continued sand mining has led to obstruction in the freeflow of water during the monsoon, and the volume of water that flows intothe Pulicat lake has dwindled. This reduction in the availability of sweetwater has brought down the fish catch substantially, thus affecting the live-lihood of hundreds of families of fisherfolk. The sand mining has alsohindered the flow of water into the heavily silted Red Hills and Cholavaramlakes, thereby posing a serious threat to Chennai’s water supply system.4
The illegal removal of sand leads to loss of revenue to the government.
Unhygienic dwelling of the migrant labourer is another cause of concern.
4 <http://www.frontlineonnet.com/fl1910/19100440.htm>, accessed on 11 May 2005
118 S Sonak, P Pangam, M Sonak, D Mayekar
In Goa, sand mining is being carried out at a large scale. Most of theseoperations are illegal, thus avoiding revenue to the government and also avoid-ing implementation of environmental protection laws. No studies have so farbeen carried out on the environmental impacts of sand mining in Goa.
Judicial interventions and regulations against sand mining invarious coastal states of India
Kerala
As stated above, The Mines and Mineral (Regulation) Act, 1957, regulates theextraction of all mineral deposits in the country. The state government had alsoframed the Kerala Minor Mineral Concession Rules, 1967, in exercise of powersconferred under Section 15 (i) of the Central Act so as to regulate the extractionof all minor minerals such as the river sand in the state. Under this Act, permitswere issued to quarry 100 tonnes at a time from a particular point. But, this
stipulation was often not enforced for want of manpower.The Kerala Protection Act of River Banks and Regulation of Removal of
Sand Act, 2001 (Act 18 of 2001, published in the Kerala Gazette [Extra] No. 285,dated 20 March 2002), is an Act to protect river banks and river beds from large-scale dredging of river sand. This Act is also meant to protect their biophysicalenvironment system and regulate the removal of river sand and matterconnected therewith or incidental thereto. Indiscriminate and uncontrolledremoval of sand from the rivers causes large-scale river bank sliding and loss ofproperty.5
Maharashtra
Judicial intervention against sand mining was sought in the state ofMaharashtra. Reckless exploitation of sand was adversely affecting the riverbed. Committee of experts suggested confining the area of exploitation to main-tain proper balance between the need for the river to flow unaffected with itsbed left intact and the local needs of the sand. Affidavit filed on behalf of thestate indicated that the guidelines framed by the Committee would be strictlyfollowed. No further direction was called for.6
Tamil Nadu
In Tamil Nadu, in a matter related to sand mining on the banks of Kusasthalai
5 http://www.geocities.com/sahasram_2000/environment/sandact.html, accessed on17 October 20056 Mukthi Sangharsh Movement vs State of Maharashtra. 1990 Supp SCC 37.
Impact of sand mining on local ecology 119
river, it was noticed that the river bridges and railway tracks were severelydamaged by sand mining in violation of rules and lease deeds. Flooding of agri-cultural lands due to break in linkage between discharge/channels and riverbasins was noticed. There was destruction of agriculture/mangrove ecosystem.Houses and buildings collapsed due to erosion. The groundwater table wentdown in all the river basins, affecting agriculture severely. The sand mining per-mitted in private lands adjacent to river beds enabled private owners toencroach the river bed illegally. Public roads were also seriously damaged.Direct irrigation to about 22 000 acres of lands was affected in Vaigai andCauvery basins. Drinking water had turned saline. Accidents occurred due toheavy lorry traffic. The noise and the dust thrown up by the lorries carryingquarried sand started affecting people’s health. Court directed that there shouldbe a special river protection force mobilized for patrolling and policing the riverareas and apprehending the culprits indulging in illicit quarrying. Such a forceshould be composed of high calibre personnel and should not fall a prey toenticements.7
The quantity of sand mining is several folds higher than the natural replen-ishments and hence imposes severe environmental problems in the river basinenvironment. On the other hand, the sand mining provides employment oppor-tunities to a considerable section of the labour force of the Palakkad district.Further, there is no viable alternative available to this crucial construction mate-rial for immediate use.
The Tamil Nadu state government cancelled all leases through an execu-tive order. Reports suggest that unauthorized sand mining has been going on inseveral places in the state for many years. The money power and the politicalinfluence of the lessees often helped them violate all norms.
From their studies in different regions of the state, social action groups inTamil Nadu inferred that the rapacious practices adopted by the leaseholdershave led to ecological damage and environmental degradation, groundwaterdepletion, and have resulted in water scarcity as well as loss of agricultural pro-duction. Widespread unsustainable quarrying of sand has also affected the flowof water in the river systems to downstream areas and has also jeopardized thesafety of structures such as bridges, dams, river embankments, power line tow-ers, and power line poles (Frontline, 24 May 2002). The sand mining resulted inirreversible damage to river systems.
The Madras High Court expressed ‘great concern’ over the ‘seriousadverse consequences’ of the illegal quarrying. The High Court dealing with thePIL (public interest litigation) petitions and complaints from affected personsadvised that the government constitute a high-level committee to go into thismatter. Accordingly, the government appointed a committee headed by
7 M K Janardhanam vs The District Collector W.P. 985/2000 (2002.07.26).
120 S Sonak, P Pangam, M Sonak, D Mayekar
Dr C Mohanadoss, Head of the Department of Geology and Director, Centre forGeo Science and Engineering, Anna University, Chennai. The committeesubmitted its report. The Madras High Court directed the state government on26 July 2002 to initiate steps to put an end to the illegal sand mining on riverbeds, particularly in areas close to rail and road bridges.
Conclusion
GEC studies normally focus on the impact of climate change on several aspectsof environmental changes occurring globally. However, there are several otherfactors affecting and causing these environmental changes, which need to bestudied. Altering local ecology through anthropogenic pressures usually is no-ticed at local level and these alterations accumulate to produce largedisturbances globally. Sand mining is one such activity, which affects local ecol-
ogy directly, but nevertheless has wide implications for GEC.Though sand mining contributes significantly to the local economy and
creates considerable pressures on it, not many studies on this sector have been
taken up. It remains a neglected sector, even in terms of policy matters.Before granting license, it is necessary to carry out a study to investigate the total volume of the sand, investigate the long-term sustainable level of near-shore extraction establish a sediment budget and quantify sediment transport investigate adverse effects, if any, on the local ecologyIt is necessary that a strategy that can balance the current demand and the
emerging environmental issues related to sand mining needs to be worked outon a river basin mode. In the absence of such policies, protecting environmentand enforcement of any existing policies become an item on the mandate of afew environmentally conscious groups and judiciary. It is observed that themain concern is weak implementation/enforcement of regulations. Illegal sandmining is a cause for environmental impacts such as coastal erosion, water pol-lution, impacts on aquatic life, etc. Judicial interventions in India have done agreat deal of work to protect local ecology. It is expected that other institutionswith an agenda to protect environment provide more support to improvedpolicy-making and still better implementation/enforcement.
Acknowledgement
The authors acknowledge Mr Bhingui, Director, Department of Mines and thestaff of the Department of Mines, Goa, especially Mr A T De’Souza andMr Vasudev Hegde for their help in data and information collection.
Impact of sand mining on local ecology 121
References
Alvares C (ed.). 2002Fish Curry and Rice: a sourcebook on Goa, its ecology and life style (4th edn)Goa: The Other India Press. 377 pp.
Bell L C. 2001Establishment of native ecosystems after mining—Australian experience acrossdiverse biogeographic zonesEcological Engineering 17: 179–186
Chakravorty S L. 2001Artisanal and small-scale mining in India[Paper No. 78]Submitted to MMSD (Mining, Minerals, and Sustainable Development) project ofIIED (International Institute for Environment and Development)
Chaffey C J and Grant C D. 2000Fire management implications of fuel loads and vegetation structure inrehabilitated sand mines near Newcastle, AustraliaForest Ecology and Management 129: 269–278
Ellis D V. 2001A review of some environmental issues affecting marine miningMarine Georesources and Geotechnology 19: 51–63
Lubke R A, Avis A M, and Moll J B. 1996Post-mining rehabilitation of coastal sand dunes in Zululand, South AfricaLandscape and Urban Planning 34: 335–345
Mirza M M Q, Warrick R A , Ericksen N J, Kenny G J. 2001Are floods getting worse in the Ganges, Brahmaputra and Meghna basins?Environmental Hazards 3: 37–48
Mossa J and McLean M. 1997Channel platform and land cover changes on a mined river floodplainApplied Geography 17 (1): 43–54
Yiiksek O, Onsoy H, Birben A R, Ozolcer I H. 1995Coastal erosion in eastern Black Sea Region, TurkeyCoastal Engineering 26: 225–239
122 B Acharya and S Pokharel
Fifty years of forest management in Nepal:a review of institutional transformation
B Acharya and S Pokharel
This paper reviews the institutional transformation in the history of forestmanagement in Nepal. The review shows that in Nepal, changes in forestryinstitutions were guided by several factors and assumptions. Over the past50 years, the devolution of forest management in Nepal took place from cen-tralized government, through decentralized government, to local user groups.Before 1957, the Nepalese government’s focus was on conversion offorestlands to agriculture for revenue generation. After the nationalization of‘private forest’ in 1957, local people were blamed to be a part of the problemthat caused deforestation. As a solution, legislation permitted central controlover the local forest resources and the bureaucracy was expanded. A two-decade long unsuccessful experiment (1957–76) proved that without people’sparticipation, forests cannot be managed effectively. Since 1978, communityforestry has gradually evolved from protection forestry to organized and legiti-mized self-governing-user-group managed forestry. This was feasible becauseof the participatory actions, adaptive learning, refining, and legitimizing com-munity forestry practices over time. Community forestry is a dynamic,adaptive, and evolving process. To move community forestry forward, ‘second-generation issues’ need to be addressed.
Introduction
More than 80% of Nepal’s population depends on agriculture (NPC 2003).Although subsistence-oriented, agriculture contributes 39% to the gross domesticproduct (NPC 2005). Forests are an integral part of the farming system. Mostfarmers rely heavily on forests to maintain agricultural productivity through theflow of nutrients from the forests to their farms via composting. Forests are a
For correspondence: [email protected]
6
Fifty years of forest management in Nepal 123
major source of fuel for cooking and heating, feed for livestock, and many non-timber forest products such as medicinal and aromatic plants. Moreover, forestscontribute to soil and water conservation, biodiversity conservation, and carbonsequestration, which have importance at local, national, and internationallevels.
Physiographically, Nepal can be broadly divided into three regions,stretching from east to west across the country: Terai (60–300 m (metres) in alti-tude), hills (300–4000 m), and mountains (2500–8848 m), changing vegetationcharacter from tropical, through sub-tropical and temperate, to alpine. Terai is anextension of the Indo-Gangetic plain that covers 23% of the total geographicarea of the country (147 181 km2 [square kilometres]); the hills cover 42% andthe mountains 35% (CBS 2001). Of the total land area of the country, forest,including shrub, covers 39.6% (HMGN 1999). The Terai, hills, and mountainsaccommodate 49%, 44%, and 7% of the total population of the country,respectively.
The deteriorating condition of Nepal’s forests has been a cause for both lo-cal and international concerns for many years (Bajracharya 1983; Eckholm 1975,1976; Ives and Messerli 1989; World Bank 1978). Causes of such deteriorationhave been the subject of several studies. To address the problem of deforestationand forest degradation across the country, Nepal has witnessed substantial insti-tutional changes in forest management over the past 50 years. However, thepast 25 years’ struggle has been for developing and refining a participatory for-est management approach called ‘community forestry’.
Following Ostrom (1992), institutions are defined as ‘a set of rules actu-ally used by a set of individuals to organize repetitive activities that produceoutcomes affecting those individuals and potentially affecting others’.Thomson and Freudenberger (1997) have discussed the characteristics of rulesand their implications for community forestry. These rules are used to deter-mine who is eligible to make decisions, who participates in making decisions,how are the rules made by the decision-making bodies, what actions areallowed or constrained, what aggregation rules will be used, what proceduresmust be followed, and what payoffs will be assigned to individuals independ-ent of their actions. In the context of community forestry, user groupconstitutions and operational plan are examples of such rules that are madeby a group of traditional forest users who are in need of their applications.The same group can change these rules later, if required, and monitor andenforce them.
For common pool resource management, various forms of institutionalarrangements have been proposed. Among them, institution building at thecommunity level has emerged as the most viable option for managing theseresources. One can expect that the local communities not only understand theirproblems rightly but also have solutions as their livelihoods depend on suchresources. The local institutional arrangements including customs, norms, and
124 B Acharya and S Pokharel
values designed to address problems may increase efficiency in the manage-ment and use of local resources.
In Nepal, the institutional changes over the past 50 years in the forestrysector have resulted in notable successes in reversing the trend of deforestationand forest degradation. Nepal’s community forestry has now been consideredas one of the best models in the world for sustainable forest management, liveli-hood improvement of the poor, and biodiversity conservation. This studyattempts to review the institutional changes that led to achieve such successes atdifferent spatial scales and time.
The history of institutional transformation in forest management in Nepalcan be broadly divided into four periods.1 Private forest management (before 1957)2 State forest management (1957–76)3 Community forest management through local government (1976–88)4 Community forest management through forestry user groups (1988
onwards)
Private forest management (before 1957)
Before 1743, Nepal was a fragmented group of small states. The land policies ofthese states were meant to bring all available lands under the state ownershipand ensure that they remained productive (Stiller 1973). Therefore, the rulers en-couraged farmers to convert as much forest land as possible to agriculture.Farmers were asked to pay up to 50% of the product of the land cultivated astaxes. Government officials and nobles who were linked to the rulers and localfunctionaries implemented these policies. After unification of Nepal by LateKing Prithvi Narayan Shah in 1769, forest lands were distributed to the officialsand nobles who served the state in the form of birta1 and jagir.2 No tax was im-posed on such land. Jagir could be kept only as long as the concerned personserved the state, whereas birta grants had no time limit and could be inheritedby the families. This practice led to the emergence of elites who could controllarge areas of land, including the forest land. Moreover, many village chiefswere authorized to act as state functionaries. They collected taxes and controlledlocal land use, including the use of forest. At that time, the population of thecountry was small and the forest resources were abundant. Hence, to increasethe state revenue through tax collection, the government encouraged convertingforest land to agriculture.
The Shah kings (1743–1845) unified Nepal. To motivate soldiers for fight-ing with neighbouring states, they granted extensive areas of land as jagir. This
1 Land granted to individuals for special services.2 Land assigned to government employees and functionaries for collecting and using share ofproduce accruing to the state in lieu of, or in addition to, cash remuneration.
Fifty years of forest management in Nepal 125
policy was continued during the hereditary dynasty of Ranas (1846–1950). Theyalso continued granting land to their own family members and key officials.This resulted in massive conversion of forest land into agriculture. By 1950,about one-third of the total forests and cultivated lands were granted to privateindividuals under birta tenure, of which about 75% belonged to the Rana fami-lies (Regmi 1978). Authors such as Kondos (1987) and Bista (1991) havedescribed existence of unequal class and caste system in Nepal, which hadimplications on the changes of forest policies.
State forest management (1957–76)
Following the replacement of Rana regime by a democratic movement in 1950,the government abolished the birta land tenure system and initiated nation-widedevelopment programmes such as construction of roads, schools, and hospitalsthrough a decentralized planning approach. A large number of political and ad-ministrative units were created at various levels in order to involve more peoplein the development process (Paudel 1994).
Since 1957, the government started nationalizing all the private forests ofNepal through the Private Forest Nationalization Act (1957). The intention be-hind this move was to prevent further destruction of forests and to ensureadequate protection, maintenance, and utilization of privately owned forests(Regmi 1978). It aimed at releasing the land from the control of few birta holdersand to use the income for the welfare of the nation (Bajracharya 1983). The peo-ple in the new government were aware of the fact that Ranas were takingadvantages from the exploitation of forest resources. Therefore, the governmenttried to discredit the Rana regime and enhanced its own involvement in forestrybusiness.
The government promulgated comprehensive forestry legislation, the ForestAct (1961). The Act, among other things, divided forests into different categories,defined duties and authorities of the Forest Department, listed offences, andprescribed penalties. The Ministry of Forestry was established in 1959 and thegovernment bureaucracy was expanded. To control deforestation, the roleof Forest Department was further strengthened through the promulgation ofForest Protection (Special Provision) Act in 1967. This Act included provisionsfor stronger penalties for damaging or illegally removing forest products fromthe national forests.
During this period, several forest-based industries were established in Teraimainly with donor support. The Forest Department was responsible for harvest-ing forests and supplying raw materials to those industries. The governmentwas also involved in exporting logs and semi-processed forest products to India.
The Private Forest Nationalization Act of 1957 raised controversy becauseof its implications on deforestation. For farmers, the nationalization of forestwas good for immediate benefits. First, it appeared that the local forests were no
126 B Acharya and S Pokharel
longer under the control of local functionaries/elites and the farmers did notrequire paying gifts and free labour to them. Second, the farmers perceived thatthey got free access to forests. Bajracharya (1983) and others have reported thatfarmers in some areas indiscriminately felled trees and cleared forests for agri-culture due to free access to these forests. Others argue that the Act was notappropriate since it was against the traditional systems of management, depriv-ing the local people of their right to manage and benefit from the forests. As aresult, forests became ‘open access’ resources, which were originally managedin the form of common property (Hobley 1985; Messerschmidt 1993).
Some researchers (for example, Joshi 1993) claim that the forests weremanaged for the owners, and the users had to pay for the forest products. Theyfurther argue that nationalization was deemed necessary to prevent the Ranarulers from continuing the use of forest as their own property. If private forestswere not nationalized, the surrounding communities probably would not havegot an access to those forests that now serve as community forests. However,Gilmour and Fisher (1991) state that nationalization of forests did not havemuch impact on the forests as people in the villages did not know about it.
Despite being the subject of controversy, the private forest nationalizationhas been considered as a major event in the institutional transformation in theforestry sector in Nepal. The implementation of this legislation could not pro-duce the desired results (Wallace 1981) because of several reasons. For instance,there were a very few trained foresters available to serve the forest department.Infrastructure, particularly roads and communication system, was very poor.Therefore, the ‘private owners’ tried to take advantage of these constraints.They wanted to clear the forest lands and convert them into agricultural landsbefore the lands were physically withdrawn from them. Some private ownersalso forced the government to reverse the policy. As a result, it was virtually im-possible to control the widespread deforestation by the private owners. Thegovernment succeeded in nationalizing only the forested land.
Following the nationalization of forests, the local functionaries lost controlover them. On the other hand, some local elites considered this as an opportu-nity to work with the forest department to maintain their power relations.Because of their knowledge and skills to cope up with the situation, it was notimpossible for these elites to get elected as local representatives in the new po-litical system called ‘Panchayat system’. The decision on private forestnationalization thus broke an informal alliance between the landlords (for ex-ample, birta holders) and the central government (Malla 2001).
Despite all the efforts, the overall implementation of legislation formulatedin this period remained ineffective. Farmers’ access to forests could not be im-proved much. Big landowners planted trees in their private land to meet theirhousehold needs, whereas the small holders and tenants had to rely either ongovernment-managed forests, where access was controlled by the governmentand local leaders, or on big private landowners. The local elites began working
Fifty years of forest management in Nepal 127
with the forest department to control the forests in a different way. Because ofbureaucracy and corruption in the forest department and its field offices, thefarmers were alienated by the government–local leader alliance. The forestrystaff delegated some responsibilities of forest protection and plantation to thelocal leaders.
In addition to implications of private forest nationalization on forest, therewere other factors that contributed to deforestation in Nepal. In Terai, deforesta-tion was caused by population growth, migration from the hills due to malariaeradication, encroachment, government’s re-settlement programme, unemploy-ment, and construction activities such as infrastructure development. Between1950 and 1975, the deforestation rate in Nepal was 4.1%, which was among thehighest in the selected tropical countries of South and South-East Asia, withmore than 25% of the total forest cover lost during this period (Thapa andWeber 1990). Consequently, Nepal’s forest area declined to 42.7% in 1978/79(HMGN 1986).
On the positive side, community-based forest management, in the form ofindigenous system, had a long history in the hills (Arnold and Campbell 1986;Gilmour and Fisher 1991; Messerschmidt 1993). These systems were operationalunder different types of institutional arrangements at different times and loca-tions. Some forms of these systems continued to exist even after private forestswere nationalized in 1957. Villagers maintained local system of indigenousforest management in many parts of Nepal despite the existence of Act and privateowners. For example, in Kipat system, forest land was regarded as a commonproperty of the local ethnic groups and was managed by their organization.Some of the rules adopted by such indigenous system of management includedharvesting forest products by species and product types, harvesting accordingto the condition of the products, limited harvesting, and use of social means formonitoring (Arnold and Campbell 1986).
Community forest management through local government(1976–88)
In the 1970s, the government placed emphasis on rural development and envi-ronmental protection. The government formulated its policies to fulfil the ‘basicneeds’ of the local people through the implementation of Integrated Rural De-velopment Projects, targeting remote hill districts. The government felt theneed for wider people’s participation in the development process, particularlyin determining the local needs and in implementing the activities at the villagelevel (Paudel 1994). Therefore, it passed the Decentralization Act in 1982, whichencompassed decision-making authorities to political units at the district andvillage levels.
In the forestry sector, the objective of forest management was to fulfillthe ‘basic needs’ of the forest products of the local communities and to stop

128 B Acharya and S Pokharel
deforestation. To achieve these objectives, for the first time in 1976, the govern-ment encouraged local people to participate in the forest managementprogramme. In 1976, the government prepared a National Forestry Plan, whichidentified people’s participation as imperative for better management of forests.To implement the concept contained in the Plan, the Forest Act of 1961 wasamended in 1977 to define new categories of forests to be managed by localcommunities, religious organizations, and individuals. To legitimize the com-munity forestry concept, the government introduced Panchayat Forest andPanchayat Protected Forest Regulations (1978) under the same Forest Act (1961).This legislation authorized the forest officials to hand over government forest tovillage Panchayats3 for forestry development.
During this period, the community forestry programme focused on hand-ing over forest lands to Village Panchayats. The denuded hills were handedover to these local government bodies as the Panchayat Forests and the de-graded natural forest areas as the Panchayat Protected Forest. The formerrequired plantation and the latter mainly the management.
The increased publicity of deforestation and environmental crisis in theHimalayas compelled the government to set aside representative forest areas asnational parks and wildlife reserves. To manage these areas, a separate office –Department of National Parks and Wildlife Conservation – was created. Somedonors supported the implementation of environmental protection and ruraldevelopment activities.
In areas where community forestry programmes were implemented, somepositive results were seen on rural development and environmental protection.Although the trend of deforestation continued in this period as well, it was atslower rates. As reforestation took place in some barren areas that were deve-loped as the ‘Panchayat Forest’, the total forest area remained 42.2% in 1985/86(HMGN 1989). In some areas, where the local communities controlled the for-ests, the condition of the forests improved significantly. The supply of forestproducts exceeded the communities’ demands for subsistence (Jackson andIngles 1994; Jackson, Ingles, Ingles, et al. 1995). Consequently, some communi-ties started to express their willingness to sell of excess forest products and touse the income for community development. However, government’s emphasiswas on forest protection and limited utilization of the forests, which restrictedtheir use for subsistence. Besides, the rural development programmes increasedaccessibility to remote areas in the hills and mountains through newly con-structed roads. This led to availability of new services such as education andhealth care in those areas. As farmers required greater incomes to buy suchservices, commercial use of forest products was found to be a potential source ofincome.
3 The lowest administrative unit, which has been re-named as Village Development Commit-tee after the restoration of democracy in 1990.
Fifty years of forest management in Nepal 129
The forest management in the hills was different from that in Terai. In thehills, forests were protected rather than being managed, which met the interestof the government and the donors. The local leaders and elites appreciated thecommunity forestry policies. Most of these leaders requested the DFO (DistrictForest Office) to speed up the forest hand over process, but emphasized moreon protection than on sustainable utilization. This was a convergence of interestof both the government and the local leaders. As chairperson of the forestcommittee, local leaders had a number of advantages including access to donorfunds and group account. They also got decision-making powers such as hiringforest watchers. Moreover, they enjoyed opportunities to participate inseminars, workshops, and study tours.
In Terai, no forests were actually managed. The interest of the ForestDepartment was in harvesting commercial timber. The government-ownedTimber Corporation of Nepal carried out all the harvesting work. During thisperiod, community forestry in Terai was severely restricted.
There were certain limitations in the implementation of community for-estry in the hills. Handing over of forest was slow as only the senior-levelgovernment authority, viz., the Regional Director, who was in-charge for theregion, was authorized to do so. This required much time to process the requestand get approval for forest hand over. The panchayats were dependent on theDFO for services required for technical forestry activities such as seedling pro-duction and plantation in the Panchayat Forest. Similarly, Panchayat ProtectedForests were also not actively managed. Training and extension services wereinadequate. Panchayats had no experience in forest management. Moreover,nationalization of forests already handed over still evoked fear among the localpeople. The DFO staff could not play the facilitator’s role as traditionally theirrole was policing. The chairperson (Pradhan Pancha) used to take one-man deci-sions in most of the forestry-related activities. The forestry projects focusedmainly on large-scale plantation to address the perceived ecological crisis in theHimalayas. Millions of seedlings were distributed free of cost for planting onthe private land.
In contrast to previous periods, more progressive forestry policy was for-mulated in favour of local people during this period. From 1976 to 1988,approximately 28 000 ha (hectares) of forests was handed over as the PanchayatForest and 35 000 ha as the Panchayat Protected Forest, primarily in the hills.However, people could not realize the benefits from the forests, although the in-tention of forest policy was to increase their participation in its protection andmanagement. In practice, users were hardly given any space and decision-mak-ing role in forest management. Their participation existed mainly in rhetoricand in the form of labour contribution at the time of planting. Despite the pro-mulgation of Decentralization Act, the situation of the local people did notimprove much. They could not take full advantage of the new forest policy.
130 B Acharya and S Pokharel
Community forest management through forestry user groups(1988 onwards)
The government prepared a 25-year master plan for the Forestry Sector in 1989(HMGN 1989). The plan recognized Community and Private Forestry as thelargest programme among the six primary forestry programmes. The govern-ment recognized that only the group of forest users can manage the forestseffectively and sustainably. Thus, the plan emphasized the need to establishCFUGs (community forestry user groups) as appropriate local managementbodies responsible for protection, development, and sustainable utilization oflocal forest resources. This removed the inconvenience caused by panchayatboundaries used to delineate the forest handed over to panchayat; and instead,increased the accessibility for traditional users to nearby forests. Operationalplan for forest management was made mandatory for handing over the foreststo the CFUGs. A need was identified to re-orient the forest department staff toassume new responsibilities of facilitators and extension workers. The plan alsorecommended handing over of all accessible forests in the hills to the local com-munities, if they were willing to assume the management responsibilities. Thisapproach of forest management became effective for practical reasons because itwas easier for local people living in the vicinity of forests to visit the forest andmanage it as compared to the government agencies located at distance. Thiswas a radical change in Nepal’s forest policy towards forest development.
While community forestry has been defined in various ways, the simpledefinition is the ‘local control and management of forest resources by commu-nity forestry user groups’. The local communities carry out the tasks of forestmanagement and receive technical assistance and guidance, where necessary,from the forest department and other service providers. The forestry technicianssuch as rangers facilitate the process with their technical skills, whereas the us-ers are the real actors in the process. This demands that the forestry field staffwork closely with the villagers in the fulfillment of different bureaucratic re-quirements which include tasks such as identifying the existing forestmanagement systems, raising awareness on community forestry policies andlegislation, preparing an operational plan with regard to the needs and concernsof the forest users, and giving regular support to the forest users.
In 1990, people’s movement overthrew the partyless panchayat systemand a multi-party democracy was restored. Many NGOs (non-governmentalorganizations) emerged. The local-level NGOs started working in the develop-ment activities at the grass-roots level, whereas the national-level NGOs wereengaged in advocacy issues at higher levels. Some environmental NGOs advo-cated for traditional user’s right in the management and sustainable utilizationof forests. Involvement of NGOs in forestry development activities reducedsome workload of the forest department.
Fifty years of forest management in Nepal 131
To implement the forestry master plan, a new legislation, the Forest Act,was promulgated in 1993. This Act gave the highest priority to community for-estry over the types of forest management. The Act identified a CFUG as aself-governed autonomous entity with authority to independently manage anduse the forest according to an agreed community forestry constitutions and op-erational plans with the DFO, which are key institutions at CFUG level. EachCFUG has an executive committee, which represents its members (the forest us-ers) in the development and execution of forest operational plans. In 1995, thegovernment issued Forest Regulation (1995) to implement the Act, which was inline with the democratic principles.
Because of the conducive community forestry policy, several donor agen-cies such as the World Bank, the UK Department for International Development,the United States Agency for International Development, the Australian Agencyfor International Development, and the Swiss Development Cooperationsupported the community forestry activities in Nepal. Several lessons werelearnt from the community forestry projects implemented simultaneously atdifferent geographic locations with donor support. Both social sciences andtechnical forestry were applied for social mobilization of local communities andfor technical forest management.
Till 1997, the focus of the community forestry programme remained prima-rily on formation of CFUGs and handing over of government-managed foreststo them. The number of groups formed and the area of forests handed over in-creased linearly. Approximately, 1000 CFUGs were formed each year.Promulgation of Forest Act (1993) and Forest Regulation (1995) played a keyrole in speeding up the process. This period remained a milestone in changingthe roles of government field staff from policing to facilitating and in forminguser groups and handing over the forests.
After 1997, the formation of groups and the forest area being handed overcontinued to increase, but at a decreasing rate. The focus shifted to strengthen-ing the existing groups, sometimes called ‘post-formation support’. Althoughmost of the forests adjacent to the settlements had been handed over, the forestslocated at a distance and on steep slopes were of less interest to the local com-munities and were left as residual government-managed forests. The early 1990scan thus be considered as a landmark in the history of community forestry,when the community forestry approach gained momentum in Nepal.
Activities that aimed at raising awareness among the users, particularly oncommunity forestry policy and legislation, made them feel the necessity of net-working among the user groups. As a result, FECOFUN (Federation ofCommunity Forestry Users, Nepal) was formed in 1994. This federation aims atnetworking among the forestry user groups and mobilizing them to advocatefor change or refinement or implement the community forestry policy and workfor the interest of the user groups. There are cases where FECOFUN has beensuccessful in presenting the concerns of users and in putting pressure on the
132 B Acharya and S Pokharel
government, especially the forest department, in matters related to policychanges, when such policies were not in favour of the users.
Since 1997, the focus in forest management has shifted to the managementof handed over forest. This required institutional support services to CFUG.These services included technical management of forest and organizational de-velopment of group (Sharma and Acharya 2004). The former included forestmanagement, non-timber forest-product-related training, forest inventory, andyield prescription. In this regard, the community forestry and inventory guide-lines were revised and made user friendly. It was necessary to revise theseguidelines because after some years of protection, the growing stock increasedand the forest products became available for harvesting. The organizational de-velopment aimed at strengthening CFUGs to address governance andlivelihood issues. Training on record keeping, financial management, funds uti-lization, audit, regularization of meetings, and general assembly was conductedunder various projects. Good governance training focused on maintainingtransparency; accountability; participation of the women, poor, and marginal-ized; and equitable cost and benefit sharing. Some donors such as the UnitedStates Agency for International Development have been supporting for goodgovernance, whereas others such as UK Department for International Devel-opment and the United Nations Development Programme are supporting forlivelihood improvement of the users and biodiversity conservation, respectively.
Discussion
Community forestry approach is participatory. The traditional forest users or-ganize themselves into a group called CFUG. The group develops a constitutionand submits it to the DFO for registration. Once it is registered, it functions as aself-governed, autonomous, and corporate body. The constitution includes in-formation related to member households such as household size and livestock.The rules including the membership fee, the rights, and penalties are defined.The executive committee is formed through election and its responsibilities arealso well defined in it.
In the next step, the group prepares forest operational plan, which is validgenerally for five years. To prepare it, the group conducts forest inventory. Thestock of timber and other forest products are calculated and the sustained yieldlevel is prescribed. The group sets up the objective of forest management. Theplan contains a list of activities to be conducted in the forest for each year andmonth. When the plan expires in five years, the group conducts another forestinventory and repeats the process. It documents the indigenous forest manage-ment systems, if any, and utilizes it while forming the operational plan.
Community forestry has resulted in a number of positive outcomes. Thereare ample examples and observations to assess the impacts of community for-estry at the local level (Branney and Dev 1994; Jackson and Ingles 1994).
Fifty years of forest management in Nepal 133
However, systematic studies have yet to be conducted at the national level. Theprogramme has resulted in rural communities’ increased access to forest re-sources through devolution of forest management rights and responsibilitiesover a large area of national forests. For instance, to date, 1.5 million households(35% of Nepal’s total population) have been organized into over 14 000 CFUGsand are managing 1.2 million hectares of forest in Nepal, which is 25% of thetotal forest area of the country.
Kanel (2004) interpreted the achievement of community forestry over thelast 25 years in terms of better forest condition, social mobilization for rural de-velopment, and institution building at the grass-roots level. Biomass per unitarea has increased and so has the regeneration in community forest (Branneyand Yadav 1998; Gautam, Webb, Shivakoti, et al. 2003). Similarly, the totalforested area has increased (Jackson, Tamrakar, Hunt, et al. 1998). These resultswere achieved due to active participation of users in the forest protection andmanagement.
Kanel and Niraula (2004) report that the total annual income of CFUGs inNepal is 12.6 million dollars. Of this, 83% comes from the sales of forest pro-ducts. CFUGs spend 36% of their income in community development such asschool support, non-formal education, and infrastructure development (for ex-ample, road, drinking water, irrigation canals). About 28% of the income isspent in forest protection and management. A small portion of their income(three per cent) is used for pro-poor programmes.
Community forestry is an institutional innovation of empowering localcommunities. Social mobilization activities have developed leadership capacityof women and disadvantaged. According to Pokharel and Nurse (2004), of thetotal members of the executive committee, women’s participation at CFUG com-mittee has increased from 19% in 1996 to 30% in 2003. About five per cent of thetotal CFUGs have only women members. Similarly, representation of Dalits(oppressed people) increased from two per cent to seven per cent during thisperiod.
It has now been well accepted that local people’s participation is essentialfor sustainable management of local resources. Therefore, in Nepal, the learningfrom community forestry is being diffused in the management of watershed aswell as development of buffer zones adjacent to national parks and wildlife re-serves. Analyses of achievements show that community forestry in Nepal hasbeen successful in formulating and implementing policies and has brought afundamental shift in management paradigm in forestry, watershed, and parkresources.
The success of community forestry in the hills can partly be attributed tomany successful indigenous systems of management that were in existence be-fore the forests were nationalized in 1957. The forestry user groups formalizedsome of these traditional organizations after the implementation of communityforestry programmes. In contrast, community forestry has limited success in
134 B Acharya and S Pokharel
Terai, where hardly any indigenous systems of management were in existence.Moreover, bio-physical and socio-economic conditions in Terai significantly dif-fer from those in the hills. Therefore, it was difficult to copy the modeldeveloped in the hills for replication in Terai.
There are certain ‘second-generation issues’ in community forestry(Sharma and Acharya 2004). Field-level observations show that community for-estry may further marginalize the weaker section of the society such as the poor,women, and oppressed, who mostly depend on the common property re-sources. Most of the benefits accrued from community forestry can go to elites.An assessment of governance situation of CFUGs in four districts concludedthat there is a need to further strengthen organizational, managerial, and techni-cal capacities of CFUGs. These groups need to internalize good governancepractices (USAID 2002) such as transparency, accountability, and democraticparticipation of users in planning, implementation, monitoring, and evaluationof forest management; and equitable cost and benefit sharing practices, inclu-sion of most vulnerable people of the community (women, ethnic, marginalized,and disadvantaged) in the mainstream of forestry development. Partnership be-tween government, private sector, and civil society needs to be improved.
Community forestry is not free from challenges. Despite clearly definedforest policies and legislation in place, a number of ad hoc policy decisions existat the national level which have created confusion. It has been felt that there is aneed to improve communication, coordination, and network of users to maketheir voice heard in policy considerations. Since community forestry reformshave mostly been led first by experience and then by legislation, there is an op-portunity to further address the ‘second-generation issues’ in the future.
Conclusion
The history of forest management in Nepal shows that the institutional trans-formation in forest management was guided by several factors andassumptions. Before 1976, local people were blamed to be a part of the prob-lem that caused deforestation. As a solution, legislation permitted centralcontrol over the local forest resources and the bureaucracy was expanded. Atwo-decade long unsuccessful experiment (1957–76) proved that withoutpeople’s participation, forests cannot be managed effectively. The shift in in-stitutions was no more than a belated recognition that the local resourcemanagement can be sustainable only if users become managers as they areoften the ones with the greatest stake in resources management and institu-tional sustainability.
This study suggests that identification, appreciation, and utilization of localinstitutions such as indigenous systems of management in the policy formu-lation and implementation are crucial for sustainable forest management.

Fifty years of forest management in Nepal 135
Although community forestry was started in 1978, it has gradually beenevolved from protection forestry to organized and legitimized self-governinguser-group-managed forestry. This was feasible because of the participatoryactions, adaptive learning, refining, and legitimizing community forestrypractices over time.
Community forestry is a dynamic, adaptive, and evolving process, which re-quires improvement for increased positive impacts. To address thesecond-generation issues and challenges in community forestry, new initia-tives need to be taken to ensure that good governance practices areinternalized by CFUGs, supporting a code of conduct of equity in access toand benefits from forest resources, specifically benefiting the women, thepoor, and disadvantaged people. By resolving issues related to governance,livelihoods, and sustainable forest management, community forestry has thepotential to contribute to poverty reduction, environmental sustainability,education, gender equity, and empowerment of women, and achieve Millen-nium Development Goals.
The recognition of community-based management in Nepal is a successfulexample of devolution of natural resources management from centralizedgovernment, through decentralized government, to local user groups. Devo-lution of authority to CFUGs to manage forest resources is a key operationalstrategy in the community forestry. The lessons can be used in similar bio-physical, socio-economical, and environmental settings in other regions of theworld.
Acknowledgement
This research was supported by the Asia Pacific Network through the projecttitled ‘Role of institutions in global environmental change’.
References
Arnold J E M and Campbell J G. 1986Collective management of hill forests in Nepal: the community forestrydevelopment projectWashington, DC: National Academic Press[Paper presented at the Common Property Resources Management Conference,Annapolis, 21–27 April 1985]
Bajracharya D. 1983Deforestation in the food/fuel context: historical and political perspectives fromNepalMountain Research and Development 3: 227–240
136 B Acharya and S Pokharel
Bista D B. 1991Fatalism and DevelopmentCalcutta: Orient Longman Ltd. 187 pp.
Branney P and Dev O P. 1994Biodiversity implications of community management of forests in NepalIn Community Development and Conservation of Biodiversity Through CommunityForestry, edited by H Wood, M McDaniel, and K Warner[Proceedings of an international seminar held in Bangkok, Thailand,26–28 October 1994. RECOFTC Report 12.] 346 pp.
Branney P and Yadav K P. 1998Changes in Community Forest Condition and Management 1994–1998: analysis ofinformation from the forest resource assessment study and socio-economic study inthe Koshi hillsKathmandu: Nepal–UK Community Forestry Project. 64 pp.
CBS (Central Bureau of Statistics). 2001Nepal in FiguresKathmandu: CBS, National Planning Commission Secretariat, His Majesty’sGovernment
Eckholm E. 1975The deterioration of mountain environmentsScience 189: 764–770
Eckholm E. 1976Losing GroundNew York: Worldwatch Institute, W W Norton
Gautam A P, Webb E L, Shivakoti G P, Zoebisch M A. 2003Land use dynamics and landscape change pattern in a mountain watershed inNepalAgriculture, Ecosystem, and Environment 99: 83–96
Gilmour D A and Fisher R J. 1991Villagers, Forests and Foresters: the philosophy, process, and practice ofcommunity forestry in NepalKathmandu: Sahayogi Press
HMGN (His Majesty’s Government of Nepal). 1986Land Utilization Report. Land Resources Mapping ProjectKathmandu: Kenting Earth Sciences Ltd, HMGN, and Government of Canada
HMGN (His Majesty’s Government of Nepal). 1989Master Plan for the Forestry Sector: main reportKathmandu: Ministry of Forests and Soil Conservation, HMGN. 292 pp.
Fifty years of forest management in Nepal 137
HMGN (His Majesty’s Government of Nepal). 1999Forest Resources of Nepal (1987–1998)[Forest Resource Information System Project, Publication No. 74]Kathmandu: Department of Forest Research and Survey, Ministry of Forests andSoil Conservation, HMGN, and the Government of Finland
Hobley M. 1985Common property does not cause deforestationJournal of Forestry 83: 663–664
Ives J D and Messerli B. 1989The Himalayan Dilemma: reconciling development and conservationLondon and New York: Routledge. 295 pp.
Jackson W J and Ingles A W. 1994Developing rural communities and conserving the biodiversity of Nepal’sforests through community forestryIn Community Development and Conservation of Biodiversity Through CommunityForestry, pp. 115–135, edited by H Wood, M McDaniel, and K Warner[Proceedings of an international seminar held in Bangkok, Thailand26–28 October 1994. RECOFTC Report 12]
Jackson W J, Ingles P B, Ingles A W, Malla Y B, Chhetri R B. 1995A Feasibility Study for Timber Processing by Forest User Groups in the MiddleHills of Nepal[An unpublished Technical Note No. 4/95 of the Nepal Australia CommunityForestry Project, Kathmandu]. 53 pp.
Jackson W J, Tamrakar R M, Hunt S, Shepherd K R. 1998Land use changes in two middle hills districts of NepalMountain Research and Development 18 (3): 193–212
Joshi A L. 1993Effects on administration of changed forest policies in NepalIn Policy and Legislation in Community Forestry, pp. 103–114, edited by K Warnerand H Wood[Proceedings of a workshop held in Bangkok, 27–29 January 1993. RECOFTCReport 11]
Kanel K. 2004Twenty-five years of community forestry: contribution to MillenniumDevelopment GoalsIn 25 Years of Community Forestry: contributing to Millennium Development Goal,pp. 4–18, edited by K R Kanel, P. Mathema, B R Kandel, D R Niraula, A R Sharma,and M GautamKathmandu: Community Forestry Division, Department of Forests[Proceedings of the Fourth National Workshop on Community Forestry,4–6 August 2004]
138 B Acharya and S Pokharel
Kanel K and Niraula D R. 2004Can rural livelihood be improved in Nepal through community forestry?Banko Janakari 14 (1): 19–26
Kondos A. 1987The question of ‘corruption’ in NepalMankind 17 (1): 15–29
Malla Y B. 2001Changing policies and the persistence of patron–client relations in Nepal:stakeholders’ responses to changes in forest policiesEnvironment History 6 (2): 287–307
Messerschmidt D A. 1993Linking indigenous knowledge to create co-management in community forestdevelopment policy In Policy and Legislation in Community Forestry, pp. 35–48, edited by K Warner andH Wood[Proceedings of a workshop held in Bangkok, Jan 27–29 1993. RECOFTC Report 11]
NPC (National Planning Commission). 2003The Tenth Plan (Poverty Reduction Strategy Paper 2002–2007)[Summary (unofficial translation)]Kathmandu: NPC, His Majesty’s Government. 118 pp.
NPC (National Planning Commission). 2005Economic SurveyKathmandu: NPC, His Majesty’s Government, Ministry of Finance, 288 pp.
Ostrom E. 1992Crafting Institutions for Self-governing Irrigation SystemsSan Francisco: Institute for Contemporary Studies Press. 128 pp.
Paudel D P. 1994Strategies for Local Level Planned Development in Nepal: an evolution ofDecentralization Act 1982 from the local perspective [map]Kathmandu: Prabesh Pratik. 240 pp.
Pokharel B K and Nurse M. 2004Forests and people’s livelihood: benefiting the poor from community forestryJournal of Forest and Livelihood 4 (1): 19–29
Regmi M C. 1978Land Tenure and Taxation in Nepal (4 volumes)Berkeley: Institute of International Studies, University of California Press
Fifty years of forest management in Nepal 139
Sharma N N and Acharya B. 2004Good governance in Nepal’s community forestry: translating concepts intoactionsIn 25 Years of Community Forestry: contributing to Millennium Development Goal,pp. 422–432, edited by K R Kanel, P Mathema, B R Kandel, D R Niraula,A R Sharma, and M GautamKathmandu: Community Forestry Division, Department of Forests[Proceedings of the Fourth National Workshop on Community Forestry,4–6 August 2004]
Stiller L F. 1973The Rise of the House of Gorkha: a study in the unification of Nepal (1768–1816)New Delhi: Manjusri Publishing House. 388 pp.
Thapa G B and Weber K E. 1990Actors and factors of deforestation in tropical AsiaEnvironmental Conservation 17 (1): 19–27
Thomson J T and Freudenberger K S 1997.Crafting institutional arrangements for Community Forestry [Community ForestryField Manual 7]FAO (Food and Agriculture Organization), Rome.Rome: FAO
USAID (United States Agency for International Development). 2002Strengthened governance of natural resources and selected institutionsIn Assessment for Planning – Natural Resources ManagementNepal: USAID. 36 pp.
Wallace M B. 1981Solving common-property resource problems: deforestation in NepalCambridge, Massachusetts: Harvard University. 224 pp.[Doctoral thesis in Public Policy]
World Bank. 1978Nepal Staff Project Report and Appraisal of Community Forestry Developmentand Training Project[Document of the World Bank]Washington, DC: World Bank

Changes inbiodiversity
Section II

Biodiversity management and monitoringin protected areas: state-of-the-art andcurrent trends
Susanne Stoll-Kleemann and Monika Bertzky
This paper is divided into two main sections. The first outlines the develop-ment of various approaches to biodiversity management and discusses resultsfrom integrated and interdisciplinary research projects that deliver success andfailure factors of biodiversity management in biosphere reserves and protectedareas. Success factors are involvement of residents, environmental educationactivities, leadership, and active support of sustainable land-use activities suchas eco-tourism. The second part analyses recent trends in monitoringbiodiversity on the protected area. Recognition of the important impact of thesocio-economic context of protected areas on biodiversity has led to severalapproaches for integrated monitoring programmes that explicitly combinebiological and social monitoring activities. Furthermore, there is a clear trendtowards the increasing use of monitoring data as a baseline to evaluate whetherconservation measures do in fact lead to the intended conservation objectivesand, thus, conservation success. In the best case, monitoring and evaluationactivities in the protected areas give reliable proof that conservation goals areobtained. Otherwise, evaluation of the data allows adaptation of managementactivities so as to implement corrective measures for the achievement ofconservation objectives. The result of these trends has been a significantbroadening of the understanding of the term monitoring, which, in turn, hasengendered new challenges for conservationists.
For correspondence: [email protected]
7
144 S Stoll-Kleemann and M Bertzky
Introduction
Human activities continue to threaten biodiversity on a global scale, yet safe-guard mechanisms are both ineffective and inadequately funded (Stoll-Kleemann and O’Riordan 2004). Leakey and Lewin (1996) liken the currentonslaught on global biodiversity to a ‘sixth extinction’: the possibility of a majorcollapse of species and habitats at a rate 1000–10 000 times higher than naturalbackground extinction. Nearly 70% of the current land surface is either partiallyor wholly disturbed by the human beings. Sala, Chapin, Armesto, et al. (2000),extrapolating present trends, believe that global biodiversity is likely to be sub-stantially undermined by 2100. According to Pimm and Raven (2000), some 18%of the species living in the global ‘hot spots’ – within which some 30%–50% ofall species may exist (Myers, Mittermeier, Mittermeier, et al. 2000) – will be lostby 2050, even if all of those areas are fully protected. If only the existing safe-guarded sites in the hot spots remain, these authors suggest that some 40% oftheir species may disappear over the next half century. This is due both to dis-turbance and to the destructive effects of fragmentation. Add to this the impactsof climate change, and the chances of re-colonization of lost species and habitatsover the coming century by means other than through careful management be-comes quite impossible. Global biodiversity cannot be maintained without acomprehensive change in the way humans govern our planet (Stoll-Kleemannand O’Riordan 2004). Given the current biodiversity crisis, the question arises asto which kind of biodiversity management is appropriate way to stop the loss ofspecies and ecosystems.
Different approaches to biodiversity management
Biodiversity management is oriented by the opposing models of segregation andintegration. Segregating strategies rely on a system of protected areas, with eacharea being assigned a unique way of use. The integration model means combin-ing agricultural and nature conservation purposes in one area (combination) orat least in the close proximity (network). The segregation model is often criti-cized for its ‘cheese cover’ pattern of nature conservation because it has lentitself to the disadvantageous practice of allowing some environmentally harm-ful and exploitative uses of non-protected regions (Stoll-Kleemann andO’Riordan 2002b). An exclusive preference for the integration strategy, on theother hand, may damage many sensitive ecosystems. One instance of this is thereconstruction of alpine mountain zones incorporating the uses of land for rec-reational purposes with their highly damaging effects on nature. A combinationof both models, as is now being applied in new profile biosphere reserves(Batisse 1997), seems appropriate. Protected areas in their modern form (evennational parks) tolerate certain anthropogenic influences but try to minimizethem and, indeed, eliminate them completely in some core regions.
Biodiversity management and monitoring in protected areas 145
Historically, biodiversity management has been dominated by attempts toreserve places for nature and to separate human and non-human species. Ideason environmental management began to emerge in the British Empire in themid-18th century. The central strategy that arose from this environmental con-cern was the creation of reserves. The idea of conservation as something doneon reserved land was common to both North America and Europe (Averbeck2002). This earlier approach has been called ‘conservation by protected areas’(see Box 1), ‘fortress conservation’, or the ‘fences and fines approach’ (Brandonand Wells 1992). It was not until the 1980s that a broader range of stakeholders,such as local communities, began to be taken seriously as a major actor in natu-ral resource management after a plethora of studies revealed the potential roleof local collective action in irrigation, rural development, agriculture, forestry,and other fields (Barrow and Murphree 2001). In the late 1980s, the dominantparadigm of ‘fortress conservation’ was challenged by conservation practition-ers who stressed not on excluding local people, either physically from theprotected areas or politically from the conservation policy process, but on ensur-ing their participation (Averbeck 2002; Cortner and Moote 1999; McNeely 1995;Pretty and Pimbert 1995; Sinclair, Ludwig, and Clark 2000; Wells and Brandon1992; West and Brechin 1991). This concept was labelled ‘community conserva-tion’.
Community conservation can be defined as ‘those principles and practicesthat argue that conservation goals should be pursued by strategies that empha-size the role of local residents in decision-making about natural resources’(Adams and Hulme 2001). The community conservation concept has the advan-tage that it equates conservation with sustainable development and hencecaptures the huge upwelling of the policy commitment arising from theBruntland Report (Bruntland 1987) and United Nations Conferences on Envi-ronment and Development in Rio in 1992 and even in Johannesburg in 2002.This position was reinforced and emphasized during the World Parks Congress2003 in Durban, which had the title ‘Benefits beyond boundaries’. Underlyingthis is the moral argument that conservation goals should contribute to andnot conflict with, basic human needs (Davey 1998; Borrini-Feyerabend 1996;Haynes 1998; McNeely 1995, Pimbert and Pretty 1995; Venter and Breen 1998).This is in line with Article 10 of the CBD (Convention on Biological Diversity).
Box 1 Definition of biodiversity
‘Biodiversity’ or ‘biological diversity’ means the variability among livingorganisms from all sources including, inter alia, terrestrial, marine, andother aquatic ecosystems and the ecological complexes of which they arepart; this includes diversity within species, between species, and of eco-systems (CBD (Convention on Biological Diversity) Art. 2: Use of Terms).
146 S Stoll-Kleemann and M Bertzky
This argument has led some commentators to contend that traditionalmanagement of conservation using the concept of protected areas must be aban-doned because of its adverse impacts on the living conditions of the rural poor.Ideas on community conservation developed in tandem with ideas on the inte-gration between preservationist goals and the consumptive andnon-consumptive use of wildlife resources (Adams and Hulme 2001; Salafskyand Wollenberg 2000). However, problems and shortcomings encountered incommunity conservation projects (a list of implementation problems of this ap-proach can be found in Stoll-Kleemann and O’Riordan 2002a) have led to theresurrection of conservation by protected areas by a coalition of biologists andconservation bureaucrats in recent years (Van Schaik and Kramer 1997) (Box 2).
Box 2 Protected areas
The concept of the protected area (‘in situ conservation’) seeks to ensurethat both ecological diversity and varied habitats are identified, protected,and maintained, and that appropriate forms of planning and managementare put in place to guarantee that such habitats and species are safe-guarded. Protected areas are recognized as a key element in theimplementation of the United Nations CBD (Convention on Biological Diver-sity)1 ratified by 188 countries. It supports a legacy of historical legislationand international and national wildlife mandates (for example, Ramsar,World Heritage Sites, Biosphere Reserves). In the past 10 years, the numberand proportion of the earth’s surface with protected area status has morethan doubled, and the overall target of 10% of land and sea covered byprotected areas has been surpassed. These areas have been successfullylinked across international boundaries and in some cases have made sig-nificant contributions to peace. According to the IUCN (The WorldConservation Union), protected areas support the well-being of societiesthrough ‘maintaining those essential ecological processes that depend onnatural ecosystems, preserving the diversity of species and the geneticvariation within them, safeguarding habitats critical for the sustainable useof species, securing landscapes and wildlife that enrich human experiencethrough their beauty, and providing opportunities for community develop-ment, scientific research, education, training, recreation, tourism, andmitigation of the forces of natural hazards’ (IUCN, UNEP, WWF, Caringfor the Earth 1991; McNeely 1995).
Protected areas cannot be safeguarded simply by defining a boundaryon a map. They need to be integrated into larger networks of broaderlandscape mosaics that include buffer zones around them. However,
11111 The UN Convention on Biological Diversity was agreed at the Earth Summit in Rio de Janeiro in1992 and ratified in 1995.
Biodiversity management and monitoring in protected areas 147
protected areas have failed to become a truly representative system cover-ing terrestrial, freshwater, and marine biomes. For example, only 1.5% ofall lake systems in the world are protected. Protecting areas has not beenable to stop the loss of species, which continues at an intolerable rate (atotal of 111 667 species are known to be threatened with extinction globallyaccording to the 2002 IUCN Red List of the Threatened Species).
Critics claim that in the context of growing human pressures and deve-lopment needs, protected areas cannot protect the biological resourceswithin their borders (Ghimire and Pimbert 1997), and there is a wide-spread belief that parks are simply not working. Bruner, Gullison, Riceet al. (2001) have shown in a study assessing the impacts of anthropogenicthreats on 84 protected areas in 22 tropical countries – published in Science– that this claim is not substantiated. Tropical parks have been surprisinglyeffective at protecting the ecosystems and species within their borders inthe constraints of chronic under-funding and significant land-use pressure.The majority of parks are successful at stopping land clearing (arguably themost serious threat to biodiversity), and to a lesser degree, effective at miti-gating logging, hunting, fire, and grazing. Bruner, Gullison, Rice et al.(2001) conclude that parks should remain a central component of conser-vation strategies and that creating new parks and addressing the tractableproblem of making existing parks perform better will make a significantcontribution to long-term biodiversity conservation.
To comply with the CBD and with international poverty reduction goals,protected areas must be viewed as linked to their economic, social, andcultural surroundings. When considered to be a functional part of morecomprehensive planning and management schemes, protected areas be-come an opportunity for sustainable development rather than an obstacle.
Conservation concepts have also been influenced by the significant shiftsin the dominant discourses of development. During the 1970s, ‘top down’, ‘tech-nocratic’, and ‘blueprint’ approaches to development came under increasingscrutiny as they failed to deliver the promised economic growth and social ben-efits (Turner and Hulme 1997). As a result, over a period of 30 years, it becameincreasingly clear that development efforts had to entertain other factors in or-der to achieve stated goals, and among these factors is the role played byintangibles such as liberty and freedom. Nobel laureate Amartya Sen addressesthis wider debate, saying, ‘Growth of gross national product or of individual in-comes can be an important means of expanding the freedoms enjoyed by themembers of the society. But freedom also depends on other determinants, suchas social and economic arrangements as well as political and civil rights (forexample, the liberty to participate in public discussion and scrutiny)’ (Sen 1999).
Box 2 Protected areas (continued). . .
148 S Stoll-Kleemann and M Bertzky
A further influence on biodiversity management concepts was the renewedinterest in the 1980s in the market as a means of delivering development(Toye 1993). To achieve public goals (including conservation, development or‘sustainable development’), economic incentives for all main actors must be setcorrectly, and this was considered best achieved by market mechanisms(Bromley 1994). Conservation bureaucracies should promote small enterprisedevelopment rather than set up fences and levy fines. Wildlife must ‘pay itsway’.
The final influence on biodiversity management and conservation conceptsintroduced here is biological. It has become clear from research in conservationbiology and the genetics of small populations that it is often not possible toachieve conservation goals within the boundaries of protected areas, even ifthey are quite large. Large dispersal areas are needed so that species can movefrom ‘island’ to ‘island’ to feed, to ensure healthy breeding stock, and to re-spond to local extinctions and climatic change (Coe 1980; Soulé 1986; Terborgh1999). Human beings, moreover, are considered integral parts of the ecosystemsthat they inhabit and use because humans both affect and are affected by eco-system functions. Social and ecological sustainability are interdependent in thatthe sustainability of the human communities depends on the sustainability ofthe ecosystems in which they live (Cortner and Moote 1999).
A way to reconcile conservation needs with those of communities is thebiosphere reserve concept. Biosphere reserves are the areas of terrestrial andcoastal/marine ecosystems that are internationally recognized underUNESCO’s (United Nations Educational, Scientific, and Cultural Organization)MAB (Man and Biosphere) Programme. There are currently about 482 sites in102 countries. The reserves are nominated by national governments and remainunder the sovereign jurisdiction of the states where they are situated. Biospherereserves are one approach towards linking biodiversity protection to sustainablemanagement of natural resources (Chape, Blyth, Fish, et al. 2003). They consti-tute a unique set of trans-sectional natural landscapes and ecosystems, manyclosely intertwined with human settlements and forms of use. Biosphere re-serves have multiple functions – conservation, sustainable development,research and monitoring, training, and education – and, as a member of theWorld Network, share a responsibility for international co-operation.
In a biosphere reserve, people are entitled to use biological resources inaccordance with the limitations imposed in the form of defined spatial zones(Figure 1). A core zone is designated as a strict protection area where people’sconsumptive use of resources is prohibited. This zone is surrounded by one ormore buffer zones that allow use within limits that ensure protection of the corezone. The original buffer zones were designed as rings of a more or less arbi-trary width. Recently, a more sophisticated understanding of conservationbiology has led to designs with more complex spatial arrangements that includeenclaves for local communities and corridors for wildlife. It thus appeared
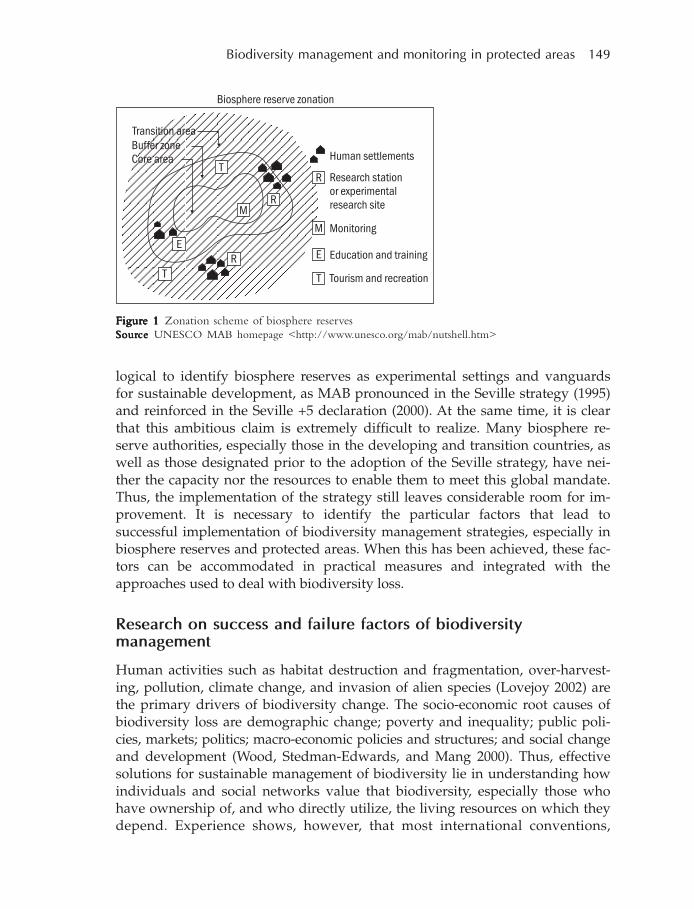
Biodiversity management and monitoring in protected areas 149
logical to identify biosphere reserves as experimental settings and vanguardsfor sustainable development, as MAB pronounced in the Seville strategy (1995)and reinforced in the Seville +5 declaration (2000). At the same time, it is clearthat this ambitious claim is extremely difficult to realize. Many biosphere re-serve authorities, especially those in the developing and transition countries, aswell as those designated prior to the adoption of the Seville strategy, have nei-ther the capacity nor the resources to enable them to meet this global mandate.Thus, the implementation of the strategy still leaves considerable room for im-provement. It is necessary to identify the particular factors that lead tosuccessful implementation of biodiversity management strategies, especially inbiosphere reserves and protected areas. When this has been achieved, these fac-tors can be accommodated in practical measures and integrated with theapproaches used to deal with biodiversity loss.
Research on success and failure factors of biodiversitymanagement
Human activities such as habitat destruction and fragmentation, over-harvest-ing, pollution, climate change, and invasion of alien species (Lovejoy 2002) arethe primary drivers of biodiversity change. The socio-economic root causes ofbiodiversity loss are demographic change; poverty and inequality; public poli-cies, markets; politics; macro-economic policies and structures; and social changeand development (Wood, Stedman-Edwards, and Mang 2000). Thus, effectivesolutions for sustainable management of biodiversity lie in understanding howindividuals and social networks value that biodiversity, especially those whohave ownership of, and who directly utilize, the living resources on which theydepend. Experience shows, however, that most international conventions,
FigurFigurFigurFigurFigure 1e 1e 1e 1e 1 Zonation scheme of biosphere reservesSourSourSourSourSourcecececece UNESCO MAB homepage <http://www.unesco.org/mab/nutshell.htm>
150 S Stoll-Kleemann and M Bertzky
national policies, and local regulatory experiments have not achieved sustain-able management of biodiversity. This is because these arrangements do notrecognize and respond to the underlying motivations of individuals and politi-cal processes. There has been a considerable progress in understanding themore proximate mechanisms generating biodiversity change such as habitatfragmentation, pollution, invasive species, as well as the effects of such changeon ecosystem functions, goods, and services. But incorporating such values intostrategies which provide incentives for the sustainable use of biodiversity re-quires the integration of measures that integrate social science principles.
One project that follows such an approach is the work of the interdiscipli-nary GoBi (Governance of Biodiversity)2 research group. In its endeavours,ecological and socio-economic data are integrated to identify important vari-ables influencing the success or failure of biodiversity management in biospherereserves and protected areas. By developing and testing a comprehensive set ofindicators, GoBi investigates which particular factors correlate with the manage-ment success or failure of biosphere reserves and protected areas. The GoBieffort combines various methods to achieve reliable and valid results. These in-clude a comprehensive literature review; a statistical meta-analysis of the casestudy literature; a global survey; a series of detailed case studies in biosphere re-serves in Cuba, South Africa, and Thailand; expert interviews, and databaseanalyses and supporting field work.
Success factors
Results from the case studies in Cuba and Thailand demonstrate concrete suc-cess factors. Guiding questions in the case studies were, ‘Is the biospherereserve concept successfully implemented in the study sites?’ and ‘Which his-torical, socio-economic, and management factors may influence successfulimplementation?’
The ‘Reserva de la Biosfera Sierra del Rosario’ is located in the lower moun-tain region of western Cuba. Established in 1984, the reserve covers an area of26 686 hectares and has a population of 5500 (2002). This biosphere reserve canbe regarded as quite successful. Concrete success factors in the regional contextare the existence of strong and positive leadership with a long continuity, involve-ment of residents, for example, in a long-lasting successful reforestation project(since 1972) and in sophisticated eco-tourism projects, and extensive and long-lasting environmental education and awareness programmes.
In the second Cuban biosphere reserve, ‘Reserva de la Biosfera Ciénaga deZapata’, which we intended to scrutinize, the time was not ripe to conduct adetailed study. Since its inception in 2000, there has been relatively slowprogress in implementing biosphere reserve concept.
22222 For more information on the background of this research project, see <www.biodiversitygovernance.de>

Biodiversity management and monitoring in protected areas 151
A success story similar to that in the first Cuban biosphere reserve exists inthe Thai Mangrove Biosphere Reserve ‘Ranong’ in south-west Thailand. Like itsCuban counterpart project, there is a strong and positive leadership with a longcontinuity. It also comprises a reforestation project (here of mangroves) thatstarted a long time ago. Also present are large-scale and long-lasting environ-mental education and awareness programmes. Taken together, these appear toform the principal components of the projects’ success (for more details on thenatural setting of the biosphere reserves, please see UNESCO-MAB BiosphereReserves Directory [UNESCO-MAB 2005]).
These conclusions are reinforced and extended by a previous study in Ger-many (Stoll-Kleemann and O’Riordan 2002a). Covering an area of 895 km2
(square kilometres), the Uckermark Lakes Nature Park is one of the largest pro-tected areas in Germany. It is situated some 80 km north of Berlin and iscomposed of a mosaic of post-glacial landscapes. The park has about 230 inter-connected lakes, heathlands, moorlands, and deciduous as well as coniferousforests. It contains species that are threatened and rare elsewhere in the middleEurope, such as otters, beavers, sea eagles, fish eagles, black storks, and manylarge butterflies. It also boasts of some 1200 plant species of which 20% arehighly endangered. This remarkable species richness is a product of the manyvariations in landscapes and vegetation types. The area has characteristicallybeen extensively managed, partly due to low population densities, and partlybecause of a history of military exclusion. The main threats to biodiversitynowadays are unsustainable forms of agriculture and intensive fishing. Tourismcan become a major threat in this ecologically sensitive region and has, there-fore, to be very carefully planned if nature conservation is to occur. TheUckermark Lakes Nature Park has 15 smaller nature conservation reserveswhere strict nature reserve management practices are followed. There are alsotwo larger landscape protection reserves, so that virtually the whole region isprotected. Nowadays, the management philosophy embraces the peaceful co-existence between nature conservation, sympathetic economic enterprise, andsustainable use of natural resources (very similar to the overall goals of bio-sphere reserves).
The Uckermark Lakes Nature Park is unusual. Its particular achievementlies in the successful integration of nature conservation and regional economicdevelopment under the visionary and charismatic leadership of the current parkdirector. This merging of objectives and adaptive management has helped tobring about reconciliation in a manner that respects both nature conservationand local sensitivities (Stoll 1999).
The administration takes the views of local people very seriously, evenwhen they speak ill of the park and its aims. The park staff has learned to beempathetic and to treat personal relations as a first priority. Park officials knowthat this process takes time, so they do not exert pressure. New conflicts havearisen, for example, disputes over hunting in the park, but officials are prepared
152 S Stoll-Kleemann and M Bertzky
to accept short-term setbacks to ensure a long-term coherent goal. TheUckermark Lakes Nature Park administration visualizes itself as a serviceagency for local interests. This extends beyond conservation management to ad-vice and financial support for farm and other enterprise schemes. These includediversification into eco-tourism and the manufacture and marketing of eco-products. Part of the drive is to build confidence and self-esteem amongst thosewho are either unemployed or looking for new opportunities. Its aim is to showthe available options so as to tailor them to the needs of individual households.
Another service concept is to gain the confidence of some local mayors andentrepreneurs to demonstrate that the park staff can work with economic andwider community interests. Demonstration projects – for example, schemes topromote the sustainable use of resources – also help to convince the sceptics.Opposition is eroded when influential actors become enthusiastic, allowingbroad objectives to be reconciled through example and good management. Inaddition, local confidence is gained when park staff personnel use bicycles, so-lar-powered boats, and go by foot when entering the strictly protected areas:practicing what they preach helps reinforce credibility. The park also runs acomprehensive programme on environmental education.
In essence, the success of this remarkable park lies in its staff who listensand cares, and constantly pursues an integrated approach and whose empa-thetic management style manifests sensitivity to people and to place. This leadsto an effective melding of understanding and management.
Failure factors
Stoll-Kleemann and O’Riordan (2002a) summarize – on the basis of a compre-hensive literature review and a case study analysis – important failure factors inbiodiversity management. Wells and Brandon (1992) note that many of the forces threatening
biodiversity lie beyond the boundary fence and involve factors over which lo-cal people have little, if any, control. Local actors are increasingly confrontedby the relentless rules of global market economics. This means that land use andagriculture are not always regulated in their own interests, forcing them togive top priority to survival rather than biodiversity (van Schaik and Kramer1997). Furthermore, the lack of necessary financial and logistical support adequateto manage protected areas (McNeely 1995) is a fundamental issue for manyadministrations and not just in poor developing countries. The forces of glo-bal market-based economics often restrict the room for financing publicsector activities. Money is often cut off in the mid-project and valuable andexperienced officers are not replaced when they leave, so goodwill evapo-rates along with empathetic communication.
A reason less represented in the literature is the apparent inability of individualsand their organizational cultures to communicate faithfully and meaningfully with
Biodiversity management and monitoring in protected areas 153
each other. Even today, many biodiversity management cultures have evolvedfrom a history of top–down relationships towards local people. This attitudeof seeming arrogance combined with an unwillingness to address local peo-ple on their own terms produces anger, resentment, and a deep unwillingnessto co-operate on the part of local interests (Stoll-Kleemann 2001). This form ofcommunication by managers, specialist scientists, and programme adminis-trators leads to a sense of alienation and misunderstanding among thosewhose interests are likely to be affected by controversial management deci-sions. This placement of communicative barriers can indeed beself-reinforcing. For example, when threatened by an aggressive challengefrom local interests, scientists and administrators frequently resort to evenmore self-protecting language. This, in turn, widens the gulf between manag-ers and the managed, making mediation, even by trained third parties, verydifficult. Much of this has to do with a lack of appreciation of local sentimentsand sensitivities.
Furthermore, there is a need for training to help all parties appreciate theirneed to be shareholders rather than stakeholders. Training is not a matter of afew days of workshops. It is essentially a function of culture change, a shift inoutlook, and a serious willingness to understand the views and aspirations ofothers. Moreover, training ought to create a fundamentally intuitive empathybetween the managers and the managed. Such empathy can only come aboutthrough case experience and a genuine willingness to reach out and admit topast mistakes.
Finally, the social relations of the individual actors should not be overlooked. Alltoo often, research and publication ignore this sensitive area of social-psy-chology-oriented management. In many cases, miscommunication andmistrust are the products of individuals who simply dislike each other orhave no faith in each other’s abilities. These interpersonal relationships mayoverride the organizational setting and management responsibilities of the in-stitutions in which these individuals operate. But at times, these interpersonalstruggles become so significant for coherent management that they dragthese self-same organizations into conflict. The lesson we learn from this isthat organizations need to have sophisticated intelligence as to how their em-ployees are perceived in any participatory framework. Sometimes this task isbest left to independent facilitators to discover and to address diplomatically.At other times, this is a sensitive management issue for senior administratorsto tackle.
Biodiversity monitoring
Protected area managers plan, implement, and control a broad range of activi-ties on administrative as well as research and outreach levels. For examplefunds must be raised, acceptance and environmental education need to be
154 S Stoll-Kleemann and M Bertzky
pushed forward, working conditions for protected area staff need to be assured,and the staff itself needs to be managed. Furthermore, monitoring activities areincreasingly regarded essential and thus in many cases play an important role inthe management of protected areas. Traditionally, the term ‘biodiversity moni-toring’ mainly refers to checking, observing, and recording information about atarget in focus over a period of time (CWF 2005; UCIPM 2003), and in the fieldof biodiversity conservation in protected areas, this activity has concentratedprimarily on biological features.
The understanding of the term ‘monitoring’, however, has undergone akind of evolutionary process, adapting itself in parallel to the development ofthe still comparably young scientific discipline of biodiversity management. To-day, and increasingly often, the meaning of the term extends far beyond thepure information-gathering process. Strategic concepts of biodiversity and con-servation management are intertwined and thus shed a new light on the task ofconducting monitoring activities in conservation. Furthermore, a recent trendtowards additional monitoring of socio-economic factors in and around pro-tected areas can be observed (Stem, Margoluis, Salafsky, et al. 2003). This trendis rooted in a growing recognition of the close linkage between the socio-eco-nomic context and conservation success in protected areas. Illegal poaching andlogging activities may, for example, hinder progress towards conservation goals.On the other hand, increased acceptance and support by local communities inand around protected areas may be very helpful.
In response to this recognition, integrated monitoring programmes havebeen developed. A popular example is represented by the BRIM (BiosphereReserve Integrated Monitoring) approach (Lass and Reusswig 2002). For biospherereserves, monitoring activities in various disciplines are of crucial importance asthey explicitly aim to reconcile biodiversity conservation and sustainable devel-opment. Key dimensions for social monitoring include, socio-demographiccharacteristics of the population living in or close to the biosphere reserve andforms and degrees of the use of ecosystem goods and services (Lass andReusswig 2002). Since identical or similar conditions frequently exist in andaround different classification types of protected areas, the development andimplementation of integrated monitoring systems can be regarded as a generaltrend in biodiversity management. Consequently, the monitoring issue in con-servation science has become ever more complex.
The UNDP (United Nations Development Programme) defines monitoring as‘a continuing function that aims primarily to provide managers and mainstakeholders with regular feedback and early indications of progress or lackthereof in the achievement of intended results. Monitoring tracks the actualperformance or situation against what was planned or expected according topre-determined standards. Monitoring generally involves collecting andanalysing data on implementation processes, strategies, and results, andrecommending corrective measures’ (UNDP 2002).
Biodiversity management and monitoring in protected areas 155
This extensive definition fills a gap in the monitoring discussion betweenconservation scientists as it clearly describes and stresses the ultimate sense andcomponents of monitoring activities. Without these, monitoring activities couldalso be named ‘measuring’ or ‘observation’ activities over time, thus losing anyrelation to effectiveness and progress issues in protected area management. Butit is exactly these issues that are gaining ever more attention in biodiversity andconservation management. Sheil (2002) explains the reason for this increasedattention in two clear and concise comments.1 Measuring is not protecting.2 Protected areas must be managed to protect the values they contain,
and not to provide statistics (Sheil 2002).Of course, providing statistics can be of high value: by using them as a po-
litical tool to stress the urgency of conservation activities or by presenting redlists of endangered species (Ibisch, Nowicki, Müller, et al. 2002; Keller andBollmann 2004).
Nevertheless, with fund raising becoming ever more difficult these days asa consequence of reduced financial resources for conservation (James, Gaston,and Balmford 2001), there is an increasing necessity to demonstrate accountabil-ity for effective and efficient use of financial inputs towards intendedconservation results. If funding institutions are not convinced about theirmoney being spent judiciously, further support will not be forthcoming. In addi-tion, and equally important, exactly this information is needed by the protectedarea managers to control, adapt, and improve their management. Adaptivemanagement systems are increasingly rated essential for successful conserva-tion of biodiversity (Day, Hockings, and Jones 2002). Moreover, the achievementof maximum efficacy in managing protected areas should be of highest prioritywhen considered in view of two important facts.1 We are living in an era in which pressures on natural resources doubtlessly
essential for human well-being are constantly rising despite growing conser-vation efforts. This trend is repeatedly affirmed by the world’s biggestassessment projects such as the Global Environmental Outlook 3 (UNEP2002) and the Millennium Ecosystem Assessment (MEA 2005).
2 Protected areas are indicators of success in achieving the Millennium Devel-opment Goal 7 (ensuring environmental sustainability), Target 9 (integratethe principles of sustainable development into country policies and pro-grammes and reverse the loss of environmental resources), and Indicator 263
(land area protected to maintain biological diversity) (Chape, Harrison,Spalding, et al. 2005).
33333 Indicator 26: Ratio of area protected to maintain biological diversity to surface area. It is defined asnationally protected area as a percentage of total surface area of a country. The generally acceptedIUCN (the World Conservation Union) definition of a protected area is an area of land or sea dedicatedto the protection and maintenance of biological diversity and of natural and associated culturalresources and is managed through legal or other effective means (World Bank 2004).
156 S Stoll-Kleemann and M Bertzky
For a detailed definition of protected area management effectiveness,please see Hockings, Stolton, and Dudley (2000).
As long as many of the designated protected areas are rather paper parks4
than safeguards for the values they contain, their use as indicators for success ismisleading and paints an inaccurate picture. Consequently, increasing attentionis being paid to the adequate and efficient use of monitoring data as a primarysource for managers of protected areas to check the performance of conserva-tion projects and programmes and let the results feed into decision-making andplanning processes.
Because the term monitoring is usually not understood as comprehen-sively as defined by the UNDP (2002), it is appearing with increasing frequencyin combination with the term ‘evaluation’. The compound phrase is seen as en-compassing the issue in its entirety.
This collocation in its broadest sense can be simply defined as ‘to assess orjudge the value or worth of something’ (Guijt and Woodhill 2002) and thus indi-rectly relates to the last point of the UNDP definition. Without an assessment ofthe usefulness and efficacy of management activities in conservation, no correc-tive measures can be recommended. Regarded from a protected areamanagement perspective, this refers to a policing attitude of managers towardsthe plans they design and activities they implement. The rationale for conduct-ing ‘monitoring and evaluation’ activities thus clearly reflects and feeds into theprinciples of an adaptive management strategy. With respect to the dynamics ofnatural systems, an adaptive management for protected areas is increasinglyrecognized as being essential for protected area success (Day, Hockings, andJones 2002; Salafsky, Margoluis, Redford, et al. 2002; WWF 2004b).
With management effectiveness becoming a keyword in conservationscience, there is growing recognition ‘that good project management is inte-grally linked to well-designed monitoring and evaluation systems’ (Stem,Margoluis, Salafsky, et al. 2005). Experience from practice has also exhibitedeven more: a survey of more than 200 forest protected areas in 37 countries con-ducted by World Wide Fund for Nature suggests that a good M&E (monitoringand evaluation) system closely correlates to those protected areas wherebiodiversity is best being conserved (WWF 2004a).
As a matter of fact, adaptive management is rarely implemented in prac-tice despite the worldwide recognition of its importance (Gregg, Chase, Geupelet al. 2003). Monitoring activities are undertaken at an increasing number ofsites, but many of these established monitoring programmes unfortunately lackadequate design and statistical rigour (Block, Franklin, Ward, et al. 2001). Fur-thermore, in those protected areas that declare that they conduct monitoring, itoften remains unsure whether those activities are actually in conformity withthe UNDP definition of the term.
44444 A legally established protected area where experts believe current protection activities are insufficientto halt degradation.
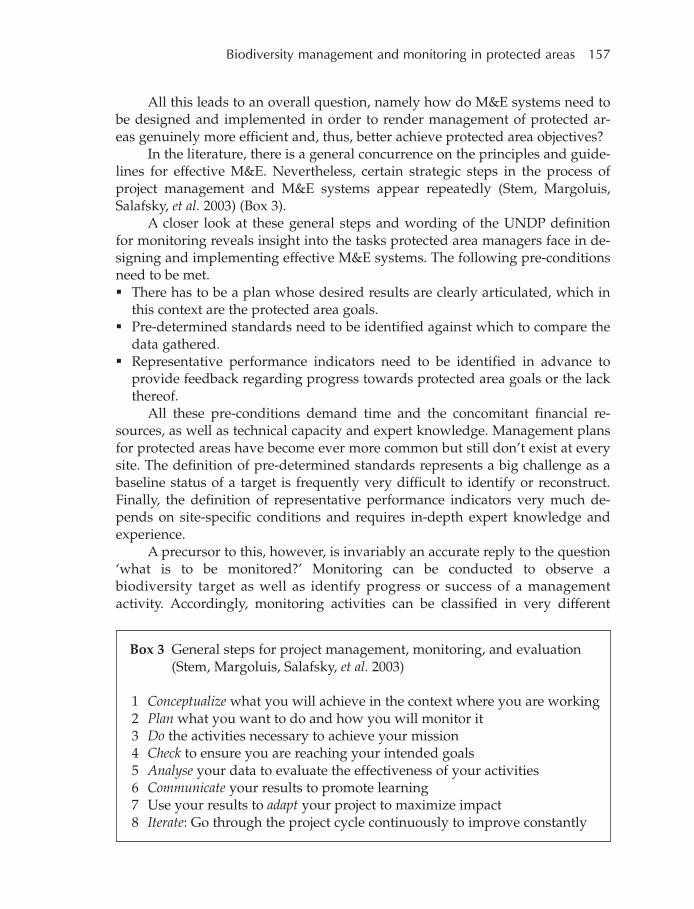
Biodiversity management and monitoring in protected areas 157
All this leads to an overall question, namely how do M&E systems need tobe designed and implemented in order to render management of protected ar-eas genuinely more efficient and, thus, better achieve protected area objectives?
In the literature, there is a general concurrence on the principles and guide-lines for effective M&E. Nevertheless, certain strategic steps in the process ofproject management and M&E systems appear repeatedly (Stem, Margoluis,Salafsky, et al. 2003) (Box 3).
A closer look at these general steps and wording of the UNDP definitionfor monitoring reveals insight into the tasks protected area managers face in de-signing and implementing effective M&E systems. The following pre-conditionsneed to be met. There has to be a plan whose desired results are clearly articulated, which in
this context are the protected area goals. Pre-determined standards need to be identified against which to compare the
data gathered. Representative performance indicators need to be identified in advance to
provide feedback regarding progress towards protected area goals or the lackthereof.
All these pre-conditions demand time and the concomitant financial re-sources, as well as technical capacity and expert knowledge. Management plansfor protected areas have become ever more common but still don’t exist at everysite. The definition of pre-determined standards represents a big challenge as abaseline status of a target is frequently very difficult to identify or reconstruct.Finally, the definition of representative performance indicators very much de-pends on site-specific conditions and requires in-depth expert knowledge andexperience.
A precursor to this, however, is invariably an accurate reply to the question‘what is to be monitored?’ Monitoring can be conducted to observe abiodiversity target as well as identify progress or success of a managementactivity. Accordingly, monitoring activities can be classified in very different
Box 3 General steps for project management, monitoring, and evaluation(Stem, Margoluis, Salafsky, et al. 2003)
1 Conceptualize what you will achieve in the context where you are working2 Plan what you want to do and how you will monitor it3 Do the activities necessary to achieve your mission4 Check to ensure you are reaching your intended goals5 Analyse your data to evaluate the effectiveness of your activities6 Communicate your results to promote learning7 Use your results to adapt your project to maximize impact8 Iterate: Go through the project cycle continuously to improve constantly
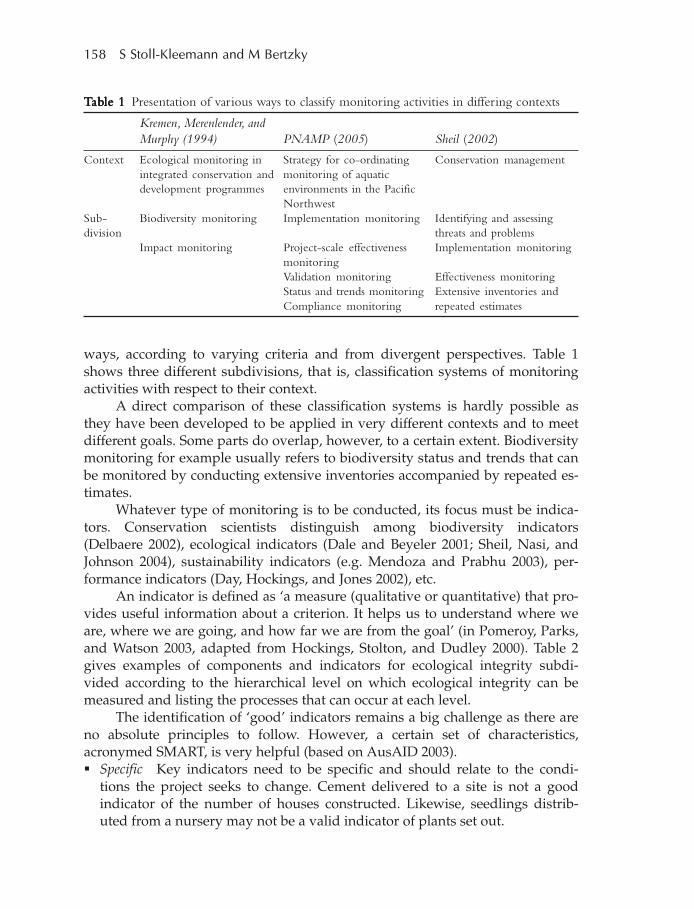
158 S Stoll-Kleemann and M Bertzky
ways, according to varying criteria and from divergent perspectives. Table 1shows three different subdivisions, that is, classification systems of monitoringactivities with respect to their context.
A direct comparison of these classification systems is hardly possible asthey have been developed to be applied in very different contexts and to meetdifferent goals. Some parts do overlap, however, to a certain extent. Biodiversitymonitoring for example usually refers to biodiversity status and trends that canbe monitored by conducting extensive inventories accompanied by repeated es-timates.
Whatever type of monitoring is to be conducted, its focus must be indica-tors. Conservation scientists distinguish among biodiversity indicators(Delbaere 2002), ecological indicators (Dale and Beyeler 2001; Sheil, Nasi, andJohnson 2004), sustainability indicators (e.g. Mendoza and Prabhu 2003), per-formance indicators (Day, Hockings, and Jones 2002), etc.
An indicator is defined as ‘a measure (qualitative or quantitative) that pro-vides useful information about a criterion. It helps us to understand where weare, where we are going, and how far we are from the goal’ (in Pomeroy, Parks,and Watson 2003, adapted from Hockings, Stolton, and Dudley 2000). Table 2gives examples of components and indicators for ecological integrity subdi-vided according to the hierarchical level on which ecological integrity can bemeasured and listing the processes that can occur at each level.
The identification of ‘good’ indicators remains a big challenge as there areno absolute principles to follow. However, a certain set of characteristics,acronymed SMART, is very helpful (based on AusAID 2003). Specific Key indicators need to be specific and should relate to the condi-
tions the project seeks to change. Cement delivered to a site is not a goodindicator of the number of houses constructed. Likewise, seedlings distrib-uted from a nursery may not be a valid indicator of plants set out.
TTTTTababababable 1le 1le 1le 1le 1 Presentation of various ways to classify monitoring activities in differing contexts
Kremen, Merenlender, andMurphy (1994) PNAMP (2005) Sheil (2002)
Context Ecological monitoring in Strategy for co-ordinating Conservation managementintegrated conservation and monitoring of aquaticdevelopment programmes environments in the Pacific
NorthwestSub- Biodiversity monitoring Implementation monitoring Identifying and assessingdivision threats and problems
Impact monitoring Project-scale effectiveness Implementation monitoringmonitoringValidation monitoring Effectiveness monitoringStatus and trends monitoring Extensive inventories andCompliance monitoring repeated estimates
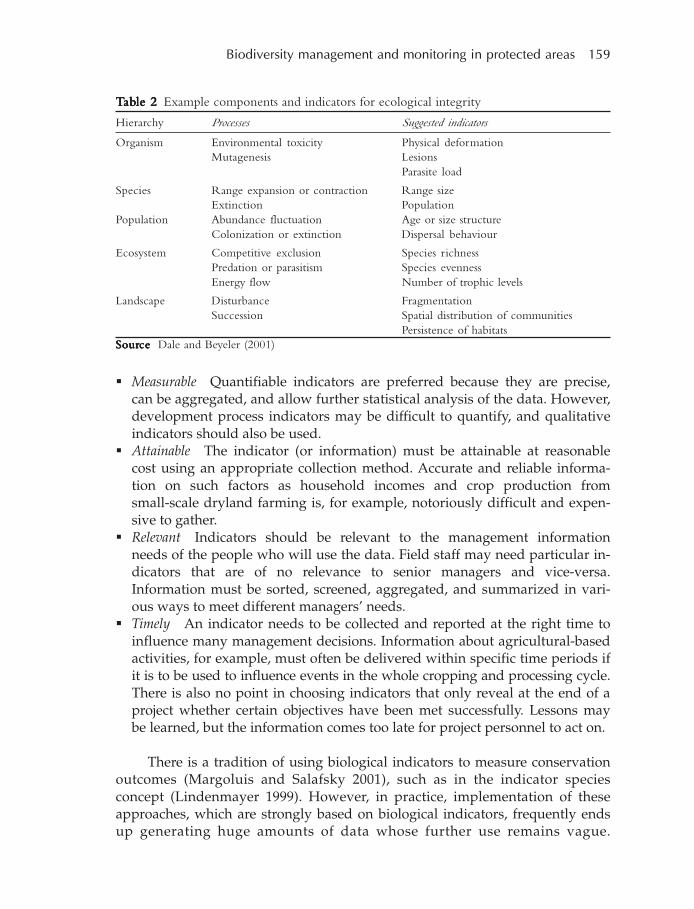
Biodiversity management and monitoring in protected areas 159
Measurable Quantifiable indicators are preferred because they are precise,can be aggregated, and allow further statistical analysis of the data. However,development process indicators may be difficult to quantify, and qualitativeindicators should also be used.
Attainable The indicator (or information) must be attainable at reasonablecost using an appropriate collection method. Accurate and reliable informa-tion on such factors as household incomes and crop production fromsmall-scale dryland farming is, for example, notoriously difficult and expen-sive to gather.
Relevant Indicators should be relevant to the management informationneeds of the people who will use the data. Field staff may need particular in-dicators that are of no relevance to senior managers and vice-versa.Information must be sorted, screened, aggregated, and summarized in vari-ous ways to meet different managers’ needs.
Timely An indicator needs to be collected and reported at the right time toinfluence many management decisions. Information about agricultural-basedactivities, for example, must often be delivered within specific time periods ifit is to be used to influence events in the whole cropping and processing cycle.There is also no point in choosing indicators that only reveal at the end of aproject whether certain objectives have been met successfully. Lessons maybe learned, but the information comes too late for project personnel to act on.
There is a tradition of using biological indicators to measure conservationoutcomes (Margoluis and Salafsky 2001), such as in the indicator speciesconcept (Lindenmayer 1999). However, in practice, implementation of theseapproaches, which are strongly based on biological indicators, frequently endsup generating huge amounts of data whose further use remains vague.
TTTTTababababable 2le 2le 2le 2le 2 Example components and indicators for ecological integrity
Hierarchy Processes Suggested indicators
Organism Environmental toxicity Physical deformationMutagenesis Lesions
Parasite load
Species Range expansion or contraction Range sizeExtinction Population
Population Abundance fluctuation Age or size structureColonization or extinction Dispersal behaviour
Ecosystem Competitive exclusion Species richnessPredation or parasitism Species evennessEnergy flow Number of trophic levels
Landscape Disturbance FragmentationSuccession Spatial distribution of communities
Persistence of habitatsSourSourSourSourSourcecececece Dale and Beyeler (2001)

160 S Stoll-Kleemann and M Bertzky
Additionally, the indicators measured often lack a direct linkage to the intendedprotected area objectives. At times, there are even external researchers needed tocope with the magnitude of work that these monitoring activities demand. Inthe worst case, protected area staff feels even distracted by monitoring activitiesand hindered from ‘getting the “real” work done’ (Margoluis and Salafsky2001). This can especially be observed when monitoring activities are third-party funded, requiring the protected area staff to undertake monitoring for theinterest of an external stakeholder, consuming working time to the detriment oftheir activities to achieve the protected area objectives (Sheil 2002).
Therefore, first approaches have explicitly been developed to avoid collec-tion of huge amounts of data, over-complexity, and the dependence on outsideresearchers to get the magnitude of work done, such as the TRA (threat reduc-tion assessment) (Margoluis and Salafsky 2001) and TNC’s (The NatureConservancy’s) ‘measuring success’ framework (TNC 2002). The proposed TRAapproach allows calculation of a TRA index by identifying threats, ranking themaccording to specific criteria, and assessing progress in the reduction of each ofthem. This TRA index can be seen as an indirect measurement of conservationsuccess (Margoluis and Salafsky 2001). In the TNC’s ‘measuring success’ frame-work, protected area functionality is defined by first identifying four generalstandards of site consolidation5 (TNC 2002): (1) basic on-site protection activi-ties; (2) long-term management capacity; (3) long-term financing for basic sitemanagement; and (4) a supportive local constituency for the site. Within thesefour categories, TNC, USAID (United States Agency for International Develop-ment), and partners identified 16 indicators that collectively compose what iscalled the ‘parks in peril consolidation scorecard’. Applying this scorecard,progress towards the goals of the parks in peril programme can be assessed(TNC 2002). This type of repeated observation and data gathering that com-prises the designated methods of analysis represents the latest approach toconducting M&E in protected areas. It is effective yet consumes less time andcost than earlier mechanisms. There is an ongoing research in this field, andnew insights and novel systems for effective M&E can be expected in the future.
With monitoring becoming a popular issue in biodiversity conservation,there has been a growing demand for transparency in conservation and datasharing for scientific benefit. The response has been the launching of several ini-tiatives, a small selection of which is presented here. In the year 2000, the UNEP(United Nations Environment Programme) established the UNEP–WCMC(World Conservation Monitoring Centre)6 to ‘provide information for policy andaction to conserve the living world’. Information available is subdivided into
55555 A consolidated site is one that has the tools, infrastructure, and staff to deal with current threats andmanagement challenges, as well as the capacity to respond to threats that arise in the future (TNC2002).
6 Details available at <http://www.unep-wcmc.org/>
Biodiversity management and monitoring in protected areas 161
habitats, species, and protected areas, and data can be downloaded according tothe thematic context in the form of maps, tables, and reports. Similarly, the GBIF(Global Biodiversity Information Facility), an international non-profit organiza-tion, provides free and universal access to data regarding the world’sbiodiversity.7 Furthermore, several other sources offer freely accessible monitor-ing data, frequently either taxonomically or geographically focused. BirdLifeInternational8, for example, works exclusively with birds but on a global cover-age, whereas NatureServe9 sets its attention on both rare and endangeredspecies in general as well as on threatened ecosystems with a geographical fo-cus on the USA, Canada, Latin America, and the Caribbean. Additionally,partnerships of organizations have been established to share knowledge and ex-perience on M&E and benefit from each other, such as the ‘conservationmeasures partnership,’ whose objective is to ‘seek better ways to design, man-age, and measure the impacts of their conservation actions’.10
There is still a long way to go towards transforming all the paper parks ofthis planet into effectively managed protected areas successfully engaged in thetask of conservation. Nevertheless, worldwide achievements in this directionand the growing number of initiatives spreading knowledge and informationand improving the success rate of protected areas seem to justify optimism thatuse of the term ‘paper parks’ may at least gradually lose some of its relevance.The vision of the term ‘sinking completely into oblivion’, however, still remainsoverly romantic.
Acknowledgement
The authors thank the Robert Bosch Foundation for funding the GoBi project.
References
Adams W M and Hulme D. 2001Conservation and communities: changing narratives, policies and practices inAfrican conservationIn African Wildlife and Livelihoods. The Promise and Performance of CommunityConservation, pp. 9–23, edited by D Hulme and M MurpheeOxford: James Currey. 320 pp.
AusAID. 2003AusGUIDElines - 1. The Logical Framework ApproachCanberra: The Australian Government
7 Details available at <http://www.gbif.net/portal/index.jsp>8 Details available at <http://www.birdlife.net/>9 Details available at <http://www.natureserve.org/index.jsp>10 Details available at <http://www.conservationmeasures.org/CMP/>
162 S Stoll-Kleemann and M Bertzky
Averbeck C. 2002Population ecology of Impala and community-based conservation in UgandaMunich: Technical University of Munich, 190 pp [Doctoral thesis submitted to theDepartment of Nutrition, Land Use and Environment]Details available at<http://tumb1.biblio.tu-muenchen.de/publ/diss/ww/2002/averbeck.html>
Barrow E and Murphree M. 2001Community conservationIn African Wildlife and Livelihoods. The Promise and Performance of CommunityConservation, pp. 24–37, edited by D Hulme and M MurphreeOxford: James Currey. 320 pp.
Batisse M. 1997Biosphere reserves. A challenge for biodiversity conservation and regionaldevelopmentEnvironment 39(5): 7–33
Block W M, Franklin A B, Ward J P J, Ganey J L, White G C. 2001Design and implementation of monitoring studies to evaluate success ofecological restoration on wildlifeRestoration Ecology 9(3): 293–303
Borrini-Feyerabend G. 1996Collaborative Management of Protected Areas: tailoring the approach to the contextGland and Cambridge: IUCN (The World Conservation Union): 67 pp.
Brandon K and Wells M. 1992Planning for people and parks: design dilemmasWorld Development 20(4): 557–570
Bromley D W. 1994Economic dimensions of community-based conservationIn Natural Connections: perspectives on community-based conservation, pp. 428–447,edited by D Western and R M WrightWashington, DC: Island Press. 581 pp.
Bruner A G, Gullison R E, Rice R E, da Fonseca G A B. 2001Effectiveness of parks in protecting tropical biodiversityScience 291(5501): 125–128.
Bruntland G (ed.). 1987Our Common Future: the world commission on environment and developmentOxford: Oxford University Press. 398 pp.
Biodiversity management and monitoring in protected areas 163
Chape S, Blyth S, Fish L, Fox P, Spalding M. 20032003 United Nations List of Protected AreasGland and Cambridge: IUCN (The World Conservation Union) and UNEP (UnitedNations Environment Programme)–WCMC (World Conservation MonitoringCenter). ix + 44 pp.
Chape S, Harrison J, Spalding M, Lysenko I. 2005Measuring the extent and effectiveness of protected areas as an indicator formeeting global biodiversity targetsPhilosophical Transactions of the Royal Society B 360: 443–455.
Coe M. 1980African wildlife resourcesIn Conservation Biology, pp. 273–302, edited by M E Soulé and B A WilcoxSunderland, Massachusetts: Sinauer Associates Inc. 395 pp.
Cortner H J and Moote M A. 1999The Politics of Ecosystem ManagementWashington, DC, Covelo, California: Island Press. 224 pp.
CWF (Canadian Wildlife Federation). 2005Space for species: glossaryDetails available at <http://www.spaceforspecies.ca>, last accessed in May 2005
Dale V H and Beyeler S C. 2001Challenges in the development and use of ecological indicatorsEcological Indicators 1 (1): 3–10
Davey A G. 1998National System Planning for Protected AreasGland and Cambridge: IUCN (The World Conservation Union)x + 71 pp.
Day J, Hockings M, and Jones G. 2002Measuring effectiveness in marine protected areas—principles and practice[Keynote presentation in aquatic protected areas. What works best and how do weknow?][Paper presented at the World Congress on Aquatic Protected Areas, Cairns,Australia, August 2002]
Delbaere B. 2002Biodiversity Indicators and Monitoring: moving towards implementationTilburg/Budapest: ECNC (European Centre for Nature Conservation).35 pp. + annexes

164 S Stoll-Kleemann and M Bertzky
Ghimire K B and Pimbert M P (eds). 1997Social Change and Conservation: environmental politics and impacts of nationalparks and protected areasLondon: Earthscan. 240 pp.
Gregg E, Chase M, Geupel G, Cohen E. 2003Developing and Implementing an Adaptive Conservation Strategy: a guide forimproving adaptive management and sharing the learning of conservationpractitionersMarin, CA: Point Reyes Bird Observatory Conservation Science. vii + 64 pp.
Guijt I and Woodhill J. 2002Managing for Impact in Rural Development — A Guide for Project M&ERome: International Fund for Agricultural Development, Office of Evaluation andStudies. xviii + pp. 1.1–8.28
Hockings M, Stolton S, and Dudley N. 2000Evaluating Effectiveness: a framework for assessing the management of protectedareas, vol. 6Glandand Cambridge: IUCN (The World Conservation Union). x + 121 pp.
Ibisch P L, Nowicki C, Müller R, Araujo N. 2002Methods for the assessment of habitat and species conservation in data-poorcountries: case study of the Pleurothallidinae (Orchidaceae) of the Andean rainforests of Bolivia[Paper presented at the Proceedings of the first international congressConservation of Biodiversity in the Andes and the Amazon Basin, Cusco, Peru, 24–28September 2001, organized by Centro Bartholomé de las Casas - CBC, Cusco, Peru;Fundación Científica San Francisco - FCSF, Del Mar, USA; Loja, Ecuador; Munich,Germany; International Network für biodiversity and culture diversity - INKA,Munich, Germany]
IUCN (The World Conservation Union), UNEP (United Nations EnvironmentProgramme), WWF (World Wide Fund for Nature), Caring for the Earth. 1991A Strategy for Sustainable LivingGland: IUCN/UNEP/WWF. 228 pp.
James A, Gaston K J, and Balmford A. 2001Can we afford to conserve biodiversityBioScience 51(1): 43–52
Keller V and Bollmann K. 2004From red lists to species of conservation concernConservation Biology 18(6): 1636–1644
Biodiversity management and monitoring in protected areas 165
Kremen C, Merenlender A M, and Murphy D D. 1994Ecological monitoring: a vital need for integrated conservation and developmentprograms in the tropicsConservation Biology 8(2): 388–397
Lass W and Reusswig F (eds). 2002Social Monitoring: meaning and methods for an integrated management inbiosphere reservesParis: UNESCO[Report of an International Workshop, Rome, 2–3 September 2001]Details available at <www.unesco.org/mab/brim/backgr.htm>
Leakey R and Lewin R. 1996The Sixth Extinction: biodiversity and its survivalLondon: Phoenix: 288 pp.
Lindenmayer D B. 1999Future directions for biodiversity conservation in managed forests: indicatorspecies, impact studies and monitoring programsForest Ecology and Management 115 (2–3): 277–287
Lovejoy T E. 2002Biodiversity: threats and challengesIn Biodiversity, Sustainability and Human Communities. Protecting Beyond the Protected,pp. 33–45, edited by T O‘Riordan and S Stoll-KleemannCambridge: Cambridge University Press. 317 pp.
Margoluis R and Salafsky N. 2001Is Our Project Succeeding? A Guide to Threat Reduction Assessment forConservationWashington, DC. 52 pp.
McNeely J A (ed.). 1995Expanding Partnerships in ConservationWashington, DC: Island Press. 386 pp.
MEA (Millennium Ecosystem Assessment). 2005Ecosystems and Human Well-being: synthesisWashington, DC: Island Press. x + 137 pp.
Mendoza G A and Prabhu R. 2003Fuzzy methodologies for assessing criteria and indicators of sustainable forestmanagementEcological Indicators 3: 227–236
166 S Stoll-Kleemann and M Bertzky
Myers N, Mittermeier R A, Mittermeier K G, da Fonseca G A P, Kent J. 2000Biodiversity hotspots for conservation prioritiesNature 403: 853–858
Pimbert M P and Pretty J N. 1995Parks, People and Professionals. Putting Participation into Protected AreaManagementGeneva: United Nations Research Institute for Social Development. 60 pp.
Pimm S L and Raven P. 2000Extinction by numbersNature 403: 843–845
PNAMP (Pacific Northwest Aquatic Monitoring Partnerships). 2005The Pacific Northwest Aquatic Monitoring Partnership’s Strategy ForCoordinating Monitoring of Aquatic Environments in the Pacific Northwest(Northern California, Oregon, Idaho, Washington)Details available at <http://www.reo.gov/PNAMP/Products/PNAMP%20Strategy%20February%202005.pdf>, I + 17 pp.
Pomeroy R S, Parks J E, and Watson L M. 2003How is Your MPA Doing? A Guidebook of Natural and Social Indicators forEvaluating Marine Protected Area Management EffectivenessGland and Cambridge: IUCN (The World Conservation Union). xvi + 216 pp.
Pretty J N and Pimbert M P. 1995Beyond conservation ideology and the wilderness mythNatural Resources Forum 19: 5–14
Sala O E, Chapin III F S, Armesto J J, Berlow E, Bloomfield J, Dirzo R, Huber-Sanwald E, Huenneke L F, Jackson R B, Kinzig A, Leemans R, Lodge D M, MooneyH A, Oesterheld M, LeRoy N. 2000Global biodiversity scenarios for the year 2100Science 287: 1770–1774
Salafsky N and Wollenberg E. 2000Linking livelihoods and conservation: a conceptual framework and scale forassessing the integration of human needs and biodiversityWorld Development 28 (8): 1431–1438
Salafsky N, Margoluis R, Redford K H, Robinson J G. 2002Improving the practice of conservation: a conceptual framework and researchagenda for conservation scienceConservation Biology 16 (6): 1469–1479
Sen A. 1999Development as FreedomOxford: Oxford University Press. 382 pp.
Biodiversity management and monitoring in protected areas 167
Sheil D. 2002Why doesn’t biodiversity monitoring support conservation priorities in thetropics?Unasylva 209 (53): 50–54
Sheil D, Nasi R, and Johnson B. 2004Ecological criteria and indicators for tropical forest-landscapes: challenges in thesearch for progressEcology and Society 9 (1): 7
Sinclair A R, Ludwig D, and Clark C W. 2000Conservation in the real worldScience 289: 1875
Soulé M E (ed.). 1986Conservation Biology: the science of scarcity and diversitySunderland, Massachusetts: Sinauer Assoc. 584 pp.
Stem C, Margoluis R, Salafsky N, Brown, M. 2005Monitoring and evaluation in conservation: a review of trends and approachesConservation Biology 19 (2): 195–309
Stem C, Margoluis R, Salafsky N, Brown M, FOS (Foundations of Success), WCS(Wildlife Conservation Society), CI (Conservation International). 2003A review of monitoring and evaluation approaches and lessons learned inconservation: summary results from the measuring conservation impactinitiative[Paper presented at the IUCN World Parks Congress: benefit beyond boundaries,Durban, South Africa, 8–18 September 2003]
Stoll S. 1999Akzeptanzprobleme bei der Ausweisung von GroßschutzgebietenFrankfurt am Main: Lang. 268 pp.
Stoll-Kleemann S. 2001Reconciling opposition to protected areas management in Europe: the GermanexperienceEnvironment 43: 32–44
Stoll-Kleemann S and O’Riordan T. 2002aFrom participation to partnership in biodiversity protection: experience fromGermany and South AfricaSociety and Natural Resources 15: 161–177
Stoll-Kleemann S and O’Riordan T. 2002bEnhancing biodiversity and humanityIn Biodiversity, Sustainability and Human Communities, pp. 295–310, edited by
168 S Stoll-Kleemann and M Bertzky
T O’Riordan and S Stoll-KleemannCambridge: Cambridge University Press. 317 pp.
Stoll-Kleemann S and O’Riordan T. 2004Global biodiversity and conflict resolution. The possible role of public privatepartnershipsIHDP Newsletter 3 (2004): 6–8
Terborgh J. 1999Requiem for NatureNew York: Island Press. 246 pp.
TNC (The Nature Conservancy). 2002Measuring Success: the parks in peril site consolidation scorecard manualArlington, Virginia: The Nature Conservancy, USAID (United States Agency forInternational Development). 22 pp.
Toye E J. 1993Dilemmas of DevelopmentOxford: Basil Blackwell. 177 pp.
Turner M and Hulme D. 1997Governance, Administration and Development: making the state workLondon: Macmillan
UCIPM (University of California Statewide Integrated Pest Management Program).2003UCIPM online – GlossaryDetails available at <http://www.ipm.ucdavis.edu/PMG/glossary.html#M>,last accessed on 9 May 2005
UNDP (United Nations Development Programme). 2002Handbook on Monitoring and Evaluating for ResultsNew York: United Nations Development Program Evaluation Office. v + 140 pp.
UNEP (United Nations Environment Programme). 2002Global Environmental Outlook 3London: Earthscan Publications Ltd. xxxiii + 426 pp.
UNESCO (United Nations Educational, Scientific and Cultural Organization)–MAB (Man and Biosphere). 2005Biosphere Reserves Directory 2005
Van Schaik C and Kramer R. 1997Towards a new protection paradigmIn Last Stand: protected areas and the defence of tropical biodiversity, pp. 212–230,edited by R Kramer, C van Schaik, and J JohnsonNew York: Oxford University Press. 256 pp.
Biodiversity management and monitoring in protected areas 169
Venter A K and Breen C M. 1998.Partnership forum framework: participative framework for protected areaoutreachEnvironmental Management 22: 803–815
Wells M and Brandon K. 1992People and Parks: linking protected area management with local communitiesWashington, DC: The International Bank for Reconstruction and Development/TheWorld Bank. 99 pp.
West P C and Brechin S R. 1991Resident People and National Parks. Social Dilemmas and Strategies inInternational ConservationTuscon: The University of Arizona Press. 443 pp.
Wood A, Stedman-Edwards P, and Mang J. 2000The Root Causes of Biodiversity LossLondon: Earthscan. 304 pp.
World Bank. 2004Millennium Development Goals—about the goalsDetails available at <http://ddp-ext.worldbank.org/ext/MDG/content/html/26.htm, last accessed in June 2005
WWF (World Wildlife Fund). 2004aAre Protected Areas Working? An Analysis of Forest Protected Areas by WWFGland: WWF. 32 pp.
WWF (World Wildlife Fund). 2004bHow Effective are Protected Areas? A Preliminary Analysis of Forest ProtectedAreas by WWF – the Largest Ever Global Assessment of Protected AreaManagement EffectivenessGland: WWF. 24 pp.
170 B F Rodrigues
Biodiversity loss and its impacts on ruralhealth / alternate systems of medicine
B F Rodrigues
There is possibly no single argument, which by itself provides sufficientgrounds for attempting to maintain all existing biological diversity. A moregeneral and pragmatic approach, however, recognizes that different but equallyvalid arguments – viz., resource values, precautionary values, ethics andaesthetics, and simple self-interest – apply in different cases, and between themprovide an overwhelmingly powerful and convincing case for the conservationof biological diversity.
Excessive collection and exploitation has depleted the present wealth andover 25 medicinal plant species have been threatened to extinction. India ex-hibits remarkable outlook in modern medicine that is based on naturalproducts besides traditional system of Indian medicine. Apart from being usedin traditional medicines, medicinal plants play an important role as trade com-modities, meeting the demand of distant markets.
This paper begins with biological diversity, its levels, and importance, fol-lowed by biodiversity at the national level, and the use of medicinal plants intraditional medicines. It also touches upon the aspects of tribal pharmacopeaand export potential of medicinal plants. Finally, it stresses upon the dangersof extinction due to overexploitation and the urgent need to savebiodiversity.
Biodiversity and its importance
Biological diversity or biodiversity refers to the variety of life forms—the differ-ent plants, animals, and microorganisms; the genes they contain; and theecosystems they form. This living wealth is the product of hundreds of millionsof years of evolutionary history. The process of evolution means that the pool ofliving diversity is dynamic. It increases when a new genetic variation is pro-duced, a new species is created, or a novel ecosystem is formed, while it
8
Biodiversity loss and its impacts on rural health / alternate systems of medicine 171
decreases when the genetic variation within a species decreases, a species be-comes extinct, or an ecosystem complex is lost. This concept emphasizes theinter-related nature of the living world and its processes.
The sheer diversity of life is of inestimable value. It provides a foundationfor the continued existence of a healthy planet and our own well-being. It is be-lieved that ecosystems rich in diversity gain greater resilience and are, therefore,able to recover more readily from stresses such as drought or human-inducedhabitat degradation. When ecosystems are diverse, there is a range of pathwaysfor primary production and ecological processes such as nutrient cycling, so thatif one is damaged or destroyed, an alternative pathway may be used and theecosystem can continue functioning at its normal level. If biological diversity isgreatly diminished, the functioning of ecosystems is put at risk.
Levels of biodiversity
Biological diversity usually exists at three different levels; genetic, species, andecosystem. Genetic diversity refers to the variety of genetic information con-tained in all the individual plants, animals, and microorganisms. Geneticdiversity may be interspecific or intraspecific. Species diversity refers to the va-riety of living species, while ecosystem diversity relates to the variety ofhabitats, biotic communities, and ecological processes, as well as the tremen-dous diversity present within the ecosystems in terms of habitat differences andthe variety of ecological processes.
Biodiversity conservation entails a shift from a reactive state – protectingnature from the impacts of development – to a proactive effort, seeking to meetpeoples’ needs from the biological resources while ensuring a long-term ecologi-cal sustainability of earth’s biotic wealth. Thus, on a global level it involves notonly the protection of the wild species and their habitats but also the safeguard-ing of the genetic diversity of the cultivated and domesticated species and theirwild relatives.
India’s biodiversity
Although its total land area is only 2.4% of the total geographical area of theworld, India accounts for eight per cent of the total global biodiversity, with anestimated 49 000 species of plants, of which 4900 are endemic. It is one of the12 mega-diversity hot spot regions of the world, other countries being Brazil,Bolivia, Colombia, China, Ecuador, Indonesia, Mexico, South Africa, Peru, USA,and Venezuela. The ecosystems of the Himalayas, the Khasi and Mizo hills ofnorth-eastern India, the Vindhya and Satpura ranges of the northern peninsularIndia, and the Western Ghats contain nearly 90% of the country’s higher plantspecies and are, therefore, of special importance to traditional medicine.Although a good proportion of the medicinal plant species do occur throughout
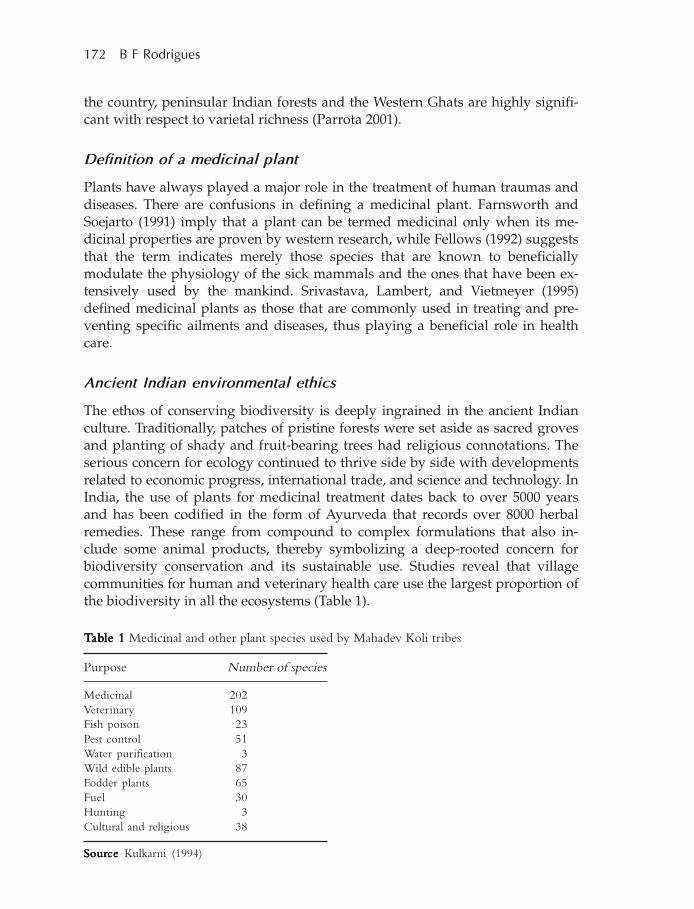
172 B F Rodrigues
the country, peninsular Indian forests and the Western Ghats are highly signifi-cant with respect to varietal richness (Parrota 2001).
Definition of a medicinal plant
Plants have always played a major role in the treatment of human traumas anddiseases. There are confusions in defining a medicinal plant. Farnsworth andSoejarto (1991) imply that a plant can be termed medicinal only when its me-dicinal properties are proven by western research, while Fellows (1992) suggeststhat the term indicates merely those species that are known to beneficiallymodulate the physiology of the sick mammals and the ones that have been ex-tensively used by the mankind. Srivastava, Lambert, and Vietmeyer (1995)defined medicinal plants as those that are commonly used in treating and pre-venting specific ailments and diseases, thus playing a beneficial role in healthcare.
Ancient Indian environmental ethics
The ethos of conserving biodiversity is deeply ingrained in the ancient Indianculture. Traditionally, patches of pristine forests were set aside as sacred grovesand planting of shady and fruit-bearing trees had religious connotations. Theserious concern for ecology continued to thrive side by side with developmentsrelated to economic progress, international trade, and science and technology. InIndia, the use of plants for medicinal treatment dates back to over 5000 yearsand has been codified in the form of Ayurveda that records over 8000 herbalremedies. These range from compound to complex formulations that also in-clude some animal products, thereby symbolizing a deep-rooted concern forbiodiversity conservation and its sustainable use. Studies reveal that villagecommunities for human and veterinary health care use the largest proportion ofthe biodiversity in all the ecosystems (Table 1).
TTTTTababababable 1le 1le 1le 1le 1 Medicinal and other plant species used by Mahadev Koli tribes
Purpose Number of species
Medicinal 202Veterinary 109Fish poison 23Pest control 51Water purification 3Wild edible plants 87Fodder plants 65Fuel 30Hunting 3Cultural and religious 38
SourSourSourSourSourcecececece Kulkarni (1994)
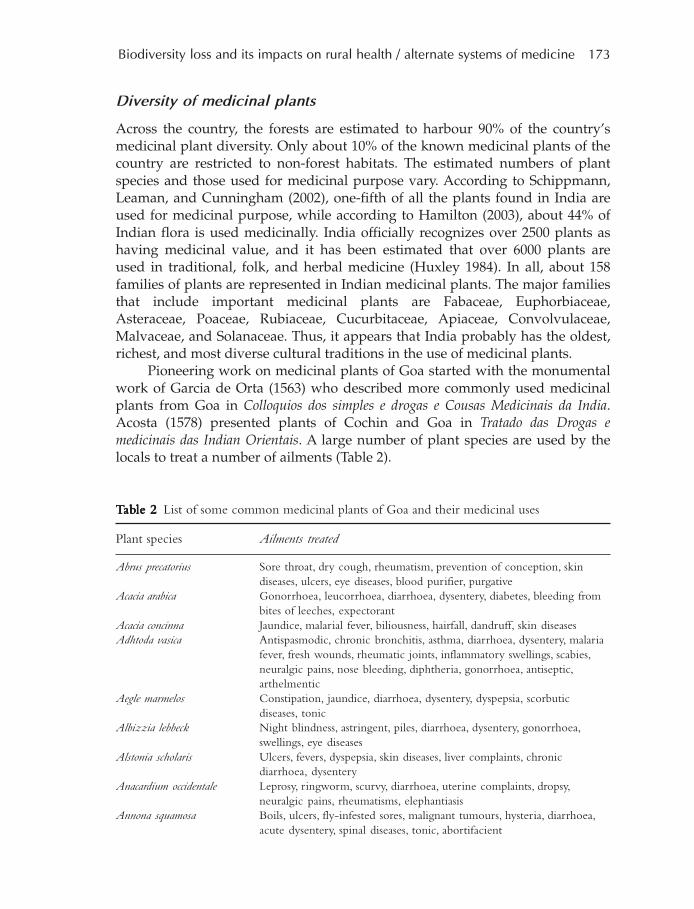
Biodiversity loss and its impacts on rural health / alternate systems of medicine 173
Diversity of medicinal plants
Across the country, the forests are estimated to harbour 90% of the country’smedicinal plant diversity. Only about 10% of the known medicinal plants of thecountry are restricted to non-forest habitats. The estimated numbers of plantspecies and those used for medicinal purpose vary. According to Schippmann,Leaman, and Cunningham (2002), one-fifth of all the plants found in India areused for medicinal purpose, while according to Hamilton (2003), about 44% ofIndian flora is used medicinally. India officially recognizes over 2500 plants ashaving medicinal value, and it has been estimated that over 6000 plants areused in traditional, folk, and herbal medicine (Huxley 1984). In all, about 158families of plants are represented in Indian medicinal plants. The major familiesthat include important medicinal plants are Fabaceae, Euphorbiaceae,Asteraceae, Poaceae, Rubiaceae, Cucurbitaceae, Apiaceae, Convolvulaceae,Malvaceae, and Solanaceae. Thus, it appears that India probably has the oldest,richest, and most diverse cultural traditions in the use of medicinal plants.
Pioneering work on medicinal plants of Goa started with the monumentalwork of Garcia de Orta (1563) who described more commonly used medicinalplants from Goa in Colloquios dos simples e drogas e Cousas Medicinais da India.Acosta (1578) presented plants of Cochin and Goa in Tratado das Drogas emedicinais das Indian Orientais. A large number of plant species are used by thelocals to treat a number of ailments (Table 2).
TTTTTababababable 2le 2le 2le 2le 2 List of some common medicinal plants of Goa and their medicinal uses
Plant species Ailments treated
Abrus precatorius Sore throat, dry cough, rheumatism, prevention of conception, skindiseases, ulcers, eye diseases, blood purifier, purgative
Acacia arabica Gonorrhoea, leucorrhoea, diarrhoea, dysentery, diabetes, bleeding frombites of leeches, expectorant
Acacia concinna Jaundice, malarial fever, biliousness, hairfall, dandruff, skin diseasesAdhtoda vasica Antispasmodic, chronic bronchitis, asthma, diarrhoea, dysentery, malaria
fever, fresh wounds, rheumatic joints, inflammatory swellings, scabies,neuralgic pains, nose bleeding, diphtheria, gonorrhoea, antiseptic,arthelmentic
Aegle marmelos Constipation, jaundice, diarrhoea, dysentery, dyspepsia, scorbuticdiseases, tonic
Albizzia lebbeck Night blindness, astringent, piles, diarrhoea, dysentery, gonorrhoea,swellings, eye diseases
Alstonia scholaris Ulcers, fevers, dyspepsia, skin diseases, liver complaints, chronicdiarrhoea, dysentery
Anacardium occidentale Leprosy, ringworm, scurvy, diarrhoea, uterine complaints, dropsy,neuralgic pains, rheumatisms, elephantiasis
Annona squamosa Boils, ulcers, fly-infested sores, malignant tumours, hysteria, diarrhoea,acute dysentery, spinal diseases, tonic, abortifacient
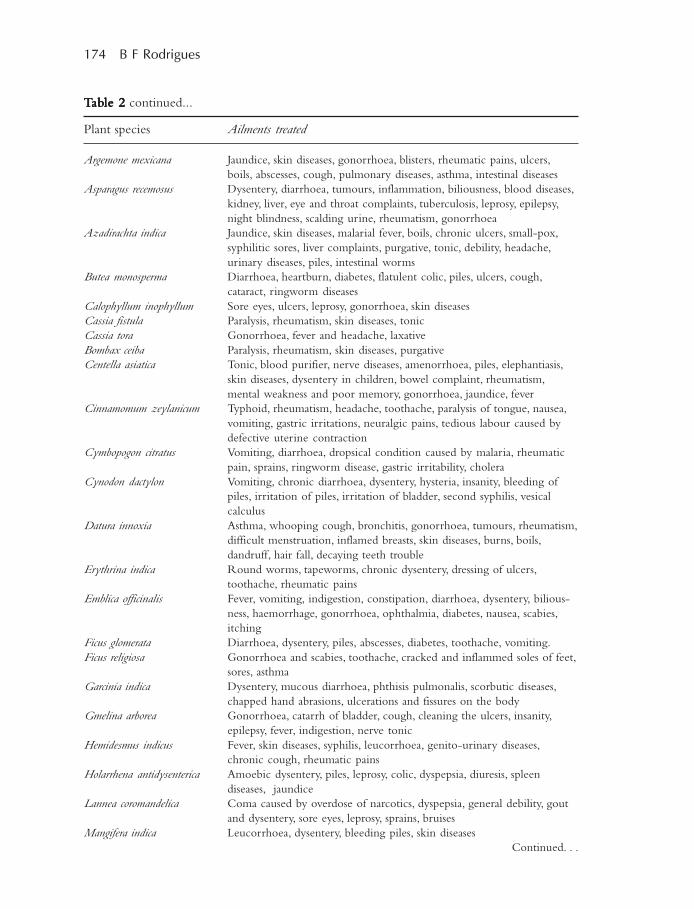
174 B F Rodrigues
Argemone mexicana Jaundice, skin diseases, gonorrhoea, blisters, rheumatic pains, ulcers,boils, abscesses, cough, pulmonary diseases, asthma, intestinal diseases
Asparagus recemosus Dysentery, diarrhoea, tumours, inflammation, biliousness, blood diseases,kidney, liver, eye and throat complaints, tuberculosis, leprosy, epilepsy,night blindness, scalding urine, rheumatism, gonorrhoea
Azadirachta indica Jaundice, skin diseases, malarial fever, boils, chronic ulcers, small-pox,syphilitic sores, liver complaints, purgative, tonic, debility, headache,urinary diseases, piles, intestinal worms
Butea monosperma Diarrhoea, heartburn, diabetes, flatulent colic, piles, ulcers, cough,cataract, ringworm diseases
Calophyllum inophyllum Sore eyes, ulcers, leprosy, gonorrhoea, skin diseasesCassia fistula Paralysis, rheumatism, skin diseases, tonicCassia tora Gonorrhoea, fever and headache, laxativeBombax ceiba Paralysis, rheumatism, skin diseases, purgativeCentella asiatica Tonic, blood purifier, nerve diseases, amenorrhoea, piles, elephantiasis,
skin diseases, dysentery in children, bowel complaint, rheumatism,mental weakness and poor memory, gonorrhoea, jaundice, fever
Cinnamomum zeylanicum Typhoid, rheumatism, headache, toothache, paralysis of tongue, nausea,vomiting, gastric irritations, neuralgic pains, tedious labour caused bydefective uterine contraction
Cymbopogon citratus Vomiting, diarrhoea, dropsical condition caused by malaria, rheumaticpain, sprains, ringworm disease, gastric irritability, cholera
Cynodon dactylon Vomiting, chronic diarrhoea, dysentery, hysteria, insanity, bleeding ofpiles, irritation of piles, irritation of bladder, second syphilis, vesicalcalculus
Datura innoxia Asthma, whooping cough, bronchitis, gonorrhoea, tumours, rheumatism,difficult menstruation, inflamed breasts, skin diseases, burns, boils,dandruff, hair fall, decaying teeth trouble
Erythrina indica Round worms, tapeworms, chronic dysentery, dressing of ulcers,toothache, rheumatic pains
Emblica officinalis Fever, vomiting, indigestion, constipation, diarrhoea, dysentery, bilious-ness, haemorrhage, gonorrhoea, ophthalmia, diabetes, nausea, scabies,itching
Ficus glomerata Diarrhoea, dysentery, piles, abscesses, diabetes, toothache, vomiting.Ficus religiosa Gonorrhoea and scabies, toothache, cracked and inflammed soles of feet,
sores, asthmaGarcinia indica Dysentery, mucous diarrhoea, phthisis pulmonalis, scorbutic diseases,
chapped hand abrasions, ulcerations and fissures on the bodyGmelina arborea Gonorrhoea, catarrh of bladder, cough, cleaning the ulcers, insanity,
epilepsy, fever, indigestion, nerve tonicHemidesmus indicus Fever, skin diseases, syphilis, leucorrhoea, genito-urinary diseases,
chronic cough, rheumatic painsHolarrhena antidysenterica Amoebic dysentery, piles, leprosy, colic, dyspepsia, diuresis, spleen
diseases, jaundiceLannea coromandelica Coma caused by overdose of narcotics, dyspepsia, general debility, gout
and dysentery, sore eyes, leprosy, sprains, bruisesMangifera indica Leucorrhoea, dysentery, bleeding piles, skin diseases
Plant species Ailments treated
TTTTTababababable 2le 2le 2le 2le 2 continued...
Continued. . .
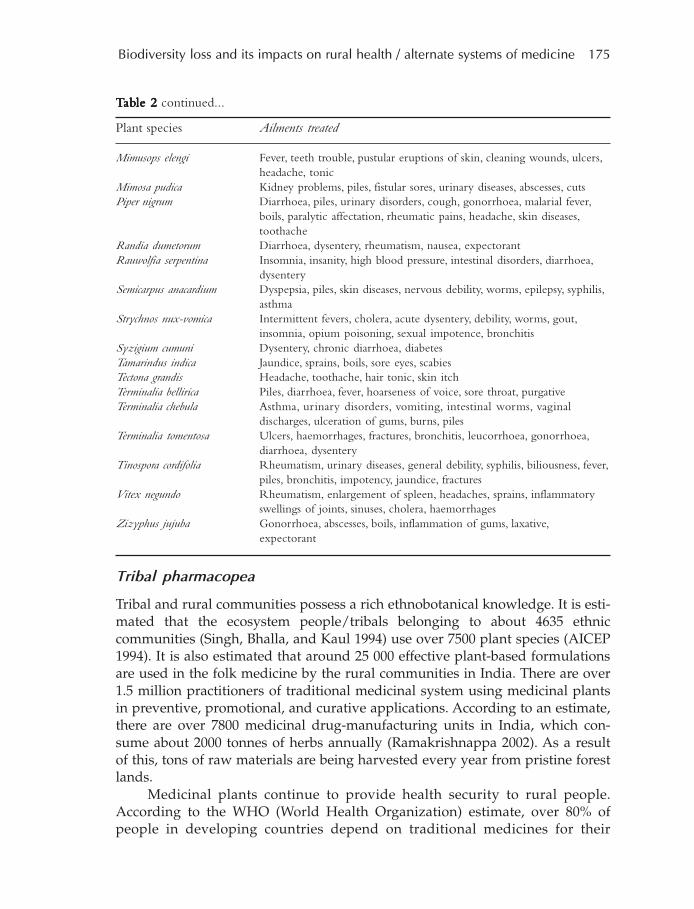
Biodiversity loss and its impacts on rural health / alternate systems of medicine 175
Mimusops elengi Fever, teeth trouble, pustular eruptions of skin, cleaning wounds, ulcers,headache, tonic
Mimosa pudica Kidney problems, piles, fistular sores, urinary diseases, abscesses, cutsPiper nigrum Diarrhoea, piles, urinary disorders, cough, gonorrhoea, malarial fever,
boils, paralytic affectation, rheumatic pains, headache, skin diseases,toothache
Randia dumetorum Diarrhoea, dysentery, rheumatism, nausea, expectorantRauwolfia serpentina Insomnia, insanity, high blood pressure, intestinal disorders, diarrhoea,
dysenterySemicarpus anacardium Dyspepsia, piles, skin diseases, nervous debility, worms, epilepsy, syphilis,
asthmaStrychnos nux-vomica Intermittent fevers, cholera, acute dysentery, debility, worms, gout,
insomnia, opium poisoning, sexual impotence, bronchitisSyzigium cumuni Dysentery, chronic diarrhoea, diabetesTamarindus indica Jaundice, sprains, boils, sore eyes, scabiesTectona grandis Headache, toothache, hair tonic, skin itchTerminalia bellirica Piles, diarrhoea, fever, hoarseness of voice, sore throat, purgativeTerminalia chebula Asthma, urinary disorders, vomiting, intestinal worms, vaginal
discharges, ulceration of gums, burns, pilesTerminalia tomentosa Ulcers, haemorrhages, fractures, bronchitis, leucorrhoea, gonorrhoea,
diarrhoea, dysenteryTinospora cordifolia Rheumatism, urinary diseases, general debility, syphilis, biliousness, fever,
piles, bronchitis, impotency, jaundice, fracturesVitex negundo Rheumatism, enlargement of spleen, headaches, sprains, inflammatory
swellings of joints, sinuses, cholera, haemorrhagesZizyphus jujuba Gonorrhoea, abscesses, boils, inflammation of gums, laxative,
expectorant
Tribal pharmacopea
Tribal and rural communities possess a rich ethnobotanical knowledge. It is esti-mated that the ecosystem people/tribals belonging to about 4635 ethniccommunities (Singh, Bhalla, and Kaul 1994) use over 7500 plant species (AICEP1994). It is also estimated that around 25 000 effective plant-based formulationsare used in the folk medicine by the rural communities in India. There are over1.5 million practitioners of traditional medicinal system using medicinal plantsin preventive, promotional, and curative applications. According to an estimate,there are over 7800 medicinal drug-manufacturing units in India, which con-sume about 2000 tonnes of herbs annually (Ramakrishnappa 2002). As a resultof this, tons of raw materials are being harvested every year from pristine forestlands.
Medicinal plants continue to provide health security to rural people.According to the WHO (World Health Organization) estimate, over 80% ofpeople in developing countries depend on traditional medicines for their
Plant species Ailments treated
TTTTTababababable 2le 2le 2le 2le 2 continued...
176 B F Rodrigues
primary health needs (Farnsworth and Soejarto 1991). In India, 3%–30% of therural population is covered under the modern health system (Darshan Shankar1992). Thus, for some 400–500 million people, traditional medicine is the onlyalternative. This is also borne out by the fact that there still exist over one mil-lion traditional, village-based carriers of the herbal medicine tradition in thecountry (LSPSS 1993).
Export potentials
Traditional medicine has served as a source of alternative medicine, new phar-maceuticals, and healthcare products. Medicinal plants are important forpharmacological research and drug development, not only as plant constituentsused directly as therapeutic agents, but also as starting materials for the synthe-sis of drugs or as models for pharmacologically active compounds (Mukherjee2003).
The value of medicinal plants as a source of foreign exchange for develop-ing countries depends on the use of plants as raw materials in thepharmaceutical industry. This provides numerous opportunities for developingnations to advance rural well-being. The global trade in the medicinal plants isof the order of 800 million dollars per year. Sales of medicinal plants havegrown by nearly 25% in India in the past 10 years, the highest growth rate in theworld (Masood 1997). Export statistics available between 1992 and 1995 indicatethat India exported about 32 600 tonnes of crude drugs valued at 46 million dol-lars (Dhar, Manjkhola, Joshi, et al. 2002). The annual export of medicinal plantsfrom India is valued at 1200 million rupees (Ramakrishnappa 2002). All the ma-jor herbal-based pharmaceutical companies are showing a constant growth ofabout 15% or more, next only to information technology industry (Kumar 2000).
In the past two decades, the pharmaceutical industry has made massive in-vestments in pharmacological, clinical, and chemical researches all over theworld in an effort to discover still more potent plant drugs. About 250 000 livingplant species contain a much greater diversity of bioactive compounds than anychemical library made by humans, but only few plant species have been system-atically investigated for the presence of bioactive compounds. A few newmedicinal plants have successfully passed the tests of commercial screening.
In recent years in India, there has been much activity in the area of re-search and development related to medicinal formulations involving plants andits compounds in both private sector involving industries and government-es-tablished institutions. Some of the industry-oriented research and developmentinstitutes include Dabur Research Foundation, Himalaya Health Care, ZanduPharmaceuticals, etc., while some examples of government-established institu-tions include the CIMAP (Central institute of Medicinal and Aromatic Plants),the NBRI (National Botanical Research Institute), the CDRI (Central DrugsResearch Institute), etc.
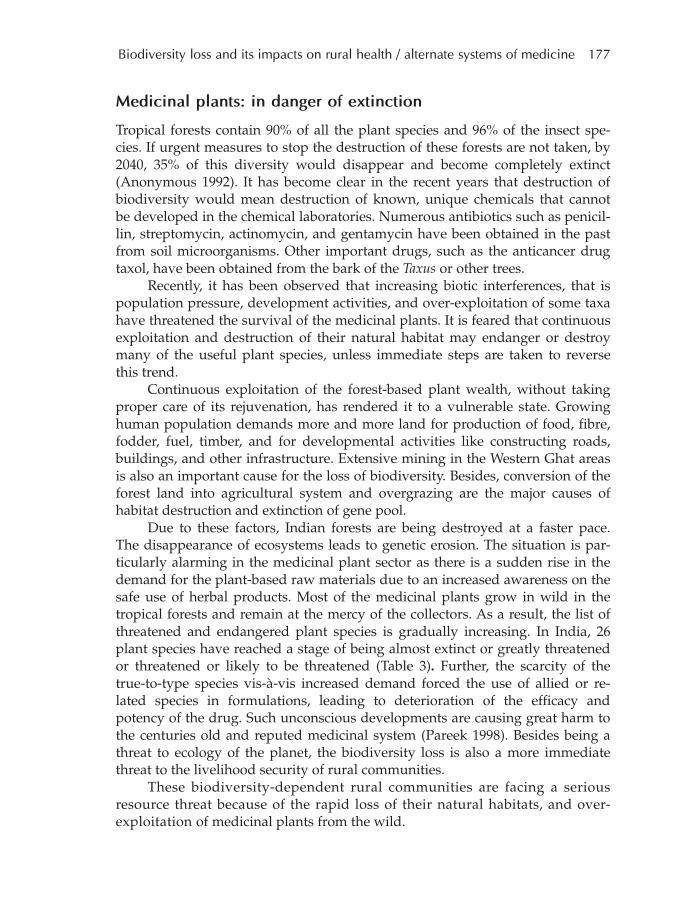
Biodiversity loss and its impacts on rural health / alternate systems of medicine 177
Medicinal plants: in danger of extinction
Tropical forests contain 90% of all the plant species and 96% of the insect spe-cies. If urgent measures to stop the destruction of these forests are not taken, by2040, 35% of this diversity would disappear and become completely extinct(Anonymous 1992). It has become clear in the recent years that destruction ofbiodiversity would mean destruction of known, unique chemicals that cannotbe developed in the chemical laboratories. Numerous antibiotics such as penicil-lin, streptomycin, actinomycin, and gentamycin have been obtained in the pastfrom soil microorganisms. Other important drugs, such as the anticancer drugtaxol, have been obtained from the bark of the Taxus or other trees.
Recently, it has been observed that increasing biotic interferences, that ispopulation pressure, development activities, and over-exploitation of some taxahave threatened the survival of the medicinal plants. It is feared that continuousexploitation and destruction of their natural habitat may endanger or destroymany of the useful plant species, unless immediate steps are taken to reversethis trend.
Continuous exploitation of the forest-based plant wealth, without takingproper care of its rejuvenation, has rendered it to a vulnerable state. Growinghuman population demands more and more land for production of food, fibre,fodder, fuel, timber, and for developmental activities like constructing roads,buildings, and other infrastructure. Extensive mining in the Western Ghat areasis also an important cause for the loss of biodiversity. Besides, conversion of theforest land into agricultural system and overgrazing are the major causes ofhabitat destruction and extinction of gene pool.
Due to these factors, Indian forests are being destroyed at a faster pace.The disappearance of ecosystems leads to genetic erosion. The situation is par-ticularly alarming in the medicinal plant sector as there is a sudden rise in thedemand for the plant-based raw materials due to an increased awareness on thesafe use of herbal products. Most of the medicinal plants grow in wild in thetropical forests and remain at the mercy of the collectors. As a result, the list ofthreatened and endangered plant species is gradually increasing. In India, 26plant species have reached a stage of being almost extinct or greatly threatenedor threatened or likely to be threatened (Table 3). Further, the scarcity of thetrue-to-type species vis-à-vis increased demand forced the use of allied or re-lated species in formulations, leading to deterioration of the efficacy andpotency of the drug. Such unconscious developments are causing great harm tothe centuries old and reputed medicinal system (Pareek 1998). Besides being athreat to ecology of the planet, the biodiversity loss is also a more immediatethreat to the livelihood security of rural communities.
These biodiversity-dependent rural communities are facing a seriousresource threat because of the rapid loss of their natural habitats, and over-exploitation of medicinal plants from the wild.
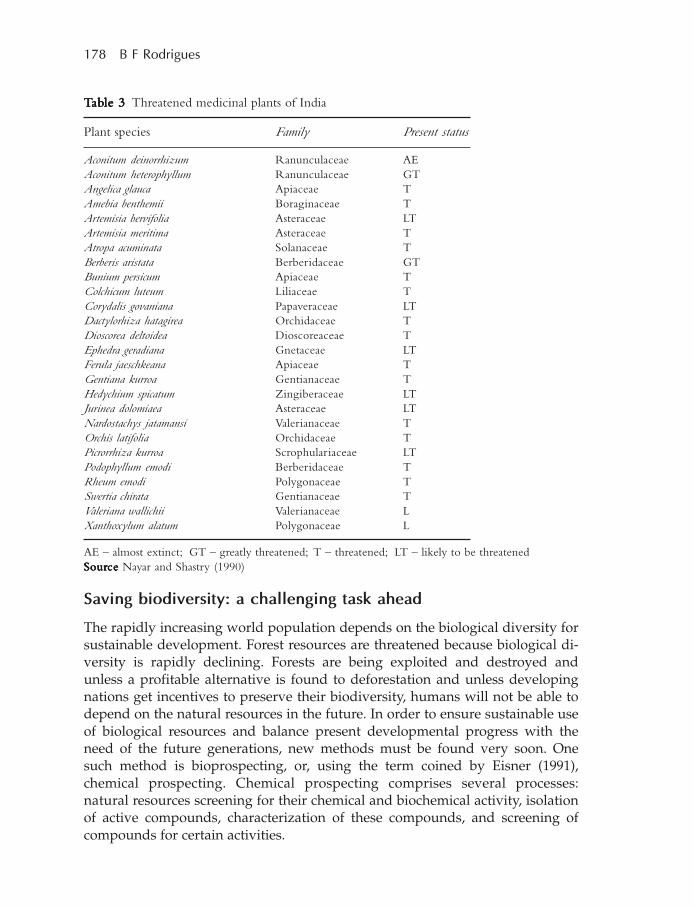
178 B F Rodrigues
Saving biodiversity: a challenging task ahead
The rapidly increasing world population depends on the biological diversity forsustainable development. Forest resources are threatened because biological di-versity is rapidly declining. Forests are being exploited and destroyed andunless a profitable alternative is found to deforestation and unless developingnations get incentives to preserve their biodiversity, humans will not be able todepend on the natural resources in the future. In order to ensure sustainable useof biological resources and balance present developmental progress with theneed of the future generations, new methods must be found very soon. Onesuch method is bioprospecting, or, using the term coined by Eisner (1991),chemical prospecting. Chemical prospecting comprises several processes:natural resources screening for their chemical and biochemical activity, isolationof active compounds, characterization of these compounds, and screening ofcompounds for certain activities.
TTTTTababababable 3le 3le 3le 3le 3 Threatened medicinal plants of India
Plant species Family Present status
Aconitum deinorrhizum Ranunculaceae AEAconitum heterophyllum Ranunculaceae GTAngelica glauca Apiaceae TAmebia benthemii Boraginaceae TArtemisia bervifolia Asteraceae LTArtemisia meritima Asteraceae TAtropa acuminata Solanaceae TBerberis aristata Berberidaceae GTBunium persicum Apiaceae TColchicum luteum Liliaceae TCorydalis govaniana Papaveraceae LTDactylorhiza hatagirea Orchidaceae TDioscorea deltoidea Dioscoreaceae TEphedra geradiana Gnetaceae LTFerula jaeschkeana Apiaceae TGentiana kurroa Gentianaceae THedychium spicatum Zingiberaceae LTJurinea dolomiaea Asteraceae LTNardostachys jatamansi Valerianaceae TOrchis latifolia Orchidaceae TPicrorrhiza kurroa Scrophulariaceae LTPodophyllum emodi Berberidaceae TRheum emodi Polygonaceae TSwertia chirata Gentianaceae TValeriana wallichii Valerianaceae LXanthoxylum alatum Polygonaceae L
AE – almost extinct; GT – greatly threatened; T – threatened; LT – likely to be threatenedSourSourSourSourSourcecececece Nayar and Shastry (1990)

Biodiversity loss and its impacts on rural health / alternate systems of medicine 179
In the 1980s, automatic screening methods were developed that allow thetesting of thousands of compounds a day for their biological activity (Tangley1996). At the same time, the understanding of the mechanism of many diseasesprovides new molecular targets for enzymes and drugs to combat human, ani-mal, and plant diseases. The race is now on between those who, for economicreasons, are destroying tropical forests and conservationists who are warningthat the biologically rich habitats are rapidly disappearing. In developing tropi-cal countries, new models of economic development are desperately needed topromote conservation and prevent the destruction of the environment.
References
Acosta C. 1578Tractado de las drogas Y medicinas de las Indias orientales, Burgos
AICEP (All India Coordinated Ethno-biological Project). 1994Summary Report of the AICEPNew Delhi: Ministry of Environment and Forests, Government of IndiaDetails available at <http://www.sadl.uleth.ca/nz/collect/faodocs/import/www.fao.org/docrep/w7261e/W7261e11.htm>
Anonymous. 1992A Guide to the Global Environment[World Resources Institute, World Resources 1992–93]Oxford: Oxford University Press
Darshan Shankar. 1992Indigenous health services: the state of the artIn State of India’s Health, pp. 129–161, edited by A MukhopadhyayNew Delhi: Voluntary Health Association of India
Dhar U, Manjkhola S, Joshi M, Bhatt A, Joshi M. 2002Current status and future strategy for development of medicinal plants sector inUttranchal, IndiaCurrent Science 83 (8): 956–964
Eisner T. 1991Chemical prospecting: a proposal for actionIn Ecology, Economics Ethics: the broken circle, pp. 1–196, edited by F H Bormann andS R KellertYale University Press
Farnsworth N R and Soejarto D D. 1991Global importance of medicinal plantsIn Conservation of Medicinal Plants, pp. 25–51, edited by O Akerale, V Heywood,and H SyngeCambridge, UK: Cambridge University Press
180 B F Rodrigues
Fellows L E. 1992Pharmaceuticals from traditional medicinal plants and others: future prospectsIn New Drugs from Natural Sources, pp. 93–100, edited by J D CoombersLondon: I B C Technical Services
Garcia da Orta. 1563Colloquies dos simples e drogas e Cousas Medicinais da India
Hamilton A. 2003Medicinal Plants and Conservation: issues and approachesUK: World Wide Fund for Nature. 51 pp.
Huxley A. 1984Green Inheritance: the world wildlife fund book of IndiaLondon: Gaia Books Ltd., Collins/Harvill. 193 pp.
Kulkarni D K. 1994Ethno-botanical Knowledge of the ‘Mahadev Koli Tribals’ of Western MaharashtraPune, India: Agarkar Research Institute
Kumar A. 2000Plants Based Medicines in India. FeaturesPress Information Bureau, Government of IndiaDetails available at <http://pib.nic.in/feature/feyr2000/fmay2000/f240520006.html>
LSPSS (Lok Swasthya Parampara Samvardhan Samithi). 1993Micro-studies Carried Out by Members of All India Network of NGO’s Involved inthe Revitalization of Local Health TraditionsCoimbatore: LSPSS
Masood E. 1997Medicinal plants threatened by over-useNature 385 (6617): 570
Mukherjee P K. 2003GMP for Indian systems of medicineIn GMP for Botanicals: Regulatory and Quality Issues on Phytomedicines, pp. 99–112,edited by P K Mukherjee and R VerpoorteNew Delhi: Business Horizons. 388 pp.
Nayar M P and Shastry A R K. 1990Red Data Book of Indian Plants, vol. 3Botanical Survey of India, Kolkata. 271 pp.

Biodiversity loss and its impacts on rural health / alternate systems of medicine 181
Pareek S K. 1998Medicinal plants in India: present and future prospectsIn Prospects of Medicinal Plants, pp. 5-14, edited by P L Gautam, R Raina, UmeshSrivastava, S P Raychaudhuri, and B B SinghNew Delhi: Indian Society of Plant Genetic Resources. 292 pp.
Parrota J A. 2001Healing Plants of Peninsular IndiaNew York: CABI (Commonwealth Agricultural Bureaux International)
Ramakrishnappa K. 2002Impact of cultivation and gathering of medicinal plants on biodiversity: casestudies from IndiaIn Biodiversity and the Ecosystem Approach in Agriculture, Forestry and FisheriesFood and Agriculture OrganizationDetails available at <http://www.fao.org/documents/show_cdr.asp?url_file=//docrep/005/aa021e/AA021e16.htm>
Schippmann U, Leaman D J, and Cunningham A B. 2002Impact of cultivation and gathering of medicinal plants on biodiversity: globaltrends and issuesIn Biodiversity and the Ecosystem Approach in Agriculture, Forestry and Fisheries,pp. 1–21, edited by Matthias Halwart and Devin BartleyRome: Food and Agriculture OrganizationDetails available at <ftp://ftp.fao.org/docrep/fao/005/aa010e/AA010E00.pdf>
Singh K S, Bhalla V and Kaul V. 1994The Biological Variation in Indian Populations[People of India National Series Volume X]New Delhi: Vedams eBooks (P) Ltd. 760 pp.
Srivastava J, Lambert J, and Vietmeyer N. 1995Medicinal Plants: a growing role in development agriculture and natural resourcesdevelopment agriculture and forestry systemsWashington, DC: The World Bank
Tangley L 1996Ground rules emerge for marine bioprospectorsBioscience 46: 245–248
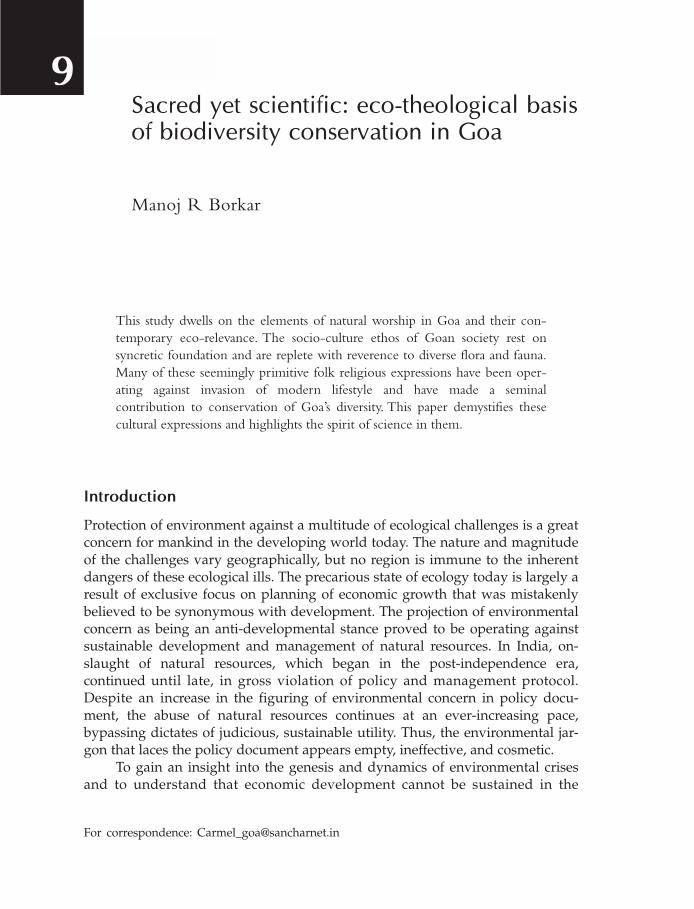
182 M R Borkar
Sacred yet scientific: eco-theological basisof biodiversity conservation in Goa
Manoj R Borkar
This study dwells on the elements of natural worship in Goa and their con-temporary eco-relevance. The socio-culture ethos of Goan society rest onsyncretic foundation and are replete with reverence to diverse flora and fauna.Many of these seemingly primitive folk religious expressions have been oper-ating against invasion of modern lifestyle and have made a seminalcontribution to conservation of Goa’s diversity. This paper demystifies thesecultural expressions and highlights the spirit of science in them.
Introduction
Protection of environment against a multitude of ecological challenges is a greatconcern for mankind in the developing world today. The nature and magnitudeof the challenges vary geographically, but no region is immune to the inherentdangers of these ecological ills. The precarious state of ecology today is largely aresult of exclusive focus on planning of economic growth that was mistakenlybelieved to be synonymous with development. The projection of environmentalconcern as being an anti-developmental stance proved to be operating againstsustainable development and management of natural resources. In India, on-slaught of natural resources, which began in the post-independence era,continued until late, in gross violation of policy and management protocol.Despite an increase in the figuring of environmental concern in policy docu-ment, the abuse of natural resources continues at an ever-increasing pace,bypassing dictates of judicious, sustainable utility. Thus, the environmental jar-gon that laces the policy document appears empty, ineffective, and cosmetic.
To gain an insight into the genesis and dynamics of environmental crisesand to understand that economic development cannot be sustained in the
For correspondence: [email protected]
9
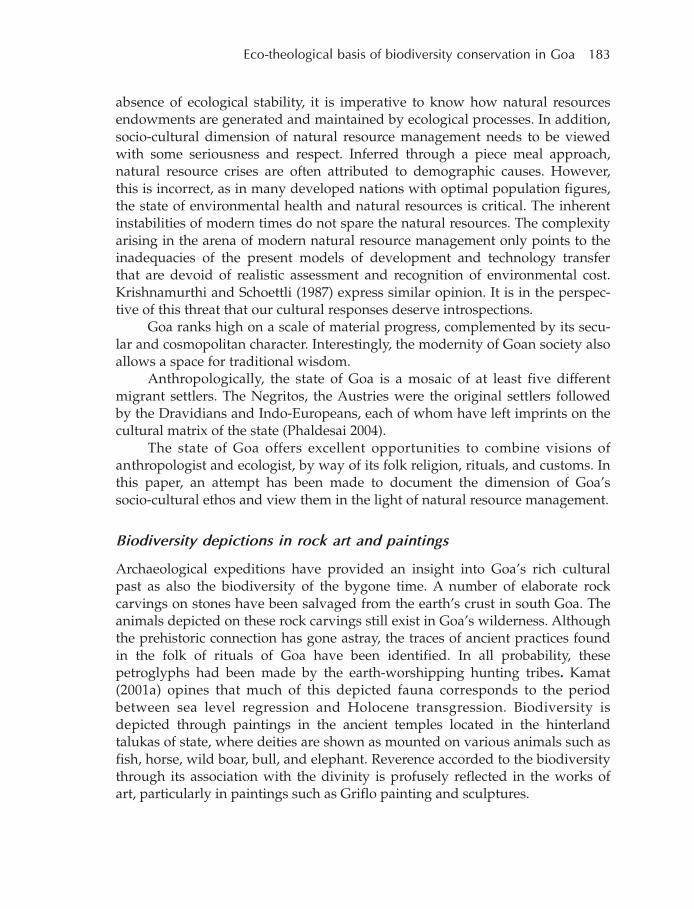
Eco-theological basis of biodiversity conservation in Goa 183
absence of ecological stability, it is imperative to know how natural resourcesendowments are generated and maintained by ecological processes. In addition,socio-cultural dimension of natural resource management needs to be viewedwith some seriousness and respect. Inferred through a piece meal approach,natural resource crises are often attributed to demographic causes. However,this is incorrect, as in many developed nations with optimal population figures,the state of environmental health and natural resources is critical. The inherentinstabilities of modern times do not spare the natural resources. The complexityarising in the arena of modern natural resource management only points to theinadequacies of the present models of development and technology transferthat are devoid of realistic assessment and recognition of environmental cost.Krishnamurthi and Schoettli (1987) express similar opinion. It is in the perspec-tive of this threat that our cultural responses deserve introspections.
Goa ranks high on a scale of material progress, complemented by its secu-lar and cosmopolitan character. Interestingly, the modernity of Goan society alsoallows a space for traditional wisdom.
Anthropologically, the state of Goa is a mosaic of at least five differentmigrant settlers. The Negritos, the Austries were the original settlers followedby the Dravidians and Indo-Europeans, each of whom have left imprints on thecultural matrix of the state (Phaldesai 2004).
The state of Goa offers excellent opportunities to combine visions ofanthropologist and ecologist, by way of its folk religion, rituals, and customs. Inthis paper, an attempt has been made to document the dimension of Goa’ssocio-cultural ethos and view them in the light of natural resource management.
Biodiversity depictions in rock art and paintings
Archaeological expeditions have provided an insight into Goa’s rich culturalpast as also the biodiversity of the bygone time. A number of elaborate rockcarvings on stones have been salvaged from the earth’s crust in south Goa. Theanimals depicted on these rock carvings still exist in Goa’s wilderness. Althoughthe prehistoric connection has gone astray, the traces of ancient practices foundin the folk of rituals of Goa have been identified. In all probability, thesepetroglyphs had been made by the earth-worshipping hunting tribes. Kamat(2001a) opines that much of this depicted fauna corresponds to the periodbetween sea level regression and Holocene transgression. Biodiversity isdepicted through paintings in the ancient temples located in the hinterlandtalukas of state, where deities are shown as mounted on various animals such asfish, horse, wild boar, bull, and elephant. Reverence accorded to the biodiversitythrough its association with the divinity is profusely reflected in the works ofart, particularly in paintings such as Griflo painting and sculptures.
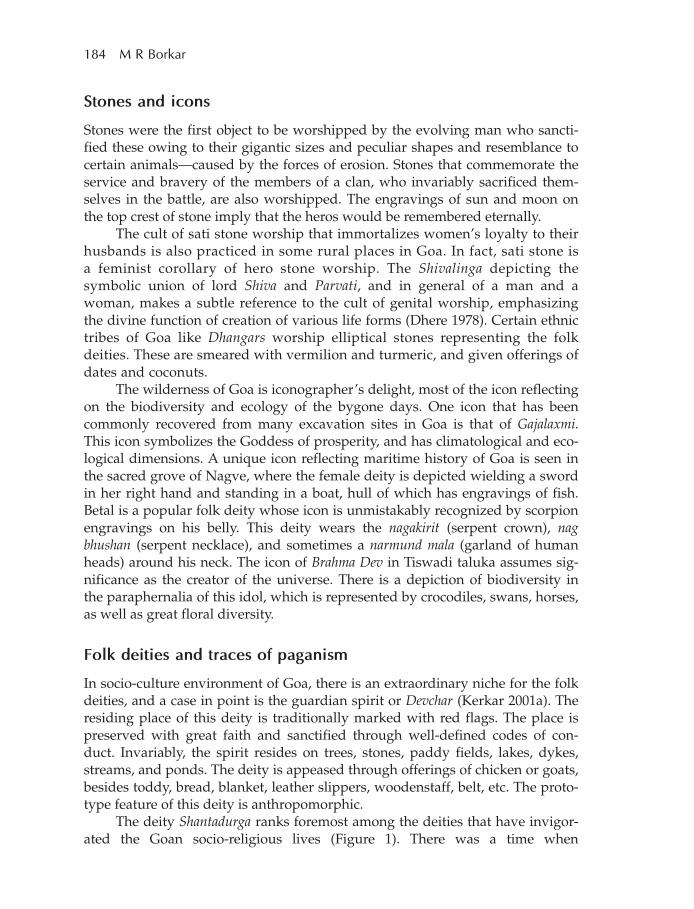
184 M R Borkar
Stones and icons
Stones were the first object to be worshipped by the evolving man who sancti-fied these owing to their gigantic sizes and peculiar shapes and resemblance tocertain animals—caused by the forces of erosion. Stones that commemorate theservice and bravery of the members of a clan, who invariably sacrificed them-selves in the battle, are also worshipped. The engravings of sun and moon onthe top crest of stone imply that the heros would be remembered eternally.
The cult of sati stone worship that immortalizes women’s loyalty to theirhusbands is also practiced in some rural places in Goa. In fact, sati stone isa feminist corollary of hero stone worship. The Shivalinga depicting thesymbolic union of lord Shiva and Parvati, and in general of a man and awoman, makes a subtle reference to the cult of genital worship, emphasizingthe divine function of creation of various life forms (Dhere 1978). Certain ethnictribes of Goa like Dhangars worship elliptical stones representing the folkdeities. These are smeared with vermilion and turmeric, and given offerings ofdates and coconuts.
The wilderness of Goa is iconographer’s delight, most of the icon reflectingon the biodiversity and ecology of the bygone days. One icon that has beencommonly recovered from many excavation sites in Goa is that of Gajalaxmi.This icon symbolizes the Goddess of prosperity, and has climatological and eco-logical dimensions. A unique icon reflecting maritime history of Goa is seen inthe sacred grove of Nagve, where the female deity is depicted wielding a swordin her right hand and standing in a boat, hull of which has engravings of fish.Betal is a popular folk deity whose icon is unmistakably recognized by scorpionengravings on his belly. This deity wears the nagakirit (serpent crown), nagbhushan (serpent necklace), and sometimes a narmund mala (garland of humanheads) around his neck. The icon of Brahma Dev in Tiswadi taluka assumes sig-nificance as the creator of the universe. There is a depiction of biodiversity inthe paraphernalia of this idol, which is represented by crocodiles, swans, horses,as well as great floral diversity.
Folk deities and traces of paganism
In socio-culture environment of Goa, there is an extraordinary niche for the folkdeities, and a case in point is the guardian spirit or Devchar (Kerkar 2001a). Theresiding place of this deity is traditionally marked with red flags. The place ispreserved with great faith and sanctified through well-defined codes of con-duct. Invariably, the spirit resides on trees, stones, paddy fields, lakes, dykes,streams, and ponds. The deity is appeased through offerings of chicken or goats,besides toddy, bread, blanket, leather slippers, woodenstaff, belt, etc. The proto-type feature of this deity is anthropomorphic.
The deity Shantadurga ranks foremost among the deities that have invigor-ated the Goan socio-religious lives (Figure 1). There was a time when

Eco-theological basis of biodiversity conservation in Goa 185
FigurFigurFigurFigurFigure 1e 1e 1e 1e 1 Cultural relics of biodiversity linkages in Goa’s cultural ethos1 ‘Sunnya dhupe’-a dog icon worshipped by velip community2 ‘Naga’ stone3 A zoomorphic gargoyle of shantadurga temple4 ‘Shantadurga’ deity symbolising earth worship5 ‘Mannge thapnee’-crocodile worship of gawde tribes6 ‘Devchar’-the guardian spirit of goa7 St. Bartholomew-patron saint of paddy growers
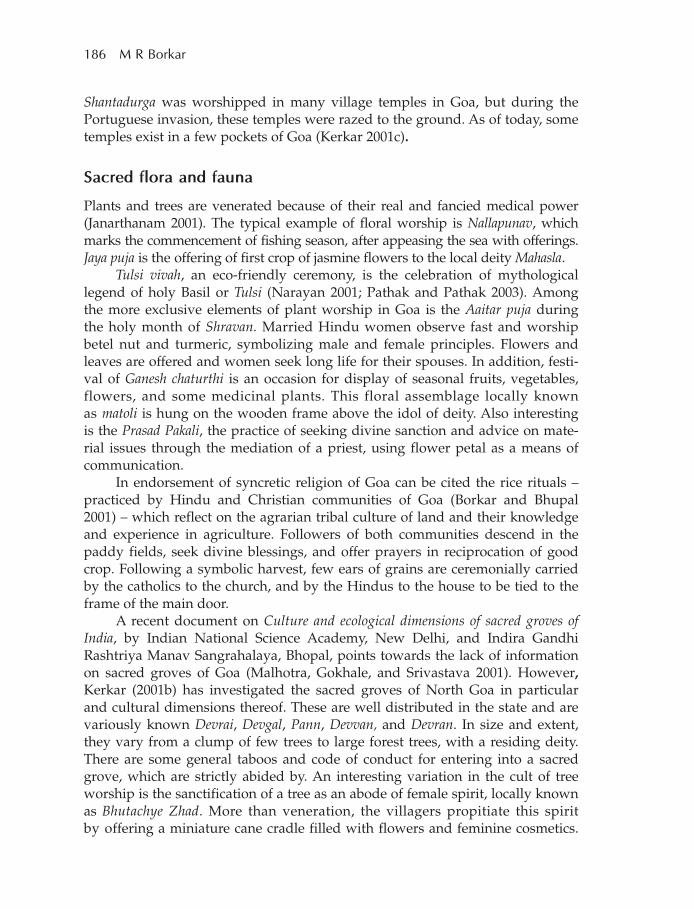
186 M R Borkar
Shantadurga was worshipped in many village temples in Goa, but during thePortuguese invasion, these temples were razed to the ground. As of today, sometemples exist in a few pockets of Goa (Kerkar 2001c).
Sacred flora and fauna
Plants and trees are venerated because of their real and fancied medical power(Janarthanam 2001). The typical example of floral worship is Nallapunav, whichmarks the commencement of fishing season, after appeasing the sea with offerings.Jaya puja is the offering of first crop of jasmine flowers to the local deity Mahasla.
Tulsi vivah, an eco-friendly ceremony, is the celebration of mythologicallegend of holy Basil or Tulsi (Narayan 2001; Pathak and Pathak 2003). Amongthe more exclusive elements of plant worship in Goa is the Aaitar puja duringthe holy month of Shravan. Married Hindu women observe fast and worshipbetel nut and turmeric, symbolizing male and female principles. Flowers andleaves are offered and women seek long life for their spouses. In addition, festi-val of Ganesh chaturthi is an occasion for display of seasonal fruits, vegetables,flowers, and some medicinal plants. This floral assemblage locally knownas matoli is hung on the wooden frame above the idol of deity. Also interestingis the Prasad Pakali, the practice of seeking divine sanction and advice on mate-rial issues through the mediation of a priest, using flower petal as a means ofcommunication.
In endorsement of syncretic religion of Goa can be cited the rice rituals –practiced by Hindu and Christian communities of Goa (Borkar and Bhupal2001) – which reflect on the agrarian tribal culture of land and their knowledgeand experience in agriculture. Followers of both communities descend in thepaddy fields, seek divine blessings, and offer prayers in reciprocation of goodcrop. Following a symbolic harvest, few ears of grains are ceremonially carriedby the catholics to the church, and by the Hindus to the house to be tied to theframe of the main door.
A recent document on Culture and ecological dimensions of sacred groves ofIndia, by Indian National Science Academy, New Delhi, and Indira GandhiRashtriya Manav Sangrahalaya, Bhopal, points towards the lack of informationon sacred groves of Goa (Malhotra, Gokhale, and Srivastava 2001). However,Kerkar (2001b) has investigated the sacred groves of North Goa in particularand cultural dimensions thereof. These are well distributed in the state and arevariously known Devrai, Devgal, Pann, Devvan, and Devran. In size and extent,they vary from a clump of few trees to large forest trees, with a residing deity.There are some general taboos and code of conduct for entering into a sacredgrove, which are strictly abided by. An interesting variation in the cult of treeworship is the sanctification of a tree as an abode of female spirit, locally knownas Bhutachye Zhad. More than veneration, the villagers propitiate this spiritby offering a miniature cane cradle filled with flowers and feminine cosmetics.
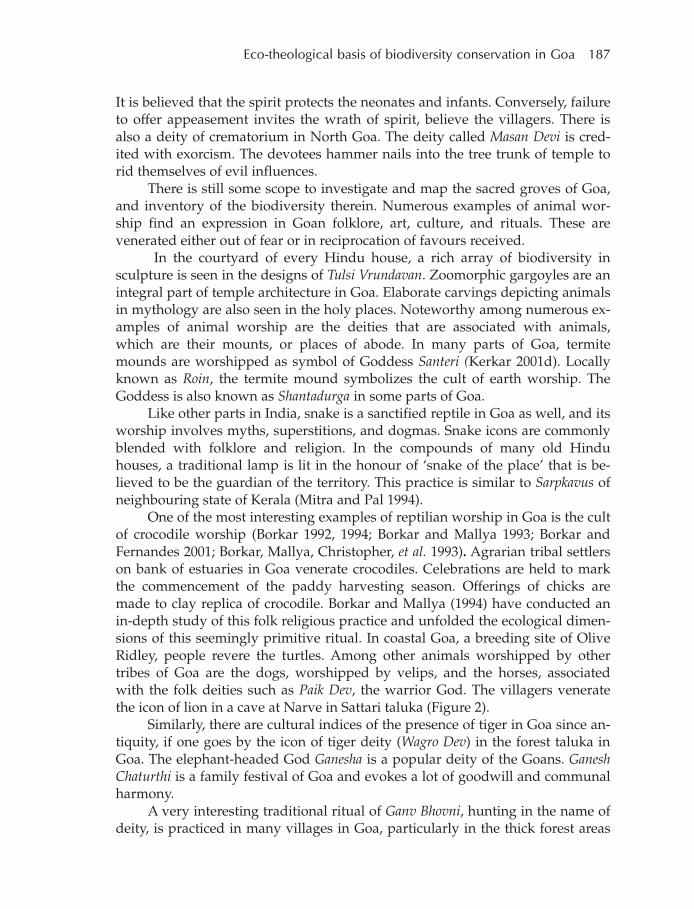
Eco-theological basis of biodiversity conservation in Goa 187
It is believed that the spirit protects the neonates and infants. Conversely, failureto offer appeasement invites the wrath of spirit, believe the villagers. There isalso a deity of crematorium in North Goa. The deity called Masan Devi is cred-ited with exorcism. The devotees hammer nails into the tree trunk of temple torid themselves of evil influences.
There is still some scope to investigate and map the sacred groves of Goa,and inventory of the biodiversity therein. Numerous examples of animal wor-ship find an expression in Goan folklore, art, culture, and rituals. These arevenerated either out of fear or in reciprocation of favours received.
In the courtyard of every Hindu house, a rich array of biodiversity insculpture is seen in the designs of Tulsi Vrundavan. Zoomorphic gargoyles are anintegral part of temple architecture in Goa. Elaborate carvings depicting animalsin mythology are also seen in the holy places. Noteworthy among numerous ex-amples of animal worship are the deities that are associated with animals,which are their mounts, or places of abode. In many parts of Goa, termitemounds are worshipped as symbol of Goddess Santeri (Kerkar 2001d). Locallyknown as Roin, the termite mound symbolizes the cult of earth worship. TheGoddess is also known as Shantadurga in some parts of Goa.
Like other parts in India, snake is a sanctified reptile in Goa as well, and itsworship involves myths, superstitions, and dogmas. Snake icons are commonlyblended with folklore and religion. In the compounds of many old Hinduhouses, a traditional lamp is lit in the honour of ‘snake of the place’ that is be-lieved to be the guardian of the territory. This practice is similar to Sarpkavus ofneighbouring state of Kerala (Mitra and Pal 1994).
One of the most interesting examples of reptilian worship in Goa is the cultof crocodile worship (Borkar 1992, 1994; Borkar and Mallya 1993; Borkar andFernandes 2001; Borkar, Mallya, Christopher, et al. 1993). Agrarian tribal settlerson bank of estuaries in Goa venerate crocodiles. Celebrations are held to markthe commencement of the paddy harvesting season. Offerings of chicks aremade to clay replica of crocodile. Borkar and Mallya (1994) have conducted anin-depth study of this folk religious practice and unfolded the ecological dimen-sions of this seemingly primitive ritual. In coastal Goa, a breeding site of OliveRidley, people revere the turtles. Among other animals worshipped by othertribes of Goa are the dogs, worshipped by velips, and the horses, associatedwith the folk deities such as Paik Dev, the warrior God. The villagers veneratethe icon of lion in a cave at Narve in Sattari taluka (Figure 2).
Similarly, there are cultural indices of the presence of tiger in Goa since an-tiquity, if one goes by the icon of tiger deity (Wagro Dev) in the forest taluka inGoa. The elephant-headed God Ganesha is a popular deity of the Goans. GaneshChaturthi is a family festival of Goa and evokes a lot of goodwill and communalharmony.
A very interesting traditional ritual of Ganv Bhovni, hunting in the name ofdeity, is practiced in many villages in Goa, particularly in the thick forest areas
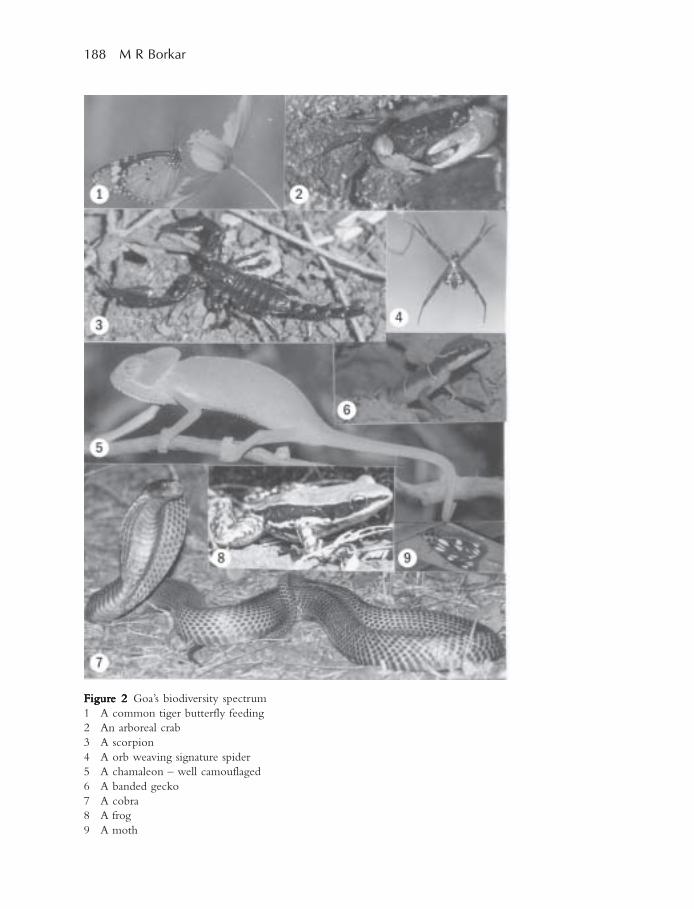
188 M R Borkar
FigurFigurFigurFigurFigure 2e 2e 2e 2e 2 Goa’s biodiversity spectrum1 A common tiger butterfly feeding2 An arboreal crab3 A scorpion4 A orb weaving signature spider5 A chamaleon – well camouflaged6 A banded gecko7 A cobra8 A frog9 A moth
Eco-theological basis of biodiversity conservation in Goa 189
that are home to wild life (Kulkarni 2001). In this cultural expression, villagershunt in the name of God, and wild meat is shared by the devotees after it is of-fered to the God. It is firmly believed that the Bhovni wards off evil and pleasesthe deity. The practice is slowly losing ground in the light of stringent imple-mentation of the Wildlife Protection Act (1972). Nevertheless, it continueswithout much pomp and festivity.
Discussion
Despite obvious western influence on certain areas of life, Goa is very much anIndian region, though with an unusual past. In spite of the religious, linguistic,and caste differences, one does not fail to notice an ideal ‘Goan culture’ that islargely a result of syncretic approach. Socialization and reinforcement of Goanregional culture rests on the foundation of confluence of Catholic and Hindutraditions that differ greatly in form and style but present a syncretic Goan style,which has helped forge a common Goan identity despite the religious differ-ences (Newman 2001). Such a development is particularly pronounced amongthe so-called lower castes of both the religions. Unfortunately, the present timeshave affected the Goan cultural tradition in all its form—Hindu, Catholic, andsyncretic. Intrusion of national and international cultural derivatives into theGoan cultural ethos has diluted the unique forms of cultural expression thatgave Goa its unique regional identity.
Between Roman Catholicism and classic Hinduism, the image – Goa restson the confluence of two traditions into a lively folk tradition; a syncreticHindu–Catholic religion – which is largely undefined, unlabelled, but mutuallyunderstood by the followers of both the communities.
Against this background, it is not difficult to understand the ecological di-mension of nature worship in the state. The gigantic structures, diverse shapesof the natural objects, variety of colours and fragrance associated with theplants, the knowledge that these natural resources provided for other kind ofbiodiversity, and the multitude of uses that they offer to the humanity, createan element of awe and respect for trees and humankind. At points of time inhistory, in the absence of rules and laws, man realized that religion and culturecould be an effective tool for conserving these resources, thus paving the wayfor the cult of plant worship. Sacred groves are classic examples of how suchfeelings of veneration translate into a sustainable utility through decentraliza-tion of propriety. This essentially symbolizes the capability of forest-basedpeople to regulate their resources. The magical and spiritual nature of such at-tachment being self-imposed restriction on human expectation from nature.Unfortunately, contemporary defilement of sacred groves only proved that tra-ditional wisdom lacks permanence. Co-modification of natural resources, ingeneral, and of forest, in particular, upsets the balance of ‘local ecosystem’, lead-ing to various ecological consequences. Chandran (1997) laments that the
190 M R Borkar
myriad relics of sacred groves scattered over the Western Ghats only proves thatindigenous people of the past with the historical continuity of resource-usepractices possessed the knowledge of complex ecological system of their locali-ties and actually developed a stake in their conservation, unlike their moderncounterparts.
The need of the hour is to rationalize the governance of all such forests bycommunity institutions. Also, it is necessary to document the social customs ofthese communities and to take inventory of the flora and fauna of these areas.As far as guardian spirits that inhabit trees are concerned, such an impressiondiscourages trespassing and encourages territoriality, a good rationale for mak-ing community self-sufficient and ensuring equity in access to the resources.Further, such taboos complement the efforts to conserve biodiversity. The eco-logical service rendered by forests is immense, and therefore their reverence isjustifiable.
As for animal worship, profuse incorporation of animal myths has beenthe hallmark of our culture and religion. In the beginning, the deities werezoomorphic and with the advent of nomadic tribes, the focus shifted to the an-thropomorphic Gods. The animals, domesticated as well as wild, haveeconomic, scientific, aesthetic, and above all ecological values. Thus, their asso-ciations with divine principle only endorsed their importance.
The sanctification of termites associated with the deity Santeri has a greatconservation value, as an edible yet schedule Termetomycis species of mushroomthat has been braving the pressure of overexploitation, grows chiefly on the soilof termite mound (Kamat 2001b). The only way of protecting this species is tobring them in the realm of divinity. Similarly, among the reptiles, snake, turtle,and crocodile play an important ecological role. The cobra, for instance, is acost-free pest control, keeping a check on the rodents. It is not surprising, there-fore, that in a country with a strong agro-based economy, this reptile is an objectof worship. With the dwindling number of the crocodiles in the state of Goa –small wild population now having being restricted to the Cumbarjuva canal – itis not the science but the religion that can save this species. It is only sanctitythat can bail this reptile out from the pressure of poaching. Similarly, religioncan only be a deterrent for indiscriminate exploitation of turtles that come to theshore of Goa for laying eggs. Against the good price that the turtle meat fetchesfor the hospitality sector in Goa, many high profile sectors in Goa perform reli-gious rituals before the trapped turtles are released back into the sea.
Offering made to the dogs by Velip (community) is only reflection of the ca-nines’ loyalty to their masters, as the Velips are the tribes specialized in the art ofcultivating difficult mountainous terrain. It is the dog that protected their cropsagainst intruders. The sanctification of cows, which is a matter of intense politi-cal debate, and often a subject of ridicule, is easy to understand in an ecologicalcontext. In the pre-industrial days when human civilization was in the processof organizing itself, pastoralist ancestors of modern man benefited from cows in
Eco-theological basis of biodiversity conservation in Goa 191
more than one way. It provided dung, which is a biofuel, milk that is a goodnutritional package, and animal power for tilling the field. Cattle also bufferedepidemics of zoonotic diseases. In rural areas, therefore, economy was largelyshaped by this single animal. Association of horses with some deities was in rec-ognition of their role in transport and services to mankind.
Such episodes of sanctification of wilderness beyond the realm of fantasycan also be evaluated in the light of modern wildlife management. A case inpoint is Ganv Bhovni, which is in fact a very effective strategy in the guise of folkritual. It is tempting to compare it with licensed hunting in some of the Africancountries to keep a check on the fast breeding species. Thus, periodically takingaway the surplus in the name of deity restores their number to good balancewith the habitat. Veneration of monkeys, elephants, and wild cats is not difficultto understand.
In the light of ecological contexts, today we inhabit a world of gadget andtechnology that has no nature link. Exploitation of nature in mood of indiffer-ence to the feeling of natural object has encouraged indiscriminateunsustainable exploitation of nature. Wisdom of ancestors in managing theirnatural resources has been sidelined. It is imperative, therefore, to reflect on ourspiritual moorings and re-examine our culture and religion for spiritual anchors.In fact, the culturally transmitted belief systems will direct the future evolutionof both; the planet and ourselves (Grassie 2004). The ill of modernization canonly be cured by the time-tested ancient system of natural resource manage-ment that has a good blend of religion and science, proven on the premises offaith and verification and is thus sacred yet scientific.
Acknowledgement
The author has received field and secretarial assistance from Dr NeelamKomarpant. Nirmal Kulkarni has contributed some photoimages. Discussionswith the volunteers of Vivekanand Environment Awareness Brigade, Keri,Sattari, have enriched the scope of this paper.
References
Borkar M R. 1992Eco-theological basis of crocodile conservation in Goa[Seminar on ‘Biodiversity of Goa’, 16 February 1992, organized by BSI (BotanicalSociety of Goa) and AGAZ (All Goa Association of Zoologist), Abstract No. 29]
Borkar M R. 1994Conservation future of the Mugger (Crocodylus palustris, Lesson), in Goa withreference to Cumbarjua canalNew Delhi: Indian Institute of Ecology and Environment[Master’s thesis submitted to the Indian Institute of Ecology and Environment]
192 M R Borkar
Borkar M R and Bhupal E. 2001Rice rituals of Goa: eco-theological reflections[Abstract in the Proceedings of a University Grants Commission sponsored statelevel seminar on Eco-spirituality: Rediscovering Ecology in Our Religion and Culture,6–7 December 2001, jointly organized by Environment Protection Club andBiodiversity Research Cell, Carmel College of Women, Nuvem, Goa, 18]
Borkar M R and Fernandes T. 2001Crocodiles worship: a herpeto-eco-theological tradition of Goa’s agrarian pastand its contemporary eco-relevance[Abstract in the Proceedings of a University Grants Commission sponsored statelevel seminar on Eco-spirituality: Rediscovering Ecology in Our Religion and Culture,6–7 December 2001, jointly organized by Environment Protection Club andBiodiversity Research Cell, Carmel College of Women, Nuvem, Goa, 19]
Borkar M R and Mallya M. 1993Eco-theological basis of crocodile conservation in GoaBiology Education 9 (4): 297–298
Borkar M R and Mallya M. 1994Study of environmental pressures and resource renewal with reference tomugger crocodile of Goa[National Symposium on Eco-environmental Impact and Organism Response,15–17 October 1994, organized by P G Department of Zoology and Botany,Government Vidharba Mahavidyalaya, Amaravati, Abstract No. 15]
Borkar M R, Mallya M, Christopher S, Phatak S. 1993The Status of the Mugger Crocodile (Crocodylus palustris, Lesson), in theCumbarjua Canal of Goa[A report submitted to World Wide Fund for Nature, Goa Division]
Chandran M D S. 1997On ecological history on Western GhatsCurrent Science 73 (2): 46–155
Dhere R C. 1978Lajja GauriPune: SriVidya Prakashan. 228 pp.
Grassie W. 2004Biocultural evolution in the 21st century: the evolutionary role of religion[Proceedings of International Symposium on Modern Science Values and Quest forUnity, 26 January 2004, organized by IISR, Jnana Deepa Vidyapeeth, Pune;Ahmednagar College, Ahmednagar; Tilak Maharashtra Vidyapeeth, Pune]

Eco-theological basis of biodiversity conservation in Goa 193
Janarthanam M K. 2001Plant in spiritual life[Abstract in Proceedings of a University Grants Commission sponsored stateseminar on Eco-spirituality: Rediscovering Ecology in Our Religion and Culture,6–7 December 2001, jointly organized by Environment Protection Club andBiodiversity Research Cell, Carmel College of Women, Nuvem, Goa, 16]
Kamat N. 2001aThe ecological dimension of the prehistoric shamanism in Goa: an analysis ofpetroglyphs in the Zuari and Mandovi river basin[Abstract in Proceedings of a University Grants Commission sponsored stateseminar Eco-spirituality – Rediscovering the Ecology in Our Religion and Culture,6–7 December 2001, jointly organized by Environment Protection Club andBiodiversity Research Cell, Carmel College of Women, Nuvem, Goa]
Kamat N. 2001bMyco-ecotheological tradition: some aspects of mushroom and religion withspecial reference to India[Abstract in Proceedings of a University Grants Commission sponsored stateseminar Eco-spirituality: Rediscovering the Ecology in Our Religion and Culture,6–7 December 2001, jointly organized by Environment Protection Club andBiodiversity Research cell, Carmel College of Women, Nuvem, Goa]
Kerkar R P. 2001aGomantak Konkanatil Devchar SankalpanaSanwad (1 August 2001) 14–15[Weekly Goa Edition, Panaji]
Kerkar R P. 2001bSacred Groves and Rivers of North Goa[A report submitted to Goa foundation under the NBSAP (National BiodiversityStrategy and Action Plan)]. 78 pp.
Kerkar R P. 2001cGomantakachi Chaitanyadatri, Shri ShanatadurgaSanwad (15 October 2001): 14–15[Newspaper Supplement, Panaji]
Kerkar R P. 2001dGomantak Kokanachi SanteriSanwad (15 June 2001) 14–15
Krishnamurthi B V and Schoettli U. 1987Environment in India’s religious and cultural heritageIn India’s Environment Crises and Responses, pp. 159–171edited by J Bandyopadhyay, N D Jayal, U Schoettli, and C SinghDehra Dun: Nataraj Publishers
194 M R Borkar
Kulkarni N. 2001Man Reptile Relationship in Taluka of Sattari[A report submitted to Goa foundation under the aegis of NBSAP (NationalBiodiversity Strategy and Action Plan)]
Malhotra K C, Gokhale Y, and Srivastava S. 2001Cultural and Ecological Dimension of Sacred Groves in IndiaNew Delhi and Bhopal: Indian National Science Academy and Indira GandhiRashtriya Manav Sangrahalaya. 35 pp.
Mitra A and Pal S. 1994The spirit of sanctuaryDown to Earth 2 (17): 21–36
Narayan T. 2001InsightHerald Newspaper (1 December 2001)
Newman R S. 2001Transformation of an Indian religionIn Of Umbrellas, Goddesses and Dreams: essays on Goan culture and society, pp. 11–34Mapusa, Goa: India Press
Pathak P V and Pathak U P. 2003Living Traditions of the Emerald Land. Tulashi Vrindavans and Holy Crosses ofGoaPanaji, Goa: Directorate of Art and Culture, Government of Goa
Phaldesai P. 2004Kaleidoscopic Goa: a cultural atlas published by Vasantrao DhempoEducation and Research Foundation. 213 pp.
Sacred groves: indigenous institutions ofbiodiversity conservation
Rajendra P Kerkar
Informal institutions operating at local level greatly help in environmentalconservation. Traditional societies in most part of the world worship trees andsacred groves. Certain activities like felling of trees are prohibited within thejurisdiction of sacred groves, resulting in biodiversity conservation. Some ofthe rare species of plants have been reported from sacred groves. Culturalbeliefs and faith are largely associated with tree worship and the resultingconservation practices. This paper aims at examining the role of these religiousand cultural institutions operating at local level in the conservation ofbiodiversity.
Introduction
Institutions, defined as a set of rules, are of great importance in safeguardingnatural resources. Those operating at local level play a pivotal role in the conser-vation of natural resources. Statements of intent on global environmentalproblems issued following the 1992 Earth Summit, including Agenda 21 and theDesertification Convention, strongly advocate as solutions a combination ofgovernment decentralization, devolution to local communities of responsibilityfor natural resources held as commons, and community participation(Holmberg, Thompson, and Timberlake 1993).
Conservation of common resources has always been challenging. Localcommunities have guarded such common resources in the past. An understand-ing of the institutions embedded in traditional societies for access and control ofthese resources would serve as a basis for formulating effective interventions.An insight into the role of diverse institutions operating at local level willgreatly help in mediating environment and community relationships.
10
196 R P Kerkar
Biodiversity conservation through religious and cultural practices
Protected areas are a well-accepted approach in NRM (natural resource man-agement). Involving local communities in NRM and conservation of suchreserved areas are now gaining importance worldwide. However, in traditionalsocieties of some countries, such as India, the concept has been practiced forcenturies by local communities through religious and cultural institutions. Thispaper documents the existence of sacred groves, locally known as Devrai (treesof Gods), in Goa.
Sacred groves are widely prevalent in the traditional societies all overIndia. These are the reserve forests preserved by traditional societies thatembed cultural beliefs. These are believed to be under the control of deities orholy spirits, thus revered and respected.
Literature review by Bhandary and Chandrashekar (2003) suggests that inIndia, about 13 720 sacred groves have been enumerated so far from 19 states.They further add that in South India, about 2000 groves occur in Kerala, 1600 inMaharashtra, 800 in Andhra Pradesh, and 448 in Tamil Nadu. No efforts havebeen made to document sacred groves of Goa, although there have been someattempts for regeneration of some sacred groves.
Brief description of study area
Loss of biodiversity is an issue that deserves immediate attention. Sacred grovesare pioneer institutions in the conservation of biodiversity. This paper is basedon a case study of sacred groves existing in Goa. The state is situated on thewest coast of India along the Arabian Sea. There are 11 talukas—smaller admin-istrative subunits in the state. The state can be divided into three regions: thecoastal land, hinterland plains, and hilly areas. Sacred groves are mainly presentin the hilly areas followed by other parts of the hinterland.
Sacred groves: beliefs and traditions
The institution of sacred groves is an ancient tradition in Goa. From time imme-morial, trees have been worshipped by the Goans. In Goa, as well as in manyparts of India, care and respect for nature have been influenced for centuries byreligious beliefs and traditions. While coastal parts of Goa have been experienc-ing significant changes there exist some fascinating examples of sacred grovesmainly in the Western Ghat regions of Sattari, Sanguem, and Canacona. Therewas a time when sacred groves and sacred trees were a common feature inevery village. But today this tradition is being eroded due to changing socio-economic conditions and land-use systems. Many sacred groves are now underthreat and have been altered both in terms of size and vegetation structure.
Sacred groves play a significant role in enhancing the glory of this land,conserving groundwater resources, and making the climatic condition
Sacred groves: indigenous institutions of biodiversity conservation 197
soothing. These sacred groves are a treasure of biodiversity and a unique exam-ple of in situ conservation of our genetic resources. Worshipping sacred grovesis one method by which human beings express gratitude to the trees that sus-tained and supported life under a given agro-ecological condition. The sacredgroves in Goa are known in different places by different names. In Sattari, theyare called Devrais, in Phonda Devgal, in Sanguem Pann, and in Canacona theyare known as Devaran or Devadano. Sanguem and Sattari are the only two talukasin Goa having major forest cover and a heavy concentration of sacred groves.
Traditional societies in Goa associated a deity with local ecology. This deitywas entrusted the work of protecting a particular region, which included vege-tation, natural flora and fauna, and people. People strongly believed that thedeity protects those who protect the natural resources. These deities are nameddifferently at different places. Certain activities are prohibited in these protectedareas. A list to this effect has been made by the village communities and is spe-cific to the local area and its ecology.
The other common feature of sacred groves is a water body locally knownas Tali. The sacred groves and associated ponds or springs constitute a uniquenetwork of ecological systems that are intertwined with the life and culture ofthe Goan rural folk.
In most places, a complete ban is not in place, but control over certain ac-tivities is practiced. Activities prohibited in and around the sacred grovesinclude felling of trees, branches, or twigs; collecting of leaf litter; grazing of cat-tle; wearing shoes; urinating; spitting, etc. Entry is prohibited in some areas,while in others, women who have attained puberty are denied entry, especiallyduring menstrual period of four days. Certain activities such as collection ofwood, fruits, and plant parts (for medicinal use) are permitted.
Documentation of Goa’s sacred groves
Ajobachi Rai, Baldyachi Rai, Comachi Rai, Birmanyachi Rai, Panvelichi Rai, HornyachiRai, Oralachi Rai, Pishyachi Rai, Abadurgyachi Rai, and Maulichi Rai of Vagheri arethe sacred groves of village Keri, situated between Vagheri and Morlegad hillsof Sayadri. Today, however, only few of these groves are well protected. Amongthese, Ajobachi Rai is unique and is considered to be the biggest known sacredgrove of Goa. A large track of forest that is evergreen is the uniqueness ofAjobachi Rai. There are a number of beliefs associated with this grove, and thevillagers, irrespective of their caste and religion, have guarded this grove thatcovers the forested area of about 10 hectares. The grove is about 1 km (kilome-tre) away from the temple of Sateri Kelbai and is situated on a hill. Thisprimary forest is composed entirely of trees of about 20–40 m (metres) tall withlittle shrub or herbaceous undergrowth. The dominating tree species are karmal,khast, kivan, kosamb, amo, ghosting, marat, nano, satvin, panas, shidam, bhillo-mad,pav, gol, and kharvat. Faunal diversity of this sacred grove is rich and the area
198 R P Kerkar
offers ideal habitat and protection to all faunal components from insects tomammals. The floral diversity has helped attract and retain various faunal com-ponents of the grove. As the area remains undisturbed from human activities,dead wood, fruits, and undergrowths act as breeding and roosting ground fordifferent animals. Ajoba is regarded as an unseen holy spirit, and all the villagersrespect him whole-heartedly. As he is the presiding deity of this grove, no onedares to cause any harm to this forest as all consider it as his abode. Activitieslike urinating, spitting, smoking, and using bad words (foul language) in the sa-cred grove are strictly disallowed. Livestock grazing and collection of dry twigsfor fuel are allowed sometimes. In special cases when timber is needed for com-munity purposes, permission is sought from Ajoba for extraction. Those whodon’t adhere to the taboos connected with this Devrai are believed to face ill healthor misfortune. Hence, no one dares to break these taboos.
Caranzol village of Sattari, which is under the shadow of Hulan Dongor,has four sacred groves, namely Karalachi Rai, Gavalachi Rai, Hunulyachi Rai, andHoleyechi Rai. Among these four groves, Holeyechi Rai is one of the biggest sacredgroves and is well protected. This grove is about 3 km away from the villageitself and is situated on a hill. A large portion of the grove appears to be in itsprimeval condition. This primary forest is composed entirely of trees about20–30 m tall with little shrub or herbaceous undergrowth. The forest is rich inwoody climbers. There are magnificent trees with large girth. It has a water-holethat attracts a variety of wild animals. The sweet chirping of innumerable birdsmakes one happy inside the grove. In 1740, the Ranes revolted against the Por-tuguese when they occupied Sanquelim and the Satteri Mahal. During theserevolts, the Ranes used to enter this grove and worship an age-old stone slab. Ifthe stone slab changed position, it was believed that the mutineers wouldachieve success in the revolt. Due to this, Holeyechi Rai is also popularly knownas Ranyachi Rai.
Sacred grove of Brahma Karmali is situated at a distance of about 4 km fromthe temple of Brahmadev and is locally known as Ajobachi Tali. The Holy SpiritAjoba is regarded as the protector of this grove. The grove has very tall and ever-green trees and has a perennial spring. Due to the continuous flow of water,there is undergrowth of turmeric-like plant. Under the roots of this plant, a localvariety of crab called belde is found. The uniqueness of this grove is that it is thehabitat of varied colourful butterflies like common birdwing, stripped tiger,common crow, blue oak leaf, common grass yellow, and glossy tiger. A greyish-white large butterfly called the ‘Malabar tree nymph’ is the main attraction ofthis grove. It is probably the slowest flyer among the Indian butterflies and isoccasionally seen hovering effortlessly at one spot, flying with its large wings.
The sacred grove of Bambar-Nanoda of Sattari is the abode of rare medicinalplants. The forest of this grove is classified as ‘Myristica swamp forest’ and isunique in Goa. The forest inside this grove has a great ecological significance.The trees have unusual aerial roots that are analogous to pneumatophores or
Sacred groves: indigenous institutions of biodiversity conservation 199
stilt roots of mangroves. Nirankar is the presiding deity of this grove and is wor-shipped by the villagers of Malolis, Uste, and Nanode. The perennial spring ofthis grove has sweet, cool, potable water, which also feeds a number of coconutand banana plantations and other agricultural produce.
Nagve village, which is 3 km from Valpoi, also has a sacred grove. Though,this grove is not densely forested, it has a varied species of trees. This grove isfamous for the rivers of the old temples, for the beautifully carved stone icons ofBrahmani, for the two-handed Goddess standing erect in the boat, and also for apanel of Gajlaxmi, covered with lichens. There are not many restrictions with re-gard to this grove.
Coparde, which is on the way to Valpoi, Thane road, has four sacredgroves. Of these, Devachi Rai has the largest area under well-protected forest.This grove is near the old temple of Brahmani Maya. There are huge Shidamtrees with elongated woody climbers. Some of the climbers are so long that theycover several trees. Inside the grove, there is a stream that flows till December.Both sides of the stream are lined with thick undergrowth of kevada (Pandanusfurcates). These kevada retain moisture and help the grove remain lush greenthroughout the year. This village is well known all over Goa as people fromvarious parts of the state come here for treatment of skin diseases. On the out-skirts of the grove, there is a pond, which is known as Devachi Tali. The water ofthis pond is believed to possess medicinal properties, which acts as an antidotefor snake poison. The patients who are dissatisfied with the allopathic treatmentcome here to get rid of their skin diseases. They reside in a Dharamshala, eatvegeta-rian food, and observe sagacity. Everyday they put the holy water ofDevachi Tali, known as tirth, on the affected part until it is cured. This grove iseasily accessible except during the monsoons.
Beside these groves, there are also many places in Sattari where one cancome across the well-conserved forests by the community in the name of reli-gion and cultural heritage. Rive village once had about more than 25 sacredgroves; however, today only a few sacred groves are intact.
Like Sattari, Sanguem taluka too has maintained the tradition of sacredgroves till date. However, sacred groves are known here as Pann and most ofthese Pann are dedicated to the folk deity Paik. Iconigraphically, the folk deityPaik is shown sitting on the horse back with a sword and ready to attack. Incurdi-vade village, there is one Paikapann. Inside the grove, there is a rooflessstone idol of Paik, which is worshipped by the locals with devotion. This grovealso has ruins of an old temple with the idol of Durga and a well in total neglect.The Paikdev is an important deity of the forest dwellers of Sanguem. Small stat-ues of clay are offered to the deity.
Salgini-Verlem comes under the newly declared Netravali wildlife sanctu-ary. In this village, there is a temple dedicated to lord Shiva and this templehas a sacred grove known as Mahadevachi Rai. This grove is surrounded by threemagnificent mountains: Endapali Dongor, Goddi Dongor, and Madiraichi Gad.
200 R P Kerkar
Kumbhari village, which is famous for the 800-m high Kumbhari hill, hasa sacred grove called Kalasdev spread over 4.04 hectares of land and con-sisting two temples. The sacred grove has a beautiful forest cover that is wellprotected by the forest dwellers.
Sanguem taluka, which has the maximum forest cover in Goa, is also giftedwith high range of mountains that have socio-religious significance for the localcommunities. Due to the traditional and cultural practices of protecting the for-ests around a folk deity of the village, an estimated 60 or more sacred groves areknown to exist within this area.
Quepem taluka too has sacred groves. The Velip community is mainly re-sponsible for guarding these places for centuries. In Morpila village, there is awell-protected sacred grove, which is a repository of ancient, untouchedbiodiversity. This grove is rich in flora and fauna, and is responsible for protect-ing the water resources of the area. Inside the grove, there is a stream called‘Paikacho Vhal’. There are a number of norms associated with this grove. Onehas to climb the steep gradient of the grove barefoot. After passing through along tunnel of bushes, one can see a beautiful spring emerging from the heart ofthe dense forest. Due to certain strong beliefs, biodiversity inside this grove isundisturbed and well protected.
Cazur village of Quepem is known for the prehistoric rock carvings dis-covered on the granite rock called ‘Dudhaphator’ near the temple of Paikdev.The velip community of this village has protected a sacred grove on a hill slopeas a mark of respect to the ancestors of the village. Nobody is allowed to lift aleaf or flower from the Pann without the permission of the deity.
Ecological significance of sacred groves
Ecological significance of sacred groves is listed below. In situ conservation of biodiversity by serving as repositories of germplasm
of a number of wild varieties of plants Help groundwater recharge Provide perennial source of water Maintain cooler temperatures, preserve soil moisture Carbon sequestration functions Prevent soil erosion and nutrient leaching Maintain soil fertility through nutrient enrichment
It is commonly reported that many of the rare plant species are found insacred groves. In situ conservation of biodiversity seems to be the most impor-tant ecological function performed by the institution of sacred groves.
Sacred groves: indigenous institutions of biodiversity conservation 201
Discussion
The forest dwellers of Goa, realizing the significance of the forest in maintainingthe ecological balance, have sanctified their forests, but today the needy andgreedy people are gradually breaking the taboos. This has eventually led to theerosion in the strong belief and faith that people have in the powers of God.
There is an ascent of atheism leading to a waning of cultural and religiouspractices across the state. Ownership of groves and the belief that Gods or HolySpirit live in them are the two factors that have played a significant role in theconservation of groves. From many villages, this tradition has disappeared andthe new generation is hardly aware of it. There is an urgent need of creatingawareness among them along with initiating a movement for maintaining thisrich heritage. Many small groves today are in need of protection not only fortheir high biological value but also to perpetuate cultural values, which areunique to each grove. These sacred groves are a rich treasure of ecological andbiological wealth and hence we have to protect them for posterity. These mini-ature biosphere reserves harbour a number of endemic and endangered speciesof flora and fauna, hence their conservation is the need of the hour!
Traditional societies in most part of the world worship trees and sacredgroves. In most societies, some deities are associated with these groves. Forexample, the Celts did not build temples but worshipped their Gods in sacredgroves or ‘Nemeton’ amongst the trees of the natural landscape. ‘Nemetona’was a Celtic Goddess particularly associated with these open-air places of wor-ship. She was the guardian of the sacred grove worshipped in regions located asfar as Lein-Winternheim near Maintz, Altripp near Speyer, and Bath in the Brit-ish West Country.1
Mention is due of Bishnoi tribe/community of Rajasthan in India that hasno match in protecting trees in the world. Villagers belonging to this tribe areknown to protect the trees at the cost of their lives.
Roy Burman (2003: 13) points out that tree worship is a common featurein India, but the institution of sacred grove though related is not common.Researchers state that preservation of the entire vegetation in association with adeity is a phenomenon quite distinct from preservation of isolated specimens ofsacred tree species such as peepal (Ficus religiosa) or umber (Ficus glomerate). Thelatter are worshipped even without any association with a deity.
Tree worship has been linked with Mother Goddess or with Saivite Gods ofHinduism. A majority of banas, sacred groves of Dakshin Kannada and Udupidistricts of Karnataka, are also dedicated to serpent God Naga. Roy Burman(2003: 10) cites Sharad Patil in saying that the Gods of Vedas are not forest dei-ties and that there are especially two deities, Kali or Durga (Mother Goddess)and Aiyappan (a Dravidian God), associated with forests. He further states that
1 Details available at <http://www.earlybritishkingdoms.com/bios/nemetona.html>
202 R P Kerkar
the grove-installed Mother Goddess was of pre-Aryan origin. Societies worship-ping Mother Goddess were pre-eminently agricultural communities in whichwomen tilled the soil and men hunted (Roy Burman 2003: 10).
Religious and cultural institutions have largely helped in the conservationof natural resources. These institutions can guide us in formulating policies forlocal ecology. While most institutions have helped in conservation of resources,certain practices, and distortion of some, have also created erosion of bio-diversity. A word of caution is needed for effective decision-making processes.
This paper is expected to throw light on religious institutions operating atlocal level and enrich the international community on ecology and communityinterrelationships. It is hoped that the insights derived from this study will helpin planning for external interventions that would work more effectively.
References
Bhandary M J and Chandrashekar K R. 2003Sacred groves of Dakshina Kannada and Udupi districts of KarnatakaCurrent Science 85 (12): 1655–1656
Holmberg J, Thompson K, and Timberlake L. 1993Facing the Future: beyond the Earth SummitLondon: IIED/Earthscan
Roy Burman J J. 2003Sacred Groves among CommunitiesNew Delhi: Mittal Publications. 256 pp.

A perspective of marine bioinvasion
A C Anil
Bioinvasions are generally taken note of only when their impacts are felt. Theimpacts directly experienced by the society can be economical (loss of fisheryor water as a resource) and human health related (for example, cholera epi-demic, toxicity due to micro algal contamination). The ecological impacts, onthe other hand, are complex and dependent on the interaction between theinvader and the native community. The cost of invasion is generally related tohow early one responds to the problem, and it increases with the lapse of time.Many cases of marine bioinvasion have been reported and their harmfuleffects on the ecosystem and human health have been documented. This paperprovides an overview of the factors that influence the success of invasive alienspecies. Translocation of organisms through ships’ ballast water is considered tobe one of the important issues threatening the naturally evolved biodiversity,and consequences of such invasions are being realized increasingly in therecent years. International efforts underway to address this issue are broughtout in this paper.
A perspective of marine bioinvasion
Bioinvasion refers to introduction of an alien organism(s) into an ecosystem.When in its native environment, the invading organism lives in semblance andis controlled by ecosystem interactions. Once in an alien environment, intro-duced species can turn out to be a threat, bringing about untold and oftenundesirable imbalances in the ecosystem (Anil, Venkat, Sawant, et al. 2002). TheIAS (invasive alien species) are serious threats to global biodiversity, second inimportance only to habitat loss (Baltz 1991; Hayes and Sliwa 2003). Invasionsare generally taken note of only when their impacts are felt. The impactsdirectly experienced by the society can be economical (loss of fishery or wateras a resource) and human health related (for example, cholera epidemic, toxicitydue to micro algal contamination). The ecological impacts, on the other hand,
11
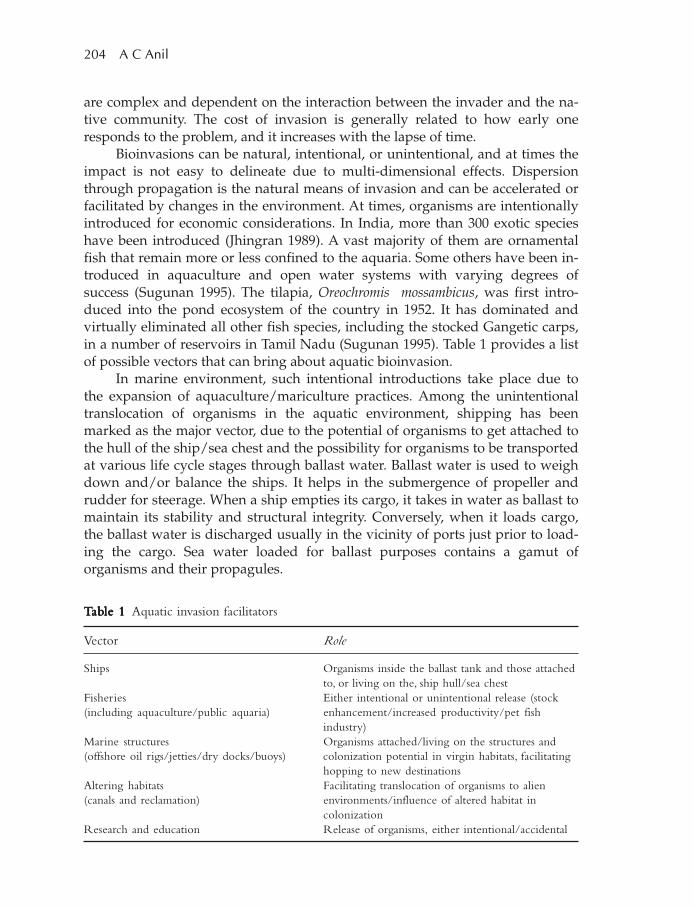
204 A C Anil
are complex and dependent on the interaction between the invader and the na-tive community. The cost of invasion is generally related to how early oneresponds to the problem, and it increases with the lapse of time.
Bioinvasions can be natural, intentional, or unintentional, and at times theimpact is not easy to delineate due to multi-dimensional effects. Dispersionthrough propagation is the natural means of invasion and can be accelerated orfacilitated by changes in the environment. At times, organisms are intentionallyintroduced for economic considerations. In India, more than 300 exotic specieshave been introduced (Jhingran 1989). A vast majority of them are ornamentalfish that remain more or less confined to the aquaria. Some others have been in-troduced in aquaculture and open water systems with varying degrees ofsuccess (Sugunan 1995). The tilapia, Oreochromis mossambicus, was first intro-duced into the pond ecosystem of the country in 1952. It has dominated andvirtually eliminated all other fish species, including the stocked Gangetic carps,in a number of reservoirs in Tamil Nadu (Sugunan 1995). Table 1 provides a listof possible vectors that can bring about aquatic bioinvasion.
In marine environment, such intentional introductions take place due tothe expansion of aquaculture/mariculture practices. Among the unintentionaltranslocation of organisms in the aquatic environment, shipping has beenmarked as the major vector, due to the potential of organisms to get attached tothe hull of the ship/sea chest and the possibility for organisms to be transportedat various life cycle stages through ballast water. Ballast water is used to weighdown and/or balance the ships. It helps in the submergence of propeller andrudder for steerage. When a ship empties its cargo, it takes in water as ballast tomaintain its stability and structural integrity. Conversely, when it loads cargo,the ballast water is discharged usually in the vicinity of ports just prior to load-ing the cargo. Sea water loaded for ballast purposes contains a gamut oforganisms and their propagules.
TTTTTababababable 1le 1le 1le 1le 1 Aquatic invasion facilitators
Vector Role
Ships Organisms inside the ballast tank and those attachedto, or living on the, ship hull/sea chest
Fisheries Either intentional or unintentional release (stock(including aquaculture/public aquaria) enhancement/increased productivity/pet fish
industry)Marine structures Organisms attached/living on the structures and(offshore oil rigs/jetties/dry docks/buoys) colonization potential in virgin habitats, facilitating
hopping to new destinationsAltering habitats Facilitating translocation of organisms to alien(canals and reclamation) environments/influence of altered habitat in
colonizationResearch and education Release of organisms, either intentional/accidental
A perspective of marine bioinvasion 205
A recent review shows that 205 taxa, not native to the Indian waters, havebeen introduced into the Indian waters since 1960 from various seas. The studyalso points out that maritime traffic could have acted as an important vector(Subba Rao 2005).
Examples of marine bioinvasion
Many cases of marine bioinvasion have been reported and their harmful effectson the ecosystem and human health have been documented (Anil, Venkat,Sawant, et al. 2002). Few examples are as follows. Mnemiopsis leidyi, an opaque comb jellyfish, about 10 centimetre long, entered
the Black Sea in early 1980s as a stowaway in ballast water on a ship from theUnited States. M. leidyi, which had until then lived in bays along the easternseaboard of the United States, encountered no predators in the Black Sea butfood in plenty. It devoured the eggs and larvae of a wide variety of fish thatled to a collapse of the fishing industry. The fish catch fell by 90% in six years.By 1990, the total biomass of M. leidyi in the Black Sea had reached an esti-mated 900 million tonnes; 10 times the total annual fish catch from all theworld’s oceans (Pearce 1995).
The zebra mussel, Dreissena polymorpha, was first discovered in NorthAmerica in Lake St Clair, Michigan, in 1988. This species is native to Europeand is believed to have been introduced in 1983 or 1984 from transoceanicships that discharged freshwater ballast containing planktonic larvae oryoung adults (Ahlstedt 1994). It has now spread, infesting more than 40% ofthe United States waterways. It fouls the cooling water intakes of the indus-try, and may have five billion dollars in control measures since 1984(Globallast 2001).
Black-stripped mussel, Mytilopsis sallei, has been reported from Mumbai andVisakhapatnam (Karande and Menon 1975; Raju, Rao, and Viswanadham1988). This species is a native to tropical and subtropical Atlantic waters andis reported to have invaded the Indian waters sometime during 1960s. It hasalso spread to Hong Kong and invaded Australian waters.
Vibrio cholerae 01 and 0139 are the causative bacteria for the human epidemiccholera, and can be transported through ballast water (Ruiz, Rawlings,Dobbs, et al. 2000). There is a strong evidence linking cholera epidemicand climate (Colwell 1996; Lobitz, Beck, Huq et al. 2000; Ruiz, Rawlings,Dobbs, et al. 2000). As the bacteria are capable of forming associationswith plankton, their survival and sojourn in the ballast water tanks aremuch easier.
The impact of HAB (harmful algal blooms) on human health, fisheryresources, and marine ecosystems is recognized increasingly in the pasttwo decades. Many causes, both natural and anthropogenic, have been attri-buted to the geographic spread of HAB. Ballast water carried by the ship has
206 A C Anil
also been identified as one of the responsible vectors. In the 1970s, the PSP(paralytic shellfish poisoning), a toxin syndrome caused by consumption ofseafood contaminated by certain HAB species, was mostly recorded in thenorthern hemisphere. Since then, there has been a cumulative global increasein the recorded distribution of the causative organisms and the confirmed ap-pearance of PSP toxins in shellfish at levels above the regulatory limit forhuman consumption (GEOHAB 2001).
Success of marine bioinvasion
Versatility in terms of resistance to grazers and predators, high tolerance to abi-otic factors, high rate of reproduction and/or fast vegetative growth, capabilityof hermaphroditic reproduction, and ability to hibernate or rejuvenate underunfavourable/favourable conditions are some of the features that determine thesuccess of invasion by an organism.
The European green crab, Carcinus maenas, which has invaded west coastof North America, South Africa, and Australia has fewer parasites in the regionsof introduction, which has helped in its successful establishment (Torchin,Lafferty, and Kuris 2002). Such facilitation is enhanced due to the lack of spe-cific predators in the introduced environment. A recent trend in the invasionliterature (Colautti, Ricciardi, Grigorovich, et al. 2004) relates the success of NIS(non-indigenous species) with the number of co-occurring enemies (that is, en-emy release hypothesis or ERH). The ERH assumes: (1) NIS are affected byfewer enemies than those in the source region, (2) NIS are less affected byenemies native to the invaded region, (3) enemies co-introduced with their hostswill behave similarly in the invaded and source regions, and (4) release fromnatural enemies of the source region results in increased vigour and advantageover the competitors in the invaded region.
Altering the environment has also been shown to influence the invasionsuccess. Examples of such catastrophes are reported from the Black Sea and theMediterranean Sea. A review on biological invasions as a component of globalchange in stressed marine ecosystems (Occhipinti-Ambrogi and Savini 2003)points out that stressed environments are easily colonized by alien species; un-derstanding the links between human and natural disturbance and massivedevelopment of NIS will help prevent marine bio-invasions that are alreadyfavoured by global oceanic trade.
Pacific oyster (Crassostrea gigas) took nearly 17 years before a large popula-tion of several million oysters became established on natural mussel beds in thenorthern Wadden Sea and eastern North Sea. A report (Diederich, Nehls, vanBeusekom, et al. 2005) indicates that further invasion will depend on high latesummer water temperatures. Spider crab (Hyas araeneus) has recently been re-ported as one of the first known benthic invasive species in the Southern OceanAntarctic Peninsula (Tavares and DeMelo 2004). The warming Antarctica is
A perspective of marine bioinvasion 207
being exposed to two complimentary forces: (1) human-mediated transport ofexotic species (Barnes 2002); and (2) polar warming (Gille 2002), leading tochanges in the barrier formed by the circumpolar freezing temperatures. Combi-nation of these two forces can have unpredictable consequences for Antarcticmarine biota and this clearly points out that the invasion pathways can be influ-enced by global climate change.
Role of ballast water in marine bioinvasion
Shipping is the backbone of global economy and facilitates transportation of90% of the commodities. A single bulk cargo ship of 200 000 tonnes can carry upto 60 000 tonnes of ballast water. It is estimated that 2–3 billion tonnes of ballastwater is carried around the world each year. Translocation of organisms throughships is considered to be one of the important issues that are threatening thenaturally evolved biodiversity, and consequences of such invasions are beingrealized increasingly in the recent years.
The IMO (International Maritime Organization), a specialized agency forthe United Nations, is responsible for the international regulation of ship safetyand prevention of marine pollution. It has been working through its memberstates to tackle the problem of ballast water since 1973. It adopted the Interna-tional Convention for the Control and Management of Ships Ballast Water andSediments in 2004. The main management measure recommended under the ex-isting IMO ballast water guidelines is the ballast exchange at sea. It is widelyrecognized that this approach has many limitations including serious safetyconcerns and the fact that translocation of species can still occur even when avessel has undertaken complete ballast exchange.
The International Convention on Ballast Water Management for Ships willrequire all new ships to implement a Ballast Water and Sediments Managementplan (IMO News 2004). All new ships will also have to carry a Ballast WaterRecord Book and will be required to carry out ballast water management proce-dures to a given standard. Existing ships will be required to do the same butafter a phase-in period.
The convention includes ballast water exchange standard (based on thelogic that the organism from the open ocean waters is less damaging to thecoastal habitats) and a ballast water performance standard (based on the qualityof ballast water that can be discharged).
Ballast water exchange standard states that ships performing ballast water ex-change shall do so with an efficiency of 95% volumetric exchange of ballastwater. For ships exchanging ballast water by the pumping through method,pumping through three times the volume of each ballast water tank shall beconsidered to meet the standard described. Pumping through less than threetimes the volume may be accepted, provided the ship can demonstrate that atleast 95% volumetric exchange is met.
208 A C Anil
Ballast water performance standard states that ship conducting ballast watermanagement shall discharge less than 10 viable organisms per cubic metregreater than or equal to 50 µm (micrometres) in minimum dimension and lessthan 10 viable organisms per millilitre less than 50 µm in minimum dimensionand greater than or equal to 10 µm in minimum dimension. Discharge of theindicator microbes shall not exceed the specified concentration.
Under Ballast Water Exchange, all ships using ballast water exchangeshould, whenever possible, conduct water exchange at least 200 nautical milesfrom the nearest land and in water at least 200 metres in depth, taking into ac-count guidelines developed by the IMO. Ships unable to conduct ballastwater exchange as above can do so as far from the nearest land as possible,and in all cases at least 50 nautical miles, from the nearest land and in water atleast 200 metres in depth. All ships shall remove and dispose of sedimentsfrom spaces designated to carry ballast water in accordance with the provi-sions of the ship’s ballast water management plan. Parties to the conventionare given the option to take additional measures before ships would be allowedto enter their ports. Such additional measures are subject to criteria set in theconvention and to the IMO guidelines yet to be developed, and may alsoinclude additional controls applicable to discharge and/or uptake areas ofballast water.
Meeting ballast water performance standard, as stated in the convention,will require development of suitable technologies. A conservative estimate indi-cates such technologies would cost from 100 000 dollars to 300 000 dollars. Ifthese are to be installed in ships (75 000) and if an average of 200 000 dollars isconsidered, the BWT (ballast water treatment) would cost 15 billion dollars. Therunning cost is estimated to be 666 million dollars, considering a cost of3.7 cents/tonne with an average of 40 000 tonnes/ship for 75 000 ships for sixexchanges a year. The technology that will be acceptable will have to prove itsworth with reference to biological performance; power requirements and pre-dictability; temperature and energy efficiency; operational and maintenanceissues; by-products and residuals; and environmental acceptability. There areseveral technological options that are under consideration to treat ballast water(Raaymakers 2003; Matheickal and Raaymakers 2004) and some of the optionsthat are being pursued are given below.
Ballast water treatment systems
Ballast water treatment by filtration Self-cleaning screen-filtration systems areone of the technological options for ballast water management. The technolo-gies currently available off the shelf are not designed to meet the requirementsof normal ballasting operations. Considerable modifications and system re-engi-neering have to be done to develop a dedicated ballast water filtration system.Several alternative technological options for pathogen inactivation (for example,
A perspective of marine bioinvasion 209
ultravoilet, ultrasound) would require a pre-filtration stage for removal of largerparticles in ballast water. It appears that identification of suitable filtration mate-rial, which is corrosion resistant, will also play an important role. Technologicaladvancements to filter smaller-sized particles (for example, 10 µm and above),which can be effective in the removal of dinoflagellates and its cysts, need to bepursued.
Ballast water treatment by ozonation Ozone is used for disinfection in anumber of applications ranging from grey water treatment, treatment of potablewater to those related to industrialized process such as aquaculture and electric-ity production. Application of ozone as an option to treat ballast water has toaddress concerns of corrosivity of ozone-treated sea-water and the footprintrequirement of the installations.
Ballast water treatment by heat The option of heating ballast water to atemperature sufficiently high to minimize or eliminate the translocation ofharmful organisms is also under consideration. The treatment is environmen-tally attractive since waste engine heat can be used and could be better thanocean exchange. However, in ships where there is no waste heat available, thistreatment method could turn out to be expensive. It also appears that thismethod may not be adequate (under the existing conditions in ship) to addressthe threats from bacteria and viruses. Vertical gradient variation in temperatureinside ballast tanks is an important concern that needs careful considerationwhile using heat treatment.
Ballast water treatment by de-oxygenation A high-speed ballast water treat-ment system that uses a vacuum chamber to remove dissolved oxygen fromballast water, resulting in low oxygen condition within the ballast tank/hold, isalso explored as a possible technology.
Ballast water treatment by electro-ionization Electro-ionization technologyhas been used in freshwater treatment applications but has never been testedwith marine or brackish water samples. Claims that have been patented includea kill of over 90% of the bacteria in 300 litres of water within just 2-minute con-tact time treatment and kill of all detectable organisms in 15 minutes of contacttime treatment. This works on electro-ionization magnetic separation technique.
Ballast water treatment by gas supersaturation Gas supersaturation is knownto affect multicellular organisms, especially when subjected to low hydrostaticpressure. The organisms may suffer from embolism and haemorrhages. Optimi-zation of a technique using this principle can have application in ballast watertreatment. However, it is to be noted that the effect depends on vascularizationof the organism and may not affect organisms such as dinoflagellates. Gas su-persaturation may also aid in removal of passivation film in the tanks, andpromote sulphur-reducing bacteria and corrosion.
Ballast water treatment by chemicals Use of potential biocides, both naturaland chemical, is being explored. The most immediate concern for this pathwayis the impacts of the product thus developed on the non-target organism
210 A C Anil
once discharged into the environment and the bioaccumulation. The biocidedeveloped will have to go through rigorous environmental safety check.
Ship design and operational issues A design of ballast system that wouldpermit continuous flow through exchange of ballast water is a possibility that isbeing explored.
The future
In most of the cases, the emphasis in bioinvasion research has been on incursionmanagement. Hicks (2003) points out that aquatic bioinvasion research has beenmostly reactive or curative and grossly inadequate in preventative research (in-vestigations designed to put one on the front foot by pro-prediction, riskassessment, and decision-support systems). The mantra of bioinvasion manage-ment should be ‘prevention is better than cure’. If an aquatic invasion isprevented then the battle is won; the other options have their own limitations.
Invasion detections always take place with reference to natural history ofthe habitat. In most of the situations, invasions become apparent only when theeffects/presence are visible. Historical data and description of fauna and floraof a geographic region are the vital basis for the determination of bioinvasions.Lack of linkage to a potential invasion pathway in several exploratory investiga-tions leads to recording of organisms as mere new reports from the area ofcollection. Rising awareness of marine invasion impacts has led to protocolsthat intensively explore habitats of possible introduction (for example, ports/drilling platforms). The aim of such protocols is to detect the rare, so as to pro-vide incursion management a practical control option. Useful reference in thiscontext is the protocol developed by the Center for Research on Introduced Ma-rine Pests (Hobart, Tasmania, Australia) (Hewitt and Martin 2001). This wasadopted by the Global Ballast Water Management Programme (executed by theIMO) in its pilot project to track invaders in six countries (Brazil, China, India,Islamic Republic of Iran, South Africa, and Ukraine) through port biologicalbaseline surveys. This protocol is being suitably adopted for the expansion ofthe initiatives in India.
Acknowledgement
The support and encouragement by Dr S R Shetye, Director, National Insitituteof Oceanography, is gratefully acknowledged.
References
Ahlstedt S A. 1994Invasion and impacts of the zebra mussel in the United StatesJournal of Shellfish Research 13: 330–333
A perspective of marine bioinvasion 211
Anil A C, Venkat K, Sawant S S, Dileepkumar M, Dhargalkar V K, Ramaiah N,Harkantra S N, Ansari Z A. 2002Marine bioinvasion: concern for ecology and shippingCurrent Science 83 (3): 214–218
Barnes D K A. 2002Biodiversity, invasions by marine life on plastic debrisNature 416: 808–809
Baltz D M. 1991Introduced fishes in marine systems and inland seasBiological Conservation 56: 151–177
Colwell R R. 1996Global climate and infectious disease: the cholera paradigmScience 274: 2025–2031
Colautti R I, Ricciardi A, Grigorovich I A, MacIsaac H J. 2004Is invasion success explained by the enemy release hypothesis?Ecology Letters 7: 721–733
Diederich S, Nehls G, van Beusekom J E E, Reise K. 2005Introduced pacific oysters (Crassostrea gigas) in the northern Wadden Sea:invasion accelerated by warm summers?Helgolander Marine Research 59: 97–106
Gille S T. 2002Warming of the Southern Ocean since 1950sScience 295: 1275–1277
GEOHAB (Global Ecology and Oceanography of Harmful Algal Blooms ). 2001Global ecology and oceanography of harmful algal bloomsIn Science Plan, edited by P Gilbert and G PitcherBaltimore and Paris: SCOR (Scientific Committee on Oceanic Research) and IOC(Intergovernmental Oceanographic Commission). 86 pp.
Globallast. 2001Stopping the ballast water stowawaysLondon: International Maritime Organization. 8 pp.[Global Ballast Water Management Programme, March 2001, InternationalMaritime Organization]
Hayes K R and Sliwa C. 2003Identifying potential marine pests—a deductive approach applied to AustraliaMarine Pollution Bulletin 46: 91–98
212 A C Anil
Hewitt C L and Martin R B. 2001Revised Protocols for Baseline Port Surveys for Introduced Marine Species:survey design, sampling protocols and specimen handlingHobart, Australia: CSIRO Marine Research. 46 pp.[Center for Research on Introduced Marine Pests, Technical report no. 22,CSIRO Marine Research, Hobart, Australia. 46 pp.
Hicks G R F. 2003Turning the Tide: is aquatic bioinvader research heading in the right direction?[12th International Conference on Aquatic Invasive Species, Windsor, Ontario,Canada, 9–12 June 2003, hosted by the Ontario Ministry of Natural Resources,Abstracts page 9, 159 pp.
IMO News. 2004IMO adopts new convention to counter ballast water threatInternational Maritime Organization, London. Issue 1: p. 5
Jhingran A G. 1989Role of exotic fishes in capture fishery waters of IndiaIn Conservation and Management of Inland Capture Fisheries Resources of India, editedby A G Jhingran and V V SugunanBarrackpore: Inland Fisheries Society of India, CIFRI (Central Inland CapturedFisheries Research Institute). 275 pp.
Karande A A and Menon K B. 1975Mytilopsis sallei, a fresh immigrant in Indian harboursBulletin of the Department of Marine Science University Cochin, VII 2: 455–466
Lobitz B, Beck L, Huq A, Wood B, Fuchs G, Faruque A S G, Colwell R R. 2000Climate and infectious disease: use of remote sensing for detection of Vibriocholerae by indirect measurementProceedings of the National Academy of Science USA 97: 1438–1443
Matheickal J and Raaymakers S (eds). 2004GloBallast Monograph Series No. 15London: IMO (International Maritime Organization)[Proceedings of the Second International Ballast Water Treatment R&D Symposium,21–23 July 2003, IMO, London]
Occhipinti-Ambrogi A and Savini A. 2003Biological invasions as a component of global change in stressed marineecosystemsMarine Pollution Bulletin 46: 542–551
Pearce F. 1995How the Soviet seas were lostNew Science 2003: 38–42
A perspective of marine bioinvasion 213
Raju G J V J, Rao K S, and Viswanadham B. 1988Recruitment of the fouling Bivalve, Mytilopsis sallei (Recluz), on metallic andnon-metallic surfaces at Visakhapatnam harbour, IndiaIn Marine Biodeterioration: advanced techniques applicable to the Indian Ocean,pp. 513–525, edited by M F Thompson, R Sarojini, and R NagabhushanamNew Delhi: Oxford and IBH. 826 pp.
Raaymakers S. 2003GloBallast Monograph Series No. 5London: International Maritime Organization[Proceedings of the First International Ballast Water Treatment R&D Symposium,26–27 March 2001, IMO, London]
Ruiz G H, Rawlings T K, Dobbs F C, Drake L A, Mullady T, Huq A, Colwell R R.2000Global spread of microorganisms by shipsNature 408: 49–50
Subba Rao, D. V. 2005Comprehensive review of the records of the biota of the Indian seas andintroduction of non-indigenous speciesAquatic Conservation: Marine and Freshwater Ecosystems 15: 117–146
Sugunan V V. 1995Reservoir Fisheries of India[FAO Fisheries Technical Paper 345]Rome: Food and Agriculture Organization. 423 pp.
Tavares M and DeMelo G A S. 2004Discovery of the first known benthic invasive in the Southern Ocean, the NorthAtlantic spider crab Hyas areaneus found in the Antarctic PeninsulaAntarctic Science 16 (2): 129–131
Torchin M E, Lafferty K D, and Kuris A M. 2002Parasites and marine invasionsParasitology 124: S137–S151
214 Mairi Jay
World trade and protection of nativebiodiversity from alien organisms:New Zealand case study
Mairi Jay
This paper explores the issue of protection of indigenous biodiversity in theface of growing biosecurity threats related to globalization of the world tradewith using New Zealand as a case study.
As an island that has been separated from continental landmasses for60 million years, New Zealand presents a graphic example of the impacts ofintroduced alien species during the past few hundred years. In consequence ofthe economic and ecological impacts of invasive alien species, New Zealandhas developed sophisticated institutional responses for countering their effects.This paper briefly outlines recent trends in global trade and travel, the natureof World Trade Organization regulations and phytosanitary measures that relateto biosecurity, the implications of trade and travel patterns for invasion of alienspecies as these have been manifest in New Zealand, and the development ofNew Zealand’s institutional systems for countering the effects of invasive alienspecies.
Introduction
Biological diversity within and between the species and ecosystems is widelyrecognized as a prerequisite for global environmental resilience, as well as asource of critical goods and services for humanity (Daily 1997; Gaston andSpicer 2004; Mooney, Lubchenko, Dirzo, et al. 1995). Conservation of nativebiodiversity has been recognized as an issue of worldwide importance. It is oneof the principles articulated in the World Conservation Strategy (IUCN/UNEP/WWF 1991) and the Earth Summit principles of Agenda 21 (UN 1992).
At the same time, scientists have become increasingly concerned at thedamage to native ecosystems and species resulting from the spread and
For correspondence: [email protected]
12
World trade and protection of native biodiversity from alien organisms 215
naturalization of non-indigenous species into areas where they have not beenpreviously recorded (Baskin 2002; Bright 2001; Pimental 2002; Pimental, Lach,Zuniga, et al. 2000; Schmitz and Simberloff 1997; Simberloff 2004).
The IUCN (SSC 2000: 3) has defined ‘alien invasive species’ as ‘an alienspecies which becomes established in natural or semi-natural ecosystems orhabitat, is an agent of change, and threatens native biological diversity’. ‘Bio-logical invasion’ or ‘alien invasion’ are the terms used to describe thenaturalization and spread of unwanted organisms into areas outside their homerange. The Species Survival Commission of the IUCN suggests that the effects ofalien invasive species may be as damaging to native species and ecosystems asthe loss and degradation of habitats (SSC 2000: 1).
Not all invasive organisms are damaging, economically, ecologically, orotherwise. By far, the majority of exotic organisms that become established in anew area remain localized or unproblematic (Richardson Pysek, Rejmanek, et al.2000; Williams and West 2000). Nevertheless, separately or in combination withother changes (such as climate change or habitat degradation), the spread of al-ien species has been a major threat to the conservation of biodiversity. TheIUCN (SSC 2000) summarizes the issue as follows.
‘The scope and cost of biological alien invasions is global and enor-mous, in both ecological and economic terms. Alien invasive speciesare found in all taxonomic groups: they include introduced viruses,fungi, algae, mosses, ferns, higher plants, invertebrates, fish, amphib-ians, reptiles, birds, and mammals. They have invaded and affectednative biota in virtually every ecosystem type on Earth. Hundreds ofextinctions have been caused by alien invasives. The ecological cost isthe irretrievable loss of native species and ecosystems.’
Furthermore, scientists expect threats to native biodiversity to increase as aconsequence of environmental changes such as land-use change, degradation ofhabitat, global atmospheric change (particularly its influence on fire and extremeweather events), globalization of economies, and susceptibility of disturbedecosystems to invasive species (Baskin 2002; Mooney and Hobbs 2000).
Di Castri (1989: 27) has proposed three major ‘crises’ of biological invasionin recent geological time, all related to human population movement and ac-companying plants and animals associated with humans. They include apre-historic wave linked to the introduction and spread of agriculture; a secondperiod, around AD 1500, when barriers of the biogeographical realms were bro-ken owing to new transportation systems; and the present period of rapidglobal communication where, due to the speed and mobility of contemporaryforms of transport, species or their propagules (seeds, eggs, and pupae) canmove across and between continents within hours.
Charles Elton was one of the earliest biologists to bring the problems asso-ciated with biological invasion to general scientific attention with his book
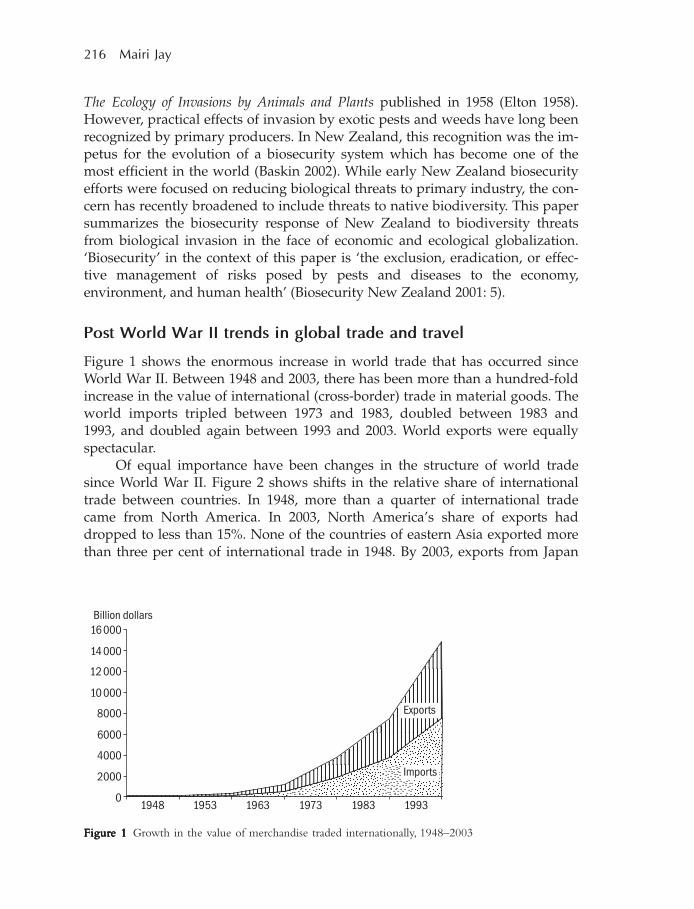
216 Mairi Jay
The Ecology of Invasions by Animals and Plants published in 1958 (Elton 1958).However, practical effects of invasion by exotic pests and weeds have long beenrecognized by primary producers. In New Zealand, this recognition was the im-petus for the evolution of a biosecurity system which has become one of themost efficient in the world (Baskin 2002). While early New Zealand biosecurityefforts were focused on reducing biological threats to primary industry, the con-cern has recently broadened to include threats to native biodiversity. This papersummarizes the biosecurity response of New Zealand to biodiversity threatsfrom biological invasion in the face of economic and ecological globalization.‘Biosecurity’ in the context of this paper is ‘the exclusion, eradication, or effec-tive management of risks posed by pests and diseases to the economy,environment, and human health’ (Biosecurity New Zealand 2001: 5).
Post World War II trends in global trade and travel
Figure 1 shows the enormous increase in world trade that has occurred sinceWorld War II. Between 1948 and 2003, there has been more than a hundred-foldincrease in the value of international (cross-border) trade in material goods. Theworld imports tripled between 1973 and 1983, doubled between 1983 and1993, and doubled again between 1993 and 2003. World exports were equallyspectacular.
Of equal importance have been changes in the structure of world tradesince World War II. Figure 2 shows shifts in the relative share of internationaltrade between countries. In 1948, more than a quarter of international tradecame from North America. In 2003, North America’s share of exports haddropped to less than 15%. None of the countries of eastern Asia exported morethan three per cent of international trade in 1948. By 2003, exports from Japan
FigurFigurFigurFigurFigure 1e 1e 1e 1e 1 Growth in the value of merchandise traded internationally, 1948–2003
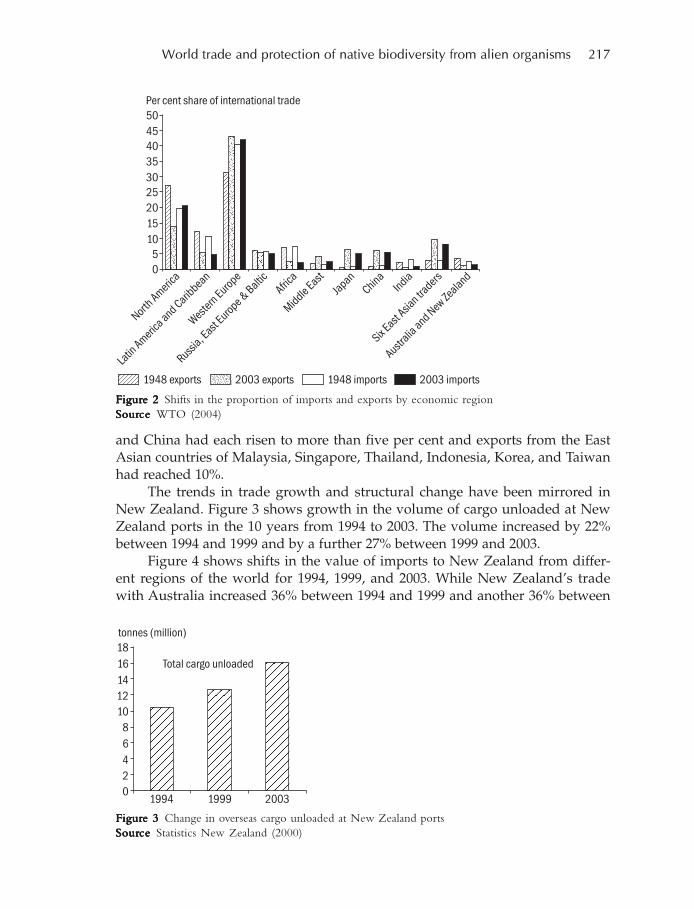
World trade and protection of native biodiversity from alien organisms 217
and China had each risen to more than five per cent and exports from the EastAsian countries of Malaysia, Singapore, Thailand, Indonesia, Korea, and Taiwanhad reached 10%.
The trends in trade growth and structural change have been mirrored inNew Zealand. Figure 3 shows growth in the volume of cargo unloaded at NewZealand ports in the 10 years from 1994 to 2003. The volume increased by 22%between 1994 and 1999 and by a further 27% between 1999 and 2003.
Figure 4 shows shifts in the value of imports to New Zealand from differ-ent regions of the world for 1994, 1999, and 2003. While New Zealand’s tradewith Australia increased 36% between 1994 and 1999 and another 36% between
FigurFigurFigurFigurFigure 2e 2e 2e 2e 2 Shifts in the proportion of imports and exports by economic regionSourSourSourSourSourcecececece WTO (2004)
FigurFigurFigurFigurFigure 3e 3e 3e 3e 3 Change in overseas cargo unloaded at New Zealand portsSourSourSourSourSourcecececece Statistics New Zealand (2000)
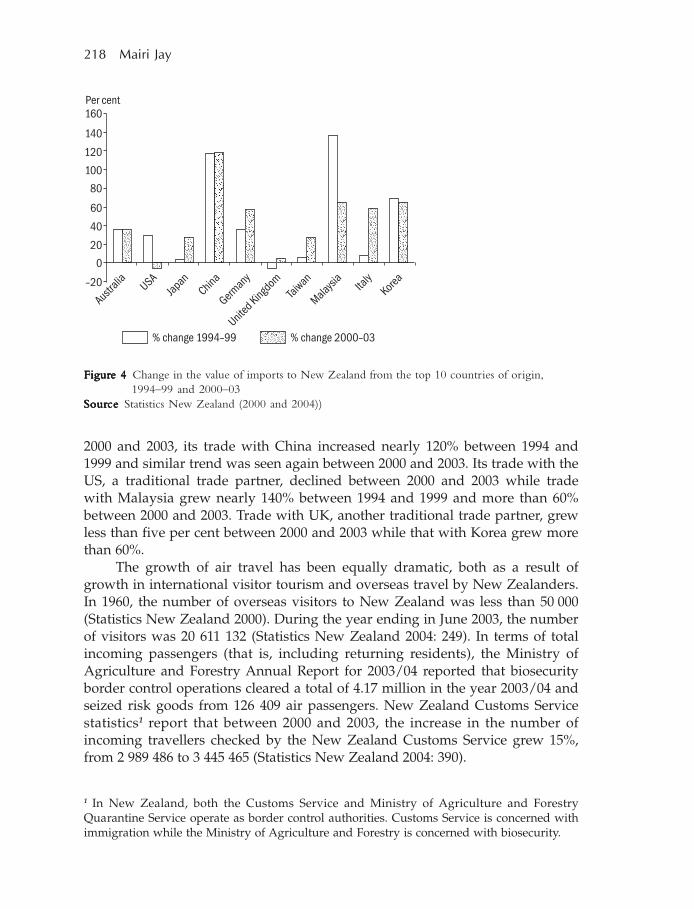
218 Mairi Jay
2000 and 2003, its trade with China increased nearly 120% between 1994 and1999 and similar trend was seen again between 2000 and 2003. Its trade with theUS, a traditional trade partner, declined between 2000 and 2003 while tradewith Malaysia grew nearly 140% between 1994 and 1999 and more than 60%between 2000 and 2003. Trade with UK, another traditional trade partner, grewless than five per cent between 2000 and 2003 while that with Korea grew morethan 60%.
The growth of air travel has been equally dramatic, both as a result ofgrowth in international visitor tourism and overseas travel by New Zealanders.In 1960, the number of overseas visitors to New Zealand was less than 50 000(Statistics New Zealand 2000). During the year ending in June 2003, the numberof visitors was 20 611 132 (Statistics New Zealand 2004: 249). In terms of totalincoming passengers (that is, including returning residents), the Ministry ofAgriculture and Forestry Annual Report for 2003/04 reported that biosecurityborder control operations cleared a total of 4.17 million in the year 2003/04 andseized risk goods from 126 409 air passengers. New Zealand Customs Servicestatistics1 report that between 2000 and 2003, the increase in the number ofincoming travellers checked by the New Zealand Customs Service grew 15%,from 2 989 486 to 3 445 465 (Statistics New Zealand 2004: 390).
1 In New Zealand, both the Customs Service and Ministry of Agriculture and ForestryQuarantine Service operate as border control authorities. Customs Service is concerned withimmigration while the Ministry of Agriculture and Forestry is concerned with biosecurity.
FigurFigurFigurFigurFigure 4e 4e 4e 4e 4 Change in the value of imports to New Zealand from the top 10 countries of origin,1994–99 and 2000–03
SourSourSourSourSourcecececece Statistics New Zealand (2000 and 2004))
World trade and protection of native biodiversity from alien organisms 219
New Zealand’s native biodiversity in the face of alien invasivespecies
As an island nation, New Zealand has experienced both advantages and disad-vantages from its biological isolation. It has benefited from an agriculture thathas remained relatively free of pests and diseases found elsewhere, and this hashelped primary production to remain highly competitive in global terms. Con-versely, an evolutionary process that has involved isolation for 60 million yearsor more has left native species and ecosystems particularly vulnerable to the ef-fects of alien species (Brown 1989; Clout and Lowe 2000).
New Zealand has experienced catastrophic losses to its native biodiversityas a consequence of the impacts of invasive alien species. Almost all the inva-sive alien species were deliberately introduced by people. The Polynesians,arriving about 700 years ago, brought with them Polynesian rat. Humans andrats were instrumental in the extinction of some 35 native birds. Next came theEuropeans from the 17th century onwards. Wilson (2004: 134–135) lists 18 spe-cies of birds that have become extinct since European colonization whileanother seven species have become extinct on mainland New Zealand, but sur-vive on the outlying islands. In 1997, the Ministry for the Environmentpublished a national State of the Environment report which stated that‘Biodiversity decline is New Zealand’s most pervasive environmental issue,with 85% of lowland forests and wetlands now gone, and at least 800 speciesand 200 subspecies of animals, fungi, and plants considered threatened’ (Taylor,Smith, Cochrane, et al. 1997).
An ecological consequence of the increasingly rapid and globalized flow ofgoods and people is the unintended introduction of new organisms into thecountry. According to a report from New Zealand’s Parliamentary Commis-sioner for the Environment (PCE 2000), there are now some 25 000 exoticvascular plants in New Zealand, the vast majority (75%) brought in as gardenplants. The number of naturalized exotic plants (2071) now exceeds the numberof native vascular plants (2055). Of the naturalized exotic plants, the Depart-ment of Conservation considers more than 240 as weeds that actually orpotentially threaten the survival of nationally rare or endangered native plants(PCE 2000). Nearly all types of native plant communities have been affected, in-cluding subalpine, tussock grasslands, frostflats, herbfields, montaineshrublands, freshwater wetlands, and a complete range of forest types (PCE2000). According to Williams and Timmins (2002), more than half the natural ar-eas with high conservation value under the administration of the Department ofConservation require weed control to protect their conservation value, and costsof weed control by the Department continue to rise. Williams and Timmins(2002) argue that current control efforts by the Department are insufficient tocontrol the spread of weeds to some native ecosystems, and that there is a majordisparity between the size of the problem and the funding provided to stem the
220 Mairi Jay
threat. They consider that despite increases in Departmental funding, weedinvasion of certain ecosystem types is occurring at rates that will require tens ofmillions of dollars to treat in a few decades.
The last three decades of the 20th century have seen an increasing expo-sure of New Zealand’s native ecology to a new range of species from all parts ofthe globe. The ecological consequences of human settlement continue to rippleas possums, goats, stoats, wasps, and other ecologically destructive organismsmake their way to the furthermost corners of New Zealand. More recently, NewZealand’s participation in global trade and travel has resulted in even greaterthreat of biological invasion and ecosystem disturbances. Ecological relation-ships and processes become more and more hybrid of native and exotic, asnatural communities experience shuffling and reshuffling of species with newaliens becoming naturalized and resident species becoming displaced.
World Trade Organization sanitary and phytosanitary regulations
The WTO (World Trade Organization) is an international body that regulates in-ternational trade by an agreement of its 146 member countries. At its heart arethe WTO agreements, negotiated and signed by the bulk of the world’s tradingnations (WTO 2005: 9). Its functions include administration of trade agreements,providing a forum for trade negotiations and dispute resolution, monitoringnational trade policies, and provision of technical assistance and training todeveloping countries. The main aim and effect of the organization is trade liber-alization and reduction of trade barriers. It credits the rapid rise in trade sinceWorld War II partly to the liberating trade effects of its predecessor, the GATT(General Agreement on Tariffs and Trade), and its own operations since its es-tablishment in 1995. Membership of the organization is voluntary but to retainmembership, countries must abide by rules of trade that have been reached bynegotiated agreement.
From an environmental and biosecurity perspective, a key element of theWTO is the ‘SPS Agreement’ (Sanitary and Phytosanitary Agreement). This is aset of rules that apply to food safety and animal and plant health (WTO 1994).The aim of this Agreement is to enable governments to provide for health pro-tection of people, plants, and animals to levels they deem appropriate, providedthat such measures are not used for trade protection (WTO 1998). Sanitary andphytosanitary measures are defined by the SPS Agreement as any measures ap-plied to protect human or animal life from risks arising from additives, contami-
nants, toxins, or disease-causing organisms in their food; to protect human life from diseases carried by plants or animals; to protect animal or plant life, including fish and wild fauna, as well as
forests and wild flora, from pests, diseases, or disease-causing organisms (forexample, invasive alien organisms); and
World trade and protection of native biodiversity from alien organisms 221
to prevent or limit other damage to a country from the entry, establishment,or spread of pests.
Countries have the right to impose measures to protect human, animal, orplant health to the level they deem necessary, but only if the measures they useare consistent with the SPS principles. SPS measures must be necessary, basedon scientific principles, and not maintained without scientific evidence. Membercountries may not discriminate between countries or between imported and do-mestically produced goods (Biosecurity New Zealand 2004/05).
The SPS Agreement works by challenge and negotiation. Any exportingcountry may lodge a complaint with the WTO against sanitary or phytosanitarybarriers imposed by an importing country (Charnovitz 1999). The case goes to apanel of the WTO which hears the evidence from both sides, and then to theWTO Appellate Body. The Appellate Body delivers a final decision. If the deci-sion goes against the importing country and that country does not comply withthe decision, the WTO may authorize the complaining country to impose tradesanctions.
The provisions of the SPS Agreement are strongly weighted in favour offree trade. Biosecurity precautions must be demonstrably necessary for human,animal, or plant life or health; they must be based on defensible scientific evi-dence, and maintained only so long as they can be justified by science.Standards are weighted in favour of those sets by international bodies such asthe International Plant Protection Convention, the Codex Alimentarius Com-mission for food safety, and the Office International Des Epizooties for animalhealth and disease. While countries my impose standards that are lower thanthose set by international agencies, they must be able to justify any that arehigher.
In practical terms, the SPS measures prompt importing countries to iden-tify and establish levels of risk through formal risk assessment. Trade goods areassessed as possible vectors of pests and disease by assessing the likelihood thatthey provide pathways into the country. The SPS Agreement and related WTOjurisprudence indicate that a risk analysis will (Biosecurity New Zealand 2001) identify the organisms whose entry, establishment, or spread the importing
country wishes to prevent, identify for those organisms the associated potential biological, economic,
and environmental consequences of entry, establishment, or spread, evaluate the likelihood of the entry, establishment, and spread of those organ-
isms, and the associated potential biological, economic, and environmentalconsequences, and
evaluate how the sanitary or phytosanitary measures that might be appliedwould affect the likelihood of the entry, establishment, or spread of thoseorganisms.
222 Mairi Jay
The SPS provisions have significant practical implications for the protec-tion of indigenous biodiversity because they impose a burden of scientific proofon the importing country to demonstrate that protection measures are necessaryand sufficient. Liberalization of trade and strict requirements of the SPS provi-sions create an imperative either to expand the scientific infrastructureassociated with the risk assessment and biosecurity control, or to accept thedangers and cost of invasive organisms.
Firstly, scientific information and understanding of native species and eco-logical systems are often much less complete than they are for commercialspecies and ecosystems. Furthermore, political and social funding priorities arelikely to favour biosecurity research related to economic threats over ecologicalthreats. Hence scientific information on biodiversity protection is likely to beless readily available and less forthcoming compared to economic issues. Thisdifference is likely to be particularly great for the countries of the world thatsupport the greatest biological diversity, many of which are middle- or low-in-come countries.
Secondly, the process of registering or defending an SPS challenge in theWTO is expensive and does not necessarily achieve the desired outcome. It in-volves developing a scientifically valid case and presenting the case throughlegal representation. Charnovitz reflects on the WTO dispute between Canadaand Australia, concerned with the importation of salmon (WTO 1995), whereCanada complained against biosecurity controls imposed by Australia on theimportation of uncooked salmon. The Australian objection was on the basis ofpossible diseases of salmon that could be introduced if it were forced to acceptCanadian salmon. The WTO disputes committee ruled against Australia in fa-vour of the Canadians. Charnovitz (1999: 186) questions: ‘Who would bear thecost of the WTO panel being wrong about the danger of alien pathogens? Notthe panel surely. Not the Canadian exporter. Not the WTO. No, it would be Aus-tralia that would suffer the cost.’ He further comments, ‘Resolving the legaldispute is not equivalent to resolving the health dispute’ (Charnovitz 1999: 186).
New Zealand’s biosecurity responses to alien species invasions
New Zealand has developed a suite of institutional responses to the threatsposed by invasive alien species. The system has developed in response to differ-ent aspects of biosecurity threat. It reflects the country’s situation as a smallnation heavily dependent on international trade but with a native biota that isunique in many respects. While one part of the system has, traditionally, beenconcerned with alien species that threaten primary production (agriculture, hor-ticulture, and forestry), another part has been concerned with species thatthreaten native species and ecosystems.
The key agencies involved in biosecurity include the Ministry of Agricul-ture, the Department of Conservation, the Ministries of Health and Fisheries,
World trade and protection of native biodiversity from alien organisms 223
and 14 regional government councils. Together, these agencies are responsiblefor the following. Border control, including pre-border, border, and post-border actions (Minis-
try of Agriculture and Forestry). Management of alien pests and weeds that have become established in New
Zealand (14 separate regional government councils). Management and control of pests and weeds that threaten native biodiversity
within public conservation land (Department of Conservation). Management and control of pests and weeds that threaten human health
(Ministry of Health) or marine environments (Ministry of Fisheries).Prior to 1992, there was virtually no co-ordination or co-operation between
these different agencies. They operated independently of each other, each with anarrow mandate to attend to their specific responsibilities and concerns. In1993, the government passed the Biosecurity Act as a means to co-ordination be-tween different agencies. The Act established a Minister for Biosecurity and aBiosecurity Authority with administrative responsibility for biosecurity policyunder the umbrella of the Ministry of Agriculture and Forestry. Continued prob-lems with co-ordination and lack of integration between different agenciesprompted the creation in 1997 of the Biosecurity Council as an advisory body tothe Minister of Biosecurity. The Council is a multi-stakeholder body that in-cludes representatives from the relevant government departments, regionalcouncils, primary production interests, tourism, and environmental organiza-tions. In principle, a strength of the system was that it not only recognized andprovided for different biosecurity objectives (protection of human health, pri-mary production, native biodiversity, and marine environments) but alsoprovided a structure for leadership, integration, and co-ordination of biosecurityfunctions across different government departments and different spatial levelsof operation.
However, central government funding for biosecurity continued (and stillcontinues) to be allocated on a separate departmental basis (Agriculture andForestry, Conservation, Health and Fisheries) and each department maintainedseparate operations. There was no agency with a strategic understanding ofbiosecurity issues across the board, no agency with a clear mandate for overallco-ordination or responsibility, and no mechanism for co-ordinated priority set-ting—for example, how should eradication of a production pest such as thegypsy moth rate against a conservation pest such as the fire ant or crazy ant?There was inadequate information sharing and analysis, lack of shared learningfrom experience, and inconsistent risk assessment. For example, while the Min-istry of Agriculture and Fisheries might produce phytosanitary risk assessmentsfor agricultural products and incoming pests, it was not obliged to include riskto human health or native species and ecosystems within its risk assessmentprogrammme. Separate funding (always insufficient for the task at hand) meantthat departments pursued their own priorities.
224 Mairi Jay
In response to increasing public criticism about the lack of attention to so-cial, cultural, and conservation values in the biosecurity system, the governmentproduced a strategy document in 2003 (Biosecurity Council 2003), which recom-mended the formation of a single agency within the Ministry of Agriculture andForestry to take an overall leadership role and co-ordination of biosecurityacross different spheres of concern (primary production, native biodiversityconservation, and human and marine health). The strategy was approved byNew Zealand’s parliamentary cabinet committee, and the Ministry of Agricul-ture and Forestry was given the mandate to take lead responsibility for allaspects of biosecurity. The Ministry has since restructured its internal organiza-tion to reinforce this biosecurity responsibility. It has created a new directorate,Biosecurity New Zealand, which has the responsibility for border administra-tion, risk analysis, export and import standards consistent with the WTO SPSAgreement, biosecurity surveillance, pest management, and responses to pestincursions. It has been agreed in principle that the Ministry of Fisheries, marinebiodiversity functions, and national pest management programmes previouslyadministered by the Department of Conservation should become the responsi-bility of the Ministry of Agriculture and Forestry, while seaport sanitaryinspections will remain the responsibility of the Ministry of Health. Responsibil-ity for mosquito incursions and other biosecurity issues related to human healthpass to the Ministry of Agriculture and Forestry. Other biosecurity organizationswill retain accountability for some services; in particular, the regional councilsretain responsibility for pests and weeds within their regional boundary, theMinistry of Fisheries for aquaculture, and the Department of Conservation forprotection of marine species and marine reserves and for pest management tiedto a conservation outcome. In short, implementation of biosecurity strategy hascreated clearer demarcation and accountability of responsibilities by differentagencies and provided for overall leadership and co-ordination of activities.
From the public statements by the Director General of the Ministry of Agri-culture and Forestry (MAF 2004) and the Assistant Director General ofBiosecurity New Zealand (O’Neil 2004), there is no doubt that the new agency,Biosecurity New Zealand, is aware of a much broader responsibility to includeprotection of human and environmental health as well as primary productionfrom the threat of alien invasive organisms. It also recognizes more clearly theneed to consult with and work closely with the other departments (the Min-istries of Health and Fisheries, and the Department of Conservation) andregional government.
However, the new system, no less than the old system, confronts the per-ennial questions: ‘How much biosecurity effort is enough?’ and ‘How toidentify priorities and decide between differing economic, environmental,social, and cultural values?’
World trade and protection of native biodiversity from alien organisms 225
Biodiversity versus economic welfare: is there a conflict?
New Zealand’s economy depends substantially on production from farming,forestry, fishing, and tourism. Primary products (meat, wool, dairy, horticulture,timber, and fish) account for more than 50% of New Zealand’s exports (StatisticsNew Zealand 2000: 515).2 In addition, tourism, New Zealand’s top foreignexchange earner (Statistics New Zealand 2000: 306), is heavily dependent onnatural attractions of the countryside.
A recent estimate of the economic costs of pests and diseases that have suc-cessfully established in the country amounted to nearly one per cent of grossdomestic product per year, plus intangibles (Hackwell and Bertram 1999) havesuggested that the cost of defending its borders against new weeds and control-ling those already here amounts to about 60 million dollars a year whileuncontrolled weeds probably cost the country another 40 million dollars interms of lost productive output. Clout has suggested that the total cost of alienvertebrates in New Zealand may exceed 270 million dollars a year. These esti-mates are considered to under-represent the true cost of alien species to NewZealand. They are significant for a small country. Given the level of costs, andthe capacity of a small country (with a population of just over four million) topay for those costs, issues of allocation become highly political.
While the past weight of operational funding has favoured economicallysignificant organisms, the environmental viewpoint has grown in strength asNew Zealanders have come to realize more and more the extent of the damagethat has been done to native ecosystems. The publication of New Zealand’s na-tional Biodiversity Strategy in 2000 gave importance to environmental/biodiversity objectives for biosecurity. A major report published by the Parlia-mentary Commissioner for the Environment (PCE 2000) provided acomprehensive analysis of New Zealand’s biosecurity framework. It was highlycritical of the operational weight placed on economic objectives to the detrimentof environmental objectives, and the almost total exclusion of marinebiosecurity issues. It stated that New Zealand’s biosecurity system needs clearlyarticulated directions ‘particularly in relation to native flora and fauna,biodiversity, and ecosystem and public health’ (PCE 2000: 7).
Hence environmental objectives have become an important part of NewZealand’s biosecurity system at least in principle. Will the financial operationalexpenditures mirror the principles? There are strong reasons for believing thathowever well intentioned the aims and principles of Biosecurity in NewZealand are, it will be difficult to maintain a balance between economic (pro-duction), conservation, and human health values. The agency has responsibilityto comply with WTO sanitary and phytosanitary principles in its assessment ofbiosecurity risk. Much of the day-to-day work that lands on staff desks will be
2 This compares with 22% of exports each from Denmark and Australia and nine percent from Ireland.
226 Mairi Jay
demands and requests from export producers or trade importers who want riskassessments or phytosanitary clearances for their products. The SPS principlesdemand rigorous scientific standards which generally take time unless there isexisting information available. Most of the existing information applies to pestsand weeds of economic significance. Scientific knowledge about the impacts ofalien organisms on native ecosystems and species is only beginning to becomemore widespread, and often applies to organisms that affect wealthy countriesmost directly. Given the sheer extent of increases in volume and diversity of in-coming trade under globalization, New Zealand’s biosecurity system will behard-pressed to provide information and practices necessary for the secure pro-tection of native biodiversity.
Acknowledgement
The author would like to thank Dr Munir Morad, Kingston University, UK, andthe editor for advice and support.
References
Baskin Y. 2002A Plague of Rats and Rubbervines. the growing threat of species invasionsWashington, DC: Island Press. 377 pp.
Biosecurity Council 2003.Protect New Zealand, the biosecurity strategy for New ZealandDetails available at <www.maf.govt.nz/biosecurity-strategy>
Biosecurity New Zealand. 2001Biosecurity Authority Policy Statement on Conducting Import Risk Analyses andApplying them in the Development of Import HealthWellington: Ministry of Agriculture and ForestryDetails available at <http://www.biosecurity.govt.nz/pests-diseases/risk-policy.htm#2.1>, last accessed on 7 July 2005
Biosecurity New Zealand. 2004/05What Does the SPS Agreement Cover?Wellington: Ministry of Agriculture and ForestryDetails available at <http://www.biosecurity.govt.nz/sps/agreement/provisions.htm>, last accessed on 6 July 2005
Bright C. 2001Biological adversity, the hidden costs of trade and economic globalizationHarvard International Review 22 (4): 24–28
World trade and protection of native biodiversity from alien organisms 227
Brown, J H. 1989Patterns, modes and extents of invasions by vertebratesIn Biological Invasions: a global perspective Scientific Committee on Problems of theEnvironment, SCOPE 37, pp. 85–111, edited by J A Drake, H A Mooney,F di Castri, R H Groves, F J Kruger, M Rejmanek, and M WilliamsonChichester: John Wiley & Sons Ltd
Charnovitz S. 1999Improving the agreement on sanitary and phytosanitary standardsIn Trade, Environment and the Millennium, pp. 171–194, edited by G P Sampson andW B ChambersTokyo: United Nations University Press, pp. 450
Clout M N and S J Lowe. 2000Invasive species and environmental changes in New ZealandIn Invasive Species in a Changing World, pp. 369–384, edited by Mooney H A andR J HobbsWashington, DC: Island Press, pp. 457
Daily G C. 1997Nature’s Services: societal dependence on natural ecosystemsWashington, DC: Island Press, 392 pp.
Di Castri F. 1989History of biological invasions with special emphasis on the Old WorldIn Biological Invasions: A Global PerspectiveScientific Committee on Problems of the Environment, SCOPE 37, edited by J ADrake, H A Mooney, F di Castri, R H Groves, F J Kruger, M Rejmanek,M Williamson.Chichester, UK: John Wiley & Sons, Ltd
Elton C. 1958The Ecology of Invasions by Animals and PlantsLondon: Methuen. 181 pp.
Gaston K J and Spicer J I. 2004Biodiversity: an introduction, (2nd edn)Oxford, UK: Blackwell, 191 pp.
Hackwell K and G Bertram. 1999Pest and Weeds The Cost of Restoring an Indigenous Dawn ChorusWellington: New Zealand Conservation Authority. pp. 70 pp.
IUCN (International Union for the Conservation of Nature)/UNEP (UnitedNations Environment Programme)/WWF (World Wide Fund for Nature). 1991Caring for the Earth, A Strategy for Sustainable LivingGland, Switzerland: IUCN, UNEP, and WWF, pp. 228
228 Mairi Jay
MAF 2004.Director General’s OverviewAnnual Report 2003/04, pp. 5–9Wellington: Ministry of Agriculture and Forestry, pp. 115.
Mooney H A and Hobbs R J (eds). 2000Invasive Species in a Changing WorldWashington, DC: Island Press, pp. 457.
Mooney H A, Lubchenko J, Dirzo R, Sala O E. 1995Biodiversity and ecosystem functioning: basic principlesIn Global Biodiversity Assessment, pp. 275–325, edited by V H Heywood andR T Watson,Cambridge: Cambridge University Press for the United Nations EnvironmentProgramme. 1140 pp.
O’Neil B. 2004Biosecurity New Zealand to be launched at Biosecurity summitBiosecurity 55 (3)[a publication of MAF Biosecurity Authority]Wellington: Ministry of Agriculture and Forestry
PCE (Parliamentary Commissioner for the Environment). 2000New Zealand Under SiegeWellington, New Zealand: PCE , pp 112.
Pimental D (ed.). 2002Biological Invasions: economic and environmental costs of alien plant, animal,and microbe speciesBoca Raton (Fl): CRC Press. pp. 369.
Pimental D, Lach L, Zuniga R, Morrison D. 2000Environmental and economic costs of nonindigneous species in the United StatesBioScience 50 (1): 53–64
Richardson D M, Pysek P, Rejmanek M, Barbour M G, Panetta F D and West, C J. 2000Naturalization and invasion of alien plants: concepts and definitionsDiversity and Distributions 6: 93–107
Schmitz D C and Simberloff D. 1997Biological invasions: a growing threatIssues in Science and Technology 13 (4): 33–40
Simberloff D. 2004A rising tide of species and literature: a review of some recent books onbiological invasionsBioScience 54 (3): 247–254
World trade and protection of native biodiversity from alien organisms 229
SSC (Species Survival Commission). 2000Guidelines for the Prevention of Biodiversity Loss Caused by Alien Invasive Species[Prepared by the SSC, Invasive Species Specialist Group, and approved by the 51stMeeting of the IUCN Council, Gland, Switzerland]Gland: IUCNDetails available at <http://iucn.org?themes/ssc/pubs/policy/invasivesEng.htm>last accessed on 12 October 2005
Statistics New Zealand. 2000New Zealand Official Yearbook (102nd edn)Auckland: David Bateman. 603 pp.
Statistics New Zealand. 2004New Zealand Official Yearbook (104th edn)Auckland: David Bateman. 481 pp.
Taylor R, Smith I, Cochrane P, Stephenson B, Gibbs N. 1997The state of our land (Chapter 8)In The State of New Zealand’s Environment 1997, pp 8.1–8.108Wellington: GP Publications for the Ministry for the Environment
UN (United Nations). 1992Conservation of biological diversity (Chapter 15)In Rio Declaration on Environment and Development, Agenda 21[United Nations Conference on Environment and Development, Rio de Janiero, 3–14 June]
Williams P A and Timmins S. 2002Economic impacts of weeds in New ZealandIn Biological Invasions: economic and environmental costs of alien plant, animal, andmicrobe species (Chapter 10)D Boca Raton (Fl): CRC Press. 369 pp.
Williams J A and West C. 2000Environmental weeds in Australia and New Zealand: issues and approaches tomanagementAustral Ecology 25: 425–444
Wilson K-J. 2004Flight of the Huia: ecology and conservation of New Zealand’s frogs, reptiles, birdsand mammalsChristchurch: Canterbury University Press 411 pp.
230 Mairi Jay
WTO (World Trade Organization). 1994Agreement on the Application of Sanitary and Phytosanitary MeasureGeneva, Switzerland: WTO. 13 pp.Details available at <http: docsonline.wto.orgGEN_searchResult.asp?RN=0&searchtype=browse&q1= %28@meta_Symbol+LTüURüA1Aü12%29+%26+%28@meta_Types+Legal+text% 29>
WTO (World Trade Organization). 1995Measures Affecting the Importation of Salmon, Dispute DS18 between Canada asthe complainant and Australia as the respondentDetails available at <http://www.wto.org/english/tratop_e/dispu_e/find_dispu_cases_e.htm#results, last accessed on 13 October, 2005
WTO (World Trade Organization). 1998Understanding the WTO Agreement on Sanitary and Phytosanitary Measures[An explanatory document published by the WTO obtainable from the WTOwebsite under ‘Trade Topics’, ‘Goods’ and ‘Sanitary and Phytosanitary Measures’]Details available at <http://www.wto.org/english/tratop_e/sps_e/sps_e.htm>last accessed on 14 October 2005
WTO (World Trade Organization). 2004Statistics: international trade statistics 2004, selected long-term t`rends, Table11.2. World merchandise trade by region and selected economy 1948, 1953, 1963,1973, 1983, 1993 and 2003Details available at <http://www.wto.org/english/res_e/statis_e/its2004_e/section2_e/ii02.xls>, last accessed on 12 October 2005
WTO (World Trade Organization). 2005Understanding the WTO (3rd edn)[Previously published as ‘Trading into the Future’ September 2003, revised October2005]Geneva, Switzerland: WTO. 116 pp.Details available at <http://www.wto.org/english/thewto_e/whatis_e/tif_e/tif_e.htm>, last accessed on 15 October 2005

A new methodology for measuringenvironmental changes
K Aruna Rao and Jubin Antony
In the past, the number of species of plants and animals found in a region wasused for measuring the environmental changes occurring in a time period.This paper proposes the use of probability of extinction of species of plants oranimals as a measure of environmental pressure. The model used to estimatethe probability of extinction is the zero inflated distribution and, in particular,the zero inflated Poisson distribution. This is an innovative application of theinflated distributions which has not been explored in the past. Tests and confi-dence intervals are developed for measuring the change in the probability ofextinction of species at two or more regions or time points. The methodologyis illustrated using simulated data sets.
Introduction
Biodiversity is most often thought of as a variety of organisms on earth. It alsoincludes two other factors: ecological diversity, that is, a variety of ecosystemsand ecological communities; and genetic diversity, a range of genetic differencesfound within and between species. All three aspects are crucial for the successand development of life on earth. Since environmental conditions at each levelare constantly changing, only diversity can ensure that some individuals andspecies will be able to adapt to the change. Biodiversity also guarantees a per-manent source of new genetic materials for future breeding programmes. Theindicators that are commonly used to evaluate a country’s performance for pro-tecting native biodiversity and natural environment are the area of nationalterritory that is meaningfully protected and the number of threatened speciescompared to the number of known species in existence in that particular coun-try. As an example of the latter, we can consider the census of butterflies foundin the Western Ghats, India, over different time points to measure the ecologicalchanges occurring in that area.
For correspondence: [email protected]
13
232 K A Rao and J Antony
In the history of life on earth, there have been five massive episodes ofextinction, and it is currently undergoing a sixth mass extinction event. The knownfigures are alarming enough. By 2003, nearly one in four mammal species wasthreatened to some degree, along with one in 10 birds. Over the past 500 years,816 species have become extinct or extinct in the wild. The International Unionfor the Conservation of Nature (IUCN 2004) Red List now includes 12 259 spe-cies threatened with extinction. A total of 762 plant and animal species are nowrecorded as extinct with another 58 known only in cultivation or captivity.Therefore, it is of great importance to estimate the probability of extinction ofthe endangered species. This probability measures the ecological pressure onthe endangered species and it can also be considered as a parameter for measur-ing the environmental change. Perhaps due to a lack of a suitable model, noattempt has been made in this direction so far. This paper is an attempt towardsthis end. As the species used to measure the change is endangered, the numberin different spots in the surveys equals zero and, thus, the model suitable to de-scribe the data obtained from these surveys is the ZIM (zero inflated model).This motivated the authors to use ZIM – more specifically ZIP (zero inflatedPoisson) model – for measuring environmental changes.
ZIM is widely applied in different disciplines like bioscience, medicine,electronics, etc. to model data with excess zeros. Heilbron (1989) proposed zero-altered Poisson and negative binomial regression models and applied them tostudy high-risk human behaviour. Lambert (1992) used the ZIP regressionmodel to study covariate effects with an example from modelling experimentalresults of soldering defects on printed wiring boards. Applications are alsofound in areas such as patent (Crepon and Duguet 1997), road safety(Miaou 1994), species abundance (Welsh, Cunningham, Donnelly, et al. 1996),medical consultations (Gurmu 1997), use of recreational facilities (Gurmu andTrivedi 1996), sexual behaviour (Heilbron 1994), migration behaviour (Boharaand Krieg 1996), and many others.
In the following section, ZIM and its application in the measurement of en-vironmental change are described. Tests for measuring environmental changesare proposed in section Test for measuring environmental changes. Confidenceinterval for ‘p’ and tests for the equality of probability of extinction at two ormore regions or time points are also given. Section Numerical illustration givesthe application of the ZIP model for a simulated data set and the paper con-cludes with section Conclusion.
Generalized zero inflated distribution and its use in measuringenvironmental changes
Consider a discrete random variable ‘X’ taking at most a countable number ofvalues i = 0, 1, 2, ... with pmf (probability mass function) P(X = i| θ) = f (i, θ),where the parameter θεΩ ⊂ R1. A new family of pmf g (x, θ, p) is defined such
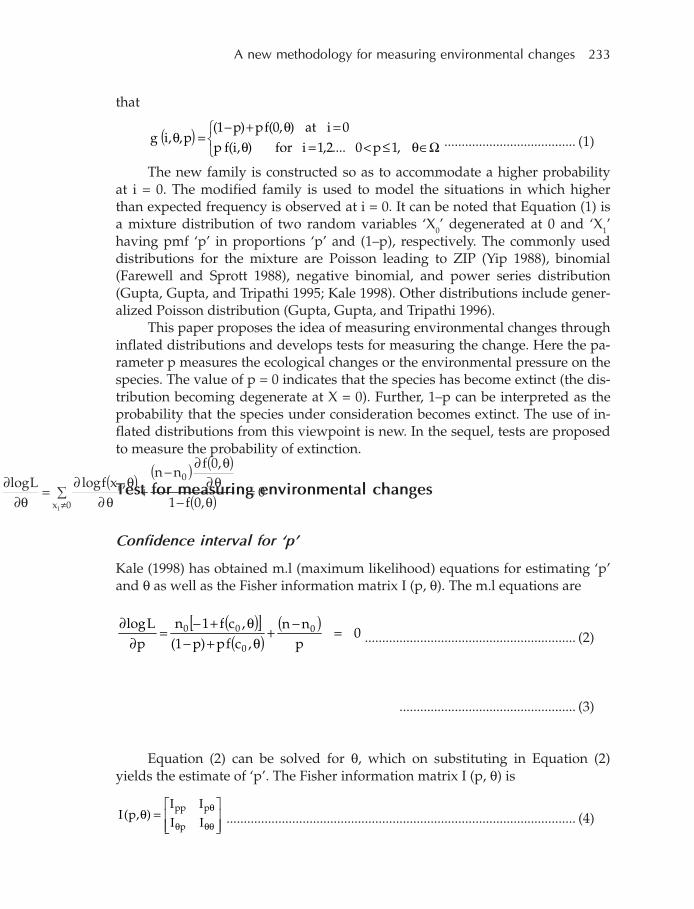
A new methodology for measuring environmental changes 233
that
( )
Ω∈θ≤<=θ=θ+−
=θ,1p0....2,1ifor),i(fp
0iat),0(fp)p1(p,,ig ...................................... (1)
The new family is constructed so as to accommodate a higher probabilityat i = 0. The modified family is used to model the situations in which higherthan expected frequency is observed at i = 0. It can be noted that Equation (1) isa mixture distribution of two random variables ‘X0’ degenerated at 0 and ‘X1’having pmf ‘p’ in proportions ‘p’ and (1–p), respectively. The commonly useddistributions for the mixture are Poisson leading to ZIP (Yip 1988), binomial(Farewell and Sprott 1988), negative binomial, and power series distribution(Gupta, Gupta, and Tripathi 1995; Kale 1998). Other distributions include gener-alized Poisson distribution (Gupta, Gupta, and Tripathi 1996).
This paper proposes the idea of measuring environmental changes throughinflated distributions and develops tests for measuring the change. Here the pa-rameter p measures the ecological changes or the environmental pressure on thespecies. The value of p = 0 indicates that the species has become extinct (the dis-tribution becoming degenerate at X = 0). Further, 1–p can be interpreted as theprobability that the species under consideration becomes extinct. The use of in-flated distributions from this viewpoint is new. In the sequel, tests are proposedto measure the probability of extinction.
Test for measuring environmental changes
Confidence interval for ‘p’
Kale (1998) has obtained m.l (maximum likelihood) equations for estimating ‘p’and θ as well as the Fisher information matrix I (p, θ). The m.l equations are
( )[ ]( )
( )0
pnn
,cfp)p1(,cf1n
pLlog 0
0
00 =−
+θ+−
θ+−=
∂∂
............................................................. (2)
( ) ( ) ( )
( ) 0,0f1
,0fnn
,xflogLlog 0
0x
i
i
=θ−
θ∂θ∂
−+∑
θ∂θ∂
=θ∂
∂≠
................................................... (3)
Equation (2) can be solved for θ, which on substituting in Equation (2)yields the estimate of ‘p’. The Fisher information matrix I (p, θ) is
=θθθθ
θ
IIII
),p(Ip
ppp..................................................................................................... (4)
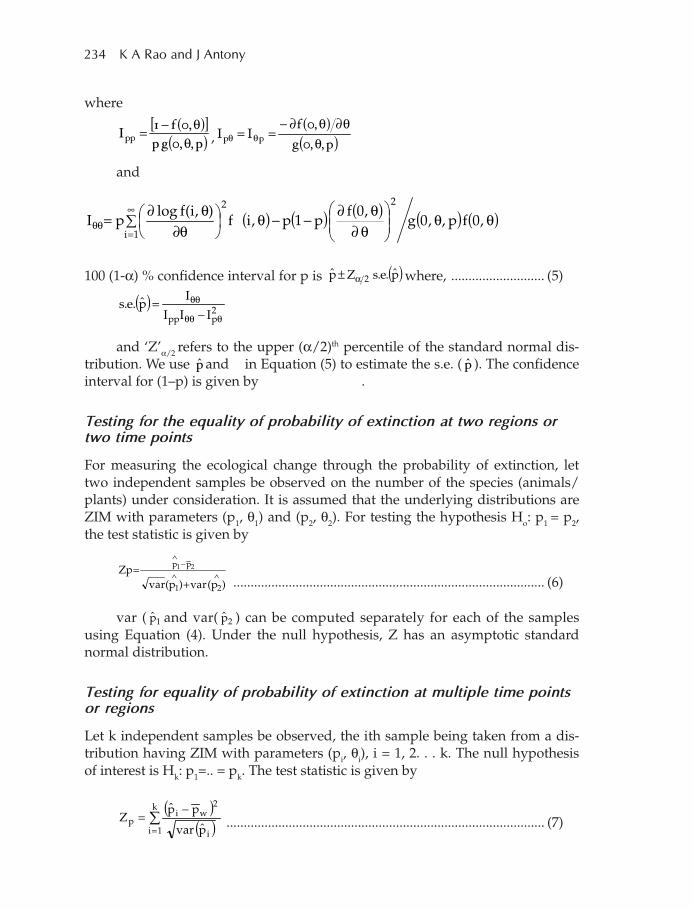
234 K A Rao and J Antony
where
( )[ ]( )p,,0gp
,0f1Ipp θ
θ−= ,( )
( )p,,0g
,0fII
pp θθ∂θ∂−
== θθ
and
( ) ( ) ( ) ( ) ( )∑ θθ
θ∂θ∂
−−θ
θ∂θ∂
=∞
=θθ
1i
22
,0fp,,0g,0f
p1p,if),i(flog
pI
100 (1-α) % confidence interval for p is ( )p.e.sZp 2α± where, ........................... (5)
( ) 2ppp III
Ip.e.s
θθθ
θθ
−=
and ‘Z’α/2 refers to the upper (α/2)th percentile of the standard normal dis-tribution. We use p and in Equation (5) to estimate the s.e. ( p ). The confidenceinterval for (1–p) is given by .
Testing for the equality of probability of extinction at two regions ortwo time points
For measuring the ecological change through the probability of extinction, lettwo independent samples be observed on the number of the species (animals/plants) under consideration. It is assumed that the underlying distributions areZIM with parameters (p1, θ1) and (p2, θ2). For testing the hypothesis Ho: p1 = p2,the test statistic is given by
)p(var)p(varZp
21
pp 21∧∧
∧−
+=
.......................................................................................... (6)
var ( 1p and var( 2p ) can be computed separately for each of the samplesusing Equation (4). Under the null hypothesis, Z has an asymptotic standardnormal distribution.
Testing for equality of probability of extinction at multiple time pointsor regions
Let k independent samples be observed, the ith sample being taken from a dis-tribution having ZIM with parameters (pi, θi), i = 1, 2. . . k. The null hypothesisof interest is Hk: p1=.. = pk. The test statistic is given by
( )( )∑
=
−=
k
1i i
2wi
ppvar
ppZ ............................................................................................ (7)
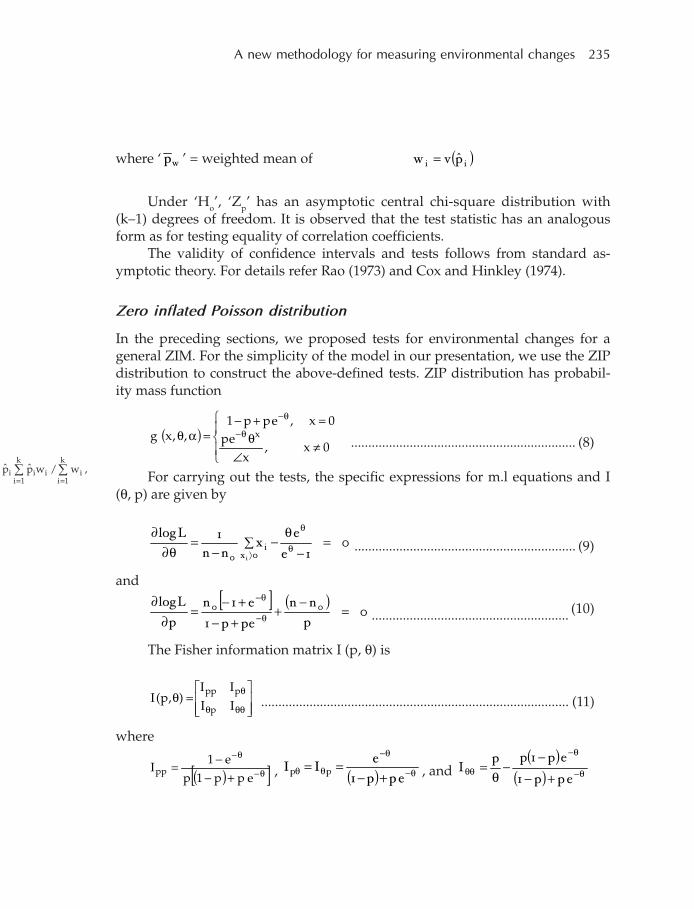
A new methodology for measuring environmental changes 235
where ‘w
p ’ = weighted mean of
,w/wpp i
k
1iii
k
1ii ∑∑
==
( )ii
pvw =
Under ‘Ho’, ‘Zp’ has an asymptotic central chi-square distribution with(k–1) degrees of freedom. It is observed that the test statistic has an analogousform as for testing equality of correlation coefficients.
The validity of confidence intervals and tests follows from standard as-ymptotic theory. For details refer Rao (1973) and Cox and Hinkley (1974).
Zero inflated Poisson distribution
In the preceding sections, we proposed tests for environmental changes for ageneral ZIM. For the simplicity of the model in our presentation, we use the ZIPdistribution to construct the above-defined tests. ZIP distribution has probabil-ity mass function
( )
≠∠
θ=+−
=αθ θ−
θ−
0x,x
ep0x,epp1
,,xg x................................................................. (8)
For carrying out the tests, the specific expressions for m.l equations and I(θ, p) are given by
01e
ex
nn
1Llog
0x
i
0 i
=−
θ−∑
−=
θ∂∂
θ
θ
⟩
................................................................ (9)
and
[ ] ( )0
p
nn
epp1
e1n
p
Llog00 =
−+
+−+−
=∂
∂θ−
θ−
......................................................... (10)
The Fisher information matrix I (p, θ) is
=θθθθ
θ
IIII
),p(Ip
ppp......................................................................................... (11)
where
( )[ ]θ−
θ−
+−−=
epp1p
e1Ipp , ( ) θ−
θ−
θθ +−==
epp1
eII pp , and
( )( ) θ−
θ−
θθ +−−
−θ
=epp1
ep1ppI
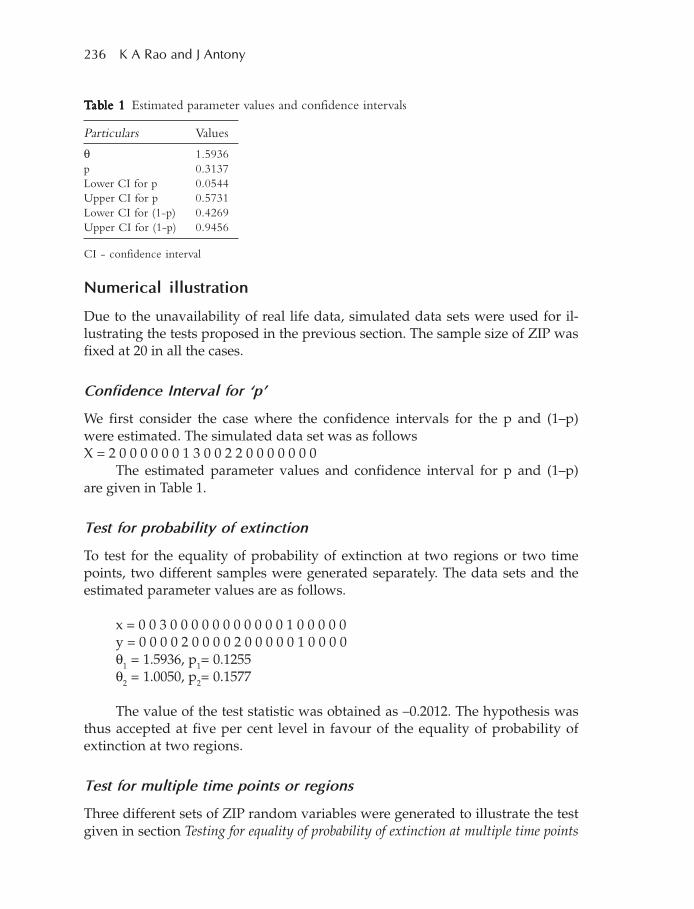
236 K A Rao and J Antony
Numerical illustration
Due to the unavailability of real life data, simulated data sets were used for il-lustrating the tests proposed in the previous section. The sample size of ZIP wasfixed at 20 in all the cases.
Confidence Interval for ‘p’
We first consider the case where the confidence intervals for the p and (1–p)were estimated. The simulated data set was as followsX = 2 0 0 0 0 0 0 1 3 0 0 2 2 0 0 0 0 0 0 0
The estimated parameter values and confidence interval for p and (1–p)are given in Table 1.
Test for probability of extinction
To test for the equality of probability of extinction at two regions or two timepoints, two different samples were generated separately. The data sets and theestimated parameter values are as follows.
x = 0 0 3 0 0 0 0 0 0 0 0 0 0 0 1 0 0 0 0 0y = 0 0 0 0 2 0 0 0 0 2 0 0 0 0 0 1 0 0 0 0θ1 = 1.5936, p1= 0.1255θ2 = 1.0050, p2= 0.1577
The value of the test statistic was obtained as –0.2012. The hypothesis wasthus accepted at five per cent level in favour of the equality of probability ofextinction at two regions.
Test for multiple time points or regions
Three different sets of ZIP random variables were generated to illustrate the testgiven in section Testing for equality of probability of extinction at multiple time points
TTTTTababababable 1le 1le 1le 1le 1 Estimated parameter values and confidence intervals
Particulars Values
θ 1.5936p 0.3137Lower CI for p 0.0544Upper CI for p 0.5731Lower CI for (1-p) 0.4269Upper CI for (1-p) 0.9456
CI - confidence interval
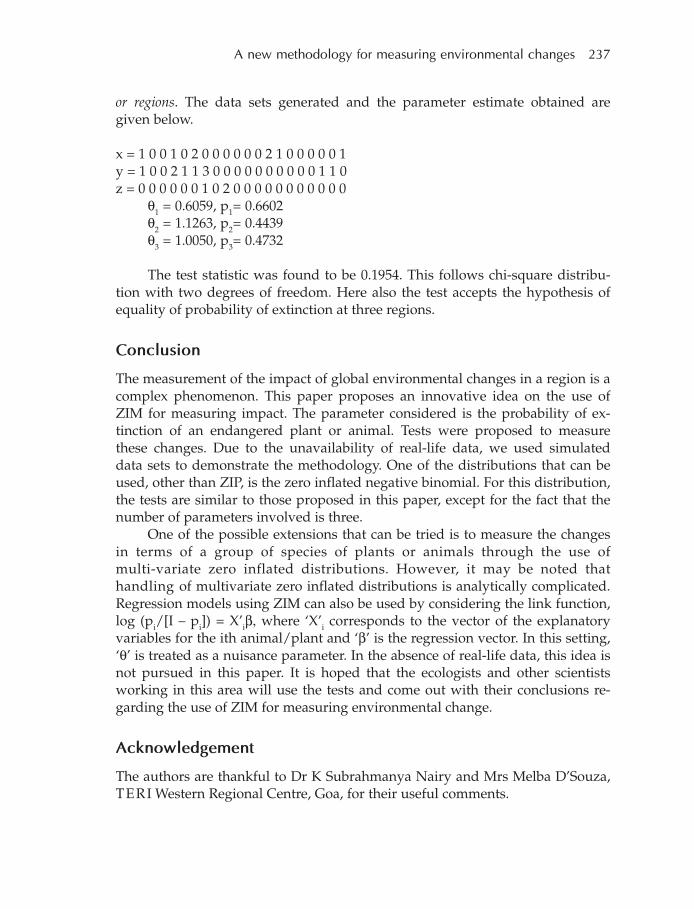
A new methodology for measuring environmental changes 237
or regions. The data sets generated and the parameter estimate obtained aregiven below.
x = 1 0 0 1 0 2 0 0 0 0 0 0 2 1 0 0 0 0 0 1y = 1 0 0 2 1 1 3 0 0 0 0 0 0 0 0 0 0 1 1 0z = 0 0 0 0 0 0 1 0 2 0 0 0 0 0 0 0 0 0 0 0
θ1 = 0.6059, p1= 0.6602θ2 = 1.1263, p2= 0.4439θ3 = 1.0050, p3= 0.4732
The test statistic was found to be 0.1954. This follows chi-square distribu-tion with two degrees of freedom. Here also the test accepts the hypothesis ofequality of probability of extinction at three regions.
Conclusion
The measurement of the impact of global environmental changes in a region is acomplex phenomenon. This paper proposes an innovative idea on the use ofZIM for measuring impact. The parameter considered is the probability of ex-tinction of an endangered plant or animal. Tests were proposed to measurethese changes. Due to the unavailability of real-life data, we used simulateddata sets to demonstrate the methodology. One of the distributions that can beused, other than ZIP, is the zero inflated negative binomial. For this distribution,the tests are similar to those proposed in this paper, except for the fact that thenumber of parameters involved is three.
One of the possible extensions that can be tried is to measure the changesin terms of a group of species of plants or animals through the use ofmulti-variate zero inflated distributions. However, it may be noted thathandling of multivariate zero inflated distributions is analytically complicated.Regression models using ZIM can also be used by considering the link function,log (pi/[I – pi]) = X’iβ, where ‘X’i corresponds to the vector of the explanatoryvariables for the ith animal/plant and ‘β’ is the regression vector. In this setting,‘θ’ is treated as a nuisance parameter. In the absence of real-life data, this idea isnot pursued in this paper. It is hoped that the ecologists and other scientistsworking in this area will use the tests and come out with their conclusions re-garding the use of ZIM for measuring environmental change.
Acknowledgement
The authors are thankful to Dr K Subrahmanya Nairy and Mrs Melba D’Souza,TERI Western Regional Centre, Goa, for their useful comments.
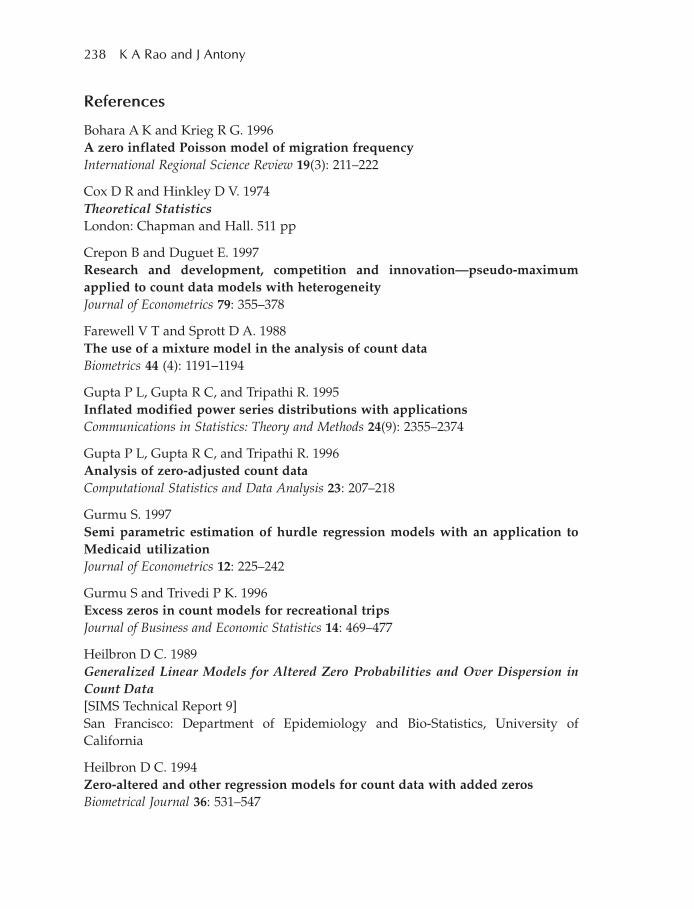
238 K A Rao and J Antony
References
Bohara A K and Krieg R G. 1996A zero inflated Poisson model of migration frequencyInternational Regional Science Review 19(3): 211–222
Cox D R and Hinkley D V. 1974Theoretical StatisticsLondon: Chapman and Hall. 511 pp
Crepon B and Duguet E. 1997Research and development, competition and innovation—pseudo-maximumapplied to count data models with heterogeneityJournal of Econometrics 79: 355–378
Farewell V T and Sprott D A. 1988The use of a mixture model in the analysis of count dataBiometrics 44 (4): 1191–1194
Gupta P L, Gupta R C, and Tripathi R. 1995Inflated modified power series distributions with applicationsCommunications in Statistics: Theory and Methods 24(9): 2355–2374
Gupta P L, Gupta R C, and Tripathi R. 1996Analysis of zero-adjusted count dataComputational Statistics and Data Analysis 23: 207–218
Gurmu S. 1997Semi parametric estimation of hurdle regression models with an application toMedicaid utilizationJournal of Econometrics 12: 225–242
Gurmu S and Trivedi P K. 1996Excess zeros in count models for recreational tripsJournal of Business and Economic Statistics 14: 469–477
Heilbron D C. 1989Generalized Linear Models for Altered Zero Probabilities and Over Dispersion inCount Data[SIMS Technical Report 9]San Francisco: Department of Epidemiology and Bio-Statistics, University ofCalifornia
Heilbron D C. 1994Zero-altered and other regression models for count data with added zerosBiometrical Journal 36: 531–547

A new methodology for measuring environmental changes 239
IUCN (World Conservation Union). 2004International Union for the Conservation of Nature—Red List of Threatened SpeciesGland: The IUCN Species Survival Commission, IUCN
Kale B K. 1998Optimal estimating equations for discrete data with higher frequencies at a pointJournal of the Indian Statistical Association 36: 125–136
Lambert D. 1992Zero inflated Poisson regression with an application to defects in manufacturingTechnometrics 34: 1–4
Miaou S P. 1994The relationship between truck accidents and geometric design of road sections:Poisson versus negative binomial regressionsAccident Analysis and Prevention 26: 471–482
Rao C R. 1973Linear Statistical Inference and its Applications, 2nd ednNew York: Wiley. 625 pp.
Welsh A, Cunningham R, Donnelly C, Lindermayer D. 1996Modeling the abundance of rare species: statistical models for counts with extrazerosEcological Modeling 88: 297–308
Yip P. 1988Inference about the mean of a Poisson distribution in the presence of a nuisanceparameterAustralian Journal of Statistics 30: 299–306
240 K A Rao, J Antony, and S Nairy
On inference concerning biodiversity
K Aruna Rao, Jubin Antony, and
Subrahmanya Nairy
Logarithmic series distribution is a commonly used distribution in the studyof the index of biodiversity. This is a discrete distribution having a real param-eter θ ε (0, 1]. There are other indices of biodiversity like Simpson’s index,Shannon–Wiener index, Brillouin index, etc. for which tests have beenproposed to compare the equality of biodiversity. However, for the originalindex, no tests have been proposed in the past to compare the indices. Thispaper proposes CI (confidence interval) and tests for index of biodiversitybased on one and two sample cases when the underlying distribution is thelogarithmic series distribution. Extensive simulation has been carried out tocompare the coverage probabilities with the confidence level for small samplesand the results indicate that they are in close agreement. Thus it can be usedeven for small samples, even though the CI relies on large sample theory.
Introduction
The growing human population and expanding consumption are placing enor-mous pressure on the environmental biodiversity. Against this background, theworld is increasingly becoming aware of the use of components of biologicaldiversity in a way and at a rate that does not lead to the long-term decline ofbiodiversity. Change in biodiversity is also used as a parameter to measure theenvironmental changes by environmentalists and ecologists.
The application of statistics in the study of biodiversity dates back toFisher, Corbet, and Williams (1943) who defined the index of biodiversity (fordefinition see section Notations and preliminaries). The study of the index ofbiodiversity involves the use of suitable probability distribution and the com-monly used distribution is logarithmic series distribution. This is a discretedistribution having a real parameter θ ε (0, 1). The other commonly used indicesof biodiversity are Simpson’s index, Shannon–Wiener index, Brillouin index, etc.(for details refer to Gore and Paranjpe (2001)). Although Hutcheson (1970)
14
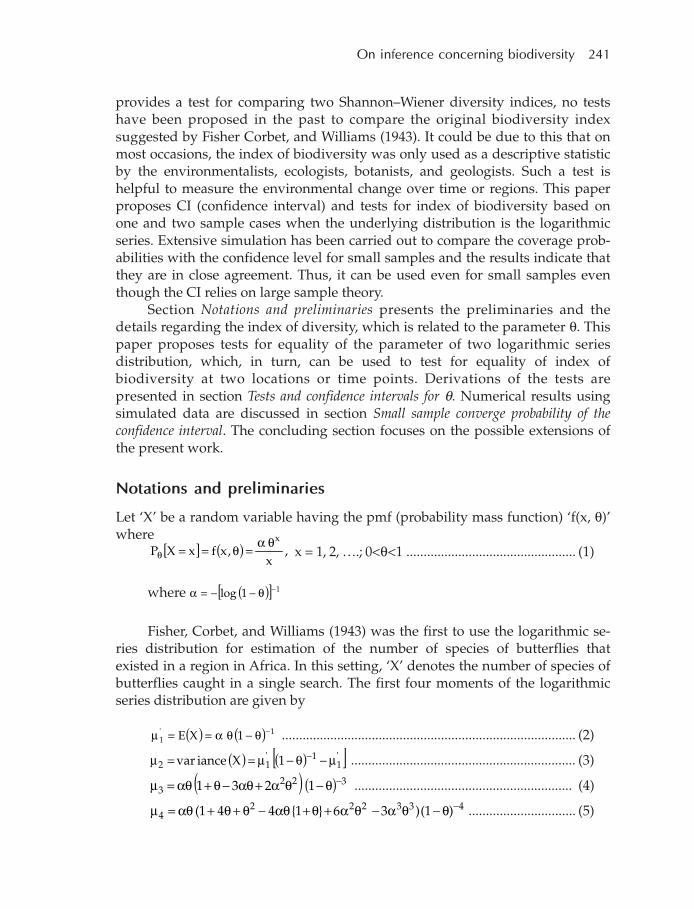
On inference concerning biodiversity 241
provides a test for comparing two Shannon–Wiener diversity indices, no testshave been proposed in the past to compare the original biodiversity indexsuggested by Fisher Corbet, and Williams (1943). It could be due to this that onmost occasions, the index of biodiversity was only used as a descriptive statisticby the environmentalists, ecologists, botanists, and geologists. Such a test ishelpful to measure the environmental change over time or regions. This paperproposes CI (confidence interval) and tests for index of biodiversity based onone and two sample cases when the underlying distribution is the logarithmicseries. Extensive simulation has been carried out to compare the coverage prob-abilities with the confidence level for small samples and the results indicate thatthey are in close agreement. Thus, it can be used even for small samples eventhough the CI relies on large sample theory.
Section Notations and preliminaries presents the preliminaries and thedetails regarding the index of diversity, which is related to the parameter θ. Thispaper proposes tests for equality of the parameter of two logarithmic seriesdistribution, which, in turn, can be used to test for equality of index ofbiodiversity at two locations or time points. Derivations of the tests arepresented in section Tests and confidence intervals for θ. Numerical results usingsimulated data are discussed in section Small sample converge probability of theconfidence interval. The concluding section focuses on the possible extensions ofthe present work.
Notations and preliminaries
Let ‘X’ be a random variable having the pmf (probability mass function) ‘f(x, θ)’where
[ ] ( ) ,x
,xfxXPxθα
=θ==θ x = 1, 2, ….; 0<θ<1 ................................................. (1)
where ( )[ ] 11log −θ−−=α
Fisher, Corbet, and Williams (1943) was the first to use the logarithmic se-ries distribution for estimation of the number of species of butterflies thatexisted in a region in Africa. In this setting, ‘X’ denotes the number of species ofbutterflies caught in a single search. The first four moments of the logarithmicseries distribution are given by
( ) ( ) 1'1 1XE −θ−θα==µ ..................................................................................... (2)
( ) ( )[ ]'1
1'12 1Xiancevar µ−θ−µ==µ − ................................................................. (3)
( ) ( ) 3223 1231 −θ−θα+αθ−θ+αθ=µ ............................................................... (4)
4332224 )1()361441( −θ−θα−θα+θ+αθ−θ+θ+αθ=µ ............................... (5)

242 K A Rao, J Antony, and S Nairy
Johnson and Kotz (1969) report the numerical values of β1 = µ32/ µ3
2 andβ2 = µ4/µ2
2 for various values of θ. From Table 1 it is clear that logarithmic seriesdistribution is a right skewed distribution having very long right tail. Figure 1represents the shape of the distribution when θ = 0.2, 0.5, and 0.7.
In a series of experiments or samples if ‘n1’ represents the number of spe-cies represented by exactly one individual in the sample then the number ofspecies represented by two, three, etc. individuals is approximately,
2
n2
1θ
θ,
3
n3
1 θθ
…, etc., respectively. The total number of species is
( )θ−
θ−=
θ∑
θ=
∞
=1log
nx
nS 1
x
1x
1.................................................................. (6)
and the total number of individuals collected is
θ−=θ∑
θ=
∞
= 1nn
M 1x
1x
1.................................................................................... (7)
The quantity
θ1n
is referred to as the index of diversity.
Tests and confidence intervals for θθθθθ
One sample case
Let ‘X’ represent the number of species of plants/animals found in botanical/zoological sample surveys in a single surveillance. From the surveys carried out
TTTTTababababable 1le 1le 1le 1le 1 Probability mass function for logarithmicseries for different theta values
x θ = 0.2 θ = 0.5 θ= 0.9
1 0.8963 0.7213 0.39092 0.0896 0.1803 0.17593 0.0120 0.0601 0.10554 0.0018 0.0225 0.07125 0.0003 0.0090 0.05136 0 0.0038 0.03857 0 0.0016 0.02978 0 0.0007 0.02349 0 0.0003 0.0187
10 0 0.0001 0.015111 0 0.0001 0.012412 0 0 0.010213 0 0 0.008514 0 0 0.007115 0 0 0.0060
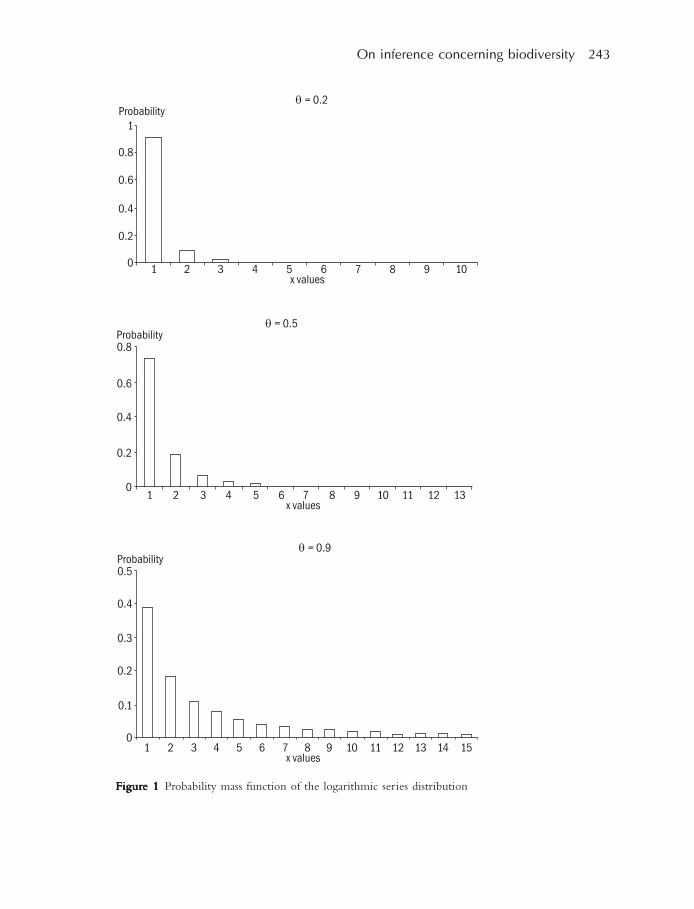
On inference concerning biodiversity 243
FigurFigurFigurFigurFigure 1e 1e 1e 1e 1 Probability mass function of the logarithmic series distribution
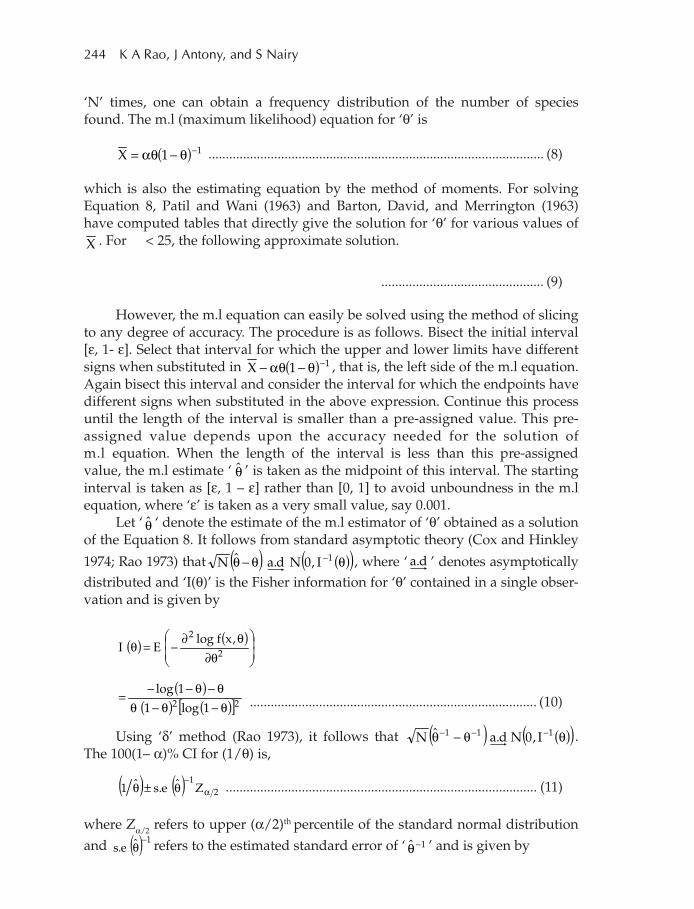
244 K A Rao, J Antony, and S Nairy
‘N’ times, one can obtain a frequency distribution of the number of speciesfound. The m.l (maximum likelihood) equation for ‘θ’ is
( ) 11X −θ−θα= ................................................................................................. (8)
which is also the estimating equation by the method of moments. For solvingEquation 8, Patil and Wani (1963) and Barton, David, and Merrington (1963)have computed tables that directly give the solution for ‘θ’ for various values ofX . For < 25, the following approximate solution.
............................................... (9)
However, the m.l equation can easily be solved using the method of slicingto any degree of accuracy. The procedure is as follows. Bisect the initial interval[ε, 1- ε]. Select that interval for which the upper and lower limits have differentsigns when substituted in ( ) 11X −θ−θα− , that is, the left side of the m.l equation.Again bisect this interval and consider the interval for which the endpoints havedifferent signs when substituted in the above expression. Continue this processuntil the length of the interval is smaller than a pre-assigned value. This pre-assigned value depends upon the accuracy needed for the solution ofm.l equation. When the length of the interval is less than this pre-assignedvalue, the m.l estimate ‘ θ ’ is taken as the midpoint of this interval. The startinginterval is taken as [ε, 1 – ε] rather than [0, 1] to avoid unboundness in the m.lequation, where ‘ε’ is taken as a very small value, say 0.001.
Let ‘ θ ‘ denote the estimate of the m.l estimator of ‘θ’ obtained as a solutionof the Equation 8. It follows from standard asymptotic theory (Cox and Hinkley
1974; Rao 1973) that ( ) ( )( )θθ−θ −1I,0Nd.aˆN , where ‘ d.a ’ denotes asymptoticallydistributed and ‘I(θ)’ is the Fisher information for ‘θ’ contained in a single obser-vation and is given by
( ) ( )
θ∂θ∂
−=θ 2
2 ,xflogEI
( )( ) ( )[ ]22 1log1
1log
θ−θ−θθ−θ−−
= ................................................................................... (10)
Using ‘δ’ method (Rao 1973), it follows that ( ) ( )( )θθ−θ −−− 111 I,0Nd.aˆN .The 100(1– α)% CI for (1/θ) is,
( ) ( ) 21Zˆe.sˆ1 α
−θ±θ .......................................................................................... (11)
where Zα/2 refers to upper (α/2)th percentile of the standard normal distribution
and ( ) 1ˆe.s−
θ refers to the estimated standard error of ‘ 1ˆ −θ ’ and is given by
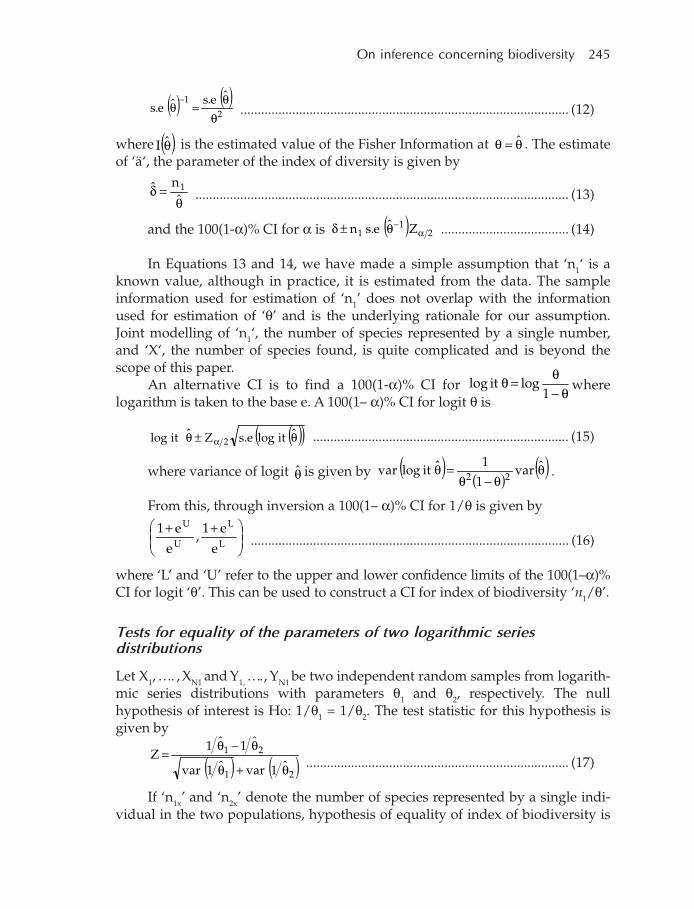
On inference concerning biodiversity 245
( ) ( )2
1 ˆe.sˆe.sθ
θ=θ
−............................................................................................... (12)
where ( )θI is the estimated value of the Fisher Information at θ=θ ˆ . The estimateof ‘ä‘, the parameter of the index of diversity is given by
θ=δ
ˆnˆ 1
............................................................................................................ (13)
and the 100(1-α)% CI for α is ( ) 21
1 Zˆe.sn α−θ±δ ..................................... (14)
In Equations 13 and 14, we have made a simple assumption that ‘n1‘ is aknown value, although in practice, it is estimated from the data. The sampleinformation used for estimation of ‘n1’ does not overlap with the informationused for estimation of ‘θ’ and is the underlying rationale for our assumption.Joint modelling of ‘n1‘, the number of species represented by a single number,and ‘X‘, the number of species found, is quite complicated and is beyond thescope of this paper.
An alternative CI is to find a 100(1-α)% CI for θ−
θ=θ1
logitlog wherelogarithm is taken to the base e. A 100(1– α)% CI for logit θ is
( )( )θ±θ αˆitloge.sZˆitlog 2 .......................................................................... (15)
where variance of logit θ is given by ( )( )
( )θθ−θ
=θ ˆvar1
1ˆitlogvar 22 .
From this, through inversion a 100(1– α)% CI for 1/θ is given by
++L
L
U
U
e
e1,
e
e1............................................................................................ (16)
where ‘L’ and ‘U’ refer to the upper and lower confidence limits of the 100(1–α)%CI for logit ‘θ’. This can be used to construct a CI for index of biodiversity ‘n1/θ’.
Tests for equality of the parameters of two logarithmic seriesdistributions
Let X1, …. , XN1 and Y1, …. , YN1 be two independent random samples from logarith-mic series distributions with parameters θ1 and θ2, respectively. The nullhypothesis of interest is Ho: 1/θ1 = 1/θ2. The test statistic for this hypothesis isgiven by
( ) ( )21
21
ˆ1varˆ1var
ˆ1ˆ1Z
θ+θ
θ−θ=
............................................................................ (17)
If ‘n1x’ and ‘n2x’ denote the number of species represented by a single indi-vidual in the two populations, hypothesis of equality of index of biodiversity is
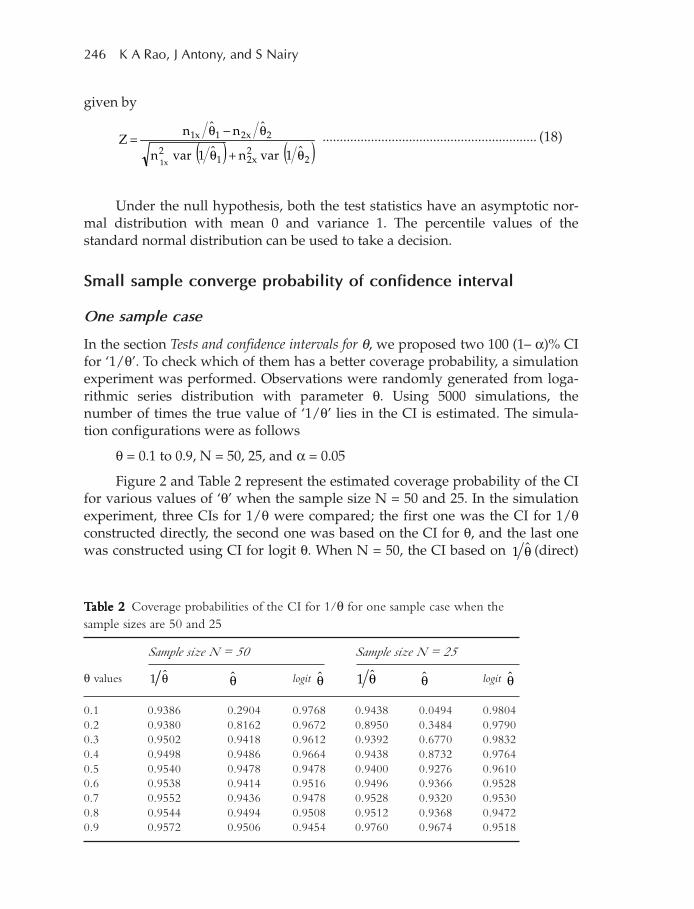
246 K A Rao, J Antony, and S Nairy
given by
( ) ( )22
x212
2x21x1
ˆ1varnˆ1varn
ˆnˆnZ
x1θ+θ
θ−θ= .............................................................. (18)
Under the null hypothesis, both the test statistics have an asymptotic nor-mal distribution with mean 0 and variance 1. The percentile values of thestandard normal distribution can be used to take a decision.
Small sample converge probability of confidence interval
One sample case
In the section Tests and confidence intervals for θ, we proposed two 100 (1– α)% CIfor ‘1/θ’. To check which of them has a better coverage probability, a simulationexperiment was performed. Observations were randomly generated from loga-rithmic series distribution with parameter θ. Using 5000 simulations, thenumber of times the true value of ‘1/θ’ lies in the CI is estimated. The simula-tion configurations were as follows
θ = 0.1 to 0.9, N = 50, 25, and α = 0.05
Figure 2 and Table 2 represent the estimated coverage probability of the CIfor various values of ‘θ’ when the sample size N = 50 and 25. In the simulationexperiment, three CIs for 1/θ were compared; the first one was the CI for 1/θconstructed directly, the second one was based on the CI for θ, and the last onewas constructed using CI for logit θ. When N = 50, the CI based on θ1 (direct)
TTTTTababababable 2le 2le 2le 2le 2 Coverage probabilities of the CI for 1/θ for one sample case when thesample sizes are 50 and 25
Sample size N = 50 Sample size N = 25
θ values θ1 θ logit θ θ1 θ logit θ
0.1 0.9386 0.2904 0.9768 0.9438 0.0494 0.98040.2 0.9380 0.8162 0.9672 0.8950 0.3484 0.97900.3 0.9502 0.9418 0.9612 0.9392 0.6770 0.98320.4 0.9498 0.9486 0.9664 0.9438 0.8732 0.97640.5 0.9540 0.9478 0.9478 0.9400 0.9276 0.96100.6 0.9538 0.9414 0.9516 0.9496 0.9366 0.95280.7 0.9552 0.9436 0.9478 0.9528 0.9320 0.95300.8 0.9544 0.9494 0.9508 0.9512 0.9368 0.94720.9 0.9572 0.9506 0.9454 0.9760 0.9674 0.9518
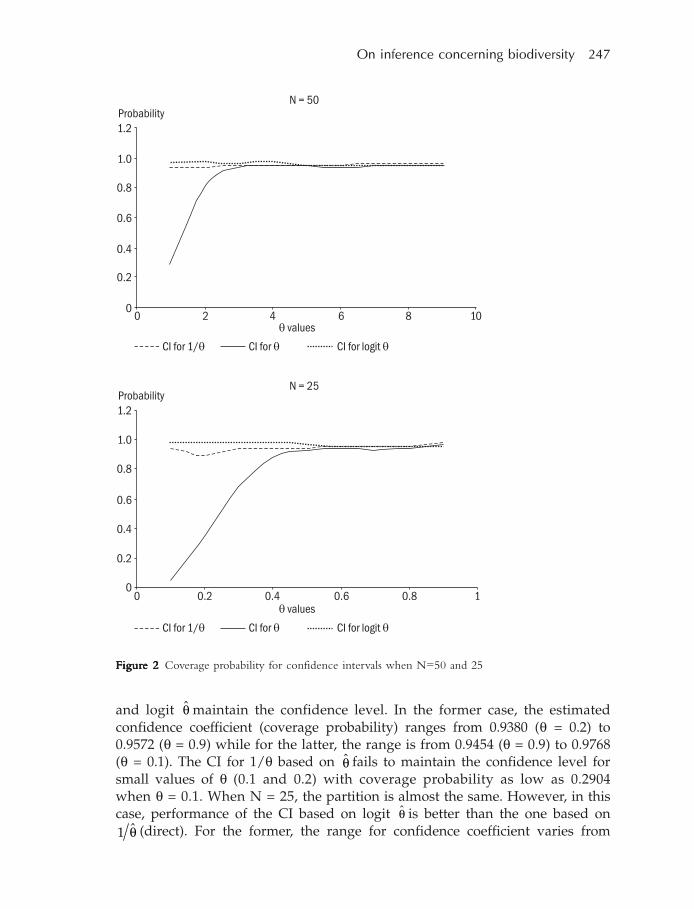
On inference concerning biodiversity 247
FigurFigurFigurFigurFigure 2e 2e 2e 2e 2 Coverage probability for confidence intervals when N=50 and 25
and logit θ maintain the confidence level. In the former case, the estimatedconfidence coefficient (coverage probability) ranges from 0.9380 (θ = 0.2) to0.9572 (θ = 0.9) while for the latter, the range is from 0.9454 (θ = 0.9) to 0.9768(θ = 0.1). The CI for 1/θ based on θ fails to maintain the confidence level forsmall values of θ (0.1 and 0.2) with coverage probability as low as 0.2904when θ = 0.1. When N = 25, the partition is almost the same. However, in thiscase, performance of the CI based on logit θ is better than the one based on
θ1 (direct). For the former, the range for confidence coefficient varies from
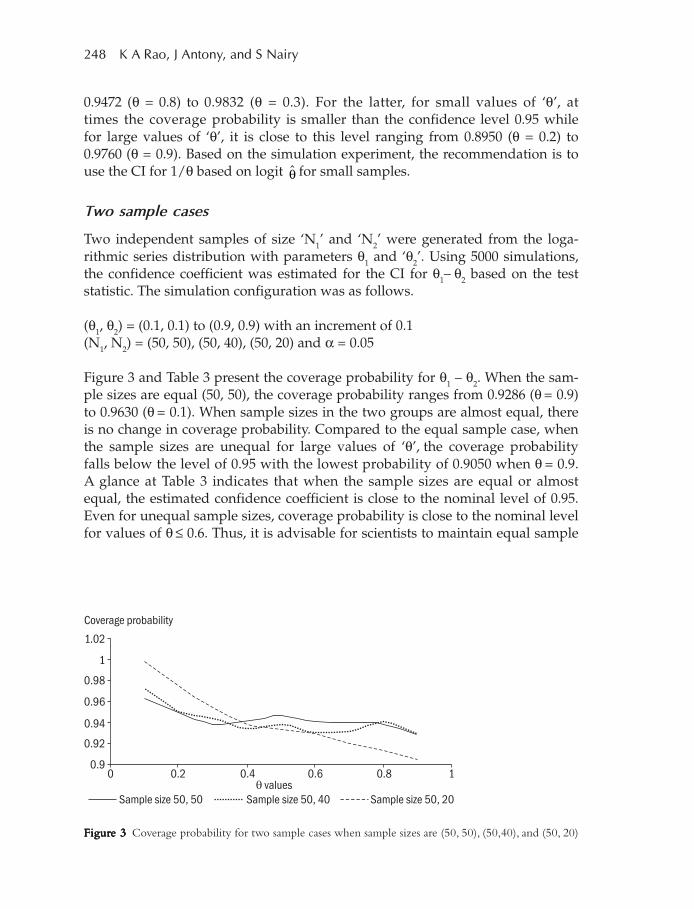
248 K A Rao, J Antony, and S Nairy
0.9472 (θ = 0.8) to 0.9832 (θ = 0.3). For the latter, for small values of ‘θ’, attimes the coverage probability is smaller than the confidence level 0.95 whilefor large values of ‘θ’, it is close to this level ranging from 0.8950 (θ = 0.2) to0.9760 (θ = 0.9). Based on the simulation experiment, the recommendation is touse the CI for 1/θ based on logit θ for small samples.
Two sample cases
Two independent samples of size ‘N1’ and ‘N2’ were generated from the loga-rithmic series distribution with parameters θ1 and ‘θ2’. Using 5000 simulations,the confidence coefficient was estimated for the CI for θ1– θ2 based on the teststatistic. The simulation configuration was as follows.
(θ1, θ2) = (0.1, 0.1) to (0.9, 0.9) with an increment of 0.1(N1, N2) = (50, 50), (50, 40), (50, 20) and α = 0.05
Figure 3 and Table 3 present the coverage probability for θ1 – θ2. When the sam-ple sizes are equal (50, 50), the coverage probability ranges from 0.9286 (θ = 0.9)to 0.9630 (θ = 0.1). When sample sizes in the two groups are almost equal, thereis no change in coverage probability. Compared to the equal sample case, whenthe sample sizes are unequal for large values of ‘θ’, the coverage probabilityfalls below the level of 0.95 with the lowest probability of 0.9050 when θ = 0.9.A glance at Table 3 indicates that when the sample sizes are equal or almostequal, the estimated confidence coefficient is close to the nominal level of 0.95.Even for unequal sample sizes, coverage probability is close to the nominal levelfor values of θ ≤ 0.6. Thus, it is advisable for scientists to maintain equal sample
FigurFigurFigurFigurFigure 3e 3e 3e 3e 3 Coverage probability for two sample cases when sample sizes are (50, 50), (50,40), and (50, 20)
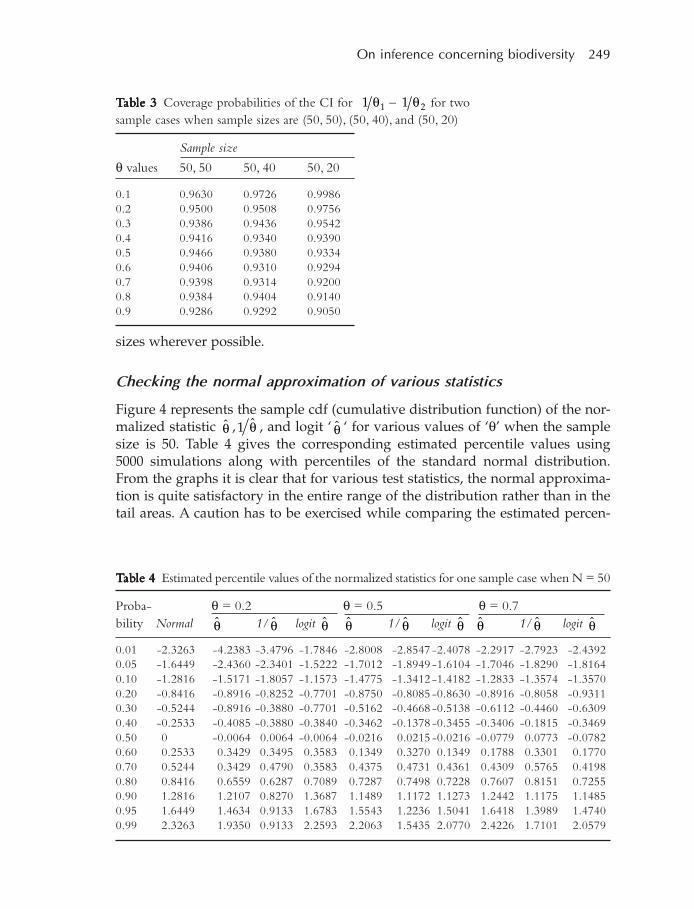
On inference concerning biodiversity 249
sizes wherever possible.
Checking the normal approximation of various statistics
Figure 4 represents the sample cdf (cumulative distribution function) of the nor-malized statistic θ , θ1 , and logit ‘ θ ‘ for various values of ‘θ’ when the samplesize is 50. Table 4 gives the corresponding estimated percentile values using5000 simulations along with percentiles of the standard normal distribution.From the graphs it is clear that for various test statistics, the normal approxima-tion is quite satisfactory in the entire range of the distribution rather than in thetail areas. A caution has to be exercised while comparing the estimated percen-
TTTTTababababable 3le 3le 3le 3le 3 Coverage probabilities of the CI for 11 θ – 21 θ for twosample cases when sample sizes are (50, 50), (50, 40), and (50, 20)
Sample size
θ values 50, 50 50, 40 50, 20
0.1 0.9630 0.9726 0.99860.2 0.9500 0.9508 0.97560.3 0.9386 0.9436 0.95420.4 0.9416 0.9340 0.93900.5 0.9466 0.9380 0.93340.6 0.9406 0.9310 0.92940.7 0.9398 0.9314 0.92000.8 0.9384 0.9404 0.91400.9 0.9286 0.9292 0.9050
TTTTTababababable 4le 4le 4le 4le 4 Estimated percentile values of the normalized statistics for one sample case when N = 50
Proba- θ = 0.2 θ = 0.5 θ = 0.7bility Normal θ 1/ θ logit θ θ 1/ θ logit θ θ 1/ θ logit θ
0.01 -2.3263 -4.2383 -3.4796 -1.7846 -2.8008 -2.8547 -2.4078 -2.2917 -2.7923 -2.43920.05 -1.6449 -2.4360 -2.3401 -1.5222 -1.7012 -1.8949 -1.6104 -1.7046 -1.8290 -1.81640.10 -1.2816 -1.5171 -1.8057 -1.1573 -1.4775 -1.3412 -1.4182 -1.2833 -1.3574 -1.35700.20 -0.8416 -0.8916 -0.8252 -0.7701 -0.8750 -0.8085 -0.8630 -0.8916 -0.8058 -0.93110.30 -0.5244 -0.8916 -0.3880 -0.7701 -0.5162 -0.4668 -0.5138 -0.6112 -0.4460 -0.63090.40 -0.2533 -0.4085 -0.3880 -0.3840 -0.3462 -0.1378 -0.3455 -0.3406 -0.1815 -0.34690.50 0 -0.0064 0.0064 -0.0064 -0.0216 0.0215 -0.0216 -0.0779 0.0773 -0.07820.60 0.2533 0.3429 0.3495 0.3583 0.1349 0.3270 0.1349 0.1788 0.3301 0.17700.70 0.5244 0.3429 0.4790 0.3583 0.4375 0.4731 0.4361 0.4309 0.5765 0.41980.80 0.8416 0.6559 0.6287 0.7089 0.7287 0.7498 0.7228 0.7607 0.8151 0.72550.90 1.2816 1.2107 0.8270 1.3687 1.1489 1.1172 1.1273 1.2442 1.1175 1.14850.95 1.6449 1.4634 0.9133 1.6783 1.5543 1.2236 1.5041 1.6418 1.3989 1.47400.99 2.3263 1.9350 0.9133 2.2593 2.2063 1.5435 2.0770 2.4226 1.7101 2.0579
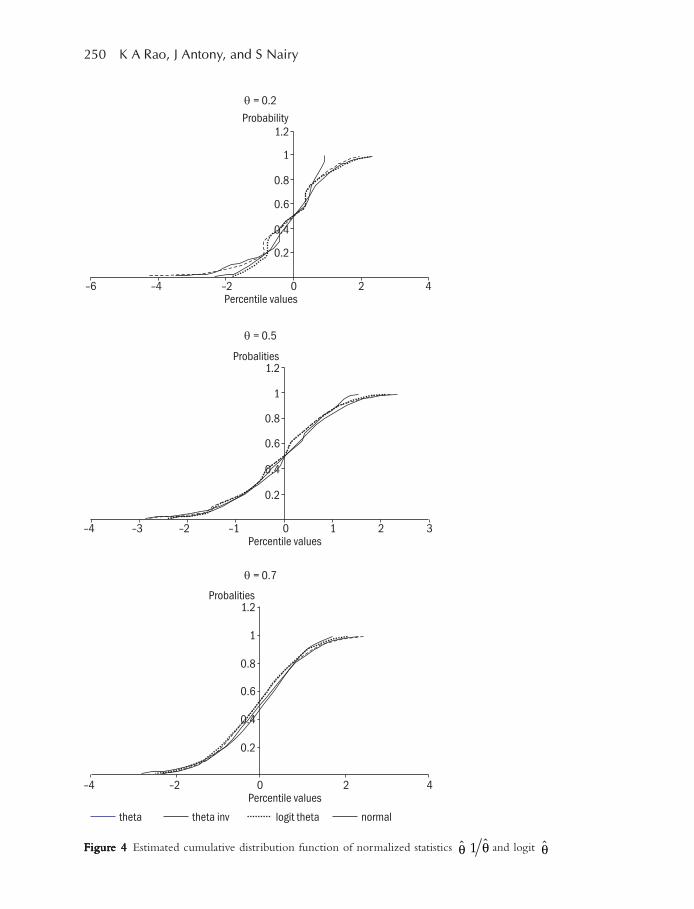
250 K A Rao, J Antony, and S Nairy
FigurFigurFigurFigurFigure 4e 4e 4e 4e 4 Estimated cumulative distribution function of normalized statistics θ θ1 and logit θ
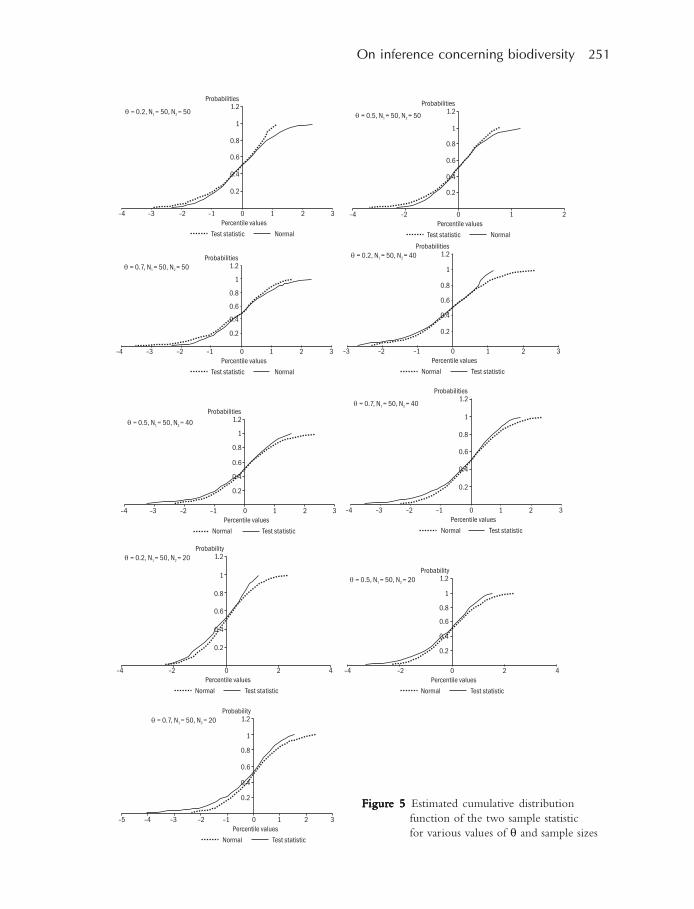
On inference concerning biodiversity 251
FigurFigurFigurFigurFigure 5e 5e 5e 5e 5 Estimated cumulative distributionfunction of the two sample statisticfor various values of θ and sample sizes
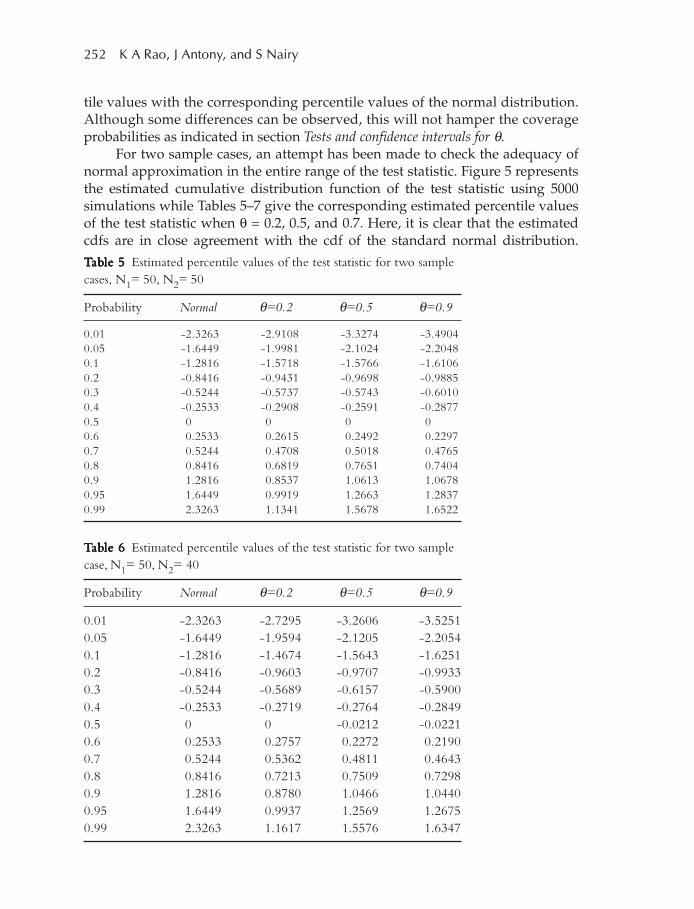
252 K A Rao, J Antony, and S Nairy
tile values with the corresponding percentile values of the normal distribution.Although some differences can be observed, this will not hamper the coverageprobabilities as indicated in section Tests and confidence intervals for θ.
For two sample cases, an attempt has been made to check the adequacy ofnormal approximation in the entire range of the test statistic. Figure 5 representsthe estimated cumulative distribution function of the test statistic using 5000simulations while Tables 5–7 give the corresponding estimated percentile valuesof the test statistic when θ = 0.2, 0.5, and 0.7. Here, it is clear that the estimatedcdfs are in close agreement with the cdf of the standard normal distribution.
TTTTTababababable 5le 5le 5le 5le 5 Estimated percentile values of the test statistic for two samplecases, N1= 50, N2= 50
Probability Normal θ=0.2 θ=0.5 θ=0.9
0.01 -2.3263 -2.9108 -3.3274 -3.49040.05 -1.6449 -1.9981 -2.1024 -2.20480.1 -1.2816 -1.5718 -1.5766 -1.61060.2 -0.8416 -0.9431 -0.9698 -0.98850.3 -0.5244 -0.5737 -0.5743 -0.60100.4 -0.2533 -0.2908 -0.2591 -0.28770.5 0 0 0 00.6 0.2533 0.2615 0.2492 0.22970.7 0.5244 0.4708 0.5018 0.47650.8 0.8416 0.6819 0.7651 0.74040.9 1.2816 0.8537 1.0613 1.06780.95 1.6449 0.9919 1.2663 1.28370.99 2.3263 1.1341 1.5678 1.6522
TTTTTababababable 6le 6le 6le 6le 6 Estimated percentile values of the test statistic for two samplecase, N1= 50, N2= 40
Probability Normal θ=0.2 θ=0.5 θ=0.9
0.01 -2.3263 -2.7295 -3.2606 -3.52510.05 -1.6449 -1.9594 -2.1205 -2.20540.1 -1.2816 -1.4674 -1.5643 -1.62510.2 -0.8416 -0.9603 -0.9707 -0.99330.3 -0.5244 -0.5689 -0.6157 -0.59000.4 -0.2533 -0.2719 -0.2764 -0.28490.5 0 0 -0.0212 -0.02210.6 0.2533 0.2757 0.2272 0.21900.7 0.5244 0.5362 0.4811 0.46430.8 0.8416 0.7213 0.7509 0.72980.9 1.2816 0.8780 1.0466 1.04400.95 1.6449 0.9937 1.2569 1.26750.99 2.3263 1.1617 1.5576 1.6347
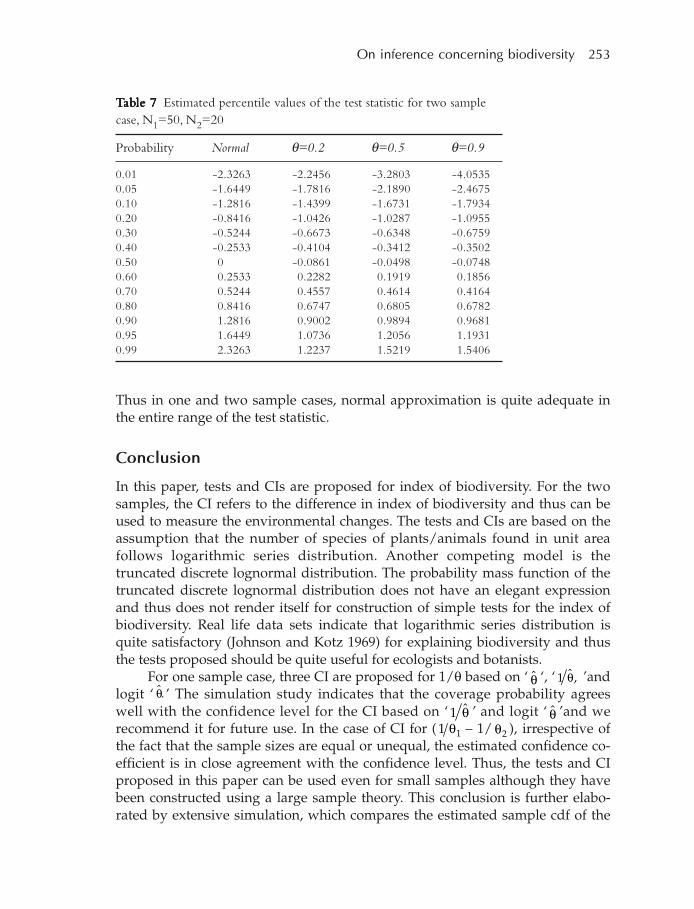
On inference concerning biodiversity 253
TTTTTababababable 7le 7le 7le 7le 7 Estimated percentile values of the test statistic for two samplecase, N1=50, N2=20
Probability Normal θ=0.2 θ=0.5 θ=0.9
0.01 -2.3263 -2.2456 -3.2803 -4.05350.05 -1.6449 -1.7816 -2.1890 -2.46750.10 -1.2816 -1.4399 -1.6731 -1.79340.20 -0.8416 -1.0426 -1.0287 -1.09550.30 -0.5244 -0.6673 -0.6348 -0.67590.40 -0.2533 -0.4104 -0.3412 -0.35020.50 0 -0.0861 -0.0498 -0.07480.60 0.2533 0.2282 0.1919 0.18560.70 0.5244 0.4557 0.4614 0.41640.80 0.8416 0.6747 0.6805 0.67820.90 1.2816 0.9002 0.9894 0.96810.95 1.6449 1.0736 1.2056 1.19310.99 2.3263 1.2237 1.5219 1.5406
Thus in one and two sample cases, normal approximation is quite adequate inthe entire range of the test statistic.
Conclusion
In this paper, tests and CIs are proposed for index of biodiversity. For the twosamples, the CI refers to the difference in index of biodiversity and thus can beused to measure the environmental changes. The tests and CIs are based on theassumption that the number of species of plants/animals found in unit areafollows logarithmic series distribution. Another competing model is thetruncated discrete lognormal distribution. The probability mass function of thetruncated discrete lognormal distribution does not have an elegant expressionand thus does not render itself for construction of simple tests for the index ofbiodiversity. Real life data sets indicate that logarithmic series distribution isquite satisfactory (Johnson and Kotz 1969) for explaining biodiversity and thusthe tests proposed should be quite useful for ecologists and botanists.
For one sample case, three CI are proposed for 1/θ based on ‘ θ ‘, ‘ ,ˆ1 θ ’andlogit ‘ .θ ’ The simulation study indicates that the coverage probability agreeswell with the confidence level for the CI based on ‘ θ1 ’ and logit ‘ θ ’and werecommend it for future use. In the case of CI for ( 11 θ – 1/ 2θ ), irrespective ofthe fact that the sample sizes are equal or unequal, the estimated confidence co-efficient is in close agreement with the confidence level. Thus, the tests and CIproposed in this paper can be used even for small samples although they havebeen constructed using a large sample theory. This conclusion is further elabo-rated by extensive simulation, which compares the estimated sample cdf of the
254 K A Rao, J Antony, and S Nairy
normalized test statistic with that of standard normal distribution. This showsthat the conclusion does not change with the values of the confidence level.
Acknowledgement
The authors are thankful to Mrs Melba D’Souza, TERI Western Regional Centre,
Goa, for her useful comments, which enhanced this presentation.
References
Barton D E, David F N, and Merrington M. 1963Tables for the solution of the exponential equation exp (b)–b/(1–p) = 1Biometrika 50: 169–172
Cox D R and Hinkley D V. 1974Theoretical StatisticsLondon: Chapman and Hall. 1–511 pp.
Fisher R A, Corbet A S, and Williams C B. 1943The relation between the number of species and the number of individuals in arandom sample of an animal populationJournal of Animal Ecology 12: 42–57
Gore A and Paranjpe S. 2001A Course in Mathematical and Statistical EcologyDordrecht: Kluwer Academic Publishers. pp. 1– 286
Hutcheson K. 1970A test for comparing diversities based on the Shannon formulaJournal of Theoretical Biology 29: 151–154
Johnson N L and Kotz S. 1969Distributions in Statistics: discrete distributionsNew York: John Wiley and Sons. pp. 1–328
Patil G P and Wani J K. 1963Maximum likelihood estimation for the complete and truncated logarithmicseries distributions, pp 398–409[Proceedings of the International Symposium on Discrete Distributions, Montreal](Also Sankhya, Series A, 27, 281–292)
Rao C R. 1973Linear Statistical Inference and its Applications (2nd edn)New York: Wiley. pp. 1–625
Unsustainablefisheries
Section III


Marine overexploitation: a syndrome ofglobal change
J P Kropp, K Eisenack, and J Scheffran
A formal dynamic description of marine overexploitation on an integratedand intermediate functional scale is provided to assess the general developmentpaths in fisheries. It is based on a pattern approach (cause–effect chains),describing the relevant driving forces and mitigation mechanisms in marinefisheries. Qualitative dynamical modelling and viability analysis are used toevaluate the internal dynamics systematically. It is shown that in spite of uncer-tain process knowledge, a variety of conclusions regarding sustainable fisheriescan be drawn. It is possible to provide valuable insights into how managementstrategies and institutional settings have to be designed in order to guaranteesafe outcomes.
Introduction
Marine overexploitation is a typical pattern of global environmental change pos-ing threats to mankind’s food security and marine biodiversity (MEA 2005). Fishcontributes to, or exceeds, 50% of the total animal proteins in a number of coun-tries, such as Bangladesh, Cambodia, Congo, Indonesia, and Japan. Overall, fishprovides more than 2.6 billion people with at least 20% of their average percapita intake of animal protein. The share of fish in total world animal proteinsupply amounted to 16% in 2001 (FAO 2004). Analysing these issues is not atask that is taken for its own sake, since a continuous unsustainable use ofmarine resources could have tremendous impacts on terrestrial protein produc-tion in future. While looking at marine fish stocks in detail, we discover that thehuman factor has impacted global marine biodiversity since historical times(Jackson, Kirby, Berger, et al. 2001; Myers and Worm 2003; Pauly, Christensen,Guenette, et al. 2002). Nevertheless, today the impacts of overexploitation andthe subsequent consequences are no longer locally nested, since 52% the of
For correspondence: [email protected]
15
258 J P Kropp, K Eisenack, and J Scheffran
marine stocks are exploited at their maximum sustainable level and 24% areoverexploited or depleted (FAO 2004).
It is a key characteristic of the entire earth system, and not only the fisherysystems, that it often deals with an exceptional dynamics involving innumer-able system parts and a multitude of (non-linear) interrelations between thesocio-economic and the natural sphere. The consequent complexity and the in-herent opaqueness in fisheries causing uncertain knowledge are often used asan argument that any kind of analysis is difficult (Hilborn and Walters 1992),and further that our knowledge is too weak to set up adequate interventionstrategies. Thus, for decades, it has been discussed in fishery science how thecomplexity could be properly handled and what the relevant factors for analys-ing the overfishing phenomenon are. Often it is argued that a more detailedanalysis of ecological relations is needed – for example, the functioning of foodwebs – in order to provide more successful strategies for utilization and controlof marine resources. This temptation will be strong, of course, since a rigorousassessment of patterns of overexploitation by one-sided views on ecological mi-cro-scale processes has been possible so far only for significantly simplifiedsystems. Ecological indicators – for example, on spawning biomass – could atbest provide only a rough estimate of the real situation. On the other hand, driv-ing forces in fisheries, the influence of the institutional settings, or industrylobbyism are rarely or unsuitably considered in analytical approaches(Anderies, Janssen, and Ostrom 2004; Jentoft 2004). Non-linearities, related to ei-ther human action or other external and/or internal forcings, could inducecounter-intuitive surprises and a vast variety of extra effects – either wanted orunwanted – in the ecological and/or socio-economic system.
Thus, we focus on a qualitative new dimension of problems at the human–environment interface in fisheries (Charles 2001; Davis and Gartside 2001).Increasing industrialization in marine fisheries – for example for the tuna fleet(FAO 2004) – considerably increases the pressure on marine resources and in-duces loss of marine biodiversity. On the other hand, fish products providemajor nourishments in several regions of the world (McGoodwin 2001), whilstin industrialized countries, designated fish species are already ‘luxury goods’.Moreover, management schemes put into force are either inefficient or they suf-fer from a lack of long-term planning and uncoordinated regulatoryframeworks (Freire and Garcia-Allut 2000; Pikitch, Santora, Babcock, et al. 2004).Neither regional management efforts, such as introduction of catch quota, northe implementation of transnational agreements (UN 1995), for example, EEZ(exclusive economic zones), has solved the permanent overexploitation of theseas and displacement of artisanal/subsistence fisheries. This array of facetsclearly shows that the properties and the associated problems of fisheries aretranssectorally structured, that is, an adequate analysis lies beyond the tradi-tional disciplinary realms (Des Clers and Nauen 2002; Pauly, Alder, Bennett,et al. 2003). Moreover, the inherent indeterminacy implies that we cannot trust
Marine overexploitation: a syndrome of global change 259
numbers and should trust only trends. Against this background, three chal-lenges emerge: (i) the need for a transsectoral and integrated analyticalapproach, (ii) the necessity to combine knowledge of different qualities from dif-ferent disciplines into a common analytical/formal concept, and (iii) thenecessity to provide application-oriented knowledge, which would not onlyhelp to avoid overexploitation but also sustain fisheries economically.
To achieve these tasks, a structured and well-organized approach is a pre-condition. It must comprise a systematic stocktaking that collects relevantinformation from various socio-economic, ecological, and institutional domainsand takes into account complexity in fisheries in an appropriate way. In a fur-ther step, modelling should be used for addressing these challenges. New andsmart techniques are able to incorporate knowledge from different domains, toevaluate the complex interplay between different system parts, and to supplyvaluable clues for management strategies. Such a strategy is essential, since ac-cording to systems theory, complex phenomena need some kind of formalanalysis. Only an advanced calculus can be used to anticipate and systemati-cally assess abrupt changes or other surprises in a system. However, with suchan approach, we are far from being able to provide an exact prognosis of howglobal fisheries evolve, since any modelling approach is a generalization intro-ducing a ‘reductionist uncertainty’. This must be distinguished from the systemscomplexity and measurement-related uncertainty. We propose an approachwhich does not undertake a formal analysis with more and more details, but al-lows us to determine the general functionalities of marine capture fisheries.With such an approach, we seek to identify ‘signals’ indicating critical develop-ments to supply a ‘weak’ prognosis of potential development paths. For thispurpose, new and unconventional tools from information sciences, theoreticalphysics, and systems theory are employed (cf. Aubin 1991; Kuipers 1994).
The presented methodology is motivated by some discouraging resultsfrom recent bio-economics, which try to anticipate future developments by iso-lated views on restricted problems, unsuitable modelling approaches, and/orinadequate presumptions (cf. Imeson, van den Bergh, and Hoekstra 2003).Policy advice based on these approaches could be misleading, and it could alsoinduce – possibly unwanted – serious side effects. Our contribution highlightsthat in spite of different types of indeterminacy, it is possible to achieve judi-cious measures to prevent or mitigate unacceptable outcomes. In the first step,we use pattern approach to identify the typical mechanisms in marine capturefisheries. In the second step, we introduce two modelling approaches capable ofdealing with uncertainties and qualitative knowledge. We illustrate that if weare accepting uncertainty, the general development in fisheries can be antici-pated and that steering options can be derived which may have a betterperformance with respect to defined sustainability targets.
We have organized this paper as follows. In the subsequent section, a briefoverview on the pattern approach is provided, followed by an elaboration of the
260 J P Kropp, K Eisenack, and J Scheffran
so-called marine overexploitation syndrome. A qualitative and semi-quantita-tive model is developed allowing a systematic analysis of the current settings infisheries and institutional arrangements. It comprises distinct stakeholdergroups and derives sustainability conditions for both the fisheries and marineresources. The implications regarding fishery management are discussed indetail. The paper ends with Conclusion.
The pattern approach
Pattern recognition is an essential technique to cope with complex situationsand is part of the learning process in human–environment interaction. The brainof mammals is most efficient in reconstructing fragmentary information andproviding solutions for unknown situations by referring to analogous cases.During the second half of the 20th century, neuroscience discovered and de-scribed the underlying mechanisms of these processes. Subsequently, a varietyof artificial neural network methodologies have been developed to make use ofthese features (cf. Kohonen 2001; Kropp and Schellnhuber 2006). Compared tothe efficiency of brains, artificial neural networks have several shortcomings; forexample, they need a huge amount of input data and do not explain how theyachieve results. Thus, they have a limited suitability to deduce knowledge fromqualitative and uncertain situations that are common in our daily life as well asin fisheries. Several crucial barriers undermine systematic examinations of ma-rine resource exploitation, including the non-linearities pervading all parts ofthe fishery system and the complexity of multi-cause–multi-effect processes. Inface of these discouraging features, the questions are how can we providepolicy-relevant knowledge that would help to steer marine capture fisheries tosafe limits, and which methodological concept would be useful in this context?
In a more general context of global change research, the so-called syn-drome approach was suggested as an instrument to analyse complextranssectoral phenomena. It provides a semi-quantitative and transsectoraloverview of the ‘dynamical degradation patterns’ that characterize contempo-rary human–environment interactions across the planet (Schellnhuber, Lüdeke,Petschel-Held 2002). It decomposes the mega-process of ‘global change’ into ar-chetypal patterns, named syndromes, under the hypothesis that the web ofrelationships governing the planetary development is made up by a finite set oftranssectoral sub-webs of distinct causal typology (syndromes). The situation inmarine capture fisheries can be described by the so-called overexploitation syn-drome, which also has a terrestrial part (that is the overexploitation of primaryforests, cf. Cassel-Gintz and Petschel-Held 2000). For discussion on furthersyndromatic pattern, cf. Schellnhuber, Block, Cassel-Gintz, et al. (1997); Petschel-Held, Block, Cassel-Gintz, et al. (1999); Kropp, Reusswig, and Lüdeke (2001);and Lüdeke, Petschel-Held, and Schellnhuber (2004).The syndrome concept was
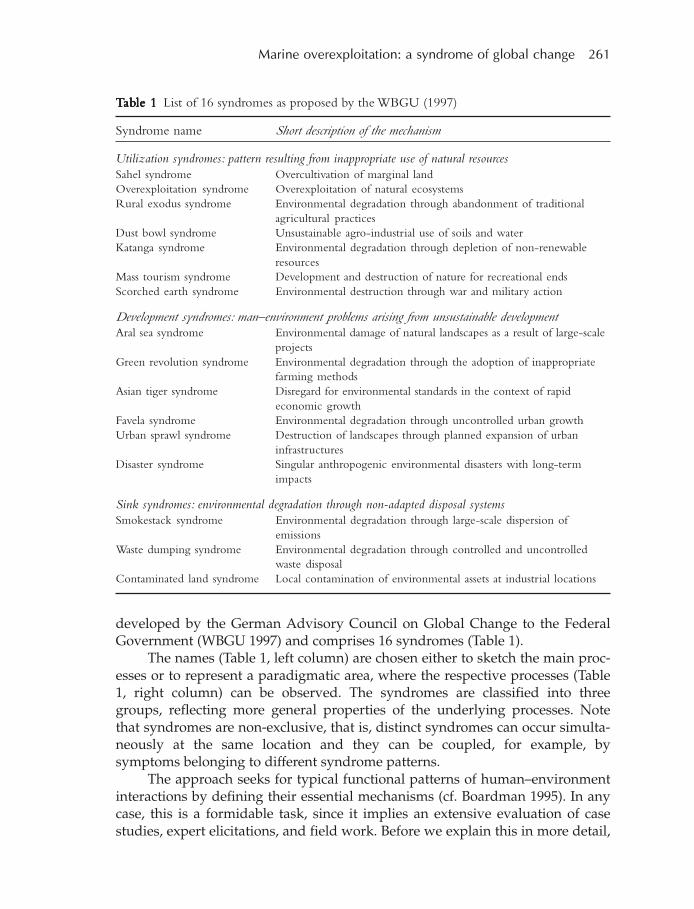
Marine overexploitation: a syndrome of global change 261
developed by the German Advisory Council on Global Change to the FederalGovernment (WBGU 1997) and comprises 16 syndromes (Table 1).
The names (Table 1, left column) are chosen either to sketch the main proc-esses or to represent a paradigmatic area, where the respective processes (Table1, right column) can be observed. The syndromes are classified into threegroups, reflecting more general properties of the underlying processes. Notethat syndromes are non-exclusive, that is, distinct syndromes can occur simulta-neously at the same location and they can be coupled, for example, bysymptoms belonging to different syndrome patterns.
The approach seeks for typical functional patterns of human–environmentinteractions by defining their essential mechanisms (cf. Boardman 1995). In anycase, this is a formidable task, since it implies an extensive evaluation of casestudies, expert elicitations, and field work. Before we explain this in more detail,
TTTTTababababable 1le 1le 1le 1le 1 List of 16 syndromes as proposed by the WBGU (1997)
Syndrome name Short description of the mechanism
Utilization syndromes: pattern resulting from inappropriate use of natural resourcesSahel syndrome Overcultivation of marginal landOverexploitation syndrome Overexploitation of natural ecosystemsRural exodus syndrome Environmental degradation through abandonment of traditional
agricultural practicesDust bowl syndrome Unsustainable agro-industrial use of soils and waterKatanga syndrome Environmental degradation through depletion of non-renewable
resourcesMass tourism syndrome Development and destruction of nature for recreational endsScorched earth syndrome Environmental destruction through war and military action
Development syndromes: man–environment problems arising from unsustainable developmentAral sea syndrome Environmental damage of natural landscapes as a result of large-scale
projectsGreen revolution syndrome Environmental degradation through the adoption of inappropriate
farming methodsAsian tiger syndrome Disregard for environmental standards in the context of rapid
economic growthFavela syndrome Environmental degradation through uncontrolled urban growthUrban sprawl syndrome Destruction of landscapes through planned expansion of urban
infrastructuresDisaster syndrome Singular anthropogenic environmental disasters with long-term
impacts
Sink syndromes: environmental degradation through non-adapted disposal systemsSmokestack syndrome Environmental degradation through large-scale dispersion of
emissionsWaste dumping syndrome Environmental degradation through controlled and uncontrolled
waste disposalContaminated land syndrome Local contamination of environmental assets at industrial locations
262 J P Kropp, K Eisenack, and J Scheffran
the following definitions have to be introduced which are essential for a generalunderstanding of the syndrome concept.1
Symptoms are the basic entities for the description of the earth system withrespect to problematic developments, as is the case with marineoverexploitation. A symptom is a functional aggregate of detailed variablesdescribing a single sub-process of global change closely related to thehuman–environment interface. Examples are loss of species diversity, urbani-zation, or freshwater scarcity. The concept works with approximately 80symptoms associated to different spheres (atmosphere, social organization,science and technology, biosphere, etc.). They also include a temporal charac-teristics of the specific trends; thus, a symptom X is characterized by thetuple ,...)X,X,X,X( &&&&&& (dots denote derivatives with respect to time, that is,trends, acceleration, etc.).
Interrelations are the connecting elements for the symptoms and specify thecausal relations. They are defined as monotonic relations, that is, with in-creasing (enforcing) or decreasing (mitigating) effect.
The marine overexploitation syndrome
The marine overexploitation syndrome is a specific expression of the generaloverexploitation syndrome (for details on the terrestrial component, cf. Cassel-Gintz and Petschel-Held 2000), that is, several symptoms are identical, forexample degradation of ecosystems, policy failure, or expansion of infrastruc-ture, and therefore also relevant for the constituting part for the marineexpression of the overexploitation syndrome. Nevertheless, some differences areprominent, such as the problem of estimating biomass exactly, the migratoryproperties of stocks, or the non-stationarity of infrastructure. The problematicdevelopment pattern is specified by the syndrome-specific network of interrela-tions (Figure 1), where the ellipses represent the symptoms, the arrowsenforcing, and the lines with bullets mitigating interactions. For a first systema-tization, one has to identify those processes that are characteristic (cf., forexample, Hutchings, Walters, and Haedrich 1997; Munro 1999; Harris 1999;Bennett, Neiland, Anang, et al. 2001); Petersen 2002; Soma 2003; Wickham 2003;Freire and Garcia-Allut 2000), that is, we have to identify symptoms and interre-lations which are at least necessary, but – possibly – not sufficient for the
1 The terms ‘symptoms and ‘syndrome’ were introduced in analogy to medicine where sev-eral combinations of symptoms may cause – serious – certain syndromes. During the recentyears, the concept was further developed, that is, it includes now curative elements. In thecontext of Figure 1, this implies that trends and arrows associated with positive effects arestronger than negatives ones. Further, the approach increasingly includes institutional pat-terns, since there is an increasing awareness that they have relevant impacts onhuman–environment interactions.
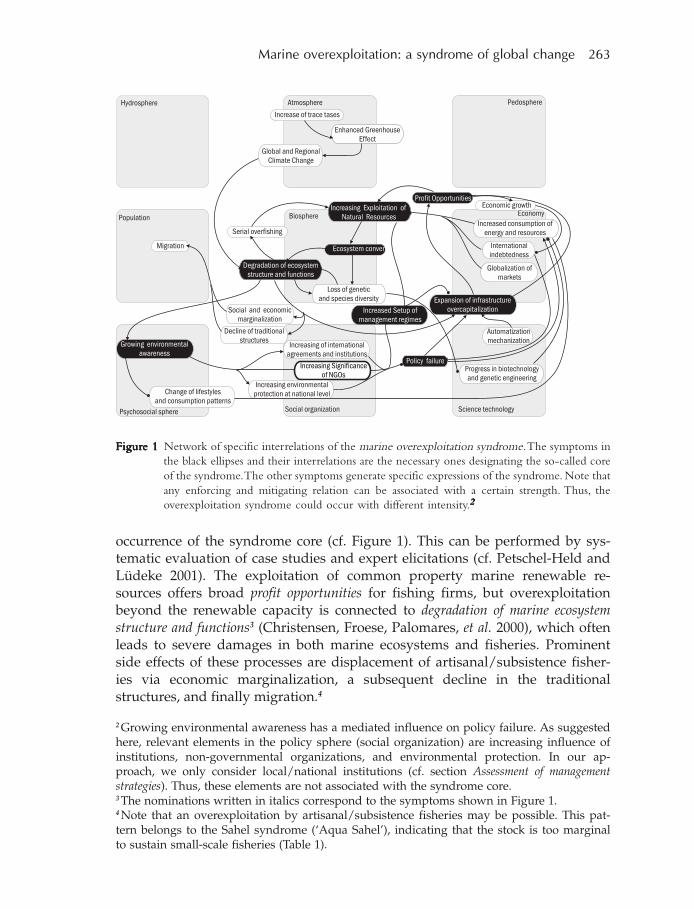
Marine overexploitation: a syndrome of global change 263
occurrence of the syndrome core (cf. Figure 1). This can be performed by sys-tematic evaluation of case studies and expert elicitations (cf. Petschel-Held andLüdeke 2001). The exploitation of common property marine renewable re-sources offers broad profit opportunities for fishing firms, but overexploitationbeyond the renewable capacity is connected to degradation of marine ecosystemstructure and functions3 (Christensen, Froese, Palomares, et al. 2000), which oftenleads to severe damages in both marine ecosystems and fisheries. Prominentside effects of these processes are displacement of artisanal/subsistence fisher-ies via economic marginalization, a subsequent decline in the traditionalstructures, and finally migration.4
FigurFigurFigurFigurFigure 1e 1e 1e 1e 1 Network of specific interrelations of the marine overexploitation syndrome. The symptoms inthe black ellipses and their interrelations are the necessary ones designating the so-called coreof the syndrome. The other symptoms generate specific expressions of the syndrome. Note thatany enforcing and mitigating relation can be associated with a certain strength. Thus, theoverexploitation syndrome could occur with different intensity.22222
2 Growing environmental awareness has a mediated influence on policy failure. As suggestedhere, relevant elements in the policy sphere (social organization) are increasing influence ofinstitutions, non-governmental organizations, and environmental protection. In our ap-proach, we only consider local/national institutions (cf. section Assessment of managementstrategies). Thus, these elements are not associated with the syndrome core.3 The nominations written in italics correspond to the symptoms shown in Figure 1.4 Note that an overexploitation by artisanal/subsistence fisheries may be possible. This pat-tern belongs to the Sahel syndrome (‘Aqua Sahel’), indicating that the stock is too marginalto sustain small-scale fisheries (Table 1).
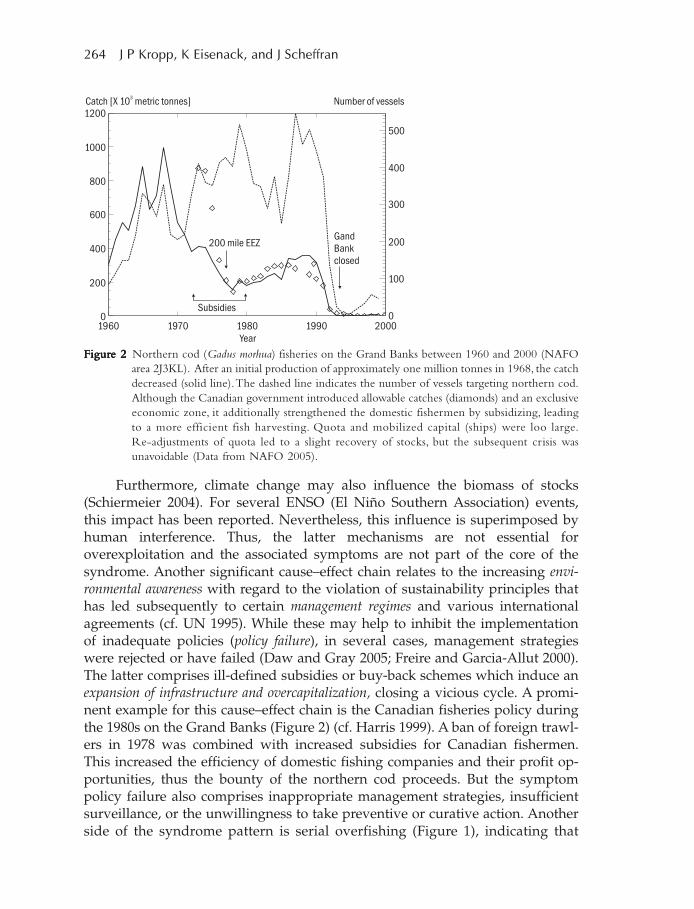
264 J P Kropp, K Eisenack, and J Scheffran
Furthermore, climate change may also influence the biomass of stocks(Schiermeier 2004). For several ENSO (El Niño Southern Association) events,this impact has been reported. Nevertheless, this influence is superimposed byhuman interference. Thus, the latter mechanisms are not essential foroverexploitation and the associated symptoms are not part of the core of thesyndrome. Another significant cause–effect chain relates to the increasing envi-ronmental awareness with regard to the violation of sustainability principles thathas led subsequently to certain management regimes and various internationalagreements (cf. UN 1995). While these may help to inhibit the implementationof inadequate policies (policy failure), in several cases, management strategieswere rejected or have failed (Daw and Gray 2005; Freire and Garcia-Allut 2000).The latter comprises ill-defined subsidies or buy-back schemes which induce anexpansion of infrastructure and overcapitalization, closing a vicious cycle. A promi-nent example for this cause–effect chain is the Canadian fisheries policy duringthe 1980s on the Grand Banks (Figure 2) (cf. Harris 1999). A ban of foreign trawl-ers in 1978 was combined with increased subsidies for Canadian fishermen.This increased the efficiency of domestic fishing companies and their profit op-portunities, thus the bounty of the northern cod proceeds. But the symptompolicy failure also comprises inappropriate management strategies, insufficientsurveillance, or the unwillingness to take preventive or curative action. Anotherside of the syndrome pattern is serial overfishing (Figure 1), indicating that
FigurFigurFigurFigurFigure 2e 2e 2e 2e 2 Northern cod (Gadus morhua) fisheries on the Grand Banks between 1960 and 2000 (NAFOarea 2J3KL). After an initial production of approximately one million tonnes in 1968, the catchdecreased (solid line). The dashed line indicates the number of vessels targeting northern cod.Although the Canadian government introduced allowable catches (diamonds) and an exclusiveeconomic zone, it additionally strengthened the domestic fishermen by subsidizing, leadingto a more efficient fish harvesting. Quota and mobilized capital (ships) were loo large.Re-adjustments of quota led to a slight recovery of stocks, but the subsequent crisis wasunavoidable (Data from NAFO 2005).
Marine overexploitation: a syndrome of global change 265
fishers change the target species if harvesting of the latter becomes inefficient.This accelerates resource degradation and ecosystem conversion, and finally di-minishes the profit opportunities of the fishing industry.
In the following section, we try to model the mechanisms of overexploita-tion in order to provide general insights into the overall behaviour of marinecapture fisheries. Their main dynamical properties are identified under the as-sumption of a weak legislatory framework. In the subsequent step, we try toassess management schemes and institutional setting systematically and pro-vide clues whether they are suitable and how they must be designed.
Qualitative modelling of the syndromatic pattern of marineoverexploitation
Based on the above-mentioned qualitative analysis and a review of the state-of-the-art bio-economic modelling, a model approach was developed, whichintegrates the main system parts and could help to anticipate the future devel-opment in fisheries. As indicated in Figure 1, fisheries can be characterized as aco-evolutionary systems that consist of an economic and a natural systems part.If we are focussing on the core of the syndromatic pattern, it becomes clear thatthis system is far from being fair and effective. It constitutes a vicious cycle,characterized by market mechanisms and policy constraints which have set theoptimization paradigm (cf. Schellnhuber and Kropp 1998) in industrial fisheriesinto force. Consequently, economic pressure on marine renewable resources hasbeen a major topic discussed in environmental economics over the past two dec-ades. One of the key characteristics in this context is the highly specializedcapital stock (ships, gear), which cannot readily be converted to other uses, thatis, fisheries are characterized by some kind of indolence which inhibits capitalreduction. But despite recent efforts, intrinsic system properties (uncertainty)have led to a situation in which current modelling approaches are still rudimen-tary and deal with unsuitable simplifications (for example, equilibriumsolutions, linear assumptions), because vagueness seems to be an obstacle forimproved models (cf. Amundsen, Bjørndal, and Conrad 1995; Boyce 1995;Clark, Clarke, and Munro 1979; Jørgensen and Kort 1997; McKelvey 1985;Munro 1999).
We surmount these difficulties by introducing a general approach whichcontains more realistic assumptions (for example, on the rational choices of fish-ing firms) and also utilizes qualitative knowledge for modelling efforts (cf.Eisenack and Kropp 2001; Kropp, Zickfeld, and Eisenack 2002, McIntosh 2003).Let us point out that the model focuses explicitly on the system dynamics,because bio-economic systems normally tend to stay far away from equilibrium.Thus, our proposed method abstracts from classical approaches by applying amethodological concept that allows a non-linear dynamical and qualitativemodelling under data-poor situations (for more details on the model, cf.
266 J P Kropp, K Eisenack, and J Scheffran
Eisenack, Welsch, and Kropp 2005). It allows all possible dynamic behaviours ofthe system to be characterized and classified on the basis of purely qualitativerelationships (that is, in the absence of quantitative information this means, forexample, that with an increase in the harvest, the stock decreases and the capitalincreases).
Let us briefly introduce the concept. Consider the dynamics of the eco-nomic and the biological stock. In the natural sphere, a resource ‘x’ is associatedwith a recruitment function R(x). The time development of the stock can bemodelled by )hh()x(Rx ′+−=& , where ‘h’ denotes the harvest of the firm underconsideration and h’ those of all the others. The economic sphere is representedby relevant agents (for example, firms, fishermen) that seek profits and interferewith the natural environment via the catch produced. The human impact on theenvironment is a function of the state of the environment, human efforts, and ef-ficiency, which is largely shaped by the impact of the technology on the fishcatch rate. Thus, each firm’s capital stock (ships, gear) is described by CIC δ−=& ,where I = 0 represents (irreversible) investment and ‘δ’ a constant depreciationrate for the capital. Moreover, assuming that fishery firms apply an optimizationstrategy, it is the goal of each fishing company to select a plan for investmentand harvest which maximizes the discounted (current-value) profit Π
[ ]−η ′∏ = + − ν −∫.t
J
e p(h h )h (h,x, C) c(I) dt ......................................................... (1)
subject to the equations for stock and capital. Here, the parameter ‘h’ representsa constant discount rate and the demand for fish is expressed by a down-ward sloping inverted demand function p(h+h’), which assigns the obtainedmarket price to the total harvest. The convex function v(h,x,C) refers to the vari-able costs which increase in ‘h’ and decrease in ‘x’ and ‘C’. Investment costs aregiven by the strictly convex and increasing function c(I), whereby the convexityreflects the inelastic supply of highly specialized equipment and rising adjust-ment costs. Finally, J = [0,T] represents a planning interval. Actually, such aproblem can be described as a non-cooperative differential game introducingthe Nash assumption that each rival rests its own decisions on given levels ofharvest and investment of the other N-1 market participants competing for thecommon property resource. Presuming also that all firms are characterized bythe same technology and behave in a similar way, one obtains h+h’ = Nh. Ap-plying optimization principles (for details, cf. Mangasarian 1966), we derive asystem of ODE (ordinary differential equations), describing the optimal evolu-tion of investment and harvest5
.............................................................................................................................. (2)
5 For sake of readability Xz denotes the first partial and Xzz the second partial derivative of thefunction X with respect to Z (cf. Equations 3 and 4)
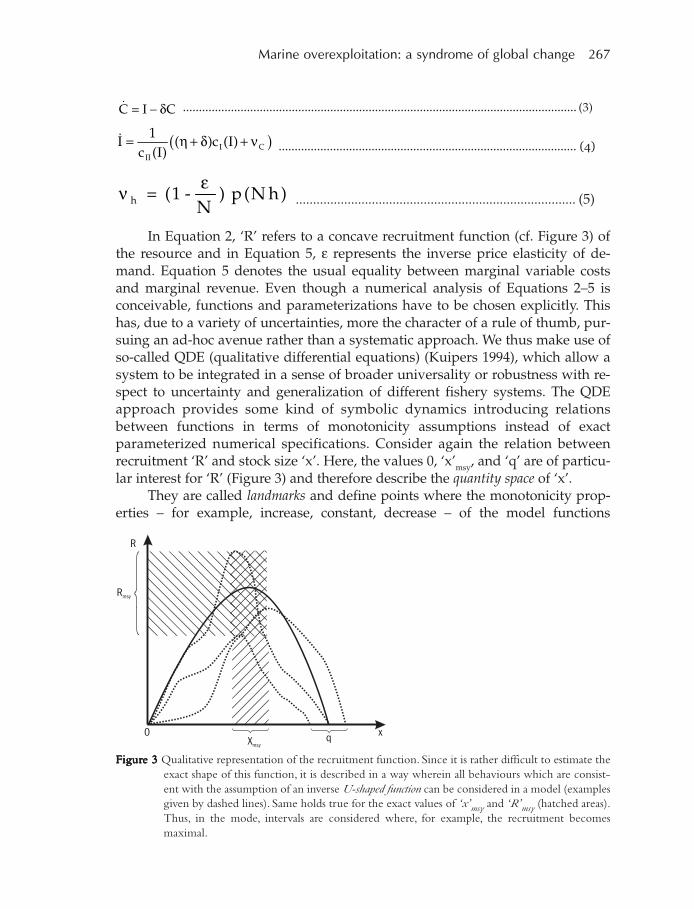
Marine overexploitation: a syndrome of global change 267
CIC δ−=& ........................................................................................................................... (3)
( )= η + δ + ν&I C
II
1I ( )c (I)
c (I) ............................................................................................. (4)
εν h = (1 - ) p (N h)N ................................................................................. (5)
In Equation 2, ‘R’ refers to a concave recruitment function (cf. Figure 3) ofthe resource and in Equation 5, ε represents the inverse price elasticity of de-mand. Equation 5 denotes the usual equality between marginal variable costsand marginal revenue. Even though a numerical analysis of Equations 2–5 isconceivable, functions and parameterizations have to be chosen explicitly. Thishas, due to a variety of uncertainties, more the character of a rule of thumb, pur-suing an ad-hoc avenue rather than a systematic approach. We thus make use ofso-called QDE (qualitative differential equations) (Kuipers 1994), which allow asystem to be integrated in a sense of broader universality or robustness with re-spect to uncertainty and generalization of different fishery systems. The QDEapproach provides some kind of symbolic dynamics introducing relationsbetween functions in terms of monotonicity assumptions instead of exactparameterized numerical specifications. Consider again the relation betweenrecruitment ‘R’ and stock size ‘x’. Here, the values 0, ‘x’msy, and ‘q’ are of particu-lar interest for ‘R’ (Figure 3) and therefore describe the quantity space of ‘x’.
They are called landmarks and define points where the monotonicity prop-erties – for example, increase, constant, decrease – of the model functions
FigurFigurFigurFigurFigure 3 e 3 e 3 e 3 e 3 Qualitative representation of the recruitment function. Since it is rather difficult to estimate theexact shape of this function, it is described in a way wherein all behaviours which are consist-ent with the assumption of an inverse U-shaped function can be considered in a model (examplesgiven by dashed lines). Same holds true for the exact values of ‘x’msy and ‘R’msy (hatched areas).Thus, in the mode, intervals are considered where, for example, the recruitment becomesmaximal.
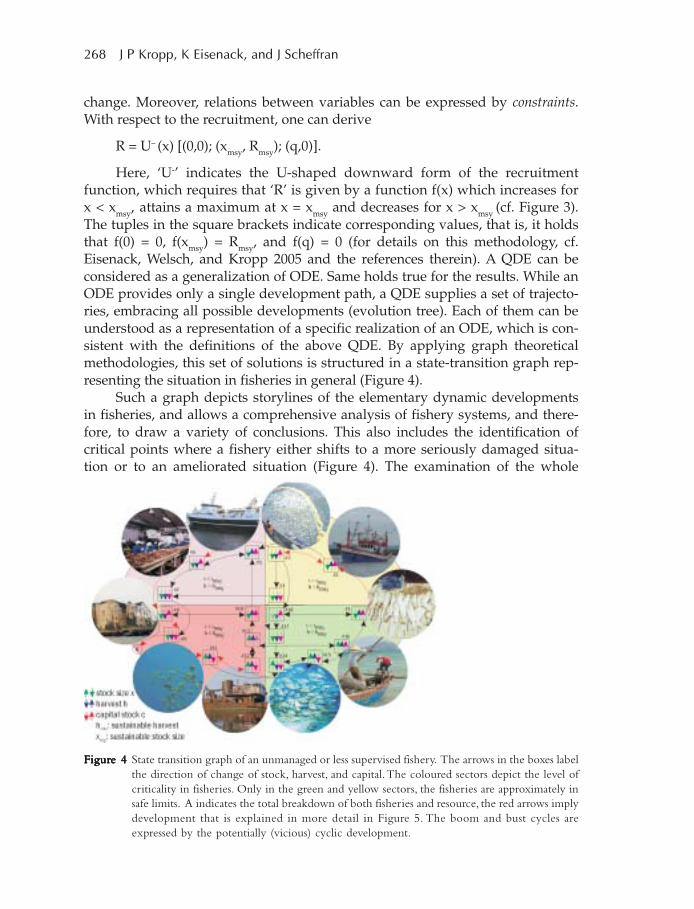
268 J P Kropp, K Eisenack, and J Scheffran
change. Moreover, relations between variables can be expressed by constraints.With respect to the recruitment, one can derive
R = U– (x) [(0,0); (xmsy, Rmsy); (q,0)].
Here, ‘U-’ indicates the U-shaped downward form of the recruitmentfunction, which requires that ‘R’ is given by a function f(x) which increases forx < xmsy, attains a maximum at x = xmsy and decreases for x > xmsy (cf. Figure 3).The tuples in the square brackets indicate corresponding values, that is, it holdsthat f(0) = 0, f(xmsy) = Rmsy, and f(q) = 0 (for details on this methodology, cf.Eisenack, Welsch, and Kropp 2005 and the references therein). A QDE can beconsidered as a generalization of ODE. Same holds true for the results. While anODE provides only a single development path, a QDE supplies a set of trajecto-ries, embracing all possible developments (evolution tree). Each of them can beunderstood as a representation of a specific realization of an ODE, which is con-sistent with the definitions of the above QDE. By applying graph theoreticalmethodologies, this set of solutions is structured in a state-transition graph rep-resenting the situation in fisheries in general (Figure 4).
Such a graph depicts storylines of the elementary dynamic developmentsin fisheries, and allows a comprehensive analysis of fishery systems, and there-fore, to draw a variety of conclusions. This also includes the identification ofcritical points where a fishery either shifts to a more seriously damaged situa-tion or to an ameliorated situation (Figure 4). The examination of the whole
FigurFigurFigurFigurFigure 4e 4e 4e 4e 4 State transition graph of an unmanaged or less supervised fishery. The arrows in the boxes labelthe direction of change of stock, harvest, and capital. The coloured sectors depict the level ofcriticality in fisheries. Only in the green and yellow sectors, the fisheries are approximately insafe limits. A indicates the total breakdown of both fisheries and resource, the red arrows implydevelopment that is explained in more detail in Figure 5. The boom and bust cycles areexpressed by the potentially (vicious) cyclic development.
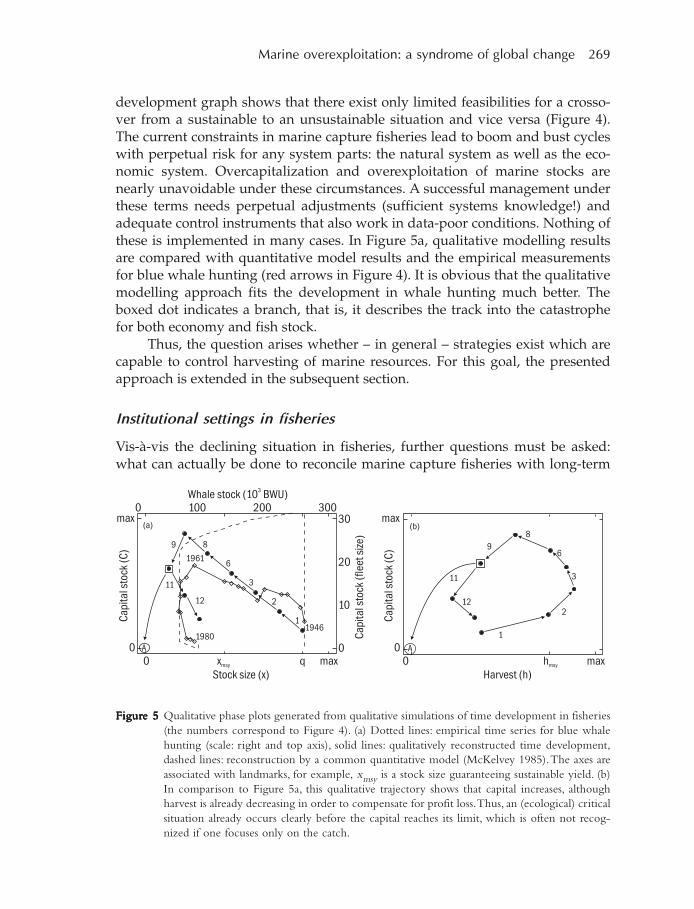
Marine overexploitation: a syndrome of global change 269
development graph shows that there exist only limited feasibilities for a crosso-ver from a sustainable to an unsustainable situation and vice versa (Figure 4).The current constraints in marine capture fisheries lead to boom and bust cycleswith perpetual risk for any system parts: the natural system as well as the eco-nomic system. Overcapitalization and overexploitation of marine stocks arenearly unavoidable under these circumstances. A successful management underthese terms needs perpetual adjustments (sufficient systems knowledge!) andadequate control instruments that also work in data-poor conditions. Nothing ofthese is implemented in many cases. In Figure 5a, qualitative modelling resultsare compared with quantitative model results and the empirical measurementsfor blue whale hunting (red arrows in Figure 4). It is obvious that the qualitativemodelling approach fits the development in whale hunting much better. Theboxed dot indicates a branch, that is, it describes the track into the catastrophefor both economy and fish stock.
Thus, the question arises whether – in general – strategies exist which arecapable to control harvesting of marine resources. For this goal, the presentedapproach is extended in the subsequent section.
Institutional settings in fisheries
Vis-à-vis the declining situation in fisheries, further questions must be asked:what can actually be done to reconcile marine capture fisheries with long-term
FigurFigurFigurFigurFigure 5e 5e 5e 5e 5 Qualitative phase plots generated from qualitative simulations of time development in fisheries(the numbers correspond to Figure 4). (a) Dotted lines: empirical time series for blue whalehunting (scale: right and top axis), solid lines: qualitatively reconstructed time development,dashed lines: reconstruction by a common quantitative model (McKelvey 1985). The axes areassociated with landmarks, for example, xmsy is a stock size guaranteeing sustainable yield. (b)In comparison to Figure 5a, this qualitative trajectory shows that capital increases, althoughharvest is already decreasing in order to compensate for profit loss. Thus, an (ecological) criticalsituation already occurs clearly before the capital reaches its limit, which is often not recog-nized if one focuses only on the catch.
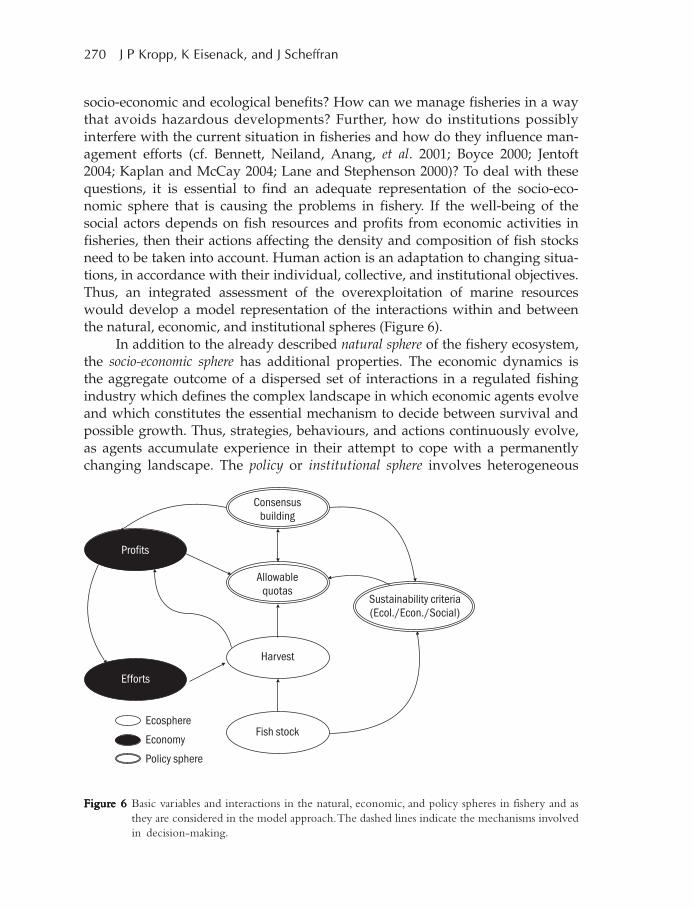
270 J P Kropp, K Eisenack, and J Scheffran
socio-economic and ecological benefits? How can we manage fisheries in a waythat avoids hazardous developments? Further, how do institutions possiblyinterfere with the current situation in fisheries and how do they influence man-agement efforts (cf. Bennett, Neiland, Anang, et al. 2001; Boyce 2000; Jentoft2004; Kaplan and McCay 2004; Lane and Stephenson 2000)? To deal with thesequestions, it is essential to find an adequate representation of the socio-eco-nomic sphere that is causing the problems in fishery. If the well-being of thesocial actors depends on fish resources and profits from economic activities infisheries, then their actions affecting the density and composition of fish stocksneed to be taken into account. Human action is an adaptation to changing situa-tions, in accordance with their individual, collective, and institutional objectives.Thus, an integrated assessment of the overexploitation of marine resourceswould develop a model representation of the interactions within and betweenthe natural, economic, and institutional spheres (Figure 6).
In addition to the already described natural sphere of the fishery ecosystem,the socio-economic sphere has additional properties. The economic dynamics isthe aggregate outcome of a dispersed set of interactions in a regulated fishingindustry which defines the complex landscape in which economic agents evolveand which constitutes the essential mechanism to decide between survival andpossible growth. Thus, strategies, behaviours, and actions continuously evolve,as agents accumulate experience in their attempt to cope with a permanentlychanging landscape. The policy or institutional sphere involves heterogeneous
FigurFigurFigurFigurFigure 6e 6e 6e 6e 6 Basic variables and interactions in the natural, economic, and policy spheres in fishery and asthey are considered in the model approach. The dashed lines indicate the mechanisms involvedin decision-making.
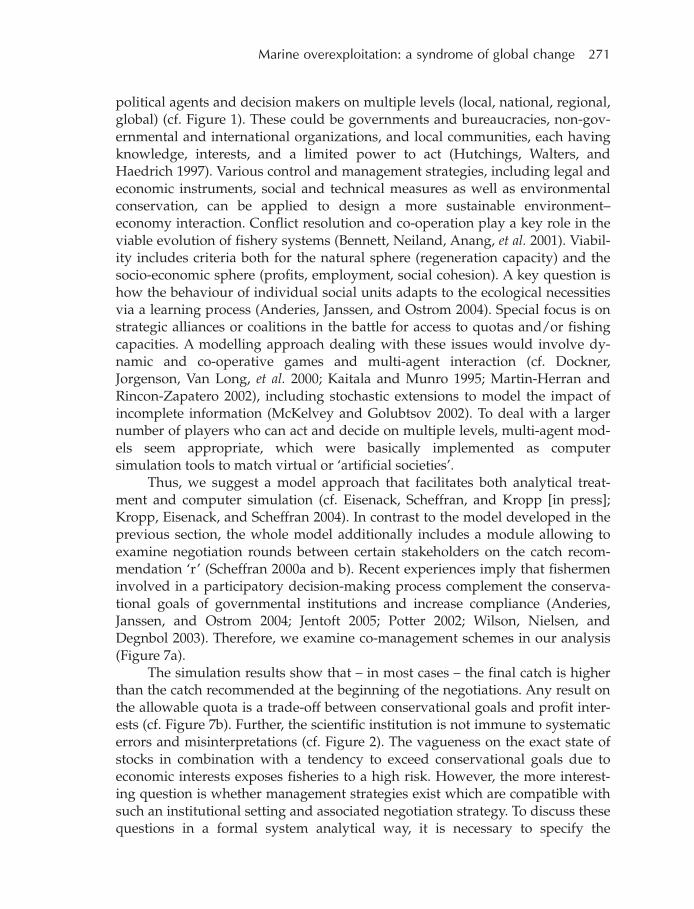
Marine overexploitation: a syndrome of global change 271
political agents and decision makers on multiple levels (local, national, regional,global) (cf. Figure 1). These could be governments and bureaucracies, non-gov-ernmental and international organizations, and local communities, each havingknowledge, interests, and a limited power to act (Hutchings, Walters, andHaedrich 1997). Various control and management strategies, including legal andeconomic instruments, social and technical measures as well as environmentalconservation, can be applied to design a more sustainable environment–economy interaction. Conflict resolution and co-operation play a key role in theviable evolution of fishery systems (Bennett, Neiland, Anang, et al. 2001). Viabil-ity includes criteria both for the natural sphere (regeneration capacity) and thesocio-economic sphere (profits, employment, social cohesion). A key question ishow the behaviour of individual social units adapts to the ecological necessitiesvia a learning process (Anderies, Janssen, and Ostrom 2004). Special focus is onstrategic alliances or coalitions in the battle for access to quotas and/or fishingcapacities. A modelling approach dealing with these issues would involve dy-namic and co-operative games and multi-agent interaction (cf. Dockner,Jorgenson, Van Long, et al. 2000; Kaitala and Munro 1995; Martin-Herran andRincon-Zapatero 2002), including stochastic extensions to model the impact ofincomplete information (McKelvey and Golubtsov 2002). To deal with a largernumber of players who can act and decide on multiple levels, multi-agent mod-els seem appropriate, which were basically implemented as computersimulation tools to match virtual or ‘artificial societies’.
Thus, we suggest a model approach that facilitates both analytical treat-ment and computer simulation (cf. Eisenack, Scheffran, and Kropp [in press];Kropp, Eisenack, and Scheffran 2004). In contrast to the model developed in theprevious section, the whole model additionally includes a module allowing toexamine negotiation rounds between certain stakeholders on the catch recom-mendation ‘r’ (Scheffran 2000a and b). Recent experiences imply that fishermeninvolved in a participatory decision-making process complement the conserva-tional goals of governmental institutions and increase compliance (Anderies,Janssen, and Ostrom 2004; Jentoft 2005; Potter 2002; Wilson, Nielsen, andDegnbol 2003). Therefore, we examine co-management schemes in our analysis(Figure 7a).
The simulation results show that – in most cases – the final catch is higherthan the catch recommended at the beginning of the negotiations. Any result onthe allowable quota is a trade-off between conservational goals and profit inter-ests (cf. Figure 7b). Further, the scientific institution is not immune to systematicerrors and misinterpretations (cf. Figure 2). The vagueness on the exact state ofstocks in combination with a tendency to exceed conservational goals due toeconomic interests exposes fisheries to a high risk. However, the more interest-ing question is whether management strategies exist which are compatible withsuch an institutional setting and associated negotiation strategy. To discuss thesequestions in a formal system analytical way, it is necessary to specify the
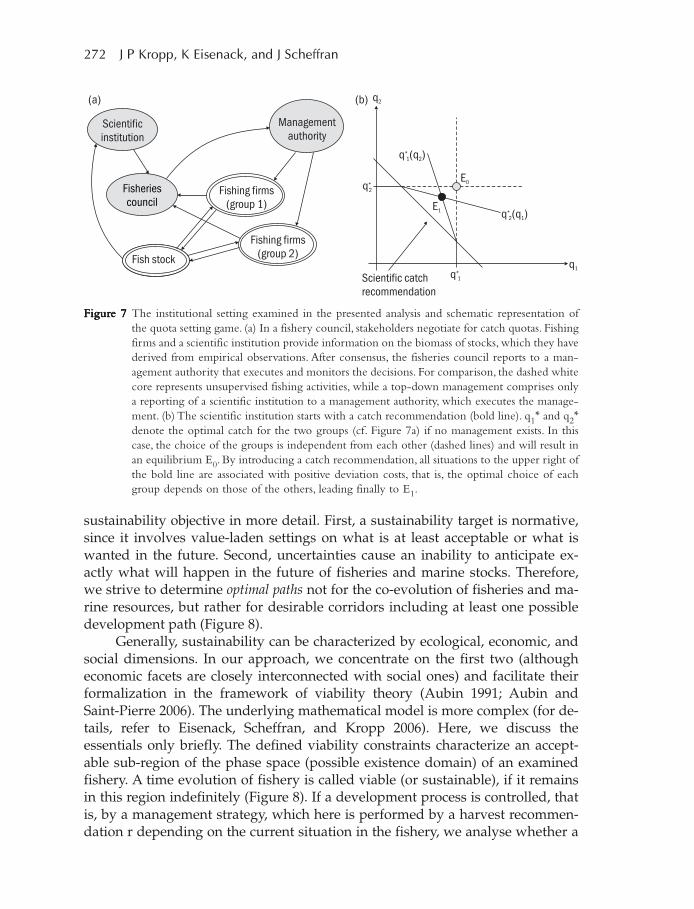
272 J P Kropp, K Eisenack, and J Scheffran
sustainability objective in more detail. First, a sustainability target is normative,since it involves value-laden settings on what is at least acceptable or what iswanted in the future. Second, uncertainties cause an inability to anticipate ex-actly what will happen in the future of fisheries and marine stocks. Therefore,we strive to determine optimal paths not for the co-evolution of fisheries and ma-rine resources, but rather for desirable corridors including at least one possibledevelopment path (Figure 8).
Generally, sustainability can be characterized by ecological, economic, andsocial dimensions. In our approach, we concentrate on the first two (althougheconomic facets are closely interconnected with social ones) and facilitate theirformalization in the framework of viability theory (Aubin 1991; Aubin andSaint-Pierre 2006). The underlying mathematical model is more complex (for de-tails, refer to Eisenack, Scheffran, and Kropp 2006). Here, we discuss theessentials only briefly. The defined viability constraints characterize an accept-able sub-region of the phase space (possible existence domain) of an examinedfishery. A time evolution of fishery is called viable (or sustainable), if it remainsin this region indefinitely (Figure 8). If a development process is controlled, thatis, by a management strategy, which here is performed by a harvest recommen-dation r depending on the current situation in the fishery, we analyse whether a
FigurFigurFigurFigurFigure 7e 7e 7e 7e 7 The institutional setting examined in the presented analysis and schematic representation ofthe quota setting game. (a) In a fishery council, stakeholders negotiate for catch quotas. Fishingfirms and a scientific institution provide information on the biomass of stocks, which they havederived from empirical observations. After consensus, the fisheries council reports to a man-agement authority that executes and monitors the decisions. For comparison, the dashed whitecore represents unsupervised fishing activities, while a top-down management comprises onlya reporting of a scientific institution to a management authority, which executes the manage-ment. (b) The scientific institution starts with a catch recommendation (bold line). q1* and q2*denote the optimal catch for the two groups (cf. Figure 7a) if no management exists. In thiscase, the choice of the groups is independent from each other (dashed lines) and will result inan equilibrium E0. By introducing a catch recommendation, all situations to the upper right ofthe bold line are associated with positive deviation costs, that is, the optimal choice of eachgroup depends on those of the others, leading finally to E1.
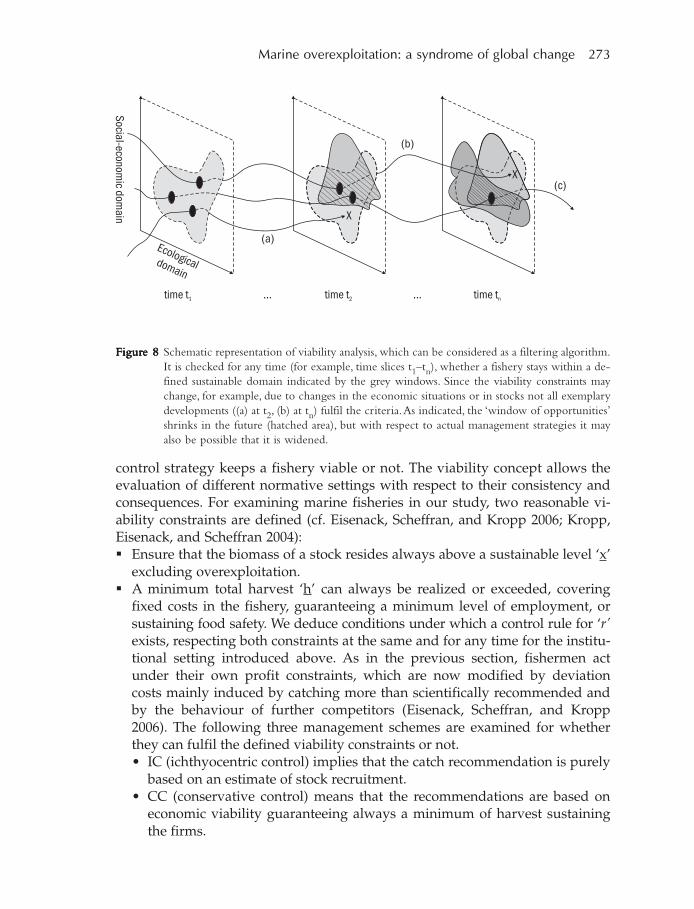
Marine overexploitation: a syndrome of global change 273
control strategy keeps a fishery viable or not. The viability concept allows theevaluation of different normative settings with respect to their consistency andconsequences. For examining marine fisheries in our study, two reasonable vi-ability constraints are defined (cf. Eisenack, Scheffran, and Kropp 2006; Kropp,Eisenack, and Scheffran 2004): Ensure that the biomass of a stock resides always above a sustainable level ‘x’
excluding overexploitation. A minimum total harvest ‘h’ can always be realized or exceeded, covering
fixed costs in the fishery, guaranteeing a minimum level of employment, orsustaining food safety. We deduce conditions under which a control rule for ‘r’exists, respecting both constraints at the same and for any time for the institu-tional setting introduced above. As in the previous section, fishermen actunder their own profit constraints, which are now modified by deviationcosts mainly induced by catching more than scientifically recommended andby the behaviour of further competitors (Eisenack, Scheffran, and Kropp2006). The following three management schemes are examined for whetherthey can fulfil the defined viability constraints or not.• IC (ichthyocentric control) implies that the catch recommendation is purely
based on an estimate of stock recruitment.• CC (conservative control) means that the recommendations are based on
economic viability guaranteeing always a minimum of harvest sustainingthe firms.
FigurFigurFigurFigurFigure 8e 8e 8e 8e 8 Schematic representation of viability analysis, which can be considered as a filtering algorithm.It is checked for any time (for example, time slices t1–tn), whether a fishery stays within a de-fined sustainable domain indicated by the grey windows. Since the viability constraints maychange, for example, due to changes in the economic situations or in stocks not all exemplarydevelopments ((a) at t2, (b) at tn) fulfil the criteria. As indicated, the ‘window of opportunities’shrinks in the future (hatched area), but with respect to actual management strategies it mayalso be possible that it is widened.
274 J P Kropp, K Eisenack, and J Scheffran
• QC (qualitative control) assumes that only qualitative economic and eco-logical observations (for example, regarding stock, capital, and harvest)can be made.
Assessment of management strategies
Examination of these management schemes shows that – indeed – time devel-opments exist that fulfil the defined sustainability criteria for any time.Nevertheless, they have distinct properties. In general, participatory manage-ment per se does not guarantee safe developments. This holds despitecooperative negotiations on allowable catches and possibly well defined stockestimates (Eisenack, Scheffran, and Kropp 2006).
The first analysed management strategy is called ichthyocentric, becausethe scientific organization considers only the state of a fish stock ‘x’ for theirharvest suggestion ‘r’, but no socio-economic conditions. This implies for an op-timal case that ‘r’ exactly equals the recruitment R(x) (cf. Figure 3) of a targetedspecies. This is a challenging task, since an exact estimation of the biomass isbound to fail, due to unavoidable measurement deficits. Assuming that the esti-mator is roughly correct and ‘r’ is realized by the firms, it is shown that the ICscheme cannot guarantee economic viability. The only exception is that thecatch recommendation is so high that firms catch significantly and voluntarilyless than recommended. Such a situation is normally observable only in lowcapitalized fisheries – for example if the competitors use only small boats – butnot in industrialized fisheries. The situation becomes even more dramatic if onefocuses on ecological sustainability. If the recommendation ‘r’ equals the actualrecruitment R(x), the simulations show that stock necessarily declines below ‘x’.Several additional mechanisms discussed in this context are illegal and unre-ported landings or the bycatch problem. Thus, implementing IC in fisheries isan unsound concept, since the idea that stock properties can be exactly esti-mated by ecological indicators is a popular fallacy. In any case, IC exposesfishery to a risky development path.
The CC strategy aims to satisfy economic viability only. Again the scientificinstitution opens the negotiation on catch quotas by a recommendation ‘r’. Incontrast to the IC scheme, it only observes the economic conditions and usesqualitative information. The aim is to guarantee a minimum catch level ‘h’(cf. section Institutional setting in fisheries). If the scientific organization has aquantitative economic model on hand, the institution would recommend a catchlevel ‘r’, which consequently leads to an actual negotiation result ‘h’. In case ofuncertainties, the scientific advisor has to supervise whether a realized catchresides above or below ‘h’. In the former case, catch recommendationsshould be reduced, whilst in the latter they can be increased. An assessment ofthis strategy yields that recommending ‘r’ guarantees economic sustainability. Itis also ecologically sustainable (stock above ‘x’), if ‘ ’ is always below an upper
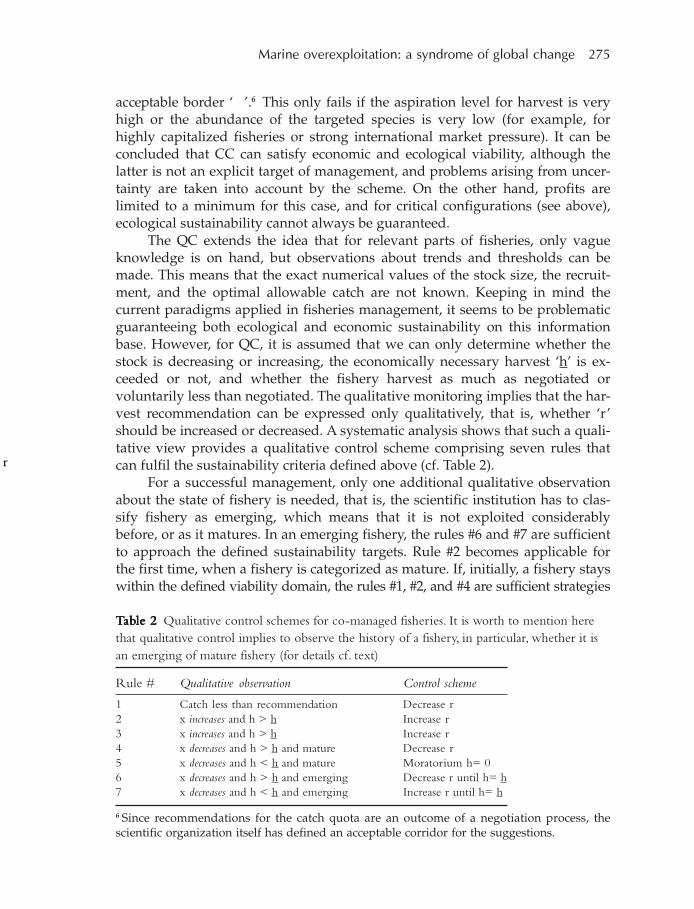
Marine overexploitation: a syndrome of global change 275
acceptable border ‘
r
’.6 This only fails if the aspiration level for harvest is veryhigh or the abundance of the targeted species is very low (for example, forhighly capitalized fisheries or strong international market pressure). It can beconcluded that CC can satisfy economic and ecological viability, although thelatter is not an explicit target of management, and problems arising from uncer-tainty are taken into account by the scheme. On the other hand, profits arelimited to a minimum for this case, and for critical configurations (see above),ecological sustainability cannot always be guaranteed.
The QC extends the idea that for relevant parts of fisheries, only vagueknowledge is on hand, but observations about trends and thresholds can bemade. This means that the exact numerical values of the stock size, the recruit-ment, and the optimal allowable catch are not known. Keeping in mind thecurrent paradigms applied in fisheries management, it seems to be problematicguaranteeing both ecological and economic sustainability on this informationbase. However, for QC, it is assumed that we can only determine whether thestock is decreasing or increasing, the economically necessary harvest ‘h’ is ex-ceeded or not, and whether the fishery harvest as much as negotiated orvoluntarily less than negotiated. The qualitative monitoring implies that the har-vest recommendation can be expressed only qualitatively, that is, whether ‘r’should be increased or decreased. A systematic analysis shows that such a quali-tative view provides a qualitative control scheme comprising seven rules thatcan fulfil the sustainability criteria defined above (cf. Table 2).
For a successful management, only one additional qualitative observationabout the state of fishery is needed, that is, the scientific institution has to clas-sify fishery as emerging, which means that it is not exploited considerablybefore, or as it matures. In an emerging fishery, the rules #6 and #7 are sufficientto approach the defined sustainability targets. Rule #2 becomes applicable forthe first time, when a fishery is categorized as mature. If, initially, a fishery stayswithin the defined viability domain, the rules #1, #2, and #4 are sufficient strategies
6 Since recommendations for the catch quota are an outcome of a negotiation process, thescientific organization itself has defined an acceptable corridor for the suggestions.
TTTTTababababable 2le 2le 2le 2le 2 Qualitative control schemes for co-managed fisheries. It is worth to mention herethat qualitative control implies to observe the history of a fishery, in particular, whether it isan emerging of mature fishery (for details cf. text)
Rule # Qualitative observation Control scheme
1 Catch less than recommendation Decrease r2 x increases and h > h Increase r3 x increases and h > h Increase r4 x decreases and h > h and mature Decrease r5 x decreases and h < h and mature Moratorium h= 06 x decreases and h > h and emerging Decrease r until h= h7 x decreases and h < h and emerging Increase r until h= h
276 J P Kropp, K Eisenack, and J Scheffran
to keep the fishery sustainable for any time. If the initial conditions are not vi-able, the rules #1 and #3–#7 are able to steer a fishery back into the viabilitydomain.
The calculations show that the acceptance of uncertainties allows to de-velop management schemes that sustain both targets simultaneously. Moreover,it can be shown that such a qualitative scheme may be more efficient. But beforesuch schemes are implemented in fisheries, a paradigm shift in policy makingand management is needed, because decision-makers too often rely on numbersinstead of systematic observations.
Discussion
A systematic examination of the mechanisms of marine resource exploitation in-dicates that a fundamental change in the socio-economic, institutional, andecological settings is needed to accomplish a turnaround to sustainability. Iso-lated views that neglect economic claims or the inherent opaqueness of fisheriesare not helpful and can provide misleading policy advice. Any change shall con-sider the transsectoral structure of fisheries. Referring to our literature survey onbioeconomic modelling, it can be stated that it is rather impossible to formulatea precise numerical model. Thus, a qualitative simulation has complementaryadvantages compared to other methods. First, we can shift the perspective fromequilibria to non-equilibrium dynamics and can unveil general dynamic pat-terns, that is, intrinsic properties of fisheries. Examples are unavoidableovercapacities and the possibility of cyclical behaviour in less monitored fisher-ies. Second, several stages of system development can be identified to enhanceour knowledge of how and when management strategies should be introduced.This allows alternative scenarios to be discussed. Third, critical branchings wereidentified. These can be associated with regions in the phase space where thequalitative direction of state variables are in a configuration, which admits irre-versible problematic and positive changes.
With respect to our systematic analysis of participatory co-managementschemes, it was shown that they are not in general viable, since the outcomestrongly depends on the relation between biological, economic, and political fac-tors, and, in particular, on the catch recommendations of the scientificinstitution. The applied viability concept shows how the dangerous effects re-lated to measurement deficits can be surmounted. In this way, thecorresponding uncertainty can be confined to a minimum, and different man-agement goals can be achieved in parallel.
The common IC scheme which is purely based on the observation of fishstocks exposes the fishery to a high risk of economic and ecological decline.Such a situation can be substantially improved by designing a more flexiblestrategy which only needs qualitative information about the state of the fisheryand does not deterministically fix the scientific institution. In addition, it can be
Marine overexploitation: a syndrome of global change 277
stated that even for a fishery outside of a viable zone, there exists a good chancethat it can be steered into the safe region if a suitable control scheme is applied.We can show that even under uncertainty, the QC strategy is at least as good asthe economical CC strategy and less risky than the data-intensive IC scheme.Because the knowledge regarding relevant processes in specific domains of ma-rine fisheries will remain insufficient over the next few decades, the need forenhanced methods capable to improve our knowledge is evident.
Conclusion
An in-depth analysis of an archetypal cause–effect pattern of global change –the marine overexploitation syndrome – is performed systematically on the ba-sis of expert knowledge, available data, and various case studies by employingnew and smart methodologies from information sciences. In particular, weshow that even in a vague environment, we can substantially improve under-standing of the complex dynamics in fisheries. The most important novel aspectof the introduced approach is to employ a trans-disciplinary pattern (syndromepattern) on an intermediate scale of complexity. The presented approaches canprovide valuable insights for future decision-making in fisheries, since manage-ment schemes can be assessed concerning their design and potential outcome.All kinds of solutions provided for the ‘clinical’ picture of the marineoverexploitation syndrome are conceivable and imply actions for mitigation/prevention of disastrous events in fisheries. We feel that the introduced tech-niques could pave the road towards an improved integrated modelling andassessment in fisheries. For the future, it is planned to develop concrete man-agement options for specific fisheries, which are based on these systemanalytical concepts.
Acknowledgement
We would like to thank various colleagues for their intellectual support duringthe preparation of this article. The kind assistance of M K B Lüdeke, C E Nauen,G Petschel-Held, and H Welsch is particularly appreciated.
References
Amundsen E S, Bjørndal T, and Conrad J M. 1995Open access harvesting of the Northeast Atlantic minke whaleEnvironmental and Resource Economics 6: 167–185
Anderies J M, Janssen M A, and Ostrom E. 2004A Framework to analyze the robustness of socio-ecological systems from aninstitutional perspectiveEcology and Society 9 (1): 18
278 J P Kropp, K Eisenack, and J Scheffran
Aubin J P. 1991Viability TheoryBoston: Birkhäuser. 543 pp.
Aubin J P and Saint-Pierre P. 2006An introduction to viability theory and management of renewable resourcesIn Advanced Methods for Decision Making and Risk Management in SustainabilityScience, edited by J Kropp and J ScheffranNew York: Nova Science Publishers
Bennett E, Neiland A, Anang E, Bannerman P, Rahman A, Huq S, Bhuiya S, Day M,Fulford-Gardiner M, Clerveaux W. 2001Towards a better understanding of conflict management in tropical fisheries:evidence from Ghana, Bangladesh and the CaribbeanMarine Policy 25 (5): 365–376
Boardman J T. 1995Wholes and parts – a systems approachIEEE Transactions on Systems, Man and Cybernetics 25 (7): 1150–1161
Boyce J R. 1995Optimal capital accumulation in a fishery: a nonlinear irreversible investmentmodelJournal of Environmental Economics and Management 28: 324–339
Boyce J R. 2000Interest group competition over policy outcomes: dynamics, strategic behavior,and social costsPublic Choice 102: 313–339
Cassel-Gintz M and Petschel-Held G. 2000GIS-based assessment of the threat to world forests by patterns ofnonsustainable civilization nature interactionJournal of Environmental Management 59: 279–298
Charles A. 2001Sustainable Fishery SystemsOxford: Blackwell. 384 pp.
Clark C W, Clarke F H, and Munro G R. 1979The optimal exploitation of renewable resource stocks: problems of irreversibleinvestmentEconometrica 47: 25–47
Christensen V, Froese R, Palomares M L, Pauly D. 2000Fishing down aquatic food websAmerican Scientist 88 (1): 46–51

Marine overexploitation: a syndrome of global change 279
Davis D and Gartside D. 2001Challenges for economic policy in sustainable management of marine naturalresourcesEcological Economics 36: 223–236
Daw T and Gray T. 2005Fisheries science and sustainability in international policy: a study of failure inthe European Union’s Common Fisheries PolicyMarine Policy 28: 257–258
Des Clers S and Nauen C E (eds). 2002New concepts and indicators in fisheries in aquacultureACP-EU Fisheries Research Report 13: 72 pp.
Dockner E, Jorgenson S, Van Long N, Sorger G (eds). 2000Differential Games in Economics and Management ScienceCambridge: Cambridge University Press. 382 pp.
Eisenack K and Kropp J. 2001Assessment of management options in marine fisheries by qualitative modelingtechniquesMarine Pollution Bulletin 43 (7–12): 215–224
Eisenack K, Welsch H, and Kropp J. 2005A qualitative dynamical modelling approach to capital accumulation inunregulated fisheriesJournal of Economic Dynamics and Control, DOI:10.1016/j.jedc.2005.08.004
Eisenack K, Scheffran J, and Kropp J P. 2006Viability assessment of management framework for fisheriesEnvironmental Modelling and Assessment, 11(1): 69–79
FAO (Food and Agriculture Organization). 2004The State of World Fisheries and Aquaculture 2004Rome: FAO
Freire J and Garcia-Allut A. 2000Socioeconomic and biological causes of management failures in Europeanartisanal fisheries: the case of Galicia (NW Spain)Marine Policy 24 (5): 375–384
Harris M. 1999Lament for an Ocean. The Collapse of the Atlantic Cod Fishery: A True Crime StoryToronto: McClelland and Steward Inc. 389 pp.
Hilborn R and Walters C J. 1992Quantitative Fisheries Stock Assessment: choice, dynamics and uncertaintyNew York: Chapman and Hall. 570 pp.
280 J P Kropp, K Eisenack, and J Scheffran
Hutchings J A, Walters C, and Haedrich R L. 1997Is scientific inquiry incompatible with government information control?Canadian Journal of Fisheries and Aquatic Sciences 54: 1198–1210
Imeson R J, van den Bergh C J M, and Heokstra J. 2003Integrated models of fisheries management and policyEnvironmental Modelling and Assessment 7 (4): 259–271
Jackson J B C, Kirby M X, Berger W H, Bjørndal K A, Botsford L W, Bourque B J,Bradbury R H, Cooke R, Erlandson J, Estes J A, Hughes T P, Kidwell S, Lange C B,Lenihan H S, Pandolfi J M, Peterson C H, Steneck R S, Tegner M J, Warner R R.2001Historical overfishing and the recent collapse of coastal ecosystemsScience 293 (5530): 629–638
Jentoft S. 2004Institutions in fisheries: what they are, what they do, and how they changeMarine Policy 28: 137–149
Jentoft S. 2005Fisheries co-management as empowermentMarine Policy 29: 1–7
Jørgensen J and Kort P M. 1997Optimal investment and finance in renewable resource harvestingJournal of Economics Dynamics and Control 21: 603–630
Kaitala V and Munro G. 1995The economic management of high seas fishery resources: some game theoreticaspectsIn Control and Game—theoretic models of the environment, pp. 299–318, edited byC Carraro and J A FilarBoston/Basel/Berlin: Birkhäuser. 388 pp.
Kaplan I M and McCay B J. 2004Cooperative research, co-management and the social dimension of fisheriesscience and managementMarine Policy 28 (2): 257–258
Kohonen T. 2001Self-Organising MapsBerlin: Springer. 362 pp.
Kropp J and Schellnhuber H J. 2006Prototyping broad-scale climate and ecosystem classes by means of self-organising mapsIn Self-Organising Maps in Geographical Information Sciences, edited by P Agarwaland A SkupinLondon: John Wiley & Sons
Marine overexploitation: a syndrome of global change 281
Kropp J, Eisenack K, and Scheffran J. 2004Sustainable marine resource management: lessons from viability analysisIn Complexity and Integrated Resources Management, 1: pp. 104–109,edited by C Pahl-Wostl, S Schmidt, A E Rizzoli, A J JakemanManno: International Environmental Modelling and Software Society. 524 pp.
Kropp J, Reusswig F, and Lüdeke M K B. 2001Global analysis and distribution of unbalanced urbanization processes: theFavela syndromeGAIA 10 (2): 109–120
Kropp J, Zickfeld K, and Eisenack K. 2002Management of critical events: the breakdown of marine fisheries and the NorthAtlantic thermohaline circulationIn The Science of Disasters: climate disruptions, heart attacks, and market crashes,pp. 192–216, edited by A Bunde, J Kropp, and H J SchellnhuberBerlin: Springer. 453 pp.
Kuipers B. 1994Qualitative Reasoning: modeling and simulation with incomplete knowledgeCambridge: MIT Press. 418 pp.
Lane D E and Stephenson R L. 2000Institutional arrangements for fisheries: alternate structures and impediments tochangeMarine Policy 24: 385–393
Lüdeke M K B, Petschel-Held G, and Schellnhuber H J. 2004Syndromes of global change: the first panoramic viewGAIA 13 (1): 42–49
Mangasarian O L. 1966Sufficient conditions for the optimal control of nonlinear systemsSIAM Journal on Control 4: 139-152.
Martin-Herran G and Rincon-Zapatero J P. 2002On efficient subgame perfect Nash equilibria in dynamic fishery gamesIn Proceedings of Tenth International Symposium on Dynamic Games and Applications,II: pp. 526–541, edited by L A Petrosjan and N A ZenkevichInternational Society of Dynamic Games. 920 pp.
McGoodwin J R. 2001Understanding the Cultures of Fishing Communities: A Key to FisheriesManagement and Food Security[Fisheries Technical Paper 401]Rome: Food and Agriculture Organization. 287 pp.
282 J P Kropp, K Eisenack, and J Scheffran
McIntosh B. 2003Qualitative modelling with imprecise ecological knowledge: a framework forsimulationEnvironmental Modelling & Software 18: 295–307
McKelvey R. 1985Decentralized regulation of a common property renewable resource industrywith irreversible investmentJournal of Environmental Economics and Management 12: 287–307
McKelvey R and Golubtsov P V. 2002The effects of incomplete information in stochastic common-stock harvestinggamesIn Proceedings of Tenth International Symposium on Dynamic Games andApplications, II: 582–603, edited by L A Petrosjan and N A ZenkevichInternational Society of Dynamic Games. 920 pp.
MEA (Millennium Ecosystem Assessment). 2005Ecosystems and Human Well-Being: Synthesis ReportWashington DC: Island Press. 160 pp.Details available at <http://www.millenniumassessment.org/en/products.aspx>
Munro G R. 1999The economics of overcapitalisation and fishery resource management: a reviewIn Overcapacity, Overcapitalisation and Subsidies in European Fisheries: 7–23,edited by A Hatcher and K RobinsonPortsmouth: University of Portsmouth, CEMARE
Myers R A and Worm B. 2003Rapid worldwide depletion of predatory fish communitiesNature 423: 280–283
NAFO (North-West Atlantic Fisheries Organization). 2005NAFO Annual Fisheries DatabaseDetails available at <http://www.nafo.ca/fisheries/stats/21stats.html
Pauly D, Alder J, Bennett E, Christensen V, Tyedmers P, Watson R. 2003The future of fisheriesScience 302: 1359–1361
Pauly D, Christensen V, Guenette S, Pitcher T J, Sumaila U R, Walters C J,Watson R, Zeller D. 2002Towards sustainability in world fisheriesNature 418: 689–695
Marine overexploitation: a syndrome of global change 283
Petersen E H. 2002Economic policy, institutions and fisheries development in the PacificMarine Policy 26 (5): 315–324
Petschel-Held G and Lüdeke M K B. 2001Integration of case studies on global change by means of artificial intelligenceIntegrated Assessment 2 (3): 123–138
Petschel-Held G, Block A, Cassel-Gintz M, Kropp J, Lüdeke M K B,Moldenhauer O, Reusswig F, Schellnhuber H J. 1999Syndromes of global change: a qualitative modeling approach to support globalenvironmental managementEnvironmental Modeling and Assessment 4 (4): 295–314
Pikitch E K, Santora C, Babcock E A, Bakun A, Bonfil R, Conover D O, Dayton P,Doukakis P, Fluharty D, Heneman B, Houde E D, Link J, Livingston P A,Mangel M, McAllister M K, Pope J, Sainsbury K J. 2004Ecosystem-based fishery managementScience 305: 346–347
Potter B. 2002Predatory politics: group interests and management of the commonsEnvironmental Politics 11: 73–94
Scheffran J. 2000aModelling sustainable use of natural resourcesIn Operations Research Proceedings, pp. 560–565, edited by K Inderfurth,G Schwödiauer, W Domschke, F Juhnke, P Kleinschmidt, and G WäscherBerlin: Springer. 577 pp.
Scheffran J. 2000bThe dynamic interaction between economy and ecology—cooperation, stabilityand sustainability for a dynamic-game model of resource conflictsMathematics and Computers in Simulation 53: 371–380
Schellnhuber H J and Kropp J. 1998Geocybernetics: controlling a complex dynamical system under uncertaintyNaturwissenschaften 85 (9): 411–425
Schellnhuber H J, Lüdeke M K B, and Petschel-Held. 2002The syndrome approach to scaling: describing global change on an intermediatefunctional scaleIntegrated Assessment 3 (2–3): 201–219
Schellnhuber H J, Block A, Cassel-Gintz M, Kropp J, Lammel G, Lass W,Lienenkamp R, Loose C, Lüdeke M K B, Moldenhauer O, Petschel-Held G,Plöchl M, Reusswig F. 1997Syndromes of global changeGAIA 6: 19–34
284 J P Kropp, K Eisenack, and J Scheffran
Schiermeier Q. 2004Climate findings let fishermen off the hookNature 428: 4
Soma K. 2003How to involve stakeholders in fisheries management—a country case study inTrinidad and TobagoMarine Policy 27 (1): 47–58
UN (United Nations). 1995The United Nations Agreement for the Implementation of the Provisions of theUnited Nations Convention on the Law of the Sea of 10 December 1982 relating tothe Conservation and Management of Straddling Fish Stocks and HighlyMigratory Fish Stocks (Agreement on High Seas Fishing)New York: UN, Department of Public Information. 40 pp.Details available at <http://www.un.org/Depts/los/convention_agreements/convention_overview_fish_stocks.htm
WBGU (Wissenschaftlicher Beirat Globale Umweltveränderungen/GermanAdvisory on Global Change to the Federal Government). 1997World in Transition: the research challengeBerlin: Springer. pp 193.Details available at <http://www.wbgu.de
Wickham E. 2003Dead Fish and Fat Cats: a no-nonsense journey through our dysfunctional fishingindustryVancouver: Granville Island Publication. 176 pp.
Wilson D C, Nielsen J R, and Degnbol P (eds). 2003The Fisheries Co-Management Experience: accomplishments, challenges andprospectsBerlin: Springer. 348 pp.
Overexploitation of fishery resources,with particular reference to Goa
Z A Ansari, C T Achuthankutty, and S G Dalal
Marine living resources are not infinite. Overexploitation is a pervasiveproblem in fishery the world over. Landings of major fisheries resources in theIndian Ocean region have declined significantly, and the Goan coast is noexception. In many cases, the rate of harvesting has exceeded the natural rateof renewal, resulting in biological overfishing. Such overexploitation leads tostock collapse or severe depletion. This paper documents overexploitation offishery resources, with particular reference to Goa.
Fish production in Goa has significantly increased from 17 000 tonnes in1963 to a maximum of 102 922 tonnes in 1993 due to mechanization. Theanalysis of data suggests that catches have exceeded maximum sustainableyield, resulting in negative growth in subsequent years.
The rich fish diversity of the Goan coast is boosted by high landing ofpenaeid prawns. The estuaries of Goa are a rich source of different species ofprawns (13 species). The occurrence of solar prawns in tonnes for a shortperiod during July–August is an important feature of the Goan coast. Highdemand coupled with the fact that too many people are dependent on theseresources have led to overexploitation. Sustainable development in fisheriesrequires careful consideration of physical reforms such as resource rent fromwhich economic benefits can be derived in the form of value-added localemployment, income, and food security, although these are highly locationspecific. Opportunities exist to review progress in fisheries management and toexchange ideas on sustainable development through resolute policy decisionon a long-term basis.
Introduction
Inaugurating the Reykjavik Conference on Responsible Fisheries in Marine Ecosystemon 3 October 2001, Dr Jacques Diouf, Director-General of FAO (Food and
16
286 Z A Ansari, C T Achuthankutty, and S G Dalal
Agriculture Organization) of the United Nations said, ‘Countries could getmore fish from the oceans if they allowed overfished stocks to recuperate, re-duced wastage, and managed fisheries resources better.’ He also warned thatthe world oceans are exhaustible.
The wealth of marine resources was assumed to be an unlimited gift of na-ture. However, this myth has faded in the face of realization that marine livingresources, although renewable, are not infinite and need to be managed on asustainable basis for the future requirement of our growing population. Not-withstanding the general concern over environmental degradation in recentyears, fishery stocks and aquatic resources have been heavily overexploited. Inmany capture fisheries in the Indian Ocean, the rate of harvesting has exceededthe natural rate of renewal, resulting in biological overfishing. FAO (1997) esti-mated that 69% of the world’s marine stocks, for which data are available, are inneed of urgent corrective conservation and management measures: 44% arefully to heavily exploited, 16% overexploited, 6% depleted, and 3% very slowlyrecovering from overfishing. More than 69% of the stocks of demersal andpelagic fish, crustaceans, and mollusks in various areas of the world’s oceansneed rehabilitation.
Overexploitation of marine resources is a worldwide problem. It takesplace when the maximum amount of fish that can be taken from the sea is ex-ceeded. The improvement in efficient fishing technology, that is becomingavailable to even smaller fishing operators, is really not giving the fish in the seamuch chance to escape the fishing gear and time to reproduce. Biologicaloverexploitation of fishery resources leads to collapse of certain fisheries or theirsevere depletion. According to Hutchings (2000), with the exception of a fewspecies, recovery of most fishing stock after collapse is very little. National andinternational efforts are, therefore, needed to protect fish stocks under threat ofoverexploitation and to allow depleted stocks to recover.
Marine fish production of Goa: present status
About 73% of the total marine fish catch of India comes from the west coast forwhich several attributes have been reported (Madhupratap, Nair,Gopalakrishnan, et al. 2001). These attributes are equally applicable to all mari-time states of west coast of India. Goa with a sea coast of about 105 km(kilometres) and a continental shelf of about 10 million ha (hectares) has an ac-tively fished area of about 20 000 km2 (square kilometres). It is endowed withrich pelagic and demersal fisheries resources (Ansari, Chatterji, Ingole, et al.1995; Doiphode 1984). Fish is generally considered an affordable source of pro-tein by the people in the state. The progress in total marine fish production ofGoa is shown in Figure 1. Fish production is exclusively from the capture fisher-ies, barring a limited production mostly through traditional aquaculture. Itconstitutes a highly productive sector, a source of valuable food and employment,
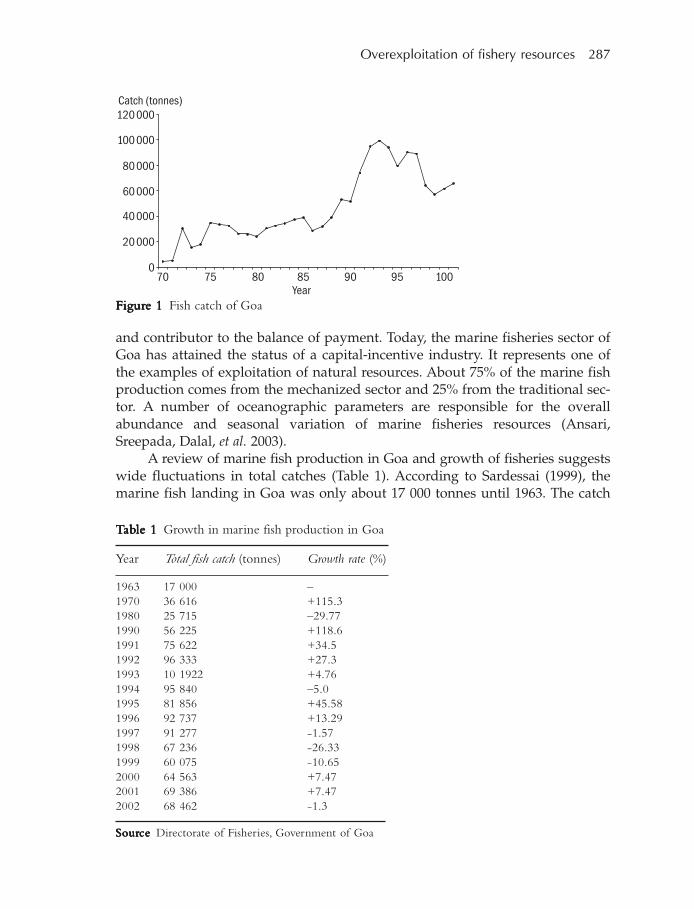
Overexploitation of fishery resources 287
and contributor to the balance of payment. Today, the marine fisheries sector ofGoa has attained the status of a capital-incentive industry. It represents one ofthe examples of exploitation of natural resources. About 75% of the marine fishproduction comes from the mechanized sector and 25% from the traditional sec-tor. A number of oceanographic parameters are responsible for the overallabundance and seasonal variation of marine fisheries resources (Ansari,Sreepada, Dalal, et al. 2003).
A review of marine fish production in Goa and growth of fisheries suggestswide fluctuations in total catches (Table 1). According to Sardessai (1999), themarine fish landing in Goa was only about 17 000 tonnes until 1963. The catch
TTTTTababababable 1le 1le 1le 1le 1 Growth in marine fish production in Goa
Year Total fish catch (tonnes) Growth rate (%)
1963 17 000 –1970 36 616 +115.31980 25 715 –29.771990 56 225 +118.61991 75 622 +34.51992 96 333 +27.31993 10 1922 +4.761994 95 840 –5.01995 81 856 +45.581996 92 737 +13.291997 91 277 -1.571998 67 236 -26.331999 60 075 -10.652000 64 563 +7.472001 69 386 +7.472002 68 462 -1.3
SourSourSourSourSourcecececece Directorate of Fisheries, Government of Goa
FigurFigurFigurFigurFigure 1e 1e 1e 1e 1 Fish catch of Goa

288 Z A Ansari, C T Achuthankutty, and S G Dalal
increased to 36 616 tonnes in 1970. It came down to 25 715 tonnes in 1980, show-ing a negative growth of about 29% between 1970 and 1980. The catch increasedto 56 225 tonnes in 1990 and showed a positive growth of 118%. However, maxi-mum catch was achieved in 1996. Between 1963 and 1999, when the averageannual marine fish production of India grew by 3.5%, that of Goa grew by6.02%. The pronounced increase in fish catch during late 1980s and early 1990scould be attributed to the mechanization and phenomenal increase in thenumber of fishing trawlers as well as advancement in gear technology. From1996 onwards, till 2000, the growth has generally been on the negative side. Thelast five years have seen stabilization in the catch to about 65 000 tonnes. Thefisheries are characterized by increased fishing pressure in the highly fished in-shore waters of Goa.
The marine fisheries of Goa are multi-species fisheries wherein severalcommercially important species of fish and prawns constitute the pelagic anddemersal fisheries resources (Mohanta and Subramanian 2001). The prominentand most important groups are mackerel and oil sardine, which form bulkof pelagic catches. Similarly, the shrimps form bulk of demersal resources.Average contribution of pelagic resources is over 50% of the total landing.Most of the catch from coastal fisheries is used for local consumption. However,varieties such as seerfish, ribbonfish, squids, cuttle fish, and shrimps aretargeted for the export market.
Exploitation of prawn fisheries resources of Goa
Marine prawn fishery
The marine prawn landing in Goa is one of the lowest among the coastal statesof India. The average landing for over a decade is only 2.1% of the total land-ings in India, which is of the order of about 4000 tonnes (Figure 2). Most of thefishing activities for exploitation of the marine prawns are carried out in shal-low coastal waters within the 50 m (metres) depth contour. Although there is alaw stipulating that only traditional fishing be allowed within 8 m depth, manytrawlers operate in the shallow coastal waters, even at the mouth of the estuar-ies fishing for juvenile prawns.
Seventeen species of marine prawns have been reported from the coast ofGoa, including the estuarine and inshore waters (George 1980). However, thefishery is mainly sustained by species such as Metapenaeus dobsoni (locallyknown as the solar prawn), Parapenaeopsis stylifera, Metapenaeus affinis, andParapenaeopsis merguiensis (Achuthankutty and Parulekar 1986). Some speciessuch as Metapenaeus monoceros, Metapenaeus moyebi, Penaeus indicus, Penaeusmonodon, Penaeus japonicus, and Prapenaeopsis hardwuckii also contribute in smallshares.
A comparison of state-wise marine prawn landings made for the years1989/90, 1993/94, and 1999/2000 indicated a tremendous reduction in the
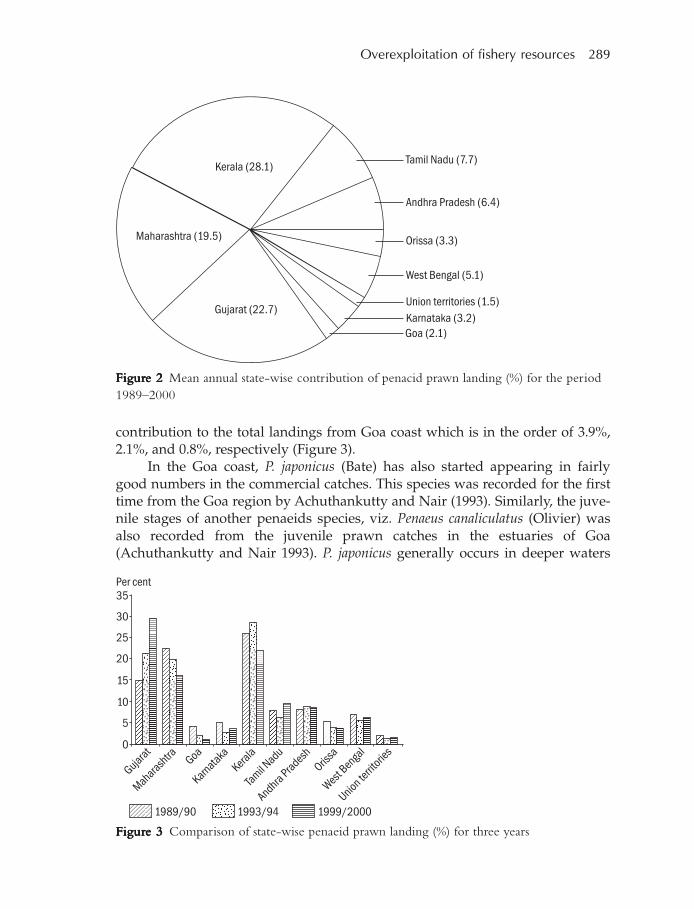
Overexploitation of fishery resources 289
contribution to the total landings from Goa coast which is in the order of 3.9%,2.1%, and 0.8%, respectively (Figure 3).
In the Goa coast, P. japonicus (Bate) has also started appearing in fairlygood numbers in the commercial catches. This species was recorded for the firsttime from the Goa region by Achuthankutty and Nair (1993). Similarly, the juve-nile stages of another penaeids species, viz. Penaeus canaliculatus (Olivier) wasalso recorded from the juvenile prawn catches in the estuaries of Goa(Achuthankutty and Nair 1993). P. japonicus generally occurs in deeper waters
FigurFigurFigurFigurFigure 2e 2e 2e 2e 2 Mean annual state-wise contribution of penacid prawn landing (%) for the period1989–2000
FigurFigurFigurFigurFigure 3e 3e 3e 3e 3 Comparison of state-wise penaeid prawn landing (%) for three years
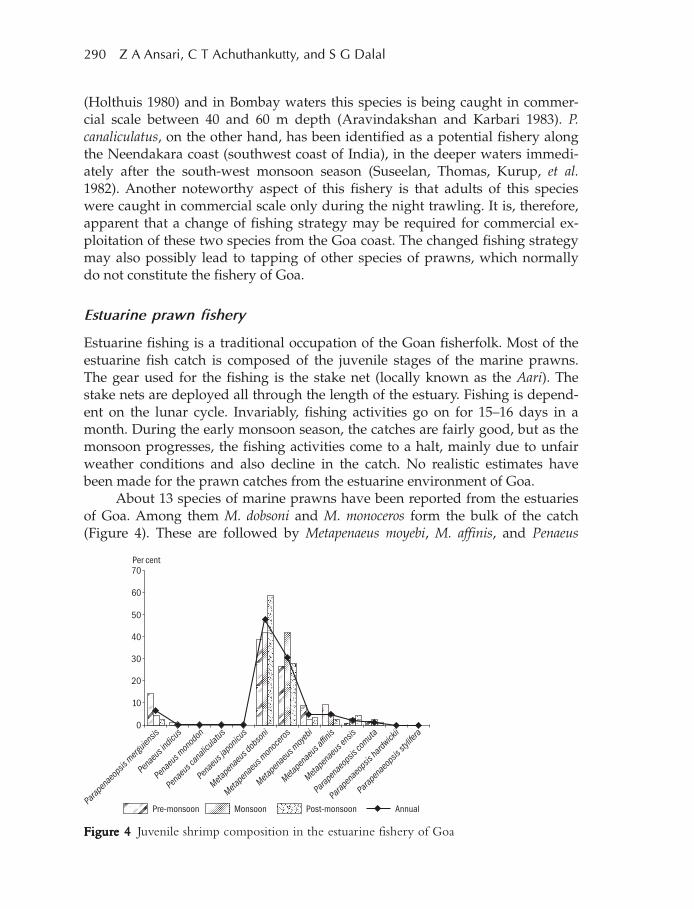
290 Z A Ansari, C T Achuthankutty, and S G Dalal
(Holthuis 1980) and in Bombay waters this species is being caught in commer-cial scale between 40 and 60 m depth (Aravindakshan and Karbari 1983). P.canaliculatus, on the other hand, has been identified as a potential fishery alongthe Neendakara coast (southwest coast of India), in the deeper waters immedi-ately after the south-west monsoon season (Suseelan, Thomas, Kurup, et al.1982). Another noteworthy aspect of this fishery is that adults of this specieswere caught in commercial scale only during the night trawling. It is, therefore,apparent that a change of fishing strategy may be required for commercial ex-ploitation of these two species from the Goa coast. The changed fishing strategymay also possibly lead to tapping of other species of prawns, which normallydo not constitute the fishery of Goa.
Estuarine prawn fishery
Estuarine fishing is a traditional occupation of the Goan fisherfolk. Most of theestuarine fish catch is composed of the juvenile stages of the marine prawns.The gear used for the fishing is the stake net (locally known as the Aari). Thestake nets are deployed all through the length of the estuary. Fishing is depend-ent on the lunar cycle. Invariably, fishing activities go on for 15–16 days in amonth. During the early monsoon season, the catches are fairly good, but as themonsoon progresses, the fishing activities come to a halt, mainly due to unfairweather conditions and also decline in the catch. No realistic estimates havebeen made for the prawn catches from the estuarine environment of Goa.
About 13 species of marine prawns have been reported from the estuariesof Goa. Among them M. dobsoni and M. monoceros form the bulk of the catch(Figure 4). These are followed by Metapenaeus moyebi, M. affinis, and Penaeus
FigurFigurFigurFigurFigure 4e 4e 4e 4e 4 Juvenile shrimp composition in the estuarine fishery of Goa
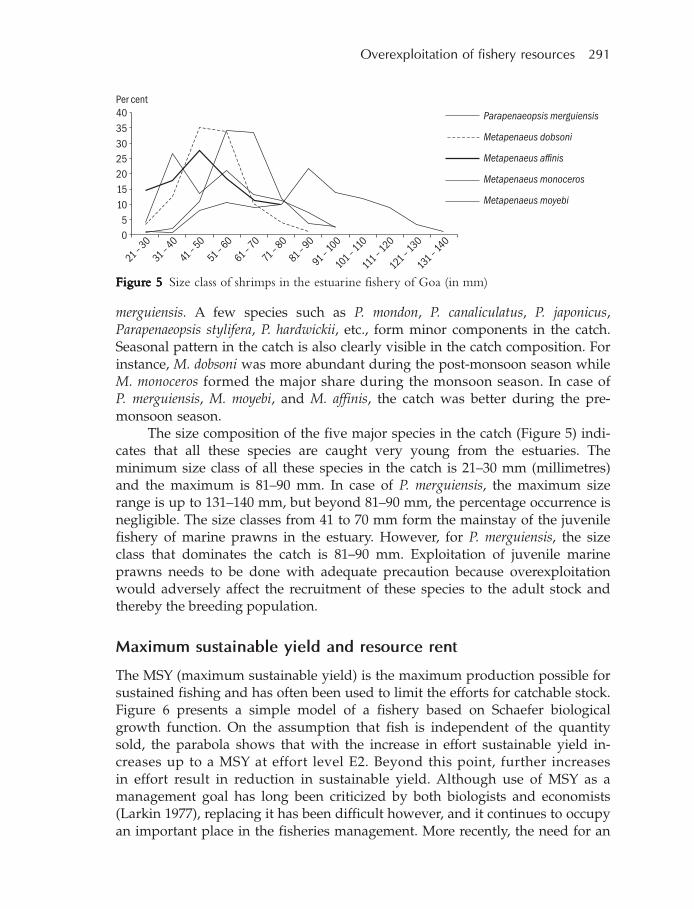
Overexploitation of fishery resources 291
merguiensis. A few species such as P. mondon, P. canaliculatus, P. japonicus,Parapenaeopsis stylifera, P. hardwickii, etc., form minor components in the catch.Seasonal pattern in the catch is also clearly visible in the catch composition. Forinstance, M. dobsoni was more abundant during the post-monsoon season whileM. monoceros formed the major share during the monsoon season. In case ofP. merguiensis, M. moyebi, and M. affinis, the catch was better during the pre-monsoon season.
The size composition of the five major species in the catch (Figure 5) indi-cates that all these species are caught very young from the estuaries. Theminimum size class of all these species in the catch is 21–30 mm (millimetres)and the maximum is 81–90 mm. In case of P. merguiensis, the maximum sizerange is up to 131–140 mm, but beyond 81–90 mm, the percentage occurrence isnegligible. The size classes from 41 to 70 mm form the mainstay of the juvenilefishery of marine prawns in the estuary. However, for P. merguiensis, the sizeclass that dominates the catch is 81–90 mm. Exploitation of juvenile marineprawns needs to be done with adequate precaution because overexploitationwould adversely affect the recruitment of these species to the adult stock andthereby the breeding population.
Maximum sustainable yield and resource rent
The MSY (maximum sustainable yield) is the maximum production possible forsustained fishing and has often been used to limit the efforts for catchable stock.Figure 6 presents a simple model of a fishery based on Schaefer biologicalgrowth function. On the assumption that fish is independent of the quantitysold, the parabola shows that with the increase in effort sustainable yield in-creases up to a MSY at effort level E2. Beyond this point, further increasesin effort result in reduction in sustainable yield. Although use of MSY as amanagement goal has long been criticized by both biologists and economists(Larkin 1977), replacing it has been difficult however, and it continues to occupyan important place in the fisheries management. More recently, the need for an
FigurFigurFigurFigurFigure 5e 5e 5e 5e 5 Size class of shrimps in the estuarine fishery of Goa (in mm)
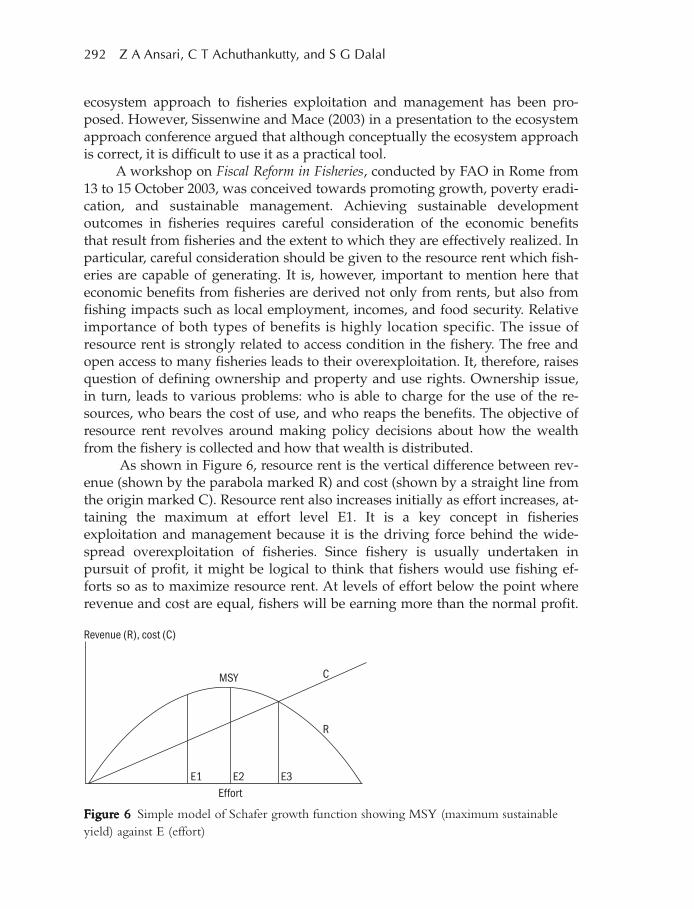
292 Z A Ansari, C T Achuthankutty, and S G Dalal
ecosystem approach to fisheries exploitation and management has been pro-posed. However, Sissenwine and Mace (2003) in a presentation to the ecosystemapproach conference argued that although conceptually the ecosystem approachis correct, it is difficult to use it as a practical tool.
A workshop on Fiscal Reform in Fisheries, conducted by FAO in Rome from13 to 15 October 2003, was conceived towards promoting growth, poverty eradi-cation, and sustainable management. Achieving sustainable developmentoutcomes in fisheries requires careful consideration of the economic benefitsthat result from fisheries and the extent to which they are effectively realized. Inparticular, careful consideration should be given to the resource rent which fish-eries are capable of generating. It is, however, important to mention here thateconomic benefits from fisheries are derived not only from rents, but also fromfishing impacts such as local employment, incomes, and food security. Relativeimportance of both types of benefits is highly location specific. The issue ofresource rent is strongly related to access condition in the fishery. The free andopen access to many fisheries leads to their overexploitation. It, therefore, raisesquestion of defining ownership and property and use rights. Ownership issue,in turn, leads to various problems: who is able to charge for the use of the re-sources, who bears the cost of use, and who reaps the benefits. The objective ofresource rent revolves around making policy decisions about how the wealthfrom the fishery is collected and how that wealth is distributed.
As shown in Figure 6, resource rent is the vertical difference between rev-enue (shown by the parabola marked R) and cost (shown by a straight line fromthe origin marked C). Resource rent also increases initially as effort increases, at-taining the maximum at effort level E1. It is a key concept in fisheriesexploitation and management because it is the driving force behind the wide-spread overexploitation of fisheries. Since fishery is usually undertaken inpursuit of profit, it might be logical to think that fishers would use fishing ef-forts so as to maximize resource rent. At levels of effort below the point whererevenue and cost are equal, fishers will be earning more than the normal profit.
FigurFigurFigurFigurFigure 6e 6e 6e 6e 6 Simple model of Schafer growth function showing MSY (maximum sustainableyield) against E (effort)

Overexploitation of fishery resources 293
Such profit will attract new entrants and if access is free and open, this will con-tinue till all resource rent is dissipated at effort level E3. At equilibrium, thefishery will operate at a point where revenue equals cost (Figure 6). At this pointthe fishers will earn normal profit but the fishery would be overexploited botheconomically and biologically. Fish resources are clearly inherently very valu-able, but this value is often hidden due to their overexploited state. If a singleperson, or company, were to be given control of a fish resource, he or she wouldbe able to charge people to use the resources, in exactly the same way as peopledo for their property or as government does for the use of many other naturalresources such as oil. The amount that could be charged depends on the implicitresource rent: the amount that is left when all exploitation costs have been de-ducted from revenue. The gains from generating resource rents will be morethan adequate to compensate losers and ensure that there remains a positivebalance. It seems the management has paid insufficient attention to resourcerent in fisheries sector.
Calculation of resource rent
As given in the key sheets of Fiscal Reform in Fishery (SIFAR 2003), a basic for-mula for calculating resource rent might be
RR= TR – (IC + CE + CFC + NP)
where,NP = r ´ KRR = resource rentTR = local revenueIC = the intermediate consumptionCE = compensation of employeesCFC = consumption of fixed capitalNP = normal profitr = opportunity cost of capitalK = value of fixed capital stock invested in the fishery
Each element in this equation may be treated as a module capable of fur-ther development. Relatively few estimates of resource rent exist, and oneimportant policy goal must be to develop many more such estimates in thefuture. Rules of thumb suggest that rents are in the order of 10%–60% of grossrevenue, usually at the higher end of the rent. An interesting example of re-source rent can be seen in a study of Namibia, presented by Lange and Motinga(1997).
The key issue is to establish who is the owner of the resource and who isthe user. With the advent of 200 mile (8046 kilometres) Exclusive EconomicZone, many states have declared the owners of the fish resources contained

294 Z A Ansari, C T Achuthankutty, and S G Dalal
therein, but relatively few have acted as if they were the owners. Nevertheless,it is the duty of the state to ensure that resources be used in an economicallyrational manner to achieve social objectives. Another alternative suggested byHannesson (1993) would be to establish a coastal Commission to collectresource rent. This commission could be set up at various levels – local, coastal,or regional – depending on objectives, nature, and the importance of the fisheriesinvolved. Yadava (2003) in his paper on fiscal reforms for Indian fisheries sug-gested resource rent as an important contributor.
Overexploitation of resources
An analysis of the catch data of the earlier years suggests that during the peakfishing season, the catches exceeded MSY after which there was a decrease infish production (Figure 7). A negative growth trend could be seen after 1996. Aparallel change in the catch composition has also been reported. While thepelagic catches have been over 50% all these years, the demersal catches haveshown a declining trend. It is worth mentioning here that hypoxic conditionsdevelop in the bottom waters of the Goa coast (Naqvi, Jayakumar, Narvekar,et al. 2000) and this may also have an adverse effect on the demersal fisheriesresources.
When the fish catch data was plotted against the number of vessels, aninteresting picture emerged (Figure 8). In early 1960s, the vessels were very fewand the catch was less. With an increase in vessels, a corresponding increase inthe catch was recorded. We can see that as the number of boats increasedfurther, the catch slowly started decreasing. There are also reports of reductionin CPUE (catch per unit effort) and diminishing economic returns. This clearlyshows that adding more vessels to the present fleet in the same fishing zonemay not increase the total catch. The depth of fishing operations has also been
FigurFigurFigurFigurFigure 7e 7e 7e 7e 7 Marine fish catch and maximum sustainable yield for Goa
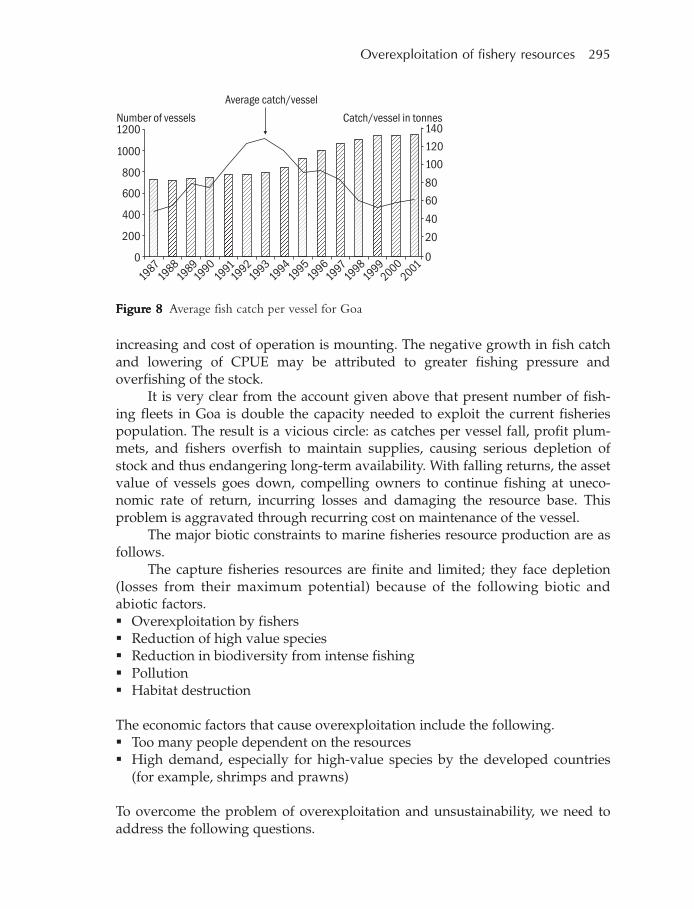
Overexploitation of fishery resources 295
increasing and cost of operation is mounting. The negative growth in fish catchand lowering of CPUE may be attributed to greater fishing pressure andoverfishing of the stock.
It is very clear from the account given above that present number of fish-ing fleets in Goa is double the capacity needed to exploit the current fisheriespopulation. The result is a vicious circle: as catches per vessel fall, profit plum-mets, and fishers overfish to maintain supplies, causing serious depletion ofstock and thus endangering long-term availability. With falling returns, the assetvalue of vessels goes down, compelling owners to continue fishing at uneco-nomic rate of return, incurring losses and damaging the resource base. Thisproblem is aggravated through recurring cost on maintenance of the vessel.
The major biotic constraints to marine fisheries resource production are asfollows.
The capture fisheries resources are finite and limited; they face depletion(losses from their maximum potential) because of the following biotic andabiotic factors. Overexploitation by fishers Reduction of high value species Reduction in biodiversity from intense fishing Pollution Habitat destruction
The economic factors that cause overexploitation include the following. Too many people dependent on the resources High demand, especially for high-value species by the developed countries
(for example, shrimps and prawns)
To overcome the problem of overexploitation and unsustainability, we need toaddress the following questions.
FigurFigurFigurFigurFigure 8e 8e 8e 8e 8 Average fish catch per vessel for Goa

296 Z A Ansari, C T Achuthankutty, and S G Dalal
What are the key factors contributing to fisheries overexploitation andunsustainability?
What are the untapped resources and how to exploit them judiciously? How do these factors interact in general and under major fisheries manage-
ment system? Which are the priority issues in addressing fisheries overexploitation? What are the best practical approaches to address the factors that may be im-
portant for responsible fisheries management?
Role of state fisheries department
State fisheries department plays a major role in the development and implemen-tation of regulatory measures. The state of Goa was among the first in thecountry to implement the marine Fisheries Regulation Act adopted by theUnited Nations Convention of 1982. Goa does not have a fully developed fish-ing harbour and receives the fish catches from Malim, Coutbona, VascoMarmugoa, and Panaji. There are six fishermen societies functioning and theDirectorate of Fisheries provides subsidy to the fishermen community throughthese societies.
The infrastructure facilities are very important and support the industry.The state government has committed to provide all the required facilities suchas auction shed, water supply, parking areas, net mending sheds, and work-shops at the jetties with cold storage facilities round the clock. The developmentof these facilities by the Directorate of Fisheries has seen a 300% increase in thefish production since 1963. Various schemes have been proposed by the fisheriesdepartment for further improvement in fisheries sector.
The industry also faces several problems for the sustainable development.1 Indiscriminate increase in the size of fleet in the recent past and problem
of overexploitation.2 Unchecked mechanized fishing in the river mouths and prohibited areas
up to 5 km from the coast, and serious conflict between traditional andmechanized sector.
3 Catching of brood stock during the monsoon season.4 Use of non-selective gear.5 A lot of by-catch along with the target species.6 Depletion of commercially important species.7 Escalating fuel cost.8 No proper fish drying yard/processing unit.
Fisheries management world over is unfortunately politically influencedand not based on scientific information. Goa is no exception to this. By far, themost important role of state fisheries department is to ensure that appropriatelocal systems of resource management operate in a legal framework, which
Overexploitation of fishery resources 297
provides legally enforceable recognition of their identity and rights. The depart-ment must also provide the framework within which they must be able toprotect themselves from within, from encroachment by neighbouring states orexternal intruders, and from other economic sectors such as tourism. High vari-ability in fish catch makes it both a potential opportunity and a threat.Therefore, the state must develop a system that takes advantage of the opportu-nity and minimizes threat.
Need for sustainable fisheries management
With marine catches stagnating due to overexploitation of commercially impor-tant stocks, rising demand can only be met through more rational fisheriesmanagement and resource development. The state fishery has several social andeconomic implications. Therefore, reducing fish stock to biologically and eco-logically harmful levels will result in a loss of potential benefits as food, income,and employment in the long run. This necessitates for the sustainable manage-ment of this renewable resource. According to Fishery Survey of India (personalcommunication), coastal water of less than 50 m depth is home to more thanhalf MSY. The conservation and management should ideally refer to all the fish-eries legislation, regulations, methods, etc., which are required to build, restore,and/or maintain the fishery resource and the marine environment of Goa. Inorder to ensure sustainability, it is important that factors contributing tofisheries overexploitation and unsustainability are understood clearly. A focuson allocation of fish resources both within and between nation states is neededto avoid cross-jurisdictional fight. A focus on the entire ecosystem, and not onlyon individual stock, is urgently needed to protect all marine resources. Theregulation becomes more pertinent in the light of the restrictions imposed in theform of fishing ban during the monsoon period.
Acknowledgement
The authors are thankful to Dr Satish Shetye, Director of NIO (National Instituteof Oceanography), for his encouragement. This is contribution number 4020from NIO.
References
Achuthankutty C T and Nair S R S. 1993A new record of two penaeids species from Goa coastJournal of Indian Fisheries Association 23: 109–111
Achuthankutty C T and Parulekar A H. 1986Biology of commercially important penaeids prawns of Goa watersIndian Journal of Marine Sciences 15: 171–173
298 Z A Ansari, C T Achuthankutty, and S G Dalal
Ansari Z A, Chatterji A, Ingole B S, Sreepada R A, Revonkar C U, Parulekar A H.1995Community structure and seasonal variation of an inshore demersal fishcommunity at Goa, west coast of IndiaEstuarine, Coastal and Shelf Science 41: 593–610
Ansari Z A, Sreepada R A, Dalal S G, Ingole B S, Chatterji A. 2003Environmental influences on the trawl catches in a bay estuarine system of GoaEstuarine, Coastal and Shelf Science 56: 503–515
Aravindakshan M and Karbari J P. 1983Kuruma shrimp from Bombay watersMarine Fisheries Information Services T & E Series 47: 9–12
Doiphode P V. 1984Local and scientific names of fishes of GoaSeafood Export Journal XVI: 35–38
FAO (Food and Agriculture Organization). 1997The State of World Fisheries and Aquaculture 1996Rome: FAO. 43 pp.
George M J. 1980Systematics of the commercially important prawns (Crustacea, Decapoda,Subfamily Penaeinae) from GoaJournal of Bombay Natural History Society 76: 297–304
Hannesson R. 1993Opening addressIn Innovation in Fisheries Management, pp. 1–5[SNF Report 96/93]Bergen, Norway: Foundation for Research in Economics and BusinessAdministration
Holthuis L B. 1980FAO species catalogue—shrimps and prawns of the worldFAO Fisheries Synopsis 1 (125): 271
Hutchings J A. 2000Collapse and recovery of marine fishesNature 406: 882–885
Lange G M and Motinga D. 1997The contribution of resource rents from minerals and fisheries to sustainableeconomic development in Namibia[Research Discussion paper 19]Namibia Ministry and Tourism
Overexploitation of fishery resources 299
Larkin P. 1977An epitaph for the concept of MSYTransaction of American Fisheries Society 106: 1011
Madhupratap M, Nair K N V, Gopalakrishnan T C, Haridas P, Nair K K C,Venugopal P, Gauns M. 2001Arabian Sea Oceanography and fisheries of the west coast of IndiaCurrent Science 81: 355–361
Mohanta K N and Subramanian S. 2001Resource potential and fisheries development in GoaFishing Chime 21: 9–11
Naqvi S W A, Jayakumar D A, Narvekar P V, Naik H, Sarma V V S, D’souza S,Joseph S, George M D. 2000Increased marine production of nitrous oxide due to intensifying anoxia on theIndian continental shelfNature 408: 346–349
Sardessai U D. 1999Status of fisheries development in GoaFishing Chime 19: 47–48
Sissenwine M and Mace P. 2003Governance for responsible fisheries: an ecosystem approachIn Responsible Fisheries in the Marine Ecosystem, pp. 1–32, edited by N Sinclair andG ValdimarssonRome: Food and Agriculture Organization
SIFAR 2003.Fiscal reform in fisheries. 2. Resource rent[Fiscal Reform in Fisheries Workshop key sheets]Rome: Food and Agriculture Organization
Suseelan C, Thomas M M, Kurup N S, Gopalakrishnan K N. 1982A potential new resource of prawns from Neendakara area in Kerala coastMarine Fisheries Information Services T&E Series 35: 15–17
Yadava Y S. 2003Fiscal reforms for fisheries in India: a case study[Paper presented at the workshop on Fiscal Reform—to promote growth, povertyeradication and sustainable management held at Food and Agriculture Organization,Rome, on 13–15 October 2003]

300 S Sonak, J A Rubinoff, and M Sonak
Conflicting interests and institutionalpluralism: a case study of fishing ban inGoa
Sangeeta Sonak, Janet A Rubinoff, andMahesh Sonak
Current fishing practices show a global trend of stock depletion. In particular,multispecies fisheries, as found in South Asian waters, have complex dynamicsand pose additional constraints for management. Use of closed season/areas tocontrol fishing efforts is a basic management tool in fisheries. Since the breed-ing season differs for different species, the closed season has to be targeted at acertain critical time period that is of importance to key species. Such regula-tions may give rise to conflicts between different types of fishers – such asmechanized and artisanal – as well as between different institutions governingresource use and allocation. This paper presents a case study of the debate onban on monsoon fishing in Goa, India. It also provides insight into such con-flicts arising as a consequence of various institutions and institutional structuresaffecting local fisheries management and their effectiveness in protecting theecosystem and marine resources. It presents a graphic example of economicand political dynamics of fisheries resource management at the local level.
Introduction
Human-induced degradation of fisheries due to increasing global demand forfish products has impacted local ecosystems worldwide. Specifically, currentfishing practices show a global trend of stock depletion. Nearly 75% of theassessed fish stocks are either overfished or fished at their biological limit andare susceptible to overfishing (World Resources 2000: 81).
Apart from being a major protein source for humans, fish generate anumber of ecosystem services that are important for human welfare. Indirect effectsof fishing can have a more important impact on aquatic ecosystem structure and
17
Conflicting interests and institutional pluralism 301
function than the removal of the fish (Hammer, Jansson, and Jansson 1993;Hughes 1994; Botsford, Castilla, and Peterson 1997; Estes, Tinker, Williams, et al.1998; Holmlund and Hammer 1999). Holmlund and Hammer (1999) argue thatfish contribute to the fundamental environmental services that are essential forecosystem function and resilience and are prerequisite for human existence.Further, they also argue that owing to the ongoing overexploitation of globalfish resources, a number of ecosystem services generated by fish populationsare at risk, with consequences for biodiversity, ecosystem functioning, and ulti-mately human welfare (Holmlund and Hammer 1999).
Overfishing was recognized as an international problem in the early 1900s(World Resources 2000: 76) and has drawn attention of a number of interna-tional programmes, especially directed at environmental managers and thegovernments of many nations. However, the common pool nature of fish re-sources poses constraints for management. The primary reasons for the failureof fisheries management can be summarized as: high biological and ecologicaluncertainty of resource dynamics, conflict between social and economic priori-ties, and the lack of definition or observance of constraints imposed by thelimits to resource production (Caddy and Cochrane 2001). A brief summary ofglobal policy issues and fisheries management in different countries, ensuringfair allocation and protection of the resources, has been provided by Caddy andCochrane (2001).
Use of closed season/areas to control fishing efforts is a basic managementtool in fisheries. Multi-species fisheries, as in Indian waters, have complex dy-namics and pose additional constraints for management. The breeding seasonvaries for different species and, hence, the closed season (and/or area) must betargeted at certain critical time periods (and/or habitats) that are of importanceto key species. Such regulations made by the legislature, executive, or, at times,by the judiciary give rise to conflicts between different types of mechanized orartisanal fishers and different institutions governing resource use and decision-making.
This paper presents a case study of the monsoon fishing ban implementa-tion in Goa, in the context of conflicts arising from competing interests ofdifferent stakeholders and their manipulation of legal institutions to protectthose interests. It also considers the implications of the debate on fishing banduring closed season in Goa to the state’s marine ecosystem and resources. Thepaper draws on interviews with key informants as well as available secondaryliterature on fisheries management. In connection with the fishing ban andpolicies for conservation of fish resources, a number of stakeholders wereinterviewed. These stakeholders include traditional and mechanized fishers, of-ficials and scientists of the Goa Directorate of Fisheries, lawyers, scientists in thestate and federal agencies, officers of NGOs (non-governmental organizations)such as NFF (National Fishworkers’ Forum) and the Goa Foundation, membersof the Goencho Ramponkarancho Ekvott (the All Goa Traditional Fishers Union),

302 S Sonak, J A Rubinoff, and M Sonak
and fisheries ministers and MLAs (member of the legislative assembly) of Goa,involved with fishing issues. In order to understand the dynamics of the debateon fishing ban, it is necessary to first examine the state and federal responsibili-ties for fisheries management and the enactment and implementation offisheries law.
Federal authority and legislation concerning fisheries in India
In India, the federal Ministry of Environment and Forests has the prime respon-sibility for the protection of the marine environment, including implementationof legislative measures, and for the management of resources in the coastal wa-ters. The Department of Ocean Development carries out scientific monitoring ofthe marine environment and management of resources in the high seas. Minis-try of Agriculture is responsible for the development of fisheries andaquaculture, and for fish processing. The Fishery Survey of India, responsiblefor the monitoring and assessment of fisheries resources in the Indian waters, isunder the jurisdiction of the Department of Agriculture. International marketingof Indian seafood is the responsibility of the MPEDA (Marine ProductsEconomic Development Agency), which is under the Ministry of Commerce.However, since fisheries are primarily a state subject, legislation and policiesconcerning local fisheries, except for coastal waters, are made at the provinciallevel in India.
Additionally, the Constitutional Doctrine of ‘Separation of Powers’ has abearing on the administrative law to some extent in India. The doctrine wasoriginally enunciated by the Montesquieu (Divan and Rosencranz 2001) in 1748by asserting
‘When the legislative and executive powers are united in the sameperson, or in the same body or magistrates, there can be no liberty.Again, there is no liberty if the judicial power is not separated fromthe legislative and executive powers. Where it joined with the legisla-tive power, the life and liberty of the subject would be exposed toarbitrary control, for the Judge would then be the legislator. Where itjoined with the executive power, the Judge might behave with vio-lence and oppression. There would be an end of everything were thesame body to exercise these three powers.’
At least theoretically, it is the function of the legislature to enact law, the ex-ecutive to implement the law, and the judiciary to interpret the law so enacted.The powers of judicial review of legislation have been specifically conferred uponthe judiciary by the Constitution of India. Any legislation enacted by the union ora state legislature, if found to be in contravention of Part III of the Constitution ofIndia which concerns fundamental rights, can be declared by the judiciary to benull and void. Similarly, the judiciary can declare legislations to be ultra vires,
Conflicting interests and institutional pluralism 303
where there is clear impingement by the Union Legislature upon subjects overwhich the state legislature has exclusive powers of legislation and vice versa. Inexercise of such judicial review, however, it is expected that the judiciary will notitself legislate or pass any judgment upon the policy of the executive action or theexercise of political power. Again, in terms of the theory of ‘Separation of Powers’,the judiciary is expected neither to usurp nor encroach upon the powers conferredupon the executive, particularly in the matter of implementation of law and exer-cise of administrative discretion. However, in practice, the judicial branch hasplayed a very important role in protecting the environment through its rulings onPIL (public interest litigation), when state administrative or legislative authoritieshave been negligent, excessively corrupt, or catered to special interests. Forexample, court rulings have set policy in the debate over Goa’s monsoon fisheriesban and the protection of marine resources.
The original Indian Fisheries Act, 1897, offers protection to fisheries againstexplosives or dynamite, whereas the Wildlife Protection Act, 1972, safeguardsmarine biota and creates conditions favourable for in situ conservation of faunaand flora. This law was amended in 1991 to prohibit fishing within the area ofGahirmatha (Orissa), the annual mass-nesting place for the Olive Ridley turtle,which is an endangered species. It was accorded the status of marine sanctuaryin 1997. The Act was further amended in 2001 to include several species of fish,corals, sea cucumbers, and seashells in Schedules I and III, and whale shark wasplaced in Schedule I. Additionally, the Forest Conservation Act, 1980, offersprotection to marine biodiversity.
The legislative framework concerning marine and coastal resources in In-dia has been discussed by Divan and Rosencranz (2001). The Territorial Waters,Continental Shelf, EEZ (Exclusive Economic Zone), and other Maritime ZonesAct of 1976 contain legal provisions for controlling marine pollution, which is amajor threat to fisheries. In terms of this legislation, the territorial waters extend12 nautical miles from the defined base line. The continental shelf is the naturalprolongation of India’s land territory to the outer edge of the continental mar-gin, or 200 nautical miles, where the continental margin does not extend up tothat distance. The EEZ extends beyond the territorial waters over a distance of200 nautical miles. Exclusive jurisdiction over EEZ is vested in the Union Legis-lature. The Merchants Shipping Act, 1958, governs civil and criminal liabilityarising out of oil spills. The Coast Guard Act, 1978, which constitutes the IndianCoast Guard, is the authority responsible for taking such measures as are neces-sary to preserve and protect the marine environment and for prevention andcontrol of marine pollution.
Other important laws or policies of the federal government, which affectmarine resource health, are the Joint Venture Policy and Foreign Investment Actof 1982 and the Deep Sea Fishing Policy, 1991. These policies allowed licensesfor foreign vessels, linked with Indian businessmen as joint ventures, to fish inthe deep seas beyond 12 nautical miles. The act also allowed duty-free import of
304 S Sonak, J A Rubinoff, and M Sonak
foreign vessels, sale of diesel at international prices, and permission to transferthe catch at high seas. Many of these foreign vessels are huge factory ships thatsweep the seas for resources, not always staying within their mandated bounda-ries and, thus, threatening the livelihoods of Indian fishermen as well as furtherdepleting commercial fish stocks. These licensing agreements were, and still are,an important source of foreign exchange to the Indian national government;however, India’s artisanal and mechanized fishers joined together in a vocal andviolent protest that begun in 1994. While licensing was temporarily suspendedin 1997, exploitation by foreign factory ships in the deep seas has continued inthe guise of ‘Indian ownership’.
The coastline in India stretches over 6000 km (kilometres), supporting nu-merous fishing communities and driving the economies of coastal villages,towns, and cities. The importance of the coastal ecology and linkages betweencommunity life, economic development, and the environment are explored in aprovocative report Fish Curry and Rice, prepared by Claude Alvares of the GoaFoundation (Alvares 2002). The report argues that overfishing in the near-shorewaters, marine pollution, excessive sand extraction, shore line development,and destruction of the khazans are endangering Goa’s ‘fish-curry-and-rice’ ethos,which had evolved over the centuries in harmony with the environment. UsingGoa as a case study, our research examines the effectiveness of state regulationor management of the Goan fisheries, its relationship with federal fisheries law,and the conflicting interests of various stakeholders in the local fishing commu-nity, especially around the controversial issue of monsoon fisheries ban orconservation period.
Fisheries regulation in Goa
Goa was a Portuguese colony from 1510 to 1961, and was thus under the juris-diction of the Portuguese colonial regime with regard to fisheries regulation anddevelopment. Prior to 1961, Portuguese law pertaining to fishing activities wasmore concerned with the control of smuggling rather than with overfishing,though there were regulations regarding mesh size to prevent catch of juvenilefish. Also the 1897 Indian Fisheries Act was enforced in Goa with regard to theprohibition of dynamiting and other destructive methods for catching fish. In the1950s, Portugal did little to develop mechanized fishing in its Indian enclave, andthe mechanized fleet in Goa consisted of two to three government purse seiners.The main technique of fishing at the time of Goa’s liberation in 1961 was beachseining—a traditional method of catching large quantities of fish that came closeto the shore. Very large shore seines – rampons – were set offshore with the help ofwooden canoes, propelled by oars. These nets were pulled by ropes from thebeach by crews of up to 100 men, sometimes over a period of days.
At the community level, control over fishing activities – including disputesettlement among fishers and rules of the rampon or other artisanal fishing
Conflicting interests and institutional pluralism 305
groups – was largely decentralized, and supervision was the jurisdiction of in-formal legal structures or local institutions. Fishing groups within the largeragricultural, coastal villages had their own leaders or ‘councils’ for settling af-fairs within their communities. Such informal or ‘folk’ rules were enforcedlargely by community and religious sanctions. With regard to monsoon fisheriesban, religious sanctions included feast and fast days of both the Catholic andHindu communities, which enforced the end of fishing at the beginning of themonsoon and the resumption/blessing of marine fishing activities as the stormsand seas calmed towards the end of the monsoon in mid-August. For Catholicfishers, the local Church, its confrarias (confraternities or ‘brotherhoods’), andpriests were an important influence over some fishing activities. In particular,Catholic fishers were not supposed to fish on Sundays, and this prohibition isstill respected today by traditional fishers, such as the rampon groups.
With regard to regulation of fisheries, the Indian Fisheries Act is the centrallegislation. This legislation was amended, inter alia, by the Indian Fisheries (TheGoa, Daman, and Diu Amendment No. 1) Act, 1970, published in the Officialgazette, Series I (No. 37) dated 30 October 1970. Section 6 of the Act concernsprotection of fish in selected waters by rules to be framed by the state govern-ments. The federal Marine Fishing Regulation Act, 1978, acted as a model,which provided guidelines to the marine states to enact laws for protection ofmarine fisheries in their own territorial waters. In general, this Act includedregulation of mesh size and gear, reservation of zones for various fishing sec-tors, and a declaration of a closed season during specific times of year. Inexercise of the powers conferred by Section 6 of the said Act, the LegislativeAssembly of the state of Goa enacted the Goa, Daman, and Diu Marine Regula-tions Act, 1981, to provide for regulation of fishing by fishing vessels in the seaalong the coastline of Goa. This Act defines ‘specified area’ to mean such area inthe sea along the entire coastline of Goa, or such portion of it, but not beyondthe territorial waters, as may be specified by the state government by notifica-tion in the official gazette. These rules prohibit fishing in inland waters with anet operated from a mechanized boat, regulate the erection of fishing stakes andnets in the rivers, prohibit use of nets with certain mesh sizes, provide for regis-tration of nets, and confer powers upon the Director of Fisheries to give licensesfor operation of all fishing nets, such as rampon, dragnet, and others.
Furthermore, the 1981 Act empowers the government to regulate, restrict,or prohibit fishing in any specified area by such class or classes of fishing ves-sels as may be prescribed, or the number of fishing vessels which may be usedfor fishing in any specified areas, or the catching in any specified area of suchspecies of fish as may be notified in the notification, or the use of such fishinggear in any specified area as may be prescribed, or the fishing in any specifiedarea during the day or night as may be prescribed. The Act enjoins upon thegovernment to have regard to the need to protect the interest of different sec-tions of the persons engaged in fishing, with particular emphasis on those
306 S Sonak, J A Rubinoff, and M Sonak
engaged in fishing using traditional, fishing crafts such as catamaran, countrycraft, or canoe, the need to conserve fishing, and the need to maintain law andorder in the sea. More specifically, the Act prohibits fishing beyond specifiedareas and the catching of juvenile fish such as mackerels, sardines, etc. Section4 (2) (b) stresses the need to conserve fish and to regulate fishing on a scientificbasis and also mentions that the government has to play a major role in this.However, most of the provisions of this Act, like the establishment of fishingzones or mesh sizes, have never, or rarely, been enforced by the Goa govern-ment. The management or conservation of marine resources was also not arecognized problem either by the mechanized sector or the Goa governmentthroughout the 1980s and 1990s.
In addition, the Legislative Assembly of Goa also enacted the Goa (Brack-ish Water) Fish Farming Regulation Act, 1981 (Act 9 of 1992), to regulate andpromote scientific fish farming in brackish water in the state of Goa. This Actprohibits fishing or fish farming except in accordance with the license issuedunder the Act. In exercise of powers conferred by Section 7 of the said Act of1991, the Government of Goa has framed the Goa (Brackish Water) FishFarming Regulation Rules, 1994.
The story of fishing ban in Goa
Prior to the development of mechanized fishing in Goa from the mid-1970s,regulation of monsoon fishing during the heavy rainy season was largely ‘en-forced’ by nature – by the stormy weather, rough seas, and the rise of sand bars– as well as by low technology of fishing craft and gear, which made it ex-tremely dangerous or impossible to fish in the spawning season betweenmid-June and mid-August. In other words, strict regulation of a monsoon ban,especially by the state, was not really necessary. Thus, it was not until mecha-nized development had reached a threshold in 1975/76 that fisheries regulation,dispute settlement over resources, and exclusive zones of exploitation bymechanized and traditional fishers, including the imposition of a monsoon ban,began to involve both artisanal fisher agitations and the legal institutions of theIndian federal and state governments.
‘Religious law’ also has regulated monsoon fishing by means of importantfeasts of both Hindu and Catholic fishers that mark the end of one season andcelebrate the beginning of the new fishing cycle. These feasts or pujas have forcenturies sanctioned the end of the fishing season as the seas get rougher inJune, in particular during the feast of St Peter (Festa de Saõ Pedro) – the patronsaint of Christian fishermen all over the world – on 29 June. When the seas be-come calm enough for traditional sea-going craft, the beginning of the newseason in mid- to late August is also marked by important religious pujas orcelebration of a special mass. Hindu fishers celebrate the narlipournima puja duringthe full moon of Shravan, which normally falls in August. The Catholic Festa de

Conflicting interests and institutional pluralism 307
Saõ Lourenco is celebrated on 10 August and is the traditional date for the bless-ing of the boats by village priests and the beginning of marine fishing if weatherpermits. In the past before mechanized fishing, such religious or informal lawhad the effect of protecting marine life during the crucial spawning season byensuring that no traditional fishers would enter the seas for two to threemonths, if not in fear of very rough surf, in terror of wrathful deities. And oneneeded the blessings and protection of either Hindu or Christian deities for asafe and productive new season. The coconut (narli pournima) puja, – along witha corresponding feast of St Lawrence among Catholic fishers – has marked thebeginning of the marine fishing season in Goa for centuries. The rites involvethe blessing of the boats, the backwater rivers, and the sea for a good fishingharvest, and a prayer to Varuna, God of the wind, to calm the seas and safe-guard all fishermen.
Two major religious communities of Goa also observe different fasting pe-riods, not eating fish, which may also, in effect, serve as a conservation ofresources. Coinciding with the monsoon season in Goa, many Hindus do not eatfish in the month of Shravan (July–August), which is also a breeding period forsome species of fish. In some communities, during Chaturmas (four months dur-ing monsoon), fish eating is prohibited. Also many Catholics observe a longfish-fasting period during the 40-day Lenten period preceding Easter (March–April). It is possible that these fasting periods have some relevance to theecological regeneration and conservation of fish.
Another traditional aspect of fish conservation relates to the creation ofbrackish water fish-ponds in the villages, which were connected to the watermanagement system. From ancient times, many villages had reclaimed alluvialor marshy wetlands for the production of paddy. Such fields, known as khazans,were maintained by the traditional village societies, known as ganvkari orcomunidades under the Portuguese, through an elaborate system of dykes (bunds),sluice gates, and internal rivulets and ponds. These fields were used for bothrice and fish production (Sonak, Kazi, and Abraham 2005). In such integratedrice and fish ecosystems, there is a ban on fishing in the fields from June toAugust, the primary rice-growing season. This inland and estuarine fishing wascontrolled by the villages, which promoted the production of fish and prawnsduring the dry season and preserved the fields for agricultural activity duringthe monsoon. The ban coincides with the breeding period of most species of thefish and hence serves as protection to juvenile fish (Sonak, Kazi, and Abraham2005).
The call for a ‘monsoon fisheries ban’ originally grew out of the disputesthat arose in the late 1970s between the traditional rampon (beach seine) fishersand the mechanized sector. As mechanization in fishing reached a critical levelby 1975, it adversely affected the livelihoods and fishing grounds of theartisanal or rampon fishing communities. In 1978/79, confrontations betweenramponkars and trawler owners in Goa turned violent as these artisanal fishers
308 S Sonak, J A Rubinoff, and M Sonak
tried to protect their marine resources from overexploitation by trawlers. Notonly did the All Goa Ramponkar Union (Goenchea Ramponkarancho Ekvott) call forexclusive fishing zones for traditional fishers, but it also agitated for a ban ontrawling and purse seining during the monsoon-breeding season between Juneand August in order to protect spawning fish, their eggs, and juveniles for thecontinued regeneration of marine resources.
In 1981, the Union Territory’s1 Legislative Assembly passed the Goa,Daman, and Diu Marine Regulations Act, which provided an exclusive 5 kmprotected zone (from the shoreline) for traditional fishermen. Furthermore, theAct recommended a ban on fishing by mechanized boats during the monsoonseason, and to this effect in 1985, the Goa Government established an interimban on fishing from 1 June to 31 August. Challenging the 1981 law, the All GoaMechanized Fishing Boat Owners Association immediately filed a writ petitionin the Supreme Court on which a final decision was not handed down for over12 years. During this interim period, the Court allowed mechanized boats tooperate within 2 km of the shoreline, but they were banned from fishing at nightfor 5 km to protect the gear and nets of the traditional fishermen. The SupremeCourt decision, which was finally handed down in 1993, essentially reiteratedthe interim order. It recognized an exclusive zone for traditional fishermen butonly at 2 km from the shore, rather than the 5 km originally in the 1981 Goa Act;it also prohibited night fishing within the 5 km zone.
However, during this period, the local Goa government never enforcedits own fisheries law or the interim ruling by the Supreme Court. Essentially,the Goa administration was not disposed to protect the rights of traditionalfishers and failed both to enforce a monsoon fisheries ban and to implementeven the reduced kilometre limitations (from 5 to 2 km) on mechanized boatsplying in Goan waters. Trawlers and purse seiners fished with impunity,though, during the monsoon, stormy weather, rough seas, and the closing ofthe sand bar at the mouth of the Mandovi River kept most mechanized boatsfrom fishing. Other than the lack of coast guard resources, the underlying reasonsfor the government’s blatant lack of enforcement of the interim Court ruling liein both the ‘development’ focus of the Goa state (the attitude was that artisanalfishermen should re-train themselves or find alternate employment) andcorruption, as a number of MLAs and other important power-brokers wereowners of, or investors in, mechanized fishing boats.
By the mid-1990s, there was a great cause for concern over the decline inmarine catches and destructive fishing practices of the mechanized sector, andsuch problems were not being addressed by the local government and fisheriesdepartment. A number of environmental NGOs, many private citizens, as well
1 Goa was not a state until 1987, and was still joined with the former Portuguese possessionsof Daman and Diu (near Gujarat) as a union territory under the direct administration of thecentral government.
Conflicting interests and institutional pluralism 309
as the traditional fishers’ union (the Goenchea Ramponkarancho Ekvott) were in-creasingly concerned with the considerable reduction of marine catches andsoaring prices in the markets. Fish and prawns are staples of the local diet. An-ecdotal evidence from fishers themselves indicated not only an overallreduction in catch, but also a decline in the most commercially desirable fishand prawns. In interviews, numerous stakeholders, both from the artisanal andmechanized sectors, expressed concerns regarding the declining fish catchin Goa since the mid-1990s. According to official statistics (Directorate ofFisheries), there has been generally an increase in marine fish production since1973 up to 1993, and thereafter a decline has been observed with theexceptions during some years.
In response to this decline as well as pressure from environmental and tra-ditional fishing groups, the Goa government initially imposed a monsoon banin a notification from the Goa Fisheries Department (15 February 1995), whichprohibited mechanized fishing – trawling and purse seining – from 1 June to 31August. Within four months of this directive, on 17 July, the ban was reduced till24 July, that is from 90 to 54 days. While no official reason was given for the cur-tailment, there was undoubtedly pressure put on the fisheries bureaucracy bypoliticians and the trawler associations. Since prior to the Supreme Court’s 1993decision, mechanized fishing during the monsoon had not been strictly enforcedand mid-July, depending on the weather, had been the period when mostmechanized craft had resumed fishing, trawler owners wanted to maintain thestatus quo.
At that time in 1995, and subsequently, mechanized boat owners haveclaimed that a 90-day ban was ‘too harsh to deprive the fishing vessel operatorsfrom deriving earnings on the assets acquired through loans from banks. Vesselowners also maintained that they had to pay wages to their crews while boatssat idle. In addition, the commercially valuable solar prawns annually arriveclose to Goan shores around mid-July and fetch high prices on the internationalmarkets. Earnings from these prawns were a major source of income for trawlerowners, which assured their economic survival for the whole year. The July1995 reduction to 54 days was reiterated again in the official Goa Gazetteer on29 April 1999. However, the 1995 and 1999 notifications were not legislativeamendments to the 1981 Act.
Following this reduction of the ban period, a PIL was filed in July 2000before the Goa Bench of the High Court of Bombay, requesting the Court tointervene to protect the fish resources on grounds that the breeding period ofmajor species is in the monsoon and that the ban should be extended up to15 August to protect the growth of juvenile fish. This writ petition was grantedby the High Court and the ban was extended to 15 August. There was criticismfrom some quarters that such interventions by judiciary amounts to encroach-ments upon the domain reserved for the executive or the legislature by theConstitution of India.
310 S Sonak, J A Rubinoff, and M Sonak
In a bid to nullify the effect of the aforesaid judicial directive extending theban period from 24 July to 15 August, a bill was passed by the Assembly on21 July to amend the Goa, Daman, and Diu Marine Regulations Act, 1981, andrestrict the ban till 24 July. The bill also prohibited motorized traditional canoesfrom fishing during the shortened ban period. Though the bill was unanimouslypassed by the assembly, the then Governor of Goa refused to sign it and re-turned the same to the Legislative Assembly for reconsideration. During theinterim, the trawler owners defied the ban and started fishing operations on25 July. The executive displayed lethargy and no trawlers were seized by the Di-rectorate of Fisheries, the department responsible for monitoring fishing activities.
With regard to the state legislative process, Articles 196 and 200 of the Con-stitution of India contain provisions for the introduction, passing, and assent tothe bills (other than Financial Bills) in a State Legislature. A bill, which containsthe text of the proposed legislation, is required to be introduced in the House ofLegislature and a vote is taken thereupon. If the majority of the members in theHouse support such bill with or without amendments or modifications, thesame is said to have been passed by the Legislature. When a bill has beenpassed by the Legislature, it is presented to the Governor, who shall declare thathe assents to the bill or that he withholds the assent there from, or that he re-serves it for consideration of the President of India. The withholding of assentby the Governor, however, is not final. As per the Constitutional Scheme, theGovernor may, as soon as possible after the presentation to him of the bill forassent, return it together with a message requesting that the House of Legisla-ture will reconsider it or any specified provisions thereon and, in particular, willconsider the discretion of introducing any such amendments as he may recom-mend in his message. When a bill is so returned, the House shall reconsider itaccordingly, and if it is passed again by the House with or without amendmentand is presented to the Governor for assent, the Governor shall not withhold as-sent there from.
The legislative move to nullify the Court’s order, the defiance of the ban,and the executive lethargy were challenged by filing another writ petition be-fore the Goa Branch of the High Court of Bombay on 2 August 2000. Thispetition emphasized the fact that the Court’s order was not being enforced andurged the sealing of all fishing jetties and the patrolling of Goa’s coastline by theCoast Guard. Filed with the writ petition was a study conducted as per the HighCourt instructions, by the NIO (National Institute of Oceanography), Goa. Dueto the breeding of certain commercially important fish species during themonsoon period,2 the NIO report recommended a monsoon ban till 31 August.
2 The incidence of fish breeding during the monsoon is a very controversial issue, as accord-ing to one scientist, ‘We just do not know enough about what triggers fish to breed at certaintimes.’ In support of the ban, the original NIO (National Institute of Oceanography) submis-sion to the Court in July and August 2000 indicated that monsoon-breeding species includedcommercially important oil sardines and mackerel, but not most prawns or pomfret. Other
Conflicting interests and institutional pluralism 311
The High Court directed the state government to forbid mechanized boats fromusing the jetties for fishing during the ban period and also asked the Depart-ment of Fisheries to monitor the jetties The government was also directedto publish the gist of this order in English and Marathi newspapers. Ratherthan the drastic measure of sealing the jetties as requested by the writ, thecourt opted for the restraint of the trawlers from operating during the specifiedperiod and for the suspension of licenses of the trawlers defying the ban until15 August.
Eventually in August 2000, a number of trawlers were seized while catch-ing fish during the ban period. On 2 August 2000, the Goa bench of BombayHigh Court directed the state government to suspend the fishing license of thesetrawlers until 15 August. Thus, despite the challenge of the MLAs and trawlerowners through the Legislative Assembly, the High Court successfully main-tained its right with respect to serious environmental concerns, to order andenforce a fisheries ban in Goa. However, soon after the court ruled on the sec-ond petition in August 2000 to curb the illegal fishing, the date of 15 August hadalready arrived, and the issue was essentially moot until the next monsoon sea-son. The court and concerned citizens won a largely empty victory. At issue herewas the inability of the courts to successfully implement the ban, especiallywithout the cooperation of the state government and bureaucracy. The fisheriesdepartment claimed that it did not have enough coast guard support to policethe waters. There was no movement in 2000 or 2001 to close the jetties or gov-ernment-subsidized fuel pumps.
During the following 2001 season, the Court’s order for a monsoon ban inGoa was essentially not enforced and was almost a copy of the occurrences in2000. However, there was a change in government in October 2000 that eventu-ally affected the implementation of the order. The new government in Goa triedto initiate a few measures to deal with some of the trawler issues prior to themonsoon. These included a ban on the issue of new trawler licenses in 2001 anda sales-tax exemption on diesel fuel for fishing trawlers and other boats but onlysold through fishermen’s cooperative societies. The state government also re-quested the banks and other financial institutions ‘to waive off penal interestand reschedule loan instalments’ due in past years (F Noronha, Goanet News,22 March 2001). However, these relief measures were minor and limited andcertainly did not stop the mechanized boats from fishing after mid-July or solvethe larger problem of preventing overfishing in a key breeding season.
species spawning from May to August are Jew fish, Ghol, Dhoma, and croaker (O Herald,14 August 2000; and unpublished scientific reports submitted by the NIO to the High Courtin support of Santana’s petitions, July and August 2000). In 2005, a new NIO study, focusedon the life cycle of the solar prawns that appear off the western coast in July, has been com-missioned by the Goa government. In fact, one scientist also indicated that a moreappropriate term should be ‘monsoon conservation period’ rather than a ‘ban’, which hasbecome a politically loaded term.
312 S Sonak, J A Rubinoff, and M Sonak
However, after Goa state elections in May 2002, measures finally began tobe introduced that supported the Court-ordered ban till 15 August despite con-tinued protests from the trawler lobby. Especially in 2003 and 2004, thegovernment took strong measures to enforce monsoon ban, which included theclosing of the jetties and government fuel pumps, as well as the cancellation ofinsurance for mechanized craft during the ban, which began on 7 June and con-tinued until 15 August. The Minister for Fisheries was strongly supportive of theban and even inspected the catch himself on some occasions.
There was a change in the political set up by the end of January 2005.President’s rule was imposed, followed by changes in the political equation information of the government. The enforcement of ban took a back seat. The banwas preponed to 31 July for trawlers and purse seiners, in a bid to supersede thejudicial directives holding the field. The ban, in respect of motorized canoes, fi-bre glass boats, etc. was not imposed from 16 July, which resulted in theirbagging most of the solar prawns in the 2005 season, much to the dismay of themechanized trawlers. Ironically, violent storms at the beginning of August pre-vented most mechanized boats from fishing till three to five days later. Thepolitical will to support the long-term monsoon ban had evaporated quickly.The new Fisheries Minister was himself a trawler owner and a major player inthe mechanized boat lobby. The significant issue of conservation and protectionof fish species as well as effective fisheries management have largely beensubverted not only by the new government but also by the mechanized boatowners and even the artisanal fishers using motorized fibre and traditional canoes.
Other perspectives on the monsoon ban and fisheries regulations
Indian fishery is a multispecies fishery. The ban on fishing corresponds to thebreeding period of the fish found along Goa’s coast. Popular species such asIndian mackerel (Rastrelliger kanagurta) and the sardine (Sardinella longicepes)have a breeding period that spans from May to August, though it is recognizedby fisheries scientists that breeding may also occur at other times of the year.Most other fish species found along the coast of Goa also have a breedingperiod spread over four months. These include pomfret (April–June,September–November), jewfish (June–July), gholfish (June–September), anddhoma (June–September). Fishing ban from 1 June to 31 August could offersome protection to these breeding fish. Such a protection is needed because lo-cals have been complaining that the fish landings per trawler have drasticallydecreased in recent years. However, the scientific community offered anotherexplanation and was of the opinion that the decline in fish catch was more a re-sult of ‘biological variability’ than increased fishing efforts. Additionally,pollution from land-based activities, algal blooms, as well as destructive fishingpractices and an excess of licensed fishing boats all contribute to reduction incatch.
Conflicting interests and institutional pluralism 313
According to the statistics given by the fisheries department, in 42 fishing(marine) villages of Goa, the total fisher population is 30 225, of which 11 944are active fishermen. The traditional sector contributes about 35% of the totalfish landings. The traditional fishermen, like the ramponkars, opined that fishcatch has reduced, and thus, they can merely sustain a living, but do not havemuch profit. As the number of active fishers and profits in many rampon grouphave decreased, the size of the beach seine or rampon has been reduced. There-fore, the number of people required to pull the net is less, and most groups orsingle net owners cannot afford to pay to more workers. As the total number offishers has increased, the number of rampons has increased.
Many fishers from the traditional fishing community (predominantlyknown as Kharvi) have upgraded their fishing vessels as well as gear, and theynow use motorized ‘canoes’ and not the ‘hodem’ or ‘ponel’ (wooden canoe),which was traditionally used for fishing. Many are also using new nets, some-times called disco rampons, which are essentially mini-purse seines. Thesefishers are against a monsoon ban for their smaller motorized vessels, or at leastthey feel that if a ban is maintained during June–July, they as ‘traditional fisher-men’ should be allowed to fish at least two weeks earlier than the mechanizedboats. Their argument was that as the trawlers are not allowed to fish during themonsoon season, it is only during this time that they can earn some money. It isoften not possible to use the traditional ‘rampon’ during monsoon because ofrough seas. Use of smaller motorized canoes should be allowed, as these vesselsdo not make huge catches or cause much harm to the resources. The traditionalfishers also complained that the trawlers fish within the prohibited inshorezone, thus reducing the catch for them. Not only do the trawlers sweep cleanthe coastal areas of fish and prawns, but also damage or destroy the nets of tra-ditional fishers, especially at night.
In the PILs before the Court, the Amicus Curiae (a lawyer who acts as‘friend of the court’) objected to the reduction of the ban period as it would nei-ther protect the natural resources of the sea nor benefit the traditionalfishermen. There was a general perception that the ban period was reduced es-sentially to accommodate the powerful trawler lobby. The government wascriticized by most of the interviewees since there was no enforcement and not asingle trawler owner was penalized, though many trawlers were found violat-ing the ban.
The executive took up the plea that there are no provisions in the law for asummary trial in Goa. Once the trawlers are caught, the prosecution against theowners is lengthy and cumbersome. The conviction, at the highest, entails impo-sition of fines, which are paltry. The original bill had a provision for summarytrial and confiscation, which were later done away with. A large number of in-terviewees felt that there has to be some regulation to restrict the number oftrawlers. Policies in other countries permit (even United Nations EnvironmentProgramme) only 30 motorized vessels per 10 km. India does not have any such
314 S Sonak, J A Rubinoff, and M Sonak
policies. The number of motorized vessels in Goa has already exceeded 1000.Traditional fishermen also spoke of the violation of laws by trawler owners.They complained that the governmental and legislative policies were aimed atfavouring the trawler owners, regardless of the interest of the traditional fishers,environment, and ecology.
The Directorate of Fisheries recommended reduction of the ban period upto 31 July. As claimed by the officials, this recommendation was based on theobservation of traditional fishermen. The Director claimed that the traditionalfishermen have observed that the breeding season of most fish has also shiftedas the monsoons now approach early. However, this was not confirmed by tra-ditional fishermen, when they were interviewed. Further, the Director ofFisheries agreed that fishing intensity has increased. The maximum number ofmotorized vessels Goa should have is 850. However, there are 2500 countrycrafts operating in Goa waters, of which 1100 are motorized vessels. There are anumber of smaller vessels operating (50%). The potential for Goan waters isfixed at 70 000 tonnes, but the actual fishing is more than 90 000 tonnes. Whilemuch of the yield comes from outside Goan waters (mainly from Karnataka tothe south and Maharashtra to the north), there are clearly signs of overfishing inGoa. Scientific officers working for the Fisheries Directorate also agreed thatthere is overfishing and that fishing intensity has increased due to a significantincrease in the numbers of trawlers, purse seiners, and motorized fibre canoesof traditional fishers. At the same time, competition from the mechanized sectorhas greatly reduced the number of fishers using rampons or beach seines.
In late July–early August, trawler owners target prawns known as ‘solarsungotta’ (Metapenaeus dobsoni), which are available in Goan waters only at thistime. Trawler owners claim that a ban on fishing till 15 August deprives them ofthis lucrative catch of prawns, which have a high demand in international mar-ket and the export of which forms a large part of their annual income. Theexport also earns much desired foreign currency for the country. Further, be-cause the closed season is not uniform for the west coast, trawler owners fromother states fish in Goan waters. Thus, such prawns do not get protection de-spite the closed season. However, the then Minister for Fisheries, whosupported the ban period up to 15 August, informed that during an inspectionvisit after 15 August 2004, he had witnessed that the trawler owners had a goodcatch of prawns. In his opinion, the ban period up to 15 August would drasti-cally affect neither the trawler owners nor the country’s foreign exchangeearnings. Some compromises to economy are needed to protect the ecology.
However, there were two major factors in July 2005 that affected the catch ofsolar prawns and profits for mechanized boat owners. One is the increasing com-petition for these prawns from artisanal fishers of Goa who have upgraded theirtechnology with fibre boats, high-powered 9.9-horse-power motors, mini purseseines, and even small wynches for the hauling of nets into canoes. Despite thetechnological improvements, the artisanal fishers still have considerably lower

Conflicting interests and institutional pluralism 315
operational costs than the mechanized fleet. And on 15 July 2005, they were alsoallowed to fish two weeks earlier than trawlers and purse seiners. (In the past, themonsoon ban restricted all motorized canoes as well as mechanized craft fromfishing.) The second factor was the considerably lower prices now paid for theseprawns by the agents of processing companies: roughly from 125–150 rupees perkg (kilogram) in the late 1990s to this year’s price of 58 rupees (and many of theartisanal fishers got far less: only 30–40 rupees per kg from the local agents).Agents claimed that they were getting lower international prices and there wasless demand for solar prawns, but they also worked together to fix prices and tosqueeze the local fishers from all sectors of the fleet.
With regard to overfishing in Goan waters, most interviewees indicated thefollowing. A number of fish species have not been found in Goa. This could be because
the species are reduced in number and/or are threatened. This is a phenom-enon, which is reported all over the world.
‘Fishing down the web phenomenon’, which is reported in many other partsof the world, is also found in Goa. Commercially valuable fish is reduced. Sonow even the smaller fish or former ‘trash fish’, which were of little impor-tance earlier, fetch a good price. There is decline in fish catch all over theworld, which results in great demand in international markets even for fish,which was commercially not very valuable earlier.
Catch per unit effort has decreased. Many active fishers do not get enough re-turns.
The size of the fish being caught now has decreased due to smaller meshsizes and harvesting of juvenile fish before it can mature and becomelarger.
These signs were also observed by traditional fishermen. They observedthat fish size is reduced, and that fish availability is less. Because of lesser avail-ability, the fish rate has increased in the markets. So traditional fishermen cansustain their occupation in fishing, in spite of less catch. Even trash fish is usedfor drying or for preparing organic manure now. So the trawler owners have re-duced their mesh size in order to catch more fish, regardless of size. This againhas an impact on small fishers. Smaller mesh size, in violation of regulations,has impacts on the fish resource base.
Traditional fishermen also confirmed that some species are gettingdepleted. Species such as ‘dodiaro’ (croakers or sciaenoids) and ‘muddashi’(ladyfish), which were earlier available in abundance, are not commonly foundin Goa waters now. Even mackerel and sardines, which were considered to bepoor man’s protein, are now being exported, or in the case of sardines, beingdried and converted into fish meal (mainly for poultry feed). Consequently, theavailability in Goan markets has decreased, and the prices have increased. Thiswill affect the nutritional status of the local community, particularly the childrenfrom low-income group families.
316 S Sonak, J A Rubinoff, and M Sonak
Most rampon fishers (that is, beach seiners), NGOs, scientists, and peoplefrom the local community opined that the fish ban from 1 June to 31 August isessential not only in the interest of traditional fishermen, but is also essential forthe ecology and conservation of fish stock. Further, it was also stated that Indiahas neither good policies for fishery management nor good implementation ofthe existing regulations. Regulation of mesh sizes, restriction on the number oftrawlers and purse seiners, strict enforcement of a ban or conservation period,and prohibited zone for in-shore fishing are some of the measures recom-mended for the preservation of fish resources.
Regarding the implementation of laws, the then Director of Fisheries,when interviewed opined that since there is no uniform ban period for all thestates, the mechanized boat owners fish in the seas offshore other states, whereit is not banned during that period. The Directorate of Fisheries does not havejurisdiction beyond Goa waters, and there is no proper infrastructure for en-forcement of existing regulations. There is only one patrol boat, which can seizeonly one trawler at a time. When there is mass violation of laws, it is not possi-ble to take proper action.
The MLA interviewed did not agree with Director of Fisheries. She saidthat she has been associated with traditional fishermen for a number of yearsand that they are in support of strict enforcement of laws. However, the govern-ment has not attempted to procure the required facilities. While subsidies arebeing given constantly to the trawler owners, little is done to protect the inter-ests of traditional fishermen. Against the reduction of ban period, she felt thatthe ban period should be fixed on the basis of scientific study. Out of ignoranceof scientific facts and the significance of ban period, which coincides with thebreeding season of some fishes, the Goa Assembly passed the July 2005 bill forreducing the ban period. However, the MLA was aware of these facts since shehad worked for the cause of traditional fishermen and felt that unless there isprotection of fish stocks, the conservation of species will not be possible. It is inthe interest of small fishers and largely our entire public that the ban is main-tained. She opined that the interests of the larger public should outweigh thoseof a few trawler owners.
In the PIL of 2000, the lawyer who argued in the court further disclosedthat at the Southern Zonal Council of Fisheries meeting held in September 1998,a decision was taken to follow the uniform dates from 10 June to 15 Augustfor a monsoon ban, which was later conveyed to all the states by the centralgovernment in 1999. This would help against the complaints of local fishermenabout the intrusion of mechanized boats from other states in local waters. NGOsare also in favour of this uniform period. However, no uniform ban has been inforce till now, though another PIL concerning this is pending in the Court. Themain problem with the uniform ban for the western coast of India is that themonsoon rains sweep northward up the coast at slightly different dates, begin-ning with Kerala in late May or early June.
Conflicting interests and institutional pluralism 317
Discussion
Common and shared problems experienced in many coastal regions include thedecline of traditional sectors such as coastal fisheries and sectoral managementthat may lead to unsustainable systems (Hammer, Holmlund, and Almlov2003). Growing participation in fisheries gives rise to conflicts, crises, and vari-ous management decisions.
At the global level, the international community is well aware of the crisisfacing fishery resources and fisheries, and has taken a number of importantinternational steps towards an improved global management system for fish-eries (Caddy and Cochrane 2001). However, the serious nature of the problemof overfishing needs to be better recognized, including improved educationfor both traditional and mechanized fishers. In addition, the increased needfor sound fisheries management implemented at the local level must bestressed. Local conflicts over the use of natural resources in the coastal zoneare part of larger – regional, national, transboundary, and international – conflictsand resource management systems. The scientific literature on conflict preven-tion, resulting from national and international policy research is, however, oflimited value for the majority of local environmental resource use conflicts(Bruckmeier 2005). Local conflicts in coastal fisheries are often handled byfishery management or legal institutions – both state and non-state – at differ-ent levels. State forums include regional, national, as well as local institutionsof governance (legislatures, courts, etc.). Non-state includes regulations anddispute settlement of village fishers as well as state-wide fisher associations,both traditional and mechanized, formal and informal. This paper has pre-sented a case study of the conflicts in Goa, involving implementation of amonsoon fisheries ban for conservation and resource maintenance, conflictsarising between different classes of fishers and their alternative managementpolicies, affecting the preservation or exploitation of marine resources. To ana-lyse the nature of competition in Goa, it is also helpful to utilize theperspective of legal pluralism to understand what has happened over the pastfew years with regard to the manipulation of different institutions for enforce-ment or circumvention of monsoon fisheries ban and, ultimately, of a soundfisheries management policy.
In a more general sense, Jacques Vanderlinden (trans. in Bavinck 1998: 151)defines legal pluralism as ‘different legal mechanisms applicable to identicalsituations’. In case of Goa, this situation would be the imposition or preventionof a monsoon fisheries ban by interested parties and the interplay of differentlegal approaches, both state and customary law, used to enforce or frustrate thatban.
The manipulation or choice of available legal institutions, which may bemost conducive to one’s position in a dispute, has been termed ‘forum shop-ping’ by Benda-Beckmann (1981) in her comprehensive article on village
318 S Sonak, J A Rubinoff, and M Sonak
dispute settlement in West Sumatra, Indonesia. The legal forum chosen by anactor or group of interested actors to address claims is based on a perceptionthat some institutions will be more supportive of a particular position than oth-ers. While her study deals mostly with informal village and local forums forconflict resolution, with overlapping jurisdictions (exterior to the state legal sys-tem), this process of ‘forum shopping’ or selection by different actors or interestgroups is analogous to what has occurred in Goa, especially in 2000–05. How-ever, in the Goa monsoon fisheries ban, the ‘forum shopping’ has been mainlyamong different state institutions: the Legislative Assembly, the judiciary, andthe executive.
The Goa case clearly presented a situation, wherein the traditional fishersand the environmentalists, through judicial interventions in 2000 and subse-quent years, were able to place a ban on monsoon fisheries. The countermoves,mainly by the trawler lobby, attempted to frustrate such a ban through interven-tion of the legislature, coupled with inaction by the executive. Conflicts betweentraditional fishers and mechanized fishing groups over resources and zones offishing have also underlain the dispute since the mid-1970s. The Goa casepresents polarization of the three most important legal institutions in the statequa its response to such conflict. All three institutions of the state (the differentlegal forums) – the Legislative Assembly, the judiciary, and the executive – havebeen involved in the conflict. The traditional fishers and environmentalists seek-ing protection to fish breeding and conservation chose to approach the judicialforum through PIL in the High Court of Bombay at Goa. The trawler lobby sup-ported by Congress MLAs and ministers, who themselves were trawler owners,chose to counter the judicial directives by the intervention of the other two statelegal institutions, namely the legislature and the executive. To counter the ban,MLAs attempted to enact a bill in July 2000 undermining the judicial order fromthe High Court. The executive in 2000/01 displayed lethargy in implementationof the ban. The doctrine of ‘Separation of Powers’ was used in support of thecriticism that the judiciary had encroached upon the domain of the legislatureand the executive in imposing ban, which is essentially a policy decision andwhich the courts by their very nature are ill equipped to take. With a change ingovernment (mainly 2002–early 2005), political considerations also affected theimplementation of the state’s fisheries laws. The legislative decisions more posi-tively supported resource management through enforcement of a monsoon banin Goa till 15 August. Since June 2005, due to a change back to the previousgovernment, administrative orders have again undermined the effectiveness ofthe ban period.
In earlier times, fishing in coastal waters was strictly a traditional occupa-tion and the pressure on resources was not alarming. Introduction ofmechanized fishing and global international markets, however, changed all this,and there ensued clashes between traditional and mechanized fishers over re-source allocation. Rival groups, through forum shopping, institutional pluralism
Conflicting interests and institutional pluralism 319
and, at times, direct action made attempts to secure their interests. The tradi-tional fishers secured support from environmentalists and activists interestedin protecting fish resources.
The legal reaction of the state of Kerala to clashes between its traditionaland mechanized fishers is an interesting comparison to the Goa case. The Keralalegislature responded with the enactment of laws prohibiting mechanized ves-sels from trawling within specified areas as well as the use of certain destructivegear. The mechanized fishers approached the judiciary questioning the restric-tions on grounds that they contravened their fundamental rights to carry ontheir trade, occupation, and business. It was also urged that the state legislaturehad no competence to enact such law as exclusive jurisdiction in this regard isconferred upon the Union legislature or the Centre as per the Constitutionalscheme. The High Court of Kerala upheld some of the contentions of the mecha-nized fishers and struck down portions of the legislation. The state of Keralatook up the matter before the Supreme Court of India in the case of ‘State ofKerala vs Joseph Anthony AIR 1994 SC 721’, which upheld the legislation andthe notifications issued there under. The Supreme Court of India ruled that theban was a reasonable restriction upon the fundamental right to carry on thetrade, occupation, or business, particularly since it was aimed at protecting thesource of livelihood of traditional fishers and to save fish resources within terri-torial waters from eventual depletion on account of overfishing.
The struggle in Goa as outlined above is a graphic example of the eco-nomic and political dynamics of this debate at the local level. In particular, itillustrates the attempt made by competing interest groups to co-opt and ma-noeuvre the legal structures of the state, as well as less formal religioussanctions, to support their position. An ironic twist to this debate on resourcemanagement is that many Goans, alarmed by the growing scarcity of seafood inlocal markets and the high prices of a dietary staple, in conjunction with envi-ronmental NGOs and traditional fishers, have demanded that the Goagovernment simply enforce its own fisheries laws and notations, passed origi-nally in 1981 and reformulated in 1994/95.
The case of fishing ban in Goa has also demonstrated the willingness ofcompeting interest groups to use alternative institutional structures of the stateto promote their own special interests or point of view – whether environmentalor economic – rather than expedite a meaningful solution to the larger issue ofoverexploitation of marine resources. As the positions of these various interestgroups – both fishers and environmentalists – in Goa have hardened, it has pro-moted distrust and confrontational ‘game playing’ rather than a meaningfuldialogue between opposing groups in the management and protection of ma-rine resources. There needs to be a less politicized process which allows fornegotiation, some degree of trust between parties, and the expression of variouseconomic as well as ecological, developmental and environmental concernsfrom all sides.
320 S Sonak, J A Rubinoff, and M Sonak
Increased collaboration and meaningful dialogue between actors shouldlead to stronger relationships and networks. Political decisions at the local levelneed to show greater respect for the traditional fishers, their skills, andknowledge and be more sensitive towards their livelihood issues. Also thefinancial situation of the mechanized fishers needs to be taken into considera-tion, given their substantial investment in equipment and gear. Barannik,Borysova, and Stolberg (2004) argue that policies towards sustainable fisheriessuch as recommended quotas are often influenced by political and economicconsiderations. Widespread corruption in the region and high domestic and in-ternational prices have been observed by them. Further, they identifyinadequate expert advice as the primary root cause of overfishing in their exam-ple of the Caspian Sea and suggest that ecological decision-making has to bepolitically independent. Sustainable fisheries at the global level are unlikelywithout effective implementation of management policies by local authoritiesand active involvement of traditional fishers in ecological decision-making.
Finally, Holmlund and Hammer (1999) point out that
‘Allowing certain populations to be degraded with the underlyingassumption that this is compensated for by conserving otherpopulations in distant ecosystems, or in nature reserves, fails to rec-ognize that fish populations are uniquely adapted to a relativelynarrow range of environmental conditions, and are necessary for sus-taining the function and resilience of particular lakes or coastal areas,and ultimately the economy of local human communities.’
References
Alvares C (ed.). 2002Fish Curry and Rice: a sourcebook on Goa, its ecology and life style, 4th ednGoa: The Other India Press, 377 pp.
Barannik V, Borysova V O, and Stolberg F. 2004The Caspian sea region: environmental changeAmbio 33 (1–2): 45–51
Bavinck M. 1998A matter of maintaining peace: state accommodation to subordinate legalsystems, the case of fisheries along the Coromandel coast of Tamil Nadu, IndiaJournal of Legal Pluralism and Unofficial Law 40: 151–170
Benda-Beckmann Keebet von. 1981Forum shopping and shopping forums: dispute processing in a MinangkabauVillage in West SumatraJournal of Legal Pluralism and Unofficial Law 19: 117–159
Conflicting interests and institutional pluralism 321
Botsford L W, Castilla J C, and Peterson C H. 1997The management of fisheries and marine ecosystemsScience 277: 509–515
Bruckmeier K. 2005Interdisciplinary conflict analysis and conflict mitigation in local resourcemanagementAmbio 34 (2): 65-73
Caddy J F and Cochrane K L. 2001A review of fisheries management past and present and some futureperspectives for the third millenniumOcean and Coastal Management 44: 653–682
Divan S and Rosencranz. 2001Environmental Law and Policy in IndiaNew Delhi: Oxford University Press
Estes J A, Tinker M T, Williams T M, Doak D F. 1998Killer whale predation on sea otters linking oceanic and nearshore ecosystemsScience 282: 473–476
Hammer M, Jansson A M, and Jansson B O. 1993Diversity change and sustainability: implications for fisheriesAmbio 22: 97–105
Hammer M, Holmlund C M, and Almlov M A. 2003Social–ecological feedback links for ecosystem management: a case study offisheries in the Central Baltic Sea archipelagoOcean and Coastal Management 46: 527–545
Hughes T P. 1994Catastrophes, phase shifts, and large-scale degradation of a Caribbean coral reefScience 265: 1547–1551
Holmlund C M and Hammer M. 1999Ecosystem services generated by fish populationsEcological Economics 29: 253–268
Noronha F. 2001Goanet News, 22 March 2001
Sonak S, Kazi S, and Abraham M. 2005Khazans in Troubled WatersNew Delhi, India: The Energy and Resources Institute. 54 pp.
World Resources. 2000World Resources 2000–2001: people and ecosystems: the fraying web of lifeWashington, DC: World Resources Institute. 389 pp.
322 A E Ashizawa, H E Hicks, and C T De Rosa
Potential health effects to reproductive-aged women and their offsprings afterexposure to polychlorinated biphenylsfrom consumption of US Great Lakes fish#
Annette E Ashizawa, Heraline E Hicks, andChristopher T De Rosa
The Great Lakes region of the US (United States) is located in the UpperMidwest region of the country, with four of the five Great Lakes located inboth Canada and the US. Discharge of pollutants to the lakes has affected thewater quality, fish, and wildlife. In 1972, Canada and the US signed the GreatLakes Water Quality Agreement to restore and maintain the chemical, physical,and biological integrity of the Great Lakes ecosystem. This paper reviews thehealth issues of reproductive-aged women after exposure to PCBs(polychlorinated biphenyls) from consuming contaminated Great Lakes fish.Women who have consumed fish contaminated with PCBs during their vul-nerable reproductive years have borne offspring with low birth weight andcognitive deficits. Government programmes have reduced environmental con-taminants, with an associated decline in body burden levels of PCBs. Healthadvisories for fish consumption and outreach programmes to educate womenhave also been helpful. The remediation of the ecosystem is a positive step inrestoring the health of the public and the environment.
For correspondence: [email protected]
#The findings and conclusions in this report are those of the authors and do not necessarilyrepresent the views of the Agency for Toxic Substances and Disease Registry.
18
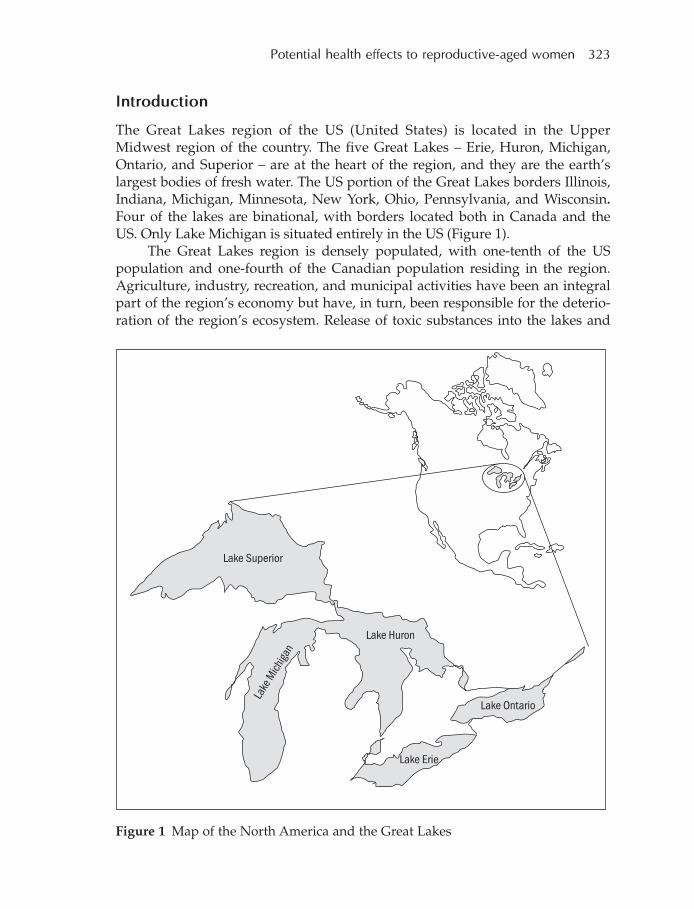
Potential health effects to reproductive-aged women 323
Introduction
The Great Lakes region of the US (United States) is located in the UpperMidwest region of the country. The five Great Lakes – Erie, Huron, Michigan,Ontario, and Superior – are at the heart of the region, and they are the earth’slargest bodies of fresh water. The US portion of the Great Lakes borders Illinois,Indiana, Michigan, Minnesota, New York, Ohio, Pennsylvania, and Wisconsin.Four of the lakes are binational, with borders located both in Canada and theUS. Only Lake Michigan is situated entirely in the US (Figure 1).
The Great Lakes region is densely populated, with one-tenth of the USpopulation and one-fourth of the Canadian population residing in the region.Agriculture, industry, recreation, and municipal activities have been an integralpart of the region’s economy but have, in turn, been responsible for the deterio-ration of the region’s ecosystem. Release of toxic substances into the lakes and
Figure 1 Map of the North America and the Great Lakes

324 A E Ashizawa, H E Hicks, and C T De Rosa
eutrophication from pollutant discharges to the lakes, overfishing, and the intro-duction of non-native species to the waterways have caused serious adverseeffects to the water quality, fish, and wildlife (USEPA 1995a; EC and USEPA2003 and 2005).
In the wake of these deteriorating conditions, the nations of Canada andthe US signed the GLWQA (Great Lakes Water Quality Agreement) in 1972. The